November 2010
PORTLAND BICYCLE COUNT REPORT 2010 Introduction
Each year since the early 1990s, the Portland Bureau of Transportation (PBOT) has counted bicycle trips at
various locations throughout the city. The majority of these counts have been conducted manually by volunteer
counters and city staff standing at street corners and on bridges during the two-hour rush (“peak period”) counting
bicycles that pass. In addition to the overall number of trips, PBOT also records the gender of each person and
whether they are wearing a helmet. Most counts are still conducted in this manner, though in the early 2000s
PBOT added a number of 24-hour automated "hose" counts (pressure-sensitive pneumatic hoses) on some bridges
and trails. These counts, while they do not record gender or helmet use, provide a more precise record of the ebb
and flow of bicycle traffic over 24-hour periods.
Prior to 2008 the majority of counts were concentrated in close-in neighborhoods and the Central City. Beginning
in 2008, the city placed an emphasis on increasing the total number of counts citywide, with a particular focus on
locations in Southwest and East Portland (east of I-205). Each year since PBOT has expanded the number of
counted locations, from 121 locations in 2008 to 153 in 2010, the highest number of locations counted since the volunteer count program began. PBOT compiled data from 150 of these locations based on manual two-
hour peak period counts. These two-hour peak period counts are multiplied by five to provide an estimate of total
daily bicycle traffic at each counted location1.
1 This is a standard traffic engineering rule of thumb. Its accuracy is borne out by our 24-hour automated counts.
Summary of the 2010 Bicycle Count: Bicycle use in Portland continued the two decade long upward trend. Bicycle traffic on Portland’s four principal bicyclefriendly bridges (Broadway, Steel, Burnside and Hawthorne bridges) showed the highest number of bicycle trips since annual counts began in
2000/2001.
Bicycle traffic on Portland’s four principal bicyclefriendly bridges and at 109 nonbridge locations showed a oneyear increase of 12 and seven percent respectively. The total number of bicycle trips
in Portland (combined bridge and nonbridge) increased eight percent compared with 2009.
Bicyclists represented approximately 14 percent of all vehicles crossing those bridges, up one percentage point from 2009
Bicycles represented approximately 20 percent of all vehicles on the Hawthorne Bridge, down one percentage point from 2009. Bicycles represented 16 , 17 and five percent of all vehicles on the
Broadway, Steel and Burnside bridges, respectively, compared to 12 , 18 and five percent in 2009.
Since the 2000/2001 counts, the overall trend in bicycle traffic was up 190 percent; roughly a tripling in use.
Helmet use remained the same as in 2009, with 77 percent of all people counted wearing their helmet. Helmet use in 2010 continued to be more prevalent among female riders (83 percent) than
for male riders (74 percent).
Female riders represented 31 percent of bicyclists citywide, showing no change from 2009.
PORTLAND BICYCLE COUNTS 2010
November 2010 2/5
Annual bicycle counts constitute one of the City’s three principal means of assessing progress in its efforts to
make the bicycle an integral part of daily life in Portland.2 This report identifies the key findings from the latest
round of bicycle counts conducted between July 20 and September 30, 2010. The report also provides graphical
representation of the data and includes a staff analysis.
The most significant finding of the 2010 count is the continuation of the two-decade upward trend of bicycle use
in Portland. Of 110 locations that were counted in both 2009 and 2010 (including the four bicycle-friendly
Willamette River bridges and trails), 46 locations showed a decrease compared to 2009 while 64 locations showed
an increase. Overall, bicycle use increased approximately eight percent compared to 2009. Helmet use showed
very little change compared to 2009 and remains relatively high at 77 percent. The split of male to female cyclists
also remained steady since 2009, with 69 percent of cyclists identified as male.
All the data discussed in this portion of the report is displayed graphically in the appendix.
Bicycle-Friendly Willamette River Bridge Counts
An important gauge for measuring bicycle use in Portland is the number of bicycle trips across the four principal
bicycle-friendly bridges over the Willamette River (Hawthorne, Burnside, Steel, and Broadway bridges). The
number of bicyclists crossing these four bridges has grown rapidly in recent years, with the exception of 2009.
2010 proved a challenging year in which to collect data on Portland’s bridges. In particular, construction on the
Broadway Bridge had significant impact on bicycle traffic on both that bridge and the Steel Bridge, which is the
nearest alternative to the Broadway. Our only available automated count data for the Steel Bridge prior to the
Broadway Bridge closure is from May, resulting in a lower than peak level observation3.
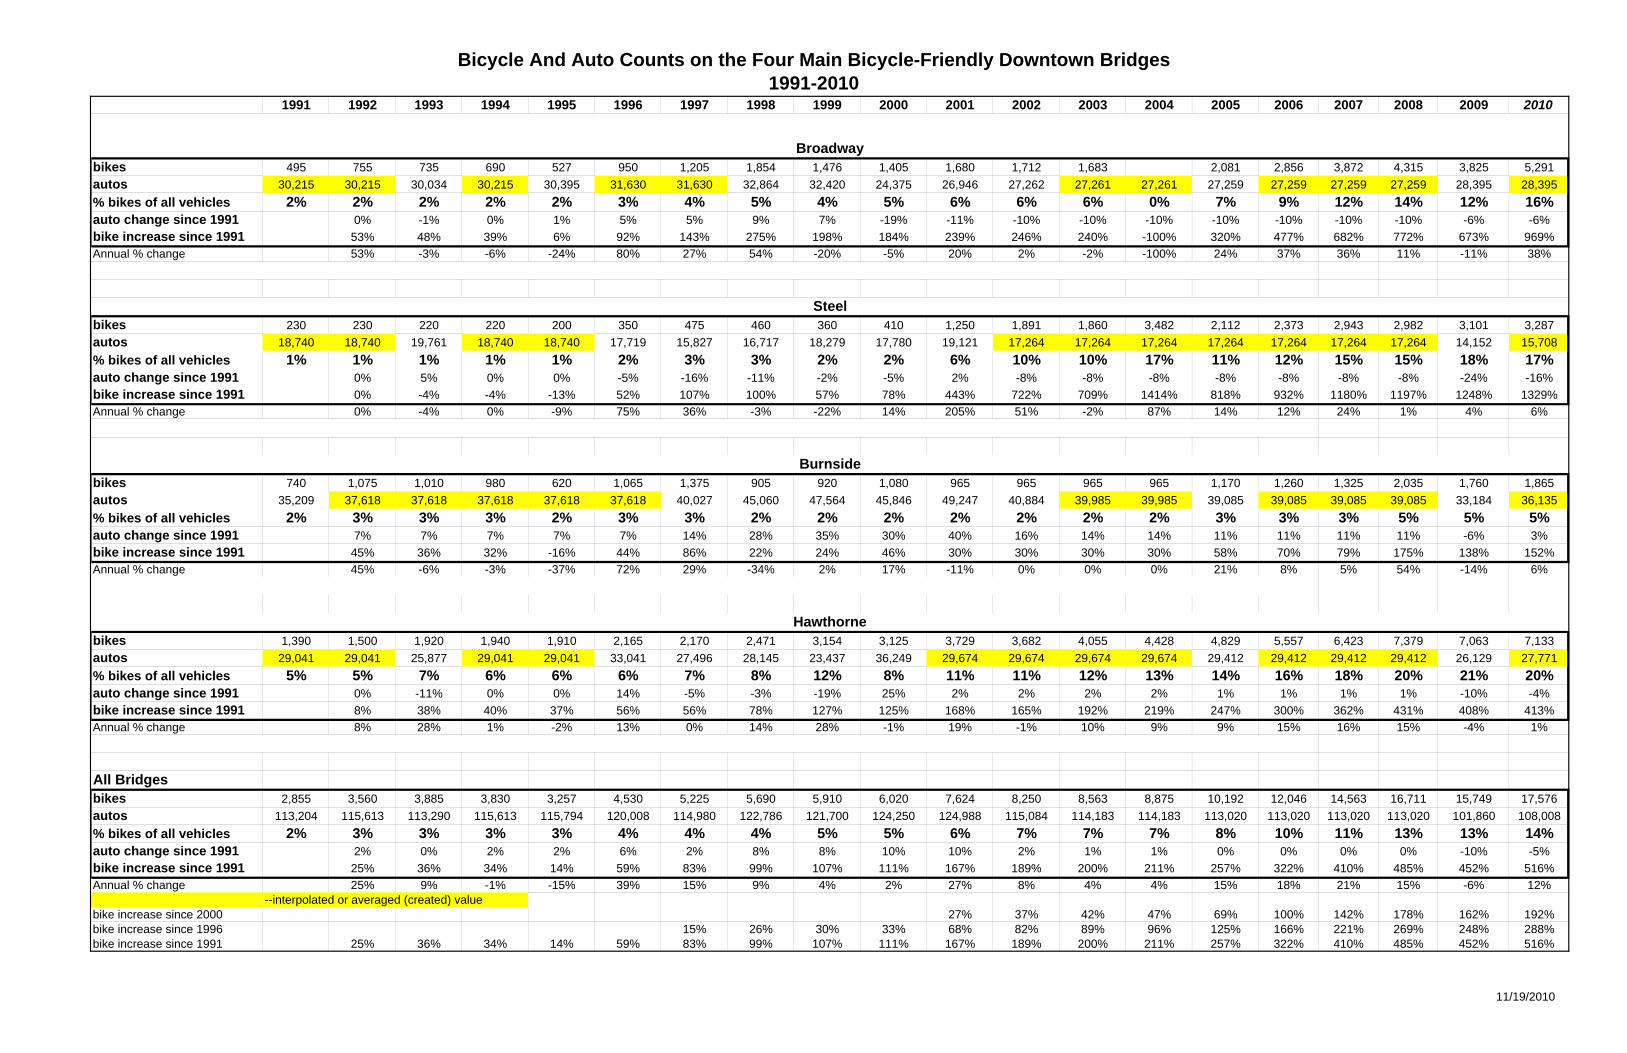
The reported numbers reflect an average of weekday bicycle trips on the bridges, which for the Hawthorne,
Burnside, Steel and Broadway Bridges were 7,133, 1,865, 3,287 and 5,291, respectively 4. The Broadway Bridge
displayed a discordantly high increase in recorded bicycle trips that was consistent across a number of count days.
No other bridges were closed during that period so it is not clear what may have contributed to those higher
numbers.
In 2010, Portlanders took an average of approximately 17,580 daily weekday bicycle trips across the Willamette
River on the city’s four principal bicycle bridges (compared to approximately 15,750 in 2009 and 16,700 in
2008).
Bicycle trips make up a significant proportion of all vehicular trips across these bridges. Though the most current
auto count numbers on the four principal bicycle bridges are from 2009 we estimate that bicycle trips accounted
for 14 percent of the combined daily bicycle and auto trips on these four bicycle-friendly bridges in 2010. For
2 The other two means include data from the US Department of Commerce (either the annual American Community Survey or the decennial US Census), and the annual resident survey conducted by the City Auditor’s Office. 3 Based on data displayed in the Chart titled “Summer and Winter Comparison of Bicycle Trips”, bicycle use in May 2010 appears to be approximately two-thirds (⅔) of trips during the summer months. 4 The Burnside Bridge count was a one-day count, only. Peak recorded use on the Hawthorne, Steel and Broadway Bridges was 7,520, 8,971 (lower deck, during the Broadway closure) and 6,072, respectively.
PORTLAND BICYCLE COUNTS 2010
November 2010 3/5
contrast, bicycles represented
only five percent of all
vehicles on these bridges in
2000. The proportion of bikes
in relation to cars on these
bridges has nearly tripled
since 2000.
Non-Bridge Counts
An increase in bicycle traffic
on the bridges is consistent
with increases in citywide
ridership. Comparisons at 109
non-bridge locations citywide
that were also counted in 2009 show an overall almost 7 percent increase in bicycle use across Portland in 2010
compared to 2009. Compared to 2000/2001, ridership citywide has increased 189 percent based on a comparison
of 32 non-bridge locations.
Citywide Manual Counts
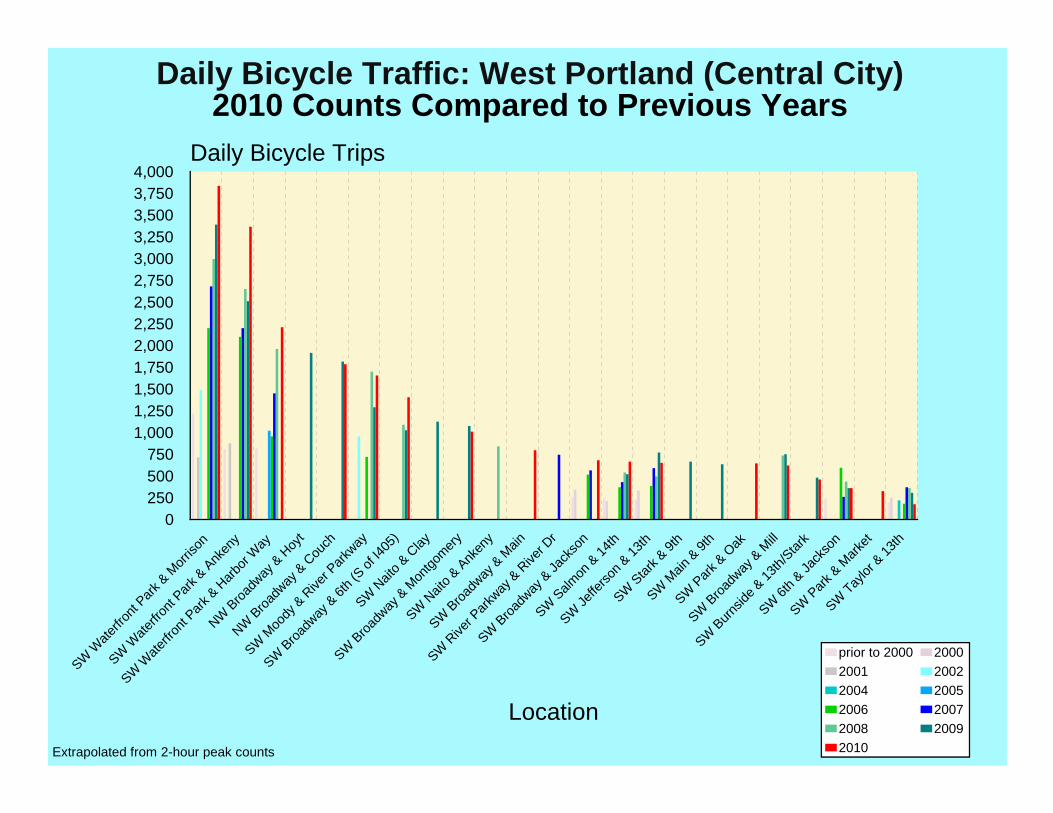
Since 2000/2001, every district in the City has seen consistent and significant growth in bicycle use. The largest
gains have been made in North Portland, which saw a 367 percent increase at 2 locations. This is followed by the
Central City with a 243 percent increase at six locations. The next highest percentages of growth since 2000/2001
were in Southeast Portland and in Southwest Portland, which experienced 234 and 133 percent increases
respectively.
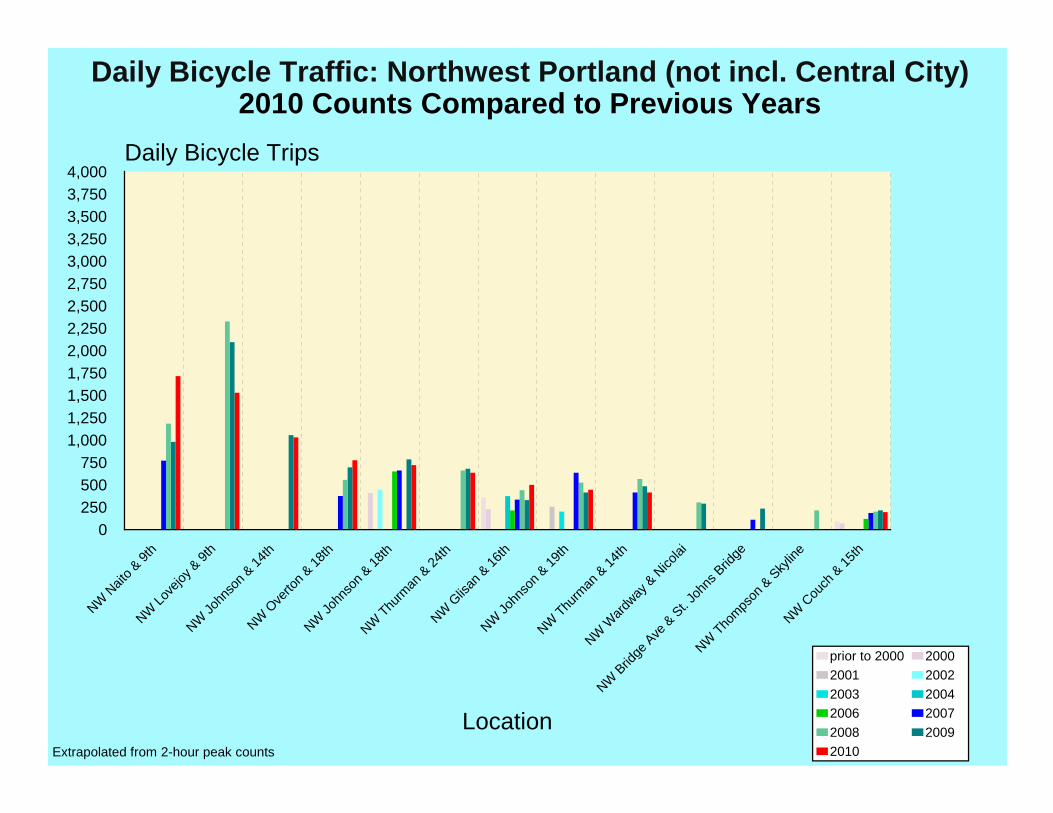
In 2010, all districts experienced growth in ridership compared to the 2009. Southwest Portland and East Portland
lead the growth with 19 percent and 9.5 percent respectively. The lowest increases are seen in Northwest Portland
up 2.0 percent and Southeast Portland up 2.9 percent.
Helmet Use
Helmet use in Portland has been trending
steadily upward since the early 1990s. In 1992
only 44 percent of Portland cyclists used a
helmet. In 2010 approximately 77 percent did.
The year of highest helmet use was 2008, when
approximately 80 percent of Portlanders wore a
helmet while riding a bicycle.
Helmet use is highest in Southwest Portland,
where approximately 88 percent of riders wear
them. It is lowest in East Portland where only 58
percent of riders were observed wearing them.
2010 Non-Bridge Bicycle Counts Compared with Prior Years
DISTRICT/ LOCATION
% CHANGE SINCE 2000/01
BASED ON # LOCATIONS
% CHANGE SINCE 2009
BASED ON # LOCATIONS
Citywide Total 189% 32 6.8% 109 Central City (west side) 243% 6 6.3% 13
North 367% 2 7.0% 7
Northeast 80% 5 7.5% 15
Southeast 234% 7 2.9% 24
East Na Na 9.5% 17
Northwest 93% 4 2.0% 10 Southwest (excluding Central City)
133% 8 19.0% 24
2010 Compared with 2009: Helmet Use
DISTRICT/ LOCATION % 2009 % 2010 CHANGE IN % POINTS
Citywide Total 77% 77% 0
Central City (west side) 81.5% 75.2% -6.3
North 82% 81% -1
Northeast 78% 77% -1
Southeast 73% 74% 1
East 60% 58% -2
Northwest 76% 74% -5 Southwest (excluding Central City) 88% 88% 0
PORTLAND BICYCLE COUNTS 2010
November 2010 4/5
Only in Southeast Portland did helmet use
grow, by approximately one percentage point.
The Central City experienced a 6.3 percent
drop from 2009 observations.
As has been the case in every year since 1992,
women wear helmets at a higher rate than do
men. In 2010 approximately 83 percent of
female riders wore helmets while 74 percent
of men wore them. Compared to 2009, helmet
use among women increased approximately
one percentage point, while helmet use by
men remained steady.
Gender Split
Because cities with high bicycle mode shares
typically achieve a balance between male and
female ridership, gender parity is considered an
important indicator of success in creating safe,
comfortable and attractive conditions for
bicycling. Women represented 31.2 percent of
all bicyclists counted during Portland’s summer
2010 counts. Looking at the citywide average,
this gender split remains essentially unchanged
compared to 2009.
Depending on the area of the City, the
proportion of women riders fluctuated between
19 percent and 34 percent. The highest
proportion of women riding bicycles was
observed in Inner Northeast Portland, where
they represented 34 percent of all riders counted,
and the lowest was in East Portland, where
women represented 19 percent of riders.
Northwest Portland saw the largest one-year
increase in the percentage of female riders,
where their numbers grew five percentage points
from last year. Northeast Portland experienced
the largest decreases in percentage of female
riders, where women as a percentage of all
people riding bicycles declined 1.8 percentage
points.
2010 Locations with Highest and Lowest Share of Female Cyclists
RANK LOCATION % TRIPS BY WOMEN
TOTAL DAILY TRIPS
1 N Vancouver & Ainsworth 45% 990
2 NW Johnson & 18th 42% 720
3 NE Skidmore & 9th 41% 535
4 SW Moody & River Parkway 41% 1655
5 SW Waterfront & Harbor Way 40% 2210
6 NE Irving & 20th 40% 1100
7 SE Clinton & 13th 40% 855
8 SE Taylor & 41st/42nd Ave 40% 1185
9 NE Going & 9th 39% 1040
10 NW Johnson & 19th 39% 445 …
106 SW Broadway & Montgomery 17% 1010
107 E Burnside & 122nd 16% 400
108 SW Beaverton Hillsdale Hwy & Shattuck 15% 305
109 SE Market & 130th 14% 360
110 N Union Path I-5 Ramp (to Hayden Island) 14% 545
111 SW Capitol & Sunset 14% 625
112 SW Canyon Ct & Skyline 12% 540
113 SW Humphrey/Talbot & Patton 11% 435
114 SE Division & 122nd 11% 360
115 SW Barbur Blvd & Capitol Hwy 9% 275
Percentage of Bicyclists Identified as Female
DISTRICT/ LOCATION % 2009 % 2010 CHANGE IN % POINTS
Citywide Total 31.0% 31.2% 0.2
Central City (west side) 31.3% 30.9% -0.4
North 32.9% 31.8% -1.1
Northeast 35.7% 33.9% -1.8
Southeast 32.8% 33.4% 0.6
East 18.6% 19.5% 0.9
Northwest 27.7% 32.8% 5.1 Southwest (excluding Central City) 25.8% 24.7% -1.1
PORTLAND BICYCLE COUNTS 2010
November 2010 5/5
The proportion of women riders at individual locations ranged from a low of 9 percent at SW Barbur and Capitol
to a high of 45 percent at N Vancouver and Ainsworth. The above table shows the ten highest and lowest
locations for women riders. This data is mapped in a display in the Appendix (Portland Bicycle Counts Locations
with Highest and Lowest Share of Women Riding Bicycles).
Summer and Winter Comparison
In recent years the city has endeavored to collect bicycle trip data at different times throughout the year on
selected bridges. In 2010 the city recorded bicycle trips on the Hawthorne Bridge in January, February, March,
May and June. The results of this are shown in the figure titled: “Summer and Winter Comparison” in the
Appendix (Summer and Winter Comparison of Bicycle Trips). As this graph shows, bicycle use in the winter is
approximately 33 percent less than average use in the summer. This is not unexpected. As shown in the graph it is
worth noting that the winter counts on the Hawthorne Bridge in 2010 are comparable to, and in some instances
exceed summer counts recorded just several years ago in 2006.
Crash Data
The City of Portland reports an indexed bicycle crash rate based on the reported number of crashes and the
number of daily bicycle trips across four of the central Willamette River bridges. A chart displaying the change in
that rate over time is included in this report. Beginning in 2008, in response to the city’s Community Policing
Agreement with the Police Bureau , the Bicycle Transportation Alliance and the Willamette Pedestrian Coalition,
the Police Bureau amended their procedures for reporting crashes, resulting in more of the crashes involving a
bicycle being reported. This increase does not necessarily represent a real increase the number of overall bicycle-
involved crashes.. The elevation may simply have occurred because fewer crashes are going unreported. Because
of this lowered threshold for reporting, reported bicycle crashes no longer offer an “apples to apples” comparison
to bicycle crashes reported prior to 2008. This likely explains the increase in reported crashes in 2008 and 2009
(data is not yet available for 2010). We do not expect to be able to understand trends in bicycle crashes in
Portland until several years of data have been collected using this new procedure. Nonetheless, we have
incorporated data collected in this new manner into our analysis of bicycle crash rate and safety.
Conclusion
Results from the 2010 Summer Bicycle Counts continued the long-term upward trend of increasing bicycle use
throughout the City of Portland. The 12 percent increase of bridge trips reflected the highest number of bicycle
trips ever counted on Portland’s four bicycle-friendly bridges, and the 7.6 percent total citywide increase
contributed to a near-tripling of bicycle use in Portland since 2000/2001. The count effort in 2010 included more
locations than ever, providing greater coverage in all districts of the city, and building an even stronger database
for future comparisons. The gender split observed in 2010 closely matches that of 2009, with approximately 31
percent of all trips being made by women. Helmet use did not vary widely from 2009’s rate of 77percent observed
wearing helmets. While bicycle trips in decrease in winter compared to summer, the drop appears to be on the
order of one-third of average summer trips.
PORTLAND BICYCLE COUNTS 2010
November 2010 6/5
APPENDIX: GRAPHS AND CHARTS
Graphs
Average Daily Bicycle Traffic 4 Willamette River Bridges
Combined Bicycle Traffic Over Four Main Portland Bicycle Bridges Juxtaposed with Bikeway Miles
Combined 2010 Bicycle Traffic Over Four Main Portland Bicycle Bridges Juxtaposed with Bicycle Crashes
Bicycle Traffic at City Count Locations (Bridge and Non-Bridge Traffic) Changes in Bicycle Traffic (Bridge, Non-Bridge, and Combined Locations 2010) Daily Bicycle Counts by Section of City SE Portland North Portland East Portland NE Portland West Portland (Central City) Southwest Portland (not including Central City) Northwest Portland (not including Central City)
City of Portland Bicycle Counts by Year by Gender
City of Portland Bicycle Counts by Sector 2010 by Gender
City of Portland Bicycle Counts by Year by Helmet Use
City of Portland Bicycle Counts by Sector 2010 by Helmet Use
Portland Bicycle Counts 2010 Locations with Highest and Lowest Share of Women Riding Bicycles
Summer and Winter Comparison of Bicycle Trips
Charts
City of Portland Bicycle Counts by Year (Gender and Helmet Use)
Citywide North Portland Northwest Portland Southwest Portland East Portland Inner NE Portland Inner SE Portland
Bicycle and Auto Counts on the Four Main Bicycle-Friendly Downtown Bridges 1991-2010
Average Daily Bicycle Traffic4 Main Willamette River Bicycle Bridges
Based on either 24-hour hose counts or extrapolated from 4-6 pm counts
2,8553,560
3,885 3,8303,257
4,5305,225
5,690 5,910 6,020
7,6248,250
8,5638,875
10,192
12,046
14,563
16,711
15,749
17,576
Before 19921992 1993 1994 1995 1996 1997 1998 1999 2000 2001 2002 2003 2004 2005 2006 2007 2008 2009 2010
Year
0
1,000
2,000
3,000
4,000
5,000
6,000
7,000
8,000
9,000
10,000
11,000
12,000
13,000
14,000
15,000Daily Bicycle Trips
Burnside
Broadway
Steel
Hawthorne
Burnside 740 1,075 1,010 980 620 1,065 1,375 905 920 1,080 965 965 965 965 1,170 1,260 1,325 2,035 1,760 1,865
Broadway 495 755 735 690 527 950 1,205 1,854 1,476 1,405 1,680 1,712 1,683 * 2,081 2,856 3,872 4,315 3,825 5,291
Steel 230 230 220 220 200 350 475 460 360 410 1,250 1,891 1,860 3,482 2,112 2,373 2,943 2,982 3,101 3,287
Hawthorne 1,390 1,500 1,920 1,940 1,910 2,165 2,170 2,471 3,154 3,125 3,729 3,682 4,055 4,428 4,829 5,557 6,423 7,379 7,063 7,133
* Broadway Bridge closed for construction during time of count.
Bicycle Traffic across Four Main Portland Bicycle Bridges Juxtaposed with Bikeway Miles
Extrapolated from peak period counts
1991 1992 1993 1994 1995 1996 1997 1998 1999 2000 2001 2002 2003 2004 2005 2006 2007 2008 2009 2010
Year
0
2,500
5,000
7,500
10,000
12,500
15,000
17,500
20,000Cyclists per Day
0
50
100
150
200
250
300
350
400
450Bikeway Miles
Bridge Bicycle TrafficBikeway Miles
Bridge Bicycle Traffic 2,850 3,555 3,885 3,830 3,207 4,520 5,225 5,690 5,910 6,015 7,686 8,250 8,562 8,875 10,192 12,046 14,563 16,711 15,749 17,576Bikeway Miles 79 84.5 87 104 114 144 167 183 214 222.5 236 253 256 262 265.5 269 272 274 281 324
Combined Bicycle Traffic over Four Main Portland Bicycle Bridges Juxtaposed with Bicycle Crashes
Extrapolated from peak period counts
!
!
! ! ! !! ! ! ! ! ! ! ! ! ! ! !
!
1991 1992 1993 1994 1995 1996 1997 1998 1999 2000 2001 2002 2003 2004 2005 2006 2007 2008 2009 2010
Year
0
2,500
5,000
7,500
10,000
12,500
15,000
17,500
20,000Cyclists per Day
0
100
200
300
400
500
600
700
800
900Crashes and Indexed Crash Rate
Bridge Bicycle TrafficReported Bicycle Crashes*Indexed Bicycle Crash Rate (Trend Line)
!
Bridge Bicycle Traffic 2,850 3,555 3,885 3,830 3,207 4,520 5,225 5,690 5,910 6,015 7,686 8,250 8,562 8,875 10,19212,04614,56316,71115,79417,576Reported Bicycle Crashes* 155 163 171 189 195 160 167 166 161 179 175 173 164 174 188 203 186 265 287 *
Indexed Bicycle Crash Rate (Trend Line) 544 459 440 493 514 354 320 292 272 298 230 210 192 196 184 168 128 159 182 *Bicycle Fatalities 2 0 4 3 2 1 5 3 0 0 5 0 4 1 4 0 6 0 4 *
“Crash Rate" represents an indexing of annual reported crashes to daily bicycle trips across the four main bicycle bridges.*2008, 2009 Reported Bicycle Crashes data reflects increased crash reporting requirements.
Bicycle Traffic at City Count LocationsBridge and Non-Bridge Traffic
Based on 24-hour hose counts or extrapolated from peak period counts
1991 1992 1993 1994 1995 1996 1997 1998 1999 2000 2001 2002 2003 2004 2005 2006 2007 2008 2009 2010
Year
0
2,500
5,000
7,500
10,000
12,500
15,000
17,500
20,000Bridge Bicycle Traffic
0
10,000
20,000
30,000
40,000
50,000
60,000Non-Bridge Bicycle Traffic
Bridge Bicycle TrafficNon-Bridge Traffic(based on 35 locations city-wide)
Bridge Bicycle Traffic 2,850 3,555 3,885 3,830 3,207 4,520 5,225 5,690 5,910 6,015 7,686 8,250 8,562 8,875 10,192 12,046 14,563 16,711 15,749 17,576Non-Bridge Traffic
(based on 35 locations city-wide)26,645 31,755 43,245 39,625 42,535
Changes in Bicycle Traffic
Based on manual and automated bicycle counts*used the higher of data available 2000/2001
7.6%
190%
11.6%
192%
6.8%
189%
One-Year Change (since 2009) Change since 2000/2001*0%
20%
40%
60%
80%
100%
120%
140%
160%
180%
200%
220%
240%
% c
han
ge
Non-Bridge Locations
Bridges (Hawthorne, Burnside, Steel & Broadway)
Combined Bridge & Non-Bridge
Based on counts from 32 locations city-wide
Based on counts from 109 locations city-wide
ridge
bridge
brid
ge
n on -
b rid
ge
combined
com
bine
d
Bridge and Non-Bridge Locations 2010
non-bridge
Daily Bicycle Traffic Inner SE Portland2010 Counts Compared to Previous Years
Based on either 24-hour hose counts or extrapolated from 2-hour peak counts
SE Har
rison
& L
add
(Circ
le)*
SE Ank
eny &
28t
h
SE Clin
ton
& 26t
h
Spring
water
& O
aks B
otto
m P
ath
Eastb
ank E
splan
ade
(n. o
f Haw
thor
ne B
ridge
)
Spring
water
Cor
ridor
(s o
f Ivo
n)
SE Salm
on &
34t
h
SE Spo
kane
& S
pring
water
SE Linc
oln &
41s
t
SE Clay
& 1
2th
SE Salm
on &
7th
SE Ank
eny &
6th
SE Tay
lor &
41s
t
SE Clay
& 7
th
SE Glad
stone
& 4
2nd
SE Milw
aukie
& M
itche
ll
SE Um
atilla
& 1
9th
SE Clin
ton
& 13t
h
SE Clay
& W
ater
SE Woo
dwar
d & 7
1st
SE Spr
ingwat
er &
Johs
on C
reek
SE Belm
ont &
16t
h
SE Glad
stone
& 2
6th
SE Milw
aukie
& P
owell
SE Woo
dsto
ck &
46t
h
SE Milw
aukie
& B
ybee
SE Mill
& 87t
h
Sellwoo
d Brid
ge
SE Cen
ter &
52n
d
SE Spo
kane
& 1
5th
SE Cen
ter &
72n
d
SE Cen
ter &
9th
SE Cen
ter &
9th
Location
0
250
500
750
1,000
1,250
1,500
1,750
2,000
2,250
2,500
2,750
3,000
3,250
3,500
3,750
4,000Daily Bicycle Trips
prior to 2000 2000 2001 2002
2003 2004 2005 2006
2007 2008 2009 2010
*Counted at NW corner of circle, compared to counts at SE corner in the years prior to 2008.
Daily Bicycle Traffic: North Portland2010 Counts Compared to Previous Years
Extrapolated from 2-hour peak counts
N Inte
rsta
te/L
loyd/
Orego
n
N Willi
ams &
Rus
sell
N Mult
nom
ah &
Whe
eler
N Van
couv
er &
Rus
sell
N Inte
rsta
te &
Gre
eley
N Inte
rsta
te &
Lar
rabe
e
N Van
couv
er &
Ains
worth
N Willa
met
te &
Wau
d Bluf
f Tra
il
N Goin
g & G
reele
y
N Unio
n Pat
h & I-
5
N Con
cord
& W
illam
ette
N Den
ver &
Ros
a Par
ks
N Fes
send
en &
Pen
insula
Cro
ssing
N Willa
met
te &
Phil
adelp
hia
N Flin
t & T
illam
ook
N Por
tsmou
th &
Willi
s
N Fail
ing &
Miss
ouri
N Bry
ant &
Con
cord
N Bry
ant &
Miss
ouri
N Willi
s & W
oolse
y
N Bry
ant &
Wab
ash
N Sm
ith &
St.
Louis
N Cha
utau
qua
& Willi
s
N Wab
ash
& N H
allec
k
N Cen
tral &
N B
urr
N Por
t Cen
ter W
y & C
emen
t Rd
Location
0
250
500
750
1,000
1,250
1,500
1,750
2,000
2,250
2,500
2,750
3,000
3,250
3,500
3,750
4,000Daily Bicycle Trips
prior to 2000 2000 2001
2003 2004 2006
2007 2008 2009
2010
Daily Bicycle Traffic East Portland2010 Counts Compared to Previous Years
Based on either 24-hour hose counts or extrapolated from 2-hour peak counts
SE Spr
ingwat
er &
I-20
5 Pat
h
SE Flav
el & 9
2nd
E Bur
nside
& I-
205
path
SE Spr
ingwat
er &
122
nd
SE Spr
ingwat
er &
92n
d
NE Mar
ine D
rive
& PDX T
rail
E Bur
nside
& 1
22nd
SE Mar
ket &
130
th
SE Divi
sion
& 122
nd
NE Airp
ort W
y & I-
205
path
SE Pow
ell &
122
nd
SE Main
& 9
6th
(Eas
t side
)
SE Bus
h & 1
22nd
SE Mill
& 135
th
NE Hals
ey &
122
nd
SE Holg
ate
& 112
th
SE Divi
sion
& 96t
h
SE Pow
ell &
148
th
SE Holg
ate
& 100
th
NE May
wood
Place
& I-20
5 Pat
h
NE Hals
ey &
92n
d
NE Fre
mon
t & 1
22nd
NE Hals
ey &
148
th
SE Pow
ell &
162
nd
SE Flav
el & D
eard
orf
NE Mar
ine D
rive
& Por
t Pat
h
Location
0
250
500
750
1,000
1,250
1,500
1,750
2,000
2,250
2,500
2,750
3,000
3,250
3,500
3,750
4,000Daily Bicycle Trips
prior to 2000 2006
2007 2008
2009 2010
Daily Bicycle Traffic: Inner NE Portland2010 Counts Compared to Previous Years
NE Mult
nom
ah &
Whe
eler
NE Irvin
g & 1
2th
NE Tilla
moo
k & 2
8th
NE Glis
an &
28t
h
NE Bro
adway
& 7
th
NE Mult
nom
ah &
7th
NE Irvin
g & 2
0th
NE Gra
nt P
l & 3
3rd
NE Goin
g & 9
th
NE Eve
rett
& 53r
d
NE Dav
is & 4
1st
NE Weid
ler &
7th
NE Skid
mor
e & 9
th
E Bur
nside
& 7
4th
NE Cou
ch &
41s
t
NE Weid
ler &
MLK
NE Irvin
g & 2
1st
NE Goin
g & 3
7th
NE Tilla
moo
k & 7
4th
NE Mult
nom
ah &
47t
h
NE Holm
an &
27t
h
NE Pre
scot
t & C
ully
NE Sisk
iyou
& 72n
d
NE Killi
ngsw
orth
& C
ully
NE Albe
rta &
72n
d
Location
0
250
500
750
1,000
1,250
1,500
1,750
2,000
2,250
2,500
2,750
3,000
3,250
3,500
3,750
4,000Daily Bicycle Trips
prior to 2000 2000
2001 2003
2004 2005
2006 2007
2008 2009
2010Extrapolated from 2-hour peak counts
Daily Bicycle Traffic: West Portland (Central City)2010 Counts Compared to Previous Years
SW W
ater
front
Par
k & M
orris
on
SW W
ater
front
Par
k & A
nken
y
SW W
ater
front
Par
k & H
arbo
r Way
NW B
road
way &
Hoy
t
NW B
road
way &
Cou
ch
SW M
oody
& R
iver P
arkw
ay
SW B
road
way &
6th
(S o
f I40
5)
SW N
aito
& Clay
SW B
road
way &
Mon
tgom
ery
SW N
aito
& Ank
eny
SW B
road
way &
Main
SW R
iver P
arkw
ay &
Rive
r Dr
SW B
road
way &
Jack
son
SW S
almon
& 1
4th
SW Je
ffers
on &
13t
h
SW S
tark
& 9
th
SW M
ain &
9th
SW P
ark &
Oak
SW B
road
way &
Mill
SW B
urns
ide &
13t
h/Sta
rk
SW 6
th &
Jack
son
SW P
ark &
Mar
ket
SW T
aylor
& 1
3th
Location
0250500750
1,0001,2501,5001,7502,0002,2502,5002,7503,0003,2503,5003,7504,000
Daily Bicycle Trips
prior to 2000 2000
2001 2002
2004 2005
2006 2007
2008 2009
2010Extrapolated from 2-hour peak counts
Daily Bicycle Traffic: Southwest Portland (not incl. Central City)2010 Counts Compared to Previous Years
SW M
oody
& G
ibbs
SW T
erwilli
ger &
Cam
pus D
rive
SW B
arbu
r & T
erwilli
ger
SW T
erwilli
ger &
Wes
twoo
d
SW C
apito
l Hwy &
Ter
willige
r
SW B
arbu
r & H
amilto
n
SW T
erwilli
ger &
She
ridan
SW C
apito
l & S
unse
t
SW P
alant
ine &
Rive
rview
Cem
etar
y
SW B
ond
& Cur
ry
SW C
anyo
n Ct &
Sky
line
SW H
umph
rey &
Pat
ton
SW T
aylor
s Fer
ry &
Ter
willige
r
SW A
rthur
& 1
st
SW K
ingsto
n & R
ose
Garde
n
SW W
illam
ette
Gre
enway
& M
iles
SW M
ultno
mah
& 4
5th
SW C
apito
l Hwy &
Ver
mon
t
SW B
H Hwy &
Sha
ttuck
SW T
erwilli
ger &
2nd
SW B
arbu
r & C
apito
l Hwy
SW B
erth
a & V
erm
ont
SW 1
8th
& Tra
il sou
th o
f Sun
set H
wy
SW V
ista
& Mon
tgom
ery
SW C
orbe
tt & N
ebra
ska
SW T
roy &
Cap
itol H
ill
SW Ill
inois
& 45t
h
SW H
amilto
n & 4
5th
SW A
rnold
& 3
5th
Location
0250500750
1,0001,2501,5001,7502,0002,2502,5002,7503,0003,2503,5003,7504,000
Daily Bicycle Trips
prior to 2000 2000
2001 2003
2006 2007
2008 2009
2010Extrapolated from 2-hour peak counts
Daily Bicycle Traffic: Northwest Portland (not incl. Central City)2010 Counts Compared to Previous Years
NW N
aito
& 9th
NW L
ovejo
y & 9
th
NW Jo
hnso
n & 1
4th
NW O
verto
n & 1
8th
NW Jo
hnso
n & 1
8th
NW T
hurm
an &
24t
h
NW G
lisan
& 1
6th
NW Jo
hnso
n & 1
9th
NW T
hurm
an &
14t
h
NW W
ardw
ay &
Nico
lai
NW B
ridge
Ave
& S
t. Jo
hns B
ridge
NW T
hom
pson
& S
kylin
e
NW C
ouch
& 1
5th
Location
0
250
500
750
1,000
1,250
1,500
1,750
2,000
2,250
2,500
2,750
3,000
3,250
3,500
3,750
4,000Daily Bicycle Trips
prior to 2000 2000
2001 2002
2003 2004
2006 2007
2008 2009
2010Extrapolated from 2-hour peak counts
City of Portland Bicycle Counts by YearBy Gender
based on manual peak hour counts
1992 1993 1994 1995 1996 1997 1998 1999 2000 2001 2002 2003 2004 2005 2006 2007 2008 2009 2010
Year
0%
5%
10%
15%
20%
25%
30%
35%
40%
45%
50%
55%
60%
65%
70%
75%
80%
85%
90%
95%
100%Percentage of all Cyclists
Men Women
City of Portland Bicycle Counts by Sector 2010By Gender
based on manual peak hour counts
Inner NE PortlandNW Portland
Inner SE PortlandNorth Portland
CitywideSW Portland
East Portland
Sector
0%
5%
10%
15%
20%
25%
30%
35%
40%
45%
50%
55%
60%
65%
70%
75%
80%
85%
90%
95%
100%Percentage of all Cyclists
Men WomenNumber in columns is total number of cyclists recorded in counts in each sector.
24,769cyclists
2,684 cyclists
3,636cyclists
1,949 cyclists
3,649cyclists
7,699 cyclists
1,265cyclists
City of Portland Bicycle Counts by YearBy Helmet Use
based on manual peak hour counts
1992 1993 1994 1995 1996 1997 1998 1999 2000 2001 2002 2003 2004 2005 2006 2007 2008 2009 2010
Year
0%
5%
10%
15%
20%
25%
30%
35%
40%
45%
50%
55%
60%
65%
70%
75%
80%
85%
90%
95%
100%Percentage of all Cyclists
with helmets without helmets
City of Portland Bicycle Counts by Sector 2010By Helmet Use
based on manual peak hour counts
SW PortlandNorth Portland
Inner NE PortlandCitywide
Inner SE PortlandNW Portland
East Portland
Sector
0%
5%
10%
15%
20%
25%
30%
35%
40%
45%
50%
55%
60%
65%
70%
75%
80%
85%
90%
95%
100%Percentage of all Cyclists
Wearing Helmets
Not Wearing Helmets
Number in columns is total number of cyclists recorded in counts in each sector.
3,649 cyclists
2,684 cyclists
7,699 cyclists
24,653 cyclists
3,381 cyclists
1,949 cyclists
1,265 cyclists
No change since 2009
Down 1% since 2009
Down 1% since 2009
No change since 2009
Up 1% since 2009
Down 5% since 2009
Down 2% since 2009
SE CLINTON ST
SE BUSH ST
SE LINCOLN ST
SE ANKENY ST
SE SALMON ST
NW
24T
H A
VE
N BRYANT ST
NE ALBERTA ST
SE SPOKANE ST
N W
ILLI
AM
S A
VE
NE HANCOCK ST
SE
100
TH
AV
E
NE
37
TH
AV
E
NE GOING ST
NE DAVIS ST
NE
41
ST
AV
E
SE BUSH ST
SE DIVISION ST
E BURNSIDE ST
NE AIRPORT WAY
NE
12
2N
D A
VE
NE HALSEY ST
NW ST HELENS RD
SE FOSTER RD
N MARINE DR
SE FLAVEL ST
NE
33
RD
DR
N W
ILLI
AM
S A
VE
NE MARINE DR
SE
162
ND
AV
E
SE DUKE ST
NE KILLINGSWORTH ST
SE
148
TH
AV
E
N WILLAMETTE BLVD
SE
28T
H A
VE
SW MULTNOMAH BLVD
SE
92N
D A
VE
SW
BA
RB
UR
BLV
D
SE
52N
D A
VE
N G
RE
ELE
Y AVE
N FESSENDEN ST
SE
45T
H A
VE
NW
14T
H A
VE
SE
41S
T A
VE
NE SANDY BLVD
SW
MO
OD
Y A
VE
SE STARK ST
NE IRVING ST
SW CAPITOL HWY
SW
CA
PIT
OL
HW
Y
NW
ST HELEN
S RD N MARINE DR
NE MARINE DR
Locations with Highest and Lowest Share of Women Riding Bicycles
Portland Bicycle Counts 2010
LEGENDLocations
10 locations with highestfemale bicycle mode split
10 locations with lowestfemale bicycle mode split
Existing BikewaysBoulevardsOff-Street Trails
Separated In-Roadway
Summer and Winter Comparison of Bicycle Trips2010 Hawthorne Bridge Counts Compared to Past Peaks
January February March April May SummerAverage
0
1,000
2,000
3,000
4,000
5,000
6,000
7,000
Daily Trips
Hawthorne 4,794 5,792 5,273 4,683 7,133
Summer 2006
Summer 2005
Summer 2000
City of Portland Bicycle Counts by YearGender and Helmet Use
w/ helmets w/o helmets Total w/ helmets w/o helmets Total w/ helmets w/o helmets Total w/ helmets w/o helmets Total w/ helmets w/o helmets w/ helmets w/o helmets w/ helmets w/o helmets1992 153 205 358 46 47 93 43% 57% 79% 49% 51% 21% 44% 56% 34% 45% 10% 10% 451 cyclists1993 229 211 440 101 55 156 52% 48% 74% 65% 35% 26% 55% 45% 38% 35% 17% 9% 596 cyclists1994 75 54 129 28 15 43 58% 42% 75% 65% 35% 25% 60% 40% 44% 31% 16% 9% 172 cyclists1995 842 401 1,243 320 162 482 68% 32% 72% 66% 34% 28% 67% 33% 49% 23% 19% 9% 1,725 cyclists1996 904 548 1,452 335 135 470 62% 38% 76% 71% 29% 24% 64% 36% 47% 29% 17% 7% 1,922 cyclists1997 2,126 1,428 3,554 900 337 1,237 60% 40% 74% 73% 27% 26% 63% 37% 44% 30% 19% 7% 4,791 cyclists1998 2,229 1,518 3,747 901 395 1,296 59% 41% 74% 70% 30% 26% 62% 38% 44% 30% 18% 8% 5,043 cyclists1999 1,978 1,109 3,087 764 264 1,028 64% 36% 75% 74% 26% 25% 67% 33% 48% 27% 19% 6% 4,115 cyclists2000 2,364 1,111 3,475 899 301 1,200 68% 32% 74% 75% 25% 26% 70% 30% 51% 24% 19% 6% 4,675 cyclists2001 3,734 1,618 5,352 1,632 457 2,089 70% 30% 72% 78% 22% 28% 72% 28% 50% 22% 22% 6% 7,441 cyclists2002 363 126 489 138 40 178 74% 26% 73% 78% 22% 27% 75% 25% 54% 19% 21% 6% 667 cyclists2003 1,854 891 2,745 910 322 1,232 68% 32% 69% 74% 26% 31% 69% 31% 47% 22% 23% 8% 3,977 cyclists2004 1,401 637 2,038 674 216 890 69% 31% 70% 76% 24% 30% 71% 29% 48% 22% 23% 7% 2,928 cyclists2005 1,064 393 1,457 528 136 664 73% 27% 69% 80% 20% 31% 75% 25% 50% 19% 25% 6% 2,121 cyclists2006 4,316 1,703 6,019 2,048 502 2,550 72% 28% 70% 80% 20% 30% 74% 26% 50% 20% 24% 6% 8,569 cyclists2007 6,649 2,366 9,015 3,369 724 4,093 74% 26% 69% 82% 18% 31% 76% 24% 51% 18% 26% 6% 13,108 cyclists2008 12,944 3,784 16,728 6,754 1,108 7,862 77% 23% 68% 86% 14% 32% 80% 20% 53% 15% 27% 5% 24,590 cyclists2009 11,340 3,887 15,227 5,619 1,219 6,838 74% 26% 69% 82% 18% 31% 77% 23% 51% 18% 25% 6% 22,065 cyclists2010 12,436 4,422 16,858 6,332 1,324 7,656 74% 26% 69% 83% 17% 31% 77% 23% 51% 18% 26% 5% 24,514 cyclists
Total 54,565 21,990 76,555 25,966 6,435 32,401 71% 29% 70% 80% 20% 30% 74% 26% 50% 20% 24% 6% 108,956 cyclists
Male Cyclists as % of all cyclists
Citywide
Female Cyclists as % of all cyclistsAll Cyclists Based onFemale Cyclists Male Cyclists Female Cyclists
PercentagesMale Cyclists
2010 Bicycle Count Report
City of Portland Bicycle Counts by YearGender and Helmet Use
w/ helmets w/o helmets Total w/ helmets w/o helmets Total w/ helmets w/o helmets Total w/ helmets w/o helmets Total w/ helmets w/o helmets w/ helmets w/o helmets w/ helmets w/o helmets1992 62 45 107 16 6 22 58% 42% 83% 73% 27% 17% 60% 40% 48% 35% 12% 5% 129 cyclists1993 0 0 0 0 0 0 0 cyclists1994 0 0 0 0 0 0 0 cyclists1995 40 19 59 19 2 21 68% 32% 74% 90% 10% 26% 74% 26% 50% 24% 24% 3% 80 cyclists1996 0 0 0 0 0 0 0 cyclists1997 156 146 302 71 29 100 52% 48% 75% 71% 29% 25% 56% 44% 39% 36% 18% 7% 402 cyclists1998 197 119 316 92 40 132 62% 38% 71% 70% 30% 29% 65% 35% 44% 27% 21% 9% 448 cyclists1999 170 128 298 60 28 88 57% 43% 77% 68% 32% 23% 60% 40% 44% 33% 16% 7% 386 cyclists2000 403 133 536 159 41 200 75% 25% 73% 80% 21% 27% 76% 24% 55% 18% 22% 6% 736 cyclists2001 821 375 1,196 359 91 450 69% 31% 73% 80% 20% 27% 72% 28% 50% 23% 22% 6% 1,646 cyclists2002 88 28 116 63 10 73 76% 24% 61% 86% 14% 39% 80% 20% 47% 15% 33% 5% 189 cyclists2003 301 161 462 153 42 195 65% 35% 70% 78% 22% 30% 69% 31% 46% 25% 23% 6% 657 cyclists2004 148 65 213 69 32 101 69% 31% 68% 68% 32% 32% 69% 31% 47% 21% 22% 10% 314 cyclists2005 0 0 0 0 0 0 0 cyclists2006 1,197 349 1,546 694 112 806 77% 23% 66% 86% 14% 34% 80% 20% 51% 15% 30% 5% 2,352 cyclists2007 1,058 361 1,419 543 95 638 75% 25% 69% 85% 15% 31% 78% 22% 51% 18% 26% 5% 2,057 cyclists2008 3,762 822 4,584 2,238 272 2,510 82% 18% 65% 89% 11% 35% 85% 15% 53% 12% 32% 4% 7,094 cyclists2009 1,615 411 2,026 873 119 992 80% 20% 67% 88% 12% 33% 82% 18% 54% 14% 29% 4% 3,018 cyclists2010 1,823 476 2,299 929 153 1,082 79% 21% 68% 86% 14% 32% 81% 19% 54% 14% 27% 5% 3,381 cyclists
Total 11,841 3,638 15,479 6,338 1,072 7,410 76% 24% 68% 86% 14% 32% 79% 21% 52% 16% 28% 5% 22,889 cyclists
w/ helmets w/o helmets Total w/ helmets w/o helmets Total w/ helmets w/o helmets Total w/ helmets w/o helmets Total w/ helmets w/o helmets w/ helmets w/o helmets w/ helmets w/o helmets1992 4 18 22 4 5 9 18% 82% 71% 44% 56% 29% 26% 74% 13% 58% 13% 16% 31 cyclists1993 52 40 92 22 14 36 57% 43% 72% 61% 39% 28% 58% 42% 41% 31% 17% 11% 128 cyclists1994 0 0 0 0 0 0 0 cyclists1995 59 63 122 15 11 26 48% 52% 82% 58% 42% 18% 50% 50% 40% 43% 10% 7% 148 cyclists1996 19 28 47 12 7 19 40% 60% 71% 63% 37% 29% 47% 53% 29% 42% 18% 11% 66 cyclists1997 231 233 464 82 43 125 50% 50% 79% 66% 34% 21% 53% 47% 39% 40% 14% 7% 589 cyclists1998 180 173 353 63 39 102 51% 49% 78% 62% 38% 22% 53% 47% 40% 38% 14% 9% 455 cyclists1999 200 161 361 75 33 108 55% 45% 77% 69% 31% 23% 59% 41% 43% 34% 16% 7% 469 cyclists2000 270 207 477 84 72 156 57% 43% 75% 54% 46% 25% 56% 44% 43% 33% 13% 11% 633 cyclists2001 304 140 444 133 40 173 68% 32% 72% 77% 23% 28% 71% 29% 49% 23% 22% 6% 617 cyclists2002 150 80 230 54 29 83 65% 35% 73% 65% 35% 27% 65% 35% 48% 26% 17% 9% 313 cyclists2003 18 9 27 9 4 13 67% 33% 68% 69% 31% 33% 68% 33% 45% 23% 23% 10% 40 cyclists2004 66 52 118 16 8 24 56% 44% 83% 67% 33% 17% 58% 42% 46% 37% 11% 6% 142 cyclists2005 35 29 64 22 2 24 55% 45% 73% 92% 8% 27% 65% 35% 40% 33% 25% 2% 88 cyclists2006 87 53 140 31 26 57 62% 38% 71% 54% 46% 29% 60% 40% 44% 27% 16% 13% 197 cyclists2007 322 133 455 150 51 201 71% 29% 69% 75% 25% 31% 72% 28% 49% 20% 23% 8% 656 cyclists2008 867 257 1,124 387 86 473 77% 23% 70% 82% 18% 30% 79% 21% 54% 16% 24% 5% 1,597 cyclists2009 870 324 1,194 381 77 458 73% 27% 72% 83% 17% 28% 76% 24% 53% 20% 23% 5% 1,652 cyclists2010 898 411 1,309 489 151 640 69% 31% 67% 76% 24% 33% 71% 29% 46% 21% 25% 8% 1,949 cyclists
Total 4,632 2,411 7,043 2,029 698 2,727 66% 34% 72% 74% 26% 28% 68% 32% 47% 25% 21% 7% 9,770 cyclists
Percentages Male Cyclists as % of all cyclists
Female Cyclists as % of all cyclistsMale Cyclists Female Cyclists Male Cyclists Female Cyclists All Cyclists
Female Cyclists Male Cyclists Female Cyclists
Based on
Percentages Male Cyclists as % of all cyclists
Female Cyclists as % of all cyclistsAll Cyclists Based onMale Cyclists
North Portland
Northwest Portland
2010 Bicycle Count Report
City of Portland Bicycle Counts by YearGender and Helmet Use
w/ helmets w/o helmets Total w/ helmets w/o helmets Total w/ helmets w/o helmets Total w/ helmets w/o helmets Total w/ helmets w/o helmets w/ helmets w/o helmets w/ helmets w/o helmets1992 16 59 75 9 18 27 21% 79% 74% 33% 67% 26% 25% 75% 16% 58% 9% 18% 102 cyclists1993 0 0 0 0 0 0 0 cyclists1994 8 16 24 4 6 10 33% 67% 71% 40% 60% 29% 35% 65% 24% 47% 12% 18% 34 cyclists1995 130 66 196 71 23 94 66% 34% 68% 76% 24% 32% 69% 31% 45% 23% 24% 8% 290 cyclists1996 179 35 214 49 8 57 84% 16% 79% 86% 14% 21% 84% 16% 66% 13% 18% 3% 271 cyclists1997 405 192 597 162 30 192 68% 32% 76% 84% 16% 24% 72% 28% 51% 24% 21% 4% 789 cyclists1998 471 189 660 172 43 215 71% 29% 75% 80% 20% 25% 73% 27% 54% 22% 20% 5% 875 cyclists1999 273 90 363 89 20 109 75% 25% 77% 82% 18% 23% 77% 23% 58% 19% 19% 4% 472 cyclists2000 374 108 482 113 28 141 78% 22% 77% 80% 20% 23% 78% 22% 60% 17% 18% 4% 623 cyclists2001 92 36 128 45 1 46 72% 28% 74% 98% 2% 26% 79% 21% 53% 21% 26% 1% 174 cyclists2002 125 18 143 21 1 22 87% 13% 87% 95% 5% 13% 88% 12% 76% 11% 13% 1% 165 cyclists2003 180 52 232 57 14 71 78% 22% 77% 80% 20% 23% 78% 22% 59% 17% 19% 5% 303 cyclists2004 0 0 0 0 0 0 0 cyclists2005 0 0 0 0 0 0 0 cyclists2006 695 85 780 220 13 233 89% 11% 77% 94% 6% 23% 90% 10% 69% 8% 22% 1% 1,013 cyclists2007 1,892 441 2,333 945 97 1,042 81% 19% 69% 91% 9% 31% 84% 16% 56% 13% 28% 3% 3,375 cyclists2008 3,010 740 3,750 1,385 136 1,521 80% 20% 71% 91% 9% 29% 83% 17% 57% 14% 26% 3% 5,271 cyclists
2008* 1,753 317 2,070 747 64 811 85% 15% 72% 92% 8% 28% 87% 13% 61% 11% 26% 2% 2,881 cyclists2009 3,371 867 4,238 1,475 222 1,697 80% 20% 71% 87% 13% 29% 82% 18% 57% 15% 25% 4% 5,935 cyclists
2009* 1,588 242 1,830 584 53 637 87% 13% 74% 92% 8% 26% 88% 12% 64% 10% 24% 2% 2,467 cyclists2010 3,703 990 4,693 1,646 232 1,878 79% 21% 71% 88% 12% 29% 81% 19% 56% 15% 25% 4% 6,571 cyclists
2010* 1,763 257 2,020 605 59 664 87% 13% 75% 91% 9% 25% 88% 12% 66% 10% 23% 2% 2,684 cyclists
Total 14,924 3,984 18,908 6,463 892 7,355 79% 21% 72% 88% 12% 28% 81% 19% 57% 15% 25% 3% 26,263 cyclists*not including Central City
w/ helmets w/o helmets Total w/ helmets w/o helmets Total w/ helmets w/o helmets Total w/ helmets w/o helmets Total w/ helmets w/o helmets w/ helmets w/o helmets w/ helmets w/o helmets1992 0 0 0 0 0 0 0 cyclists1993 0 0 0 0 0 0 0 cyclists1994 0 0 0 0 0 0 0 cyclists1995 0 0 0 0 0 0 0 cyclists1996 0 0 0 0 0 0 0 cyclists1997 0 0 0 0 0 0 0 cyclists1998 0 0 0 0 0 0 0 cyclists1999 0 0 0 0 0 0 0 cyclists2000 0 0 0 0 0 0 0 cyclists2001 0 0 0 0 0 0 0 cyclists2002 0 0 0 0 0 0 0 cyclists2003 0 0 0 0 0 0 0 cyclists2004 0 0 0 0 0 0 0 cyclists2005 0 0 0 0 0 0 0 cyclists2006 71 153 224 16 18 34 32% 68% 87% 47% 53% 13% 34% 66% 28% 59% 6% 7% 258 cyclists2007 241 187 428 61 37 98 56% 44% 81% 62% 38% 19% 57% 43% 46% 36% 12% 7% 526 cyclists2008 511 337 848 150 45 195 60% 40% 81% 77% 23% 19% 63% 37% 49% 32% 14% 4% 1,043 cyclists2009 506 372 878 143 57 200 58% 42% 81% 72% 29% 19% 60% 40% 47% 35% 13% 5% 1,078 cyclists2010 551 467 1,018 178 69 247 54% 46% 80% 72% 28% 20% 58% 42% 44% 37% 14% 5% 1,265 cyclists
Total 1,880 1,516 3,396 548 226 774 55% 45% 81% 71% 29% 19% 58% 42% 45% 36% 13% 5% 4,170 cyclists
Percentages Male Cyclists as % of all cyclists
Female Cyclists as % of all cyclistsMale Cyclists Female Cyclists Male Cyclists Female Cyclists All Cyclists
Female Cyclists Male Cyclists Female Cyclists
Based on
Percentages Male Cyclists as % of all cyclists
Female Cyclists as % of all cyclistsAll Cyclists Based onMale Cyclists
Southwest Portland
East Portland
2010 Bicycle Count Report
City of Portland Bicycle Counts by YearGender and Helmet Use
w/ helmets w/o helmets Total w/ helmets w/o helmets Total w/ helmets w/o helmets Total w/ helmets w/o helmets Total w/ helmets w/o helmets w/ helmets w/o helmets w/ helmets w/o helmets1992 70 71 141 17 16 33 50% 50% 81% 52% 48% 19% 50% 50% 40% 41% 10% 9% 174 cyclists1993 177 171 348 79 41 120 51% 49% 74% 66% 34% 26% 55% 45% 38% 37% 17% 9% 468 cyclists1994 67 38 105 24 9 33 64% 36% 76% 73% 27% 24% 66% 34% 49% 28% 17% 7% 138 cyclists1995 311 110 421 124 66 190 74% 26% 69% 65% 35% 31% 71% 29% 51% 18% 20% 11% 611 cyclists1996 412 301 713 128 79 207 58% 42% 78% 62% 38% 23% 59% 41% 45% 33% 14% 9% 920 cyclists1997 736 517 1,253 335 124 459 59% 41% 73% 73% 27% 27% 63% 37% 43% 30% 20% 7% 1,712 cyclists1998 929 770 1,699 393 180 573 55% 45% 75% 69% 31% 25% 58% 42% 41% 34% 17% 8% 2,272 cyclists1999 656 367 1,023 254 97 351 64% 36% 74% 72% 28% 26% 66% 34% 48% 27% 18% 7% 1,374 cyclists2000 627 367 994 262 86 348 63% 37% 74% 75% 25% 26% 66% 34% 47% 27% 20% 6% 1,342 cyclists2001 1,416 690 2,106 615 177 792 67% 33% 73% 78% 22% 27% 70% 30% 49% 24% 21% 6% 2,898 cyclists2002 0 0 0 0 0 0 0 cyclists2003 402 272 674 233 126 359 60% 40% 65% 65% 35% 35% 61% 39% 39% 26% 23% 12% 1,033 cyclists2004 246 134 380 116 47 163 65% 35% 70% 71% 29% 30% 67% 33% 45% 25% 21% 9% 543 cyclists2005 0 0 0 0 0 0 0 cyclists2006 927 494 1,421 464 140 604 65% 35% 70% 77% 23% 30% 69% 31% 46% 24% 23% 7% 2,025 cyclists2007 985 362 1,347 540 134 674 73% 27% 67% 80% 20% 33% 75% 25% 49% 18% 27% 7% 2,021 cyclists2008 1,408 480 1,888 839 181 1,020 75% 25% 65% 82% 18% 35% 77% 23% 48% 17% 29% 6% 2,908 cyclists2009 1,452 469 1,921 878 190 1,068 76% 24% 64% 82% 18% 36% 78% 22% 49% 16% 29% 6% 2,989 cyclists2010 1,794 617 2,411 1,028 210 1,238 74% 26% 66% 83% 17% 34% 77% 23% 49% 17% 28% 6% 3,649 cyclists
Total 12,615 6,230 18,845 6,329 1,903 8,232 67% 33% 70% 77% 23% 30% 70% 30% 47% 23% 23% 7% 27,077 cyclists
w/ helmets w/o helmets Total w/ helmets w/o helmets Total w/ helmets w/o helmets Total w/ helmets w/o helmets Total w/ helmets w/o helmets w/ helmets w/o helmets w/ helmets w/o helmets1992 1 12 13 0 2 2 8% 92% 87% 0% 100% 13% 7% 93% 7% 80% 0% 13% 15 cyclists1993 0 0 0 0 0 0 0 cyclists1994 0 0 0 0 0 0 0 cyclists1995 302 143 445 91 60 151 68% 32% 75% 60% 40% 25% 66% 34% 51% 24% 15% 10% 596 cyclists1996 294 184 478 146 41 187 62% 38% 72% 78% 22% 28% 66% 34% 44% 28% 22% 6% 665 cyclists1997 598 340 938 250 111 361 64% 36% 72% 69% 31% 28% 65% 35% 46% 26% 19% 9% 1,299 cyclists1998 452 267 719 181 93 274 63% 37% 72% 66% 34% 28% 64% 36% 46% 27% 18% 9% 993 cyclists1999 679 363 1,042 286 86 372 65% 35% 74% 77% 23% 26% 68% 32% 48% 26% 20% 6% 1,414 cyclists2000 690 296 986 281 74 355 70% 30% 74% 79% 21% 26% 72% 28% 51% 22% 21% 6% 1,341 cyclists2001 1,101 377 1,478 480 148 628 74% 26% 70% 76% 24% 30% 75% 25% 52% 18% 23% 7% 2,106 cyclists2002 0 0 0 0 0 0 0 cyclists2003 953 397 1,350 458 136 594 71% 29% 69% 77% 23% 31% 73% 27% 49% 20% 24% 7% 1,944 cyclists2004 941 386 1,327 473 129 602 71% 29% 69% 79% 21% 31% 73% 27% 49% 20% 25% 7% 1,929 cyclists2005 1,029 364 1,393 506 134 640 74% 26% 69% 79% 21% 31% 76% 24% 51% 18% 25% 7% 2,033 cyclists2006 1,339 569 1,908 623 193 816 70% 30% 70% 76% 24% 30% 72% 28% 49% 21% 23% 7% 2,724 cyclists2007 2,151 882 3,033 1,130 310 1,440 71% 29% 68% 78% 22% 32% 73% 27% 48% 20% 25% 7% 4,473 cyclists2008 3,386 1,148 4,534 1,755 388 2,143 75% 25% 68% 82% 18% 32% 77% 23% 51% 17% 26% 6% 6,677 cyclists2009 3,526 1,444 4,970 1,869 554 2,423 71% 29% 67% 77% 23% 33% 73% 27% 48% 20% 25% 7% 7,393 cyclists2010 3,667 1,461 5,128 2,062 509 2,571 72% 28% 67% 80% 20% 33% 74% 26% 48% 19% 27% 7% 7,699 cyclists
2010Total 21,109 8,633 29,742 10,591 2,968 13,559 71% 29% 69% 78% 22% 31% 73% 27% 49% 20% 24% 7% 43,301 cyclists
Percentages Male Cyclists as % of all cyclists
Female Cyclists as % of all cyclistsMale Cyclists Female Cyclists Male Cyclists Female Cyclists All Cyclists
Female Cyclists Male Cyclists Female Cyclists
Based on
Percentages Male Cyclists as % of all cyclists
Female Cyclists as % of all cyclistsAll Cyclists Based onMale Cyclists
Inner NE Portland
Inner SE Portland
2010 Bicycle Count Report
Bicycle And Auto Counts on the Four Main Bicycle-Friendly Downtown Bridges1991-2010
1991 1992 1993 1994 1995 1996 1997 1998 1999 2000 2001 2002 2003 2004 2005 2006 2007 2008 2009 2010
bikes 495 755 735 690 527 950 1,205 1,854 1,476 1,405 1,680 1,712 1,683 2,081 2,856 3,872 4,315 3,825 5,291
autos 30,215 30,215 30,034 30,215 30,395 31,630 31,630 32,864 32,420 24,375 26,946 27,262 27,261 27,261 27,259 27,259 27,259 27,259 28,395 28,395
% bikes of all vehicles 2% 2% 2% 2% 2% 3% 4% 5% 4% 5% 6% 6% 6% 0% 7% 9% 12% 14% 12% 16%auto change since 1991 0% -1% 0% 1% 5% 5% 9% 7% -19% -11% -10% -10% -10% -10% -10% -10% -10% -6% -6%
bike increase since 1991 53% 48% 39% 6% 92% 143% 275% 198% 184% 239% 246% 240% -100% 320% 477% 682% 772% 673% 969%
Annual % change 53% -3% -6% -24% 80% 27% 54% -20% -5% 20% 2% -2% -100% 24% 37% 36% 11% -11% 38%
bikes 230 230 220 220 200 350 475 460 360 410 1,250 1,891 1,860 3,482 2,112 2,373 2,943 2,982 3,101 3,287
autos 18,740 18,740 19,761 18,740 18,740 17,719 15,827 16,717 18,279 17,780 19,121 17,264 17,264 17,264 17,264 17,264 17,264 17,264 14,152 15,708
% bikes of all vehicles 1% 1% 1% 1% 1% 2% 3% 3% 2% 2% 6% 10% 10% 17% 11% 12% 15% 15% 18% 17%auto change since 1991 0% 5% 0% 0% -5% -16% -11% -2% -5% 2% -8% -8% -8% -8% -8% -8% -8% -24% -16%
bike increase since 1991 0% -4% -4% -13% 52% 107% 100% 57% 78% 443% 722% 709% 1414% 818% 932% 1180% 1197% 1248% 1329%
Annual % change 0% -4% 0% -9% 75% 36% -3% -22% 14% 205% 51% -2% 87% 14% 12% 24% 1% 4% 6%
bikes 740 1,075 1,010 980 620 1,065 1,375 905 920 1,080 965 965 965 965 1,170 1,260 1,325 2,035 1,760 1,865
autos 35,209 37,618 37,618 37,618 37,618 37,618 40,027 45,060 47,564 45,846 49,247 40,884 39,985 39,985 39,085 39,085 39,085 39,085 33,184 36,135
% bikes of all vehicles 2% 3% 3% 3% 2% 3% 3% 2% 2% 2% 2% 2% 2% 2% 3% 3% 3% 5% 5% 5%auto change since 1991 7% 7% 7% 7% 7% 14% 28% 35% 30% 40% 16% 14% 14% 11% 11% 11% 11% -6% 3%
bike increase since 1991 45% 36% 32% -16% 44% 86% 22% 24% 46% 30% 30% 30% 30% 58% 70% 79% 175% 138% 152%
Annual % change 45% -6% -3% -37% 72% 29% -34% 2% 17% -11% 0% 0% 0% 21% 8% 5% 54% -14% 6%
bikes 1,390 1,500 1,920 1,940 1,910 2,165 2,170 2,471 3,154 3,125 3,729 3,682 4,055 4,428 4,829 5,557 6,423 7,379 7,063 7,133
autos 29,041 29,041 25,877 29,041 29,041 33,041 27,496 28,145 23,437 36,249 29,674 29,674 29,674 29,674 29,412 29,412 29,412 29,412 26,129 27,771
% bikes of all vehicles 5% 5% 7% 6% 6% 6% 7% 8% 12% 8% 11% 11% 12% 13% 14% 16% 18% 20% 21% 20%auto change since 1991 0% -11% 0% 0% 14% -5% -3% -19% 25% 2% 2% 2% 2% 1% 1% 1% 1% -10% -4%
bike increase since 1991 8% 38% 40% 37% 56% 56% 78% 127% 125% 168% 165% 192% 219% 247% 300% 362% 431% 408% 413%
Annual % change 8% 28% 1% -2% 13% 0% 14% 28% -1% 19% -1% 10% 9% 9% 15% 16% 15% -4% 1%
All Bridgesbikes 2,855 3,560 3,885 3,830 3,257 4,530 5,225 5,690 5,910 6,020 7,624 8,250 8,563 8,875 10,192 12,046 14,563 16,711 15,749 17,576
autos 113,204 115,613 113,290 115,613 115,794 120,008 114,980 122,786 121,700 124,250 124,988 115,084 114,183 114,183 113,020 113,020 113,020 113,020 101,860 108,008
% bikes of all vehicles 2% 3% 3% 3% 3% 4% 4% 4% 5% 5% 6% 7% 7% 7% 8% 10% 11% 13% 13% 14%auto change since 1991 2% 0% 2% 2% 6% 2% 8% 8% 10% 10% 2% 1% 1% 0% 0% 0% 0% -10% -5%
bike increase since 1991 25% 36% 34% 14% 59% 83% 99% 107% 111% 167% 189% 200% 211% 257% 322% 410% 485% 452% 516%
Annual % change 25% 9% -1% -15% 39% 15% 9% 4% 2% 27% 8% 4% 4% 15% 18% 21% 15% -6% 12%--interpolated or averaged (created) value
bike increase since 2000 27% 37% 42% 47% 69% 100% 142% 178% 162% 192%bike increase since 1996 15% 26% 30% 33% 68% 82% 89% 96% 125% 166% 221% 269% 248% 288%bike increase since 1991 25% 36% 34% 14% 59% 83% 99% 107% 111% 167% 189% 200% 211% 257% 322% 410% 485% 452% 516%
Broadway
Hawthorne
Burnside
Steel
11/19/2010