28
FIFA World Quality of Service Report 1 | Page 2010 FIFA World Cup Quality of Service Report Compiled by: Eric Nkopodi August 2010
FIFA World Quality of Service Report
1 | P a g e
2010 FIFA World Cup Quality of Service
Report
Compiled by: Eric Nkopodi
August 2010

FIFA World Quality of Service Report
2 | P a g e
Contents
Abbreviations ..................................................................................................................................................................... 4
Definitions.......................................................................................................................................................................... 4
1. Introduction ............................................................................................................................................................... 6
1.1 Background ....................................................................................................................................................... 6 1.2 Objectives .......................................................................................................................................................... 7 1.3 Consumer issues during the tournament ......................................................................................................... 7
2. Drive Test Methodology ............................................................................................................................................ 8
3. Computational Methodology..................................................................................................................................... 9
4. Measurements results ............................................................................................................................................. 11
Measurements Details ............................................................................................................................................. 11
4.1 Soccer City Stadium ........................................................................................................................................ 12 4.1.1 Measurement Results ...................................................................................................................................... 12
4.2 Ellis Park Stadium ............................................................................................................................................ 13 4.2.1 Measurement Results ...................................................................................................................................... 14
4.3 Loftus Versfeld Stadium .................................................................................................................................. 15 4.3.1 Measurement Results ...................................................................................................................................... 15
4.4 Free State Stadium .......................................................................................................................................... 16 4.4.1 Measurement Results ...................................................................................................................................... 17
4.5 Nelson Mandela Bay Stadium ........................................................................................................................ 18 4.5.1 Measurement Results ...................................................................................................................................... 18
4.6 Royal Bafokeng Stadium ................................................................................................................................. 19 4.6.1 Measurement Results ...................................................................................................................................... 20
4.7 Peter Mokaba Stadium ................................................................................................................................... 21 4.7.1 Measurement Results ...................................................................................................................................... 21
4.8 Moses Mabida Stadium .................................................................................................................................. 22 4.8.1 Measurement Results ...................................................................................................................................... 23
4.9 Mbombela Stadium ........................................................................................................................................ 24 4.9.1 Measurement Results ...................................................................................................................................... 24

FIFA World Quality of Service Report
3 | P a g e
4.10 Green point Stadium ....................................................................................................................................... 25 4.10.1 Measurement Results .............................................................................................................................. 26
5. Average Results ........................................................................................................................................................ 27
6. Conclusion and Recommendations ......................................................................................................................... 27

FIFA World Quality of Service Report
4 | P a g e
Abbreviations
CC Cell C
DCR Drop Call Rate
BSC Base Station Controller
FWC FIFA World Cup
GOS Grade of Service
GSM Global Systems for Mobile
ICASA Independent Communications Authority of South Africa
RXQual Receiver Quality
RXlev Receiver Level
SM&C Spectrum Monitoring and Control
QoS Quality of Service
VC Vodacom
Definitions
Completed Calls
These are calls that were successfully set up and received by the called party
including the release failed calls.
Call Setup Rate
These are the percentage of calls that are successfully setup to a valid number,
properly dialed and where called party busy tone, ringing tone or answer signal is
recognized at the Network Termination Point of the calling user.
Call Drop Rate
A percentage of calls that are unintentionally disconnected in the middle of the
conversation without the user’s intervention.
FIFA World Quality of Service Report
5 | P a g e
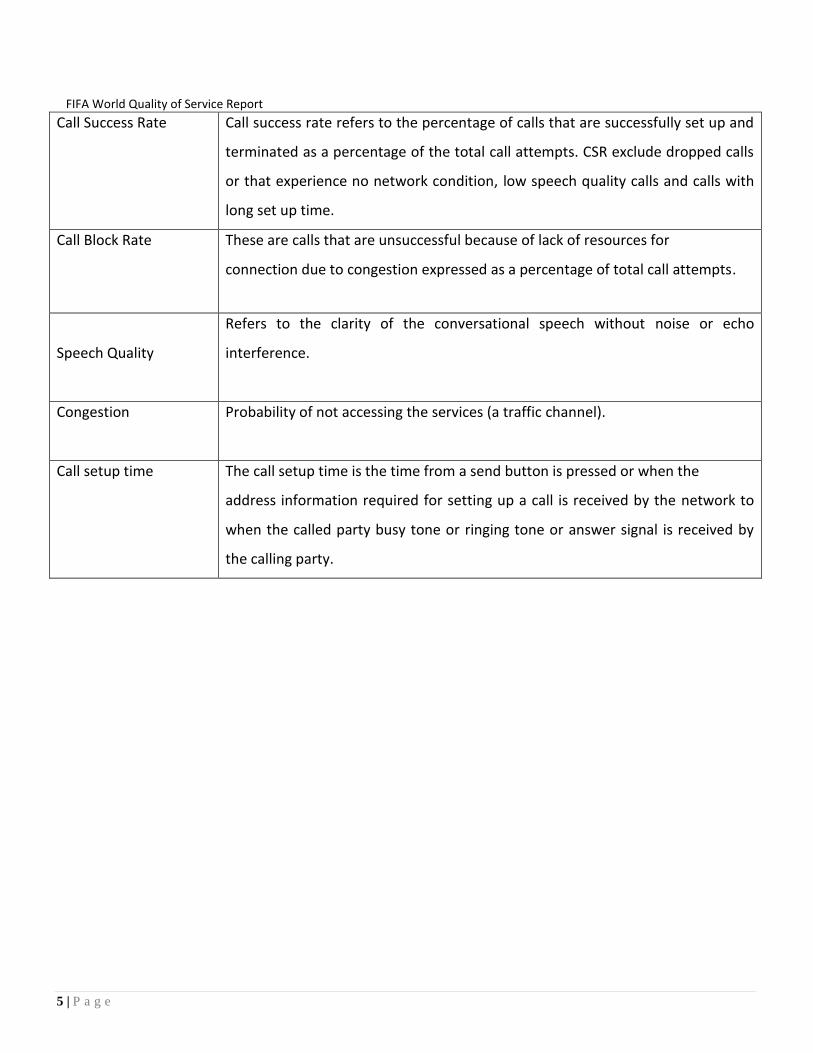
Call Success Rate
Call success rate refers to the percentage of calls that are successfully set up and
terminated as a percentage of the total call attempts. CSR exclude dropped calls
or that experience no network condition, low speech quality calls and calls with
long set up time.
Call Block Rate
These are calls that are unsuccessful because of lack of resources for
connection due to congestion expressed as a percentage of total call attempts.
Speech Quality
Refers to the clarity of the conversational speech without noise or echo
interference.
Congestion
Probability of not accessing the services (a traffic channel).
Call setup time
The call setup time is the time from a send button is pressed or when the
address information required for setting up a call is received by the network to
when the called party busy tone or ringing tone or answer signal is received by
the calling party.

FIFA World Quality of Service Report
6 | P a g e
1. Introduction
1.1 Background
The SM&C Department of ICASA performed QoS monitoring in all the ten stadia for the FWC. The
measurement tests were performed during match days. This report will give an analysis of all stadium
measurements.
Fig 1: Map showing the stadiums where the measurements were conducted

FIFA World Quality of Service Report
7 | P a g e
1.2 Objectives
The objectives of QoS Monitoring were:
(i) To measure the GSM service to the telecommunications user;
(ii) To measure coverage during the match days.
(iii) To measure Radio Congestion during match days.
1.3 Consumer issues during the tournament
One of ICASA’s mandates is to ensure that the consumers are protected and given acceptable Quality of
Service level. Some of the challenges that were experienced during FWC were:
Some service providers were limiting the number of subscribers that they accept concurrently in the
network.
Instances when the network was inaccessible making it impossible for one to make or receive
phone calls.

FIFA World Quality of Service Report
8 | P a g e
2. Drive Test Methodology
Drive testing is the most common and possibly the best way to analyse Network performance by means
of coverage evaluation, system availability, network capacity, network retainability and call quality.
Although these tests only provide data on the downlink side of the process, it provides a perspective to
the service provider about what’s happening from a subscriber point of view. The drive testing is
basically collecting measurement data with drive test equipment.
The Drive Test equipment consists of:
TEMS Investigation Software
Maps of South Africa
TEMS phones
GPS
Laptop
In each area where the tests were conducted, the distance covered was at least 400m around the
stadium.
Voice Quality enabled Mobile to Mobile test methodology was adopted. Mobile 1 (Vodacom) was
used to call Mobile 2 (MTN) and Mobile 3 (Cell-C).
The minimum samples of calls were 100 calls per test.
Long Calls and Short Calls were initiated to provide a true reflection of the actual GSM network
coverage and performance.

FIFA World Quality of Service Report
9 | P a g e
3. Computational Methodology
Call Success Rate
Call Success Rate refers to the percentage of calls that are successfully set up and terminated as a
percentage of the total call attempts. CSR exclude dropped calls or calls that experience no network
condition, low speech quality calls and calls with long set up time. The number of successful call setups
should be divided by the number of call setups. The result, and the number of call setups, is taken as
Measurement’s results. CSR can be calculated as shown below:
Call Success Rate
Call Attempts X
Call Failures Y
CSR = (X/Y ) * 100
Drop Call Rate
Dropped Call Rate means the rate at which a call, in which connection succeeds, (i.e. the network is
accessed and set up is successful, whether or not the communication channel is assigned) but is
disconnected due to abnormal call release. The measurement of dropped call rate is described by the
ratio of successful originated calls that were found to drop to the total num of successful originated
calls that were correctly released. DCR can be calculated as shown below:
Drop Call Rate
Successful Call Attempts S
Drop Calls D
DCR = (S/D ) * 100
FIFA World Quality of Service Report
10 | P a g e
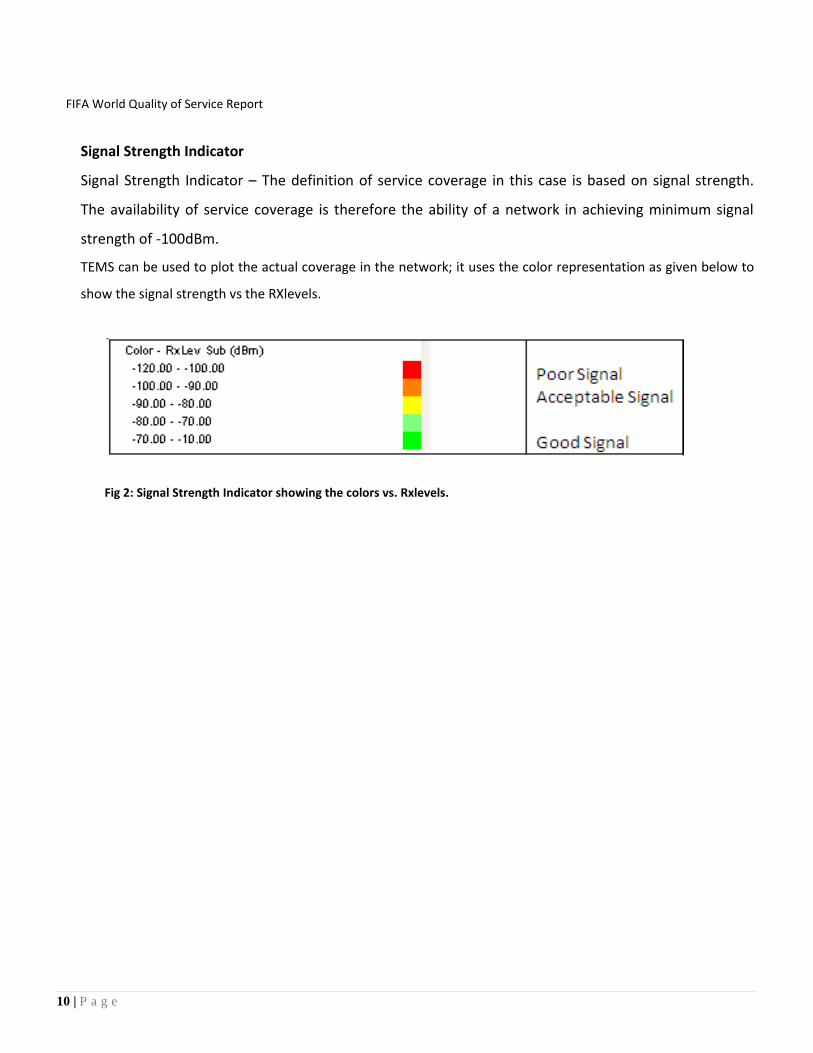
Signal Strength Indicator
Signal Strength Indicator – The definition of service coverage in this case is based on signal strength.
The availability of service coverage is therefore the ability of a network in achieving minimum signal
strength of -100dBm.
TEMS can be used to plot the actual coverage in the network; it uses the color representation as given below to
show the signal strength vs the RXlevels.
Fig 2: Signal Strength Indicator showing the colors vs. Rxlevels.

FIFA World Quality of Service Report
11 | P a g e
4. Measurements Results
The Quality of Service monitoring measurements were performed on the following dates:
Game Day Venue
01 10-Jun-10 SC-JHB
03 & 08 12-Jun-10 LV-PTA & EP-JHB
16 13-Jun-10 FS-BLM
22 16-Jun-10 MM-DBN
36 21-Jun-10 PM-PLK
33 22-Jun-10 RB-RUS
37 23-Jun-10 NMB-PE
46 25-Jun-10 MB-NEL
54 29-Jun-10 GP-CPT
Measurements Details
Collection Type
Only GSM technology measurements were conducted on Cell-C, MTN and
Vodacom’s networks. The objective was to conduct an unbiased comparison
of the quality performance of three mobile networks. The targets of the
parameters are based on ITU recommendations.
Collection Date
This report is based on measurements done before the match dates above.

FIFA World Quality of Service Report
12 | P a g e
4.1 Soccer City Stadium
4.1.1 Measurement Results
(i) Coverage map
MTN Vodacom Cell-C

FIFA World Quality of Service Report
13 | P a g e
(ii) Parameters
Metric Target MTN VC CC Comments
Overall Call Setup
Success Rate 98% 78 % 80% 83%
All operators below the
target
Good RxQual - Good
RxLev 95% 85% 81% 90%
All operators below the
target
Dropped Calls Rate 2% 4% 6% 0.01%
MTN and Vodacom below
the target
4.2 Ellis Park Stadium

FIFA World Quality of Service Report
14 | P a g e
4.2.1 Measurement Results
(i) Coverage map
MTN Vodacom Cell-C
(ii) Parameters
Metric Target MTN VC CC Comments
Overall Call Setup
Success Rate 98% 95.% 91% 92%
All operators below the
target
Good RxQual - Good
RxLev 95% 93% 92% 95%
MTN and Vodacom are
below the target
Dropped Calls Rate 2% 9% 12% 0%
MTN and Vodacom below
the target

FIFA World Quality of Service Report
15 | P a g e
4.3 Loftus Versfeld Stadium
4.3.1 Measurement Results
(i) Coverage map
MTN Vodacom Cell-C

FIFA World Quality of Service Report
16 | P a g e
(ii) Parameters
Metric Target MTN VC CC Comments
Overall Call Setup
Success Rate 98% 95% 92% 94%
All operators below the
target
Good RxQual - Good
RxLev 95% 85% 81% 90%
All operators below the
target
Dropped Calls Rate 2% 4% 6% 2%
MTN and Vodacom below
the target
4.4 Free State Stadium

FIFA World Quality of Service Report
17 | P a g e
4.4.1 Measurement Results
(i) Coverage map
MTN Vodacom Cell-C
(ii) Parameters
Metric Target MTN VC CC Comments
Overall Call Setup
Success Rate 98% 98% 100% 100%
All operators are above
the target
Good RxQual - Good
RxLev 95% 90% 98% 98% MTN is below the target
Dropped Calls Rate 2% 0.02% 0% 0%
All operators are above
the target
FIFA World Quality of Service Report
18 | P a g e
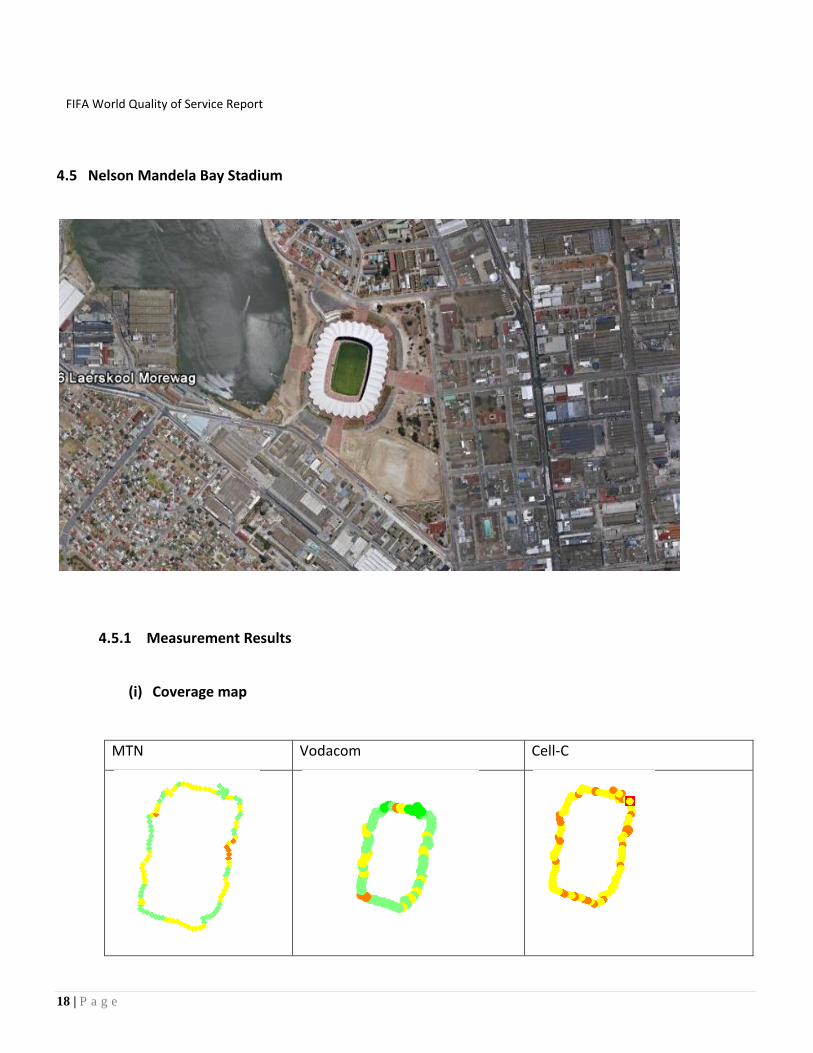
4.5 Nelson Mandela Bay Stadium
4.5.1 Measurement Results
(i) Coverage map
MTN Vodacom Cell-C
FIFA World Quality of Service Report
19 | P a g e
(ii) Parameters
Metric Target MTN VC CC Comments
Overall Call Setup
Success Rate 98% 100% 100% 98%
All operators are above
the target
Good RxQual - Good
RxLev 95% 95 % 97% 94%
All operators are above
the target
Dropped Calls Rate 2% 0% 0% 0%
All operators are above
the target
4.6 Royal Bafokeng Stadium
FIFA World Quality of Service Report
20 | P a g e
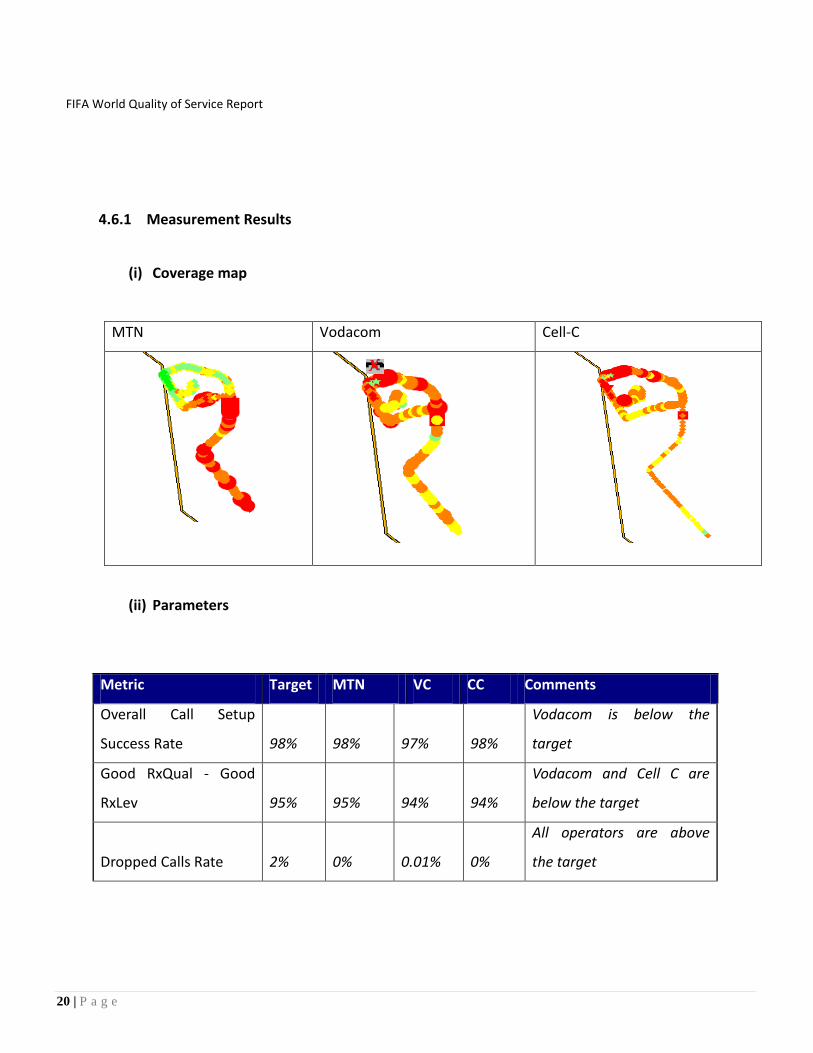
4.6.1 Measurement Results
(i) Coverage map
MTN Vodacom Cell-C
(ii) Parameters
Metric Target MTN VC CC Comments
Overall Call Setup
Success Rate 98% 98% 97% 98%
Vodacom is below the
target
Good RxQual - Good
RxLev 95% 95% 94% 94%
Vodacom and Cell C are
below the target
Dropped Calls Rate 2% 0% 0.01% 0%
All operators are above
the target

FIFA World Quality of Service Report
21 | P a g e
4.7 Peter Mokaba Stadium
4.7.1 Measurement Results
(i) Coverage map
MTN Vodacom Cell-C
FIFA World Quality of Service Report
22 | P a g e
(ii) Parameters
Metric Target MTN VC CC Comments
Overall Call Setup
Success Rate 98% 99% 100% 100%
All operators are above
the target
Good RxQual - Good
RxLev 95% 95% 97% 95%
All operators are within or
above the target
Dropped Calls Rate 2% 0.01% 0% 0%
All operators are above
the target
4.8 Moses Mabida Stadium
FIFA World Quality of Service Report
23 | P a g e
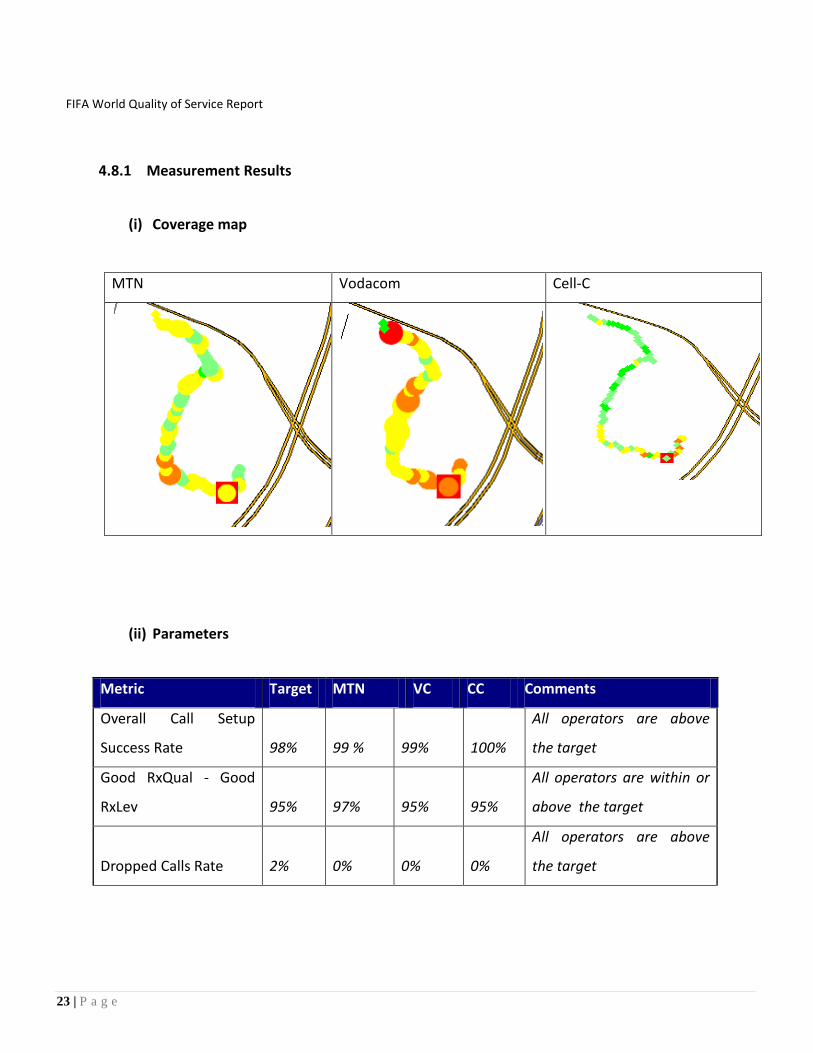
4.8.1 Measurement Results
(i) Coverage map
MTN Vodacom Cell-C
(ii) Parameters
Metric Target MTN VC CC Comments
Overall Call Setup
Success Rate 98% 99 % 99% 100%
All operators are above
the target
Good RxQual - Good
RxLev 95% 97% 95% 95%
All operators are within or
above the target
Dropped Calls Rate 2% 0% 0% 0%
All operators are above
the target

FIFA World Quality of Service Report
24 | P a g e
4.9 Mbombela Stadium
4.9.1 Measurement Results
(i) Coverage map
MTN Vodacom Cell-C

FIFA World Quality of Service Report
25 | P a g e
(ii) Parameters
Metric Target MTN VC CC Comments
Overall Call Setup
Success Rate 98% 82% 80% 80%
All operators below the
target
Good RxQual - Good
RxLev 95% 85% 81% 78%
All operators below the
target
Dropped Calls Rate 2% 3% 3% 3%
All operators below the
target
4.10 Green point Stadium
FIFA World Quality of Service Report
26 | P a g e
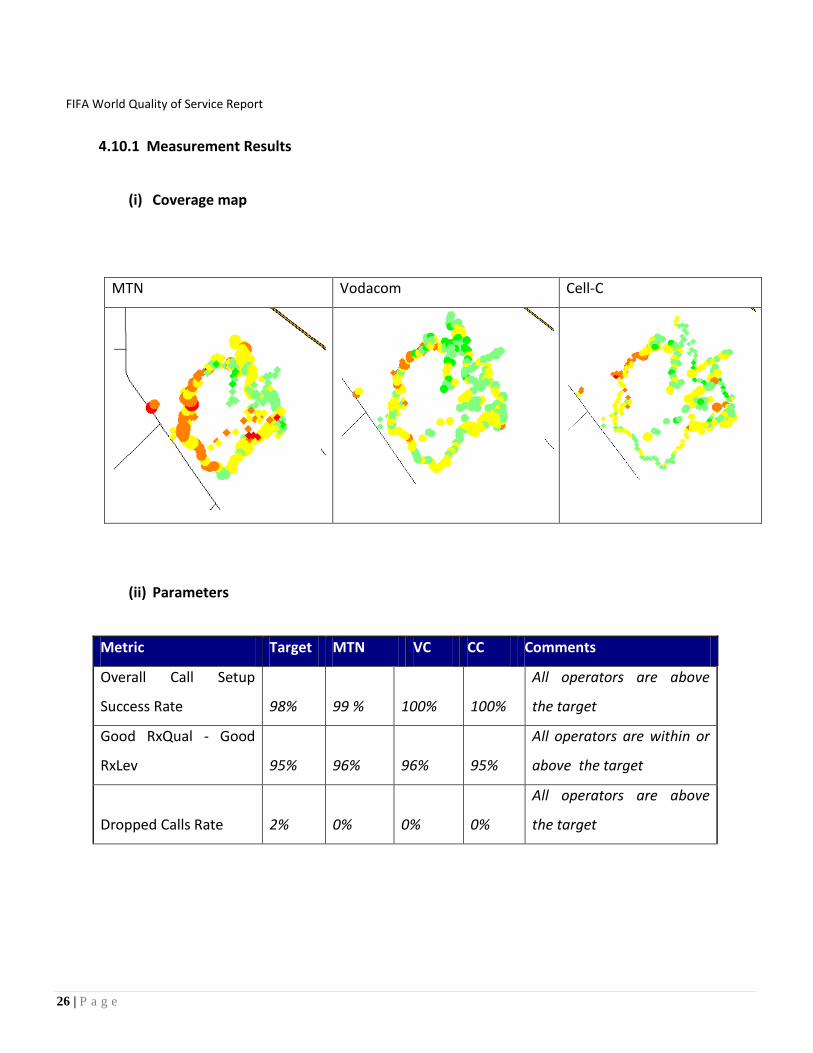
4.10.1 Measurement Results
(i) Coverage map
MTN Vodacom Cell-C
(ii) Parameters
Metric Target MTN VC CC Comments
Overall Call Setup
Success Rate 98% 99 % 100% 100%
All operators are above
the target
Good RxQual - Good
RxLev 95% 96% 96% 95%
All operators are within or
above the target
Dropped Calls Rate 2% 0% 0% 0%
All operators are above
the target

FIFA World Quality of Service Report
27 | P a g e
5. Average Results
(i) Parameters
Metric Target MTN VC CC Comments
Average Overall Call Setup
Success Rate 98% 93.90% 93.59 % 94.50 %
All operators below
the target
Average Good RxQual - Good
RxLev 95% 91.50% 91.20 % 92.64 %
All operators below
the target
Average Dropped Calls Rate 2% 2 % 2.6 % 0.30%
VC is below the
target
6. Conclusion and Recommendations
The drive test results represent a snapshot of the mobile service provider's network
performance based on the specified routes during the time of day when the measurements
were carried out and using a particular type of handset. The reported level of service quality
may therefore not be exactly comparable with the consumer's own experience;
The operators should be mandated to improve coverage in and around the stadiums so that
the consumers can enjoy Voice and Data services in future events.
ICASA should get three independent test numbers for independent results.
Most of the stadiums are built out of town, so more sites need to be brought up for capacity
improvements.
More licenses are needed in order to reduce the travelling costs, since South Africa is too big
to be monitored by SM&C only. Regional staff should be trained on the software to assist
SM&C with monitoring.
FIFA World Quality of Service Report
28 | P a g e
All the measurements of engineering standards such as Grade of Service (GOS) are to be
carried out in accordance with ITU-T’s recommendations.
Network performance parameters like Coverage, Drop calls Rate (DCR) and Call Completion
Rate (CCR) should be measured on a sample basis by the Authority from time to time, directly
or if it so chooses, through a Consultant.


