143
2010 ch Mar 245 Number 10, ies Ser Health Behaviors of Adults: United States, 2005–2007

2010
ch
Ma
r
245
Nu
mb
er
10,
ies
Ser
Health Behaviors of Adults: United States, 2005–2007

Copyright information
All material appearing in this report is in the public domain and may be reproduced or copied without permission; citation as to source, however, is appreciated.
Suggested citation
Schoenborn CA, Adams PF. Health behaviors of adults: United States, 2005–2007. National Center for Health Statistics. Vital Health Stat 10(245). 2010.
Library of Congress Catalog Number 362.1’0973’021s—dc21
For sale by the U.S. Government Printing Office Superintendent of Documents Mail Stop: SSOP Washington, DC 20402-9328 Printed on acid-free paper.

Series 10, Number 245
Health Behaviors of Adults: United States, 2005–2007
Data From the National Health Interview Survey
U.S. DEPARTMENT OF HEALTH AND HUMAN SERVICES Centers for Disease Control and Prevention National Center for Health Statistics
Hyattsville, Maryland March 2010 DHHS Publication No. (PHS) 2010–1573

National Center for Health Statistics
Edward J. Sondik, Ph.D., Director
Jennifer H. Madans, Ph.D., Associate Director for Science
Division of Health Interview Statistics
Jane F. Gentleman, Ph.D., Director

Contents
Abstract . . . . . . . . . . . . . . . . . . . . . . . . . . . . . . . . . . . . . . . . . . . . . . . . . . . . . . . . . . . . . . . . . . . . . . . . . . . . . . . . . . . . . . . . . . . . . . . . . . 1
Chapter 1. Introduction . . . . . . . . . . . . . . . . . . . . . . . . . . . . . . . . . . . . . . . . . . . . . . . . . . . . . . . . . . . . . . . . . . . . . . . . . . . . . . . . . . . . . . 1
Chapter 2. Methods . . . . . . . . . . . . . . . . . . . . . . . . . . . . . . . . . . . . . . . . . . . . . . . . . . . . . . . . . . . . . . . . . . . . . . . . . . . . . . . . . . . . . . . . . 3 Data Source . . . . . . . . . . . . . . . . . . . . . . . . . . . . . . . . . . . . . . . . . . . . . . . . . . . . . . . . . . . . . . . . . . . . . . . . . . . . . . . . . . . . . . . . . . . . . 3 Measurement of Health Behaviors . . . . . . . . . . . . . . . . . . . . . . . . . . . . . . . . . . . . . . . . . . . . . . . . . . . . . . . . . . . . . . . . . . . . . . . . . . . 3 Strengths and Limitations of the Data . . . . . . . . . . . . . . . . . . . . . . . . . . . . . . . . . . . . . . . . . . . . . . . . . . . . . . . . . . . . . . . . . . . . . . . . 5 Statistical Analysis . . . . . . . . . . . . . . . . . . . . . . . . . . . . . . . . . . . . . . . . . . . . . . . . . . . . . . . . . . . . . . . . . . . . . . . . . . . . . . . . . . . . . . . 6
Chapter 3. Alcohol Use . . . . . . . . . . . . . . . . . . . . . . . . . . . . . . . . . . . . . . . . . . . . . . . . . . . . . . . . . . . . . . . . . . . . . . . . . . . . . . . . . . . . . 7 All Adults. . . . . . . . . . . . . . . . . . . . . . . . . . . . . . . . . . . . . . . . . . . . . . . . . . . . . . . . . . . . . . . . . . . . . . . . . . . . . . . . . . . . . . . . . . . . . . . 7 Sex . . . . . . . . . . . . . . . . . . . . . . . . . . . . . . . . . . . . . . . . . . . . . . . . . . . . . . . . . . . . . . . . . . . . . . . . . . . . . . . . . . . . . . . . . . . . . . . . . . . . 7 Age. . . . . . . . . . . . . . . . . . . . . . . . . . . . . . . . . . . . . . . . . . . . . . . . . . . . . . . . . . . . . . . . . . . . . . . . . . . . . . . . . . . . . . . . . . . . . . . . . . . . 7 Race . . . . . . . . . . . . . . . . . . . . . . . . . . . . . . . . . . . . . . . . . . . . . . . . . . . . . . . . . . . . . . . . . . . . . . . . . . . . . . . . . . . . . . . . . . . . . . . . . . . 7 Hispanic or Latino Origin and Race. . . . . . . . . . . . . . . . . . . . . . . . . . . . . . . . . . . . . . . . . . . . . . . . . . . . . . . . . . . . . . . . . . . . . . . . . . 8 Education . . . . . . . . . . . . . . . . . . . . . . . . . . . . . . . . . . . . . . . . . . . . . . . . . . . . . . . . . . . . . . . . . . . . . . . . . . . . . . . . . . . . . . . . . . . . . . . 8 Poverty Status . . . . . . . . . . . . . . . . . . . . . . . . . . . . . . . . . . . . . . . . . . . . . . . . . . . . . . . . . . . . . . . . . . . . . . . . . . . . . . . . . . . . . . . . . . . 9 Marital Status. . . . . . . . . . . . . . . . . . . . . . . . . . . . . . . . . . . . . . . . . . . . . . . . . . . . . . . . . . . . . . . . . . . . . . . . . . . . . . . . . . . . . . . . . . . . 9 Geographic Region . . . . . . . . . . . . . . . . . . . . . . . . . . . . . . . . . . . . . . . . . . . . . . . . . . . . . . . . . . . . . . . . . . . . . . . . . . . . . . . . . . . . . . 10
Chapter 4. Cigarette Smoking . . . . . . . . . . . . . . . . . . . . . . . . . . . . . . . . . . . . . . . . . . . . . . . . . . . . . . . . . . . . . . . . . . . . . . . . . . . . . . . 19 All Adults. . . . . . . . . . . . . . . . . . . . . . . . . . . . . . . . . . . . . . . . . . . . . . . . . . . . . . . . . . . . . . . . . . . . . . . . . . . . . . . . . . . . . . . . . . . . . . 19 Sex . . . . . . . . . . . . . . . . . . . . . . . . . . . . . . . . . . . . . . . . . . . . . . . . . . . . . . . . . . . . . . . . . . . . . . . . . . . . . . . . . . . . . . . . . . . . . . . . . . . 19 Age. . . . . . . . . . . . . . . . . . . . . . . . . . . . . . . . . . . . . . . . . . . . . . . . . . . . . . . . . . . . . . . . . . . . . . . . . . . . . . . . . . . . . . . . . . . . . . . . . . . 19 Race . . . . . . . . . . . . . . . . . . . . . . . . . . . . . . . . . . . . . . . . . . . . . . . . . . . . . . . . . . . . . . . . . . . . . . . . . . . . . . . . . . . . . . . . . . . . . . . . . . 20 Hispanic or Latino Origin and Race. . . . . . . . . . . . . . . . . . . . . . . . . . . . . . . . . . . . . . . . . . . . . . . . . . . . . . . . . . . . . . . . . . . . . . . . . 20 Education . . . . . . . . . . . . . . . . . . . . . . . . . . . . . . . . . . . . . . . . . . . . . . . . . . . . . . . . . . . . . . . . . . . . . . . . . . . . . . . . . . . . . . . . . . . . . . 21 Poverty Status . . . . . . . . . . . . . . . . . . . . . . . . . . . . . . . . . . . . . . . . . . . . . . . . . . . . . . . . . . . . . . . . . . . . . . . . . . . . . . . . . . . . . . . . . . 21 Marital Status. . . . . . . . . . . . . . . . . . . . . . . . . . . . . . . . . . . . . . . . . . . . . . . . . . . . . . . . . . . . . . . . . . . . . . . . . . . . . . . . . . . . . . . . . . . 21 Geographic Region . . . . . . . . . . . . . . . . . . . . . . . . . . . . . . . . . . . . . . . . . . . . . . . . . . . . . . . . . . . . . . . . . . . . . . . . . . . . . . . . . . . . . . 22
Chapter 5. Leisure-time Physical Activity . . . . . . . . . . . . . . . . . . . . . . . . . . . . . . . . . . . . . . . . . . . . . . . . . . . . . . . . . . . . . . . . . . . . . 38 All Adults. . . . . . . . . . . . . . . . . . . . . . . . . . . . . . . . . . . . . . . . . . . . . . . . . . . . . . . . . . . . . . . . . . . . . . . . . . . . . . . . . . . . . . . . . . . . . . 38 Sex . . . . . . . . . . . . . . . . . . . . . . . . . . . . . . . . . . . . . . . . . . . . . . . . . . . . . . . . . . . . . . . . . . . . . . . . . . . . . . . . . . . . . . . . . . . . . . . . . . . 38 Age. . . . . . . . . . . . . . . . . . . . . . . . . . . . . . . . . . . . . . . . . . . . . . . . . . . . . . . . . . . . . . . . . . . . . . . . . . . . . . . . . . . . . . . . . . . . . . . . . . . 38 Race . . . . . . . . . . . . . . . . . . . . . . . . . . . . . . . . . . . . . . . . . . . . . . . . . . . . . . . . . . . . . . . . . . . . . . . . . . . . . . . . . . . . . . . . . . . . . . . . . . 38 Hispanic or Latino Origin and Race. . . . . . . . . . . . . . . . . . . . . . . . . . . . . . . . . . . . . . . . . . . . . . . . . . . . . . . . . . . . . . . . . . . . . . . . . 38 Education . . . . . . . . . . . . . . . . . . . . . . . . . . . . . . . . . . . . . . . . . . . . . . . . . . . . . . . . . . . . . . . . . . . . . . . . . . . . . . . . . . . . . . . . . . . . . . 39 Poverty Status . . . . . . . . . . . . . . . . . . . . . . . . . . . . . . . . . . . . . . . . . . . . . . . . . . . . . . . . . . . . . . . . . . . . . . . . . . . . . . . . . . . . . . . . . . 39 Marital Status. . . . . . . . . . . . . . . . . . . . . . . . . . . . . . . . . . . . . . . . . . . . . . . . . . . . . . . . . . . . . . . . . . . . . . . . . . . . . . . . . . . . . . . . . . . 39 Geographic Region . . . . . . . . . . . . . . . . . . . . . . . . . . . . . . . . . . . . . . . . . . . . . . . . . . . . . . . . . . . . . . . . . . . . . . . . . . . . . . . . . . . . . . 40
iii

Chapter 6. Body Weight Status. . . . . . . . . . . . . . . . . . . . . . . . . . . . . . . . . . . . . . . . . . . . . . . . . . . . . . . . . . . . . . . . . . . . . . . . . . . . . . . 54 All Adults. . . . . . . . . . . . . . . . . . . . . . . . . . . . . . . . . . . . . . . . . . . . . . . . . . . . . . . . . . . . . . . . . . . . . . . . . . . . . . . . . . . . . . . . . . . . . . 54 Sex . . . . . . . . . . . . . . . . . . . . . . . . . . . . . . . . . . . . . . . . . . . . . . . . . . . . . . . . . . . . . . . . . . . . . . . . . . . . . . . . . . . . . . . . . . . . . . . . . . . 54 Age. . . . . . . . . . . . . . . . . . . . . . . . . . . . . . . . . . . . . . . . . . . . . . . . . . . . . . . . . . . . . . . . . . . . . . . . . . . . . . . . . . . . . . . . . . . . . . . . . . . 54 Race . . . . . . . . . . . . . . . . . . . . . . . . . . . . . . . . . . . . . . . . . . . . . . . . . . . . . . . . . . . . . . . . . . . . . . . . . . . . . . . . . . . . . . . . . . . . . . . . . . 54 Hispanic or Latino Origin and Race. . . . . . . . . . . . . . . . . . . . . . . . . . . . . . . . . . . . . . . . . . . . . . . . . . . . . . . . . . . . . . . . . . . . . . . . . 54 Education . . . . . . . . . . . . . . . . . . . . . . . . . . . . . . . . . . . . . . . . . . . . . . . . . . . . . . . . . . . . . . . . . . . . . . . . . . . . . . . . . . . . . . . . . . . . . . 55 Poverty Status . . . . . . . . . . . . . . . . . . . . . . . . . . . . . . . . . . . . . . . . . . . . . . . . . . . . . . . . . . . . . . . . . . . . . . . . . . . . . . . . . . . . . . . . . . 55 Marital Status. . . . . . . . . . . . . . . . . . . . . . . . . . . . . . . . . . . . . . . . . . . . . . . . . . . . . . . . . . . . . . . . . . . . . . . . . . . . . . . . . . . . . . . . . . . 55 Geographic Region . . . . . . . . . . . . . . . . . . . . . . . . . . . . . . . . . . . . . . . . . . . . . . . . . . . . . . . . . . . . . . . . . . . . . . . . . . . . . . . . . . . . . . 56
Chapter 7. Sleep . . . . . . . . . . . . . . . . . . . . . . . . . . . . . . . . . . . . . . . . . . . . . . . . . . . . . . . . . . . . . . . . . . . . . . . . . . . . . . . . . . . . . . . . . . 61 All Adults. . . . . . . . . . . . . . . . . . . . . . . . . . . . . . . . . . . . . . . . . . . . . . . . . . . . . . . . . . . . . . . . . . . . . . . . . . . . . . . . . . . . . . . . . . . . . . 61 Sex . . . . . . . . . . . . . . . . . . . . . . . . . . . . . . . . . . . . . . . . . . . . . . . . . . . . . . . . . . . . . . . . . . . . . . . . . . . . . . . . . . . . . . . . . . . . . . . . . . . 61 Age. . . . . . . . . . . . . . . . . . . . . . . . . . . . . . . . . . . . . . . . . . . . . . . . . . . . . . . . . . . . . . . . . . . . . . . . . . . . . . . . . . . . . . . . . . . . . . . . . . . 61 Race . . . . . . . . . . . . . . . . . . . . . . . . . . . . . . . . . . . . . . . . . . . . . . . . . . . . . . . . . . . . . . . . . . . . . . . . . . . . . . . . . . . . . . . . . . . . . . . . . . 61 Hispanic or Latino Origin and Race. . . . . . . . . . . . . . . . . . . . . . . . . . . . . . . . . . . . . . . . . . . . . . . . . . . . . . . . . . . . . . . . . . . . . . . . . 61 Education . . . . . . . . . . . . . . . . . . . . . . . . . . . . . . . . . . . . . . . . . . . . . . . . . . . . . . . . . . . . . . . . . . . . . . . . . . . . . . . . . . . . . . . . . . . . . . 61 Poverty Status . . . . . . . . . . . . . . . . . . . . . . . . . . . . . . . . . . . . . . . . . . . . . . . . . . . . . . . . . . . . . . . . . . . . . . . . . . . . . . . . . . . . . . . . . . 62 Marital Status. . . . . . . . . . . . . . . . . . . . . . . . . . . . . . . . . . . . . . . . . . . . . . . . . . . . . . . . . . . . . . . . . . . . . . . . . . . . . . . . . . . . . . . . . . . 62 Geographic Region . . . . . . . . . . . . . . . . . . . . . . . . . . . . . . . . . . . . . . . . . . . . . . . . . . . . . . . . . . . . . . . . . . . . . . . . . . . . . . . . . . . . . . 62
Chapter 8. Summary and Conclusions . . . . . . . . . . . . . . . . . . . . . . . . . . . . . . . . . . . . . . . . . . . . . . . . . . . . . . . . . . . . . . . . . . . . . . . . . 66 Summary . . . . . . . . . . . . . . . . . . . . . . . . . . . . . . . . . . . . . . . . . . . . . . . . . . . . . . . . . . . . . . . . . . . . . . . . . . . . . . . . . . . . . . . . . . . . . . 66 Conclusions . . . . . . . . . . . . . . . . . . . . . . . . . . . . . . . . . . . . . . . . . . . . . . . . . . . . . . . . . . . . . . . . . . . . . . . . . . . . . . . . . . . . . . . . . . . . 67
References . . . . . . . . . . . . . . . . . . . . . . . . . . . . . . . . . . . . . . . . . . . . . . . . . . . . . . . . . . . . . . . . . . . . . . . . . . . . . . . . . . . . . . . . . . . . . . . 75
Appendix I. Technical Notes on Methods . . . . . . . . . . . . . . . . . . . . . . . . . . . . . . . . . . . . . . . . . . . . . . . . . . . . . . . . . . . . . . . . . . . . . . 77 Sample Design. . . . . . . . . . . . . . . . . . . . . . . . . . . . . . . . . . . . . . . . . . . . . . . . . . . . . . . . . . . . . . . . . . . . . . . . . . . . . . . . . . . . . . . . . . 77 Response Rates . . . . . . . . . . . . . . . . . . . . . . . . . . . . . . . . . . . . . . . . . . . . . . . . . . . . . . . . . . . . . . . . . . . . . . . . . . . . . . . . . . . . . . . . . 77 Item Nonresponse . . . . . . . . . . . . . . . . . . . . . . . . . . . . . . . . . . . . . . . . . . . . . . . . . . . . . . . . . . . . . . . . . . . . . . . . . . . . . . . . . . . . . . . 77 Imputed Income. . . . . . . . . . . . . . . . . . . . . . . . . . . . . . . . . . . . . . . . . . . . . . . . . . . . . . . . . . . . . . . . . . . . . . . . . . . . . . . . . . . . . . . . . 77 Age Adjustment . . . . . . . . . . . . . . . . . . . . . . . . . . . . . . . . . . . . . . . . . . . . . . . . . . . . . . . . . . . . . . . . . . . . . . . . . . . . . . . . . . . . . . . . . 77 Tests of Significance . . . . . . . . . . . . . . . . . . . . . . . . . . . . . . . . . . . . . . . . . . . . . . . . . . . . . . . . . . . . . . . . . . . . . . . . . . . . . . . . . . . . . 78 Relative Standard Error. . . . . . . . . . . . . . . . . . . . . . . . . . . . . . . . . . . . . . . . . . . . . . . . . . . . . . . . . . . . . . . . . . . . . . . . . . . . . . . . . . . 78
Appendix II. Definitions of Selected Terms. . . . . . . . . . . . . . . . . . . . . . . . . . . . . . . . . . . . . . . . . . . . . . . . . . . . . . . . . . . . . . . . . . . . . 79 Definitions of Sociodemographic Terms . . . . . . . . . . . . . . . . . . . . . . . . . . . . . . . . . . . . . . . . . . . . . . . . . . . . . . . . . . . . . . . . . . . . . 79 Definitions of Health Behavior Terms . . . . . . . . . . . . . . . . . . . . . . . . . . . . . . . . . . . . . . . . . . . . . . . . . . . . . . . . . . . . . . . . . . . . . . . 79
Appendix III. Health Behavior Questions . . . . . . . . . . . . . . . . . . . . . . . . . . . . . . . . . . . . . . . . . . . . . . . . . . . . . . . . . . . . . . . . . . . . . . 82 Alcohol Use . . . . . . . . . . . . . . . . . . . . . . . . . . . . . . . . . . . . . . . . . . . . . . . . . . . . . . . . . . . . . . . . . . . . . . . . . . . . . . . . . . . . . . . . . . . . 82 Cigarette Smoking . . . . . . . . . . . . . . . . . . . . . . . . . . . . . . . . . . . . . . . . . . . . . . . . . . . . . . . . . . . . . . . . . . . . . . . . . . . . . . . . . . . . . . . 82 Leisure-time Physical Activity . . . . . . . . . . . . . . . . . . . . . . . . . . . . . . . . . . . . . . . . . . . . . . . . . . . . . . . . . . . . . . . . . . . . . . . . . . . . . 82 Body Weight and Height. . . . . . . . . . . . . . . . . . . . . . . . . . . . . . . . . . . . . . . . . . . . . . . . . . . . . . . . . . . . . . . . . . . . . . . . . . . . . . . . . . 82 Sleep. . . . . . . . . . . . . . . . . . . . . . . . . . . . . . . . . . . . . . . . . . . . . . . . . . . . . . . . . . . . . . . . . . . . . . . . . . . . . . . . . . . . . . . . . . . . . . . . . . 82
Appendix IV. Tables of Unadjusted Estimates . . . . . . . . . . . . . . . . . . . . . . . . . . . . . . . . . . . . . . . . . . . . . . . . . . . . . . . . . . . . . . . . . . . 83
Figures
Chapter 3 3.1. Percentage of adults who were current drinkers, by age and sex: United States, 2005–2007 . . . . . . . . . . . . . . . . . . . . . . . . 7 3.2. Percentage of adults who had five or more drinks in 1 day at least once in past year, by age and sex: United States,
2005–2007. . . . . . . . . . . . . . . . . . . . . . . . . . . . . . . . . . . . . . . . . . . . . . . . . . . . . . . . . . . . . . . . . . . . . . . . . . . . . . . . . . . . . . . . . . 7 3.3. Percentage of adults who were current drinkers, by race and sex: United States, 2005–2007. . . . . . . . . . . . . . . . . . . . . . . . 8 3.4. Percentage of adults who had five or more drinks in 1 day at least once in past year, by race and sex: United States,
2005–2007. . . . . . . . . . . . . . . . . . . . . . . . . . . . . . . . . . . . . . . . . . . . . . . . . . . . . . . . . . . . . . . . . . . . . . . . . . . . . . . . . . . . . . . . . . 8 3.5. Percentage of adults who had five or more drinks in 1 day at least once in past year, by Hispanic origin and race
and sex: United States, 2005–2007 . . . . . . . . . . . . . . . . . . . . . . . . . . . . . . . . . . . . . . . . . . . . . . . . . . . . . . . . . . . . . . . . . . . . . . 9
iv

3.6. Percentage of adults who were current drinkers, by education and sex: United States, 2005–2007 . . . . . . . . . . . . . . . . . . . 9 3.7. Percentage of adults who had five or more drinks in 1 day at least once in past year, by education: United States,
2005–2007. . . . . . . . . . . . . . . . . . . . . . . . . . . . . . . . . . . . . . . . . . . . . . . . . . . . . . . . . . . . . . . . . . . . . . . . . . . . . . . . . . . . . . . . . 10
Chapter 4 4.1. Percent distributions of current cigarette smoking status of adults, by sex: United States, 2005–2007 . . . . . . . . . . . . . . . 19 4.2. Percent distribution of number of days smoked in the past 30 days among adult nondaily smokers: United States,
2005–2007. . . . . . . . . . . . . . . . . . . . . . . . . . . . . . . . . . . . . . . . . . . . . . . . . . . . . . . . . . . . . . . . . . . . . . . . . . . . . . . . . . . . . . . . . 19 4.3. Percent distribution of usual number of cigarettes on days smoked among all adult current smokers: United States,
2005–2007. . . . . . . . . . . . . . . . . . . . . . . . . . . . . . . . . . . . . . . . . . . . . . . . . . . . . . . . . . . . . . . . . . . . . . . . . . . . . . . . . . . . . . . . . 20 4.4. Percent distribution of age of smoking initiation among all adult current smokers: United States, 2005–2007 . . . . . . . . . 20 4.5. Percentage of adult current smokers who tried to quit in the past year, by age and smoking frequency: United States,
2005–2007. . . . . . . . . . . . . . . . . . . . . . . . . . . . . . . . . . . . . . . . . . . . . . . . . . . . . . . . . . . . . . . . . . . . . . . . . . . . . . . . . . . . . . . . . 21 4.6. Mean number of cigarettes on days smoked by adult current smokers, by Hispanic origin and race and sex,
United States, 2005–2007. . . . . . . . . . . . . . . . . . . . . . . . . . . . . . . . . . . . . . . . . . . . . . . . . . . . . . . . . . . . . . . . . . . . . . . . . . . . . 21 4.7. Percentage of adult current smokers who started smoking younger than 16 years of age, by level of education:
United States, 2005–2007. . . . . . . . . . . . . . . . . . . . . . . . . . . . . . . . . . . . . . . . . . . . . . . . . . . . . . . . . . . . . . . . . . . . . . . . . . . . . 22
Chapter 5 5.1. Percentage of adults who engaged in leisure-time physical activity, by level of activity and age: United States,
2005–2007 . . . . . . . . . . . . . . . . . . . . . . . . . . . . . . . . . . . . . . . . . . . . . . . . . . . . . . . . . . . . . . . . . . . . . . . . . . . . . . . . . . . . . . . . 38 5.2. Percentage of adults who engaged in at least some leisure-time strengthening activity, by sex and age: United States,
2005–2007. . . . . . . . . . . . . . . . . . . . . . . . . . . . . . . . . . . . . . . . . . . . . . . . . . . . . . . . . . . . . . . . . . . . . . . . . . . . . . . . . . . . . . . . . 38 5.3. Percentage of adults who engaged in leisure-time physical activity, by level of activity and education: United States,
2005–2007. . . . . . . . . . . . . . . . . . . . . . . . . . . . . . . . . . . . . . . . . . . . . . . . . . . . . . . . . . . . . . . . . . . . . . . . . . . . . . . . . . . . . . . . . 39 5.4. Percentage of adults who engaged in leisure-time physical activity, by level of activity and poverty status:
United States, 2005–2007 . . . . . . . . . . . . . . . . . . . . . . . . . . . . . . . . . . . . . . . . . . . . . . . . . . . . . . . . . . . . . . . . . . . . . . . . . . . . 39
Chapter 6 6.1. Percent distribution of body weight status of adults, by sex: United States, 2005–2007 . . . . . . . . . . . . . . . . . . . . . . . . . . . 54 6.2. Percentage of adults who were obese, by age and sex: United States, 2005–2007 . . . . . . . . . . . . . . . . . . . . . . . . . . . . . . . 54 6.3. Percentage of adults who were overweight (including obese), by sex and race: United States, 2005–2007. . . . . . . . . . . . 55 6.4. Percent distributions of body weight status of adults, by Hispanic origin and race: United States, 2005–2007. . . . . . . . . 55 6.5. Percentage of adults who were obese, by education and sex: United States, 2005–2007 . . . . . . . . . . . . . . . . . . . . . . . . . . 56 6.6. Percentage of adults who were obese, by poverty status and sex: United States, 2005–2007 . . . . . . . . . . . . . . . . . . . . . . . 56
Chapter 7 7.1. Percent distributions of hours of sleep in a 24-hour period, by sex: United States, 2005–2007 . . . . . . . . . . . . . . . . . . . . . 61 7.2. Percentage of adults who slept 6 hours or less in a 24-hour period, by marital status: United States, 2005–2007 . . . . . . 61
Text Tables
Chapter 3 3.1. Age-adjusted percent distributions (with standard errors) of lifetime alcohol drinking status for adults 18 years of
age and over, by selected characteristics: United States, average annual, 2005–2007 . . . . . . . . . . . . . . . . . . . . . . . . . . . . . 11 3.2. Age-adjusted percent distributions (with standard errors) of current alcohol drinking status for adults 18 years of age
and over, by selected characteristics: United States, average annual, 2005–2007. . . . . . . . . . . . . . . . . . . . . . . . . . . . . . . . . 14 3.3. Age-adjusted percentages (with standard errors) of adults 18 years of age and over who had five or more drinks in
1 day at least once in the past year, and age-adjusted percentages (with standard errors) of adults 18 years of age and over who had five or more drinks in 1 day on at least 12 days in the past year, by selected characteristics: United States, average annual, 2005–2007 . . . . . . . . . . . . . . . . . . . . . . . . . . . . . . . . . . . . . . . . . . . . . . . . . . . . . . . . . . . . . . . 17
3.4. Age-adjusted percentages (with standard errors) of current drinkers 18 years of age and over who had five or more drinks in 1 day at least once in the past year, and age-adjusted percentages (with standard errors) of current drinkers 18 years of age and over who had five or more drinks in 1 day on at least 12 days in the past year, by selected characteristics: United States, average annual, 2005–2007 . . . . . . . . . . . . . . . . . . . . . . . . . . . . . . . . . . . . . . . . . . . 18
v

Chapter 4 4.1. Age-adjusted percent distributions (with standard errors) of lifetime cigarette smoking status for adults 18 years of
age and over, by selected characteristics: United States, average annual, 2005–2007 . . . . . . . . . . . . . . . . . . . . . . . . . . . . . 23 4.2. Age-adjusted percent distributions (with standard errors) of current cigarette smoking status for adults 18 years of
age and over, and age-adjusted mean number (with standard errors) of cigarettes on days smoked among current smokers 18 years of age and over, by selected characteristics: United States, average annual, 2005–2007 . . . . . . . . . . . . 26
4.3. Age-adjusted percent distributions (with standard errors) of usual number of cigarettes on days smoked among all current cigarette smokers 18 years of age and over, by selected characteristics: United States, average annual, 2005–2007. . . . . . . . . . . . . . . . . . . . . . . . . . . . . . . . . . . . . . . . . . . . . . . . . . . . . . . . . . . . . . . . . . . . . . . . . . . . . . . . . . . . . . . . . 29
4.4. Age-adjusted percent distributions (with standard errors) of age of smoking initiation among current cigarette smokers 18 years of age and over: United States, average annual, 2005–2007. . . . . . . . . . . . . . . . . . . . . . . . . . . . . . . . . . . . . . . . . . 32
4.5. Age-adjusted percentages (with standard errors) of current cigarette smokers 18 years of age and over who tried to quit smoking in the past year, by current smoking status and selected characteristics: United States, average annual, 2005–2007. . . . . . . . . . . . . . . . . . . . . . . . . . . . . . . . . . . . . . . . . . . . . . . . . . . . . . . . . . . . . . . . . . . . . . . . . . . . . . . . . . . . . . . . . 35
Chapter 5 5.1. Age-adjusted percent distributions (with standard errors) of leisure-time physical activity status for adults 18 years
of age and over and age-adjusted percentages (with standard errors) of adults 18 years of age and over who engaged in some but less than regular and regular leisure-time physical activity, by selected characteristics: United States, average annual, 2005–2007 . . . . . . . . . . . . . . . . . . . . . . . . . . . . . . . . . . . . . . . . . . . . . . . . . . . . . . . . . . . . . . . . . . . . . . . . . . . 41
5.2. Age-adjusted percent distributions (with standard errors) of times per week engaged in light-moderate leisure-time physical activity for adults 18 years of age and over, by selected characteristics: United States, average annual, 2005–2007. . . . . . . . . . . . . . . . . . . . . . . . . . . . . . . . . . . . . . . . . . . . . . . . . . . . . . . . . . . . . . . . . . . . . . . . . . . . . . . . . . . . . . . . . 44
5.3. Age-adjusted percent distributions (with standard errors) of times per week engaged in vigorous leisure-time physical activity for adults 18 years of age and over, by selected characteristics: United States, average annual, 2005–2007 . . . . 47
5.4. Age-adjusted percentages (with standard errors) of adults 18 years of age and over who engaged in regular leisure-time physical activity, by type of activity and selected characteristics, United States, average annual, 2005–2007 . . . . . . . . . . 50
5.5. Age-adjusted percentages (with standard errors) of adults 18 years of age and over who engaged in any leisure-time strengthening activities, by selected characteristics: United States, average annual, 2005–2007 . . . . . . . . . . . . . . . . . . . . . 53
Chapter 6 6.1. Age-adjusted percentages (with standard errors) of adults 18 years of age and over who were overweight, by selected
characteristics: United States, average annual, 2005–2007. . . . . . . . . . . . . . . . . . . . . . . . . . . . . . . . . . . . . . . . . . . . . . . . . . . 57 6.2. Age-adjusted percent distributions (with standard errors) of body weight status for adults 18 years of age and over,
by selected characteristics: United States, average annual, 2005–2007 . . . . . . . . . . . . . . . . . . . . . . . . . . . . . . . . . . . . . . . . . 58
Chapter 7 7.1. Age-adjusted percent distributions (with standard errors) of usual hours of sleep for adults 18 years of age and over,
by selected characteristics: United States, average annual, 2005–2007 . . . . . . . . . . . . . . . . . . . . . . . . . . . . . . . . . . . . . . . . . 63
Chapter 8 8.1. Age-adjusted percentages (with standard errors) of adults 18 years of age and over who engaged in selected unhealthy
behaviors, by selected characteristics: United States, average annual, 2005–2007 . . . . . . . . . . . . . . . . . . . . . . . . . . . . . . . . 69 8.2. Age-adjusted percentages (with standard errors) of adults 18 years of age over who engaged in selected healthy
behaviors, by selected characteristics: United States, average annual, 2005–2007 . . . . . . . . . . . . . . . . . . . . . . . . . . . . . . . . 72
Appendix Tables I. Completed interviews and response rates by year: National Health Interview Survey, 2005–2007. . . . . . . . . . . . . . . . . . . 77 II. Age distribution used in age-adjusting data shown in chapters 3–8 . . . . . . . . . . . . . . . . . . . . . . . . . . . . . . . . . . . . . . . . . . . 78 III. Crude percent distributions (with standard errors) of lifetime alcohol drinking status for adults 18 years of age and
over, by selected characteristics: United States, average annual, 2005–2007 . . . . . . . . . . . . . . . . . . . . . . . . . . . . . . . . . . . . 83 IV. Crude percent distributions (with standard errors) of current alcohol drinking status for adults 18 years of age and
over, by selected characteristics: United States, average annual, 2005–2007 . . . . . . . . . . . . . . . . . . . . . . . . . . . . . . . . . . . . 86 V. Crude percentages (with standard errors) of adults 18 years of age and over who had five or more drinks in 1 day at
least once in the past year, and crude percentages (with standard errors) of adults 18 years of age and over who had five or more drinks in 1 day on at least 12 days in the past year, by selected characteristics: United States, average annual, 2005–2007 . . . . . . . . . . . . . . . . . . . . . . . . . . . . . . . . . . . . . . . . . . . . . . . . . . . . . . . . . . . . . . . . . . . . . . . . . . . . . . . . . . 89
vi

VI. Crude percentages (with standard errors) of current drinkers 18 years of age and over who had five or more drinks in 1 day at least once in the past year, and crude percentages (with standard errors) who had five or more drinks in 1 day on at least 12 days in the past year, by selected characteristics: United States, average annual, 2005–2007. . . . . . 90
VII. Crude percent distributions (with standard errors) of lifetime cigarette smoking status for adults 18 years of age and over, by selected characteristics: United States, average annual, 2005–2007 . . . . . . . . . . . . . . . . . . . . . . . . . . . . . . . . . . . . 91
VIII. Crude percent distributions (with standard errors) of current cigarette smoking status for adults 18 years of age and over, and crude mean number (with standard errors) of cigarettes on days smoked among current smokers 18 years of age and over, by selected characteristics: United States, average annual, 2005–2007 . . . . . . . . . . . . . . . . . . . . . . . . . . . 94
IX. Crude percent distributions (with standard errors) of usual number of cigarettes on days smoked among all current cigarette smokers 18 years of age and over, by selected characteristics: United States, average annual, 2005–2007 . . . . 97
X. Crude percent distributions (with standard errors) of age of smoking initiation among current cigarette smokers 18 years of age and over: United States, average annual, 2005–2007. . . . . . . . . . . . . . . . . . . . . . . . . . . . . . . . . . . . . . . . . 100
XI. Crude percentages (with standard errors) of current cigarette smokers 18 years of age and over who tried to quit smoking in the past year, by current smoking status and selected characteristics: United States, average annual, 2005–2007. . . . . . . . . . . . . . . . . . . . . . . . . . . . . . . . . . . . . . . . . . . . . . . . . . . . . . . . . . . . . . . . . . . . . . . . . . . . . . . . . . . . . . . . 103
XII. Crude percent distributions (with standard errors) of leisure-time physical activity status for adults 18 years of age and over and crude percentages (with standard errors) of adults 18 years of age and over who engaged in some but less than regular and regular leisure-time physical activity, by selected characteristics: United States, average annual, 2005–2007. . . . . . . . . . . . . . . . . . . . . . . . . . . . . . . . . . . . . . . . . . . . . . . . . . . . . . . . . . . . . . . . . . . . . . . . . . . . . . . . . . . . . . . . 106
XIII. Crude percent distributions (with standard errors) of times per week engaged in light-moderate leisure-time physical activity for adults 18 years of age and over, by selected characteristics: United States, average annual, 2005–2007 . . . 109
XIV. Crude percent distributions (with standard errors) of times per week engaged in vigorous leisure-time physical activity for adults 18 years of age and over, by selected characteristics: United States, average annual, 2005–2007 . . . . . . . . . . 112
XV. Crude percentages (with standard errors) of adults 18 years of age and over who engaged in regular leisure-time physical activity, by type of activity and selected characteristics, United States, average annual, 2005–2007 . . . . . . . . . 115
XVI. Crude percentages (with standard errors) of adults 18 years of age and over who engaged in any leisure-time strengthening activities, by selected characteristics: United States, average annual, 2005–2007 . . . . . . . . . . . . . . . . . . . . 118
XVII. Crude percentages (with standard errors) of adults 18 years of age and over who were overweight, by selected characteristics: United States, average annual, 2005–2007. . . . . . . . . . . . . . . . . . . . . . . . . . . . . . . . . . . . . . . . . . . . . . . . . . 119
XVIII. Crude percent distributions (with standard errors) of body weight status for adults 18 years of age and over, by selected characteristics: United States, average annual, 2005–2007 . . . . . . . . . . . . . . . . . . . . . . . . . . . . . . . . . . . . . . . . . . 120
XIX. Crude percent distributions (with standard errors) of usual hours of sleep for adults 18 years of age and over, by selected characteristics: United States, average annual, 2005–2007 . . . . . . . . . . . . . . . . . . . . . . . . . . . . . . . . . . . . . . . . . . 123
XX. Crude percentages (with standard errors) of adults 18 years of age and over who engaged in selected unhealthy behaviors, by selected characteristics: United States, average annual, 2005–2007 . . . . . . . . . . . . . . . . . . . . . . . . . . . . . . . 126
XXI. Crude percentages (with standard errors) of adults 18 years of age and over who engaged in selected healthy behaviors, by selected characteristics: United States, average annual, 2005–2007 . . . . . . . . . . . . . . . . . . . . . . . . . . . . . . . 129
XXII. Number of adults 18 years of age and over, by selected characteristics: United States, average annual, 2005–2007 . . . 132
vii

Objective This report presents selected
prevalence estimates for key indicators of alcohol use, cigarette smoking, leisure-time physical activity, body weight status, and sleep among U.S. adults, using data from the 2005–2007 National Health Interview Survey (NHIS). The NHIS is conducted annually by the Centers for Disease Control and Prevention’s National Center for Health Statistics. Estimates are shown for several sociodemographic subgroups for both sexes combined and for men and women separately. The subgroups are compared in terms of their prevalence of ‘‘healthy’’ and ‘‘unhealthy’’ behaviors.
Methods Data for the U.S. civilian
noninstitutionalized population were collected by the NHIS using computer-assisted personal interviews (CAPI). Questions on health behaviors were asked of one randomly selected adult per family in the Sample Adult component of the basic core questionnaire. This report is based on a total of 79,096 completed interviews with sample adults aged 18 years and over, representing an overall sample adult response rate of 69.2% for the 3 years combined. Statistics shown in this report were age adjusted to the 2000 U.S. standard population.
Results Overall, 6 in 10 (61.2%) U.S. adults
were current drinkers in 2005–2007; about 1 in 4 adults (24.6%) were lifetime abstainers. About 1 in 5 adults (20.4%) were current smokers and over one-half of adults (58.5%) had never smoked cigarettes. About 4 in 10 (42.5%) current smokers tried to quit smoking in the past year. About 6 in 10 adults engaged in at least some leisure-time physical activity with about 3 in 10 regularly engaging in such activities. About 6 in 10 adults were overweight or obese (BMI>25), with about 4 in 10 adults being of healthy weight. About 6 in 10 adults usually slept 7 to 8 hours in a 24-hour period.
Keywords: smoking c leisure-time physical activity c body weight c sleep
Health Behaviors of Adults: United States, 2005–2007 by Charlotte A. Schoenborn, M.P.H., and Patricia F. Adams, Division of Health Interview Statistics
Chapter 1 Introduction
This report describes prevalence of selected health behaviors among U.S. adults aged 18 years of age and over during the period 2005–2007. Estimates for alcohol consumption, cigarette smoking, leisure-time physical activity, body weight status, and hours of sleep are shown for major population subgroups.
Prevention of disease through promotion of exercise, fitness, good nutrition, and healthy lifestyles is a priority of the U.S. Department of Health and Human Services (HHS), the U.S. government’s principal agency for protecting the health of all Americans (1). Since the first Surgeon General’s report on health promotion and disease prevention in 1979, HHS has led a federal prevention initiative called Healthy People, bringing together a coalition of experts from federal, state, and local governments and the private sector to set national health promotion and disease prevention objectives (2–5). These Healthy People objectives, which are revised and updated every 10 years, encompass a wide range of domains— including the health care system, health policy, the environment, and health behaviors.
Scientific investigations on the health consequences of selected health behaviors have expanded dramatically since the first Healthy People objectives were established. Summaries of the existing literature have been published for key health behaviors, including tobacco use (6), alcohol use (7), physical activity (8), overweight and
obesity (9), and sleep (10). In agencies across HHS, other federal departments, and the private sector, research continues in an effort to increase understanding of the nature of the associations between health behaviors and health outcomes, to determine the most effective ways of communicating these health risks to the public, and to monitor progress in this important public health mission (11–23). Despite evidence of the potential harm of some health behaviors and substantial efforts to disseminate this information to the public, many Americans continue to engage in health behaviors that put them at risk of chronic disease and disability.
Monitoring prevalence of selected health behaviors across major population subgroups can help identify groups that are less likely to have adopted health-promoting behaviors and consequently are at greater risk for diseases and disabilities associated with those health behaviors. Such information can be used to more effectively tailor interventions to reach the most vulnerable populations.
The Centers for Disease Control and Prevention’s (CDC) National Center for Health Statistics (NCHS) has been instrumental in monitoring progress toward achieving health promotion and disease prevention objectives since the 1980s. The National Health Interview Survey (NHIS) has been a major data collection tool for this effort, particularly for monitoring health behavior change. The NHIS provided data to monitor the progress toward achieving the 1990 National Health Objectives and the Healthy People 2000 objectives using supplemental questionnaires (24–27). In 1997, as the
Page 1

Page 2 [ Series 10, No. 245
Healthy People 2010 health promotion and disease prevention objectives were being developed, NHIS introduced questions on selected health behaviors into the NHIS annual Sample Adult Core questionnaire as part of a major questionnaire redesign (28). Many of these questions, asked of one sample adult aged 18 years and over in each NHIS interviewed family, have been used to monitor progress toward achieving the Healthy People 2010 objectives. The behaviors included in the Sample Adult Core questionnaire are alcohol use, cigarette smoking, leisure-time physical activity, height, weight, and (beginning in 2004) hours of sleep. The questions have remained essentially unchanged since 1997.
The current report is the fourth report based on the NHIS annual core questionnaire devoted exclusively to prevalence of adult health behaviors. Reports have been previously published for 1997–1998, 1999–2001, and 2002–2004 (29–34). Each report provides age-adjusted and unadjusted estimates for both sexes and for men and women separately, by selected sociodemographic characteristics. To facilitate comparison of findings across data years, the format and content of these reports have remained constant to the extent possible. Each report offers unique information, however, and readers are encouraged to refer to earlier reports for additional details about: (a) the background of each of the NHIS health behavior measures (29–32); (b) changes to the NHIS race and ethnicity variables (33); (c) activities of federal agencies and selected private sector organizations in the areas of health promotion and disease prevention (34). Analysis of trends is beyond the scope of the current report. However, all reports are available on the National Center for Health Statistics website at www.cdc.gov/nchs for readers interested in comparing estimates across time periods.

Series 10, No. 245 [ Page 3
Chapter 2 Methods
Data Source The statistics shown in this report
are based on data from the Sample Adult component of the 2005–2007 National Health Interview Surveys (NHIS) (35–37). NHIS, one of the major data collection systems of NCHS, is a survey of a nationally representative sample of the U.S. civilian noninstitutionalized household population. Basic health and demographic information is collected in the Family component for all members of the family. Adults present at the time of the interview are asked to respond for themselves. Proxy responses are accepted for adults not present at the time of the interview and those physically or mentally incapable of responding for themselves. Additional information is collected on one randomly selected adult aged 18 years or over (that is, the ‘‘sample adult’’) and one randomly selected child under 18 years (that is, the ‘‘sample child’’) per family. Information on the sample adult is self-reported except in rare cases when the sample adult is physically or mentally incapable of responding. National estimates for a broad range of health measures for U.S. adults, based on the NHIS, are published annually (38–40).
Measurement of Health Behaviors
Alcohol use
The measure of alcohol drinking status included in this report is consistent with that shown in NCHS’s annual report to Congress titled, Health, United States (41).
Lifetime alcohol drinking status (Table 3.1)
Describes lifetime history of alcohol use and includes four mutually exclusive categories:
1. Lifetime abstainers are adults who
have had fewer than 12 drinks in their entire life.
2. Former infrequent drinkers are adults who have had at least 12 drinks in their lifetime, but fewer than 12 drinks in any 1 year and no drinks in the past year.
3. Former regular drinkers are adults who had at least 12 drinks in a single year but no drinks in the past year.
4. Current drinkers are adults who have had at least 12 drinks in their lifetime and at least one drink in the past year.
Current drinking status (Table 3.2)
Describes alcohol consumption during the past year:
1. Nondrinkers are adults who had no drinks in the past year (lifetime abstainers and former drinkers).
2. Current infrequent drinkers are adults who had at least 12 drinks in their lifetime and 1–11 drinks during the past year.
3. Light drinkers are adults who had three or fewer drinks per week, on average in the past year.
4. Moderate drinkers are persons who had more than 3 drinks and up to and including 7 drinks per week (women), or more than 3 drinks and up to and including 14 drinks per week (men), on average, in the past year.
5. Heavier drinkers are adults who had at least 12 drinks in their lifetime and had more than 7 drinks per week (women), or more than 14 drinks per week (men), on average, in the past year. (See Appendix II for details.)
Five or more drinks in 1 day (Tables 3.3 and 3.4)
Current drinkers were asked how many days in the past year they consumed five or more alcoholic beverages. ‘‘Five or more drinks in 1 day’’ is a measure of heavy or ‘‘at risk’’ drinking (which may or may not be episodic). The question on five or more drinks in 1 day was included in the NHIS questionnaire to gain greater understanding of typical drinking behavior over the course of the year. It
was not designed as a measure of binge drinking, which usually refers to number of drinks ‘‘at one sitting’’ or ‘‘during a 2-hour period.’’ The question about having five or more drinks in 1 day followed, but was entirely separate from, the questions about usual drinking practices. Table 3.3 shows the percentage of all adults who had five or more drinks in 1 day at least once, and the percentage of adults who drank this amount at least 12 times during the past year, thus showing the prevalence of this behavior in the general adult population. Table 3.4 shows the percentage of current drinkers who had five or more drinks in 1 day at least once and the percentage of adults who drank this amount at least 12 times during the past year.
Cigarette smoking
Lifetime cigarette smoking status (Table 4.1)
Measurement of cigarette smoking status has remained relatively unchanged over the history of NHIS:
1. Never smokers are adults who had never smoked cigarettes or who had smoked fewer than 100 cigarettes in their entire life. Respondents who had not smoked at least 100 cigarettes are not asked the questions about current smoking practices.
2. Former smokers are adults who had smoked at least 100 cigarettes in their entire life but were not currently smoking.
3. Current smokers are adults who had smoked at least 100 cigarettes in their entire life and were still smoking.
Classification of current smokers has changed slightly over the history of NHIS. From 1964 through 1991, current smokers were defined as those persons who had smoked at least 100 cigarettes in their entire life and answered ‘‘yes’’ to the follow-up question, ‘‘Do you smoke now?’’ In 1992, the NHIS question about current smoking was modified slightly to be consistent with international smoking data so that daily smokers and nondaily smokers could be

Page 4 [ Series 10, No. 245
distinguished. The question was changed to read, ‘‘Do you now smoke cigarettes every day, some days, or not at all?’’ In this report, estimates for all current smokers are shown in Table 4.1.
Current cigarette smoking status (Table 4.2)
The category nonsmoker includes persons who had never smoked 100 cigarettes in their entire life (i.e., never smokers) as well as those who smoked in the past, but quit smoking prior to the date of the interview (i.e., former smokers). Nondaily smokers include all persons who said they smoked ‘‘some days’’ regardless of the number of days they smoked in the past 30 days. Daily smokers are those who said they smoked every day. The category current smoker includes daily and nondaily smokers.
Number of cigarettes on days smoked (Table 4.2 and Table 4.3)
Separate questions about number of cigarettes smoked in a day were asked of adults who smoked every day (daily smokers) and adults who smoked only some days (nondaily smokers). For nondaily smokers, the question specified that they were being asked about the average number of cigarettes smoked on those days that they smoked. Amount smoked is presented in two ways. Table 4.2 shows the mean number of cigarettes smoked on days smoked, for all smokers, daily smokers, and nondaily smokers who smoked at least once in the past 30 days. Table 4.3 shows percent distributions of the number of cigarettes usually smoked on days smoked for all smokers (daily and nondaily combined): less than 15 cigarettes, 15–24 cigarettes, 25–34 cigarettes, and 35 cigarettes or more. For nondaily smokers, these estimates reflect the number of cigarettes these adults smoked on the days that they smoked.
Age of smoking initiation (Table 4.4)
Adults who had ever smoked at least 100 cigarettes in their entire life were asked at what age they first started to smoke fairly regularly. Data on age of initiation shown in this report are limited to estimates for current smokers (Table 4.4).
Attempts to quit smoking (Table 4.5)
All current smokers were asked if they had stopped smoking for more than 1 day in the past year because they were trying to quit (Table 4.5).
Leisure-time physical activity
Leisure-time physical activity status (Table 5.1)
Includes three levels of activity:
1. Inactive—engaged in no light-moderate or vigorous activity lasting at least 10 minutes.
2. Some, less than regular—engaged in any light-moderate or vigorous activity but the frequency or duration did not meet the criteria for ‘‘regular.’’
3. Regular—engaged in light-moderate leisure-time physical activity at least five times per week, on average, for at least 30 minutes each time or vigorous leisure-time physical activity at least three times per week, on average, for at least 20 minutes each time.
In addition, a summary category ‘‘at least some’’ is shown for comparability with earlier reports. In these earlier reports, responses of any light-moderate or vigorous activity lasting 10 minutes or longer resulted in a classification of ‘‘at least some.’’ With the revised, three-category indicator shown in this report, classification of leisure-time physical activity was limited to respondents who had complete information for both frequency and duration of both light-moderate and vigorous leisure-time physical activity. This method of calculating leisure-time physical activity levels is consistent with other published estimates (41,42).
Light-moderate leisure-time physical activity (Table 5.2)
This was based on a question that asked how often the person engaged in at least 10 minutes of light-moderate leisure-time physical activity that caused light sweating or a slight-to-moderate increase in breathing or heart rate. Answers could be provided in any time unit (per day, per week, per month, or per year). Frequency of activity was
converted into times per week and then categorized as follows:
1. None 2. Some, but less than one time per week 3. One to two times per week 4. Three to four times per week 5. Five or more times per week
The ‘‘none’’ category consists of all persons who engaged in no light-moderate activity, including some who engaged in only vigorous activity. The indicator for light-moderate physical activity shown in this report is designed to estimate the percentage of adults who assess their level of leisure-time physical activity to be in the light-moderate range. The indicator here differs from the measure of moderate activity used for tracking progress toward the Healthy People 2010 objectives; the latter encompasses all activity that is at least light-moderate (including vigorous activity).
Vigorous leisure-time physical activity (Table 5.3)
This category was based on a question that asked how often the person engaged in at least 10 minutes of vigorous activity that caused heavy sweating or large increases in breathing or heart rate. Response options were identical to those of the light-moderate activity question and frequency was categorized in the same manner.
Questions asking about light-moderate leisure-time physical activity and vigorous leisure-time physical activity were independent, with the question about vigorous activity asked first. Respondents could have reported engaging in only light-moderate activity, only vigorous activity, both types of activity, or neither one. Table 5.1 presents data for the two types of activity combined, whereas Tables 5.2 and 5.3 present data for frequency of engaging in each type of activity separately.
Regular leisure-time physical activity (Table 5.4)
This category combines frequency and duration of each activity separately:
1. Regular light-moderate activity is
Series 10, No. 245 [ Page 5
defined as engaging in light-moderate activity five times or more per week for 30 minutes or more each time.
2. Regular vigorous activity is defined as engaging in vigorous activity three times or more per week for 20 minutes or more each time.
3. Any regular activity is defined as meeting either criterion or both criteria. Estimates for regular activity shown in Tables 5.1 and 5.4 are identical.
Strengthening activity (Table 5.5)
This activity includes any leisure-time activities designed to strengthen muscles, such as weight lifting or calisthenics. Unlike light-moderate activity or vigorous activity, there was no minimum duration specified in the question, and duration of the activity was not asked.
This report presents data only for leisure-time physical activity. In 2000 and 2005, the NHIS Cancer Supplements included questions related to nonleisure-time physical activity. In those supplements, respondents were asked to describe their usual daily activities related to moving around:
1. Sit during most of the day 2. Stand during most of the day 3. Walk around most of the day
They were also asked about their usual daily activities related to lifting or carrying things:
1. None 2. Light loads 3. Moderate loads 4. Heavy loads 5. Unable to lift or carry
Respondents were explicitly instructed to exclude activities done in their leisure time. Analysis of these data suggested that adults who were active in their usual daily activities related to moving around or lifting or carrying were also more likely to be active in their leisure time (43). Physical activity prevalence for U.S. adults based on the 2000 and 2005 NHIS Cancer Supplements have been published online (43,44).
Body weight status
Height and weight were used to compute body mass index (BMI), which is a measure of body weight relative to height. The BMI was computed using respondent-reported height and weight, without shoes.
Body mass index is based on metric units and is defined as body weight divided by height2 (i.e., kilograms/ meters2). The categories of BMI used in this report are consistent with standard BMI classifications used by the World Health Organization (WHO)(45) and the Healthy People 2010 objectives (5). Adults were classified as follows:
1. Obese adults had a BMI of 30 or greater.
2. Overweight but not obese adults had a BMI of greater than or equal to 25 and less than 30.
3. Healthy weight adults had a BMI of greater than or equal to 18.5 and less than 25.
4. Underweight adults had a BMI of less than 18.5.
Tables 6.1 and 6.2 show categories of body weight status representing ranges of BMI values.
Overweight, shown in Table 6.1, is defined as a BMI of 25 or greater. The BMI equivalents are listed in footnotes in each table. See ‘‘Strengths and Limitations’’ section for additional information about the BMI measure.
Sleep (Table 7.1)
Hours of sleep was based on a single question that asked adults how many hours of sleep they usually get in a 24-hour period. This question appears at the end of the section on health behaviors and allows responses in whole hours only. The question on sleep was introduced into the annual Sample Adult Core questionnaire in 2004. Prior to this, sleep was asked about in the 1977 NHIS Health Habits supplement and the 1985 and 1990 NHIS Health Promotion and Disease Prevention supplements (24,25, 46–49).
Strengths and Limitations of the Data
The collection of data on alcohol use, cigarette smoking, leisure-time physical activity, body weight, height, and sleep on the annual Sample Adult Core questionnaire makes it possible to produce annual prevalence estimates for these health behaviors for a nationally representative sample of civilian noninstitutionalized U.S. adults. By combining data years, it is possible to study the health behaviors of some smaller population subgroups that would have too few cases to yield reliable estimates with a single year of data. Data on health behaviors are collected in combination with data on a wide range of other health characteristics (including chronic health conditions, injury episodes, access to medical care, and health insurance coverage), making it possible to study interrelationships among the various health characteristics and to track these relationships over time.
All of the information on alcohol use, cigarette smoking, leisure-time physical activity, height, weight, and sleep were self-reported by one randomly selected adult in each family. Self-reporting enhances accuracy of the data to the extent that respondents willingly provide the information. It is recognized, however, that there may be some underreporting of some health behaviors that may be considered undesirable. Estimates of behaviors generally thought to be harmful to health (e.g., heavier alcohol use, current cigarette smoking, physical inactivity in leisure time, overweight body weight status, and sleeping 6 hours or less) can be considered to be conservative estimates of the actual prevalence of such behaviors, given that under-reporting may occur. Body weight relative to height is particularly sensitive to underreporting. The nature and extent of differences between reported and measured height and weight have been reported elsewhere (50–52). The BMI measure also has limitations in terms of its potential for overestimating body mass for persons who are very muscular or underestimating it for persons who

Page 6 [ Series 10, No. 245
have lost muscle mass, such as the elderly.
Most of the health behaviors included in this report are described in terms of ‘‘usual’’ or ‘‘average’’ behavior. Questions were designed to elicit information that would characterize respondents’ typical health behaviors and do not allow detailed exploration of patterns of health behavior. In addition to the questions being of a general nature, the indicators described previously and shown in Chapters 3-8 further generalize adult health behavior characteristics in an effort to provide a meaningful overview for major population subgroups.
The strength of this approach is that it provides a ‘‘snapshot’’ of the important subgroups of the U.S. population in terms of general health behavioral characteristics. It is possible to estimate which groups are most likely to drink heavily (on average), smoke cigarettes daily or less than daily, be completely sedentary or irregularly active in their leisure time, be overweight or obese, and get fewer than 7 to 8 hours of sleep. Together, these estimates help pinpoint the groups who might benefit most from health education or other interventions. Such estimates do not, however, identify some important patterns of unhealthy behaviors. For example, the data collected in NHIS do not allow for clear identification of episodic heavy (binge) drinkers, irregularities in exercise patterns, fluctuations in body weight status, or sleep patterns (sleeping at night versus napping). Some information on patterns is captured for smoking, with a series of questions addressed to persons who smoked cigarettes on a less-than-daily basis. A discussion of the history of the NHIS health behavior measures, including their strengths and limitations, is available (29–32).
Statistical Analysis Three years of data were combined
to increase reliability of the estimates for some of the smaller population subgroups. Even with the 3 years of data, the standard errors for some subgroups are quite large. In tables shown in this report, estimates with a
relative standard error greater than 30% and less than or equal to 50% are considered statistically unreliable and are indicated with an asterisk (*). Readers should exercise caution when interpreting these statistics. A dagger (†) is substituted for estimates with a relative standard error greater than 50%. These estimates are not reliable and therefore are not shown.
The household response rate for the NHIS data years 2005–2007 was 86.9%. This report is based on data from 79,096 completed interviews with sample adults aged 18 years and over. Among adults identified in interviewed households as eligible for the Sample Adult component, the combined (conditional) response rate was 80%. The final Sample Adult response rate for the 3 years combined, which takes into account both Family and Sample Adult interview nonresponse, was 69.2%. Procedures used in calculating response rates are described in detail in Appendix I of the Survey Description of the NHIS data files (35–37).
All estimates and associated standard errors shown in this report were generated using SUDAAN, a software package that is designed to handle a complex sample design such as that used by NHIS (53). All estimates were weighted, using the Sample Adult Record Weight, to reflect the U.S. civilian noninstitutionalized population aged 18 years and over.
Most estimates presented in this report were age adjusted to the projected 2000 U.S. standard population aged 18 years and over (54,55). Age adjustment was used to allow comparison among various sociodemographic subgroups that have different age structures. The age categories used to age adjust the 2005–2007 estimates are the same as those used for the 1999–2001 and 2002–2004 reports on health behaviors of U.S. adults: 18–44 years, 45–64 years, and 65 years and over (33,34). The age groups used in the first set of reports on adult health behaviors from the NHIS Sample Adult Core questionnaire (1997–1998) were slightly different: 18–24 years, 25–44 years, 45–64 years, and 65 years and over (29–32). The two younger age groups were combined in the subsequent reports
to improve stability of the estimates. The same projected 2000 U.S. standard population was used for all reports. Tables showing crude (unadjusted) estimates by race, Hispanic or Latino origin and race, education, poverty status, marital status, and geographic region are available in ‘‘Appendix III.’’ These crude estimates can be used in conjunction with the population estimates (Table XXII) to calculate the numbers of persons in each category shown in the tables of this report.
Age-adjusted estimates were compared using two-tailed t-tests at the 0.05 level. No adjustments were made for multiple comparisons. Terms such as ‘‘greater than’’ and ‘‘less than’’ indicate a statistically significant difference. Terms such as ‘‘similar’’ or ‘‘no difference’’ indicate that the statistics being compared were not significantly different. Lack of comment regarding the difference between any two statistics does not mean that the difference was tested and found to be not significant.
Most statistics presented in this report can be replicated using NHIS public-use data files and website at: http://www.cdc.gov/nchs/nhis.htm. Data for some of the smaller race and ethnicity subgroups are not included on the public-use data files to protect respondent confidentiality, and therefore corresponding estimates cannot be replicated. Many of the references cited in this report are also available via the NCHS website at: http://www.cdc.gov/ nchs.
Series 10, No. 245 [ Page 7
0
20
40
60
80
Per
cent
18–24 25–44 45–64 65–74 75 and overAge in years
Men
Women
NOTE: Estimates are based on household interviews of a sample of the civilian noninstitutionalized population.
DATA SOURCE: CDC/NCHS, National Health Interview Survey, 2005–2007.
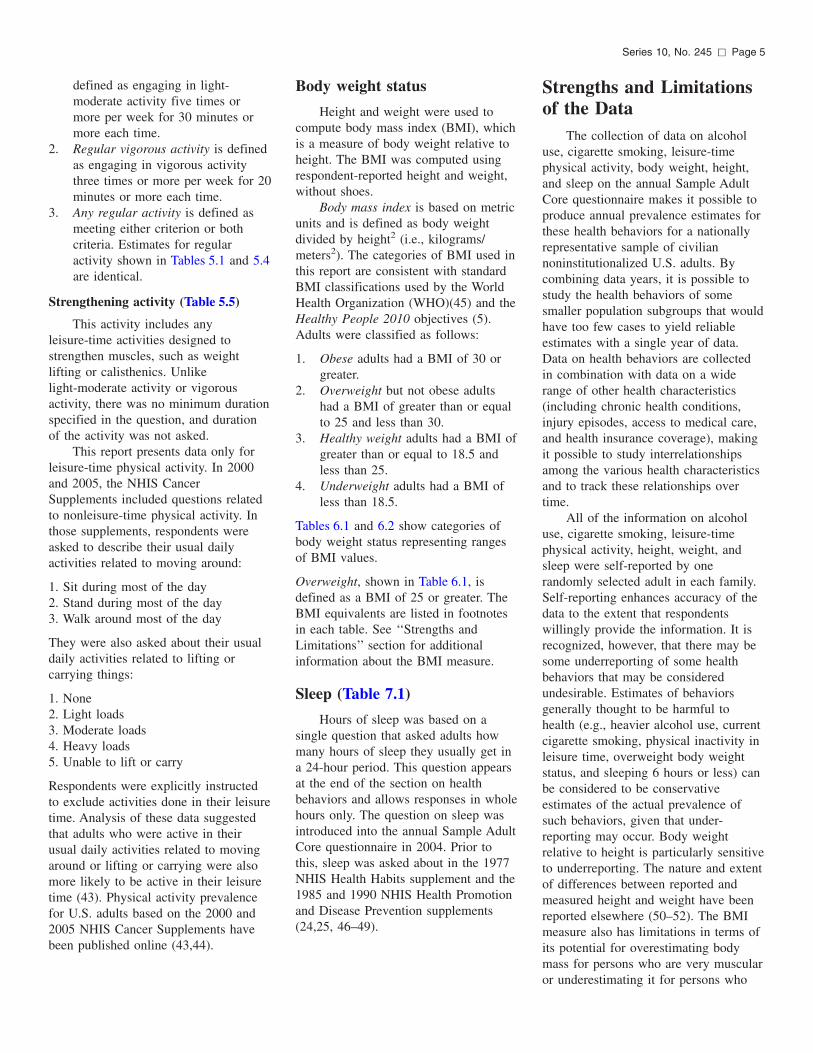
Figure 3.1. Percentage of adults who were current drinkers, by age and sex: United States, 2005–2007
Men
Women
NOTE: Estimates are based on household interviews of a sample of the civilian noninstitutionalized population.
DATA SOURCE: CDC/NCHS, National Health Interview Survey, 2005–2007.
0
10
20
30
40
50
18–24 25–44 45–64 65–74 75 and over
Per
cent
Age in years
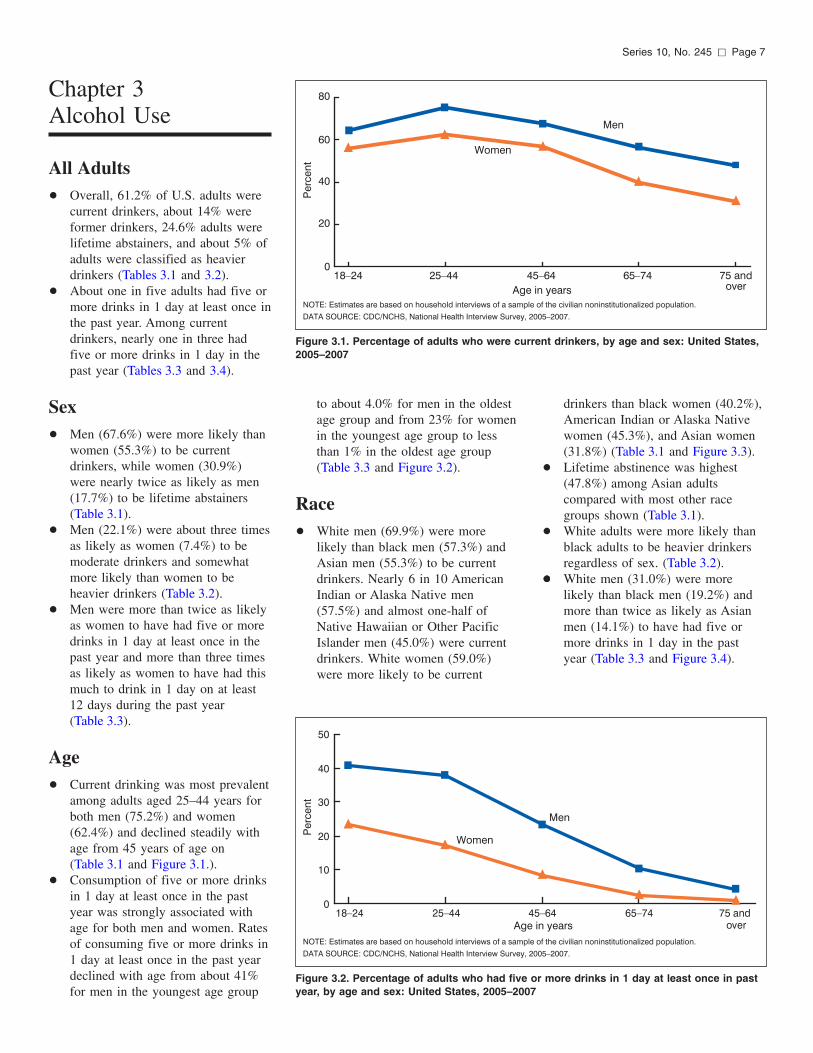
Figure 3.2. Percentage of adults who had five or more drinks in 1 day at least once in past year, by age and sex: United States, 2005–2007
Chapter 3 Alcohol Use
All Adults + Overall, 61.2% of U.S. adults were
current drinkers, about 14% were former drinkers, 24.6% adults were lifetime abstainers, and about 5% of adults were classified as heavier drinkers (Tables 3.1 and 3.2).
+ About one in five adults had five or more drinks in 1 day at least once in the past year. Among current drinkers, nearly one in three had five or more drinks in 1 day in the past year (Tables 3.3 and 3.4).
Sex + Men (67.6%) were more likely than
women (55.3%) to be current drinkers, while women (30.9%) were nearly twice as likely as men (17.7%) to be lifetime abstainers (Table 3.1).
+ Men (22.1%) were about three times as likely as women (7.4%) to be moderate drinkers and somewhat more likely than women to be heavier drinkers (Table 3.2).
+ Men were more than twice as likely as women to have had five or more drinks in 1 day at least once in the past year and more than three times as likely as women to have had this much to drink in 1 day on at least 12 days during the past year (Table 3.3).
Age + Current drinking was most prevalent
among adults aged 25–44 years for both men (75.2%) and women (62.4%) and declined steadily with age from 45 years of age on (Table 3.1 and Figure 3.1.).
+ Consumption of five or more drinks in 1 day at least once in the past year was strongly associated with age for both men and women. Rates of consuming five or more drinks in 1 day at least once in the past year declined with age from about 41% for men in the youngest age group
to about 4.0% for men in the oldest age group and from 23% for women in the youngest age group to less than 1% in the oldest age group (Table 3.3 and Figure 3.2).
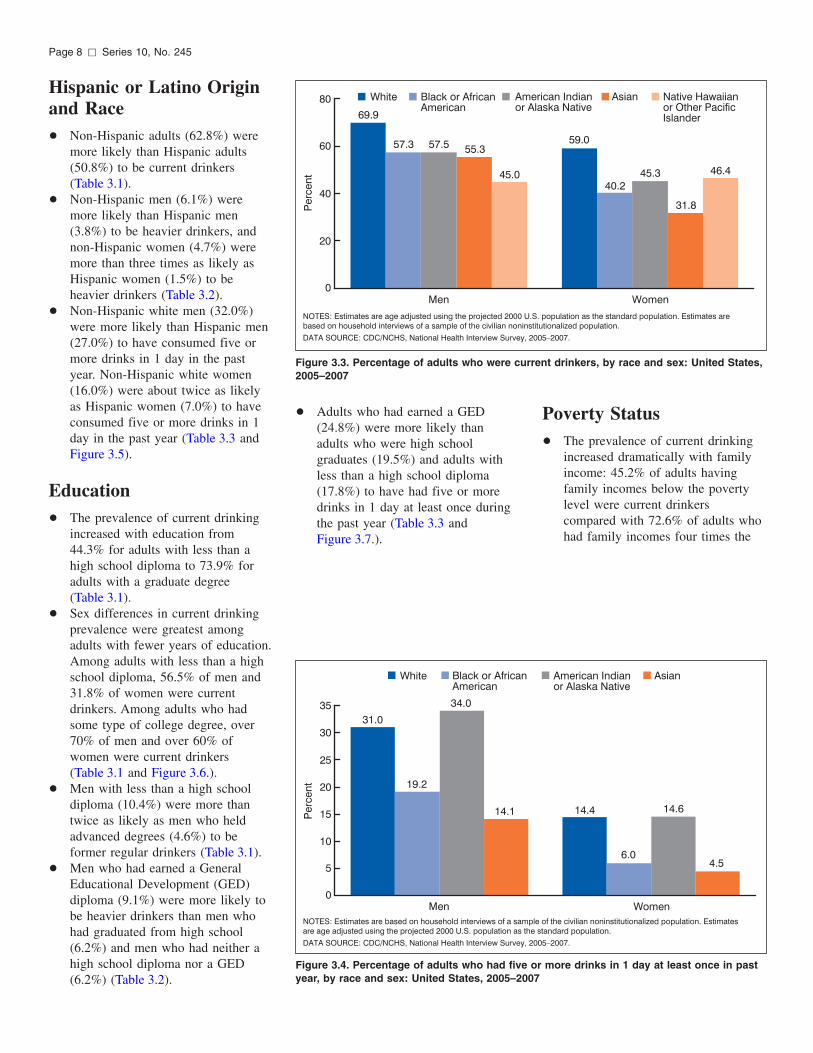
Race + White men (69.9%) were more
likely than black men (57.3%) and Asian men (55.3%) to be current drinkers. Nearly 6 in 10 American Indian or Alaska Native men (57.5%) and almost one-half of Native Hawaiian or Other Pacific Islander men (45.0%) were current drinkers. White women (59.0%) were more likely to be current
drinkers than black women (40.2%), American Indian or Alaska Native women (45.3%), and Asian women (31.8%) (Table 3.1 and Figure 3.3).
+ Lifetime abstinence was highest (47.8%) among Asian adults compared with most other race groups shown (Table 3.1).
+ White adults were more likely than black adults to be heavier drinkers regardless of sex. (Table 3.2).
++ White men (31.0%) were more likely than black men (19.2%) and more than twice as likely as Asian men (14.1%) to have had five or more drinks in 1 day in the past year (Table 3.3 and Figure 3.4).
Page 8 [ Series 10, No. 245
NOTES: Estimates are age adjusted using the projected 2000 U.S. population as the standard population. Estimates are based on household interviews of a sample of the civilian noninstitutionalized population.
DATA SOURCE: CDC/NCHS, National Health Interview Survey, 2005–2007.
0
20
40
60
80
Men Women P
erce
nt
White Black or African American
American Indian or Alaska Native
Asian Native Hawaiian or Other Pacific Islander69.9
57.3 57.5 55.3
45.0
59.0
40.2 45.3
31.8
46.4
Figure 3.3. Percentage of adults who were current drinkers, by race and sex: United States, 2005–2007
NOTES: Estimates are based on household interviews of a sample of the civilian noninstitutionalized population. Estimates are age adjusted using the projected 2000 U.S. population as the standard population.
DATA SOURCE: CDC/NCHS, National Health Interview Survey, 2005–2007.
31.0
14.4
19.2
6.0
34.0
14.614.1
4.5
0
5
15
20
10
25
30
35
Men Women
White Black or African American
American Indian or Alaska Native
Asian
Per
cent
Figure 3.4. Percentage of adults who had five or more drinks in 1 day at least once in past year, by race and sex: United States, 2005–2007
Hispanic or Latino Origin and Race + Non-Hispanic adults (62.8%) were
more likely than Hispanic adults (50.8%) to be current drinkers (Table 3.1).
+ Non-Hispanic men (6.1%) were more likely than Hispanic men (3.8%) to be heavier drinkers, and non-Hispanic women (4.7%) were more than three times as likely as Hispanic women (1.5%) to be heavier drinkers (Table 3.2).
+ Non-Hispanic white men (32.0%) were more likely than Hispanic men (27.0%) to have consumed five or more drinks in 1 day in the past year. Non-Hispanic white women (16.0%) were about twice as likely as Hispanic women (7.0%) to have consumed five or more drinks in 1 day in the past year (Table 3.3 and Figure 3.5).
Education + The prevalence of current drinking
increased with education from 44.3% for adults with less than a high school diploma to 73.9% for adults with a graduate degree (Table 3.1).
+ Sex differences in current drinking prevalence were greatest among adults with fewer years of education. Among adults with less than a high school diploma, 56.5% of men and 31.8% of women were current drinkers. Among adults who had some type of college degree, over 70% of men and over 60% of women were current drinkers (Table 3.1 and Figure 3.6.).
+ Men with less than a high school diploma (10.4%) were more than twice as likely as men who held advanced degrees (4.6%) to be former regular drinkers (Table 3.1).
+ Men who had earned a General Educational Development (GED) diploma (9.1%) were more likely to be heavier drinkers than men who had graduated from high school (6.2%) and men who had neither a high school diploma nor a GED (6.2%) (Table 3.2).
+ Adults who had earned a GED (24.8%) were more likely than adults who were high school graduates (19.5%) and adults with less than a high school diploma (17.8%) to have had five or more drinks in 1 day at least once during the past year (Table 3.3 and Figure 3.7.).
Poverty Status + The prevalence of current drinking
increased dramatically with family income: 45.2% of adults having family incomes below the poverty level were current drinkers compared with 72.6% of adults who had family incomes four times the

General Educational Development High school Some collegeLess thanhigh school (GED) high school equivalency graduate
diploma
Associate of arts degree Bachelor’s degree Graduate degree
78.1 76.180 72.2 71.569.5 68.1
64.1 63.3 60.9 61.7 56.560
49.2 50.2
31.8
Men Women
NOTES: Estimates are based on household interviews of a sample of the civilian noninstitutionalized population. Estimatesage adjusted using the projected 2000 U.S. population as the standard population.
DATA SOURCE: CDC/NCHS, National Health Interview Survey, 2005–2007.
Per
cent
40
20
0
are
Figure 3.6. Percentage of adults who were current drinkers, by education and sex: United States, 2005–2007
Series 10, No. 245 [ Page 9
NOTES: Estimates are based on household interviews of a sample of the civilian noninstitutionalized population. Estimates are age adjusted using the projected 2000 U.S. population as the standard population.
DATA SOURCE: CDC/NCHS, National Health Interview Survey, 2005–2007.
27.0
7.0
32.0
16.0 19.0
5.9
Men Women
Hispanic Non-Hispanic white Non-Hispanic black
Per
cent
5
0
15
20
10
25
30
35
Figure 3.5. Percentage of adults who had five or more drinks in 1 day at least once in past year, by Hispanic origin and race and sex: United States, 2005–2007
status group to be kers (Table 3.2). ting adults (28.9%) were kely than married adults ) to have had five or more n 1 day at least once in the ar (Table 3.3).
poverty level or more. Persons with family incomes below the poverty level (36.2%) were more than twice as likely as adults with family incomes four times the poverty level or more (16.8%) to be lifetime abstainers (Table 3.1).
+ Men with family incomes below the poverty level (6.7%) were more likely than men in the highest family income group (5.3%) to be heavier drinkers, whereas the reverse was true for women; women with family incomes below the poverty level (3.5%) were less likely than women in the highest income groups (5.3%) to be heavier drinkers (Table 3.2).
+ Adults in the upper family income groups were more likely to have had five or more drinks in 1 day at least once in the past year than were adults in the lower family income groups (Table 3.3).
+ Among current drinkers, men and women with family incomes below the poverty level were more likely than those in the highest family income group to have had five or more drinks in 1 day on at least 12 days in the past year (Table 3.4).
Marital Status + The prevalence of lifetime
abstention from alcohol was highest among never married adults (30.4%) and widowed adults (31.4%) and lowest among cohabiting adults (13.9%) (Table 3.1).
+ Cohabiting adults (8.6%) and divorced or separated adults (6.4%) were more likely than married adults (3.8%) to be heavier drinkers. Widowed adults (49.9%) were more likely than adults in any other marital nondrin
+ Cohabimore li(17.7%drinks ipast ye

High schoolLess than General Educational Development Some college high school (GED) high school equivalency graduate
diploma
Associate of arts degree Bachelor’s degree Graduate degree
24.825
22.7 22.4 21.5
19.520 17.717.8
Page 10 [ Series 10, No. 245
Geographic Region + Adults living in the South were less
likely to be current drinkers than adults living in the Northeast, Midwest, or West. Lifetime abstention was highest among adults living in the South compared with adults living in the other regions. (Table 3.1).
Per
cent
15
10
5
0 Both sexes
NOTES: Estimates are based on household interviews of a sample of the civilian noninstitutionalized population. Estimates are age adjusted using the projected 2000 U.S. population as the standard population.
DATA SOURCE: CDC/NCHS, National Health Interview Survey, 2005–2007.
Figure 3.7. Percentage of adults who had five or more drinks in 1 day at least once in past year, by education: United states, 2005–2007

Series 10, No. 245 [ Page 11
Table 3.1. Age-adjusted percent distributions (with standard errors) of lifetime alcohol drinking status for adults 18 years of age and over, by selected characteristics: United States, average annual, 2005–2007
Lifetime alcohol drinking status1
Lifetime Former Former Selected characteristic Total abstainer infrequent regular Current
Both sexes Percent distribution (standard error)
Ages 18 years and over (age-adjusted)2 . . . . . . . . . . . . . 100.0 24.6 (0.32) 8.1 (0.14) 6.2 (0.15) 61.2 (0.31) Ages 18 years and over (crude)2 . . . . . . . . . . . . . . . . . . 100.0 24.4 (0.32) 8.2 (0.14) 6.3 (0.15) 61.2 (0.31)
Age:3
18–24 years . . . . . . . . . . . . . . . . . . . . . . . . . . . . . 100.0 35.8 (0.85) 2.9 (0.25) 1.7 (0.17) 60.0 (0.88) 25–44 years . . . . . . . . . . . . . . . . . . . . . . . . . . . . . 100.0 20.9 (0.38) 6.1 (0.19) 4.4 (0.16) 68.7 (0.41) 45–64 years . . . . . . . . . . . . . . . . . . . . . . . . . . . . . 100.0 20.4 (0.38) 9.9 (0.25) 7.7 (0.24) 62.1 (0.42) 65–74 years . . . . . . . . . . . . . . . . . . . . . . . . . . . . . 100.0 28.2 (0.68) 13.8 (0.48) 10.6 (0.46) 47.5 (0.74) 75 years and over . . . . . . . . . . . . . . . . . . . . . . . . . . 100.0 36.1 (0.75) 14.1 (0.47) 12.2 (0.49) 37.6 (0.74)
Race: White, single race . . . . . . . . . . . . . . . . . . . . . . . . . . 100.0 21.7 (0.34) 7.9 (0.16) 6.3 (0.17) 64.2 (0.34) Black or African American, single race . . . . . . . . . . . . . 100.0 36.1 (0.72) 10.0 (0.33) 6.5 (0.31) 47.7 (0.64) American Indian or Alaska Native, single race . . . . . . . . 100.0 28.5 (3.60) 10.1 (1.39) 10.0 (1.51) 51.5 (3.10) Asian, single race . . . . . . . . . . . . . . . . . . . . . . . . . . 100.0 47.8 (1.06) 6.3 (0.55) 3.0 (0.35) 43.1 (1.01) Native Hawaiian or Other Pacific Islander, single race. . . . 100.0 37.7 (6.80) *9.8 (3.37) *6.0 (2.87) 46.4 (5.58) Two or more races . . . . . . . . . . . . . . . . . . . . . . . . . 100.0 23.5 (1.74) 12.8 (1.36) 11.1 (1.14) 53.0 (1.87)
Black or African American, white . . . . . . . . . . . . . . . 100.0 32.0 (5.15) *10.5 (3.79) *10.4 (3.12) 47.1 (4.69) American Indian or Alaska Native, white . . . . . . . . . . . 100.0 20.4 (2.37) 12.3 (2.07) 13.5 (1.63) 54.3 (2.65)
Hispanic or Latino origin and race: Hispanic or Latino . . . . . . . . . . . . . . . . . . . . . . . . . . 100.0 35.8 (0.60) 7.8 (0.33) 5.8 (0.28) 50.8 (0.59)
Mexican or Mexican American . . . . . . . . . . . . . . . . . 100.0 37.2 (0.78) 7.9 (0.45) 6.8 (0.42) 48.3 (0.74) Not Hispanic or Latino . . . . . . . . . . . . . . . . . . . . . . . 100.0 22.9 (0.35) 8.2 (0.15) 6.3 (0.16) 62.8 (0.33)
White, single race . . . . . . . . . . . . . . . . . . . . . . . . 100.0 19.0 (0.38) 7.9 (0.17) 6.4 (0.19) 66.8 (0.37) Black or African American, single race . . . . . . . . . . . . 100.0 36.3 (0.73) 9.9 (0.33) 6.5 (0.32) 47.5 (0.65)
Education: Less than high school graduate . . . . . . . . . . . . . . . . . 100.0 37.1 (0.62) 10.7 (0.33) 8.3 (0.30) 44.3 (0.56) GED diploma4 . . . . . . . . . . . . . . . . . . . . . . . . . . . . 100.0 21.6 (1.24) 12.0 (0.90) 9.8 (0.78) 56.8 (1.37) High school graduate . . . . . . . . . . . . . . . . . . . . . . . . 100.0 28.1 (0.54) 9.0 (0.25) 6.5 (0.27) 56.6 (0.51) Some college—no degree . . . . . . . . . . . . . . . . . . . . . 100.0 21.4 (0.50) 7.9 (0.28) 5.9 (0.27) 64.9 (0.57) Associate of arts degree . . . . . . . . . . . . . . . . . . . . . . 100.0 19.3 (0.60) 8.3 (0.40) 6.2 (0.36) 66.3 (0.72) Bachelor of arts, science degree . . . . . . . . . . . . . . . . . 100.0 17.1 (0.46) 5.6 (0.27) 4.3 (0.22) 73.1 (0.53) Masters, doctorate, medical degree . . . . . . . . . . . . . . . 100.0 17.0 (0.62) 4.9 (0.31) 4.1 (0.28) 73.9 (0.68)
Poverty status:5
Below poverty level . . . . . . . . . . . . . . . . . . . . . . . . . 100.0 36.2 (0.72) 10.6 (0.40) 8.3 (0.36) 45.2 (0.72) ≥1 and <2 times poverty level . . . . . . . . . . . . . . . . . . 100.0 32.2 (0.61) 9.9 (0.34) 8.0 (0.34) 50.0 (0.60) ≥2 and <4 times poverty level . . . . . . . . . . . . . . . . . . 100.0 24.9 (0.47) 8.8 (0.25) 6.6 (0.26) 59.9 (0.52) 4 times poverty level or more . . . . . . . . . . . . . . . . . . . 100.0 16.8 (0.39) 6.0 (0.19) 4.6 (0.18) 72.6 (0.42)
Marital status: Never married . . . . . . . . . . . . . . . . . . . . . . . . . . . . 100.0 30.4 (0.64) 7.1 (0.36) 5.6 (0.34) 57.3 (0.68) Married . . . . . . . . . . . . . . . . . . . . . . . . . . . . . . . . 100.0 23.0 (0.37) 8.7 (0.19) 6.4 (0.19) 62.1 (0.37) Cohabiting . . . . . . . . . . . . . . . . . . . . . . . . . . . . . . 100.0 13.9 (0.81) 6.9 (0.62) 7.2 (0.67) 72.2 (1.09) Divorced or separated . . . . . . . . . . . . . . . . . . . . . . . 100.0 19.6 (0.53) 9.4 (0.35) 7.9 (0.32) 63.3 (0.59) Widowed . . . . . . . . . . . . . . . . . . . . . . . . . . . . . . . 100.0 31.4 (2.39) 11.6 (1.24) 6.9 (0.98) 50.1 (2.60)
Geographic region: Northeast . . . . . . . . . . . . . . . . . . . . . . . . . . . . . . . 100.0 18.8 (0.49) 7.2 (0.28) 5.2 (0.24) 68.9 (0.54) Midwest . . . . . . . . . . . . . . . . . . . . . . . . . . . . . . . . 100.0 19.8 (0.62) 8.2 (0.30) 6.8 (0.46) 65.4 (0.63) South . . . . . . . . . . . . . . . . . . . . . . . . . . . . . . . . . 100.0 29.9 (0.62) 8.9 (0.25) 6.3 (0.20) 55.1 (0.55) West . . . . . . . . . . . . . . . . . . . . . . . . . . . . . . . . . . 100.0 25.9 (0.58) 7.6 (0.26) 6.3 (0.24) 60.4 (0.57)
Men
Ages 18 years and over (age-adjusted)2 . . . . . . . . . . . . . 100.0 17.7 (0.35) 7.2 (0.18) 7.7 (0.20) 67.6 (0.36) Ages 18 years and over (crude)2 . . . . . . . . . . . . . . . . . . 100.0 17.5 (0.35) 7.1 (0.18) 7.7 (0.21) 67.9 (0.36)
Age:3
18–24 years . . . . . . . . . . . . . . . . . . . . . . . . . . . . . 100.0 32.5 (1.15) 2.3 (0.35) 1.4 (0.23) 64.2 (1.18) 25–44 years . . . . . . . . . . . . . . . . . . . . . . . . . . . . . 100.0 15.2 (0.44) 5.0 (0.25) 4.6 (0.24) 75.2 (0.50) 45–64 years . . . . . . . . . . . . . . . . . . . . . . . . . . . . . 100.0 13.6 (0.46) 9.0 (0.34) 10.0 (0.36) 67.6 (0.54) 65–74 years . . . . . . . . . . . . . . . . . . . . . . . . . . . . . 100.0 17.0 (0.83) 12.6 (0.70) 14.1 (0.73) 56.4 (1.08) 75 years and over . . . . . . . . . . . . . . . . . . . . . . . . . . 100.0 21.3 (1.02) 12.8 (0.73) 18.3 (0.91) 47.8 (1.15)
See footnotes at end of table.

Page 12 [ Series 10, No. 245
Table 3.1. Age-adjusted percent distributions (with standard errors) of lifetime alcohol drinking status for adults 18 years of age and over, by selected characteristics: United States, average annual, 2005–2007—Con.
Lifetime alcohol drinking status1
Lifetime Former Former Selected characteristic Total abstainer infrequent regular Current
Men—Con. Percent distribution (standard error)
Race: White, single race . . . . . . . . . . . . . . . . . . . . . . . . . . 100.0 15.5 (0.38) 7.0 (0.20) 7.7 (0.23) 69.9 (0.39) Black or African American, single race . . . . . . . . . . . . . 100.0 26.6 (0.95) 8.0 (0.48) 8.4 (0.49) 57.3 (1.01) American Indian or Alaska Native, single race . . . . . . . . 100.0 18.7 (3.27) 10.7 (2.67) 13.0 (2.26) 57.5 (3.47) Asian, single race . . . . . . . . . . . . . . . . . . . . . . . . . . 100.0 33.5 (1.43) 7.4 (0.78) 4.1 (0.64) 55.3 (1.50) Native Hawaiian or Other Pacific Islander, single race. . . . 100.0 38.9 (9.66) *9.4 (4.39) † 45.0 (7.95) Two or more races . . . . . . . . . . . . . . . . . . . . . . . . . 100.0 19.7 (2.55) 10.6 (1.94) 14.7 (2.07) 55.8 (3.01)
Black or African American, white . . . . . . . . . . . . . . . 100.0 21.9 (5.42) † 17.5 (2.98) 52.1 (7.74) American Indian or Alaska Native, white . . . . . . . . . . . 100.0 16.2 (2.97) 10.1 (2.49) 17.1 (2.86) 57.3 (4.01)
Hispanic or Latino origin and race: Hispanic or Latino . . . . . . . . . . . . . . . . . . . . . . . . . . 100.0 21.9 (0.75) 7.7 (0.49) 7.4 (0.45) 63.1 (0.82)
Mexican or Mexican American . . . . . . . . . . . . . . . . . 100.0 22.3 (1.00) 7.6 (0.68) 8.8 (0.66) 61.5 (1.01) Not Hispanic or Latino . . . . . . . . . . . . . . . . . . . . . . . 100.0 16.9 (0.39) 7.1 (0.20) 7.8 (0.23) 68.3 (0.39)
White, single race . . . . . . . . . . . . . . . . . . . . . . . . 100.0 14.2 (0.43) 6.9 (0.22) 7.8 (0.26) 71.2 (0.44) Black or African American, single race . . . . . . . . . . . . 100.0 26.6 (0.97) 8.0 (0.49) 8.5 (0.50) 57.2 (1.03)
Education: Less than high school graduate . . . . . . . . . . . . . . . . . 100.0 23.6 (0.77) 9.9 (0.47) 10.4 (0.46) 56.5 (0.81) GED diploma4 . . . . . . . . . . . . . . . . . . . . . . . . . . . . 100.0 12.8 (1.40) 11.3 (1.40) 12.1 (1.26) 64.1 (1.88) High school graduate . . . . . . . . . . . . . . . . . . . . . . . . 100.0 20.7 (0.67) 7.7 (0.33) 8.6 (0.41) 63.3 (0.69) Some college—no degree . . . . . . . . . . . . . . . . . . . . . 100.0 16.1 (0.68) 6.7 (0.41) 7.8 (0.45) 69.5 (0.80) Associate of arts degree . . . . . . . . . . . . . . . . . . . . . . 100.0 13.8 (0.77) 6.7 (0.54) 7.5 (0.58) 72.2 (0.99) Bachelor of arts, science degree . . . . . . . . . . . . . . . . . 100.0 12.3 (0.56) 4.9 (0.36) 4.7 (0.31) 78.1 (0.69) Masters, doctorate, medical degree . . . . . . . . . . . . . . . 100.0 14.6 (0.82) 4.7 (0.46) 4.6 (0.44) 76.1 (0.94)
Poverty status:5
Below poverty level . . . . . . . . . . . . . . . . . . . . . . . . . 100.0 25.0 (1.03) 9.3 (0.65) 11.1 (0.65) 54.9 (1.11) ≥1 and <2 times poverty level . . . . . . . . . . . . . . . . . . 100.0 23.5 (0.78) 8.7 (0.50) 10.3 (0.52) 57.6 (0.91) ≥2 and <4 times poverty level . . . . . . . . . . . . . . . . . . 100.0 18.1 (0.56) 8.1 (0.34) 8.4 (0.37) 65.6 (0.63) 4 times poverty level or more . . . . . . . . . . . . . . . . . . . 100.0 12.8 (0.47) 5.4 (0.26) 5.4 (0.25) 76.5 (0.52)
Marital status: Never married . . . . . . . . . . . . . . . . . . . . . . . . . . . . 100.0 23.8 (0.77) 6.5 (0.51) 7.5 (0.57) 62.6 (0.88) Married . . . . . . . . . . . . . . . . . . . . . . . . . . . . . . . . 100.0 16.0 (0.42) 7.9 (0.25) 7.8 (0.27) 68.3 (0.45) Cohabiting . . . . . . . . . . . . . . . . . . . . . . . . . . . . . . 100.0 9.9 (0.93) 5.6 (0.79) 8.7 (1.01) 75.9 (1.38) Divorced or separated . . . . . . . . . . . . . . . . . . . . . . . 100.0 12.2 (0.70) 7.4 (0.46) 9.9 (0.55) 70.7 (0.87) Widowed . . . . . . . . . . . . . . . . . . . . . . . . . . . . . . . 100.0 13.6 (3.53) 5.8 (0.68) 11.3 (2.51) 69.5 (4.26)
Geographic region: Northeast . . . . . . . . . . . . . . . . . . . . . . . . . . . . . . . 100.0 13.1 (0.60) 6.3 (0.38) 6.2 (0.38) 74.6 (0.71) Midwest . . . . . . . . . . . . . . . . . . . . . . . . . . . . . . . . 100.0 14.3 (0.67) 6.7 (0.37) 8.4 (0.55) 70.8 (0.69) South . . . . . . . . . . . . . . . . . . . . . . . . . . . . . . . . . 100.0 21.9 (0.70) 8.2 (0.33) 8.1 (0.32) 62.0 (0.67) West . . . . . . . . . . . . . . . . . . . . . . . . . . . . . . . . . . 100.0 18.1 (0.62) 6.6 (0.36) 7.6 (0.35) 67.9 (0.67)
Women
Ages 18 years and over (age-adjusted)2 . . . . . . . . . . . . . 100.0 30.9 (0.39) 9.0 (0.19) 4.9 (0.16) 55.3 (0.39) Ages 18 years and over (crude)2 . . . . . . . . . . . . . . . . . . 100.0 30.8 (0.39) 9.3 (0.19) 5.0 (0.16) 55.0 (0.39)
Age:3
18–24 years . . . . . . . . . . . . . . . . . . . . . . . . . . . . . 100.0 39.1 (1.02) 3.4 (0.32) 1.9 (0.24) 55.9 (1.07) 25–44 years . . . . . . . . . . . . . . . . . . . . . . . . . . . . . 100.0 26.4 (0.51) 7.1 (0.26) 4.1 (0.21) 62.4 (0.54) 45–64 years . . . . . . . . . . . . . . . . . . . . . . . . . . . . . 100.0 26.8 (0.52) 10.7 (0.34) 5.5 (0.26) 57.0 (0.56) 65–74 years . . . . . . . . . . . . . . . . . . . . . . . . . . . . . 100.0 37.6 (0.91) 14.8 (0.65) 7.7 (0.50) 39.9 (0.89) 75 years and over . . . . . . . . . . . . . . . . . . . . . . . . . . 100.0 45.6 (0.98) 15.0 (0.60) 8.3 (0.50) 31.1 (0.90)
Race: White, single race . . . . . . . . . . . . . . . . . . . . . . . . . . 100.0 27.3 (0.42) 8.8 (0.21) 5.0 (0.18) 59.0 (0.43) Black or African American, single race . . . . . . . . . . . . . 100.0 43.4 (0.86) 11.5 (0.45) 5.1 (0.35) 40.2 (0.73) American Indian or Alaska Native, single race . . . . . . . . 100.0 37.9 (4.64) 9.7 (1.48) 7.3 (1.72) 45.3 (4.26) Asian, single race . . . . . . . . . . . . . . . . . . . . . . . . . . 100.0 60.8 (1.40) 5.5 (0.68) 2.0 (0.37) 31.8 (1.27) Native Hawaiian or Other Pacific Islander, single race. . . . 100.0 39.3 (6.76) † † 46.4 (7.19) Two or more races . . . . . . . . . . . . . . . . . . . . . . . . . 100.0 26.4 (2.35) 15.0 (1.66) 8.0 (1.32) 50.7 (2.24)
Black or African American, white . . . . . . . . . . . . . . . 100.0 36.7 (6.35) *10.3 (4.33) *9.6 (3.74) 43.4 (4.94) American Indian or Alaska Native, white . . . . . . . . . . . 100.0 24.7 (3.92) 14.8 (2.40) 9.5 (2.16) 51.1 (3.55)
See footnotes at end of table.

Series 10, No. 245 [ Page 13
Table 3.1. Age-adjusted percent distributions (with standard errors) of lifetime alcohol drinking status for adults 18 years of age and over, by selected characteristics: United States, average annual, 2005–2007—Con.
Lifetime alcohol drinking status1
Lifetime Former Former Selected characteristic Total abstainer infrequent regular Current
Women—Con. Percent distribution (standard error)
Hispanic or Latino origin and race: Hispanic or Latino . . . . . . . . . . . . . . . . . . . . . . . . . . 100.0 49.3 (0.79) 8.1 (0.41) 4.5 (0.34) 38.2 (0.75)
Mexican or Mexican American . . . . . . . . . . . . . . . . . 100.0 52.5 (1.00) 8.3 (0.56) 5.1 (0.49) 34.2 (0.94) Not Hispanic or Latino . . . . . . . . . . . . . . . . . . . . . . . 100.0 28.1 (0.42) 9.1 (0.20) 5.0 (0.17) 57.9 (0.42)
White, single race . . . . . . . . . . . . . . . . . . . . . . . . 100.0 23.3 (0.46) 8.8 (0.23) 5.1 (0.20) 62.9 (0.47) Black or African American, single race . . . . . . . . . . . . 100.0 43.6 (0.87) 11.5 (0.46) 5.1 (0.36) 39.9 (0.75)
Education: Less than high school graduate . . . . . . . . . . . . . . . . . 100.0 50.3 (0.79) 11.5 (0.45) 6.6 (0.37) 31.8 (0.69) GED diploma4 . . . . . . . . . . . . . . . . . . . . . . . . . . . . 100.0 30.7 (1.85) 12.7 (1.28) 7.6 (0.99) 49.2 (1.87) High school graduate . . . . . . . . . . . . . . . . . . . . . . . . 100.0 34.7 (0.68) 10.3 (0.35) 4.9 (0.29) 50.2 (0.67) Some college—no degree . . . . . . . . . . . . . . . . . . . . . 100.0 25.8 (0.66) 8.9 (0.40) 4.4 (0.27) 60.9 (0.71) Associate of arts degree . . . . . . . . . . . . . . . . . . . . . . 100.0 23.4 (0.82) 9.5 (0.56) 5.4 (0.44) 61.7 (0.94) Bachelor of arts, science degree . . . . . . . . . . . . . . . . . 100.0 21.9 (0.64) 6.2 (0.38) 3.9 (0.29) 68.1 (0.73) Masters, doctorate, medical degree . . . . . . . . . . . . . . . 100.0 19.9 (0.87) 5.1 (0.43) 3.4 (0.34) 71.5 (0.94)
Poverty status:5
Below poverty level . . . . . . . . . . . . . . . . . . . . . . . . . 100.0 43.6 (0.83) 11.5 (0.48) 6.7 (0.40) 38.4 (0.82) ≥1 and <2 times poverty level . . . . . . . . . . . . . . . . . . 100.0 39.2 (0.77) 11.0 (0.45) 6.3 (0.36) 43.6 (0.70) ≥2 and <4 times poverty level . . . . . . . . . . . . . . . . . . 100.0 31.0 (0.63) 9.6 (0.37) 5.0 (0.27) 54.5 (0.68) 4 times poverty level or more . . . . . . . . . . . . . . . . . . . 100.0 21.1 (0.55) 6.7 (0.28) 3.7 (0.22) 68.5 (0.61)
Marital status: Never married . . . . . . . . . . . . . . . . . . . . . . . . . . . . 100.0 37.1 (0.91) 7.6 (0.50) 3.8 (0.33) 51.6 (0.90) Married . . . . . . . . . . . . . . . . . . . . . . . . . . . . . . . . 100.0 30.0 (0.49) 9.4 (0.27) 4.8 (0.21) 55.9 (0.49) Cohabiting . . . . . . . . . . . . . . . . . . . . . . . . . . . . . . 100.0 19.0 (1.44) 8.4 (0.99) 5.0 (0.72) 67.9 (1.67) Divorced or separated . . . . . . . . . . . . . . . . . . . . . . . 100.0 24.6 (0.68) 10.7 (0.49) 6.6 (0.37) 58.2 (0.77) Widowed . . . . . . . . . . . . . . . . . . . . . . . . . . . . . . . 100.0 36.3 (2.77) 13.2 (1.57) 5.8 (1.03) 44.6 (2.90)
Geographic region: Northeast . . . . . . . . . . . . . . . . . . . . . . . . . . . . . . . 100.0 23.8 (0.66) 8.0 (0.38) 4.3 (0.29) 64.1 (0.72) Midwest . . . . . . . . . . . . . . . . . . . . . . . . . . . . . . . . 100.0 24.7 (0.75) 9.5 (0.41) 5.4 (0.48) 60.5 (0.80) South . . . . . . . . . . . . . . . . . . . . . . . . . . . . . . . . . 100.0 36.9 (0.71) 9.5 (0.31) 4.8 (0.21) 49.0 (0.66) West . . . . . . . . . . . . . . . . . . . . . . . . . . . . . . . . . . 100.0 33.4 (0.79) 8.5 (0.39) 5.1 (0.27) 53.1 (0.78)
* Estimates preceded by an asterisk have a relative standard error of greater than 30% and less than or equal to 50%. These should be interpreted with caution as they do not meet the standard of reliability or precision.
† Estimates with a relative standard error greater than 50% are indicated with a dagger, but are not shown. 1Lifetime alcohol drinking status: Lifetime abstainer—had fewer than 12 drinks in entire lifetime; former infrequent—had 12 drinks or more in lifetime, but never as many as 12 drinks in a single year, and had no drinks in the past year; former regular—had 12 drinks or more in one year, but no drinks in the past year; current drinker-had at least 12 drinks in lifetime and at least 1 drink in the past year. 2Persons of other races and unknown race and ethnicity, unknown education, unknown poverty status, and unknown marital status are included in total. 3Estimates for age groups are not age adjusted. 4GED is General Educational Development high school equivalency diploma. 5Poverty status is based on family income and family size using the U.S. Census Bureau poverty thresholds for 2004, 2005, and 2006.
NOTES: Unless otherwise specified, estimates are age adjusted using the projected 2000 U.S. population as the standard population and using three age groups: 18–44 years, 45–64 years, and 65 years and over. For crude percent distributions, refer to Appendix Table III. Denominator for each percent distribution excludes persons with unknown lifetime drinking status. See Appendix II for definitions of terms. See Appendix III for health behavior questions.
DATA SOURCE: National Health Interview Survey, 2005–2007. Estimates are based on household interviews of a sample of the civilian noninstitutionalized population.

Page 14 [ Series 10, No. 245
Table 3.2. Age-adjusted percent distributions (with standard errors) of current alcohol drinking status for adults 18 years of age and over, by selected characteristics: United States, average annual, 2005–2007
Current alcohol drinking status1
Selected characteristic Total Nondrinker Infrequent Light Moderate Heavier
Both sexes Percent distribution (standard error)
Ages 18 years and over (age-adjusted)2 . . . . . . . . . . . . . 100.0 38.8 (0.31) 12.3 (0.16) 29.3 (0.23) 14.4 (0.18) 5.0 (0.12) Ages 18 years and over (crude)2 . . . . . . . . . . . . . . . . . . 100.0 38.8 (0.31) 12.4 (0.16) 29.2 (0.23) 14.5 (0.18) 5.0 (0.12)
Age:3
18–24 years . . . . . . . . . . . . . . . . . . . . . . . . . . . . . 100.0 40.0 (0.88) 9.1 (0.41) 30.4 (0.68) 13.4 (0.52) 6.8 (0.41) 25–44 years . . . . . . . . . . . . . . . . . . . . . . . . . . . . . 100.0 31.3 (0.41) 13.3 (0.26) 34.8 (0.37) 15.7 (0.29) 4.9 (0.18) 45–64 years . . . . . . . . . . . . . . . . . . . . . . . . . . . . . 100.0 37.9 (0.42) 13.4 (0.28) 28.2 (0.36) 15.0 (0.29) 5.4 (0.17) 65–74 years . . . . . . . . . . . . . . . . . . . . . . . . . . . . . 100.0 52.5 (0.74) 11.2 (0.43) 19.7 (0.54) 12.5 (0.49) 4.0 (0.32) 75 years and over . . . . . . . . . . . . . . . . . . . . . . . . . . 100.0 62.4 (0.74) 10.3 (0.44) 14.6 (0.53) 10.3 (0.45) 2.2 (0.21)
Race: White, single race . . . . . . . . . . . . . . . . . . . . . . . . . . 100.0 35.8 (0.34) 12.3 (0.18) 30.6 (0.26) 15.7 (0.21) 5.4 (0.14) Black or African American, single race . . . . . . . . . . . . . 100.0 52.3 (0.64) 12.2 (0.39) 22.8 (0.50) 9.1 (0.34) 3.4 (0.22) American Indian or Alaska Native, single race . . . . . . . . 100.0 48.5 (3.10) 14.0 (1.76) 22.1 (1.88) 10.6 (1.85) 4.6 (1.14) Asian, single race . . . . . . . . . . . . . . . . . . . . . . . . . . 100.0 56.9 (1.01) 11.0 (0.63) 23.3 (0.83) 7.1 (0.52) 1.5 (0.24) Native Hawaiian or Other Pacific Islander, single race. . . . 100.0 53.6 (5.58) *5.7 (2.77) 23.9 (4.61) *6.7 (2.40) *10.1 (3.77) Two or more races . . . . . . . . . . . . . . . . . . . . . . . . . 100.0 47.0 (1.87) 13.6 (1.33) 23.0 (1.56) 10.0 (1.22) 6.0 (0.96)
Black or African American, white . . . . . . . . . . . . . . . 100.0 52.9 (4.69) 14.3 (2.83) 22.4 (4.34) *5.6 (1.76) *4.8 (1.85) American Indian or Alaska Native, white . . . . . . . . . . . 100.0 45.7 (2.65) 12.2 (1.91) 22.9 (2.43) 11.7 (1.98) 7.1 (1.48)
Hispanic or Latino origin and race: Hispanic or Latino . . . . . . . . . . . . . . . . . . . . . . . . . . 100.0 49.2 (0.59) 12.1 (0.39) 24.9 (0.49) 10.9 (0.36) 2.6 (0.17)
Mexican or Mexican American . . . . . . . . . . . . . . . . . 100.0 51.7 (0.74) 10.7 (0.46) 23.3 (0.59) 11.3 (0.46) 2.7 (0.21) Not Hispanic or Latino . . . . . . . . . . . . . . . . . . . . . . . 100.0 37.2 (0.33) 12.4 (0.18) 30.0 (0.26) 14.9 (0.20) 5.4 (0.13)
White, single race . . . . . . . . . . . . . . . . . . . . . . . . 100.0 33.2 (0.37) 12.4 (0.20) 31.7 (0.29) 16.5 (0.24) 6.0 (0.16) Black or African American, single race . . . . . . . . . . . . 100.0 52.5 (0.65) 12.1 (0.39) 22.8 (0.51) 9.0 (0.34) 3.3 (0.23)
Education: Less than high school graduate . . . . . . . . . . . . . . . . . 100.0 55.7 (0.56) 10.2 (0.33) 19.4 (0.45) 9.8 (0.35) 4.5 (0.23) GED diploma4 . . . . . . . . . . . . . . . . . . . . . . . . . . . . 100.0 43.2 (1.37) 12.8 (0.94) 23.7 (1.14) 12.8 (0.96) 7.2 (0.70) High school graduate . . . . . . . . . . . . . . . . . . . . . . . . 100.0 43.4 (0.51) 13.0 (0.31) 25.9 (0.42) 12.5 (0.30) 5.0 (0.20) Some college—no degree . . . . . . . . . . . . . . . . . . . . . 100.0 35.1 (0.57) 13.3 (0.37) 30.7 (0.49) 14.6 (0.39) 6.1 (0.27) Associate of arts degree . . . . . . . . . . . . . . . . . . . . . . 100.0 33.7 (0.72) 14.9 (0.49) 31.9 (0.66) 14.9 (0.50) 4.5 (0.32) Bachelor of arts, science degree . . . . . . . . . . . . . . . . . 100.0 26.9 (0.53) 11.9 (0.35) 36.3 (0.54) 19.5 (0.46) 5.3 (0.28) Masters, doctorate, medical degree . . . . . . . . . . . . . . . 100.0 26.1 (0.68) 10.7 (0.47) 39.7 (0.76) 19.8 (0.62) 3.6 (0.31)
Poverty status:5
Below poverty level . . . . . . . . . . . . . . . . . . . . . . . . . 100.0 54.8 (0.72) 10.7 (0.38) 20.0 (0.48) 9.4 (0.40) 4.8 (0.31) ≥1 and <2 times poverty level . . . . . . . . . . . . . . . . . . 100.0 50.0 (0.60) 12.4 (0.35) 22.6 (0.47) 10.3 (0.38) 4.6 (0.24) ≥2 and <4 times poverty level . . . . . . . . . . . . . . . . . . 100.0 40.1 (0.52) 13.3 (0.32) 28.4 (0.45) 13.0 (0.31) 4.9 (0.20) 4 times poverty level or more . . . . . . . . . . . . . . . . . . . 100.0 27.4 (0.42) 11.8 (0.27) 36.1 (0.42) 19.3 (0.35) 5.3 (0.19)
Marital status: Never married . . . . . . . . . . . . . . . . . . . . . . . . . . . . 100.0 42.7 (0.68) 10.1 (0.37) 26.8 (0.52) 14.2 (0.41) 5.8 (0.27) Married . . . . . . . . . . . . . . . . . . . . . . . . . . . . . . . . 100.0 37.9 (0.37) 13.5 (0.22) 30.4 (0.32) 14.2 (0.24) 3.8 (0.13) Cohabiting . . . . . . . . . . . . . . . . . . . . . . . . . . . . . . 100.0 27.8 (1.09) 12.3 (0.73) 32.9 (1.03) 18.3 (0.93) 8.6 (0.61) Divorced or separated . . . . . . . . . . . . . . . . . . . . . . . 100.0 36.7 (0.59) 12.6 (0.41) 29.9 (0.57) 14.3 (0.42) 6.4 (0.30) Widowed . . . . . . . . . . . . . . . . . . . . . . . . . . . . . . . 100.0 49.9 (2.60) 14.1 (1.68) 22.5 (2.38) 8.9 (2.06) 4.5 (1.22)
Geographic region: Northeast . . . . . . . . . . . . . . . . . . . . . . . . . . . . . . . 100.0 31.1 (0.54) 13.1 (0.39) 33.9 (0.51) 16.8 (0.48) 4.9 (0.26) Midwest . . . . . . . . . . . . . . . . . . . . . . . . . . . . . . . . 100.0 34.6 (0.63) 13.3 (0.36) 31.6 (0.47) 15.0 (0.36) 5.5 (0.28) South . . . . . . . . . . . . . . . . . . . . . . . . . . . . . . . . . 100.0 44.9 (0.55) 11.9 (0.26) 25.6 (0.41) 12.8 (0.28) 4.7 (0.19) West . . . . . . . . . . . . . . . . . . . . . . . . . . . . . . . . . . 100.0 39.6 (0.57) 11.1 (0.31) 29.2 (0.42) 14.8 (0.40) 5.1 (0.23)
Men
Ages 18 years and over (age-adjusted)2 . . . . . . . . . . . . . 100.0 32.4 (0.36) 9.2 (0.20) 30.4 (0.32) 22.1 (0.30) 5.7 (0.18) Ages 18 years and over (crude)2 . . . . . . . . . . . . . . . . . . 100.0 32.1 (0.36) 9.2 (0.20) 30.6 (0.32) 22.2 (0.29) 5.8 (0.18)
Age:3
18–24 years . . . . . . . . . . . . . . . . . . . . . . . . . . . . . 100.0 35.8 (1.18) 7.0 (0.56) 28.8 (0.99) 20.1 (0.89) 7.8 (0.65) 25–44 years . . . . . . . . . . . . . . . . . . . . . . . . . . . . . 100.0 24.8 (0.50) 9.4 (0.31) 35.7 (0.54) 24.0 (0.47) 5.9 (0.28) 45–64 years . . . . . . . . . . . . . . . . . . . . . . . . . . . . . 100.0 32.4 (0.54) 9.7 (0.34) 29.7 (0.52) 22.2 (0.47) 5.8 (0.27) 65–74 years . . . . . . . . . . . . . . . . . . . . . . . . . . . . . 100.0 43.6 (1.08) 9.7 (0.60) 22.4 (0.88) 19.9 (0.88) 4.3 (0.39) 75 years and over . . . . . . . . . . . . . . . . . . . . . . . . . . 100.0 52.2 (1.15) 9.2 (0.70) 18.3 (0.95) 17.9 (0.89) 2.2 (0.33)
See footnotes at end of table.

Series 10, No. 245 [ Page 15
Table 3.2. Age-adjusted percent distributions (with standard errors) of current alcohol drinking status for adults 18 years of age and over, by selected characteristics: United States, average annual, 2005–2007—Con.
Current alcohol drinking status1
Selected characteristic Total Nondrinker Infrequent Light Moderate Heavier
Men—Con. Percent distribution (standard error)
Race: White, single race . . . . . . . . . . . . . . . . . . . . . . . . . . 100.0 30.1 (0.39) 9.0 (0.22) 31.1 (0.37) 23.6 (0.33) 6.0 (0.21) Black or African American, single race . . . . . . . . . . . . . 100.0 42.7 (1.01) 9.6 (0.57) 26.5 (0.83) 16.1 (0.69) 4.8 (0.43) American Indian or Alaska Native, single race . . . . . . . . 100.0 42.5 (3.47) 8.1 (1.81) 26.9 (2.88) 16.4 (3.32) *5.6 (1.92) Asian, single race . . . . . . . . . . . . . . . . . . . . . . . . . . 100.0 44.7 (1.50) 11.3 (0.94) 30.3 (1.35) 11.5 (0.98) 2.0 (0.39) Native Hawaiian or Other Pacific Islander, single race. . . . 100.0 55.0 (7.95) † *15.9 (5.55) *13.1 (4.76) *15.7 (5.86) Two or more races . . . . . . . . . . . . . . . . . . . . . . . . . 100.0 44.2 (3.01) 10.3 (1.73) 22.7 (2.31) 15.6 (2.21) 6.6 (1.41)
Black or African American, white . . . . . . . . . . . . . . . 100.0 47.9 (7.74) *9.1 (3.69) *24.9 (7.70) *8.1 (3.30) *9.9 (4.39) American Indian or Alaska Native, white . . . . . . . . . . . 100.0 42.7 (4.01) 9.8 (2.47) 25.0 (3.50) 17.2 (3.30) *4.5 (1.46)
Hispanic or Latino origin and race: Hispanic or Latino . . . . . . . . . . . . . . . . . . . . . . . . . . 100.0 36.9 (0.82) 9.1 (0.50) 31.1 (0.78) 18.9 (0.65) 3.8 (0.29)
Mexican or Mexican American . . . . . . . . . . . . . . . . . 100.0 38.5 (1.01) 7.7 (0.55) 29.8 (0.92) 19.5 (0.84) 4.3 (0.39) Not Hispanic or Latino . . . . . . . . . . . . . . . . . . . . . . . 100.0 31.7 (0.39) 9.3 (0.22) 30.2 (0.36) 22.5 (0.33) 6.1 (0.21)
White, single race . . . . . . . . . . . . . . . . . . . . . . . . 100.0 28.8 (0.44) 9.1 (0.24) 30.9 (0.41) 24.4 (0.38) 6.6 (0.25) Black or African American, single race . . . . . . . . . . . . 100.0 42.8 (1.03) 9.6 (0.58) 26.6 (0.85) 16.0 (0.70) 4.7 (0.44)
Education: Less than high school graduate . . . . . . . . . . . . . . . . . 100.0 43.5 (0.81) 8.4 (0.46) 24.7 (0.72) 16.7 (0.62) 6.2 (0.39) GED diploma4 . . . . . . . . . . . . . . . . . . . . . . . . . . . . 100.0 35.9 (1.88) 9.5 (1.13) 24.6 (1.74) 20.6 (1.63) 9.1 (1.08) High school graduate . . . . . . . . . . . . . . . . . . . . . . . . 100.0 36.7 (0.69) 9.3 (0.38) 28.0 (0.60) 19.6 (0.53) 6.2 (0.31) Some college—no degree . . . . . . . . . . . . . . . . . . . . . 100.0 30.5 (0.80) 10.2 (0.50) 30.3 (0.73) 21.9 (0.65) 7.0 (0.44) Associate of arts degree . . . . . . . . . . . . . . . . . . . . . . 100.0 27.8 (0.99) 10.5 (0.67) 32.3 (0.98) 23.9 (0.93) 5.3 (0.57) Bachelor of arts, science degree . . . . . . . . . . . . . . . . . 100.0 21.9 (0.69) 9.0 (0.44) 36.1 (0.77) 28.3 (0.74) 4.7 (0.39) Masters, doctorate, medical degree . . . . . . . . . . . . . . . 100.0 23.9 (0.94) 8.3 (0.60) 38.2 (1.06) 26.6 (1.00) 2.9 (0.48)
Poverty status:5
Below poverty level . . . . . . . . . . . . . . . . . . . . . . . . . 100.0 45.1 (1.11) 7.7 (0.53) 22.8 (0.85) 17.3 (0.81) 6.7 (0.56) ≥1 and <2 times poverty level . . . . . . . . . . . . . . . . . . 100.0 42.4 (0.91) 9.6 (0.49) 24.8 (0.73) 16.7 (0.64) 6.3 (0.42) ≥2 and <4 times poverty level . . . . . . . . . . . . . . . . . . 100.0 34.4 (0.63) 9.8 (0.41) 29.9 (0.62) 19.9 (0.51) 5.8 (0.32) 4 times poverty level or more . . . . . . . . . . . . . . . . . . . 100.0 23.5 (0.52) 8.9 (0.32) 35.0 (0.57) 27.2 (0.54) 5.3 (0.30)
Marital status: Never married . . . . . . . . . . . . . . . . . . . . . . . . . . . . 100.0 37.4 (0.88) 7.7 (0.46) 26.8 (0.76) 20.6 (0.68) 7.1 (0.42) Married . . . . . . . . . . . . . . . . . . . . . . . . . . . . . . . . 100.0 31.7 (0.45) 10.4 (0.27) 32.4 (0.46) 21.3 (0.39) 4.1 (0.19) Cohabiting . . . . . . . . . . . . . . . . . . . . . . . . . . . . . . 100.0 24.1 (1.38) 9.7 (0.91) 33.0 (1.41) 25.3 (1.32) 7.8 (0.76) Divorced or separated . . . . . . . . . . . . . . . . . . . . . . . 100.0 29.3 (0.87) 7.2 (0.51) 30.0 (0.87) 24.3 (0.82) 9.0 (0.56) Widowed . . . . . . . . . . . . . . . . . . . . . . . . . . . . . . . 100.0 30.5 (4.26) *10.3 (3.74) 22.8 (4.87) 29.2 (6.70) *7.1 (2.48)
Geographic region: Northeast . . . . . . . . . . . . . . . . . . . . . . . . . . . . . . . 100.0 25.4 (0.71) 9.9 (0.49) 34.1 (0.80) 25.0 (0.75) 5.4 (0.42) Midwest . . . . . . . . . . . . . . . . . . . . . . . . . . . . . . . . 100.0 29.2 (0.69) 9.6 (0.43) 31.9 (0.62) 22.9 (0.59) 6.2 (0.40) South . . . . . . . . . . . . . . . . . . . . . . . . . . . . . . . . . 100.0 38.0 (0.67) 8.9 (0.31) 27.1 (0.56) 20.1 (0.47) 5.8 (0.30) West . . . . . . . . . . . . . . . . . . . . . . . . . . . . . . . . . . 100.0 32.1 (0.67) 8.5 (0.38) 31.5 (0.64) 22.3 (0.66) 5.4 (0.32)
Women
Ages 18 years and over (age-adjusted)2 . . . . . . . . . . . . . 100.0 44.7 (0.39) 15.3 (0.23) 28.3 (0.31) 7.4 (0.17) 4.3 (0.13) Ages 18 years and over (crude)2 . . . . . . . . . . . . . . . . . . 100.0 45.0 (0.39) 15.3 (0.23) 27.9 (0.30) 7.4 (0.17) 4.3 (0.13)
Age:3
18–24 years . . . . . . . . . . . . . . . . . . . . . . . . . . . . . 100.0 44.1 (1.07) 11.1 (0.58) 31.9 (0.95) 6.8 (0.48) 5.8 (0.46) 25–44 years . . . . . . . . . . . . . . . . . . . . . . . . . . . . . 100.0 37.6 (0.54) 17.0 (0.39) 34.0 (0.48) 7.5 (0.27) 3.8 (0.18) 45–64 years . . . . . . . . . . . . . . . . . . . . . . . . . . . . . 100.0 43.0 (0.56) 16.9 (0.40) 26.8 (0.46) 8.3 (0.30) 5.0 (0.22) 65–74 years . . . . . . . . . . . . . . . . . . . . . . . . . . . . . 100.0 60.1 (0.89) 12.4 (0.60) 17.3 (0.64) 6.3 (0.44) 3.8 (0.50) 75 years and over . . . . . . . . . . . . . . . . . . . . . . . . . . 100.0 68.9 (0.90) 11.0 (0.56) 12.2 (0.62) 5.5 (0.41) 2.3 (0.28)
Race: White, single race . . . . . . . . . . . . . . . . . . . . . . . . . . 100.0 41.0 (0.43) 15.5 (0.27) 30.3 (0.35) 8.2 (0.20) 4.8 (0.16) Black or African American, single race . . . . . . . . . . . . . 100.0 59.8 (0.73) 14.4 (0.49) 20.0 (0.58) 3.4 (0.25) 2.2 (0.19) American Indian or Alaska Native, single race . . . . . . . . 100.0 54.7 (4.26) 19.5 (3.52) 17.5 (2.14) 4.6 (1.25) *3.6 (1.11) Asian, single race . . . . . . . . . . . . . . . . . . . . . . . . . . 100.0 68.2 (1.27) 10.7 (0.85) 16.9 (1.01) 3.1 (0.46) 1.1 (0.28) Native Hawaiian or Other Pacific Islander, single race. . . . 100.0 53.6 (7.19) *10.7 (5.02) 33.1 (7.36) † † Two or more races . . . . . . . . . . . . . . . . . . . . . . . . . 100.0 49.3 (2.24) 17.0 (2.00) 23.5 (2.18) 4.7 (1.02) 5.5 (1.25)
Black or African American, white . . . . . . . . . . . . . . . 100.0 56.6 (4.94) 18.1 (4.05) 20.4 (4.38) *3.9 (1.92) † American Indian or Alaska Native, white . . . . . . . . . . . 100.0 48.9 (3.55) 15.4 (3.12) 20.4 (3.09) *5.1 (1.53) 10.2 (2.53)
See footnotes at end of table.

Page 16 [ Series 10, No. 245
Table 3.2. Age-adjusted percent distributions (with standard errors) of current alcohol drinking status for adults 18 years of age and over, by selected characteristics: United States, average annual, 2005–2007—Con.
Current alcohol drinking status1
Selected characteristic Total Nondrinker Infrequent Light Moderate Heavier
Women—Con. Percent distribution (standard error)
Hispanic or Latino origin and race: Hispanic or Latino . . . . . . . . . . . . . . . . . . . . . . . . . . 100.0 61.8 (0.75) 15.2 (0.59) 18.6 (0.58) 2.8 (0.23) 1.5 (0.17)
Mexican or Mexican American . . . . . . . . . . . . . . . . . 100.0 65.8 (0.94) 13.9 (0.74) 16.5 (0.69) 2.6 (0.28) 1.1 (0.18) Not Hispanic or Latino . . . . . . . . . . . . . . . . . . . . . . . 100.0 42.1 (0.42) 15.3 (0.25) 29.8 (0.34) 8.0 (0.19) 4.7 (0.15)
White, single race . . . . . . . . . . . . . . . . . . . . . . . . 100.0 37.1 (0.47) 15.6 (0.29) 32.6 (0.39) 9.2 (0.24) 5.3 (0.18) Black or African American, single race . . . . . . . . . . . . 100.0 60.1 (0.75) 14.1 (0.50) 20.0 (0.59) 3.5 (0.25) 2.2 (0.19)
Education: Less than high school graduate . . . . . . . . . . . . . . . . . 100.0 68.2 (0.69) 12.2 (0.48) 13.9 (0.50) 2.8 (0.24) 2.7 (0.23) GED diploma4 . . . . . . . . . . . . . . . . . . . . . . . . . . . . 100.0 50.8 (1.87) 16.3 (1.41) 22.9 (1.57) 4.6 (0.74) 5.2 (0.84) High school graduate . . . . . . . . . . . . . . . . . . . . . . . . 100.0 49.8 (0.67) 16.7 (0.48) 24.2 (0.58) 5.6 (0.30) 3.6 (0.23) Some college—no degree . . . . . . . . . . . . . . . . . . . . . 100.0 39.1 (0.71) 16.1 (0.51) 31.1 (0.65) 8.3 (0.40) 5.2 (0.30) Associate of arts degree . . . . . . . . . . . . . . . . . . . . . . 100.0 38.3 (0.94) 18.3 (0.71) 31.6 (0.89) 8.0 (0.48) 3.8 (0.36) Bachelor of arts, science degree . . . . . . . . . . . . . . . . . 100.0 31.9 (0.73) 14.7 (0.54) 36.5 (0.71) 11.0 (0.46) 6.0 (0.37) Masters, doctorate, medical degree . . . . . . . . . . . . . . . 100.0 28.5 (0.94) 13.1 (0.72) 41.2 (1.04) 12.7 (0.68) 4.5 (0.44)
Poverty status:5
Below poverty level . . . . . . . . . . . . . . . . . . . . . . . . . 100.0 61.6 (0.82) 12.9 (0.51) 18.1 (0.62) 3.7 (0.31) 3.5 (0.29) ≥1 and <2 times poverty level . . . . . . . . . . . . . . . . . . 100.0 56.4 (0.70) 14.8 (0.48) 20.7 (0.56) 4.8 (0.32) 3.2 (0.26) ≥2 and <4 times poverty level . . . . . . . . . . . . . . . . . . 100.0 45.5 (0.68) 16.7 (0.45) 27.0 (0.58) 6.6 (0.30) 4.1 (0.25) 4 times poverty level or more . . . . . . . . . . . . . . . . . . . 100.0 31.5 (0.61) 14.9 (0.39) 37.3 (0.59) 10.8 (0.35) 5.3 (0.25)
Marital status: Never married . . . . . . . . . . . . . . . . . . . . . . . . . . . . 100.0 48.4 (0.90) 12.8 (0.54) 27.1 (0.71) 7.1 (0.41) 4.4 (0.31) Married . . . . . . . . . . . . . . . . . . . . . . . . . . . . . . . . 100.0 44.1 (0.49) 16.5 (0.33) 28.5 (0.42) 7.2 (0.23) 3.6 (0.17) Cohabiting . . . . . . . . . . . . . . . . . . . . . . . . . . . . . . 100.0 32.1 (1.67) 14.9 (1.20) 32.7 (1.60) 10.4 (1.02) 9.6 (0.97) Divorced or separated . . . . . . . . . . . . . . . . . . . . . . . 100.0 41.8 (0.77) 16.2 (0.56) 29.8 (0.71) 7.5 (0.39) 4.6 (0.31) Widowed . . . . . . . . . . . . . . . . . . . . . . . . . . . . . . . 100.0 55.4 (2.90) 15.2 (1.87) 22.5 (2.70) 3.1 (0.54) *3.8 (1.38)
Geographic region: Northeast . . . . . . . . . . . . . . . . . . . . . . . . . . . . . . . 100.0 35.9 (0.72) 16.1 (0.54) 33.9 (0.70) 9.6 (0.50) 4.4 (0.30) Midwest . . . . . . . . . . . . . . . . . . . . . . . . . . . . . . . . 100.0 39.5 (0.80) 16.7 (0.53) 31.4 (0.64) 7.4 (0.34) 4.8 (0.30) South . . . . . . . . . . . . . . . . . . . . . . . . . . . . . . . . . 100.0 51.0 (0.66) 14.8 (0.37) 24.2 (0.50) 6.1 (0.26) 3.7 (0.19) West . . . . . . . . . . . . . . . . . . . . . . . . . . . . . . . . . . 100.0 46.9 (0.78) 13.6 (0.45) 27.1 (0.59) 7.5 (0.32) 4.8 (0.30)
* Estimates preceded by an asterisk have a relative standard error of greater than 30% and less than or equal to 50%. These should be interpreted with caution as they do not meet the standard of reliability or precision.
† Estimates with a relative standard error greater than 50% are indicated with a dagger, but are not shown. 1Current alcohol drinking status: Nondrinker—no drinks in the past year (includes former drinkers and lifetime abstainers); infrequent—at least 12 drinks in lifetime and 1–11 drinks in past year; light— 3 drinks or less per week, on average, in the past year; moderate—more than 3 and up to and including 14 drinks per week for men, and more than 3 and up to and including 7 drinks per week for women, on average, in the past year; heavier—more than 14 drinks per week for men, and more than 7 drinks per week for women, on average, in the past year. 2Persons of other races and unknown race and ethnicity, unknown education, unknown poverty status, and unknown marital status are included in the total. 3Estimates for age groups are not age adjusted. 4GED is General Educational Development high school equivalency diploma. 5Poverty status is based on family income and family size using the U.S. Census Bureau poverty thresholds for 2004, 2005, and 2006.
NOTES: Unless otherwise specified, estimates are age adjusted using the projected 2000 U.S. population as the standard population and using three age groups: 18–44 years, 45–64 years, and 65 years and over. For crude percent distributions, refer to Appendix Table IV. Denominator for each percent distribution excludes persons with unknown lifetime and unknown current drinking status. See Appendix II for definitions of terms. See Appendix III for health behavior questions.
DATA SOURCE: National Health Interview Survey, 2005–2007. Estimates are based on household interviews of a sample of the civilian noninstitutionalized population.

Series 10, No. 245 [ Page 17
Table 3.3. Age-adjusted percentages (with standard errors) of adults 18 years of age and over who had five or more drinks in 1 day at least once in the past year, and age-adjusted percentages (with standard errors) of adults 18 years of age and over who had five or more drinks in 1 day on at least 12 days in the past year, by selected characteristics: United States, average annual, 2005–2007
Five or more drinks in 1 day at least once1 Five or more drinks in 1 day on at least 12 days1
Selected characteristic Both sexes Men Women Both sexes Men Women
Percent of adults (standard error)
Ages 18 years and over (age-adjusted)2 . . . . . . . . . . . . . Ages 18 years and over (crude)2 . . . . . . . . . . . . . . . . . .
20.5 (0.24) 20.2 (0.25)
28.8 (0.37) 28.9 (0.39)
12.8 (0.22) 12.3 (0.22)
9.2 (0.16) 9.1 (0.16)
14.6 (0.27) 14.7 (0.28)
4.2 (0.14) 4.0 (0.13)
Age3
18–24 years . . . . . . . . . . . . . . . . . . . . . . . . . . . . . . . 25–44 years . . . . . . . . . . . . . . . . . . . . . . . . . . . . . . . 45–64 years . . . . . . . . . . . . . . . . . . . . . . . . . . . . . . . 65–74 years . . . . . . . . . . . . . . . . . . . . . . . . . . . . . . . 75 years and over . . . . . . . . . . . . . . . . . . . . . . . . . . .
31.9 (0.84) 27.4 (0.40) 15.6 (0.29)
6.1 (0.33) 2.2 (0.22)
40.7 (1.25) 37.9 (0.61) 23.3 (0.50) 10.3 (0.62)
4.3 (0.47)
23.4 (0.89) 17.2 (0.39)
8.5 (0.29) 2.5 (0.28) 0.8 (0.18)
16.2 (0.62) 11.8 (0.27) 6.8 (0.20) 2.8 (0.21) 0.9 (0.14)
22.9 (1.00) 18.8 (0.46) 11.5 (0.37) 4.9 (0.42) 2.0 (0.32)
9.7 (0.62) 5.1 (0.23) 2.4 (0.15) 0.9 (0.18)
*0.3 (0.12)
Race White, single race . . . . . . . . . . . . . . . . . . . . . . . . . . . Black or African American, single race. . . . . . . . . . . . . . . American Indian or Alaska Native, single race . . . . . . . . . . Asian, single race . . . . . . . . . . . . . . . . . . . . . . . . . . . Native Hawaiian or Other Pacific Islander, single race . . . . . Two or more races . . . . . . . . . . . . . . . . . . . . . . . . . . .
Black or African American, white . . . . . . . . . . . . . . . . . American Indian or Alaska Native, white . . . . . . . . . . . .
22.5 (0.28) 11.9 (0.39) 24.5 (2.88) 9.2 (0.59)
21.1 (4.78) 21.6 (1.58) 13.7 (3.14) 27.1 (2.58)
31.0 (0.42) 19.2 (0.75) 34.0 (4.19) 14.1 (1.05) 30.5 (6.90) 28.6 (2.60) 19.6 (5.72) 32.6 (3.80)
14.4 (0.27) 6.0 (0.34)
14.6 (2.23) 4.5 (0.55)
*9.8 (3.54) 15.0 (1.70)
9.6 (2.86) 20.8 (3.06)
10.0 (0.18) 5.9 (0.31)
11.7 (1.73) 3.8 (0.42)
13.7 (3.97) 10.2 (1.30) *3.2 (1.20) 13.0 (2.12)
15.6 (0.30) 10.7 (0.64) 17.2 (2.74) 6.2 (0.74)
23.6 (6.47) 15.3 (2.19)
† 15.6 (3.21)
4.6 (0.17) 2.0 (0.19) 6.1 (1.51) 1.5 (0.35)
† 5.5 (1.14)
*1.9 (0.81) 10.3 (2.48)
Hispanic or Latino origin and race
Hispanic or Latino . . . . . . . . . . . . . . . . . . . . . . . . . . . Mexican or Mexican American . . . . . . . . . . . . . . . . . .
Not Hispanic or Latino. . . . . . . . . . . . . . . . . . . . . . . . . White, single race . . . . . . . . . . . . . . . . . . . . . . . . . . Black or African American, single race . . . . . . . . . . . . .
17.2 (0.43) 18.8 (0.56) 21.2 (0.27) 23.8 (0.32) 11.7 (0.40)
27.0 (0.72) 30.0 (0.95) 29.2 (0.41) 32.0 (0.48) 19.0 (0.78)
7.0 (0.36) 6.8 (0.43)
13.8 (0.25) 16.0 (0.31)
5.9 (0.34)
8.6 (0.30) 9.9 (0.40) 9.4 (0.18)
10.4 (0.21) 5.9 (0.32)
14.3 (0.53) 16.8 (0.71) 14.7 (0.31) 16.0 (0.35) 10.6 (0.66)
2.6 (0.21) 2.4 (0.24) 4.4 (0.16) 5.1 (0.19) 2.0 (0.20)
Education
Less than high school graduate . . . . . . . . . . . . . . . . . . . GED diploma4 . . . . . . . . . . . . . . . . . . . . . . . . . . . . . . High school graduate . . . . . . . . . . . . . . . . . . . . . . . . . Some college—no degree . . . . . . . . . . . . . . . . . . . . . . Associate of arts degree . . . . . . . . . . . . . . . . . . . . . . . Bachelor of arts, science degree . . . . . . . . . . . . . . . . . . Masters, doctorate, medical degree . . . . . . . . . . . . . . . .
17.8 (0.49) 24.8 (1.20) 19.5 (0.40) 22.7 (0.49) 21.5 (0.61) 22.4 (0.51) 17.7 (0.63)
27.0 (0.79) 35.0 (1.84) 27.5 (0.64) 31.1 (0.80) 31.8 (1.00) 30.4 (0.83) 23.6 (1.04)
8.2 (0.44) 14.0 (1.23) 11.4 (0.42) 15.4 (0.51) 13.4 (0.64) 14.7 (0.50) 12.1 (0.65)
9.7 (0.37) 13.6 (0.96)
9.5 (0.28) 10.3 (0.35)
8.9 (0.42) 8.8 (0.34) 5.3 (0.40)
15.9 (0.64) 20.7 (1.58) 15.2 (0.49) 16.0 (0.60) 15.4 (0.81) 13.3 (0.59)
8.2 (0.78)
3.2 (0.26) 6.0 (0.83) 3.8 (0.27) 5.4 (0.35) 3.7 (0.34) 4.5 (0.30) 2.6 (0.33)
Poverty status5
Below poverty level . . . . . . . . . . . . . . . . . . . . . . . . . . ≥1 and <2 times poverty level . . . . . . . . . . . . . . . . . . . . ≥2 and <4 times poverty level . . . . . . . . . . . . . . . . . . . . 4 times poverty level or more . . . . . . . . . . . . . . . . . . . .
17.2 (0.57) 17.3 (0.44) 20.0 (0.37) 23.6 (0.40)
26.2 (0.99) 25.2 (0.75) 28.0 (0.59) 31.6 (0.61)
10.7 (0.53) 10.5 (0.43) 12.4 (0.39) 15.1 (0.42)
9.3 (0.38) 8.9 (0.31) 9.1 (0.26) 9.6 (0.27)
16.0 (0.77) 14.6 (0.57) 14.4 (0.44) 14.5 (0.44)
4.5 (0.31) 3.9 (0.28) 4.0 (0.25) 4.3 (0.26)
Marital status Never married. . . . . . . . . . . . . . . . . . . . . . . . . . . . . . Married . . . . . . . . . . . . . . . . . . . . . . . . . . . . . . . . . . Cohabiting . . . . . . . . . . . . . . . . . . . . . . . . . . . . . . . . Divorced or separated. . . . . . . . . . . . . . . . . . . . . . . . . Widowed . . . . . . . . . . . . . . . . . . . . . . . . . . . . . . . . .
23.2 (0.49) 17.7 (0.27) 28.9 (0.89) 21.9 (0.54) 10.6 (2.11)
30.3 (0.73) 25.9 (0.46) 35.7 (1.28) 33.3 (0.94) 31.3 (6.77)
15.3 (0.54) 10.1 (0.26) 21.4 (1.02) 14.3 (0.59)
4.8 (1.13)
11.9 (0.36) 6.8 (0.16)
14.1 (0.74) 10.1 (0.39) *6.2 (1.98)
17.2 (0.58) 11.4 (0.31) 19.1 (1.09) 18.6 (0.80) 25.1 (6.86)
5.9 (0.34) 2.6 (0.13) 8.7 (0.76) 4.4 (0.34)
*0.9 (0.36)
Geographic region Northeast . . . . . . . . . . . . . . . . . . . . . . . . . . . . . . . . Midwest . . . . . . . . . . . . . . . . . . . . . . . . . . . . . . . . . South . . . . . . . . . . . . . . . . . . . . . . . . . . . . . . . . . . . West . . . . . . . . . . . . . . . . . . . . . . . . . . . . . . . . . . .
21.4 (0.58) 25.1 (0.53) 17.6 (0.39) 19.8 (0.46)
29.9 (0.89) 34.2 (0.82) 25.5 (0.58) 27.6 (0.72)
13.9 (0.55) 16.5 (0.48) 10.3 (0.34) 12.1 (0.47)
8.8 (0.39) 11.6 (0.36) 8.3 (0.24) 8.5 (0.30)
13.9 (0.67) 17.9 (0.60) 13.4 (0.43) 13.5 (0.50)
4.4 (0.38) 5.5 (0.34) 3.6 (0.19) 3.4 (0.24)
* Estimates preceded by an asterisk have a relative standard error of greater than 30% and less than or equal to 50%. These should be interpreted with caution as they do not meet the standard of reliability or precision.
† Estimates with a relative standard error greater than 50% are indicated with a dagger, but are not shown. 1Adults who had had at least one drink in the past year (current drinkers) were asked on how many days in the past year they had had five or more drinks of any alcoholic beverage. Estimates in this table are the percentage of all adults who had five or more drinks (with nondrinkers assigned a value of zero drinks.) 2Persons of other races and unknown race and ethnicity, unknown education, unknown poverty status, and unknown marital status are included in total. 3Estimates for age groups are not age adjusted. 4GED is General Educational Development high school equivalency diploma. 5Poverty status is based on family income and family size using the U.S. Census Bureau poverty thresholds for 2004, 2005, and 2006.
NOTES: Unless otherwise specified, estimates are age adjusted using the projected 2000 U.S. population as the standard population and using three age groups: 18–44 years, 45–64 years, and 65 years and over. For crude percentages, refer to Appendix Table V. Denominator for each percentage excludes persons with unknown lifetime drinking status and/or unknown five or more drinks in 1 day. See Appendix II for definitions of terms. See Appendix III for health behavior questions.
DATA SOURCE: National Health Interview Survey, 2005–2007. Estimates are based on household interviews of a sample of the civilian noninstitutionalized population.

Page 18 [ Series 10, No. 245
Table 3.4. Age-adjusted percentages (with standard errors) of current drinkers 18 years of age and over who had five or more drinks in 1 day at least once in the past year, and age-adjusted percentages (with standard errors) of current drinkers 18 years of age and over who had five or more drinks in 1 day on at least 12 days in the past year, by selected characteristics: United States, average annual, 2005–2007
Five or more drinks in 1 day at least once1 Five or more drinks in 1 day on at least 12 days1
Selected characteristic Both sexes Men Women Both sexes Men Women
Percent of current drinkers (standard error)
Ages 18 years and over (age-adjusted)2 . . . . . . . . . . . . . Ages 18 years and over (crude)2 . . . . . . . . . . . . . . . . . .
32.2 (0.32) 33.3 (0.35)
41.4 (0.45) 42.9 (0.50)
21.7 (0.33) 22.4 (0.36)
14.5 (0.23) 14.9 (0.25)
21.0 (0.36) 21.8 (0.38)
7.1 (0.22) 7.3 (0.23)
Age3
18–24 years . . . . . . . . . . . . . . . . . . . . . . . . . . . . . . . 25–44 years . . . . . . . . . . . . . . . . . . . . . . . . . . . . . . . 45–64 years . . . . . . . . . . . . . . . . . . . . . . . . . . . . . . . 65–74 years . . . . . . . . . . . . . . . . . . . . . . . . . . . . . . . 75 years and over . . . . . . . . . . . . . . . . . . . . . . . . . . .
53.8 (1.02) 40.1 (0.52) 25.2 (0.44) 12.8 (0.67)
5.8 (0.56)
64.0 (1.38) 50.7 (0.71) 34.7 (0.69) 18.4 (1.06)
9.1 (0.96)
42.3 (1.30) 27.7 (0.58) 14.9 (0.48)
6.2 (0.69) 2.5 (0.59)
27.3 (0.91) 17.3 (0.37) 11.0 (0.32) 5.9 (0.44) 2.5 (0.38)
36.1 (1.35) 25.1 (0.58) 17.1 (0.54)
8.8 (0.73) 4.2 (0.67)
17.5 (1.05) 8.2 (0.36) 4.3 (0.27) 2.4 (0.45)
*0.9 (0.37)
Race White, single race . . . . . . . . . . . . . . . . . . . . . . . . . . . Black or African American, single race. . . . . . . . . . . . . . . American Indian or Alaska Native, single race . . . . . . . . . . Asian, single race . . . . . . . . . . . . . . . . . . . . . . . . . . . Native Hawaiian or Other Pacific Islander, single race . . . . . Two or more races . . . . . . . . . . . . . . . . . . . . . . . . . . .
Black or African American, white . . . . . . . . . . . . . . . . . American Indian or Alaska Native, white . . . . . . . . . . . .
33.6 (0.35) 23.9 (0.74) 46.4 (3.83) 19.9 (1.19) 44.2 (7.09) 37.7 (2.67) 24.8 (5.31) 45.5 (3.71)
43.0 (0.50) 32.7 (1.19) 57.8 (5.32) 24.5 (1.68) 60.2 (9.19) 49.8 (3.84) 33.7 (7.58) 54.4 (5.02)
23.0 (0.38) 13.9 (0.76) 30.8 (4.00) 12.1 (1.44)
*18.2 (7.33) 24.9 (2.83) 14.8 (4.17) 34.5 (4.74)
15.0 (0.25) 12.0 (0.62) 21.6 (2.88) 8.1 (0.85)
28.5 (5.31) 18.4 (2.52) *5.8 (2.46) 21.8 (3.58)
21.6 (0.39) 18.4 (1.05) 29.1 (4.08) 10.8 (1.24) 44.1 (8.69) 27.6 (4.08)
† 26.8 (5.64)
7.4 (0.26) 4.8 (0.45)
11.9 (2.88) 3.7 (0.86)
† 8.7 (1.80)
*2.9 (1.26) 15.9 (3.54)
Hispanic or Latino origin and race
Hispanic or Latino . . . . . . . . . . . . . . . . . . . . . . . . . . . Mexican or Mexican American . . . . . . . . . . . . . . . . . .
Not Hispanic or Latino. . . . . . . . . . . . . . . . . . . . . . . . . White, single race . . . . . . . . . . . . . . . . . . . . . . . . . . Black or African American, single race . . . . . . . . . . . . .
32.3 (0.74) 37.2 (1.10) 32.2 (0.34) 33.9 (0.38) 23.7 (0.76)
41.5 (1.03) 47.2 (1.47) 41.5 (0.50) 43.5 (0.55) 32.4 (1.23)
17.1 (0.82) 18.2 (1.05) 22.3 (0.36) 23.8 (0.41) 13.8 (0.78)
16.1 (0.54) 19.6 (0.79) 14.3 (0.25) 14.8 (0.28) 12.0 (0.64)
21.9 (0.78) 26.3 (1.10) 20.9 (0.40) 21.7 (0.44) 18.2 (1.09)
6.3 (0.51) 6.6 (0.63) 7.2 (0.24) 7.6 (0.28) 4.8 (0.46)
Education
Less than high school graduate . . . . . . . . . . . . . . . . . . . GED diploma4 . . . . . . . . . . . . . . . . . . . . . . . . . . . . . . High school graduate . . . . . . . . . . . . . . . . . . . . . . . . . Some college—no degree . . . . . . . . . . . . . . . . . . . . . . Associate of arts degree . . . . . . . . . . . . . . . . . . . . . . . Bachelor of arts, science degree . . . . . . . . . . . . . . . . . . Masters, doctorate, medical degree . . . . . . . . . . . . . . . .
38.5 (0.84) 41.3 (1.81) 33.2 (0.57) 33.9 (0.62) 31.4 (0.82) 29.8 (0.64) 23.6 (0.80)
46.1 (1.10) 52.7 (2.35) 42.4 (0.85) 44.0 (0.96) 43.1 (1.21) 38.2 (0.96) 30.6 (1.26)
24.5 (1.14) 25.3 (2.24) 21.7 (0.70) 24.1 (0.72) 20.8 (0.95) 20.6 (0.68) 16.5 (0.87)
21.1 (0.72) 23.0 (1.57) 16.2 (0.44) 15.4 (0.48) 12.9 (0.59) 11.6 (0.43) 7.0 (0.53)
27.4 (0.99) 31.4 (2.28) 23.3 (0.69) 22.6 (0.79) 20.7 (1.04) 16.6 (0.72) 10.6 (0.97)
9.7 (0.75) 11.6 (1.73) 7.2 (0.49) 8.4 (0.53) 5.8 (0.51) 6.2 (0.42) 3.7 (0.47)
Poverty status5
Below poverty level . . . . . . . . . . . . . . . . . . . . . . . . . . ≥1 and <2 times poverty level . . . . . . . . . . . . . . . . . . . . ≥2 and <4 times poverty level . . . . . . . . . . . . . . . . . . . . 4 times poverty level or more . . . . . . . . . . . . . . . . . . . .
35.3 (0.92) 32.5 (0.72) 32.0 (0.51) 31.6 (0.49)
45.3 (1.34) 42.0 (1.07) 41.4 (0.78) 40.6 (0.70)
25.2 (1.11) 21.9 (0.86) 21.3 (0.60) 21.1 (0.54)
19.4 (0.71) 16.9 (0.56) 14.6 (0.38) 12.8 (0.35)
28.0 (1.22) 24.4 (0.92) 21.3 (0.62) 18.6 (0.54)
10.7 (0.76) 8.3 (0.60) 6.9 (0.41) 6.0 (0.35)
Marital status
Never married. . . . . . . . . . . . . . . . . . . . . . . . . . . . . . Married . . . . . . . . . . . . . . . . . . . . . . . . . . . . . . . . . . Cohabiting . . . . . . . . . . . . . . . . . . . . . . . . . . . . . . . . Divorced or separated. . . . . . . . . . . . . . . . . . . . . . . . . Widowed . . . . . . . . . . . . . . . . . . . . . . . . . . . . . . . . .
38.5 (0.71) 27.8 (0.38) 38.8 (1.17) 33.5 (0.74) 20.3 (3.49)
47.0 (1.05) 36.8 (0.57) 45.6 (1.62) 46.4 (1.19) 42.5 (7.52)
27.2 (0.86) 17.4 (0.42) 30.2 (1.38) 23.2 (0.87) 10.6 (2.30)
19.7 (0.58) 10.7 (0.25) 19.0 (1.00) 15.6 (0.57) 11.7 (3.36)
26.6 (0.89) 16.2 (0.42) 24.4 (1.41) 26.1 (1.04) 33.1 (7.69)
10.5 (0.58) 4.5 (0.22)
12.1 (1.04) 7.2 (0.55)
*2.1 (0.76)
Geographic region
Northeast . . . . . . . . . . . . . . . . . . . . . . . . . . . . . . . . Midwest . . . . . . . . . . . . . . . . . . . . . . . . . . . . . . . . . South . . . . . . . . . . . . . . . . . . . . . . . . . . . . . . . . . . . West . . . . . . . . . . . . . . . . . . . . . . . . . . . . . . . . . . .
30.0 (0.70) 36.5 (0.62) 30.3 (0.56) 31.9 (0.66)
39.3 (1.05) 46.6 (0.94) 39.7 (0.77) 39.8 (0.91)
20.6 (0.74) 25.3 (0.64) 19.5 (0.57) 22.0 (0.77)
12.4 (0.52) 16.8 (0.48) 14.3 (0.39) 13.6 (0.46)
18.2 (0.83) 24.4 (0.75) 20.8 (0.62) 19.5 (0.68)
6.5 (0.55) 8.5 (0.49) 6.9 (0.34) 6.2 (0.42)
* Estimates preceded by an asterisk have a relative standard error of greater than 30% and less than or equal to 50%. These should be interpreted with caution as they do not meet the standard of reliability or precision.
† Estimates with a relative standard error greater than 50% are indicated with a dagger, but are not shown. 1Adults who had had at least one drink in the past year (current drinkers) were asked on how many days in the past year they had had five or more drinks. 2Persons of other races and unknown race and ethnicity, unknown education, unknown poverty status, and unknown marital status are included in total. 3Estimates for age groups are not age adjusted. 4GED is General Educational Development high school equivalency diploma. 5Poverty status is based on family income and family size using the U.S. Census Bureau poverty thresholds for 2004, 2005, and 2006.
NOTES: Unless otherwise specified, estimates are age adjusted using the projected 2000 U.S. population as the standard population and using three age groups: 18–44 years, 45–64 years, and 65 years and over. For crude percentages, refer to Appendix Table VI. Denominator for each percentage excludes persons with unknown lifetime drinking status, nondrinkers, and current drinkers with unknown information for five or more drinks in 1 day. See Appendix II for definitions of terms. See Appendix III for health behavior questions.
DATA SOURCE: National Health Interview Survey, 2005–2007. Estimates are based on household interviews of a sample of the civilian noninstitutionalized population.

Series 10, No. 245 [ Page 19
64.4
14.4 17.6
3.5
16.2 21.1
4.2
58.5
0
10
20
30
40
50
60
70
Both sexes Men Women
Current daily Current nondaily Former Never
Per
cent
NOTES: Estimates are based on household interviews of a sample of the civilian noninstitutionalized population. Totals do not add to 100% due to rounding. Estimates are age adjusted using the projected 2000 U.S. population as the standard population.
DATA SOURCE: CDC/NCHS, National Health Interview Survey, 2005–2007.
25.2
51.8
5.0
18.1
Figure 4.1. Percent distributions of current cigarette smoking status of adults, by sex: United States, 2005–2007
5 days or less 27.4%
6–10 days 17.1%
11–15 days 21.0%
16–20 days 17.5%
21 days or more 17.0%
NOTE: Estimates are based on household interviews of a sample of the civilian noninstitutionalized population. Estimates are age adjusted using the projected 2000 U.S. population as the standard population.
DATA SOURCE: CDC/NCHS, National Health Interview Survey, 2005–2007.
Figure 4.2. Percent distribution of number of days smoked in the past 30 days among adult nondaily smokers: United States, 2005–2007
Chapter 4 Cigarette Smoking
All Adults + Overall, 20.4% of U.S. adults were
current smokers, 21.1% of adults were formers smokers, and over one-half of adults (58.5%) had never smoked cigarettes (Table 4.1).
+ Among all adults, 16% smoked daily and 4% smoked less than daily (Table 4.2 and Figure 4.1).
+ About one in four nondaily smokers (27.4%) smoked on 5 days or less in the past 30 days; about 17% nondaily smokers smoked on 21 days or more during the past 30 days (Figure 4.2).
+ Daily smokers smoked an average of 17 cigarettes a day compared with 5 cigarettes a day for nondaily smokers on days that they smoked (Table 4.2).
+ About one-half of all current smokers (daily and nondaily) (52.9%) usually smoked fewer than 15 cigarettes on days smoked; about one-third (35.3%) usually smoked 15–24 cigarettes on days smoked (Table 4.3 and Figure 4.3).
+ Approximately 3 in 10 current smokers (31.8%) started smoking before the age of 16 years and about 1 in 5 current smokers (17.1%) started smoking at age 21 years or over (Table 4.4 and Figure 4.4).
+ About 4 in 10 current smokers (42.5%) attempted to quit smoking in the past year, with nondaily smokers (54.6%) more likely than daily smokers (39.6%) to have attempted to quit (Table 4.5).
Sex + Men (23.0%) were more likely than
women (18.0%) to be current smokers and also more likely to be former smokers (Table 4.1).
+ Male smokers (daily and nondaily) were about twice as likely as female smokers to usually smoke 35 or more cigarettes on days smoked (Table 4.3).
+ Male smokers were more likely than female smokers to have started smoking before the age of 16 years, and female smokers were more likely than male smokers to have started smoking at age 21 years and over (Table 4.4).
Age+ Current smoking was most prevalent
among adults aged 18–24 years (23.5%) and aged 25–44 years (23.4%) and declined with age (Table 4.1).
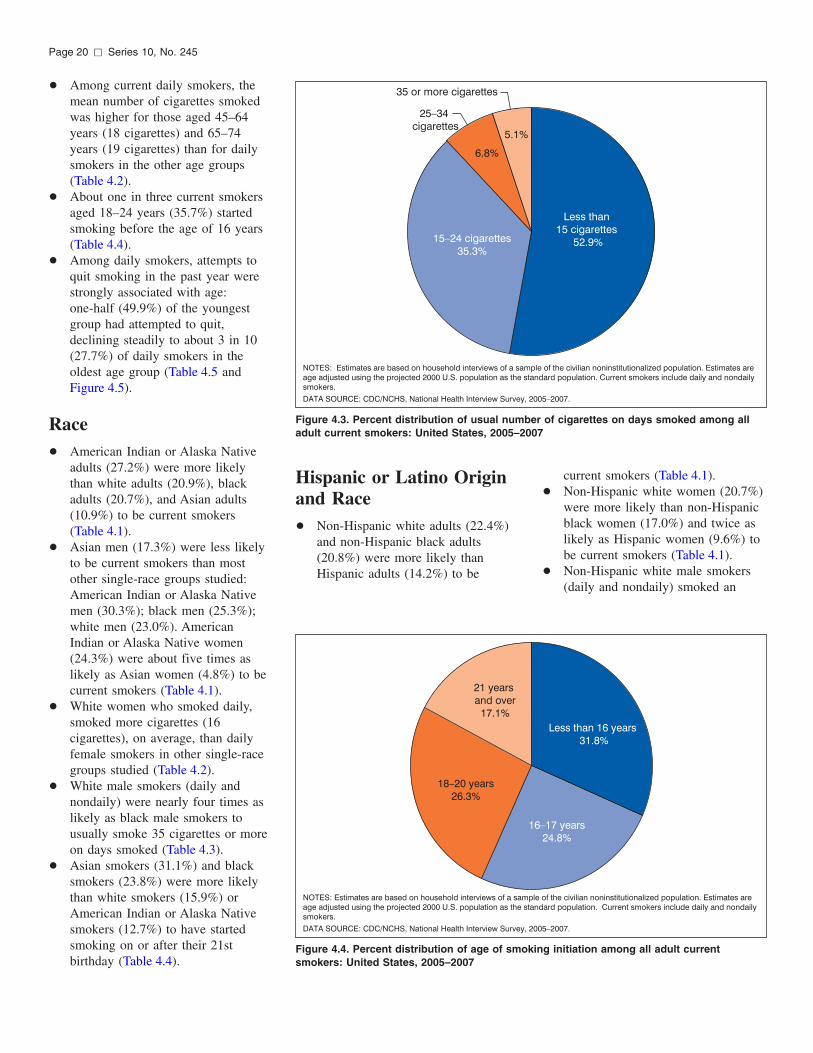
35 or more cigarettes
25–34 cigarettes
5.1%
Less than 15 cigarettes
52.9%15–24 cigarettes 35.3%
6.8%
NOTES: Estimates are based on household interviews of a sample of the civilian noninstitutionalized population. Estimates are age adjusted using the projected 2000 U.S. population as the standard population. Current smokers include daily and nondaily smokers.
DATA SOURCE: CDC/NCHS, National Health Interview Survey, 2005–2007.
Less than 16 years 31.8%
18–20 years 26.3%
16–17 years 24.8%
21 years and over
17.1%
NOTES: Estimates are based on household interviews of a sample of the civilian noninstitutionalized population. Estimates are age adjusted using the projected 2000 U.S. population as the standard population. Current smokers include daily and nondaily smokers.
DATA SOURCE: CDC/NCHS, National Health Interview Survey, 2005–2007.
Page 20 [ Series 10, No. 245
Figure 4.3. Percent distribution of usual number of cigarettes on days smoked among all adult current smokers: United States, 2005–2007
Figure 4.4. Percent distribution of age of smoking initiation among all adult current smokers: United States, 2005–2007
+ Among current daily smokers, the mean number of cigarettes smoked was higher for those aged 45–64 years (18 cigarettes) and 65–74 years (19 cigarettes) than for daily smokers in the other age groups (Table 4.2).
+ About one in three current smokers aged 18–24 years (35.7%) started smoking before the age of 16 years (Table 4.4).
+ Among daily smokers, attempts to quit smoking in the past year were strongly associated with age: one-half (49.9%) of the youngest group had attempted to quit, declining steadily to about 3 in 10 (27.7%) of daily smokers in the oldest age group (Table 4.5 and Figure 4.5).
Race + American Indian or Alaska Native
adults (27.2%) were more likely than white adults (20.9%), black adults (20.7%), and Asian adults (10.9%) to be current smokers (Table 4.1).
+ Asian men (17.3%) were less likely to be current smokers than most other single-race groups studied: American Indian or Alaska Native men (30.3%); black men (25.3%); white men (23.0%). American Indian or Alaska Native women (24.3%) were about five times as likely as Asian women (4.8%) to be current smokers (Table 4.1).
+ White women who smoked daily, smoked more cigarettes (16 cigarettes), on average, than daily female smokers in other single-race groups studied (Table 4.2).
+ White male smokers (daily and nondaily) were nearly four times as likely as black male smokers to usually smoke 35 cigarettes or more on days smoked (Table 4.3).
+ Asian smokers (31.1%) and black smokers (23.8%) were more likely than white smokers (15.9%) or American Indian or Alaska Native smokers (12.7%) to have started smoking on or after their 21st birthday (Table 4.4).
Hispanic or Latino Origin and Race + Non-Hispanic white adults (22.4%)
and non-Hispanic black adults (20.8%) were more likely than Hispanic adults (14.2%) to be
current smokers (Table 4.1).+ Non-Hispanic white women (20.7%)
were more likely than non-Hispanic black women (17.0%) and twice as likely as Hispanic women (9.6%) to be current smokers (Table 4.1).
+ Non-Hispanic white male smokers (daily and nondaily) smoked an

Non-Hispanic black 20
Non-Hispanic whiteHispanic
Num
ber
of c
igar
ette
s on
day
s sm
oked
17.4
15 14.2
9.610 8.5
10.9
7.4
5
0 Men Women
NOTES: Estimates are based on household interviews of a sample of the civilian noninstitutionalized population. Estimates are age adjusted using the projected 2000 U.S. population as the standard population. Current smokers include daily and nondaily smokers.
DATA SOURCE: CDC/NCHS, National Health Interview Survey, 2005–2007.
Series 10, No. 245 [ Page 21
0
10
20
30
40
50
60
18–24 25–44 45–64 Age in years
65–74 75 and over
Per
cent Daily smokers
Nondaily smokers
NOTE: Estimates are based on household interviews of a sample of the civilian noninstitutionalized population.
DATA SOURCE: CDC/NCHS, National Health Interview Survey, 2005–2007.
Figure 4.5. Percentage of adult current smokers who tried to quit in the past year, by age and smoking frequency: United States, 2005–2007
Figure 4.6. Mean number of cigarettes on days smoked by adult current smokers, by Hispanic origin and race and sex: United States, 2005–2007
average of about 17 cigarettes a day on days they smoked, compared with 11 cigarettes for non-Hispanic black male smokers and 9 cigarettes for Hispanic male smokers. Among female smokers (daily and nondaily, combined), non-Hispanic white women smoked more cigarettes (14 cigarettes), on average, than either non-Hispanic black women (10 cigarettes) or Hispanic women (7 cigarettes) (Table 4.2 and Figure 4.6).
+ Non-Hispanic white male smokers were more likely than non-Hispanic black male smokers to have started smoking before age 16 years (Table 4.4).
Education + With the exception of adults having
a GED high school equivalency diploma, for whom current smoking rates were very high (43.4%), prevalence of current cigarette smoking declined steadily with increasing education—from 28.2% among adults with less than a high school diploma to 6.3% among adults with a masters, doctorate, or medical degree (Table 4.1).
+ Adults who had earned a bachelor of arts or science degree (6.6%) or an advanced academic degree (4.1%) were less than one-half as likely as adults with less education (15.8%–39.4%) to be daily smokers (Table 4.2).
+ Adult current smokers with less than a high school diploma (43.2%) were more than twice as likely as adults with a bachelor’s degree or higher to have started smoking before the age of 16 years (Table 4.4 and Figure 4.7).
Poverty Status + Men with family incomes below the
poverty level (31.8%) were almost twice as likely as men in the highest family income group (17.2%) to be current smokers, and women with family incomes below the poverty level (25.8%) were twice as likely as women in the highest family
income group (12.8%) to be current smokers (Table 4.1).
+ Smokers with the lowest family incomes were more likely to have started smoking before 16 years of age than were smokers in the highest family income groups (Table 4.4).
Marital Status + Cohabiting adults (34.6%) and
divorced or separated adults (30.6%) were more likely than never married adults (22.3%) and married adults (16.2%) to be current smokers (Table 4.1).

High schoolLess than General Educational Development Some college high school (GED) high school equivalency graduate
diploma
Associate of arts degree Bachelor’s degree Graduate degree
Per
cent
60 52.9
50 43.2
40
28.3 28.9 27.4
20
30
17.4 17.2
10
0 Both sexes
Page 22 [ Series 10, No. 245
+ Prevalence of daily smoking was about twice as high among cohabiting adults as married adults (Table 4.2).
Geographic Region + Adults living in the West (16.8%)
were less likely to be current smokers than those living in the Northeast (19.0%), South (21.3%), or Midwest (23.4%) (Table 4.1).
+ Among all current smokers, adults living in the West smoked fewer cigarettes on days that they smoked than adults in the other regions of the country (Table 4.2 and Table 4.3).
NOTES: Estimates are based on household interviews of a sample of the civilian noninstitutionalized population. Estimates are age adjusted using the projected 2000 U.S. population as the standard population. Current smokers include daily and nondaily smokers.
DATA SOURCE: CDC/NCHS, National Health Interview Survey, 2005–2007.
Figure 4.7. Percentage of adult current smokers who started smoking younger than 16 years of age, by level of education: United States, 2005–2007

Series 10, No. 245 [ Page 23
Table 4.1. Age-adjusted percent distributions (with standard errors) of lifetime cigarette smoking status for adults 18 years of age and over, by selected characteristics: United States, average annual, 2005–2007
Lifetime cigarette smoking status1
Never Former Current Selected characteristic Total smoker smoker smoker
Both sexes Percent distribution (standard error)
Ages 18 years and over (age-adjusted)2 . . . . . . . . . . . . . 100.0 58.5 (0.26) 21.1 (0.19) 20.4 (0.21) Ages 18 years and over (crude)2 . . . . . . . . . . . . . . . . . 100.0 58.1 (0.27) 21.4 (0.21) 20.5 (0.21)
Age:3
18–24 years . . . . . . . . . . . . . . . . . . . . . . . . . . . . . 100.0 69.8 (0.74) 6.7 (0.34) 23.5 (0.67) 25–44 years . . . . . . . . . . . . . . . . . . . . . . . . . . . . . 100.0 62.5 (0.37) 14.0 (0.26) 23.4 (0.32) 45–64 years . . . . . . . . . . . . . . . . . . . . . . . . . . . . . 100.0 51.7 (0.43) 26.7 (0.36) 21.6 (0.34) 65–74 years . . . . . . . . . . . . . . . . . . . . . . . . . . . . . 100.0 48.4 (0.69) 39.2 (0.67) 12.4 (0.44) 75 years and over . . . . . . . . . . . . . . . . . . . . . . . . . . 100.0 56.2 (0.75) 38.6 (0.74) 5.1 (0.31)
Race: White, single race . . . . . . . . . . . . . . . . . . . . . . . . . . 100.0 56.7 (0.29) 22.4 (0.21) 20.9 (0.24) Black or African American, single race . . . . . . . . . . . . . 100.0 65.0 (0.56) 14.4 (0.39) 20.7 (0.49) American Indian or Alaska Native, single race . . . . . . . . 100.0 52.2 (4.62) 20.6 (3.10) 27.2 (3.07) Asian, single race . . . . . . . . . . . . . . . . . . . . . . . . . . 100.0 77.6 (0.84) 11.5 (0.63) 10.9 (0.63) Native Hawaiian or Other Pacific Islander, single race. . . . 100.0 71.0 (5.86) *12.4 (3.87) 16.5 (4.17) Two or more races . . . . . . . . . . . . . . . . . . . . . . . . . 100.0 50.9 (2.07) 24.5 (1.44) 24.7 (1.78)
Black or African American, white . . . . . . . . . . . . . . . 100.0 65.4 (4.73) 17.6 (3.69) 17.0 (3.02) American Indian or Alaska Native, white . . . . . . . . . . . 100.0 43.1 (3.02) 27.1 (2.03) 29.7 (2.86)
Hispanic or Latino origin and race: Hispanic or Latino . . . . . . . . . . . . . . . . . . . . . . . . . . 100.0 70.2 (0.57) 15.6 (0.46) 14.2 (0.43)
Mexican or Mexican American . . . . . . . . . . . . . . . . . 100.0 70.7 (0.71) 15.2 (0.60) 14.1 (0.52) Not Hispanic or Latino . . . . . . . . . . . . . . . . . . . . . . . 100.0 56.7 (0.29) 21.7 (0.20) 21.6 (0.23)
White, single race . . . . . . . . . . . . . . . . . . . . . . . . 100.0 54.1 (0.33) 23.5 (0.24) 22.4 (0.27) Black or African American, single race . . . . . . . . . . . . 100.0 64.8 (0.57) 14.4 (0.39) 20.8 (0.50)
Education: Less than high school graduate . . . . . . . . . . . . . . . . . 100.0 53.9 (0.62) 18.0 (0.41) 28.2 (0.56) GED diploma4 . . . . . . . . . . . . . . . . . . . . . . . . . . . . 100.0 33.1 (1.28) 23.5 (1.04) 43.4 (1.33) High school graduate . . . . . . . . . . . . . . . . . . . . . . . . 100.0 54.4 (0.47) 20.8 (0.35) 24.9 (0.40) Some college—no degree . . . . . . . . . . . . . . . . . . . . . 100.0 55.8 (0.55) 22.9 (0.42) 21.3 (0.43) Associate of arts degree . . . . . . . . . . . . . . . . . . . . . . 100.0 57.3 (0.72) 22.8 (0.61) 19.9 (0.57) Bachelor of arts, science degree . . . . . . . . . . . . . . . . . 100.0 67.8 (0.50) 21.9 (0.45) 10.3 (0.34) Masters, doctorate, medical degree . . . . . . . . . . . . . . . 100.0 71.8 (0.66) 21.9 (0.61) 6.3 (0.33)
Poverty status:5
Below poverty level . . . . . . . . . . . . . . . . . . . . . . . . . 100.0 56.2 (0.73) 15.5 (0.44) 28.3 (0.66) ≥1 and <2 times poverty level . . . . . . . . . . . . . . . . . . 100.0 55.8 (0.58) 19.0 (0.43) 25.1 (0.50) ≥2 and <4 times poverty level . . . . . . . . . . . . . . . . . . 100.0 56.7 (0.43) 21.5 (0.33) 21.8 (0.37) 4 times poverty level or more . . . . . . . . . . . . . . . . . . . 100.0 61.4 (0.39) 23.5 (0.32) 15.1 (0.29)
Marital status: Never married . . . . . . . . . . . . . . . . . . . . . . . . . . . . 100.0 62.9 (0.62) 14.8 (0.47) 22.3 (0.51) Married . . . . . . . . . . . . . . . . . . . . . . . . . . . . . . . . 100.0 60.2 (0.32) 23.6 (0.26) 16.2 (0.23) Cohabiting . . . . . . . . . . . . . . . . . . . . . . . . . . . . . . 100.0 41.0 (1.10) 24.4 (1.02) 34.6 (0.97) Divorced or separated . . . . . . . . . . . . . . . . . . . . . . . 100.0 48.2 (0.61) 21.2 (0.45) 30.6 (0.56) Widowed . . . . . . . . . . . . . . . . . . . . . . . . . . . . . . . 100.0 50.9 (2.59) 20.8 (1.82) 28.3 (2.55)
Geographic region: Northeast . . . . . . . . . . . . . . . . . . . . . . . . . . . . . . . 100.0 57.8 (0.62) 23.1 (0.45) 19.0 (0.49) Midwest . . . . . . . . . . . . . . . . . . . . . . . . . . . . . . . . 100.0 54.8 (0.56) 21.8 (0.36) 23.4 (0.44) South . . . . . . . . . . . . . . . . . . . . . . . . . . . . . . . . . 100.0 59.1 (0.43) 19.6 (0.33) 21.3 (0.34) West . . . . . . . . . . . . . . . . . . . . . . . . . . . . . . . . . . 100.0 62.3 (0.56) 20.9 (0.37) 16.8 (0.43)
Men
Ages 18 years and over (age-adjusted)2 . . . . . . . . . . . . . 100.0 51.8 (0.37) 25.2 (0.29) 23.0 (0.31) Ages 18 years and over (crude)2 . . . . . . . . . . . . . . . . . 100.0 51.8 (0.38) 24.8 (0.32) 23.4 (0.32)
Age:3
18–24 years . . . . . . . . . . . . . . . . . . . . . . . . . . . . . 100.0 66.6 (1.11) 6.1 (0.46) 27.3 (1.02) 25–44 years . . . . . . . . . . . . . . . . . . . . . . . . . . . . . 100.0 58.8 (0.54) 14.9 (0.39) 26.3 (0.48) 45–64 years . . . . . . . . . . . . . . . . . . . . . . . . . . . . . 100.0 44.5 (0.58) 31.4 (0.55) 24.1 (0.50) 65–74 years . . . . . . . . . . . . . . . . . . . . . . . . . . . . . 100.0 36.3 (0.96) 49.9 (1.02) 13.8 (0.69) 75 years and over . . . . . . . . . . . . . . . . . . . . . . . . . . 100.0 36.3 (1.18) 58.0 (1.19) 5.6 (0.53)
See footnotes at end of table.

Page 24 [ Series 10, No. 245
Table 4.1. Age-adjusted percent distributions (with standard errors) of lifetime cigarette smoking status for adults 18 years of age and over, by selected characteristics: United States, average annual, 2005–2007—Con.
Lifetime cigarette smoking status1
Never Former Current Selected characteristic Total smoker smoker smoker
Men—Con. Percent distribution (standard error) Race:
White, single race . . . . . . . . . . . . . . . . . . . . . . . . . . 100.0 50.6 (0.41) 26.3 (0.32) 23.0 (0.35) Black or African American, single race . . . . . . . . . . . . . 100.0 56.3 (0.88) 18.4 (0.63) 25.3 (0.82) American Indian or Alaska Native, single race . . . . . . . . 100.0 45.1 (5.50) 24.6 (3.64) 30.3 (4.73) Asian, single race . . . . . . . . . . . . . . . . . . . . . . . . . . 100.0 64.5 (1.42) 18.2 (1.11) 17.3 (1.11) Native Hawaiian or Other Pacific Islander, single race. . . . 100.0 63.7 (7.92) *10.3 (4.82) 26.1 (6.69) Two or more races . . . . . . . . . . . . . . . . . . . . . . . . . 100.0 46.4 (2.88) 29.8 (2.25) 23.8 (2.49)
Black or African American, white . . . . . . . . . . . . . . . 100.0 51.3 (8.09) 31.8 (6.73) 16.9 (4.89) American Indian or Alaska Native, white . . . . . . . . . . . 100.0 38.4 (4.10) 32.5 (2.91) 29.1 (3.83)
Hispanic or Latino origin and race: Hispanic or Latino . . . . . . . . . . . . . . . . . . . . . . . . . . 100.0 59.4 (0.89) 21.9 (0.81) 18.6 (0.70)
Mexican or Mexican American . . . . . . . . . . . . . . . . . 100.0 59.3 (1.11) 21.6 (0.98) 19.1 (0.86) Not Hispanic or Latino . . . . . . . . . . . . . . . . . . . . . . . 100.0 50.5 (0.41) 25.5 (0.31) 23.9 (0.34)
White, single race . . . . . . . . . . . . . . . . . . . . . . . . 100.0 48.9 (0.46) 26.9 (0.36) 24.2 (0.40) Black or African American, single race . . . . . . . . . . . . 100.0 55.9 (0.90) 18.5 (0.64) 25.6 (0.85)
Education: Less than high school graduate . . . . . . . . . . . . . . . . . 100.0 44.5 (0.89) 23.9 (0.62) 31.6 (0.81) GED diploma4 . . . . . . . . . . . . . . . . . . . . . . . . . . . . 100.0 25.2 (1.67) 26.5 (1.59) 48.3 (1.92) High school graduate . . . . . . . . . . . . . . . . . . . . . . . . 100.0 46.3 (0.65) 25.9 (0.54) 27.8 (0.60) Some college—no degree . . . . . . . . . . . . . . . . . . . . . 100.0 50.1 (0.80) 26.3 (0.65) 23.7 (0.67) Associate of arts degree . . . . . . . . . . . . . . . . . . . . . . 100.0 50.8 (1.10) 26.1 (0.93) 23.1 (0.93) Bachelor of arts, science degree . . . . . . . . . . . . . . . . . 100.0 62.3 (0.76) 25.9 (0.67) 11.8 (0.57) Masters, doctorate, medical degree . . . . . . . . . . . . . . . 100.0 70.5 (0.97) 22.9 (0.90) 6.6 (0.51)
Poverty status:5
Below poverty level . . . . . . . . . . . . . . . . . . . . . . . . . 100.0 48.3 (1.14) 19.9 (0.80) 31.8 (1.02) ≥1 and <2 times poverty level . . . . . . . . . . . . . . . . . . 100.0 46.9 (0.90) 24.3 (0.68) 28.8 (0.81) ≥2 and <4 times poverty level . . . . . . . . . . . . . . . . . . 100.0 49.4 (0.60) 25.7 (0.50) 24.9 (0.56) 4 times poverty level or more . . . . . . . . . . . . . . . . . . . 100.0 56.5 (0.56) 26.3 (0.46) 17.2 (0.44)
Marital status: Never married . . . . . . . . . . . . . . . . . . . . . . . . . . . . 100.0 57.3 (0.89) 17.2 (0.70) 25.5 (0.75) Married . . . . . . . . . . . . . . . . . . . . . . . . . . . . . . . . 100.0 53.8 (0.45) 27.9 (0.39) 18.3 (0.35) Cohabiting . . . . . . . . . . . . . . . . . . . . . . . . . . . . . . 100.0 37.7 (1.41) 26.3 (1.39) 35.9 (1.31) Divorced or separated . . . . . . . . . . . . . . . . . . . . . . . 100.0 40.7 (0.95) 24.0 (0.71) 35.3 (0.86) Widowed . . . . . . . . . . . . . . . . . . . . . . . . . . . . . . . 100.0 38.3 (6.21) 26.8 (4.02) 34.8 (6.11)
Geographic region: Northeast . . . . . . . . . . . . . . . . . . . . . . . . . . . . . . . 100.0 53.1 (0.92) 26.2 (0.68) 20.7 (0.76) Midwest . . . . . . . . . . . . . . . . . . . . . . . . . . . . . . . . 100.0 48.5 (0.76) 25.8 (0.59) 25.7 (0.66) South . . . . . . . . . . . . . . . . . . . . . . . . . . . . . . . . . 100.0 51.6 (0.59) 24.3 (0.51) 24.2 (0.50) West . . . . . . . . . . . . . . . . . . . . . . . . . . . . . . . . . . 100.0 54.9 (0.78) 25.1 (0.54) 20.0 (0.63)
Women
Ages 18 years and over (age-adjusted)2 . . . . . . . . . . . . . 100.0 64.4 (0.33) 17.6 (0.23) 18.0 (0.24) Ages 18 years and over (crude)2 . . . . . . . . . . . . . . . . . 100.0 64.0 (0.33) 18.2 (0.25) 17.8 (0.24)
Age:3
18–24 years . . . . . . . . . . . . . . . . . . . . . . . . . . . . . 100.0 73.1 (0.89) 7.2 (0.50) 19.7 (0.80) 25–44 years . . . . . . . . . . . . . . . . . . . . . . . . . . . . . 100.0 66.2 (0.48) 13.1 (0.34) 20.7 (0.41) 45–64 years . . . . . . . . . . . . . . . . . . . . . . . . . . . . . 100.0 58.4 (0.56) 22.4 (0.46) 19.2 (0.40) 65–74 years . . . . . . . . . . . . . . . . . . . . . . . . . . . . . 100.0 58.6 (0.92) 30.1 (0.87) 11.3 (0.57) 75 years and over . . . . . . . . . . . . . . . . . . . . . . . . . . 100.0 69.0 (0.85) 26.2 (0.83) 4.8 (0.37)
Race: White, single race . . . . . . . . . . . . . . . . . . . . . . . . . . 100.0 62.0 (0.37) 19.2 (0.27) 18.8 (0.28) Black or African American, single race . . . . . . . . . . . . . 100.0 71.7 (0.66) 11.4 (0.44) 16.9 (0.54) American Indian or Alaska Native, single race . . . . . . . . 100.0 58.1 (3.91) 17.6 (3.20) 24.3 (2.82) Asian, single race . . . . . . . . . . . . . . . . . . . . . . . . . . 100.0 89.5 (0.77) 5.6 (0.58) 4.8 (0.54) Native Hawaiian or Other Pacific Islander, single race. . . . 100.0 78.8 (6.29) *16.3 (6.08) † Two or more races . . . . . . . . . . . . . . . . . . . . . . . . . 100.0 54.1 (2.81) 20.4 (1.94) 25.6 (2.25)
Black or African American, white . . . . . . . . . . . . . . . 100.0 72.5 (4.92) *10.9 (3.56) 16.6 (3.54) American Indian or Alaska Native, white . . . . . . . . . . . 100.0 47.3 (4.11) 22.4 (3.05) 30.3 (3.57)
See footnotes at end of table.

Series 10, No. 245 [ Page 25
Table 4.1. Age-adjusted percent distributions (with standard errors) of lifetime cigarette smoking status for adults 18 years of age and over, by selected characteristics: United States, average annual, 2005–2007—Con.
Lifetime cigarette smoking status1
Never Former Current Selected characteristic Total smoker smoker smoker
Women—Con. Percent distribution (standard error)
Hispanic or Latino origin and race: Hispanic or Latino . . . . . . . . . . . . . . . . . . . . . . . . . . 100.0 80.4 (0.58) 10.0 (0.43) 9.6 (0.42)
Mexican or Mexican American . . . . . . . . . . . . . . . . . 100.0 82.2 (0.72) 9.2 (0.56) 8.6 (0.52) Not Hispanic or Latino . . . . . . . . . . . . . . . . . . . . . . . 100.0 62.1 (0.37) 18.6 (0.26) 19.3 (0.28)
White, single race . . . . . . . . . . . . . . . . . . . . . . . . 100.0 58.7 (0.42) 20.6 (0.31) 20.7 (0.33) Black or African American, single race . . . . . . . . . . . . 100.0 71.7 (0.66) 11.3 (0.45) 17.0 (0.55)
Education: Less than high school graduate . . . . . . . . . . . . . . . . . 100.0 62.6 (0.76) 12.8 (0.49) 24.5 (0.70) GED diploma4 . . . . . . . . . . . . . . . . . . . . . . . . . . . . 100.0 41.2 (1.81) 20.5 (1.34) 38.2 (1.77) High school graduate . . . . . . . . . . . . . . . . . . . . . . . . 100.0 61.2 (0.65) 16.9 (0.44) 21.9 (0.54) Some college—no degree . . . . . . . . . . . . . . . . . . . . . 100.0 60.3 (0.69) 20.4 (0.56) 19.3 (0.53) Associate of arts degree . . . . . . . . . . . . . . . . . . . . . . 100.0 61.9 (0.91) 20.7 (0.79) 17.4 (0.68) Bachelor of arts, science degree . . . . . . . . . . . . . . . . . 100.0 73.3 (0.66) 17.8 (0.57) 8.9 (0.39) Masters, doctorate, medical degree . . . . . . . . . . . . . . . 100.0 73.7 (0.90) 20.2 (0.84) 6.1 (0.43)
Poverty status:5
Below poverty level . . . . . . . . . . . . . . . . . . . . . . . . . 100.0 61.3 (0.80) 12.9 (0.48) 25.8 (0.74) ≥1 and <2 times poverty level . . . . . . . . . . . . . . . . . . 100.0 62.8 (0.66) 15.3 (0.52) 21.9 (0.58) ≥2 and <4 times poverty level . . . . . . . . . . . . . . . . . . 100.0 63.3 (0.58) 17.9 (0.43) 18.8 (0.46) 4 times poverty level or more . . . . . . . . . . . . . . . . . . . 100.0 66.6 (0.51) 20.6 (0.44) 12.8 (0.36)
Marital status: Never married . . . . . . . . . . . . . . . . . . . . . . . . . . . . 100.0 68.4 (0.80) 12.9 (0.65) 18.6 (0.63) Married . . . . . . . . . . . . . . . . . . . . . . . . . . . . . . . . 100.0 67.0 (0.40) 18.8 (0.33) 14.2 (0.29) Cohabiting . . . . . . . . . . . . . . . . . . . . . . . . . . . . . . 100.0 45.2 (1.74) 21.5 (1.52) 33.3 (1.38) Divorced or separated . . . . . . . . . . . . . . . . . . . . . . . 100.0 53.2 (0.76) 19.4 (0.58) 27.3 (0.71) Widowed . . . . . . . . . . . . . . . . . . . . . . . . . . . . . . . 100.0 54.3 (2.82) 19.3 (2.02) 26.4 (2.78)
Geographic region: Northeast . . . . . . . . . . . . . . . . . . . . . . . . . . . . . . . 100.0 61.7 (0.71) 20.8 (0.56) 17.5 (0.55) Midwest . . . . . . . . . . . . . . . . . . . . . . . . . . . . . . . . 100.0 60.2 (0.76) 18.5 (0.52) 21.2 (0.56) South . . . . . . . . . . . . . . . . . . . . . . . . . . . . . . . . . 100.0 65.6 (0.51) 15.8 (0.37) 18.6 (0.40) West . . . . . . . . . . . . . . . . . . . . . . . . . . . . . . . . . . 100.0 69.4 (0.67) 17.1 (0.48) 13.5 (0.44)
* Estimates preceded by an asterisk have a relative standard error of greater than 30% and less than or equal to 50%. These should be interpreted with caution as they do not meet the standard of reliability or precision.
† Estimates with a relative standard error greater than 50% are indicated with a dagger, but are not shown. 1Lifetime cigarette smoking status: Never smoker—never smoked at all or smoked less than 100 cigarettes in lifetime; former smoker—smoked at least 100 cigarettes in lifetime but not currently smoking; current smoker—smoked at least 100 cigarettes in lifetime and currently smoked. 2Persons of other races and unknown race and ethnicity, unknown education, unknown poverty status, and unknown marital status are included in the total. 3Estimates for age groups are not age adjusted. 4GED is General Educational Development high school equivalency diploma. 5Poverty status is based on family income and family size using the U.S. Census Bureau poverty thresholds for 2004, 2005, and 2006.
NOTES: Unless otherwise specified, estimates are age adjusted using the projected 2000 U.S. population as the standard population and using three age groups: 18–44 years, 45–64 years, and 65 years and over. For crude percent distributions, refer to Appendix Table VII. Denominator for each percent distribution excludes persons with unknown smoking status. See Appendix II for definitions of terms. See Appendix III for health behavior questions.
DATA SOURCE: National Health Interview Survey, 2005–2007. Estimates are based on household interviews of a sample of the civilian noninstitutionalized population.

Page 26 [ Series 10, No. 245
Table 4.2. Age-adjusted percent distributions (with standard errors) of current cigarette smoking status for adults 18 years of age and over, and age-adjusted mean number (with standard errors) of cigarettes on days smoked among current smokers 18 years of age and over, by selected characteristics: United States, average annual, 2005–2007
Current cigarette smoking status1 Number of cigarettes on days smoked2
Non- Nondaily Daily All current Nondaily Daily Selected characteristic Total smoker smoker smoker smokers smokers smokers
Both sexes Percent distribution (standard error) Mean (standard error)
Ages 18 years and over (age-adjusted)3 . . . . . . . . . . . . . 100.0 79.6 (0.21) 4.2 (0.09) 16.2 (0.20) 14.3 (0.13) 4.5 (0.11) 16.6 (0.14) Ages 18 years and over (crude)3 . . . . . . . . . . . . . . . . . . 100.0 79.5 (0.21) 4.2 (0.09) 16.3 (0.20) 14.2 (0.12) 4.4 (0.09) 16.6 (0.12)
Age:4
18–24 years . . . . . . . . . . . . . . . . . . . . . . . . . . . . . 100.0 76.5 (0.67) 6.9 (0.37) 16.6 (0.60) 10.4 (0.32) 3.6 (0.19) 13.2 (0.36) 25–44 years . . . . . . . . . . . . . . . . . . . . . . . . . . . . . 100.0 76.6 (0.32) 5.1 (0.15) 18.4 (0.30) 13.6 (0.15) 4.4 (0.13) 16.0 (0.16) 45–64 years . . . . . . . . . . . . . . . . . . . . . . . . . . . . . 100.0 78.4 (0.34) 3.5 (0.13) 18.1 (0.32) 16.2 (0.18) 5.1 (0.19) 18.2 (0.18) 65–74 years . . . . . . . . . . . . . . . . . . . . . . . . . . . . . 100.0 87.6 (0.44) 2.1 (0.19) 10.4 (0.41) 16.4 (0.52) 4.7 (0.47) 18.7 (0.55) 75 years and over . . . . . . . . . . . . . . . . . . . . . . . . . . 100.0 94.9 (0.31) 0.9 (0.13) 4.2 (0.28) 13.6 (0.63) 4.6 (0.92) 15.3 (0.68)
Race: White, single race . . . . . . . . . . . . . . . . . . . . . . . . . . 100.0 79.1 (0.24) 4.2 (0.10) 16.7 (0.23) 15.1 (0.14) 4.6 (0.13) 17.4 (0.15) Black or African American, single race . . . . . . . . . . . . . 100.0 79.3 (0.49) 5.1 (0.26) 15.5 (0.43) 10.3 (0.21) 4.5 (0.24) 12.2 (0.24) American Indian or Alaska Native, single race . . . . . . . . 100.0 72.8 (3.07) 8.6 (1.72) 18.7 (2.44) 10.8 (1.11) 2.8 (0.34) 14.4 (1.15) Asian, single race . . . . . . . . . . . . . . . . . . . . . . . . . . 100.0 89.1 (0.63) 2.9 (0.30) 8.1 (0.54) 9.7 (0.42) 3.9 (0.36) 11.6 (0.51) Native Hawaiian or Other Pacific Islander, single race. . . . 100.0 83.5 (4.17) † 13.3 (3.65) 9.5 (1.65) 2.3 (0.00) 11.9 (1.56) Two or more races . . . . . . . . . . . . . . . . . . . . . . . . . 100.0 75.3 (1.78) 4.2 (0.75) 20.4 (1.64) 11.9 (0.61) 4.9 (0.41) 13.3 (0.65)
Black or African American, white . . . . . . . . . . . . . . . 100.0 83.0 (3.02) *3.0 (1.21) 14.0 (2.87) 9.1 (0.95) 5.5 (1.37) 9.8 (1.07) American Indian or Alaska Native, white . . . . . . . . . . . 100.0 70.3 (2.86) 5.0 (1.28) 24.7 (2.72) 13.5 (0.87) 4.0 (0.58) 15.4 (0.85)
Hispanic or Latino origin and race: Hispanic or Latino . . . . . . . . . . . . . . . . . . . . . . . . . . 100.0 85.8 (0.43) 5.4 (0.25) 8.8 (0.35) 8.1 (0.22) 3.6 (0.21) 10.6 (0.28)
Mexican or Mexican American . . . . . . . . . . . . . . . . . 100.0 85.9 (0.52) 5.9 (0.31) 8.2 (0.44) 7.5 (0.30) 3.7 (0.26) 10.0 (0.39) Not Hispanic or Latino . . . . . . . . . . . . . . . . . . . . . . . 100.0 78.4 (0.23) 4.0 (0.10) 17.5 (0.22) 14.9 (0.14) 4.7 (0.12) 17.1 (0.14)
White, single race . . . . . . . . . . . . . . . . . . . . . . . . 100.0 77.6 (0.27) 3.9 (0.11) 18.5 (0.27) 15.8 (0.15) 4.8 (0.14) 17.9 (0.16) Black or African American, single race . . . . . . . . . . . . 100.0 79.2 (0.50) 5.2 (0.27) 15.7 (0.44) 10.3 (0.22) 4.4 (0.23) 12.2 (0.24)
Education: Less than high school graduate . . . . . . . . . . . . . . . . . 100.0 71.8 (0.56) 4.8 (0.25) 23.3 (0.55) 15.2 (0.32) 4.6 (0.25) 17.2 (0.33) GED diploma5 . . . . . . . . . . . . . . . . . . . . . . . . . . . . 100.0 56.6 (1.33) 4.0 (0.46) 39.4 (1.35) 19.1 (0.76) 5.0 (0.51) 20.3 (0.77) High school graduate . . . . . . . . . . . . . . . . . . . . . . . . 100.0 75.1 (0.40) 4.4 (0.18) 20.4 (0.38) 14.8 (0.19) 4.8 (0.21) 16.8 (0.20) Some college—no degree . . . . . . . . . . . . . . . . . . . . . 100.0 78.7 (0.43) 4.8 (0.22) 16.5 (0.39) 13.8 (0.28) 4.4 (0.20) 16.2 (0.31) Associate of arts degree . . . . . . . . . . . . . . . . . . . . . . 100.0 80.1 (0.57) 4.1 (0.27) 15.8 (0.52) 13.3 (0.31) 4.4 (0.26) 15.4 (0.34) Bachelor of arts, science degree . . . . . . . . . . . . . . . . . 100.0 89.7 (0.34) 3.7 (0.20) 6.6 (0.29) 11.3 (0.34) 3.9 (0.22) 14.8 (0.38) Masters, doctorate, medical degree . . . . . . . . . . . . . . . 100.0 93.7 (0.33) 2.3 (0.20) 4.1 (0.27) 11.2 (0.56) 3.7 (0.29) 15.2 (0.64)
Poverty status:6
Below poverty level . . . . . . . . . . . . . . . . . . . . . . . . . 100.0 71.7 (0.66) 5.3 (0.24) 22.9 (0.63) 13.9 (0.34) 4.3 (0.27) 16.0 (0.37) ≥1 and <2 times poverty level . . . . . . . . . . . . . . . . . . 100.0 74.9 (0.50) 4.6 (0.22) 20.6 (0.48) 15.0 (0.29) 4.4 (0.23) 17.2 (0.32) ≥2 and <4 times poverty level . . . . . . . . . . . . . . . . . . 100.0 78.2 (0.37) 4.2 (0.18) 17.5 (0.36) 14.5 (0.20) 4.8 (0.22) 16.7 (0.21) 4 times poverty level or more . . . . . . . . . . . . . . . . . . . 100.0 84.9 (0.29) 3.7 (0.17) 11.4 (0.26) 13.8 (0.26) 4.5 (0.20) 16.5 (0.28)
Marital status: Never married . . . . . . . . . . . . . . . . . . . . . . . . . . . . 100.0 77.7 (0.51) 5.7 (0.26) 16.6 (0.48) 13.1 (0.34) 4.9 (0.42) 15.7 (0.37) Married . . . . . . . . . . . . . . . . . . . . . . . . . . . . . . . . 100.0 83.8 (0.23) 3.2 (0.11) 13.0 (0.22) 14.7 (0.20) 4.4 (0.16) 17.1 (0.21) Cohabiting . . . . . . . . . . . . . . . . . . . . . . . . . . . . . . 100.0 65.4 (0.97) 6.0 (0.44) 28.6 (0.94) 14.4 (0.45) 4.1 (0.37) 16.5 (0.48) Divorced or separated . . . . . . . . . . . . . . . . . . . . . . . 100.0 69.4 (0.56) 5.3 (0.28) 25.2 (0.56) 15.4 (0.24) 4.9 (0.22) 17.5 (0.25) Widowed . . . . . . . . . . . . . . . . . . . . . . . . . . . . . . . 100.0 71.7 (2.55) 5.1 (1.52) 23.1 (2.38) 14.8 (0.84) 5.4 (1.00) 16.6 (0.81)
Geographic region: Northeast . . . . . . . . . . . . . . . . . . . . . . . . . . . . . . . 100.0 81.0 (0.49) 4.2 (0.25) 14.8 (0.45) 14.0 (0.32) 4.6 (0.26) 16.4 (0.33) Midwest . . . . . . . . . . . . . . . . . . . . . . . . . . . . . . . . 100.0 76.6 (0.44) 4.7 (0.20) 18.7 (0.44) 14.7 (0.21) 5.0 (0.23) 17.0 (0.23) South . . . . . . . . . . . . . . . . . . . . . . . . . . . . . . . . . 100.0 78.7 (0.34) 3.8 (0.13) 17.5 (0.33) 15.2 (0.24) 4.5 (0.18) 17.3 (0.24) West . . . . . . . . . . . . . . . . . . . . . . . . . . . . . . . . . . 100.0 83.2 (0.43) 4.4 (0.20) 12.4 (0.37) 12.0 (0.26) 3.9 (0.18) 14.6 (0.27)
Men
Ages 18 years and over (age-adjusted)3 . . . . . . . . . . . . . 100.0 77.0 (0.31) 5.0 (0.15) 18.1 (0.29) 15.3 (0.19) 4.6 (0.16) 18.0 (0.20) Ages 18 years and over (crude)3 . . . . . . . . . . . . . . . . . . 100.0 76.6 (0.32) 5.0 (0.15) 18.4 (0.29) 15.1 (0.18) 4.5 (0.13) 17.9 (0.18)
Age:4
18–24 years . . . . . . . . . . . . . . . . . . . . . . . . . . . . . 100.0 72.7 (1.02) 8.4 (0.62) 18.9 (0.90) 10.9 (0.49) 3.8 (0.28) 14.1 (0.58) 25–44 years . . . . . . . . . . . . . . . . . . . . . . . . . . . . . 100.0 73.7 (0.48) 6.1 (0.24) 20.2 (0.45) 14.2 (0.21) 4.4 (0.18) 17.1 (0.23) 45–64 years . . . . . . . . . . . . . . . . . . . . . . . . . . . . . 100.0 75.9 (0.50) 3.7 (0.20) 20.4 (0.47) 17.8 (0.27) 5.2 (0.29) 19.8 (0.28) 65–74 years . . . . . . . . . . . . . . . . . . . . . . . . . . . . . 100.0 86.2 (0.69) 2.3 (0.31) 11.5 (0.65) 18.4 (0.82) 4.5 (0.72) 21.1 (0.83) 75 years and over . . . . . . . . . . . . . . . . . . . . . . . . . . 100.0 94.4 (0.53) 1.1 (0.25) 4.5 (0.47) 13.8 (1.09) *5.3 (1.65) 15.7 (1.17)

Series 10, No. 245 [ Page 27
Table 4.2. Age-adjusted percent distributions (with standard errors) of current cigarette smoking status for adults 18 years of age and over, and age-adjusted mean number (with standard errors) of cigarettes on days smoked among current smokers 18 years of age and over, by selected characteristics: United States, average annual, 2005–2007—Con.
Current cigarette smoking status1 Number of cigarettes on days smoked2
Non- Nondaily Daily All current Nondaily Daily Selected characteristic Total smoker smoker smoker smokers smokers smokers
Men—Con. Percent distribution (standard error) Mean (standard error)
Race: White, single race . . . . . . . . . . . . . . . . . . . . . . . . . . 100.0 77.0 (0.35) 4.7 (0.16) 18.3 (0.33) 16.3 (0.21) 4.7 (0.20) 18.9 (0.22) Black or African American, single race . . . . . . . . . . . . . 100.0 74.7 (0.82) 6.8 (0.50) 18.5 (0.73) 10.9 (0.35) 4.3 (0.33) 13.2 (0.38) American Indian or Alaska Native, single race . . . . . . . . 100.0 69.7 (4.73) *6.7 (2.02) 23.7 (4.06) 13.0 (1.50) 3.1 (0.63) 16.6 (1.32) Asian, single race . . . . . . . . . . . . . . . . . . . . . . . . . . 100.0 82.7 (1.11) 4.6 (0.55) 12.7 (1.01) 9.6 (0.46) 3.9 (0.44) 11.4 (0.57) Native Hawaiian or Other Pacific Islander, single race. . . . 100.0 73.9 (6.69) † 19.6 (5.26) 9.8 (2.33) 2.3 (0.00) 14.0 (1.21) Two or more races . . . . . . . . . . . . . . . . . . . . . . . . . 100.0 76.2 (2.49) 4.9 (1.19) 18.9 (2.28) 13.2 (0.99) 4.9 (0.39) 15.3 (1.17)
Black or African American, white . . . . . . . . . . . . . . . 100.0 83.1 (4.89) † *13.3 (4.44) 10.6 (1.83) 3.9 (0.87) 12.3 (2.22) American Indian or Alaska Native, white . . . . . . . . . . . 100.0 70.9 (3.83) *4.8 (1.62) 24.2 (3.64) 15.6 (1.33) 4.5 (0.81) 17.6 (1.30)
Hispanic or Latino origin and race: Hispanic or Latino . . . . . . . . . . . . . . . . . . . . . . . . . . 100.0 81.4 (0.70) 7.4 (0.41) 11.3 (0.57) 8.5 (0.29) 3.9 (0.33) 11.2 (0.36)
Mexican or Mexican American . . . . . . . . . . . . . . . . . 100.0 80.9 (0.86) 8.2 (0.52) 10.8 (0.71) 7.8 (0.37) 4.1 (0.40) 10.3 (0.50) Not Hispanic or Latino . . . . . . . . . . . . . . . . . . . . . . . 100.0 76.1 (0.34) 4.6 (0.16) 19.4 (0.32) 16.2 (0.20) 4.8 (0.18) 18.6 (0.21)
White, single race . . . . . . . . . . . . . . . . . . . . . . . . 100.0 75.8 (0.40) 4.2 (0.18) 19.9 (0.38) 17.4 (0.23) 5.1 (0.23) 19.7 (0.23) Black or African American, single race . . . . . . . . . . . . 100.0 74.4 (0.85) 6.9 (0.51) 18.7 (0.75) 10.9 (0.35) 4.3 (0.32) 13.2 (0.38)
Education: Less than high school graduate . . . . . . . . . . . . . . . . . 100.0 68.4 (0.81) 6.3 (0.40) 25.3 (0.81) 16.0 (0.47) 4.8 (0.36) 18.6 (0.49) GED diploma5 . . . . . . . . . . . . . . . . . . . . . . . . . . . . 100.0 51.7 (1.92) 4.2 (0.71) 44.1 (1.95) 20.1 (1.05) 6.0 (0.78) 21.2 (1.07) High school graduate . . . . . . . . . . . . . . . . . . . . . . . . 100.0 72.2 (0.60) 5.2 (0.29) 22.6 (0.56) 15.9 (0.31) 4.9 (0.33) 18.1 (0.32) Some college—no degree . . . . . . . . . . . . . . . . . . . . . 100.0 76.3 (0.67) 5.7 (0.37) 18.0 (0.58) 14.6 (0.36) 4.6 (0.31) 17.4 (0.38) Associate of arts degree . . . . . . . . . . . . . . . . . . . . . . 100.0 76.9 (0.93) 4.5 (0.41) 18.7 (0.86) 15.3 (0.52) 4.2 (0.30) 17.5 (0.53) Bachelor of arts, science degree . . . . . . . . . . . . . . . . . 100.0 88.2 (0.57) 4.1 (0.31) 7.6 (0.51) 12.3 (0.54) 3.6 (0.23) 16.3 (0.61) Masters, doctorate, medical degree . . . . . . . . . . . . . . . 100.0 93.4 (0.51) 2.3 (0.30) 4.3 (0.41) 11.2 (0.73) 2.9 (0.25) 15.3 (0.81)
Poverty status:6
Below poverty level . . . . . . . . . . . . . . . . . . . . . . . . . 100.0 68.2 (1.02) 6.7 (0.44) 25.1 (0.97) 15.2 (0.60) 4.6 (0.50) 17.8 (0.66) ≥1 and <2 times poverty level . . . . . . . . . . . . . . . . . . 100.0 71.2 (0.81) 5.6 (0.35) 23.2 (0.79) 16.1 (0.46) 4.7 (0.48) 18.5 (0.50) ≥2 and <4 times poverty level . . . . . . . . . . . . . . . . . . 100.0 75.1 (0.56) 5.0 (0.28) 19.9 (0.54) 15.3 (0.28) 5.0 (0.31) 17.8 (0.33) 4 times poverty level or more . . . . . . . . . . . . . . . . . . . 100.0 82.8 (0.44) 4.2 (0.27) 13.0 (0.40) 15.0 (0.34) 4.3 (0.25) 18.0 (0.36)
Marital status: Never married . . . . . . . . . . . . . . . . . . . . . . . . . . . . 100.0 74.5 (0.75) 6.5 (0.40) 18.9 (0.69) 14.1 (0.52) 5.1 (0.61) 17.1 (0.59) Married . . . . . . . . . . . . . . . . . . . . . . . . . . . . . . . . 100.0 81.7 (0.35) 3.8 (0.17) 14.5 (0.32) 15.5 (0.26) 4.3 (0.21) 18.1 (0.27) Cohabiting . . . . . . . . . . . . . . . . . . . . . . . . . . . . . . 100.0 64.1 (1.31) 6.5 (0.59) 29.4 (1.26) 15.8 (0.63) 4.2 (0.37) 18.1 (0.64) Divorced or separated . . . . . . . . . . . . . . . . . . . . . . . 100.0 64.7 (0.86) 6.5 (0.49) 28.8 (0.86) 17.5 (0.39) 5.3 (0.36) 20.1 (0.41) Widowed . . . . . . . . . . . . . . . . . . . . . . . . . . . . . . . 100.0 65.2 (6.11) *2.8 (1.16) 32.0 (6.09) 19.1 (1.87) 6.6 (1.51) 19.7 (1.87)
Geographic region: Northeast . . . . . . . . . . . . . . . . . . . . . . . . . . . . . . . 100.0 79.3 (0.76) 4.9 (0.43) 15.8 (0.62) 14.6 (0.38) 4.5 (0.37) 17.4 (0.40) Midwest . . . . . . . . . . . . . . . . . . . . . . . . . . . . . . . . 100.0 74.3 (0.66) 5.2 (0.31) 20.4 (0.65) 15.9 (0.32) 5.1 (0.31) 18.5 (0.35) South . . . . . . . . . . . . . . . . . . . . . . . . . . . . . . . . . 100.0 75.8 (0.50) 4.6 (0.22) 19.5 (0.48) 16.4 (0.35) 4.8 (0.28) 18.9 (0.36) West . . . . . . . . . . . . . . . . . . . . . . . . . . . . . . . . . . 100.0 80.0 (0.63) 5.2 (0.32) 14.8 (0.53) 12.9 (0.37) 3.8 (0.23) 15.7 (0.39)
Women
Ages 18 years and over (age-adjusted)3 . . . . . . . . . . . . . 100.0 82.0 (0.24) 3.5 (0.11) 14.4 (0.23) 13.1 (0.15) 4.4 (0.13) 15.1 (0.15) Ages 18 years and over (crude)3 . . . . . . . . . . . . . . . . . . 100.0 82.2 (0.24) 3.5 (0.10) 14.4 (0.23) 13.1 (0.13) 4.3 (0.12) 15.1 (0.14)
Age:4
18–24 years . . . . . . . . . . . . . . . . . . . . . . . . . . . . . 100.0 80.3 (0.80) 5.3 (0.45) 14.4 (0.73) 9.7 (0.31) 3.4 (0.21) 12.0 (0.31) 25–44 years . . . . . . . . . . . . . . . . . . . . . . . . . . . . . 100.0 79.3 (0.41) 4.1 (0.18) 16.6 (0.38) 12.8 (0.19) 4.2 (0.18) 14.8 (0.21) 45–64 years . . . . . . . . . . . . . . . . . . . . . . . . . . . . . 100.0 80.8 (0.40) 3.2 (0.18) 16.0 (0.38) 14.5 (0.21) 4.9 (0.23) 16.3 (0.22) 65–74 years . . . . . . . . . . . . . . . . . . . . . . . . . . . . . 100.0 88.7 (0.57) 1.8 (0.23) 9.5 (0.53) 14.4 (0.60) 5.0 (0.58) 16.1 (0.67) 75 years and over . . . . . . . . . . . . . . . . . . . . . . . . . . 100.0 95.2 (0.37) 0.8 (0.14) 4.0 (0.35) 13.5 (0.73) 3.8 (0.55) 15.0 (0.79)
Race: White, single race . . . . . . . . . . . . . . . . . . . . . . . . . . 100.0 81.2 (0.28) 3.6 (0.12) 15.2 (0.27) 13.7 (0.16) 4.4 (0.15) 15.7 (0.17) Black or African American, single race . . . . . . . . . . . . . 100.0 83.1 (0.54) 3.7 (0.26) 13.2 (0.48) 9.6 (0.23) 4.5 (0.30) 11.0 (0.27) American Indian or Alaska Native, single race . . . . . . . . 100.0 75.7 (2.82) 11.0 (2.35) 13.3 (2.04) 8.1 (1.03) 3.0 (0.46) 11.3 (1.30) Asian, single race . . . . . . . . . . . . . . . . . . . . . . . . . . 100.0 95.2 (0.54) 1.2 (0.24) 3.6 (0.49) 10.8 (1.03) 3.4 (0.67) 12.4 (1.10) Native Hawaiian or Other Pacific Islander, single race. . . . 100.0 95.0 (2.70) – † 6.3 (1.52) – 6.3 (1.52) Two or more races . . . . . . . . . . . . . . . . . . . . . . . . . 100.0 74.4 (2.25) 3.7 (0.88) 21.9 (2.10) 10.7 (0.65) 4.3 (0.94) 11.7 (0.66)
Black or African American, white . . . . . . . . . . . . . . . 100.0 83.4 (3.54) *2.5 (1.25) 14.1 (3.41) 8.9 (1.44) *7.0 (2.54) 9.2 (1.49) American Indian or Alaska Native, white . . . . . . . . . . . 100.0 69.7 (3.57) *5.2 (1.96) 25.1 (3.27) 11.4 (1.05) 3.4 (0.74) 13.1 (1.08)
See footnotes at end of table.
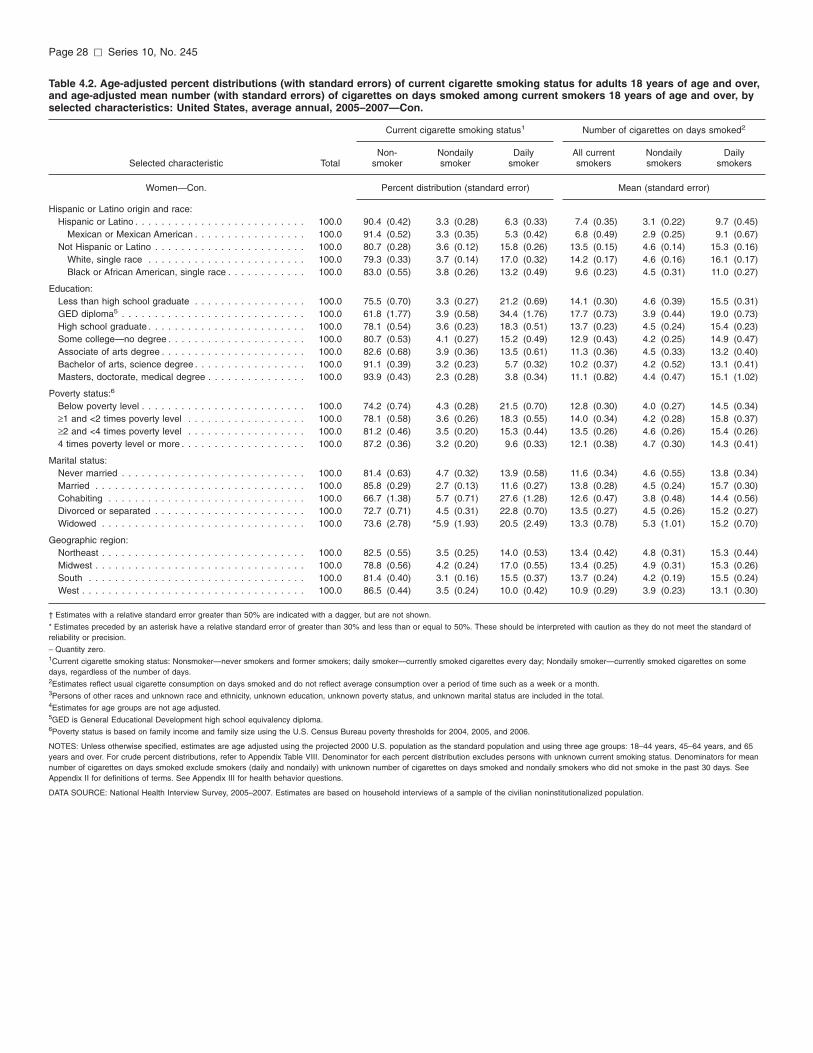
Page 28 [ Series 10, No. 245
Table 4.2. Age-adjusted percent distributions (with standard errors) of current cigarette smoking status for adults 18 years of age and over, and age-adjusted mean number (with standard errors) of cigarettes on days smoked among current smokers 18 years of age and over, by selected characteristics: United States, average annual, 2005–2007—Con.
Current cigarette smoking status1 Number of cigarettes on days smoked2
Non- Nondaily Daily All current Nondaily Daily Selected characteristic Total smoker smoker smoker smokers smokers smokers
Women—Con. Percent distribution (standard error) Mean (standard error)
Hispanic or Latino origin and race: Hispanic or Latino . . . . . . . . . . . . . . . . . . . . . . . . . . 100.0 90.4 (0.42) 3.3 (0.28) 6.3 (0.33) 7.4 (0.35) 3.1 (0.22) 9.7 (0.45)
Mexican or Mexican American . . . . . . . . . . . . . . . . . 100.0 91.4 (0.52) 3.3 (0.35) 5.3 (0.42) 6.8 (0.49) 2.9 (0.25) 9.1 (0.67) Not Hispanic or Latino . . . . . . . . . . . . . . . . . . . . . . . 100.0 80.7 (0.28) 3.6 (0.12) 15.8 (0.26) 13.5 (0.15) 4.6 (0.14) 15.3 (0.16)
White, single race . . . . . . . . . . . . . . . . . . . . . . . . 100.0 79.3 (0.33) 3.7 (0.14) 17.0 (0.32) 14.2 (0.17) 4.6 (0.16) 16.1 (0.17) Black or African American, single race . . . . . . . . . . . . 100.0 83.0 (0.55) 3.8 (0.26) 13.2 (0.49) 9.6 (0.23) 4.5 (0.31) 11.0 (0.27)
Education: Less than high school graduate . . . . . . . . . . . . . . . . . 100.0 75.5 (0.70) 3.3 (0.27) 21.2 (0.69) 14.1 (0.30) 4.6 (0.39) 15.5 (0.31) GED diploma5 . . . . . . . . . . . . . . . . . . . . . . . . . . . . 100.0 61.8 (1.77) 3.9 (0.58) 34.4 (1.76) 17.7 (0.73) 3.9 (0.44) 19.0 (0.73) High school graduate . . . . . . . . . . . . . . . . . . . . . . . . 100.0 78.1 (0.54) 3.6 (0.23) 18.3 (0.51) 13.7 (0.23) 4.5 (0.24) 15.4 (0.23) Some college—no degree . . . . . . . . . . . . . . . . . . . . . 100.0 80.7 (0.53) 4.1 (0.27) 15.2 (0.49) 12.9 (0.43) 4.2 (0.25) 14.9 (0.47) Associate of arts degree . . . . . . . . . . . . . . . . . . . . . . 100.0 82.6 (0.68) 3.9 (0.36) 13.5 (0.61) 11.3 (0.36) 4.5 (0.33) 13.2 (0.40) Bachelor of arts, science degree . . . . . . . . . . . . . . . . . 100.0 91.1 (0.39) 3.2 (0.23) 5.7 (0.32) 10.2 (0.37) 4.2 (0.52) 13.1 (0.41) Masters, doctorate, medical degree . . . . . . . . . . . . . . . 100.0 93.9 (0.43) 2.3 (0.28) 3.8 (0.34) 11.1 (0.82) 4.4 (0.47) 15.1 (1.02)
Poverty status:6
Below poverty level . . . . . . . . . . . . . . . . . . . . . . . . . 100.0 74.2 (0.74) 4.3 (0.28) 21.5 (0.70) 12.8 (0.30) 4.0 (0.27) 14.5 (0.34) ≥1 and <2 times poverty level . . . . . . . . . . . . . . . . . . 100.0 78.1 (0.58) 3.6 (0.26) 18.3 (0.55) 14.0 (0.34) 4.2 (0.28) 15.8 (0.37) ≥2 and <4 times poverty level . . . . . . . . . . . . . . . . . . 100.0 81.2 (0.46) 3.5 (0.20) 15.3 (0.44) 13.5 (0.26) 4.6 (0.26) 15.4 (0.26) 4 times poverty level or more . . . . . . . . . . . . . . . . . . . 100.0 87.2 (0.36) 3.2 (0.20) 9.6 (0.33) 12.1 (0.38) 4.7 (0.30) 14.3 (0.41)
Marital status: Never married . . . . . . . . . . . . . . . . . . . . . . . . . . . . 100.0 81.4 (0.63) 4.7 (0.32) 13.9 (0.58) 11.6 (0.34) 4.6 (0.55) 13.8 (0.34) Married . . . . . . . . . . . . . . . . . . . . . . . . . . . . . . . . 100.0 85.8 (0.29) 2.7 (0.13) 11.6 (0.27) 13.8 (0.28) 4.5 (0.24) 15.7 (0.30) Cohabiting . . . . . . . . . . . . . . . . . . . . . . . . . . . . . . 100.0 66.7 (1.38) 5.7 (0.71) 27.6 (1.28) 12.6 (0.47) 3.8 (0.48) 14.4 (0.56) Divorced or separated . . . . . . . . . . . . . . . . . . . . . . . 100.0 72.7 (0.71) 4.5 (0.31) 22.8 (0.70) 13.5 (0.27) 4.5 (0.26) 15.2 (0.27) Widowed . . . . . . . . . . . . . . . . . . . . . . . . . . . . . . . 100.0 73.6 (2.78) *5.9 (1.93) 20.5 (2.49) 13.3 (0.78) 5.3 (1.01) 15.2 (0.70)
Geographic region: Northeast . . . . . . . . . . . . . . . . . . . . . . . . . . . . . . . 100.0 82.5 (0.55) 3.5 (0.25) 14.0 (0.53) 13.4 (0.42) 4.8 (0.31) 15.3 (0.44) Midwest . . . . . . . . . . . . . . . . . . . . . . . . . . . . . . . . 100.0 78.8 (0.56) 4.2 (0.24) 17.0 (0.55) 13.4 (0.25) 4.9 (0.31) 15.3 (0.26) South . . . . . . . . . . . . . . . . . . . . . . . . . . . . . . . . . 100.0 81.4 (0.40) 3.1 (0.16) 15.5 (0.37) 13.7 (0.24) 4.2 (0.19) 15.5 (0.24) West . . . . . . . . . . . . . . . . . . . . . . . . . . . . . . . . . . 100.0 86.5 (0.44) 3.5 (0.24) 10.0 (0.42) 10.9 (0.29) 3.9 (0.23) 13.1 (0.30)
† Estimates with a relative standard error greater than 50% are indicated with a dagger, but are not shown.
* Estimates preceded by an asterisk have a relative standard error of greater than 30% and less than or equal to 50%. These should be interpreted with caution as they do not meet the standard of reliability or precision.
– Quantity zero. 1Current cigarette smoking status: Nonsmoker—never smokers and former smokers; daily smoker—currently smoked cigarettes every day; Nondaily smoker—currently smoked cigarettes on some days, regardless of the number of days. 2Estimates reflect usual cigarette consumption on days smoked and do not reflect average consumption over a period of time such as a week or a month. 3Persons of other races and unknown race and ethnicity, unknown education, unknown poverty status, and unknown marital status are included in the total. 4Estimates for age groups are not age adjusted. 5GED is General Educational Development high school equivalency diploma. 6Poverty status is based on family income and family size using the U.S. Census Bureau poverty thresholds for 2004, 2005, and 2006.
NOTES: Unless otherwise specified, estimates are age adjusted using the projected 2000 U.S. population as the standard population and using three age groups: 18–44 years, 45–64 years, and 65 years and over. For crude percent distributions, refer to Appendix Table VIII. Denominator for each percent distribution excludes persons with unknown current smoking status. Denominators for mean number of cigarettes on days smoked exclude smokers (daily and nondaily) with unknown number of cigarettes on days smoked and nondaily smokers who did not smoke in the past 30 days. See Appendix II for definitions of terms. See Appendix III for health behavior questions.
DATA SOURCE: National Health Interview Survey, 2005–2007. Estimates are based on household interviews of a sample of the civilian noninstitutionalized population.

Series 10, No. 245 [ Page 29
Table 4.3. Age-adjusted percent distributions (with standard errors) of usual number of cigarettes on days smoked among all current cigarette smokers 18 years of age and over, by selected characteristics: United States, average annual, 2005–2007
Usual number of cigarettes on days smoked among all current smokers1
Less Selected characteristic Total than 15 15–24 25–34 35 or more
Both sexes Percent distribution (standard error)
Ages 18 years and over (age-adjusted)2 . . . . . . . . . . . . . 100.0 52.9 (0.58) 35.3 (0.51) 6.8 (0.28) 5.1 (0.27) Ages 18 years and over (crude)2 . . . . . . . . . . . . . . . . . . 100.0 53.1 (0.56) 35.3 (0.49) 6.7 (0.27) 4.8 (0.24)
Age:3
18–24 years . . . . . . . . . . . . . . . . . . . . . . . . . . . . . 100.0 71.2 (1.46) 23.8 (1.33) 3.5 (0.59) *1.4 (0.69) 25–44 years . . . . . . . . . . . . . . . . . . . . . . . . . . . . . 100.0 54.4 (0.77) 35.8 (0.74) 6.6 (0.43) 3.2 (0.27) 45–64 years . . . . . . . . . . . . . . . . . . . . . . . . . . . . . 100.0 44.8 (0.80) 39.6 (0.75) 8.1 (0.44) 7.5 (0.42) 65–74 years . . . . . . . . . . . . . . . . . . . . . . . . . . . . . 100.0 46.2 (1.97) 36.1 (1.85) 8.5 (1.08) 9.2 (1.25) 75 years and over . . . . . . . . . . . . . . . . . . . . . . . . . . 100.0 56.5 (3.13) 34.6 (2.98) 3.8 (1.06) *5.1 (1.65)
Race: White, single race . . . . . . . . . . . . . . . . . . . . . . . . . . 100.0 49.0 (0.64) 37.6 (0.57) 7.6 (0.32) 5.8 (0.31) Black or African American, single race . . . . . . . . . . . . . 100.0 73.6 (1.13) 22.4 (0.98) 2.3 (0.46) 1.7 (0.33) American Indian or Alaska Native, single race . . . . . . . . 100.0 67.4 (4.83) 22.6 (4.23) *6.7 (3.24) *3.3 (1.37) Asian, single race . . . . . . . . . . . . . . . . . . . . . . . . . . 100.0 74.7 (2.32) 23.2 (2.30) *1.2 (0.59) † Native Hawaiian or Other Pacific Islander, single race. . . . 100.0 68.9 (11.70) *31.1 (11.70) – – Two or more races . . . . . . . . . . . . . . . . . . . . . . . . . 100.0 64.0 (3.84) 31.5 (3.82) *2.8 (1.05) *1.7 (0.74)
Black or African American, white . . . . . . . . . . . . . . . 100.0 76.6 (6.45) 23.4 (6.45) – – American Indian or Alaska Native, white . . . . . . . . . . . 100.0 55.7 (5.43) 37.7 (5.40) *4.0 (1.66) *2.6 (1.26)
Hispanic or Latino origin and race: Hispanic or Latino . . . . . . . . . . . . . . . . . . . . . . . . . . 100.0 81.2 (1.09) 15.6 (1.05) 1.9 (0.38) 1.3 (0.39)
Mexican or Mexican American . . . . . . . . . . . . . . . . . 100.0 83.3 (1.38) 14.0 (1.36) 1.3 (0.37) *1.4 (0.59) Not Hispanic or Latino . . . . . . . . . . . . . . . . . . . . . . . 100.0 50.2 (0.61) 37.2 (0.54) 7.2 (0.29) 5.4 (0.29)
White, single race . . . . . . . . . . . . . . . . . . . . . . . . 100.0 45.5 (0.68) 40.1 (0.61) 8.3 (0.34) 6.2 (0.34) Black or African American, single race . . . . . . . . . . . . 100.0 73.5 (1.15) 22.6 (1.00) 2.3 (0.48) 1.7 (0.33)
Education: Less than high school graduate . . . . . . . . . . . . . . . . . 100.0 51.1 (1.21) 34.4 (1.07) 7.6 (0.66) 6.9 (0.76) GED diploma4 . . . . . . . . . . . . . . . . . . . . . . . . . . . . 100.0 35.4 (2.31) 40.5 (2.47) 13.2 (1.75) 11.0 (1.88) High school graduate . . . . . . . . . . . . . . . . . . . . . . . . 100.0 49.4 (0.95) 38.4 (0.89) 7.3 (0.51) 4.9 (0.45) Some college—no degree . . . . . . . . . . . . . . . . . . . . . 100.0 55.4 (1.21) 34.7 (1.17) 6.0 (0.59) 4.0 (0.52) Associate of arts degree . . . . . . . . . . . . . . . . . . . . . . 100.0 56.0 (1.67) 35.6 (1.65) 4.2 (0.62) 4.1 (0.72) Bachelor of arts, science degree . . . . . . . . . . . . . . . . . 100.0 64.4 (1.68) 28.8 (1.60) 4.6 (0.82) 2.2 (0.59) Masters, doctorate, medical degree . . . . . . . . . . . . . . . 100.0 67.1 (2.72) 24.6 (2.53) 5.1 (1.37) 3.3 (0.96)
Poverty status:5
Below poverty level . . . . . . . . . . . . . . . . . . . . . . . . . 100.0 56.7 (1.37) 31.8 (1.12) 5.9 (0.61) 5.6 (0.84) ≥1 and <2 times poverty level . . . . . . . . . . . . . . . . . . 100.0 50.9 (1.13) 36.0 (1.03) 6.6 (0.57) 6.5 (0.69) ≥2 and <4 times poverty level . . . . . . . . . . . . . . . . . . 100.0 50.5 (1.04) 37.7 (0.96) 7.4 (0.50) 4.4 (0.37) 4 times poverty level or more . . . . . . . . . . . . . . . . . . . 100.0 54.5 (1.19) 34.1 (1.10) 6.7 (0.59) 4.6 (0.51)
Marital status: Never married . . . . . . . . . . . . . . . . . . . . . . . . . . . . 100.0 60.0 (1.53) 30.2 (1.47) 5.0 (0.63) 4.8 (0.83) Married . . . . . . . . . . . . . . . . . . . . . . . . . . . . . . . . 100.0 50.6 (0.89) 36.4 (0.80) 7.5 (0.46) 5.4 (0.44) Cohabiting . . . . . . . . . . . . . . . . . . . . . . . . . . . . . . 100.0 51.8 (2.47) 35.7 (2.36) 8.7 (1.43) 3.8 (0.56) Divorced or separated . . . . . . . . . . . . . . . . . . . . . . . 100.0 48.0 (1.13) 38.4 (1.13) 7.1 (0.61) 6.4 (0.55) Widowed . . . . . . . . . . . . . . . . . . . . . . . . . . . . . . . 100.0 47.3 (4.66) 41.4 (4.72) *6.6 (2.07) *4.7 (1.63)
Geographic region: Northeast . . . . . . . . . . . . . . . . . . . . . . . . . . . . . . . 100.0 53.8 (1.39) 35.4 (1.25) 6.4 (0.61) 4.4 (0.54) Midwest . . . . . . . . . . . . . . . . . . . . . . . . . . . . . . . . 100.0 51.5 (1.10) 35.6 (0.98) 8.1 (0.57) 4.8 (0.40) South . . . . . . . . . . . . . . . . . . . . . . . . . . . . . . . . . 100.0 49.8 (0.96) 36.4 (0.80) 7.1 (0.45) 6.6 (0.55) West . . . . . . . . . . . . . . . . . . . . . . . . . . . . . . . . . . 100.0 60.9 (1.33) 32.1 (1.21) 4.3 (0.55) 2.8 (0.44)
Men
Ages 18 years and over (age-adjusted)2 . . . . . . . . . . . . . 100.0 48.6 (0.80) 36.1 (0.71) 8.3 (0.41) 7.0 (0.45) Ages 18 years and over (crude)2 . . . . . . . . . . . . . . . . . . 100.0 49.2 (0.76) 36.1 (0.67) 8.3 (0.41) 6.4 (0.38)
Age:3
18–24 years . . . . . . . . . . . . . . . . . . . . . . . . . . . . . 100.0 68.6 (2.05) 24.2 (1.78) 4.8 (0.93) † 25–44 years . . . . . . . . . . . . . . . . . . . . . . . . . . . . . 100.0 50.6 (1.08) 37.5 (1.05) 7.9 (0.64) 4.0 (0.40) 45–64 years . . . . . . . . . . . . . . . . . . . . . . . . . . . . . 100.0 40.0 (1.13) 39.6 (1.10) 10.3 (0.69) 10.1 (0.67) 65–74 years . . . . . . . . . . . . . . . . . . . . . . . . . . . . . 100.0 38.6 (2.80) 37.4 (2.61) 10.0 (1.57) 14.0 (2.14) 75 years and over . . . . . . . . . . . . . . . . . . . . . . . . . . 100.0 56.2 (4.86) 33.1 (4.65) *4.7 (1.88) *6.0 (3.00)
See footnotes at end of table.
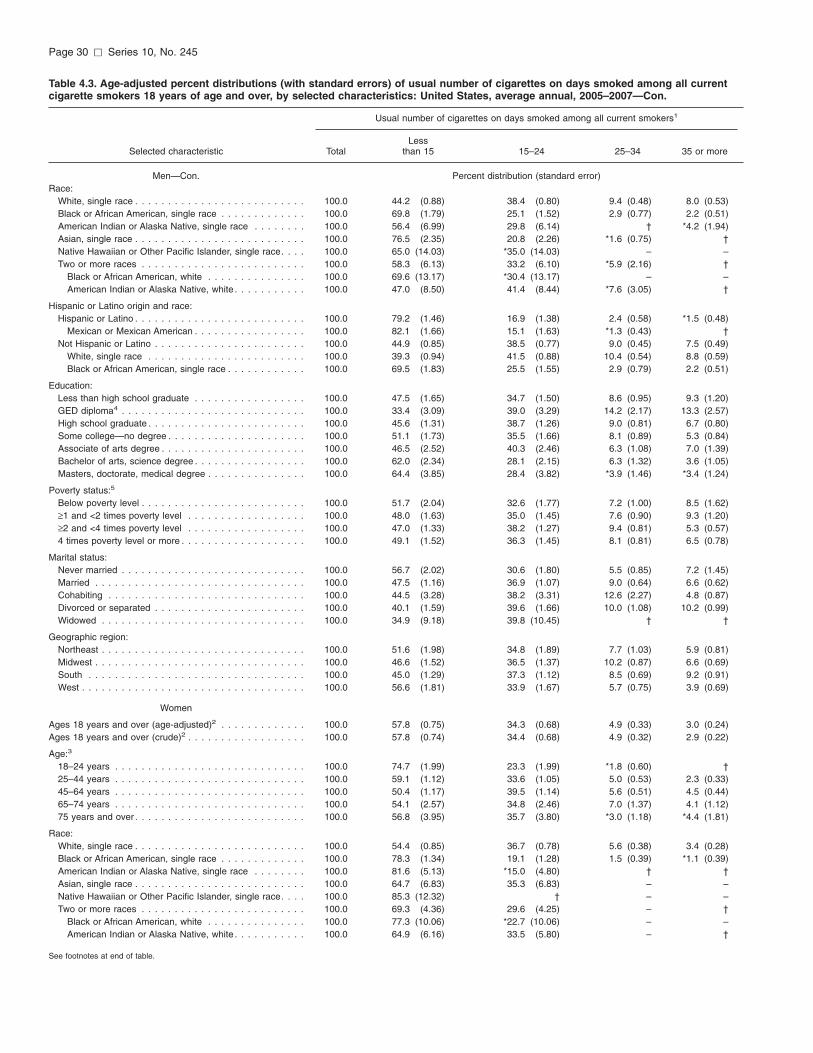
Page 30 [ Series 10, No. 245
Table 4.3. Age-adjusted percent distributions (with standard errors) of usual number of cigarettes on days smoked among all current cigarette smokers 18 years of age and over, by selected characteristics: United States, average annual, 2005–2007—Con.
Usual number of cigarettes on days smoked among all current smokers1
Less Selected characteristic Total than 15 15–24 25–34 35 or more
Men—Con. Percent distribution (standard error) Race:
White, single race . . . . . . . . . . . . . . . . . . . . . . . . . . 100.0 44.2 (0.88) 38.4 (0.80) 9.4 (0.48) 8.0 (0.53) Black or African American, single race . . . . . . . . . . . . . 100.0 69.8 (1.79) 25.1 (1.52) 2.9 (0.77) 2.2 (0.51) American Indian or Alaska Native, single race . . . . . . . . 100.0 56.4 (6.99) 29.8 (6.14) † *4.2 (1.94) Asian, single race . . . . . . . . . . . . . . . . . . . . . . . . . . 100.0 76.5 (2.35) 20.8 (2.26) *1.6 (0.75) † Native Hawaiian or Other Pacific Islander, single race. . . . 100.0 65.0 (14.03) *35.0 (14.03) – – Two or more races . . . . . . . . . . . . . . . . . . . . . . . . . 100.0 58.3 (6.13) 33.2 (6.10) *5.9 (2.16) †
Black or African American, white . . . . . . . . . . . . . . . 100.0 69.6 (13.17) *30.4 (13.17) – – American Indian or Alaska Native, white . . . . . . . . . . . 100.0 47.0 (8.50) 41.4 (8.44) *7.6 (3.05) †
Hispanic or Latino origin and race: Hispanic or Latino . . . . . . . . . . . . . . . . . . . . . . . . . . 100.0 79.2 (1.46) 16.9 (1.38) 2.4 (0.58) *1.5 (0.48)
Mexican or Mexican American . . . . . . . . . . . . . . . . . 100.0 82.1 (1.66) 15.1 (1.63) *1.3 (0.43) † Not Hispanic or Latino . . . . . . . . . . . . . . . . . . . . . . . 100.0 44.9 (0.85) 38.5 (0.77) 9.0 (0.45) 7.5 (0.49)
White, single race . . . . . . . . . . . . . . . . . . . . . . . . 100.0 39.3 (0.94) 41.5 (0.88) 10.4 (0.54) 8.8 (0.59) Black or African American, single race . . . . . . . . . . . . 100.0 69.5 (1.83) 25.5 (1.55) 2.9 (0.79) 2.2 (0.51)
Education: Less than high school graduate . . . . . . . . . . . . . . . . . 100.0 47.5 (1.65) 34.7 (1.50) 8.6 (0.95) 9.3 (1.20) GED diploma4 . . . . . . . . . . . . . . . . . . . . . . . . . . . . 100.0 33.4 (3.09) 39.0 (3.29) 14.2 (2.17) 13.3 (2.57) High school graduate . . . . . . . . . . . . . . . . . . . . . . . . 100.0 45.6 (1.31) 38.7 (1.26) 9.0 (0.81) 6.7 (0.80) Some college—no degree . . . . . . . . . . . . . . . . . . . . . 100.0 51.1 (1.73) 35.5 (1.66) 8.1 (0.89) 5.3 (0.84) Associate of arts degree . . . . . . . . . . . . . . . . . . . . . . 100.0 46.5 (2.52) 40.3 (2.46) 6.3 (1.08) 7.0 (1.39) Bachelor of arts, science degree . . . . . . . . . . . . . . . . . 100.0 62.0 (2.34) 28.1 (2.15) 6.3 (1.32) 3.6 (1.05) Masters, doctorate, medical degree . . . . . . . . . . . . . . . 100.0 64.4 (3.85) 28.4 (3.82) *3.9 (1.46) *3.4 (1.24)
Poverty status:5
Below poverty level . . . . . . . . . . . . . . . . . . . . . . . . . 100.0 51.7 (2.04) 32.6 (1.77) 7.2 (1.00) 8.5 (1.62) ≥1 and <2 times poverty level . . . . . . . . . . . . . . . . . . 100.0 48.0 (1.63) 35.0 (1.45) 7.6 (0.90) 9.3 (1.20) ≥2 and <4 times poverty level . . . . . . . . . . . . . . . . . . 100.0 47.0 (1.33) 38.2 (1.27) 9.4 (0.81) 5.3 (0.57) 4 times poverty level or more . . . . . . . . . . . . . . . . . . . 100.0 49.1 (1.52) 36.3 (1.45) 8.1 (0.81) 6.5 (0.78)
Marital status: Never married . . . . . . . . . . . . . . . . . . . . . . . . . . . . 100.0 56.7 (2.02) 30.6 (1.80) 5.5 (0.85) 7.2 (1.45) Married . . . . . . . . . . . . . . . . . . . . . . . . . . . . . . . . 100.0 47.5 (1.16) 36.9 (1.07) 9.0 (0.64) 6.6 (0.62) Cohabiting . . . . . . . . . . . . . . . . . . . . . . . . . . . . . . 100.0 44.5 (3.28) 38.2 (3.31) 12.6 (2.27) 4.8 (0.87) Divorced or separated . . . . . . . . . . . . . . . . . . . . . . . 100.0 40.1 (1.59) 39.6 (1.66) 10.0 (1.08) 10.2 (0.99) Widowed . . . . . . . . . . . . . . . . . . . . . . . . . . . . . . . 100.0 34.9 (9.18) 39.8 (10.45) † †
Geographic region: Northeast . . . . . . . . . . . . . . . . . . . . . . . . . . . . . . . 100.0 51.6 (1.98) 34.8 (1.89) 7.7 (1.03) 5.9 (0.81) Midwest . . . . . . . . . . . . . . . . . . . . . . . . . . . . . . . . 100.0 46.6 (1.52) 36.5 (1.37) 10.2 (0.87) 6.6 (0.69) South . . . . . . . . . . . . . . . . . . . . . . . . . . . . . . . . . 100.0 45.0 (1.29) 37.3 (1.12) 8.5 (0.69) 9.2 (0.91) West . . . . . . . . . . . . . . . . . . . . . . . . . . . . . . . . . . 100.0 56.6 (1.81) 33.9 (1.67) 5.7 (0.75) 3.9 (0.69)
Women
Ages 18 years and over (age-adjusted)2 . . . . . . . . . . . . . 100.0 57.8 (0.75) 34.3 (0.68) 4.9 (0.33) 3.0 (0.24) Ages 18 years and over (crude)2 . . . . . . . . . . . . . . . . . . 100.0 57.8 (0.74) 34.4 (0.68) 4.9 (0.32) 2.9 (0.22)
Age:3
18–24 years . . . . . . . . . . . . . . . . . . . . . . . . . . . . . 100.0 74.7 (1.99) 23.3 (1.99) *1.8 (0.60) † 25–44 years . . . . . . . . . . . . . . . . . . . . . . . . . . . . . 100.0 59.1 (1.12) 33.6 (1.05) 5.0 (0.53) 2.3 (0.33) 45–64 years . . . . . . . . . . . . . . . . . . . . . . . . . . . . . 100.0 50.4 (1.17) 39.5 (1.14) 5.6 (0.51) 4.5 (0.44) 65–74 years . . . . . . . . . . . . . . . . . . . . . . . . . . . . . 100.0 54.1 (2.57) 34.8 (2.46) 7.0 (1.37) 4.1 (1.12) 75 years and over . . . . . . . . . . . . . . . . . . . . . . . . . . 100.0 56.8 (3.95) 35.7 (3.80) *3.0 (1.18) *4.4 (1.81)
Race: White, single race . . . . . . . . . . . . . . . . . . . . . . . . . . 100.0 54.4 (0.85) 36.7 (0.78) 5.6 (0.38) 3.4 (0.28) Black or African American, single race . . . . . . . . . . . . . 100.0 78.3 (1.34) 19.1 (1.28) 1.5 (0.39) *1.1 (0.39) American Indian or Alaska Native, single race . . . . . . . . 100.0 81.6 (5.13) *15.0 (4.80) † † Asian, single race . . . . . . . . . . . . . . . . . . . . . . . . . . 100.0 64.7 (6.83) 35.3 (6.83) – – Native Hawaiian or Other Pacific Islander, single race. . . . 100.0 85.3 (12.32) † – – Two or more races . . . . . . . . . . . . . . . . . . . . . . . . . 100.0 69.3 (4.36) 29.6 (4.25) – †
Black or African American, white . . . . . . . . . . . . . . . 100.0 77.3 (10.06) *22.7 (10.06) – – American Indian or Alaska Native, white . . . . . . . . . . . 100.0 64.9 (6.16) 33.5 (5.80) – †
See footnotes at end of table.

Series 10, No. 245 [ Page 31
Table 4.3. Age-adjusted percent distributions (with standard errors) of usual number of cigarettes on days smoked among all current cigarette smokers 18 years of age and over, by selected characteristics: United States, average annual, 2005–2007—Con.
Usual number of cigarettes on days smoked among all current smokers1
Less Selected characteristic Total than 15 15–24 25–34 35 or more
Women—Con. Percent distribution (standard error)
Hispanic or Latino origin and race: Hispanic or Latino . . . . . . . . . . . . . . . . . . . . . . . . . . 100.0 84.7 (1.76) 13.2 (1.68) *1.0 (0.35) †
Mexican or Mexican American . . . . . . . . . . . . . . . . . 100.0 86.9 (2.32) 10.8 (2.16) † † Not Hispanic or Latino . . . . . . . . . . . . . . . . . . . . . . . 100.0 56.0 (0.78) 35.7 (0.72) 5.2 (0.35) 3.1 (0.26)
White, single race . . . . . . . . . . . . . . . . . . . . . . . . 100.0 52.1 (0.89) 38.4 (0.83) 5.9 (0.41) 3.5 (0.29) Black or African American, single race . . . . . . . . . . . . 100.0 78.5 (1.34) 18.9 (1.27) 1.5 (0.40) *1.1 (0.40)
Education: Less than high school graduate . . . . . . . . . . . . . . . . . 100.0 55.7 (1.55) 34.1 (1.43) 6.2 (0.81) 4.0 (0.58) GED diploma4 . . . . . . . . . . . . . . . . . . . . . . . . . . . . 100.0 38.5 (3.42) 40.2 (3.31) 13.7 (3.25) 7.6 (2.15) High school graduate . . . . . . . . . . . . . . . . . . . . . . . . 100.0 53.7 (1.31) 37.8 (1.26) 5.3 (0.63) 3.2 (0.47) Some college—no degree . . . . . . . . . . . . . . . . . . . . . 100.0 59.9 (1.62) 33.8 (1.56) 3.7 (0.63) 2.5 (0.59) Associate of arts degree . . . . . . . . . . . . . . . . . . . . . . 100.0 65.9 (2.31) 30.7 (2.28) 2.1 (0.59) *1.3 (0.48) Bachelor of arts, science degree . . . . . . . . . . . . . . . . . 100.0 67.4 (2.43) 29.5 (2.33) *2.5 (0.84) *0.6 (0.27) Masters, doctorate, medical degree . . . . . . . . . . . . . . . 100.0 70.7 (3.55) 19.8 (2.86) *6.3 (2.26) *3.2 (1.51)
Poverty status:5
Below poverty level . . . . . . . . . . . . . . . . . . . . . . . . . 100.0 61.1 (1.62) 31.0 (1.44) 4.7 (0.70) 3.1 (0.59) ≥1 and <2 times poverty level . . . . . . . . . . . . . . . . . . 100.0 53.8 (1.58) 36.9 (1.50) 5.6 (0.76) 3.7 (0.59) ≥2 and <4 times poverty level . . . . . . . . . . . . . . . . . . 100.0 55.0 (1.49) 37.0 (1.45) 4.9 (0.62) 3.2 (0.50) 4 times poverty level or more . . . . . . . . . . . . . . . . . . . 100.0 62.1 (1.72) 31.1 (1.59) 4.7 (0.76) 2.1 (0.60)
Marital status: Never married . . . . . . . . . . . . . . . . . . . . . . . . . . . . 100.0 65.4 (2.21) 28.9 (2.23) 4.0 (0.90) *1.7 (0.52) Married . . . . . . . . . . . . . . . . . . . . . . . . . . . . . . . . 100.0 54.7 (1.33) 35.7 (1.23) 5.8 (0.64) 3.8 (0.52) Cohabiting . . . . . . . . . . . . . . . . . . . . . . . . . . . . . . 100.0 61.4 (3.00) 31.9 (2.89) 3.9 (0.79) 2.8 (0.62) Divorced or separated . . . . . . . . . . . . . . . . . . . . . . . 100.0 55.0 (1.50) 37.5 (1.45) 4.5 (0.68) 3.0 (0.51) Widowed . . . . . . . . . . . . . . . . . . . . . . . . . . . . . . . 100.0 51.8 (5.31) 42.1 (5.38) 3.8 (0.96) 2.2 (0.48)
Geographic region: Northeast . . . . . . . . . . . . . . . . . . . . . . . . . . . . . . . 100.0 56.1 (1.73) 36.0 (1.59) 5.0 (0.75) 2.9 (0.62) Midwest . . . . . . . . . . . . . . . . . . . . . . . . . . . . . . . . 100.0 57.0 (1.42) 34.5 (1.29) 5.6 (0.69) 2.9 (0.45) South . . . . . . . . . . . . . . . . . . . . . . . . . . . . . . . . . 100.0 55.5 (1.25) 35.4 (1.11) 5.4 (0.54) 3.8 (0.43) West . . . . . . . . . . . . . . . . . . . . . . . . . . . . . . . . . . 100.0 66.7 (1.73) 29.6 (1.66) 2.4 (0.60) 1.3 (0.38)
* Estimates preceded by an asterisk have a relative standard error of greater than 30% and less than or equal to 50%. These should be interpreted with caution as they do not meet the standard of reliability or precision.
† Estimates with a relative standard error greater than 50% are indicated with a dagger, but are not shown.
– Quantity zero. 1Usual number of cigarettes on days smoked includes the usual cigarette consumption of daily and nondaily smokers combined. Estimates for nondaily smokers reflect number of cigarettes smoked only on the days that they smoked and are limited to those who smoked at least once in the past 30 days. 2Persons of other races and unknown race and ethnicity, unknown education, unknown poverty status, and unknown marital status are included in the total. 3Estimates for age groups are not age adjusted. 4GED is General Educational Development high school equivalency diploma. 5Poverty status is based on family income and family size using the U.S. Census Bureau poverty thresholds for 2004, 2005, and 2006.
NOTES: Unless otherwise specified, estimates are age adjusted using the projected 2000 U.S. population as the standard population and using three age groups: 18–44 years, 45–64 years, and 65 years and over. For crude percent distributions, refer to Appendix Table IX. Denominator for each percent distribution excludes smokers with unknown number of cigarettes on days smoked. See Appendix II for definitions of terms. See Appendix III for health behavior questions.
DATA SOURCE: National Health Interview Survey, 2005–2007. Estimates are based on household interviews of a sample of the civilian noninstitutionalized population.
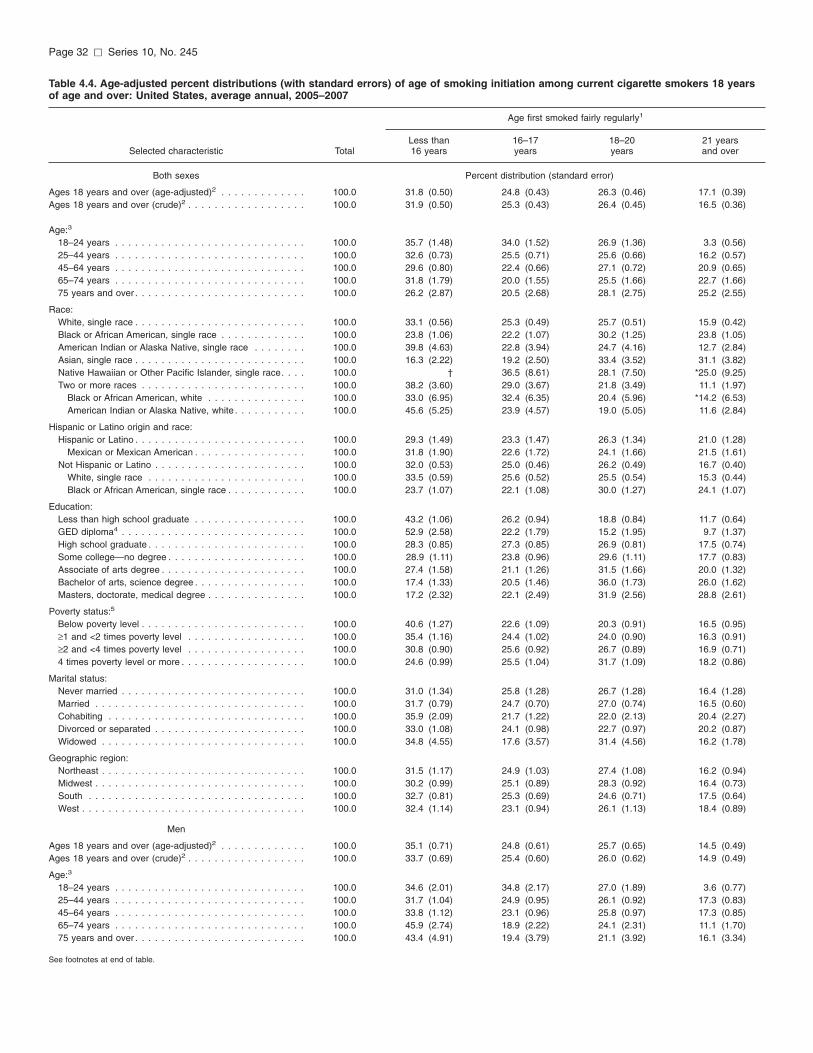
Page 32 [ Series 10, No. 245
Table 4.4. Age-adjusted percent distributions (with standard errors) of age of smoking initiation among current cigarette smokers 18 years of age and over: United States, average annual, 2005–2007
Age first smoked fairly regularly1
Less than 16–17 18–20 21 years Selected characteristic Total 16 years years years and over
Both sexes Percent distribution (standard error)
Ages 18 years and over (age-adjusted)2 . . . . . . . . . . . . . 100.0 31.8 (0.50) 24.8 (0.43) 26.3 (0.46) 17.1 (0.39) Ages 18 years and over (crude)2 . . . . . . . . . . . . . . . . . . 100.0 31.9 (0.50) 25.3 (0.43) 26.4 (0.45) 16.5 (0.36)
Age:3
18–24 years . . . . . . . . . . . . . . . . . . . . . . . . . . . . . 100.0 35.7 (1.48) 34.0 (1.52) 26.9 (1.36) 3.3 (0.56) 25–44 years . . . . . . . . . . . . . . . . . . . . . . . . . . . . . 100.0 32.6 (0.73) 25.5 (0.71) 25.6 (0.66) 16.2 (0.57) 45–64 years . . . . . . . . . . . . . . . . . . . . . . . . . . . . . 100.0 29.6 (0.80) 22.4 (0.66) 27.1 (0.72) 20.9 (0.65) 65–74 years . . . . . . . . . . . . . . . . . . . . . . . . . . . . . 100.0 31.8 (1.79) 20.0 (1.55) 25.5 (1.66) 22.7 (1.66) 75 years and over . . . . . . . . . . . . . . . . . . . . . . . . . . 100.0 26.2 (2.87) 20.5 (2.68) 28.1 (2.75) 25.2 (2.55)
Race: White, single race . . . . . . . . . . . . . . . . . . . . . . . . . . 100.0 33.1 (0.56) 25.3 (0.49) 25.7 (0.51) 15.9 (0.42) Black or African American, single race . . . . . . . . . . . . . 100.0 23.8 (1.06) 22.2 (1.07) 30.2 (1.25) 23.8 (1.05) American Indian or Alaska Native, single race . . . . . . . . 100.0 39.8 (4.63) 22.8 (3.94) 24.7 (4.16) 12.7 (2.84) Asian, single race . . . . . . . . . . . . . . . . . . . . . . . . . . 100.0 16.3 (2.22) 19.2 (2.50) 33.4 (3.52) 31.1 (3.82) Native Hawaiian or Other Pacific Islander, single race. . . . 100.0 † 36.5 (8.61) 28.1 (7.50) *25.0 (9.25) Two or more races . . . . . . . . . . . . . . . . . . . . . . . . . 100.0 38.2 (3.60) 29.0 (3.67) 21.8 (3.49) 11.1 (1.97)
Black or African American, white . . . . . . . . . . . . . . . 100.0 33.0 (6.95) 32.4 (6.35) 20.4 (5.96) *14.2 (6.53) American Indian or Alaska Native, white . . . . . . . . . . . 100.0 45.6 (5.25) 23.9 (4.57) 19.0 (5.05) 11.6 (2.84)
Hispanic or Latino origin and race: Hispanic or Latino . . . . . . . . . . . . . . . . . . . . . . . . . . 100.0 29.3 (1.49) 23.3 (1.47) 26.3 (1.34) 21.0 (1.28)
Mexican or Mexican American . . . . . . . . . . . . . . . . . 100.0 31.8 (1.90) 22.6 (1.72) 24.1 (1.66) 21.5 (1.61) Not Hispanic or Latino . . . . . . . . . . . . . . . . . . . . . . . 100.0 32.0 (0.53) 25.0 (0.46) 26.2 (0.49) 16.7 (0.40)
White, single race . . . . . . . . . . . . . . . . . . . . . . . . 100.0 33.5 (0.59) 25.6 (0.52) 25.5 (0.54) 15.3 (0.44) Black or African American, single race . . . . . . . . . . . . 100.0 23.7 (1.07) 22.1 (1.08) 30.0 (1.27) 24.1 (1.07)
Education: Less than high school graduate . . . . . . . . . . . . . . . . . 100.0 43.2 (1.06) 26.2 (0.94) 18.8 (0.84) 11.7 (0.64) GED diploma4 . . . . . . . . . . . . . . . . . . . . . . . . . . . . 100.0 52.9 (2.58) 22.2 (1.79) 15.2 (1.95) 9.7 (1.37) High school graduate . . . . . . . . . . . . . . . . . . . . . . . . 100.0 28.3 (0.85) 27.3 (0.85) 26.9 (0.81) 17.5 (0.74) Some college—no degree . . . . . . . . . . . . . . . . . . . . . 100.0 28.9 (1.11) 23.8 (0.96) 29.6 (1.11) 17.7 (0.83) Associate of arts degree . . . . . . . . . . . . . . . . . . . . . . 100.0 27.4 (1.58) 21.1 (1.26) 31.5 (1.66) 20.0 (1.32) Bachelor of arts, science degree . . . . . . . . . . . . . . . . . 100.0 17.4 (1.33) 20.5 (1.46) 36.0 (1.73) 26.0 (1.62) Masters, doctorate, medical degree . . . . . . . . . . . . . . . 100.0 17.2 (2.32) 22.1 (2.49) 31.9 (2.56) 28.8 (2.61)
Poverty status:5
Below poverty level . . . . . . . . . . . . . . . . . . . . . . . . . 100.0 40.6 (1.27) 22.6 (1.09) 20.3 (0.91) 16.5 (0.95) ≥1 and <2 times poverty level . . . . . . . . . . . . . . . . . . 100.0 35.4 (1.16) 24.4 (1.02) 24.0 (0.90) 16.3 (0.91) ≥2 and <4 times poverty level . . . . . . . . . . . . . . . . . . 100.0 30.8 (0.90) 25.6 (0.92) 26.7 (0.89) 16.9 (0.71) 4 times poverty level or more . . . . . . . . . . . . . . . . . . . 100.0 24.6 (0.99) 25.5 (1.04) 31.7 (1.09) 18.2 (0.86)
Marital status: Never married . . . . . . . . . . . . . . . . . . . . . . . . . . . . 100.0 31.0 (1.34) 25.8 (1.28) 26.7 (1.28) 16.4 (1.28) Married . . . . . . . . . . . . . . . . . . . . . . . . . . . . . . . . 100.0 31.7 (0.79) 24.7 (0.70) 27.0 (0.74) 16.5 (0.60) Cohabiting . . . . . . . . . . . . . . . . . . . . . . . . . . . . . . 100.0 35.9 (2.09) 21.7 (1.22) 22.0 (2.13) 20.4 (2.27) Divorced or separated . . . . . . . . . . . . . . . . . . . . . . . 100.0 33.0 (1.08) 24.1 (0.98) 22.7 (0.97) 20.2 (0.87) Widowed . . . . . . . . . . . . . . . . . . . . . . . . . . . . . . . 100.0 34.8 (4.55) 17.6 (3.57) 31.4 (4.56) 16.2 (1.78)
Geographic region: Northeast . . . . . . . . . . . . . . . . . . . . . . . . . . . . . . . 100.0 31.5 (1.17) 24.9 (1.03) 27.4 (1.08) 16.2 (0.94) Midwest . . . . . . . . . . . . . . . . . . . . . . . . . . . . . . . . 100.0 30.2 (0.99) 25.1 (0.89) 28.3 (0.92) 16.4 (0.73) South . . . . . . . . . . . . . . . . . . . . . . . . . . . . . . . . . 100.0 32.7 (0.81) 25.3 (0.69) 24.6 (0.71) 17.5 (0.64) West . . . . . . . . . . . . . . . . . . . . . . . . . . . . . . . . . . 100.0 32.4 (1.14) 23.1 (0.94) 26.1 (1.13) 18.4 (0.89)
Men
Ages 18 years and over (age-adjusted)2 . . . . . . . . . . . . . 100.0 35.1 (0.71) 24.8 (0.61) 25.7 (0.65) 14.5 (0.49) Ages 18 years and over (crude)2 . . . . . . . . . . . . . . . . . . 100.0 33.7 (0.69) 25.4 (0.60) 26.0 (0.62) 14.9 (0.49)
Age:3
18–24 years . . . . . . . . . . . . . . . . . . . . . . . . . . . . . 100.0 34.6 (2.01) 34.8 (2.17) 27.0 (1.89) 3.6 (0.77) 25–44 years . . . . . . . . . . . . . . . . . . . . . . . . . . . . . 100.0 31.7 (1.04) 24.9 (0.95) 26.1 (0.92) 17.3 (0.83) 45–64 years . . . . . . . . . . . . . . . . . . . . . . . . . . . . . 100.0 33.8 (1.12) 23.1 (0.96) 25.8 (0.97) 17.3 (0.85) 65–74 years . . . . . . . . . . . . . . . . . . . . . . . . . . . . . 100.0 45.9 (2.74) 18.9 (2.22) 24.1 (2.31) 11.1 (1.70) 75 years and over . . . . . . . . . . . . . . . . . . . . . . . . . . 100.0 43.4 (4.91) 19.4 (3.79) 21.1 (3.92) 16.1 (3.34)
See footnotes at end of table.

Series 10, No. 245 [ Page 33
Table 4.4. Age-adjusted percent distributions (with standard errors) of age of smoking initiation among current cigarette smokers 18 years of age and over: United States, average annual, 2005–2007—Con.
Age first smoked fairly regularly1
Less than 16–17 18–20 21 years Selected characteristic Total 16 years years years and over
Men—Con. Percent distribution (standard error)
Race: White, single race . . . . . . . . . . . . . . . . . . . . . . . . . . 100.0 36.9 (0.79) 25.2 (0.69) 24.7 (0.70) 13.2 (0.52) Black or African American, single race . . . . . . . . . . . . . 100.0 26.3 (1.66) 23.2 (1.56) 30.0 (1.84) 20.5 (1.43) American Indian or Alaska Native, single race . . . . . . . . 100.0 45.3 (5.71) 20.3 (5.02) 28.8 (5.45) † Asian, single race . . . . . . . . . . . . . . . . . . . . . . . . . . 100.0 14.8 (2.52) 21.1 (2.77) 31.8 (3.96) 32.2 (4.12) Native Hawaiian or Other Pacific Islander, single race. . . . 100.0 † 40.8 (8.33) 22.9 (5.84) *24.2 (11.89) Two or more races . . . . . . . . . . . . . . . . . . . . . . . . . 100.0 38.2 (6.13) 23.1 (5.93) 26.7 (6.49) 12.0 (3.17)
Black or African American, white . . . . . . . . . . . . . . . 100.0 *25.3 (10.93) † *30.9 (14.11) † American Indian or Alaska Native, white . . . . . . . . . . . 100.0 45.2 (8.33) *14.8 (4.59) 28.3 (8.41) *11.7 (4.27)
Hispanic or Latino origin and race: Hispanic or Latino . . . . . . . . . . . . . . . . . . . . . . . . . . 100.0 32.8 (2.05) 23.9 (1.99) 26.1 (1.71) 17.2 (1.36)
Mexican or Mexican American . . . . . . . . . . . . . . . . . 100.0 37.2 (2.38) 23.1 (2.07) 22.9 (1.85) 16.8 (1.70) Not Hispanic or Latino . . . . . . . . . . . . . . . . . . . . . . . 100.0 35.3 (0.76) 25.0 (0.66) 25.6 (0.69) 14.1 (0.52)
White, single race . . . . . . . . . . . . . . . . . . . . . . . . 100.0 37.5 (0.86) 25.5 (0.75) 24.4 (0.76) 12.6 (0.55) Black or African American, single race . . . . . . . . . . . . 100.0 26.1 (1.67) 23.4 (1.58) 29.8 (1.87) 20.6 (1.46)
Education: Less than high school graduate . . . . . . . . . . . . . . . . . 100.0 47.0 (1.52) 26.5 (1.30) 17.2 (1.11) 9.3 (0.79) GED diploma4 . . . . . . . . . . . . . . . . . . . . . . . . . . . . 100.0 56.0 (3.23) 23.8 (2.56) 13.4 (2.37) 6.8 (1.17) High school graduate . . . . . . . . . . . . . . . . . . . . . . . . 100.0 29.8 (1.20) 27.5 (1.22) 27.9 (1.15) 14.8 (0.92) Some college—no degree . . . . . . . . . . . . . . . . . . . . . 100.0 31.9 (1.73) 22.4 (1.36) 30.6 (1.66) 15.1 (1.11) Associate of arts degree . . . . . . . . . . . . . . . . . . . . . . 100.0 32.8 (2.27) 20.8 (1.72) 27.9 (2.10) 18.5 (1.64) Bachelor of arts, science degree . . . . . . . . . . . . . . . . . 100.0 19.4 (1.96) 22.1 (2.23) 35.3 (2.29) 23.3 (2.13) Masters, doctorate, medical degree . . . . . . . . . . . . . . . 100.0 21.9 (3.58) 20.1 (3.65) 26.0 (3.44) 32.0 (3.93)
Poverty status:5
Below poverty level . . . . . . . . . . . . . . . . . . . . . . . . . 100.0 44.6 (1.99) 23.6 (1.91) 18.4 (1.30) 13.4 (1.28) ≥1 and <2 times poverty level . . . . . . . . . . . . . . . . . . 100.0 39.3 (1.84) 23.3 (1.65) 24.3 (1.27) 13.1 (1.08) ≥2 and <4 times poverty level . . . . . . . . . . . . . . . . . . 100.0 34.2 (1.28) 25.7 (1.24) 25.8 (1.22) 14.3 (0.83) 4 times poverty level or more . . . . . . . . . . . . . . . . . . . 100.0 28.2 (1.47) 25.0 (1.29) 30.2 (1.41) 16.5 (1.06)
Marital status: Never married . . . . . . . . . . . . . . . . . . . . . . . . . . . . 100.0 36.1 (1.91) 25.1 (1.52) 25.9 (1.70) 12.9 (1.12) Married . . . . . . . . . . . . . . . . . . . . . . . . . . . . . . . . 100.0 34.3 (1.08) 23.9 (0.91) 26.9 (0.99) 14.9 (0.73) Cohabiting . . . . . . . . . . . . . . . . . . . . . . . . . . . . . . 100.0 35.7 (2.78) 22.9 (1.84) 22.8 (3.10) 18.7 (3.02) Divorced or separated . . . . . . . . . . . . . . . . . . . . . . . 100.0 35.8 (1.52) 25.6 (1.53) 20.4 (1.29) 18.2 (1.20) Widowed . . . . . . . . . . . . . . . . . . . . . . . . . . . . . . . 100.0 47.7 (9.41) *15.9 (6.55) *22.8 (7.19) *13.6 (4.72)
Geographic region: Northeast . . . . . . . . . . . . . . . . . . . . . . . . . . . . . . . 100.0 34.8 (1.72) 23.4 (1.50) 27.1 (1.70) 14.8 (1.37) Midwest . . . . . . . . . . . . . . . . . . . . . . . . . . . . . . . . 100.0 33.5 (1.46) 25.5 (1.31) 27.3 (1.38) 13.8 (1.00) South . . . . . . . . . . . . . . . . . . . . . . . . . . . . . . . . . 100.0 35.7 (1.10) 25.3 (0.95) 24.8 (0.96) 14.2 (0.75) West . . . . . . . . . . . . . . . . . . . . . . . . . . . . . . . . . . 100.0 35.9 (1.65) 23.6 (1.33) 24.2 (1.45) 16.3 (1.09)
Women
Ages 18 years and over (age-adjusted)2 . . . . . . . . . . . . . 100.0 28.5 (0.64) 24.9 (0.62) 26.9 (0.63) 19.7 (0.56) Ages 18 years and over (crude)2 . . . . . . . . . . . . . . . . . . 100.0 29.6 (0.66) 25.1 (0.61) 26.8 (0.62) 18.5 (0.52)
Age:3
18–24 years . . . . . . . . . . . . . . . . . . . . . . . . . . . . . 100.0 37.3 (2.03) 32.9 (2.05) 26.8 (2.04) 3.1 (0.78) 25–44 years . . . . . . . . . . . . . . . . . . . . . . . . . . . . . 100.0 33.8 (1.00) 26.3 (0.97) 24.9 (0.92) 14.9 (0.72) 45–64 years . . . . . . . . . . . . . . . . . . . . . . . . . . . . . 100.0 24.7 (1.07) 21.6 (0.93) 28.6 (1.11) 25.2 (0.96) 65–74 years . . . . . . . . . . . . . . . . . . . . . . . . . . . . . 100.0 17.1 (1.96) 21.2 (2.10) 27.1 (2.14) 34.7 (2.63) 75 years and over . . . . . . . . . . . . . . . . . . . . . . . . . . 100.0 13.3 (2.69) 21.2 (3.75) 33.4 (3.86) 32.1 (3.58)
Race: White, single race . . . . . . . . . . . . . . . . . . . . . . . . . . 100.0 29.3 (0.72) 25.5 (0.70) 26.6 (0.70) 18.5 (0.61) Black or African American, single race . . . . . . . . . . . . . 100.0 20.9 (1.25) 21.0 (1.36) 30.2 (1.57) 27.9 (1.55) American Indian or Alaska Native, single race . . . . . . . . 100.0 32.0 (6.14) 23.5 (5.26) 22.9 (4.98) 21.6 (4.61) Asian, single race . . . . . . . . . . . . . . . . . . . . . . . . . . 100.0 19.8 (3.81) *12.3 (4.06) 41.5 (6.86) 26.4 (6.53) Native Hawaiian or Other Pacific Islander, single race. . . . 100.0 *45.5 (18.58) – † † Two or more races . . . . . . . . . . . . . . . . . . . . . . . . . 100.0 39.4 (4.53) 32.0 (3.95) 18.6 (3.49) 10.1 (2.30)
Black or African American, white . . . . . . . . . . . . . . . 100.0 42.8 (9.85) 28.8 (6.74) *16.3 (6.10) † American Indian or Alaska Native, white . . . . . . . . . . . 100.0 48.5 (7.02) 28.6 (5.34) *12.0 (5.24) *11.0 (3.41)
See footnotes at end of table.

Page 34 [ Series 10, No. 245
Table 4.4. Age-adjusted percent distributions (with standard errors) of age of smoking initiation among current cigarette smokers 18 years of age and over: United States, average annual, 2005–2007—Con.
Age first smoked fairly regularly1
Less than 16–17 18–20 21 years Selected characteristic Total 16 years years years and over
Women—Con. Percent distribution (standard error)
Hispanic or Latino origin and race: Hispanic or Latino . . . . . . . . . . . . . . . . . . . . . . . . . . 100.0 24.6 (1.97) 22.6 (2.32) 26.7 (2.27) 26.1 (2.14)
Mexican or Mexican American . . . . . . . . . . . . . . . . . 100.0 26.0 (2.89) 21.3 (3.05) 25.3 (3.13) 27.3 (2.87) Not Hispanic or Latino . . . . . . . . . . . . . . . . . . . . . . . 100.0 28.8 (0.67) 25.0 (0.65) 26.9 (0.66) 19.3 (0.58)
White, single race . . . . . . . . . . . . . . . . . . . . . . . . 100.0 29.7 (0.76) 25.7 (0.74) 26.6 (0.74) 18.0 (0.63) Black or African American, single race . . . . . . . . . . . . 100.0 20.9 (1.28) 20.7 (1.36) 30.0 (1.59) 28.4 (1.57)
Education: Less than high school graduate . . . . . . . . . . . . . . . . . 100.0 39.5 (1.45) 25.5 (1.35) 20.8 (1.22) 14.2 (1.02) GED diploma4 . . . . . . . . . . . . . . . . . . . . . . . . . . . . 100.0 45.0 (2.65) 20.9 (2.53) 18.3 (3.34) 15.8 (3.21) High school graduate . . . . . . . . . . . . . . . . . . . . . . . . 100.0 27.6 (1.25) 27.7 (1.28) 25.3 (1.12) 19.5 (1.04) Some college—no degree . . . . . . . . . . . . . . . . . . . . . 100.0 25.5 (1.31) 25.4 (1.39) 28.6 (1.44) 20.5 (1.21) Associate of arts degree . . . . . . . . . . . . . . . . . . . . . . 100.0 22.5 (1.70) 21.5 (1.86) 34.8 (2.34) 21.2 (1.96) Bachelor of arts, science degree . . . . . . . . . . . . . . . . . 100.0 15.1 (1.69) 18.8 (1.71) 37.0 (2.54) 29.2 (2.36) Masters, doctorate, medical degree . . . . . . . . . . . . . . . 100.0 11.4 (2.73) 23.4 (3.25) 38.2 (3.61) 26.9 (3.17)
Poverty status:5
Below poverty level . . . . . . . . . . . . . . . . . . . . . . . . . 100.0 37.5 (1.42) 21.6 (1.19) 21.8 (1.20) 19.1 (1.24) ≥1 and <2 times poverty level . . . . . . . . . . . . . . . . . . 100.0 32.1 (1.45) 25.5 (1.43) 23.5 (1.34) 18.9 (1.20) ≥2 and <4 times poverty level . . . . . . . . . . . . . . . . . . 100.0 27.2 (1.24) 25.5 (1.26) 27.8 (1.33) 19.6 (1.08) 4 times poverty level or more . . . . . . . . . . . . . . . . . . . 100.0 19.7 (1.27) 26.3 (1.50) 33.7 (1.68) 20.3 (1.34)
Marital status: Never married . . . . . . . . . . . . . . . . . . . . . . . . . . . . 100.0 25.5 (1.47) 26.6 (2.06) 27.6 (1.95) 20.3 (2.11) Married . . . . . . . . . . . . . . . . . . . . . . . . . . . . . . . . 100.0 27.3 (1.08) 25.8 (1.15) 27.4 (1.10) 19.6 (1.03) Cohabiting . . . . . . . . . . . . . . . . . . . . . . . . . . . . . . 100.0 36.4 (3.09) 20.2 (1.55) 20.4 (2.03) 23.0 (2.95) Divorced or separated . . . . . . . . . . . . . . . . . . . . . . . 100.0 30.2 (1.47) 22.8 (1.33) 24.8 (1.35) 22.2 (1.21) Widowed . . . . . . . . . . . . . . . . . . . . . . . . . . . . . . . 100.0 29.9 (4.97) 18.1 (4.19) 34.8 (5.46) 17.2 (1.60)
Geographic region: Northeast . . . . . . . . . . . . . . . . . . . . . . . . . . . . . . . 100.0 29.0 (1.59) 26.1 (1.55) 27.5 (1.31) 17.4 (1.16) Midwest . . . . . . . . . . . . . . . . . . . . . . . . . . . . . . . . 100.0 27.0 (1.15) 24.9 (1.11) 29.3 (1.21) 18.8 (1.04) South . . . . . . . . . . . . . . . . . . . . . . . . . . . . . . . . . 100.0 29.5 (1.09) 25.2 (1.04) 24.3 (1.02) 21.0 (0.97) West . . . . . . . . . . . . . . . . . . . . . . . . . . . . . . . . . . 100.0 28.6 (1.43) 22.7 (1.44) 28.4 (1.59) 20.3 (1.35)
† Estimates with a relative standard error greater than 50% are indicated with a dagger, but are not shown.
* Estimates preceded by an asterisk have a relative standard error of greater than 30% and less than or equal to 50%. These should be interpreted with caution as they do not meet the standard of reliability or precision.
– Quantity zero. 1Current smokers were asked at what age they first starting smoking fairly regularly. Answers were recorded in single years and combined for this table. 2Persons of other races and unknown race and ethnicity, unknown education, unknown poverty status, and unknown marital status are included in the total. 3Estimates for age groups are not age adjusted. 4GED is General Educational Development high school equivalency diploma. 5Poverty status is based on family income and family size using the U.S. Census Bureau poverty thresholds for 2004, 2005, and 2006.
NOTES: Unless otherwise specified, estimates are age adjusted using the projected 2000 U.S. population as the standard population and using three age groups: 18–44 years, 45–64 years, and 65 years and over. For crude percent distributions, refer to Appendix Table X. Denominator for each percent distribution excludes current smokers with unknown age of smoking initiation. See Appendix II for definitions of terms. See Appendix III for health behavior questions.
DATA SOURCE: National Health Interview Survey, 2005–2007. Estimates are based on household interviews of a sample of the civilian noninstitutionalized population.

Series 10, No. 245 [ Page 35
Table 4.5. Age-adjusted percentages (with standard errors) of current cigarette smokers 18 years of age and over who tried to quit smoking in the past year, by current smoking status and selected characteristics: United States, average annual, 2005–2007
All current Nondaily Daily Selected characteristic smokers smokers smokers
Both sexes Percent who tried to quit1 (standard error)
Ages 18 years and over (age-adjusted)2 . . . . . . . . . . . . . 42.5 (0.54) 54.6 (1.14) 39.6 (0.59) Ages 18 years and over (crude)2 . . . . . . . . . . . . . . . . . . 43.5 (0.53) 55.1 (1.10) 40.5 (0.57)
Age:3
18–24 years . . . . . . . . . . . . . . . . . . . . . . . . . . . . . 52.0 (1.62) 57.2 (2.82) 49.9 (1.89) 25–44 years . . . . . . . . . . . . . . . . . . . . . . . . . . . . . 45.0 (0.80) 54.7 (1.53) 42.4 (0.90) 45–64 years . . . . . . . . . . . . . . . . . . . . . . . . . . . . . 40.3 (0.82) 55.1 (1.95) 37.4 (0.88) 65–74 years . . . . . . . . . . . . . . . . . . . . . . . . . . . . . 34.1 (1.83) 56.8 (4.50) 29.6 (1.93) 75 years and over . . . . . . . . . . . . . . . . . . . . . . . . . . 29.3 (2.79) 36.8 (6.60) 27.7 (3.02)
Race: White, single race . . . . . . . . . . . . . . . . . . . . . . . . . . 41.5 (0.59) 54.2 (1.31) 38.7 (0.65) Black or African American, single race . . . . . . . . . . . . . 46.6 (1.42) 56.7 (2.65) 43.3 (1.55) American Indian or Alaska Native, single race . . . . . . . . 46.1 (4.75) 54.6 (7.46) 44.1 (5.99) Asian, single race . . . . . . . . . . . . . . . . . . . . . . . . . . 45.8 (3.69) 63.5 (5.22) 41.0 (3.51) Native Hawaiian or Other Pacific Islander, single race. . . . 52.0 (14.03) † 65.5 (13.99) Two or more races . . . . . . . . . . . . . . . . . . . . . . . . . 50.0 (4.07) 47.9 (7.02) 50.3 (4.43)
Black or African American, white . . . . . . . . . . . . . . . 31.8 (7.96) † 33.5 (8.82) American Indian or Alaska Native, white . . . . . . . . . . . 49.7 (5.87) 68.3 (11.95) 46.9 (6.19)
Hispanic or Latino origin and race: Hispanic or Latino . . . . . . . . . . . . . . . . . . . . . . . . . . 43.9 (1.63) 51.0 (2.73) 40.8 (1.83)
Mexican or Mexican American . . . . . . . . . . . . . . . . . 41.3 (2.05) 48.6 (3.33) 37.5 (2.36) Not Hispanic or Latino . . . . . . . . . . . . . . . . . . . . . . . 42.4 (0.58) 56.0 (1.28) 39.5 (0.62)
White, single race . . . . . . . . . . . . . . . . . . . . . . . . 41.5 (0.64) 55.8 (1.51) 38.7 (0.69) Black or African American, single race . . . . . . . . . . . . 46.4 (1.45) 56.3 (2.70) 43.0 (1.58)
Education: Less than high school graduate . . . . . . . . . . . . . . . . . 39.3 (1.12) 54.0 (2.52) 36.4 (1.22) GED diploma4 . . . . . . . . . . . . . . . . . . . . . . . . . . . . 36.6 (2.28) 64.3 (4.87) 34.7 (2.39) High school graduate . . . . . . . . . . . . . . . . . . . . . . . . 40.4 (0.93) 54.4 (2.15) 37.6 (1.02) Some college—no degree . . . . . . . . . . . . . . . . . . . . . 48.2 (1.19) 59.8 (2.61) 45.4 (1.27) Associate of arts degree . . . . . . . . . . . . . . . . . . . . . . 44.5 (1.71) 52.7 (3.95) 42.6 (1.91) Bachelor of arts, science degree . . . . . . . . . . . . . . . . . 46.3 (1.68) 50.2 (3.10) 44.0 (2.11) Masters, doctorate, medical degree . . . . . . . . . . . . . . . 43.8 (2.76) 48.7 (4.62) 41.7 (3.33)
Poverty status:5
Below poverty level . . . . . . . . . . . . . . . . . . . . . . . . . 41.8 (1.19) 58.0 (2.42) 38.1 (1.31) ≥1 and <2 times poverty level . . . . . . . . . . . . . . . . . . 41.9 (1.11) 55.2 (2.48) 39.3 (1.26) ≥2 and <4 times poverty level . . . . . . . . . . . . . . . . . . 41.3 (1.08) 55.2 (2.26) 38.1 (1.23) 4 times poverty level or more . . . . . . . . . . . . . . . . . . . 44.7 (1.12) 51.9 (2.46) 42.7 (1.31)
Marital status: Never married . . . . . . . . . . . . . . . . . . . . . . . . . . . . 40.1 (1.23) 50.0 (2.73) 37.0 (1.38) Married . . . . . . . . . . . . . . . . . . . . . . . . . . . . . . . . 42.1 (0.81) 55.0 (1.73) 39.0 (0.89) Cohabiting . . . . . . . . . . . . . . . . . . . . . . . . . . . . . . 44.9 (2.31) 49.4 (4.82) 44.0 (2.56) Divorced or separated . . . . . . . . . . . . . . . . . . . . . . . 42.2 (1.06) 57.5 (2.49) 39.1 (1.16) Widowed . . . . . . . . . . . . . . . . . . . . . . . . . . . . . . . 37.0 (4.05) 50.7 (10.33) 34.4 (4.33)
Geographic region: Northeast . . . . . . . . . . . . . . . . . . . . . . . . . . . . . . . 46.6 (1.28) 61.1 (2.70) 42.8 (1.44) Midwest . . . . . . . . . . . . . . . . . . . . . . . . . . . . . . . . 43.7 (1.02) 54.9 (2.22) 41.0 (1.13) South . . . . . . . . . . . . . . . . . . . . . . . . . . . . . . . . . 40.1 (0.91) 54.8 (1.95) 37.2 (0.96) West . . . . . . . . . . . . . . . . . . . . . . . . . . . . . . . . . . 41.8 (1.24) 49.3 (2.38) 39.8 (1.32)
Men
Ages 18 years and over (age-adjusted)2 . . . . . . . . . . . . . 41.5 (0.78) 51.4 (1.62) 39.2 (0.85) Ages 18 years and over (crude)2 . . . . . . . . . . . . . . . . . . 42.4 (0.73) 51.7 (1.53) 39.8 (0.80)
Age:3
18–24 years . . . . . . . . . . . . . . . . . . . . . . . . . . . . . 49.8 (2.17) 52.6 (3.86) 48.6 (2.56) 25–44 years . . . . . . . . . . . . . . . . . . . . . . . . . . . . . 44.0 (1.07) 50.7 (2.00) 42.0 (1.24) 45–64 years . . . . . . . . . . . . . . . . . . . . . . . . . . . . . 38.4 (1.16) 53.7 (2.77) 35.6 (1.24) 65–74 years . . . . . . . . . . . . . . . . . . . . . . . . . . . . . 36.5 (2.87) 58.2 (6.46) 32.1 (3.10) 75 years and over . . . . . . . . . . . . . . . . . . . . . . . . . . 27.7 (4.36) *18.5 (6.98) 29.9 (5.06)
See footnotes at end of table.

Page 36 [ Series 10, No. 245
Table 4.5. Age-adjusted percentages (with standard errors) of current cigarette smokers 18 years of age and over who tried to quit smoking in the past year, by current smoking status and selected characteristics: United States, average annual, 2005–2007—Con.
All current Nondaily Daily Selected characteristic smokers smokers smokers
Men—Con. Percent who tried to quit1 (standard error)
Race: White, single race . . . . . . . . . . . . . . . . . . . . . . . . . . 40.4 (0.85) 50.5 (1.91) 38.2 (0.93) Black or African American, single race . . . . . . . . . . . . . 45.5 (2.10) 55.2 (3.54) 41.9 (2.35) American Indian or Alaska Native, single race . . . . . . . . 50.3 (6.13) 63.3 (9.14) 55.9 (5.38) Asian, single race . . . . . . . . . . . . . . . . . . . . . . . . . . 46.2 (4.20) 63.4 (5.91) 41.0 (3.97) Native Hawaiian or Other Pacific Islander, single race. . . . *40.8 (13.16) † 54.6 (10.65) Two or more races . . . . . . . . . . . . . . . . . . . . . . . . . 50.6 (6.24) 46.9 (9.87) 52.8 (7.52)
Black or African American, white . . . . . . . . . . . . . . . † – † American Indian or Alaska Native, white . . . . . . . . . . . 54.7 (8.42) 82.2 (11.32) 50.2 (9.15)
Hispanic or Latino origin and race: Hispanic or Latino . . . . . . . . . . . . . . . . . . . . . . . . . . 40.3 (1.99) 47.5 (3.40) 37.7 (2.33)
Mexican or Mexican American . . . . . . . . . . . . . . . . . 38.0 (2.42) 46.8 (3.93) 33.8 (2.70) Not Hispanic or Latino . . . . . . . . . . . . . . . . . . . . . . . 41.7 (0.83) 53.3 (1.85) 39.3 (0.90)
White, single race . . . . . . . . . . . . . . . . . . . . . . . . 40.6 (0.92) 52.5 (2.26) 38.4 (0.99) Black or African American, single race . . . . . . . . . . . . 45.4 (2.13) 54.8 (3.61) 42.0 (2.38)
Education: Less than high school graduate . . . . . . . . . . . . . . . . . 38.1 (1.55) 48.1 (3.22) 35.8 (1.75) GED diploma4 . . . . . . . . . . . . . . . . . . . . . . . . . . . . 37.9 (3.01) 67.6 (7.24) 35.9 (3.15) High school graduate . . . . . . . . . . . . . . . . . . . . . . . . 40.3 (1.29) 52.1 (3.21) 37.9 (1.43) Some college—no degree . . . . . . . . . . . . . . . . . . . . . 46.9 (1.80) 58.6 (3.63) 44.0 (1.98) Associate of arts degree . . . . . . . . . . . . . . . . . . . . . . 44.7 (2.41) 54.6 (6.19) 42.8 (2.69) Bachelor of arts, science degree . . . . . . . . . . . . . . . . . 43.6 (2.29) 43.5 (4.11) 43.4 (2.90) Masters, doctorate, medical degree . . . . . . . . . . . . . . . 44.5 (4.03) 43.0 (6.84) 47.4 (4.76)
Poverty status:5
Below poverty level . . . . . . . . . . . . . . . . . . . . . . . . . 40.1 (1.90) 53.3 (3.53) 36.9 (2.13) ≥1 and <2 times poverty level . . . . . . . . . . . . . . . . . . 38.4 (1.58) 45.6 (3.67) 36.7 (1.72) ≥2 and <4 times poverty level . . . . . . . . . . . . . . . . . . 41.2 (1.43) 53.2 (3.06) 38.5 (1.60) 4 times poverty level or more . . . . . . . . . . . . . . . . . . . 44.9 (1.50) 51.8 (3.11) 43.2 (1.71)
Marital status: Never married . . . . . . . . . . . . . . . . . . . . . . . . . . . . 38.2 (1.70) 46.2 (3.56) 35.8 (1.90) Married . . . . . . . . . . . . . . . . . . . . . . . . . . . . . . . . 41.5 (1.10) 53.0 (2.25) 38.7 (1.22) Cohabiting . . . . . . . . . . . . . . . . . . . . . . . . . . . . . . 45.0 (3.04) 48.1 (6.83) 44.0 (3.32) Divorced or separated . . . . . . . . . . . . . . . . . . . . . . . 39.8 (1.50) 51.0 (3.40) 37.7 (1.69) Widowed . . . . . . . . . . . . . . . . . . . . . . . . . . . . . . . 27.3 (6.99) 23.5 (5.13) 27.2 (7.54)
Geographic region: Northeast . . . . . . . . . . . . . . . . . . . . . . . . . . . . . . . 47.4 (1.85) 60.4 (3.75) 43.4 (2.00) Midwest . . . . . . . . . . . . . . . . . . . . . . . . . . . . . . . . 41.6 (1.54) 51.6 (3.23) 39.3 (1.73) South . . . . . . . . . . . . . . . . . . . . . . . . . . . . . . . . . 39.4 (1.28) 49.6 (2.58) 37.4 (1.42) West . . . . . . . . . . . . . . . . . . . . . . . . . . . . . . . . . . 40.9 (1.70) 48.3 (3.29) 39.1 (1.77)
Women
Ages 18 years and over (age-adjusted)2 . . . . . . . . . . . . . 43.7 (0.72) 59.1 (1.60) 40.2 (0.81) Ages 18 years and over (crude)2 . . . . . . . . . . . . . . . . . . 44.9 (0.73) 59.7 (1.55) 41.4 (0.82)
Age:3
18–24 years . . . . . . . . . . . . . . . . . . . . . . . . . . . . . 55.1 (2.18) 64.5 (3.85) 51.7 (2.59) 25–44 years . . . . . . . . . . . . . . . . . . . . . . . . . . . . . 46.3 (1.12) 60.7 (2.28) 42.8 (1.25) 45–64 years . . . . . . . . . . . . . . . . . . . . . . . . . . . . . 42.4 (1.14) 56.7 (2.72) 39.6 (1.25) 65–74 years . . . . . . . . . . . . . . . . . . . . . . . . . . . . . 31.6 (2.24) 55.2 (6.34) 27.1 (2.27) 75 years and over . . . . . . . . . . . . . . . . . . . . . . . . . . 30.6 (3.72) 52.8 (8.61) 26.1 (3.94)
Race: White, single race . . . . . . . . . . . . . . . . . . . . . . . . . . 43.1 (0.80) 59.2 (1.81) 39.5 (0.90) Black or African American, single race . . . . . . . . . . . . . 47.8 (1.61) 58.6 (3.68) 44.8 (1.83) American Indian or Alaska Native, single race . . . . . . . . 39.1 (5.92) 63.3 (8.08) 26.9 (6.09) Asian, single race . . . . . . . . . . . . . . . . . . . . . . . . . . 42.5 (5.07) 59.7 (10.52) 40.1 (6.02) Native Hawaiian or Other Pacific Islander, single race. . . . 36.1 (0.00) – 36.1 (0.00) Two or more races . . . . . . . . . . . . . . . . . . . . . . . . . 49.9 (5.03) 59.3 (11.96) 49.6 (5.34)
Black or African American, white . . . . . . . . . . . . . . . 40.6 (9.79) *62.4 (26.42) 40.4 (10.43) American Indian or Alaska Native, white . . . . . . . . . . . 43.4 (7.29) *51.7 (17.45) 42.8 (7.74)
See footnotes at end of table.

Series 10, No. 245 [ Page 37
Table 4.5. Age-adjusted percentages (with standard errors) of current cigarette smokers 18 years of age and over who tried to quit smoking in the past year, by current smoking status and selected characteristics: United States, average annual, 2005–2007—Con.
All current Nondaily Daily Selected characteristic smokers smokers smokers
Women—Con. Percent who tried to quit1 (standard error)
Hispanic or Latino origin and race: Hispanic or Latino . . . . . . . . . . . . . . . . . . . . . . . . . . 50.3 (2.50) 58.7 (4.30) 46.0 (2.94)
Mexican or Mexican American . . . . . . . . . . . . . . . . . 48.3 (3.27) 56.3 (5.50) 43.0 (4.03) Not Hispanic or Latino . . . . . . . . . . . . . . . . . . . . . . . 43.4 (0.76) 59.3 (1.71) 39.9 (0.84)
White, single race . . . . . . . . . . . . . . . . . . . . . . . . 42.7 (0.85) 59.6 (1.95) 39.3 (0.94) Black or African American, single race . . . . . . . . . . . . 47.3 (1.63) 58.4 (3.74) 44.2 (1.85)
Education: Less than high school graduate . . . . . . . . . . . . . . . . . 40.7 (1.46) 64.5 (3.93) 37.0 (1.52) GED diploma4 . . . . . . . . . . . . . . . . . . . . . . . . . . . . 33.9 (2.87) 60.3 (6.61) 31.6 (2.95) High school graduate . . . . . . . . . . . . . . . . . . . . . . . . 40.9 (1.37) 58.4 (3.07) 37.5 (1.50) Some college—no degree . . . . . . . . . . . . . . . . . . . . . 49.7 (1.55) 62.3 (3.22) 47.0 (1.65) Associate of arts degree . . . . . . . . . . . . . . . . . . . . . . 44.5 (2.35) 52.4 (4.99) 42.4 (2.57) Bachelor of arts, science degree . . . . . . . . . . . . . . . . . 49.9 (2.36) 58.4 (4.64) 45.2 (2.93) Masters, doctorate, medical degree . . . . . . . . . . . . . . . 43.1 (3.76) 54.4 (6.41) 36.1 (4.30)
Poverty status:5 . . . . . . . . . . . . . . . . . . . . . . . . . . . . . Below poverty level . . . . . . . . . . . . . . . . . . . . . . . . . 43.2 (1.38) 63.0 (3.18) 39.2 (1.54) ≥1 and <2 times poverty level . . . . . . . . . . . . . . . . . . 45.9 (1.52) 64.6 (3.29) 42.2 (1.71) ≥2 and <4 times poverty level . . . . . . . . . . . . . . . . . . 41.7 (1.39) 58.2 (2.96) 38.1 (1.61) 4 times poverty level or more . . . . . . . . . . . . . . . . . . . 44.6 (1.63) 52.5 (3.45) 42.0 (1.90)
Marital status: Never married . . . . . . . . . . . . . . . . . . . . . . . . . . . . 43.2 (1.79) 55.9 (4.19) 39.1 (2.00) Married . . . . . . . . . . . . . . . . . . . . . . . . . . . . . . . . 42.2 (1.20) 57.4 (2.80) 38.8 (1.32) Cohabiting . . . . . . . . . . . . . . . . . . . . . . . . . . . . . . 44.1 (3.64) 50.1 (6.94) 42.6 (4.33) Divorced or separated . . . . . . . . . . . . . . . . . . . . . . . 44.4 (1.47) 64.5 (3.24) 40.3 (1.56) Widowed . . . . . . . . . . . . . . . . . . . . . . . . . . . . . . . 40.9 (5.01) 54.4 (11.66) 37.9 (5.48)
Geographic region: Northeast . . . . . . . . . . . . . . . . . . . . . . . . . . . . . . . 45.7 (1.69) 61.7 (3.73) 42.0 (1.94) Midwest . . . . . . . . . . . . . . . . . . . . . . . . . . . . . . . . 46.2 (1.40) 59.0 (2.94) 43.1 (1.71) South . . . . . . . . . . . . . . . . . . . . . . . . . . . . . . . . . 41.0 (1.16) 61.5 (2.66) 37.0 (1.18) West . . . . . . . . . . . . . . . . . . . . . . . . . . . . . . . . . . 44.1 (1.76) 52.3 (3.68) 41.8 (1.91)
† Estimates with a relative standard error greater than 50% are indicated with a dagger, but are not shown.
* Estimates preceded by an asterisk have a relative standard error of greater than 30% and less than or equal to 50%. These should be interpreted with caution as they do not meet the standard of reliability or precision.
– Quantity zero. 1Percentage of cigarette smokers who had stopped smoking for more than 1 day in the past year because they were trying to quit. 2Persons of other races and unknown race and ethnicity, unknown education, unknown poverty status, and unknown marital status are included in the total. 3Estimates for age groups are not age adjusted. 4GED is General Educational Development high school equivalency diploma. 5Poverty status is based on family income and family size using the U.S. Census Bureau poverty thresholds for 2004, 2005, and 2006.
NOTES: Unless otherwise specified, estimates are age adjusted using the projected 2000 U.S. population as the standard population and using three age groups: 18–44 years, 45–64 years, and 65 years and over. For crude percentages, refer to Appendix Table XI. Denominator for each percentage excludes current smokers for whom information on quit attempts was unknown. See Appendix II for definitions of terms. See Appendix III for health behavior questions.
DATA SOURCE: National Health Interview Survey, 2005–2007. Estimates are based on household interviews of a sample of the civilian noninstitutionalized population.

Page 38 [ Series 10, No. 245
0
20
40
60
80
Per
cent
18–24 25–44 45–64 65–74 75 and overAge in years
Regular activity
At least some activity
NOTES: Estimates are based on household interviews of a sample of the civilian noninstitutionalized population.
DATA SOURCE: CDC/NCHS, National Health Interview Survey, 2005–2007.
Figure 5.1. Percentage of adults who engaged in leisure-time physical activity, by level of activity and age: United States, 2005–2007
0
10
20
30
40
50
Per
cent
18–24 25–44 45–64 65–74 75 and overAge in years
Women
Men
NOTES: Estimates are based on household interviews of a sample of the civilian noninstitutionalized population.
DATA SOURCE: CDC/NCHS, National Health Interview Survey, 2005–2007.
Figure 5.2. Percentage of adults who engaged in at least some leisure-time strengthening activity, by sex and age: United States, 2005–2007
Chapter 5 Leisure-time Physical Activity
All Adults + Overall, 60.3% of adults engaged in
at least some leisure-time physical activity, with 30.7% engaging in activity sufficient in frequency and duration to be classified as ‘‘regular’’ (Table 5.1).
+ Almost 4 in 10 adults (39.7%) engaged in no leisure-time physical activity (Table 5.1).
+ Overall, about one in five adults (21.9%) engaged in light-moderate leisure-time physical activity at least five times per week and about one in eight adults (11.1%) engaged in vigorous leisure-time physical activity this often (Table 5.2 and Table 5.3).
+ About one-fourth of adults engaged in at least some leisure-time strengthening activity (Table 5.5).
Sex + Men (61.9%) were more likely than
women (58.9%) to engage in at least some leisure-time physical activity (Table 5.1).
+ Men were more likely than women to engage in regular vigorous leisure-time physical activity, but men and women were about equally likely to engage in regular light-moderate leisure-time physical activity (Table 5.4).
+ About 3 in 10 men (27.4%) compared with about 2 in 10 women (21.1%) engaged in leisure-time strengthening activities (Table 5.5).
Age + The percentage of adults who
engaged in at least some leisure-time physical activity decreased with age from 66.3% among adults 18–24 years to 39.6% among adults 75 years and over (Table 5.1 and Figure 5.1).
+ The percentage of adults who engaged in any regular leisure-time physical activity declined steadily with age from 37.5% of adults 18–24 years to 17.4% of adults aged 75 years and over (Table 5.4 and Figure 5.1).
+ Participation in leisure-time strengthening physical activities declined with age for both men and women (Table 5.5 and Figure 5.2).
Race + White adults (61.9%) and Asian
adults (60.3%) were more likely
than black adults (48.8%) to engage in at least some leisure-time physical activity (Table 5.1).
+ Engaging in regular leisure-time physical activity was more prevalent among white adults than among Asian adults and black adults (Table 5.1).
Hispanic or Latino Origin and Race + Non-Hispanic white adults (64.9%)
were more likely than non-Hispanic black adults (48.8%) and Hispanic adults (46.5%) to engage in at least

46.2
General Educational Development High schoolLess than Some collegehigh school (GED) high school equivalency graduate
diploma
Associate of arts degree Bachelor’s degree Graduate degree 100
80.7 75.080
67.165.2
Per
cent
40
52.7 48.4
42.339.4
23.921.717.8 20
0
32.8 34.2
At least some activity Regular activity
NOTES: Estimates are based on household interviews of a sample of the civilian noninstitutionalized population. Estimates are age adjusted using the projected 2000 U.S. population as the standard population.
DATA SOURCE: CDC/NCHS, National Health Interview Survey, 2005–2007.
19.9 20
At least some activity Regular activity80 72.2
59.260
48.6 39.2 42.5
Per
cent
40
28.8 22.8
0 Below >1 and <2 times >2 and <4 times 4 times or more
Poverty level NOTES: Estimates are based on household interviews of a sample of the civilian noninstitutionalized population. Estimates are age adjusted using the projected 2000 U.S. population as the standard population.
DATA SOURCE: CDC/NCHS, National Health Interview Survey, 2005–2007.
Series 10, No. 245 [ Page 39
Figure 5.3. Percentage of adults who engaged in leisure-time physical activity, by level of activity and education: United States, 2005–2007
Figure 5.4. Percentage of adults who engaged in leisure-time physical activity, by level of activity and poverty status: United States, 2005–2007
some leisure-time physical activity (Table 5.1).
+ Engaging in regular leisure-time physical activity was more prevalent among non-Hispanic white adults (33.8%) than among non-Hispanic black adults (23.1%) and Hispanic adults (22.3%) (Table 5.1).
Education + The percentage of adults who
engaged in at least some leisuretime physical activity increased with education. Adults with a graduate level degree were about twice as likely as adults with less than a high school diploma to engage in at least some leisure-time physical activity and more than twice as likely to be regularly active (Table 5.1 and Figure 5.3).
+ Adults with higher levels of education were more likely than those with fewer years of education to engage in regular leisure-time physical activity. Educational differences were particularly striking for regular vigorous activities and were greater for women than for men (Table 5.4).
+ Adults with an advanced academic degree (39.0%) were more than three times as likely as adults with less than a high school diploma (12.0%) to engage in leisure-time strengthening activities (Table 5.5).
Poverty Status + Among U.S. adults, the likelihood of
engaging in at least some leisure-time physical activity increased with family income (Table 5.1 and Figure 5.4).
(39.2%) were nearly twice as likely as adults with family incomes below the poverty level (19.9%) to engage
+ Adults who had family incomes four times the poverty level or more
in regular leisure-time physical activity (Table 5.1 and Figure 5.4).
+ Adults with the highest family incomes (30.6%) were more than twice as likely as adults with the lowest family incomes (12.8%) to engage in regular vigorous leisure-time physical activities;
adults with the highest family incomes (16.1%) were about 50% more likely than those in the lowest income group (10.9%) to engage in regular light-moderate leisure-time physical activity (Table 5.4).
Marital Status + Married adults were more likely
than adults in the other marital
status groups to engage in at least some leisure-time physical activity (Table 5.1).
+ Widowed adults (19.7%) were less likely than never married adults (31.9%), married adults (30.8%), and divorced or separated adults (28.4%) to engage in regular leisure-time physical activity (Table 5.1).
+ Adults who had never been married

Page 40 [ Series 10, No. 245
were more likely than adults in any other marital status group to engage in leisure-time strengthening activities (Table 5.5).
Geographic Region + Adults living in the South (27.4%)
were least likely to engage in regular leisure-time physical activity compared with adults living in any other region (Table 5.1).

Series 10, No. 245 [ Page 41
Table 5.1. Age-adjusted percent distributions (with standard errors) of leisure-time physical activity status for adults 18 years of age and over and age-adjusted percentages (with standard errors) of adults 18 years of age and over who engaged in some but less than regular and regular leisure-time physical activity, by selected characteristics: United States, average annual, 2005–2007
Leisure-time physical activity status1
At least some2
Some, less than
Selected characteristic Total Inactive (some+regular) regular Regular
Both sexes Percent distribution (standard error) Percent (standard error)
Ages 18 years and over (age-adjusted)3 . . . . . . . . . . . . . 100.00 39.7 (0.40) 60.3 (0.40) 29.6 (0.27) 30.7 (0.29) Ages 18 years and over (crude)3 . . . . . . . . . . . . . . . . . . 100.00 39.7 (0.40) 60.3 (0.40) 29.7 (0.27) 30.6 (0.29)
Age:4
18–24 years . . . . . . . . . . . . . . . . . . . . . . . . . . . . . 100.00 33.7 (0.79) 66.3 (0.79) 28.7 (0.67) 37.5 (0.76) 25–44 years . . . . . . . . . . . . . . . . . . . . . . . . . . . . . 100.00 35.5 (0.51) 64.5 (0.51) 31.5 (0.38) 33.0 (0.40) 45–64 years . . . . . . . . . . . . . . . . . . . . . . . . . . . . . 100.00 39.9 (0.50) 60.1 (0.50) 30.6 (0.39) 29.5 (0.43) 65–74 years . . . . . . . . . . . . . . . . . . . . . . . . . . . . . 100.00 48.0 (0.82) 52.0 (0.82) 26.6 (0.64) 25.4 (0.67) 75 years and over . . . . . . . . . . . . . . . . . . . . . . . . . . 100.00 60.4 (0.80) 39.6 (0.80) 22.3 (0.62) 17.4 (0.60)
Race: White, single race . . . . . . . . . . . . . . . . . . . . . . . . . . 100.00 38.1 (0.43) 61.9 (0.43) 30.0 (0.30) 31.8 (0.32) Black or African American, single race . . . . . . . . . . . . . 100.00 51.2 (0.75) 48.8 (0.75) 25.6 (0.54) 23.2 (0.55) American Indian or Alaska Native, single race . . . . . . . . 100.00 38.4 (2.39) 61.6 (2.39) 35.3 (2.19) 26.3 (2.30) Asian, single race . . . . . . . . . . . . . . . . . . . . . . . . . . 100.00 39.7 (1.07) 60.3 (1.07) 30.6 (0.99) 29.7 (0.96) Native Hawaiian or Other Pacific Islander, single race. . . . 100.00 42.0 (6.78) 58.0 (6.78) 27.1 (4.97) 30.8 (5.48) Two or more races . . . . . . . . . . . . . . . . . . . . . . . . . 100.00 37.1 (2.00) 62.9 (2.00) 33.2 (1.96) 29.7 (1.76)
Black or African American, white . . . . . . . . . . . . . . . 100.00 47.3 (4.53) 52.7 (4.53) 24.9 (3.90) 27.7 (4.22) American Indian or Alaska Native, white . . . . . . . . . . . 100.00 37.0 (2.85) 63.0 (2.85) 35.8 (3.10) 27.2 (2.58)
Hispanic or Latino origin and race: Hispanic or Latino . . . . . . . . . . . . . . . . . . . . . . . . . . 100.00 53.5 (0.65) 46.5 (0.65) 24.2 (0.52) 22.3 (0.52)
Mexican or Mexican American . . . . . . . . . . . . . . . . . 100.00 53.2 (0.83) 46.8 (0.83) 24.8 (0.66) 22.0 (0.69) Not Hispanic or Latino . . . . . . . . . . . . . . . . . . . . . . . 100.00 37.5 (0.43) 62.5 (0.43) 30.5 (0.30) 32.0 (0.32)
White, single race . . . . . . . . . . . . . . . . . . . . . . . . 100.00 35.1 (0.47) 64.9 (0.47) 31.1 (0.34) 33.8 (0.36) Black or African American, single race . . . . . . . . . . . . 100.00 51.2 (0.77) 48.8 (0.77) 25.7 (0.56) 23.1 (0.56)
Education: Less than high school graduate . . . . . . . . . . . . . . . . . 100.00 60.6 (0.65) 39.4 (0.65) 21.6 (0.53) 17.8 (0.48) GED diploma5 . . . . . . . . . . . . . . . . . . . . . . . . . . . . 100.00 51.6 (1.42) 48.4 (1.42) 26.7 (1.16) 21.7 (1.20) High school graduate . . . . . . . . . . . . . . . . . . . . . . . . 100.00 47.3 (0.63) 52.7 (0.63) 28.8 (0.49) 23.9 (0.44) Some college—no degree . . . . . . . . . . . . . . . . . . . . . 100.00 34.8 (0.58) 65.2 (0.58) 32.3 (0.51) 32.8 (0.53) Associate of arts degree . . . . . . . . . . . . . . . . . . . . . . 100.00 32.9 (0.70) 67.1 (0.70) 32.9 (0.69) 34.2 (0.72) Bachelor of arts, science degree . . . . . . . . . . . . . . . . . 100.00 25.0 (0.53) 75.0 (0.53) 32.6 (0.56) 42.3 (0.60) Masters, doctorate, medical degree . . . . . . . . . . . . . . . 100.00 19.3 (0.61) 80.7 (0.61) 34.5 (0.75) 46.2 (0.76)
Poverty status:6
Below poverty level . . . . . . . . . . . . . . . . . . . . . . . . . 100.00 57.5 (0.79) 42.5 (0.79) 22.5 (0.53) 19.9 (0.61) ≥1 and <2 times poverty level . . . . . . . . . . . . . . . . . . 100.00 51.4 (0.65) 48.6 (0.65) 25.8 (0.52) 22.8 (0.54) ≥2 and <4 times poverty level . . . . . . . . . . . . . . . . . . 100.00 40.8 (0.54) 59.2 (0.54) 30.5 (0.42) 28.8 (0.42) 4 times poverty level or more . . . . . . . . . . . . . . . . . . . 100.00 27.8 (0.46) 72.2 (0.46) 33.0 (0.42) 39.2 (0.41)
Marital status: Never married . . . . . . . . . . . . . . . . . . . . . . . . . . . . 100.00 40.7 (0.67) 59.3 (0.67) 27.4 (0.57) 31.9 (0.58) Married . . . . . . . . . . . . . . . . . . . . . . . . . . . . . . . . 100.00 38.0 (0.46) 62.0 (0.46) 31.3 (0.35) 30.8 (0.36) Cohabiting . . . . . . . . . . . . . . . . . . . . . . . . . . . . . . 100.00 41.1 (1.15) 58.9 (1.15) 29.2 (1.01) 29.7 (1.03) Divorced or separated . . . . . . . . . . . . . . . . . . . . . . . 100.00 43.9 (0.68) 56.1 (0.68) 27.7 (0.56) 28.4 (0.58) Widowed . . . . . . . . . . . . . . . . . . . . . . . . . . . . . . . 100.00 53.6 (2.66) 46.4 (2.66) 26.7 (2.52) 19.7 (1.79)
Geographic region: Northeast . . . . . . . . . . . . . . . . . . . . . . . . . . . . . . . 100.00 37.6 (0.74) 62.4 (0.74) 30.2 (0.63) 32.2 (0.61) Midwest . . . . . . . . . . . . . . . . . . . . . . . . . . . . . . . . 100.00 34.4 (0.93) 65.6 (0.93) 33.5 (0.62) 32.0 (0.66) South . . . . . . . . . . . . . . . . . . . . . . . . . . . . . . . . . 100.00 46.0 (0.71) 54.0 (0.71) 26.5 (0.44) 27.4 (0.48) West . . . . . . . . . . . . . . . . . . . . . . . . . . . . . . . . . . 100.00 36.4 (0.68) 63.6 (0.68) 30.2 (0.52) 33.5 (0.57)
Men
Ages 18 years and over (age-adjusted)3 . . . . . . . . . . . . . 100.00 38.1 (0.47) 61.9 (0.47) 29.3 (0.37) 32.6 (0.38) Ages 18 years and over (crude)3 . . . . . . . . . . . . . . . . . . 100.00 38.0 (0.47) 62.0 (0.47) 29.4 (0.37) 32.7 (0.38)
Age:4
18–24 years . . . . . . . . . . . . . . . . . . . . . . . . . . . . . 100.00 30.8 (1.05) 69.2 (1.05) 26.9 (0.99) 42.3 (1.12) 25–44 years . . . . . . . . . . . . . . . . . . . . . . . . . . . . . 100.00 34.4 (0.65) 65.6 (0.65) 31.6 (0.54) 34.0 (0.54) 45–64 years . . . . . . . . . . . . . . . . . . . . . . . . . . . . . 100.00 40.2 (0.63) 59.8 (0.63) 29.5 (0.54) 30.4 (0.56) 65–74 years . . . . . . . . . . . . . . . . . . . . . . . . . . . . . 100.00 45.5 (1.12) 54.5 (1.12) 26.3 (0.93) 28.2 (0.96) 75 years and over . . . . . . . . . . . . . . . . . . . . . . . . . . 100.00 53.1 (1.23) 46.9 (1.23) 24.4 (1.01) 22.5 (0.99)
See footnotes at end of table.

Page 42 [ Series 10, No. 245
Table 5.1. Age-adjusted percent distributions (with standard errors) of leisure-time physical activity status for adults 18 years of age and over and age-adjusted percentages (with standard errors) of adults 18 years of age and over who engaged in some but less than regular and regular leisure-time physical activity, by selected characteristics: United States, average annual, 2005–2007—Con.
Leisure-time physical activity status1
At least some2
Some, less than
Selected characteristic Total Inactive (some+regular) regular Regular
Men—Con. Percent distribution (standard error) Percent (standard error)
Race: White, single race . . . . . . . . . . . . . . . . . . . . . . . . . . 100.00 37.2 (0.51) 62.8 (0.51) 29.6 (0.41) 33.2 (0.42) Black or African American, single race . . . . . . . . . . . . . 100.00 46.6 (1.03) 53.4 (1.03) 24.8 (0.81) 28.6 (0.92) American Indian or Alaska Native, single race . . . . . . . . 100.00 38.0 (3.68) 62.0 (3.68) 35.0 (3.27) 27.0 (3.34) Asian, single race . . . . . . . . . . . . . . . . . . . . . . . . . . 100.00 36.5 (1.41) 63.5 (1.41) 30.9 (1.38) 32.6 (1.41) Native Hawaiian or Other Pacific Islander, single race. . . . 100.00 45.6 (9.86) 54.4 (9.86) 31.1 (8.06) 23.3 (6.18) Two or more races . . . . . . . . . . . . . . . . . . . . . . . . . 100.00 36.9 (3.00) 63.1 (3.00) 33.3 (3.01) 29.8 (2.56)
Black or African American, white . . . . . . . . . . . . . . . 100.00 50.5 (6.91) 49.5 (6.91) *18.0 (5.66) 31.4 (5.82) American Indian or Alaska Native, white . . . . . . . . . . . 100.00 36.8 (4.11) 63.2 (4.11) 36.9 (4.49) 26.3 (3.49)
Hispanic or Latino origin and race: Hispanic or Latino . . . . . . . . . . . . . . . . . . . . . . . . . . 100.00 51.5 (0.91) 48.5 (0.91) 24.2 (0.75) 24.3 (0.78)
Mexican or Mexican American . . . . . . . . . . . . . . . . . 100.00 52.1 (1.18) 47.9 (1.18) 24.5 (1.00) 23.4 (0.93) Not Hispanic or Latino . . . . . . . . . . . . . . . . . . . . . . . 100.00 35.8 (0.51) 64.2 (0.51) 30.1 (0.41) 34.1 (0.42)
White, single race . . . . . . . . . . . . . . . . . . . . . . . . 100.00 34.2 (0.57) 65.8 (0.57) 30.6 (0.47) 35.2 (0.48) Black or African American, single race . . . . . . . . . . . . 100.00 46.6 (1.05) 53.4 (1.05) 25.1 (0.83) 28.3 (0.94)
Education: Less than high school graduate . . . . . . . . . . . . . . . . . 100.00 58.5 (0.90) 41.5 (0.90) 21.4 (0.73) 20.2 (0.74) GED diploma5 . . . . . . . . . . . . . . . . . . . . . . . . . . . . 100.00 46.0 (2.08) 54.0 (2.08) 28.0 (1.76) 26.0 (1.96) High school graduate . . . . . . . . . . . . . . . . . . . . . . . . 100.00 46.2 (0.81) 53.8 (0.81) 28.3 (0.70) 25.5 (0.63) Some college—no degree . . . . . . . . . . . . . . . . . . . . . 100.00 33.4 (0.80) 66.6 (0.80) 31.9 (0.76) 34.8 (0.82) Associate of arts degree . . . . . . . . . . . . . . . . . . . . . . 100.00 31.4 (1.04) 68.6 (1.04) 31.5 (1.07) 37.1 (1.07) Bachelor of arts, science degree . . . . . . . . . . . . . . . . . 100.00 22.9 (0.70) 77.1 (0.70) 32.8 (0.80) 44.3 (0.81) Masters, doctorate, medical degree . . . . . . . . . . . . . . . 100.00 17.6 (0.81) 82.4 (0.81) 35.2 (1.16) 47.2 (1.13)
Poverty status:6
Below poverty level . . . . . . . . . . . . . . . . . . . . . . . . . 100.00 55.2 (1.13) 44.8 (1.13) 22.0 (0.84) 22.8 (0.99) ≥1 and <2 times poverty level . . . . . . . . . . . . . . . . . . 100.00 50.9 (0.98) 49.1 (0.98) 24.6 (0.77) 24.5 (0.81) ≥2 and <4 times poverty level . . . . . . . . . . . . . . . . . . 100.00 40.2 (0.71) 59.8 (0.71) 29.7 (0.59) 30.0 (0.59) 4 times poverty level or more . . . . . . . . . . . . . . . . . . . 100.00 27.0 (0.55) 73.0 (0.55) 32.6 (0.58) 40.5 (0.56)
Marital status: Never married . . . . . . . . . . . . . . . . . . . . . . . . . . . . 100.00 39.0 (0.90) 61.0 (0.90) 25.8 (0.77) 35.2 (0.82) Married . . . . . . . . . . . . . . . . . . . . . . . . . . . . . . . . 100.00 37.7 (0.57) 62.3 (0.57) 31.6 (0.49) 30.7 (0.47) Cohabiting . . . . . . . . . . . . . . . . . . . . . . . . . . . . . . 100.00 40.4 (1.55) 59.6 (1.55) 28.2 (1.37) 31.4 (1.45) Divorced or separated . . . . . . . . . . . . . . . . . . . . . . . 100.00 41.6 (1.00) 58.4 (1.00) 25.1 (0.84) 33.3 (0.94) Widowed . . . . . . . . . . . . . . . . . . . . . . . . . . . . . . . 100.00 48.2 (6.56) 51.8 (6.56) 37.7 (6.61) 14.2 (2.18)
Geographic region: Northeast . . . . . . . . . . . . . . . . . . . . . . . . . . . . . . . 100.00 34.7 (0.91) 65.3 (0.91) 30.9 (0.85) 34.4 (0.93) Midwest . . . . . . . . . . . . . . . . . . . . . . . . . . . . . . . . 100.00 33.5 (1.12) 66.5 (1.12) 32.7 (0.90) 33.8 (0.82) South . . . . . . . . . . . . . . . . . . . . . . . . . . . . . . . . . 100.00 44.3 (0.81) 55.7 (0.81) 25.9 (0.56) 29.7 (0.62) West . . . . . . . . . . . . . . . . . . . . . . . . . . . . . . . . . . 100.00 35.5 (0.82) 64.5 (0.82) 29.8 (0.69) 34.7 (0.74)
Women
Ages 18 years and over (age-adjusted)3 . . . . . . . . . . . . . 100.00 41.1 (0.45) 58.9 (0.45) 30.0 (0.33) 28.9 (0.35) Ages 18 years and over (crude)3 . . . . . . . . . . . . . . . . . . 100.00 41.3 (0.45) 58.7 (0.45) 30.0 (0.33) 28.7 (0.35)
Age:4
18–24 years . . . . . . . . . . . . . . . . . . . . . . . . . . . . . 100.00 36.6 (1.03) 63.4 (1.03) 30.5 (0.91) 32.9 (0.95) 25–44 years . . . . . . . . . . . . . . . . . . . . . . . . . . . . . 100.00 36.6 (0.57) 63.4 (0.57) 31.3 (0.49) 32.1 (0.51) 45–64 years . . . . . . . . . . . . . . . . . . . . . . . . . . . . . 100.00 39.7 (0.62) 60.3 (0.62) 31.6 (0.50) 28.7 (0.53) 65–74 years . . . . . . . . . . . . . . . . . . . . . . . . . . . . . 100.00 50.0 (1.01) 50.0 (1.01) 27.0 (0.83) 23.0 (0.84) 75 years and over . . . . . . . . . . . . . . . . . . . . . . . . . . 100.00 65.0 (0.91) 35.0 (0.91) 20.9 (0.74) 14.0 (0.68)
Race: White, single race . . . . . . . . . . . . . . . . . . . . . . . . . . 100.00 38.9 (0.48) 61.1 (0.48) 30.5 (0.36) 30.6 (0.40) Black or African American, single race . . . . . . . . . . . . . 100.00 55.0 (0.87) 45.0 (0.87) 26.2 (0.69) 18.8 (0.58) American Indian or Alaska Native, single race . . . . . . . . 100.00 38.2 (3.12) 61.8 (3.12) 36.4 (2.70) 25.4 (2.62) Asian, single race . . . . . . . . . . . . . . . . . . . . . . . . . . 100.00 42.9 (1.49) 57.1 (1.49) 30.3 (1.35) 26.8 (1.27) Native Hawaiian or Other Pacific Islander, single race. . . . 100.00 40.5 (5.38) 59.5 (5.38) *19.5 (7.02) 39.9 (9.83) Two or more races . . . . . . . . . . . . . . . . . . . . . . . . . 100.00 37.6 (2.39) 62.4 (2.39) 32.8 (2.31) 29.6 (2.32)
Black or African American, white . . . . . . . . . . . . . . . 100.00 46.2 (5.93) 53.8 (5.93) 29.7 (5.04) 24.1 (5.63) American Indian or Alaska Native, white . . . . . . . . . . . 100.00 37.4 (3.51) 62.6 (3.51) 34.1 (3.87) 28.5 (3.62)
See footnotes at end of table.

Series 10, No. 245 [ Page 43
Table 5.1. Age-adjusted percent distributions (with standard errors) of leisure-time physical activity status for adults 18 years of age and over and age-adjusted percentages (with standard errors) of adults 18 years of age and over who engaged in some but less than regular and regular leisure-time physical activity, by selected characteristics: United States, average annual, 2005–2007—Con.
Leisure-time physical activity status1
At least some2
Some, less than
Selected characteristic Total Inactive (some+regular) regular Regular
Women—Con. Percent distribution (standard error) Percent (standard error)
Hispanic or Latino origin and race: Hispanic or Latino . . . . . . . . . . . . . . . . . . . . . . . . . . 100.00 55.4 (0.80) 44.6 (0.80) 24.1 (0.65) 20.5 (0.65)
Mexican or Mexican American . . . . . . . . . . . . . . . . . 100.00 54.3 (1.03) 45.7 (1.03) 25.1 (0.84) 20.6 (0.89) Not Hispanic or Latino . . . . . . . . . . . . . . . . . . . . . . . 100.00 38.9 (0.49) 61.1 (0.49) 30.9 (0.36) 30.2 (0.39)
White, single race . . . . . . . . . . . . . . . . . . . . . . . . 100.00 35.8 (0.53) 64.2 (0.53) 31.6 (0.40) 32.5 (0.45) Black or African American, single race . . . . . . . . . . . . 100.00 54.8 (0.89) 45.2 (0.89) 26.3 (0.70) 18.9 (0.59)
Education: Less than high school graduate . . . . . . . . . . . . . . . . . 100.00 62.7 (0.78) 37.3 (0.78) 21.9 (0.66) 15.4 (0.55) GED diploma5 . . . . . . . . . . . . . . . . . . . . . . . . . . . . 100.00 57.6 (1.81) 42.4 (1.81) 25.3 (1.50) 17.1 (1.35) High school graduate . . . . . . . . . . . . . . . . . . . . . . . . 100.00 48.4 (0.72) 51.6 (0.72) 29.3 (0.60) 22.3 (0.57) Some college—no degree . . . . . . . . . . . . . . . . . . . . . 100.00 36.0 (0.71) 64.0 (0.71) 32.8 (0.68) 31.2 (0.64) Associate of arts degree . . . . . . . . . . . . . . . . . . . . . . 100.00 34.0 (0.89) 66.0 (0.89) 33.9 (0.89) 32.0 (0.91) Bachelor of arts, science degree . . . . . . . . . . . . . . . . . 100.00 27.1 (0.73) 72.9 (0.73) 32.5 (0.74) 40.4 (0.79) Masters, doctorate, medical degree . . . . . . . . . . . . . . . 100.00 21.0 (0.88) 79.0 (0.88) 34.1 (0.97) 45.0 (1.05)
Poverty status:6
Below poverty level . . . . . . . . . . . . . . . . . . . . . . . . . 100.00 59.2 (0.84) 40.8 (0.84) 22.9 (0.65) 17.9 (0.62) ≥1 and <2 times poverty level . . . . . . . . . . . . . . . . . . 100.00 51.7 (0.79) 48.3 (0.79) 26.9 (0.69) 21.4 (0.60) ≥2 and <4 times poverty level . . . . . . . . . . . . . . . . . . 100.00 41.2 (0.67) 58.8 (0.67) 31.2 (0.53) 27.7 (0.56) 4 times poverty level or more . . . . . . . . . . . . . . . . . . . 100.00 28.6 (0.60) 71.4 (0.60) 33.5 (0.58) 37.9 (0.58)
Marital status: Never married . . . . . . . . . . . . . . . . . . . . . . . . . . . . 100.00 42.5 (0.93) 57.5 (0.93) 29.3 (0.80) 28.2 (0.76) Married . . . . . . . . . . . . . . . . . . . . . . . . . . . . . . . . 100.00 38.3 (0.53) 61.7 (0.53) 30.9 (0.44) 30.7 (0.47) Cohabiting . . . . . . . . . . . . . . . . . . . . . . . . . . . . . . 100.00 42.2 (1.68) 57.8 (1.68) 30.3 (1.49) 27.5 (1.47) Divorced or separated . . . . . . . . . . . . . . . . . . . . . . . 100.00 45.5 (0.82) 54.5 (0.82) 29.4 (0.70) 25.1 (0.67) Widowed . . . . . . . . . . . . . . . . . . . . . . . . . . . . . . . 100.00 55.1 (2.81) 44.9 (2.81) 23.6 (2.42) 21.3 (2.14)
Geographic region: Northeast . . . . . . . . . . . . . . . . . . . . . . . . . . . . . . . 100.00 40.0 (0.91) 60.0 (0.91) 29.7 (0.79) 30.3 (0.75) Midwest . . . . . . . . . . . . . . . . . . . . . . . . . . . . . . . . 100.00 35.3 (0.93) 64.7 (0.93) 34.3 (0.64) 30.4 (0.79) South . . . . . . . . . . . . . . . . . . . . . . . . . . . . . . . . . 100.00 47.4 (0.82) 52.6 (0.82) 27.1 (0.56) 25.4 (0.57) West . . . . . . . . . . . . . . . . . . . . . . . . . . . . . . . . . . 100.00 37.1 (0.76) 62.9 (0.76) 30.6 (0.67) 32.3 (0.71)
* Estimates preceded by an asterisk have a relative standard error of greater than 30% and less than or equal to 50%. These should be interpreted with caution as they do not meet the standard of reliability or precision. 1Questions related to leisure-time physical activity were phrased in terms of current behavior and lack a specific reference period. ‘‘Inactive’’ is no light-moderate or vigorous leisure-time physical activity lasting at least 10 minutes; ‘‘At least some’’ is some light-moderate or vigorous leisure-time physical activity lasting at least 10 minutes, regardless of the frequency or duration of the activity; ‘‘Some, less than regular’’ is some light-moderate or vigorous leisure-time physical activity lasting at least 10 minutes but the activity did not meet the definition for regular leisure-time physical activity; ‘‘Regular’’ is vigorous leisure-time physical activity at least three times per week lasting at least 20 minutes each time or light-moderate leisure-time physical activity at least five times per week lasting at least 30 minutes each time or both. 2Any vigorous or light-moderate leisure-time physical activity, regardless of frequency or duration. This category, which is the sum of the categories ‘‘some activity’’ and ‘‘regular actvity,’’ corresponds to the category of the same name shown in earlier editions of this report (1997–1998, 1999–2001, and 2002–2004) with one small difference. In the earlier reports, adults for whom duration information was missing were classified as having engaged in activity. Beginning with the current report, these adults were excluded from the denominator when calculating percentages in order to be consistent with other published estimates. 3Persons of other races and unknown race and ethnicity, unknown education, unknown poverty status, and unknown marital status are included in the total. 4Estimates for age groups are not age adjusted. 5GED is General Educational Development high school equivalency diploma. 6Poverty status is based on family income and family size using the U.S. Census Bureau poverty thresholds for 2004, 2005, and 2006.
NOTES: Unless otherwise specified, estimates are age adjusted using the projected 2000 U.S. population as the standard population and using three age groups: 18–44 years, 45–64 years, and 65 years and over. For crude percentages, refer to Appendix Table XII. Denominator for each percentage excludes persons with unknown leisure-time physical activity status. See Appendix II for definitions of terms. See Appendix III for health behavior questions.
DATA SOURCE: National Health Interview Survey, 2005–2007. Estimates are based on household interviews of a sample of the civilian noninstitutionalized population.

Page 44 [ Series 10, No. 245
Table 5.2. Age-adjusted percent distributions (with standard errors) of times per week engaged in light-moderate leisure-time physical activity for adults 18 years of age and over, by selected characteristics: United States, average annual, 2005–2007
Times per week engaged in light-moderate activity1
Selected characteristic Total None2 Less than 13 1–2 3–4 5 or more
Both sexes Percent distribution (standard error)
Ages 18 years and over (age-adjusted)4 . . . . . . . . . . . . . 100.0 48.4 (0.40) 1.8 (0.06) 14.6 (0.20) 13.3 (0.18) 21.9 (0.26) Ages 18 years and over (crude)4 . . . . . . . . . . . . . . . . . . 100.0 48.4 (0.40) 1.8 (0.06) 14.6 (0.21) 13.3 (0.18) 21.9 (0.26)
Age:5
18–24 years . . . . . . . . . . . . . . . . . . . . . . . . . . . . . 100.0 47.7 (0.86) 1.7 (0.20) 14.6 (0.50) 12.7 (0.50) 23.3 (0.67) 25–44 years . . . . . . . . . . . . . . . . . . . . . . . . . . . . . 100.0 45.6 (0.50) 2.0 (0.10) 16.6 (0.30) 14.7 (0.28) 21.1 (0.35) 45–64 years . . . . . . . . . . . . . . . . . . . . . . . . . . . . . 100.0 47.2 (0.50) 2.0 (0.12) 15.2 (0.32) 13.5 (0.28) 22.1 (0.37) 65–74 years . . . . . . . . . . . . . . . . . . . . . . . . . . . . . 100.0 52.8 (0.81) 1.3 (0.16) 10.4 (0.45) 12.1 (0.44) 23.4 (0.68) 75 years and over . . . . . . . . . . . . . . . . . . . . . . . . . . 100.0 63.5 (0.78) 1.0 (0.14) 7.5 (0.40) 7.6 (0.37) 20.3 (0.61)
Race: White, single race . . . . . . . . . . . . . . . . . . . . . . . . . . 100.0 46.7 (0.44) 1.8 (0.07) 15.2 (0.23) 13.7 (0.20) 22.6 (0.29) Black or African American, single race . . . . . . . . . . . . . 100.0 60.3 (0.71) 1.8 (0.18) 11.0 (0.38) 10.7 (0.36) 16.3 (0.47) American Indian or Alaska Native, single race . . . . . . . . 100.0 46.9 (2.50) *4.5 (1.38) 13.3 (1.92) 12.8 (1.64) 22.6 (2.25) Asian, single race . . . . . . . . . . . . . . . . . . . . . . . . . . 100.0 50.4 (1.09) 1.7 (0.33) 14.2 (0.67) 11.4 (0.79) 22.2 (1.00) Native Hawaiian or Other Pacific Islander, single race. . . . 100.0 52.5 (6.71) † *12.8 (4.11) 15.8 (4.34) 15.2 (4.38) Two or more races . . . . . . . . . . . . . . . . . . . . . . . . . 100.0 45.9 (2.00) 2.0 (0.57) 13.8 (1.29) 14.9 (1.55) 23.3 (1.83)
Black or African American, white . . . . . . . . . . . . . . . 100.0 55.0 (4.64) † 14.1 (3.30) 12.0 (3.26) 17.5 (3.32) American Indian or Alaska Native, white . . . . . . . . . . . 100.0 46.3 (2.91) *1.9 (0.83) 15.2 (2.08) 15.1 (2.29) 21.6 (2.37)
Hispanic or Latino origin and race: Hispanic or Latino . . . . . . . . . . . . . . . . . . . . . . . . . . 100.0 62.3 (0.64) 1.6 (0.16) 10.8 (0.37) 9.7 (0.33) 15.6 (0.46)
Mexican or Mexican American . . . . . . . . . . . . . . . . . 100.0 62.0 (0.82) 1.5 (0.21) 11.4 (0.54) 9.6 (0.40) 15.5 (0.58) Not Hispanic or Latino . . . . . . . . . . . . . . . . . . . . . . . 100.0 46.2 (0.43) 1.8 (0.07) 15.2 (0.23) 13.9 (0.20) 22.9 (0.29)
White, single race . . . . . . . . . . . . . . . . . . . . . . . . 100.0 43.6 (0.48) 1.8 (0.08) 16.1 (0.26) 14.6 (0.23) 24.0 (0.33) Black or African American, single race . . . . . . . . . . . . 100.0 60.2 (0.73) 1.8 (0.18) 11.1 (0.39) 10.7 (0.36) 16.3 (0.48)
Education: Less than high school graduate . . . . . . . . . . . . . . . . . 100.0 67.1 (0.64) 1.5 (0.16) 9.3 (0.35) 6.8 (0.29) 15.3 (0.45) GED diploma6 . . . . . . . . . . . . . . . . . . . . . . . . . . . . 100.0 58.3 (1.39) 2.0 (0.37) 11.7 (0.94) 9.4 (0.75) 18.6 (1.12) High school graduate . . . . . . . . . . . . . . . . . . . . . . . . 100.0 55.2 (0.61) 1.9 (0.13) 12.9 (0.34) 11.0 (0.31) 19.0 (0.41) Some college—no degree . . . . . . . . . . . . . . . . . . . . . 100.0 44.3 (0.62) 2.0 (0.14) 15.9 (0.42) 14.2 (0.38) 23.6 (0.47) Associate of arts degree . . . . . . . . . . . . . . . . . . . . . . 100.0 41.6 (0.75) 1.9 (0.19) 16.3 (0.55) 15.5 (0.53) 24.7 (0.64) Bachelor of arts, science degree . . . . . . . . . . . . . . . . . 100.0 35.3 (0.61) 1.8 (0.15) 18.1 (0.45) 18.2 (0.42) 26.6 (0.54) Masters, doctorate, medical degree . . . . . . . . . . . . . . . 100.0 30.4 (0.73) 1.9 (0.21) 19.3 (0.62) 19.8 (0.64) 28.5 (0.69)
Poverty status:7
Below poverty level . . . . . . . . . . . . . . . . . . . . . . . . . 100.0 64.1 (0.72) 1.3 (0.14) 9.3 (0.35) 7.9 (0.33) 17.5 (0.55) ≥1 and <2 times poverty level . . . . . . . . . . . . . . . . . . 100.0 58.4 (0.67) 1.6 (0.15) 11.8 (0.36) 9.3 (0.33) 18.9 (0.45) ≥2 and <4 times poverty level . . . . . . . . . . . . . . . . . . 100.0 49.2 (0.54) 2.0 (0.13) 14.1 (0.32) 13.2 (0.31) 21.5 (0.41) 4 times poverty level or more . . . . . . . . . . . . . . . . . . . 100.0 38.2 (0.48) 2.0 (0.11) 18.0 (0.36) 16.9 (0.30) 24.9 (0.38)
Marital status: Never married . . . . . . . . . . . . . . . . . . . . . . . . . . . . 100.0 50.6 (0.69) 1.8 (0.20) 13.6 (0.46) 11.9 (0.37) 22.1 (0.51) Married . . . . . . . . . . . . . . . . . . . . . . . . . . . . . . . . 100.0 46.1 (0.46) 1.9 (0.09) 15.7 (0.27) 14.3 (0.25) 21.9 (0.32) Cohabiting . . . . . . . . . . . . . . . . . . . . . . . . . . . . . . 100.0 48.6 (1.17) 2.0 (0.34) 14.2 (0.75) 11.9 (0.70) 23.3 (0.99) Divorced or separated . . . . . . . . . . . . . . . . . . . . . . . 100.0 51.9 (0.66) 1.9 (0.18) 12.8 (0.42) 12.9 (0.42) 20.4 (0.51) Widowed . . . . . . . . . . . . . . . . . . . . . . . . . . . . . . . 100.0 59.4 (2.55) *1.3 (0.42) 11.3 (1.71) 10.5 (1.75) 17.6 (1.64)
Geographic region: Northeast . . . . . . . . . . . . . . . . . . . . . . . . . . . . . . . 100.0 48.5 (0.89) 1.7 (0.17) 15.0 (0.47) 12.4 (0.38) 22.3 (0.54) Midwest . . . . . . . . . . . . . . . . . . . . . . . . . . . . . . . . 100.0 43.3 (0.91) 2.1 (0.14) 17.2 (0.50) 14.0 (0.42) 23.4 (0.61) South . . . . . . . . . . . . . . . . . . . . . . . . . . . . . . . . . 100.0 53.7 (0.67) 1.7 (0.10) 12.6 (0.30) 12.8 (0.29) 19.2 (0.43) West . . . . . . . . . . . . . . . . . . . . . . . . . . . . . . . . . . 100.0 45.0 (0.72) 1.8 (0.12) 14.9 (0.40) 13.9 (0.37) 24.3 (0.54)
Men
Ages 18 years and over (age-adjusted)4 . . . . . . . . . . . . . 100.0 48.9 (0.49) 2.1 (0.10) 15.1 (0.29) 12.3 (0.25) 21.6 (0.34) Ages 18 years and over (crude)4 . . . . . . . . . . . . . . . . . . 100.0 48.7 (0.49) 2.1 (0.10) 15.3 (0.29) 12.3 (0.25) 21.6 (0.34)
Age:5
18–24 years . . . . . . . . . . . . . . . . . . . . . . . . . . . . . 100.0 49.3 (1.21) 1.6 (0.29) 13.8 (0.73) 11.0 (0.71) 24.2 (0.96) 25–44 years . . . . . . . . . . . . . . . . . . . . . . . . . . . . . 100.0 46.9 (0.67) 2.4 (0.16) 17.2 (0.43) 13.4 (0.40) 20.0 (0.48) 45–64 years . . . . . . . . . . . . . . . . . . . . . . . . . . . . . 100.0 48.2 (0.65) 2.2 (0.18) 16.0 (0.45) 12.3 (0.40) 21.3 (0.50) 65–74 years . . . . . . . . . . . . . . . . . . . . . . . . . . . . . 100.0 51.4 (1.10) 1.9 (0.29) 10.7 (0.67) 12.2 (0.68) 23.8 (0.93) 75 years and over . . . . . . . . . . . . . . . . . . . . . . . . . . 100.0 57.5 (1.25) 1.3 (0.27) 8.8 (0.73) 8.6 (0.65) 23.8 (1.02)
See footnotes at end of table.

Series 10, No. 245 [ Page 45
Table 5.2. Age-adjusted percent distributions (with standard errors) of times per week engaged in light-moderate leisure-time physical activity for adults 18 years of age and over, by selected characteristics: United States, average annual, 2005–2007—Con.
Times per week engaged in light-moderate activity1
Selected characteristic Total None2 Less than 13 1–2 3–4 5 or more
Men—Con. Percent distribution (standard error)
Race: White, single race . . . . . . . . . . . . . . . . . . . . . . . . . . 100.0 47.5 (0.55) 2.1 (0.11) 15.7 (0.33) 12.5 (0.28) 22.2 (0.38) Black or African American, single race . . . . . . . . . . . . . 100.0 58.9 (1.00) 2.0 (0.35) 10.7 (0.58) 10.9 (0.57) 17.6 (0.73) American Indian or Alaska Native, single race . . . . . . . . 100.0 49.0 (3.97) *6.2 (2.57) 12.1 (2.83) 10.2 (2.10) 22.5 (2.98) Asian, single race . . . . . . . . . . . . . . . . . . . . . . . . . . 100.0 50.8 (1.50) 1.3 (0.33) 15.9 (1.03) 11.4 (1.11) 20.7 (1.42) Native Hawaiian or Other Pacific Islander, single race. . . . 100.0 49.9 (9.79) † *11.0 (5.03) *18.4 (5.99) *13.9 (5.19) Two or more races . . . . . . . . . . . . . . . . . . . . . . . . . 100.0 48.3 (2.92) *2.8 (1.13) 14.9 (1.93) 14.1 (2.27) 20.0 (2.24)
Black or African American, white . . . . . . . . . . . . . . . 100.0 61.7 (6.92) † *13.9 (5.32) † 16.1 (4.56) American Indian or Alaska Native, white . . . . . . . . . . . 100.0 47.4 (4.04) † 17.0 (3.14) 15.9 (3.45) 17.2 (2.95)
Hispanic or Latino origin and race: Hispanic or Latino . . . . . . . . . . . . . . . . . . . . . . . . . . 100.0 62.3 (0.91) 1.8 (0.26) 10.8 (0.55) 9.4 (0.51) 15.7 (0.69)
Mexican or Mexican American . . . . . . . . . . . . . . . . . 100.0 62.9 (1.17) 1.8 (0.34) 11.3 (0.78) 9.0 (0.61) 14.8 (0.83) Not Hispanic or Latino . . . . . . . . . . . . . . . . . . . . . . . 100.0 46.5 (0.54) 2.2 (0.11) 15.9 (0.32) 12.8 (0.28) 22.7 (0.37)
White, single race . . . . . . . . . . . . . . . . . . . . . . . . 100.0 44.3 (0.61) 2.2 (0.12) 16.7 (0.37) 13.2 (0.32) 23.5 (0.42) Black or African American, single race . . . . . . . . . . . . 100.0 58.8 (1.01) 2.0 (0.36) 10.8 (0.60) 10.9 (0.58) 17.5 (0.75)
Education: Less than high school graduate . . . . . . . . . . . . . . . . . 100.0 67.0 (0.90) 1.9 (0.23) 9.4 (0.51) 6.2 (0.38) 15.5 (0.67) GED diploma6 . . . . . . . . . . . . . . . . . . . . . . . . . . . . 100.0 54.4 (2.12) 2.4 (0.64) 13.7 (1.53) 9.3 (1.08) 20.1 (1.77) High school graduate . . . . . . . . . . . . . . . . . . . . . . . . 100.0 55.8 (0.80) 2.1 (0.20) 13.4 (0.48) 10.2 (0.46) 18.6 (0.56) Some college—no degree . . . . . . . . . . . . . . . . . . . . . 100.0 45.1 (0.86) 2.3 (0.22) 16.3 (0.62) 13.3 (0.57) 23.1 (0.70) Associate of arts degree . . . . . . . . . . . . . . . . . . . . . . 100.0 42.4 (1.17) 2.1 (0.30) 16.6 (0.86) 13.7 (0.75) 25.2 (0.98) Bachelor of arts, science degree . . . . . . . . . . . . . . . . . 100.0 35.5 (0.82) 2.1 (0.23) 19.0 (0.65) 17.0 (0.60) 26.3 (0.73) Masters, doctorate, medical degree . . . . . . . . . . . . . . . 100.0 31.1 (1.06) 2.5 (0.37) 20.6 (0.93) 18.4 (0.93) 27.4 (1.03)
Poverty status:7
Below poverty level . . . . . . . . . . . . . . . . . . . . . . . . . 100.0 64.1 (1.12) 1.5 (0.27) 9.1 (0.56) 7.4 (0.52) 18.0 (0.93) ≥1 and <2 times poverty level . . . . . . . . . . . . . . . . . . 100.0 59.2 (1.07) 1.7 (0.19) 11.6 (0.61) 8.4 (0.51) 19.1 (0.68) ≥2 and <4 times poverty level . . . . . . . . . . . . . . . . . . 100.0 50.7 (0.73) 2.3 (0.19) 14.0 (0.44) 12.0 (0.45) 20.9 (0.57) 4 times poverty level or more . . . . . . . . . . . . . . . . . . . 100.0 39.2 (0.62) 2.3 (0.16) 18.9 (0.52) 15.4 (0.39) 24.1 (0.52)
Marital status: Never married . . . . . . . . . . . . . . . . . . . . . . . . . . . . 100.0 50.8 (0.92) 1.8 (0.21) 13.0 (0.57) 11.1 (0.55) 23.3 (0.74) Married . . . . . . . . . . . . . . . . . . . . . . . . . . . . . . . . 100.0 47.3 (0.60) 2.3 (0.14) 16.7 (0.40) 12.8 (0.33) 20.8 (0.44) Cohabiting . . . . . . . . . . . . . . . . . . . . . . . . . . . . . . 100.0 49.1 (1.58) 2.3 (0.49) 13.5 (1.01) 11.6 (1.05) 23.5 (1.30) Divorced or separated . . . . . . . . . . . . . . . . . . . . . . . 100.0 52.1 (1.00) 2.2 (0.27) 12.5 (0.68) 12.6 (0.69) 20.6 (0.74) Widowed . . . . . . . . . . . . . . . . . . . . . . . . . . . . . . . 100.0 60.1 (5.93) *0.4 (0.20) 21.4 (5.49) 6.5 (1.87) 11.6 (1.73)
Geographic region: Northeast . . . . . . . . . . . . . . . . . . . . . . . . . . . . . . . 100.0 48.0 (1.08) 1.9 (0.23) 16.0 (0.67) 11.8 (0.57) 22.3 (0.76) Midwest . . . . . . . . . . . . . . . . . . . . . . . . . . . . . . . . 100.0 44.3 (1.19) 2.7 (0.23) 17.1 (0.71) 12.6 (0.56) 23.3 (0.79) South . . . . . . . . . . . . . . . . . . . . . . . . . . . . . . . . . 100.0 54.1 (0.80) 1.9 (0.16) 13.1 (0.42) 11.8 (0.41) 19.0 (0.55) West . . . . . . . . . . . . . . . . . . . . . . . . . . . . . . . . . . 100.0 46.0 (0.88) 2.0 (0.18) 15.5 (0.53) 12.9 (0.49) 23.5 (0.67)
Women
Ages 18 years and over (age-adjusted)4 . . . . . . . . . . . . . 100.0 47.9 (0.44) 1.5 (0.08) 14.2 (0.23) 14.3 (0.24) 22.2 (0.31) Ages 18 years and over (crude)4 . . . . . . . . . . . . . . . . . . 100.0 48.1 (0.44) 1.5 (0.08) 14.1 (0.23) 14.2 (0.23) 22.2 (0.31)
Age:5
18–24 years . . . . . . . . . . . . . . . . . . . . . . . . . . . . . 100.0 46.2 (1.08) 1.8 (0.27) 15.3 (0.69) 14.3 (0.70) 22.4 (0.84) 25–44 years . . . . . . . . . . . . . . . . . . . . . . . . . . . . . 100.0 44.2 (0.57) 1.6 (0.12) 16.0 (0.38) 16.0 (0.37) 22.2 (0.46) 45–64 years . . . . . . . . . . . . . . . . . . . . . . . . . . . . . 100.0 46.2 (0.61) 1.8 (0.15) 14.5 (0.39) 14.6 (0.37) 22.9 (0.46) 65–74 years . . . . . . . . . . . . . . . . . . . . . . . . . . . . . 100.0 53.9 (1.02) 0.9 (0.16) 10.1 (0.59) 12.1 (0.56) 23.0 (0.85) 75 years and over . . . . . . . . . . . . . . . . . . . . . . . . . . 100.0 67.4 (0.88) 0.8 (0.15) 6.7 (0.43) 6.9 (0.44) 18.1 (0.71)
Race: White, single race . . . . . . . . . . . . . . . . . . . . . . . . . . 100.0 45.7 (0.48) 1.5 (0.09) 14.8 (0.27) 15.0 (0.27) 23.1 (0.35) Black or African American, single race . . . . . . . . . . . . . 100.0 61.4 (0.85) 1.6 (0.17) 11.2 (0.47) 10.5 (0.44) 15.3 (0.59) American Indian or Alaska Native, single race . . . . . . . . 100.0 44.6 (3.25) *2.8 (1.12) 14.7 (2.18) 15.8 (2.55) 22.1 (2.61) Asian, single race . . . . . . . . . . . . . . . . . . . . . . . . . . 100.0 50.2 (1.51) 2.0 (0.55) 12.6 (0.86) 11.5 (0.94) 23.6 (1.25) Native Hawaiian or Other Pacific Islander, single race. . . . 100.0 56.7 (7.54) – *14.5 (5.47) *10.6 (4.34) *18.1 (8.77) Two or more races . . . . . . . . . . . . . . . . . . . . . . . . . 100.0 44.0 (2.45) *1.5 (0.58) 12.7 (1.72) 15.5 (1.88) 26.3 (2.56)
Black or African American, white . . . . . . . . . . . . . . . 100.0 51.5 (6.03) † 14.0 (3.53) *15.9 (4.81) 17.8 (4.71) American Indian or Alaska Native, white . . . . . . . . . . . 100.0 45.2 (3.83) † 12.8 (2.56) 14.0 (2.77) 26.4 (3.56)
See footnotes at end of table.

Page 46 [ Series 10, No. 245
Table 5.2. Age-adjusted percent distributions (with standard errors) of times per week engaged in light-moderate leisure-time physical activity for adults 18 years of age and over, by selected characteristics: United States, average annual, 2005–2007—Con.
Times per week engaged in light-moderate activity1
Selected characteristic Total None2 Less than 13 1–2 3–4 5 or more
Women—Con. Percent distribution (standard error)
Hispanic or Latino origin and race: Hispanic or Latino . . . . . . . . . . . . . . . . . . . . . . . . . . 100.0 62.0 (0.78) 1.3 (0.18) 10.8 (0.48) 10.2 (0.43) 15.7 (0.56)
Mexican or Mexican American . . . . . . . . . . . . . . . . . 100.0 60.7 (1.04) 1.2 (0.21) 11.4 (0.69) 10.3 (0.56) 16.5 (0.77) Not Hispanic or Latino . . . . . . . . . . . . . . . . . . . . . . . 100.0 45.8 (0.48) 1.6 (0.08) 14.7 (0.26) 14.9 (0.26) 23.1 (0.35)
White, single race . . . . . . . . . . . . . . . . . . . . . . . . 100.0 42.7 (0.53) 1.5 (0.10) 15.5 (0.30) 15.8 (0.31) 24.4 (0.40) Black or African American, single race . . . . . . . . . . . . 100.0 61.2 (0.87) 1.6 (0.17) 11.3 (0.48) 10.6 (0.45) 15.3 (0.60)
Education: Less than high school graduate . . . . . . . . . . . . . . . . . 100.0 67.0 (0.75) 1.2 (0.21) 9.3 (0.44) 7.4 (0.41) 15.2 (0.55) GED diploma6 . . . . . . . . . . . . . . . . . . . . . . . . . . . . 100.0 62.4 (1.75) 1.5 (0.38) 9.5 (1.01) 9.6 (1.07) 17.0 (1.32) High school graduate . . . . . . . . . . . . . . . . . . . . . . . . 100.0 54.5 (0.71) 1.6 (0.15) 12.4 (0.43) 11.8 (0.40) 19.6 (0.53) Some college—no degree . . . . . . . . . . . . . . . . . . . . . 100.0 43.5 (0.75) 1.8 (0.19) 15.6 (0.53) 15.0 (0.50) 24.0 (0.58) Associate of arts degree . . . . . . . . . . . . . . . . . . . . . . 100.0 40.8 (0.92) 1.7 (0.24) 16.1 (0.68) 16.9 (0.71) 24.5 (0.82) Bachelor of arts, science degree . . . . . . . . . . . . . . . . . 100.0 35.1 (0.79) 1.4 (0.19) 17.3 (0.58) 19.3 (0.59) 26.9 (0.71) Masters, doctorate, medical degree . . . . . . . . . . . . . . . 100.0 29.9 (1.00) 1.4 (0.24) 18.0 (0.85) 21.0 (0.86) 29.7 (0.96)
Poverty status:7
Below poverty level . . . . . . . . . . . . . . . . . . . . . . . . . 100.0 64.1 (0.78) 1.1 (0.13) 9.4 (0.43) 8.2 (0.41) 17.3 (0.60) ≥1 and <2 times poverty level . . . . . . . . . . . . . . . . . . 100.0 57.5 (0.78) 1.6 (0.21) 11.9 (0.46) 10.1 (0.41) 18.9 (0.56) ≥2 and <4 times poverty level . . . . . . . . . . . . . . . . . . 100.0 47.7 (0.64) 1.6 (0.16) 14.3 (0.42) 14.4 (0.40) 22.0 (0.52) 4 times poverty level or more . . . . . . . . . . . . . . . . . . . 100.0 37.0 (0.61) 1.6 (0.14) 17.1 (0.43) 18.5 (0.44) 25.8 (0.51)
Marital status: Never married . . . . . . . . . . . . . . . . . . . . . . . . . . . . 100.0 50.0 (0.92) 1.8 (0.33) 14.1 (0.63) 12.8 (0.52) 21.2 (0.71) Married . . . . . . . . . . . . . . . . . . . . . . . . . . . . . . . . 100.0 45.1 (0.53) 1.5 (0.10) 14.7 (0.32) 15.7 (0.33) 23.0 (0.40) Cohabiting . . . . . . . . . . . . . . . . . . . . . . . . . . . . . . 100.0 48.4 (1.70) 1.7 (0.45) 14.9 (1.04) 11.9 (0.90) 23.1 (1.48) Divorced or separated . . . . . . . . . . . . . . . . . . . . . . . 100.0 51.8 (0.82) 1.7 (0.24) 13.1 (0.52) 13.1 (0.52) 20.4 (0.68) Widowed . . . . . . . . . . . . . . . . . . . . . . . . . . . . . . . 100.0 59.2 (2.77) *1.5 (0.53) 8.4 (1.45) 11.6 (2.13) 19.3 (1.99)
Geographic region: Northeast . . . . . . . . . . . . . . . . . . . . . . . . . . . . . . . 100.0 48.8 (1.00) 1.5 (0.22) 14.1 (0.56) 13.0 (0.51) 22.5 (0.74) Midwest . . . . . . . . . . . . . . . . . . . . . . . . . . . . . . . . 100.0 42.2 (0.88) 1.5 (0.14) 17.4 (0.51) 15.4 (0.53) 23.5 (0.67) South . . . . . . . . . . . . . . . . . . . . . . . . . . . . . . . . . 100.0 53.3 (0.77) 1.5 (0.12) 12.1 (0.35) 13.7 (0.39) 19.5 (0.49) West . . . . . . . . . . . . . . . . . . . . . . . . . . . . . . . . . . 100.0 43.9 (0.82) 1.7 (0.16) 14.3 (0.49) 15.0 (0.49) 25.2 (0.67)
* Estimates preceded by an asterisk have a relative standard error of greater than 30% and less than or equal to 50%. These should be interpreted with caution as they do not meet the standard of reliability or precision.
† Estimates with a relative standard error greater than 50% are indicated with a dagger, but are not shown.
– Qunatity zero. 1Light-moderate activity refers to leisure-time physical activities that cause only light sweating or a light to moderate increase in breathing or heart rate and are done for at least 10 minutes per episode. 2‘‘None’’ may include individuals who engaged in only vigorous activity. 3‘‘Less than 1’’ refers to frequencies of light-moderate activities lasting 10 minutes per episode that occurred less than one time per week (for example, three times per month.) 4Persons of other races and unknown race and ethnicity, unknown education, unknown poverty status, and unknown marital status are included in the total. 5Estimates for age groups are not age adjusted. 6GED is General Educational Development high school equivalency diploma. 7Poverty status is based on family income and family size using the U.S. Census Bureau poverty thresholds for 2004, 2005, and 2006.
NOTES: Unless otherwise specified, estimates are age adjusted using the projected 2000 U.S. population as the standard population and using three age groups: 18–44 years, 45–64 years, and 65 years and over. For crude percent distributions, refer to Appendix Table XIII. Denominator for each percent distribution excludes persons with unknown light-moderate leisure-time physical activity status. See Appendix II for definitions of terms. See Appendix III for health behavior questions.
DATA SOURCE: National Health Interview Survey, 2005–2007. Estimates are based on household interviews of a sample of the civilian noninstitutionalized population.
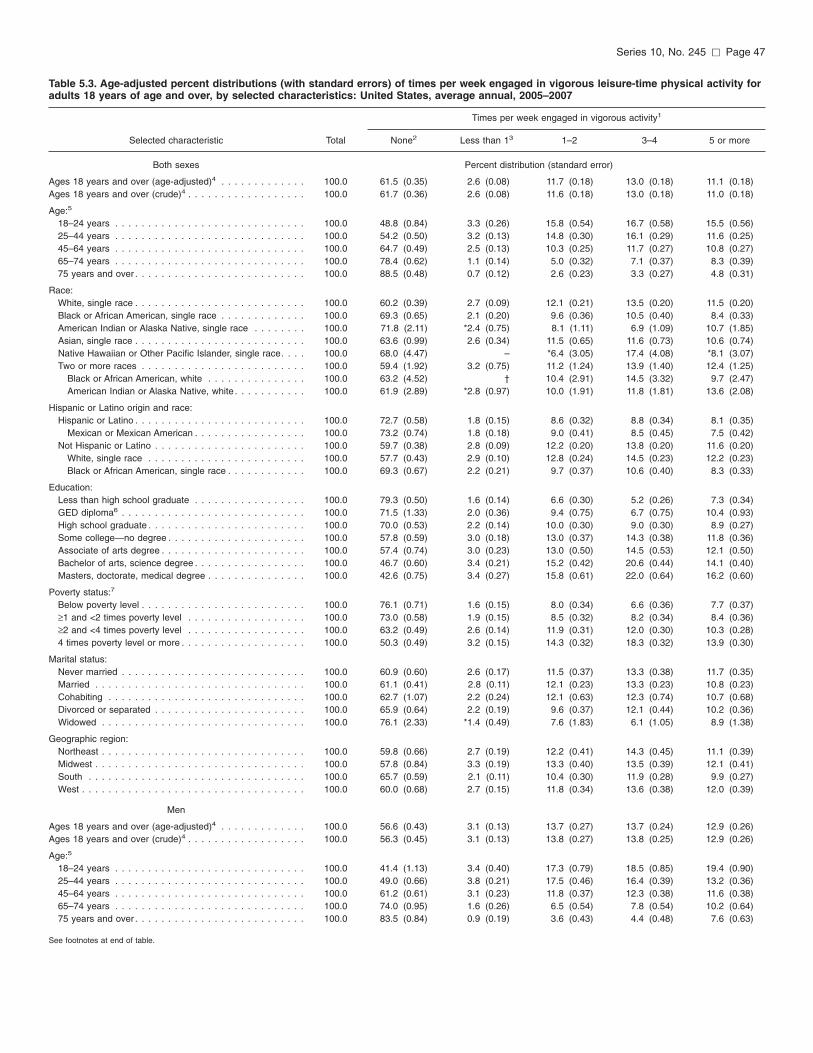
Series 10, No. 245 [ Page 47
Table 5.3. Age-adjusted percent distributions (with standard errors) of times per week engaged in vigorous leisure-time physical activity for adults 18 years of age and over, by selected characteristics: United States, average annual, 2005–2007
Times per week engaged in vigorous activity1
Selected characteristic Total None2 Less than 13 1–2 3–4 5 or more
Both sexes Percent distribution (standard error)
Ages 18 years and over (age-adjusted)4 . . . . . . . . . . . . . 100.0 61.5 (0.35) 2.6 (0.08) 11.7 (0.18) 13.0 (0.18) 11.1 (0.18) Ages 18 years and over (crude)4 . . . . . . . . . . . . . . . . . . 100.0 61.7 (0.36) 2.6 (0.08) 11.6 (0.18) 13.0 (0.18) 11.0 (0.18)
Age:5
18–24 years . . . . . . . . . . . . . . . . . . . . . . . . . . . . . 100.0 48.8 (0.84) 3.3 (0.26) 15.8 (0.54) 16.7 (0.58) 15.5 (0.56) 25–44 years . . . . . . . . . . . . . . . . . . . . . . . . . . . . . 100.0 54.2 (0.50) 3.2 (0.13) 14.8 (0.30) 16.1 (0.29) 11.6 (0.25) 45–64 years . . . . . . . . . . . . . . . . . . . . . . . . . . . . . 100.0 64.7 (0.49) 2.5 (0.13) 10.3 (0.25) 11.7 (0.27) 10.8 (0.27) 65–74 years . . . . . . . . . . . . . . . . . . . . . . . . . . . . . 100.0 78.4 (0.62) 1.1 (0.14) 5.0 (0.32) 7.1 (0.37) 8.3 (0.39) 75 years and over . . . . . . . . . . . . . . . . . . . . . . . . . . 100.0 88.5 (0.48) 0.7 (0.12) 2.6 (0.23) 3.3 (0.27) 4.8 (0.31)
Race: White, single race . . . . . . . . . . . . . . . . . . . . . . . . . . 100.0 60.2 (0.39) 2.7 (0.09) 12.1 (0.21) 13.5 (0.20) 11.5 (0.20) Black or African American, single race . . . . . . . . . . . . . 100.0 69.3 (0.65) 2.1 (0.20) 9.6 (0.36) 10.5 (0.40) 8.4 (0.33) American Indian or Alaska Native, single race . . . . . . . . 100.0 71.8 (2.11) *2.4 (0.75) 8.1 (1.11) 6.9 (1.09) 10.7 (1.85) Asian, single race . . . . . . . . . . . . . . . . . . . . . . . . . . 100.0 63.6 (0.99) 2.6 (0.34) 11.5 (0.65) 11.6 (0.73) 10.6 (0.74) Native Hawaiian or Other Pacific Islander, single race. . . . 100.0 68.0 (4.47) – *6.4 (3.05) 17.4 (4.08) *8.1 (3.07) Two or more races . . . . . . . . . . . . . . . . . . . . . . . . . 100.0 59.4 (1.92) 3.2 (0.75) 11.2 (1.24) 13.9 (1.40) 12.4 (1.25)
Black or African American, white . . . . . . . . . . . . . . . 100.0 63.2 (4.52) † 10.4 (2.91) 14.5 (3.32) 9.7 (2.47) American Indian or Alaska Native, white . . . . . . . . . . . 100.0 61.9 (2.89) *2.8 (0.97) 10.0 (1.91) 11.8 (1.81) 13.6 (2.08)
Hispanic or Latino origin and race: Hispanic or Latino . . . . . . . . . . . . . . . . . . . . . . . . . . 100.0 72.7 (0.58) 1.8 (0.15) 8.6 (0.32) 8.8 (0.34) 8.1 (0.35)
Mexican or Mexican American . . . . . . . . . . . . . . . . . 100.0 73.2 (0.74) 1.8 (0.18) 9.0 (0.41) 8.5 (0.45) 7.5 (0.42) Not Hispanic or Latino . . . . . . . . . . . . . . . . . . . . . . . 100.0 59.7 (0.38) 2.8 (0.09) 12.2 (0.20) 13.8 (0.20) 11.6 (0.20)
White, single race . . . . . . . . . . . . . . . . . . . . . . . . 100.0 57.7 (0.43) 2.9 (0.10) 12.8 (0.24) 14.5 (0.23) 12.2 (0.23) Black or African American, single race . . . . . . . . . . . . 100.0 69.3 (0.67) 2.2 (0.21) 9.7 (0.37) 10.6 (0.40) 8.3 (0.33)
Education: Less than high school graduate . . . . . . . . . . . . . . . . . 100.0 79.3 (0.50) 1.6 (0.14) 6.6 (0.30) 5.2 (0.26) 7.3 (0.34) GED diploma6 . . . . . . . . . . . . . . . . . . . . . . . . . . . . 100.0 71.5 (1.33) 2.0 (0.36) 9.4 (0.75) 6.7 (0.75) 10.4 (0.93) High school graduate . . . . . . . . . . . . . . . . . . . . . . . . 100.0 70.0 (0.53) 2.2 (0.14) 10.0 (0.30) 9.0 (0.30) 8.9 (0.27) Some college—no degree . . . . . . . . . . . . . . . . . . . . . 100.0 57.8 (0.59) 3.0 (0.18) 13.0 (0.37) 14.3 (0.38) 11.8 (0.36) Associate of arts degree . . . . . . . . . . . . . . . . . . . . . . 100.0 57.4 (0.74) 3.0 (0.23) 13.0 (0.50) 14.5 (0.53) 12.1 (0.50) Bachelor of arts, science degree . . . . . . . . . . . . . . . . . 100.0 46.7 (0.60) 3.4 (0.21) 15.2 (0.42) 20.6 (0.44) 14.1 (0.40) Masters, doctorate, medical degree . . . . . . . . . . . . . . . 100.0 42.6 (0.75) 3.4 (0.27) 15.8 (0.61) 22.0 (0.64) 16.2 (0.60)
Poverty status:7
Below poverty level . . . . . . . . . . . . . . . . . . . . . . . . . 100.0 76.1 (0.71) 1.6 (0.15) 8.0 (0.34) 6.6 (0.36) 7.7 (0.37) ≥1 and <2 times poverty level . . . . . . . . . . . . . . . . . . 100.0 73.0 (0.58) 1.9 (0.15) 8.5 (0.32) 8.2 (0.34) 8.4 (0.36) ≥2 and <4 times poverty level . . . . . . . . . . . . . . . . . . 100.0 63.2 (0.49) 2.6 (0.14) 11.9 (0.31) 12.0 (0.30) 10.3 (0.28) 4 times poverty level or more . . . . . . . . . . . . . . . . . . . 100.0 50.3 (0.49) 3.2 (0.15) 14.3 (0.32) 18.3 (0.32) 13.9 (0.30)
Marital status: Never married . . . . . . . . . . . . . . . . . . . . . . . . . . . . 100.0 60.9 (0.60) 2.6 (0.17) 11.5 (0.37) 13.3 (0.38) 11.7 (0.35) Married . . . . . . . . . . . . . . . . . . . . . . . . . . . . . . . . 100.0 61.1 (0.41) 2.8 (0.11) 12.1 (0.23) 13.3 (0.23) 10.8 (0.23) Cohabiting . . . . . . . . . . . . . . . . . . . . . . . . . . . . . . 100.0 62.7 (1.07) 2.2 (0.24) 12.1 (0.63) 12.3 (0.74) 10.7 (0.68) Divorced or separated . . . . . . . . . . . . . . . . . . . . . . . 100.0 65.9 (0.64) 2.2 (0.19) 9.6 (0.37) 12.1 (0.44) 10.2 (0.36) Widowed . . . . . . . . . . . . . . . . . . . . . . . . . . . . . . . 100.0 76.1 (2.33) *1.4 (0.49) 7.6 (1.83) 6.1 (1.05) 8.9 (1.38)
Geographic region: Northeast . . . . . . . . . . . . . . . . . . . . . . . . . . . . . . . 100.0 59.8 (0.66) 2.7 (0.19) 12.2 (0.41) 14.3 (0.45) 11.1 (0.39) Midwest . . . . . . . . . . . . . . . . . . . . . . . . . . . . . . . . 100.0 57.8 (0.84) 3.3 (0.19) 13.3 (0.40) 13.5 (0.39) 12.1 (0.41) South . . . . . . . . . . . . . . . . . . . . . . . . . . . . . . . . . 100.0 65.7 (0.59) 2.1 (0.11) 10.4 (0.30) 11.9 (0.28) 9.9 (0.27) West . . . . . . . . . . . . . . . . . . . . . . . . . . . . . . . . . . 100.0 60.0 (0.68) 2.7 (0.15) 11.8 (0.34) 13.6 (0.38) 12.0 (0.39)
Men
Ages 18 years and over (age-adjusted)4 . . . . . . . . . . . . . 100.0 56.6 (0.43) 3.1 (0.13) 13.7 (0.27) 13.7 (0.24) 12.9 (0.26) Ages 18 years and over (crude)4 . . . . . . . . . . . . . . . . . . 100.0 56.3 (0.45) 3.1 (0.13) 13.8 (0.27) 13.8 (0.25) 12.9 (0.26)
Age:5
18–24 years . . . . . . . . . . . . . . . . . . . . . . . . . . . . . 100.0 41.4 (1.13) 3.4 (0.40) 17.3 (0.79) 18.5 (0.85) 19.4 (0.90) 25–44 years . . . . . . . . . . . . . . . . . . . . . . . . . . . . . 100.0 49.0 (0.66) 3.8 (0.21) 17.5 (0.46) 16.4 (0.39) 13.2 (0.36) 45–64 years . . . . . . . . . . . . . . . . . . . . . . . . . . . . . 100.0 61.2 (0.61) 3.1 (0.23) 11.8 (0.37) 12.3 (0.38) 11.6 (0.38) 65–74 years . . . . . . . . . . . . . . . . . . . . . . . . . . . . . 100.0 74.0 (0.95) 1.6 (0.26) 6.5 (0.54) 7.8 (0.54) 10.2 (0.64) 75 years and over . . . . . . . . . . . . . . . . . . . . . . . . . . 100.0 83.5 (0.84) 0.9 (0.19) 3.6 (0.43) 4.4 (0.48) 7.6 (0.63)
See footnotes at end of table.

Page 48 [ Series 10, No. 245
Table 5.3. Age-adjusted percent distributions (with standard errors) of times per week engaged in vigorous leisure-time physical activity for adults 18 years of age and over, by selected characteristics: United States, average annual, 2005–2007—Con.
Times per week engaged in vigorous activity1
Selected characteristic Total None2 Less than 13 1–2 3–4 5 or more
Men Percent distribution (standard error) Race:
White, single race . . . . . . . . . . . . . . . . . . . . . . . . . . 100.0 55.9 (0.48) 3.2 (0.14) 14.0 (0.31) 13.8 (0.27) 13.1 (0.29) Black or African American, single race . . . . . . . . . . . . . 100.0 61.4 (0.98) 2.5 (0.38) 11.4 (0.59) 13.2 (0.69) 11.4 (0.58) American Indian or Alaska Native, single race . . . . . . . . 100.0 67.6 (3.27) *3.8 (1.47) 8.9 (1.70) 7.8 (1.67) 12.0 (3.10) Asian, single race . . . . . . . . . . . . . . . . . . . . . . . . . . 100.0 56.8 (1.47) 2.8 (0.56) 14.3 (1.04) 14.1 (1.16) 12.0 (1.32) Native Hawaiian or Other Pacific Islander, single race. . . . 100.0 68.8 (6.69) – † *15.5 (5.29) † Two or more races . . . . . . . . . . . . . . . . . . . . . . . . . 100.0 56.3 (2.76) 4.6 (1.35) 12.9 (1.98) 13.9 (1.82) 12.3 (1.81)
Black or African American, white . . . . . . . . . . . . . . . 100.0 62.4 (6.79) † *10.1 (4.78) *15.1 (4.92) *10.1 (3.73) American Indian or Alaska Native, white . . . . . . . . . . . 100.0 58.6 (4.05) *4.6 (1.77) 11.4 (2.92) 12.8 (2.49) 12.5 (2.62)
Hispanic or Latino origin and race: Hispanic or Latino . . . . . . . . . . . . . . . . . . . . . . . . . . 100.0 67.4 (0.83) 2.2 (0.25) 10.9 (0.51) 10.2 (0.51) 9.4 (0.59)
Mexican or Mexican American . . . . . . . . . . . . . . . . . 100.0 68.1 (1.03) 2.0 (0.28) 11.2 (0.65) 10.3 (0.67) 8.4 (0.63) Not Hispanic or Latino . . . . . . . . . . . . . . . . . . . . . . . 100.0 54.7 (0.48) 3.3 (0.14) 14.2 (0.30) 14.4 (0.27) 13.5 (0.29)
White, single race . . . . . . . . . . . . . . . . . . . . . . . . 100.0 53.4 (0.54) 3.3 (0.15) 14.6 (0.36) 14.6 (0.31) 14.0 (0.33) Black or African American, single race . . . . . . . . . . . . 100.0 61.4 (1.01) 2.6 (0.39) 11.5 (0.61) 13.2 (0.71) 11.3 (0.59)
Education: Less than high school graduate . . . . . . . . . . . . . . . . . 100.0 74.5 (0.77) 2.2 (0.24) 8.2 (0.47) 6.2 (0.40) 9.0 (0.56) GED diploma6 . . . . . . . . . . . . . . . . . . . . . . . . . . . . 100.0 63.8 (2.02) 2.4 (0.56) 12.0 (1.23) 8.3 (1.22) 13.5 (1.56) High school graduate . . . . . . . . . . . . . . . . . . . . . . . . 100.0 65.5 (0.70) 2.8 (0.23) 11.6 (0.46) 9.7 (0.40) 10.4 (0.41) Some college—no degree . . . . . . . . . . . . . . . . . . . . . 100.0 52.4 (0.83) 3.4 (0.29) 15.3 (0.57) 14.9 (0.56) 14.0 (0.57) Associate of arts degree . . . . . . . . . . . . . . . . . . . . . . 100.0 51.6 (1.13) 3.3 (0.35) 15.7 (0.87) 15.4 (0.82) 14.0 (0.78) Bachelor of arts, science degree . . . . . . . . . . . . . . . . . 100.0 41.4 (0.80) 4.0 (0.34) 17.3 (0.63) 21.2 (0.62) 16.0 (0.61) Masters, doctorate, medical degree . . . . . . . . . . . . . . . 100.0 37.5 (1.03) 3.7 (0.42) 18.7 (0.95) 22.3 (0.94) 17.8 (0.92)
Poverty status:7
Below poverty level . . . . . . . . . . . . . . . . . . . . . . . . . 100.0 71.3 (1.00) 1.9 (0.28) 9.6 (0.57) 7.5 (0.53) 9.6 (0.63) ≥1 and <2 times poverty level . . . . . . . . . . . . . . . . . . 100.0 69.3 (0.86) 2.3 (0.24) 9.8 (0.50) 8.9 (0.50) 9.7 (0.59) ≥2 and <4 times poverty level . . . . . . . . . . . . . . . . . . 100.0 59.2 (0.65) 3.0 (0.22) 13.6 (0.47) 12.4 (0.40) 11.8 (0.44) 4 times poverty level or more . . . . . . . . . . . . . . . . . . . 100.0 45.8 (0.59) 3.7 (0.22) 16.3 (0.45) 18.4 (0.41) 15.8 (0.43)
Marital status: Never married . . . . . . . . . . . . . . . . . . . . . . . . . . . . 100.0 57.8 (0.79) 2.7 (0.26) 11.7 (0.45) 14.1 (0.52) 13.7 (0.53) Married . . . . . . . . . . . . . . . . . . . . . . . . . . . . . . . . 100.0 57.0 (0.53) 3.4 (0.18) 14.7 (0.38) 13.2 (0.31) 11.7 (0.33) Cohabiting . . . . . . . . . . . . . . . . . . . . . . . . . . . . . . 100.0 58.5 (1.45) 2.6 (0.38) 13.0 (0.86) 13.3 (1.07) 12.5 (1.01) Divorced or separated . . . . . . . . . . . . . . . . . . . . . . . 100.0 58.5 (0.99) 2.9 (0.34) 10.9 (0.62) 14.6 (0.77) 13.1 (0.66) Widowed . . . . . . . . . . . . . . . . . . . . . . . . . . . . . . . 100.0 69.3 (6.30) *0.7 (0.22) *18.8 (6.30) 3.2 (0.56) 8.1 (2.18)
Geographic region: Northeast . . . . . . . . . . . . . . . . . . . . . . . . . . . . . . . 100.0 53.8 (0.88) 3.5 (0.31) 14.8 (0.66) 15.2 (0.65) 12.8 (0.59) Midwest . . . . . . . . . . . . . . . . . . . . . . . . . . . . . . . . 100.0 53.6 (0.99) 3.9 (0.32) 14.6 (0.60) 13.7 (0.48) 14.2 (0.57) South . . . . . . . . . . . . . . . . . . . . . . . . . . . . . . . . . 100.0 60.5 (0.73) 2.4 (0.19) 12.6 (0.44) 12.8 (0.38) 11.7 (0.40) West . . . . . . . . . . . . . . . . . . . . . . . . . . . . . . . . . . 100.0 55.6 (0.87) 3.1 (0.23) 13.6 (0.53) 14.2 (0.50) 13.5 (0.58)
Women
Ages 18 years and over (age-adjusted)4 . . . . . . . . . . . . . 100.0 66.1 (0.39) 2.2 (0.09) 9.9 (0.20) 12.4 (0.23) 9.4 (0.20) Ages 18 years and over (crude)4 . . . . . . . . . . . . . . . . . . 100.0 66.7 (0.39) 2.1 (0.09) 9.7 (0.20) 12.1 (0.23) 9.3 (0.20)
Age:5
18–24 years . . . . . . . . . . . . . . . . . . . . . . . . . . . . . 100.0 56.1 (1.09) 3.2 (0.33) 14.2 (0.77) 14.9 (0.72) 11.6 (0.65) 25–44 years . . . . . . . . . . . . . . . . . . . . . . . . . . . . . 100.0 59.3 (0.56) 2.7 (0.16) 12.1 (0.32) 15.9 (0.41) 10.1 (0.30) 45–64 years . . . . . . . . . . . . . . . . . . . . . . . . . . . . . 100.0 68.0 (0.60) 2.0 (0.14) 8.9 (0.34) 11.1 (0.34) 10.0 (0.35) 65–74 years . . . . . . . . . . . . . . . . . . . . . . . . . . . . . 100.0 82.1 (0.71) 0.8 (0.15) 3.8 (0.35) 6.6 (0.48) 6.7 (0.46) 75 years and over . . . . . . . . . . . . . . . . . . . . . . . . . . 100.0 91.6 (0.51) 0.6 (0.15) 2.0 (0.23) 2.7 (0.29) 3.1 (0.31)
Race: White, single race . . . . . . . . . . . . . . . . . . . . . . . . . . 100.0 64.3 (0.44) 2.2 (0.11) 10.3 (0.23) 13.3 (0.27) 9.9 (0.23) Black or African American, single race . . . . . . . . . . . . . 100.0 75.8 (0.67) 1.8 (0.18) 8.0 (0.42) 8.3 (0.39) 6.0 (0.34) American Indian or Alaska Native, single race . . . . . . . . 100.0 75.2 (2.80) *1.2 (0.55) 7.5 (1.44) 6.2 (1.43) 9.9 (2.09) Asian, single race . . . . . . . . . . . . . . . . . . . . . . . . . . 100.0 70.2 (1.28) 2.5 (0.40) 8.8 (0.77) 9.2 (0.77) 9.4 (0.76) Native Hawaiian or Other Pacific Islander, single race. . . . 100.0 65.6 (6.27) – † *19.4 (6.04) † Two or more races . . . . . . . . . . . . . . . . . . . . . . . . . 100.0 62.3 (2.45) *1.9 (0.71) 9.6 (1.34) 13.9 (2.15) 12.2 (1.55)
Black or African American, white . . . . . . . . . . . . . . . 100.0 64.8 (5.86) † *10.5 (3.55) *13.9 (4.52) *8.6 (3.07) American Indian or Alaska Native, white . . . . . . . . . . . 100.0 65.3 (3.47) † 8.4 (2.13) 10.7 (2.71) 14.8 (3.14)
See footnotes at end of table.

Series 10, No. 245 [ Page 49
Table 5.3. Age-adjusted percent distributions (with standard errors) of times per week engaged in vigorous leisure-time physical activity for adults 18 years of age and over, by selected characteristics: United States, average annual, 2005–2007—Con.
Times per week engaged in vigorous activity1
Selected characteristic Total None2 Less than 13 1–2 3–4 5 or more
Women Percent distribution (standard error)
Hispanic or Latino origin and race: Hispanic or Latino . . . . . . . . . . . . . . . . . . . . . . . . . . 100.0 78.2 (0.67) 1.4 (0.17) 6.2 (0.34) 7.3 (0.41) 6.9 (0.40)
Mexican or Mexican American . . . . . . . . . . . . . . . . . 100.0 78.8 (0.88) 1.5 (0.23) 6.6 (0.44) 6.6 (0.51) 6.5 (0.55) Not Hispanic or Latino . . . . . . . . . . . . . . . . . . . . . . . 100.0 64.3 (0.42) 2.3 (0.10) 10.5 (0.23) 13.2 (0.25) 9.8 (0.23)
White, single race . . . . . . . . . . . . . . . . . . . . . . . . 100.0 61.7 (0.49) 2.4 (0.12) 11.1 (0.26) 14.4 (0.30) 10.4 (0.27) Black or African American, single race . . . . . . . . . . . . 100.0 75.7 (0.68) 1.8 (0.19) 8.1 (0.44) 8.4 (0.40) 6.0 (0.35)
Education: Less than high school graduate . . . . . . . . . . . . . . . . . 100.0 84.5 (0.56) 1.0 (0.15) 4.9 (0.33) 4.1 (0.31) 5.5 (0.35) GED diploma6 . . . . . . . . . . . . . . . . . . . . . . . . . . . . 100.0 79.8 (1.45) 1.6 (0.46) 6.6 (0.84) 4.9 (0.72) 7.1 (0.96) High school graduate . . . . . . . . . . . . . . . . . . . . . . . . 100.0 74.7 (0.63) 1.6 (0.15) 8.3 (0.36) 8.1 (0.47) 7.3 (0.33) Some college—no degree . . . . . . . . . . . . . . . . . . . . . 100.0 62.6 (0.70) 2.6 (0.22) 11.0 (0.48) 13.8 (0.48) 10.0 (0.42) Associate of arts degree . . . . . . . . . . . . . . . . . . . . . . 100.0 61.9 (0.89) 2.7 (0.30) 10.9 (0.56) 13.7 (0.69) 10.7 (0.59) Bachelor of arts, science degree . . . . . . . . . . . . . . . . . 100.0 51.8 (0.77) 2.8 (0.22) 13.1 (0.52) 20.1 (0.59) 12.2 (0.47) Masters, doctorate, medical degree . . . . . . . . . . . . . . . 100.0 47.7 (1.03) 3.1 (0.36) 13.2 (0.68) 21.4 (0.85) 14.6 (0.75)
Poverty status:7
Below poverty level . . . . . . . . . . . . . . . . . . . . . . . . . 100.0 79.6 (0.74) 1.3 (0.15) 6.8 (0.43) 5.9 (0.37) 6.4 (0.39) ≥1 and <2 times poverty level . . . . . . . . . . . . . . . . . . 100.0 76.2 (0.63) 1.6 (0.18) 7.3 (0.36) 7.5 (0.40) 7.4 (0.37) ≥2 and <4 times poverty level . . . . . . . . . . . . . . . . . . 100.0 67.0 (0.61) 2.2 (0.17) 10.3 (0.36) 11.7 (0.44) 8.9 (0.35) 4 times poverty level or more . . . . . . . . . . . . . . . . . . . 100.0 55.1 (0.62) 2.7 (0.18) 12.1 (0.38) 18.2 (0.45) 11.9 (0.37)
Marital status: Never married . . . . . . . . . . . . . . . . . . . . . . . . . . . . 100.0 64.6 (0.83) 2.6 (0.23) 11.3 (0.61) 12.2 (0.49) 9.3 (0.44) Married . . . . . . . . . . . . . . . . . . . . . . . . . . . . . . . . 100.0 65.0 (0.47) 2.3 (0.13) 9.6 (0.25) 13.4 (0.31) 9.8 (0.28) Cohabiting . . . . . . . . . . . . . . . . . . . . . . . . . . . . . . 100.0 67.7 (1.39) 1.7 (0.30) 11.3 (0.97) 10.8 (0.86) 8.5 (0.78) Divorced or separated . . . . . . . . . . . . . . . . . . . . . . . 100.0 71.0 (0.74) 1.7 (0.22) 8.8 (0.46) 10.3 (0.45) 8.2 (0.39) Widowed . . . . . . . . . . . . . . . . . . . . . . . . . . . . . . . 100.0 78.0 (2.22) *1.6 (0.63) 4.3 (0.85) 7.0 (1.35) 9.1 (1.64)
Geographic region: Northeast . . . . . . . . . . . . . . . . . . . . . . . . . . . . . . . 100.0 65.1 (0.82) 2.1 (0.24) 9.8 (0.49) 13.5 (0.54) 9.6 (0.47) Midwest . . . . . . . . . . . . . . . . . . . . . . . . . . . . . . . . 100.0 61.8 (0.92) 2.7 (0.21) 12.1 (0.45) 13.3 (0.52) 10.1 (0.46) South . . . . . . . . . . . . . . . . . . . . . . . . . . . . . . . . . 100.0 70.5 (0.63) 1.8 (0.14) 8.5 (0.32) 11.0 (0.36) 8.2 (0.31) West . . . . . . . . . . . . . . . . . . . . . . . . . . . . . . . . . . 100.0 64.4 (0.75) 2.3 (0.20) 9.9 (0.38) 12.9 (0.48) 10.5 (0.43)
* Estimates preceded by an asterisk have a relative standard error of greater than 30% and less than or equal to 50%. These should be interpreted with caution as they do not meet the standard of reliability or precision.
– Quantity zero.
† Estimates with a relative standard error greater than 50% are indicated with a dagger, but are not shown. 1Vigorous activity refers to leisure-time physical activities that cause heavy sweating or large increases in breathing or heart rate and are done for at least 10 minutes per episode. 2‘‘None’’ may include individuals who engaged in only light-moderate activity. 3‘‘Less than 1’’ refers to frequencies of vigorous activities lasting 10 minutes per episode that occurred less than one time per week (for example, three times per month.) 4Persons of other races and unknown race and ethnicity, unknown education, unknown poverty status, and unknown marital status are included in the total. 5Estimates for age groups are not age adjusted. 6GED is General Educational Development high school equivalency diploma. 7Poverty status is based on family income and family size using the U.S. Census Bureau poverty thresholds for 2004, 2005, and 2006.
NOTES: Unless otherwise specified, estimates are age adjusted using the projected 2000 U.S. population as the standard population and using three age groups: 18–44 years, 45–64 years, and 65 years and over. For crude percent distributions, refer to Appendix Table XIV. Denominator for each percent distribution excludes persons with unknown vigorous leisure-time physical activity status. See Appendix II for definitions of terms. See Appendix III for health behavior questions.
DATA SOURCE: National Health Interview Survey, 2005–2007. Estimates are based on household interviews of a sample of the civilian noninstitutionalized population.
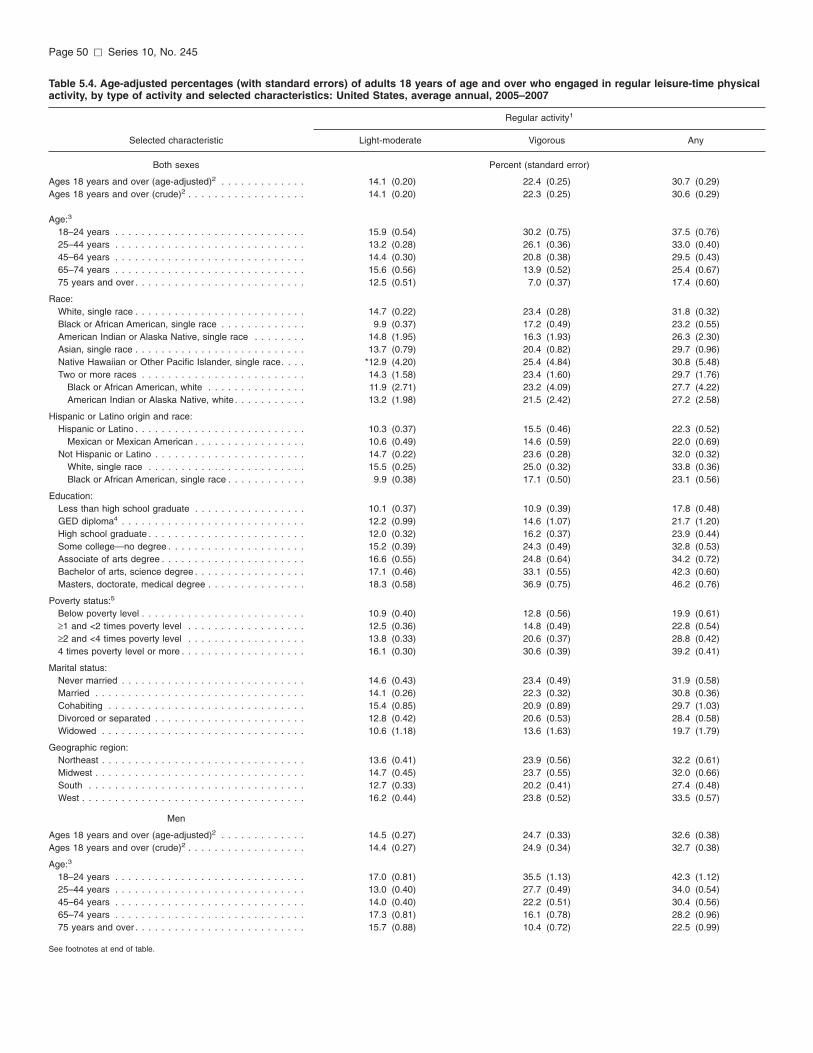
Page 50 [ Series 10, No. 245
Table 5.4. Age-adjusted percentages (with standard errors) of adults 18 years of age and over who engaged in regular leisure-time physical activity, by type of activity and selected characteristics: United States, average annual, 2005–2007
Regular activity1
Selected characteristic Light-moderate Vigorous Any
Both sexes Percent (standard error)
Ages 18 years and over (age-adjusted)2 . . . . . . . . . . . . . 14.1 (0.20) 22.4 (0.25) 30.7 (0.29) Ages 18 years and over (crude)2 . . . . . . . . . . . . . . . . . . 14.1 (0.20) 22.3 (0.25) 30.6 (0.29)
Age:3
18–24 years . . . . . . . . . . . . . . . . . . . . . . . . . . . . . 15.9 (0.54) 30.2 (0.75) 37.5 (0.76) 25–44 years . . . . . . . . . . . . . . . . . . . . . . . . . . . . . 13.2 (0.28) 26.1 (0.36) 33.0 (0.40) 45–64 years . . . . . . . . . . . . . . . . . . . . . . . . . . . . . 14.4 (0.30) 20.8 (0.38) 29.5 (0.43) 65–74 years . . . . . . . . . . . . . . . . . . . . . . . . . . . . . 15.6 (0.56) 13.9 (0.52) 25.4 (0.67) 75 years and over . . . . . . . . . . . . . . . . . . . . . . . . . . 12.5 (0.51) 7.0 (0.37) 17.4 (0.60)
Race: White, single race . . . . . . . . . . . . . . . . . . . . . . . . . . 14.7 (0.22) 23.4 (0.28) 31.8 (0.32) Black or African American, single race . . . . . . . . . . . . . 9.9 (0.37) 17.2 (0.49) 23.2 (0.55) American Indian or Alaska Native, single race . . . . . . . . 14.8 (1.95) 16.3 (1.93) 26.3 (2.30) Asian, single race . . . . . . . . . . . . . . . . . . . . . . . . . . 13.7 (0.79) 20.4 (0.82) 29.7 (0.96) Native Hawaiian or Other Pacific Islander, single race. . . . *12.9 (4.20) 25.4 (4.84) 30.8 (5.48) Two or more races . . . . . . . . . . . . . . . . . . . . . . . . . 14.3 (1.58) 23.4 (1.60) 29.7 (1.76)
Black or African American, white . . . . . . . . . . . . . . . 11.9 (2.71) 23.2 (4.09) 27.7 (4.22) American Indian or Alaska Native, white . . . . . . . . . . . 13.2 (1.98) 21.5 (2.42) 27.2 (2.58)
Hispanic or Latino origin and race: Hispanic or Latino . . . . . . . . . . . . . . . . . . . . . . . . . . 10.3 (0.37) 15.5 (0.46) 22.3 (0.52)
Mexican or Mexican American . . . . . . . . . . . . . . . . . 10.6 (0.49) 14.6 (0.59) 22.0 (0.69) Not Hispanic or Latino . . . . . . . . . . . . . . . . . . . . . . . 14.7 (0.22) 23.6 (0.28) 32.0 (0.32)
White, single race . . . . . . . . . . . . . . . . . . . . . . . . 15.5 (0.25) 25.0 (0.32) 33.8 (0.36) Black or African American, single race . . . . . . . . . . . . 9.9 (0.38) 17.1 (0.50) 23.1 (0.56)
Education: Less than high school graduate . . . . . . . . . . . . . . . . . 10.1 (0.37) 10.9 (0.39) 17.8 (0.48) GED diploma4 . . . . . . . . . . . . . . . . . . . . . . . . . . . . 12.2 (0.99) 14.6 (1.07) 21.7 (1.20) High school graduate . . . . . . . . . . . . . . . . . . . . . . . . 12.0 (0.32) 16.2 (0.37) 23.9 (0.44) Some college—no degree . . . . . . . . . . . . . . . . . . . . . 15.2 (0.39) 24.3 (0.49) 32.8 (0.53) Associate of arts degree . . . . . . . . . . . . . . . . . . . . . . 16.6 (0.55) 24.8 (0.64) 34.2 (0.72) Bachelor of arts, science degree . . . . . . . . . . . . . . . . . 17.1 (0.46) 33.1 (0.55) 42.3 (0.60) Masters, doctorate, medical degree . . . . . . . . . . . . . . . 18.3 (0.58) 36.9 (0.75) 46.2 (0.76)
Poverty status:5
Below poverty level . . . . . . . . . . . . . . . . . . . . . . . . . 10.9 (0.40) 12.8 (0.56) 19.9 (0.61) ≥1 and <2 times poverty level . . . . . . . . . . . . . . . . . . 12.5 (0.36) 14.8 (0.49) 22.8 (0.54) ≥2 and <4 times poverty level . . . . . . . . . . . . . . . . . . 13.8 (0.33) 20.6 (0.37) 28.8 (0.42) 4 times poverty level or more . . . . . . . . . . . . . . . . . . . 16.1 (0.30) 30.6 (0.39) 39.2 (0.41)
Marital status: Never married . . . . . . . . . . . . . . . . . . . . . . . . . . . . 14.6 (0.43) 23.4 (0.49) 31.9 (0.58) Married . . . . . . . . . . . . . . . . . . . . . . . . . . . . . . . . 14.1 (0.26) 22.3 (0.32) 30.8 (0.36) Cohabiting . . . . . . . . . . . . . . . . . . . . . . . . . . . . . . 15.4 (0.85) 20.9 (0.89) 29.7 (1.03) Divorced or separated . . . . . . . . . . . . . . . . . . . . . . . 12.8 (0.42) 20.6 (0.53) 28.4 (0.58) Widowed . . . . . . . . . . . . . . . . . . . . . . . . . . . . . . . 10.6 (1.18) 13.6 (1.63) 19.7 (1.79)
Geographic region: Northeast . . . . . . . . . . . . . . . . . . . . . . . . . . . . . . . 13.6 (0.41) 23.9 (0.56) 32.2 (0.61) Midwest . . . . . . . . . . . . . . . . . . . . . . . . . . . . . . . . 14.7 (0.45) 23.7 (0.55) 32.0 (0.66) South . . . . . . . . . . . . . . . . . . . . . . . . . . . . . . . . . 12.7 (0.33) 20.2 (0.41) 27.4 (0.48) West . . . . . . . . . . . . . . . . . . . . . . . . . . . . . . . . . . 16.2 (0.44) 23.8 (0.52) 33.5 (0.57)
Men
Ages 18 years and over (age-adjusted)2 . . . . . . . . . . . . . 14.5 (0.27) 24.7 (0.33) 32.6 (0.38) Ages 18 years and over (crude)2 . . . . . . . . . . . . . . . . . . 14.4 (0.27) 24.9 (0.34) 32.7 (0.38)
Age:3
18–24 years . . . . . . . . . . . . . . . . . . . . . . . . . . . . . 17.0 (0.81) 35.5 (1.13) 42.3 (1.12) 25–44 years . . . . . . . . . . . . . . . . . . . . . . . . . . . . . 13.0 (0.40) 27.7 (0.49) 34.0 (0.54) 45–64 years . . . . . . . . . . . . . . . . . . . . . . . . . . . . . 14.0 (0.40) 22.2 (0.51) 30.4 (0.56) 65–74 years . . . . . . . . . . . . . . . . . . . . . . . . . . . . . 17.3 (0.81) 16.1 (0.78) 28.2 (0.96) 75 years and over . . . . . . . . . . . . . . . . . . . . . . . . . . 15.7 (0.88) 10.4 (0.72) 22.5 (0.99)
See footnotes at end of table.

Series 10, No. 245 [ Page 51
Table 5.4. Age-adjusted percentages (with standard errors) of adults 18 years of age and over who engaged in regular leisure-time physical activity, by type of activity and selected characteristics: United States, average annual, 2005–2007—Con.
Regular activity1
Selected characteristic Light-moderate Vigorous Any
Men—Con Percent (standard error) Race:
White, single race . . . . . . . . . . . . . . . . . . . . . . . . . . 14.9 (0.30) 25.2 (0.37) 33.2 (0.42) Black or African American, single race . . . . . . . . . . . . . 11.4 (0.62) 22.4 (0.85) 28.6 (0.92) American Indian or Alaska Native, single race . . . . . . . . 16.2 (2.80) 18.5 (3.16) 27.0 (3.34) Asian, single race . . . . . . . . . . . . . . . . . . . . . . . . . . 13.6 (1.20) 23.6 (1.30) 32.6 (1.41) Native Hawaiian or Other Pacific Islander, single race. . . . *9.1 (4.09) 23.3 (6.18) 23.3 (6.18) Two or more races . . . . . . . . . . . . . . . . . . . . . . . . . 13.0 (1.86) 22.9 (2.24) 29.8 (2.56)
Black or African American, white . . . . . . . . . . . . . . . 15.4 (4.54) 25.2 (5.70) 31.4 (5.82) American Indian or Alaska Native, white . . . . . . . . . . . 10.3 (2.27) 21.2 (3.16) 26.3 (3.49)
Hispanic or Latino origin and race: Hispanic or Latino . . . . . . . . . . . . . . . . . . . . . . . . . . 10.5 (0.54) 18.0 (0.71) 24.3 (0.78)
Mexican or Mexican American . . . . . . . . . . . . . . . . . 10.0 (0.65) 17.2 (0.83) 23.4 (0.93) Not Hispanic or Latino . . . . . . . . . . . . . . . . . . . . . . . 15.2 (0.30) 26.0 (0.38) 34.1 (0.42)
White, single race . . . . . . . . . . . . . . . . . . . . . . . . 15.8 (0.34) 26.8 (0.44) 35.2 (0.48) Black or African American, single race . . . . . . . . . . . . 11.3 (0.63) 22.2 (0.87) 28.3 (0.94)
Education: Less than high school graduate . . . . . . . . . . . . . . . . . 10.8 (0.57) 13.5 (0.62) 20.2 (0.74) GED diploma4 . . . . . . . . . . . . . . . . . . . . . . . . . . . . 14.2 (1.64) 18.6 (1.78) 26.0 (1.96) High school graduate . . . . . . . . . . . . . . . . . . . . . . . . 12.3 (0.46) 18.3 (0.54) 25.5 (0.63) Some college—no degree . . . . . . . . . . . . . . . . . . . . . 15.4 (0.60) 26.8 (0.76) 34.8 (0.82) Associate of arts degree . . . . . . . . . . . . . . . . . . . . . . 17.5 (0.88) 27.6 (0.99) 37.1 (1.07) Bachelor of arts, science degree . . . . . . . . . . . . . . . . . 17.3 (0.63) 35.4 (0.76) 44.3 (0.81) Masters, doctorate, medical degree . . . . . . . . . . . . . . . 17.7 (0.85) 38.5 (1.09) 47.2 (1.13)
Poverty status:5
Below poverty level . . . . . . . . . . . . . . . . . . . . . . . . . 11.9 (0.73) 15.5 (0.87) 22.8 (0.99) ≥1 and <2 times poverty level . . . . . . . . . . . . . . . . . . 13.1 (0.55) 16.6 (0.77) 24.5 (0.81) ≥2 and <4 times poverty level . . . . . . . . . . . . . . . . . . 14.0 (0.46) 22.3 (0.54) 30.0 (0.59) 4 times poverty level or more . . . . . . . . . . . . . . . . . . . 16.1 (0.42) 32.4 (0.52) 40.5 (0.56)
Marital status: Never married . . . . . . . . . . . . . . . . . . . . . . . . . . . . 16.0 (0.63) 26.1 (0.69) 35.2 (0.82) Married . . . . . . . . . . . . . . . . . . . . . . . . . . . . . . . . 13.7 (0.37) 23.0 (0.42) 30.7 (0.47) Cohabiting . . . . . . . . . . . . . . . . . . . . . . . . . . . . . . 15.5 (1.17) 23.7 (1.32) 31.4 (1.45) Divorced or separated . . . . . . . . . . . . . . . . . . . . . . . 13.9 (0.64) 25.7 (0.90) 33.3 (0.94) Widowed . . . . . . . . . . . . . . . . . . . . . . . . . . . . . . . 7.9 (1.61) 9.1 (1.75) 14.2 (2.18)
Geographic region: Northeast . . . . . . . . . . . . . . . . . . . . . . . . . . . . . . . 13.8 (0.59) 26.5 (0.85) 34.4 (0.93) Midwest . . . . . . . . . . . . . . . . . . . . . . . . . . . . . . . . 15.2 (0.60) 25.8 (0.70) 33.8 (0.82) South . . . . . . . . . . . . . . . . . . . . . . . . . . . . . . . . . 13.3 (0.47) 22.7 (0.53) 29.7 (0.62) West . . . . . . . . . . . . . . . . . . . . . . . . . . . . . . . . . . 16.1 (0.54) 25.6 (0.71) 34.7 (0.74)
Women
Ages 18 years and over (age-adjusted)2 . . . . . . . . . . . . . 13.8 (0.24) 20.3 (0.30) 28.9 (0.35) Ages 18 years and over (crude)2 . . . . . . . . . . . . . . . . . . 13.8 (0.24) 20.0 (0.30) 28.7 (0.35)
Age:3
18–24 years . . . . . . . . . . . . . . . . . . . . . . . . . . . . . 14.7 (0.70) 24.9 (0.87) 32.9 (0.95) 25–44 years . . . . . . . . . . . . . . . . . . . . . . . . . . . . . 13.4 (0.36) 24.4 (0.47) 32.1 (0.51) 45–64 years . . . . . . . . . . . . . . . . . . . . . . . . . . . . . 14.7 (0.38) 19.5 (0.47) 28.7 (0.53) 65–74 years . . . . . . . . . . . . . . . . . . . . . . . . . . . . . 14.2 (0.70) 12.1 (0.62) 23.0 (0.84) 75 years and over . . . . . . . . . . . . . . . . . . . . . . . . . . 10.4 (0.59) 4.8 (0.38) 14.0 (0.68)
Race: White, single race . . . . . . . . . . . . . . . . . . . . . . . . . . 14.5 (0.28) 21.7 (0.34) 30.6 (0.40) Black or African American, single race . . . . . . . . . . . . . 8.8 (0.42) 12.8 (0.48) 18.8 (0.58) American Indian or Alaska Native, single race . . . . . . . . 13.1 (1.95) 14.5 (2.33) 25.4 (2.62) Asian, single race . . . . . . . . . . . . . . . . . . . . . . . . . . 13.9 (1.01) 17.3 (1.09) 26.8 (1.27) Native Hawaiian or Other Pacific Islander, single race. . . . *18.1 (8.77) 27.4 (6.61) 39.9 (9.83) Two or more races . . . . . . . . . . . . . . . . . . . . . . . . . 15.5 (2.34) 23.6 (2.20) 29.6 (2.32)
Black or African American, white . . . . . . . . . . . . . . . *8.6 (3.12) 20.7 (5.37) 24.1 (5.63) American Indian or Alaska Native, white . . . . . . . . . . . 16.8 (3.24) 22.0 (3.48) 28.5 (3.62)
See footnotes at end of table.

Page 52 [ Series 10, No. 245
Table 5.4. Age-adjusted percentages (with standard errors) of adults 18 years of age and over who engaged in regular leisure-time physical activity, by type of activity and selected characteristics: United States, average annual, 2005–2007—Con.
Regular activity1
Selected characteristic Light-moderate Vigorous Any
Women—Con. Percent (standard error)
Hispanic or Latino origin and race: Hispanic or Latino . . . . . . . . . . . . . . . . . . . . . . . . . . 10.3 (0.48) 13.0 (0.53) 20.5 (0.65)
Mexican or Mexican American . . . . . . . . . . . . . . . . . 11.2 (0.67) 12.1 (0.71) 20.6 (0.89) Not Hispanic or Latino . . . . . . . . . . . . . . . . . . . . . . . 14.3 (0.27) 21.4 (0.33) 30.2 (0.39)
White, single race . . . . . . . . . . . . . . . . . . . . . . . . 15.3 (0.32) 23.3 (0.39) 32.5 (0.45) Black or African American, single race . . . . . . . . . . . . 8.8 (0.43) 12.9 (0.49) 18.9 (0.59)
Education: Less than high school graduate . . . . . . . . . . . . . . . . . 9.4 (0.46) 8.1 (0.43) 15.4 (0.55) GED diploma4 . . . . . . . . . . . . . . . . . . . . . . . . . . . . 10.1 (1.10) 10.1 (1.05) 17.1 (1.35) High school graduate . . . . . . . . . . . . . . . . . . . . . . . . 11.9 (0.43) 13.9 (0.48) 22.3 (0.57) Some college—no degree . . . . . . . . . . . . . . . . . . . . . 15.0 (0.49) 22.1 (0.57) 31.2 (0.64) Associate of arts degree . . . . . . . . . . . . . . . . . . . . . . 16.0 (0.69) 22.8 (0.79) 32.0 (0.91) Bachelor of arts, science degree . . . . . . . . . . . . . . . . . 17.0 (0.59) 30.8 (0.73) 40.4 (0.79) Masters, doctorate, medical degree . . . . . . . . . . . . . . . 18.9 (0.86) 34.9 (0.99) 45.0 (1.05)
Poverty status:5
Below poverty level . . . . . . . . . . . . . . . . . . . . . . . . . 10.3 (0.46) 10.8 (0.53) 17.9 (0.62) ≥1 and <2 times poverty level . . . . . . . . . . . . . . . . . . 12.0 (0.48) 13.3 (0.51) 21.4 (0.60) ≥2 and <4 times poverty level . . . . . . . . . . . . . . . . . . 13.6 (0.44) 18.9 (0.49) 27.7 (0.56) 4 times poverty level or more . . . . . . . . . . . . . . . . . . . 16.1 (0.42) 28.8 (0.54) 37.9 (0.58)
Marital status: Never married . . . . . . . . . . . . . . . . . . . . . . . . . . . . 13.2 (0.60) 20.1 (0.61) 28.2 (0.76) Married . . . . . . . . . . . . . . . . . . . . . . . . . . . . . . . . 14.5 (0.33) 21.6 (0.42) 30.7 (0.47) Cohabiting . . . . . . . . . . . . . . . . . . . . . . . . . . . . . . 15.1 (1.30) 17.2 (0.95) 27.5 (1.47) Divorced or separated . . . . . . . . . . . . . . . . . . . . . . . 12.1 (0.55) 17.2 (0.56) 25.1 (0.67) Widowed . . . . . . . . . . . . . . . . . . . . . . . . . . . . . . . 11.4 (1.43) 15.0 (1.99) 21.3 (2.14)
Geographic region: Northeast . . . . . . . . . . . . . . . . . . . . . . . . . . . . . . . 13.5 (0.58) 21.6 (0.64) 30.3 (0.75) Midwest . . . . . . . . . . . . . . . . . . . . . . . . . . . . . . . . 14.3 (0.52) 21.7 (0.68) 30.4 (0.79) South . . . . . . . . . . . . . . . . . . . . . . . . . . . . . . . . . 12.2 (0.37) 17.9 (0.50) 25.4 (0.57) West . . . . . . . . . . . . . . . . . . . . . . . . . . . . . . . . . . 16.3 (0.58) 21.9 (0.60) 32.3 (0.71)
* Estimates preceded by an asterisk have a relative standard error of greater than 30% and less than or equal to 50%. These should be interpreted with caution as they do not meet the standard of reliability or precision. 1Regular leisure-time physical activity: ‘‘Regular light-moderate’’ — engaged in light-moderate activity at least 5 times per week for at least 30 minutes each time; ‘‘Regular vigorous’’ — engaged in vigorous activity at least 3 times per week for at least 20 minutes each time; and ‘‘Any regular’’ — engaged in activity that met either criterion or both criteria. Estimates for ‘‘any regular’’ are identical to those shown in table 5.1. 2Persons of other races and unknown race and ethnicity, unknown education, unknown poverty status, and unknown marital status are included in the total. 3Estimates for age groups are not age adjusted. 4GED is General Educational Development high school equivalency diploma. 5Poverty status is based on family income and family size using the U.S. Census Bureau poverty thresholds for 2004, 2005, and 2006.
NOTES: Unless otherwise specified, estimates are age adjusted using the projected 2000 U.S. population as the standard population and using three age groups: 18–44 years, 45–64 years, and 65 years and over. For crude percentages, refer to Appendix Table XV. Denominator for each percentage excludes persons with unknown leisure-time physical activity status. See Appendix II for definitions of terms. See Appendix III for health behavior questions.
DATA SOURCE: National Health Interview Survey, 2005–2007. Estimates are based on household interviews of a sample of the civilian noninstitutionalized population.
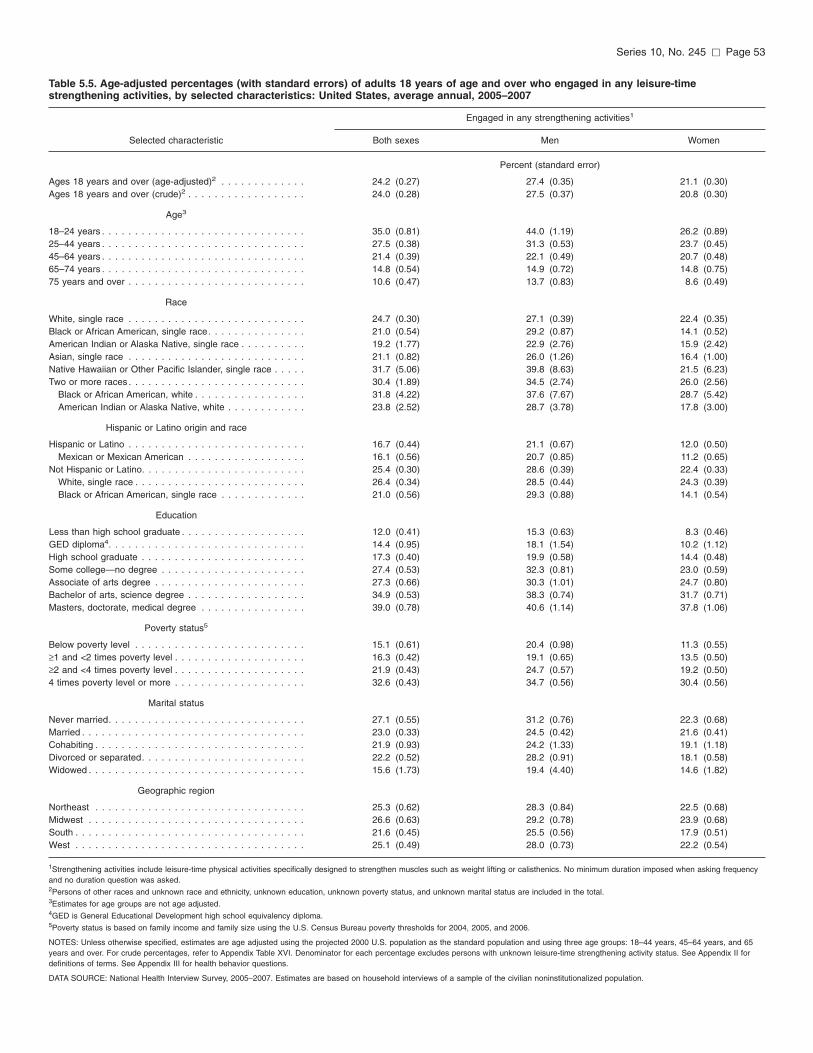
Series 10, No. 245 [ Page 53
Table 5.5. Age-adjusted percentages (with standard errors) of adults 18 years of age and over who engaged in any leisure-time strengthening activities, by selected characteristics: United States, average annual, 2005–2007
Engaged in any strengthening activities1
Selected characteristic Both sexes Men Women
Percent (standard error)
Ages 18 years and over (age-adjusted)2 . . . . . . . . . . . . . 24.2 (0.27) 27.4 (0.35) 21.1 (0.30) Ages 18 years and over (crude)2 . . . . . . . . . . . . . . . . . . 24.0 (0.28) 27.5 (0.37) 20.8 (0.30)
Age3
18–24 years . . . . . . . . . . . . . . . . . . . . . . . . . . . . . . . 35.0 (0.81) 44.0 (1.19) 26.2 (0.89) 25–44 years . . . . . . . . . . . . . . . . . . . . . . . . . . . . . . . 27.5 (0.38) 31.3 (0.53) 23.7 (0.45) 45–64 years . . . . . . . . . . . . . . . . . . . . . . . . . . . . . . . 21.4 (0.39) 22.1 (0.49) 20.7 (0.48) 65–74 years . . . . . . . . . . . . . . . . . . . . . . . . . . . . . . . 14.8 (0.54) 14.9 (0.72) 14.8 (0.75) 75 years and over . . . . . . . . . . . . . . . . . . . . . . . . . . . 10.6 (0.47) 13.7 (0.83) 8.6 (0.49)
Race
White, single race . . . . . . . . . . . . . . . . . . . . . . . . . . . 24.7 (0.30) 27.1 (0.39) 22.4 (0.35) Black or African American, single race. . . . . . . . . . . . . . . 21.0 (0.54) 29.2 (0.87) 14.1 (0.52) American Indian or Alaska Native, single race . . . . . . . . . . 19.2 (1.77) 22.9 (2.76) 15.9 (2.42) Asian, single race . . . . . . . . . . . . . . . . . . . . . . . . . . . 21.1 (0.82) 26.0 (1.26) 16.4 (1.00) Native Hawaiian or Other Pacific Islander, single race . . . . . 31.7 (5.06) 39.8 (8.63) 21.5 (6.23) Two or more races . . . . . . . . . . . . . . . . . . . . . . . . . . . 30.4 (1.89) 34.5 (2.74) 26.0 (2.56)
Black or African American, white . . . . . . . . . . . . . . . . . 31.8 (4.22) 37.6 (7.67) 28.7 (5.42) American Indian or Alaska Native, white . . . . . . . . . . . . 23.8 (2.52) 28.7 (3.78) 17.8 (3.00)
Hispanic or Latino origin and race
Hispanic or Latino . . . . . . . . . . . . . . . . . . . . . . . . . . . 16.7 (0.44) 21.1 (0.67) 12.0 (0.50) Mexican or Mexican American . . . . . . . . . . . . . . . . . . 16.1 (0.56) 20.7 (0.85) 11.2 (0.65)
Not Hispanic or Latino. . . . . . . . . . . . . . . . . . . . . . . . . 25.4 (0.30) 28.6 (0.39) 22.4 (0.33) White, single race . . . . . . . . . . . . . . . . . . . . . . . . . . 26.4 (0.34) 28.5 (0.44) 24.3 (0.39) Black or African American, single race . . . . . . . . . . . . . 21.0 (0.56) 29.3 (0.88) 14.1 (0.54)
Education
Less than high school graduate . . . . . . . . . . . . . . . . . . . 12.0 (0.41) 15.3 (0.63) 8.3 (0.46) GED diploma4 . . . . . . . . . . . . . . . . . . . . . . . . . . . . . . 14.4 (0.95) 18.1 (1.54) 10.2 (1.12) High school graduate . . . . . . . . . . . . . . . . . . . . . . . . . 17.3 (0.40) 19.9 (0.58) 14.4 (0.48) Some college—no degree . . . . . . . . . . . . . . . . . . . . . . 27.4 (0.53) 32.3 (0.81) 23.0 (0.59) Associate of arts degree . . . . . . . . . . . . . . . . . . . . . . . 27.3 (0.66) 30.3 (1.01) 24.7 (0.80) Bachelor of arts, science degree . . . . . . . . . . . . . . . . . . 34.9 (0.53) 38.3 (0.74) 31.7 (0.71) Masters, doctorate, medical degree . . . . . . . . . . . . . . . . 39.0 (0.78) 40.6 (1.14) 37.8 (1.06)
Poverty status5
Below poverty level . . . . . . . . . . . . . . . . . . . . . . . . . . 15.1 (0.61) 20.4 (0.98) 11.3 (0.55) ≥1 and <2 times poverty level . . . . . . . . . . . . . . . . . . . . 16.3 (0.42) 19.1 (0.65) 13.5 (0.50) ≥2 and <4 times poverty level . . . . . . . . . . . . . . . . . . . . 21.9 (0.43) 24.7 (0.57) 19.2 (0.50) 4 times poverty level or more . . . . . . . . . . . . . . . . . . . . 32.6 (0.43) 34.7 (0.56) 30.4 (0.56)
Marital status
Never married. . . . . . . . . . . . . . . . . . . . . . . . . . . . . . 27.1 (0.55) 31.2 (0.76) 22.3 (0.68) Married . . . . . . . . . . . . . . . . . . . . . . . . . . . . . . . . . . 23.0 (0.33) 24.5 (0.42) 21.6 (0.41) Cohabiting . . . . . . . . . . . . . . . . . . . . . . . . . . . . . . . . 21.9 (0.93) 24.2 (1.33) 19.1 (1.18) Divorced or separated. . . . . . . . . . . . . . . . . . . . . . . . . 22.2 (0.52) 28.2 (0.91) 18.1 (0.58) Widowed . . . . . . . . . . . . . . . . . . . . . . . . . . . . . . . . . 15.6 (1.73) 19.4 (4.40) 14.6 (1.82)
Geographic region
Northeast . . . . . . . . . . . . . . . . . . . . . . . . . . . . . . . . 25.3 (0.62) 28.3 (0.84) 22.5 (0.68) Midwest . . . . . . . . . . . . . . . . . . . . . . . . . . . . . . . . . 26.6 (0.63) 29.2 (0.78) 23.9 (0.68) South . . . . . . . . . . . . . . . . . . . . . . . . . . . . . . . . . . . 21.6 (0.45) 25.5 (0.56) 17.9 (0.51) West . . . . . . . . . . . . . . . . . . . . . . . . . . . . . . . . . . . 25.1 (0.49) 28.0 (0.73) 22.2 (0.54)
1Strengthening activities include leisure-time physical activities specifically designed to strengthen muscles such as weight lifting or calisthenics. No minimum duration imposed when asking frequency and no duration question was asked. 2Persons of other races and unknown race and ethnicity, unknown education, unknown poverty status, and unknown marital status are included in the total. 3Estimates for age groups are not age adjusted. 4GED is General Educational Development high school equivalency diploma. 5Poverty status is based on family income and family size using the U.S. Census Bureau poverty thresholds for 2004, 2005, and 2006.
NOTES: Unless otherwise specified, estimates are age adjusted using the projected 2000 U.S. population as the standard population and using three age groups: 18–44 years, 45–64 years, and 65 years and over. For crude percentages, refer to Appendix Table XVI. Denominator for each percentage excludes persons with unknown leisure-time strengthening activity status. See Appendix II for definitions of terms. See Appendix III for health behavior questions.
DATA SOURCE: National Health Interview Survey, 2005–2007. Estimates are based on household interviews of a sample of the civilian noninstitutionalized population.

Page 54 [ Series 10, No. 245
2.7
1.0
44.2
31.1
28.0
42.2
25.0
25.7
0 20 40 60 80 100
Women
Men
Percent
Underweight Healthy weight Overweight, not obese Obese
NOTES: Estimates are based on household interviews of a sample of the civilian noninstitutionalized population. Totals do not add to 100% due to rounding. Estimates are age adjusted using the projected 2000 U.S. population as the standard population.
DATA SOURCE: CDC/NCHS, National Health Interview Survey, 2005–2007.
Figure 6.1. Percent distribution of body weight status of adults, by sex: United States, 2005–2007
Men
Women
NOTE: Estimates are based on household interviews of a sample of the civilian noninstitutionalized population.
DATA SOURCE: CDC/NCHS, National Health Interview Survey, 2005-2007.
0
10
5
15
20
25
30
35
18–24 25–44 45–64 Age in years
65–74 75 and over
Per
cent
Figure 6.2. Percentage of adults who were obese, by age and sex: United States, 2005–2007
Chapter 6 Body Weight Status
All Adults + Overall, nearly 6 in 10 adults
(60.4%) were overweight (including obese) (Table 6.1).
+ About 25.4% of adults were obese, 35% were overweight but not obese, 37.7% were in the healthy weight range, and 1.9% of adults were underweight (Table 6.2).
Sex + Men (67.9%) were considerably
more likely than women (53.0%) to be overweight, although men (25.7%) and women (25.0%) were about equally likely to be obese. (Tables 6.1 and 6.2 and Figure 6.1).
+ Women (44.2%) were more likely than men (31.1%) to be of healthy weight, and women (2.7%) were about three times as likely as men (1.0%) to be underweight (Table 6.2 and Figure 6.1).
Age + Overweight was most prevalent
among adults 45–64 years (68.2%) and 65–74 years of age (67.0%) and markedly lower for adults 75 years and over (53.3%) (Table 6.1).
+ Men aged 45–64 years (30.5%) were about twice as likely as the youngest men (15.9%) and the oldest men (15.9%) to be obese (Table 6.2 and Figure 6.2).
+ Among women, prevalence of obesity was highest for those 45–64 years of age (30.2%) and 64–74 years of age (29.2%) and lowest for those 18–24 years of age (16.2%) and 75 years of age and over (18.0%) (Table 6.2 and Figure 6.2).
+ The youngest adults and the oldest adults were more likely than adults in the other age groups to be underweight (Table 6.2).
Race + Over one-half of white adults
(60.2%) were overweight. American Indian or Alaska Native adults (70.0%) and black adults (69.2%) were about twice as likely as Asian adults (36.9%) to be overweight (Table 6.1).
+ Among black adults, prevalence of overweight was about the same for men and women, whereas prevalence of overweight was markedly higher for white men (68.7%) than white women (51.6%) (Table 6.1 and Figure 6.3).
+ Black adults (34.2%) were more likely than white adults (24.8%) and about four times as likely as Asian adults (8.6%) to be obese (Table 6.2).
Hispanic or Latino Origin and Race + Hispanic adults were more likely
than non-Hispanic adults to be overweight or obese (Tables 6.1 and 6.2).
+ Non-Hispanic black women (38.8%) were markedly more likely than non-Hispanic white women (22.9%) and Hispanic women (29.3%) to be obese (Table 6.2).
+ About 4 in 10 non-Hispanic white adults (39.2%) were in the healthy weight range compared with about 3 in 10 non-Hispanic black adults (29.4%) and about one-third of

Men Women 80 72.571.868.7 69.2 69.2 68.2
60 54.051.6
45.7
Per
cent
40
28.1
20
0White Black or American Indian Asian Native Hawaiian
African or Alaska Native or Other American Pacific Islander
NOTES: Estimates are based on household interviews of a sample of the civilian noninstitutionalized population. Estimates are age adjusted using the projected 2000 U.S. population as the standard population.
DATA SOURCE: CDC/NCHS, National Health Interview Survey, 2005–2007.
50 Hispanic Non-Hispanic white Non-Hispanic black
39.939.240 34.6 34.6 34.6
31.3 29.430 27.6
Per
cent
20
24.3
10
0 1.3
Un
1.9
derweight
1.4
Healthy weight ObeseOverweight, not obese
NOTES: Estimates are age adjusted using the projected 2000 U.S. population as the standard population. Estimates are based on household interviews of a sample of the civilian noninstitutionalized population.
DATA SOURCE: CDC/NCHS, National Health Interview Survey, 2005–2007.
Series 10, No. 245 [ Page 55
Figure 6.3. Percentage of adults who were overweight (including obese), by sex and race: United States, 2005–2007
Figure 6.4. Percent distributions of body weight status of adults, by Hispanic origin and race: United States, 2005–2007
Hispanic adults (31.3%) (Table 6.2 and Figure 6.4).
Education + Among adults, the prevalence of
being overweight decreased as education increased. About 6 in 10 adults (64.3%) with less than a high school diploma were overweight compared with 5 in 10 adults (51.2%) who had earned a graduate degree (Table 6.1).
+ Prevalence of obesity was markedly lower among adults who had earned a bachelor’s or higher degree compared with adults having fewer years of education (Table 6.2).
+ Educational differentials in prevalence of obesity were greater for women than for men (Table 6.2 and Figure 6.5).
+ Prevalence of healthy weight was positively associated with level of education for women. Nearly 6 in 10 women (56.2%) with the highest level of education compared with about one-third of women (34.6%) who had not graduated from high school were in the healthy weight range. Among men, there was no clear association between education and healthy weight status (Table 6.2).
Poverty Status + Men with family incomes four times
the poverty level or more (70.2%) were more likely than men with incomes below the poverty level (60.4%) to be overweight. In contrast, women with the highest family incomes (46.0%) were less likely than women with family incomes that were below the poverty level (60.6%) to be overweight (Table 6.1).
+ About one-fourth (28.8%) of adults with family incomes that were below the poverty level were obese compared with about one-fifth (22.1%) of adults with family incomes that were four times the poverty level or more (Table 6.2).
+ Prevalence of obesity was strongly associated with relative income level for women but not for men. Women
with family incomes below the poverty level (32.8%) were almost twice as likely as the highest income group of women (18.9%) to be obese. In contrast, obesity rates were about the same for men with family incomes below the poverty level (23.3%) and men with the highest family incomes (24.9%) (Table 6.2 and Figure 6.6).
Marital Status + Married men (73.5%) were
markedly more likely than never married men (56.9%) to be overweight whereas married women (53.2%) and never married women (52.0%) were about equally likely to be overweight (Table 6.1).
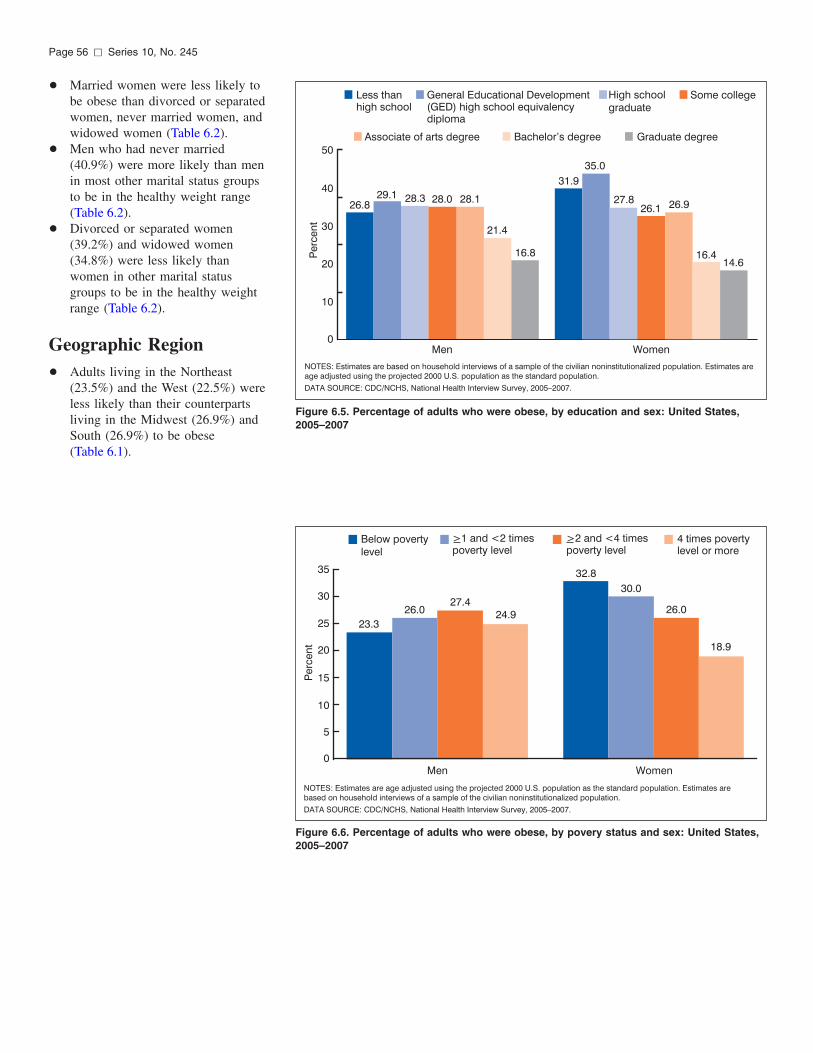
General Educational Development High schoolLess than Some collegehigh school (GED) high school equivalency graduate
diploma
Associate of arts degree Bachelor’s degree Graduate degree 50
35.0 31.9
40 29.1 28.3 28.0 28.1 27.8 26.926.8 26.1
16.8 16.4Per
cent
30 21.4
14.620
10
0 Men Women
NOTES: Estimates are based on household interviews of a sample of the civilian noninstitutionalized population. Estimates are age adjusted using the projected 2000 U.S. population as the standard population.
DATA SOURCE: CDC/NCHS, National Health Interview Survey, 2005–2007.
Page 56 [ Series 10, No. 245
Figure 6.5. Percentage of adults who were obese, by education and sex: United States, 2005–2007
+ Married women were less likely to be obese than divorced or separated women, never married women, and widowed women (Table 6.2).
+ Men who had never married (40.9%) were more likely than men in most other marital status groups to be in the healthy weight range (Table 6.2).
+ Divorced or separated women (39.2%) and widowed women (34.8%) were less likely than women in other marital status groups to be in the healthy weight range (Table 6.2).
Geographic Region + Adults living in the Northeast
(23.5%) and the West (22.5%) were less likely than their counterparts living in the Midwest (26.9%) and South (26.9%) to be obese (Table 6.1).
>1 and <2 times >2 and <4 times 4 times poverty level poverty level poverty level level or more Below poverty
35 32.8 30.0
30 27.4 26.026.0 24.9
25 23.3
18.920
15
10
5
0 Men Women
Per
cent
NOTES: Estimates are age adjusted using the projected 2000 U.S. population as the standard population. Estimates are based on household interviews of a sample of the civilian noninstitutionalized population.
DATA SOURCE: CDC/NCHS, National Health Interview Survey, 2005–2007.
Figure 6.6. Percentage of adults who were obese, by povery status and sex: United States, 2005–2007

Series 10, No. 245 [ Page 57
Table 6.1. Age-adjusted percentages (with standard errors) of adults 18 years of age and over who were overweight, by selected characteristics: United States, average annual, 2005–2007
Overweight (BMI of 25 or more)1
Selected characteristic Both sexes Men Women
Percent (standard error)
Ages 18 years and over (age-adjusted)2 . . . . . . . . . . . . . 60.4 (0.25) 67.9 (0.33) 53.0 (0.34) Ages 18 years and over (crude)2 . . . . . . . . . . . . . . . . . . 60.8 (0.25) 68.3 (0.33) 53.5 (0.34)
Age3
18–24 years . . . . . . . . . . . . . . . . . . . . . . . . . . . . . . . 41.8 (0.72) 46.6 (1.05) 37.0 (0.97) 25–44 years . . . . . . . . . . . . . . . . . . . . . . . . . . . . . . . 60.9 (0.37) 70.1 (0.49) 51.4 (0.52) 45–64 years . . . . . . . . . . . . . . . . . . . . . . . . . . . . . . . 68.2 (0.36) 75.8 (0.49) 60.6 (0.53) 65–74 years . . . . . . . . . . . . . . . . . . . . . . . . . . . . . . . 67.0 (0.65) 71.8 (0.89) 62.8 (0.95) 75 years and over . . . . . . . . . . . . . . . . . . . . . . . . . . . 53.3 (0.73) 58.2 (1.13) 50.0 (0.92)
Race
White, single race . . . . . . . . . . . . . . . . . . . . . . . . . . . 60.2 (0.28) 68.7 (0.37) 51.6 (0.39) Black or African American, single race. . . . . . . . . . . . . . . 69.2 (0.54) 69.2 (0.85) 69.2 (0.67) American Indian or Alaska Native, single race . . . . . . . . . . 70.0 (2.23) 71.8 (3.38) 68.2 (2.97) Asian, single race . . . . . . . . . . . . . . . . . . . . . . . . . . . 36.9 (1.02) 45.7 (1.47) 28.1 (1.32) Native Hawaiian or Other Pacific Islander, single race . . . . . 63.5 (4.59) 72.5 (6.53) 54.0 (6.81) Two or more races . . . . . . . . . . . . . . . . . . . . . . . . . . . 65.7 (1.85) 73.4 (2.34) 58.3 (2.70)
Black or African American, white . . . . . . . . . . . . . . . . . 62.9 (4.77) 66.0 (6.39) 62.1 (6.48) American Indian or Alaska Native, white . . . . . . . . . . . . 70.3 (2.62) 77.3 (3.09) 62.2 (4.24)
Hispanic or Latino origin and race
Hispanic or Latino . . . . . . . . . . . . . . . . . . . . . . . . . . . 67.5 (0.55) 72.2 (0.78) 62.4 (0.72) Mexican or Mexican American . . . . . . . . . . . . . . . . . . 69.4 (0.68) 73.5 (0.93) 65.0 (0.95)
Not Hispanic or Latino. . . . . . . . . . . . . . . . . . . . . . . . . 59.3 (0.27) 67.2 (0.37) 51.7 (0.37) White, single race . . . . . . . . . . . . . . . . . . . . . . . . . . 58.9 (0.31) 68.1 (0.41) 49.8 (0.43) Black or African American, single race . . . . . . . . . . . . . 69.2 (0.54) 69.1 (0.86) 69.2 (0.68)
Education
Less than high school graduate . . . . . . . . . . . . . . . . . . . 64.3 (0.54) 65.7 (0.77) 62.8 (0.77) GED diploma4 . . . . . . . . . . . . . . . . . . . . . . . . . . . . . . 68.2 (1.34) 71.1 (1.81) 64.8 (1.90) High school graduate . . . . . . . . . . . . . . . . . . . . . . . . . 62.8 (0.48) 68.9 (0.61) 56.7 (0.66) Some college—no degree . . . . . . . . . . . . . . . . . . . . . . 60.5 (0.54) 68.4 (0.75) 53.4 (0.72) Associate of arts degree . . . . . . . . . . . . . . . . . . . . . . . 64.0 (0.69) 73.9 (1.01) 56.1 (0.92) Bachelor of arts, science degree . . . . . . . . . . . . . . . . . . 55.1 (0.54) 67.8 (0.77) 42.2 (0.74) Masters, doctorate, medical degree . . . . . . . . . . . . . . . . 51.2 (0.76) 62.2 (1.13) 40.1 (1.02)
Poverty status5
Below poverty level . . . . . . . . . . . . . . . . . . . . . . . . . . 60.5 (0.67) 60.4 (1.04) 60.6 (0.81) ≥1 and <2 times poverty level . . . . . . . . . . . . . . . . . . . . 61.8 (0.57) 64.9 (0.90) 59.0 (0.69) ≥2 and <4 times poverty level . . . . . . . . . . . . . . . . . . . . 61.6 (0.46) 69.1 (0.55) 54.2 (0.68) 4 times poverty level or more . . . . . . . . . . . . . . . . . . . . 58.8 (0.41) 70.2 (0.56) 46.0 (0.63)
Marital status
Never married. . . . . . . . . . . . . . . . . . . . . . . . . . . . . . 54.7 (0.63) 56.9 (0.83) 52.0 (0.95) Married . . . . . . . . . . . . . . . . . . . . . . . . . . . . . . . . . . 63.4 (0.32) 73.5 (0.41) 53.2 (0.46) Cohabiting . . . . . . . . . . . . . . . . . . . . . . . . . . . . . . . . 60.9 (1.05) 67.3 (1.41) 53.2 (1.66) Divorced or separated. . . . . . . . . . . . . . . . . . . . . . . . . 62.9 (0.60) 68.7 (0.90) 58.7 (0.77) Widowed . . . . . . . . . . . . . . . . . . . . . . . . . . . . . . . . . 64.7 (2.55) 68.4 (5.71) 63.5 (2.83)
Geographic region
Northeast . . . . . . . . . . . . . . . . . . . . . . . . . . . . . . . . 58.1 (0.62) 67.2 (0.85) 49.6 (0.78) Midwest . . . . . . . . . . . . . . . . . . . . . . . . . . . . . . . . . 61.5 (0.53) 69.1 (0.67) 53.9 (0.79) South . . . . . . . . . . . . . . . . . . . . . . . . . . . . . . . . . . . 61.9 (0.40) 68.6 (0.54) 55.4 (0.56) West . . . . . . . . . . . . . . . . . . . . . . . . . . . . . . . . . . . 58.5 (0.52) 66.0 (0.71) 50.7 (0.66)
1Body Mass Index (BMI) is calculated as kilograms/meters2, using self-reported height and weight. Overweight is a BMI greater than or equal to 25, which includes obese. 2Persons of other races and unknown race and ethnicity, unknown education, unknown poverty status, and unknown marital status are included in the total. 3Estimates for age groups are not age adjusted. 4GED is General Educational Development high school equivalency diploma. 5Poverty status is based on family income and family size using the U.S. Census Bureau poverty thresholds for 2004, 2005, and 2006.
NOTES: Unless otherwise specified, estimates are age adjusted using the projected 2000 U.S. population as the standard population and using three age groups: 18–44 years, 45–64 years, and 65 years and over. For crude percentages, refer to Appendix Table XVII. Denominator for each percentage excludes persons with unknown body mass index. See Appendix II for definitions of terms. See Appendix III for health behavior questions.
DATA SOURCE: National Health Interview Survey, 2005–2007. Estimates are based on household interviews of a sample of the civilian noninstitutionalized population.

Page 58 [ Series 10, No. 245
Table 6.2. Age-adjusted percent distributions (with standard errors) of body weight status for adults 18 years of age and over, by selected characteristics: United States, average annual, 2005–2007
Body weight status1
Not overweight Overweight
Healthy Overweight Selected characteristic Total Underweight weight (but not obese) Obese
Both sexes Percent distribution (standard error)
Ages 18 years and over (age-adjusted)2 . . . . . . . . . . . . . 100.0 1.9 (0.07) 37.7 (0.25) 35.0 (0.22) 25.4 (0.22) Ages 18 years and over (crude)2 . . . . . . . . . . . . . . . . . . 100.0 1.9 (0.07) 37.3 (0.25) 35.2 (0.22) 25.6 (0.22)
Age:3
18–24 years . . . . . . . . . . . . . . . . . . . . . . . . . . . . . 100.0 3.8 (0.31) 54.3 (0.73) 25.8 (0.63) 16.0 (0.52) 25–44 years . . . . . . . . . . . . . . . . . . . . . . . . . . . . . 100.0 1.6 (0.09) 37.5 (0.37) 34.8 (0.34) 26.1 (0.34) 45–64 years . . . . . . . . . . . . . . . . . . . . . . . . . . . . . 100.0 1.1 (0.09) 30.7 (0.36) 37.9 (0.39) 30.3 (0.39) 65–74 years . . . . . . . . . . . . . . . . . . . . . . . . . . . . . 100.0 1.4 (0.16) 31.5 (0.65) 39.6 (0.66) 27.5 (0.62) 75 years and over . . . . . . . . . . . . . . . . . . . . . . . . . . 100.0 3.6 (0.27) 43.1 (0.71) 36.1 (0.65) 17.2 (0.52)
Race: White, single race . . . . . . . . . . . . . . . . . . . . . . . . . . 100.0 1.8 (0.08) 38.0 (0.28) 35.3 (0.25) 24.8 (0.24) Black or African American, single race . . . . . . . . . . . . . 100.0 1.4 (0.14) 29.4 (0.53) 35.0 (0.53) 34.2 (0.57) American Indian or Alaska Native, single race . . . . . . . . 100.0 *0.8 (0.36) 29.2 (2.25) 36.8 (2.17) 33.2 (2.47) Asian, single race . . . . . . . . . . . . . . . . . . . . . . . . . . 100.0 4.9 (0.52) 58.2 (1.02) 28.3 (0.93) 8.6 (0.57) Native Hawaiian or Other Pacific Islander, single race. . . . 100.0 † 32.7 (5.41) 34.6 (6.03) 29.0 (4.69) Two or more races . . . . . . . . . . . . . . . . . . . . . . . . . 100.0 1.3 (0.35) 33.1 (1.82) 34.5 (1.87) 31.2 (1.88)
Black or African American, white . . . . . . . . . . . . . . . 100.0 † 36.2 (4.81) 42.4 (4.64) 20.5 (3.60) American Indian or Alaska Native, white . . . . . . . . . . . 100.0 *1.3 (0.55) 28.4 (2.54) 35.7 (2.61) 34.6 (2.57)
Hispanic or Latino origin and race: Hispanic or Latino . . . . . . . . . . . . . . . . . . . . . . . . . . 100.0 1.3 (0.12) 31.3 (0.54) 39.9 (0.56) 27.6 (0.53)
Mexican or Mexican American . . . . . . . . . . . . . . . . . 100.0 1.1 (0.14) 29.4 (0.67) 39.7 (0.73) 29.8 (0.68) Not Hispanic or Latino . . . . . . . . . . . . . . . . . . . . . . . 100.0 2.0 (0.08) 38.7 (0.27) 34.3 (0.24) 25.0 (0.24)
White, single race . . . . . . . . . . . . . . . . . . . . . . . . 100.0 1.9 (0.09) 39.2 (0.31) 34.6 (0.28) 24.3 (0.26) Black or African American, single race . . . . . . . . . . . . 100.0 1.4 (0.14) 29.4 (0.54) 34.6 (0.53) 34.6 (0.59)
Education: Less than high school graduate . . . . . . . . . . . . . . . . . 100.0 2.3 (0.25) 33.5 (0.52) 35.0 (0.54) 29.3 (0.51) GED diploma4 . . . . . . . . . . . . . . . . . . . . . . . . . . . . 100.0 1.6 (0.34) 30.2 (1.31) 36.3 (1.30) 31.9 (1.30) High school graduate . . . . . . . . . . . . . . . . . . . . . . . . 100.0 1.9 (0.12) 35.4 (0.48) 34.7 (0.43) 28.0 (0.42) Some college—no degree . . . . . . . . . . . . . . . . . . . . . 100.0 1.8 (0.14) 37.7 (0.52) 33.5 (0.50) 27.0 (0.47) Associate of arts degree . . . . . . . . . . . . . . . . . . . . . . 100.0 1.6 (0.19) 34.4 (0.69) 36.6 (0.68) 27.4 (0.61) Bachelor of arts, science degree . . . . . . . . . . . . . . . . . 100.0 1.8 (0.15) 43.1 (0.54) 36.2 (0.52) 18.9 (0.43) Masters, doctorate, medical degree . . . . . . . . . . . . . . . 100.0 2.1 (0.22) 46.7 (0.77) 35.7 (0.71) 15.5 (0.55)
Poverty status:5
Below poverty level . . . . . . . . . . . . . . . . . . . . . . . . . 100.0 2.7 (0.22) 36.8 (0.65) 31.7 (0.58) 28.8 (0.59) ≥1 and <2 times poverty level . . . . . . . . . . . . . . . . . . 100.0 2.2 (0.19) 36.0 (0.54) 33.6 (0.56) 28.2 (0.47) ≥2 and <4 times poverty level . . . . . . . . . . . . . . . . . . 100.0 1.8 (0.13) 36.6 (0.45) 34.9 (0.42) 26.7 (0.40) 4 times poverty level or more . . . . . . . . . . . . . . . . . . . 100.0 1.6 (0.11) 39.6 (0.41) 36.7 (0.38) 22.1 (0.33)
Marital status: Never married . . . . . . . . . . . . . . . . . . . . . . . . . . . . 100.0 3.4 (0.28) 42.0 (0.60) 30.7 (0.57) 24.0 (0.55) Married . . . . . . . . . . . . . . . . . . . . . . . . . . . . . . . . 100.0 1.4 (0.08) 35.2 (0.32) 37.4 (0.30) 26.0 (0.29) Cohabiting . . . . . . . . . . . . . . . . . . . . . . . . . . . . . . 100.0 1.7 (0.32) 37.5 (1.05) 34.6 (1.05) 26.3 (0.94) Divorced or separated . . . . . . . . . . . . . . . . . . . . . . . 100.0 1.6 (0.15) 35.5 (0.59) 34.2 (0.54) 28.7 (0.57) Widowed . . . . . . . . . . . . . . . . . . . . . . . . . . . . . . . 100.0 1.4 (0.29) 33.9 (2.54) 33.0 (2.58) 31.7 (2.50)
Geographic region: Northeast . . . . . . . . . . . . . . . . . . . . . . . . . . . . . . . 100.0 2.1 (0.18) 39.8 (0.61) 34.6 (0.53) 23.5 (0.51) Midwest . . . . . . . . . . . . . . . . . . . . . . . . . . . . . . . . 100.0 1.6 (0.12) 36.9 (0.55) 34.6 (0.45) 26.9 (0.49) South . . . . . . . . . . . . . . . . . . . . . . . . . . . . . . . . . 100.0 2.1 (0.14) 36.1 (0.38) 35.0 (0.35) 26.9 (0.37) West . . . . . . . . . . . . . . . . . . . . . . . . . . . . . . . . . . 100.0 1.8 (0.13) 39.7 (0.53) 35.9 (0.50) 22.5 (0.42)
Men
Ages 18 years and over (age-adjusted)2 . . . . . . . . . . . . . 100.0 1.0 (0.08) 31.1 (0.33) 42.2 (0.34) 25.7 (0.30) Ages 18 years and over (crude)2 . . . . . . . . . . . . . . . . . . 100.0 1.0 (0.08) 30.7 (0.33) 42.4 (0.34) 26.0 (0.31)
Age:3
18–24 years . . . . . . . . . . . . . . . . . . . . . . . . . . . . . 100.0 2.9 (0.46) 50.5 (1.06) 30.7 (0.96) 15.9 (0.76) 25–44 years . . . . . . . . . . . . . . . . . . . . . . . . . . . . . 100.0 0.6 (0.08) 29.3 (0.49) 42.9 (0.51) 27.3 (0.49) 45–64 years . . . . . . . . . . . . . . . . . . . . . . . . . . . . . 100.0 0.5 (0.07) 23.7 (0.48) 45.4 (0.58) 30.5 (0.53) 65–74 years . . . . . . . . . . . . . . . . . . . . . . . . . . . . . 100.0 1.0 (0.19) 27.2 (0.87) 46.3 (1.02) 25.5 (0.91) 75 years and over . . . . . . . . . . . . . . . . . . . . . . . . . . 100.0 2.4 (0.42) 39.4 (1.09) 42.3 (1.12) 15.9 (0.86)
See footnotes at end of table.

Series 10, No. 245 [ Page 59
Table 6.2. Age-adjusted percent distributions (with standard errors) of body weight status for adults 18 years of age and over, by selected characteristics: United States, average annual, 2005–2007—Con.
Body weight status1
Not overweight Overweight
Healthy Overweight Selected characteristic Total Underweight weight (but not obese) Obese
Men—Con. Percent distribution (standard error)
Race: White, single race . . . . . . . . . . . . . . . . . . . . . . . . . . 100.0 0.9 (0.09) 30.4 (0.36) 42.9 (0.38) 25.8 (0.33) Black or African American, single race . . . . . . . . . . . . . 100.0 1.2 (0.22) 29.6 (0.84) 40.1 (0.86) 29.1 (0.82) American Indian or Alaska Native, single race . . . . . . . . 100.0 † 27.4 (3.39) 38.0 (3.89) 33.9 (4.01) Asian, single race . . . . . . . . . . . . . . . . . . . . . . . . . . 100.0 3.0 (0.61) 51.3 (1.47) 35.8 (1.38) 9.9 (0.84) Native Hawaiian or Other Pacific Islander, single race. . . . 100.0 – 27.5 (6.53) 36.9 (9.10) 35.5 (7.16) Two or more races . . . . . . . . . . . . . . . . . . . . . . . . . 100.0 *1.4 (0.54) 25.2 (2.29) 39.9 (3.25) 33.5 (3.14)
Black or African American, white . . . . . . . . . . . . . . . 100.0 † 31.8 (6.38) 57.5 (6.52) *8.6 (3.07) American Indian or Alaska Native, white . . . . . . . . . . . 100.0 † 21.3 (2.99) 40.0 (4.00) 37.3 (3.83)
Hispanic or Latino origin and race: Hispanic or Latino . . . . . . . . . . . . . . . . . . . . . . . . . . 100.0 0.8 (0.14) 27.0 (0.77) 46.5 (0.87) 25.7 (0.73)
Mexican or Mexican American . . . . . . . . . . . . . . . . . 100.0 0.6 (0.16) 25.8 (0.93) 46.8 (1.11) 26.7 (0.93) Not Hispanic or Latino . . . . . . . . . . . . . . . . . . . . . . . 100.0 1.1 (0.10) 31.7 (0.36) 41.6 (0.37) 25.6 (0.33)
White, single race . . . . . . . . . . . . . . . . . . . . . . . . 100.0 0.9 (0.11) 31.0 (0.41) 42.4 (0.43) 25.6 (0.37) Black or African American, single race . . . . . . . . . . . . 100.0 1.2 (0.22) 29.7 (0.86) 39.6 (0.87) 29.4 (0.85)
Education: Less than high school graduate . . . . . . . . . . . . . . . . . 100.0 1.9 (0.35) 32.4 (0.78) 38.8 (0.79) 26.8 (0.72) GED diploma4 . . . . . . . . . . . . . . . . . . . . . . . . . . . . 100.0 *1.6 (0.47) 27.3 (1.76) 42.0 (1.99) 29.1 (1.76) High school graduate . . . . . . . . . . . . . . . . . . . . . . . . 100.0 1.1 (0.14) 30.0 (0.60) 40.7 (0.65) 28.3 (0.59) Some college—no degree . . . . . . . . . . . . . . . . . . . . . 100.0 1.1 (0.18) 30.5 (0.74) 40.4 (0.82) 28.0 (0.72) Associate of arts degree . . . . . . . . . . . . . . . . . . . . . . 100.0 *0.4 (0.13) 25.7 (1.00) 45.8 (1.12) 28.1 (0.93) Bachelor of arts, science degree . . . . . . . . . . . . . . . . . 100.0 0.6 (0.14) 31.6 (0.76) 46.4 (0.80) 21.4 (0.64) Masters, doctorate, medical degree . . . . . . . . . . . . . . . 100.0 *0.4 (0.14) 37.4 (1.13) 45.4 (1.15) 16.8 (0.84)
Poverty status:5
Below poverty level . . . . . . . . . . . . . . . . . . . . . . . . . 100.0 2.2 (0.39) 37.5 (1.02) 37.1 (1.03) 23.3 (0.92) ≥1 and <2 times poverty level . . . . . . . . . . . . . . . . . . 100.0 1.5 (0.27) 33.5 (0.84) 38.9 (0.89) 26.0 (0.71) ≥2 and <4 times poverty level . . . . . . . . . . . . . . . . . . 100.0 0.9 (0.13) 30.0 (0.55) 41.7 (0.59) 27.4 (0.55) 4 times poverty level or more . . . . . . . . . . . . . . . . . . . 100.0 0.6 (0.10) 29.3 (0.56) 45.3 (0.57) 24.9 (0.49)
Marital status: Never married . . . . . . . . . . . . . . . . . . . . . . . . . . . . 100.0 2.2 (0.27) 40.9 (0.82) 36.5 (0.85) 20.4 (0.69) Married . . . . . . . . . . . . . . . . . . . . . . . . . . . . . . . . 100.0 0.6 (0.07) 25.9 (0.40) 45.1 (0.46) 28.4 (0.42) Cohabiting . . . . . . . . . . . . . . . . . . . . . . . . . . . . . . 100.0 *1.0 (0.44) 31.6 (1.38) 40.4 (1.47) 27.0 (1.28) Divorced or separated . . . . . . . . . . . . . . . . . . . . . . . 100.0 0.8 (0.19) 30.5 (0.88) 42.6 (0.96) 26.1 (0.83) Widowed . . . . . . . . . . . . . . . . . . . . . . . . . . . . . . . 100.0 *0.7 (0.26) 30.9 (5.71) 38.4 (6.16) 30.0 (5.86)
Geographic region: Northeast . . . . . . . . . . . . . . . . . . . . . . . . . . . . . . . 100.0 1.0 (0.17) 31.8 (0.84) 42.9 (0.89) 24.3 (0.79) Midwest . . . . . . . . . . . . . . . . . . . . . . . . . . . . . . . . 100.0 0.8 (0.11) 30.2 (0.67) 41.5 (0.67) 27.6 (0.58) South . . . . . . . . . . . . . . . . . . . . . . . . . . . . . . . . . 100.0 1.2 (0.18) 30.1 (0.52) 41.7 (0.55) 27.0 (0.52) West . . . . . . . . . . . . . . . . . . . . . . . . . . . . . . . . . . 100.0 1.1 (0.15) 32.9 (0.71) 43.7 (0.73) 22.3 (0.58)
Women
Ages 18 years and over (age-adjusted)2 . . . . . . . . . . . . . 100.0 2.7 (0.11) 44.2 (0.34) 28.0 (0.27) 25.0 (0.29) Ages 18 years and over (crude)2 . . . . . . . . . . . . . . . . . . 100.0 2.7 (0.10) 43.8 (0.34) 28.2 (0.27) 25.3 (0.29)
Age:3
18–24 years . . . . . . . . . . . . . . . . . . . . . . . . . . . . . 100.0 4.8 (0.40) 58.2 (0.97) 20.8 (0.78) 16.2 (0.70) 25–44 years . . . . . . . . . . . . . . . . . . . . . . . . . . . . . 100.0 2.7 (0.17) 45.9 (0.52) 26.6 (0.44) 24.8 (0.44) 45–64 years . . . . . . . . . . . . . . . . . . . . . . . . . . . . . 100.0 1.7 (0.16) 37.7 (0.54) 30.5 (0.51) 30.2 (0.52) 65–74 years . . . . . . . . . . . . . . . . . . . . . . . . . . . . . 100.0 1.9 (0.25) 35.4 (0.96) 33.5 (0.85) 29.2 (0.84) 75 years and over . . . . . . . . . . . . . . . . . . . . . . . . . . 100.0 4.4 (0.36) 45.6 (0.90) 32.0 (0.83) 18.0 (0.66)
Race: White, single race . . . . . . . . . . . . . . . . . . . . . . . . . . 100.0 2.7 (0.12) 45.7 (0.39) 27.8 (0.31) 23.8 (0.32) Black or African American, single race . . . . . . . . . . . . . 100.0 1.6 (0.18) 29.3 (0.67) 30.8 (0.64) 38.4 (0.73) American Indian or Alaska Native, single race . . . . . . . . 100.0 † 31.0 (3.02) 34.8 (3.23) 33.4 (3.42) Asian, single race . . . . . . . . . . . . . . . . . . . . . . . . . . 100.0 6.8 (0.83) 65.1 (1.39) 21.0 (1.20) 7.1 (0.70) Native Hawaiian or Other Pacific Islander, single race. . . . 100.0 † 37.1 (8.71) 32.2 (7.74) 21.8 (5.42) Two or more races . . . . . . . . . . . . . . . . . . . . . . . . . 100.0 *1.0 (0.41) 40.7 (2.69) 29.6 (2.33) 28.7 (2.22)
Black or African American, white . . . . . . . . . . . . . . . 100.0 – 37.9 (6.48) 37.0 (5.64) 25.1 (4.46) American Indian or Alaska Native, white . . . . . . . . . . . 100.0 † 36.5 (4.15) 31.0 (3.74) 31.3 (3.27)
See footnotes at end of table.

Page 60 [ Series 10, No. 245
Table 6.2. Age-adjusted percent distributions (with standard errors) of body weight status for adults 18 years of age and over, by selected characteristics: United States, average annual, 2005–2007—Con.
Body weight status1
Not overweight Overweight
Healthy Overweight Selected characteristic Total Underweight weight (but not obese) Obese
Women—Con. Percent distribution (standard error)
Hispanic or Latino origin and race: Hispanic or Latino . . . . . . . . . . . . . . . . . . . . . . . . . . 100.0 1.7 (0.20) 35.8 (0.72) 33.1 (0.69) 29.3 (0.70)
Mexican or Mexican American . . . . . . . . . . . . . . . . . 100.0 1.6 (0.24) 33.4 (0.95) 32.0 (0.93) 32.9 (0.96) Not Hispanic or Latino . . . . . . . . . . . . . . . . . . . . . . . 100.0 2.9 (0.12) 45.4 (0.37) 27.2 (0.29) 24.5 (0.31)
White, single race . . . . . . . . . . . . . . . . . . . . . . . . 100.0 2.9 (0.13) 47.3 (0.43) 26.8 (0.35) 22.9 (0.35) Black or African American, single race . . . . . . . . . . . . 100.0 1.6 (0.19) 29.1 (0.67) 30.5 (0.64) 38.8 (0.74)
Education: Less than high school graduate . . . . . . . . . . . . . . . . . 100.0 2.6 (0.30) 34.6 (0.73) 31.0 (0.70) 31.9 (0.73) GED diploma4 . . . . . . . . . . . . . . . . . . . . . . . . . . . . 100.0 *1.7 (0.51) 33.5 (1.88) 29.9 (1.58) 35.0 (1.75) High school graduate . . . . . . . . . . . . . . . . . . . . . . . . 100.0 2.7 (0.21) 40.6 (0.66) 28.8 (0.54) 27.8 (0.57) Some college—no degree . . . . . . . . . . . . . . . . . . . . . 100.0 2.4 (0.21) 44.2 (0.71) 27.3 (0.61) 26.1 (0.60) Associate of arts degree . . . . . . . . . . . . . . . . . . . . . . 100.0 2.6 (0.32) 41.4 (0.93) 29.1 (0.83) 26.9 (0.80) Bachelor of arts, science degree . . . . . . . . . . . . . . . . . 100.0 3.1 (0.26) 54.8 (0.74) 25.7 (0.64) 16.4 (0.54) Masters, doctorate, medical degree . . . . . . . . . . . . . . . 100.0 3.6 (0.39) 56.2 (1.05) 25.6 (0.91) 14.6 (0.71)
Poverty status:5
Below poverty level . . . . . . . . . . . . . . . . . . . . . . . . . 100.0 3.0 (0.27) 36.4 (0.78) 27.8 (0.76) 32.8 (0.74) ≥1 and <2 times poverty level . . . . . . . . . . . . . . . . . . 100.0 2.7 (0.25) 38.3 (0.69) 29.0 (0.73) 30.0 (0.64) ≥2 and <4 times poverty level . . . . . . . . . . . . . . . . . . 100.0 2.6 (0.21) 43.3 (0.65) 28.2 (0.54) 26.0 (0.54) 4 times poverty level or more . . . . . . . . . . . . . . . . . . . 100.0 2.8 (0.20) 51.1 (0.62) 27.2 (0.52) 18.9 (0.44)
Marital status: Never married . . . . . . . . . . . . . . . . . . . . . . . . . . . . 100.0 4.5 (0.48) 43.5 (0.87) 24.0 (0.75) 27.9 (0.80) Married . . . . . . . . . . . . . . . . . . . . . . . . . . . . . . . . 100.0 2.3 (0.14) 44.5 (0.45) 29.4 (0.38) 23.8 (0.38) Cohabiting . . . . . . . . . . . . . . . . . . . . . . . . . . . . . . 100.0 2.3 (0.36) 44.6 (1.67) 27.8 (1.56) 25.4 (1.43) Divorced or separated . . . . . . . . . . . . . . . . . . . . . . . 100.0 2.1 (0.23) 39.2 (0.77) 28.2 (0.65) 30.5 (0.76) Widowed . . . . . . . . . . . . . . . . . . . . . . . . . . . . . . . 100.0 1.6 (0.38) 34.8 (2.82) 31.5 (2.75) 32.0 (2.70)
Geographic region: Northeast . . . . . . . . . . . . . . . . . . . . . . . . . . . . . . . 100.0 3.1 (0.29) 47.3 (0.82) 26.9 (0.61) 22.7 (0.64) Midwest . . . . . . . . . . . . . . . . . . . . . . . . . . . . . . . . 100.0 2.5 (0.19) 43.6 (0.80) 27.7 (0.56) 26.1 (0.71) South . . . . . . . . . . . . . . . . . . . . . . . . . . . . . . . . . 100.0 2.8 (0.18) 41.8 (0.54) 28.7 (0.46) 26.7 (0.47) West . . . . . . . . . . . . . . . . . . . . . . . . . . . . . . . . . . 100.0 2.6 (0.21) 46.7 (0.66) 28.0 (0.56) 22.6 (0.50)
* Estimates preceded by an asterisk have a relative standard error of greater than 30% and less than or equal to 50%. These should be interpreted with caution as they do not meet the standard of reliability or precision.
† Estimates with a relative standard error greater than 50% are indicated with a dagger, but are not shown.
– Quantity zero. 1Body weight status was based on Body Mass Index (BMI) calculated as kilograms/meters2, using self-reported height and weight. Underweight is a BMI of less than 18.5; Healthy weight is a BMI of greater than or equal to 18.5 and less than 25; Overweight, but not obese is a BMI of greater than or equal to 25 and less than 30; Obese is a BMI of greater than or equal to 30. 2Persons of other races and unknown race and ethnicity, unknown education, unknown poverty status, and unknown marital status are included in the total. 3Estimates for age groups are not age adjusted. 4GED is General Educational Development high school equivalency diploma. 5Poverty status is based on family income and family size using the U.S. Census Bureau poverty thresholds for 2004, 2005, and 2006.
NOTES: Unless otherwise specified, estimates are age adjusted using the projected 2000 U.S. population as the standard population and using three age groups: 18–44 years, 45–64 years, and 65 years and over. For crude percent distributions, refer to Appendix Table XVIII. Denominator for each percent distribution excludes persons with unknown body mass index. See Appendix II for definitions of terms. See Appendix III for health behavior questions.
DATA SOURCE: National Health Interview Survey, 2005–2007. Estimates are based on household interviews of a sample of the civilian noninstitutionalized population.

Less than 6 hours 6 hours 7–8 hours 9 hours or more
100
7.7
20.3
63.5
8.5
7.6
20.8
63.6
8.0
7.7
19.8
63.4
9.1
80
Per
cent 60
40
20
0 Both sexes Men Women
NOTES: Estimates are based on household interviews of a sample of the civilian noninstitutionalized population. Estimates are age adjusted using the projected 2000 U.S. population as the standard population.
DATA SOURCE: CDC/NCHS: National Health Interview Survey, 2005–2007.
40 37.136.3
30 27.0 28.8 27.7
Married Cohabiting Divorced or separated
Per
cent
20
10
0 Widowed Never married
NOTES: Estimates are based on household interviews of a sample of the civilian noninstitutionalized population. Estimates are age adjusted using the projected 2000 U.S. population as the standard population.
DATA SOURCE: CDC/NCHS, National Health Interview Survey, 2005–2007.
Series 10, No. 245 [ Page 61
Figure 7.1. Percent distributions of hours of sleep in a 24-hour period, by sex: United States, 2005–2007
Figure 7.2. Percentage of adults who slept 6 hours of less in a 24-hour period, by marital status: United States, 2005–2007
Chapter 7 Sleep
All Adults Overall, about 6 in 10 adults + (63.5%) usually slept 7 to 8 hours in a 24-hour period (Table 7.1).
+ Almost 3 in 10 adults (28.0%) averaged 6 hours of sleep or less in a 24-hour period—20.3% of adults slept 6 hours and 7.7% slept less than 6 hours (Table 7.1 and Figure 7.1).
+ Fewer than 1 in 10 adults (8.5%) slept an average of 9 hours or more (Table 7.1).
Sex + Men and women were about equally
likely to usually sleep 7 to 8 hours (Table 7.1).
+ Differences between men and women in usual hours of sleep varied by age. Among adults aged 25–44 years, men were more likely than women to sleep 6 hours or less, whereas among adults aged 65 years and over, women were more likely than men to usually sleep 6 hours or less.
Age + Adults aged 25–64 years were the
most likely to usually sleep 6 hours or less and the least likely to sleep 9 hours or more compared with both younger and older adults (Table 7.1).
+ Adults aged 75 years and over were the least likely to sleep 7–8 hours (58.0%) and the most likely to sleep 9 hours or more (20.2%) (Table 7.1).
Race + Black adults (55.5%) were less
likely than both white adults (64.7%) and Asian adults (63.7%) to sleep 7 to 8 hours.
+ Black adults (34.2%) were more likely than white adults (27.0%) and Asian adults (29.4%) to sleep 6 hours or less in a 24-hour period. Black adults were also more likely
than these two other groups to sleep 9 hours or more (Table 7.1).
Hispanic or Latino Origin and Race + Hispanic adults (65.3%) and
non-Hispanic white adults (64.4%) were more likely than non-Hispanic black adults (55.4%) to sleep 7 to 8 hours a night (Table 7.1).
Education + About 7 in 10 adults who had a
bachelor’s degree (69.3%) or an advanced degree (70.2%) averaged 7 to 8 hours of sleep compared with about one-half of adults who had a GED (52.2%) and about 6 in 10 other adults who were not college graduates (Table 7.1).

Page 62 [ Series 10, No. 245
Poverty Status + Adults with family incomes below
the poverty threshold (12.5%) and those with family incomes at or just above the poverty threshold (9.8%) were the most likely to sleep 9 hours or more (Table 7.1).
Marital Status + Divorced or separated adults
(36.3%) were more likely than married adults (27.0%), never married adults (27.7%), and cohabiting adults (28.8%) to sleep 6 hours or less (Table 7.1 and Figure 7.2).
Geographic Region + Adults living in the West (66.5%)
were the most likely to sleep 7 to 8 hours compared with adults in the Midwest (62.7%), South (63.0%), and Northeast (61.9%) (Table 7.1).

Series 10, No. 245 [ Page 63
Table 7.1. Age-adjusted percent distributions (with standard errors) of usual hours of sleep for adults 18 years of age and over, by selected characteristics: United States, 2005–2007
Hours of sleep1
Selected characteristic Total 6 or less 7–8 9 or more
Both sexes Percent distribution (standard error)
Ages 18 years and over (age-adjusted)2 . . . . . . . . . . . . . 100.0 28.0 (0.22) 63.5 (0.24) 8.5 (0.12) Ages 18 years and over (crude)2 . . . . . . . . . . . . . . . . . . 100.0 28.1 (0.22) 63.5 (0.24) 8.4 (0.12)
Age:3
18–24 years . . . . . . . . . . . . . . . . . . . . . . . . . . . . . 100.0 22.8 (0.63) 64.7 (0.71) 12.5 (0.49) 25–44 years . . . . . . . . . . . . . . . . . . . . . . . . . . . . . 100.0 30.2 (0.34) 64.1 (0.36) 5.8 (0.17) 45–64 years . . . . . . . . . . . . . . . . . . . . . . . . . . . . . 100.0 30.4 (0.38) 63.5 (0.40) 6.1 (0.19) 65–74 years . . . . . . . . . . . . . . . . . . . . . . . . . . . . . 100.0 23.9 (0.60) 63.5 (0.64) 12.6 (0.44) 75 years and over . . . . . . . . . . . . . . . . . . . . . . . . . . 100.0 21.9 (0.59) 58.0 (0.69) 20.2 (0.59)
Race: White, single race . . . . . . . . . . . . . . . . . . . . . . . . . . 100.0 27.0 (0.25) 64.7 (0.27) 8.3 (0.14) Black or African American, single race . . . . . . . . . . . . . 100.0 34.2 (0.56) 55.5 (0.60) 10.3 (0.34) American Indian or Alaska Native, single race . . . . . . . . 100.0 30.2 (2.35) 57.3 (2.99) 12.5 (1.90) Asian, single race . . . . . . . . . . . . . . . . . . . . . . . . . . 100.0 29.4 (0.93) 63.7 (0.99) 6.9 (0.57) Native Hawaiian or Other Pacific Islander, single race. . . . 100.0 36.3 (5.67) 60.2 (5.64) † Two or more races . . . . . . . . . . . . . . . . . . . . . . . . . 100.0 33.9 (1.94) 53.9 (2.06) 12.2 (1.65)
Black or African American, white . . . . . . . . . . . . . . . 100.0 36.3 (5.08) 56.2 (5.33) 7.5 (2.16) American Indian or Alaska Native, white . . . . . . . . . . . 100.0 31.0 (2.53) 55.0 (2.80) 14.1 (2.69)
Hispanic or Latino origin and race: Hispanic or Latino . . . . . . . . . . . . . . . . . . . . . . . . . . 100.0 26.3 (0.53) 65.3 (0.54) 8.4 (0.30)
Mexican or Mexican American . . . . . . . . . . . . . . . . . 100.0 23.1 (0.66) 66.9 (0.71) 9.9 (0.44) Not Hispanic or Latino . . . . . . . . . . . . . . . . . . . . . . . 100.0 28.5 (0.24) 63.0 (0.27) 8.5 (0.14)
White, single race . . . . . . . . . . . . . . . . . . . . . . . . 100.0 27.4 (0.28) 64.4 (0.30) 8.2 (0.15) Black or African American, single race . . . . . . . . . . . . 100.0 34.3 (0.56) 55.4 (0.61) 10.3 (0.35)
Education: Less than high school graduate . . . . . . . . . . . . . . . . . 100.0 27.8 (0.51) 59.8 (0.55) 12.4 (0.36) GED diploma4 . . . . . . . . . . . . . . . . . . . . . . . . . . . . 100.0 36.3 (1.33) 52.2 (1.32) 11.4 (1.01) High school graduate . . . . . . . . . . . . . . . . . . . . . . . . 100.0 27.9 (0.39) 62.8 (0.45) 9.3 (0.27) Some college—no degree . . . . . . . . . . . . . . . . . . . . . 100.0 30.1 (0.46) 61.5 (0.51) 8.4 (0.30) Associate of arts degree . . . . . . . . . . . . . . . . . . . . . . 100.0 29.9 (0.62) 63.2 (0.67) 6.8 (0.37) Bachelor of arts, science degree . . . . . . . . . . . . . . . . . 100.0 24.9 (0.48) 69.3 (0.49) 5.8 (0.27) Masters, doctorate, medical degree . . . . . . . . . . . . . . . 100.0 24.4 (0.67) 70.2 (0.71) 5.4 (0.33)
Poverty status:5
Below poverty level . . . . . . . . . . . . . . . . . . . . . . . . . 100.0 31.7 (0.61) 55.8 (0.63) 12.5 (0.41) ≥1 and <2 times poverty level . . . . . . . . . . . . . . . . . . 100.0 30.3 (0.52) 59.8 (0.53) 9.8 (0.36) ≥2 and <4 times poverty level . . . . . . . . . . . . . . . . . . 100.0 28.0 (0.38) 63.2 (0.39) 8.7 (0.23) 4 times poverty level or more . . . . . . . . . . . . . . . . . . . 100.0 25.9 (0.36) 67.6 (0.40) 6.5 (0.22)
Marital status: Never married . . . . . . . . . . . . . . . . . . . . . . . . . . . . 100.0 27.7 (0.54) 62.4 (0.60) 9.9 (0.35) Married . . . . . . . . . . . . . . . . . . . . . . . . . . . . . . . . 100.0 27.0 (0.29) 65.8 (0.30) 7.2 (0.16) Cohabiting . . . . . . . . . . . . . . . . . . . . . . . . . . . . . . 100.0 28.8 (0.99) 61.4 (1.11) 9.8 (0.75) Divorced or separated . . . . . . . . . . . . . . . . . . . . . . . 100.0 36.3 (0.58) 56.6 (0.59) 7.1 (0.29) Widowed . . . . . . . . . . . . . . . . . . . . . . . . . . . . . . . 100.0 37.1 (2.60) 54.0 (2.59) 8.8 (1.18)
Geographic region: Northeast . . . . . . . . . . . . . . . . . . . . . . . . . . . . . . . 100.0 31.0 (0.49) 61.9 (0.56) 7.2 (0.27) Midwest . . . . . . . . . . . . . . . . . . . . . . . . . . . . . . . . 100.0 29.0 (0.47) 62.7 (0.51) 8.4 (0.25) South . . . . . . . . . . . . . . . . . . . . . . . . . . . . . . . . . 100.0 27.9 (0.36) 63.0 (0.40) 9.1 (0.22) West . . . . . . . . . . . . . . . . . . . . . . . . . . . . . . . . . . 100.0 24.6 (0.44) 66.5 (0.48) 8.9 (0.26)
Men
Ages 18 years and over (age-adjusted)2 . . . . . . . . . . . . . 100.0 28.4 (0.32) 63.6 (0.34) 8.0 (0.18) Ages 18 years and over (crude)2 . . . . . . . . . . . . . . . . . . 100.0 28.7 (0.32) 63.6 (0.34) 7.7 (0.18)
Age:3
18–24 years . . . . . . . . . . . . . . . . . . . . . . . . . . . . . 100.0 22.4 (0.89) 66.0 (1.04) 11.6 (0.73) 25–44 years . . . . . . . . . . . . . . . . . . . . . . . . . . . . . 100.0 32.1 (0.51) 63.3 (0.52) 4.6 (0.23) 45–64 years . . . . . . . . . . . . . . . . . . . . . . . . . . . . . 100.0 30.8 (0.54) 63.5 (0.56) 5.7 (0.26) 65–74 years . . . . . . . . . . . . . . . . . . . . . . . . . . . . . 100.0 21.9 (0.85) 64.2 (0.94) 13.9 (0.70) 75 years and over . . . . . . . . . . . . . . . . . . . . . . . . . . 100.0 18.7 (0.91) 60.3 (1.12) 21.0 (0.97)
See footnotes at end of table.

Page 64 [ Series 10, No. 245
Table 7.1. Age-adjusted percent distributions (with standard errors) of usual hours of sleep for adults 18 years of age and over, by selected characteristics: United States, 2005–2007—Con.
Hours of sleep1
Selected characteristic Total 6 or less 7–8 9 or more
Men—Con. Percent distribution (standard error)
Race: White, single race . . . . . . . . . . . . . . . . . . . . . . . . . . 100.0 27.6 (0.36) 64.7 (0.39) 7.6 (0.20) Black or African American, single race . . . . . . . . . . . . . 100.0 34.1 (0.86) 56.0 (0.90) 10.0 (0.53) American Indian or Alaska Native, single race . . . . . . . . 100.0 26.3 (3.68) 61.5 (4.07) 12.2 (2.87) Asian, single race . . . . . . . . . . . . . . . . . . . . . . . . . . 100.0 30.2 (1.32) 62.8 (1.42) 7.0 (0.86) Native Hawaiian or Other Pacific Islander, single race. . . . 100.0 34.8 (9.00) 59.4 (8.88) † Two or more races . . . . . . . . . . . . . . . . . . . . . . . . . 100.0 30.4 (2.72) 55.7 (3.10) 13.9 (2.96)
Black or African American, white . . . . . . . . . . . . . . . 100.0 34.9 (8.35) 56.5 (8.17) † American Indian or Alaska Native, white . . . . . . . . . . . 100.0 27.4 (3.71) 56.9 (4.30) 15.6 (4.44)
Hispanic or Latino origin and race: Hispanic or Latino . . . . . . . . . . . . . . . . . . . . . . . . . . 100.0 25.8 (0.78) 67.1 (0.79) 7.1 (0.40)
Mexican or Mexican American . . . . . . . . . . . . . . . . . 100.0 22.4 (0.99) 68.8 (1.04) 8.8 (0.61) Not Hispanic or Latino . . . . . . . . . . . . . . . . . . . . . . . 100.0 29.0 (0.35) 62.9 (0.37) 8.1 (0.20)
White, single race . . . . . . . . . . . . . . . . . . . . . . . . 100.0 28.3 (0.40) 64.0 (0.43) 7.6 (0.22) Black or African American, single race . . . . . . . . . . . . 100.0 34.1 (0.88) 55.8 (0.91) 10.1 (0.54)
Education: Less than high school graduate . . . . . . . . . . . . . . . . . 100.0 25.9 (0.74) 62.1 (0.80) 11.9 (0.55) GED diploma4 . . . . . . . . . . . . . . . . . . . . . . . . . . . . 100.0 36.2 (1.86) 52.5 (1.94) 11.3 (1.50) High school graduate . . . . . . . . . . . . . . . . . . . . . . . . 100.0 28.1 (0.56) 62.9 (0.65) 8.9 (0.37) Some college—no degree . . . . . . . . . . . . . . . . . . . . . 100.0 31.2 (0.71) 60.8 (0.76) 7.9 (0.44) Associate of arts degree . . . . . . . . . . . . . . . . . . . . . . 100.0 30.8 (0.99) 63.1 (1.07) 6.1 (0.57) Bachelor of arts, science degree . . . . . . . . . . . . . . . . . 100.0 26.6 (0.70) 68.2 (0.73) 5.2 (0.38) Masters, doctorate, medical degree . . . . . . . . . . . . . . . 100.0 26.3 (0.99) 69.7 (1.03) 4.0 (0.36)
Poverty status:5
Below poverty level . . . . . . . . . . . . . . . . . . . . . . . . . 100.0 29.5 (0.94) 58.0 (1.01) 12.5 (0.67) ≥1 and <2 times poverty level . . . . . . . . . . . . . . . . . . 100.0 29.4 (0.80) 60.6 (0.80) 10.0 (0.55) ≥2 and <4 times poverty level . . . . . . . . . . . . . . . . . . 100.0 28.8 (0.60) 62.8 (0.59) 8.4 (0.36) 4 times poverty level or more . . . . . . . . . . . . . . . . . . . 100.0 27.7 (0.51) 66.5 (0.55) 5.8 (0.30)
Marital status: Never married . . . . . . . . . . . . . . . . . . . . . . . . . . . . 100.0 27.3 (0.79) 62.8 (0.87) 9.9 (0.52) Married . . . . . . . . . . . . . . . . . . . . . . . . . . . . . . . . 100.0 28.4 (0.43) 65.3 (0.45) 6.3 (0.21) Cohabiting . . . . . . . . . . . . . . . . . . . . . . . . . . . . . . 100.0 30.6 (1.41) 61.0 (1.50) 8.4 (0.95) Divorced or separated . . . . . . . . . . . . . . . . . . . . . . . 100.0 36.7 (0.95) 56.3 (0.99) 6.9 (0.46) Widowed . . . . . . . . . . . . . . . . . . . . . . . . . . . . . . . 100.0 44.7 (5.79) 48.9 (5.74) 6.4 (1.05)
Geographic region: Northeast . . . . . . . . . . . . . . . . . . . . . . . . . . . . . . . 100.0 32.2 (0.73) 60.9 (0.80) 7.0 (0.44) Midwest . . . . . . . . . . . . . . . . . . . . . . . . . . . . . . . . 100.0 29.4 (0.70) 62.7 (0.75) 7.8 (0.36) South . . . . . . . . . . . . . . . . . . . . . . . . . . . . . . . . . 100.0 28.2 (0.51) 63.3 (0.55) 8.5 (0.31) West . . . . . . . . . . . . . . . . . . . . . . . . . . . . . . . . . . 100.0 24.6 (0.62) 67.2 (0.68) 8.2 (0.39)
Women
Ages 18 years and over (age-adjusted)2 . . . . . . . . . . . . . 100.0 27.5 (0.28) 63.4 (0.31) 9.1 (0.16) Ages 18 years and over (crude)2 . . . . . . . . . . . . . . . . . . 100.0 27.6 (0.28) 63.3 (0.30) 9.1 (0.16)
Age:3
18–24 years . . . . . . . . . . . . . . . . . . . . . . . . . . . . . 100.0 23.2 (0.83) 63.4 (0.95) 13.4 (0.68) 25–44 years . . . . . . . . . . . . . . . . . . . . . . . . . . . . . 100.0 28.3 (0.45) 64.8 (0.47) 6.9 (0.24) 45–64 years . . . . . . . . . . . . . . . . . . . . . . . . . . . . . 100.0 30.0 (0.48) 63.6 (0.51) 6.4 (0.26) 65–74 years . . . . . . . . . . . . . . . . . . . . . . . . . . . . . 100.0 25.7 (0.81) 62.9 (0.87) 11.4 (0.55) 75 years and over . . . . . . . . . . . . . . . . . . . . . . . . . . 100.0 23.9 (0.76) 56.5 (0.88) 19.6 (0.72)
Race: White, single race . . . . . . . . . . . . . . . . . . . . . . . . . . 100.0 26.2 (0.31) 64.8 (0.34) 8.9 (0.18) Black or African American, single race . . . . . . . . . . . . . 100.0 34.3 (0.72) 55.2 (0.78) 10.6 (0.41) American Indian or Alaska Native, single race . . . . . . . . 100.0 33.8 (2.99) 53.0 (3.28) 13.1 (2.42) Asian, single race . . . . . . . . . . . . . . . . . . . . . . . . . . 100.0 28.5 (1.33) 64.6 (1.40) 6.8 (0.73) Native Hawaiian or Other Pacific Islander, single race. . . . 100.0 38.9 (7.27) 60.1 (7.27) † Two or more races . . . . . . . . . . . . . . . . . . . . . . . . . 100.0 37.1 (2.73) 51.9 (2.62) 10.9 (1.54)
Black or African American, white . . . . . . . . . . . . . . . 100.0 37.6 (6.18) 54.1 (6.22) *8.3 (2.95) American Indian or Alaska Native, white . . . . . . . . . . . 100.0 35.0 (3.60) 52.5 (3.74) 12.5 (2.41)
See footnotes at end of table.
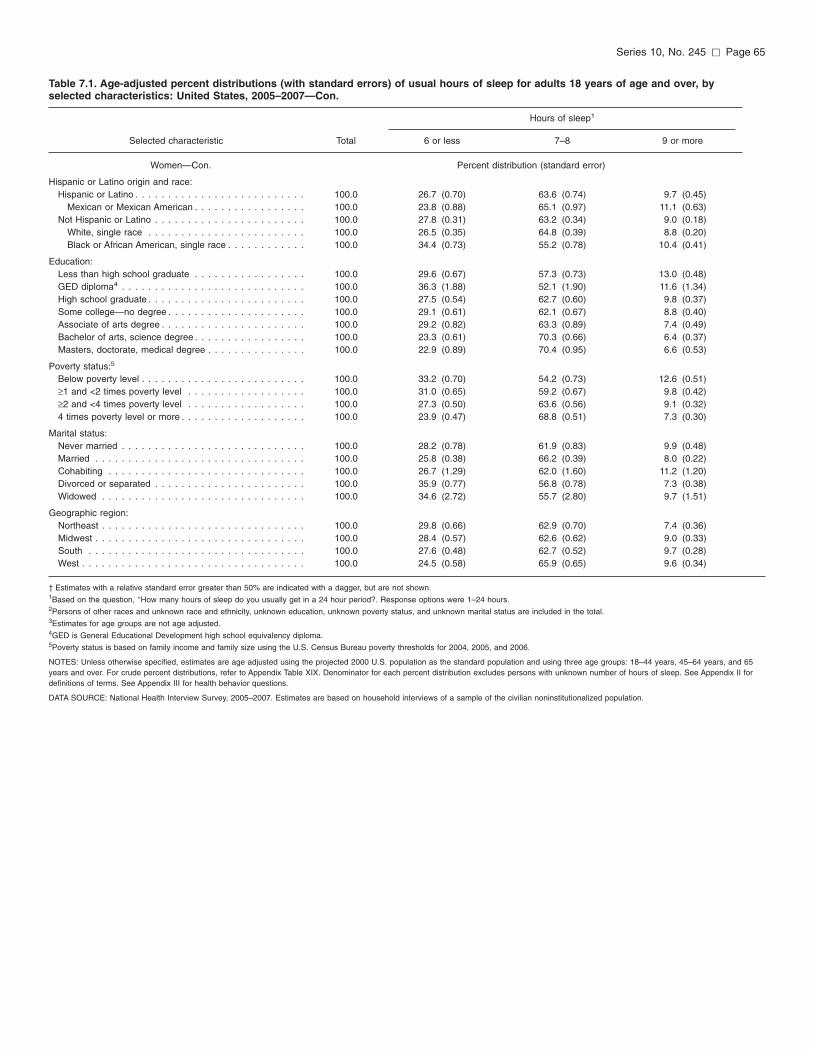
Series 10, No. 245 [ Page 65
Table 7.1. Age-adjusted percent distributions (with standard errors) of usual hours of sleep for adults 18 years of age and over, by selected characteristics: United States, 2005–2007—Con.
Hours of sleep1
Selected characteristic Total 6 or less 7–8 9 or more
Women—Con. Percent distribution (standard error)
Hispanic or Latino origin and race: Hispanic or Latino . . . . . . . . . . . . . . . . . . . . . . . . . . 100.0 26.7 (0.70) 63.6 (0.74) 9.7 (0.45)
Mexican or Mexican American . . . . . . . . . . . . . . . . . 100.0 23.8 (0.88) 65.1 (0.97) 11.1 (0.63) Not Hispanic or Latino . . . . . . . . . . . . . . . . . . . . . . . 100.0 27.8 (0.31) 63.2 (0.34) 9.0 (0.18)
White, single race . . . . . . . . . . . . . . . . . . . . . . . . 100.0 26.5 (0.35) 64.8 (0.39) 8.8 (0.20) Black or African American, single race . . . . . . . . . . . . 100.0 34.4 (0.73) 55.2 (0.78) 10.4 (0.41)
Education: Less than high school graduate . . . . . . . . . . . . . . . . . 100.0 29.6 (0.67) 57.3 (0.73) 13.0 (0.48) GED diploma4 . . . . . . . . . . . . . . . . . . . . . . . . . . . . 100.0 36.3 (1.88) 52.1 (1.90) 11.6 (1.34) High school graduate . . . . . . . . . . . . . . . . . . . . . . . . 100.0 27.5 (0.54) 62.7 (0.60) 9.8 (0.37) Some college—no degree . . . . . . . . . . . . . . . . . . . . . 100.0 29.1 (0.61) 62.1 (0.67) 8.8 (0.40) Associate of arts degree . . . . . . . . . . . . . . . . . . . . . . 100.0 29.2 (0.82) 63.3 (0.89) 7.4 (0.49) Bachelor of arts, science degree . . . . . . . . . . . . . . . . . 100.0 23.3 (0.61) 70.3 (0.66) 6.4 (0.37) Masters, doctorate, medical degree . . . . . . . . . . . . . . . 100.0 22.9 (0.89) 70.4 (0.95) 6.6 (0.53)
Poverty status:5
Below poverty level . . . . . . . . . . . . . . . . . . . . . . . . . 100.0 33.2 (0.70) 54.2 (0.73) 12.6 (0.51) ≥1 and <2 times poverty level . . . . . . . . . . . . . . . . . . 100.0 31.0 (0.65) 59.2 (0.67) 9.8 (0.42) ≥2 and <4 times poverty level . . . . . . . . . . . . . . . . . . 100.0 27.3 (0.50) 63.6 (0.56) 9.1 (0.32) 4 times poverty level or more . . . . . . . . . . . . . . . . . . . 100.0 23.9 (0.47) 68.8 (0.51) 7.3 (0.30)
Marital status: Never married . . . . . . . . . . . . . . . . . . . . . . . . . . . . 100.0 28.2 (0.78) 61.9 (0.83) 9.9 (0.48) Married . . . . . . . . . . . . . . . . . . . . . . . . . . . . . . . . 100.0 25.8 (0.38) 66.2 (0.39) 8.0 (0.22) Cohabiting . . . . . . . . . . . . . . . . . . . . . . . . . . . . . . 100.0 26.7 (1.29) 62.0 (1.60) 11.2 (1.20) Divorced or separated . . . . . . . . . . . . . . . . . . . . . . . 100.0 35.9 (0.77) 56.8 (0.78) 7.3 (0.38) Widowed . . . . . . . . . . . . . . . . . . . . . . . . . . . . . . . 100.0 34.6 (2.72) 55.7 (2.80) 9.7 (1.51)
Geographic region: Northeast . . . . . . . . . . . . . . . . . . . . . . . . . . . . . . . 100.0 29.8 (0.66) 62.9 (0.70) 7.4 (0.36) Midwest . . . . . . . . . . . . . . . . . . . . . . . . . . . . . . . . 100.0 28.4 (0.57) 62.6 (0.62) 9.0 (0.33) South . . . . . . . . . . . . . . . . . . . . . . . . . . . . . . . . . 100.0 27.6 (0.48) 62.7 (0.52) 9.7 (0.28) West . . . . . . . . . . . . . . . . . . . . . . . . . . . . . . . . . . 100.0 24.5 (0.58) 65.9 (0.65) 9.6 (0.34)
† Estimates with a relative standard error greater than 50% are indicated with a dagger, but are not shown. 1Based on the question, ‘‘How many hours of sleep do you usually get in a 24 hour period?. Response options were 1–24 hours. 2Persons of other races and unknown race and ethnicity, unknown education, unknown poverty status, and unknown marital status are included in the total. 3Estimates for age groups are not age adjusted. 4GED is General Educational Development high school equivalency diploma. 5Poverty status is based on family income and family size using the U.S. Census Bureau poverty thresholds for 2004, 2005, and 2006.
NOTES: Unless otherwise specified, estimates are age adjusted using the projected 2000 U.S. population as the standard population and using three age groups: 18–44 years, 45–64 years, and 65 years and over. For crude percent distributions, refer to Appendix Table XIX. Denominator for each percent distribution excludes persons with unknown number of hours of sleep. See Appendix II for definitions of terms. See Appendix III for health behavior questions.
DATA SOURCE: National Health Interview Survey, 2005–2007. Estimates are based on household interviews of a sample of the civilian noninstitutionalized population.

Page 66 [ Series 10, No. 245
Chapter 8 Summary and Conclusions
Summary This chapter summarizes the major
findings described in the earlier chapters, but from a different viewpoint. Rather than describing variations in prevalence of individual behaviors, this chapter focuses on population subgroups, highlighting the differences across the behaviors. Table 8.1 shows a comparison of ‘‘unhealthy’’ behaviors across population subgroups, while Table 8.2 presents the same comparisons for ‘‘healthy’’ behaviors. Because behaviors may occur on a continuum, classification of ‘‘healthy’’ and ‘‘unhealthy’’ was not always straightforward. Although there is little controversy over the classification of ‘‘current cigarette smoker’’ as ‘‘unhealthy,’’ the decision to present only ‘‘never smoked cigarettes’’ in the table on ‘‘healthy behaviors’’ was somewhat arbitrary. One might also have shown ‘‘not current cigarette smoker.’’ Similarly, the presentation of ‘‘five or more drinks in 1 day’’ is only one indicator of possibly harmful levels of alcohol consumption (7). Classification of healthy alcohol use is even more problematic, as studies on the health benefits of light or moderate alcohol use abound but a clear consensus on ‘‘healthy alcohol use’’ has not been reached (7).
Unhealthy behaviors (Table 8.1)
Overall, 1 in 5 U.S. adults had five or more drinks in a single day at least once in the past year; 1 in 5 adults were current cigarette smokers; 4 in 10 adults were physically inactive in their leisure time; 1 in 4 adults were obese; and about 3 in 10 adults averaged 6 hours or less of sleep in a 24-hour period.
Examination of sex differences in these unhealthy behaviors revealed that men were more than twice as likely as women to have consumed five or more drinks in 1 day in the past year. Men
were also more likely than women to be current smokers and to sleep 6 hours or less, although the gender differences were more modest than for having had five or more drinks of alcohol. Men were somewhat less likely than women to be physically inactive in terms of leisure-time physical activities. Men and women did not differ in terms of prevalence of obesity.
Overall, compared with adults in most other age groups, adults aged 18–24 years were more likely to have had five or more drinks in 1 day at least once in the past year and to be current smokers; they were less likely to be physically inactive in their leisure-time, to be obese, or to sleep 6 hours or less. Adults aged 25–64 years were the most likely to sleep 6 hours or less compared with both the youngest and the two oldest age groups.
Variations in prevalence of unhealthy behaviors by race and ethnicity were found. Asian adults had significantly lower rates of ‘‘at risk’’ drinking (that is, having five or more drinks in 1 day at least once in the past year), current smoking, and obesity compared with all other race groups. Prevalence of ‘‘at risk’’ drinking was nearly twice as high among white adults (22.5%) as among black adults (11.9%), whereas prevalence of leisure-time physical inactivity and obesity were markedly higher among black adults than white adults. Overall, adults of Hispanic origin were less likely to have had five or more drinks in 1 day at least once in the past year, to be current smokers, or to average 6 hours or less of sleep, but were more likely to be physically inactive and more likely to be obese compared with non-Hispanic adults. Differences between Hispanic and non-Hispanic adults were particularly noteworthy for women. Hispanic women had very low rates of smoking compared with non-Hispanic white women and non-Hispanic black women. Hispanic women also had much lower rates of having had five or more drinks at least once in the past year than non-Hispanic white women.
Educational differences in health behaviors are generally consistent across the behaviors studied. Adults with higher levels of education were less
likely than those with fewer years of education to be current smokers, to be physically inactive in their leisure time, to be obese, and to sleep 6 hours or less in a 24-hour period. The association between education and alcohol consumption was more complex, with prevalence of having five or more drinks in 1 day at least once in the past year lowest among adults who had not graduated from high school and those who had achieved a masters degree or higher, and higher among those with levels of education in between. One of the most interesting findings with respect to education and health behaviors was the prevalence of some of the behaviors among adults who had obtained a GED diploma. Although on the educational achievement continuum, this group falls between those who graduated from high school and those who did not; in some cases their health behaviors are very different from both of these groups. GED holders were more likely than both nonhigh school graduates and high school graduates to have had five or more drinks in 1 day at least once in the past year. Similarly, GED holders were more likely than both nonhigh school graduates and high school graduates to be current smokers. Adults with a GED were less likely than nonhigh school graduates and more likely than high school graduates to be physically inactive. Adults with a GED were similar to nonhigh school graduates in terms of prevalence of obesity. GED holders were more likely to sleep 6 hours or less than nonhigh school graduates and high school graduates.
Prevalence of engaging in unhealthy behaviors did not show a consistent association with family income level. Whereas prevalence of cigarette smoking and lack of leisure-time physical activity declined steadily with increasing family income for both men and women, prevalence of having had five or more drinks in 1 day at least once in the past year increased modestly, most notably among adults at the highest family income level. Prevalence of obesity declined sharply with increasing family income for women but not for men. Women at the lower family income levels were more

Series 10, No. 245 [ Page 67
likely to average 6 hours or less of sleep than women with higher family incomes. No family income differences in sleep were noted for men.
Some interesting marital status differences were noted in prevalence of unhealthy behaviors, but the findings were not consistent across the behaviors and were not always the same for men and women. Married adults, both men and women, had lower prevalence of current cigarette smoking than all other marital status groups. Widowed women (but not men) had the lowest prevalence of ‘‘at risk’’ drinking. Married women had among the lowest and married men had among the highest rates of obesity compared with other marital status groups. Rates of ‘‘at risk’’ drinking and smoking were higher for cohabiting (that is, living together as if married) adults than for married adults. Divorced or separated adults were more likely to sleep 6 hours or less than adults in most other marital status categories.
Some variations were found in prevalence of unhealthy behaviors by geographic region, although the results did not provide any clear and systematic picture of differences by this characteristic. Adults living in the South had the lowest prevalence of having had five or more drinks in 1 day at least once in the past year, the highest prevalence of being physically inactive in leisure time, and among the highest prevalence of obesity. Adults living in the West had the lowest smoking rates compared with adults living in other regions and were the least likely to average 6 hours or less of sleep in a 24-hour period.
Healthy behaviors (Table 8.2)
Overall, about 6 in 10 adults had never smoked cigarettes, about 3 in 10 were regularly physically active in their leisure time, almost 4 in 10 were of healthy weight, and about 6 in 10 usually slept 7 to 8 hours in a 24-hour period.
Women were more likely than men to have never smoked cigarettes, and to be of healthy body weight; men were more likely than women to engage in regular leisure-time physical activity. Men and women were equally likely to
sleep 7 to 8 hours a night. Younger adults were more likely
than older adults to have never smoked cigarettes, to engage in regular leisure-time physical activity, and to be of healthy weight. Adults aged 75 years and over were less likely than all other age groups to average 7 to 8 hours of sleep in a 24-hour period.
Prevalence of healthy behaviors was not consistent across race or Hispanic origin subgroups. Black and Asian adults were more likely than white adults to have never smoked cigarettes. White adults and Asian adults were more likely than black adults to engage in regular leisure-time physical activity and to sleep 7 to 8 hours. Asian adults were the group most likely to be of healthy weight. White women were considerably more likely than black women to be of healthy weight, whereas prevalence of healthy weight was about the same for white men and black men. Prevalence of sleeping 7 to 8 hours was similar for Asian adults and white adults; both groups were more likely than black adults to sleep this amount.
Hispanic adults were more likely than non-Hispanic adults to have never smoked cigarettes and to average 7 to 8 hours of sleep, but Hispanic adults were less likely than non-Hispanic adults to engage in regular leisure-time physical activity and to be of healthy weight.
Prevalence of healthy behaviors was strongly associated with education: persons with higher levels of education were more likely than those with less education to have never smoked cigarettes, to be regularly physically active in their leisure time, to be of healthy weight, and to usually sleep 7 to 8 hours in a 24-hour period.
The associations between family income level and healthy behaviors varied by behavior and in some cases differed for men and women. Among women, prevalence of regular leisure-time physical activity and prevalence of healthy body weight showed clear and consistent positive associations with family income level. In contrast, among men, prevalence of regular leisure-time physical activity increased but prevalence of healthy weight decreased with increased level of family income. For both men and
women, prevalence of never having smoked cigarettes and usually sleeping 7 to 8 hours in a night increased between the lowest and highest level of family income.
Findings related to marital status were mixed. Never married and married adults were more likely than adults in the other marital status groups to have never smoked cigarettes. Never married men were more likely than married men to be of healthy weight although the same was not found for women; never married women and married women were about equally likely to be of healthy weight. Married adults—both men and women—were more likely than adults who were not married to usually sleep 7 to 8 hours in a 24-hour period.
Prevalence of health behaviors varied by region, but no one region stood out as having consistently higher prevalence of healthy behaviors. Adults living in the West had the highest prevalence of never having smoked cigarettes and usually sleeping 7 to 8 hours in a 24-hour period. Adults living in the West were similar to adults living in the Northeast in terms of prevalence of healthy body weight. Adults living in the South were the least likely to engage in regular physical activity.
Conclusions This report highlights
sociodemographic variations in alcohol use, cigarette smoking, leisure-time physical activity, body weight status, and usually sleeping 7 to 8 hours in a 24-hour period among adults in the United States during the period 2005–2007. It is the fourth report since 1997, when the NHIS began collecting annual data on health behaviors to examine variations in these key health indicators among important population subgroups. Since 1997, rates of cigarette smoking have declined by several percentage points, rates of obesity have climbed, and rates of alcohol use, leisure-time physical activity, and sleep (introduced in 2004) have remained relatively unchanged. Comparisons of the findings presented in this report for 2005–2007 with those for earlier periods can help identify subgroups that may have benefited more or less than others

Page 68 [ Series 10, No. 245
by the major health promotion initiatives that have been underway in this country in the past decade. Readers interested in trends are encouraged to refer to these earlier reports (29–34).
Series 10, No. 245 [ Page 69
Table 8.1. Age-adjusted percentages (with standard errors) of adults 18 years of age and over who engaged in selected unhealthy behaviors, by selected characteristics: United States, average annual, 2005–2007
Selected unhealthy behaviors
Five or more drinks in 1 day Current Physically Slept at least once cigarette inactive 6 hours
Selected characteristic (past year)1 smoker2 (leisure time)3 Obese4 or less5
Both sexes Percent (standard error)
Ages 18 years and over (age-adjusted)6 . . . . . . . . . . . . . 20.5 (0.24) 20.4 (0.21) 39.7 (0.40) 25.4 (0.22) 28.0 (0.22) Ages 18 years and over (crude)6 . . . . . . . . . . . . . . . . . . 20.2 (0.25) 20.5 (0.21) 39.7 (0.40) 25.6 (0.22) 28.1 (0.22)
Age:7
18–24 years . . . . . . . . . . . . . . . . . . . . . . . . . . . . . 31.9 (0.84) 23.5 (0.67) 33.7 (0.79) 16.0 (0.52) 22.8 (0.63) 25–44 years . . . . . . . . . . . . . . . . . . . . . . . . . . . . . 27.4 (0.40) 23.4 (0.32) 35.5 (0.51) 26.1 (0.34) 30.2 (0.34) 45–64 years . . . . . . . . . . . . . . . . . . . . . . . . . . . . . 15.6 (0.29) 21.6 (0.34) 39.9 (0.50) 30.3 (0.39) 30.4 (0.38) 65–74 years . . . . . . . . . . . . . . . . . . . . . . . . . . . . . 6.1 (0.33) 12.4 (0.44) 48.0 (0.82) 27.5 (0.62) 23.9 (0.60) 75 years and over . . . . . . . . . . . . . . . . . . . . . . . . . . 2.2 (0.22) 5.1 (0.31) 60.4 (0.80) 17.2 (0.52) 21.9 (0.59)
Race: White, single race . . . . . . . . . . . . . . . . . . . . . . . . . . 22.5 (0.28) 20.9 (0.24) 38.1 (0.43) 24.8 (0.24) 27.0 (0.25) Black or African American, single race . . . . . . . . . . . . . 11.9 (0.39) 20.7 (0.49) 51.2 (0.75) 34.2 (0.57) 34.2 (0.56) American Indian or Alaska Native, single race . . . . . . . . 24.5 (2.88) 27.2 (3.07) 38.4 (2.39) 33.2 (2.47) 30.2 (2.35) Asian, single race . . . . . . . . . . . . . . . . . . . . . . . . . . 9.2 (0.59) 10.9 (0.63) 39.7 (1.07) 8.6 (0.57) 29.4 (0.93) Native Hawaiian or Other Pacific Islander, single race. . . . 21.1 (4.78) 16.5 (4.17) 42.0 (6.78) 29.0 (4.69) 36.3 (5.67) Two or more races . . . . . . . . . . . . . . . . . . . . . . . . . 21.6 (1.58) 24.7 (1.78) 37.1 (2.00) 31.2 (1.88) 33.9 (1.94)
Black or African American, white . . . . . . . . . . . . . . . 13.7 (3.14) 17.0 (3.02) 47.3 (4.53) 20.5 (3.60) 36.3 (5.08) American Indian or Alaska Native, white . . . . . . . . . . . 27.1 (2.58) 29.7 (2.86) 37.0 (2.85) 34.6 (2.57) 31.0 (2.53)
Hispanic or Latino origin and race: Hispanic or Latino . . . . . . . . . . . . . . . . . . . . . . . . . . 17.2 (0.43) 14.2 (0.43) 53.5 (0.65) 27.6 (0.53) 26.3 (0.53)
Mexican or Mexican American . . . . . . . . . . . . . . . . . 18.8 (0.56) 14.1 (0.52) 53.2 (0.83) 29.8 (0.68) 23.1 (0.66) Not Hispanic or Latino . . . . . . . . . . . . . . . . . . . . . . . 21.2 (0.27) 21.6 (0.23) 37.5 (0.43) 25.0 (0.24) 28.5 (0.24)
White, single race . . . . . . . . . . . . . . . . . . . . . . . . 23.8 (0.32) 22.4 (0.27) 35.1 (0.47) 24.3 (0.26) 27.4 (0.28) Black or African American, single race . . . . . . . . . . . . 11.7 (0.40) 20.8 (0.50) 51.2 (0.77) 34.6 (0.59) 34.3 (0.56)
Education: Less than high school graduate . . . . . . . . . . . . . . . . . 17.8 (0.49) 28.2 (0.56) 60.6 (0.65) 29.3 (0.51) 27.8 (0.51) GED diploma8 . . . . . . . . . . . . . . . . . . . . . . . . . . . . 24.8 (1.20) 43.4 (1.33) 51.6 (1.42) 31.9 (1.30) 36.3 (1.33) High school graduate . . . . . . . . . . . . . . . . . . . . . . . . 19.5 (0.40) 24.9 (0.40) 47.3 (0.63) 28.0 (0.42) 27.9 (0.39) Some college—no degree . . . . . . . . . . . . . . . . . . . . . 22.7 (0.49) 21.3 (0.43) 34.8 (0.58) 27.0 (0.47) 30.1 (0.46) Associate of arts degree . . . . . . . . . . . . . . . . . . . . . . 21.5 (0.61) 19.9 (0.57) 32.9 (0.70) 27.4 (0.61) 29.9 (0.62) Bachelor of arts, science degree . . . . . . . . . . . . . . . . . 22.4 (0.51) 10.3 (0.34) 25.0 (0.53) 18.9 (0.43) 24.9 (0.48) Masters, doctorate, medical degree . . . . . . . . . . . . . . . 17.7 (0.63) 6.3 (0.33) 19.3 (0.61) 15.5 (0.55) 24.4 (0.67)
Poverty status:9
Below poverty level . . . . . . . . . . . . . . . . . . . . . . . . . 17.2 (0.57) 28.3 (0.66) 57.5 (0.79) 28.8 (0.59) 31.7 (0.61) ≥1 and <2 times poverty level . . . . . . . . . . . . . . . . . . 17.3 (0.44) 25.1 (0.50) 51.4 (0.65) 28.2 (0.47) 30.3 (0.52) ≥2 and <4 times poverty level . . . . . . . . . . . . . . . . . . 20.0 (0.37) 21.8 (0.37) 40.8 (0.54) 26.7 (0.40) 28.0 (0.38) 4 times poverty level or more . . . . . . . . . . . . . . . . . . . 23.6 (0.40) 15.1 (0.29) 27.8 (0.46) 22.1 (0.33) 25.9 (0.36)
Marital status: Never married . . . . . . . . . . . . . . . . . . . . . . . . . . . . 23.2 (0.49) 22.3 (0.51) 40.7 (0.67) 24.0 (0.55) 27.7 (0.54) Married . . . . . . . . . . . . . . . . . . . . . . . . . . . . . . . . 17.7 (0.27) 16.2 (0.23) 38.0 (0.46) 26.0 (0.29) 27.0 (0.29) Cohabiting . . . . . . . . . . . . . . . . . . . . . . . . . . . . . . 28.9 (0.89) 34.6 (0.97) 41.1 (1.15) 26.3 (0.94) 28.8 (0.99) Divorced or separated . . . . . . . . . . . . . . . . . . . . . . . 21.9 (0.54) 30.6 (0.56) 43.9 (0.68) 28.7 (0.57) 36.3 (0.58) Widowed . . . . . . . . . . . . . . . . . . . . . . . . . . . . . . . 10.6 (2.11) 28.3 (2.55) 53.6 (2.66) 31.7 (2.50) 37.1 (2.60)
Geographic region: Northeast . . . . . . . . . . . . . . . . . . . . . . . . . . . . . . . 21.4 (0.58) 19.0 (0.49) 37.6 (0.74) 23.5 (0.51) 31.0 (0.49) Midwest . . . . . . . . . . . . . . . . . . . . . . . . . . . . . . . . 25.1 (0.53) 23.4 (0.44) 34.4 (0.93) 26.9 (0.49) 29.0 (0.47) South . . . . . . . . . . . . . . . . . . . . . . . . . . . . . . . . . 17.6 (0.39) 21.3 (0.34) 46.0 (0.71) 26.9 (0.37) 27.9 (0.36) West . . . . . . . . . . . . . . . . . . . . . . . . . . . . . . . . . . 19.8 (0.46) 16.8 (0.43) 36.4 (0.68) 22.5 (0.42) 24.6 (0.44)
Men
Ages 18 years and over (age-adjusted)6 . . . . . . . . . . . . . 28.8 (0.37) 23.0 (0.31) 38.1 (0.47) 25.7 (0.30) 28.4 (0.32) Ages 18 years and over (crude)6 . . . . . . . . . . . . . . . . . . 28.9 (0.39) 23.4 (0.32) 38.0 (0.47) 26.0 (0.31) 28.7 (0.32)
Age:7
18–24 years . . . . . . . . . . . . . . . . . . . . . . . . . . . . . 40.7 (1.25) 27.3 (1.02) 30.8 (1.05) 15.9 (0.76) 22.4 (0.89) 25–44 years . . . . . . . . . . . . . . . . . . . . . . . . . . . . . 37.9 (0.61) 26.3 (0.48) 34.4 (0.65) 27.3 (0.49) 32.1 (0.51) 45–64 years . . . . . . . . . . . . . . . . . . . . . . . . . . . . . 23.3 (0.50) 24.1 (0.50) 40.2 (0.63) 30.5 (0.53) 30.8 (0.54) 65–74 years . . . . . . . . . . . . . . . . . . . . . . . . . . . . . 10.3 (0.62) 13.8 (0.69) 45.5 (1.12) 25.5 (0.91) 21.9 (0.85) 75 years and over . . . . . . . . . . . . . . . . . . . . . . . . . . 4.3 (0.47) 5.6 (0.53) 53.1 (1.23) 15.9 (0.86) 18.7 (0.91)
See footnotes at end of table.

Page 70 [ Series 10, No. 245
Table 8.1. Age-adjusted percentages (with standard errors) of adults 18 years of age and over who engaged in selected unhealthy behaviors, by selected characteristics: United States, average annual, 2005–2007—Con.
Selected unhealthy behaviors
Five or more drinks in 1 day Current Physically Slept at least once cigarette inactive 6 hours
Selected characteristic (past year)1 smoker2 (leisure time)3 Obese4 or less5
Men—Con. Percent (standard error)
Race: White, single race . . . . . . . . . . . . . . . . . . . . . . . . . . 31.0 (0.42) 23.0 (0.35) 37.2 (0.51) 25.8 (0.33) 27.6 (0.36) Black or African American, single race . . . . . . . . . . . . . 19.2 (0.75) 25.3 (0.82) 46.6 (1.03) 29.1 (0.82) 34.1 (0.86) American Indian or Alaska Native, single race . . . . . . . . 34.0 (4.19) 30.3 (4.73) 38.0 (3.68) 33.9 (4.01) 26.3 (3.68) Asian, single race . . . . . . . . . . . . . . . . . . . . . . . . . . 14.1 (1.05) 17.3 (1.11) 36.5 (1.41) 9.9 (0.84) 30.2 (1.32) Native Hawaiian or Other Pacific Islander, single race. . . . 30.5 (6.90) 26.1 (6.69) 45.6 (9.86) 35.5 (7.16) 34.8 (9.00) Two or more races . . . . . . . . . . . . . . . . . . . . . . . . . 28.6 (2.60) 23.8 (2.49) 36.9 (3.00) 33.5 (3.14) 30.4 (2.72)
Black or African American, white . . . . . . . . . . . . . . . 19.6 (5.72) 16.9 (4.89) 50.5 (6.91) *8.6 (3.07) 34.9 (8.35) American Indian or Alaska Native, white . . . . . . . . . . . 32.6 (3.80) 29.1 (3.83) 36.8 (4.11) 37.3 (3.83) 27.4 (3.71)
Hispanic or Latino origin and race: Hispanic or Latino . . . . . . . . . . . . . . . . . . . . . . . . . . 27.0 (0.72) 18.6 (0.70) 51.5 (0.91) 25.7 (0.73) 25.8 (0.78)
Mexican or Mexican American . . . . . . . . . . . . . . . . . 30.0 (0.95) 19.1 (0.86) 52.1 (1.18) 26.7 (0.93) 22.4 (0.99) Not Hispanic or Latino . . . . . . . . . . . . . . . . . . . . . . . 29.2 (0.41) 23.9 (0.34) 35.8 (0.51) 25.6 (0.33) 29.0 (0.35)
White, single race . . . . . . . . . . . . . . . . . . . . . . . . 32.0 (0.48) 24.2 (0.40) 34.2 (0.57) 25.6 (0.37) 28.3 (0.40) Black or African American, single race . . . . . . . . . . . . 19.0 (0.78) 25.6 (0.85) 46.6 (1.05) 29.4 (0.85) 34.1 (0.88)
Education: Less than high school graduate . . . . . . . . . . . . . . . . . 27.0 (0.79) 31.6 (0.81) 58.5 (0.90) 26.8 (0.72) 25.9 (0.74) GED diploma8 . . . . . . . . . . . . . . . . . . . . . . . . . . . . 35.0 (1.84) 48.3 (1.92) 46.0 (2.08) 29.1 (1.76) 36.2 (1.86) High school graduate . . . . . . . . . . . . . . . . . . . . . . . . 27.5 (0.64) 27.8 (0.60) 46.2 (0.81) 28.3 (0.59) 28.1 (0.56) Some college—no degree . . . . . . . . . . . . . . . . . . . . . 31.1 (0.80) 23.7 (0.67) 33.4 (0.80) 28.0 (0.72) 31.2 (0.71) Associate of arts degree . . . . . . . . . . . . . . . . . . . . . . 31.8 (1.00) 23.1 (0.93) 31.4 (1.04) 28.1 (0.93) 30.8 (0.99) Bachelor of arts, science degree . . . . . . . . . . . . . . . . . 30.4 (0.83) 11.8 (0.57) 22.9 (0.70) 21.4 (0.64) 26.6 (0.70) Masters, doctorate, medical degree . . . . . . . . . . . . . . . 23.6 (1.04) 6.6 (0.51) 17.6 (0.81) 16.8 (0.84) 26.3 (0.99)
Poverty status:9
Below poverty level . . . . . . . . . . . . . . . . . . . . . . . . . 26.2 (0.99) 31.8 (1.02) 55.2 (1.13) 23.3 (0.92) 29.5 (0.94) ≥1 and <2 times poverty level . . . . . . . . . . . . . . . . . . 25.2 (0.75) 28.8 (0.81) 50.9 (0.98) 26.0 (0.71) 29.4 (0.80) ≥2 and <4 times poverty level . . . . . . . . . . . . . . . . . . 28.0 (0.59) 24.9 (0.56) 40.2 (0.71) 27.4 (0.55) 28.8 (0.60) 4 times poverty level or more . . . . . . . . . . . . . . . . . . . 31.6 (0.61) 17.2 (0.44) 27.0 (0.55) 24.9 (0.49) 27.7 (0.51)
Marital status: Never married . . . . . . . . . . . . . . . . . . . . . . . . . . . . 30.3 (0.73) 25.5 (0.75) 39.0 (0.90) 20.4 (0.69) 27.3 (0.79) Married . . . . . . . . . . . . . . . . . . . . . . . . . . . . . . . . 25.9 (0.46) 18.3 (0.35) 37.7 (0.57) 28.4 (0.42) 28.4 (0.43) Cohabiting . . . . . . . . . . . . . . . . . . . . . . . . . . . . . . 35.7 (1.28) 35.9 (1.31) 40.4 (1.55) 27.0 (1.28) 30.6 (1.41) Divorced or separated . . . . . . . . . . . . . . . . . . . . . . . 33.3 (0.94) 35.3 (0.86) 41.6 (1.00) 26.1 (0.83) 36.7 (0.95) Widowed . . . . . . . . . . . . . . . . . . . . . . . . . . . . . . . 31.3 (6.77) 34.8 (6.11) 48.2 (6.56) 30.0 (5.86) 44.7 (5.79)
Geographic region: Northeast . . . . . . . . . . . . . . . . . . . . . . . . . . . . . . . 29.9 (0.89) 20.7 (0.76) 34.7 (0.91) 24.3 (0.79) 32.2 (0.73) Midwest . . . . . . . . . . . . . . . . . . . . . . . . . . . . . . . . 34.2 (0.82) 25.7 (0.66) 33.5 (1.12) 27.6 (0.58) 29.4 (0.70) South . . . . . . . . . . . . . . . . . . . . . . . . . . . . . . . . . 25.5 (0.58) 24.2 (0.50) 44.3 (0.81) 27.0 (0.52) 28.2 (0.51) West . . . . . . . . . . . . . . . . . . . . . . . . . . . . . . . . . . 27.6 (0.72) 20.0 (0.63) 35.5 (0.82) 22.3 (0.58) 24.6 (0.62)
Women
Ages 18 years and over (age-adjusted)6 . . . . . . . . . . . . . 12.8 (0.22) 18.0 (0.24) 41.1 (0.45) 25.0 (0.29) 27.5 (0.28) Ages 18 years and over (crude)6 . . . . . . . . . . . . . . . . . . 12.3 (0.22) 17.8 (0.24) 41.3 (0.45) 25.3 (0.29) 27.6 (0.28)
Age:7
18–24 years . . . . . . . . . . . . . . . . . . . . . . . . . . . . . 23.4 (0.89) 19.7 (0.80) 36.6 (1.03) 16.2 (0.70) 23.2 (0.83) 25–44 years . . . . . . . . . . . . . . . . . . . . . . . . . . . . . 17.2 (0.39) 20.7 (0.41) 36.6 (0.57) 24.8 (0.44) 28.3 (0.45) 45–64 years . . . . . . . . . . . . . . . . . . . . . . . . . . . . . 8.5 (0.29) 19.2 (0.40) 39.7 (0.62) 30.2 (0.52) 30.0 (0.48) 65–74 years . . . . . . . . . . . . . . . . . . . . . . . . . . . . . 2.5 (0.28) 11.3 (0.57) 50.0 (1.01) 29.2 (0.84) 25.7 (0.81) 75 years and over . . . . . . . . . . . . . . . . . . . . . . . . . . 0.8 (0.18) 4.8 (0.37) 65.0 (0.91) 18.0 (0.66) 23.9 (0.76)
Race: White, single race . . . . . . . . . . . . . . . . . . . . . . . . . . 14.4 (0.27) 18.8 (0.28) 38.9 (0.48) 23.8 (0.32) 26.2 (0.31) Black or African American, single race . . . . . . . . . . . . . 6.0 (0.34) 16.9 (0.54) 55.0 (0.87) 38.4 (0.73) 34.3 (0.72) American Indian or Alaska Native, single race . . . . . . . . 14.6 (2.23) 24.3 (2.82) 38.2 (3.12) 33.4 (3.42) 33.8 (2.99) Asian, single race . . . . . . . . . . . . . . . . . . . . . . . . . . 4.5 (0.55) 4.8 (0.54) 42.9 (1.49) 7.1 (0.70) 28.5 (1.33) Native Hawaiian or Other Pacific Islander, single race. . . . *9.8 (3.54) † 40.5 (5.38) 21.8 (5.42) 38.9 (7.27) Two or more races . . . . . . . . . . . . . . . . . . . . . . . . . 15.0 (1.70) 25.6 (2.25) 37.6 (2.39) 28.7 (2.22) 37.1 (2.73)
Black or African American, white . . . . . . . . . . . . . . . 9.6 (2.86) 16.6 (3.54) 46.2 (5.93) 25.1 (4.46) 37.6 (6.18) American Indian or Alaska Native, white . . . . . . . . . . . 20.8 (3.06) 30.3 (3.57) 37.4 (3.51) 31.3 (3.27) 35.0 (3.60)
See footnotes at end of table.

Series 10, No. 245 [ Page 71
Table 8.1. Age-adjusted percentages (with standard errors) of adults 18 years of age and over who engaged in selected unhealthy behaviors, by selected characteristics: United States, average annual, 2005–2007—Con.
Selected unhealthy behaviors
Five or more drinks in 1 day Current Physically Slept at least once cigarette inactive 6 hours
Selected characteristic (past year)1 smoker2 (leisure time)3 Obese4 or less5
Women—Con. Percent (standard error)
Hispanic or Latino origin and race: Hispanic or Latino . . . . . . . . . . . . . . . . . . . . . . . . . . 7.0 (0.36) 9.6 (0.42) 55.4 (0.80) 29.3 (0.70) 26.7 (0.70)
Mexican or Mexican American . . . . . . . . . . . . . . . . . 6.8 (0.43) 8.6 (0.52) 54.3 (1.03) 32.9 (0.96) 23.8 (0.88) Not Hispanic or Latino . . . . . . . . . . . . . . . . . . . . . . . 13.8 (0.25) 19.3 (0.28) 38.9 (0.49) 24.5 (0.31) 27.8 (0.31)
White, single race . . . . . . . . . . . . . . . . . . . . . . . . 16.0 (0.31) 20.7 (0.33) 35.8 (0.53) 22.9 (0.35) 26.5 (0.35) Black or African American, single race . . . . . . . . . . . . 5.9 (0.34) 17.0 (0.55) 54.8 (0.89) 38.8 (0.74) 34.4 (0.73)
Education: Less than high school graduate . . . . . . . . . . . . . . . . . 8.2 (0.44) 24.5 (0.70) 62.7 (0.78) 31.9 (0.73) 29.6 (0.67) GED diploma8 . . . . . . . . . . . . . . . . . . . . . . . . . . . . 14.0 (1.23) 38.2 (1.77) 57.6 (1.81) 35.0 (1.75) 36.3 (1.88) High school graduate . . . . . . . . . . . . . . . . . . . . . . . . 11.4 (0.42) 21.9 (0.54) 48.4 (0.72) 27.8 (0.57) 27.5 (0.54) Some college—no degree . . . . . . . . . . . . . . . . . . . . . 15.4 (0.51) 19.3 (0.53) 36.0 (0.71) 26.1 (0.60) 29.1 (0.61) Associate of arts degree . . . . . . . . . . . . . . . . . . . . . . 13.4 (0.64) 17.4 (0.68) 34.0 (0.89) 26.9 (0.80) 29.2 (0.82) Bachelor of arts, science degree . . . . . . . . . . . . . . . . . 14.7 (0.50) 8.9 (0.39) 27.1 (0.73) 16.4 (0.54) 23.3 (0.61) Masters, doctorate, medical degree . . . . . . . . . . . . . . . 12.1 (0.65) 6.1 (0.43) 21.0 (0.88) 14.6 (0.71) 22.9 (0.89)
Poverty status:9
Below poverty level . . . . . . . . . . . . . . . . . . . . . . . . . 10.7 (0.53) 25.8 (0.74) 59.2 (0.84) 32.8 (0.74) 33.2 (0.70) ≥1 and <2 times poverty level . . . . . . . . . . . . . . . . . . 10.5 (0.43) 21.9 (0.58) 51.7 (0.79) 30.0 (0.64) 31.0 (0.65) ≥2 and <4 times poverty level . . . . . . . . . . . . . . . . . . 12.4 (0.39) 18.8 (0.46) 41.2 (0.67) 26.0 (0.54) 27.3 (0.50) 4 times poverty level or more . . . . . . . . . . . . . . . . . . . 15.1 (0.42) 12.8 (0.36) 28.6 (0.60) 18.9 (0.44) 23.9 (0.47)
Marital status: Never married . . . . . . . . . . . . . . . . . . . . . . . . . . . . 15.3 (0.54) 18.6 (0.63) 42.5 (0.93) 27.9 (0.80) 28.2 (0.78) Married . . . . . . . . . . . . . . . . . . . . . . . . . . . . . . . . 10.1 (0.26) 14.2 (0.29) 38.3 (0.53) 23.8 (0.38) 25.8 (0.38) Cohabiting . . . . . . . . . . . . . . . . . . . . . . . . . . . . . . 21.4 (1.02) 33.3 (1.38) 42.2 (1.68) 25.4 (1.43) 26.7 (1.29) Divorced or separated . . . . . . . . . . . . . . . . . . . . . . . 14.3 (0.59) 27.3 (0.71) 45.5 (0.82) 30.5 (0.76) 35.9 (0.77) Widowed . . . . . . . . . . . . . . . . . . . . . . . . . . . . . . . 4.8 (1.13) 26.4 (2.78) 55.1 (2.81) 32.0 (2.70) 34.6 (2.72)
Geographic region: Northeast . . . . . . . . . . . . . . . . . . . . . . . . . . . . . . . 13.9 (0.55) 17.5 (0.55) 40.0 (0.91) 22.7 (0.64) 29.8 (0.66) Midwest . . . . . . . . . . . . . . . . . . . . . . . . . . . . . . . . 16.5 (0.48) 21.2 (0.56) 35.3 (0.93) 26.1 (0.71) 28.4 (0.57) South . . . . . . . . . . . . . . . . . . . . . . . . . . . . . . . . . 10.3 (0.34) 18.6 (0.40) 47.4 (0.82) 26.7 (0.47) 27.6 (0.48) West . . . . . . . . . . . . . . . . . . . . . . . . . . . . . . . . . . 12.1 (0.47) 13.5 (0.44) 37.1 (0.76) 22.6 (0.50) 24.5 (0.58)
* Estimates preceded by an asterisk have a relative standard error of greater than 30% and less than or equal to 50%. These should be interpreted with caution as they do not meet the standard of reliability or precision.
† Estimates with a relative standard error greater than 50% are indicated with a dagger, but are not shown. 1Five or more drinks in 1 day at least once in the past year was asked of only current drinkers but estimates reflect percent of all adults who engaged in this behavior (as shown in Table 3.3). 2Smoked at least 100 cigarettes in lifetime and currently smoked. 3Never engaged in any light, moderate, or vigorous leisure-time physical activity. 4Obese is defined as a body mass index (BMI) of greater than or equal to 30. 5Usual number of hours of sleep in a 24-hour period. 6Persons of other races and unknown race and ethnicity, unknown education, unknown poverty status, and unknown marital status are included in total. 7Estimates for age groups are not age adjusted. 8GED is General Educational Development high school equivalency diploma. 9Poverty status is based on family income and family size using the U.S. Census Bureau poverty thresholds for 2004, 2005, and 2006.
NOTES: Unless otherwise specified, estimates are age adjusted using the projected 2000 U.S. population as the standard population and using three age groups: 18–44 years, 45–64 years, and 65 years and over. For crude percentages, refer to Appendix Table XX. Denominator for each percentage excludes persons with unknown health behavior characteristics. See Appendix II for definitions of terms. See Appendix III for health behavior questions.
DATA SOURCE: National Health Interview Survey, 2005–2007. Estimates are based on household interviews of a sample of the civilian noninstitutionalized population.

Page 72 [ Series 10, No. 245
Table 8.2. Age-adjusted percentages (with standard errors) of adults 18 years of age and over who engaged in selected healthy behaviors, by selected characteristics: United States, average annual, 2005–2007
Selected healthy behaviors
Never Any regular smoked leisure-time Healthy Slept
Selected characteristic cigarettes1 physical activity2 weight3 7–8 hours4
Both sexes Percent (standard error)
Ages 18 years and over (age-adjusted)5 . . . . . . . . . . . . . 58.5 (0.26) 30.7 (0.29) 37.7 (0.25) 63.5 (0.24) Ages 18 years and over (crude)5 . . . . . . . . . . . . . . . . . . 58.1 (0.27) 30.6 (0.29) 37.3 (0.25) 63.5 (0.24)
Age:6
18–24 years . . . . . . . . . . . . . . . . . . . . . . . . . . . . . 69.8 (0.74) 37.5 (0.76) 54.3 (0.73) 64.7 (0.71) 25–44 years . . . . . . . . . . . . . . . . . . . . . . . . . . . . . 62.5 (0.37) 33.0 (0.40) 37.5 (0.37) 64.1 (0.36) 45–64 years . . . . . . . . . . . . . . . . . . . . . . . . . . . . . 51.7 (0.43) 29.5 (0.43) 30.7 (0.36) 63.5 (0.40) 65–74 years . . . . . . . . . . . . . . . . . . . . . . . . . . . . . 48.4 (0.69) 25.4 (0.67) 31.5 (0.65) 63.5 (0.64) 75 years and over . . . . . . . . . . . . . . . . . . . . . . . . . . 56.2 (0.75) 17.4 (0.60) 43.1 (0.71) 58.0 (0.69)
Race: White, single race . . . . . . . . . . . . . . . . . . . . . . . . . . 56.7 (0.29) 31.8 (0.32) 38.0 (0.28) 64.7 (0.27) Black or African American, single race . . . . . . . . . . . . . 65.0 (0.56) 23.2 (0.55) 29.4 (0.53) 55.5 (0.60) American Indian or Alaska Native, single race . . . . . . . . 52.2 (4.62) 26.3 (2.30) 29.2 (2.25) 57.3 (2.99) Asian, single race . . . . . . . . . . . . . . . . . . . . . . . . . . 77.6 (0.84) 29.7 (0.96) 58.2 (1.02) 63.7 (0.99) Native Hawaiian or Other Pacific Islander, single race. . . . 71.0 (5.86) 30.8 (5.48) 32.7 (5.41) 60.2 (5.64) Two or more races . . . . . . . . . . . . . . . . . . . . . . . . . 50.9 (2.07) 29.7 (1.76) 33.1 (1.82) 53.9 (2.06)
Black or African American, white . . . . . . . . . . . . . . . 65.4 (4.73) 27.7 (4.22) 36.2 (4.81) 56.2 (5.33) American Indian or Alaska Native, white . . . . . . . . . . . 43.1 (3.02) 27.2 (2.58) 28.4 (2.54) 55.0 (2.80)
Hispanic or Latino origin and race: Hispanic or Latino . . . . . . . . . . . . . . . . . . . . . . . . . . 70.2 (0.57) 22.3 (0.52) 31.3 (0.54) 65.3 (0.54)
Mexican or Mexican American . . . . . . . . . . . . . . . . . 70.7 (0.71) 22.0 (0.69) 29.4 (0.67) 66.9 (0.71) Not Hispanic or Latino . . . . . . . . . . . . . . . . . . . . . . . 56.7 (0.29) 32.0 (0.32) 38.7 (0.27) 63.0 (0.27)
White, single race . . . . . . . . . . . . . . . . . . . . . . . . 54.1 (0.33) 33.8 (0.36) 39.2 (0.31) 64.4 (0.30) Black or African American, single race . . . . . . . . . . . . 64.8 (0.57) 23.1 (0.56) 29.4 (0.54) 55.4 (0.61)
Education: Less than high school graduate . . . . . . . . . . . . . . . . . 53.9 (0.62) 17.8 (0.48) 33.5 (0.52) 59.8 (0.55) GED diploma7 . . . . . . . . . . . . . . . . . . . . . . . . . . . . 33.1 (1.28) 21.7 (1.20) 30.2 (1.31) 52.2 (1.32) High school graduate . . . . . . . . . . . . . . . . . . . . . . . . 54.4 (0.47) 23.9 (0.44) 35.4 (0.48) 62.8 (0.45) Some college—no degree . . . . . . . . . . . . . . . . . . . . . 55.8 (0.55) 32.8 (0.53) 37.7 (0.52) 61.5 (0.51) Associate of arts degree . . . . . . . . . . . . . . . . . . . . . . 57.3 (0.72) 34.2 (0.72) 34.4 (0.69) 63.2 (0.67) Bachelor of arts, science degree . . . . . . . . . . . . . . . . . 67.8 (0.50) 42.3 (0.60) 43.1 (0.54) 69.3 (0.49) Masters, doctorate, medical degree . . . . . . . . . . . . . . . 71.8 (0.66) 46.2 (0.76) 46.7 (0.77) 70.2 (0.71)
Poverty status:8
Below poverty level . . . . . . . . . . . . . . . . . . . . . . . . . 56.2 (0.73) 19.9 (0.61) 36.8 (0.65) 55.8 (0.63) ≥1 and <2 times poverty level . . . . . . . . . . . . . . . . . . 55.8 (0.58) 22.8 (0.54) 36.0 (0.54) 59.8 (0.53) ≥2 and <4 times poverty level . . . . . . . . . . . . . . . . . . 56.7 (0.43) 28.8 (0.42) 36.6 (0.45) 63.2 (0.39) 4 times poverty level or more . . . . . . . . . . . . . . . . . . . 61.4 (0.39) 39.2 (0.41) 39.6 (0.41) 67.6 (0.40)
Marital status: Never married . . . . . . . . . . . . . . . . . . . . . . . . . . . . 62.9 (0.62) 31.9 (0.58) 42.0 (0.60) 62.4 (0.60) Married . . . . . . . . . . . . . . . . . . . . . . . . . . . . . . . . 60.2 (0.32) 30.8 (0.36) 35.2 (0.32) 65.8 (0.30) Cohabiting . . . . . . . . . . . . . . . . . . . . . . . . . . . . . . 41.0 (1.10) 29.7 (1.03) 37.5 (1.05) 61.4 (1.11) Divorced or separated . . . . . . . . . . . . . . . . . . . . . . . 48.2 (0.61) 28.4 (0.58) 35.5 (0.59) 56.6 (0.59) Widowed . . . . . . . . . . . . . . . . . . . . . . . . . . . . . . . 50.9 (2.59) 19.7 (1.79) 33.9 (2.54) 54.0 (2.59)
Geographic region: Northeast . . . . . . . . . . . . . . . . . . . . . . . . . . . . . . . 57.8 (0.62) 32.2 (0.61) 39.8 (0.61) 61.9 (0.56) Midwest . . . . . . . . . . . . . . . . . . . . . . . . . . . . . . . . 54.8 (0.56) 32.0 (0.66) 36.9 (0.55) 62.7 (0.51) South . . . . . . . . . . . . . . . . . . . . . . . . . . . . . . . . . 59.1 (0.43) 27.4 (0.48) 36.1 (0.38) 63.0 (0.40) West . . . . . . . . . . . . . . . . . . . . . . . . . . . . . . . . . . 62.3 (0.56) 33.5 (0.57) 39.7 (0.53) 66.5 (0.48)
Men
Ages 18 years and over (age-adjusted)5 . . . . . . . . . . . . . 51.8 (0.37) 32.6 (0.38) 31.1 (0.33) 63.6 (0.34) Ages 18 years and over (crude)5 . . . . . . . . . . . . . . . . . . 51.8 (0.38) 32.7 (0.38) 30.7 (0.33) 63.6 (0.34)
Age:6
18–24 years . . . . . . . . . . . . . . . . . . . . . . . . . . . . . 66.6 (1.11) 42.3 (1.12) 50.5 (1.06) 66.0 (1.04) 25–44 years . . . . . . . . . . . . . . . . . . . . . . . . . . . . . 58.8 (0.54) 34.0 (0.54) 29.3 (0.49) 63.3 (0.52) 45–64 years . . . . . . . . . . . . . . . . . . . . . . . . . . . . . 44.5 (0.58) 30.4 (0.56) 23.7 (0.48) 63.5 (0.56) 65–74 years . . . . . . . . . . . . . . . . . . . . . . . . . . . . . 36.3 (0.96) 28.2 (0.96) 27.2 (0.87) 64.2 (0.94) 75 years and over . . . . . . . . . . . . . . . . . . . . . . . . . . 36.3 (1.18) 22.5 (0.99) 39.4 (1.09) 60.3 (1.12)
See footnotes at end of table.

Series 10, No. 245 [ Page 73
Table 8.2. Age-adjusted percentages (with standard errors) of adults 18 years of age and over who engaged in selected healthy behaviors, by selected characteristics: United States, average annual, 2005–2007—Con.
Selected healthy behaviors
Never Any regular smoked leisure-time Healthy Slept
Selected characteristic cigarettes1 physical activity2 weight3 7–8 hours4
Men—Con. Percent (standard error)
Race: White, single race . . . . . . . . . . . . . . . . . . . . . . . . . . 50.6 (0.41) 33.2 (0.42) 30.4 (0.36) 64.7 (0.39) Black or African American, single race . . . . . . . . . . . . . 56.3 (0.88) 28.6 (0.92) 29.6 (0.84) 56.0 (0.90) American Indian or Alaska Native, single race . . . . . . . . 45.1 (5.50) 27.0 (3.34) 27.4 (3.39) 61.5 (4.07) Asian, single race . . . . . . . . . . . . . . . . . . . . . . . . . . 64.5 (1.42) 32.6 (1.41) 51.3 (1.47) 62.8 (1.42) Native Hawaiian or Other Pacific Islander, single race. . . . 63.7 (7.92) 23.3 (6.18) 27.5 (6.53) 59.4 (8.88) Two or more races . . . . . . . . . . . . . . . . . . . . . . . . . 46.4 (2.88) 29.8 (2.56) 25.2 (2.29) 55.7 (3.10)
Black or African American, white . . . . . . . . . . . . . . . 51.3 (8.09) 31.4 (5.82) 31.8 (6.38) 56.5 (8.17) American Indian or Alaska Native, white . . . . . . . . . . . 38.4 (4.10) 26.3 (3.49) 21.3 (2.99) 56.9 (4.30)
Hispanic or Latino origin and race: Hispanic or Latino . . . . . . . . . . . . . . . . . . . . . . . . . . 59.4 (0.89) 24.3 (0.78) 27.0 (0.77) 67.1 (0.79)
Mexican or Mexican American . . . . . . . . . . . . . . . . . 59.3 (1.11) 23.4 (0.93) 25.8 (0.93) 68.8 (1.04) Not Hispanic or Latino . . . . . . . . . . . . . . . . . . . . . . . 50.5 (0.41) 34.1 (0.42) 31.7 (0.36) 62.9 (0.37)
White, single race . . . . . . . . . . . . . . . . . . . . . . . . 48.9 (0.46) 35.2 (0.48) 31.0 (0.41) 64.0 (0.43) Black or African American, single race . . . . . . . . . . . . 55.9 (0.90) 28.3 (0.94) 29.7 (0.86) 55.8 (0.91)
Education: Less than high school graduate . . . . . . . . . . . . . . . . . 44.5 (0.89) 20.2 (0.74) 32.4 (0.78) 62.1 (0.80) GED diploma7 . . . . . . . . . . . . . . . . . . . . . . . . . . . . 25.2 (1.67) 26.0 (1.96) 27.3 (1.76) 52.5 (1.94) High school graduate . . . . . . . . . . . . . . . . . . . . . . . . 46.3 (0.65) 25.5 (0.63) 30.0 (0.60) 62.9 (0.65) Some college—no degree . . . . . . . . . . . . . . . . . . . . . 50.1 (0.80) 34.8 (0.82) 30.5 (0.74) 60.8 (0.76) Associate of arts degree . . . . . . . . . . . . . . . . . . . . . . 50.8 (1.10) 37.1 (1.07) 25.7 (1.00) 63.1 (1.07) Bachelor of arts, science degree . . . . . . . . . . . . . . . . . 62.3 (0.76) 44.3 (0.81) 31.6 (0.76) 68.2 (0.73) Masters, doctorate, medical degree . . . . . . . . . . . . . . . 70.5 (0.97) 47.2 (1.13) 37.4 (1.13) 69.7 (1.03)
Poverty status:8
Below poverty level . . . . . . . . . . . . . . . . . . . . . . . . . 48.3 (1.14) 22.8 (0.99) 37.5 (1.02) 58.0 (1.01) ≥1 and <2 times poverty level . . . . . . . . . . . . . . . . . . 46.9 (0.90) 24.5 (0.81) 33.5 (0.84) 60.6 (0.80) ≥2 and <4 times poverty level . . . . . . . . . . . . . . . . . . 49.4 (0.60) 30.0 (0.59) 30.0 (0.55) 62.8 (0.59) 4 times poverty level or more . . . . . . . . . . . . . . . . . . . 56.5 (0.56) 40.5 (0.56) 29.3 (0.56) 66.5 (0.55)
Marital status: Never married . . . . . . . . . . . . . . . . . . . . . . . . . . . . 57.3 (0.89) 35.2 (0.82) 40.9 (0.82) 62.8 (0.87) Married . . . . . . . . . . . . . . . . . . . . . . . . . . . . . . . . 53.8 (0.45) 30.7 (0.47) 25.9 (0.40) 65.3 (0.45) Cohabiting . . . . . . . . . . . . . . . . . . . . . . . . . . . . . . 37.7 (1.41) 31.4 (1.45) 31.6 (1.38) 61.0 (1.50) Divorced or separated . . . . . . . . . . . . . . . . . . . . . . . 40.7 (0.95) 33.3 (0.94) 30.5 (0.88) 56.3 (0.99) Widowed . . . . . . . . . . . . . . . . . . . . . . . . . . . . . . . 38.3 (6.21) 14.2 (2.18) 30.9 (5.71) 48.9 (5.74)
Geographic region: Northeast . . . . . . . . . . . . . . . . . . . . . . . . . . . . . . . 53.1 (0.92) 34.4 (0.93) 31.8 (0.84) 60.9 (0.80) Midwest . . . . . . . . . . . . . . . . . . . . . . . . . . . . . . . . 48.5 (0.76) 33.8 (0.82) 30.2 (0.67) 62.7 (0.75) South . . . . . . . . . . . . . . . . . . . . . . . . . . . . . . . . . 51.6 (0.59) 29.7 (0.62) 30.1 (0.52) 63.3 (0.55) West . . . . . . . . . . . . . . . . . . . . . . . . . . . . . . . . . . 54.9 (0.78) 34.7 (0.74) 32.9 (0.71) 67.2 (0.68)
Women
Ages 18 years and over (age-adjusted)5 . . . . . . . . . . . . . 64.4 (0.33) 28.9 (0.35) 44.2 (0.34) 63.4 (0.31) Ages 18 years and over (crude)5 . . . . . . . . . . . . . . . . . . 64.0 (0.33) 28.7 (0.35) 43.8 (0.34) 63.3 (0.30)
Age:6
18–24 years . . . . . . . . . . . . . . . . . . . . . . . . . . . . . 73.1 (0.89) 32.9 (0.95) 58.2 (0.97) 63.4 (0.95) 25–44 years . . . . . . . . . . . . . . . . . . . . . . . . . . . . . 66.2 (0.48) 32.1 (0.51) 45.9 (0.52) 64.8 (0.47) 45–64 years . . . . . . . . . . . . . . . . . . . . . . . . . . . . . 58.4 (0.56) 28.7 (0.53) 37.7 (0.54) 63.6 (0.51) 65–74 years . . . . . . . . . . . . . . . . . . . . . . . . . . . . . 58.6 (0.92) 23.0 (0.84) 35.4 (0.96) 62.9 (0.87) 75 years and over . . . . . . . . . . . . . . . . . . . . . . . . . . 69.0 (0.85) 14.0 (0.68) 45.6 (0.90) 56.5 (0.88)
Race: White, single race . . . . . . . . . . . . . . . . . . . . . . . . . . 62.0 (0.37) 30.6 (0.40) 45.7 (0.39) 64.8 (0.34) Black or African American, single race . . . . . . . . . . . . . 71.7 (0.66) 18.8 (0.58) 29.3 (0.67) 55.2 (0.78) American Indian or Alaska Native, single race . . . . . . . . 58.1 (3.91) 25.4 (2.62) 31.0 (3.02) 53.0 (3.28) Asian, single race . . . . . . . . . . . . . . . . . . . . . . . . . . 89.5 (0.77) 26.8 (1.27) 65.1 (1.39) 64.6 (1.40) Native Hawaiian or Other Pacific Islander, single race. . . . 78.8 (6.29) 39.9 (9.83) 37.1 (8.71) 60.1 (7.27) Two or more races . . . . . . . . . . . . . . . . . . . . . . . . . 54.1 (2.81) 29.6 (2.32) 40.7 (2.69) 51.9 (2.62)
Black or African American, white . . . . . . . . . . . . . . . 72.5 (4.92) 24.1 (5.63) 37.9 (6.48) 54.1 (6.22) American Indian or Alaska Native, white . . . . . . . . . . . 47.3 (4.11) 28.5 (3.62) 36.5 (4.15) 52.5 (3.74)
See footnotes at end of table.

Page 74 [ Series 10, No. 245
Table 8.2. Age-adjusted percentages (with standard errors) of adults 18 years of age and over who engaged in selected healthy behaviors, by selected characteristics: United States, average annual, 2005–2007—Con.
Selected healthy behaviors
Never Any regular smoked leisure-time Healthy Slept
Selected characteristic cigarettes1 physical activity2 weight3 7–8 hours4
Women—Con. Percent (standard error)
Hispanic or Latino origin and race: Hispanic or Latino . . . . . . . . . . . . . . . . . . . . . . . . . . 80.4 (0.58) 20.5 (0.65) 35.8 (0.72) 63.6 (0.74)
Mexican or Mexican American . . . . . . . . . . . . . . . . . 82.2 (0.72) 20.6 (0.89) 33.4 (0.95) 65.1 (0.97) Not Hispanic or Latino . . . . . . . . . . . . . . . . . . . . . . . 62.1 (0.37) 30.2 (0.39) 45.4 (0.37) 63.2 (0.34)
White, single race . . . . . . . . . . . . . . . . . . . . . . . . 58.7 (0.42) 32.5 (0.45) 47.3 (0.43) 64.8 (0.39) Black or African American, single race . . . . . . . . . . . . 71.7 (0.66) 18.9 (0.59) 29.1 (0.67) 55.2 (0.78)
Education: Less than high school graduate . . . . . . . . . . . . . . . . . 62.6 (0.76) 15.4 (0.55) 34.6 (0.73) 57.3 (0.73) GED diploma7 . . . . . . . . . . . . . . . . . . . . . . . . . . . . 41.2 (1.81) 17.1 (1.35) 33.5 (1.88) 52.1 (1.90) High school graduate . . . . . . . . . . . . . . . . . . . . . . . . 61.2 (0.65) 22.3 (0.57) 40.6 (0.66) 62.7 (0.60) Some college—no degree . . . . . . . . . . . . . . . . . . . . . 60.3 (0.69) 31.2 (0.64) 44.2 (0.71) 62.1 (0.67) Associate of arts degree . . . . . . . . . . . . . . . . . . . . . . 61.9 (0.91) 32.0 (0.91) 41.4 (0.93) 63.3 (0.89) Bachelor of arts, science degree . . . . . . . . . . . . . . . . . 73.3 (0.66) 40.4 (0.79) 54.8 (0.74) 70.3 (0.66) Masters, doctorate, medical degree . . . . . . . . . . . . . . . 73.7 (0.90) 45.0 (1.05) 56.2 (1.05) 70.4 (0.95)
Poverty status:8
Below poverty level . . . . . . . . . . . . . . . . . . . . . . . . . 61.3 (0.80) 17.9 (0.62) 36.4 (0.78) 54.2 (0.73) ≥1 and <2 times poverty level . . . . . . . . . . . . . . . . . . 62.8 (0.66) 21.4 (0.60) 38.3 (0.69) 59.2 (0.67) ≥2 and <4 times poverty level . . . . . . . . . . . . . . . . . . 63.3 (0.58) 27.7 (0.56) 43.3 (0.65) 63.6 (0.56) 4 times poverty level or more . . . . . . . . . . . . . . . . . . . 66.6 (0.51) 37.9 (0.58) 51.1 (0.62) 68.8 (0.51)
Marital status: Never married . . . . . . . . . . . . . . . . . . . . . . . . . . . . 68.4 (0.80) 28.2 (0.76) 43.5 (0.87) 61.9 (0.83) Married . . . . . . . . . . . . . . . . . . . . . . . . . . . . . . . . 67.0 (0.40) 30.7 (0.47) 44.5 (0.45) 66.2 (0.39) Cohabiting . . . . . . . . . . . . . . . . . . . . . . . . . . . . . . 45.2 (1.74) 27.5 (1.47) 44.6 (1.67) 62.0 (1.60) Divorced or separated . . . . . . . . . . . . . . . . . . . . . . . 53.2 (0.76) 25.1 (0.67) 39.2 (0.77) 56.8 (0.78) Widowed . . . . . . . . . . . . . . . . . . . . . . . . . . . . . . . 54.3 (2.82) 21.3 (2.14) 34.8 (2.82) 55.7 (2.80)
Geographic region: Northeast . . . . . . . . . . . . . . . . . . . . . . . . . . . . . . . 61.7 (0.71) 30.3 (0.75) 47.3 (0.82) 62.9 (0.70) Midwest . . . . . . . . . . . . . . . . . . . . . . . . . . . . . . . . 60.2 (0.76) 30.4 (0.79) 43.6 (0.80) 62.6 (0.62) South . . . . . . . . . . . . . . . . . . . . . . . . . . . . . . . . . 65.6 (0.51) 25.4 (0.57) 41.8 (0.54) 62.7 (0.52) West . . . . . . . . . . . . . . . . . . . . . . . . . . . . . . . . . . 69.4 (0.67) 32.3 (0.71) 46.7 (0.66) 65.9 (0.65)
1Never smoked cigarettes or smoked fewer than 100 cigarettes in lifetime. 2Engaged in light-moderate leisure-time physical activity at least 5 times per week for at least 30 minutes each time or engaged in vigorous leisure-time physical activity at least 3 times per week for at least 20 minutes each time or both. 3Healthy weight is a BMI of greater than or equal to 18.5 and less than 25. 4Usual number of hours of sleep in a 24-hour period. 5Persons of other races and unknown race and ethnicity, unknown education, unknown poverty status, and unknown marital status are included in total. 6Estimates for age groups are not age adjusted. 7GED is General Educational Development high school equivalency diploma. 8Poverty status is based on family income and family size using the U.S. Census Bureau poverty thresholds for 2004, 2005, and 2006.
NOTES: Unless otherwise specified, estimates are age adjusted using the projected 2000 U.S. population as the standard population and using three age groups: 18–44 years, 45–64 years, and 65 years and over. For crude percentages, refer to Appendix Table XXI. Denominator for each percentage excludes persons with unknown health behavior characteristics. See Appendix II for definitions of terms. See Appendix III for health behavior questions.
DATA SOURCE: National Health Interview Survey, 2005–2007. Estimates are based on household interviews of a sample of the civilian noninstitutionalized population.

Series 10, No. 245 [ Page 75
References
1. U.S. Department of Health and Human Services. Available from: http:// www.hhs.gov. Accessed: May 5, 2009.
2. U.S. Department of Health and Human Services. Healthy People. The Surgeon General’s Report on Health Promotion and Disease Prevention. Background Papers. Institute of Medicine. National Academies of Science, editor. U.S. Public Health Service. Washington: U.S. Government Printing Office. 1979.
3. U.S. Department of Health and Human Services. Promoting Health/Preventing Disease: Objectives for the Nation. Washington: U.S. Public Health Service. 1980.
4. U.S. Department of Health and Human Services. Healthy People 2000: National Health Promotion and Disease Prevention Objectives. Washington: U.S. Public Health Service. 1990.
5. U.S. Department of Health and Human Services. Healthy People 2010. 2nd ed. With Understanding and Improving Health and Objectives for Improving Health. 2 vols. Washington, D.C., U.S. Government Printing Office. 2000.
6. U.S Department of Health and Human Services. The health consequences of smoking: A report of the Surgeon General. Centers for Disease Control and Prevention. National Center for Chronic Disease Prevention and Health Promotion. Atlanta, GA. 2004.
7. National Institutes of Health. National Institute on Alcohol Abuse and Alcoholism. 10th Special Report to the U.S. Congress on Alcohol and Health. NIH Publication No. 00–1583. Bethesda, MD. 2000.
8. U.S. Department of Health and Human Services. Physical activity and health: A report of the Surgeon General. National Center for Chronic Disease Prevention and Health Promotion. Atlanta, GA. 1996.
9. U.S. Department of Health and Human Services. The Surgeon General’s call to action to prevent and decrease overweight and obesity. Office of the Surgeon General, editor. Rockville, MD, Department of Health and Human Services. 2001.
10. Institute of Medicine of the National Academies. Sleep Medicine and Research. Available from: http:// www.iom.edu/. 2006.
11. Centers for Disease Control and Prevention. National Center for Health Statistics. Available from: http://
www.cdc.gov/nchs. 12. Centers for Disease Control and
Prevention. National Center for Health Statistics. National Health Interview Survey. Available from: http:// www.cdc.gov/nchs/nhis.htm.
13. Centers for Disease Control and Prevention. National Center for Health Statistics. National Health and Nutrition Examination Survey. Available from: http://www.cdc.gov/nchs/nhanes.htm.
14. Centers for Disease Control and Prevention. Behavioral Risk Factor Surveillance System. Available from: http://www.cdc.gov/BRFSS/.
15. Centers for Disease Control and Prevention. Health Promotion. National Center for Chronic Disease Prevention and Health Promotion. Available from: http://www.cdc.gov/nccdphp.
16. National Cancer Institute. National Institutes of Health. Available from: http://www.cancer.gov.
17. National Heart, Lung, and Blood Institute. National Institutes of Health. Available from: http:// www.nhlbi.nih.gov. Accessed 3–30–06.
18. National Heart, Lung, and Blood Institute. National Institutes of Health. 2003 National Sleep Disorders Research Plan. 2003.
19. National Institute on Alcohol Abuse and Alcoholism. National Institutes of Health. Available from: http:// www.niaaa.nih.gov. 2006.
20. U.S. Department of Health and Human Services and the U.S. Department of Agriculture. Dietary Guidelines for Americans, 2005. Available from: http://www.healthierus.gov/ dietaryguidelines/. 2005.
21. Institute of Medicine of the National Academies. Available from: http:// www.iom.edu. 2006.
22. Institute of Medicine of the National Academies. Sleep Medicine and Research. Available from: http:// www.iom.edu. 2006.
23. National Sleep Foundation. Available from: http://www.sleepfoundation.org.
24. Moss AJ, Parsons VL. Current estimates from the National Health Interview Survey: United States, 1985. National Center for Health Statistics. Vital Health Stat 10(160). 1986.
25. Adams PF Benson V. Current estimates from the National Health Interview Survey: United States, 1990. Vital Health Stat 10(181). 1991.
26. Adams PF Benson V. Current estimates from the National Health Interview Survey: United States, 1991. Vital Health Stat 10(184). 1992.
27. Division of Health Interview Survey. 1998 National Health Interview Survey (NHIS) Public-use Data Release. NHIS Survey Description. National Center for Health Statistics. Hyattsville, MD. Available from: http://www.cdc.gov/ nchs.
28. Centers for Disease Control and Prevention, National Center for Health Statistics, National Health Interview Survey. Health measures in the 1997 redesigned National Health Interview Survey (NHIS). Available from: http://www.cdc.gov/nchs/nhis.htm.
29. Schoenborn CA, Adams PF. Alcohol use among adults: United States 1997–98. Advance data from vital and health statistics; no. 324. Hyattsville, MD. National Center for Health Statistics. Revised: April 18, 2002.
30. Schoenborn CA, Barnes PM. Leisure-time physical activity among adults: United States, 1997–98. Advance data from vital and health statistics; no. 325. Hyattsville, MD. National Center for Health Statistics. 2002.
31. Schoenborn CA, Adams PF, Barnes PM. Body weight status of adults: United States, 1997–98. Advance data from vital and health statistics; no. 330. Hyattsville, MD. National Center for Health Statistics. 2002.
32. Schoenborn CA, Vickerie JL, Barnes PM. Cigarette smoking behavior of adults: United States, 1997–98. Advance data from vital and health statistics; no. 331. Hyattsville, MD. National Center for Health Statistics. 2003.
33. Schoenborn CA, Adams P, Barnes PM, Vickerie JL. Health behaviors of adults: United States, 1999–2001. National Center for Health Statistics. Vital Health Stat (10)219. Hyattsville, MD. 2004.
34. Adams PF, Schoenborn CA. Health behaviors of adults: United States, 2002–04. National Center for Health Statistics. Vital Health Stat (10)230. Hyattsville, MD. 2006.
35. National Center for Health Statistics. 2005 National Health Interview Survey (NHIS). Public-Use Data Release. NHIS Survey Description Document. National Center for Health Statistics. 2006.
36. National Center for Health Statistics. 2006 National Health Interview Survey (NHIS). Public-Use Data Release. NHIS Survey Description Document. National Center for Health Statistics. 2007.

Page 76 [ Series 10, No. 245
37. National Center for Health Statistics. 2007 National Health Interview Survey (NHIS). Public-Use Data Release. NHIS Survey Description Document. National
38.
39.
Center for Health Statistics. 2008. Pleis JR, Lethbridge-Cejku M. Summary health statistics for U.S. adults: National Health Interview Survey, 2005. National Center for Health Statistics. Vital Health Stat 10(232). 2006. Pleis JR, Lethbridge-Cejku M. Summary health statistics for U.S. adults: National Health Interview Survey, 2006. National Center for
40.
Health Statistics. Vital Health Stat 10(235). 2007. Pleis JR, Lucas JW. Summary health statistics for U.S. adults: National Health Interview Survey, 2007. National Center for Health Statistics. Vital Health Stat 10(240). 2009.
41. National Center for Health Statistics. Health, United States, 2008. With special feature on health of young adults. Hyattsville, MD. 2009.
42. Barnes PM, Schiller JS, Heyman KM. Early release of selected estimates based on data from the January-September 2008 National Health Interview Survey. National Center for Health Statistics. 2009. Available from: http://www.cdc.gov/nchs/nhis.htm. Series of Internet-only reports released approximately quarterly beginning in April 2001.
43. Barnes PM, Schoenborn CA. Physical activity among adults: United States, 2000. Advance data from vital and health statistics; no. 333. Hyattsville, MD. National Center for Health
44. Statistics. 2005. Barnes PM. Physical activity among adults: United States, 2000 and 2005. Health E-Stat. Internet only data release. National Center for Health Statistics. 2007. Available from
45.
46.
‘‘Publications and Information Products’’ at: http://ww.cdc.gov/nchs. Kuczmarski RJ, Flegal KM. Criteria for definition of overweight in transition: Background and recommendations for the United States. Am J Clin Nutr 72(5):1074–1081. 2000. Howie LJ, Drury TF. Current estimates from the Health Interview Survey: United States, 1977. National Center for Health Statistics. Vital Health Stat
47. 10(126). 1978. Schoenborn CA, Danchik KM. Health practices among adults: United States, 1977. Advance data from vital and health statistics; no 64. Hyattsville,
48.
MD: National Center for Health Statistics. 1980. Schoenborn CA. Health habits of U.S. adults, 1985: ‘‘The Alameda 7’’
49.
50.
Revisited. Pub Health Rep 101(6):571– 80. 1986. Hale L, Do PD. Racial differences in self-reports of sleep duration in a population-based study. Sleep 30(9):1096–1103. 2007. Rowland M. Self-reported weight and height. Am J Clin Nutr 52: 1125–33. 1990.
51. Kuczmarski MF, Kuczmarski RJ, Najjar M. Effects of age on validity of
52.
self-reported height, weight, and body mass index: Findings from the Third Health and Nutrition Examination Survey, 1988–1994. J Am Diet Assoc 101(1):28–34. 2001. Stommel M, Schoenborn CA. Accuracy and usefulness of BMI measures based on self-reported weight and height: Findings from the NHANES & NHIS 2001–2006. BMC Public Health 9:421. 2009. Available from: http:// www.biomedcentral.com/1471-2458/9/ 421.
53.
54.
Research Triangle Institute. SUDAAN (Release 10.0). [Computer Software]. Research Triangle Park, NC: Research Triangle Institute. 2008. Klein RJ, Schoenborn CA. Age adjustment using the projected U.S. population. Healthy People Statistical Notes no. 20. Hyattsville, MD. National
55. Center for Health Statistics. 2001. Day JC. Population projections of the United States by age, sex, race, and Hispanic origin: 1995–2050. Current Population Reports P25–1130. U.S. Bureau of the Census. Washington, D.C. U.S. Government Printing Office. 1996.
56. Office of Management and Budget. Revisions to the Standards for the Classification of Federal Data on Race
57.
and Ethnicity. Federal Register 62(210):58782–90. 1997. DeNavas-Walt C, Proctor BD, Lee CH. U.S. Census Bureau. Current Population Reports, P60–229, Income, Poverty, and Health Insurance Coverage in the United States: 2004. U.S. Government Printing Office, Washington. 2005. Available from: http://www.census.gov/prod/2005pubs/ p60-229.pdf.
58. DeNavas-Walt C, Proctor BD, Lee CH. U.S. Census Bureau. Current Population Reports, P60–231, Income, Poverty, and Health Insurance Coverage in the United States: 2005.
U.S. Government Printing Office, Washington. 2006. Available from: http://www.census.gov/prod/2006pubs/ p60-231.pdf.
59. DeNavas-Walt C, Proctor BD, Smith J. U.S. Census Bureau. Current Population Reports, P60–233, Income, poverty, and health insurance coverage in the United States: 2006. U.S. Government Printing Office, Washington. 2007. Available from: http://www.census.gov/prod/2007pubs/ p60-233.pdf.

Series 10, No. 245 [ Page 77
Table I. Completed interviews and response rates by year: National Health Interview Survey, 2005–2007
Interviews and response rates 2005 2006 2007
Completed interviews Number
Household . . . . . . . . . . . . . . . . . . . . . . 38,509 29,204 29,266 Family . . . . . . . . . . . . . . . . . . . . . . . . . 39,284 29,868 29,915 Sample adult . . . . . . . . . . . . . . . . . . . . . 31,428 24,275 23,393
Conditional response rates1 Percent
Family . . . . . . . . . . . . . . . . . . . . . . . . . 99.5 99.6 99.4 Sample adult . . . . . . . . . . . . . . . . . . . . . 80.1 81.4 78.3
Final response rates2 Percent
Household . . . . . . . . . . . . . . . . . . . . . . 86.5 87.3 87.1 Family . . . . . . . . . . . . . . . . . . . . . . . . . 86.1 87.0 86.6 Sample adult . . . . . . . . . . . . . . . . . . . . . 69.0 70.8 67.8
1Conditional response rates are calculated by dividing the number of interviews by the number identified as eligible for the interview. 2Final response rates are calculated by multiplying the final household response rate by the conditional response rate for each survey component.
Appendix I Technical Notes on Methods
Sample Design The National Health Interview
Survey (NHIS) is a cross-sectional household interview survey of the U.S. civilian noninstitutionalized population. Data are collected continuously throughout the year in all 50 states and the District of Columbia. NHIS uses a multistage, clustered sample design to produce national estimates for a variety of health indicators. Information on basic health topics is collected for all household members, by proxy from one family member for children and adults not present at the time of interview. Additional information is collected from one randomly sampled adult and for one randomly sampled child in each family. Self-response is required for the Sample Adult questionnaire except in the rare case of sample adults who are physically or mentally incapable of responding for themselves. An adult family member who is knowledgeable about the sample child’s health provides information for the child component. Interviews are conducted in the home using a computer-assisted personal interview (CAPI) questionnaire. Telephone follow-up is permitted if subsequent in-home interviews cannot be conducted.
Response Rates The response rates for each of the
survey years included in this report are shown in Table I. The household response rate for the NHIS data years 2005–2007 combined was 86.9%. Of the adults identified as eligible for the Sample Adult interview, the conditional response rate was 80%. The final (unconditional) response rate for the Sample Adult questionnaire for 2005–2007 (that is, taking into both account household and family nonresponse), was 69.2%. Procedures used in calculating response rates for combined data years are described in
detail in Appendix I of the Survey Description of the NHIS data files (35–37).
Item Nonresponse Item nonresponse for each of the
sociodemographic indicators shown in this report was less than 1%, with the exception of the poverty threshold, which is based on detailed family income questions asked in the family component of the questionnaire. Item nonresponse for the poverty indicator was 15.8%. (Imputation procedures used for the poverty variable are described below.) Item nonresponse for the health behavior items was less than 6%. The denominators for statistics shown in the tables exclude persons with unknown health behavior characteristics for a given table. Estimates for persons with unknown sociodemographic characteristics are not shown separately, but these persons are included in the totals.
Imputed Income The poverty status variable shown
in each table is based on detailed family income for which item nonresponse is relatively high. To reduce biases associated with missing data, information on family income and personal earnings has been imputed by
NCHS analysts using multiple-imputation methodology. Five ASCII data sets containing imputed values for the survey year and additional information about the imputed income files can be found at http:// www.cdc.gov/nchs/nhis.htm. The imputed income files for 2005–2007 were used to calculate estimates by poverty status shown in this report. Additional information on the NHIS income variables and imputation procedures are available (40).
Age Adjustment Data shown in this report were age
adjusted using the projected 2000 U.S. population as the standard population (54,55). Age adjustment was used to allow comparison among various population subgroups that have different age structures and to allow comparison of changes over time. Age adjustment is particularly important when comparing groups with different demographic characteristics such as race and ethnicity, education, and marital status. The following age groups were used for age adjustment: 18–44 years, 45–64 years, and 65 years and over (Table II).
Estimates were calculated using software for statistical analysis of correlated data (SUDAAN) (53). The SUDAAN procedure PROC DESCRIPT was used to produce age-adjusted percents and their standard errors.

Page 78 [ Series 10, No. 245
Table II. Age distribution used in age-adjusting data shown in Chapters 3–8
Age
2000 U.S. standard
population (Thousands)
18 years and over . . . . . . . . 18–44 years . . . . . . . . . . 45–64 years . . . . . . . . . . 65 years and over . . . . . .
203,851 108,150 60,991 34,710
Tests of Significance Statistical tests performed to assess
significance of differences between the estimates were two-tailed with no adjustments for multiple comparisons. The test statistic used to determine the statistical significance of differences between two percents was:
|Xa – Xb|Z = ,2 + Sb
2√Sa
Here Xa and Xb are the two percents being compared, and Sa and Sb are the standard errors of the percents. The critical value used for two-sided tests at the 0.05 level was 1.96.
Relative Standard Error Estimates with a relative standard
error of greater than 30% and less than or equal to 50% are indicated in the tables with an asterisk (*) and should be used with caution as they do not meet the standard of reliability or precision. Estimates with a relative standard error of greater than 50% are indicated with a dagger (†) and are not shown. The relative standard errors are calculated as follows:
Relative standard error = (SE/Est) 100,
where SE is the standard error of the estimate, and Est is the estimate (percent, rate, mean, or frequency).

Series 10, No. 245 [ Page 79
Appendix II Definitions of Selected Terms
Definitions of Sociodemographic Terms
Age—The age recorded for each person is the age at the last birthday.
Hispanic or Latino origin and race—Hispanic or Latino origin and race are two separate and distinct concepts. Persons of Hispanic or Latino origin may be of any race. Hispanic or Latino origin includes persons of Mexican, Puerto Rican, Cuban, Central and South American, or Spanish origins. All tables show Mexican or Mexican American persons as a subset of Hispanic or Latino. Other groups are not shown for reasons of confidentiality or statistical reliability. (See definition of ‘‘race’’ for additional detail.)
Race—The categories for race are consistent with the 1997 Office of Management and Budget (OMB) federal guidelines (56), which distinguish persons of ‘‘one race’’ from persons of ‘‘two or more races.’’ The classification includes subcategories for single race persons: white; black or African American; American Indian or Alaska Native; Asian; and Native Hawaiian or Other Pacific Islander. The category ‘‘two or more races’’ refers to persons who indicated more than one race group. Data for multiple race combinations can only be reported to the extent that the estimates meet the requirements for confidentiality and statistical reliability. In this report, three categories are shown for multiple race individuals (a summary category and two multiple race categories: black or African American and white; American Indian and Alaska Native and white). Other combinations are not shown separately due to statistical unreliability as measured by the relative standard errors of the estimates (but they are included in the total for ‘‘two or more races’’). The text in this report uses shorter versions of the new OMB race and Hispanic origin terms for conciseness and the tables use the
complete terms. For example, the category ‘‘not Hispanic or Latino, black or African American, single race’’ in the tables is referred to as ‘‘non-Hispanic black’’ in the text.
Education—The categories of education are based on the years of school completed or highest degree obtained for persons aged 18 years and over. Respondents were shown a flash card to choose an appropriate category. Only years completed in a school that advances a person toward an elementary or high school diploma, General Educational Development high school equivalency diploma (GED), or a college, university, or professional degree are included. Education in other schools or home schooling is counted only if the credits are accepted in a regular school system.
Poverty status—Poverty status is based on family income and family size using the U.S. Census Bureau’s poverty thresholds (57–59). Each adult’s poverty status is expressed in terms of a ratio of family income to the appropriate poverty threshold. The lowest family income group consists of persons living below the poverty level (ratio less than 1.00). The highest group consists of persons living in families with incomes that were at least four times the poverty level (ratio of 4.00 or more).
Marital status—Respondents were asked to choose a marital status category most appropriate for their marital situation. Persons reporting their marital status as ‘‘married’’ may, in some cases, have been living in common law marital unions. Alternatively, these individuals could have identified their marital status as ‘‘living with partner.’’ Adults who were living with a partner were considered to be members of the same family (as if married) and are categorized as ‘‘cohabiting’’ in this report. The distinction between ‘‘married’’ and ‘‘living with partner’’ was made by the respondent.
Geographic region—In the geographic classification of the U.S. population, states are grouped into the four regions used by the U.S. Census Bureau:
Region States included
Northeast Maine, Vermont, New Hampshire, Massachusetts, Connecticut, Rhode Island, New York, New Jersey, and Pennsylvania;
Midwest Ohio, Illinois, Indiana, Michigan, Wisconsin, Minnesota, Iowa, Missouri, North Dakota, South Dakota, Kansas, and Nebraska;
South Delaware, Maryland, District of Columbia, West Virginia, Virginia, Kentucky, Tennessee, North Carolina, South Carolina, Georgia, Florida, Alabama, Mississippi, Louisiana, Oklahoma, Arkansas, and Texas;
West Washington, Oregon, California, Nevada, New Mexico, Arizona, Idaho, Utah, Colorado, Montana, Wyoming, Alaska, and Hawaii.
Definitions of Health Behavior Terms
Alcohol use terms
Lifetime abstainer—Had fewer than 12 drinks in entire lifetime.
Former infrequent drinker—Had 12 drinks or more in lifetime, but never as many as 12 drinks in a single year, and has had no drinks in the past year.
Former regular drinker—Had 12 drinks or more in 1 year, but no drinks in the past year.
Current drinker—Had at least 12 drinks in lifetime and at least 1 drink in the past year.
Current drinking levels—Were based on self-reports of the average frequency of alcohol consumption during the past year (could be reported in terms of days per week, per month, or per year), and the number of drinks the respondent drank on the days he or she drank. Neither size nor type of beverage consumed was specified. In calculating current drinking levels, the number of days the respondent drank

Page 80 [ Series 10, No. 245
was converted from the time unit initially reported (days per week, per month, or per year) to number of days per year. Then, average number of drinks per week was calculated as follows:
�(# days per year) (# drinks per day) 7365 days D
Current drinker levels were classified as:
Infrequent: 1 to 11 drinks in the past year.
Light: Three drinks or less per week, on average.
Moderate: Men—More than 3 drinks and up to and including 14 drinks per week, on average. Women—More than 3 drinks and up to and including 7 drinks per week, on average.
Heavier: Men—More than 14 drinks per week, on average (more than 2 per day). Women—More than 7 drinks per week, on average (more than one per day.)
Nondrinker—Person who has not had any drinks in the past year, including former drinkers and lifetime abstainers.
Five or more drinks in 1 day in the past year—Current drinkers were asked how many times in the past year they had five or more alcoholic beverages in 1 day.
Cigarette smoking terms
Lifetime smoking status—Includes both past smoking history and current smoking practice.
Never smokers—Are adults who never smoked a cigarette or who smoked fewer than 100 cigarettes in their entire lifetime.
Former smokers—Are adults who had smoked at least 100 cigarettes in their lifetime, but said they currently did not smoke.
Current smokers—Are adults who had smoked 100 cigarettes in their lifetime and currently smoked cigarettes every day (daily) or some days (nondaily).
Current smoking status—Is based on the same criteria as lifetime smoking status, but displayed somewhat differently. Current smokers are separated into two categories (daily and nondaily), and never smokers and former smokers are combined into a single category (nonsmoker).
Daily smokers—Are adults who currently smoked every day.
Nondaily smokers—Are adults who currently smoked some days, regardless of the number of days smoked in the past 30 days.
Nonsmokers—Are adults who currently did not smoke cigarettes, including both former smokers and never smokers.
Amount smoked—Adults who smoked daily and those who smoked less than daily were asked separate questions about the usual number of cigarettes smoked in a day. Daily smokers were asked how many cigarettes, on average, they usually smoked a day. Nondaily smokers were asked to report the usual number smoked ‘‘on days that they smoked during the past 30 days.’’ Smokers who said they smoked ‘‘some days’’ (nondaily smokers), but who then said they had not smoked in the past 30 days, were excluded from the analysis of amount smoked.
Two indicators for amount smoked are shown in this report. One measure is the mean number of cigarettes smoked on the days the respondent smoked. The second is a percent distribution of usual number of cigarettes smoked on those days the respondent smoked. This distribution is shown for the following four categories: less than 15 cigarettes, 15–24 cigarettes, 25–34 cigarettes, and 35 cigarettes or more.
Quit attempt—All current smokers were asked if they had stopped smoking for more than 1 day in the past 12 months because they were trying to quit. All current smokers (including nondaily smokers) who said they had stopped for more than 1 day because they were trying to quit were classified as having attempted to quit.
Leisure-time physical activity terms
All questions related to leisure-time physical activity were phrased in terms of current behavior and lack a specific reference period. An introductory phrase explained to respondents that they were being asked about leisure-time physical activities only. In this report, persons who volunteered a response indicating that they were ‘‘unable to do the activity’’ were combined with those saying they ‘‘never’’ engaged in the activity.
Inactive—Includes persons who engaged in no light, moderate, or vigorous leisure-time physical activity lasting 10 minutes or longer. Persons classified as physically inactive include persons who volunteered that they were unable to engage in the activity. ‘‘Inactive’’ may include individuals who engaged in only strengthening activities.
At least some activity—Is any light-moderate, or vigorous leisure-time physical activity lasting 10 minutes or longer, regardless of frequency or duration.
Some, less than regular activity—Is any light, moderate, or vigorous leisure-time physical activity lasting at least 10 minutes that did not meet the criteria for ‘‘Regular.’’
Regular—See definition ‘‘Any regular’’ in the following text.
Light or moderate activity—Is activity lasting at least 10 minutes that caused light sweating or slight to moderate increase in breathing or heart rate.
Vigorous activity—Is activity lasting at least 10 minutes that caused heavy sweating or large increases in breathing or heart rate.
Regular activity—Is leisure-time activity engaged in for a minimum specified duration and a minimum specified frequency:
Regular light or moderate activity—Is light or moderate activity that occurred, on average, five or more times per week for at least 30 minutes each time.
Regular vigorous activity—Is vigorous activity that occurred, on average, three or more times per

Series 10, No. 245 [ Page 81
week for at least 20 minutes each time.
Any regular activity—Is either regular light or moderate or regular vigorous, or both. It does not include other combinations of activity levels (e.g., vigorous activity twice a week combined with light or moderate activity three times a week). The number of individuals with such combinations of activity is small.
Strengthening activity—Is any leisure-time physical activity designed specifically to strengthen muscles, including, but not limited to, weight lifting or calisthenics (e.g., push-ups, sit-ups, etc). The reference period was unspecified, and no information on duration was collected. Strengthening activities may overlap with light, moderate, or vigorous activities, as respondents were told to report such activities, even if they had included them in their previous responses to light-moderate or vigorous activities.
Body weight terms
Body mass index (BMI)—Body mass index was calculated from self-reported height and weight. Height reported in U.S. customary units (feet and inches) was first converted to height in inches and then to height in meters (m) (1 meter = 39.37 inches). Weight reported in U.S. customary units (pounds) was converted to weight in kilograms (kg) (1 kilogram = 2.205 pounds). Thus,
BMI = kg/ (m2), where: kg = weight in pounds/2.205, and m = height in inches/39.37.
Body weight status—Body weight status refers to the entire spectrum of body weight, including underweight, healthy weight, overweight but not obese, and obese. It is based on a BMI calculated from self-reported height and weight, without shoes.
Not overweight—This category includes persons with a BMI of less than 25 and includes both healthy weight and underweight.
Underweight—Persons with a BMI of less than 18.5 were classified as underweight.
Healthy weight—Persons with a BMI of at least 18.5 and less than 25 were classified as in the healthy weight range.
Overweight—Persons with a BMI of 25 or more were classified as overweight. This category includes the following two subgroups:
Overweight (but not obese)— Persons with a BMI of at least 25 and less than 30 were classified as overweight but not obese.
Obese—Persons with a BMI of 30 or more were classified as obese.
Sleep term
Sleep—Adults were asked how many hours of sleep they averaged in a 24-hour period. Responses were limited to whole hours.

Page 82 [ Series 10, No. 245
Appendix III Health Behavior Questions
The 2005–2007 National Health Interview Surveys’ Sample Adult questionnaires contained the selected questions on health behaviors shown below. Each question is preceded by its question number, beginning with the acronym ‘‘AHB.’’ AHB represents the Adult Health Behavior section of the Sample Adult questionnaire. The complete NHIS Sample Adult questionnaire, as well as information about other components of the NHIS, is available from: http:// www.cdc.gov/nchs/nhis.htm. Many of the references cited in this report are also available via the NCHS website at: http://www.cdc.gov/nchs.
Alcohol Use AHB.140 In any ONE year, have you
had at least 12 drinks of any type of alcoholic beverage? {Asked of all adults.}
AHB.150 In your ENTIRE LIFE, have you had at least 12 drinks of any type of alcoholic beverage? {Asked of adults who never had at least 12 drinks in any one year.}
AHB.160 In the PAST YEAR, how often did you drink any type of alcoholic beverage? {Days per week/month/year} {Asked of adults who ever had 12 drinks of alcohol in their lifetime.}
AHB.170 In the PAST YEAR, on those days that you drank alcoholic beverages, on the average, how many drinks did you have? {Asked of current drinkers.}
AHB.180 In the PAST YEAR, on how many days did you have 5 or more drinks of any alcoholic beverage? {Asked of current drinkers.}
Cigarette Smoking AHB.010 Have you smoked at least
100 cigarettes in your ENTIRE LIFE? {Asked of all adults.}
AHB.020 How old were you when you FIRST started to smoke fairly regularly? (Asked of adults who had smoked at least 100 cigarettes in lifetime.)
AHB.030 Do you NOW smoke every day, some days, or not at all? (Asked of adults who had smoked at least 100 cigarettes in lifetime.)
AHB.040 How long has it been since you quit smoking cigarettes? (Asked of former smokers.)
AHB.050 On the average, how many cigarettes do you now smoke a day? {Asked of adults who smoked ever day (daily smokers).}
AHB.060 On how many of the past 30 days did you smoke a cigarette? {Asked of adults who smoked only some days (nondaily smokers).}
AHB.070 On the average, when you smoked during the PAST 30 DAYS, about how many cigarettes did you smoke a day? {Asked of nondaily smokers who smoked at least one day in the past 30 days.}
AHB.080 During the PAST 12 MONTHS, have you stopped smoking for more than one day BECAUSE YOU WERE TRYING TO QUIT SMOKING? {Asked of all current smokers.}
Leisure-time Physical Activity
The following introductory phrase was read to the respondent by the interviewer immediately before asking the physical activity questions:
The next questions are about physical activities (exercise, sports, physically active hobbies...) that you may do in your
LEISURE time.
AHB.090 How often do you do VIGOROUS leisure-time physical activities for AT LEAST 10 MINUTES that cause HEAVY sweating or LARGE increases in breathing or heart rate? {Asked of all adults.}
AHB.100 About how long do you do these vigorous leisure-time physical activities each time? {Asked of adults who reported any vigorous activity.}
AHB.110 How often do you do LIGHT OR MODERATE leisure-time physical activities for AT LEAST 10 MINUTES that cause ONLY LIGHT sweating or a SLIGHT TO MODERATE increase in breathing or heart rate? {Asked of all adults.}
AHB.120 About how long do you do these light or moderate leisure-time physical activities each time? {Asked of adults who reported any light-moderate activity.}
AHB.130 How often do you do LEISURE-TIME physical activities specifically designed to STRENGTHEN your muscles such as lifting weights or doing calisthenics? (Include all such activities even if you mentioned them before.) {Asked of all adults.}
Body Weight and Height AHB.190 How tall are you without
shoes? {Asked of all adults.}
AHB.200 How much do you weigh without shoes? {Asked of all adults.}
Sleep AHB.210 On average, how many
hours of sleep do you get in a 24-hour period? {Asked of all adults.}

Series 10, No. 245 [ Page 83
Appendix IV Tables of Unadjusted Estimates
Table III. Crude percent distributions (with standard errors) of lifetime alcohol drinking status for adults 18 years of age and over, by selected characteristics: United States, average annual, 2005–2007
Lifetime alcohol drinking status1
Lifetime Former Regular Selected characteristic Total abstainer infrequent regular Current
Both sexes Percent distribution (standard error)
Ages 18 years and over (crude)2 . . . . . . . . . . . . . . . . . . 100.0 24.4 (0.32) 8.2 (0.14) 6.3 (0.15) 61.2 (0.31) Ages 18 years and over (age-adjusted)2,3 . . . . . . . . . . . . 100.0 24.6 (0.32) 8.1 (0.14) 6.2 (0.15) 61.2 (0.31)
Age: 18–24 years . . . . . . . . . . . . . . . . . . . . . . . . . . . . . 100.0 35.8 (0.85) 2.9 (0.25) 1.7 (0.17) 60.0 (0.88) 25–44 years . . . . . . . . . . . . . . . . . . . . . . . . . . . . . 100.0 20.9 (0.38) 6.1 (0.19) 4.4 (0.16) 68.7 (0.41) 45–64 years . . . . . . . . . . . . . . . . . . . . . . . . . . . . . 100.0 20.4 (0.38) 9.9 (0.25) 7.7 (0.24) 62.1 (0.42) 65–74 years . . . . . . . . . . . . . . . . . . . . . . . . . . . . . 100.0 28.2 (0.68) 13.8 (0.48) 10.6 (0.46) 47.5 (0.74) 75 years and over . . . . . . . . . . . . . . . . . . . . . . . . . . 100.0 36.1 (0.75) 14.1 (0.47) 12.2 (0.49) 37.6 (0.74)
Race: White, single race . . . . . . . . . . . . . . . . . . . . . . . . . . 100.0 21.6 (0.34) 8.1 (0.16) 6.5 (0.18) 64.0 (0.34) Black or African American, single race . . . . . . . . . . . . . 100.0 35.8 (0.72) 9.5 (0.32) 5.9 (0.29) 49.1 (0.67) American Indian or Alaska Native, single race . . . . . . . . 100.0 27.4 (3.13) 9.4 (1.05) 9.4 (1.32) 54.2 (3.05) Asian, single race . . . . . . . . . . . . . . . . . . . . . . . . . . 100.0 47.0 (1.07) 6.0 (0.53) 2.7 (0.32) 44.5 (1.04) Native Hawaiian or Other Pacific Islander, single race. . . . 100.0 36.7 (6.85) *10.1 (3.61) *6.1 (3.01) 47.1 (5.96) Two or more races . . . . . . . . . . . . . . . . . . . . . . . . . 100.0 22.8 (1.72) 11.2 (1.22) 9.7 (1.05) 56.5 (1.92)
Black or African American, white . . . . . . . . . . . . . . . 100.0 31.6 (4.73) *6.5 (2.30) 5.2 (1.53) 56.7 (4.84) American Indian or Alaska Native, white . . . . . . . . . . . 100.0 19.7 (2.25) 12.3 (1.99) 13.8 (1.78) 54.4 (2.73)
Hispanic or Latino origin and race: Hispanic or Latino . . . . . . . . . . . . . . . . . . . . . . . . . . 100.0 35.3 (0.58) 6.9 (0.28) 4.9 (0.24) 53.1 (0.60)
Mexican or Mexican American . . . . . . . . . . . . . . . . . 100.0 36.3 (0.73) 6.7 (0.34) 5.3 (0.32) 51.8 (0.75) Not Hispanic or Latino . . . . . . . . . . . . . . . . . . . . . . . 100.0 22.8 (0.35) 8.4 (0.15) 6.5 (0.17) 62.4 (0.34)
White, single race . . . . . . . . . . . . . . . . . . . . . . . . 100.0 19.2 (0.37) 8.3 (0.18) 6.7 (0.20) 65.9 (0.37) Black or African American, single race . . . . . . . . . . . . 100.0 35.9 (0.74) 9.5 (0.33) 6.0 (0.30) 48.8 (0.68)
Education: Less than high school graduate . . . . . . . . . . . . . . . . . 100.0 37.5 (0.61) 11.4 (0.33) 9.0 (0.32) 42.4 (0.55) GED diploma4 . . . . . . . . . . . . . . . . . . . . . . . . . . . . 100.0 20.8 (1.23) 12.0 (0.93) 9.5 (0.76) 57.9 (1.40) High school graduate . . . . . . . . . . . . . . . . . . . . . . . . 100.0 27.9 (0.54) 9.5 (0.26) 6.9 (0.30) 55.9 (0.50) Some college—no degree . . . . . . . . . . . . . . . . . . . . . 100.0 21.3 (0.50) 7.5 (0.28) 5.6 (0.25) 65.8 (0.59) Associate of arts degree . . . . . . . . . . . . . . . . . . . . . . 100.0 18.7 (0.58) 8.1 (0.39) 6.2 (0.36) 67.1 (0.72) Bachelor of arts, science degree . . . . . . . . . . . . . . . . . 100.0 16.8 (0.45) 5.4 (0.26) 4.1 (0.21) 73.8 (0.53) Masters, doctorate, medical degree . . . . . . . . . . . . . . . 100.0 16.4 (0.59) 5.1 (0.33) 4.2 (0.28) 74.3 (0.67)
Poverty status:5
Below poverty level . . . . . . . . . . . . . . . . . . . . . . . . . 100.0 36.0 (0.74) 9.7 (0.40) 7.4 (0.34) 47.1 (0.84) ≥ 1 and <2 times poverty level . . . . . . . . . . . . . . . . . . 100.0 32.8 (0.63) 10.1 (0.34) 8.2 (0.33) 49.0 (0.63) ≥ 2 and <4 times poverty level . . . . . . . . . . . . . . . . . . 100.0 25.0 (0.48) 9.0 (0.25) 6.7 (0.26) 59.4 (0.52) 4 times poverty level or more . . . . . . . . . . . . . . . . . . . 100.0 16.3 (0.37) 6.2 (0.20) 4.7 (0.18) 73.0 (0.41)
Marital status: Never married . . . . . . . . . . . . . . . . . . . . . . . . . . . . 100.0 30.9 (0.61) 4.1 (0.19) 3.2 (0.16) 62.2 (0.64) Married . . . . . . . . . . . . . . . . . . . . . . . . . . . . . . . . 100.0 22.7 (0.36) 8.9 (0.20) 6.6 (0.20) 61.9 (0.37) Cohabiting . . . . . . . . . . . . . . . . . . . . . . . . . . . . . . 100.0 13.0 (0.61) 5.8 (0.43) 5.8 (0.46) 75.5 (0.83) Divorced or separated . . . . . . . . . . . . . . . . . . . . . . . 100.0 19.3 (0.48) 9.8 (0.33) 8.5 (0.32) 62.5 (0.56) Widowed . . . . . . . . . . . . . . . . . . . . . . . . . . . . . . . 100.0 38.6 (0.79) 14.8 (0.50) 10.5 (0.47) 36.1 (0.71)
Geographic region: Northeast . . . . . . . . . . . . . . . . . . . . . . . . . . . . . . . 100.0 18.6 (0.48) 7.5 (0.29) 5.4 (0.25) 68.7 (0.55) Midwest . . . . . . . . . . . . . . . . . . . . . . . . . . . . . . . . 100.0 19.6 (0.61) 8.3 (0.30) 6.9 (0.48) 65.4 (0.64) South . . . . . . . . . . . . . . . . . . . . . . . . . . . . . . . . . 100.0 29.7 (0.61) 9.0 (0.25) 6.3 (0.21) 55.1 (0.56) West . . . . . . . . . . . . . . . . . . . . . . . . . . . . . . . . . . 100.0 25.6 (0.58) 7.6 (0.27) 6.3 (0.24) 60.7 (0.56)
See footnotes at end of table.

Page 84 [ Series 10, No. 245
Table III. Crude percent distributions (with standard errors) of lifetime alcohol drinking status for adults 18 years of age and over, by selected characteristics: United States, average annual, 2005–2007—Con.
Lifetime alcohol drinking status1
Lifetime Former Regular Selected characteristic Total abstainer infrequent regular Current
Men Percent distribution (standard error)
Ages 18 years and over (crude)2 . . . . . . . . . . . . . . . . . . 100.0 17.5 (0.35) 7.1 (0.18) 7.7 (0.21) 67.9 (0.36) Ages 18 years and over (age-adjusted)2,3 . . . . . . . . . . . . 100.0 17.7 (0.35) 7.2 (0.18) 7.7 (0.20) 67.6 (0.36)
Age: 18–24 years . . . . . . . . . . . . . . . . . . . . . . . . . . . . . 100.0 32.5 (1.15) 2.3 (0.35) 1.4 (0.23) 64.2 (1.18) 25–44 years . . . . . . . . . . . . . . . . . . . . . . . . . . . . . 100.0 15.2 (0.44) 5.0 (0.25) 4.6 (0.24) 75.2 (0.50) 45–64 years . . . . . . . . . . . . . . . . . . . . . . . . . . . . . 100.0 13.6 (0.46) 9.0 (0.34) 10.0 (0.36) 67.6 (0.54) 65–74 years . . . . . . . . . . . . . . . . . . . . . . . . . . . . . 100.0 17.0 (0.83) 12.6 (0.70) 14.1 (0.73) 56.4 (1.08) 75 years and over . . . . . . . . . . . . . . . . . . . . . . . . . . 100.0 21.3 (1.02) 12.8 (0.73) 18.3 (0.91) 47.8 (1.15)
Race: White, single race . . . . . . . . . . . . . . . . . . . . . . . . . . 100.0 15.3 (0.37) 7.1 (0.21) 7.8 (0.24) 70.0 (0.40) Black or African American, single race . . . . . . . . . . . . . 100.0 27.0 (0.97) 7.5 (0.47) 7.2 (0.45) 58.6 (1.03) American Indian or Alaska Native, single race . . . . . . . . 100.0 19.2 (3.25) 9.4 (2.02) 11.6 (2.06) 60.3 (3.59) Asian, single race . . . . . . . . . . . . . . . . . . . . . . . . . . 100.0 33.0 (1.43) 6.6 (0.74) 3.6 (0.55) 56.9 (1.51) Native Hawaiian or Other Pacific Islander, single race. . . . 100.0 40.8 (10.59) *8.9 (4.02) † 43.4 (9.11) Two or more races . . . . . . . . . . . . . . . . . . . . . . . . . 100.0 20.3 (2.66) 8.8 (1.74) 12.3 (1.85) 59.0 (2.99)
Black or African American, white . . . . . . . . . . . . . . . 100.0 32.2 (8.71) † *4.6 (2.14) 58.2 (8.64) American Indian or Alaska Native, white . . . . . . . . . . . 100.0 16.2 (2.91) 8.7 (2.30) 17.0 (3.03) 58.5 (3.99)
Hispanic or Latino origin and race: Hispanic or Latino . . . . . . . . . . . . . . . . . . . . . . . . . . 100.0 22.5 (0.74) 6.2 (0.37) 5.6 (0.36) 65.8 (0.81)
Mexican or Mexican American . . . . . . . . . . . . . . . . . 100.0 22.5 (0.93) 5.9 (0.44) 6.1 (0.48) 65.6 (0.99) Not Hispanic or Latino . . . . . . . . . . . . . . . . . . . . . . . 100.0 16.6 (0.39) 7.3 (0.20) 8.0 (0.24) 68.3 (0.40)
White, single race . . . . . . . . . . . . . . . . . . . . . . . . 100.0 14.0 (0.42) 7.2 (0.23) 8.2 (0.27) 70.8 (0.44) Black or African American, single race . . . . . . . . . . . . 100.0 26.9 (0.98) 7.4 (0.48) 7.4 (0.46) 58.5 (1.05)
Education: Less than high school graduate . . . . . . . . . . . . . . . . . 100.0 23.6 (0.76) 10.3 (0.48) 11.1 (0.48) 55.4 (0.80) GED diploma4 . . . . . . . . . . . . . . . . . . . . . . . . . . . . 100.0 12.3 (1.36) 11.3 (1.44) 11.5 (1.20) 65.1 (1.89) High school graduate . . . . . . . . . . . . . . . . . . . . . . . . 100.0 20.4 (0.67) 7.7 (0.34) 8.7 (0.42) 63.5 (0.69) Some college—no degree . . . . . . . . . . . . . . . . . . . . . 100.0 16.4 (0.70) 6.3 (0.40) 7.1 (0.42) 70.4 (0.81) Associate of arts degree . . . . . . . . . . . . . . . . . . . . . . 100.0 13.5 (0.74) 6.4 (0.51) 7.1 (0.54) 73.2 (0.96) Bachelor of arts, science degree . . . . . . . . . . . . . . . . . 100.0 12.2 (0.56) 4.9 (0.36) 4.5 (0.31) 78.4 (0.70) Masters, doctorate, medical degree . . . . . . . . . . . . . . . 100.0 14.0 (0.76) 5.1 (0.48) 5.1 (0.46) 75.8 (0.92)
Poverty status:5
Below poverty level . . . . . . . . . . . . . . . . . . . . . . . . . 100.0 25.4 (1.05) 8.2 (0.58) 9.2 (0.59) 57.5 (1.20) ≥ 1 and <2 times poverty level . . . . . . . . . . . . . . . . . . 100.0 23.7 (0.78) 8.6 (0.48) 10.2 (0.51) 57.7 (0.91) ≥ 2 and <4 times poverty level . . . . . . . . . . . . . . . . . . 100.0 18.1 (0.56) 8.1 (0.34) 8.4 (0.37) 65.6 (0.63) 4 times poverty level or more . . . . . . . . . . . . . . . . . . . 100.0 12.3 (0.46) 5.5 (0.27) 5.7 (0.26) 76.6 (0.52)
Marital status: Never married . . . . . . . . . . . . . . . . . . . . . . . . . . . . 100.0 26.2 (0.77) 3.6 (0.26) 3.6 (0.24) 67.0 (0.79) Married . . . . . . . . . . . . . . . . . . . . . . . . . . . . . . . . 100.0 15.8 (0.41) 8.4 (0.26) 8.4 (0.29) 67.6 (0.45) Cohabiting . . . . . . . . . . . . . . . . . . . . . . . . . . . . . . 100.0 9.5 (0.75) 4.6 (0.58) 6.6 (0.71) 79.5 (1.10) Divorced or separated . . . . . . . . . . . . . . . . . . . . . . . 100.0 12.0 (0.63) 7.9 (0.45) 10.5 (0.55) 69.7 (0.82) Widowed . . . . . . . . . . . . . . . . . . . . . . . . . . . . . . . 100.0 18.1 (1.29) 13.1 (1.03) 19.4 (1.23) 49.6 (1.61)
Geographic region: Northeast . . . . . . . . . . . . . . . . . . . . . . . . . . . . . . . 100.0 12.7 (0.58) 6.4 (0.38) 6.5 (0.40) 74.6 (0.70) Midwest . . . . . . . . . . . . . . . . . . . . . . . . . . . . . . . . 100.0 14.1 (0.66) 6.6 (0.38) 8.3 (0.57) 71.2 (0.71) South . . . . . . . . . . . . . . . . . . . . . . . . . . . . . . . . . 100.0 21.6 (0.70) 8.2 (0.33) 8.0 (0.33) 62.3 (0.67) West . . . . . . . . . . . . . . . . . . . . . . . . . . . . . . . . . . 100.0 18.0 (0.62) 6.5 (0.36) 7.4 (0.35) 68.3 (0.68)
Women
Ages 18 years and over (crude)2 . . . . . . . . . . . . . . . . . . 100.0 30.8 (0.39) 9.3 (0.19) 5.0 (0.16) 55.0 (0.39) Ages 18 years and over (age-adjusted)2,3 . . . . . . . . . . . . 100.0 30.9 (0.39) 9.0 (0.19) 4.9 (0.16) 55.3 (0.39)
Age: 18–24 years . . . . . . . . . . . . . . . . . . . . . . . . . . . . . 100.0 39.1 (1.02) 3.4 (0.32) 1.9 (0.24) 55.9 (1.07) 25–44 years . . . . . . . . . . . . . . . . . . . . . . . . . . . . . 100.0 26.4 (0.51) 7.1 (0.26) 4.1 (0.21) 62.4 (0.54) 45–64 years . . . . . . . . . . . . . . . . . . . . . . . . . . . . . 100.0 26.8 (0.52) 10.7 (0.34) 5.5 (0.26) 57.0 (0.56) 65–74 years . . . . . . . . . . . . . . . . . . . . . . . . . . . . . 100.0 37.6 (0.91) 14.8 (0.65) 7.7 (0.50) 39.9 (0.89) 75 years and over . . . . . . . . . . . . . . . . . . . . . . . . . . 100.0 45.6 (0.98) 15.0 (0.60) 8.3 (0.50) 31.1 (0.90)
See footnotes at end of table.

Series 10, No. 245 [ Page 85
Table III. Crude percent distributions (with standard errors) of lifetime alcohol drinking status for adults 18 years of age and over, by selected characteristics: United States, average annual, 2005–2007—Con.
Lifetime alcohol drinking status1
Lifetime Former Regular Selected characteristic Total abstainer infrequent regular Current
Women—Con. Percent distribution (standard error) Race:
White, single race . . . . . . . . . . . . . . . . . . . . . . . . . . 100.0 27.5 (0.42) 9.1 (0.22) 5.2 (0.19) 58.3 (0.43) Black or African American, single race . . . . . . . . . . . . . 100.0 42.9 (0.87) 11.1 (0.46) 4.8 (0.34) 41.3 (0.77) American Indian or Alaska Native, single race . . . . . . . . 100.0 35.7 (4.23) 9.3 (1.50) 7.1 (1.74) 47.9 (4.05) Asian, single race . . . . . . . . . . . . . . . . . . . . . . . . . . 100.0 60.2 (1.43) 5.4 (0.68) 1.8 (0.33) 32.7 (1.33) Native Hawaiian or Other Pacific Islander, single race. . . . 100.0 32.3 (7.47) † † 51.0 (8.00) Two or more races . . . . . . . . . . . . . . . . . . . . . . . . . 100.0 25.2 (2.36) 13.5 (1.52) 7.2 (1.21) 54.1 (2.45)
Black or African American, white . . . . . . . . . . . . . . . 100.0 31.3 (5.51) *7.5 (3.24) *5.6 (2.12) 55.6 (5.90) American Indian or Alaska Native, white . . . . . . . . . . . 100.0 23.7 (3.77) 16.5 (2.68) 10.1 (2.33) 49.7 (3.75)
Hispanic or Latino origin and race: Hispanic or Latino . . . . . . . . . . . . . . . . . . . . . . . . . . 100.0 48.7 (0.77) 7.6 (0.37) 4.2 (0.30) 39.7 (0.76)
Mexican or Mexican American . . . . . . . . . . . . . . . . . 100.0 51.5 (0.99) 7.6 (0.48) 4.4 (0.38) 36.7 (0.98) Not Hispanic or Latino . . . . . . . . . . . . . . . . . . . . . . . 100.0 28.3 (0.42) 9.5 (0.21) 5.1 (0.18) 57.1 (0.41)
White, single race . . . . . . . . . . . . . . . . . . . . . . . . 100.0 23.9 (0.45) 9.4 (0.24) 5.3 (0.21) 61.5 (0.46) Black or African American, single race . . . . . . . . . . . . 100.0 43.2 (0.89) 11.1 (0.46) 4.9 (0.35) 41.0 (0.79)
Education: Less than high school graduate . . . . . . . . . . . . . . . . . 100.0 50.9 (0.75) 12.4 (0.46) 7.1 (0.37) 29.8 (0.64) GED diploma4 . . . . . . . . . . . . . . . . . . . . . . . . . . . . 100.0 29.8 (1.88) 12.7 (1.34) 7.3 (0.97) 50.4 (2.01) High school graduate . . . . . . . . . . . . . . . . . . . . . . . . 100.0 34.7 (0.65) 11.1 (0.37) 5.3 (0.32) 48.9 (0.63) Some college—no degree . . . . . . . . . . . . . . . . . . . . . 100.0 25.5 (0.66) 8.5 (0.39) 4.3 (0.27) 61.8 (0.72) Associate of arts degree . . . . . . . . . . . . . . . . . . . . . . 100.0 22.8 (0.80) 9.5 (0.56) 5.5 (0.44) 62.4 (0.94) Bachelor of arts, science degree . . . . . . . . . . . . . . . . . 100.0 21.3 (0.63) 5.8 (0.35) 3.7 (0.26) 69.2 (0.71) Masters, doctorate, medical degree . . . . . . . . . . . . . . . 100.0 19.0 (0.82) 5.1 (0.45) 3.3 (0.32) 72.6 (0.90)
Poverty status:5
Below poverty level . . . . . . . . . . . . . . . . . . . . . . . . . 100.0 43.4 (0.85) 10.8 (0.47) 6.2 (0.38) 39.8 (0.91) ≥ 1 and <2 times poverty level . . . . . . . . . . . . . . . . . . 100.0 40.2 (0.79) 11.4 (0.45) 6.5 (0.36) 41.9 (0.71) ≥ 2 and <4 times poverty level . . . . . . . . . . . . . . . . . . 100.0 31.4 (0.62) 9.9 (0.38) 5.2 (0.28) 53.6 (0.67) 4 times poverty level or more . . . . . . . . . . . . . . . . . . . 100.0 20.5 (0.52) 6.9 (0.28) 3.6 (0.22) 69.1 (0.60)
Marital status: Never married . . . . . . . . . . . . . . . . . . . . . . . . . . . . 100.0 36.5 (0.80) 4.6 (0.26) 2.7 (0.21) 56.4 (0.83) Married . . . . . . . . . . . . . . . . . . . . . . . . . . . . . . . . 100.0 29.6 (0.48) 9.5 (0.27) 4.7 (0.21) 56.3 (0.49) Cohabiting . . . . . . . . . . . . . . . . . . . . . . . . . . . . . . 100.0 16.9 (0.94) 7.2 (0.64) 4.9 (0.58) 71.2 (1.20) Divorced or separated . . . . . . . . . . . . . . . . . . . . . . . 100.0 24.2 (0.63) 11.2 (0.46) 7.0 (0.37) 57.7 (0.74) Widowed . . . . . . . . . . . . . . . . . . . . . . . . . . . . . . . 100.0 43.6 (0.87) 15.2 (0.55) 8.3 (0.48) 32.9 (0.75)
Geographic region: Northeast . . . . . . . . . . . . . . . . . . . . . . . . . . . . . . . 100.0 23.8 (0.65) 8.4 (0.40) 4.4 (0.29) 63.5 (0.73) Midwest . . . . . . . . . . . . . . . . . . . . . . . . . . . . . . . . 100.0 24.7 (0.74) 9.8 (0.42) 5.6 (0.49) 60.0 (0.80) South . . . . . . . . . . . . . . . . . . . . . . . . . . . . . . . . . 100.0 37.0 (0.71) 9.7 (0.31) 4.9 (0.21) 48.6 (0.67) West . . . . . . . . . . . . . . . . . . . . . . . . . . . . . . . . . . 100.0 33.0 (0.79) 8.7 (0.41) 5.2 (0.28) 53.2 (0.77)
* Estimates preceded by an asterisk have a relative standard error of greater than 30% and less than or equal to 50%. These should be interpreted with caution as they do not meet the standard of reliability or precision.
† Estimates with a relative standard error greater than 50% are indicated with a dagger, but are not shown. 1Lifetime alcohol drinking status: Lifetime abstainer—had fewer than 12 drinks in entire lifetime; Former infrequent—had 12 drinks or more in lifetime, but never as many as 12 drinks in a single year, and had no drinks in the past year; former regular—had 12 drinks or more in 1 year, but no drinks in the past year; current drinker—had at least 12 drinks in lifetime and at least 1 drink in the past year. 2Persons of other races and unknown race and ethnicity, unknown education, unknown poverty status, and unknown marital status are included in total. 3Estimates are age adjusted using the projected 2000 U.S. population as the standard population and using three age groups: 18–44 years, 45–64 years, and 65 years and over. 4GED is General Educational Development high school equivalency diploma. 5Poverty status is based on family income and family size using the U.S. Census Bureau poverty thresholds for 2004, 2005, and 2006.
NOTES: For age adjusted percent distributions, refer to Table 3.1. Denominator for each percent distribution excludes persons with unknown lifetime drinking status. See Appendix II for definitions of terms. See Appendix III for health behavior questions.
DATA SOURCE: National Health Interview Survey, 2005–2007. Estimates are based on household interviews of a sample of the civilian noninstitutionalized population.

Page 86 [ Series 10, No. 245
Table IV. Crude percent distributions (with standard errors) of current alcohol drinking status for adults 18 years of age and over, by selected characteristics: United States, average annual, 2005–2007
Current alcohol drinking status1
Selected characteristic Total Nondrinker Infrequent Light Moderate Heavier
Both sexes Percent distribution (standard error)
Ages 18 years and over (crude)2 . . . . . . . . . . . . . . . . . . 100.0 38.8 (0.31) 12.4 (0.16) 29.2 (0.23) 14.5 (0.18) 5.0 (0.12) Ages 18 years and over (age-adjusted)2,3 . . . . . . . . . . . . 100.0 38.8 (0.31) 12.3 (0.16) 29.3 (0.23) 14.4 (0.18) 5.0 (0.12)
Age: 18–24 years . . . . . . . . . . . . . . . . . . . . . . . . . . . . . 100.0 40.0 (0.88) 9.1 (0.41) 30.4 (0.68) 13.4 (0.52) 6.8 (0.41) 25–44 years . . . . . . . . . . . . . . . . . . . . . . . . . . . . . 100.0 31.3 (0.41) 13.3 (0.26) 34.8 (0.37) 15.7 (0.29) 4.9 (0.18) 45–64 years . . . . . . . . . . . . . . . . . . . . . . . . . . . . . 100.0 37.9 (0.42) 13.4 (0.28) 28.2 (0.36) 15.0 (0.29) 5.4 (0.17) 65–74 years . . . . . . . . . . . . . . . . . . . . . . . . . . . . . 100.0 52.5 (0.74) 11.2 (0.43) 19.7 (0.54) 12.5 (0.49) 4.0 (0.32) 75 years and over . . . . . . . . . . . . . . . . . . . . . . . . . . 100.0 62.4 (0.74) 10.3 (0.44) 14.6 (0.53) 10.3 (0.45) 2.2 (0.21)
Race: White, single race . . . . . . . . . . . . . . . . . . . . . . . . . . 100.0 36.0 (0.34) 12.4 (0.18) 30.4 (0.26) 15.7 (0.21) 5.4 (0.14) Black or African American, single race . . . . . . . . . . . . . 100.0 50.9 (0.67) 12.4 (0.40) 23.6 (0.52) 9.4 (0.35) 3.5 (0.23) American Indian or Alaska Native, single race . . . . . . . . 100.0 45.8 (3.05) 14.5 (1.76) 23.2 (1.93) 11.2 (1.96) 4.8 (1.13) Asian, single race . . . . . . . . . . . . . . . . . . . . . . . . . . 100.0 55.5 (1.04) 11.3 (0.65) 24.2 (0.86) 7.3 (0.53) 1.6 (0.26) Native Hawaiian or Other Pacific Islander, single race. . . . 100.0 52.9 (5.96) *6.3 (3.14) 25.7 (5.00) *7.5 (2.75) *7.6 (3.44) Two or more races . . . . . . . . . . . . . . . . . . . . . . . . . 100.0 43.5 (1.92) 13.9 (1.37) 25.3 (1.78) 10.8 (1.32) 6.3 (1.00)
Black or African American, white . . . . . . . . . . . . . . . 100.0 43.3 (4.84) 18.4 (3.93) 26.0 (4.32) *7.9 (2.53) *4.4 (1.58) American Indian or Alaska Native, white . . . . . . . . . . . 100.0 45.6 (2.73) 11.7 (1.80) 23.3 (2.48) 12.2 (2.06) 7.0 (1.41)
Hispanic or Latino origin and race: Hispanic or Latino . . . . . . . . . . . . . . . . . . . . . . . . . . 100.0 46.9 (0.60) 12.1 (0.38) 26.5 (0.50) 11.5 (0.37) 2.7 (0.17)
Mexican or Mexican American . . . . . . . . . . . . . . . . . 100.0 48.2 (0.75) 11.0 (0.47) 25.6 (0.62) 12.2 (0.47) 2.9 (0.22) Not Hispanic or Latino . . . . . . . . . . . . . . . . . . . . . . . 100.0 37.6 (0.34) 12.4 (0.17) 29.6 (0.25) 14.9 (0.20) 5.4 (0.13)
White, single race . . . . . . . . . . . . . . . . . . . . . . . . 100.0 34.1 (0.37) 12.5 (0.20) 31.0 (0.28) 16.4 (0.23) 5.9 (0.16) Black or African American, single race . . . . . . . . . . . . 100.0 51.2 (0.68) 12.2 (0.40) 23.6 (0.53) 9.3 (0.36) 3.4 (0.23)
Education: Less than high school graduate . . . . . . . . . . . . . . . . . 100.0 57.6 (0.55) 10.0 (0.31) 18.4 (0.42) 9.4 (0.33) 4.2 (0.22) GED diploma4 . . . . . . . . . . . . . . . . . . . . . . . . . . . . 100.0 42.1 (1.40) 13.0 (0.95) 24.1 (1.17) 13.2 (0.98) 7.4 (0.71) High school graduate . . . . . . . . . . . . . . . . . . . . . . . . 100.0 44.1 (0.50) 13.1 (0.30) 25.4 (0.41) 12.4 (0.30) 4.9 (0.19) Some college—no degree . . . . . . . . . . . . . . . . . . . . . 100.0 34.2 (0.59) 13.3 (0.37) 31.4 (0.51) 14.7 (0.40) 6.2 (0.28) Associate of arts degree . . . . . . . . . . . . . . . . . . . . . . 100.0 32.9 (0.72) 15.1 (0.50) 32.5 (0.67) 14.9 (0.49) 4.5 (0.32) Bachelor of arts, science degree . . . . . . . . . . . . . . . . . 100.0 26.2 (0.53) 11.9 (0.35) 37.1 (0.54) 19.4 (0.46) 5.4 (0.29) Masters, doctorate, medical degree . . . . . . . . . . . . . . . 100.0 25.7 (0.67) 10.9 (0.46) 39.2 (0.73) 20.4 (0.61) 3.7 (0.29)
Poverty status:5
Below poverty level . . . . . . . . . . . . . . . . . . . . . . . . . 100.0 52.9 (0.84) 10.9 (0.38) 21.2 (0.54) 9.8 (0.43) 4.9 (0.33) ≥ 1 and <2 times poverty level . . . . . . . . . . . . . . . . . . 100.0 51.0 (0.63) 12.3 (0.35) 22.0 (0.46) 10.1 (0.37) 4.5 (0.23) ≥ 2 and <4 times poverty level . . . . . . . . . . . . . . . . . . 100.0 40.6 (0.52) 13.3 (0.32) 28.1 (0.44) 13.0 (0.31) 4.9 (0.20) 4 times poverty level or more . . . . . . . . . . . . . . . . . . . 100.0 27.0 (0.41) 12.1 (0.26) 36.1 (0.41) 19.2 (0.33) 5.4 (0.18)
Marital status: Never married . . . . . . . . . . . . . . . . . . . . . . . . . . . . 100.0 37.8 (0.64) 9.3 (0.30) 30.0 (0.50) 15.7 (0.41) 6.8 (0.29) Married . . . . . . . . . . . . . . . . . . . . . . . . . . . . . . . . 100.0 38.1 (0.37) 13.5 (0.22) 30.0 (0.31) 14.4 (0.24) 4.0 (0.14) Cohabiting . . . . . . . . . . . . . . . . . . . . . . . . . . . . . . 100.0 24.5 (0.83) 12.4 (0.61) 34.7 (0.87) 19.5 (0.90) 8.7 (0.55) Divorced or separated . . . . . . . . . . . . . . . . . . . . . . . 100.0 37.5 (0.56) 13.0 (0.41) 28.8 (0.52) 14.2 (0.38) 6.4 (0.28) Widowed . . . . . . . . . . . . . . . . . . . . . . . . . . . . . . . 100.0 63.9 (0.71) 11.3 (0.47) 15.2 (0.54) 6.7 (0.34) 2.8 (0.25)
Geographic region: Northeast . . . . . . . . . . . . . . . . . . . . . . . . . . . . . . . 100.0 31.3 (0.55) 13.3 (0.40) 33.5 (0.49) 16.8 (0.47) 4.9 (0.25) Midwest . . . . . . . . . . . . . . . . . . . . . . . . . . . . . . . . 100.0 34.6 (0.64) 13.3 (0.36) 31.5 (0.46) 14.9 (0.36) 5.5 (0.27) South . . . . . . . . . . . . . . . . . . . . . . . . . . . . . . . . . 100.0 44.9 (0.56) 12.0 (0.26) 25.5 (0.41) 12.8 (0.28) 4.7 (0.19) West . . . . . . . . . . . . . . . . . . . . . . . . . . . . . . . . . . 100.0 39.3 (0.56) 11.2 (0.31) 29.3 (0.42) 14.9 (0.40) 5.1 (0.23)
Men
Ages 18 years and over (crude)2 . . . . . . . . . . . . . . . . . . 100.0 32.1 (0.36) 9.2 (0.20) 30.6 (0.32) 22.2 (0.29) 5.8 (0.18) Ages 18 years and over (age-adjusted)2,3 . . . . . . . . . . . . 100.0 32.4 (0.36) 9.2 (0.20) 30.4 (0.32) 22.1 (0.30) 5.7 (0.18)
Age: 18–24 years . . . . . . . . . . . . . . . . . . . . . . . . . . . . . 100.0 35.8 (1.18) 7.0 (0.56) 28.8 (0.99) 20.1 (0.89) 7.8 (0.65) 25–44 years . . . . . . . . . . . . . . . . . . . . . . . . . . . . . 100.0 24.8 (0.50) 9.4 (0.31) 35.7 (0.54) 24.0 (0.47) 5.9 (0.28) 45–64 years . . . . . . . . . . . . . . . . . . . . . . . . . . . . . 100.0 32.4 (0.54) 9.7 (0.34) 29.7 (0.52) 22.2 (0.47) 5.8 (0.27) 65–74 years . . . . . . . . . . . . . . . . . . . . . . . . . . . . . 100.0 43.6 (1.08) 9.7 (0.60) 22.4 (0.88) 19.9 (0.88) 4.3 (0.39) 75 years and over . . . . . . . . . . . . . . . . . . . . . . . . . . 100.0 52.2 (1.15) 9.2 (0.70) 18.3 (0.95) 17.9 (0.89) 2.2 (0.33)
See footnotes at end of table.

Series 10, No. 245 [ Page 87
Table IV. Crude percent distributions (with standard errors) of current alcohol drinking status for adults 18 years of age and over, by selected characteristics: United States, average annual, 2005–2007—Con.
Current alcohol drinking status1
Selected characteristic Total Nondrinker Infrequent Light Moderate Heavier
Men—Con. Percent distribution (standard error)
Race: White, single race . . . . . . . . . . . . . . . . . . . . . . . . . . 100.0 30.0 (0.40) 9.1 (0.22) 31.1 (0.37) 23.6 (0.33) 6.1 (0.21) Black or African American, single race . . . . . . . . . . . . . 100.0 41.4 (1.03) 9.5 (0.57) 27.3 (0.85) 16.6 (0.72) 5.0 (0.45) American Indian or Alaska Native, single race . . . . . . . . 100.0 39.7 (3.59) 9.0 (1.97) 27.7 (3.10) 17.2 (3.41) *5.7 (1.79) Asian, single race . . . . . . . . . . . . . . . . . . . . . . . . . . 100.0 43.1 (1.51) 11.7 (0.97) 31.3 (1.37) 11.6 (0.98) 2.1 (0.42) Native Hawaiian or Other Pacific Islander, single race. . . . 100.0 56.6 (9.11) † *16.7 (6.05) *13.5 (5.17) † Two or more races . . . . . . . . . . . . . . . . . . . . . . . . . 100.0 41.0 (2.99) 9.9 (1.57) 24.8 (2.54) 16.9 (2.37) 7.0 (1.54)
Black or African American, white . . . . . . . . . . . . . . . 100.0 41.8 (8.64) *10.7 (4.49) 27.5 (7.89) *11.2 (4.70) *8.8 (3.78) American Indian or Alaska Native, white . . . . . . . . . . . 100.0 41.5 (3.99) 9.0 (2.20) 26.3 (3.63) 18.2 (3.47) *4.6 (1.53)
Hispanic or Latino origin and race: Hispanic or Latino . . . . . . . . . . . . . . . . . . . . . . . . . . 100.0 34.2 (0.81) 8.8 (0.47) 33.1 (0.78) 19.9 (0.66) 3.8 (0.28)
Mexican or Mexican American . . . . . . . . . . . . . . . . . 100.0 34.4 (0.99) 7.9 (0.55) 32.4 (0.95) 20.8 (0.84) 4.3 (0.37) Not Hispanic or Latino . . . . . . . . . . . . . . . . . . . . . . . 100.0 31.7 (0.40) 9.3 (0.22) 30.2 (0.35) 22.5 (0.32) 6.1 (0.20)
White, single race . . . . . . . . . . . . . . . . . . . . . . . . 100.0 29.2 (0.44) 9.1 (0.24) 30.7 (0.40) 24.3 (0.37) 6.5 (0.24) Black or African American, single race . . . . . . . . . . . . 100.0 41.5 (1.05) 9.5 (0.58) 27.3 (0.87) 16.5 (0.73) 4.9 (0.46)
Education: Less than high school graduate . . . . . . . . . . . . . . . . . 100.0 44.6 (0.80) 8.3 (0.45) 24.1 (0.70) 16.4 (0.61) 6.0 (0.38) GED diploma4 . . . . . . . . . . . . . . . . . . . . . . . . . . . . 100.0 34.9 (1.89) 9.2 (1.09) 25.2 (1.79) 21.1 (1.67) 9.4 (1.10) High school graduate . . . . . . . . . . . . . . . . . . . . . . . . 100.0 36.5 (0.69) 9.4 (0.38) 28.0 (0.59) 19.7 (0.53) 6.2 (0.32) Some college—no degree . . . . . . . . . . . . . . . . . . . . . 100.0 29.6 (0.81) 10.0 (0.49) 31.0 (0.75) 22.1 (0.66) 7.2 (0.46) Associate of arts degree . . . . . . . . . . . . . . . . . . . . . . 100.0 26.8 (0.96) 10.8 (0.68) 33.3 (0.99) 23.7 (0.89) 5.4 (0.57) Bachelor of arts, science degree . . . . . . . . . . . . . . . . . 100.0 21.6 (0.70) 8.9 (0.44) 36.6 (0.77) 28.1 (0.73) 4.7 (0.40) Masters, doctorate, medical degree . . . . . . . . . . . . . . . 100.0 24.2 (0.92) 8.4 (0.59) 36.9 (0.99) 27.6 (0.95) 2.8 (0.39)
Poverty status:5
Below poverty level . . . . . . . . . . . . . . . . . . . . . . . . . 100.0 42.5 (1.20) 7.9 (0.53) 24.1 (0.87) 18.3 (0.87) 6.8 (0.61) ≥ 1 and <2 times poverty level . . . . . . . . . . . . . . . . . . 100.0 42.3 (0.91) 9.6 (0.48) 24.8 (0.73) 16.8 (0.64) 6.2 (0.42) ≥ 2 and <4 times poverty level . . . . . . . . . . . . . . . . . . 100.0 34.4 (0.63) 9.8 (0.41) 29.9 (0.62) 19.9 (0.51) 5.8 (0.32) 4 times poverty level or more . . . . . . . . . . . . . . . . . . . 100.0 23.4 (0.52) 8.9 (0.31) 35.2 (0.56) 27.1 (0.52) 5.3 (0.28)
Marital status: Never married . . . . . . . . . . . . . . . . . . . . . . . . . . . . 100.0 33.0 (0.79) 7.1 (0.37) 28.8 (0.70) 22.5 (0.65) 8.2 (0.44) Married . . . . . . . . . . . . . . . . . . . . . . . . . . . . . . . . 100.0 32.4 (0.45) 10.4 (0.27) 31.5 (0.44) 21.4 (0.38) 4.1 (0.18) Cohabiting . . . . . . . . . . . . . . . . . . . . . . . . . . . . . . 100.0 20.5 (1.10) 9.2 (0.75) 34.3 (1.25) 27.8 (1.28) 8.0 (0.69) Divorced or separated . . . . . . . . . . . . . . . . . . . . . . . 100.0 30.3 (0.82) 7.3 (0.46) 29.0 (0.80) 24.1 (0.74) 9.1 (0.53) Widowed . . . . . . . . . . . . . . . . . . . . . . . . . . . . . . . 100.0 50.4 (1.61) 8.1 (0.83) 20.6 (1.32) 15.6 (1.12) 5.0 (0.70)
Geographic region: Northeast . . . . . . . . . . . . . . . . . . . . . . . . . . . . . . . 100.0 25.4 (0.70) 10.0 (0.50) 33.9 (0.77) 25.1 (0.74) 5.4 (0.41) Midwest . . . . . . . . . . . . . . . . . . . . . . . . . . . . . . . . 100.0 28.8 (0.71) 9.6 (0.44) 32.1 (0.62) 23.0 (0.59) 6.3 (0.41) South . . . . . . . . . . . . . . . . . . . . . . . . . . . . . . . . . 100.0 37.7 (0.67) 8.9 (0.32) 27.3 (0.57) 20.1 (0.47) 5.9 (0.30) West . . . . . . . . . . . . . . . . . . . . . . . . . . . . . . . . . . 100.0 31.7 (0.68) 8.6 (0.39) 31.7 (0.65) 22.3 (0.65) 5.4 (0.32)
Women
Ages 18 years and over (crude)2 . . . . . . . . . . . . . . . . . . 100.0 45.0 (0.39) 15.3 (0.23) 27.9 (0.30) 7.4 (0.17) 4.3 (0.13) Ages 18 years and over (age-adjusted)2,3 . . . . . . . . . . . . 100.0 44.7 (0.39) 15.3 (0.23) 28.3 (0.31) 7.4 (0.17) 4.3 (0.13)
Age: 18–24 years . . . . . . . . . . . . . . . . . . . . . . . . . . . . . 100.0 44.1 (1.07) 11.1 (0.58) 31.9 (0.95) 6.8 (0.48) 5.8 (0.46) 25–44 years . . . . . . . . . . . . . . . . . . . . . . . . . . . . . 100.0 37.6 (0.54) 17.0 (0.39) 34.0 (0.48) 7.5 (0.27) 3.8 (0.18) 45–64 years . . . . . . . . . . . . . . . . . . . . . . . . . . . . . 100.0 43.0 (0.56) 16.9 (0.40) 26.8 (0.46) 8.3 (0.30) 5.0 (0.22) 65–74 years . . . . . . . . . . . . . . . . . . . . . . . . . . . . . 100.0 60.1 (0.89) 12.4 (0.60) 17.3 (0.64) 6.3 (0.44) 3.8 (0.50) 75 years and over . . . . . . . . . . . . . . . . . . . . . . . . . . 100.0 68.9 (0.90) 11.0 (0.56) 12.2 (0.62) 5.5 (0.41) 2.3 (0.28)
Race: White, single race . . . . . . . . . . . . . . . . . . . . . . . . . . 100.0 41.7 (0.43) 15.5 (0.26) 29.7 (0.34) 8.2 (0.20) 4.8 (0.15) Black or African American, single race . . . . . . . . . . . . . 100.0 58.7 (0.77) 14.7 (0.51) 20.7 (0.61) 3.5 (0.26) 2.3 (0.19) American Indian or Alaska Native, single race . . . . . . . . 100.0 52.1 (4.05) 20.0 (3.46) 18.7 (2.25) 5.3 (1.48) *3.9 (1.25) Asian, single race . . . . . . . . . . . . . . . . . . . . . . . . . . 100.0 67.3 (1.33) 10.9 (0.86) 17.4 (1.06) 3.2 (0.48) 1.2 (0.29) Native Hawaiian or Other Pacific Islander, single race. . . . 100.0 49.0 (8.00) *12.5 (6.07) 35.3 (7.92) † † Two or more races . . . . . . . . . . . . . . . . . . . . . . . . . 100.0 45.9 (2.45) 17.7 (2.13) 25.7 (2.52) 5.0 (1.10) 5.6 (1.24)
Black or African American, white . . . . . . . . . . . . . . . 100.0 44.4 (5.90) 23.5 (5.57) 25.0 (4.96) † † American Indian or Alaska Native, white . . . . . . . . . . . 100.0 50.3 (3.75) 14.8 (2.92) 19.8 (3.13) 5.3 (1.57) 9.7 (2.37)
See footnotes at end of table.

Page 88 [ Series 10, No. 245
Table IV. Crude percent distributions (with standard errors) of current alcohol drinking status for adults 18 years of age and over, by selected characteristics: United States, average annual, 2005–2007—Con.
Current alcohol drinking status1
Selected characteristic Total Nondrinker Infrequent Light Moderate Heavier
Women—Con. Percent distribution (standard error) Hispanic or Latino origin and race:
Hispanic or Latino . . . . . . . . . . . . . . . . . . . . . . . . . . 100.0 60.3 (0.76) 15.5 (0.59) 19.7 (0.58) 2.8 (0.22) 1.6 (0.19) Mexican or Mexican American . . . . . . . . . . . . . . . . . 100.0 63.3 (0.98) 14.5 (0.78) 18.1 (0.71) 2.7 (0.27) 1.3 (0.21)
Not Hispanic or Latino . . . . . . . . . . . . . . . . . . . . . . . 100.0 42.9 (0.41) 15.3 (0.24) 29.1 (0.33) 8.0 (0.19) 4.7 (0.14) White, single race . . . . . . . . . . . . . . . . . . . . . . . . 100.0 38.5 (0.46) 15.6 (0.28) 31.3 (0.37) 9.1 (0.23) 5.3 (0.17) Black or African American, single race . . . . . . . . . . . . 100.0 59.0 (0.79) 14.4 (0.51) 20.6 (0.62) 3.6 (0.26) 2.3 (0.20)
Education: Less than high school graduate . . . . . . . . . . . . . . . . . 100.0 70.2 (0.64) 11.7 (0.45) 12.9 (0.45) 2.6 (0.22) 2.5 (0.21) GED diploma4 . . . . . . . . . . . . . . . . . . . . . . . . . . . . 100.0 49.6 (2.01) 17.1 (1.47) 22.9 (1.60) 4.8 (0.78) 5.3 (0.86) High school graduate . . . . . . . . . . . . . . . . . . . . . . . . 100.0 51.1 (0.63) 16.4 (0.45) 23.1 (0.54) 5.7 (0.28) 3.7 (0.24) Some college—no degree . . . . . . . . . . . . . . . . . . . . . 100.0 38.2 (0.72) 16.2 (0.51) 31.8 (0.67) 8.3 (0.40) 5.3 (0.31) Associate of arts degree . . . . . . . . . . . . . . . . . . . . . . 100.0 37.6 (0.94) 18.5 (0.71) 31.9 (0.91) 8.0 (0.47) 3.8 (0.37) Bachelor of arts, science degree . . . . . . . . . . . . . . . . . 100.0 30.8 (0.71) 14.9 (0.55) 37.5 (0.72) 10.9 (0.45) 6.0 (0.36) Masters, doctorate, medical degree . . . . . . . . . . . . . . . 100.0 27.4 (0.90) 13.6 (0.72) 41.5 (1.01) 12.8 (0.66) 4.7 (0.45)
Poverty status:5
Below poverty level . . . . . . . . . . . . . . . . . . . . . . . . . 100.0 60.2 (0.91) 13.0 (0.51) 19.1 (0.70) 3.9 (0.32) 3.6 (0.30) ≥ 1 and <2 times poverty level . . . . . . . . . . . . . . . . . . 100.0 58.1 (0.71) 14.4 (0.46) 19.7 (0.53) 4.6 (0.30) 3.1 (0.24) ≥ 2 and <4 times poverty level . . . . . . . . . . . . . . . . . . 100.0 46.4 (0.67) 16.5 (0.44) 26.4 (0.56) 6.5 (0.29) 4.0 (0.25) 4 times poverty level or more . . . . . . . . . . . . . . . . . . . 100.0 30.9 (0.60) 15.5 (0.39) 37.0 (0.58) 11.0 (0.34) 5.6 (0.24)
Marital status: Never married . . . . . . . . . . . . . . . . . . . . . . . . . . . . 100.0 43.6 (0.83) 11.9 (0.45) 31.4 (0.72) 7.8 (0.42) 5.2 (0.32) Married . . . . . . . . . . . . . . . . . . . . . . . . . . . . . . . . 100.0 43.7 (0.49) 16.5 (0.32) 28.4 (0.41) 7.5 (0.23) 3.8 (0.17) Cohabiting . . . . . . . . . . . . . . . . . . . . . . . . . . . . . . 100.0 28.8 (1.20) 15.9 (0.98) 35.2 (1.26) 10.4 (0.94) 9.5 (0.79) Divorced or separated . . . . . . . . . . . . . . . . . . . . . . . 100.0 42.3 (0.74) 16.9 (0.59) 28.6 (0.64) 7.4 (0.37) 4.6 (0.28) Widowed . . . . . . . . . . . . . . . . . . . . . . . . . . . . . . . 100.0 67.1 (0.75) 12.1 (0.53) 13.9 (0.56) 4.5 (0.32) 2.3 (0.25)
Geographic region: Northeast . . . . . . . . . . . . . . . . . . . . . . . . . . . . . . . 100.0 36.5 (0.73) 16.2 (0.54) 33.2 (0.69) 9.6 (0.50) 4.4 (0.30) Midwest . . . . . . . . . . . . . . . . . . . . . . . . . . . . . . . . 100.0 40.0 (0.80) 16.8 (0.53) 30.9 (0.63) 7.4 (0.34) 4.8 (0.29) South . . . . . . . . . . . . . . . . . . . . . . . . . . . . . . . . . 100.0 51.4 (0.67) 14.7 (0.37) 23.9 (0.49) 6.1 (0.26) 3.7 (0.19) West . . . . . . . . . . . . . . . . . . . . . . . . . . . . . . . . . . 100.0 46.8 (0.77) 13.7 (0.46) 27.0 (0.59) 7.6 (0.33) 4.9 (0.30)
* Estimates preceded by an asterisk have a relative standard error of greater than 30% and less than or equal to 50%. These should be interpreted with caution as they do not meet the standard of reliability or precision.
† Estimates with a relative standard error greater than 50% are indicated with a dagger, but are not shown. 1Current alcohol drinking status: Nondrinker—no drinks in the past year (includes former drinkers and lifetime abstainers); infrequent—at least 12 drinks in lifetime and 1–11 drinks in past year; light—3 drinks or less per week, on average, in the past year; moderate—more than 3 and up to and including 14 drinks per week for men, and more than 3 and up to and including 7 drinks per week for women, on average, in the past year; heavier—more than 14 drinks per week for men, and more than 7 drinks per week for women, on average, in the past year. 2Persons of other races and unknown race and ethnicity, unknown education, unknown poverty status, and unknown marital status are included in the total. 3Estimates are age adjusted using the projected 2000 U.S. population as the standard population and using three age groups: 18–44 years, 45–64 years, and 65 years and over. 4GED is General Educational Development high school equivalency diploma. 5Poverty status is based on family income and family size using the U.S. Census Bureau poverty thresholds for 2004, 2005, and 2006.
NOTES: For age-adjusted percent distributions, refer to Table 3.2. Denominator for each percent distribution excludes persons with unknown lifetime and unknown current drinking status. See Appendix II for definitions of terms. See Appendix III for health behavior questions.
DATA SOURCE: National Health Interview Survey, 2005–2007. Estimates are based on household interviews of a sample of the civilian noninstitutionalized population.

Series 10, No. 245 [ Page 89
Table V. Crude percentages (with standard errors) of adults 18 years of age and over who had five or more drinks in 1 day at least once in the past year, and crude percentages (with standard errors) of adults 18 years of age and over who had five or more drinks in 1 day on at least 12 days in the past year, by selected characteristics: United States, average annual, 2005–2007
Five or more drinks in 1 day at least once1 Five or more drinks in 1 day on at least 12 days1
Selected characteristic Both sexes Men Women Both sexes Men Women
Percent of adults (standard error)
Ages 18 years and over (crude)2 . . . . . . . . . . . . . . . . . . Ages 18 years and over (age-adjusted)2,3 . . . . . . . . . . . .
20.2 (0.25) 20.5 (0.24)
28.9 (0.39) 28.8 (0.37)
12.3 (0.22) 12.8 (0.22)
9.1 (0.16) 9.2 (0.16)
14.7 (0.28) 14.6 (0.27)
4.0 (0.13) 4.2 (0.14)
Age 18–24 years . . . . . . . . . . . . . . . . . . . . . . . . . . . . . . . 25–44 years . . . . . . . . . . . . . . . . . . . . . . . . . . . . . . . 45–64 years . . . . . . . . . . . . . . . . . . . . . . . . . . . . . . . 65–74 years . . . . . . . . . . . . . . . . . . . . . . . . . . . . . . . 75 years and over . . . . . . . . . . . . . . . . . . . . . . . . . . .
31.9 (0.84) 27.4 (0.40) 15.6 (0.29)
6.1 (0.33) 2.2 (0.22)
40.7 (1.25) 37.9 (0.61) 23.3 (0.50) 10.3 (0.62)
4.3 (0.47)
23.4 (0.89) 17.2 (0.39)
8.5 (0.29) 2.5 (0.28) 0.8 (0.18)
16.2 (0.62) 11.8 (0.27) 6.8 (0.20) 2.8 (0.21) 0.9 (0.14)
22.9 (1.00) 18.8 (0.46) 11.5 (0.37) 4.9 (0.42) 2.0 (0.32)
9.7 (0.62) 5.1 (0.23) 2.4 (0.15) 0.9 (0.18)
*0.3 (0.12)
Race White, single race . . . . . . . . . . . . . . . . . . . . . . . . . . . Black or African American, single race. . . . . . . . . . . . . . . American Indian or Alaska Native, single race . . . . . . . . . . Asian, single race . . . . . . . . . . . . . . . . . . . . . . . . . . . Native Hawaiian or Other Pacific Islander, single race . . . . . Two or more races . . . . . . . . . . . . . . . . . . . . . . . . . . .
Black or African American, white . . . . . . . . . . . . . . . . . American Indian or Alaska Native, white . . . . . . . . . . . .
21.8 (0.29) 12.5 (0.41) 26.3 (3.15) 9.8 (0.64)
19.9 (4.70) 23.7 (1.75) 17.5 (3.65) 26.8 (2.66)
30.7 (0.45) 20.3 (0.81) 36.4 (4.74) 15.1 (1.15) 28.1 (7.90) 31.2 (2.91) 22.8 (6.61) 33.2 (4.21)
13.5 (0.26) 6.2 (0.35)
15.9 (2.38) 4.7 (0.59)
*11.3 (4.15) 16.7 (1.87)
*14.2 (4.30) 19.6 (3.01)
9.7 (0.18) 6.2 (0.32)
12.7 (2.00) 4.0 (0.45)
*11.7 (3.76) 11.1 (1.45) *4.0 (1.44) 12.4 (2.10)
15.5 (0.31) 11.3 (0.68) 18.4 (3.10) 6.6 (0.82)
*20.9 (7.38) 16.3 (2.39)
† 15.2 (3.30)
4.3 (0.15) 2.1 (0.20) 6.9 (1.75) 1.6 (0.37)
† 6.2 (1.25)
*2.8 (1.19) 9.2 (2.26)
Hispanic or Latino origin and race
Hispanic or Latino . . . . . . . . . . . . . . . . . . . . . . . . . . . Mexican or Mexican American . . . . . . . . . . . . . . . . . .
Not Hispanic or Latino. . . . . . . . . . . . . . . . . . . . . . . . . White, single race . . . . . . . . . . . . . . . . . . . . . . . . . . Black or African American, single race . . . . . . . . . . . . .
19.4 (0.47) 21.6 (0.62) 20.4 (0.27) 22.2 (0.32) 12.3 (0.42)
30.5 (0.78) 34.2 (1.01) 28.7 (0.43) 30.8 (0.49) 20.0 (0.83)
7.9 (0.41) 8.0 (0.51)
12.9 (0.24) 14.4 (0.29)
6.1 (0.35)
9.6 (0.35) 11.4 (0.47) 9.0 (0.18) 9.7 (0.20) 6.1 (0.33)
16.2 (0.61) 19.2 (0.80) 14.4 (0.31) 15.4 (0.35) 11.1 (0.70)
2.9 (0.24) 2.9 (0.29) 4.1 (0.14) 4.6 (0.17) 2.1 (0.21)
Education
Less than high school graduate . . . . . . . . . . . . . . . . . . . GED diploma4 . . . . . . . . . . . . . . . . . . . . . . . . . . . . . . High school graduate . . . . . . . . . . . . . . . . . . . . . . . . . Some college—no degree . . . . . . . . . . . . . . . . . . . . . . Associate of arts degree . . . . . . . . . . . . . . . . . . . . . . . Bachelor of arts, science degree . . . . . . . . . . . . . . . . . . Masters, doctorate, medical degree . . . . . . . . . . . . . . . .
16.2 (0.45) 25.5 (1.23) 18.4 (0.39) 24.1 (0.57) 21.9 (0.64) 23.2 (0.55) 16.7 (0.58)
25.8 (0.78) 36.2 (1.94) 27.6 (0.67) 33.2 (0.89) 32.9 (1.05) 31.1 (0.90) 21.4 (0.92)
7.1 (0.38) 14.3 (1.28) 10.0 (0.36) 16.3 (0.58) 13.5 (0.66) 15.5 (0.54) 11.7 (0.64)
8.9 (0.34) 14.0 (0.99)
9.0 (0.26) 11.0 (0.39) 9.0 (0.43) 9.1 (0.36) 4.8 (0.35)
15.2 (0.62) 21.4 (1.64) 15.2 (0.50) 17.1 (0.67) 15.8 (0.84) 13.5 (0.63)
7.1 (0.61)
2.8 (0.22) 6.3 (0.87) 3.3 (0.23) 5.7 (0.38) 3.7 (0.33) 4.7 (0.32) 2.5 (0.30)
Poverty status5
Below poverty level . . . . . . . . . . . . . . . . . . . . . . . . . . ≥ 1 and <2 times poverty level . . . . . . . . . . . . . . . . . . . ≥ 2 and <4 times poverty level . . . . . . . . . . . . . . . . . . . 4 times poverty level or more . . . . . . . . . . . . . . . . . . . .
18.8 (0.70) 16.7 (0.44) 19.5 (0.37) 23.0 (0.39)
29.1 (1.18) 25.4 (0.76) 28.0 (0.61) 31.1 (0.60)
11.6 (0.61) 9.6 (0.40)
11.7 (0.38) 14.4 (0.39)
10.1 (0.43) 8.6 (0.30) 8.9 (0.26) 9.2 (0.26)
17.5 (0.87) 14.7 (0.58) 14.4 (0.45) 14.2 (0.42)
4.9 (0.34) 3.6 (0.26) 3.8 (0.24) 4.0 (0.23)
Marital status Never married. . . . . . . . . . . . . . . . . . . . . . . . . . . . . . Married . . . . . . . . . . . . . . . . . . . . . . . . . . . . . . . . . . Cohabiting . . . . . . . . . . . . . . . . . . . . . . . . . . . . . . . . Divorced or separated. . . . . . . . . . . . . . . . . . . . . . . . . Widowed . . . . . . . . . . . . . . . . . . . . . . . . . . . . . . . . .
30.3 (0.62) 17.0 (0.26) 34.8 (0.98) 20.2 (0.48)
3.9 (0.29)
38.6 (0.84) 24.2 (0.44) 42.1 (1.39) 32.1 (0.86) 11.0 (1.04)
20.7 (0.68) 9.9 (0.26)
26.8 (1.25) 12.3 (0.49)
2.2 (0.24)
15.8 (0.46) 6.6 (0.16)
16.9 (0.86) 9.7 (0.35) 1.8 (0.20)
22.2 (0.69) 10.7 (0.29) 22.6 (1.23) 18.4 (0.73)
6.6 (0.87)
8.3 (0.45) 2.5 (0.13)
10.9 (0.97) 3.8 (0.27) 0.7 (0.14)
Geographic region Northeast . . . . . . . . . . . . . . . . . . . . . . . . . . . . . . . . Midwest . . . . . . . . . . . . . . . . . . . . . . . . . . . . . . . . . South . . . . . . . . . . . . . . . . . . . . . . . . . . . . . . . . . . . West . . . . . . . . . . . . . . . . . . . . . . . . . . . . . . . . . . .
20.5 (0.58) 24.8 (0.55) 17.5 (0.40) 19.7 (0.48)
29.2 (0.90) 34.5 (0.90) 25.7 (0.61) 27.9 (0.77)
12.9 (0.53) 15.7 (0.48) 10.0 (0.35) 11.8 (0.46)
8.4 (0.37) 11.4 (0.37) 8.3 (0.25) 8.4 (0.31)
13.6 (0.65) 18.1 (0.63) 13.5 (0.45) 13.6 (0.52)
4.0 (0.34) 5.2 (0.32) 3.5 (0.18) 3.3 (0.23)
* Estimates preceded by an asterisk have a relative standard error of greater than 30% and less than or equal to 50%. These should be interpreted with caution as they do not meet the standard of reliability or precision.
† Estimates with a relative standard error greater than 50% are indicated with a dagger, but are not shown. 1Adults who had had at least one drink in the past year (current drinkers) were asked on how many days in the past year they had had five or more drinks of any alcoholic beverage. Estimates in this table are the percentage of all adults who had five or more drinks (with nondrinkers assigned a value of zero drinks.) 2Persons of other races and unknown race and ethnicity, unknown education, unknown poverty status, and unknown marital status are included in total. 3Estimates are age adjusted using the projected 2000 U.S. population as the standard population and using three age groups: 18–44 years, 45–64 years, and 65 years and over. 4GED is General Educational Development high school equivalency diploma. 5Poverty status is based on family income and family size using the U.S. Census Bureau poverty thresholds for 2004, 2005, and 2006.
NOTES: For age-adjusted percentages, refer to Table 3.3. Denominator for each percentage excludes persons with unknown lifetime drinking status and/or unknown five or more drinks in 1 day. See Appendix II for definitions of terms. See Appendix III for health behavior questions.
DATA SOURCE: National Health Interview Survey, 2005–2007. Estimates are based on household interviews of a sample of the civilian noninstitutionalized population.

Page 90 [ Series 10, No. 245
Table VI. Crude percentages (with standard errors) of current drinkers 18 years of age and over who had five or more drinks in 1 day at least once in the past year, and crude percentages (with standard errors) who had five or more drinks in 1 day on at least 12 days in the past year, by selected characteristics: United States, average annual, 2005–2007
Five or more drinks in 1 day at least once1 Five or more drinks in 1 day on at least 12 days1
Selected characteristic Both sexes Men Women Both sexes Men Women
Percent of current drinkers (standard error)
Ages 18 years and over (crude)2 . . . . . . . . . . . . . . . . . . Ages 18 years and over (age-adjusted)2,3 . . . . . . . . . . . .
33.3 (0.35) 32.2 (0.32)
42.9 41.4
(0.50) (0.45)
22.4 (0.36) 21.7 (0.33)
14.9 (0.25) 14.5 (0.23)
21.8 21.0
(0.38) (0.36)
7.3 (0.23) 7.1 (0.22)
Age
18–24 years . . . . . . . . . . . . . . . . . . . . . . . . . . . . . . . 25–44 years . . . . . . . . . . . . . . . . . . . . . . . . . . . . . . . 45–64 years . . . . . . . . . . . . . . . . . . . . . . . . . . . . . . . 65–74 years . . . . . . . . . . . . . . . . . . . . . . . . . . . . . . . 75 years and over . . . . . . . . . . . . . . . . . . . . . . . . . . .
53.8 (1.02) 40.1 (0.52) 25.2 (0.44) 12.8 (0.67)
5.8 (0.56)
64.0 (1.38) 50.7 (0.71) 34.7 (0.69) 18.4 (1.06) 9.1 (0.96)
42.3 (1.30) 27.7 (0.58) 14.9 (0.48)
6.2 (0.69) 2.5 (0.59)
27.3 (0.91) 17.3 (0.37) 11.0 (0.32) 5.9 (0.44) 2.5 (0.38)
36.1 (1.35) 25.1 (0.58) 17.1 (0.54) 8.8 (0.73) 4.2 (0.67)
17.5 (1.05) 8.2 (0.36) 4.3 (0.27) 2.4 (0.45)
*0.9 (0.37)
Race
White, single race . . . . . . . . . . . . . . . . . . . . . . . . . . . Black or African American, single race. . . . . . . . . . . . . . . American Indian or Alaska Native, single race . . . . . . . . . . Asian, single race . . . . . . . . . . . . . . . . . . . . . . . . . . . Native Hawaiian or Other Pacific Islander, single race . . . . . Two or more races . . . . . . . . . . . . . . . . . . . . . . . . . . .
Black or African American, white . . . . . . . . . . . . . . . . . American Indian or Alaska Native, white . . . . . . . . . . . .
34.3 (0.38) 25.6 (0.78) 48.8 (4.09) 22.2 (1.33) 42.2 (8.76) 42.5 (2.76) 31.4 (5.94) 50.0 (3.96)
44.2 (0.55) 35.0 (1.27) 60.8 (5.82) 26.8 (1.87) 64.6 (11.40) 53.8 (3.74) 40.3 (9.71) 58.1 (5.21)
23.2 (0.40) 15.1 (0.81) 33.4 (4.30) 14.6 (1.71)
*22.1 (8.34) 30.9 (3.43) 25.6 (7.30) 39.4 (5.55)
15.3 (0.26) 12.7 (0.65) 23.6 (3.19) 9.1 (0.99)
24.9 (7.42) 19.9 (2.55) *7.2 (2.58) 23.1 (3.72)
22.3 (0.42) 19.4 (1.11) 30.7 (4.37) 11.8 (1.41) 48.1 (12.71) 28.1 (3.76)
† 26.6 (5.31)
7.4 (0.26) 5.1 (0.49)
14.4 (3.45) 4.8 (1.13)
† 11.6 (2.37) *5.1 (2.18) 18.5 (4.32)
Hispanic or Latino origin and race
Hispanic or Latino . . . . . . . . . . . . . . . . . . . . . . . . . . . Mexican or Mexican American . . . . . . . . . . . . . . . . . .
Not Hispanic or Latino. . . . . . . . . . . . . . . . . . . . . . . . . White, single race . . . . . . . . . . . . . . . . . . . . . . . . . . Black or African American, single race . . . . . . . . . . . . .
36.9 (0.77) 42.1 (1.00) 32.8 (0.37) 33.9 (0.41) 25.4 (0.80)
46.9 52.6 42.3 43.7 34.5
(1.02) (1.29) (0.55) (0.60) (1.31)
19.9 (0.95) 21.8 (1.28) 22.7 (0.38) 23.6 (0.43) 15.0 (0.82)
18.4 (0.62) 22.2 (0.84) 14.5 (0.26) 14.8 (0.29) 12.6 (0.67)
24.8 29.6 21.3 21.8 19.2
(0.86) (1.12) (0.42) (0.46) (1.15)
7.4 (0.60) 7.8 (0.78) 7.2 (0.24) 7.4 (0.27) 5.1 (0.50)
Education
Less than high school graduate . . . . . . . . . . . . . . . . . . . GED diploma4 . . . . . . . . . . . . . . . . . . . . . . . . . . . . . . High school graduate . . . . . . . . . . . . . . . . . . . . . . . . . Some college—no degree . . . . . . . . . . . . . . . . . . . . . . Associate of arts degree . . . . . . . . . . . . . . . . . . . . . . . Bachelor of arts, science degree . . . . . . . . . . . . . . . . . . Masters, doctorate, medical degree . . . . . . . . . . . . . . . .
38.9 (0.89) 44.4 (1.85) 33.2 (0.60) 36.9 (0.73) 32.8 (0.86) 31.5 (0.70) 22.5 (0.76)
47.2 56.2 43.8 47.5 45.2 39.9 28.2
(1.19) (2.41) (0.91) (1.08) (1.25) (1.06) (1.16)
24.1 (1.13) 28.6 (2.39) 20.6 (0.67) 26.6 (0.85) 21.6 (1.00) 22.4 (0.76) 16.2 (0.87)
21.3 (0.73) 24.4 (1.59) 16.2 (0.45) 16.8 (0.56) 13.5 (0.61) 12.3 (0.47)
6.5 (0.47)
27.9 (1.03) 33.3 (2.35) 24.2 (0.73) 24.5 (0.89) 21.7 (1.09) 17.3 (0.78) 9.4 (0.79)
9.5 (0.73) 12.5 (1.72)
6.7 (0.45) 9.3 (0.61) 6.0 (0.53) 6.8 (0.46) 3.4 (0.41)
Poverty status5
Below poverty level . . . . . . . . . . . . . . . . . . . . . . . . . . ≥ 1 and <2 times poverty level . . . . . . . . . . . . . . . . . . . ≥ 2 and <4 times poverty level . . . . . . . . . . . . . . . . . . . 4 times poverty level or more . . . . . . . . . . . . . . . . . . . .
40.5 (1.09) 34.4 (0.78) 33.1 (0.56) 31.6 (0.49)
51.5 44.5 43.1 40.8
(1.55) (1.13) (0.86) (0.73)
29.5 (1.25) 23.1 (0.91) 22.0 (0.63) 21.0 (0.53)
21.7 (0.77) 17.6 (0.58) 15.1 (0.41) 12.6 (0.34)
31.0 25.7 22.1 18.6
(1.30) (0.94) (0.66) (0.53)
12.4 (0.80) 8.6 (0.62) 7.2 (0.43) 5.8 (0.33)
Marital status Never married. . . . . . . . . . . . . . . . . . . . . . . . . . . . . . Married . . . . . . . . . . . . . . . . . . . . . . . . . . . . . . . . . . Cohabiting . . . . . . . . . . . . . . . . . . . . . . . . . . . . . . . . Divorced or separated. . . . . . . . . . . . . . . . . . . . . . . . . Widowed . . . . . . . . . . . . . . . . . . . . . . . . . . . . . . . . .
49.3 (0.76) 27.6 (0.38) 46.3 (1.18) 32.6 (0.71) 10.9 (0.77)
58.2 35.9 53.4 46.6 22.4
(0.97) (0.59) (1.56) (1.11) (1.97)
36.9 (0.99) 17.7 (0.43) 37.9 (1.62) 21.4 (0.82)
6.7 (0.71)
25.7 (0.65) 10.7 (0.25) 22.6 (1.11) 15.6 (0.54)
5.0 (0.55)
33.6 15.9 28.6 26.6 13.4
(0.92) (0.41) (1.48) (0.99) (1.69)
14.8 (0.76) 4.5 (0.22)
15.4 (1.34) 6.7 (0.47) 2.0 (0.42)
Geographic region Northeast . . . . . . . . . . . . . . . . . . . . . . . . . . . . . . . . Midwest . . . . . . . . . . . . . . . . . . . . . . . . . . . . . . . . . South . . . . . . . . . . . . . . . . . . . . . . . . . . . . . . . . . . . West . . . . . . . . . . . . . . . . . . . . . . . . . . . . . . . . . . .
30.0 (0.77) 38.1 (0.69) 31.9 (0.62) 32.7 (0.71)
39.5 48.8 41.6 41.2
(1.13) (1.07) (0.84) (0.97)
20.4 (0.78) 26.3 (0.72) 20.7 (0.63) 22.2 (0.78)
12.3 (0.52) 17.6 (0.52) 15.1 (0.42) 13.9 (0.49)
18.3 25.6 21.9 20.1
(0.85) (0.82) (0.66) (0.72)
6.3 (0.54) 8.7 (0.51) 7.3 (0.36) 6.3 (0.42)
* Estimates preceded by an asterisk have a relative standard error of greater than 30% and less than or equal to 50%. These should be interpreted with caution as they do not meet the standard of reliability or precision.
† Estimates with a relative standard error greater than 50% are indicated with a dagger, but are not shown. 1Adults who had had at least one drink in the past year were asked on how many days in the past year they had had five or more drinks. 2Persons of other races and unknown race and ethnicity, unknown education, unknown poverty status, and unknown marital status are included in total. 3Estimates are age adjusted using the projected 2000 U.S. population as the standard population and using three age groups: 18–44 years, 45–64 years, and 65 years and over. 4GED is General Educational Development high school equivalency diploma. 5Poverty status is based on family income and family size using the U.S. Census Bureau poverty thresholds for 2004, 2005, and 2006.
NOTES: For age-adjusted percentages, refer to Table 3.4. Denominator for each percentage excludes persons with unknown lifetime drinking status, nondrinkers, and current drinkers with unknown information for five or more drinks in 1 day. See Appendix II for definitions of terms. See Appendix III for health behavior questions.
DATA SOURCE: National Health Interview Survey, 2005–2007. Estimates are based on household interviews of a sample of the civilian noninstitutionalized population.

Series 10, No. 245 [ Page 91
Table VII. Crude percent distributions (with standard errors) of lifetime cigarette smoking status for adults 18 years of age and over, by selected characteristics: United States, average annual 2005–2007
Lifetime cigarette smoking status1
Never Former Current Selected characteristic Total smoker smoker smoker
Both sexes Percent distribution (standard error)
Ages 18 years and over (crude)2 . . . . . . . . . . . . . . . . . . 100.0 58.1 (0.27) 21.4 (0.21) 20.5 (0.21) Ages 18 years and over (age-adjusted)2,3 . . . . . . . . . . . . 100.0 58.5 (0.26) 21.1 (0.19) 20.4 (0.21)
Age: 18–24 years . . . . . . . . . . . . . . . . . . . . . . . . . . . . . 100.0 69.8 (0.74) 6.7 (0.34) 23.5 (0.67) 25–44 years . . . . . . . . . . . . . . . . . . . . . . . . . . . . . 100.0 62.5 (0.37) 14.0 (0.26) 23.4 (0.32) 45–64 years . . . . . . . . . . . . . . . . . . . . . . . . . . . . . 100.0 51.7 (0.43) 26.7 (0.36) 21.6 (0.34) 65–74 years . . . . . . . . . . . . . . . . . . . . . . . . . . . . . 100.0 48.4 (0.69) 39.2 (0.67) 12.4 (0.44) 75 years and over . . . . . . . . . . . . . . . . . . . . . . . . . . 100.0 56.2 (0.75) 38.6 (0.74) 5.1 (0.31)
Race: White, single race . . . . . . . . . . . . . . . . . . . . . . . . . . 100.0 56.2 (0.29) 23.1 (0.23) 20.7 (0.24) Black or African American, single race . . . . . . . . . . . . . 100.0 65.6 (0.57) 13.2 (0.39) 21.2 (0.50) American Indian or Alaska Native, single race . . . . . . . . 100.0 52.1 (4.17) 19.8 (2.64) 28.1 (3.07) Asian, single race . . . . . . . . . . . . . . . . . . . . . . . . . . 100.0 77.7 (0.83) 10.8 (0.62) 11.5 (0.66) Native Hawaiian or Other Pacific Islander, single race. . . . 100.0 72.6 (5.61) *13.0 (4.12) 14.5 (3.87) Two or more races . . . . . . . . . . . . . . . . . . . . . . . . . 100.0 52.2 (2.19) 21.8 (1.47) 26.0 (1.90)
Black or African American, white . . . . . . . . . . . . . . . 100.0 65.4 (4.42) 14.7 (2.98) 19.9 (3.43) American Indian or Alaska Native, white . . . . . . . . . . . 100.0 43.0 (2.96) 26.5 (2.16) 30.5 (2.97)
Hispanic or Latino origin and race: Hispanic or Latino . . . . . . . . . . . . . . . . . . . . . . . . . . 100.0 71.7 (0.54) 13.4 (0.40) 14.9 (0.44)
Mexican or Mexican American . . . . . . . . . . . . . . . . . 100.0 73.2 (0.64) 12.2 (0.43) 14.6 (0.52) Not Hispanic or Latino . . . . . . . . . . . . . . . . . . . . . . . 100.0 56.1 (0.29) 22.6 (0.23) 21.3 (0.23)
White, single race . . . . . . . . . . . . . . . . . . . . . . . . 100.0 53.4 (0.33) 24.8 (0.26) 21.8 (0.27) Black or African American, single race . . . . . . . . . . . . 100.0 65.3 (0.58) 13.3 (0.40) 21.4 (0.51)
Education: Less than high school graduate . . . . . . . . . . . . . . . . . 100.0 53.6 (0.60) 20.1 (0.47) 26.4 (0.52) GED diploma4 . . . . . . . . . . . . . . . . . . . . . . . . . . . . 100.0 32.5 (1.27) 22.5 (1.04) 45.0 (1.39) High school graduate . . . . . . . . . . . . . . . . . . . . . . . . 100.0 53.7 (0.47) 22.1 (0.38) 24.3 (0.39) Some college—no degree . . . . . . . . . . . . . . . . . . . . . 100.0 56.7 (0.60) 21.2 (0.45) 22.1 (0.45) Associate of arts degree . . . . . . . . . . . . . . . . . . . . . . 100.0 57.1 (0.71) 22.3 (0.60) 20.6 (0.58) Bachelor of arts, science degree . . . . . . . . . . . . . . . . . 100.0 68.7 (0.50) 20.5 (0.45) 10.7 (0.36) Masters, doctorate, medical degree . . . . . . . . . . . . . . . 100.0 70.1 (0.66) 23.2 (0.61) 6.7 (0.35)
Poverty status:5
Below poverty level . . . . . . . . . . . . . . . . . . . . . . . . . 100.0 57.5 (0.79) 14.0 (0.44) 28.5 (0.67) ≥1 and <2 times poverty level . . . . . . . . . . . . . . . . . . 100.0 56.2 (0.58) 19.8 (0.43) 24.0 (0.48) ≥2 and <4 times poverty level . . . . . . . . . . . . . . . . . . 100.0 56.5 (0.43) 22.0 (0.35) 21.5 (0.37) 4 times poverty level or more . . . . . . . . . . . . . . . . . . . 100.0 60.6 (0.37) 24.0 (0.33) 15.4 (0.28)
Marital status: Never married . . . . . . . . . . . . . . . . . . . . . . . . . . . . 100.0 66.5 (0.57) 9.5 (0.29) 24.1 (0.51) Married . . . . . . . . . . . . . . . . . . . . . . . . . . . . . . . . 100.0 59.0 (0.32) 24.7 (0.28) 16.3 (0.23) Cohabiting . . . . . . . . . . . . . . . . . . . . . . . . . . . . . . 100.0 43.6 (0.96) 18.2 (0.74) 38.2 (0.96) Divorced or separated . . . . . . . . . . . . . . . . . . . . . . . 100.0 46.7 (0.55) 22.8 (0.46) 30.5 (0.51) Widowed . . . . . . . . . . . . . . . . . . . . . . . . . . . . . . . 100.0 56.6 (0.75) 30.6 (0.71) 12.8 (0.47)
Geographic region: Northeast . . . . . . . . . . . . . . . . . . . . . . . . . . . . . . . 100.0 57.0 (0.63) 24.1 (0.50) 18.9 (0.47) Midwest . . . . . . . . . . . . . . . . . . . . . . . . . . . . . . . . 100.0 54.5 (0.55) 22.1 (0.39) 23.4 (0.45) South . . . . . . . . . . . . . . . . . . . . . . . . . . . . . . . . . 100.0 58.8 (0.44) 19.8 (0.36) 21.4 (0.34) West . . . . . . . . . . . . . . . . . . . . . . . . . . . . . . . . . . 100.0 62.0 (0.57) 21.0 (0.40) 16.9 (0.43)
Men
Ages 18 years and over (crude)2 . . . . . . . . . . . . . . . . . . 100.0 51.8 (0.38) 24.8 (0.32) 23.4 (0.32) Ages 18 years and over (age-adjusted)2,3 . . . . . . . . . . . . 100.0 51.8 (0.37) 25.2 (0.29) 23.0 (0.31)
Age: 18–24 years . . . . . . . . . . . . . . . . . . . . . . . . . . . . . 100.0 66.6 (1.11) 6.1 (0.46) 27.3 (1.02) 25–44 years . . . . . . . . . . . . . . . . . . . . . . . . . . . . . 100.0 58.8 (0.54) 14.9 (0.39) 26.3 (0.48) 45–64 years . . . . . . . . . . . . . . . . . . . . . . . . . . . . . 100.0 44.5 (0.58) 31.4 (0.55) 24.1 (0.50) 65–74 years . . . . . . . . . . . . . . . . . . . . . . . . . . . . . 100.0 36.3 (0.96) 49.9 (1.02) 13.8 (0.69) 75 years and over . . . . . . . . . . . . . . . . . . . . . . . . . . 100.0 36.3 (1.18) 58.0 (1.19) 5.6 (0.53)
See footnotes at end of table.

Page 92 [ Series 10, No. 245
Table VII. Crude percent distributions (with standard errors) of lifetime cigarette smoking status for adults 18 years of age and over, by selected characteristics: United States, average annual 2005–2007—Con.
Lifetime cigarette smoking status1
Never Former Current Selected characteristic Total smoker smoker smoker
Men—Con. Percent distribution (standard error)
Race: White, single race . . . . . . . . . . . . . . . . . . . . . . . . . . 100.0 50.4 (0.42) 26.5 (0.37) 23.2 (0.35) Black or African American, single race . . . . . . . . . . . . . 100.0 57.7 (0.91) 16.3 (0.63) 26.0 (0.85) American Indian or Alaska Native, single race . . . . . . . . 100.0 47.8 (5.30) 21.6 (3.17) 30.6 (4.67) Asian, single race . . . . . . . . . . . . . . . . . . . . . . . . . . 100.0 65.2 (1.40) 16.5 (1.09) 18.3 (1.16) Native Hawaiian or Other Pacific Islander, single race. . . . 100.0 65.8 (8.42) *11.4 (5.23) *22.9 (7.26) Two or more races . . . . . . . . . . . . . . . . . . . . . . . . . 100.0 49.6 (3.02) 24.6 (2.30) 25.8 (2.73)
Black or African American, white . . . . . . . . . . . . . . . 100.0 60.4 (7.63) 19.7 (5.51) *19.9 (6.00) American Indian or Alaska Native, white . . . . . . . . . . . 100.0 40.4 (4.23) 29.7 (3.30) 29.9 (4.12)
Hispanic or Latino origin and race: Hispanic or Latino . . . . . . . . . . . . . . . . . . . . . . . . . . 100.0 62.8 (0.84) 17.5 (0.67) 19.7 (0.70)
Mexican or Mexican American . . . . . . . . . . . . . . . . . 100.0 63.8 (1.00) 16.2 (0.68) 20.1 (0.84) Not Hispanic or Latino . . . . . . . . . . . . . . . . . . . . . . . 100.0 50.0 (0.41) 26.0 (0.36) 24.0 (0.34)
White, single race . . . . . . . . . . . . . . . . . . . . . . . . 100.0 48.1 (0.46) 28.1 (0.42) 23.8 (0.40) Black or African American, single race . . . . . . . . . . . . 100.0 57.2 (0.94) 16.4 (0.65) 26.4 (0.88)
Education: Less than high school graduate . . . . . . . . . . . . . . . . . 100.0 43.8 (0.89) 25.6 (0.72) 30.6 (0.79) GED diploma4 . . . . . . . . . . . . . . . . . . . . . . . . . . . . 100.0 25.3 (1.70) 24.7 (1.66) 50.0 (2.00) High school graduate . . . . . . . . . . . . . . . . . . . . . . . . 100.0 46.0 (0.66) 25.9 (0.58) 28.1 (0.61) Some college—no degree . . . . . . . . . . . . . . . . . . . . . 100.0 52.1 (0.88) 23.3 (0.70) 24.6 (0.71) Associate of arts degree . . . . . . . . . . . . . . . . . . . . . . 100.0 51.5 (1.10) 24.3 (0.91) 24.2 (0.95) Bachelor of arts, science degree . . . . . . . . . . . . . . . . . 100.0 63.4 (0.78) 24.4 (0.71) 12.3 (0.60) Masters, doctorate, medical degree . . . . . . . . . . . . . . . 100.0 67.5 (0.96) 25.6 (0.91) 6.9 (0.52)
Poverty status:5
Below poverty level . . . . . . . . . . . . . . . . . . . . . . . . . 100.0 50.6 (1.25) 16.8 (0.79) 32.6 (1.05) ≥1 and <2 times poverty level . . . . . . . . . . . . . . . . . . 100.0 47.4 (0.91) 24.2 (0.70) 28.5 (0.80) ≥2 and <4 times poverty level . . . . . . . . . . . . . . . . . . 100.0 49.4 (0.62) 25.7 (0.54) 25.0 (0.57) 4 times poverty level or more . . . . . . . . . . . . . . . . . . . 100.0 55.8 (0.55) 26.5 (0.50) 17.7 (0.43)
Marital status: Never married . . . . . . . . . . . . . . . . . . . . . . . . . . . . 100.0 62.5 (0.81) 9.9 (0.41) 27.7 (0.74) Married . . . . . . . . . . . . . . . . . . . . . . . . . . . . . . . . 100.0 51.7 (0.46) 30.1 (0.43) 18.1 (0.34) Cohabiting . . . . . . . . . . . . . . . . . . . . . . . . . . . . . . 100.0 40.8 (1.26) 19.1 (1.04) 40.1 (1.28) Divorced or separated . . . . . . . . . . . . . . . . . . . . . . . 100.0 38.6 (0.85) 25.3 (0.73) 36.1 (0.79) Widowed . . . . . . . . . . . . . . . . . . . . . . . . . . . . . . . 100.0 33.2 (1.44) 50.0 (1.56) 16.8 (1.19)
Geographic region: Northeast . . . . . . . . . . . . . . . . . . . . . . . . . . . . . . . 100.0 52.3 (0.97) 26.9 (0.78) 20.9 (0.75) Midwest . . . . . . . . . . . . . . . . . . . . . . . . . . . . . . . . 100.0 48.6 (0.78) 25.3 (0.70) 26.1 (0.69) South . . . . . . . . . . . . . . . . . . . . . . . . . . . . . . . . . 100.0 51.7 (0.61) 23.7 (0.56) 24.6 (0.51) West . . . . . . . . . . . . . . . . . . . . . . . . . . . . . . . . . . 100.0 55.1 (0.79) 24.5 (0.58) 20.4 (0.64)
Women
Ages 18 years and over (crude)2 . . . . . . . . . . . . . . . . . . 100.0 64.0 (0.33) 18.2 (0.25) 17.8 (0.24) Ages 18 years and over (age-adjusted)2,3 . . . . . . . . . . . . 100.0 64.4 (0.33) 17.6 (0.23) 18.0 (0.24)
Age: 18–24 years . . . . . . . . . . . . . . . . . . . . . . . . . . . . . 100.0 73.1 (0.89) 7.2 (0.50) 19.7 (0.80) 25–44 years . . . . . . . . . . . . . . . . . . . . . . . . . . . . . 100.0 66.2 (0.48) 13.1 (0.34) 20.7 (0.41) 45–64 years . . . . . . . . . . . . . . . . . . . . . . . . . . . . . 100.0 58.4 (0.56) 22.4 (0.46) 19.2 (0.40) 65–74 years . . . . . . . . . . . . . . . . . . . . . . . . . . . . . 100.0 58.6 (0.92) 30.1 (0.87) 11.3 (0.57) 75 years and over . . . . . . . . . . . . . . . . . . . . . . . . . . 100.0 69.0 (0.85) 26.2 (0.83) 4.8 (0.37)
Race: White, single race . . . . . . . . . . . . . . . . . . . . . . . . . . 100.0 61.6 (0.37) 20.0 (0.28) 18.4 (0.27) Black or African American, single race . . . . . . . . . . . . . 100.0 71.9 (0.68) 10.8 (0.45) 17.3 (0.56) American Indian or Alaska Native, single race . . . . . . . . 100.0 56.3 (4.14) 18.0 (3.33) 25.7 (3.06) Asian, single race . . . . . . . . . . . . . . . . . . . . . . . . . . 100.0 89.5 (0.78) 5.5 (0.56) 5.0 (0.56) Native Hawaiian or Other Pacific Islander, single race. . . . 100.0 80.2 (6.77) *14.8 (6.27) † Two or more races . . . . . . . . . . . . . . . . . . . . . . . . . 100.0 54.8 (2.98) 19.0 (1.89) 26.2 (2.39)
Black or African American, white . . . . . . . . . . . . . . . 100.0 68.8 (5.42) *11.4 (3.45) 19.8 (4.13) American Indian or Alaska Native, white . . . . . . . . . . . 100.0 46.1 (4.09) 22.7 (3.13) 31.1 (3.64)
See footnotes at end of table.

Series 10, No. 245 [ Page 93
Table VII. Crude percent distributions (with standard errors) of lifetime cigarette smoking status for adults 18 years of age and over, by selected characteristics: United States, average annual 2005–2007—Con.
Lifetime cigarette smoking status1
Never Former Current Selected characteristic Total smoker smoker smoker
Women—Con. Percent distribution (standard error)
Hispanic or Latino origin and race: Hispanic or Latino . . . . . . . . . . . . . . . . . . . . . . . . . . 100.0 81.1 (0.55) 9.1 (0.38) 9.8 (0.42)
Mexican or Mexican American . . . . . . . . . . . . . . . . . 100.0 83.6 (0.67) 7.8 (0.46) 8.5 (0.52) Not Hispanic or Latino . . . . . . . . . . . . . . . . . . . . . . . 100.0 61.6 (0.37) 19.4 (0.27) 18.9 (0.27)
White, single race . . . . . . . . . . . . . . . . . . . . . . . . 100.0 58.4 (0.41) 21.7 (0.32) 19.8 (0.31) Black or African American, single race . . . . . . . . . . . . 100.0 71.8 (0.68) 10.8 (0.46) 17.4 (0.57)
Education: Less than high school graduate . . . . . . . . . . . . . . . . . 100.0 63.0 (0.71) 14.7 (0.53) 22.3 (0.63) GED diploma4 . . . . . . . . . . . . . . . . . . . . . . . . . . . . 100.0 40.1 (1.83) 20.1 (1.31) 39.7 (1.86) High school graduate . . . . . . . . . . . . . . . . . . . . . . . . 100.0 60.8 (0.63) 18.5 (0.46) 20.7 (0.49) Some college—no degree . . . . . . . . . . . . . . . . . . . . . 100.0 60.7 (0.71) 19.4 (0.57) 19.9 (0.55) Associate of arts degree . . . . . . . . . . . . . . . . . . . . . . 100.0 61.4 (0.91) 20.7 (0.79) 17.9 (0.68) Bachelor of arts, science degree . . . . . . . . . . . . . . . . . 100.0 73.9 (0.65) 16.8 (0.55) 9.3 (0.41) Masters, doctorate, medical degree . . . . . . . . . . . . . . . 100.0 72.9 (0.92) 20.7 (0.85) 6.4 (0.44)
Poverty status:5
Below poverty level . . . . . . . . . . . . . . . . . . . . . . . . . 100.0 62.5 (0.84) 12.0 (0.47) 25.6 (0.75) ≥1 and <2 times poverty level . . . . . . . . . . . . . . . . . . 100.0 63.4 (0.63) 16.2 (0.48) 20.3 (0.53) ≥2 and <4 times poverty level . . . . . . . . . . . . . . . . . . 100.0 63.1 (0.57) 18.5 (0.44) 18.3 (0.44) 4 times poverty level or more . . . . . . . . . . . . . . . . . . . 100.0 65.7 (0.50) 21.2 (0.44) 13.0 (0.35)
Marital status: Never married . . . . . . . . . . . . . . . . . . . . . . . . . . . . 100.0 71.2 (0.70) 9.0 (0.41) 19.7 (0.61) Married . . . . . . . . . . . . . . . . . . . . . . . . . . . . . . . . 100.0 66.3 (0.41) 19.2 (0.34) 14.5 (0.29) Cohabiting . . . . . . . . . . . . . . . . . . . . . . . . . . . . . . 100.0 46.8 (1.37) 17.2 (1.01) 36.0 (1.30) Divorced or separated . . . . . . . . . . . . . . . . . . . . . . . 100.0 52.2 (0.71) 21.2 (0.59) 26.6 (0.65) Widowed . . . . . . . . . . . . . . . . . . . . . . . . . . . . . . . 100.0 62.4 (0.81) 25.9 (0.76) 11.8 (0.51)
Geographic region: Northeast . . . . . . . . . . . . . . . . . . . . . . . . . . . . . . . 100.0 61.1 (0.71) 21.7 (0.59) 17.2 (0.53) Midwest . . . . . . . . . . . . . . . . . . . . . . . . . . . . . . . . 100.0 60.0 (0.76) 19.1 (0.54) 20.9 (0.56) South . . . . . . . . . . . . . . . . . . . . . . . . . . . . . . . . . 100.0 65.3 (0.51) 16.2 (0.38) 18.5 (0.39) West . . . . . . . . . . . . . . . . . . . . . . . . . . . . . . . . . . 100.0 68.9 (0.68) 17.6 (0.51) 13.5 (0.44)
* Estimates preceded by an asterisk have a relative standard error of greater than 30% and less than or equal to 50%. These should be interpreted with caution as they do not meet the standard of reliability or precision.
† Estimates with a relative standard error greater than 50% are indicated with a dagger, but are not shown. 1Lifetime cigarette smoking status: Never smoker—never smoked at all or smoked less than 100 cigarettes in lifetime; former smoker—smoked at least 100 cigarettes in lifetime but not currently smoking; current smoker—smoked at least 100 cigarettes in lifetime and currently smoked. 2Persons of other races and unknown race and ethnicity, unknown education, unknown poverty status, and unknown marital status are included in the total. 3Estimates are age adjusted using the projected 2000 U.S. population as the standard population and using three age groups: 18–44 years, 45–64 years, and 65 years and over. 4GED is General Educational Development high school equivalency diploma. 5Poverty status is based on family income and family size using the U.S. Census Bureau poverty thresholds for 2004, 2005, and 2006.
NOTES: For age-adjusted percent distributions, refer to Table 4.1. Denominator for each percent distribution excludes persons with unknown smoking status. See Appendix II for definitions of terms. See Apprendix III for health behavior questions.
DATA SOURCE: National Health Interview Survey, 2005–2007. Estimates are based on household interviews of a sample of the civilian noninstitutionalized population.

Page 94 [ Series 10, No. 245
Table VIII. Crude percent distributions (with standard errors) of current cigarette smoking status for adults 18 years of age and over, and crude mean number (with standard errors) of cigarettes on days smoked among current smokers 18 years of age and over, by selected characteristics: United States, average annual, 2005–2007
Current cigarette smoking status1 Number of cigarettes on days smoked2
Non- Nondaily Daily All current Nondaily Daily Selected characteristic Total smoker smoker smoker smokers smokers smokers
Both sexes Percent distribution (standard error) Mean (standard error)
Ages 18 years and over (crude)3 . . . . . . . . . . . . . . . . . . 100.0 79.5 (0.21) 4.2 (0.09) 16.3 (0.20) 14.2 (0.12) 4.4 (0.09) 16.6 (0.12) Ages 18 years and over (age-adjusted)3,4 . . . . . . . . . . . . 100.0 79.6 (0.21) 4.2 (0.09) 16.2 (0.20) 14.3 (0.13) 4.5 (0.11) 16.6 (0.14)
Age: 18–24 years . . . . . . . . . . . . . . . . . . . . . . . . . . . . . 100.0 76.5 (0.67) 6.9 (0.37) 16.6 (0.60) 10.4 (0.32) 3.6 (0.19) 13.2 (0.36) 25–44 years . . . . . . . . . . . . . . . . . . . . . . . . . . . . . 100.0 76.6 (0.32) 5.1 (0.15) 18.4 (0.30) 13.6 (0.15) 4.4 (0.13) 16.0 (0.16) 45–64 years . . . . . . . . . . . . . . . . . . . . . . . . . . . . . 100.0 78.4 (0.34) 3.5 (0.13) 18.1 (0.32) 16.2 (0.18) 5.1 (0.19) 18.2 (0.18) 65–74 years . . . . . . . . . . . . . . . . . . . . . . . . . . . . . 100.0 87.6 (0.44) 2.1 (0.19) 10.4 (0.41) 16.4 (0.52) 4.7 (0.47) 18.7 (0.55) 75 years and over . . . . . . . . . . . . . . . . . . . . . . . . . . 100.0 94.9 (0.31) 0.9 (0.13) 4.2 (0.28) 13.6 (0.63) 4.6 (0.92) 15.3 (0.68)
Race: White, single race . . . . . . . . . . . . . . . . . . . . . . . . . . 100.0 79.3 (0.24) 4.0 (0.10) 16.7 (0.23) 15.0 (0.13) 4.5 (0.11) 17.4 (0.14) Black or African American, single race . . . . . . . . . . . . . 100.0 78.8 (0.50) 5.3 (0.27) 15.9 (0.44) 10.4 (0.21) 4.5 (0.23) 12.3 (0.23) American Indian or Alaska Native, single race . . . . . . . . 100.0 71.9 (3.07) 8.6 (1.59) 19.6 (2.57) 11.0 (1.00) 3.0 (0.41) 14.2 (1.13) Asian, single race . . . . . . . . . . . . . . . . . . . . . . . . . . 100.0 88.5 (0.66) 3.0 (0.32) 8.4 (0.57) 10.0 (0.42) 3.7 (0.36) 12.2 (0.51) Native Hawaiian or Other Pacific Islander, single race. . . . 100.0 85.5 (3.87) † 11.0 (3.22) 9.3 (1.66) 2.6 (0.41) 11.5 (1.61) Two or more races . . . . . . . . . . . . . . . . . . . . . . . . . 100.0 74.0 (1.90) 4.6 (0.81) 21.4 (1.75) 12.2 (0.63) 4.4 (0.51) 13.9 (0.67)
Black or African American, white . . . . . . . . . . . . . . . 100.0 80.1 (3.43) *4.4 (1.80) 15.5 (3.13) 9.4 (1.14) 5.5 (1.37) 10.5 (1.35) American Indian or Alaska Native, white . . . . . . . . . . . 100.0 69.5 (2.97) 5.1 (1.30) 25.4 (2.78) 14.3 (0.89) 4.0 (0.59) 16.4 (0.88)
Hispanic or Latino origin and race: Hispanic or Latino . . . . . . . . . . . . . . . . . . . . . . . . . . 100.0 85.1 (0.44) 5.9 (0.27) 9.0 (0.33) 7.8 (0.20) 3.5 (0.16) 10.6 (0.25)
Mexican or Mexican American . . . . . . . . . . . . . . . . . 100.0 85.4 (0.52) 6.5 (0.34) 8.1 (0.40) 7.1 (0.25) 3.4 (0.18) 9.9 (0.34) Not Hispanic or Latino . . . . . . . . . . . . . . . . . . . . . . . 100.0 78.7 (0.23) 3.9 (0.10) 17.4 (0.22) 14.9 (0.13) 4.6 (0.11) 17.1 (0.13)
White, single race . . . . . . . . . . . . . . . . . . . . . . . . 100.0 78.2 (0.27) 3.7 (0.10) 18.0 (0.26) 15.8 (0.14) 4.8 (0.13) 18.0 (0.15) Black or African American, single race . . . . . . . . . . . . 100.0 78.6 (0.51) 5.3 (0.28) 16.1 (0.45) 10.4 (0.21) 4.5 (0.23) 12.3 (0.23)
Education: Less than high school graduate . . . . . . . . . . . . . . . . . 100.0 73.6 (0.52) 4.5 (0.23) 21.8 (0.51) 15.2 (0.32) 4.5 (0.24) 17.3 (0.33) GED diploma5 . . . . . . . . . . . . . . . . . . . . . . . . . . . . 100.0 55.0 (1.39) 4.2 (0.48) 40.8 (1.40) 18.1 (0.47) 5.2 (0.61) 19.4 (0.48) High school graduate . . . . . . . . . . . . . . . . . . . . . . . . 100.0 75.7 (0.39) 4.2 (0.17) 20.1 (0.37) 14.8 (0.18) 4.7 (0.20) 16.8 (0.19) Some college—no degree . . . . . . . . . . . . . . . . . . . . . 100.0 77.9 (0.45) 5.1 (0.24) 17.0 (0.40) 13.2 (0.21) 4.4 (0.19) 15.8 (0.23) Associate of arts degree . . . . . . . . . . . . . . . . . . . . . . 100.0 79.4 (0.58) 4.3 (0.28) 16.3 (0.53) 13.5 (0.28) 4.6 (0.25) 15.7 (0.30) Bachelor of arts, science degree . . . . . . . . . . . . . . . . . 100.0 89.3 (0.36) 3.8 (0.21) 6.9 (0.31) 11.0 (0.28) 3.9 (0.17) 14.8 (0.32) Masters, doctorate, medical degree . . . . . . . . . . . . . . . 100.0 93.3 (0.35) 2.3 (0.20) 4.4 (0.28) 11.6 (0.55) 3.8 (0.28) 15.6 (0.65)
Poverty status:6
Below poverty level . . . . . . . . . . . . . . . . . . . . . . . . . 100.0 71.5 (0.67) 5.5 (0.25) 22.9 (0.64) 13.8 (0.31) 4.1 (0.21) 16.0 (0.33) ≥1 and <2 times poverty level . . . . . . . . . . . . . . . . . . 100.0 76.0 (0.48) 4.4 (0.21) 19.6 (0.46) 14.8 (0.26) 4.3 (0.20) 17.0 (0.28) ≥2 and <4 times poverty level . . . . . . . . . . . . . . . . . . 100.0 78.5 (0.37) 4.2 (0.18) 17.4 (0.36) 14.5 (0.19) 4.7 (0.20) 16.7 (0.20) 4 times poverty level or more . . . . . . . . . . . . . . . . . . . 100.0 84.6 (0.28) 3.7 (0.16) 11.8 (0.26) 13.8 (0.22) 4.4 (0.16) 16.5 (0.22)
Marital status: Never married . . . . . . . . . . . . . . . . . . . . . . . . . . . . 100.0 75.9 (0.51) 6.6 (0.27) 17.4 (0.46) 11.8 (0.24) 4.3 (0.17) 14.6 (0.27) Married . . . . . . . . . . . . . . . . . . . . . . . . . . . . . . . . 100.0 83.7 (0.23) 3.1 (0.10) 13.2 (0.22) 14.8 (0.17) 4.4 (0.14) 17.1 (0.17) Cohabiting . . . . . . . . . . . . . . . . . . . . . . . . . . . . . . 100.0 61.8 (0.96) 6.8 (0.45) 31.3 (0.93) 14.1 (0.29) 3.9 (0.25) 16.2 (0.31) Divorced or separated . . . . . . . . . . . . . . . . . . . . . . . 100.0 69.5 (0.51) 5.2 (0.24) 25.3 (0.51) 15.8 (0.23) 5.1 (0.22) 18.0 (0.24) Widowed . . . . . . . . . . . . . . . . . . . . . . . . . . . . . . . 100.0 87.2 (0.47) 1.9 (0.19) 10.8 (0.43) 15.2 (0.37) 5.4 (0.62) 16.6 (0.38)
Geographic region: Northeast . . . . . . . . . . . . . . . . . . . . . . . . . . . . . . . 100.0 81.1 (0.47) 4.1 (0.23) 14.8 (0.44) 13.9 (0.27) 4.6 (0.27) 16.3 (0.26) Midwest . . . . . . . . . . . . . . . . . . . . . . . . . . . . . . . . 100.0 76.6 (0.45) 4.7 (0.19) 18.7 (0.45) 14.7 (0.19) 4.9 (0.21) 17.0 (0.21) South . . . . . . . . . . . . . . . . . . . . . . . . . . . . . . . . . 100.0 78.6 (0.34) 3.8 (0.13) 17.6 (0.33) 15.0 (0.22) 4.3 (0.13) 17.2 (0.22) West . . . . . . . . . . . . . . . . . . . . . . . . . . . . . . . . . . 100.0 83.1 (0.43) 4.4 (0.20) 12.6 (0.37) 12.0 (0.26) 3.9 (0.17) 14.7 (0.27)
Men
Ages 18 years and over (crude)3 . . . . . . . . . . . . . . . . . . 100.0 76.6 (0.32) 5.0 (0.15) 18.4 (0.29) 15.1 (0.18) 4.5 (0.13) 17.9 (0.18) Ages 18 years and over (age-adjusted)3,4 . . . . . . . . . . . . 100.0 77.0 (0.31) 5.0 (0.15) 18.1 (0.29) 15.3 (0.19) 4.6 (0.16) 18.0 (0.20)
Age: 18–24 years . . . . . . . . . . . . . . . . . . . . . . . . . . . . . 100.0 72.7 (1.02) 8.4 (0.62) 18.9 (0.90) 10.9 (0.49) 3.8 (0.28) 14.1 (0.58) 25–44 years . . . . . . . . . . . . . . . . . . . . . . . . . . . . . 100.0 73.7 (0.48) 6.1 (0.24) 20.2 (0.45) 14.2 (0.21) 4.4 (0.18) 17.1 (0.23) 45–64 years . . . . . . . . . . . . . . . . . . . . . . . . . . . . . 100.0 75.9 (0.50) 3.7 (0.20) 20.4 (0.47) 17.8 (0.27) 5.2 (0.29) 19.8 (0.28) 65–74 years . . . . . . . . . . . . . . . . . . . . . . . . . . . . . 100.0 86.2 (0.69) 2.3 (0.31) 11.5 (0.65) 18.4 (0.82) 4.5 (0.72) 21.1 (0.83) 75 years and over . . . . . . . . . . . . . . . . . . . . . . . . . . 100.0 94.4 (0.53) 1.1 (0.25) 4.5 (0.47) 13.8 (1.09) *5.3 (1.65) 15.7 (1.17)
See footnotes at end of table.

Series 10, No. 245 [ Page 95
Table VIII. Crude percent distributions (with standard errors) of current cigarette smoking status for adults 18 years of age and over, and crude mean number (with standard errors) of cigarettes on days smoked among current smokers 18 years of age and over, by selected characteristics: United States, average annual, 2005–2007—Con.
Current cigarette smoking status1 Number of cigarettes on days smoked2
Non- Nondaily Daily All current Nondaily Daily Selected characteristic Total smoker smoker smoker smokers smokers smokers
Men Percent distribution (standard error) Mean (standard error)
Race: White, single race . . . . . . . . . . . . . . . . . . . . . . . . . . 100.0 76.8 (0.35) 4.7 (0.16) 18.5 (0.33) 16.0 (0.20) 4.6 (0.15) 18.8 (0.20) Black or African American, single race . . . . . . . . . . . . . 100.0 74.0 (0.85) 7.1 (0.53) 18.9 (0.75) 10.9 (0.35) 4.4 (0.32) 13.3 (0.36) American Indian or Alaska Native, single race . . . . . . . . 100.0 69.4 (4.67) 5.3 (1.55) 25.3 (4.28) 13.5 (1.46) 2.9 (0.77) 15.6 (1.63) Asian, single race . . . . . . . . . . . . . . . . . . . . . . . . . . 100.0 81.7 (1.16) 4.9 (0.57) 13.3 (1.05) 10.0 (0.51) 3.9 (0.43) 12.2 (0.61) Native Hawaiian or Other Pacific Islander, single race. . . . 100.0 77.1 (7.26) † *16.3 (6.14) 9.4 (1.87) 2.6 (0.41) 12.1 (1.85) Two or more races . . . . . . . . . . . . . . . . . . . . . . . . . 100.0 74.2 (2.73) 5.2 (1.27) 20.6 (2.51) 13.4 (0.99) 4.4 (0.54) 15.7 (1.12)
Black or African American, white . . . . . . . . . . . . . . . 100.0 80.1 (6.00) † *14.6 (5.12) 10.1 (2.05) 3.9 (0.87) 12.3 (2.42) American Indian or Alaska Native, white . . . . . . . . . . . 100.0 70.1 (4.12) *5.0 (1.78) 24.9 (3.82) 16.0 (1.27) 4.5 (0.85) 18.4 (1.30)
Hispanic or Latino origin and race: Hispanic or Latino . . . . . . . . . . . . . . . . . . . . . . . . . . 100.0 80.3 (0.70) 8.2 (0.44) 11.5 (0.54) 8.1 (0.25) 3.6 (0.21) 11.1 (0.33)
Mexican or Mexican American . . . . . . . . . . . . . . . . . 100.0 79.9 (0.84) 9.3 (0.56) 10.8 (0.66) 7.4 (0.31) 3.6 (0.23) 10.4 (0.44) Not Hispanic or Latino . . . . . . . . . . . . . . . . . . . . . . . 100.0 76.0 (0.34) 4.5 (0.16) 19.5 (0.33) 16.1 (0.19) 4.7 (0.16) 18.5 (0.19)
White, single race . . . . . . . . . . . . . . . . . . . . . . . . 100.0 76.2 (0.40) 4.0 (0.17) 19.8 (0.38) 17.3 (0.21) 5.0 (0.20) 19.6 (0.22) Black or African American, single race . . . . . . . . . . . . 100.0 73.6 (0.88) 7.1 (0.54) 19.2 (0.77) 10.9 (0.35) 4.3 (0.30) 13.4 (0.37)
Education: Less than high school graduate . . . . . . . . . . . . . . . . . 100.0 69.4 (0.79) 6.1 (0.39) 24.5 (0.78) 16.0 (0.47) 4.5 (0.31) 18.7 (0.49) GED diploma5 . . . . . . . . . . . . . . . . . . . . . . . . . . . . 100.0 50.0 (2.00) 4.4 (0.75) 45.7 (2.02) 19.2 (0.71) 6.1 (0.98) 20.4 (0.74) High school graduate . . . . . . . . . . . . . . . . . . . . . . . . 100.0 71.9 (0.61) 5.2 (0.29) 23.0 (0.57) 15.6 (0.27) 4.9 (0.29) 17.9 (0.28) Some college—no degree . . . . . . . . . . . . . . . . . . . . . 100.0 75.4 (0.71) 6.0 (0.40) 18.6 (0.61) 14.1 (0.32) 4.6 (0.28) 17.1 (0.34) Associate of arts degree . . . . . . . . . . . . . . . . . . . . . . 100.0 75.8 (0.95) 4.7 (0.44) 19.5 (0.88) 15.3 (0.43) 4.7 (0.35) 17.7 (0.44) Bachelor of arts, science degree . . . . . . . . . . . . . . . . . 100.0 87.7 (0.60) 4.2 (0.32) 8.0 (0.54) 11.8 (0.41) 3.6 (0.20) 15.9 (0.51) Masters, doctorate, medical degree . . . . . . . . . . . . . . . 100.0 93.1 (0.52) 2.3 (0.28) 4.6 (0.44) 12.0 (0.78) 3.4 (0.37) 16.0 (0.89)
Poverty status:6
Below poverty level . . . . . . . . . . . . . . . . . . . . . . . . . 100.0 67.4 (1.05) 7.2 (0.48) 25.4 (1.00) 14.8 (0.56) 4.1 (0.32) 17.6 (0.61) ≥1 and <2 times poverty level . . . . . . . . . . . . . . . . . . 100.0 71.5 (0.80) 5.6 (0.34) 22.8 (0.79) 15.4 (0.40) 4.4 (0.28) 18.1 (0.44) ≥2 and <4 times poverty level . . . . . . . . . . . . . . . . . . 100.0 75.0 (0.57) 5.0 (0.28) 20.0 (0.55) 15.2 (0.26) 4.9 (0.29) 17.7 (0.30) 4 times poverty level or more . . . . . . . . . . . . . . . . . . . 100.0 82.3 (0.43) 4.1 (0.25) 13.5 (0.39) 15.0 (0.30) 4.3 (0.21) 18.1 (0.31)
Marital status: Never married . . . . . . . . . . . . . . . . . . . . . . . . . . . . 100.0 72.3 (0.74) 7.7 (0.43) 19.9 (0.67) 12.6 (0.35) 4.4 (0.23) 15.7 (0.39) Married . . . . . . . . . . . . . . . . . . . . . . . . . . . . . . . . 100.0 81.9 (0.34) 3.6 (0.16) 14.6 (0.31) 15.7 (0.24) 4.3 (0.20) 18.3 (0.24) Cohabiting . . . . . . . . . . . . . . . . . . . . . . . . . . . . . . 100.0 59.9 (1.28) 7.6 (0.66) 32.5 (1.22) 15.0 (0.43) 4.2 (0.36) 17.4 (0.45) Divorced or separated . . . . . . . . . . . . . . . . . . . . . . . 100.0 63.9 (0.79) 6.2 (0.42) 29.9 (0.78) 18.1 (0.38) 5.4 (0.35) 20.7 (0.40) Widowed . . . . . . . . . . . . . . . . . . . . . . . . . . . . . . . 100.0 83.2 (1.19) 2.0 (0.44) 14.7 (1.13) 17.8 (0.86) 7.4 (2.12) 19.0 (0.87)
Geographic region: Northeast . . . . . . . . . . . . . . . . . . . . . . . . . . . . . . . 100.0 79.1 (0.75) 4.8 (0.41) 16.0 (0.63) 14.5 (0.37) 4.5 (0.38) 17.4 (0.37) Midwest . . . . . . . . . . . . . . . . . . . . . . . . . . . . . . . . 100.0 73.9 (0.69) 5.3 (0.31) 20.8 (0.68) 15.8 (0.28) 5.1 (0.30) 18.4 (0.32) South . . . . . . . . . . . . . . . . . . . . . . . . . . . . . . . . . 100.0 75.4 (0.51) 4.7 (0.22) 19.9 (0.49) 16.1 (0.33) 4.4 (0.19) 18.7 (0.33) West . . . . . . . . . . . . . . . . . . . . . . . . . . . . . . . . . . 100.0 79.6 (0.64) 5.3 (0.33) 15.1 (0.53) 12.7 (0.35) 3.9 (0.22) 15.7 (0.38)
Women
Ages 18 years and over (crude)3 . . . . . . . . . . . . . . . . . . 100.0 82.2 (0.24) 3.5 (0.10) 14.4 (0.23) 13.1 (0.13) 4.3 (0.12) 15.1 (0.14) Ages 18 years and over (age-adjusted)3,4 . . . . . . . . . . . . 100.0 82.0 (0.24) 3.5 (0.11) 14.4 (0.23) 13.1 (0.15) 4.4 (0.13) 15.1 (0.15)
Age: 18–24 years . . . . . . . . . . . . . . . . . . . . . . . . . . . . . 100.0 80.3 (0.80) 5.3 (0.45) 14.4 (0.73) 9.7 (0.31) 3.4 (0.21) 12.0 (0.31) 25–44 years . . . . . . . . . . . . . . . . . . . . . . . . . . . . . 100.0 79.3 (0.41) 4.1 (0.18) 16.6 (0.38) 12.8 (0.19) 4.2 (0.18) 14.8 (0.21) 45–64 years . . . . . . . . . . . . . . . . . . . . . . . . . . . . . 100.0 80.8 (0.40) 3.2 (0.18) 16.0 (0.38) 14.5 (0.21) 4.9 (0.23) 16.3 (0.22) 65–74 years . . . . . . . . . . . . . . . . . . . . . . . . . . . . . 100.0 88.7 (0.57) 1.8 (0.23) 9.5 (0.53) 14.4 (0.60) 5.0 (0.58) 16.1 (0.67) 75 years and over . . . . . . . . . . . . . . . . . . . . . . . . . . 100.0 95.2 (0.37) 0.8 (0.14) 4.0 (0.35) 13.5 (0.73) 3.8 (0.55) 15.0 (0.79)
Race: White, single race . . . . . . . . . . . . . . . . . . . . . . . . . . 100.0 81.6 (0.27) 3.4 (0.12) 15.0 (0.26) 13.7 (0.15) 4.3 (0.14) 15.7 (0.16) Black or African American, single race . . . . . . . . . . . . . 100.0 82.7 (0.56) 3.8 (0.27) 13.5 (0.50) 9.7 (0.20) 4.7 (0.32) 11.1 (0.23) American Indian or Alaska Native, single race . . . . . . . . 100.0 74.3 (3.06) 11.9 (2.58) 13.8 (2.16) 7.9 (1.02) 3.0 (0.47) 11.5 (1.38) Asian, single race . . . . . . . . . . . . . . . . . . . . . . . . . . 100.0 95.0 (0.56) 1.2 (0.26) 3.8 (0.51) 10.0 (0.82) 3.2 (0.53) 12.0 (0.86) Native Hawaiian or Other Pacific Islander, single race. . . . 100.0 95.0 (2.64) – † *9.3 (3.45) – *9.3 (3.45) Two or more races . . . . . . . . . . . . . . . . . . . . . . . . . 100.0 73.8 (2.39) 4.0 (0.97) 22.3 (2.21) 11.1 (0.68) 4.4 (0.95) 12.3 (0.70)
Black or African American, white . . . . . . . . . . . . . . . 100.0 80.2 (4.13) *3.7 (1.84) 16.1 (3.86) 8.9 (1.29) *7.0 (2.54) 9.3 (1.48) American Indian or Alaska Native, white . . . . . . . . . . . 100.0 68.9 (3.64) *5.1 (1.83) 26.0 (3.43) 12.4 (1.09) 3.4 (0.75) 14.2 (1.08)
See footnotes at end of table.

Page 96 [ Series 10, No. 245
Table VIII. Crude percent distributions (with standard errors) of current cigarette smoking status for adults 18 years of age and over, and crude mean number (with standard errors) of cigarettes on days smoked among current smokers 18 years of age and over, by selected characteristics: United States, average annual, 2005–2007—Con.
Current cigarette smoking status1 Number of cigarettes on days smoked2
Non- Nondaily Daily All current Nondaily Daily Selected characteristic Total smoker smoker smoker smokers smokers smokers
Women—Con. Percent distribution (standard error) Mean (standard error)
Hispanic or Latino origin and race: Hispanic or Latino . . . . . . . . . . . . . . . . . . . . . . . . . . 100.0 90.2 (0.42) 3.5 (0.28) 6.3 (0.32) 7.4 (0.29) 3.1 (0.22) 9.6 (0.37)
Mexican or Mexican American . . . . . . . . . . . . . . . . . 100.0 91.5 (0.52) 3.5 (0.35) 5.1 (0.38) 6.5 (0.39) 2.8 (0.25) 8.9 (0.56) Not Hispanic or Latino . . . . . . . . . . . . . . . . . . . . . . . 100.0 81.1 (0.27) 3.4 (0.11) 15.5 (0.26) 13.5 (0.14) 4.5 (0.13) 15.4 (0.14)
White, single race . . . . . . . . . . . . . . . . . . . . . . . . 100.0 80.2 (0.31) 3.4 (0.13) 16.4 (0.30) 14.2 (0.16) 4.5 (0.15) 16.1 (0.16) Black or African American, single race . . . . . . . . . . . . 100.0 82.6 (0.57) 3.8 (0.27) 13.6 (0.51) 9.7 (0.20) 4.7 (0.33) 11.1 (0.24)
Education: Less than high school graduate . . . . . . . . . . . . . . . . . 100.0 77.7 (0.63) 3.0 (0.24) 19.2 (0.61) 14.2 (0.30) 4.6 (0.39) 15.6 (0.31) GED diploma5 . . . . . . . . . . . . . . . . . . . . . . . . . . . . 100.0 60.3 (1.86) 4.0 (0.61) 35.7 (1.83) 16.8 (0.53) 4.2 (0.55) 18.1 (0.53) High school graduate . . . . . . . . . . . . . . . . . . . . . . . . 100.0 79.3 (0.49) 3.3 (0.20) 17.4 (0.47) 13.8 (0.22) 4.4 (0.24) 15.5 (0.22) Some college—no degree . . . . . . . . . . . . . . . . . . . . . 100.0 80.1 (0.55) 4.3 (0.28) 15.7 (0.51) 12.3 (0.27) 4.1 (0.22) 14.4 (0.29) Associate of arts degree . . . . . . . . . . . . . . . . . . . . . . 100.0 82.1 (0.68) 4.0 (0.37) 13.9 (0.61) 11.6 (0.35) 4.6 (0.34) 13.6 (0.39) Bachelor of arts, science degree . . . . . . . . . . . . . . . . . 100.0 90.7 (0.41) 3.4 (0.25) 5.8 (0.33) 10.0 (0.34) 4.1 (0.30) 13.3 (0.39) Masters, doctorate, medical degree . . . . . . . . . . . . . . . 100.0 93.6 (0.44) 2.4 (0.28) 4.0 (0.35) 11.2 (0.76) 4.3 (0.42) 15.0 (0.94)
Poverty status:6
Below poverty level . . . . . . . . . . . . . . . . . . . . . . . . . 100.0 74.4 (0.75) 4.4 (0.28) 21.2 (0.71) 12.8 (0.27) 4.1 (0.25) 14.5 (0.28) ≥1 and <2 times poverty level . . . . . . . . . . . . . . . . . . 100.0 79.7 (0.53) 3.4 (0.24) 16.9 (0.50) 14.0 (0.31) 4.2 (0.28) 15.8 (0.32) ≥2 and <4 times poverty level . . . . . . . . . . . . . . . . . . 100.0 81.7 (0.44) 3.4 (0.20) 14.9 (0.42) 13.5 (0.26) 4.4 (0.23) 15.4 (0.26) 4 times poverty level or more . . . . . . . . . . . . . . . . . . . 100.0 87.0 (0.35) 3.2 (0.19) 9.9 (0.32) 12.0 (0.27) 4.5 (0.22) 14.3 (0.28)
Marital status: Never married . . . . . . . . . . . . . . . . . . . . . . . . . . . . 100.0 80.3 (0.61) 5.3 (0.32) 14.4 (0.55) 10.6 (0.24) 4.1 (0.21) 12.9 (0.26) Married . . . . . . . . . . . . . . . . . . . . . . . . . . . . . . . . 100.0 85.5 (0.29) 2.6 (0.13) 11.8 (0.27) 13.7 (0.22) 4.4 (0.20) 15.7 (0.23) Cohabiting . . . . . . . . . . . . . . . . . . . . . . . . . . . . . . 100.0 64.0 (1.30) 6.0 (0.63) 30.0 (1.26) 13.1 (0.39) 3.5 (0.31) 14.9 (0.40) Divorced or separated . . . . . . . . . . . . . . . . . . . . . . . 100.0 73.4 (0.65) 4.5 (0.28) 22.2 (0.64) 13.7 (0.24) 4.7 (0.27) 15.5 (0.24) Widowed . . . . . . . . . . . . . . . . . . . . . . . . . . . . . . . 100.0 88.2 (0.51) 1.9 (0.21) 9.9 (0.47) 14.2 (0.40) 4.9 (0.55) 15.7 (0.43)
Geographic region: Northeast . . . . . . . . . . . . . . . . . . . . . . . . . . . . . . . 100.0 82.8 (0.53) 3.4 (0.24) 13.8 (0.51) 13.2 (0.33) 4.7 (0.32) 15.2 (0.33) Midwest . . . . . . . . . . . . . . . . . . . . . . . . . . . . . . . . 100.0 79.1 (0.56) 4.1 (0.23) 16.8 (0.54) 13.4 (0.25) 4.6 (0.25) 15.4 (0.26) South . . . . . . . . . . . . . . . . . . . . . . . . . . . . . . . . . 100.0 81.5 (0.39) 3.0 (0.16) 15.5 (0.37) 13.7 (0.23) 4.1 (0.18) 15.5 (0.23) West . . . . . . . . . . . . . . . . . . . . . . . . . . . . . . . . . . 100.0 86.5 (0.44) 3.5 (0.24) 10.1 (0.42) 10.9 (0.28) 3.9 (0.25) 13.2 (0.31)
† Estimates with a relative standard error greater than 50% are indicated with a dagger, but are not shown.
* Estimates preceded by an asterisk have a relative standard error of greater than 30% and less than or equal to 50%. These should be interpreted with caution as they do not meet the standard of reliability or precision.
– Quantity zero. 1Current cigarette smoking status: Nonsmoker—never smokers and former smokers; daily smokers—currently smoked everyday; nondaily smokers—currently smoked some days, regardless of number of days they smoked. 2Estimates reflect usual cigarette consumption on days smoked and do not reflect average consumption over a period of time such as a week or a month. 3Persons of other races and unknown race and ethnicity, unknown education, unknown poverty status, and unknown marital status are included in the total. 4Estimates are age adjusted using the projected 2000 U.S. population as the standard population and using three age groups: 18–44 years, 45–64 years, and 65 years and over. 5GED is General Educational Development high school equivalency diploma. 6Poverty status is based on family income and family size using the U.S. Census Bureau poverty thresholds for 2004, 2005, and 2006.
NOTES: For age-adjusted percent distributions, refer to Table 4.2. Denominator for each percent distribution excludes persons with unknown current smoking status. Denominators for mean number of cigarettes on days smoked exclude smokers (daily and nondaily) with unknown number of cigarettes on days smoked and nondaily smokers who did not smoke in the past 30 days. See Appendix II for definitions of terms. See Appendix III for health behavior questions.
DATA SOURCE: National Health Interview Survey, 2005–2007. Estimates are based on household interviews of a sample of the civilian noninstitutionalized population.

Series 10, No. 245 [ Page 97
Table IX. Crude percent distributions (with standard errors) of usual number of cigarettes on days smoked among all current cigarette smokers 18 years of age and over, by selected characteristics: United States, average annual, 2005–2007
Usual number of cigarettes on days smoked among all current smokers1
Less 35 or Selected characteristic Total than 15 15–24 25–34 more
Both sexes Percent distribution (standard error)
Ages 18 years and over (crude)2 . . . . . . . . . . . . . . . . . . 100.0 53.1 (0.56) 35.3 (0.49) 6.7 (0.27) 4.8 (0.24) Ages 18 years and over (age-adjusted)2,3 . . . . . . . . . . . . 100.0 52.9 (0.58) 35.3 (0.51) 6.8 (0.28) 5.1 (0.27)
Age: 18–24 years . . . . . . . . . . . . . . . . . . . . . . . . . . . . . 100.0 71.2 (1.46) 23.8 (1.33) 3.5 (0.59) *1.4 (0.69) 25–44 years . . . . . . . . . . . . . . . . . . . . . . . . . . . . . 100.0 54.4 (0.77) 35.8 (0.74) 6.6 (0.43) 3.2 (0.27) 45–64 years . . . . . . . . . . . . . . . . . . . . . . . . . . . . . 100.0 44.8 (0.80) 39.6 (0.75) 8.1 (0.44) 7.5 (0.42) 65–74 years . . . . . . . . . . . . . . . . . . . . . . . . . . . . . 100.0 46.2 (1.97) 36.1 (1.85) 8.5 (1.08) 9.2 (1.25) 75 years and over . . . . . . . . . . . . . . . . . . . . . . . . . . 100.0 56.5 (3.13) 34.6 (2.98) 3.8 (1.06) *5.1 (1.65)
Race: White, single race . . . . . . . . . . . . . . . . . . . . . . . . . . 100.0 49.2 (0.62) 37.7 (0.56) 7.7 (0.31) 5.5 (0.28) Black or African American, single race . . . . . . . . . . . . . 100.0 73.3 (1.13) 22.9 (0.99) 2.2 (0.46) 1.6 (0.29) American Indian or Alaska Native, single race . . . . . . . . 100.0 67.6 (4.72) 23.4 (4.61) *5.2 (2.04) *3.8 (1.61) Asian, single race . . . . . . . . . . . . . . . . . . . . . . . . . . 100.0 72.6 (2.57) 25.0 (2.51) *1.4 (0.69) † Native Hawaiian or Other Pacific Islander, single race. . . . 100.0 70.5 (12.49) *29.5 (12.49) – – Two or more races . . . . . . . . . . . . . . . . . . . . . . . . . 100.0 62.7 (3.79) 32.1 (3.75) *3.2 (1.22) *2.0 (0.86)
Black or African American, white . . . . . . . . . . . . . . . 100.0 76.3 (7.49) *23.7 (7.49) – – American Indian or Alaska Native, white . . . . . . . . . . . 100.0 52.4 (5.40) 39.8 (5.39) *4.7 (1.93) *3.1 (1.45)
Hispanic or Latino origin and race: Hispanic or Latino . . . . . . . . . . . . . . . . . . . . . . . . . . 100.0 81.7 (1.04) 15.5 (0.99) 1.8 (0.36) 1.0 (0.24)
Mexican or Mexican American . . . . . . . . . . . . . . . . . 100.0 84.2 (1.32) 13.5 (1.27) 1.4 (0.42) *0.8 (0.27) Not Hispanic or Latino . . . . . . . . . . . . . . . . . . . . . . . 100.0 50.1 (0.59) 37.4 (0.52) 7.3 (0.29) 5.2 (0.26)
White, single race . . . . . . . . . . . . . . . . . . . . . . . . 100.0 45.4 (0.66) 40.3 (0.60) 8.3 (0.34) 6.0 (0.32) Black or African American, single race . . . . . . . . . . . . 100.0 73.0 (1.16) 23.2 (1.01) 2.2 (0.47) 1.6 (0.30)
Education: Less than high school graduate . . . . . . . . . . . . . . . . . 100.0 51.0 (1.19) 34.5 (1.08) 7.6 (0.67) 6.9 (0.76) GED diploma4 . . . . . . . . . . . . . . . . . . . . . . . . . . . . 100.0 37.5 (2.10) 40.5 (2.12) 12.8 (1.56) 9.3 (1.19) High school graduate . . . . . . . . . . . . . . . . . . . . . . . . 100.0 49.3 (0.92) 38.7 (0.86) 7.3 (0.48) 4.7 (0.38) Some college—no degree . . . . . . . . . . . . . . . . . . . . . 100.0 57.6 (1.16) 33.4 (1.08) 5.8 (0.51) 3.3 (0.36) Associate of arts degree . . . . . . . . . . . . . . . . . . . . . . 100.0 54.4 (1.54) 36.7 (1.54) 4.8 (0.67) 4.1 (0.60) Bachelor of arts, science degree . . . . . . . . . . . . . . . . . 100.0 65.4 (1.56) 28.9 (1.53) 3.9 (0.64) 1.8 (0.41) Masters, doctorate, medical degree . . . . . . . . . . . . . . . 100.0 66.0 (2.71) 25.1 (2.51) 5.1 (1.33) 3.8 (1.07)
Poverty status:5
Below poverty level . . . . . . . . . . . . . . . . . . . . . . . . . 100.0 56.8 (1.26) 32.4 (1.06) 5.7 (0.60) 5.1 (0.72) ≥1 and <2 times poverty level . . . . . . . . . . . . . . . . . . 100.0 51.7 (1.12) 35.8 (1.03) 6.5 (0.56) 6.0 (0.64) ≥2 and <4 times poverty level . . . . . . . . . . . . . . . . . . 100.0 50.6 (1.00) 37.8 (0.94) 7.4 (0.49) 4.2 (0.34) 4 times poverty level or more . . . . . . . . . . . . . . . . . . . 100.0 54.7 (1.06) 33.9 (0.97) 6.8 (0.53) 4.5 (0.40)
Marital status: Never married . . . . . . . . . . . . . . . . . . . . . . . . . . . . 100.0 64.5 (1.14) 28.4 (1.01) 4.1 (0.45) 3.0 (0.50) Married . . . . . . . . . . . . . . . . . . . . . . . . . . . . . . . . 100.0 49.8 (0.83) 37.4 (0.76) 7.6 (0.43) 5.2 (0.36) Cohabiting . . . . . . . . . . . . . . . . . . . . . . . . . . . . . . 100.0 53.6 (1.49) 34.4 (1.42) 8.2 (0.89) 3.7 (0.53) Divorced or separated . . . . . . . . . . . . . . . . . . . . . . . 100.0 46.5 (1.00) 39.1 (1.02) 7.3 (0.54) 7.2 (0.58) Widowed . . . . . . . . . . . . . . . . . . . . . . . . . . . . . . . 100.0 48.1 (1.93) 40.0 (1.94) 6.5 (0.94) 5.3 (0.85)
Geographic region: Northeast . . . . . . . . . . . . . . . . . . . . . . . . . . . . . . . 100.0 53.7 (1.33) 35.8 (1.25) 6.1 (0.54) 4.4 (0.51) Midwest . . . . . . . . . . . . . . . . . . . . . . . . . . . . . . . . 100.0 51.3 (1.06) 35.7 (0.93) 8.4 (0.59) 4.5 (0.34) South . . . . . . . . . . . . . . . . . . . . . . . . . . . . . . . . . 100.0 50.4 (0.93) 36.3 (0.80) 7.1 (0.45) 6.2 (0.49) West . . . . . . . . . . . . . . . . . . . . . . . . . . . . . . . . . . 100.0 61.1 (1.28) 32.3 (1.10) 4.0 (0.51) 2.7 (0.39)
Men
Ages 18 years and over (crude)2 . . . . . . . . . . . . . . . . . . 100.0 49.2 (0.76) 36.1 (0.67) 8.3 (0.41) 6.4 (0.38) Ages 18 years and over (age-adjusted)2,3 . . . . . . . . . . . . 100.0 48.6 (0.80) 36.1 (0.71) 8.3 (0.41) 7.0 (0.45)
Age: 18–24 years . . . . . . . . . . . . . . . . . . . . . . . . . . . . . 100.0 68.6 (2.05) 24.2 (1.78) 4.8 (0.93) † 25–44 years . . . . . . . . . . . . . . . . . . . . . . . . . . . . . 100.0 50.6 (1.08) 37.5 (1.05) 7.9 (0.64) 4.0 (0.40) 45–64 years . . . . . . . . . . . . . . . . . . . . . . . . . . . . . 100.0 40.0 (1.13) 39.6 (1.10) 10.3 (0.69) 10.1 (0.67) 65–74 years . . . . . . . . . . . . . . . . . . . . . . . . . . . . . 100.0 38.6 (2.80) 37.4 (2.61) 10.0 (1.57) 14.0 (2.14) 75 years and over . . . . . . . . . . . . . . . . . . . . . . . . . . 100.0 56.2 (4.86) 33.1 (4.65) *4.7 (1.88) *6.0 (3.00)
See footnotes at end of table.

Page 98 [ Series 10, No. 245
Table IX. Crude percent distributions (with standard errors) of usual number of cigarettes on days smoked among all current cigarette smokers 18 years of age and over, by selected characteristics: United States, average annual, 2005–2007—Con.
Usual number of cigarettes on days smoked among all current smokers1
Less 35 or Selected characteristic Total than 15 15–24 25–34 more
Men—Con. Percent distribution (standard error)
Race: White, single race . . . . . . . . . . . . . . . . . . . . . . . . . . 100.0 44.9 (0.84) 38.4 (0.76) 9.4 (0.48) 7.3 (0.46) Black or African American, single race . . . . . . . . . . . . . 100.0 70.1 (1.79) 24.7 (1.53) 2.9 (0.79) 2.3 (0.49) American Indian or Alaska Native, single race . . . . . . . . 100.0 55.9 (7.01) 31.2 (6.91) *7.5 (3.39) *5.4 (2.52) Asian, single race . . . . . . . . . . . . . . . . . . . . . . . . . . 100.0 73.2 (2.90) 23.7 (2.79) *1.8 (0.89) † Native Hawaiian or Other Pacific Islander, single race. . . . 100.0 70.0 (14.26) *30.0 (14.26) – – Two or more races . . . . . . . . . . . . . . . . . . . . . . . . . 100.0 57.9 (5.66) 32.7 (5.60) *6.6 (2.41) †
Black or African American, white . . . . . . . . . . . . . . . 100.0 71.6 (13.88) *28.4 (13.88) – – American Indian or Alaska Native, white . . . . . . . . . . . 100.0 46.4 (7.88) 40.2 (7.82) *8.8 (3.55) †
Hispanic or Latino origin and race: Hispanic or Latino . . . . . . . . . . . . . . . . . . . . . . . . . . 100.0 80.3 (1.34) 16.4 (1.27) 2.1 (0.50) 1.2 (0.29)
Mexican or Mexican American . . . . . . . . . . . . . . . . . 100.0 82.7 (1.66) 14.8 (1.61) *1.6 (0.53) *0.9 (0.33) Not Hispanic or Latino . . . . . . . . . . . . . . . . . . . . . . . 100.0 45.1 (0.82) 38.7 (0.74) 9.1 (0.45) 7.1 (0.43)
White, single race . . . . . . . . . . . . . . . . . . . . . . . . 100.0 39.5 (0.91) 41.8 (0.83) 10.5 (0.54) 8.2 (0.53) Black or African American, single race . . . . . . . . . . . . 100.0 69.7 (1.83) 25.1 (1.56) 2.9 (0.80) 2.3 (0.50)
Education: Less than high school graduate . . . . . . . . . . . . . . . . . 100.0 47.8 (1.64) 34.5 (1.52) 8.7 (0.99) 9.0 (1.20) GED diploma4 . . . . . . . . . . . . . . . . . . . . . . . . . . . . 100.0 35.7 (2.94) 37.7 (2.85) 15.0 (2.30) 11.5 (1.81) High school graduate . . . . . . . . . . . . . . . . . . . . . . . . 100.0 46.1 (1.26) 39.2 (1.19) 8.8 (0.73) 5.9 (0.57) Some college—no degree . . . . . . . . . . . . . . . . . . . . . 100.0 53.2 (1.66) 34.6 (1.52) 7.7 (0.82) 4.4 (0.60) Associate of arts degree . . . . . . . . . . . . . . . . . . . . . . 100.0 45.5 (2.29) 40.9 (2.32) 7.0 (1.13) 6.5 (1.04) Bachelor of arts, science degree . . . . . . . . . . . . . . . . . 100.0 63.0 (2.17) 29.0 (2.12) 5.3 (1.04) 2.7 (0.70) Masters, doctorate, medical degree . . . . . . . . . . . . . . . 100.0 62.0 (3.93) 29.8 (3.83) *3.5 (1.44) *4.7 (1.65)
Poverty status:5
Below poverty level . . . . . . . . . . . . . . . . . . . . . . . . . 100.0 52.3 (1.95) 33.2 (1.67) 7.0 (0.96) 7.5 (1.41) ≥1 and <2 times poverty level . . . . . . . . . . . . . . . . . . 100.0 49.9 (1.61) 34.9 (1.41) 7.3 (0.85) 7.9 (1.02) ≥2 and <4 times poverty level . . . . . . . . . . . . . . . . . . 100.0 47.1 (1.27) 38.5 (1.24) 9.3 (0.79) 5.0 (0.52) 4 times poverty level or more . . . . . . . . . . . . . . . . . . . 100.0 49.5 (1.43) 35.7 (1.29) 8.5 (0.74) 6.3 (0.62)
Marital status: Never married . . . . . . . . . . . . . . . . . . . . . . . . . . . . 100.0 60.8 (1.58) 30.5 (1.37) 4.7 (0.63) 4.1 (0.78) Married . . . . . . . . . . . . . . . . . . . . . . . . . . . . . . . . 100.0 46.3 (1.10) 38.0 (1.05) 9.2 (0.63) 6.5 (0.54) Cohabiting . . . . . . . . . . . . . . . . . . . . . . . . . . . . . . 100.0 48.7 (2.24) 35.9 (2.23) 11.1 (1.42) 4.3 (0.79) Divorced or separated . . . . . . . . . . . . . . . . . . . . . . . 100.0 38.7 (1.38) 39.6 (1.45) 10.1 (0.94) 11.6 (1.04) Widowed . . . . . . . . . . . . . . . . . . . . . . . . . . . . . . . 100.0 36.8 (3.66) 44.6 (3.89) 8.1 (1.98) 10.4 (2.34)
Geographic region: Northeast . . . . . . . . . . . . . . . . . . . . . . . . . . . . . . . 100.0 51.7 (1.91) 35.1 (1.82) 7.3 (0.87) 5.9 (0.80) Midwest . . . . . . . . . . . . . . . . . . . . . . . . . . . . . . . . 100.0 46.7 (1.45) 36.6 (1.25) 10.7 (0.90) 6.0 (0.55) South . . . . . . . . . . . . . . . . . . . . . . . . . . . . . . . . . 100.0 45.9 (1.25) 37.3 (1.10) 8.5 (0.68) 8.2 (0.80) West . . . . . . . . . . . . . . . . . . . . . . . . . . . . . . . . . . 100.0 57.5 (1.68) 33.7 (1.52) 5.2 (0.74) 3.6 (0.58)
Women
Ages 18 years and over (crude)2 . . . . . . . . . . . . . . . . . . 100.0 57.8 (0.74) 34.4 (0.68) 4.9 (0.32) 2.9 (0.22) Ages 18 years and over (age-adjusted)2,3 . . . . . . . . . . . . 100.0 57.8 (0.75) 34.3 (0.68) 4.9 (0.33) 3.0 (0.24)
Age: 18–24 years . . . . . . . . . . . . . . . . . . . . . . . . . . . . . 100.0 74.7 (1.99) 23.3 (1.99) *1.8 (0.60) † 25–44 years . . . . . . . . . . . . . . . . . . . . . . . . . . . . . 100.0 59.1 (1.12) 33.6 (1.05) 5.0 (0.53) 2.3 (0.33) 45–64 years . . . . . . . . . . . . . . . . . . . . . . . . . . . . . 100.0 50.4 (1.17) 39.5 (1.14) 5.6 (0.51) 4.5 (0.44) 65–74 years . . . . . . . . . . . . . . . . . . . . . . . . . . . . . 100.0 54.1 (2.57) 34.8 (2.46) 7.0 (1.37) 4.1 (1.12) 75 years and over . . . . . . . . . . . . . . . . . . . . . . . . . . 100.0 56.8 (3.95) 35.7 (3.80) *3.0 (1.18) *4.4 (1.81)
Race: White, single race . . . . . . . . . . . . . . . . . . . . . . . . . . 100.0 54.3 (0.84) 36.8 (0.78) 5.6 (0.37) 3.3 (0.26) Black or African American, single race . . . . . . . . . . . . . 100.0 77.1 (1.36) 20.7 (1.36) 1.3 (0.32) 0.8 (0.25) American Indian or Alaska Native, single race . . . . . . . . 100.0 82.3 (4.59) 13.6 (4.05) † † Asian, single race . . . . . . . . . . . . . . . . . . . . . . . . . . 100.0 70.5 (5.83) 29.5 (5.83) – – Native Hawaiian or Other Pacific Islander, single race. . . . 100.0 *73.5 (23.12) † – – Two or more races . . . . . . . . . . . . . . . . . . . . . . . . . 100.0 67.2 (4.53) 31.5 (4.44) – † Black or African American, white . . . . . . . . . . . . . . . . 100.0 79.5 (8.39) *20. (8.39) – – American Indian or Alaska Native, white . . . . . . . . . . . 100.0 59.1 (6.87) 39.4 (6.66) – †
See footnotes at end of table.

Series 10, No. 245 [ Page 99
Table IX. Crude percent distributions (with standard errors) of usual number of cigarettes on days smoked among all current cigarette smokers 18 years of age and over, by selected characteristics: United States, average annual, 2005–2007—Con.
Usual number of cigarettes on days smoked among all current smokers1
Less 35 or Selected characteristic Total than 15 15–24 25–34 more
Women—Con. Percent distribution (standard error)
Hispanic or Latino origin and race: Hispanic or Latino . . . . . . . . . . . . . . . . . . . . . . . . . . 100.0 84.7 (1.59) 13.5 (1.56) *1.0 (0.37) †
Mexican or Mexican American . . . . . . . . . . . . . . . . . 100.0 87.8 (2.03) 10.3 (1.92) † † Not Hispanic or Latino . . . . . . . . . . . . . . . . . . . . . . . 100.0 55.8 (0.77) 35.9 (0.72) 5.1 (0.34) 3.1 (0.23)
White, single race . . . . . . . . . . . . . . . . . . . . . . . . 100.0 52.0 (0.88) 38.6 (0.83) 5.9 (0.40) 3.5 (0.28) Black or African American, single race . . . . . . . . . . . . 100.0 77.0 (1.39) 20.8 (1.38) 1.4 (0.33) 0.9 (0.26)
Education: Less than high school graduate . . . . . . . . . . . . . . . . . 100.0 55.2 (1.56) 34.5 (1.46) 6.1 (0.80) 4.2 (0.58) GED diploma4 . . . . . . . . . . . . . . . . . . . . . . . . . . . . 100.0 39.8 (2.74) 44.1 (2.99) 9.8 (1.75) 6.3 (1.46) High school graduate . . . . . . . . . . . . . . . . . . . . . . . . 100.0 53.3 (1.28) 38.1 (1.23) 5.5 (0.62) 3.2 (0.45) Some college—no degree . . . . . . . . . . . . . . . . . . . . . 100.0 62.2 (1.57) 32.1 (1.48) 3.6 (0.59) 2.1 (0.39) Associate of arts degree . . . . . . . . . . . . . . . . . . . . . . 100.0 63.8 (2.12) 32.2 (2.05) 2.4 (0.67) *1.6 (0.58) Bachelor of arts, science degree . . . . . . . . . . . . . . . . . 100.0 68.4 (2.15) 28.8 (2.09) 2.0 (0.60) *0.7 (0.32) Masters, doctorate, medical degree . . . . . . . . . . . . . . . 100.0 70.7 (3.40) 19.5 (2.74) *6.9 (2.32) *2.8 (1.28)
Poverty status:5
Below poverty level . . . . . . . . . . . . . . . . . . . . . . . . . 100.0 60.9 (1.51) 31.6 (1.40) 4.6 (0.62) 3.0 (0.52) ≥1 and <2 times poverty level . . . . . . . . . . . . . . . . . . 100.0 53.7 (1.57) 36.9 (1.53) 5.5 (0.77) 3.8 (0.60) ≥2 and <4 times poverty level . . . . . . . . . . . . . . . . . . 100.0 55.1 (1.47) 37.0 (1.43) 4.8 (0.62) 3.1 (0.45) 4 times poverty level or more . . . . . . . . . . . . . . . . . . . 100.0 62.1 (1.50) 31.4 (1.44) 4.5 (0.66) 2.0 (0.37)
Marital status: Never married . . . . . . . . . . . . . . . . . . . . . . . . . . . . 100.0 70.8 (1.47) 24.9 (1.45) 3.1 (0.59) 1.2 (0.26) Married . . . . . . . . . . . . . . . . . . . . . . . . . . . . . . . . 100.0 54.1 (1.22) 36.7 (1.15) 5.6 (0.57) 3.5 (0.40) Cohabiting . . . . . . . . . . . . . . . . . . . . . . . . . . . . . . 100.0 59.6 (2.23) 32.7 (2.02) 4.7 (0.97) 3.0 (0.66) Divorced or separated . . . . . . . . . . . . . . . . . . . . . . . 100.0 53.7 (1.41) 38.6 (1.37) 4.6 (0.61) 3.1 (0.45) Widowed . . . . . . . . . . . . . . . . . . . . . . . . . . . . . . . 100.0 52.1 (2.28) 38.4 (2.23) 6.0 (1.07) 3.5 (0.75)
Geographic region: Northeast . . . . . . . . . . . . . . . . . . . . . . . . . . . . . . . 100.0 55.9 (1.70) 36.5 (1.64) 4.7 (0.69) 2.9 (0.55) Midwest . . . . . . . . . . . . . . . . . . . . . . . . . . . . . . . . 100.0 56.8 (1.42) 34.7 (1.30) 5.7 (0.71) 2.7 (0.39) South . . . . . . . . . . . . . . . . . . . . . . . . . . . . . . . . . 100.0 55.8 (1.22) 35.0 (1.10) 5.4 (0.53) 3.8 (0.41) West . . . . . . . . . . . . . . . . . . . . . . . . . . . . . . . . . . 100.0 66.4 (1.73) 30.1 (1.64) 2.2 (0.47) 1.3 (0.32)
* Estimates preceded by an asterisk have a relative standard error of greater than 30% and less than or equal to 50%. These should be interpreted with caution as they do not meet the standard of reliability or precision.
† Estimates with a relative standard error greater than 50% are indicated with a dagger, but are not shown.
– Quantity zero. 1Usual number of cigarettes on days smoked includes the usual cigarette consumption of daily and nondaily smokers combined. Estimates for nondaily smokers reflect number of cigarettes smoked only on the days that they smoked and are limited to those who smoked at least once in the past 30 days. 2Persons of other races and unknown race and ethnicity, unknown education, unknown poverty status, and unknown marital status are included in the total. 3Estimates are age adjusted using the projected 2000 U.S. population as the standard population and using three age groups: 18–44 years, 45–64 years, and 65 years and over. 4GED is General Educational Development high school equivalency diploma. 5Poverty status is based on family income and family size using the U.S. Census Bureau poverty thresholds for 2004, 2005, and 2006.
NOTES: For age-adjusted percent distributions, refer to Table 4.3. Denominator for each percent distribution excludes smokers with unknown number of cigarettes on days smoked. See Appendix II for definitions of terms. See Appendix III for health behavior questions.
DATA SOURCE: National Health Interview Survey, 2005–2007. Estimates are based on household interviews of a sample of the civilian noninstitutionalized population.
Page 100 [ Series 10, No. 245
Table X. Crude percent distributions (with standard errors) of age of smoking initiation among current cigarette smokers 18 years of age and over: United States, average annual, 2005–2007
Age first smoked fairly regularly1
Less than 16–17 18–20 21 years Selected characteristic Total 16 years years years and over
Both sexes Percent distribution (standard error)
Ages 18 years and over (crude)2 . . . . . . . . . . . . . . . . . . 100.0 31.9 (0.50) 25.3 (0.43) 26.4 (0.45) 16.5 (0.36) Ages 18 years and over (age-adjusted)2,3 . . . . . . . . . . . . 100.0 31.8 (0.50) 24.8 (0.43) 26.3 (0.46) 17.1 (0.39)
Age: 18–24 years . . . . . . . . . . . . . . . . . . . . . . . . . . . . . 100.0 35.7 (1.48) 34.0 (1.52) 26.9 (1.36) 3.3 (0.56) 25–44 years . . . . . . . . . . . . . . . . . . . . . . . . . . . . . 100.0 32.6 (0.73) 25.5 (0.71) 25.6 (0.66) 16.2 (0.57) 45–64 years . . . . . . . . . . . . . . . . . . . . . . . . . . . . . 100.0 29.6 (0.80) 22.4 (0.66) 27.1 (0.72) 20.9 (0.65) 65–74 years . . . . . . . . . . . . . . . . . . . . . . . . . . . . . 100.0 31.8 (1.79) 20.0 (1.55) 25.5 (1.66) 22.7 (1.66) 75 years and over . . . . . . . . . . . . . . . . . . . . . . . . . . 100.0 26.2 (2.87) 20.5 (2.68) 28.1 (2.75) 25.2 (2.55)
Race: White, single race . . . . . . . . . . . . . . . . . . . . . . . . . . 100.0 33.2 (0.55) 25.8 (0.48) 25.8 (0.49) 15.2 (0.39) Black or African American, single race . . . . . . . . . . . . . 100.0 23.1 (1.01) 22.9 (1.06) 29.9 (1.24) 24.1 (1.02) American Indian or Alaska Native, single race . . . . . . . . 100.0 43.9 (5.21) 23.4 (3.95) 21.4 (3.54) 11.4 (2.52) Asian, single race . . . . . . . . . . . . . . . . . . . . . . . . . . 100.0 17.6 (2.26) 21.9 (2.87) 33.8 (2.76) 26.7 (2.91) Native Hawaiian or Other Pacific Islander, single race. . . . 100.0 † *36.5 (15.11) *34.5 (15.40) † Two or more races . . . . . . . . . . . . . . . . . . . . . . . . . 100.0 41.2 (3.55) 23.0 (3.10) 22.8 (3.41) 13.1 (2.43)
Black or African American, white . . . . . . . . . . . . . . . 100.0 34.3 (8.77) *20.6 (8.77) *30.5 (9.35) † American Indian or Alaska Native, white . . . . . . . . . . . 100.0 47.8 (5.03) 19.1 (3.57) 18.8 (4.79) 14.3 (3.69)
Hispanic or Latino origin and race: Hispanic or Latino . . . . . . . . . . . . . . . . . . . . . . . . . . 100.0 29.1 (1.30) 24.2 (1.25) 27.5 (1.27) 19.3 (1.10)
Mexican or Mexican American . . . . . . . . . . . . . . . . . 100.0 31.8 (1.71) 23.8 (1.61) 25.0 (1.57) 19.4 (1.46) Not Hispanic or Latino . . . . . . . . . . . . . . . . . . . . . . . 100.0 32.1 (0.52) 25.4 (0.45) 26.2 (0.48) 16.2 (0.38)
White, single race . . . . . . . . . . . . . . . . . . . . . . . . 100.0 33.7 (0.59) 26.0 (0.52) 25.5 (0.52) 14.7 (0.41) Black or African American, single race . . . . . . . . . . . . 100.0 23.1 (1.03) 22.8 (1.06) 29.7 (1.26) 24.4 (1.04)
Education: Less than high school graduate . . . . . . . . . . . . . . . . . 100.0 43.7 (1.06) 26.5 (0.96) 18.7 (0.84) 11.2 (0.63) GED diploma4 . . . . . . . . . . . . . . . . . . . . . . . . . . . . 100.0 53.0 (2.22) 24.6 (1.94) 13.3 (1.40) 9.1 (1.06) High school graduate . . . . . . . . . . . . . . . . . . . . . . . . 100.0 28.7 (0.83) 27.6 (0.83) 27.0 (0.78) 16.7 (0.69) Some college—no degree . . . . . . . . . . . . . . . . . . . . . 100.0 28.8 (1.04) 24.8 (0.91) 29.5 (1.03) 16.9 (0.77) Associate of arts degree . . . . . . . . . . . . . . . . . . . . . . 100.0 26.7 (1.36) 22.0 (1.23) 31.4 (1.51) 19.8 (1.21) Bachelor of arts, science degree . . . . . . . . . . . . . . . . . 100.0 17.2 (1.29) 21.5 (1.49) 36.2 (1.60) 25.1 (1.44) Masters, doctorate, medical degree . . . . . . . . . . . . . . . 100.0 16.0 (2.04) 21.6 (2.35) 34.8 (2.55) 27.7 (2.33)
Poverty status:5
Below poverty level . . . . . . . . . . . . . . . . . . . . . . . . . 100.0 41.1 (1.18) 23.2 (0.98) 20.6 (0.92) 15.1 (0.81) ≥1 and <2 times poverty level . . . . . . . . . . . . . . . . . . 100.0 35.8 (1.15) 25.0 (1.01) 24.2 (0.91) 15.1 (0.83) ≥2 and <4 times poverty level . . . . . . . . . . . . . . . . . . 100.0 31.0 (0.89) 25.8 (0.93) 26.8 (0.88) 16.4 (0.67) 4 times poverty level or more . . . . . . . . . . . . . . . . . . . 100.0 24.5 (0.90) 26.2 (1.00) 30.9 (0.97) 18.5 (0.77)
Marital status: Never married . . . . . . . . . . . . . . . . . . . . . . . . . . . . 100.0 30.8 (0.99) 28.6 (1.01) 28.1 (0.97) 12.6 (0.65) Married . . . . . . . . . . . . . . . . . . . . . . . . . . . . . . . . 100.0 30.7 (0.75) 24.9 (0.67) 27.5 (0.70) 16.9 (0.55) Cohabiting . . . . . . . . . . . . . . . . . . . . . . . . . . . . . . 100.0 38.9 (1.56) 26.0 (1.36) 21.8 (1.25) 13.3 (1.02) Divorced or separated . . . . . . . . . . . . . . . . . . . . . . . 100.0 32.9 (0.99) 22.8 (0.84) 23.5 (0.91) 20.7 (0.80) Widowed . . . . . . . . . . . . . . . . . . . . . . . . . . . . . . . 100.0 26.8 (1.73) 18.5 (1.47) 27.8 (1.71) 26.9 (1.68)
Geographic region: Northeast . . . . . . . . . . . . . . . . . . . . . . . . . . . . . . . 100.0 31.4 (1.15) 25.3 (0.98) 27.4 (1.06) 15.9 (0.91) Midwest . . . . . . . . . . . . . . . . . . . . . . . . . . . . . . . . 100.0 31.0 (1.00) 25.8 (0.88) 28.5 (0.90) 14.7 (0.67) South . . . . . . . . . . . . . . . . . . . . . . . . . . . . . . . . . 100.0 32.2 (0.81) 25.8 (0.68) 24.7 (0.72) 17.2 (0.57) West . . . . . . . . . . . . . . . . . . . . . . . . . . . . . . . . . . 100.0 32.8 (1.11) 23.3 (0.96) 25.6 (1.03) 18.3 (0.89)
Men
Ages 18 years and over (crude)2 . . . . . . . . . . . . . . . . . . 100.0 33.7 (0.69) 25.4 (0.60) 26.0 (0.62) 14.9 (0.49) Ages 18 years and over (age-adjusted)2,3 . . . . . . . . . . . . 100.0 35.1 (0.71) 24.8 (0.61) 25.7 (0.65) 14.5 (0.49)
Age: 18–24 years . . . . . . . . . . . . . . . . . . . . . . . . . . . . . 100.0 34.6 (2.01) 34.8 (2.17) 27.0 (1.89) 3.6 (0.77) 25–44 years . . . . . . . . . . . . . . . . . . . . . . . . . . . . . 100.0 31.7 (1.04) 24.9 (0.95) 26.1 (0.92) 17.3 (0.83) 45–64 years . . . . . . . . . . . . . . . . . . . . . . . . . . . . . 100.0 33.8 (1.12) 23.1 (0.96) 25.8 (0.97) 17.3 (0.85) 65–74 years . . . . . . . . . . . . . . . . . . . . . . . . . . . . . 100.0 45.9 (2.74) 18.9 (2.22) 24.1 (2.31) 11.1 (1.70) 75 years and over . . . . . . . . . . . . . . . . . . . . . . . . . . 100.0 43.4 (4.91) 19.4 (3.79) 21.1 (3.92) 16.1 (3.34)
See footnotes at end of table.

Series 10, No. 245 [ Page 101
Table X. Crude percent distributions (with standard errors) of age of smoking initiation among current cigarette smokers 18 years of age and over: United States, average annual, 2005–2007—Con.
Age first smoked fairly regularly1
Less than 16–17 18–20 21 years Selected characteristic Total 16 years years years and over
Men—Con. Percent distribution (standard error)
Race: White, single race . . . . . . . . . . . . . . . . . . . . . . . . . . 100.0 35.6 (0.76) 25.8 (0.68) 25.1 (0.68) 13.5 (0.53) Black or African American, single race . . . . . . . . . . . . . 100.0 24.7 (1.57) 23.9 (1.56) 29.9 (1.87) 21.6 (1.46) American Indian or Alaska Native, single race . . . . . . . . 100.0 51.2 (7.22) 19.5 (5.19) 26.0 (5.45) † Asian, single race . . . . . . . . . . . . . . . . . . . . . . . . . . 100.0 15.5 (2.50) 23.9 (3.15) 32.9 (3.14) 27.7 (3.28) Native Hawaiian or Other Pacific Islander, single race. . . . 100.0 † *43.5 (17.42) *36.0 (17.68) † Two or more races . . . . . . . . . . . . . . . . . . . . . . . . . 100.0 38.9 (5.63) 22.0 (5.12) 25.3 (5.64) 13.8 (3.82)
Black or African American, white . . . . . . . . . . . . . . . 100.0 *21.6 (10.75) † *35.6 (17.46) † American Indian or Alaska Native, white . . . . . . . . . . . 100.0 44.7 (7.65) *17.3 (5.45) *24.4 (7.87) *13.6 (5.20)
Hispanic or Latino origin and race: Hispanic or Latino . . . . . . . . . . . . . . . . . . . . . . . . . . 100.0 30.2 (1.65) 24.4 (1.55) 27.5 (1.55) 17.9 (1.38)
Mexican or Mexican American . . . . . . . . . . . . . . . . . 100.0 33.0 (2.07) 24.4 (1.91) 24.8 (1.82) 17.8 (1.77) Not Hispanic or Latino . . . . . . . . . . . . . . . . . . . . . . . 100.0 34.2 (0.74) 25.6 (0.65) 25.8 (0.67) 14.5 (0.52)
White, single race . . . . . . . . . . . . . . . . . . . . . . . . 100.0 36.3 (0.83) 26.1 (0.75) 24.7 (0.74) 12.8 (0.56) Black or African American, single race . . . . . . . . . . . . 100.0 24.5 (1.59) 24.2 (1.58) 29.7 (1.90) 21.7 (1.48)
Education: Less than high school graduate . . . . . . . . . . . . . . . . . 100.0 46.3 (1.56) 27.3 (1.38) 17.1 (1.10) 9.3 (0.79) GED diploma4 . . . . . . . . . . . . . . . . . . . . . . . . . . . . 100.0 53.7 (2.98) 26.7 (2.87) 12.3 (1.82) 7.4 (1.26) High school graduate . . . . . . . . . . . . . . . . . . . . . . . . 100.0 29.3 (1.10) 27.3 (1.11) 28.3 (1.11) 15.2 (0.94) Some college—no degree . . . . . . . . . . . . . . . . . . . . . 100.0 30.3 (1.60) 23.8 (1.31) 30.6 (1.52) 15.3 (1.08) Associate of arts degree . . . . . . . . . . . . . . . . . . . . . . 100.0 29.3 (2.05) 21.9 (1.70) 29.2 (2.11) 19.6 (1.67) Bachelor of arts, science degree . . . . . . . . . . . . . . . . . 100.0 18.9 (1.91) 22.3 (2.21) 35.5 (2.16) 23.3 (2.00) Masters, doctorate, medical degree . . . . . . . . . . . . . . . 100.0 21.9 (3.31) 21.0 (3.56) 29.0 (3.44) 28.1 (3.34)
Poverty status:5
Below poverty level . . . . . . . . . . . . . . . . . . . . . . . . . 100.0 42.6 (1.86) 24.3 (1.75) 20.1 (1.40) 13.0 (1.19) ≥1 and <2 times poverty level . . . . . . . . . . . . . . . . . . 100.0 38.0 (1.81) 24.2 (1.59) 24.7 (1.26) 13.1 (1.06) ≥2 and <4 times poverty level . . . . . . . . . . . . . . . . . . 100.0 33.2 (1.21) 26.2 (1.23) 25.9 (1.22) 14.7 (0.86) 4 times poverty level or more . . . . . . . . . . . . . . . . . . . 100.0 27.3 (1.29) 26.0 (1.25) 29.6 (1.25) 17.1 (0.99)
Marital status: Never married . . . . . . . . . . . . . . . . . . . . . . . . . . . . 100.0 31.0 (1.34) 28.7 (1.39) 28.1 (1.31) 12.2 (0.88) Married . . . . . . . . . . . . . . . . . . . . . . . . . . . . . . . . 100.0 32.8 (1.03) 24.2 (0.88) 27.5 (0.96) 15.6 (0.74) Cohabiting . . . . . . . . . . . . . . . . . . . . . . . . . . . . . . 100.0 38.5 (2.17) 26.6 (1.92) 21.3 (1.99) 13.6 (1.41) Divorced or separated . . . . . . . . . . . . . . . . . . . . . . . 100.0 36.6 (1.41) 23.6 (1.27) 21.4 (1.19) 18.4 (1.07) Widowed . . . . . . . . . . . . . . . . . . . . . . . . . . . . . . . 100.0 44.2 (3.81) 16.9 (2.88) 22.9 (3.35) 16.0 (2.83)
Geographic region: Northeast . . . . . . . . . . . . . . . . . . . . . . . . . . . . . . . 100.0 32.8 (1.67) 24.7 (1.45) 27.4 (1.68) 15.0 (1.38) Midwest . . . . . . . . . . . . . . . . . . . . . . . . . . . . . . . . 100.0 33.2 (1.37) 26.0 (1.24) 27.8 (1.29) 13.0 (0.87) South . . . . . . . . . . . . . . . . . . . . . . . . . . . . . . . . . 100.0 33.8 (1.08) 26.2 (0.97) 25.1 (0.98) 14.9 (0.76) West . . . . . . . . . . . . . . . . . . . . . . . . . . . . . . . . . . 100.0 35.1 (1.59) 23.6 (1.31) 24.1 (1.25) 17.1 (1.20)
Women
Ages 18 years and over (crude)2 . . . . . . . . . . . . . . . . . . 100.0 29.6 (0.66) 25.1 (0.61) 26.8 (0.62) 18.5 (0.52) Ages 18 years and over (age-adjusted)2,3 . . . . . . . . . . . . 100.0 28.5 (0.64) 24.9 (0.62) 26.9 (0.63) 19.7 (0.56)
Age: 18–24 years . . . . . . . . . . . . . . . . . . . . . . . . . . . . . 100.0 37.3 (2.03) 32.9 (2.05) 26.8 (2.04) 3.1 (0.78) 25–44 years . . . . . . . . . . . . . . . . . . . . . . . . . . . . . 100.0 33.8 (1.00) 26.3 (0.97) 24.9 (0.92) 14.9 (0.72) 45–64 years . . . . . . . . . . . . . . . . . . . . . . . . . . . . . 100.0 24.7 (1.07) 21.6 (0.93) 28.6 (1.11) 25.2 (0.96) 65–74 years . . . . . . . . . . . . . . . . . . . . . . . . . . . . . 100.0 17.1 (1.96) 21.2 (2.10) 27.1 (2.14) 34.7 (2.63) 75 years and over . . . . . . . . . . . . . . . . . . . . . . . . . . 100.0 13.3 (2.69) 21.2 (3.75) 33.4 (3.86) 32.1 (3.58)
Race: White, single race . . . . . . . . . . . . . . . . . . . . . . . . . . 100.0 30.5 (0.74) 25.8 (0.70) 26.5 (0.70) 17.2 (0.57) Black or African American, single race . . . . . . . . . . . . . 100.0 21.3 (1.26) 21.6 (1.33) 29.8 (1.52) 27.3 (1.45) American Indian or Alaska Native, single race . . . . . . . . 100.0 35.3 (7.02) 28.0 (6.36) 15.9 (4.08) 20.8 (4.83) Asian, single race . . . . . . . . . . . . . . . . . . . . . . . . . . 100.0 24.9 (5.03) *14.9 (5.06) 37.2 (5.71) 23.0 (4.66) Native Hawaiian or Other Pacific Islander, single race. . . . 100.0 † – † † Two or more races . . . . . . . . . . . . . . . . . . . . . . . . . 100.0 43.3 (4.77) 23.8 (3.98) 20.5 (3.86) 12.4 (2.95)
Black or African American, white . . . . . . . . . . . . . . . 100.0 42.2 (11.75) † *27.3 (10.25) † American Indian or Alaska Native, white . . . . . . . . . . . 100.0 51.2 (7.22) 20.9 (5.56) *13.0 (5.25) *15.0 (4.71)
See footnotes at end of table.

Page 102 [ Series 10, No. 245
Table X. Crude percent distributions (with standard errors) of age of smoking initiation among current cigarette smokers 18 years of age and over: United States, average annual, 2005–2007—Con.
Age first smoked fairly regularly1
Less than 16–17 18–20 21 years Selected characteristic Total 16 years years years and over
Women—Con. Percent distribution (standard error)
Hispanic or Latino origin and race: Hispanic or Latino . . . . . . . . . . . . . . . . . . . . . . . . . . 100.0 26.8 (2.05) 23.6 (2.10) 27.5 (2.15) 22.1 (1.74)
Mexican or Mexican American . . . . . . . . . . . . . . . . . 100.0 28.8 (3.08) 22.3 (2.85) 25.5 (2.96) 23.4 (2.42) Not Hispanic or Latino . . . . . . . . . . . . . . . . . . . . . . . 100.0 29.8 (0.69) 25.2 (0.65) 26.8 (0.65) 18.2 (0.55)
White, single race . . . . . . . . . . . . . . . . . . . . . . . . 100.0 30.8 (0.78) 26.0 (0.74) 26.4 (0.74) 16.8 (0.59) Black or African American, single race . . . . . . . . . . . . 100.0 21.3 (1.29) 21.1 (1.31) 29.8 (1.54) 27.8 (1.47)
Education: Less than high school graduate . . . . . . . . . . . . . . . . . 100.0 40.2 (1.51) 25.3 (1.34) 20.7 (1.23) 13.7 (1.03) GED diploma4 . . . . . . . . . . . . . . . . . . . . . . . . . . . . 100.0 52.1 (3.05) 21.6 (2.26) 14.8 (2.12) 11.5 (1.82) High school graduate . . . . . . . . . . . . . . . . . . . . . . . . 100.0 28.0 (1.28) 28.0 (1.28) 25.4 (1.11) 18.6 (1.02) Some college—no degree . . . . . . . . . . . . . . . . . . . . . 100.0 27.3 (1.31) 25.8 (1.32) 28.2 (1.37) 18.7 (1.07) Associate of arts degree . . . . . . . . . . . . . . . . . . . . . . 100.0 23.9 (1.74) 22.2 (1.83) 33.8 (2.16) 20.1 (1.72) Bachelor of arts, science degree . . . . . . . . . . . . . . . . . 100.0 14.9 (1.52) 20.5 (1.82) 37.1 (2.29) 27.5 (2.07) Masters, doctorate, medical degree . . . . . . . . . . . . . . . 100.0 9.2 (2.12) 22.2 (3.00) 41.4 (3.66) 27.2 (3.17)
Poverty status:5
Below poverty level . . . . . . . . . . . . . . . . . . . . . . . . . 100.0 39.8 (1.45) 22.1 (1.11) 21.1 (1.18) 16.9 (1.03) ≥1 and <2 times poverty level . . . . . . . . . . . . . . . . . . 100.0 33.2 (1.48) 25.9 (1.45) 23.5 (1.35) 17.3 (1.11) ≥2 and <4 times poverty level . . . . . . . . . . . . . . . . . . 100.0 28.2 (1.28) 25.3 (1.26) 27.9 (1.30) 18.6 (1.01) 4 times poverty level or more . . . . . . . . . . . . . . . . . . . 100.0 20.5 (1.26) 26.4 (1.43) 32.7 (1.57) 20.4 (1.20)
Marital status: Never married . . . . . . . . . . . . . . . . . . . . . . . . . . . . 100.0 30.3 (1.41) 28.4 (1.60) 28.1 (1.48) 13.2 (0.94) Married . . . . . . . . . . . . . . . . . . . . . . . . . . . . . . . . 100.0 28.1 (1.07) 25.8 (1.03) 27.6 (1.03) 18.6 (0.84) Cohabiting . . . . . . . . . . . . . . . . . . . . . . . . . . . . . . 100.0 39.4 (2.42) 25.3 (1.93) 22.5 (1.82) 12.8 (1.48) Divorced or separated . . . . . . . . . . . . . . . . . . . . . . . 100.0 29.5 (1.36) 22.1 (1.17) 25.5 (1.29) 22.9 (1.17) Widowed . . . . . . . . . . . . . . . . . . . . . . . . . . . . . . . 100.0 20.7 (1.87) 19.1 (1.70) 29.5 (2.05) 30.7 (2.08)
Geographic region: Northeast . . . . . . . . . . . . . . . . . . . . . . . . . . . . . . . 100.0 30.0 (1.62) 25.9 (1.47) 27.3 (1.30) 16.9 (1.13) Midwest . . . . . . . . . . . . . . . . . . . . . . . . . . . . . . . . 100.0 28.4 (1.18) 25.6 (1.16) 29.3 (1.22) 16.7 (0.96) South . . . . . . . . . . . . . . . . . . . . . . . . . . . . . . . . . 100.0 30.4 (1.12) 25.3 (1.00) 24.4 (1.01) 20.0 (0.86) West . . . . . . . . . . . . . . . . . . . . . . . . . . . . . . . . . . 100.0 29.4 (1.48) 22.8 (1.44) 27.8 (1.52) 20.0 (1.39)
† Estimates with a relative standard error greater than 50% are indicated with a dagger, but are not shown.
* Estimates preceded by an asterisk have a relative standard error of greater than 30% and less than or equal to 50%. These should be interpreted with caution as they do not meet the standard of reliability or precision.
– Quantity zero. 1Current smokers were asked at what age they first starting smoking fairly regularly. Answers were recorded in single years and combined for this table. 2Persons of other races and unknown race and ethnicity, unknown education, unknown poverty status, and unknown marital status are included in the total. 3Estimates are age adjusted using the projected 2000 U.S. population as the standard population and using three age groups: 18–44 years, 45–64 years, and 65 years and over. 4GED is General Educational Development high school equivalency diploma. 5Poverty status is based on family income and family size using the U.S. Census Bureau poverty thresholds for 2004, 2005, and 2006.
NOTES: For age-adjusted percent distributions, refer to Table 4.4. Denominator for each percent distribution excludes current smokers with unknown age of smoking initiation. See Appendix II for definitions of terms. See Appendix III for health behavior questions.
DATA SOURCE: National Health Interview Survey, 2005–2007. Estimates are based on household interviews of a sample of the civilian noninstitutionalized population.

Series 10, No. 245 [ Page 103
Table XI. Crude percentages (with standard errors) of current cigarette smokers 18 years of age and over who tried to quit smoking in the past year, by current smoking status and selected characteristics: United States, average annual, 2005–2007
All current Nondaily Daily Selected characteristic smokers smokers smokers
Both sexes Percent who tried to quit1 (standard error)
Ages 18 years and over (crude)2 . . . . . . . . . . . . . . . . . . 43.5 (0.53) 55.1 (1.10) 40.5 (0.57) Ages 18 years and over (age-adjusted)2,3 . . . . . . . . . . . . 42.5 (0.54) 54.6 (1.14) 39.6 (0.59)
Age: 18–24 years . . . . . . . . . . . . . . . . . . . . . . . . . . . . . 52.0 (1.62) 57.2 (2.82) 49.9 (1.89) 25–44 years . . . . . . . . . . . . . . . . . . . . . . . . . . . . . 45.0 (0.80) 54.7 (1.53) 42.4 (0.90) 45–64 years . . . . . . . . . . . . . . . . . . . . . . . . . . . . . 40.3 (0.82) 55.1 (1.95) 37.4 (0.88) 65–74 years . . . . . . . . . . . . . . . . . . . . . . . . . . . . . 34.1 (1.83) 56.8 (4.50) 29.6 (1.93) 75 years and over . . . . . . . . . . . . . . . . . . . . . . . . . . 29.3 (2.79) 36.8 (6.60) 27.7 (3.02)
Race: White, single race . . . . . . . . . . . . . . . . . . . . . . . . . . 42.5 (0.58) 54.5 (1.25) 39.7 (0.64) Black or African American, single race . . . . . . . . . . . . . 47.3 (1.37) 58.1 (2.67) 43.8 (1.50) American Indian or Alaska Native, single race . . . . . . . . 47.0 (4.37) 55.8 (8.15) 43.1 (5.29) Asian, single race . . . . . . . . . . . . . . . . . . . . . . . . . . 49.3 (3.15) 58.3 (4.77) 46.1 (3.85) Native Hawaiian or Other Pacific Islander, single race. . . . 53.7 (15.30) † 66.3 (14.67) Two or more races . . . . . . . . . . . . . . . . . . . . . . . . . 53.2 (3.80) 54.8 (8.73) 52.8 (4.08)
Black or African American, white . . . . . . . . . . . . . . . 39.5 (9.51) † 41.7 (11.05) American Indian or Alaska Native, white . . . . . . . . . . . 51.8 (5.47) 68.1 (12.40) 48.5 (5.77)
Hispanic or Latino origin and race: Hispanic or Latino . . . . . . . . . . . . . . . . . . . . . . . . . . 44.7 (1.46) 48.0 (2.37) 42.5 (1.74)
Mexican or Mexican American . . . . . . . . . . . . . . . . . 42.5 (1.88) 46.2 (2.73) 39.5 (2.34) Not Hispanic or Latino . . . . . . . . . . . . . . . . . . . . . . . 43.4 (0.56) 56.8 (1.25) 40.4 (0.60)
White, single race . . . . . . . . . . . . . . . . . . . . . . . . 42.5 (0.63) 56.5 (1.47) 39.6 (0.68) Black or African American, single race . . . . . . . . . . . . 47.0 (1.40) 57.7 (2.72) 43.5 (1.53)
Education: Less than high school graduate . . . . . . . . . . . . . . . . . 39.7 (1.13) 53.9 (2.57) 36.8 (1.24) GED diploma4 . . . . . . . . . . . . . . . . . . . . . . . . . . . . 38.2 (2.02) 57.0 (5.76) 36.3 (2.14) High school graduate . . . . . . . . . . . . . . . . . . . . . . . . 41.2 (0.92) 55.1 (2.06) 38.2 (1.02) Some college—no degree . . . . . . . . . . . . . . . . . . . . . 50.0 (1.16) 59.1 (2.44) 47.3 (1.23) Associate of arts degree . . . . . . . . . . . . . . . . . . . . . . 45.3 (1.53) 54.2 (3.48) 43.0 (1.71) Bachelor of arts, science degree . . . . . . . . . . . . . . . . . 48.4 (1.60) 53.4 (2.69) 45.7 (2.01) Masters, doctorate, medical degree . . . . . . . . . . . . . . . 43.4 (2.65) 48.5 (4.22) 40.7 (3.32)
Poverty status:5
Below poverty level . . . . . . . . . . . . . . . . . . . . . . . . . 42.8 (1.12) 57.9 (2.37) 39.2 (1.21) ≥1 and <2 times poverty level . . . . . . . . . . . . . . . . . . 43.0 (1.13) 55.0 (2.31) 40.3 (1.28) ≥2 and <4 times poverty level . . . . . . . . . . . . . . . . . . 42.2 (1.07) 55.9 (2.12) 38.9 (1.20) 4 times poverty level or more . . . . . . . . . . . . . . . . . . . 45.8 (1.00) 53.3 (2.24) 43.5 (1.13)
Marital status: Never married . . . . . . . . . . . . . . . . . . . . . . . . . . . . 46.5 (1.11) 54.2 (2.00) 43.6 (1.27) Married . . . . . . . . . . . . . . . . . . . . . . . . . . . . . . . . 42.9 (0.76) 56.3 (1.64) 39.8 (0.84) Cohabiting . . . . . . . . . . . . . . . . . . . . . . . . . . . . . . 43.5 (1.61) 49.8 (3.46) 42.1 (1.81) Divorced or separated . . . . . . . . . . . . . . . . . . . . . . . 42.3 (0.99) 57.4 (2.30) 39.2 (1.08) Widowed . . . . . . . . . . . . . . . . . . . . . . . . . . . . . . . 38.3 (1.91) 57.9 (5.10) 34.9 (1.98)
Geographic region: Northeast . . . . . . . . . . . . . . . . . . . . . . . . . . . . . . . 48.0 (1.27) 61.5 (2.61) 44.3 (1.42) Midwest . . . . . . . . . . . . . . . . . . . . . . . . . . . . . . . . 45.0 (0.95) 56.7 (2.08) 42.0 (1.07) South . . . . . . . . . . . . . . . . . . . . . . . . . . . . . . . . . 40.9 (0.88) 54.4 (1.92) 37.9 (0.92) West . . . . . . . . . . . . . . . . . . . . . . . . . . . . . . . . . . 42.9 (1.23) 49.5 (2.29) 40.6 (1.34)
Men
Ages 18 years and over (crude)2 . . . . . . . . . . . . . . . . . . 42.4 (0.73) 51.7 (1.53) 39.8 (0.80) Ages 18 years and over (age-adjusted)2,3 . . . . . . . . . . . . 41.5 (0.78) 51.4 (1.62) 39.2 (0.85)
Age: 18–24 years . . . . . . . . . . . . . . . . . . . . . . . . . . . . . 49.8 (2.17) 52.6 (3.86) 48.6 (2.56) 25–44 years . . . . . . . . . . . . . . . . . . . . . . . . . . . . . 44.0 (1.07) 50.7 (2.00) 42.0 (1.24) 45–64 years . . . . . . . . . . . . . . . . . . . . . . . . . . . . . 38.4 (1.16) 53.7 (2.77) 35.6 (1.24) 65–74 years . . . . . . . . . . . . . . . . . . . . . . . . . . . . . 36.5 (2.87) 58.2 (6.46) 32.1 (3.10) 75 years and over . . . . . . . . . . . . . . . . . . . . . . . . . . 27.7 (4.36) *18.5 (6.98) 29.9 (5.06)
See footnotes at end of table.
Page 104 [ Series 10, No. 245
Table XI. Crude percentages (with standard errors) of current cigarette smokers 18 years of age and over who tried to quit smoking in the past year, by current smoking status and selected characteristics: United States, average annual, 2005–2007—Con.
All current Nondaily Daily Selected characteristic smokers smokers smokers
Men—Con. Percent who tried to quit1 (standard error)
Race: White, single race . . . . . . . . . . . . . . . . . . . . . . . . . . 41.1 (0.80) 50.2 (1.77) 38.8 (0.88) Black or African American, single race . . . . . . . . . . . . . 46.7 (2.09) 58.0 (3.71) 42.5 (2.29) American Indian or Alaska Native, single race . . . . . . . . 50.8 (6.05) 56.5 (14.14) 49.6 (6.95) Asian, single race . . . . . . . . . . . . . . . . . . . . . . . . . . 49.0 (3.53) 57.8 (5.63) 45.8 (4.30) Native Hawaiian or Other Pacific Islander, single race. . . . *51.5 (17.53) † 66.7 (17.46) Two or more races . . . . . . . . . . . . . . . . . . . . . . . . . 53.5 (5.85) 52.5 (12.12) 53.7 (6.50)
Black or African American, white . . . . . . . . . . . . . . . † – † American Indian or Alaska Native, white . . . . . . . . . . . 55.9 (7.84) 82.6 (10.38) 50.5 (8.93)
Hispanic or Latino origin and race: Hispanic or Latino . . . . . . . . . . . . . . . . . . . . . . . . . . 41.8 (1.79) 44.4 (2.81) 40.0 (2.17)
Mexican or Mexican American . . . . . . . . . . . . . . . . . 39.9 (2.23) 42.2 (3.20) 37.9 (2.83) Not Hispanic or Latino . . . . . . . . . . . . . . . . . . . . . . . 42.4 (0.79) 53.9 (1.80) 39.8 (0.84)
White, single race . . . . . . . . . . . . . . . . . . . . . . . . 41.2 (0.88) 52.6 (2.20) 38.9 (0.94) Black or African American, single race . . . . . . . . . . . . 46.6 (2.12) 57.4 (3.79) 42.6 (2.32)
Education: Less than high school graduate . . . . . . . . . . . . . . . . . 38.9 (1.56) 48.5 (3.25) 36.5 (1.76) GED diploma4 . . . . . . . . . . . . . . . . . . . . . . . . . . . . 39.1 (2.78) 60.9 (8.55) 37.0 (2.94) High school graduate . . . . . . . . . . . . . . . . . . . . . . . . 40.9 (1.21) 52.3 (2.85) 38.3 (1.33) Some college—no degree . . . . . . . . . . . . . . . . . . . . . 47.5 (1.71) 57.2 (3.43) 44.3 (1.81) Associate of arts degree . . . . . . . . . . . . . . . . . . . . . . 44.6 (2.12) 54.0 (4.88) 42.3 (2.41) Bachelor of arts, science degree . . . . . . . . . . . . . . . . . 44.9 (2.19) 46.1 (3.83) 44.3 (2.75) Masters, doctorate, medical degree . . . . . . . . . . . . . . . 44.3 (3.93) 44.6 (6.24) 44.1 (4.84)
Poverty status:5
Below poverty level . . . . . . . . . . . . . . . . . . . . . . . . . 41.1 (1.74) 53.4 (3.45) 37.6 (1.87) ≥1 and <2 times poverty level . . . . . . . . . . . . . . . . . . 40.0 (1.53) 48.4 (3.18) 37.9 (1.70) ≥2 and <4 times poverty level . . . . . . . . . . . . . . . . . . 41.6 (1.37) 53.1 (2.90) 38.7 (1.50) 4 times poverty level or more . . . . . . . . . . . . . . . . . . . 45.5 (1.37) 51.7 (2.98) 43.6 (1.52)
Marital status: Never married . . . . . . . . . . . . . . . . . . . . . . . . . . . . 44.8 (1.46) 50.8 (2.65) 42.5 (1.70) Married . . . . . . . . . . . . . . . . . . . . . . . . . . . . . . . . 41.8 (1.06) 53.8 (2.18) 38.8 (1.17) Cohabiting . . . . . . . . . . . . . . . . . . . . . . . . . . . . . . 43.6 (2.23) 49.3 (4.65) 42.2 (2.47) Divorced or separated . . . . . . . . . . . . . . . . . . . . . . . 40.0 (1.37) 50.0 (3.36) 37.9 (1.50) Widowed . . . . . . . . . . . . . . . . . . . . . . . . . . . . . . . 33.9 (3.59) 46.4 (10.57) 32.2 (3.88)
Geographic region: Northeast . . . . . . . . . . . . . . . . . . . . . . . . . . . . . . . 49.2 (1.82) 60.5 (3.61) 45.8 (1.94) Midwest . . . . . . . . . . . . . . . . . . . . . . . . . . . . . . . . 42.6 (1.36) 52.5 (2.96) 40.2 (1.58) South . . . . . . . . . . . . . . . . . . . . . . . . . . . . . . . . . 40.0 (1.22) 50.0 (2.52) 37.7 (1.30) West . . . . . . . . . . . . . . . . . . . . . . . . . . . . . . . . . . 41.1 (1.62) 47.1 (3.21) 39.0 (1.70)
Women
Ages 18 years and over (crude)2 . . . . . . . . . . . . . . . . . . 44.9 (0.73) 59.7 (1.55) 41.4 (0.82) Ages 18 years and over (age-adjusted)2,3 . . . . . . . . . . . . 43.7 (0.72) 59.1 (1.60) 40.2 (0.81)
Age: 18–24 years . . . . . . . . . . . . . . . . . . . . . . . . . . . . . 55.1 (2.18) 64.5 (3.85) 51.7 (2.59) 25–44 years . . . . . . . . . . . . . . . . . . . . . . . . . . . . . 46.3 (1.12) 60.7 (2.28) 42.8 (1.25) 45–64 years . . . . . . . . . . . . . . . . . . . . . . . . . . . . . 42.4 (1.14) 56.7 (2.72) 39.6 (1.25) 65–74 years . . . . . . . . . . . . . . . . . . . . . . . . . . . . . 31.6 (2.24) 55.2 (6.34) 27.1 (2.27) 75 years and over . . . . . . . . . . . . . . . . . . . . . . . . . . 30.6 (3.72) 52.8 (8.61) 26.1 (3.94)
Race: White, single race . . . . . . . . . . . . . . . . . . . . . . . . . . 44.3 (0.81) 60.2 (1.75) 40.6 (0.92) Black or African American, single race . . . . . . . . . . . . . 48.0 (1.58) 58.3 (3.61) 45.1 (1.76) American Indian or Alaska Native, single race . . . . . . . . 42.4 (6.13) 55.4 (10.25) 31.2 (7.10) Asian, single race . . . . . . . . . . . . . . . . . . . . . . . . . . 50.4 (5.98) 60.5 (9.58) 47.2 (7.08) Native Hawaiian or Other Pacific Islander, single race. . . . *65.0 (23.91) – *65.0 (23.91) Two or more races . . . . . . . . . . . . . . . . . . . . . . . . . 52.9 (4.61) 57.7 (12.70) 52.0 (5.04)
Black or African American, white . . . . . . . . . . . . . . . 57.1 (11.69) *62.4 (26.42) 55.9 (13.20) American Indian or Alaska Native, white . . . . . . . . . . . 47.2 (6.81) *51.6 (18.98) 46.3 (7.45)
See footnotes at end of table.

Series 10, No. 245 [ Page 105
Table XI. Crude percentages (with standard errors) of current cigarette smokers 18 years of age and over who tried to quit smoking in the past year, by current smoking status and selected characteristics: United States, average annual, 2005–2007—Con.
All current Nondaily Daily Selected characteristic smokers smokers smokers
Women—Con. Percent who tried to quit1 (standard error)
Hispanic or Latino origin and race: Hispanic or Latino . . . . . . . . . . . . . . . . . . . . . . . . . . 50.7 (2.24) 57.0 (3.90) 47.2 (2.72)
Mexican or Mexican American . . . . . . . . . . . . . . . . . 49.3 (3.05) 57.9 (4.76) 43.4 (3.94) Not Hispanic or Latino . . . . . . . . . . . . . . . . . . . . . . . 44.5 (0.76) 60.1 (1.66) 41.0 (0.85)
White, single race . . . . . . . . . . . . . . . . . . . . . . . . 43.9 (0.86) 60.7 (1.90) 40.4 (0.97) Black or African American, single race . . . . . . . . . . . . 47.6 (1.59) 58.1 (3.65) 44.6 (1.78)
Education: Less than high school graduate . . . . . . . . . . . . . . . . . 40.9 (1.46) 64.4 (4.01) 37.2 (1.53) GED diploma4 . . . . . . . . . . . . . . . . . . . . . . . . . . . . 37.0 (2.85) 52.5 (7.77) 35.2 (3.06) High school graduate . . . . . . . . . . . . . . . . . . . . . . . . 41.5 (1.39) 59.2 (3.07) 38.2 (1.51) Some college—no degree . . . . . . . . . . . . . . . . . . . . . 52.7 (1.55) 61.3 (3.21) 50.4 (1.72) Associate of arts degree . . . . . . . . . . . . . . . . . . . . . . 46.0 (2.20) 54.4 (4.92) 43.7 (2.39) Bachelor of arts, science degree . . . . . . . . . . . . . . . . . 53.0 (2.24) 62.3 (3.55) 47.6 (2.86) Masters, doctorate, medical degree . . . . . . . . . . . . . . . 42.5 (3.56) 52.5 (6.05) 36.6 (4.20)
Poverty status:5
Below poverty level . . . . . . . . . . . . . . . . . . . . . . . . . 44.4 (1.34) 63.2 (3.10) 40.5 (1.49) ≥1 and <2 times poverty level . . . . . . . . . . . . . . . . . . 46.6 (1.56) 64.2 (3.27) 43.1 (1.76) ≥2 and <4 times poverty level . . . . . . . . . . . . . . . . . . 43.0 (1.44) 59.7 (2.76) 39.2 (1.64) 4 times poverty level or more . . . . . . . . . . . . . . . . . . . 46.3 (1.47) 55.5 (2.99) 43.4 (1.69)
Marital status: Never married . . . . . . . . . . . . . . . . . . . . . . . . . . . . 49.3 (1.57) 60.3 (2.91) 45.3 (1.89) Married . . . . . . . . . . . . . . . . . . . . . . . . . . . . . . . . 44.3 (1.17) 59.7 (2.52) 40.9 (1.30) Cohabiting . . . . . . . . . . . . . . . . . . . . . . . . . . . . . . 43.3 (2.32) 50.4 (5.36) 41.9 (2.57) Divorced or separated . . . . . . . . . . . . . . . . . . . . . . . 44.5 (1.37) 64.4 (2.94) 40.5 (1.50) Widowed . . . . . . . . . . . . . . . . . . . . . . . . . . . . . . . 39.9 (2.19) 60.9 (5.61) 35.9 (2.26)
Geographic region: Northeast . . . . . . . . . . . . . . . . . . . . . . . . . . . . . . . 46.6 (1.69) 62.7 (3.61) 42.8 (1.93) Midwest . . . . . . . . . . . . . . . . . . . . . . . . . . . . . . . . 47.7 (1.41) 61.8 (2.83) 44.2 (1.75) South . . . . . . . . . . . . . . . . . . . . . . . . . . . . . . . . . 41.9 (1.14) 60.5 (2.68) 38.2 (1.20) West . . . . . . . . . . . . . . . . . . . . . . . . . . . . . . . . . . 45.6 (1.86) 53.2 (3.58) 43.0 (2.03)
† Estimates with a relative standard error greater than 50% are indicated with a dagger, but are not shown.
* Estimates preceded by an asterisk have a relative standard error of greater than 30% and less than or equal to 50%. These should be interpreted with caution as they do not meet the standard of reliability or precision.
– Quantity zero. 1Percentage of cigarette smokers who had stopped smoking for more than one day in the past year because they were trying to quit. 2Persons of other races and unknown race and ethnicity, unknown education, unknown poverty status, and unknown marital status are included in the total. 3Estimates are age adjusted using the projected 2000 U.S. population as the standard population and using three age groups: 18–44 years, 45–64 years, and 65 years and over. 4GED is General Educational Development high school equivalency diploma. 5Poverty status is based on family income and family size using the U.S. Census Bureau poverty thresholds for 2004, 2005, and 2006.
NOTES: For age-adjusted percentages, refer to Table 4.5. Denominator for each percentage excludes current smokers for whom information on quit attempts was unknown. See Appendix II for definitions of terms. See Appendix III for health behavior questions.
DATA SOURCE: National Health Interview Survey, 2005–2007. Estimates are based on household interviews of a sample of the civilian noninstitutionalized population.

Page 106 [ Series 10, No. 245
Table XII. Crude percent distributions (with standard errors) of leisure-time physical activity status for adults 18 years of age and over and crude percentages (with standard errors) of adults 18 years of age and over who engaged in some but less than regular and regular leisure-time physical activity, by selected characteristics: United States, average annual, 2005–2007
Leisure-time physical activity status1
At least some2 Some, less Selected characteristic Total Inactive (some+regular) than regular Regular
Both sexes Percent distribution (standard error) Percent (standard error)
Ages 18 years and over (crude)3 . . . . . . . . . . . . . . . . . . 100.00 39.7 (0.40) 60.3 (0.40) 29.7 (0.27) 30.6 (0.29) Ages 18 years and over (age-adjusted)3,4 . . . . . . . . . . . . 100.00 39.7 (0.40) 60.3 (0.40) 29.6 (0.27) 30.7 (0.29)
Age: 18–24 years . . . . . . . . . . . . . . . . . . . . . . . . . . . . . 100.00 33.7 (0.79) 66.3 (0.79) 28.7 (0.67) 37.5 (0.76) 25–44 years . . . . . . . . . . . . . . . . . . . . . . . . . . . . . 100.00 35.5 (0.51) 64.5 (0.51) 31.5 (0.38) 33.0 (0.40) 45–64 years . . . . . . . . . . . . . . . . . . . . . . . . . . . . . 100.00 39.9 (0.50) 60.1 (0.50) 30.6 (0.39) 29.5 (0.43) 65–74 years . . . . . . . . . . . . . . . . . . . . . . . . . . . . . 100.00 48.0 (0.82) 52.0 (0.82) 26.6 (0.64) 25.4 (0.67) 75 years and over . . . . . . . . . . . . . . . . . . . . . . . . . . 100.00 60.4 (0.80) 39.6 (0.80) 22.3 (0.62) 17.4 (0.60)
Race: White, single race . . . . . . . . . . . . . . . . . . . . . . . . . . 100.00 38.3 (0.43) 61.7 (0.43) 30.0 (0.30) 31.6 (0.32) Black or African American, single race . . . . . . . . . . . . . 100.00 50.3 (0.77) 49.7 (0.77) 26.0 (0.55) 23.8 (0.57) American Indian or Alaska Native, single race . . . . . . . . 100.00 38.1 (2.36) 61.9 (2.36) 34.7 (2.27) 27.2 (2.40) Asian, single race . . . . . . . . . . . . . . . . . . . . . . . . . . 100.00 38.9 (1.07) 61.1 (1.07) 31.4 (1.00) 29.7 (0.97) Native Hawaiian or Other Pacific Islander, single race. . . . 100.00 42.8 (7.19) 57.2 (7.19) 25.1 (5.08) 32.0 (6.18) Two or more races . . . . . . . . . . . . . . . . . . . . . . . . . 100.00 34.9 (2.04) 65.1 (2.04) 33.7 (1.94) 31.4 (1.89)
Black or African American, white . . . . . . . . . . . . . . . 100.00 39.4 (4.72) 60.6 (4.72) 28.2 (4.25) 32.4 (4.74) American Indian or Alaska Native, white . . . . . . . . . . . 100.00 37.6 (2.93) 62.4 (2.93) 35.1 (2.97) 27.3 (2.57)
Hispanic or Latino origin and race: Hispanic or Latino . . . . . . . . . . . . . . . . . . . . . . . . . . 100.00 51.7 (0.64) 48.3 (0.64) 25.0 (0.52) 23.3 (0.51)
Mexican or Mexican American . . . . . . . . . . . . . . . . . 100.00 51.1 (0.80) 48.9 (0.80) 25.7 (0.66) 23.2 (0.66) Not Hispanic or Latino . . . . . . . . . . . . . . . . . . . . . . . 100.00 37.9 (0.43) 62.1 (0.43) 30.4 (0.30) 31.7 (0.32)
White, single race . . . . . . . . . . . . . . . . . . . . . . . . 100.00 35.9 (0.47) 64.1 (0.47) 31.0 (0.34) 33.1 (0.36) Black or African American, single race . . . . . . . . . . . . 100.00 50.2 (0.79) 49.8 (0.79) 26.1 (0.57) 23.6 (0.58)
Education: Less than high school graduate . . . . . . . . . . . . . . . . . 100.00 61.6 (0.63) 38.4 (0.63) 21.2 (0.51) 17.2 (0.46) GED diploma5 . . . . . . . . . . . . . . . . . . . . . . . . . . . . 100.00 51.6 (1.42) 48.4 (1.42) 26.6 (1.16) 21.8 (1.19) High school graduate . . . . . . . . . . . . . . . . . . . . . . . . 100.00 47.7 (0.62) 52.3 (0.62) 28.7 (0.49) 23.5 (0.43) Some college—no degree . . . . . . . . . . . . . . . . . . . . . 100.00 33.9 (0.59) 66.1 (0.59) 32.6 (0.52) 33.5 (0.55) Associate of arts degree . . . . . . . . . . . . . . . . . . . . . . 100.00 32.6 (0.70) 67.4 (0.70) 33.1 (0.68) 34.4 (0.72) Bachelor of arts, science degree . . . . . . . . . . . . . . . . . 100.00 24.2 (0.54) 75.8 (0.54) 32.9 (0.57) 42.9 (0.61) Masters, doctorate, medical degree . . . . . . . . . . . . . . . 100.00 19.1 (0.61) 80.9 (0.61) 34.3 (0.72) 46.6 (0.75)
Poverty status:6
Below poverty level . . . . . . . . . . . . . . . . . . . . . . . . . 100.00 55.8 (0.88) 44.2 (0.88) 23.1 (0.55) 21.1 (0.70) ≥1 and <2 times poverty level . . . . . . . . . . . . . . . . . . 100.00 51.8 (0.64) 48.2 (0.64) 25.6 (0.52) 22.6 (0.52) ≥2 and <4 times poverty level . . . . . . . . . . . . . . . . . . 100.00 41.1 (0.54) 58.9 (0.54) 30.3 (0.42) 28.6 (0.42) 4 times poverty level or more . . . . . . . . . . . . . . . . . . . 100.00 27.6 (0.45) 72.4 (0.45) 33.2 (0.41) 39.1 (0.41)
Marital status: Never married . . . . . . . . . . . . . . . . . . . . . . . . . . . . 100.00 35.5 (0.64) 64.5 (0.64) 28.4 (0.51) 36.1 (0.57) Married . . . . . . . . . . . . . . . . . . . . . . . . . . . . . . . . 100.00 38.1 (0.45) 61.9 (0.45) 31.2 (0.35) 30.7 (0.36) Cohabiting . . . . . . . . . . . . . . . . . . . . . . . . . . . . . . 100.00 38.3 (0.97) 61.7 (0.97) 30.4 (0.92) 31.3 (0.90) Divorced or separated . . . . . . . . . . . . . . . . . . . . . . . 100.00 44.2 (0.65) 55.8 (0.65) 28.2 (0.52) 27.6 (0.52) Widowed . . . . . . . . . . . . . . . . . . . . . . . . . . . . . . . 100.00 60.1 (0.80) 39.9 (0.80) 23.0 (0.64) 16.9 (0.57)
Geographic region: Northeast . . . . . . . . . . . . . . . . . . . . . . . . . . . . . . . 100.00 37.9 (0.75) 62.1 (0.75) 30.3 (0.63) 31.9 (0.61) Midwest . . . . . . . . . . . . . . . . . . . . . . . . . . . . . . . . 100.00 34.5 (0.92) 65.5 (0.92) 33.5 (0.61) 31.9 (0.66) South . . . . . . . . . . . . . . . . . . . . . . . . . . . . . . . . . 100.00 46.1 (0.71) 53.9 (0.71) 26.5 (0.44) 27.4 (0.48) West . . . . . . . . . . . . . . . . . . . . . . . . . . . . . . . . . . 100.00 36.1 (0.69) 63.9 (0.69) 30.3 (0.53) 33.6 (0.58)
Men
Ages 18 years and over (crude)3 . . . . . . . . . . . . . . . . . . 100.00 38.0 (0.47) 62.0 (0.47) 29.4 (0.37) 32.7 (0.38) Ages 18 years and over (age-adjusted)3,4 . . . . . . . . . . . . 100.00 38.1 (0.47) 61.9 (0.47) 29.3 (0.37) 32.6 (0.38)
Age: 18–24 years . . . . . . . . . . . . . . . . . . . . . . . . . . . . . 100.00 30.8 (1.05) 69.2 (1.05) 26.9 (0.99) 42.3 (1.12) 25–44 years . . . . . . . . . . . . . . . . . . . . . . . . . . . . . 100.00 34.4 (0.65) 65.6 (0.65) 31.6 (0.54) 34.0 (0.54) 45–64 years . . . . . . . . . . . . . . . . . . . . . . . . . . . . . 100.00 40.2 (0.63) 59.8 (0.63) 29.5 (0.54) 30.4 (0.56) 65–74 years . . . . . . . . . . . . . . . . . . . . . . . . . . . . . 100.00 45.5 (1.12) 54.5 (1.12) 26.3 (0.93) 28.2 (0.96) 75 years and over . . . . . . . . . . . . . . . . . . . . . . . . . . 100.00 53.1 (1.23) 46.9 (1.23) 24.4 (1.01) 22.5 (0.99)
See footnotes at end of table.

Series 10, No. 245 [ Page 107
Table XII. Crude percent distributions (with standard errors) of leisure-time physical activity status for adults 18 years of age and over and crude percentages (with standard errors) of adults 18 years of age and over who engaged in some but less than regular and regular leisure-time physical activity, by selected characteristics: United States, average annual, 2005–2007—Con.
Leisure-time physical activity status1
At least some2 Some, less Selected characteristic Total Inactive (some+regular) than regular Regular
Men—Con. Percent distribution (standard error) Percent (standard error)
Race: White, single race . . . . . . . . . . . . . . . . . . . . . . . . . . 100.00 37.2 (0.51) 62.8 (0.51) 29.6 (0.41) 33.2 (0.42) Black or African American, single race . . . . . . . . . . . . . 100.00 45.3 (1.06) 54.7 (1.06) 25.3 (0.84) 29.5 (0.95) American Indian or Alaska Native, single race . . . . . . . . 100.00 38.6 (3.69) 61.4 (3.69) 32.6 (3.39) 28.8 (3.80) Asian, single race . . . . . . . . . . . . . . . . . . . . . . . . . . 100.00 35.1 (1.42) 64.9 (1.42) 32.1 (1.43) 32.9 (1.42) Native Hawaiian or Other Pacific Islander, single race. . . . 100.00 46.9 (10.17) 53.1 (10.17) 29.8 (8.79) 23.3 (6.68) Two or more races . . . . . . . . . . . . . . . . . . . . . . . . . 100.00 34.1 (2.97) 65.9 (2.97) 34.4 (3.02) 31.6 (2.67)
Black or African American, white . . . . . . . . . . . . . . . 100.00 38.9 (8.04) 61.1 (8.04) *17.9 (5.78) 43.1 (8.07) American Indian or Alaska Native, white . . . . . . . . . . . 100.00 36.3 (4.08) 63.7 (4.08) 36.9 (4.30) 26.8 (3.52)
Hispanic or Latino origin and race: Hispanic or Latino . . . . . . . . . . . . . . . . . . . . . . . . . . 100.00 49.6 (0.85) 50.4 (0.85) 25.3 (0.74) 25.2 (0.71)
Mexican or Mexican American . . . . . . . . . . . . . . . . . 100.00 50.2 (1.07) 49.8 (1.07) 25.4 (0.92) 24.4 (0.84) Not Hispanic or Latino . . . . . . . . . . . . . . . . . . . . . . . 100.00 36.1 (0.51) 63.9 (0.51) 30.0 (0.41) 33.9 (0.42)
White, single race . . . . . . . . . . . . . . . . . . . . . . . . 100.00 34.7 (0.56) 65.3 (0.56) 30.5 (0.47) 34.8 (0.47) Black or African American, single race . . . . . . . . . . . . 100.00 45.4 (1.08) 54.6 (1.08) 25.5 (0.86) 29.1 (0.97)
Education: Less than high school graduate . . . . . . . . . . . . . . . . . 100.00 58.9 (0.90) 41.1 (0.90) 21.2 (0.71) 19.9 (0.74) GED diploma5 . . . . . . . . . . . . . . . . . . . . . . . . . . . . 100.00 46.1 (2.08) 53.9 (2.08) 27.8 (1.75) 26.1 (1.97) High school graduate . . . . . . . . . . . . . . . . . . . . . . . . 100.00 46.2 (0.81) 53.8 (0.81) 28.4 (0.70) 25.4 (0.63) Some college—no degree . . . . . . . . . . . . . . . . . . . . . 100.00 32.4 (0.81) 67.6 (0.81) 32.0 (0.77) 35.5 (0.85) Associate of arts degree . . . . . . . . . . . . . . . . . . . . . . 100.00 31.3 (1.04) 68.7 (1.04) 31.6 (1.04) 37.1 (1.06) Bachelor of arts, science degree . . . . . . . . . . . . . . . . . 100.00 22.5 (0.70) 77.5 (0.70) 32.9 (0.81) 44.5 (0.82) Masters, doctorate, medical degree . . . . . . . . . . . . . . . 100.00 18.1 (0.81) 81.9 (0.81) 34.4 (1.07) 47.5 (1.07)
Poverty status:6
Below poverty level . . . . . . . . . . . . . . . . . . . . . . . . . 100.00 52.7 (1.21) 47.3 (1.21) 22.9 (0.86) 24.4 (1.13) ≥1 and <2 times poverty level . . . . . . . . . . . . . . . . . . 100.00 50.5 (0.98) 49.5 (0.98) 24.8 (0.78) 24.8 (0.82) ≥2 and <4 times poverty level . . . . . . . . . . . . . . . . . . 100.00 40.2 (0.71) 59.8 (0.71) 29.7 (0.59) 30.0 (0.59) 4 times poverty level or more . . . . . . . . . . . . . . . . . . . 100.00 27.1 (0.55) 72.9 (0.55) 32.7 (0.56) 40.2 (0.55)
Marital status: Never married . . . . . . . . . . . . . . . . . . . . . . . . . . . . 100.00 33.2 (0.78) 66.8 (0.78) 26.9 (0.69) 39.9 (0.78) Married . . . . . . . . . . . . . . . . . . . . . . . . . . . . . . . . 100.00 38.2 (0.56) 61.8 (0.56) 31.2 (0.48) 30.6 (0.47) Cohabiting . . . . . . . . . . . . . . . . . . . . . . . . . . . . . . 100.00 37.9 (1.36) 62.1 (1.36) 29.3 (1.24) 32.8 (1.29) Divorced or separated . . . . . . . . . . . . . . . . . . . . . . . 100.00 42.5 (0.92) 57.5 (0.92) 25.6 (0.78) 31.9 (0.83) Widowed . . . . . . . . . . . . . . . . . . . . . . . . . . . . . . . 100.00 55.8 (1.67) 44.2 (1.67) 23.5 (1.32) 20.8 (1.30)
Geographic region: Northeast . . . . . . . . . . . . . . . . . . . . . . . . . . . . . . . 100.00 34.7 (0.92) 65.3 (0.92) 31.0 (0.84) 34.3 (0.94) Midwest . . . . . . . . . . . . . . . . . . . . . . . . . . . . . . . . 100.00 33.3 (1.12) 66.7 (1.12) 32.8 (0.91) 33.9 (0.82) South . . . . . . . . . . . . . . . . . . . . . . . . . . . . . . . . . 100.00 44.3 (0.81) 55.7 (0.81) 25.9 (0.56) 29.8 (0.62) West . . . . . . . . . . . . . . . . . . . . . . . . . . . . . . . . . . 100.00 35.1 (0.84) 64.9 (0.84) 30.0 (0.69) 35.0 (0.75)
Women
Ages 18 years and over (crude)3 . . . . . . . . . . . . . . . . . . 100.00 41.3 (0.45) 58.7 (0.45) 30.0 (0.33) 28.7 (0.35) Ages 18 years and over (age-adjusted)3,4 . . . . . . . . . . . . 100.00 41.1 (0.45) 58.9 (0.45) 30.0 (0.33) 28.9 (0.35)
Age: 18–24 years . . . . . . . . . . . . . . . . . . . . . . . . . . . . . 100.00 36.6 (1.03) 63.4 (1.03) 30.5 (0.91) 32.9 (0.95) 25–44 years . . . . . . . . . . . . . . . . . . . . . . . . . . . . . 100.00 36.6 (0.57) 63.4 (0.57) 31.3 (0.49) 32.1 (0.51) 45–64 years . . . . . . . . . . . . . . . . . . . . . . . . . . . . . 100.00 39.7 (0.62) 60.3 (0.62) 31.6 (0.50) 28.7 (0.53) 65–74 years . . . . . . . . . . . . . . . . . . . . . . . . . . . . . 100.00 50.0 (1.01) 50.0 (1.01) 27.0 (0.83) 23.0 (0.84) 75 years and over . . . . . . . . . . . . . . . . . . . . . . . . . . 100.00 65.0 (0.91) 35.0 (0.91) 20.9 (0.74) 14.0 (0.68)
Race: White, single race . . . . . . . . . . . . . . . . . . . . . . . . . . 100.00 39.4 (0.48) 60.6 (0.48) 30.4 (0.35) 30.2 (0.39) Black or African American, single race . . . . . . . . . . . . . 100.00 54.3 (0.88) 45.7 (0.88) 26.5 (0.69) 19.2 (0.60) American Indian or Alaska Native, single race . . . . . . . . 100.00 37.5 (3.16) 62.5 (3.16) 36.8 (2.83) 25.7 (2.81) Asian, single race . . . . . . . . . . . . . . . . . . . . . . . . . . 100.00 42.5 (1.50) 57.5 (1.50) 30.8 (1.35) 26.7 (1.28) Native Hawaiian or Other Pacific Islander, single race. . . . 100.00 38.2 (7.92) 61.8 (7.92) *19.7 (6.56) 42.1 (9.56) Two or more races . . . . . . . . . . . . . . . . . . . . . . . . . 100.00 35.8 (2.47) 64.2 (2.47) 33.0 (2.25) 31.2 (2.59)
Black or African American, white . . . . . . . . . . . . . . . 100.00 39.8 (5.96) 60.2 (5.96) 35.2 (5.71) 25.0 (5.71) American Indian or Alaska Native, white . . . . . . . . . . . 100.00 39.1 (3.70) 60.9 (3.70) 32.9 (3.70) 27.9 (3.60)
See footnotes at end of table.

Page 108 [ Series 10, No. 245
Table XII. Crude percent distributions (with standard errors) of leisure-time physical activity status for adults 18 years of age and over and crude percentages (with standard errors) of adults 18 years of age and over who engaged in some but less than regular and regular leisure-time physical activity, by selected characteristics: United States, average annual, 2005–2007—Con.
Leisure-time physical activity status1
At least some2 Some, less Selected characteristic Total Inactive (some+regular) than regular Regular
Women—Con. Percent distribution (standard error) Percent (standard error)
Hispanic or Latino origin and race: Hispanic or Latino . . . . . . . . . . . . . . . . . . . . . . . . . . 100.00 53.9 (0.79) 46.1 (0.79) 24.8 (0.65) 21.3 (0.65)
Mexican or Mexican American . . . . . . . . . . . . . . . . . 100.00 52.1 (1.00) 47.9 (1.00) 26.1 (0.84) 21.8 (0.89) Not Hispanic or Latino . . . . . . . . . . . . . . . . . . . . . . . 100.00 39.6 (0.49) 60.4 (0.49) 30.7 (0.35) 29.7 (0.38)
White, single race . . . . . . . . . . . . . . . . . . . . . . . . 100.00 37.0 (0.53) 63.0 (0.53) 31.4 (0.39) 31.6 (0.44) Black or African American, single race . . . . . . . . . . . . 100.00 54.1 (0.91) 45.9 (0.91) 26.6 (0.71) 19.2 (0.61)
Education: Less than high school graduate . . . . . . . . . . . . . . . . . 100.00 64.2 (0.73) 35.8 (0.73) 21.3 (0.61) 14.5 (0.50) GED diploma5 . . . . . . . . . . . . . . . . . . . . . . . . . . . . 100.00 57.4 (1.82) 42.6 (1.82) 25.3 (1.48) 17.3 (1.35) High school graduate . . . . . . . . . . . . . . . . . . . . . . . . 100.00 49.1 (0.70) 50.9 (0.70) 29.1 (0.57) 21.8 (0.55) Some college—no degree . . . . . . . . . . . . . . . . . . . . . 100.00 35.2 (0.72) 64.8 (0.72) 33.1 (0.69) 31.7 (0.66) Associate of arts degree . . . . . . . . . . . . . . . . . . . . . . 100.00 33.5 (0.89) 66.5 (0.89) 34.2 (0.88) 32.3 (0.91) Bachelor of arts, science degree . . . . . . . . . . . . . . . . . 100.00 25.9 (0.72) 74.1 (0.72) 32.9 (0.74) 41.2 (0.79) Masters, doctorate, medical degree . . . . . . . . . . . . . . . 100.00 20.1 (0.85) 79.9 (0.85) 34.2 (0.95) 45.7 (1.03)
Poverty status:6
Below poverty level . . . . . . . . . . . . . . . . . . . . . . . . . 100.00 58.0 (0.92) 42.0 (0.92) 23.3 (0.68) 18.8 (0.67) ≥1 and <2 times poverty level . . . . . . . . . . . . . . . . . . 100.00 52.9 (0.77) 47.1 (0.77) 26.4 (0.66) 20.7 (0.57) ≥2 and <4 times poverty level . . . . . . . . . . . . . . . . . . 100.00 41.9 (0.67) 58.1 (0.67) 30.9 (0.53) 27.2 (0.56) 4 times poverty level or more . . . . . . . . . . . . . . . . . . . 100.00 28.1 (0.58) 71.9 (0.58) 33.8 (0.55) 38.0 (0.57)
Marital status: Never married . . . . . . . . . . . . . . . . . . . . . . . . . . . . 100.00 38.3 (0.87) 61.7 (0.87) 30.2 (0.73) 31.5 (0.76) Married . . . . . . . . . . . . . . . . . . . . . . . . . . . . . . . . 100.00 38.0 (0.53) 62.0 (0.53) 31.2 (0.44) 30.8 (0.47) Cohabiting . . . . . . . . . . . . . . . . . . . . . . . . . . . . . . 100.00 38.7 (1.28) 61.3 (1.28) 31.6 (1.28) 29.7 (1.22) Divorced or separated . . . . . . . . . . . . . . . . . . . . . . . 100.00 45.4 (0.78) 54.6 (0.78) 29.9 (0.66) 24.7 (0.61) Widowed . . . . . . . . . . . . . . . . . . . . . . . . . . . . . . . 100.00 61.2 (0.88) 38.8 (0.88) 22.9 (0.70) 16.0 (0.61)
Geographic region: Northeast . . . . . . . . . . . . . . . . . . . . . . . . . . . . . . . 100.00 40.7 (0.93) 59.3 (0.93) 29.6 (0.78) 29.7 (0.75) Midwest . . . . . . . . . . . . . . . . . . . . . . . . . . . . . . . . 100.00 35.7 (0.92) 64.3 (0.92) 34.2 (0.63) 30.1 (0.78) South . . . . . . . . . . . . . . . . . . . . . . . . . . . . . . . . . 100.00 47.7 (0.82) 52.3 (0.82) 27.1 (0.55) 25.2 (0.57) West . . . . . . . . . . . . . . . . . . . . . . . . . . . . . . . . . . 100.00 37.0 (0.77) 63.0 (0.77) 30.7 (0.66) 32.2 (0.71)
* Estimates preceded by an asterisk have a relative standard error of greater than 30% and less than or equal to 50%. These should be interpreted with caution as they do not meet the standard of reliability or precision. 1Questions related to leisure-time physical activity were phrased in terms of current behavior and lack a specific reference period. ‘‘Inactive’’ is no light-moderate or vigorous leisure-time physical activity lasting at least 10 minutes; ‘‘At least some’’ is some light-moderate or vigorous leisure-time physical activity lasting at least 10 minutes, regardless of the frequency or duration of the activity; ‘‘Some, less than regular’’ is some light-moderate or vigorous leisure-time physical activity lasting at least 10 minutes but the activity did not meet the definition for regular leisure-time physical activity; ‘‘Regular’’ is vigorous leisure-time physical activity at least three times per week lasting at least 20 minutes each time OR light-moderate leisure-time physical activity at least five times per week lasting at least 30 minutes each time OR both. 2Any vigorous or light-moderate leisure-time physical activity, regardless of frequency or duration. This category, which is the sum of the categories ‘‘Some activity’’ and ‘‘Regular actvity,’’ corresponds to the category of the same name shown in earlier editions of this report (1997–1998, 1999–2001, and 2002–2004) with one small difference. In the earlier reports, adults for whom duration information was missing were classified as having engaged in activity. Beginning with the current report, these adults were excluded from the denominator when calculating percentages in order to be consistent with other published estimates. 3Persons of other races and unknown race and ethnicity, unknown education, unknown poverty status, and unknown marital status are included in the total. 4Estimates are age adjusted using the projected 2000 U.S. population as the standard population and using three age groups: 18–44 years, 45–64 years, and 65 years and over. 5GED is General Educational Development high school equivalency diploma. 6Poverty status is based on family income and family size using the U.S. Census Bureau poverty thresholds for 2004, 2005, and 2006.
NOTES: For age-adjusted percentages, refer to Table 5.1. Denominator for each percentage excludes persons with unknown leisure-time physical activity status. See Appendix II for definitions of terms. See Appendix III for health behavior questions.
DATA SOURCE: National Health Interview Survey, 2005–2007. Estimates are based on household interviews of a sample of the civilian noninstitutionalized population.

Series 10, No. 245 [ Page 109
Table XIII. Crude percent distributions (with standard errors) of times per week engaged in light-moderate leisure-time physical activity for adults 18 years of age and over, by selected characteristics: United States, average annual, 2005–2007
Times per week engaged in light-moderate activity1
Selected characteristic Total None2 Less than 13 1–2 3–4 5 or more
Both sexes Percent distribution (standard error)
Ages 18 years and over (crude)4 . . . . . . . . . . . . . . . . . . 100.0 48.4 (0.40) 1.8 (0.06) 14.6 (0.21) 13.3 (0.18) 21.9 (0.26) Ages 18 years and over (age-adjusted)4,5 . . . . . . . . . . . . 100.0 48.4 (0.40) 1.8 (0.06) 14.6 (0.20) 13.3 (0.18) 21.9 (0.26)
Age: 18–24 years . . . . . . . . . . . . . . . . . . . . . . . . . . . . . 100.0 47.7 (0.86) 1.7 (0.20) 14.6 (0.50) 12.7 (0.50) 23.3 (0.67) 25–44 years . . . . . . . . . . . . . . . . . . . . . . . . . . . . . 100.0 45.6 (0.50) 2.0 (0.10) 16.6 (0.30) 14.7 (0.28) 21.1 (0.35) 45–64 years . . . . . . . . . . . . . . . . . . . . . . . . . . . . . 100.0 47.2 (0.50) 2.0 (0.12) 15.2 (0.32) 13.5 (0.28) 22.1 (0.37) 65–74 years . . . . . . . . . . . . . . . . . . . . . . . . . . . . . 100.0 52.8 (0.81) 1.3 (0.16) 10.4 (0.45) 12.1 (0.44) 23.4 (0.68) 75 years and over . . . . . . . . . . . . . . . . . . . . . . . . . . 100.0 63.5 (0.78) 1.0 (0.14) 7.5 (0.40) 7.6 (0.37) 20.3 (0.61)
Race: White, single race . . . . . . . . . . . . . . . . . . . . . . . . . . 100.0 46.7 (0.44) 1.8 (0.07) 15.2 (0.24) 13.7 (0.20) 22.6 (0.29) Black or African American, single race . . . . . . . . . . . . . 100.0 59.7 (0.72) 1.8 (0.19) 11.2 (0.39) 10.9 (0.36) 16.4 (0.48) American Indian or Alaska Native, single race . . . . . . . . 100.0 46.9 (2.53) 3.6 (0.95) 13.3 (1.76) 12.9 (1.60) 23.4 (2.21) Asian, single race . . . . . . . . . . . . . . . . . . . . . . . . . . 100.0 50.0 (1.09) 1.8 (0.34) 14.7 (0.70) 11.7 (0.80) 21.8 (1.01) Native Hawaiian or Other Pacific Islander, single race. . . . 100.0 54.1 (6.91) † *12.6 (4.30) 14.7 (4.10) 15.6 (4.64) Two or more races . . . . . . . . . . . . . . . . . . . . . . . . . 100.0 44.5 (2.07) 2.0 (0.51) 14.4 (1.36) 15.3 (1.64) 23.7 (1.88)
Black or African American, white . . . . . . . . . . . . . . . 100.0 48.6 (4.94) † 16.5 (3.58) 12.7 (3.53) 20.1 (3.81) American Indian or Alaska Native, white . . . . . . . . . . . 100.0 46.5 (2.92) *1.7 (0.72) 15.6 (2.13) 15.2 (2.28) 21.0 (2.27)
Hispanic or Latino origin and race: Hispanic or Latino . . . . . . . . . . . . . . . . . . . . . . . . . . 100.0 61.6 (0.62) 1.7 (0.17) 11.4 (0.37) 9.9 (0.33) 15.4 (0.42)
Mexican or Mexican American . . . . . . . . . . . . . . . . . 100.0 61.3 (0.76) 1.6 (0.22) 12.1 (0.49) 9.8 (0.39) 15.2 (0.51) Not Hispanic or Latino . . . . . . . . . . . . . . . . . . . . . . . 100.0 46.4 (0.43) 1.8 (0.07) 15.1 (0.23) 13.8 (0.20) 22.8 (0.28)
White, single race . . . . . . . . . . . . . . . . . . . . . . . . 100.0 44.1 (0.48) 1.8 (0.08) 15.8 (0.26) 14.3 (0.23) 23.9 (0.32) Black or African American, single race . . . . . . . . . . . . 100.0 59.6 (0.74) 1.8 (0.19) 11.3 (0.40) 10.9 (0.37) 16.4 (0.49)
Education: Less than high school graduate . . . . . . . . . . . . . . . . . 100.0 67.6 (0.61) 1.5 (0.15) 9.0 (0.33) 6.6 (0.28) 15.3 (0.43) GED diploma6 . . . . . . . . . . . . . . . . . . . . . . . . . . . . 100.0 58.2 (1.38) 1.9 (0.34) 11.8 (0.95) 9.5 (0.76) 18.6 (1.12) High school graduate . . . . . . . . . . . . . . . . . . . . . . . . 100.0 55.4 (0.60) 1.8 (0.13) 12.8 (0.33) 10.9 (0.30) 19.1 (0.41) Some college—no degree . . . . . . . . . . . . . . . . . . . . . 100.0 43.8 (0.62) 2.0 (0.15) 16.1 (0.42) 14.4 (0.39) 23.6 (0.47) Associate of arts degree . . . . . . . . . . . . . . . . . . . . . . 100.0 41.3 (0.75) 1.9 (0.19) 16.5 (0.55) 15.6 (0.52) 24.7 (0.63) Bachelor of arts, science degree . . . . . . . . . . . . . . . . . 100.0 34.7 (0.62) 1.8 (0.15) 18.7 (0.47) 18.4 (0.42) 26.5 (0.54) Masters, doctorate, medical degree . . . . . . . . . . . . . . . 100.0 30.1 (0.73) 2.0 (0.22) 19.5 (0.60) 19.7 (0.62) 28.7 (0.67)
Poverty status:7
Below poverty level . . . . . . . . . . . . . . . . . . . . . . . . . 100.0 63.1 (0.75) 1.3 (0.14) 9.6 (0.36) 8.2 (0.35) 17.9 (0.55) ≥1 and <2 times poverty level . . . . . . . . . . . . . . . . . . 100.0 58.6 (0.65) 1.6 (0.14) 11.5 (0.34) 9.3 (0.33) 19.0 (0.44) ≥2 and <4 times poverty level . . . . . . . . . . . . . . . . . . 100.0 49.5 (0.53) 1.9 (0.13) 14.0 (0.31) 13.1 (0.30) 21.5 (0.41) 4 times poverty level or more . . . . . . . . . . . . . . . . . . . 100.0 37.9 (0.47) 2.0 (0.11) 18.3 (0.36) 16.9 (0.29) 24.9 (0.37)
Marital status: Never married . . . . . . . . . . . . . . . . . . . . . . . . . . . . 100.0 48.3 (0.67) 1.8 (0.15) 14.7 (0.39) 12.9 (0.37) 22.3 (0.48) Married . . . . . . . . . . . . . . . . . . . . . . . . . . . . . . . . 100.0 46.1 (0.46) 1.9 (0.09) 15.6 (0.27) 14.2 (0.24) 22.1 (0.32) Cohabiting . . . . . . . . . . . . . . . . . . . . . . . . . . . . . . 100.0 47.0 (0.97) 2.0 (0.26) 15.0 (0.68) 12.5 (0.62) 23.4 (0.82) Divorced or separated . . . . . . . . . . . . . . . . . . . . . . . 100.0 51.8 (0.63) 1.8 (0.16) 13.2 (0.41) 12.7 (0.38) 20.5 (0.47) Widowed . . . . . . . . . . . . . . . . . . . . . . . . . . . . . . . 100.0 63.2 (0.79) 1.0 (0.12) 8.2 (0.39) 7.8 (0.34) 19.8 (0.66)
Geographic region: Northeast . . . . . . . . . . . . . . . . . . . . . . . . . . . . . . . 100.0 48.5 (0.88) 1.7 (0.17) 15.0 (0.46) 12.5 (0.38) 22.4 (0.53) Midwest . . . . . . . . . . . . . . . . . . . . . . . . . . . . . . . . 100.0 43.3 (0.91) 2.1 (0.14) 17.2 (0.51) 14.0 (0.42) 23.3 (0.61) South . . . . . . . . . . . . . . . . . . . . . . . . . . . . . . . . . 100.0 53.7 (0.67) 1.7 (0.10) 12.6 (0.30) 12.8 (0.29) 19.2 (0.43) West . . . . . . . . . . . . . . . . . . . . . . . . . . . . . . . . . . 100.0 44.7 (0.72) 1.8 (0.12) 15.0 (0.41) 14.0 (0.37) 24.4 (0.55)
Men
Ages 18 years and over (crude)4 . . . . . . . . . . . . . . . . . . 100.0 48.7 (0.49) 2.1 (0.10) 15.3 (0.29) 12.3 (0.25) 21.6 (0.34) Ages 18 years and over (age-adjusted)4,5 . . . . . . . . . . . . 100.0 48.9 (0.49) 2.1 (0.10) 15.1 (0.29) 12.3 (0.25) 21.6 (0.34)
Age: 18–24 years . . . . . . . . . . . . . . . . . . . . . . . . . . . . . 100.0 49.3 (1.21) 1.6 (0.29) 13.8 (0.73) 11.0 (0.71) 24.2 (0.96) 25–44 years . . . . . . . . . . . . . . . . . . . . . . . . . . . . . 100.0 46.9 (0.67) 2.4 (0.16) 17.2 (0.43) 13.4 (0.40) 20.0 (0.48) 45–64 years . . . . . . . . . . . . . . . . . . . . . . . . . . . . . 100.0 48.2 (0.65) 2.2 (0.18) 16.0 (0.45) 12.3 (0.40) 21.3 (0.50) 65–74 years . . . . . . . . . . . . . . . . . . . . . . . . . . . . . 100.0 51.4 (1.10) 1.9 (0.29) 10.7 (0.67) 12.2 (0.68) 23.8 (0.93) 75 years and over . . . . . . . . . . . . . . . . . . . . . . . . . . 100.0 57.5 (1.25) 1.3 (0.27) 8.8 (0.73) 8.6 (0.65) 23.8 (1.02)
See footnotes at end of table.

Page 110 [ Series 10, No. 245
Table XIII. Crude percent distributions (with standard errors) of times per week engaged in light-moderate leisure-time physical activity for adults 18 years of age and over, by selected characteristics: United States, average annual, 2005–2007—Con.
Times per week engaged in light-moderate activity1
Selected characteristic Total None2 Less than 13 1–2 3–4 5 or more
Men—Con. Percent distribution (standard error)
Race: White, single race . . . . . . . . . . . . . . . . . . . . . . . . . . 100.0 47.4 (0.55) 2.2 (0.11) 15.8 (0.33) 12.5 (0.28) 22.1 (0.37) Black or African American, single race . . . . . . . . . . . . . 100.0 58.3 (1.02) 2.0 (0.37) 10.9 (0.61) 11.0 (0.59) 17.7 (0.74) American Indian or Alaska Native, single race . . . . . . . . 100.0 49.3 (3.96) *4.6 (1.62) 11.8 (2.43) 9.4 (1.78) 24.9 (3.24) Asian, single race . . . . . . . . . . . . . . . . . . . . . . . . . . 100.0 50.1 (1.51) 1.4 (0.35) 16.6 (1.10) 11.6 (1.11) 20.3 (1.42) Native Hawaiian or Other Pacific Islander, single race. . . . 100.0 51.0 (10.08) † † *16.2 (6.18) *13.8 (5.51) Two or more races . . . . . . . . . . . . . . . . . . . . . . . . . 100.0 46.7 (3.02) *2.3 (0.76) 15.8 (2.12) 14.6 (2.33) 20.7 (2.28)
Black or African American, white . . . . . . . . . . . . . . . 100.0 54.4 (8.10) † *13.5 (5.29) † 22.9 (6.55) American Indian or Alaska Native, white . . . . . . . . . . . 100.0 46.6 (4.11) † 17.9 (3.34) 17.0 (3.52) 16.6 (2.73)
Hispanic or Latino origin and race: Hispanic or Latino . . . . . . . . . . . . . . . . . . . . . . . . . . 100.0 62.1 (0.85) 2.0 (0.27) 11.5 (0.56) 9.3 (0.50) 15.0 (0.61)
Mexican or Mexican American . . . . . . . . . . . . . . . . . 100.0 62.9 (1.04) 1.9 (0.33) 12.2 (0.76) 8.9 (0.57) 14.1 (0.70) Not Hispanic or Latino . . . . . . . . . . . . . . . . . . . . . . . 100.0 46.5 (0.53) 2.2 (0.11) 15.9 (0.32) 12.8 (0.27) 22.6 (0.37)
White, single race . . . . . . . . . . . . . . . . . . . . . . . . 100.0 44.6 (0.60) 2.2 (0.12) 16.6 (0.37) 13.1 (0.31) 23.5 (0.42) Black or African American, single race . . . . . . . . . . . . 100.0 58.2 (1.04) 2.0 (0.38) 11.0 (0.63) 11.1 (0.59) 17.6 (0.76)
Education: Less than high school graduate . . . . . . . . . . . . . . . . . 100.0 67.1 (0.88) 1.9 (0.23) 9.2 (0.50) 6.2 (0.38) 15.6 (0.66) GED diploma6 . . . . . . . . . . . . . . . . . . . . . . . . . . . . 100.0 54.5 (2.11) 2.2 (0.55) 14.0 (1.55) 9.3 (1.09) 20.0 (1.78) High school graduate . . . . . . . . . . . . . . . . . . . . . . . . 100.0 55.8 (0.81) 2.1 (0.21) 13.5 (0.49) 10.1 (0.46) 18.5 (0.56) Some college—no degree . . . . . . . . . . . . . . . . . . . . . 100.0 44.8 (0.88) 2.3 (0.23) 16.4 (0.64) 13.4 (0.59) 23.1 (0.71) Associate of arts degree . . . . . . . . . . . . . . . . . . . . . . 100.0 42.5 (1.16) 2.2 (0.30) 17.0 (0.86) 13.6 (0.73) 24.8 (0.96) Bachelor of arts, science degree . . . . . . . . . . . . . . . . . 100.0 35.2 (0.84) 2.1 (0.23) 19.5 (0.67) 17.1 (0.60) 26.1 (0.73) Masters, doctorate, medical degree . . . . . . . . . . . . . . . 100.0 30.8 (1.02) 2.5 (0.38) 20.6 (0.90) 18.5 (0.89) 27.6 (0.97)
Poverty status:7
Below poverty level . . . . . . . . . . . . . . . . . . . . . . . . . 100.0 62.9 (1.15) 1.6 (0.29) 9.6 (0.58) 7.8 (0.54) 18.2 (0.94) ≥1 and <2 times poverty level . . . . . . . . . . . . . . . . . . 100.0 59.0 (1.06) 1.6 (0.19) 11.6 (0.59) 8.5 (0.52) 19.2 (0.67) ≥2 and <4 times poverty level . . . . . . . . . . . . . . . . . . 100.0 50.7 (0.73) 2.3 (0.19) 14.0 (0.44) 12.0 (0.45) 20.9 (0.57) 4 times poverty level or more . . . . . . . . . . . . . . . . . . . 100.0 39.1 (0.61) 2.4 (0.16) 19.3 (0.52) 15.3 (0.39) 23.9 (0.50)
Marital status: Never married . . . . . . . . . . . . . . . . . . . . . . . . . . . . 100.0 49.1 (0.85) 1.8 (0.20) 14.3 (0.54) 11.9 (0.50) 22.8 (0.64) Married . . . . . . . . . . . . . . . . . . . . . . . . . . . . . . . . 100.0 47.5 (0.58) 2.3 (0.14) 16.4 (0.38) 12.7 (0.32) 21.0 (0.43) Cohabiting . . . . . . . . . . . . . . . . . . . . . . . . . . . . . . 100.0 48.1 (1.41) 2.4 (0.40) 14.1 (0.89) 11.8 (0.96) 23.6 (1.11) Divorced or separated . . . . . . . . . . . . . . . . . . . . . . . 100.0 52.2 (0.90) 2.1 (0.23) 12.8 (0.65) 12.2 (0.60) 20.7 (0.68) Widowed . . . . . . . . . . . . . . . . . . . . . . . . . . . . . . . 100.0 60.5 (1.62) 0.7 (0.21) 9.4 (0.94) 8.4 (0.81) 20.9 (1.31)
Geographic region: Northeast . . . . . . . . . . . . . . . . . . . . . . . . . . . . . . . 100.0 47.7 (1.07) 1.9 (0.22) 16.2 (0.68) 11.9 (0.57) 22.3 (0.76) Midwest . . . . . . . . . . . . . . . . . . . . . . . . . . . . . . . . 100.0 44.2 (1.20) 2.8 (0.24) 17.3 (0.74) 12.6 (0.56) 23.2 (0.79) South . . . . . . . . . . . . . . . . . . . . . . . . . . . . . . . . . 100.0 54.0 (0.79) 1.9 (0.17) 13.2 (0.42) 11.9 (0.41) 18.9 (0.55) West . . . . . . . . . . . . . . . . . . . . . . . . . . . . . . . . . . 100.0 45.7 (0.89) 2.0 (0.19) 15.8 (0.54) 13.0 (0.50) 23.6 (0.68)
Women
Ages 18 years and over (crude)4 . . . . . . . . . . . . . . . . . . 100.0 48.1 (0.44) 1.5 (0.08) 14.1 (0.23) 14.2 (0.23) 22.2 (0.31) Ages 18 years and over (age-adjusted)4,5 . . . . . . . . . . . . 100.0 47.9 (0.44) 1.5 (0.08) 14.2 (0.23) 14.3 (0.24) 22.2 (0.31)
Age: 18–24 years . . . . . . . . . . . . . . . . . . . . . . . . . . . . . 100.0 46.2 (1.08) 1.8 (0.27) 15.3 (0.69) 14.3 (0.70) 22.4 (0.84) 25–44 years . . . . . . . . . . . . . . . . . . . . . . . . . . . . . 100.0 44.2 (0.57) 1.6 (0.12) 16.0 (0.38) 16.0 (0.37) 22.2 (0.46) 45–64 years . . . . . . . . . . . . . . . . . . . . . . . . . . . . . 100.0 46.2 (0.61) 1.8 (0.15) 14.5 (0.39) 14.6 (0.37) 22.9 (0.46) 65–74 years . . . . . . . . . . . . . . . . . . . . . . . . . . . . . 100.0 53.9 (1.02) 0.9 (0.16) 10.1 (0.59) 12.1 (0.56) 23.0 (0.85) 75 years and over . . . . . . . . . . . . . . . . . . . . . . . . . . 100.0 67.4 (0.88) 0.8 (0.15) 6.7 (0.43) 6.9 (0.44) 18.1 (0.71)
Race: White, single race . . . . . . . . . . . . . . . . . . . . . . . . . . 100.0 46.1 (0.48) 1.5 (0.09) 14.5 (0.26) 14.8 (0.27) 23.1 (0.34) Black or African American, single race . . . . . . . . . . . . . 100.0 60.8 (0.86) 1.7 (0.17) 11.4 (0.48) 10.7 (0.45) 15.4 (0.59) American Indian or Alaska Native, single race . . . . . . . . 100.0 44.5 (3.30) *2.5 (1.00) 14.8 (2.11) 16.4 (2.62) 21.8 (2.72) Asian, single race . . . . . . . . . . . . . . . . . . . . . . . . . . 100.0 50.0 (1.51) 2.1 (0.57) 12.9 (0.88) 11.7 (0.97) 23.3 (1.26) Native Hawaiian or Other Pacific Islander, single race. . . . 100.0 57.7 (9.18) – *11.7 (4.55) *13.1 (5.64) *17.6 (7.65) Two or more races . . . . . . . . . . . . . . . . . . . . . . . . . 100.0 42.4 (2.58) *1.7 (0.67) 13.2 (1.73) 16.1 (1.99) 26.6 (2.72)
Black or African American, white . . . . . . . . . . . . . . . 100.0 44.8 (6.12) † 18.5 (4.74) 17.4 (5.12) 18.2 (4.78) American Indian or Alaska Native, white . . . . . . . . . . . 100.0 46.4 (3.76) † 12.9 (2.63) 13.2 (2.56) 26.1 (3.45)
See footnotes at end of table.

Series 10, No. 245 [ Page 111
Table XIII. Crude percent distributions (with standard errors) of times per week engaged in light-moderate leisure-time physical activity for adults 18 years of age and over, by selected characteristics: United States, average annual, 2005–2007—Con.
Times per week engaged in light-moderate activity1
Selected characteristic Total None2 Less than 13 1–2 3–4 5 or more
Women—Con. Percent distribution (standard error)
Hispanic or Latino origin and race: Hispanic or Latino . . . . . . . . . . . . . . . . . . . . . . . . . . 100.0 61.1 (0.76) 1.4 (0.20) 11.2 (0.46) 10.5 (0.43) 15.8 (0.54)
Mexican or Mexican American . . . . . . . . . . . . . . . . . 100.0 59.5 (0.97) 1.4 (0.25) 11.9 (0.62) 10.8 (0.55) 16.4 (0.71) Not Hispanic or Latino . . . . . . . . . . . . . . . . . . . . . . . 100.0 46.3 (0.47) 1.6 (0.08) 14.5 (0.25) 14.7 (0.26) 23.1 (0.34)
White, single race . . . . . . . . . . . . . . . . . . . . . . . . 100.0 43.6 (0.52) 1.5 (0.09) 15.1 (0.29) 15.5 (0.30) 24.3 (0.38) Black or African American, single race . . . . . . . . . . . . 100.0 60.7 (0.88) 1.7 (0.17) 11.5 (0.49) 10.8 (0.45) 15.4 (0.60)
Education: Less than high school graduate . . . . . . . . . . . . . . . . . 100.0 68.1 (0.71) 1.1 (0.19) 8.7 (0.41) 7.0 (0.37) 15.0 (0.52) GED diploma6 . . . . . . . . . . . . . . . . . . . . . . . . . . . . 100.0 62.2 (1.75) 1.5 (0.40) 9.6 (0.99) 9.7 (1.07) 17.1 (1.31) High school graduate . . . . . . . . . . . . . . . . . . . . . . . . 100.0 55.0 (0.68) 1.6 (0.14) 12.1 (0.40) 11.7 (0.37) 19.7 (0.51) Some college—no degree . . . . . . . . . . . . . . . . . . . . . 100.0 43.0 (0.75) 1.8 (0.19) 15.9 (0.53) 15.3 (0.52) 24.0 (0.59) Associate of arts degree . . . . . . . . . . . . . . . . . . . . . . 100.0 40.4 (0.92) 1.8 (0.24) 16.2 (0.68) 17.1 (0.71) 24.6 (0.82) Bachelor of arts, science degree . . . . . . . . . . . . . . . . . 100.0 34.2 (0.78) 1.5 (0.20) 17.9 (0.59) 19.6 (0.59) 26.8 (0.71) Masters, doctorate, medical degree . . . . . . . . . . . . . . . 100.0 29.3 (0.99) 1.4 (0.23) 18.3 (0.86) 21.0 (0.83) 30.0 (0.95)
Poverty status:7
Below poverty level . . . . . . . . . . . . . . . . . . . . . . . . . 100.0 63.2 (0.82) 1.1 (0.13) 9.6 (0.44) 8.5 (0.44) 17.6 (0.61) ≥1 and <2 times poverty level . . . . . . . . . . . . . . . . . . 100.0 58.3 (0.75) 1.6 (0.18) 11.4 (0.44) 9.9 (0.39) 18.8 (0.54) ≥2 and <4 times poverty level . . . . . . . . . . . . . . . . . . 100.0 48.3 (0.64) 1.6 (0.15) 14.0 (0.41) 14.2 (0.40) 22.0 (0.51) 4 times poverty level or more . . . . . . . . . . . . . . . . . . . 100.0 36.5 (0.59) 1.6 (0.14) 17.3 (0.42) 18.7 (0.42) 25.9 (0.49)
Marital status: Never married . . . . . . . . . . . . . . . . . . . . . . . . . . . . 100.0 47.4 (0.87) 1.7 (0.22) 15.2 (0.54) 14.0 (0.52) 21.7 (0.66) Married . . . . . . . . . . . . . . . . . . . . . . . . . . . . . . . . 100.0 44.8 (0.53) 1.5 (0.11) 14.8 (0.32) 15.8 (0.33) 23.1 (0.40) Cohabiting . . . . . . . . . . . . . . . . . . . . . . . . . . . . . . 100.0 45.7 (1.35) 1.6 (0.33) 16.1 (0.96) 13.4 (0.86) 23.2 (1.15) Divorced or separated . . . . . . . . . . . . . . . . . . . . . . . 100.0 51.5 (0.78) 1.7 (0.21) 13.5 (0.51) 13.1 (0.47) 20.3 (0.61) Widowed . . . . . . . . . . . . . . . . . . . . . . . . . . . . . . . 100.0 63.9 (0.87) 1.0 (0.14) 7.9 (0.43) 7.6 (0.38) 19.5 (0.74)
Geographic region: Northeast . . . . . . . . . . . . . . . . . . . . . . . . . . . . . . . 100.0 49.3 (1.00) 1.5 (0.23) 13.9 (0.55) 12.9 (0.50) 22.4 (0.72) Midwest . . . . . . . . . . . . . . . . . . . . . . . . . . . . . . . . 100.0 42.5 (0.87) 1.5 (0.14) 17.2 (0.50) 15.3 (0.53) 23.5 (0.66) South . . . . . . . . . . . . . . . . . . . . . . . . . . . . . . . . . 100.0 53.5 (0.77) 1.5 (0.12) 12.0 (0.35) 13.6 (0.39) 19.5 (0.49) West . . . . . . . . . . . . . . . . . . . . . . . . . . . . . . . . . . 100.0 43.8 (0.82) 1.7 (0.16) 14.3 (0.49) 15.0 (0.49) 25.2 (0.67)
† Estimates with a relative standard error greater than 50% are indicated with a dagger, but are not shown.
* Estimates preceded by an asterisk have a relative standard error of greater than 30% and less than or equal to 50%. These should be interpreted with caution as they do not meet the standard of reliability or precision.
– Quantity zero. 1Light-moderate activity includes leisure-time physical activities that cause only light sweating or a light to moderate increase in breathing or heart rate and are done for at least 10 minutes per episode. 2‘‘None’’ may include individuals who engaged in only vigorous activity. 3Less than 1’’ refers to frequencies of light-moderate activities lasting 10 minutes per episode that occurred less than one time per week (for example, three times per month.) 4Persons of other races and unknown race and ethnicity, unknown education, unknown poverty status, and unknown marital status are included in the total. 5Estimates are age adjusted using the projected 2000 U.S. population as the standard population and using three age groups: 18–44 years, 45–64 years, and 65 years and over. 6GED is General Educational Development high school equivalency diploma. 7Poverty status is based on family income and family size using the U.S. Census Bureau poverty thresholds for 2004, 2005, and 2006.
NOTES: For age-adjusted percent distributions, refer to Table 5.2. Denominator for each percent distribution excludes persons with unknown light-moderate leisure-time physical activity status. See Appendix II for definitions of terms. See Appendix III for health behavior questions.
DATA SOURCE: National Health Interview Survey, 2005–2007. Estimates are based on household interviews of a sample of the civilian noninstitutionalized population.

Page 112 [ Series 10, No. 245
Table XIV. Crude percent distributions (with standard errors) of times per week engaged in vigorous leisure-time physical activity for adults 18 years of age and over, by selected characteristics: United States, average annual, 2005–2007
Times per week engaged in vigorous activity1
Selected characteristic Total None2 Less than 13 1–2 3–4 5 or more
Both sexes Percent distribution (standard error)
Ages 18 years and over (crude)4 . . . . . . . . . . . . . . . . . . 100.0 61.7 (0.36) 2.6 (0.08) 11.6 (0.18) 13.0 (0.18) 11.0 (0.18) Ages 18 years and over (age-adjusted)4,5 . . . . . . . . . . . . 100.0 61.5 (0.35) 2.6 (0.08) 11.7 (0.18) 13.0 (0.18) 11.1 (0.18)
Age: 18–24 years . . . . . . . . . . . . . . . . . . . . . . . . . . . . . 100.0 48.8 (0.84) 3.3 (0.26) 15.8 (0.54) 16.7 (0.58) 15.5 (0.56) 25–44 years . . . . . . . . . . . . . . . . . . . . . . . . . . . . . 100.0 54.2 (0.50) 3.2 (0.13) 14.8 (0.30) 16.1 (0.29) 11.6 (0.25) 45–64 years . . . . . . . . . . . . . . . . . . . . . . . . . . . . . 100.0 64.7 (0.49) 2.5 (0.13) 10.3 (0.25) 11.7 (0.27) 10.8 (0.27) 65–74 years . . . . . . . . . . . . . . . . . . . . . . . . . . . . . 100.0 78.4 (0.62) 1.1 (0.14) 5.0 (0.32) 7.1 (0.37) 8.3 (0.39) 75 years and over . . . . . . . . . . . . . . . . . . . . . . . . . . 100.0 88.5 (0.48) 0.7 (0.12) 2.6 (0.23) 3.3 (0.27) 4.8 (0.31)
Race: White, single race . . . . . . . . . . . . . . . . . . . . . . . . . . 100.0 60.8 (0.39) 2.7 (0.09) 11.9 (0.20) 13.3 (0.20) 11.4 (0.20) Black or African American, single race . . . . . . . . . . . . . 100.0 68.1 (0.69) 2.2 (0.21) 10.0 (0.38) 11.0 (0.42) 8.7 (0.34) American Indian or Alaska Native, single race . . . . . . . . 100.0 69.4 (2.36) 2.5 (0.74) 9.0 (1.25) 7.7 (1.22) 11.5 (2.10) Asian, single race . . . . . . . . . . . . . . . . . . . . . . . . . . 100.0 62.2 (1.07) 2.8 (0.36) 12.2 (0.70) 12.1 (0.76) 10.8 (0.75) Native Hawaiian or Other Pacific Islander, single race. . . . 100.0 66.4 (5.59) – *6.1 (2.75) 18.6 (4.52) *8.9 (3.53) Two or more races . . . . . . . . . . . . . . . . . . . . . . . . . 100.0 55.9 (2.21) 3.4 (0.79) 12.2 (1.39) 15.1 (1.60) 13.4 (1.38)
Black or African American, white . . . . . . . . . . . . . . . 100.0 58.2 (4.75) † 12.3 (2.95) 15.6 (3.57) 11.3 (3.02) American Indian or Alaska Native, white . . . . . . . . . . . 100.0 62.0 (3.09) *2.7 (0.95) 9.8 (1.84) 12.1 (1.89) 13.4 (2.10)
Hispanic or Latino origin and race: Hispanic or Latino . . . . . . . . . . . . . . . . . . . . . . . . . . 100.0 69.9 (0.60) 2.0 (0.16) 9.8 (0.36) 9.8 (0.38) 8.5 (0.33)
Mexican or Mexican American . . . . . . . . . . . . . . . . . 100.0 69.7 (0.78) 2.0 (0.20) 10.5 (0.47) 9.8 (0.51) 8.0 (0.39) Not Hispanic or Latino . . . . . . . . . . . . . . . . . . . . . . . 100.0 60.5 (0.39) 2.7 (0.09) 11.9 (0.20) 13.4 (0.20) 11.4 (0.20)
White, single race . . . . . . . . . . . . . . . . . . . . . . . . 100.0 59.2 (0.43) 2.8 (0.10) 12.2 (0.23) 13.9 (0.22) 11.9 (0.22) Black or African American, single race . . . . . . . . . . . . 100.0 68.1 (0.71) 2.3 (0.22) 10.1 (0.39) 11.0 (0.43) 8.5 (0.34)
Education: Less than high school graduate . . . . . . . . . . . . . . . . . 100.0 80.7 (0.48) 1.5 (0.13) 6.1 (0.27) 4.8 (0.24) 6.8 (0.31) GED diploma6 . . . . . . . . . . . . . . . . . . . . . . . . . . . . 100.0 70.9 (1.39) 2.1 (0.38) 9.6 (0.77) 6.9 (0.79) 10.5 (0.93) High school graduate . . . . . . . . . . . . . . . . . . . . . . . . 100.0 71.1 (0.50) 2.1 (0.13) 9.6 (0.29) 8.6 (0.28) 8.6 (0.26) Some college—no degree . . . . . . . . . . . . . . . . . . . . . 100.0 56.1 (0.65) 3.2 (0.19) 13.7 (0.40) 14.9 (0.40) 12.2 (0.38) Associate of arts degree . . . . . . . . . . . . . . . . . . . . . . 100.0 56.8 (0.77) 3.0 (0.23) 13.3 (0.50) 14.6 (0.54) 12.3 (0.49) Bachelor of arts, science degree . . . . . . . . . . . . . . . . . 100.0 45.3 (0.64) 3.5 (0.22) 15.6 (0.45) 21.2 (0.45) 14.4 (0.41) Masters, doctorate, medical degree . . . . . . . . . . . . . . . 100.0 42.9 (0.79) 3.3 (0.25) 15.5 (0.59) 21.9 (0.62) 16.5 (0.61)
Poverty status:7
Below poverty level . . . . . . . . . . . . . . . . . . . . . . . . . 100.0 73.9 (0.89) 1.7 (0.16) 8.7 (0.39) 7.3 (0.43) 8.4 (0.43) ≥1 and <2 times poverty level . . . . . . . . . . . . . . . . . . 100.0 73.7 (0.57) 1.9 (0.14) 8.3 (0.32) 8.0 (0.33) 8.2 (0.34) ≥2 and <4 times poverty level . . . . . . . . . . . . . . . . . . 100.0 63.8 (0.49) 2.6 (0.14) 11.7 (0.30) 11.8 (0.30) 10.2 (0.27) 4 times poverty level or more . . . . . . . . . . . . . . . . . . . 100.0 50.4 (0.49) 3.3 (0.15) 14.2 (0.30) 18.1 (0.30) 14.0 (0.29)
Marital status: Never married . . . . . . . . . . . . . . . . . . . . . . . . . . . . 100.0 51.9 (0.66) 3.0 (0.19) 14.5 (0.39) 16.4 (0.43) 14.2 (0.41) Married . . . . . . . . . . . . . . . . . . . . . . . . . . . . . . . . 100.0 61.7 (0.41) 2.8 (0.11) 11.7 (0.23) 13.0 (0.22) 10.8 (0.23) Cohabiting . . . . . . . . . . . . . . . . . . . . . . . . . . . . . . 100.0 58.5 (1.01) 2.7 (0.29) 14.0 (0.67) 13.5 (0.67) 11.3 (0.58) Divorced or separated . . . . . . . . . . . . . . . . . . . . . . . 100.0 67.1 (0.62) 2.0 (0.16) 9.6 (0.36) 11.3 (0.36) 10.0 (0.33) Widowed . . . . . . . . . . . . . . . . . . . . . . . . . . . . . . . 100.0 86.8 (0.47) 0.8 (0.11) 3.5 (0.25) 3.8 (0.25) 5.1 (0.31)
Geographic region: Northeast . . . . . . . . . . . . . . . . . . . . . . . . . . . . . . . 100.0 60.5 (0.70) 2.7 (0.19) 11.9 (0.40) 14.0 (0.45) 10.9 (0.39) Midwest . . . . . . . . . . . . . . . . . . . . . . . . . . . . . . . . 100.0 58.1 (0.87) 3.3 (0.19) 13.2 (0.41) 13.4 (0.39) 12.1 (0.41) South . . . . . . . . . . . . . . . . . . . . . . . . . . . . . . . . . 100.0 65.8 (0.59) 2.1 (0.11) 10.4 (0.30) 11.8 (0.27) 9.9 (0.27) West . . . . . . . . . . . . . . . . . . . . . . . . . . . . . . . . . . 100.0 59.8 (0.72) 2.7 (0.15) 11.8 (0.35) 13.6 (0.39) 12.0 (0.39)
Men
Ages 18 years and over (crude)4 . . . . . . . . . . . . . . . . . . 100.0 56.3 (0.45) 3.1 (0.13) 13.8 (0.27) 13.8 (0.25) 12.9 (0.26) Ages 18 years and over (age-adjusted)4,5 . . . . . . . . . . . . 100.0 56.6 (0.43) 3.1 (0.13) 13.7 (0.27) 13.7 (0.24) 12.9 (0.26)
Age: 18–24 years . . . . . . . . . . . . . . . . . . . . . . . . . . . . . 100.0 41.4 (1.13) 3.4 (0.40) 17.3 (0.79) 18.5 (0.85) 19.4 (0.90) 25–44 years . . . . . . . . . . . . . . . . . . . . . . . . . . . . . 100.0 49.0 (0.66) 3.8 (0.21) 17.5 (0.46) 16.4 (0.39) 13.2 (0.36) 45–64 years . . . . . . . . . . . . . . . . . . . . . . . . . . . . . 100.0 61.2 (0.61) 3.1 (0.23) 11.8 (0.37) 12.3 (0.38) 11.6 (0.38) 65–74 years . . . . . . . . . . . . . . . . . . . . . . . . . . . . . 100.0 74.0 (0.95) 1.6 (0.26) 6.5 (0.54) 7.8 (0.54) 10.2 (0.64) 75 years and over . . . . . . . . . . . . . . . . . . . . . . . . . . 100.0 83.5 (0.84) 0.9 (0.19) 3.6 (0.43) 4.4 (0.48) 7.6 (0.63)
See footnotes at end of table.

Series 10, No. 245 [ Page 113
Table XIV. Crude percent distributions (with standard errors) of times per week engaged in vigorous leisure-time physical activity for adults 18 years of age and over, by selected characteristics: United States, average annual, 2005–2007—Con.
Times per week engaged in vigorous activity1
Selected characteristic Total None2 Less than 13 1–2 3–4 5 or more
Men—Con. Percent distribution (standard error) Race:
White, single race . . . . . . . . . . . . . . . . . . . . . . . . . . 100.0 55.9 (0.49) 3.2 (0.14) 14.0 (0.31) 13.8 (0.27) 13.1 (0.28) Black or African American, single race . . . . . . . . . . . . . 100.0 59.5 (1.06) 2.7 (0.41) 12.1 (0.64) 14.0 (0.74) 11.7 (0.60) American Indian or Alaska Native, single race . . . . . . . . 100.0 65.9 (3.91) *3.6 (1.34) 9.9 (1.91) 8.2 (1.77) 12.4 (3.52) Asian, single race . . . . . . . . . . . . . . . . . . . . . . . . . . 100.0 54.6 (1.58) 2.9 (0.59) 15.4 (1.17) 14.9 (1.20) 12.2 (1.27) Native Hawaiian or Other Pacific Islander, single race. . . . 100.0 69.0 (7.72) – † *15.8 (5.53) † Two or more races . . . . . . . . . . . . . . . . . . . . . . . . . 100.0 52.3 (3.00) 4.7 (1.33) 14.0 (2.23) 15.1 (2.01) 13.9 (2.03)
Black or African American, white . . . . . . . . . . . . . . . 100.0 52.1 (8.10) † *10.8 (4.29) *18.3 (6.40) *15.3 (5.70) American Indian or Alaska Native, white . . . . . . . . . . . 100.0 58.0 (4.17) *4.3 (1.58) 11.3 (2.87) 13.2 (2.71) 13.2 (2.75)
Hispanic or Latino origin and race: Hispanic or Latino . . . . . . . . . . . . . . . . . . . . . . . . . . 100.0 63.8 (0.83) 2.4 (0.27) 12.5 (0.57) 11.4 (0.55) 9.7 (0.51)
Mexican or Mexican American . . . . . . . . . . . . . . . . . 100.0 64.0 (1.04) 2.2 (0.32) 13.1 (0.73) 11.6 (0.66) 9.1 (0.58) Not Hispanic or Latino . . . . . . . . . . . . . . . . . . . . . . . 100.0 55.1 (0.49) 3.2 (0.14) 14.0 (0.30) 14.2 (0.27) 13.4 (0.29)
White, single race . . . . . . . . . . . . . . . . . . . . . . . . 100.0 54.4 (0.54) 3.3 (0.16) 14.2 (0.34) 14.3 (0.31) 13.8 (0.32) Black or African American, single race . . . . . . . . . . . . 100.0 59.6 (1.08) 2.8 (0.42) 12.2 (0.66) 13.9 (0.76) 11.5 (0.60)
Education: Less than high school graduate . . . . . . . . . . . . . . . . . 100.0 75.2 (0.77) 2.1 (0.23) 7.9 (0.46) 6.0 (0.39) 8.8 (0.54) GED diploma6 . . . . . . . . . . . . . . . . . . . . . . . . . . . . 100.0 63.1 (2.11) 2.5 (0.59) 12.2 (1.26) 8.8 (1.31) 13.4 (1.57) High school graduate . . . . . . . . . . . . . . . . . . . . . . . . 100.0 65.5 (0.71) 2.8 (0.23) 11.6 (0.46) 9.7 (0.40) 10.4 (0.41) Some college—no degree . . . . . . . . . . . . . . . . . . . . . 100.0 50.1 (0.89) 3.6 (0.31) 16.2 (0.59) 15.6 (0.60) 14.4 (0.60) Associate of arts degree . . . . . . . . . . . . . . . . . . . . . . 100.0 50.8 (1.16) 3.4 (0.35) 16.1 (0.87) 15.8 (0.84) 14.0 (0.75) Bachelor of arts, science degree . . . . . . . . . . . . . . . . . 100.0 40.3 (0.85) 4.2 (0.37) 17.6 (0.65) 21.5 (0.63) 16.3 (0.62) Masters, doctorate, medical degree . . . . . . . . . . . . . . . 100.0 39.4 (1.04) 3.3 (0.35) 17.4 (0.86) 22.2 (0.89) 17.7 (0.86)
Poverty status:7
Below poverty level . . . . . . . . . . . . . . . . . . . . . . . . . 100.0 67.8 (1.24) 2.2 (0.31) 10.8 (0.64) 8.6 (0.64) 10.7 (0.75) ≥1 and <2 times poverty level . . . . . . . . . . . . . . . . . . 100.0 68.8 (0.90) 2.3 (0.24) 10.0 (0.52) 9.1 (0.53) 9.8 (0.59) ≥2 and <4 times poverty level . . . . . . . . . . . . . . . . . . 100.0 59.2 (0.67) 3.0 (0.22) 13.6 (0.47) 12.4 (0.41) 11.8 (0.44) 4 times poverty level or more . . . . . . . . . . . . . . . . . . . 100.0 45.9 (0.59) 3.8 (0.23) 16.3 (0.44) 18.3 (0.40) 15.7 (0.41)
Marital status: Never married . . . . . . . . . . . . . . . . . . . . . . . . . . . . 100.0 46.8 (0.83) 3.2 (0.27) 15.3 (0.53) 17.7 (0.59) 17.0 (0.62) Married . . . . . . . . . . . . . . . . . . . . . . . . . . . . . . . . 100.0 58.4 (0.53) 3.3 (0.18) 13.9 (0.36) 12.8 (0.29) 11.6 (0.32) Cohabiting . . . . . . . . . . . . . . . . . . . . . . . . . . . . . . 100.0 54.2 (1.32) 3.3 (0.45) 15.3 (1.00) 14.0 (0.93) 13.1 (0.87) Divorced or separated . . . . . . . . . . . . . . . . . . . . . . . 100.0 60.6 (0.92) 2.7 (0.31) 10.7 (0.54) 13.4 (0.64) 12.5 (0.59) Widowed . . . . . . . . . . . . . . . . . . . . . . . . . . . . . . . 100.0 82.4 (1.17) 1.0 (0.27) 4.3 (0.61) 4.9 (0.63) 7.3 (0.85)
Geographic region: Northeast . . . . . . . . . . . . . . . . . . . . . . . . . . . . . . . 100.0 54.1 (0.91) 3.5 (0.31) 14.6 (0.64) 15.2 (0.66) 12.6 (0.58) Midwest . . . . . . . . . . . . . . . . . . . . . . . . . . . . . . . . 100.0 53.2 (1.04) 4.0 (0.33) 14.8 (0.61) 13.8 (0.50) 14.3 (0.57) South . . . . . . . . . . . . . . . . . . . . . . . . . . . . . . . . . 100.0 60.3 (0.75) 2.4 (0.19) 12.7 (0.45) 12.9 (0.39) 11.8 (0.40) West . . . . . . . . . . . . . . . . . . . . . . . . . . . . . . . . . . 100.0 55.0 (0.91) 3.1 (0.24) 13.9 (0.54) 14.4 (0.52) 13.6 (0.58)
Women
Ages 18 years and over (crude)4 . . . . . . . . . . . . . . . . . . 100.0 66.7 (0.39) 2.1 (0.09) 9.7 (0.20) 12.1 (0.23) 9.3 (0.20) Ages 18 years and over (age-adjusted)4,5 . . . . . . . . . . . . 100.0 66.1 (0.39) 2.2 (0.09) 9.9 (0.20) 12.4 (0.23) 9.4 (0.20)
Age: 18–24 years . . . . . . . . . . . . . . . . . . . . . . . . . . . . . 100.0 56.1 (1.09) 3.2 (0.33) 14.2 (0.77) 14.9 (0.72) 11.6 (0.65) 25–44 years . . . . . . . . . . . . . . . . . . . . . . . . . . . . . 100.0 59.3 (0.56) 2.7 (0.16) 12.1 (0.32) 15.9 (0.41) 10.1 (0.30) 45–64 years . . . . . . . . . . . . . . . . . . . . . . . . . . . . . 100.0 68.0 (0.60) 2.0 (0.14) 8.9 (0.34) 11.1 (0.34) 10.0 (0.35) 65–74 years . . . . . . . . . . . . . . . . . . . . . . . . . . . . . 100.0 82.1 (0.71) 0.8 (0.15) 3.8 (0.35) 6.6 (0.48) 6.7 (0.46) 75 years and over . . . . . . . . . . . . . . . . . . . . . . . . . . 100.0 91.6 (0.51) 0.6 (0.15) 2.0 (0.23) 2.7 (0.29) 3.1 (0.31)
Race: White, single race . . . . . . . . . . . . . . . . . . . . . . . . . . 100.0 65.4 (0.44) 2.2 (0.10) 9.9 (0.22) 12.8 (0.26) 9.7 (0.23) Black or African American, single race . . . . . . . . . . . . . 100.0 75.1 (0.71) 1.9 (0.19) 8.3 (0.44) 8.5 (0.40) 6.2 (0.36) American Indian or Alaska Native, single race . . . . . . . . 100.0 72.9 (3.08) *1.4 (0.62) 8.2 (1.55) 7.1 (1.64) 10.5 (2.29) Asian, single race . . . . . . . . . . . . . . . . . . . . . . . . . . 100.0 69.4 (1.35) 2.6 (0.42) 9.1 (0.81) 9.4 (0.80) 9.5 (0.78) Native Hawaiian or Other Pacific Islander, single race. . . . 100.0 63.6 (7.87) – † *21.7 (7.22) † Two or more races . . . . . . . . . . . . . . . . . . . . . . . . . 100.0 59.5 (2.92) *2.1 (0.76) 10.5 (1.48) 15.1 (2.49) 12.9 (1.72)
Black or African American, white . . . . . . . . . . . . . . . 100.0 62.4 (5.98) † *13.3 (4.15) *13.8 (4.17) *8.5 (3.33) American Indian or Alaska Native, white . . . . . . . . . . . 100.0 66.5 (3.85) † 8.0 (2.06) 10.8 (2.59) 13.8 (3.01)
See footnotes at end of table.

Page 114 [ Series 10, No. 245
Table XIV. Crude percent distributions (with standard errors) of times per week engaged in vigorous leisure-time physical activity for adults 18 years of age and over, by selected characteristics: United States, average annual, 2005–2007—Con.
Times per week engaged in vigorous activity1
Selected characteristic Total None2 Less than 13 1–2 3–4 5 or more
Women—Con. Percent distribution (standard error)
Hispanic or Latino origin and race: Hispanic or Latino . . . . . . . . . . . . . . . . . . . . . . . . . . 100.0 76.4 (0.71) 1.5 (0.18) 6.9 (0.38) 8.0 (0.46) 7.2 (0.40)
Mexican or Mexican American . . . . . . . . . . . . . . . . . 100.0 76.0 (0.97) 1.7 (0.25) 7.6 (0.51) 7.8 (0.64) 6.9 (0.51) Not Hispanic or Latino . . . . . . . . . . . . . . . . . . . . . . . 100.0 65.4 (0.42) 2.2 (0.10) 10.1 (0.22) 12.7 (0.25) 9.6 (0.22)
White, single race . . . . . . . . . . . . . . . . . . . . . . . . 100.0 63.5 (0.48) 2.3 (0.12) 10.4 (0.25) 13.6 (0.28) 10.2 (0.26) Black or African American, single race . . . . . . . . . . . . 100.0 75.0 (0.72) 1.9 (0.19) 8.4 (0.45) 8.6 (0.41) 6.1 (0.36)
Education: Less than high school graduate . . . . . . . . . . . . . . . . . 100.0 86.1 (0.49) 0.9 (0.14) 4.4 (0.29) 3.7 (0.27) 5.0 (0.31) GED diploma6 . . . . . . . . . . . . . . . . . . . . . . . . . . . . 100.0 79.2 (1.52) 1.7 (0.47) 6.8 (0.86) 5.0 (0.75) 7.3 (0.99) High school graduate . . . . . . . . . . . . . . . . . . . . . . . . 100.0 76.2 (0.58) 1.5 (0.13) 7.7 (0.33) 7.6 (0.40) 7.1 (0.31) Some college—no degree . . . . . . . . . . . . . . . . . . . . . 100.0 61.2 (0.75) 2.7 (0.23) 11.5 (0.51) 14.2 (0.50) 10.3 (0.44) Associate of arts degree . . . . . . . . . . . . . . . . . . . . . . 100.0 61.5 (0.92) 2.8 (0.30) 11.1 (0.57) 13.7 (0.69) 11.0 (0.60) Bachelor of arts, science degree . . . . . . . . . . . . . . . . . 100.0 50.0 (0.80) 2.9 (0.23) 13.7 (0.54) 20.8 (0.60) 12.6 (0.49) Masters, doctorate, medical degree . . . . . . . . . . . . . . . 100.0 46.6 (1.08) 3.2 (0.35) 13.5 (0.69) 21.6 (0.85) 15.2 (0.82)
Poverty status:7
Below poverty level . . . . . . . . . . . . . . . . . . . . . . . . . 100.0 78.2 (0.87) 1.4 (0.17) 7.3 (0.48) 6.3 (0.42) 6.8 (0.41) ≥1 and <2 times poverty level . . . . . . . . . . . . . . . . . . 100.0 77.7 (0.60) 1.5 (0.16) 6.8 (0.33) 7.0 (0.37) 6.9 (0.34) ≥2 and <4 times poverty level . . . . . . . . . . . . . . . . . . 100.0 68.1 (0.61) 2.1 (0.17) 9.9 (0.35) 11.2 (0.42) 8.7 (0.34) 4 times poverty level or more . . . . . . . . . . . . . . . . . . . 100.0 55.2 (0.63) 2.7 (0.18) 12.0 (0.36) 17.9 (0.44) 12.1 (0.38)
Marital status: Never married . . . . . . . . . . . . . . . . . . . . . . . . . . . . 100.0 57.9 (0.87) 2.9 (0.24) 13.5 (0.60) 14.8 (0.55) 10.9 (0.48) Married . . . . . . . . . . . . . . . . . . . . . . . . . . . . . . . . 100.0 65.0 (0.48) 2.3 (0.13) 9.5 (0.25) 13.3 (0.31) 10.0 (0.28) Cohabiting . . . . . . . . . . . . . . . . . . . . . . . . . . . . . . 100.0 63.2 (1.38) 2.1 (0.36) 12.6 (0.88) 12.9 (1.01) 9.2 (0.74) Divorced or separated . . . . . . . . . . . . . . . . . . . . . . . 100.0 71.6 (0.73) 1.6 (0.17) 8.8 (0.47) 9.8 (0.39) 8.2 (0.37) Widowed . . . . . . . . . . . . . . . . . . . . . . . . . . . . . . . 100.0 87.8 (0.50) 0.7 (0.12) 3.3 (0.27) 3.6 (0.27) 4.5 (0.31)
Geographic region: Northeast . . . . . . . . . . . . . . . . . . . . . . . . . . . . . . . 100.0 66.1 (0.83) 2.0 (0.23) 9.6 (0.46) 13.0 (0.53) 9.4 (0.46) Midwest . . . . . . . . . . . . . . . . . . . . . . . . . . . . . . . . 100.0 62.7 (0.92) 2.6 (0.21) 11.7 (0.46) 12.9 (0.50) 10.0 (0.46) South . . . . . . . . . . . . . . . . . . . . . . . . . . . . . . . . . 100.0 70.9 (0.63) 1.8 (0.13) 8.3 (0.32) 10.9 (0.36) 8.1 (0.30) West . . . . . . . . . . . . . . . . . . . . . . . . . . . . . . . . . . 100.0 64.6 (0.77) 2.3 (0.20) 9.8 (0.39) 12.8 (0.48) 10.5 (0.43)
– Quantity zero.
* Estimates preceded by an asterisk have a relative standard error of greater than 30% and less than or equal to 50%. These should be interpreted with caution as they do not meet the standard of reliability or precision.
† Estimates with a relative standard error greater than 50% are indicated with a dagger, but are not shown. 1Vigorous activity refers to leisure-time physical activities that cause heavy sweating or large increases in breathing or heart rate and are done for at least 10 minutes per episode. 2‘‘None’’ may include individuals who engaged in only light-moderate activity. 3‘‘Less than 1’’ refers to frequencies of vigorous activities lasting 10 minutes per episode that occurred less than one time per week (for example, three times per month). 4Persons of other races and unknown race and ethnicity, unknown education, unknown poverty status, and unknown marital status are included in the total. 5Estimates are age adjusted using the projected 2000 U.S. population as the standard population and using three age groups: 18–44 years, 45–64 years, and 65 years and over. 6GED is General Educational Development high school equivalency diploma. 7Poverty status is based on family income and family size using the U.S. Census Bureau poverty thresholds for 2004, 2005, and 2006.
NOTES: For age-adjusted percent distributions, refer to Table 5.3. Denominator for each percent distribution excludes persons with unknown vigorous leisure-time physical activity status. See Appendix II for definitions of terms. See Appendix III for health behavior questions.
DATA SOURCE: National Health Interview Survey, 2005–2007. Estimates are based on household interviews of a sample of the civilian noninstitutionalized population.

Series 10, No. 245 [ Page 115
Table XV. Crude percentages (with standard errors) of adults 18 years of age and over who engaged in regular leisure-time physical activity, by type of activity and selected characteristics: United States, average annual, 2005–2007
Regular activity1
Selected characteristic Light-moderate Vigorous Any
Both sexes Percent (standard error)
Ages 18 years and over (crude)2 . . . . . . . . . . . . . . . . . . 14.1 (0.20) 22.3 (0.25) 30.6 (0.29) Ages 18 years and over (age-adjusted)2,3 . . . . . . . . . . . . 14.1 (0.20) 22.4 (0.25) 30.7 (0.29)
Age: 18–24 years . . . . . . . . . . . . . . . . . . . . . . . . . . . . . 15.9 (0.54) 30.2 (0.75) 37.5 (0.76) 25–44 years . . . . . . . . . . . . . . . . . . . . . . . . . . . . . 13.2 (0.28) 26.1 (0.36) 33.0 (0.40) 45–64 years . . . . . . . . . . . . . . . . . . . . . . . . . . . . . 14.4 (0.30) 20.8 (0.38) 29.5 (0.43) 65–74 years . . . . . . . . . . . . . . . . . . . . . . . . . . . . . 15.6 (0.56) 13.9 (0.52) 25.4 (0.67) 75 years and over . . . . . . . . . . . . . . . . . . . . . . . . . . 12.5 (0.51) 7.0 (0.37) 17.4 (0.60)
Race: White, single race . . . . . . . . . . . . . . . . . . . . . . . . . . 14.7 (0.22) 23.0 (0.28) 31.6 (0.32) Black or African American, single race . . . . . . . . . . . . . 10.0 (0.37) 17.8 (0.52) 23.8 (0.57) American Indian or Alaska Native, single race . . . . . . . . 15.1 (1.99) 17.6 (2.19) 27.2 (2.40) Asian, single race . . . . . . . . . . . . . . . . . . . . . . . . . . 13.3 (0.80) 21.0 (0.86) 29.7 (0.97) Native Hawaiian or Other Pacific Islander, single race. . . . *13.1 (4.29) 27.2 (5.66) 32.0 (6.18) Two or more races . . . . . . . . . . . . . . . . . . . . . . . . . 14.8 (1.68) 25.4 (1.85) 31.4 (1.89)
Black or African American, white . . . . . . . . . . . . . . . 14.1 (3.35) 25.7 (4.44) 32.4 (4.74) American Indian or Alaska Native, white . . . . . . . . . . . 13.0 (1.88) 21.7 (2.54) 27.3 (2.57)
Hispanic or Latino origin and race: Hispanic or Latino . . . . . . . . . . . . . . . . . . . . . . . . . . 10.2 (0.34) 16.8 (0.47) 23.3 (0.51)
Mexican or Mexican American . . . . . . . . . . . . . . . . . 10.4 (0.43) 16.4 (0.61) 23.2 (0.66) Not Hispanic or Latino . . . . . . . . . . . . . . . . . . . . . . . 14.7 (0.22) 23.2 (0.28) 31.7 (0.32)
White, single race . . . . . . . . . . . . . . . . . . . . . . . . 15.5 (0.25) 24.2 (0.32) 33.1 (0.36) Black or African American, single race . . . . . . . . . . . . 10.0 (0.38) 17.7 (0.53) 23.6 (0.58)
Education: Less than high school graduate . . . . . . . . . . . . . . . . . 10.0 (0.35) 10.2 (0.36) 17.2 (0.46) GED diploma4 . . . . . . . . . . . . . . . . . . . . . . . . . . . . 12.3 (0.99) 14.9 (1.09) 21.8 (1.19) High school graduate . . . . . . . . . . . . . . . . . . . . . . . . 12.0 (0.32) 15.6 (0.35) 23.5 (0.43) Some college—no degree . . . . . . . . . . . . . . . . . . . . . 15.2 (0.39) 25.2 (0.53) 33.5 (0.55) Associate of arts degree . . . . . . . . . . . . . . . . . . . . . . 16.5 (0.55) 25.0 (0.65) 34.4 (0.72) Bachelor of arts, science degree . . . . . . . . . . . . . . . . . 17.0 (0.46) 33.9 (0.57) 42.9 (0.61) Masters, doctorate, medical degree . . . . . . . . . . . . . . . 18.6 (0.57) 37.0 (0.73) 46.6 (0.75)
Poverty status:5
Below poverty level . . . . . . . . . . . . . . . . . . . . . . . . . 11.2 (0.42) 14.0 (0.68) 21.1 (0.70) ≥1 and <2 times poverty level . . . . . . . . . . . . . . . . . . 12.5 (0.35) 14.4 (0.47) 22.6 (0.52) ≥2 and <4 times poverty level . . . . . . . . . . . . . . . . . . 13.8 (0.33) 20.2 (0.37) 28.6 (0.42) 4 times poverty level or more . . . . . . . . . . . . . . . . . . . 16.0 (0.30) 30.5 (0.39) 39.1 (0.41)
Marital status: Never married . . . . . . . . . . . . . . . . . . . . . . . . . . . . 14.7 (0.39) 28.9 (0.55) 36.1 (0.57) Married . . . . . . . . . . . . . . . . . . . . . . . . . . . . . . . . 14.3 (0.25) 22.1 (0.32) 30.7 (0.36) Cohabiting . . . . . . . . . . . . . . . . . . . . . . . . . . . . . . 15.2 (0.68) 22.7 (0.78) 31.3 (0.90) Divorced or separated . . . . . . . . . . . . . . . . . . . . . . . 12.8 (0.37) 19.7 (0.46) 27.6 (0.52) Widowed . . . . . . . . . . . . . . . . . . . . . . . . . . . . . . . 11.6 (0.50) 7.8 (0.38) 16.9 (0.57)
Geographic region: Northeast . . . . . . . . . . . . . . . . . . . . . . . . . . . . . . . 13.6 (0.40) 23.4 (0.57) 31.9 (0.61) Midwest . . . . . . . . . . . . . . . . . . . . . . . . . . . . . . . . 14.7 (0.44) 23.6 (0.56) 31.9 (0.66) South . . . . . . . . . . . . . . . . . . . . . . . . . . . . . . . . . 12.6 (0.33) 20.1 (0.41) 27.4 (0.48) West . . . . . . . . . . . . . . . . . . . . . . . . . . . . . . . . . . 16.3 (0.44) 23.9 (0.54) 33.6 (0.58)
Men
Ages 18 years and over (crude)2 . . . . . . . . . . . . . . . . . . 14.4 (0.27) 24.9 (0.34) 32.7 (0.38) Ages 18 years and over (age-adjusted)2,3 . . . . . . . . . . . . 14.5 (0.27) 24.7 (0.33) 32.6 (0.38)
Age: 18–24 years . . . . . . . . . . . . . . . . . . . . . . . . . . . . . 17.0 (0.81) 35.5 (1.13) 42.3 (1.12) 25–44 years . . . . . . . . . . . . . . . . . . . . . . . . . . . . . 13.0 (0.40) 27.7 (0.49) 34.0 (0.54) 45–64 years . . . . . . . . . . . . . . . . . . . . . . . . . . . . . 14.0 (0.40) 22.2 (0.51) 30.4 (0.56) 65–74 years . . . . . . . . . . . . . . . . . . . . . . . . . . . . . 17.3 (0.81) 16.1 (0.78) 28.2 (0.96) 75 years and over . . . . . . . . . . . . . . . . . . . . . . . . . . 15.7 (0.88) 10.4 (0.72) 22.5 (0.99)
See footnotes at end of table.

Page 116 [ Series 10, No. 245
Table XV. Crude percentages (with standard errors) of adults 18 years of age and over who engaged in regular leisure-time physical activity, by type of activity and selected characteristics: United States, average annual, 2005–2007—Con.
Regular activity1
Selected characteristic Light-moderate Vigorous Any
Men—Con. Percent (standard error) Race:
White, single race . . . . . . . . . . . . . . . . . . . . . . . . . . 14.9 (0.30) 25.1 (0.38) 33.2 (0.42) Black or African American, single race . . . . . . . . . . . . . 11.3 (0.62) 23.5 (0.90) 29.5 (0.95) American Indian or Alaska Native, single race . . . . . . . . 18.0 (3.14) 19.3 (3.66) 28.8 (3.80) Asian, single race . . . . . . . . . . . . . . . . . . . . . . . . . . 13.0 (1.21) 24.5 (1.32) 32.9 (1.42) Native Hawaiian or Other Pacific Islander, single race. . . . *9.1 (4.21) 23.3 (6.68) 23.3 (6.68) Two or more races . . . . . . . . . . . . . . . . . . . . . . . . . 13.3 (1.87) 25.3 (2.53) 31.6 (2.67)
Black or African American, white . . . . . . . . . . . . . . . 21.8 (6.52) 33.6 (7.74) 43.1 (8.07) American Indian or Alaska Native, white . . . . . . . . . . . 10.0 (2.11) 22.2 (3.44) 26.8 (3.52)
Hispanic or Latino origin and race: Hispanic or Latino . . . . . . . . . . . . . . . . . . . . . . . . . . 10.0 (0.48) 19.5 (0.67) 25.2 (0.71)
Mexican or Mexican American . . . . . . . . . . . . . . . . . 9.6 (0.56) 18.8 (0.78) 24.4 (0.84) Not Hispanic or Latino . . . . . . . . . . . . . . . . . . . . . . . 15.1 (0.30) 25.8 (0.38) 33.9 (0.42)
White, single race . . . . . . . . . . . . . . . . . . . . . . . . 15.8 (0.34) 26.3 (0.43) 34.8 (0.47) Black or African American, single race . . . . . . . . . . . . 11.2 (0.64) 23.2 (0.91) 29.1 (0.97)
Education: Less than high school graduate . . . . . . . . . . . . . . . . . 10.9 (0.56) 13.1 (0.60) 19.9 (0.74) GED diploma4 . . . . . . . . . . . . . . . . . . . . . . . . . . . . 14.3 (1.66) 19.0 (1.83) 26.1 (1.97) High school graduate . . . . . . . . . . . . . . . . . . . . . . . . 12.2 (0.46) 18.2 (0.54) 25.4 (0.63) Some college—no degree . . . . . . . . . . . . . . . . . . . . . 15.3 (0.59) 28.0 (0.82) 35.5 (0.85) Associate of arts degree . . . . . . . . . . . . . . . . . . . . . . 17.1 (0.84) 27.8 (1.00) 37.1 (1.06) Bachelor of arts, science degree . . . . . . . . . . . . . . . . . 17.0 (0.63) 35.9 (0.78) 44.5 (0.82) Masters, doctorate, medical degree . . . . . . . . . . . . . . . 18.1 (0.81) 38.3 (1.03) 47.5 (1.07)
Poverty status:5
Below poverty level . . . . . . . . . . . . . . . . . . . . . . . . . 12.1 (0.74) 17.4 (1.08) 24.4 (1.13) ≥1 and <2 times poverty level . . . . . . . . . . . . . . . . . . 13.2 (0.54) 16.9 (0.79) 24.8 (0.82) ≥2 and <4 times poverty level . . . . . . . . . . . . . . . . . . 14.0 (0.46) 22.3 (0.55) 30.0 (0.59) 4 times poverty level or more . . . . . . . . . . . . . . . . . . . 15.8 (0.41) 32.2 (0.52) 40.2 (0.55)
Marital status: Never married . . . . . . . . . . . . . . . . . . . . . . . . . . . . 15.8 (0.53) 32.8 (0.78) 39.9 (0.78) Married . . . . . . . . . . . . . . . . . . . . . . . . . . . . . . . . 13.9 (0.36) 22.6 (0.41) 30.6 (0.47) Cohabiting . . . . . . . . . . . . . . . . . . . . . . . . . . . . . . 15.2 (0.96) 25.0 (1.13) 32.8 (1.29) Divorced or separated . . . . . . . . . . . . . . . . . . . . . . . 13.7 (0.58) 24.1 (0.79) 31.9 (0.83) Widowed . . . . . . . . . . . . . . . . . . . . . . . . . . . . . . . 13.5 (1.05) 10.4 (0.97) 20.8 (1.30)
Geographic region: Northeast . . . . . . . . . . . . . . . . . . . . . . . . . . . . . . . 13.8 (0.60) 26.3 (0.86) 34.3 (0.94) Midwest . . . . . . . . . . . . . . . . . . . . . . . . . . . . . . . . 15.1 (0.60) 26.0 (0.71) 33.9 (0.82) South . . . . . . . . . . . . . . . . . . . . . . . . . . . . . . . . . 13.2 (0.47) 22.8 (0.53) 29.8 (0.62) West . . . . . . . . . . . . . . . . . . . . . . . . . . . . . . . . . . 16.1 (0.54) 25.9 (0.74) 35.0 (0.75)
Women
Ages 18 years and over (crude)2 . . . . . . . . . . . . . . . . . . 13.8 (0.24) 20.0 (0.30) 28.7 (0.35) Ages 18 years and over (age-adjusted)2,3 . . . . . . . . . . . . 13.8 (0.24) 20.3 (0.30) 28.9 (0.35)
Age: 18–24 years . . . . . . . . . . . . . . . . . . . . . . . . . . . . . 14.7 (0.70) 24.9 (0.87) 32.9 (0.95) 25–44 years . . . . . . . . . . . . . . . . . . . . . . . . . . . . . 13.4 (0.36) 24.4 (0.47) 32.1 (0.51) 45–64 years . . . . . . . . . . . . . . . . . . . . . . . . . . . . . 14.7 (0.38) 19.5 (0.47) 28.7 (0.53) 65–74 years . . . . . . . . . . . . . . . . . . . . . . . . . . . . . 14.2 (0.70) 12.1 (0.62) 23.0 (0.84) 75 years and over . . . . . . . . . . . . . . . . . . . . . . . . . . 10.4 (0.59) 4.8 (0.38) 14.0 (0.68)
Race: White, single race . . . . . . . . . . . . . . . . . . . . . . . . . . 14.6 (0.28) 21.1 (0.34) 30.2 (0.39) Black or African American, single race . . . . . . . . . . . . . 8.8 (0.42) 13.1 (0.50) 19.2 (0.60) American Indian or Alaska Native, single race . . . . . . . . 12.2 (2.00) 15.8 (2.57) 25.7 (2.81) Asian, single race . . . . . . . . . . . . . . . . . . . . . . . . . . 13.5 (1.01) 17.6 (1.11) 26.7 (1.28) Native Hawaiian or Other Pacific Islander, single race. . . . *17.6 (7.65) 31.6 (8.57) 42.1 (9.56) Two or more races . . . . . . . . . . . . . . . . . . . . . . . . . 16.3 (2.63) 25.4 (2.57) 31.2 (2.59)
Black or African American, white . . . . . . . . . . . . . . . *8.8 (3.45) 20.3 (5.24) 25.0 (5.71) American Indian or Alaska Native, white . . . . . . . . . . . 16.4 (3.11) 21.2 (3.46) 27.9 (3.60)
See footnotes at end of table.

Series 10, No. 245 [ Page 117
Table XV. Crude percentages (with standard errors) of adults 18 years of age and over who engaged in regular leisure-time physical activity, by type of activity and selected characteristics: United States, average annual, 2005–2007—Con.
Regular activity1
Selected characteristic Light-moderate Vigorous Any
Women—Con. Percent (standard error)
Hispanic or Latino origin and race: Hispanic or Latino . . . . . . . . . . . . . . . . . . . . . . . . . . 10.3 (0.46) 14.0 (0.57) 21.3 (0.65)
Mexican or Mexican American . . . . . . . . . . . . . . . . . 11.2 (0.61) 13.7 (0.78) 21.8 (0.89) Not Hispanic or Latino . . . . . . . . . . . . . . . . . . . . . . . 14.3 (0.27) 20.8 (0.33) 29.7 (0.38)
White, single race . . . . . . . . . . . . . . . . . . . . . . . . 15.2 (0.31) 22.2 (0.38) 31.6 (0.44) Black or African American, single race . . . . . . . . . . . . 8.9 (0.43) 13.2 (0.51) 19.2 (0.61)
Education: Less than high school graduate . . . . . . . . . . . . . . . . . 9.1 (0.42) 7.3 (0.37) 14.5 (0.50) GED diploma4 . . . . . . . . . . . . . . . . . . . . . . . . . . . . 10.2 (1.08) 10.5 (1.09) 17.3 (1.35) High school graduate . . . . . . . . . . . . . . . . . . . . . . . . 11.8 (0.41) 13.2 (0.44) 21.8 (0.55) Some college—no degree . . . . . . . . . . . . . . . . . . . . . 15.0 (0.49) 22.8 (0.59) 31.7 (0.66) Associate of arts degree . . . . . . . . . . . . . . . . . . . . . . 16.1 (0.69) 22.9 (0.80) 32.3 (0.91) Bachelor of arts, science degree . . . . . . . . . . . . . . . . . 16.9 (0.58) 32.0 (0.74) 41.2 (0.79) Masters, doctorate, medical degree . . . . . . . . . . . . . . . 19.1 (0.86) 35.7 (1.02) 45.7 (1.03)
Poverty status:5
Below poverty level . . . . . . . . . . . . . . . . . . . . . . . . . 10.5 (0.47) 11.6 (0.60) 18.8 (0.67) ≥1 and <2 times poverty level . . . . . . . . . . . . . . . . . . 11.9 (0.45) 12.5 (0.48) 20.7 (0.57) ≥2 and <4 times poverty level . . . . . . . . . . . . . . . . . . 13.6 (0.43) 18.3 (0.48) 27.2 (0.56) 4 times poverty level or more . . . . . . . . . . . . . . . . . . . 16.3 (0.41) 28.7 (0.53) 38.0 (0.57)
Marital status: Never married . . . . . . . . . . . . . . . . . . . . . . . . . . . . 13.4 (0.54) 24.2 (0.68) 31.5 (0.76) Married . . . . . . . . . . . . . . . . . . . . . . . . . . . . . . . . 14.7 (0.33) 21.7 (0.42) 30.8 (0.47) Cohabiting . . . . . . . . . . . . . . . . . . . . . . . . . . . . . . 15.1 (0.95) 20.3 (1.06) 29.7 (1.22) Divorced or separated . . . . . . . . . . . . . . . . . . . . . . . 12.1 (0.48) 16.7 (0.51) 24.7 (0.61) Widowed . . . . . . . . . . . . . . . . . . . . . . . . . . . . . . . 11.1 (0.54) 7.2 (0.40) 16.0 (0.61)
Geographic region: Northeast . . . . . . . . . . . . . . . . . . . . . . . . . . . . . . . 13.5 (0.57) 20.9 (0.64) 29.7 (0.75) Midwest . . . . . . . . . . . . . . . . . . . . . . . . . . . . . . . . 14.4 (0.51) 21.2 (0.67) 30.1 (0.78) South . . . . . . . . . . . . . . . . . . . . . . . . . . . . . . . . . 12.2 (0.37) 17.6 (0.50) 25.2 (0.57) West . . . . . . . . . . . . . . . . . . . . . . . . . . . . . . . . . . 16.4 (0.58) 21.8 (0.60) 32.2 (0.71)
* Estimates preceded by an asterisk have a relative standard error of greater than 30% and less than or equal to 50%. These should be interpreted with caution as they do not meet the standard of reliability or precision. 1Regular leisure-time physical activity: ‘‘Regular light-moderate’’ — engaged in light-moderate activity at least 5 times per week for at least 30 minutes each time; ‘‘Regular vigorous’’ — engaged in vigorous activity at least 3 times per week for at least 20 minutes each time; ‘‘Any regular’’ — engaged in activity that met either criterion or both criteria. Estimates for ‘‘any regular’’ are identical to those shown in table XII. 2Persons of other races and unknown race and ethnicity, unknown education, unknown poverty status, and unknown marital status are included in the total. 3Estimates are age adjusted using the projected 2000 U.S. population as the standard population and using three age groups: 18–44 years, 45–64 years, and 65 years and over. 4GED is General Educational Development high school equivalency diploma. 5Poverty status is based on family income and family size using the U.S. Census Bureau poverty thresholds for 2004, 2005, and 2006.
NOTES: For age-adjusted percentages, refer to Table 5.4. Denominator for each percentage excludes persons with unknown leisure-time physical activity status. See Appendix II definitions of terms. See Appendix III for health behavior questions.
DATA SOURCE: National Health Interview Survey, 2005–2007. Estimates are based on household interviews of a sample of the civilian noninstitutionalized population.
Page 118 [ Series 10, No. 245
Table XVI. Crude percentages (with standard errors) of adults 18 years of age and over who engaged in any leisure-time strengthening activities, by selected characteristics: United States, average annual, 2005–2007
Engaged in any strengthening activities1
Selected characteristic Both sexes Men Women
Percent (standard error)
Ages 18 years and over (crude)2 . . . . . . . . . . . . . . . . . . . . . . . . . . . . . . . . 24.0 (0.28) 27.5 (0.37) 20.8 (0.30) Ages 18 years and over (age-adjusted)2,3 . . . . . . . . . . . . . . . . . . . . . . . . . . . 24.2 (0.27) 27.4 (0.35) 21.1 (0.30)
Age
18–24 years . . . . . . . . . . . . . . . . . . . . . . . . . . . . . . . . . . . . . . . . . . . . . 35.0 (0.81) 44.0 (1.19) 26.2 (0.89) 25–44 years . . . . . . . . . . . . . . . . . . . . . . . . . . . . . . . . . . . . . . . . . . . . . 27.5 (0.38) 31.3 (0.53) 23.7 (0.45) 45–64 years . . . . . . . . . . . . . . . . . . . . . . . . . . . . . . . . . . . . . . . . . . . . . 21.4 (0.39) 22.1 (0.49) 20.7 (0.48) 65–74 years . . . . . . . . . . . . . . . . . . . . . . . . . . . . . . . . . . . . . . . . . . . . . 14.8 (0.54) 14.9 (0.72) 14.8 (0.75) 75 years and over . . . . . . . . . . . . . . . . . . . . . . . . . . . . . . . . . . . . . . . . . 10.6 (0.47) 13.7 (0.83) 8.6 (0.49)
Race
White, single race. . . . . . . . . . . . . . . . . . . . . . . . . . . . . . . . . . . . . . . . . . 24.4 (0.30) 26.9 (0.40) 22.0 (0.34) Black or African American, single race . . . . . . . . . . . . . . . . . . . . . . . . . . . . . 21.8 (0.59) 30.9 (0.97) 14.4 (0.54) American Indian or Alaska Native, single race . . . . . . . . . . . . . . . . . . . . . . . . 20.9 (2.00) 24.6 (2.96) 17.2 (2.74) Asian, single race . . . . . . . . . . . . . . . . . . . . . . . . . . . . . . . . . . . . . . . . . . 21.8 (0.86) 27.3 (1.35) 16.7 (1.02) Native Hawaiian or Other Pacific Islander, single race . . . . . . . . . . . . . . . . . . . 31.6 (5.26) 38.6 (8.83) *23.8 (7.39) Two or more races . . . . . . . . . . . . . . . . . . . . . . . . . . . . . . . . . . . . . . . . . 31.9 (2.05) 37.0 (2.85) 27.0 (2.74)
Black or African American, white . . . . . . . . . . . . . . . . . . . . . . . . . . . . . . . 34.7 (4.49) 41.7 (7.99) 30.1 (5.45) American Indian or Alaska Native, white . . . . . . . . . . . . . . . . . . . . . . . . . . 23.8 (2.48) 29.2 (3.74) 17.5 (2.89)
Hispanic or Latino origin and race
Hispanic or Latino. . . . . . . . . . . . . . . . . . . . . . . . . . . . . . . . . . . . . . . . . . 18.3 (0.47) 23.3 (0.69) 13.0 (0.55) Mexican or Mexican American. . . . . . . . . . . . . . . . . . . . . . . . . . . . . . . . . 17.9 (0.60) 22.9 (0.87) 12.3 (0.72)
Not Hispanic or Latino . . . . . . . . . . . . . . . . . . . . . . . . . . . . . . . . . . . . . . . 24.9 (0.30) 28.1 (0.40) 21.9 (0.33) White, single race . . . . . . . . . . . . . . . . . . . . . . . . . . . . . . . . . . . . . . . . 25.5 (0.33) 27.7 (0.44) 23.5 (0.37) Black or African American, single race. . . . . . . . . . . . . . . . . . . . . . . . . . . . 21.7 (0.60) 30.8 (0.98) 14.4 (0.55)
Education
Less than high school graduate . . . . . . . . . . . . . . . . . . . . . . . . . . . . . . . . . 11.2 (0.38) 14.8 (0.62) 7.8 (0.41) GED diploma4 . . . . . . . . . . . . . . . . . . . . . . . . . . . . . . . . . . . . . . . . . . . . 14.5 (0.97) 18.5 (1.61) 10.2 (1.13) High school graduate. . . . . . . . . . . . . . . . . . . . . . . . . . . . . . . . . . . . . . . . 16.7 (0.38) 19.7 (0.59) 13.9 (0.45) Some college—no degree. . . . . . . . . . . . . . . . . . . . . . . . . . . . . . . . . . . . . 28.4 (0.58) 33.9 (0.90) 23.5 (0.61) Associate of arts degree. . . . . . . . . . . . . . . . . . . . . . . . . . . . . . . . . . . . . . 27.4 (0.67) 30.5 (1.01) 24.9 (0.80) Bachelor of arts, science degree. . . . . . . . . . . . . . . . . . . . . . . . . . . . . . . . . 35.7 (0.54) 38.8 (0.76) 32.6 (0.73) Masters, doctorate, medical degree . . . . . . . . . . . . . . . . . . . . . . . . . . . . . . . 38.9 (0.77) 39.7 (1.07) 38.0 (1.05)
Poverty status5
Below poverty level . . . . . . . . . . . . . . . . . . . . . . . . . . . . . . . . . . . . . . . . . 16.5 (0.75) 23.0 (1.26) 11.9 (0.62) ≥1 and <2 times poverty level . . . . . . . . . . . . . . . . . . . . . . . . . . . . . . . . . . 16.0 (0.41) 19.5 (0.68) 13.0 (0.47) ≥2 and <4 times poverty level . . . . . . . . . . . . . . . . . . . . . . . . . . . . . . . . . . 21.6 (0.43) 24.7 (0.59) 18.8 (0.49) 4 times poverty level or more. . . . . . . . . . . . . . . . . . . . . . . . . . . . . . . . . . . 32.3 (0.43) 34.1 (0.55) 30.3 (0.55)
Marital status
Never married . . . . . . . . . . . . . . . . . . . . . . . . . . . . . . . . . . . . . . . . . . . . 33.3 (0.62) 39.5 (0.83) 25.9 (0.73) Married . . . . . . . . . . . . . . . . . . . . . . . . . . . . . . . . . . . . . . . . . . . . . . . . 22.7 (0.32) 23.6 (0.40) 21.7 (0.41) Cohabiting . . . . . . . . . . . . . . . . . . . . . . . . . . . . . . . . . . . . . . . . . . . . . . 24.3 (0.82) 27.1 (1.21) 21.2 (1.05) Divorced or separated . . . . . . . . . . . . . . . . . . . . . . . . . . . . . . . . . . . . . . . 21.4 (0.48) 26.2 (0.82) 18.1 (0.54) Widowed . . . . . . . . . . . . . . . . . . . . . . . . . . . . . . . . . . . . . . . . . . . . . . . 11.2 (0.45) 14.8 (1.07) 10.3 (0.49)
Geographic region
Northeast . . . . . . . . . . . . . . . . . . . . . . . . . . . . . . . . . . . . . . . . . . . . . . . 24.8 (0.63) 27.9 (0.85) 22.0 (0.68) Midwest . . . . . . . . . . . . . . . . . . . . . . . . . . . . . . . . . . . . . . . . . . . . . . . . 26.4 (0.64) 29.4 (0.82) 23.5 (0.67) South . . . . . . . . . . . . . . . . . . . . . . . . . . . . . . . . . . . . . . . . . . . . . . . . . 21.5 (0.45) 25.6 (0.59) 17.8 (0.51) West . . . . . . . . . . . . . . . . . . . . . . . . . . . . . . . . . . . . . . . . . . . . . . . . . . 25.2 (0.51) 28.2 (0.76) 22.2 (0.55)
* Estimates preceded by an asterisk have a relative standard error of greater than 30% and less than or equal to 50%. These should be interpreted with caution as they do not meet the standard of reliability or precision. 1Strengthening activities include leisure-time physical activities specifically designed to strengthen muscles such as weight lifting or calisthenics. No minimum duration imposed when asking frequency and no duration question was asked. 2Persons of other races and unknown race and ethnicity, unknown education, unknown poverty status, and unknown marital status are included in the total. 3Estimates are age adjusted using the projected 2000 U.S. population as the standard population and using three age groups: 18–44 years, 45–64 years, and 65 years and over. 4GED is General Educational Development high school equivalency diploma. 5Poverty status is based on family income and family size using the U.S. Census Bureau poverty thresholds for 2004, 2005, and 2006.
NOTES: For age-adjusted percentages, refer to Table 5.5. Denominator for each percentage excludes persons with unknown leisure-time strengthening activity status. See Appendix II for definitions of terms. See Appendix III for health behavior questions.
DATA SOURCE: National Health Interview Survey, 2005–2007. Estimates are based on household interviews of a sample of the civilian noninstitutionalized population.

Series 10, No. 245 [ Page 119
Table XVII. Crude percentages (with standard errors) of adults 18 years of age and over who were overweight, by selected characteristics: United States, average annual, 2005–2007
Overweight (BMI of 25 or more)1
Selected characteristic Both sexes Men Women
Percent (standard error)
Ages 18 years and over (crude)2 . . . . . . . . . . . . . . . . . . 60.8 (0.25) 68.3 (0.33) 53.5 (0.34) Ages 18 years and over (age-adjusted)2,3 . . . . . . . . . . . . 60.4 (0.25) 67.9 (0.33) 53.0 (0.34)
Age
18–24 years . . . . . . . . . . . . . . . . . . . . . . . . . . . . . . . 41.8 (0.72) 46.6 (1.05) 37.0 (0.97) 25–44 years . . . . . . . . . . . . . . . . . . . . . . . . . . . . . . . 60.9 (0.37) 70.1 (0.49) 51.4 (0.52) 45–64 years . . . . . . . . . . . . . . . . . . . . . . . . . . . . . . . 68.2 (0.36) 75.8 (0.49) 60.6 (0.53) 65–74 years . . . . . . . . . . . . . . . . . . . . . . . . . . . . . . . 67.0 (0.65) 71.8 (0.89) 62.8 (0.95) 75 years and over . . . . . . . . . . . . . . . . . . . . . . . . . . . 53.3 (0.73) 58.2 (1.13) 50.0 (0.92)
Race
White, single race . . . . . . . . . . . . . . . . . . . . . . . . . . . 60.7 (0.28) 69.3 (0.37) 52.3 (0.39) Black or African American, single race. . . . . . . . . . . . . . . 69.1 (0.55) 69.2 (0.88) 69.0 (0.69) American Indian or Alaska Native, single race . . . . . . . . . . 69.6 (2.33) 71.7 (3.64) 67.4 (3.07) Asian, single race . . . . . . . . . . . . . . . . . . . . . . . . . . . 37.2 (1.05) 46.7 (1.50) 28.0 (1.35) Native Hawaiian or Other Pacific Islander, single race . . . . . 67.9 (5.23) 77.0 (7.58) 57.6 (8.16) Two or more races . . . . . . . . . . . . . . . . . . . . . . . . . . . 64.7 (1.96) 72.2 (2.44) 57.1 (2.89)
Black or African American, white . . . . . . . . . . . . . . . . . 58.6 (4.77) 56.5 (8.08) 60.1 (6.18) American Indian or Alaska Native, white . . . . . . . . . . . . 70.8 (2.57) 77.1 (3.10) 63.2 (4.23)
Hispanic or Latino origin and race
Hispanic or Latino . . . . . . . . . . . . . . . . . . . . . . . . . . . 66.4 (0.54) 71.3 (0.77) 61.1 (0.73) Mexican or Mexican American . . . . . . . . . . . . . . . . . . 67.4 (0.68) 71.4 (0.94) 62.7 (0.94)
Not Hispanic or Latino. . . . . . . . . . . . . . . . . . . . . . . . . 60.0 (0.27) 67.9 (0.36) 52.5 (0.36) White, single race . . . . . . . . . . . . . . . . . . . . . . . . . . 59.8 (0.30) 69.0 (0.40) 50.9 (0.42) Black or African American, single race . . . . . . . . . . . . . 69.1 (0.56) 69.1 (0.89) 69.1 (0.70)
Education
Less than high school graduate . . . . . . . . . . . . . . . . . . . 64.2 (0.53) 65.6 (0.78) 62.7 (0.73) GED diploma4 . . . . . . . . . . . . . . . . . . . . . . . . . . . . . . 68.2 (1.35) 71.0 (1.83) 65.1 (1.91) High school graduate . . . . . . . . . . . . . . . . . . . . . . . . . 63.3 (0.47) 69.3 (0.61) 57.5 (0.63) Some college—no degree . . . . . . . . . . . . . . . . . . . . . . 60.0 (0.58) 67.8 (0.81) 52.9 (0.75) Associate of arts degree . . . . . . . . . . . . . . . . . . . . . . . 64.6 (0.68) 74.4 (0.98) 56.7 (0.92) Bachelor of arts, science degree . . . . . . . . . . . . . . . . . . 55.4 (0.55) 68.7 (0.77) 41.9 (0.74) Masters, doctorate, medical degree . . . . . . . . . . . . . . . . 53.5 (0.75) 64.6 (1.04) 41.2 (1.06)
Poverty status5
Below poverty level . . . . . . . . . . . . . . . . . . . . . . . . . . 59.4 (0.73) 59.5 (1.10) 59.3 (0.86) ≥1 and <2 times poverty level . . . . . . . . . . . . . . . . . . . . 61.5 (0.56) 64.5 (0.91) 58.9 (0.65) ≥2 and <4 times poverty level . . . . . . . . . . . . . . . . . . . . 61.7 (0.46) 69.1 (0.57) 54.4 (0.69) 4 times poverty level or more . . . . . . . . . . . . . . . . . . . . 60.2 (0.39) 71.6 (0.53) 47.6 (0.62)
Marital status
Never married. . . . . . . . . . . . . . . . . . . . . . . . . . . . . . 50.8 (0.56) 54.3 (0.74) 46.4 (0.81) Married . . . . . . . . . . . . . . . . . . . . . . . . . . . . . . . . . . 64.3 (0.31) 74.1 (0.39) 53.9 (0.45) Cohabiting . . . . . . . . . . . . . . . . . . . . . . . . . . . . . . . . 58.9 (0.92) 66.1 (1.26) 50.8 (1.31) Divorced or separated. . . . . . . . . . . . . . . . . . . . . . . . . 64.1 (0.55) 69.8 (0.79) 60.1 (0.70) Widowed . . . . . . . . . . . . . . . . . . . . . . . . . . . . . . . . . 58.0 (0.68) 60.5 (1.53) 57.3 (0.77)
Geographic region
Northeast . . . . . . . . . . . . . . . . . . . . . . . . . . . . . . . . 58.8 (0.62) 67.8 (0.83) 50.5 (0.80) Midwest . . . . . . . . . . . . . . . . . . . . . . . . . . . . . . . . . 61.8 (0.53) 69.4 (0.67) 54.4 (0.77) South . . . . . . . . . . . . . . . . . . . . . . . . . . . . . . . . . . . 62.2 (0.40) 69.0 (0.54) 55.7 (0.56) West . . . . . . . . . . . . . . . . . . . . . . . . . . . . . . . . . . . 58.9 (0.53) 66.5 (0.72) 51.2 (0.67)
1Body Mass Index (BMI) is calculated as kilograms/meters2, using self-reported height and weight. Overweight is a BMI greater than or equal to 25, which includes obese. 2Persons of other races and unknown race and ethnicity, unknown education, unknown poverty status, and unknown marital status are included in the total. 3Estimates are age adjusted using the projected 2000 U.S. population as the standard population and using three age groups: 18–44 years, 45–64 years, and 65 years and over. 4GED is General Educational Development high school equivalency diploma. 5Poverty status is based on family income and family size using the U.S. Census Bureau poverty thresholds for 2004, 2005, and 2006.
NOTES: For age-adjusted percentages, refer to Table 6.1. Denominator for each percentage excludes persons with unknown body mass index. See Appendix II for definitions of terms. See Appendix III for health behavior questions.
DATA SOURCE: National Health Interview Survey, 2005–2007. Estimates are based on household interviews of a sample of the civilian noninstitutionalized population.

Page 120 [ Series 10, No. 245
Table XVIII. Crude percent distributions (with standard errors) of body weight status for adults 18 years of age and over, by selected characteristics: United States, average annual, 2005–2007
Body weight status1
Not overweight Overweight
Healthy Overweight Selected characteristic Total Underweight weight (but not obese) Obese
Both sexes Percent distribution (standard error)
Ages 18 years and over (crude)2 . . . . . . . . . . . . . . . . . . 100.0 1.9 (0.07) 37.3 (0.25) 35.2 (0.22) 25.6 (0.22) Ages 18 years and over (age-adjusted)2,3 . . . . . . . . . . . . 100.0 1.9 (0.07) 37.7 (0.25) 35.0 (0.22) 25.4 (0.22)
Age: 18–24 years . . . . . . . . . . . . . . . . . . . . . . . . . . . . . 100.0 3.8 (0.31) 54.3 (0.73) 25.8 (0.63) 16.0 (0.52) 25–44 years . . . . . . . . . . . . . . . . . . . . . . . . . . . . . 100.0 1.6 (0.09) 37.5 (0.37) 34.8 (0.34) 26.1 (0.34) 45–64 years . . . . . . . . . . . . . . . . . . . . . . . . . . . . . 100.0 1.1 (0.09) 30.7 (0.36) 37.9 (0.39) 30.3 (0.39) 65–74 years . . . . . . . . . . . . . . . . . . . . . . . . . . . . . 100.0 1.4 (0.16) 31.5 (0.65) 39.6 (0.66) 27.5 (0.62) 75 years and over . . . . . . . . . . . . . . . . . . . . . . . . . . 100.0 3.6 (0.27) 43.1 (0.71) 36.1 (0.65) 17.2 (0.52)
Race: White, single race . . . . . . . . . . . . . . . . . . . . . . . . . . 100.0 1.8 (0.08) 37.5 (0.27) 35.6 (0.25) 25.1 (0.24) Black or African American, single race . . . . . . . . . . . . . 100.0 1.4 (0.14) 29.6 (0.55) 34.7 (0.53) 34.3 (0.58) American Indian or Alaska Native, single race . . . . . . . . 100.0 *0.9 (0.39) 29.5 (2.37) 36.3 (2.13) 33.3 (2.39) Asian, single race . . . . . . . . . . . . . . . . . . . . . . . . . . 100.0 5.0 (0.54) 57.9 (1.04) 28.4 (0.95) 8.7 (0.58) Native Hawaiian or Other Pacific Islander, single race. . . . 100.0 † 29.0 (5.20) 36.3 (6.43) 31.6 (6.77) Two or more races . . . . . . . . . . . . . . . . . . . . . . . . . 100.0 1.3 (0.36) 34.0 (1.92) 34.6 (1.91) 30.2 (1.85)
Black or African American, white . . . . . . . . . . . . . . . 100.0 † 40.0 (4.79) 40.6 (4.80) 18.0 (3.38) American Indian or Alaska Native, white . . . . . . . . . . . 100.0 *1.2 (0.50) 28.0 (2.50) 35.5 (2.63) 35.3 (2.69)
Hispanic or Latino origin and race: Hispanic or Latino . . . . . . . . . . . . . . . . . . . . . . . . . . 100.0 1.2 (0.12) 32.3 (0.53) 39.2 (0.55) 27.2 (0.52)
Mexican or Mexican American . . . . . . . . . . . . . . . . . 100.0 1.2 (0.16) 31.5 (0.66) 38.5 (0.68) 28.8 (0.67) Not Hispanic or Latino . . . . . . . . . . . . . . . . . . . . . . . 100.0 2.0 (0.08) 38.1 (0.27) 34.6 (0.24) 25.4 (0.24)
White, single race . . . . . . . . . . . . . . . . . . . . . . . . 100.0 1.9 (0.09) 38.3 (0.30) 35.1 (0.27) 24.7 (0.26) Black or African American, single race . . . . . . . . . . . . 100.0 1.4 (0.14) 29.5 (0.56) 34.3 (0.54) 34.8 (0.59)
Education: Less than high school graduate . . . . . . . . . . . . . . . . . 100.0 2.3 (0.24) 33.5 (0.52) 35.0 (0.51) 29.1 (0.50) GED diploma4 . . . . . . . . . . . . . . . . . . . . . . . . . . . . 100.0 1.6 (0.34) 30.2 (1.32) 35.8 (1.29) 32.4 (1.33) High school graduate . . . . . . . . . . . . . . . . . . . . . . . . 100.0 1.8 (0.12) 34.9 (0.47) 35.0 (0.43) 28.2 (0.42) Some college—no degree . . . . . . . . . . . . . . . . . . . . . 100.0 1.8 (0.15) 38.2 (0.56) 33.1 (0.51) 26.9 (0.49) Associate of arts degree . . . . . . . . . . . . . . . . . . . . . . 100.0 1.5 (0.18) 33.9 (0.67) 36.7 (0.68) 27.9 (0.62) Bachelor of arts, science degree . . . . . . . . . . . . . . . . . 100.0 1.7 (0.14) 42.8 (0.54) 36.1 (0.52) 19.3 (0.43) Masters, doctorate, medical degree . . . . . . . . . . . . . . . 100.0 1.8 (0.18) 44.7 (0.76) 36.8 (0.71) 16.7 (0.56)
Poverty status:5
Below poverty level . . . . . . . . . . . . . . . . . . . . . . . . . 100.0 2.8 (0.24) 37.8 (0.71) 31.3 (0.59) 28.1 (0.62) ≥1 and <2 times poverty level . . . . . . . . . . . . . . . . . . 100.0 2.2 (0.19) 36.3 (0.53) 33.8 (0.54) 27.7 (0.46) ≥2 and <4 times poverty level . . . . . . . . . . . . . . . . . . 100.0 1.8 (0.13) 36.5 (0.45) 35.0 (0.41) 26.7 (0.40) 4 times poverty level or more . . . . . . . . . . . . . . . . . . . 100.0 1.5 (0.10) 38.3 (0.39) 37.2 (0.37) 23.0 (0.33)
Marital status: Never married . . . . . . . . . . . . . . . . . . . . . . . . . . . . 100.0 3.1 (0.22) 46.1 (0.55) 29.2 (0.48) 21.5 (0.46) Married . . . . . . . . . . . . . . . . . . . . . . . . . . . . . . . . 100.0 1.4 (0.07) 34.4 (0.31) 37.7 (0.30) 26.5 (0.29) Cohabiting . . . . . . . . . . . . . . . . . . . . . . . . . . . . . . 100.0 1.7 (0.24) 39.3 (0.91) 33.1 (0.84) 25.8 (0.78) Divorced or separated . . . . . . . . . . . . . . . . . . . . . . . 100.0 1.5 (0.14) 34.4 (0.54) 34.7 (0.51) 29.4 (0.52) Widowed . . . . . . . . . . . . . . . . . . . . . . . . . . . . . . . 100.0 3.1 (0.25) 38.9 (0.67) 33.8 (0.67) 24.1 (0.60)
Geographic region: Northeast . . . . . . . . . . . . . . . . . . . . . . . . . . . . . . . 100.0 2.0 (0.18) 39.2 (0.61) 34.8 (0.53) 24.0 (0.52) Midwest . . . . . . . . . . . . . . . . . . . . . . . . . . . . . . . . 100.0 1.6 (0.12) 36.5 (0.54) 34.7 (0.45) 27.1 (0.49) South . . . . . . . . . . . . . . . . . . . . . . . . . . . . . . . . . 100.0 2.0 (0.14) 35.8 (0.38) 35.1 (0.34) 27.1 (0.37) West . . . . . . . . . . . . . . . . . . . . . . . . . . . . . . . . . . 100.0 1.8 (0.12) 39.3 (0.53) 36.1 (0.51) 22.8 (0.42)
Men
Ages 18 years and over (crude)2 . . . . . . . . . . . . . . . . . . 100.0 1.0 (0.08) 30.7 (0.33) 42.4 (0.34) 26.0 (0.31) Ages 18 years and over (age-adjusted)2,3 . . . . . . . . . . . . 100.0 1.0 (0.08) 31.1 (0.33) 42.2 (0.34) 25.7 (0.30)
Age: 18–24 years . . . . . . . . . . . . . . . . . . . . . . . . . . . . . 100.0 2.9 (0.46) 50.5 (1.06) 30.7 (0.96) 15.9 (0.76) 25–44 years . . . . . . . . . . . . . . . . . . . . . . . . . . . . . 100.0 0.6 (0.08) 29.3 (0.49) 42.9 (0.51) 27.3 (0.49) 45–64 years . . . . . . . . . . . . . . . . . . . . . . . . . . . . . 100.0 0.5 (0.07) 23.7 (0.48) 45.4 (0.58) 30.5 (0.53) 65–74 years . . . . . . . . . . . . . . . . . . . . . . . . . . . . . 100.0 1.0 (0.19) 27.2 (0.87) 46.3 (1.02) 25.5 (0.91) 75 years and over . . . . . . . . . . . . . . . . . . . . . . . . . . 100.0 2.4 (0.42) 39.4 (1.09) 42.3 (1.12) 15.9 (0.86)
See footnotes at end of table.

Series 10, No. 245 [ Page 121
Table XVIII. Crude percent distributions (with standard errors) of body weight status for adults 18 years of age and over, by selected characteristics: United States, average annual, 2005–2007—Con.
Body weight status1
Not overweight Overweight
Healthy Overweight Selected characteristic Total Underweight weight (but not obese) Obese
Men—Con. Percent distribution (standard error) Race:
White, single race . . . . . . . . . . . . . . . . . . . . . . . . . . 100.0 0.9 (0.09) 29.8 (0.36) 43.1 (0.38) 26.2 (0.33) Black or African American, single race . . . . . . . . . . . . . 100.0 1.1 (0.21) 29.7 (0.87) 39.7 (0.87) 29.5 (0.84) American Indian or Alaska Native, single race . . . . . . . . 100.0 † 27.4 (3.65) 39.2 (3.84) 32.6 (3.88) Asian, single race . . . . . . . . . . . . . . . . . . . . . . . . . . 100.0 3.0 (0.64) 50.3 (1.50) 36.3 (1.40) 10.4 (0.88) Native Hawaiian or Other Pacific Islander, single race. . . . 100.0 – *23.0 (7.58) 36.8 (9.43) 40.2 (9.95) Two or more races . . . . . . . . . . . . . . . . . . . . . . . . . 100.0 *1.5 (0.60) 26.3 (2.39) 39.4 (3.29) 32.8 (3.10)
Black or African American, white . . . . . . . . . . . . . . . 100.0 † 40.1 (8.03) 44.6 (8.20) *11.9 (4.34) American Indian or Alaska Native, white . . . . . . . . . . . 100.0 † 21.6 (3.01) 39.0 (4.15) 38.0 (4.09)
Hispanic or Latino origin and race: Hispanic or Latino . . . . . . . . . . . . . . . . . . . . . . . . . . 100.0 0.8 (0.15) 27.9 (0.76) 45.4 (0.82) 25.9 (0.72)
Mexican or Mexican American . . . . . . . . . . . . . . . . . 100.0 0.7 (0.19) 27.9 (0.94) 44.9 (1.01) 26.5 (0.89) Not Hispanic or Latino . . . . . . . . . . . . . . . . . . . . . . . 100.0 1.0 (0.09) 31.1 (0.36) 41.9 (0.37) 26.0 (0.33)
White, single race . . . . . . . . . . . . . . . . . . . . . . . . 100.0 0.9 (0.10) 30.1 (0.40) 42.8 (0.42) 26.2 (0.37) Black or African American, single race . . . . . . . . . . . . 100.0 1.2 (0.22) 29.8 (0.88) 39.2 (0.89) 29.9 (0.87)
Education: Less than high school graduate . . . . . . . . . . . . . . . . . 100.0 1.9 (0.33) 32.5 (0.78) 38.9 (0.77) 26.7 (0.72) GED diploma4 . . . . . . . . . . . . . . . . . . . . . . . . . . . . 100.0 *1.6 (0.49) 27.5 (1.78) 41.3 (1.99) 29.7 (1.79) High school graduate . . . . . . . . . . . . . . . . . . . . . . . . 100.0 1.0 (0.13) 29.7 (0.60) 40.7 (0.64) 28.6 (0.60) Some college—no degree . . . . . . . . . . . . . . . . . . . . . 100.0 1.1 (0.19) 31.1 (0.79) 39.9 (0.82) 27.9 (0.74) Associate of arts degree . . . . . . . . . . . . . . . . . . . . . . 100.0 *0.4 (0.12) 25.3 (0.97) 45.8 (1.11) 28.6 (0.93) Bachelor of arts, science degree . . . . . . . . . . . . . . . . . 100.0 0.6 (0.12) 30.7 (0.76) 46.7 (0.81) 22.0 (0.65) Masters, doctorate, medical degree . . . . . . . . . . . . . . . 100.0 *0.4 (0.12) 35.0 (1.04) 46.6 (1.09) 18.0 (0.82)
Poverty status:5
Below poverty level . . . . . . . . . . . . . . . . . . . . . . . . . 100.0 2.3 (0.46) 38.2 (1.07) 36.6 (1.04) 22.9 (0.93) ≥1 and <2 times poverty level . . . . . . . . . . . . . . . . . . 100.0 1.6 (0.27) 33.9 (0.85) 38.8 (0.88) 25.7 (0.70) ≥2 and <4 times poverty level . . . . . . . . . . . . . . . . . . 100.0 0.9 (0.13) 29.9 (0.56) 41.7 (0.59) 27.4 (0.55) 4 times poverty level or more . . . . . . . . . . . . . . . . . . . 100.0 0.5 (0.08) 27.9 (0.53) 45.8 (0.56) 25.8 (0.49)
Marital status: Never married . . . . . . . . . . . . . . . . . . . . . . . . . . . . 100.0 2.3 (0.29) 43.4 (0.74) 34.9 (0.72) 19.4 (0.60) Married . . . . . . . . . . . . . . . . . . . . . . . . . . . . . . . . 100.0 0.6 (0.07) 25.3 (0.39) 45.4 (0.45) 28.7 (0.41) Cohabiting . . . . . . . . . . . . . . . . . . . . . . . . . . . . . . 100.0 *0.7 (0.24) 33.2 (1.24) 39.5 (1.28) 26.5 (1.10) Divorced or separated . . . . . . . . . . . . . . . . . . . . . . . 100.0 0.8 (0.15) 29.4 (0.78) 43.2 (0.88) 26.7 (0.76) Widowed . . . . . . . . . . . . . . . . . . . . . . . . . . . . . . . 100.0 1.7 (0.40) 37.8 (1.55) 41.3 (1.56) 19.2 (1.17)
Geographic region: Northeast . . . . . . . . . . . . . . . . . . . . . . . . . . . . . . . 100.0 0.9 (0.17) 31.3 (0.82) 42.9 (0.88) 24.9 (0.80) Midwest . . . . . . . . . . . . . . . . . . . . . . . . . . . . . . . . 100.0 0.7 (0.11) 29.9 (0.67) 41.5 (0.67) 27.9 (0.59) South . . . . . . . . . . . . . . . . . . . . . . . . . . . . . . . . . 100.0 1.2 (0.17) 29.8 (0.53) 41.7 (0.55) 27.3 (0.53) West . . . . . . . . . . . . . . . . . . . . . . . . . . . . . . . . . . 100.0 1.0 (0.14) 32.5 (0.72) 43.9 (0.74) 22.5 (0.59)
Women
Ages 18 years and over (crude)2 . . . . . . . . . . . . . . . . . . 100.0 2.7 (0.10) 43.8 (0.34) 28.2 (0.27) 25.3 (0.29) Ages 18 years and over (age-adjusted)2,3 . . . . . . . . . . . . 100.0 2.7 (0.11) 44.2 (0.34) 28.0 (0.27) 25.0 (0.29)
Age: 18–24 years . . . . . . . . . . . . . . . . . . . . . . . . . . . . . 100.0 4.8 (0.40) 58.2 (0.97) 20.8 (0.78) 16.2 (0.70) 25–44 years . . . . . . . . . . . . . . . . . . . . . . . . . . . . . 100.0 2.7 (0.17) 45.9 (0.52) 26.6 (0.44) 24.8 (0.44) 45–64 years . . . . . . . . . . . . . . . . . . . . . . . . . . . . . 100.0 1.7 (0.16) 37.7 (0.54) 30.5 (0.51) 30.2 (0.52) 65–74 years . . . . . . . . . . . . . . . . . . . . . . . . . . . . . 100.0 1.9 (0.25) 35.4 (0.96) 33.5 (0.85) 29.2 (0.84) 75 years and over . . . . . . . . . . . . . . . . . . . . . . . . . . 100.0 4.4 (0.36) 45.6 (0.90) 32.0 (0.83) 18.0 (0.66)
Race: White, single race . . . . . . . . . . . . . . . . . . . . . . . . . . 100.0 2.7 (0.11) 45.0 (0.39) 28.2 (0.31) 24.1 (0.32) Black or African American, single race . . . . . . . . . . . . . 100.0 1.5 (0.18) 29.5 (0.69) 30.6 (0.64) 38.4 (0.74) American Indian or Alaska Native, single race . . . . . . . . 100.0 † 31.7 (3.12) 33.3 (3.24) 34.1 (3.45) Asian, single race . . . . . . . . . . . . . . . . . . . . . . . . . . 100.0 6.9 (0.84) 65.2 (1.41) 20.8 (1.23) 7.1 (0.70) Native Hawaiian or Other Pacific Islander, single race. . . . 100.0 † 35.7 (8.04) 35.7 (8.80) *21.9 (6.71) Two or more races . . . . . . . . . . . . . . . . . . . . . . . . . 100.0 *1.1 (0.42) 41.8 (2.88) 29.7 (2.39) 27.5 (2.21)
Black or African American, white . . . . . . . . . . . . . . . 100.0 – 39.9 (6.18) 37.8 (5.93) 22.3 (4.79) American Indian or Alaska Native, white . . . . . . . . . . . 100.0 † 35.7 (4.13) 31.2 (3.69) 32.0 (3.38)
See footnotes at end of table.

Page 122 [ Series 10, No. 245
Table XVIII. Crude percent distributions (with standard errors) of body weight status for adults 18 years of age and over, by selected characteristics: United States, average annual, 2005–2007—Con.
Body weight status1
Not overweight Overweight
Healthy Overweight Selected characteristic Total Underweight weight (but not obese) Obese
Women—Con. Percent distribution (standard error)
Hispanic or Latino origin and race: Hispanic or Latino . . . . . . . . . . . . . . . . . . . . . . . . . . 100.0 1.8 (0.20) 37.2 (0.73) 32.4 (0.68) 28.6 (0.69)
Mexican or Mexican American . . . . . . . . . . . . . . . . . 100.0 1.7 (0.27) 35.6 (0.94) 31.3 (0.89) 31.4 (0.93) Not Hispanic or Latino . . . . . . . . . . . . . . . . . . . . . . . 100.0 2.8 (0.11) 44.7 (0.37) 27.7 (0.29) 24.8 (0.31)
White, single race . . . . . . . . . . . . . . . . . . . . . . . . 100.0 2.8 (0.12) 46.2 (0.42) 27.5 (0.34) 23.4 (0.35) Black or African American, single race . . . . . . . . . . . . 100.0 1.6 (0.18) 29.3 (0.69) 30.3 (0.65) 38.8 (0.75)
Education: Less than high school graduate . . . . . . . . . . . . . . . . . 100.0 2.8 (0.30) 34.5 (0.70) 31.1 (0.65) 31.7 (0.69) GED diploma4 . . . . . . . . . . . . . . . . . . . . . . . . . . . . 100.0 1.6 (0.48) 33.2 (1.89) 29.7 (1.57) 35.5 (1.81) High school graduate . . . . . . . . . . . . . . . . . . . . . . . . 100.0 2.6 (0.19) 40.0 (0.63) 29.6 (0.52) 27.9 (0.56) Some college—no degree . . . . . . . . . . . . . . . . . . . . . 100.0 2.5 (0.22) 44.6 (0.73) 27.0 (0.61) 26.0 (0.61) Associate of arts degree . . . . . . . . . . . . . . . . . . . . . . 100.0 2.4 (0.31) 40.9 (0.92) 29.2 (0.83) 27.5 (0.82) Bachelor of arts, science degree . . . . . . . . . . . . . . . . . 100.0 2.9 (0.25) 55.2 (0.75) 25.4 (0.63) 16.5 (0.53) Masters, doctorate, medical degree . . . . . . . . . . . . . . . 100.0 3.4 (0.36) 55.4 (1.08) 25.9 (0.95) 15.3 (0.75)
Poverty status:5
Below poverty level . . . . . . . . . . . . . . . . . . . . . . . . . 100.0 3.1 (0.27) 37.6 (0.82) 27.4 (0.75) 31.9 (0.75) ≥1 and <2 times poverty level . . . . . . . . . . . . . . . . . . 100.0 2.8 (0.24) 38.3 (0.66) 29.4 (0.70) 29.4 (0.63) ≥2 and <4 times poverty level . . . . . . . . . . . . . . . . . . 100.0 2.6 (0.21) 43.0 (0.66) 28.5 (0.53) 25.9 (0.54) 4 times poverty level or more . . . . . . . . . . . . . . . . . . . 100.0 2.6 (0.18) 49.8 (0.61) 27.7 (0.52) 19.9 (0.45)
Marital status: Never married . . . . . . . . . . . . . . . . . . . . . . . . . . . . 100.0 4.1 (0.32) 49.5 (0.80) 22.2 (0.60) 24.2 (0.64) Married . . . . . . . . . . . . . . . . . . . . . . . . . . . . . . . . 100.0 2.2 (0.13) 43.8 (0.45) 29.7 (0.38) 24.3 (0.39) Cohabiting . . . . . . . . . . . . . . . . . . . . . . . . . . . . . . 100.0 2.9 (0.44) 46.3 (1.32) 25.8 (1.12) 25.1 (1.08) Divorced or separated . . . . . . . . . . . . . . . . . . . . . . . 100.0 2.0 (0.21) 37.9 (0.71) 28.7 (0.62) 31.3 (0.71) Widowed . . . . . . . . . . . . . . . . . . . . . . . . . . . . . . . 100.0 3.5 (0.30) 39.2 (0.74) 32.0 (0.76) 25.4 (0.69)
Geographic region: Northeast . . . . . . . . . . . . . . . . . . . . . . . . . . . . . . . 100.0 3.0 (0.29) 46.4 (0.83) 27.4 (0.63) 23.2 (0.65) Midwest . . . . . . . . . . . . . . . . . . . . . . . . . . . . . . . . 100.0 2.5 (0.19) 43.1 (0.79) 28.0 (0.56) 26.4 (0.71) South . . . . . . . . . . . . . . . . . . . . . . . . . . . . . . . . . 100.0 2.8 (0.18) 41.5 (0.54) 28.8 (0.45) 26.9 (0.47) West . . . . . . . . . . . . . . . . . . . . . . . . . . . . . . . . . . 100.0 2.5 (0.20) 46.3 (0.67) 28.2 (0.57) 23.0 (0.51)
* Estimates preceded by an asterisk have a relative standard error of greater than 30% and less then or equal to 50%. These should be interpreted with caution as they do not meet the standard of reliability or precision.
† Estimates with a relative standard error greater than 50% are indicated with a dagger, but are not shown.
– Quanity zero. 1Body weight status was based on Body Mass Index (BMI) calculated as kilograms/meters2, using self-reported height and weight. Underweight is a BMI of less than 18.5; Healthy weight is a BMI of greater than or equal to 18.5 and less than 25; Overweight, but not obese, is a BMI of greater than or equal to 25 and less than 30; Obese is a BMI of greater than or equal to 30. 2Persons of other races and unknown race and ethnicity, unknown education, unknown poverty status, and unknown marital status are included in the total. 3Estimates are age adjusted using the projected 2000 U.S. population as the standard population and using three age groups: 18–44 years, 45–64 years, and 65 years and over. 4GED is General Educational Development high school equivalency diploma. 5Poverty status is based on family income and family size using the U.S. Census Bureau poverty thresholds for 2004, 2005, and 2006.
NOTES: For age-adjusted percent distributions, refer to Table 6.2. Denominator for each percent distribution excludes persons with unknown body mass index. See Appendix II for definitions of terms. See Appendix III for health behavior questions.
DATA SOURCE: National Health Interview Survey, 2005–2007. Estimates are based on household interviews of a sample of the civilian noninstitutionalized population.

Series 10, No. 245 [ Page 123
Table XIX. Crude percent distributions (with standard errors) of usual hours of sleep for adults 18 years of age and over, by selected characteristics: United States, 2005–2007
Hours of sleep1
Selected characteristic Total 6 or less 7–8 9 or more
Both sexes Percent distribution (standard error)
Ages 18 years and over (crude)2 . . . . . . . . . . . . . . . . . . 100.0 28.1 (0.22) 63.5 (0.24) 8.4 (0.12) Ages 18 years and over (age-adjusted)2,3 . . . . . . . . . . . . 100.0 28.0 (0.22) 63.5 (0.24) 8.5 (0.12)
Age: 18–24 years . . . . . . . . . . . . . . . . . . . . . . . . . . . . . 100.0 22.8 (0.63) 64.7 (0.71) 12.5 (0.49) 25–44 years . . . . . . . . . . . . . . . . . . . . . . . . . . . . . 100.0 30.2 (0.34) 64.1 (0.36) 5.8 (0.17) 45–64 years . . . . . . . . . . . . . . . . . . . . . . . . . . . . . 100.0 30.4 (0.38) 63.5 (0.40) 6.1 (0.19) 65–74 years . . . . . . . . . . . . . . . . . . . . . . . . . . . . . 100.0 23.9 (0.60) 63.5 (0.64) 12.6 (0.44) 75 years and over . . . . . . . . . . . . . . . . . . . . . . . . . . 100.0 21.9 (0.59) 58.0 (0.69) 20.2 (0.59)
Race: White, single race . . . . . . . . . . . . . . . . . . . . . . . . . . 100.0 27.0 (0.25) 64.7 (0.27) 8.2 (0.13) Black or African American, single race . . . . . . . . . . . . . 100.0 34.7 (0.57) 55.6 (0.61) 9.8 (0.33) American Indian or Alaska Native, single race . . . . . . . . 100.0 29.3 (2.43) 59.1 (2.96) 11.6 (1.80) Asian, single race . . . . . . . . . . . . . . . . . . . . . . . . . . 100.0 29.2 (0.93) 64.2 (0.99) 6.6 (0.55) Native Hawaiian or Other Pacific Islander, single race. . . . 100.0 37.3 (6.07) 58.9 (5.99) † Two or more races . . . . . . . . . . . . . . . . . . . . . . . . . 100.0 33.3 (1.94) 55.1 (2.07) 11.5 (1.66)
Black or African American, white . . . . . . . . . . . . . . . 100.0 33.6 (4.57) 57.2 (4.83) 9.2 (2.68) American Indian or Alaska Native, white . . . . . . . . . . . 100.0 31.1 (2.56) 55.6 (2.76) 13.3 (2.56)
Hispanic or Latino origin and race: Hispanic or Latino . . . . . . . . . . . . . . . . . . . . . . . . . . 100.0 25.6 (0.51) 66.3 (0.52) 8.1 (0.28)
Mexican or Mexican American . . . . . . . . . . . . . . . . . 100.0 22.5 (0.62) 68.3 (0.66) 9.2 (0.38) Not Hispanic or Latino . . . . . . . . . . . . . . . . . . . . . . . 100.0 28.5 (0.24) 63.0 (0.26) 8.4 (0.14)
White, single race . . . . . . . . . . . . . . . . . . . . . . . . 100.0 27.4 (0.28) 64.4 (0.30) 8.3 (0.15) Black or African American, single race . . . . . . . . . . . . 100.0 34.7 (0.58) 55.5 (0.62) 9.8 (0.34)
Education: Less than high school graduate . . . . . . . . . . . . . . . . . 100.0 27.8 (0.49) 59.1 (0.54) 13.1 (0.36) GED diploma4 . . . . . . . . . . . . . . . . . . . . . . . . . . . . 100.0 37.1 (1.35) 51.9 (1.35) 11.0 (0.99) High school graduate . . . . . . . . . . . . . . . . . . . . . . . . 100.0 27.9 (0.38) 62.7 (0.44) 9.4 (0.26) Some college—no degree . . . . . . . . . . . . . . . . . . . . . 100.0 30.6 (0.47) 61.4 (0.51) 8.0 (0.29) Associate of arts degree . . . . . . . . . . . . . . . . . . . . . . 100.0 30.6 (0.62) 62.9 (0.67) 6.5 (0.35) Bachelor of arts, science degree . . . . . . . . . . . . . . . . . 100.0 25.4 (0.49) 69.4 (0.50) 5.2 (0.24) Masters, doctorate, medical degree . . . . . . . . . . . . . . . 100.0 24.9 (0.68) 70.0 (0.71) 5.1 (0.31)
Poverty status:5
Below poverty level . . . . . . . . . . . . . . . . . . . . . . . . . 100.0 31.2 (0.60) 56.4 (0.63) 12.3 (0.41) ≥1 and <2 times poverty level . . . . . . . . . . . . . . . . . . 100.0 29.9 (0.50) 59.8 (0.52) 10.3 (0.35) ≥2 and <4 times poverty level . . . . . . . . . . . . . . . . . . 100.0 27.9 (0.37) 63.2 (0.39) 8.9 (0.23) 4 times poverty level or more . . . . . . . . . . . . . . . . . . . 100.0 26.5 (0.36) 67.7 (0.39) 5.9 (0.19)
Marital status: Never married . . . . . . . . . . . . . . . . . . . . . . . . . . . . 100.0 26.5 (0.47) 63.3 (0.53) 10.2 (0.34) Married . . . . . . . . . . . . . . . . . . . . . . . . . . . . . . . . 100.0 27.1 (0.28) 65.8 (0.30) 7.1 (0.15) Cohabiting . . . . . . . . . . . . . . . . . . . . . . . . . . . . . . 100.0 30.3 (0.92) 60.8 (0.95) 8.9 (0.53) Divorced or separated . . . . . . . . . . . . . . . . . . . . . . . 100.0 36.2 (0.54) 56.8 (0.56) 7.0 (0.27) Widowed . . . . . . . . . . . . . . . . . . . . . . . . . . . . . . . 100.0 26.9 (0.62) 56.7 (0.71) 16.4 (0.56)
Geographic region: Northeast . . . . . . . . . . . . . . . . . . . . . . . . . . . . . . . 100.0 31.1 (0.49) 61.8 (0.55) 7.1 (0.26) Midwest . . . . . . . . . . . . . . . . . . . . . . . . . . . . . . . . 100.0 29.1 (0.48) 62.7 (0.52) 8.3 (0.25) South . . . . . . . . . . . . . . . . . . . . . . . . . . . . . . . . . 100.0 28.0 (0.37) 63.0 (0.40) 9.0 (0.22) West . . . . . . . . . . . . . . . . . . . . . . . . . . . . . . . . . . 100.0 24.8 (0.45) 66.5 (0.49) 8.6 (0.26)
Men
Ages 18 years and over (crude)2 . . . . . . . . . . . . . . . . . . 100.0 28.7 (0.32) 63.6 (0.34) 7.7 (0.18) Ages 18 years and over (age-adjusted)2,3 . . . . . . . . . . . . 100.0 28.4 (0.32) 63.6 (0.34) 8.0 (0.18)
Age: 18–24 years . . . . . . . . . . . . . . . . . . . . . . . . . . . . . 100.0 22.4 (0.89) 66.0 (1.04) 11.6 (0.73) 25–44 years . . . . . . . . . . . . . . . . . . . . . . . . . . . . . 100.0 32.1 (0.51) 63.3 (0.52) 4.6 (0.23) 45–64 years . . . . . . . . . . . . . . . . . . . . . . . . . . . . . 100.0 30.8 (0.54) 63.5 (0.56) 5.7 (0.26) 65–74 years . . . . . . . . . . . . . . . . . . . . . . . . . . . . . 100.0 21.9 (0.85) 64.2 (0.94) 13.9 (0.70) 75 years and over . . . . . . . . . . . . . . . . . . . . . . . . . . 100.0 18.7 (0.91) 60.3 (1.12) 21.0 (0.97)
See footnotes at end of table.

Page 124 [ Series 10, No. 245
Table XIX. Crude percent distributions (with standard errors) of usual hours of sleep for adults 18 years of age and over, by selected characteristics: United States, 2005–2007—Con.
Hours of sleep1
Selected characteristic Total 6 or less 7–8 9 or more
Men—Con. Percent distribution (standard error)
Race: White, single race . . . . . . . . . . . . . . . . . . . . . . . . . . 100.0 27.8 (0.36) 64.8 (0.39) 7.4 (0.19) Black or African American, single race . . . . . . . . . . . . . 100.0 34.8 (0.89) 55.9 (0.92) 9.3 (0.52) American Indian or Alaska Native, single race . . . . . . . . 100.0 25.5 (3.53) 64.4 (3.91) 10.1 (2.47) Asian, single race . . . . . . . . . . . . . . . . . . . . . . . . . . 100.0 30.3 (1.30) 63.1 (1.41) 6.6 (0.82) Native Hawaiian or Other Pacific Islander, single race. . . . 100.0 35.2 (9.67) 58.7 (9.58) † Two or more races . . . . . . . . . . . . . . . . . . . . . . . . . 100.0 29.7 (2.64) 57.6 (3.06) 12.7 (2.85)
Black or African American, white . . . . . . . . . . . . . . . 100.0 31.5 (7.51) 61.7 (7.87) † American Indian or Alaska Native, white . . . . . . . . . . . 100.0 28.0 (3.77) 58.2 (4.22) 13.8 (4.11)
Hispanic or Latino origin and race: Hispanic or Latino . . . . . . . . . . . . . . . . . . . . . . . . . . 100.0 25.3 (0.73) 68.0 (0.76) 6.7 (0.37)
Mexican or Mexican American . . . . . . . . . . . . . . . . . 100.0 22.2 (0.86) 70.1 (0.93) 7.7 (0.51) Not Hispanic or Latino . . . . . . . . . . . . . . . . . . . . . . . 100.0 29.2 (0.35) 62.9 (0.37) 7.9 (0.20)
White, single race . . . . . . . . . . . . . . . . . . . . . . . . 100.0 28.3 (0.40) 64.1 (0.43) 7.6 (0.22) Black or African American, single race . . . . . . . . . . . . 100.0 34.7 (0.90) 55.7 (0.93) 9.6 (0.53)
Education: Less than high school graduate . . . . . . . . . . . . . . . . . 100.0 25.7 (0.73) 61.8 (0.80) 12.5 (0.56) GED diploma4 . . . . . . . . . . . . . . . . . . . . . . . . . . . . 100.0 37.2 (1.92) 51.9 (1.97) 10.9 (1.50) High school graduate . . . . . . . . . . . . . . . . . . . . . . . . 100.0 28.4 (0.57) 62.9 (0.65) 8.7 (0.36) Some college—no degree . . . . . . . . . . . . . . . . . . . . . 100.0 32.0 (0.72) 60.7 (0.76) 7.3 (0.42) Associate of arts degree . . . . . . . . . . . . . . . . . . . . . . 100.0 31.6 (1.00) 62.9 (1.05) 5.5 (0.52) Bachelor of arts, science degree . . . . . . . . . . . . . . . . . 100.0 27.3 (0.72) 68.1 (0.73) 4.7 (0.35) Masters, doctorate, medical degree . . . . . . . . . . . . . . . 100.0 26.2 (0.94) 69.7 (0.97) 4.1 (0.37)
Poverty status:5
Below poverty level . . . . . . . . . . . . . . . . . . . . . . . . . 100.0 29.2 (0.93) 59.0 (0.99) 11.8 (0.64) ≥1 and <2 times poverty level . . . . . . . . . . . . . . . . . . 100.0 29.1 (0.78) 60.8 (0.80) 10.1 (0.55) ≥2 and <4 times poverty level . . . . . . . . . . . . . . . . . . 100.0 28.8 (0.60) 62.8 (0.59) 8.4 (0.36) 4 times poverty level or more . . . . . . . . . . . . . . . . . . . 100.0 28.3 (0.50) 66.6 (0.54) 5.1 (0.26)
Marital status: Never married . . . . . . . . . . . . . . . . . . . . . . . . . . . . 100.0 26.0 (0.64) 64.0 (0.72) 10.0 (0.48) Married . . . . . . . . . . . . . . . . . . . . . . . . . . . . . . . . 100.0 28.1 (0.42) 65.3 (0.44) 6.6 (0.22) Cohabiting . . . . . . . . . . . . . . . . . . . . . . . . . . . . . . 100.0 32.3 (1.29) 60.6 (1.32) 7.1 (0.68) Divorced or separated . . . . . . . . . . . . . . . . . . . . . . . 100.0 37.0 (0.86) 56.0 (0.89) 6.9 (0.41) Widowed . . . . . . . . . . . . . . . . . . . . . . . . . . . . . . . 100.0 26.1 (1.38) 56.7 (1.55) 17.2 (1.29)
Geographic region: Northeast . . . . . . . . . . . . . . . . . . . . . . . . . . . . . . . 100.0 32.3 (0.73) 60.9 (0.79) 6.8 (0.42) Midwest . . . . . . . . . . . . . . . . . . . . . . . . . . . . . . . . 100.0 29.8 (0.72) 62.8 (0.75) 7.5 (0.35) South . . . . . . . . . . . . . . . . . . . . . . . . . . . . . . . . . 100.0 28.5 (0.52) 63.3 (0.56) 8.2 (0.31) West . . . . . . . . . . . . . . . . . . . . . . . . . . . . . . . . . . 100.0 25.0 (0.64) 67.2 (0.69) 7.8 (0.38)
Women
Ages 18 years and over (crude)2 . . . . . . . . . . . . . . . . . . 100.0 27.6 (0.28) 63.3 (0.30) 9.1 (0.16) Ages 18 years and over (age-adjusted)2,3 . . . . . . . . . . . . 100.0 27.5 (0.28) 63.4 (0.31) 9.1 (0.16)
Age: 18–24 years . . . . . . . . . . . . . . . . . . . . . . . . . . . . . 100.0 23.2 (0.83) 63.4 (0.95) 13.4 (0.68) 25–44 years . . . . . . . . . . . . . . . . . . . . . . . . . . . . . 100.0 28.3 (0.45) 64.8 (0.47) 6.9 (0.24) 45–64 years . . . . . . . . . . . . . . . . . . . . . . . . . . . . . 100.0 30.0 (0.48) 63.6 (0.51) 6.4 (0.26) 65–74 years . . . . . . . . . . . . . . . . . . . . . . . . . . . . . 100.0 25.7 (0.81) 62.9 (0.87) 11.4 (0.55) 75 years and over . . . . . . . . . . . . . . . . . . . . . . . . . . 100.0 23.9 (0.76) 56.5 (0.88) 19.6 (0.72)
Race: White, single race . . . . . . . . . . . . . . . . . . . . . . . . . . 100.0 26.3 (0.31) 64.7 (0.33) 9.0 (0.18) Black or African American, single race . . . . . . . . . . . . . 100.0 34.6 (0.73) 55.3 (0.78) 10.1 (0.40) American Indian or Alaska Native, single race . . . . . . . . 100.0 33.1 (3.11) 53.7 (3.42) 13.2 (2.53) Asian, single race . . . . . . . . . . . . . . . . . . . . . . . . . . 100.0 28.2 (1.33) 65.1 (1.41) 6.6 (0.72) Native Hawaiian or Other Pacific Islander, single race. . . . 100.0 39.6 (8.08) 59.1 (8.07) † Two or more races . . . . . . . . . . . . . . . . . . . . . . . . . 100.0 36.9 (2.82) 52.7 (2.67) 10.4 (1.49)
Black or African American, white . . . . . . . . . . . . . . . 100.0 35.1 (5.68) 54.1 (5.89) *10.8 (3.85) American Indian or Alaska Native, white . . . . . . . . . . . 100.0 34.8 (3.49) 52.5 (3.65) 12.7 (2.46)
See footnotes at end of table.
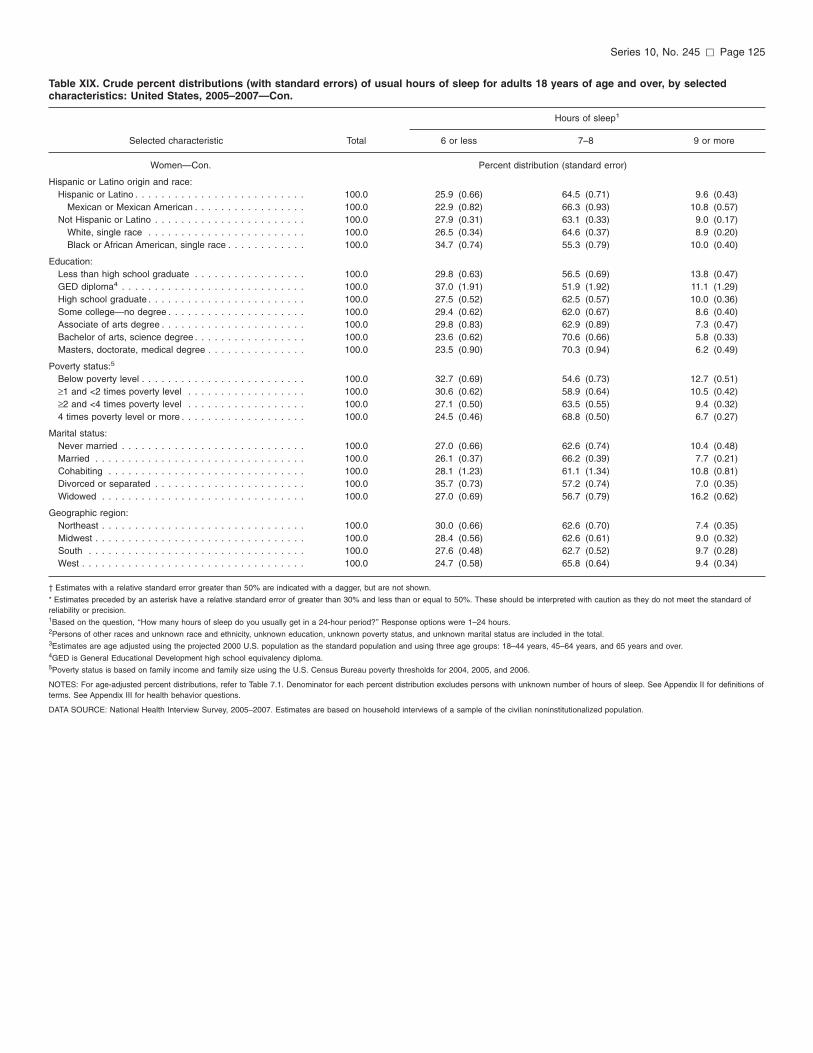
Series 10, No. 245 [ Page 125
Table XIX. Crude percent distributions (with standard errors) of usual hours of sleep for adults 18 years of age and over, by selected characteristics: United States, 2005–2007—Con.
Hours of sleep1
Selected characteristic Total 6 or less 7–8 9 or more
Women—Con. Percent distribution (standard error)
Hispanic or Latino origin and race: Hispanic or Latino . . . . . . . . . . . . . . . . . . . . . . . . . . 100.0 25.9 (0.66) 64.5 (0.71) 9.6 (0.43)
Mexican or Mexican American . . . . . . . . . . . . . . . . . 100.0 22.9 (0.82) 66.3 (0.93) 10.8 (0.57) Not Hispanic or Latino . . . . . . . . . . . . . . . . . . . . . . . 100.0 27.9 (0.31) 63.1 (0.33) 9.0 (0.17)
White, single race . . . . . . . . . . . . . . . . . . . . . . . . 100.0 26.5 (0.34) 64.6 (0.37) 8.9 (0.20) Black or African American, single race . . . . . . . . . . . . 100.0 34.7 (0.74) 55.3 (0.79) 10.0 (0.40)
Education: Less than high school graduate . . . . . . . . . . . . . . . . . 100.0 29.8 (0.63) 56.5 (0.69) 13.8 (0.47) GED diploma4 . . . . . . . . . . . . . . . . . . . . . . . . . . . . 100.0 37.0 (1.91) 51.9 (1.92) 11.1 (1.29) High school graduate . . . . . . . . . . . . . . . . . . . . . . . . 100.0 27.5 (0.52) 62.5 (0.57) 10.0 (0.36) Some college—no degree . . . . . . . . . . . . . . . . . . . . . 100.0 29.4 (0.62) 62.0 (0.67) 8.6 (0.40) Associate of arts degree . . . . . . . . . . . . . . . . . . . . . . 100.0 29.8 (0.83) 62.9 (0.89) 7.3 (0.47) Bachelor of arts, science degree . . . . . . . . . . . . . . . . . 100.0 23.6 (0.62) 70.6 (0.66) 5.8 (0.33) Masters, doctorate, medical degree . . . . . . . . . . . . . . . 100.0 23.5 (0.90) 70.3 (0.94) 6.2 (0.49)
Poverty status:5
Below poverty level . . . . . . . . . . . . . . . . . . . . . . . . . 100.0 32.7 (0.69) 54.6 (0.73) 12.7 (0.51) ≥1 and <2 times poverty level . . . . . . . . . . . . . . . . . . 100.0 30.6 (0.62) 58.9 (0.64) 10.5 (0.42) ≥2 and <4 times poverty level . . . . . . . . . . . . . . . . . . 100.0 27.1 (0.50) 63.5 (0.55) 9.4 (0.32) 4 times poverty level or more . . . . . . . . . . . . . . . . . . . 100.0 24.5 (0.46) 68.8 (0.50) 6.7 (0.27)
Marital status: Never married . . . . . . . . . . . . . . . . . . . . . . . . . . . . 100.0 27.0 (0.66) 62.6 (0.74) 10.4 (0.48) Married . . . . . . . . . . . . . . . . . . . . . . . . . . . . . . . . 100.0 26.1 (0.37) 66.2 (0.39) 7.7 (0.21) Cohabiting . . . . . . . . . . . . . . . . . . . . . . . . . . . . . . 100.0 28.1 (1.23) 61.1 (1.34) 10.8 (0.81) Divorced or separated . . . . . . . . . . . . . . . . . . . . . . . 100.0 35.7 (0.73) 57.2 (0.74) 7.0 (0.35) Widowed . . . . . . . . . . . . . . . . . . . . . . . . . . . . . . . 100.0 27.0 (0.69) 56.7 (0.79) 16.2 (0.62)
Geographic region: Northeast . . . . . . . . . . . . . . . . . . . . . . . . . . . . . . . 100.0 30.0 (0.66) 62.6 (0.70) 7.4 (0.35) Midwest . . . . . . . . . . . . . . . . . . . . . . . . . . . . . . . . 100.0 28.4 (0.56) 62.6 (0.61) 9.0 (0.32) South . . . . . . . . . . . . . . . . . . . . . . . . . . . . . . . . . 100.0 27.6 (0.48) 62.7 (0.52) 9.7 (0.28) West . . . . . . . . . . . . . . . . . . . . . . . . . . . . . . . . . . 100.0 24.7 (0.58) 65.8 (0.64) 9.4 (0.34)
† Estimates with a relative standard error greater than 50% are indicated with a dagger, but are not shown.
* Estimates preceded by an asterisk have a relative standard error of greater than 30% and less than or equal to 50%. These should be interpreted with caution as they do not meet the standard of reliability or precision. 1Based on the question, ‘‘How many hours of sleep do you usually get in a 24-hour period?’’ Response options were 1–24 hours. 2Persons of other races and unknown race and ethnicity, unknown education, unknown poverty status, and unknown marital status are included in the total. 3Estimates are age adjusted using the projected 2000 U.S. population as the standard population and using three age groups: 18–44 years, 45–64 years, and 65 years and over. 4GED is General Educational Development high school equivalency diploma. 5Poverty status is based on family income and family size using the U.S. Census Bureau poverty thresholds for 2004, 2005, and 2006.
NOTES: For age-adjusted percent distributions, refer to Table 7.1. Denominator for each percent distribution excludes persons with unknown number of hours of sleep. See Appendix II for definitions of terms. See Appendix III for health behavior questions.
DATA SOURCE: National Health Interview Survey, 2005–2007. Estimates are based on household interviews of a sample of the civilian noninstitutionalized population.

Page 126 [ Series 10, No. 245
Table XX. Crude percentages (with standard errors) of adults 18 years of age and over who engaged in selected unhealthy behaviors, by selected characteristics: United States, average annual, 2005–2007
Selected unhealthy behaviors
Five or more drinks in 1 day Current Physically Slept at least once cigarette inactive 6 hours
Selected characteristic (past year)1 smoker2 (leisure time)3 Obese4 or less5
Both sexes Percent (standard error)
Ages 18 years and over (crude)6 . . . . . . . . . . . . . . . . . . 20.2 (0.25) 20.5 (0.21) 39.7 (0.40) 25.6 (0.22) 28.1 (0.22) Ages 18 years and over (age-adjusted)6,7 . . . . . . . . . . . . 20.5 (0.24) 20.4 (0.21) 39.7 (0.40) 25.4 (0.22) 28.0 (0.22)
Age: 18–24 years . . . . . . . . . . . . . . . . . . . . . . . . . . . . . 31.9 (0.84) 23.5 (0.67) 33.7 (0.79) 16.0 (0.52) 22.8 (0.63) 25–44 years . . . . . . . . . . . . . . . . . . . . . . . . . . . . . 27.4 (0.40) 23.4 (0.32) 35.5 (0.51) 26.1 (0.34) 30.2 (0.34) 45–64 years . . . . . . . . . . . . . . . . . . . . . . . . . . . . . 15.6 (0.29) 21.6 (0.34) 39.9 (0.50) 30.3 (0.39) 30.4 (0.38) 65–74 years . . . . . . . . . . . . . . . . . . . . . . . . . . . . . 6.1 (0.33) 12.4 (0.44) 48.0 (0.82) 27.5 (0.62) 23.9 (0.60) 75 years and over . . . . . . . . . . . . . . . . . . . . . . . . . . 2.2 (0.22) 5.1 (0.31) 60.4 (0.80) 17.2 (0.52) 21.9 (0.59)
Race: White, single race . . . . . . . . . . . . . . . . . . . . . . . . . . 21.8 (0.29) 20.7 (0.24) 38.3 (0.43) 25.1 (0.24) 27.0 (0.25) Black or African American, single race . . . . . . . . . . . . . 12.5 (0.41) 21.2 (0.50) 50.3 (0.77) 34.3 (0.58) 34.7 (0.57) American Indian or Alaska Native, single race . . . . . . . . 26.3 (3.15) 28.1 (3.07) 38.1 (2.36) 33.3 (2.39) 29.3 (2.43) Asian, single race . . . . . . . . . . . . . . . . . . . . . . . . . . 9.8 (0.64) 11.5 (0.66) 38.9 (1.07) 8.7 (0.58) 29.2 (0.93) Native Hawaiian or Other Pacific Islander, single race. . . . 19.9 (4.70) 14.5 (3.87) 42.8 (7.19) 31.6 (6.77) 37.3 (6.07) Two or more races . . . . . . . . . . . . . . . . . . . . . . . . . 23.7 (1.75) 26.0 (1.90) 34.9 (2.04) 30.2 (1.85) 33.3 (1.94)
Black or African American, white . . . . . . . . . . . . . . . 17.5 (3.65) 19.9 (3.43) 39.4 (4.72) 18.0 (3.38) 33.6 (4.57) American Indian or Alaska Native, white . . . . . . . . . . . 26.8 (2.66) 30.5 (2.97) 37.6 (2.93) 35.3 (2.69) 31.1 (2.56)
Hispanic or Latino origin and race: Hispanic or Latino . . . . . . . . . . . . . . . . . . . . . . . . . . 19.4 (0.47) 14.9 (0.44) 51.7 (0.64) 27.2 (0.52) 25.6 (0.51)
Mexican or Mexican American . . . . . . . . . . . . . . . . . 21.6 (0.62) 14.6 (0.52) 51.1 (0.80) 28.8 (0.67) 22.5 (0.62) Not Hispanic or Latino . . . . . . . . . . . . . . . . . . . . . . . 20.4 (0.27) 21.3 (0.23) 37.9 (0.43) 25.4 (0.24) 28.5 (0.24)
White, single race . . . . . . . . . . . . . . . . . . . . . . . . 22.2 (0.32) 21.8 (0.27) 35.9 (0.47) 24.7 (0.26) 27.4 (0.28) Black or African American, single race . . . . . . . . . . . . 12.3 (0.42) 21.4 (0.51) 50.2 (0.79) 34.8 (0.59) 34.7 (0.58)
Education: Less than high school graduate . . . . . . . . . . . . . . . . . 16.2 (0.45) 26.4 (0.52) 61.6 (0.63) 29.1 (0.50) 27.8 (0.49) GED diploma8 . . . . . . . . . . . . . . . . . . . . . . . . . . . . 25.5 (1.23) 45.0 (1.39) 51.6 (1.42) 32.4 (1.33) 37.1 (1.35) High school graduate . . . . . . . . . . . . . . . . . . . . . . . . 18.4 (0.39) 24.3 (0.39) 47.7 (0.62) 28.2 (0.42) 27.9 (0.38) Some college—no degree . . . . . . . . . . . . . . . . . . . . . 24.1 (0.57) 22.1 (0.45) 33.9 (0.59) 26.9 (0.49) 30.6 (0.47) Associate of arts degree . . . . . . . . . . . . . . . . . . . . . . 21.9 (0.64) 20.6 (0.58) 32.6 (0.70) 27.9 (0.62) 30.6 (0.62) Bachelor of arts, science degree . . . . . . . . . . . . . . . . . 23.2 (0.55) 10.7 (0.36) 24.2 (0.54) 19.3 (0.43) 25.4 (0.49) Masters, doctorate, medical degree . . . . . . . . . . . . . . . 16.7 (0.58) 6.7 (0.35) 19.1 (0.61) 16.7 (0.56) 24.9 (0.68)
Poverty status:9
Below poverty level . . . . . . . . . . . . . . . . . . . . . . . . . 18.8 (0.70) 28.5 (0.67) 55.8 (0.88) 28.1 (0.62) 31.2 (0.60) ≥1 and <2 times poverty level . . . . . . . . . . . . . . . . . . 16.7 (0.44) 24.0 (0.48) 51.8 (0.64) 27.7 (0.46) 29.9 (0.50) ≥2 and <4 times poverty level . . . . . . . . . . . . . . . . . . 19.5 (0.37) 21.5 (0.37) 41.1 (0.54) 26.7 (0.40) 27.9 (0.37) 4 times poverty level or more . . . . . . . . . . . . . . . . . . . 23.0 (0.39) 15.4 (0.28) 27.6 (0.45) 23.0 (0.33) 26.5 (0.36)
Marital status: Never married . . . . . . . . . . . . . . . . . . . . . . . . . . . . 30.3 (0.62) 24.1 (0.51) 35.5 (0.64) 21.5 (0.46) 26.5 (0.47) Married . . . . . . . . . . . . . . . . . . . . . . . . . . . . . . . . 17.0 (0.26) 16.3 (0.23) 38.1 (0.45) 26.5 (0.29) 27.1 (0.28) Cohabiting . . . . . . . . . . . . . . . . . . . . . . . . . . . . . . 34.8 (0.98) 38.2 (0.96) 38.3 (0.97) 25.8 (0.78) 30.3 (0.92) Divorced or separated . . . . . . . . . . . . . . . . . . . . . . . 20.2 (0.48) 30.5 (0.51) 44.2 (0.65) 29.4 (0.52) 36.2 (0.54) Widowed . . . . . . . . . . . . . . . . . . . . . . . . . . . . . . . 3.9 (0.29) 12.8 (0.47) 60.1 (0.80) 24.1 (0.60) 26.9 (0.62)
Geographic region: Northeast . . . . . . . . . . . . . . . . . . . . . . . . . . . . . . . 20.5 (0.58) 18.9 (0.47) 37.9 (0.75) 24.0 (0.52) 31.1 (0.49) Midwest . . . . . . . . . . . . . . . . . . . . . . . . . . . . . . . . 24.8 (0.55) 23.4 (0.45) 34.5 (0.92) 27.1 (0.49) 29.1 (0.48) South . . . . . . . . . . . . . . . . . . . . . . . . . . . . . . . . . 17.5 (0.40) 21.4 (0.34) 46.1 (0.71) 27.1 (0.37) 28.0 (0.37) West . . . . . . . . . . . . . . . . . . . . . . . . . . . . . . . . . . 19.7 (0.48) 16.9 (0.43) 36.1 (0.69) 22.8 (0.42) 24.8 (0.45)
Men
Ages 18 years and over (crude)6 . . . . . . . . . . . . . . . . . . 28.9 (0.39) 23.4 (0.32) 38.0 (0.47) 26.0 (0.31) 28.7 (0.32) Ages 18 years and over (age-adjusted)6,7 . . . . . . . . . . . . 28.8 (0.37) 23.0 (0.31) 38.1 (0.47) 25.7 (0.30) 28.4 (0.32)
Age: 18–24 years . . . . . . . . . . . . . . . . . . . . . . . . . . . . . 40.7 (1.25) 27.3 (1.02) 30.8 (1.05) 15.9 (0.76) 22.4 (0.89) 25–44 years . . . . . . . . . . . . . . . . . . . . . . . . . . . . . 37.9 (0.61) 26.3 (0.48) 34.4 (0.65) 27.3 (0.49) 32.1 (0.51) 45–64 years . . . . . . . . . . . . . . . . . . . . . . . . . . . . . 23.3 (0.50) 24.1 (0.50) 40.2 (0.63) 30.5 (0.53) 30.8 (0.54) 65–74 years . . . . . . . . . . . . . . . . . . . . . . . . . . . . . 10.3 (0.62) 13.8 (0.69) 45.5 (1.12) 25.5 (0.91) 21.9 (0.85) 75 years and over . . . . . . . . . . . . . . . . . . . . . . . . . . 4.3 (0.47) 5.6 (0.53) 53.1 (1.23) 15.9 (0.86) 18.7 (0.91)
See footnotes at end of table.

Series 10, No. 245 [ Page 127
Table XX. Crude percentages (with standard errors) of adults 18 years of age and over who engaged in selected unhealthy behaviors, by selected characteristics: United States, average annual, 2005–2007—Con.
Selected unhealthy behaviors
Five or more drinks in 1 day Current Physically Slept at least once cigarette inactive 6 hours
Selected characteristic (past year)1 smoker2 (leisure time)3 Obese4 or less5
Men—Con. Percent (standard error) Race:
White, single race . . . . . . . . . . . . . . . . . . . . . . . . . . 30.7 (0.45) 23.2 (0.35) 37.2 (0.51) 26.2 (0.33) 27.8 (0.36) Black or African American, single race . . . . . . . . . . . . . 20.3 (0.81) 26.0 (0.85) 45.3 (1.06) 29.5 (0.84) 34.8 (0.89) American Indian or Alaska Native, single race . . . . . . . . 36.4 (4.74) 30.6 (4.67) 38.6 (3.69) 32.6 (3.88) 25.5 (3.53) Asian, single race . . . . . . . . . . . . . . . . . . . . . . . . . . 15.1 (1.15) 18.3 (1.16) 35.1 (1.42) 10.4 (0.88) 30.3 (1.30) Native Hawaiian or Other Pacific Islander, single race. . . . 28.1 (7.90) *22.9 (7.26) 46.9 (10.17) 40.2 (9.95) 35.2 (9.67) Two or more races . . . . . . . . . . . . . . . . . . . . . . . . . 31.2 (2.91) 25.8 (2.73) 34.1 (2.97) 32.8 (3.10) 29.7 (2.64)
Black or African American, white . . . . . . . . . . . . . . . 22.8 (6.61) *19.9 (6.00) 38.9 (8.04) *11.9 (4.34) 31.5 (7.51) American Indian or Alaska Native, white . . . . . . . . . . . 33.2 (4.21) 29.9 (4.12) 36.3 (4.08) 38.0 (4.09) 28.0 (3.77)
Hispanic or Latino origin and race: Hispanic or Latino . . . . . . . . . . . . . . . . . . . . . . . . . . 30.5 (0.78) 19.7 (0.70) 49.6 (0.85) 25.9 (0.72) 25.3 (0.73)
Mexican or Mexican American . . . . . . . . . . . . . . . . . 34.2 (1.01) 20.1 (0.84) 50.2 (1.07) 26.5 (0.89) 22.2 (0.86) Not Hispanic or Latino . . . . . . . . . . . . . . . . . . . . . . . 28.7 (0.43) 24.0 (0.34) 36.1 (0.51) 26.0 (0.33) 29.2 (0.35)
White, single race . . . . . . . . . . . . . . . . . . . . . . . . 30.8 (0.49) 23.8 (0.40) 34.7 (0.56) 26.2 (0.37) 28.3 (0.40) Black or African American, single race . . . . . . . . . . . . 20.0 (0.83) 26.4 (0.88) 45.4 (1.08) 29.9 (0.87) 34.7 (0.90)
Education: Less than high school graduate . . . . . . . . . . . . . . . . . 25.8 (0.78) 30.6 (0.79) 58.9 (0.90) 26.7 (0.72) 25.7 (0.73) GED diploma8 . . . . . . . . . . . . . . . . . . . . . . . . . . . . 36.2 (1.94) 50.0 (2.00) 46.1 (2.08) 29.7 (1.79) 37.2 (1.92) High school graduate . . . . . . . . . . . . . . . . . . . . . . . . 27.6 (0.67) 28.1 (0.61) 46.2 (0.81) 28.6 (0.60) 28.4 (0.57) Some college—no degree . . . . . . . . . . . . . . . . . . . . . 33.2 (0.89) 24.6 (0.71) 32.4 (0.81) 27.9 (0.74) 32.0 (0.72) Associate of arts degree . . . . . . . . . . . . . . . . . . . . . . 32.9 (1.05) 24.2 (0.95) 31.3 (1.04) 28.6 (0.93) 31.6 (1.00) Bachelor of arts, science degree . . . . . . . . . . . . . . . . . 31.1 (0.90) 12.3 (0.60) 22.5 (0.70) 22.0 (0.65) 27.3 (0.72) Masters, doctorate, medical degree . . . . . . . . . . . . . . . 21.4 (0.92) 6.9 (0.52) 18.1 (0.81) 18.0 (0.82) 26.2 (0.94)
Poverty status:9
Below poverty level . . . . . . . . . . . . . . . . . . . . . . . . . 29.1 (1.18) 32.6 (1.05) 52.7 (1.21) 22.9 (0.93) 29.2 (0.93) ≥1 and <2 times poverty level . . . . . . . . . . . . . . . . . . 25.4 (0.76) 28.5 (0.80) 50.5 (0.98) 25.7 (0.70) 29.1 (0.78) ≥2 and <4 times poverty level . . . . . . . . . . . . . . . . . . 28.0 (0.61) 25.0 (0.57) 40.2 (0.71) 27.4 (0.55) 28.8 (0.60) 4 times poverty level or more . . . . . . . . . . . . . . . . . . . 31.1 (0.60) 17.7 (0.43) 27.1 (0.55) 25.8 (0.49) 28.3 (0.50)
Marital status: Never married . . . . . . . . . . . . . . . . . . . . . . . . . . . . 38.6 (0.84) 27.7 (0.74) 33.2 (0.78) 19.4 (0.60) 26.0 (0.64) Married . . . . . . . . . . . . . . . . . . . . . . . . . . . . . . . . 24.2 (0.44) 18.1 (0.34) 38.2 (0.56) 28.7 (0.41) 28.1 (0.42) Cohabiting . . . . . . . . . . . . . . . . . . . . . . . . . . . . . . 42.1 (1.39) 40.1 (1.28) 37.9 (1.36) 26.5 (1.10) 32.3 (1.29) Divorced or separated . . . . . . . . . . . . . . . . . . . . . . . 32.1 (0.86) 36.1 (0.79) 42.5 (0.92) 26.7 (0.76) 37.0 (0.86) Widowed . . . . . . . . . . . . . . . . . . . . . . . . . . . . . . . 11.0 (1.04) 16.8 (1.19) 55.8 (1.67) 19.2 (1.17) 26.1 (1.38)
Geographic region: Northeast . . . . . . . . . . . . . . . . . . . . . . . . . . . . . . . 29.2 (0.90) 20.9 (0.75) 34.7 (0.92) 24.9 (0.80) 32.3 (0.73) Midwest . . . . . . . . . . . . . . . . . . . . . . . . . . . . . . . . 34.5 (0.90) 26.1 (0.69) 33.3 (1.12) 27.9 (0.59) 29.8 (0.72) South . . . . . . . . . . . . . . . . . . . . . . . . . . . . . . . . . 25.7 (0.61) 24.6 (0.51) 44.3 (0.81) 27.3 (0.53) 28.5 (0.52) West . . . . . . . . . . . . . . . . . . . . . . . . . . . . . . . . . . 27.9 (0.77) 20.4 (0.64) 35.1 (0.84) 22.5 (0.59) 25.0 (0.64)
Women
Ages 18 years and over (crude)6 . . . . . . . . . . . . . . . . . . 12.3 (0.22) 17.8 (0.24) 41.3 (0.45) 25.3 (0.29) 27.6 (0.28) Ages 18 years and over (age-adjusted)6,7 . . . . . . . . . . . . 12.8 (0.22) 18.0 (0.24) 41.1 (0.45) 25.0 (0.29) 27.5 (0.28)
Age: 18–24 years . . . . . . . . . . . . . . . . . . . . . . . . . . . . . 23.4 (0.89) 19.7 (0.80) 36.6 (1.03) 16.2 (0.70) 23.2 (0.83) 25–44 years . . . . . . . . . . . . . . . . . . . . . . . . . . . . . 17.2 (0.39) 20.7 (0.41) 36.6 (0.57) 24.8 (0.44) 28.3 (0.45) 45–64 years . . . . . . . . . . . . . . . . . . . . . . . . . . . . . 8.5 (0.29) 19.2 (0.40) 39.7 (0.62) 30.2 (0.52) 30.0 (0.48) 65–74 years . . . . . . . . . . . . . . . . . . . . . . . . . . . . . 2.5 (0.28) 11.3 (0.57) 50.0 (1.01) 29.2 (0.84) 25.7 (0.81) 75 years and over . . . . . . . . . . . . . . . . . . . . . . . . . . 0.8 (0.18) 4.8 (0.37) 65.0 (0.91) 18.0 (0.66) 23.9 (0.76)
Race: White, single race . . . . . . . . . . . . . . . . . . . . . . . . . . 13.5 (0.26) 18.4 (0.27) 39.4 (0.48) 24.1 (0.32) 26.3 (0.31) Black or African American, single race . . . . . . . . . . . . . 6.2 (0.35) 17.3 (0.56) 54.3 (0.88) 38.4 (0.74) 34.6 (0.73) American Indian or Alaska Native, single race . . . . . . . . 15.9 (2.38) 25.7 (3.06) 37.5 (3.16) 34.1 (3.45) 33.1 (3.11) Asian, single race . . . . . . . . . . . . . . . . . . . . . . . . . . 4.7 (0.59) 5.0 (0.56) 42.5 (1.50) 7.1 (0.70) 28.2 (1.33) Native Hawaiian or Other Pacific Islander, single race. . . . *11.3 (4.15) † 38.2 (7.92) *21.9 (6.71) 39.6 (8.08) Two or more races . . . . . . . . . . . . . . . . . . . . . . . . . 16.7 (1.87) 26.2 (2.39) 35.8 (2.47) 27.5 (2.21) 36.9 (2.82)
Black or African American, white . . . . . . . . . . . . . . . *14.2 (4.30) 19.8 (4.13) 39.8 (5.96) 22.3 (4.79) 35.1 (5.68) American Indian or Alaska Native, white . . . . . . . . . . . 19.6 (3.01) 31.1 (3.64) 39.1 (3.70) 32.0 (3.38) 34.8 (3.49)
See footnotes at end of table.

Page 128 [ Series 10, No. 245
Table XX. Crude percentages (with standard errors) of adults 18 years of age and over who engaged in selected unhealthy behaviors, by selected characteristics: United States, average annual, 2005–2007—Con.
Selected unhealthy behaviors
Five or more drinks in 1 day Current Physically Slept at least once cigarette inactive 6 hours
Selected characteristic (past year)1 smoker2 (leisure time)3 Obese4 or less5
Women—Con. Percent (standard error)
Hispanic or Latino origin and race: Hispanic or Latino . . . . . . . . . . . . . . . . . . . . . . . . . . 7.9 (0.41) 9.8 (0.42) 53.9 (0.79) 28.6 (0.69) 25.9 (0.66)
Mexican or Mexican American . . . . . . . . . . . . . . . . . 8.0 (0.51) 8.5 (0.52) 52.1 (1.00) 31.4 (0.93) 22.9 (0.82) Not Hispanic or Latino . . . . . . . . . . . . . . . . . . . . . . . 12.9 (0.24) 18.9 (0.27) 39.6 (0.49) 24.8 (0.31) 27.9 (0.31)
White, single race . . . . . . . . . . . . . . . . . . . . . . . . 14.4 (0.29) 19.8 (0.31) 37.0 (0.53) 23.4 (0.35) 26.5 (0.34) Black or African American, single race . . . . . . . . . . . . 6.1 (0.35) 17.4 (0.57) 54.1 (0.91) 38.8 (0.75) 34.7 (0.74)
Education: Less than high school graduate . . . . . . . . . . . . . . . . . 7.1 (0.38) 22.3 (0.63) 64.2 (0.73) 31.7 (0.69) 29.8 (0.63) GED diploma8 . . . . . . . . . . . . . . . . . . . . . . . . . . . . 14.3 (1.28) 39.7 (1.86) 57.4 (1.82) 35.5 (1.81) 37.0 (1.91) High school graduate . . . . . . . . . . . . . . . . . . . . . . . . 10.0 (0.36) 20.7 (0.49) 49.1 (0.70) 27.9 (0.56) 27.5 (0.52) Some college—no degree . . . . . . . . . . . . . . . . . . . . . 16.3 (0.58) 19.9 (0.55) 35.2 (0.72) 26.0 (0.61) 29.4 (0.62) Associate of arts degree . . . . . . . . . . . . . . . . . . . . . . 13.5 (0.66) 17.9 (0.68) 33.5 (0.89) 27.5 (0.82) 29.8 (0.83) Bachelor of arts, science degree . . . . . . . . . . . . . . . . . 15.5 (0.54) 9.3 (0.41) 25.9 (0.72) 16.5 (0.53) 23.6 (0.62) Masters, doctorate, medical degree . . . . . . . . . . . . . . . 11.7 (0.64) 6.4 (0.44) 20.1 (0.85) 15.3 (0.75) 23.5 (0.90)
Poverty status:9
Below poverty level . . . . . . . . . . . . . . . . . . . . . . . . . 11.6 (0.61) 25.6 (0.75) 58.0 (0.92) 31.9 (0.75) 32.7 (0.69) ≥1 and <2 times poverty level . . . . . . . . . . . . . . . . . . 9.6 (0.40) 20.3 (0.53) 52.9 (0.77) 29.4 (0.63) 30.6 (0.62) ≥2 and <4 times poverty level . . . . . . . . . . . . . . . . . . 11.7 (0.38) 18.3 (0.44) 41.9 (0.67) 25.9 (0.54) 27.1 (0.50) 4 times poverty level or more . . . . . . . . . . . . . . . . . . . 14.4 (0.39) 13.0 (0.35) 28.1 (0.58) 19.9 (0.45) 24.5 (0.46)
Marital status: Never married . . . . . . . . . . . . . . . . . . . . . . . . . . . . 20.7 (0.68) 19.7 (0.61) 38.3 (0.87) 24.2 (0.64) 27.0 (0.66) Married . . . . . . . . . . . . . . . . . . . . . . . . . . . . . . . . 9.9 (0.26) 14.5 (0.29) 38.0 (0.53) 24.3 (0.39) 26.1 (0.37) Cohabiting . . . . . . . . . . . . . . . . . . . . . . . . . . . . . . 26.8 (1.25) 36.0 (1.30) 38.7 (1.28) 25.1 (1.08) 28.1 (1.23) Divorced or separated . . . . . . . . . . . . . . . . . . . . . . . 12.3 (0.49) 26.6 (0.65) 45.4 (0.78) 31.3 (0.71) 35.7 (0.73) Widowed . . . . . . . . . . . . . . . . . . . . . . . . . . . . . . . 2.2 (0.24) 11.8 (0.51) 61.2 (0.88) 25.4 (0.69) 27.0 (0.69)
Geographic region: Northeast . . . . . . . . . . . . . . . . . . . . . . . . . . . . . . . 12.9 (0.53) 17.2 (0.53) 40.7 (0.93) 23.2 (0.65) 30.0 (0.66) Midwest . . . . . . . . . . . . . . . . . . . . . . . . . . . . . . . . 15.7 (0.48) 20.9 (0.56) 35.7 (0.92) 26.4 (0.71) 28.4 (0.56) South . . . . . . . . . . . . . . . . . . . . . . . . . . . . . . . . . 10.0 (0.35) 18.5 (0.39) 47.7 (0.82) 26.9 (0.47) 27.6 (0.48) West . . . . . . . . . . . . . . . . . . . . . . . . . . . . . . . . . . 11.8 (0.46) 13.5 (0.44) 37.0 (0.77) 23.0 (0.51) 24.7 (0.58)
* Estimates preceded by an asterisk have a relative standard error of greater than 30% and less than or equal to 50%. These should be interpreted with caution as they do not meet the standard of reliability or precision.
† Estimates with a relative standard error greater than 50% are indicated with a dagger, but are not shown. 1Five or more drinks in 1 day at least once in the past year was asked of only current drinkers but estimates reflect percent of all adults who engaged in this behavior (as shown in Table V). 2Smoked at least 100 cigarettes in lifetime and currently smoked. 3Never engaged in any light, moderate, or vigorous leisure-time physical activity. 4Obese is defined as a body mass index (BMI) of greater than or equal to 30. 5Usual number of hours of sleep in a 24-hour period. 6Persons of other races and unknown race and ethnicity, unknown education, unknown poverty status, and unknown marital status are included in total. 7Estimates are age adjusted using the projected 2000 U.S. population as the standard population and using three age groups: 18–44 years, 45–64 years, and 65 years and over. 8GED is General Educational Development high school equivalency diploma. 9Poverty status is based on family income and family size using the U.S. Census Bureau poverty thresholds for 2004, 2005, and 2006.
NOTES: For age-adjusted percentages, refer to Table 8.1. Denominator for each percentage excludes persons with unknown health behavior characteristic. See Appendix II for definitions of terms. See Appendix III for health behavior questions.
DATA SOURCE: National Health Interview Survey, 2005–2007. Estimates are based on household interviews of a sample of the civilian noninstitutionalized population.

Series 10, No. 245 [ Page 129
Table XXI. Crude percentages (with standard errors) of adults 18 years of age and over who engaged in selected healthy behaviors, by selected characteristics: United States, average annual, 2005–2007
Selected healthy behaviors
Never Any regular smoked leisure-time Healthy Slept
Selected characteristic cigarettes1 physical activity2 weight3 7–8 hours4
Both sexes Percent (standard error)
Ages 18 years and over (crude)5 . . . . . . . . . . . . . . . . . . 58.1 (0.27) 30.6 (0.29) 37.3 (0.25) 63.5 (0.24) Ages 18 years and over (age-adjusted)5,6 . . . . . . . . . . . . 58.5 (0.26) 30.7 (0.29) 37.7 (0.25) 63.5 (0.24)
Age: 18–24 years . . . . . . . . . . . . . . . . . . . . . . . . . . . . . 69.8 (0.74) 37.5 (0.76) 54.3 (0.73) 64.7 (0.71) 25–44 years . . . . . . . . . . . . . . . . . . . . . . . . . . . . . 62.5 (0.37) 33.0 (0.40) 37.5 (0.37) 64.1 (0.36) 45–64 years . . . . . . . . . . . . . . . . . . . . . . . . . . . . . 51.7 (0.43) 29.5 (0.43) 30.7 (0.36) 63.5 (0.40) 65–74 years . . . . . . . . . . . . . . . . . . . . . . . . . . . . . 48.4 (0.69) 25.4 (0.67) 31.5 (0.65) 63.5 (0.64) 75 years and over . . . . . . . . . . . . . . . . . . . . . . . . . . 56.2 (0.75) 17.4 (0.60) 43.1 (0.71) 58.0 (0.69)
Race: White, single race . . . . . . . . . . . . . . . . . . . . . . . . . . 56.2 (0.29) 31.6 (0.32) 37.5 (0.27) 64.7 (0.27) Black or African American, single race . . . . . . . . . . . . . 65.6 (0.57) 23.8 (0.57) 29.6 (0.55) 55.6 (0.61) American Indian or Alaska Native, single race . . . . . . . . 52.1 (4.17) 27.2 (2.40) 29.5 (2.37) 59.1 (2.96) Asian, single race . . . . . . . . . . . . . . . . . . . . . . . . . . 77.7 (0.83) 29.7 (0.97) 57.9 (1.04) 64.2 (0.99) Native Hawaiian or Other Pacific Islander, single race. . . . 72.6 (5.61) 32.0 (6.18) 29.0 (5.20) 58.9 (5.99) Two or more races . . . . . . . . . . . . . . . . . . . . . . . . . 52.2 (2.19) 31.4 (1.89) 34.0 (1.92) 55.1 (2.07)
Black or African American, white . . . . . . . . . . . . . . . 65.4 (4.42) 32.4 (4.74) 40.0 (4.79) 57.2 (4.83) American Indian or Alaska Native, white . . . . . . . . . . . 43.0 (2.96) 27.3 (2.57) 28.0 (2.50) 55.6 (2.76)
Hispanic or Latino origin and race: Hispanic or Latino . . . . . . . . . . . . . . . . . . . . . . . . . . 71.7 (0.54) 23.3 (0.51) 32.3 (0.53) 66.3 (0.52)
Mexican or Mexican American . . . . . . . . . . . . . . . . . 73.2 (0.64) 23.2 (0.66) 31.5 (0.66) 68.3 (0.66) Not Hispanic or Latino . . . . . . . . . . . . . . . . . . . . . . . 56.1 (0.29) 31.7 (0.32) 38.1 (0.27) 63.0 (0.26)
White, single race . . . . . . . . . . . . . . . . . . . . . . . . 53.4 (0.33) 33.1 (0.36) 38.3 (0.30) 64.4 (0.30) Black or African American, single race . . . . . . . . . . . . 65.3 (0.58) 23.6 (0.58) 29.5 (0.56) 55.5 (0.62)
Education: Less than high school graduate . . . . . . . . . . . . . . . . . 53.6 (0.60) 17.2 (0.46) 33.5 (0.52) 59.1 (0.54) GED diploma7 . . . . . . . . . . . . . . . . . . . . . . . . . . . . 32.5 (1.27) 21.8 (1.19) 30.2 (1.32) 51.9 (1.35) High school graduate . . . . . . . . . . . . . . . . . . . . . . . . 53.7 (0.47) 23.5 (0.43) 34.9 (0.47) 62.7 (0.44) Some college—no degree . . . . . . . . . . . . . . . . . . . . . 56.7 (0.60) 33.5 (0.55) 38.2 (0.56) 61.4 (0.51) Associate of arts degree . . . . . . . . . . . . . . . . . . . . . . 57.1 (0.71) 34.4 (0.72) 33.9 (0.67) 62.9 (0.67) Bachelor of arts, science degree . . . . . . . . . . . . . . . . . 68.7 (0.50) 42.9 (0.61) 42.8 (0.54) 69.4 (0.50) Masters, doctorate, medical degree . . . . . . . . . . . . . . . 70.1 (0.66) 46.6 (0.75) 44.7 (0.76) 70.0 (0.71)
Poverty status:8
Below poverty level . . . . . . . . . . . . . . . . . . . . . . . . . 57.5 (0.79) 21.1 (0.70) 37.8 (0.71) 56.4 (0.63) ≥1 and <2 times poverty level . . . . . . . . . . . . . . . . . . 56.2 (0.58) 22.6 (0.52) 36.3 (0.53) 59.8 (0.52) ≥2 and <4 times poverty level . . . . . . . . . . . . . . . . . . 56.5 (0.43) 28.6 (0.42) 36.5 (0.45) 63.2 (0.39) 4 times poverty level or more . . . . . . . . . . . . . . . . . . . 60.6 (0.37) 39.1 (0.41) 38.3 (0.39) 67.7 (0.39)
Marital status: Never married . . . . . . . . . . . . . . . . . . . . . . . . . . . . 66.5 (0.57) 36.1 (0.57) 46.1 (0.55) 63.3 (0.53) Married . . . . . . . . . . . . . . . . . . . . . . . . . . . . . . . . 59.0 (0.32) 30.7 (0.36) 34.4 (0.31) 65.8 (0.30) Cohabiting . . . . . . . . . . . . . . . . . . . . . . . . . . . . . . 43.6 (0.96) 31.3 (0.90) 39.3 (0.91) 60.8 (0.95) Divorced or separated . . . . . . . . . . . . . . . . . . . . . . . 46.7 (0.55) 27.6 (0.52) 34.4 (0.54) 56.8 (0.56) Widowed . . . . . . . . . . . . . . . . . . . . . . . . . . . . . . . 56.6 (0.75) 16.9 (0.57) 38.9 (0.67) 56.7 (0.71)
Geographic region: Northeast . . . . . . . . . . . . . . . . . . . . . . . . . . . . . . . 57.0 (0.63) 31.9 (0.61) 39.2 (0.61) 61.8 (0.55) Midwest . . . . . . . . . . . . . . . . . . . . . . . . . . . . . . . . 54.5 (0.55) 31.9 (0.66) 36.5 (0.54) 62.7 (0.52) South . . . . . . . . . . . . . . . . . . . . . . . . . . . . . . . . . 58.8 (0.44) 27.4 (0.48) 35.8 (0.38) 63.0 (0.40) West . . . . . . . . . . . . . . . . . . . . . . . . . . . . . . . . . . 62.0 (0.57) 33.6 (0.58) 39.3 (0.53) 66.5 (0.49)
Men
Ages 18 years and over (crude)5 . . . . . . . . . . . . . . . . . . 51.8 (0.38) 32.7 (0.38) 30.7 (0.33) 63.6 (0.34) Ages 18 years and over (age-adjusted)5,6 . . . . . . . . . . . . 51.8 (0.37) 32.6 (0.38) 31.1 (0.33) 63.6 (0.34)
Age: 18–24 years . . . . . . . . . . . . . . . . . . . . . . . . . . . . . 66.6 (1.11) 42.3 (1.12) 50.5 (1.06) 66.0 (1.04) 25–44 years . . . . . . . . . . . . . . . . . . . . . . . . . . . . . 58.8 (0.54) 34.0 (0.54) 29.3 (0.49) 63.3 (0.52) 45–64 years . . . . . . . . . . . . . . . . . . . . . . . . . . . . . 44.5 (0.58) 30.4 (0.56) 23.7 (0.48) 63.5 (0.56) 65–74 years . . . . . . . . . . . . . . . . . . . . . . . . . . . . . 36.3 (0.96) 28.2 (0.96) 27.2 (0.87) 64.2 (0.94) 75 years and over . . . . . . . . . . . . . . . . . . . . . . . . . . 36.3 (1.18) 22.5 (0.99) 39.4 (1.09) 60.3 (1.12)
See footnotes at end of table.

Page 130 [ Series 10, No. 245
Table XXI. Crude percentages (with standard errors) of adults 18 years of age and over who engaged in selected healthy behaviors, by selected characteristics: United States, average annual, 2005–2007—Con.
Selected healthy behaviors
Never Any regular smoked leisure-time Healthy Slept
Selected characteristic cigarettes1 physical activity2 weight3 7–8 hours4
Men—Con. Percent (standard error)
Race: White, single race . . . . . . . . . . . . . . . . . . . . . . . . . . 50.4 (0.42) 33.2 (0.42) 29.8 (0.36) 64.8 (0.39) Black or African American, single race . . . . . . . . . . . . . 57.7 (0.91) 29.5 (0.95) 29.7 (0.87) 55.9 (0.92) American Indian or Alaska Native, single race . . . . . . . . 47.8 (5.30) 28.8 (3.80) 27.4 (3.65) 64.4 (3.91) Asian, single race . . . . . . . . . . . . . . . . . . . . . . . . . . 65.2 (1.40) 32.9 (1.42) 50.3 (1.50) 63.1 (1.41) Native Hawaiian or Other Pacific Islander, single race. . . . 65.8 (8.42) 23.3 (6.68) *23.0 (7.58) 58.7 (9.58) Two or more races . . . . . . . . . . . . . . . . . . . . . . . . . 49.6 (3.02) 31.6 (2.67) 26.3 (2.39) 57.6 (3.06)
Black or African American, white . . . . . . . . . . . . . . . 60.4 (7.63) 43.1 (8.07) 40.1 (8.03) 61.7 (7.87) American Indian or Alaska Native, white . . . . . . . . . . . 40.4 (4.23) 26.8 (3.52) 21.6 (3.01) 58.2 (4.22)
Hispanic or Latino origin and race: Hispanic or Latino . . . . . . . . . . . . . . . . . . . . . . . . . . 62.8 (0.84) 25.2 (0.71) 27.9 (0.76) 68.0 (0.76)
Mexican or Mexican American . . . . . . . . . . . . . . . . . 63.8 (1.00) 24.4 (0.84) 27.9 (0.94) 70.1 (0.93) Not Hispanic or Latino . . . . . . . . . . . . . . . . . . . . . . . 50.0 (0.41) 33.9 (0.42) 31.1 (0.36) 62.9 (0.37)
White, single race . . . . . . . . . . . . . . . . . . . . . . . . 48.1 (0.46) 34.8 (0.47) 30.1 (0.40) 64.1 (0.43) Black or African American, single race . . . . . . . . . . . . 57.2 (0.94) 29.1 (0.97) 29.8 (0.88) 55.7 (0.93)
Education: Less than high school graduate . . . . . . . . . . . . . . . . . 43.8 (0.89) 19.9 (0.74) 32.5 (0.78) 61.8 (0.80) GED diploma7 . . . . . . . . . . . . . . . . . . . . . . . . . . . . 25.3 (1.70) 26.1 (1.97) 27.5 (1.78) 51.9 (1.97) High school graduate . . . . . . . . . . . . . . . . . . . . . . . . 46.0 (0.66) 25.4 (0.63) 29.7 (0.60) 62.9 (0.65) Some college—no degree . . . . . . . . . . . . . . . . . . . . . 52.1 (0.88) 35.5 (0.85) 31.1 (0.79) 60.7 (0.76) Associate of arts degree . . . . . . . . . . . . . . . . . . . . . . 51.5 (1.10) 37.1 (1.06) 25.3 (0.97) 62.9 (1.05) Bachelor of arts, science degree . . . . . . . . . . . . . . . . . 63.4 (0.78) 44.5 (0.82) 30.7 (0.76) 68.1 (0.73) Masters, doctorate, medical degree . . . . . . . . . . . . . . . 67.5 (0.96) 47.5 (1.07) 35.0 (1.04) 69.7 (0.97)
Poverty status:8
Below poverty level . . . . . . . . . . . . . . . . . . . . . . . . . 50.6 (1.25) 24.4 (1.13) 38.2 (1.07) 59.0 (0.99) ≥1 and <2 times poverty level . . . . . . . . . . . . . . . . . . 47.4 (0.91) 24.8 (0.82) 33.9 (0.85) 60.8 (0.80) ≥2 and <4 times poverty level . . . . . . . . . . . . . . . . . . 49.4 (0.62) 30.0 (0.59) 29.9 (0.56) 62.8 (0.59) 4 times poverty level or more . . . . . . . . . . . . . . . . . . . 55.8 (0.55) 40.2 (0.55) 27.9 (0.53) 66.6 (0.54)
Marital status: Never married . . . . . . . . . . . . . . . . . . . . . . . . . . . . 62.5 (0.81) 39.9 (0.78) 43.4 (0.74) 64.0 (0.72) Married . . . . . . . . . . . . . . . . . . . . . . . . . . . . . . . . 51.7 (0.46) 30.6 (0.47) 25.3 (0.39) 65.3 (0.44) Cohabiting . . . . . . . . . . . . . . . . . . . . . . . . . . . . . . 40.8 (1.26) 32.8 (1.29) 33.2 (1.24) 60.6 (1.32) Divorced or separated . . . . . . . . . . . . . . . . . . . . . . . 38.6 (0.85) 31.9 (0.83) 29.4 (0.78) 56.0 (0.89) Widowed . . . . . . . . . . . . . . . . . . . . . . . . . . . . . . . 33.2 (1.44) 20.8 (1.30) 37.8 (1.55) 56.7 (1.55)
Geographic region: Northeast . . . . . . . . . . . . . . . . . . . . . . . . . . . . . . . 52.3 (0.97) 34.3 (0.94) 31.3 (0.82) 60.9 (0.79) Midwest . . . . . . . . . . . . . . . . . . . . . . . . . . . . . . . . 48.6 (0.78) 33.9 (0.82) 29.9 (0.67) 62.8 (0.75) South . . . . . . . . . . . . . . . . . . . . . . . . . . . . . . . . . 51.7 (0.61) 29.8 (0.62) 29.8 (0.53) 63.3 (0.56) West . . . . . . . . . . . . . . . . . . . . . . . . . . . . . . . . . . 55.1 (0.79) 35.0 (0.75) 32.5 (0.72) 67.2 (0.69)
Women
Ages 18 years and over (crude)5 . . . . . . . . . . . . . . . . . . 64.0 (0.33) 28.7 (0.35) 43.8 (0.34) 63.3 (0.30) Ages 18 years and over (age-adjusted)5,6 . . . . . . . . . . . . 64.4 (0.33) 28.9 (0.35) 44.2 (0.34) 63.4 (0.31)
Age: 18–24 years . . . . . . . . . . . . . . . . . . . . . . . . . . . . . 73.1 (0.89) 32.9 (0.95) 58.2 (0.97) 63.4 (0.95) 25–44 years . . . . . . . . . . . . . . . . . . . . . . . . . . . . . 66.2 (0.48) 32.1 (0.51) 45.9 (0.52) 64.8 (0.47) 45–64 years . . . . . . . . . . . . . . . . . . . . . . . . . . . . . 58.4 (0.56) 28.7 (0.53) 37.7 (0.54) 63.6 (0.51) 65–74 years . . . . . . . . . . . . . . . . . . . . . . . . . . . . . 58.6 (0.92) 23.0 (0.84) 35.4 (0.96) 62.9 (0.87) 75 years and over . . . . . . . . . . . . . . . . . . . . . . . . . . 69.0 (0.85) 14.0 (0.68) 45.6 (0.90) 56.5 (0.88)
Race: White, single race . . . . . . . . . . . . . . . . . . . . . . . . . . 61.6 (0.37) 30.2 (0.39) 45.0 (0.39) 64.7 (0.33) Black or African American, single race . . . . . . . . . . . . . 71.9 (0.68) 19.2 (0.60) 29.5 (0.69) 55.3 (0.78) American Indian or Alaska Native, single race . . . . . . . . 56.3 (4.14) 25.7 (2.81) 31.7 (3.12) 53.7 (3.42) Asian, single race . . . . . . . . . . . . . . . . . . . . . . . . . . 89.5 (0.78) 26.7 (1.28) 65.2 (1.41) 65.1 (1.41) Native Hawaiian or Other Pacific Islander, single race. . . . 80.2 (6.77) 42.1 (9.56) 35.7 (8.04) 59.1 (8.07) Two or more races . . . . . . . . . . . . . . . . . . . . . . . . . 54.8 (2.98) 31.2 (2.59) 41.8 (2.88) 52.7 (2.67)
Black or African American, white . . . . . . . . . . . . . . . 68.8 (5.42) 25.0 (5.71) 39.9 (6.18) 54.1 (5.89) American Indian or Alaska Native, white . . . . . . . . . . . 46.1 (4.09) 27.9 (3.60) 35.7 (4.13) 52.5 (3.65)
See footnotes at end of table.

Series 10, No. 245 [ Page 131
Table XXI. Crude percentages (with standard errors) of adults 18 years of age and over who engaged in selected healthy behaviors, by selected characteristics: United States, average annual, 2005–2007—Con.
Selected healthy behaviors
Never Any regular smoked leisure-time Healthy Slept
Selected characteristic cigarettes1 physical activity2 weight3 7–8 hours4
Women—Con. Percent (standard error)
Hispanic or Latino origin and race: Hispanic or Latino . . . . . . . . . . . . . . . . . . . . . . . . . . 81.1 (0.55) 21.3 (0.65) 37.2 (0.73) 64.5 (0.71)
Mexican or Mexican American . . . . . . . . . . . . . . . . . 83.6 (0.67) 21.8 (0.89) 35.6 (0.94) 66.3 (0.93) Not Hispanic or Latino . . . . . . . . . . . . . . . . . . . . . . . 61.6 (0.37) 29.7 (0.38) 44.7 (0.37) 63.1 (0.33)
White, single race . . . . . . . . . . . . . . . . . . . . . . . . 58.4 (0.41) 31.6 (0.44) 46.2 (0.42) 64.6 (0.37) Black or African American, single race . . . . . . . . . . . . 71.8 (0.68) 19.2 (0.61) 29.3 (0.69) 55.3 (0.79)
Education: Less than high school graduate . . . . . . . . . . . . . . . . . 63.0 (0.71) 14.5 (0.50) 34.5 (0.70) 56.5 (0.69) GED diploma7 . . . . . . . . . . . . . . . . . . . . . . . . . . . . 40.1 (1.83) 17.3 (1.35) 33.2 (1.89) 51.9 (1.92) High school graduate . . . . . . . . . . . . . . . . . . . . . . . . 60.8 (0.63) 21.8 (0.55) 40.0 (0.63) 62.5 (0.57) Some college—no degree . . . . . . . . . . . . . . . . . . . . . 60.7 (0.71) 31.7 (0.66) 44.6 (0.73) 62.0 (0.67) Associate of arts degree . . . . . . . . . . . . . . . . . . . . . . 61.4 (0.91) 32.3 (0.91) 40.9 (0.92) 62.9 (0.89) Bachelor of arts, science degree . . . . . . . . . . . . . . . . . 73.9 (0.65) 41.2 (0.79) 55.2 (0.75) 70.6 (0.66) Masters, doctorate, medical degree . . . . . . . . . . . . . . . 72.9 (0.92) 45.7 (1.03) 55.4 (1.08) 70.3 (0.94)
Poverty status:8
Below poverty level . . . . . . . . . . . . . . . . . . . . . . . . . 62.5 (0.84) 18.8 (0.67) 37.6 (0.82) 54.6 (0.73) ≥1 and <2 times poverty level . . . . . . . . . . . . . . . . . . 63.4 (0.63) 20.7 (0.57) 38.3 (0.66) 58.9 (0.64) ≥2 and <4 times poverty level . . . . . . . . . . . . . . . . . . 63.1 (0.57) 27.2 (0.56) 43.0 (0.66) 63.5 (0.55) 4 times poverty level or more . . . . . . . . . . . . . . . . . . . 65.7 (0.50) 38.0 (0.57) 49.8 (0.61) 68.8 (0.50)
Marital status: Never married . . . . . . . . . . . . . . . . . . . . . . . . . . . . 71.2 (0.70) 31.5 (0.76) 49.5 (0.80) 62.6 (0.74) Married . . . . . . . . . . . . . . . . . . . . . . . . . . . . . . . . 66.3 (0.41) 30.8 (0.47) 43.8 (0.45) 66.2 (0.39) Cohabiting . . . . . . . . . . . . . . . . . . . . . . . . . . . . . . 46.8 (1.37) 29.7 (1.22) 46.3 (1.32) 61.1 (1.34) Divorced or separated . . . . . . . . . . . . . . . . . . . . . . . 52.2 (0.71) 24.7 (0.61) 37.9 (0.71) 57.2 (0.74) Widowed . . . . . . . . . . . . . . . . . . . . . . . . . . . . . . . 62.4 (0.81) 16.0 (0.61) 39.2 (0.74) 56.7 (0.79)
Geographic region: Northeast . . . . . . . . . . . . . . . . . . . . . . . . . . . . . . . 61.1 (0.71) 29.7 (0.75) 46.4 (0.83) 62.6 (0.70) Midwest . . . . . . . . . . . . . . . . . . . . . . . . . . . . . . . . 60.0 (0.76) 30.1 (0.78) 43.1 (0.79) 62.6 (0.61) South . . . . . . . . . . . . . . . . . . . . . . . . . . . . . . . . . 65.3 (0.51) 25.2 (0.57) 41.5 (0.54) 62.7 (0.52) West . . . . . . . . . . . . . . . . . . . . . . . . . . . . . . . . . . 68.9 (0.68) 32.2 (0.71) 46.3 (0.67) 65.8 (0.64)
* Estimates preceded by an asterisk have a relative standard error of greater than 30% and less than or equal to 50%. These should be interpreted with caution as they do not meet the standard of reliability or precision. 1Never smoked cigarettes or smoked fewer than 100 cigarettes in lifetime. 2Engaged in light-moderate leisure-time physical activity at least 5 times per week for at least 30 minutes each time or engaged in vigorous leisure-time physical activity at least 3 times per week for at least 20 minutes each time or both. 3Healthy weight is a BMI of greater than or equal to 18.5 and less than 25. 4Usual number of hours of sleep in a 24-hour period. 5Persons of other races and unknown race and ethnicity, unknown education, unknown poverty status, and unknown marital status are included in total. 6Estimates are age adjusted using the projected 2000 U.S. population as the standard population and using three age groups: 18–44 years, 45–64 years, and 65 years and over. 7GED is General Educational Development high school equivalency diploma. 8Poverty status is based on family income and family size using the U.S. Census Bureau poverty thresholds for 2004, 2005, and 2006.
NOTES: For age-adjusted percentages, refer to Table 8.2. Denominator for each percentage excludes persons with unknown health behavior characteristics. See Appendix II for definitions of terms. See Appendix III for health behavior questions.
DATA SOURCE: National Health Interview Survey, 2005–2007. Estimates are based on household interviews of a sample of the civilian noninstitutionalized population.

Page 132 [ Series 10, No. 245
Table XXII. Number of adults 18 years of age and over, by selected characteristics: United States, average annual, 2005–2007
Selected characteristic Both sexes Men Women
Number (in thousands)
Total1 . . . . . . . . . . . . . . . . . . . . . . . . . . . . . . . . . . . 220,407 106,307 114,100
Age
18–24 years . . . . . . . . . . . . . . . . . . . . . . . . . . . . . . . 28,469 14,267 14,202 25–44 years . . . . . . . . . . . . . . . . . . . . . . . . . . . . . . . 82,102 40,764 41,337 45–64 years . . . . . . . . . . . . . . . . . . . . . . . . . . . . . . . 74,212 36,052 38,160 65–74 years . . . . . . . . . . . . . . . . . . . . . . . . . . . . . . . 18,928 8,704 10,224 75 years and over . . . . . . . . . . . . . . . . . . . . . . . . . . . 16,697 6,519 10,177
Race
White, single race . . . . . . . . . . . . . . . . . . . . . . . . . . . 180,250 87,677 92,573 Black or African American, single race. . . . . . . . . . . . . . . 25,802 11,568 14,234 American Indian or Alaska Native, single race . . . . . . . . . . 1,825 921 903 Asian, single race . . . . . . . . . . . . . . . . . . . . . . . . . . . 9,553 4,645 4,908 Native Hawaiian or other Pacific Islander, single race . . . . . 333 182 151 Two or more races . . . . . . . . . . . . . . . . . . . . . . . . . . . 2,646 1,314 1,331
Black or African American, white . . . . . . . . . . . . . . . . . 363 150 213 American Indian or Alaska Native, white . . . . . . . . . . . . 1,282 684 598
Hispanic or Latino origin and race
Hispanic or Latino . . . . . . . . . . . . . . . . . . . . . . . . . . . 28,764 14,793 13,970 Mexican or Mexican American . . . . . . . . . . . . . . . . . . 17,863 9,410 8,452
Not Hispanic or Latino. . . . . . . . . . . . . . . . . . . . . . . . . 191,644 91,514 100,130 White, single race . . . . . . . . . . . . . . . . . . . . . . . . . . 153,640 73,992 79,648 Black or African American, single race . . . . . . . . . . . . . 24,968 11,160 13,809
Education
Less than high school graduate . . . . . . . . . . . . . . . . . . . 35,504 17,537 17,967 GED diploma2 . . . . . . . . . . . . . . . . . . . . . . . . . . . . . . 6,004 3,089 2,915 High school graduate . . . . . . . . . . . . . . . . . . . . . . . . . 57,593 27,733 29,860 Some college—no degree . . . . . . . . . . . . . . . . . . . . . . 41,412 19,287 22,125 Associate of arts degree . . . . . . . . . . . . . . . . . . . . . . . 20,824 9,128 11,696 Bachelor of arts, science degree . . . . . . . . . . . . . . . . . . 37,284 18,380 18,904 Masters, doctorate, medical degree . . . . . . . . . . . . . . . . 19,284 9,967 9,317
Poverty3
Below poverty level . . . . . . . . . . . . . . . . . . . . . . . . . . 26,926 11,210 15,716 ≥1 and <2 times poverty level . . . . . . . . . . . . . . . . . . . . 41,015 18,645 22,371 ≥2 and <4 times poverty level . . . . . . . . . . . . . . . . . . . . 67,910 32,842 35,068 4 times poverty level or more . . . . . . . . . . . . . . . . . . . . 84,556 43,610 40,945
Marital status
Never married. . . . . . . . . . . . . . . . . . . . . . . . . . . . . . 44,278 24,250 20,028 Married . . . . . . . . . . . . . . . . . . . . . . . . . . . . . . . . . . 124,441 62,339 62,102 Cohabiting . . . . . . . . . . . . . . . . . . . . . . . . . . . . . . . . 13,381 6,999 6,382 Divorced or separated. . . . . . . . . . . . . . . . . . . . . . . . . 23,832 9,706 14,126 Widowed . . . . . . . . . . . . . . . . . . . . . . . . . . . . . . . . . 13,689 2,715 10,974
Geographic region
Northeast . . . . . . . . . . . . . . . . . . . . . . . . . . . . . . . . 39,028 18,235 20,793 Midwest . . . . . . . . . . . . . . . . . . . . . . . . . . . . . . . . . 53,097 25,808 27,290 South . . . . . . . . . . . . . . . . . . . . . . . . . . . . . . . . . . . 81,397 38,979 42,418 West . . . . . . . . . . . . . . . . . . . . . . . . . . . . . . . . . . . 46,884 23,285 23,599
1Persons of other races and unknown race and ethnicity, unknown education, unknown poverty status, and unknown marital status are included in total. 2GED is General Educational Development high school equivalency diploma. 3Poverty status is based on family income and family size using the U.S. Census Bureau poverty thresholds for 2004, 2005, and 2006.
NOTES: Population estimates can be used in conjuction with the unadjusted statistics to calculate the numbers of persons in each category shown in the Appendix IV tables of the report. See Appendix II for definitions of terms.
DATA SOURCE: National Health Interview Survey, 2005–2007. Estimates are based on household interviews of a sample of the civilian noninstitutionalized population.

Vital and Health Statistics Series Descriptions
ACTIVE SERIES
Series 1. Programs and Collection Procedures—This type of report describes the data collection programs of the National Center for Health Statistics. Series 1 includes descriptions of the methods used to collect and process the data, definitions, and other material necessary for understanding the data.
Series 2. Data Evaluation and Methods Research—This type of report concerns statistical methods and includes analytical techniques, objective evaluations of reliability of collected data, and contributions to statistical theory. Also included are experimental tests of new survey methods, comparisons of U.S. methodologies with those of other countries, and as of 2009, studies of cognition and survey measurement, and final reports of major committees concerning vital and health statistics measurement and methods.
Series 3. Analytical and Epidemiological Studies—This type of report presents analytical or interpretive studies based on vital and health statistics. As of 2009, Series 3 also includes studies based on surveys that are not part of continuing data systems of the National Center for Health Statistics and international vital and health statistics reports.
Series 10. Data From the National Health Interview Survey—This type of report contains statistics on illness; unintentional injuries; disability; use of hospital, medical, and other health services; and a wide range of special current health topics covering many aspects of health behaviors, health status, and health care utilization. Series 10 is based on data collected in this continuing national household interview survey.
Series 11. Data From the National Health Examination Survey, the National Health and Nutrition Examination Surveys, and the Hispanic Health and Nutrition Examination Survey— In this type of report, data from direct examination, testing, and measurement on representative samples of the civilian noninstitutionalized population provide the basis for (1) medically defined total prevalence of specific diseases or conditions in the United States and the distributions of the population with respect to physical, physiological, and psychological characteristics, and (2) analyses of trends and relationships among various measurements and between survey periods.
Series 13. Data From the National Health Care Survey—This type of report contains statistics on health resources and the public’s use of health care resources including ambulatory, hospital, and long-term care services based on data collected directly from health care providers and provider records.
Series 20. Data on Mortality—This type of report contains statistics on mortality that are not included in regular, annual, or monthly reports. Special analyses by cause of death, age, other demographic variables, and geographic and trend analyses are included.
Series 21. Data on Natality, Marriage, and Divorce—This type of report contains statistics on natality, marriage, and divorce that are not included in regular, annual, or monthly reports. Special analyses by health and demographic variables and geographic and trend analyses are included.
Series 23. Data From the National Survey of Family Growth—These reports contain statistics on factors that affect birth rates, including contraception and infertility; factors affecting the formation and dissolution of families, including cohabitation, marriage, divorce, and remarriage; and behavior related to the risk of HIV and other sexually transmitted diseases. These statistics are based on national surveys of women and men of childbearing age.
DISCONTINUED SERIES
Series 4. Documents and Committee Reports—These are final reports of major committees concerned with vital and health statistics and documents. The last Series 4 report was published in 2002. As of 2009, this type of report is included in Series 2 or another appropriate series, depending on the report topic.
Series 5. International Vital and Health Statistics Reports—This type of report compares U.S. vital and health statistics with those of other countries or presents other international data of relevance to the health statistics system of the United States. The last Series 5 report was published in 2003. As of 2009, this type of report is included in Series 3 or another series, depending on the report topic.
Series 6. Cognition and Survey Measurement—This type of report uses methods of cognitive science to design, evaluate, and test survey instruments. The last Series 6 report was published in 1999. As of 2009, this type of report is included in Series 2.
Series 12. Data From the Institutionalized Population Surveys— The last Series 12 report was published in 1974. Reports from these surveys are included in Series 13.
Series 14. Data on Health Resources: Manpower and Facilities— The last Series 14 report was published in 1989. Reports on health resources are included in Series 13.
Series 15. Data From Special Surveys— This type of report contains statistics on health and health-related topics collected in special surveys that are not part of the continuing data systems of the National Center for Health Statistics. The last Series 15 report was published in 2002. As of 2009, reports based on these surveys are included in Series 3.
Series 16. Compilations of Advance Data From Vital and Health Statistics— The last Series 16 report was published in 1996. All reports are available online, and so compilations of Advance Data reports are no longer needed.
Series 22. Data From the National Mortality and Natality Surveys— The last Series 22 report was published in 1973. Reports from these sample surveys, based on vital records, are published in Series 20 or 21.
Series 24. Compilations of Data on Natality, Mortality, Marriage, and Divorce—The last Series 24 report was published in 1996. All reports are available online, and so compilations of reports are no longer needed.
For answers to questions about this report or for a list of reports published in these series, contact:
Information Dissemination Staff National Center for Health Statistics Centers for Disease Control and Prevention 3311 Toledo Road, Room 5412 Hyattsville, MD 20782
1–800–232–4636 E-mail: [email protected] Internet: http://www.cdc.gov/nchs

U.S. DEPARTMENT OF HEALTH & HUMAN SERVICES
Centers for Disease Control and Prevention National Center for Health Statistics 3311 Toledo Road Hyattsville, MD 20782
OFFICIAL BUSINESS PENALTY FOR PRIVATE USE, $300
MEDIA MAIL POSTAGE & FEES PAID
CDC/NCHS PERMIT NO. G-284
CS206373 T35999 (3/2010) DHHS Publication No. (PHS) 2010–1573, Series 10, No. 245


