42
2010 Interim Results July 2010

2010 Interim ResultsJuly 2010

Agenda
Business review and outlook
Financial results
Q&A

Highlights
Revenues up 33% to £46.2m (2009: £34.6m)
Signals/Illumination Revenue up by 23% to £26.1m :
Obstruction products up 60% to £4.9m
Lighting products up 60% to £4.0m
Operating profit £5.3m (2009:£0.6m)
Underlying EPS 10.8p (2009:1.0p)
Interim Dividend 2.8pence (2009: 2.3pence)

Half year Revenues
2010 2009
Total Revenue £46.2m £34.6m
Signals/Illumination £26.1m £21.2m
Electromagnetic Components £7.5m £5.4m
Indication Components £12.5m £8.0m

Contribution Margins
2010 2009
Signals/Illumination 42.0% 35.5%
Electromagnetic Components 18.3% 24.9%
Indication Components 54.6% 49.2%
Indication Components
Revenues up over 50% versus 2009
Inventory replenishment in H1
Some softness anticipated in H2
Shortages in the general electronics component market starting
to affect customer schedules
Fundamentals of the business unchanged
Margins solid
Demand driven by Servers, Storage, Cellular Infrastructure and
Networking/Internet

Electromagnetic Components
Revenues up £2.1m (40%) versus 2009
200 amp Disconnect still showing growth
Traditional business continues recovery
Prospects for Disconnect still promising but on thin margins
Smart Metering starting to proliferate throughout the world
Major new customer in US market

Signals/Illumination
2010 2009
Revenue: £25.6m £21.2m
Traffic £12.8m £11.2m
Obstruction £4.9m £3.0m
Transportation £4.4m £4.5m
Lighting £4.0m £2.5m

Signals - Traffic
US traffic continues steady with little big contract activity
Strong European performance
UK market performs well
Margins improved
Market showing some nervousness for second half

€750m potential market
More than 15million lights still to replace
50W halogen lamps (1yr life)
vs.
8W Dialight LED lamps (5yr life)
European growth opportunity
Signals - Obstruction
Continued strong growth
Wind Turbine Market in US quite soft
White Strobe showing outstanding growth
H1 shipments almost equal to full year 2009
New “single level” strobe shipping
Previously announced contracts shipping in volume
BTI acquisition on plan

• White LED Strobe replaces over 80,000 conventional strobes in the US alone
• Potential 10 year lamp life
• Over 95% still to be converted
• Wind turbines forecasted to produce up to 35% of Europe’s electricity by 2030
Potential market over $250m
for strobes alone
Dialight LED
Dual Beacon
Xenon Strobe
Telecom • Broadcast • Wind Turbines • Tall Structures
Obstruction Lighting growth potential

Illumination
Revenues up 60%
Industrial White Lighting sales in H1 2010 almost as twice those
in full year 2009
Safesite High Bay continues early success in multiple
applications
Strong paybacks with Dialight LED Lights
Multiple customers
Pipeline of new products

White Light Strategy

Type Efficiency
lm/W
Life -hours
x1000
Cost Per
lumen $
Colour
Rendering Ra
High Pressure
Sodium
60 -120 10 - 20 0.0004 30
Ceramic Metal
Halide
60 -100 6 -12 0.0010 70 - 95
Fluorescent 40 -100 6 - 45 0.0005 60 - 90
Halogen & Tungsten 8 -22 2 - 10 0.0002 100
Cool white LED
6000k
90 -130 50 0.015 70
Warm white LED
3000k
20 - 50 50 0.04 75 -90
How do LEDs compare to the competition?

LED Technology Roadmap

Why LEDs?
• Long Life
• High Efficiency
• Shock & Vibration
• Extreme Climates
• Zero Maintenance
• Precise Optical Control
• Instant Light
• Switching Cycles
• Improved Visibility
=Superior Cost
of
Ownership

2010 Global Projection: $75 billion
Residential
23% Industrial
7%
Outdoor
17%Commercial
21%
Portable
18%
Parts &
Accessories
14%
Source: Freedonia
Lighting Market Segments
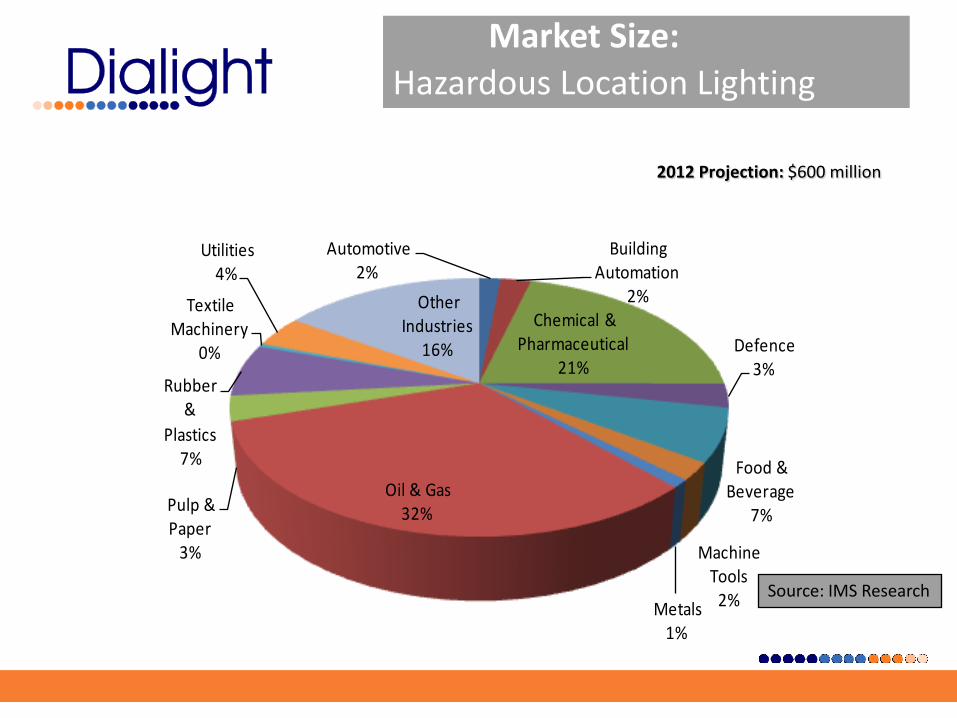
Automotive 2%
Building Automation
2%Chemical &
Pharmaceutical 21%
Defence 3%
Food & Beverage
7%
Machine Tools
2%Metals 1%
Oil & Gas 32%Pulp &
Paper 3%
Rubber &
Plastics 7%
Textile Machinery
0%
Utilities 4%
Other Industries
16%
Source: IMS Research
Market Size:
Hazardous Location Lighting
2012 Projection: $600 million

Dialight LED Lighting
Product Portfolio
HZC / STW Area LightPower Consumption: 100WReplaces: 250W HIDEnergy Savings: 40%Typical Payback: 2-4 years
Wallpack / BulkheadPower Consumption: 22WReplaces: 70W HIDEnergy Savings: 70%Typical Payback: 2-4 years
RTO Area LightPower Consumption: 9WReplaces: 65W IncanEnergy Savings: 75 – 85%Typical Payback: 1-3 years
FRT Linear FixturePower Consumption: 30WReplaces: 35W FluorEnergy Savings: 25%Typical Payback: 4-6 years
Linear FixturePower Consumption: 100WReplaces: 200W FluorEnergy Savings: 50%Typical Payback: < 2 years
High BayPower Consumption: 150WReplaces: 400W HIDEnergy Savings: 65%Typical Payback: 1-3 years
LPK Linear FixturePower Consumption: 72WReplaces: 100W FluorEnergy Savings: 30%Typical Payback: 3-5 years

Installed BaseArkema ChemicalsDegussa Engineered CarbDow ChemicalDow CorningFMC AlcoyFormosa PlasticGreat Salk Lake MineralsIndolex Chemical Co.ISP ChemicalsLubrizol PainsevilleLyondell Bassell Oxbow Carbon & MineralsOxy ChemicalRain CII Carbon LLCRed Cedar GatheringReichhold ChemicalsRohm HaasSaint Gobain PlasticsSartomerSasol North AmericaSolvay ChemicalsSun ProductsTamecoThatcher Chemical
Chemical & Petrochemical
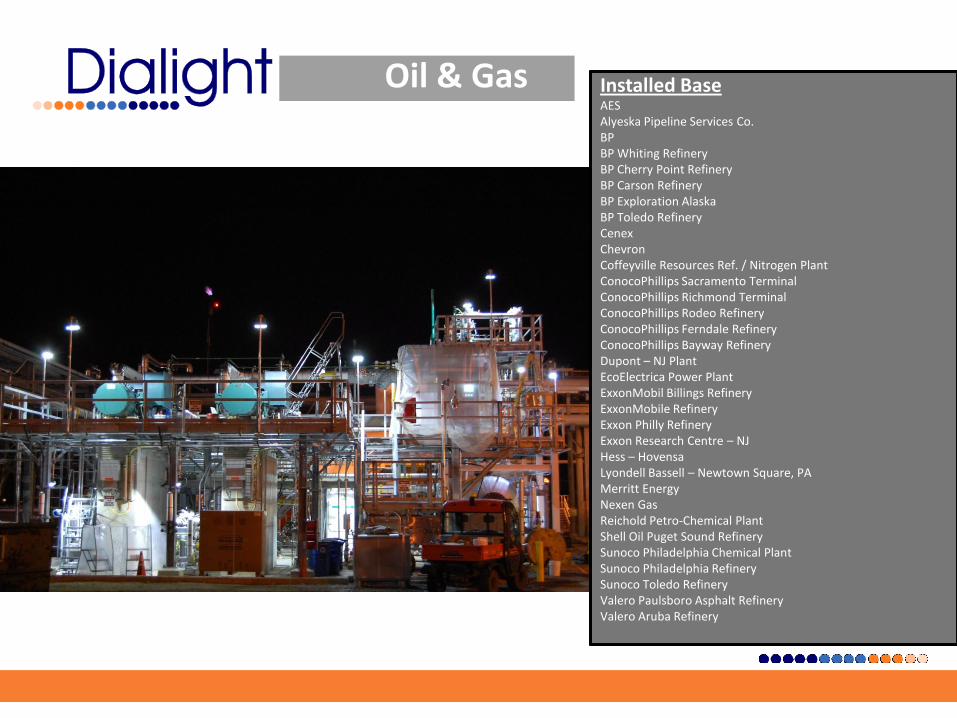
Oil & Gas Installed BaseAESAlyeska Pipeline Services Co.BPBP Whiting RefineryBP Cherry Point RefineryBP Carson RefineryBP Exploration AlaskaBP Toledo RefineryCenexChevronCoffeyville Resources Ref. / Nitrogen PlantConocoPhillips Sacramento TerminalConocoPhillips Richmond TerminalConocoPhillips Rodeo RefineryConocoPhillips Ferndale RefineryConocoPhillips Bayway RefineryDupont – NJ PlantEcoElectrica Power PlantExxonMobil Billings RefineryExxonMobile RefineryExxon Philly RefineryExxon Research Centre – NJHess – HovensaLyondell Bassell – Newtown Square, PAMerritt EnergyNexen GasReichold Petro-Chemical PlantShell Oil Puget Sound RefinerySunoco Philadelphia Chemical PlantSunoco Philadelphia RefinerySunoco Toledo RefineryValero Paulsboro Asphalt RefineryValero Aruba Refinery

Water, Sewage & Wastewater Treatment
Installed BaseCity of Philadelphia, Water Dept
City of Reno, NV
Dip Abitibi Bowater
Excel Energy
Henkel
Idaho Power
LA Water & Power
Passaic Valley Sewage
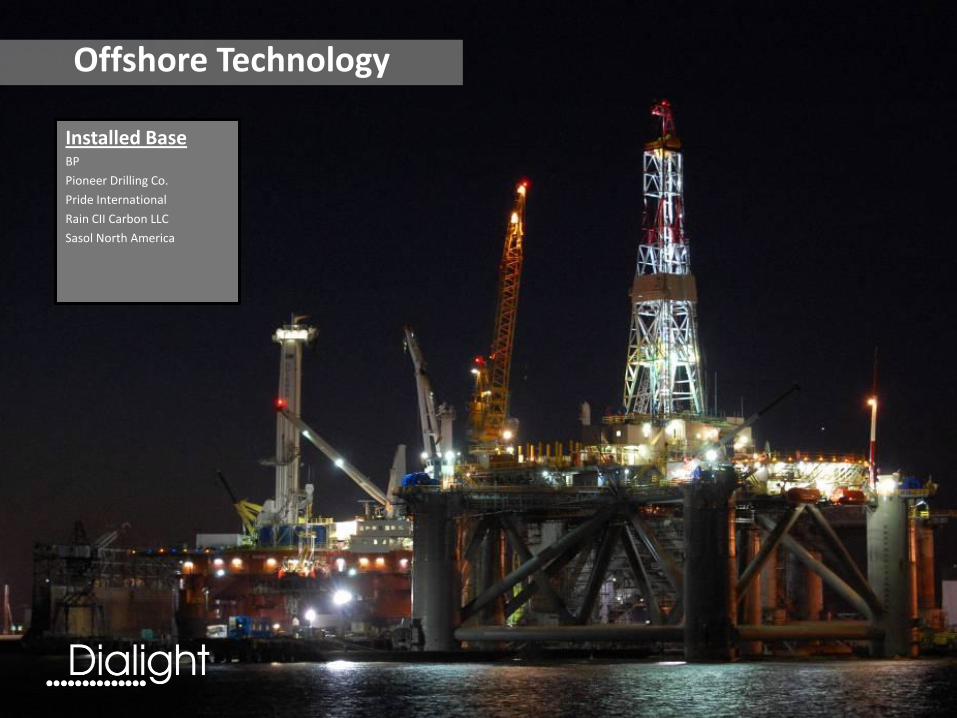
Offshore Technology
Installed BaseBP
Pioneer Drilling Co.
Pride International
Rain CII Carbon LLC
Sasol North America
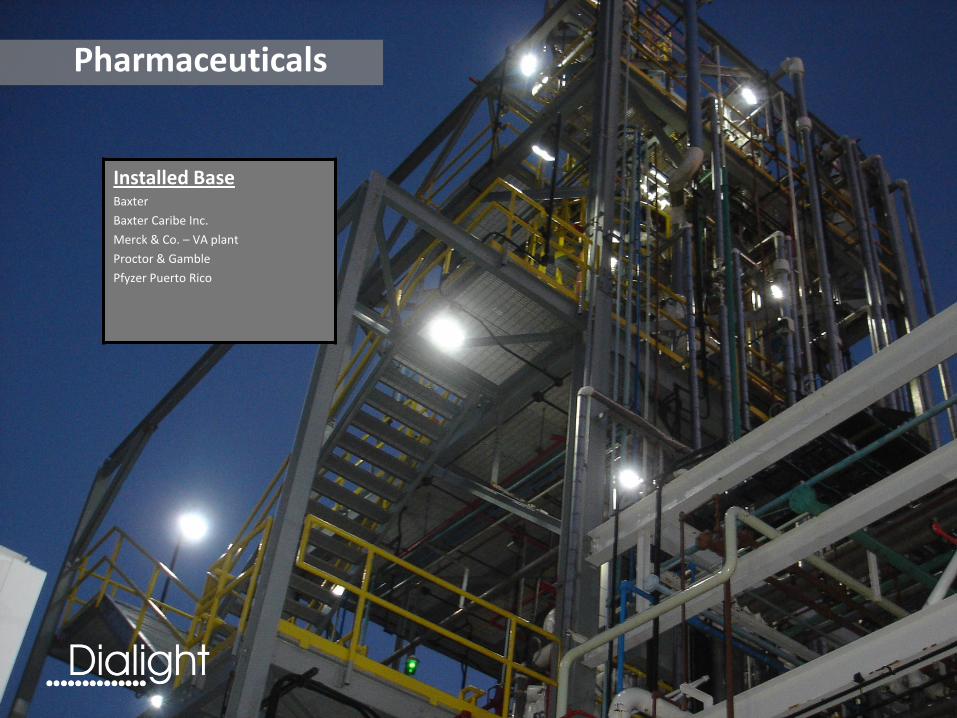
Pharmaceuticals
Installed BaseBaxter
Baxter Caribe Inc.
Merck & Co. – VA plant
Proctor & Gamble
Pfyzer Puerto Rico

Mining ApplicationsInstalled BaseAntelope Coal Mine
Arch Black Thunder Coal Mine
Climax Molybdenum Henderson Mine
Coal Peers
Henderson Mine
Jacobs Ranch Mine
Kiewit Buckskin Mining
Mississippi Phosphates Corp.
Mountain Coal West Elk Mine
Oxbow Carbon and Minerals
Peabody Twenty Mile Mine
Peabody Caballo Coal Mine
PCS Phosphate
Pilbara Iron
Red Path Mining
Rio Tinto Antelope Mine
Rio Tinto Cordero Rojo Mine
Rio Tinto Kennecott Copper Mine
Rio Tinto Kayenta Mine
Teck-Cominko Pogo Mine
Unico Mining
Western Energy Rose Bud Mine
Westmore Coal - Abasaloka Mine

Power Generation & Utilities
Installed BaseAnderson Merrit Energy
Chamming Electric Montana Power (PPL) Colstrip Power Plant
Chesapeake Energy PNM NM
Coalstrip – PA Light Public Service New Mexico
Colorado Springs Utilities Portland General Electric
Connectiz Rocky Mountain Power Hunter Station
Coteau Rocky Mountain Power Huntingdon Plant
Covanta Energy – DE Plant Rohr
DTE Energy Rytway
Energy Nuclear – River Bend Station Sebago
Enogex Spectra Energy
Envirolight Snowey Hydro
Eraring Energy Southwest Generation
Farmington, NM Tucson Electric Power
Great River Energy Wiliams Energy Gas Plant
Idaho Power Corporation Wisconsin Power & Light
IES Utilities, Inc OGS Xcel Energy
Kaneka Eperan
Kapar Energy
Line Power
Midwest Generation

Warehouse ApplicationsInstalled Base3E - Electrical Eng & Equipment Co. Noctur
Anderson Rittenhouse Electric
Archer Daniels Midland Corp. Rockline Industries
Aisin – Japan SEPTA
Automation & Electronics Steffen Inc.
The Baltimore Sun TECOT Dover Branch Transfers
Buckman Labs Timken David SIPE
City of Toronto Vektra Electric
Concord Phillips Wichita
Conectiv Edgemoor
DOT Warehouse
DTE Energy-St. Clair PP
Eco Lighting Services & Tech
FedEx
Galavan Industries
Glenadale Complex
Henrico County
Huntsmann
I/O Solutions & Controls
Jesco
John Deere
KEW Incorporated C/O Gerrie
Klockner Pentaplast
Lafarge
Medsafe Warehouse
Meng Xue Song
Mozel Inc.
Noctur
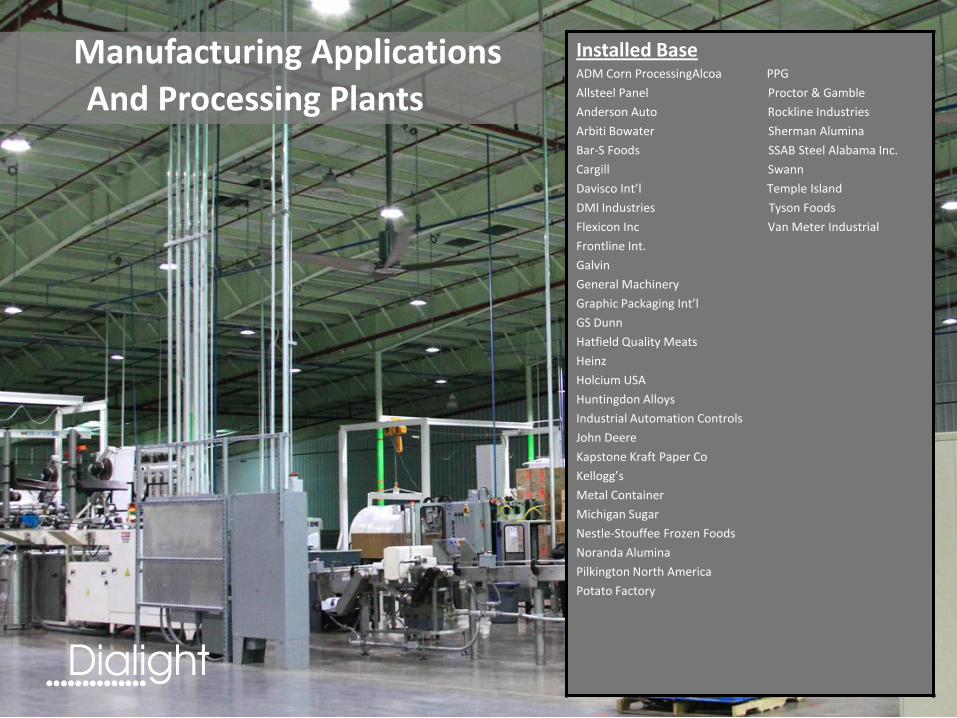
Manufacturing Applications
And Processing Plants
Installed BaseADM Corn ProcessingAlcoa PPG
Allsteel Panel Proctor & Gamble
Anderson Auto Rockline Industries
Arbiti Bowater Sherman Alumina
Bar-S Foods SSAB Steel Alabama Inc.
Cargill Swann
Davisco Int’l Temple Island
DMI Industries Tyson Foods
Flexicon Inc Van Meter Industrial
Frontline Int.
Galvin
General Machinery
Graphic Packaging Int’l
GS Dunn
Hatfield Quality Meats
Heinz
Holcium USA
Huntingdon Alloys
Industrial Automation Controls
John Deere
Kapstone Kraft Paper Co
Kellogg’s
Metal Container
Michigan Sugar
Nestle-Stouffee Frozen Foods
Noranda Alumina
Pilkington North America
Potato Factory

Case Study:
Baxter Pharmaceuticals
Project Overview
(50) 250W HID vs. (40) 100W LED
$6,000 (34,000 kWh) Energy Savings / yr
$35,000 Lifetime Maintenance Savings
30 tons CO2 Reduced
Payback = 23 Months

Case Study:
Rockline Industries
Project Overview
(140) 400W Metal Halide vs. (140) 150W LED
$16,000 (144,000 kWh) Energy Savings / yr
$77,500 Lifetime Maintenance Savings
124 tons of CO2 Reduced
Rebate Incentive: $48,000 ($342 per fixture)
Payback: < 9 Months (with rebate)

Case Study:
Frontline International
Project Overview
(59) 400W HID vs. (59) 150W LED
$18,000 (123,486 kWh) Energy Savings / yr
$30,000 Lifetime Maintenance Savings
106 tons of CO2 Reduced
Payback = 13 Months
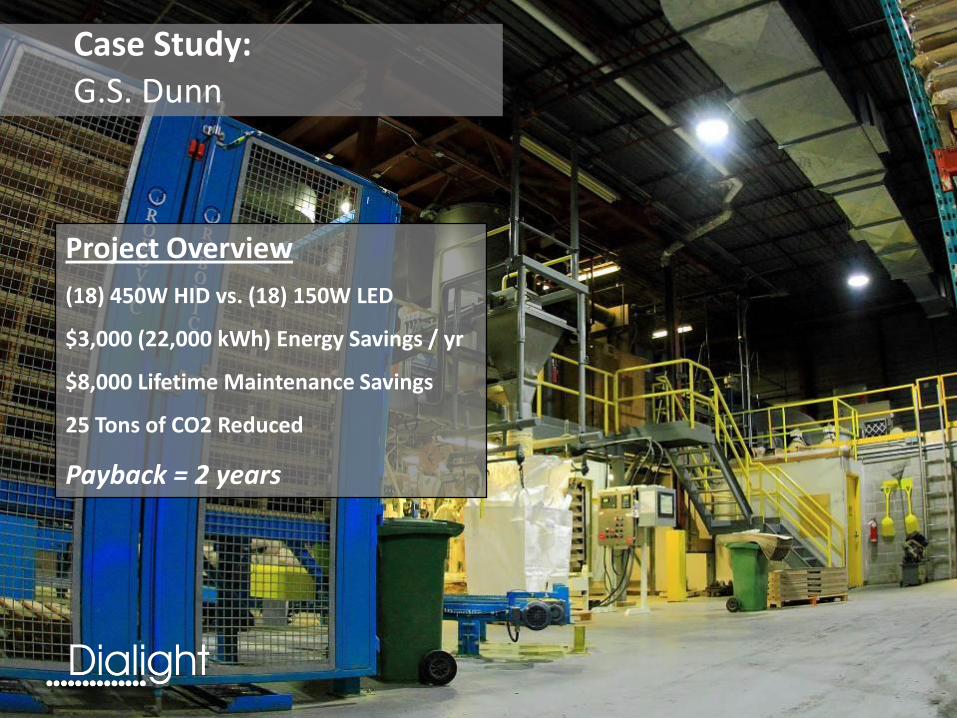
Case Study:
G.S. Dunn
Project Overview
(18) 450W HID vs. (18) 150W LED
$3,000 (22,000 kWh) Energy Savings / yr
$8,000 Lifetime Maintenance Savings
25 Tons of CO2 Reduced
Payback = 2 years

Outlook
Group shows continued excellent prospects for Revenue Growth and Profitability
Signals/Illumination demonstrating strong growth and margins
Improved LED efficiency and cost is moving the adoption point
Pipeline of new and improved White Lighting products
Reengineering and cost reduction programmes continue to drive profits in Signals/Illumination
LED Indication anticipated H2 softness but still a strong profit and cash generator for the full year
Prospects for Disconnect improved with the addition of a new US customer, albeit on thin margins

George RalphFinance Director

Summary Profit & Loss Account
2010 £M 2009 £M
Revenue 46.2 34.6
Gross Profit 12.6 7.0
Gross Profit % 27.3 20.2
Overhead costs (7.3) (6.4)
Operating profit 5.3 0.6
Net financing cost (0.1) (0.1)
Profit before tax 5.2 0.5
Tax (1.8) (0.2)
Profit from cont. ops 3.4 0.3
Exceptional profit - 2.0
Retained profit 3.4 2.3
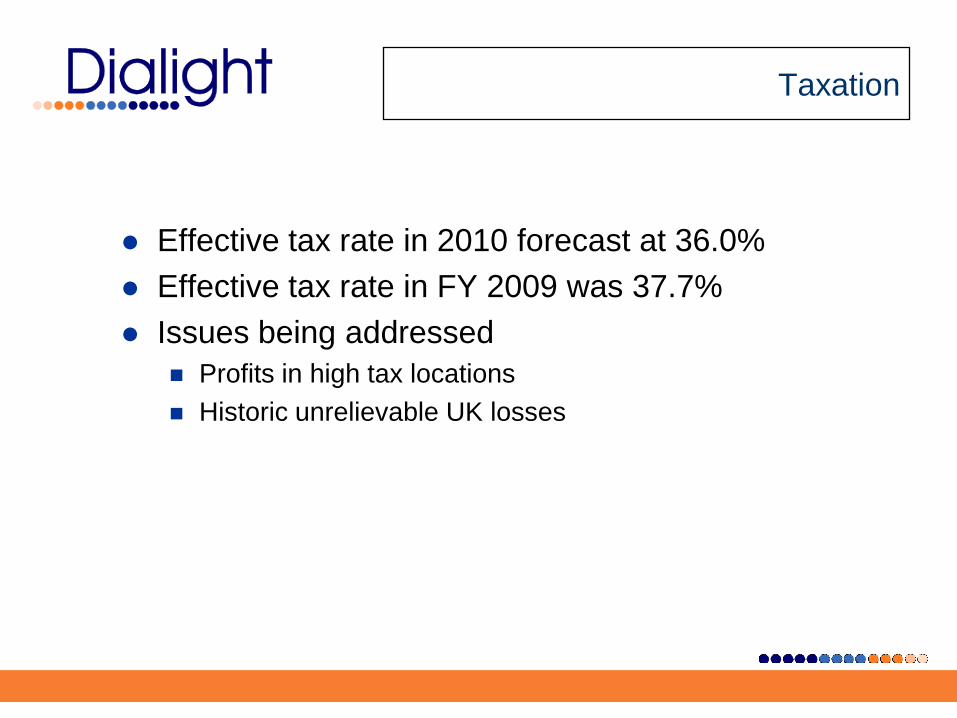
Taxation
Effective tax rate in 2010 forecast at 36.0%
Effective tax rate in FY 2009 was 37.7%
Issues being addressed
Profits in high tax locations
Historic unrelievable UK losses

Dividends and Earnings Per Share
2010 2009
Interim dividend per share 2.8p 2.3p
Basic EPS 10.8p 7.3p
Dividend cover 3.9 times 3.2 times
Adjusted EPS 10.8p 1.0p
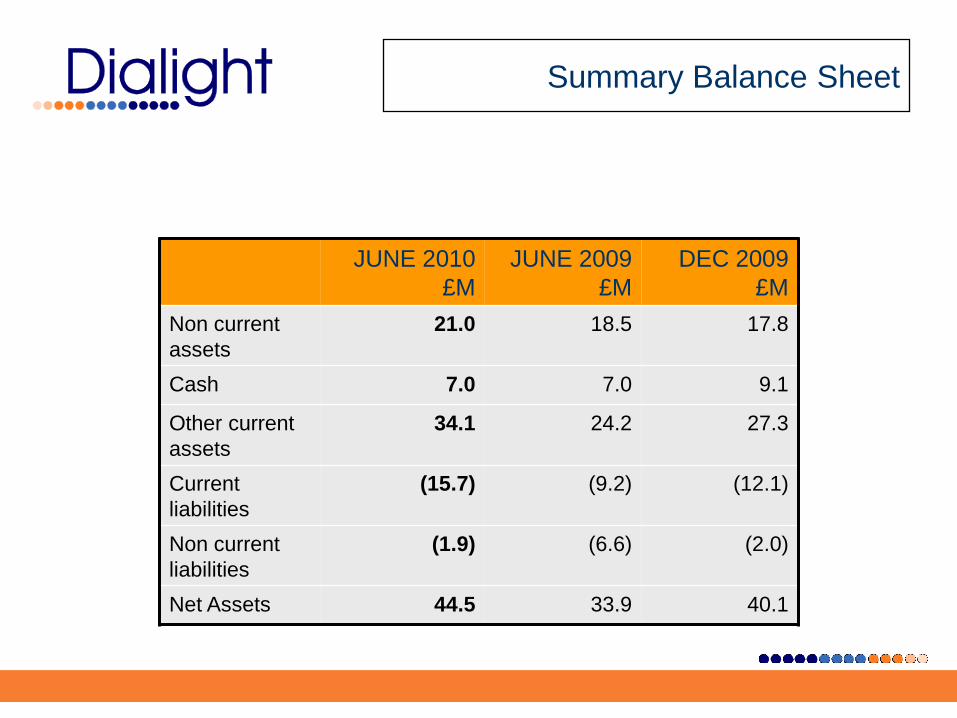
Summary Balance Sheet
JUNE 2010
£M
JUNE 2009
£M
DEC 2009
£M
Non current
assets
21.0 18.5 17.8
Cash 7.0 7.0 9.1
Other current
assets
34.1 24.2 27.3
Current
liabilities
(15.7) (9.2) (12.1)
Non current
liabilities
(1.9) (6.6) (2.0)
Net Assets 44.5 33.9 40.1

Summarised Cash flow
2010£M 2009£M
Operating cash 6.7 2.1
Working capital (2.5) 3.7
Cash from operations 4.2 5.8
Tax/financing (1.6) (0.4)
Investing activities (3.7) (0.9)
Financing activities (1.4) (1.2)
Change in net cash (2.5) 3.3
Working capital / Cash flow
Working capital requirements increased due to growth in
business.
Inventory – strategic purchasing to protect growth
Small improvement in receivables days outstanding compared
with year end.
Improvement in payables days outstanding compared with year
end
Cash - Continuing strong operating cash flow. Debt free balance
sheet

Outlook
Group shows continued excellent prospects for Revenue Growth and Profitability
Signals/Illumination demonstrating strong growth and margins
Improved LED efficiency and cost is moving the adoption point
Pipeline of new and improved White Lighting products
Reengineering and cost reduction programmes continue to drive profits in Signals/Illumination
LED Indication anticipated H2 softness but still a strong profit and cash generator for the full year
Prospects for Disconnect improved with the addition of a new US customer, albeit on thin margins


