2010 Maximum Residue Level (MRL) Workshop – Global Regulations Residue Decline Curves Related to MRLs San Francisco, CA June 2-3, 2010 Phil Brindle, PhD Global MRLs & Import Tolerances BASF Aricultural Solutions, Research Triangle Park, NC 27709, USA Email: [email protected]Tele: +1 919 547 2654
Transcript
2010 Maximum Residue Level (MRL) Workshop –Global Regulations
Residue Decline Curves Related to MRLsSan Francisco, CA
June 2-3, 2010
Phil Brindle, PhD Global MRLs & Import Tolerances
BASF Aricultural Solutions, Research Triangle Park,NC 27709, USA
�Maximum R esidue L evel (MRL) legally allowed in/on food, or animal feedstuff, after use of crop protection chemical according to G ood Agricultural P ractice (GAP)
4
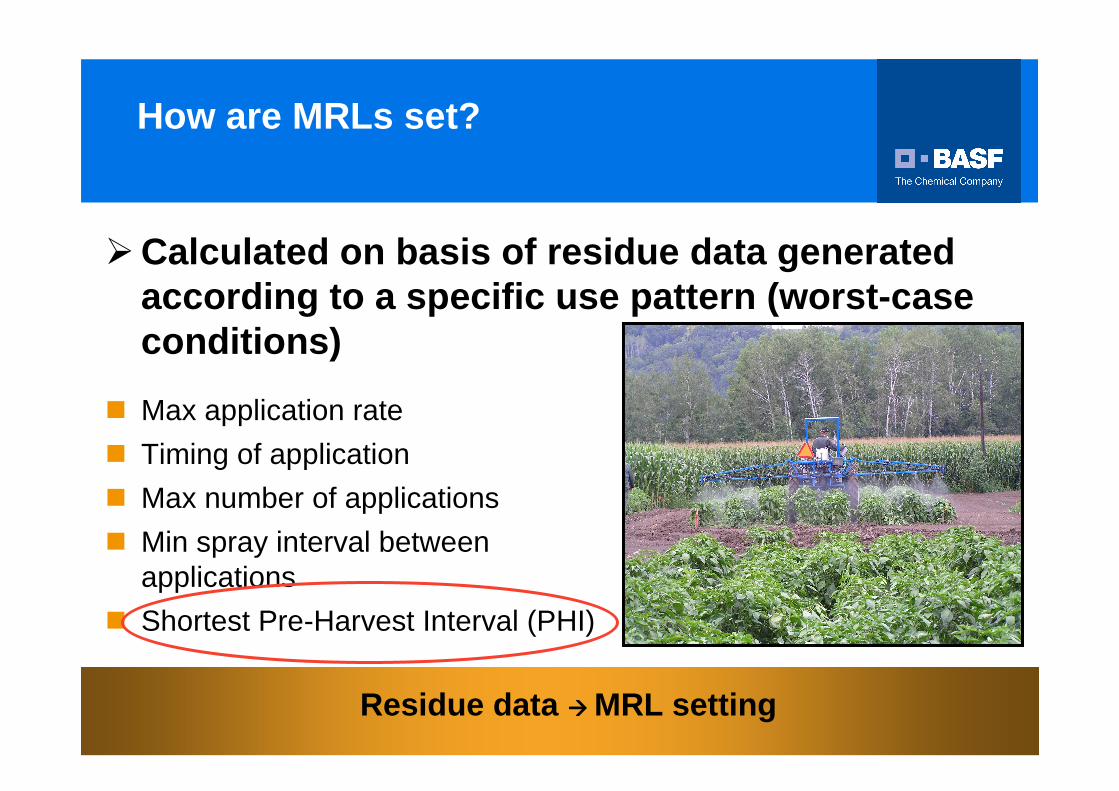
How are MRLs set?
�Calculated on basis of residue data generated according to a specific use pattern (worst-case conditions)
� Max application rate
� Timing of application
� Max number of applications
� Min spray interval between applications
� Shortest Pre-Harvest Interval (PHI)
Residue data ���� MRL setting
5
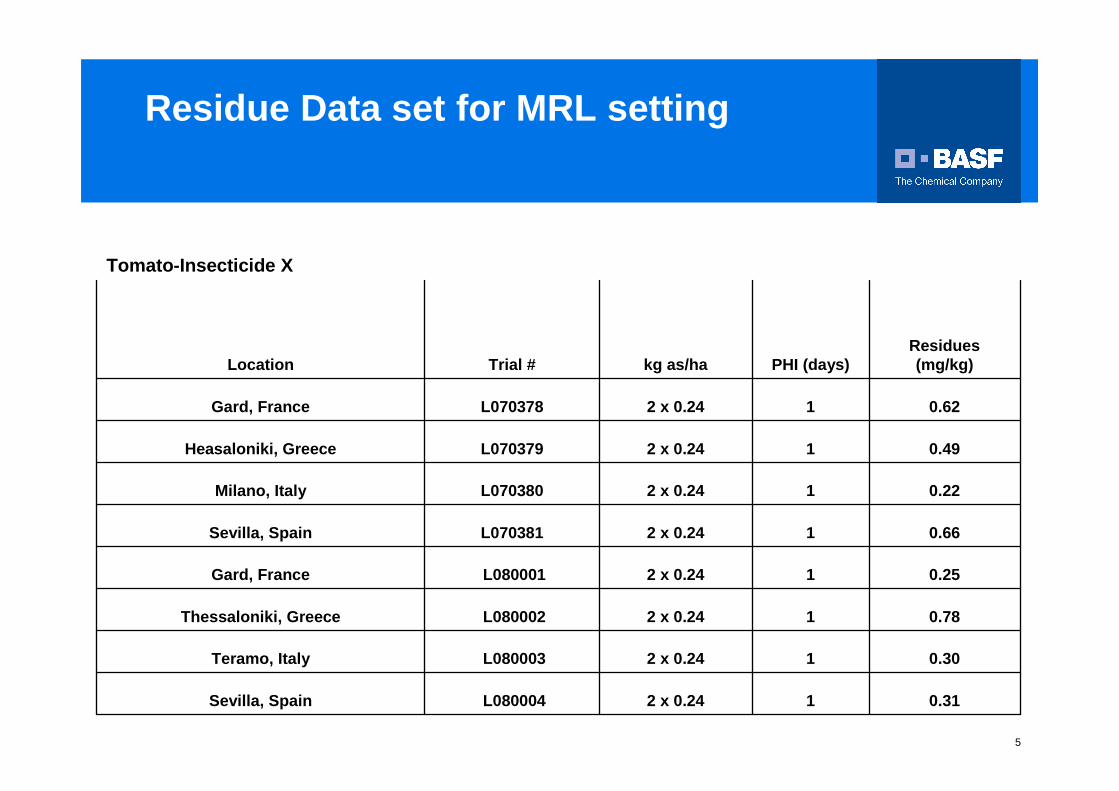
Residue Data set for MRL setting
0.3112 x 0.24L080004 Sevilla, Spain
0.3012 x 0.24L080003 Teramo, Italy
0.7812 x 0.24L080002 Thessaloniki, Greece
0.2512 x 0.24L080001 Gard, France
0.6612 x 0.24L070381Sevilla, Spain
0.2212 x 0.24L070380Milano, Italy
0.4912 x 0.24L070379Heasaloniki, Greece
0.6212 x 0.24L070378Gard, France
Residues(mg/kg)PHI (days)kg as/haTrial #Location
Tomato-Insecticide X
6
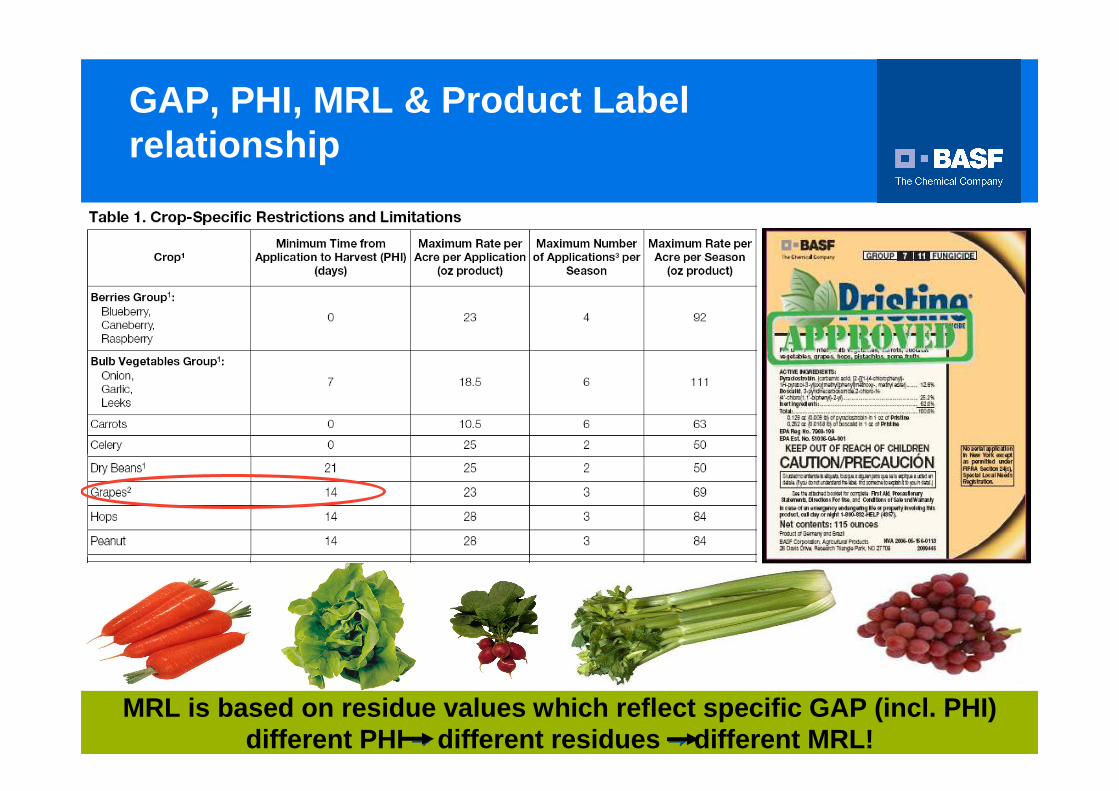
MRL is based on residue values which reflect specific GAP (incl. PHI)different PHI →→→→ different residues →→→→ different MRL!
GAP, PHI, MRL & Product Label relationship
7
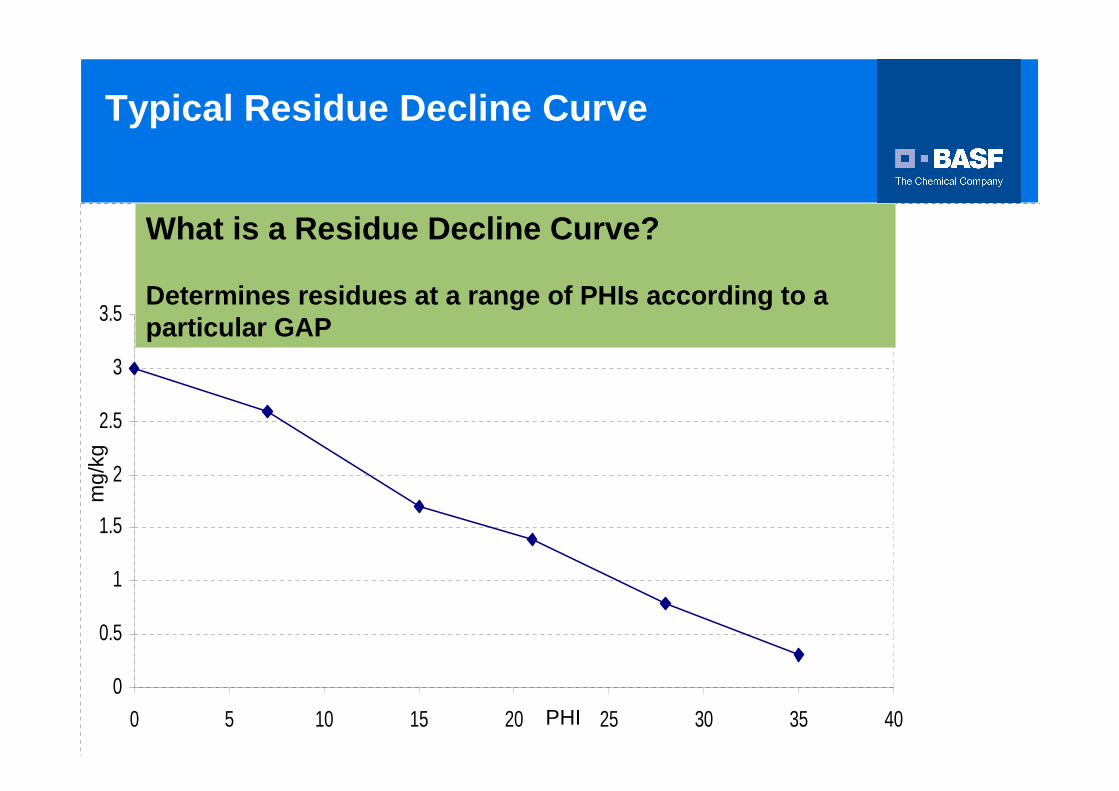
Typical Residue Decline Curve
0
0.5
1
1.5
2
2.5
3
3.5
0 5 10 15 20 25 30 35 40
What is a Residue Decline Curve?
Determines residues at a range of PHIs according to a particular GAP
PHI
mg/
kg
8
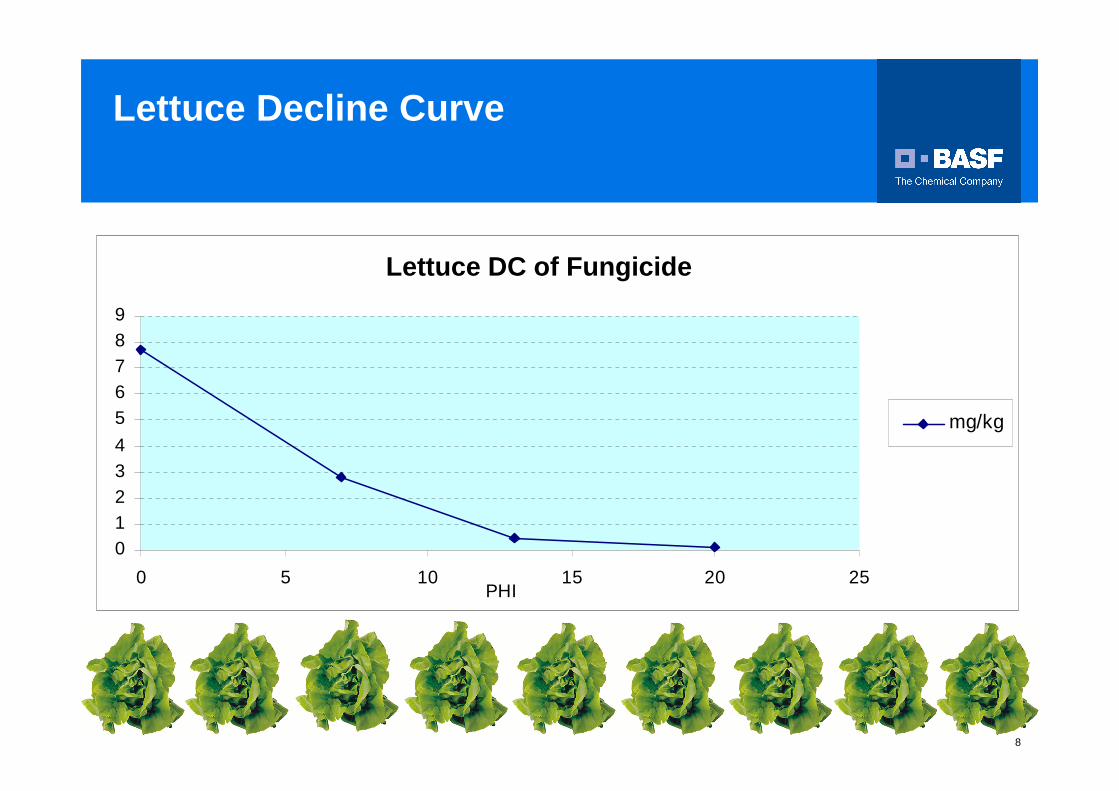
Lettuce Decline Curve
PHI
01234
56789
0 5 10 15 20 25
mg/kg
Lettuce DC of Fungicide
9
PHI (days)
00.05
0.10.15
0.2
0.250.3
0.350.4
0.45
0 5 10 15 20 25 30
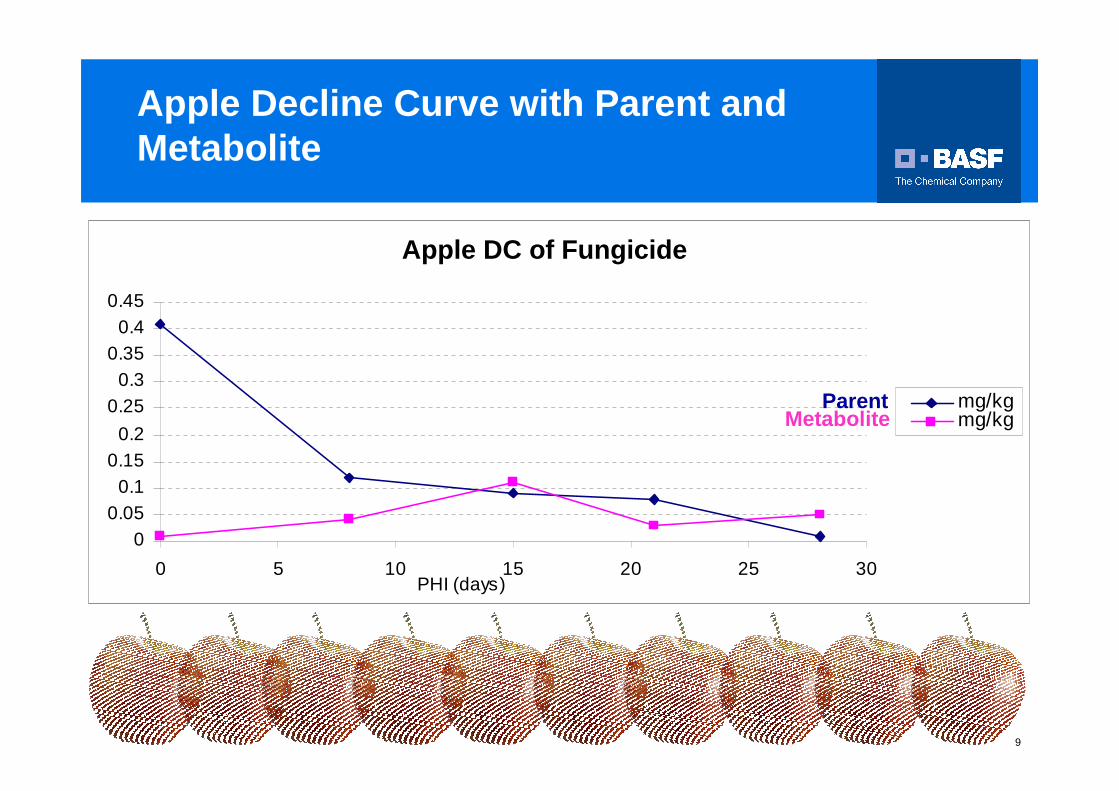
mg/kgmg/kgMetabolite
Parent
Apple Decline Curve with Parent and Metabolite
Apple DC of Fungicide
10
PHI (days)
00.05
0.10.15
0.2
0.250.3
0.350.4
0.45
0 5 10 15 20 25 30
mg/kgmg/kgmg/kg
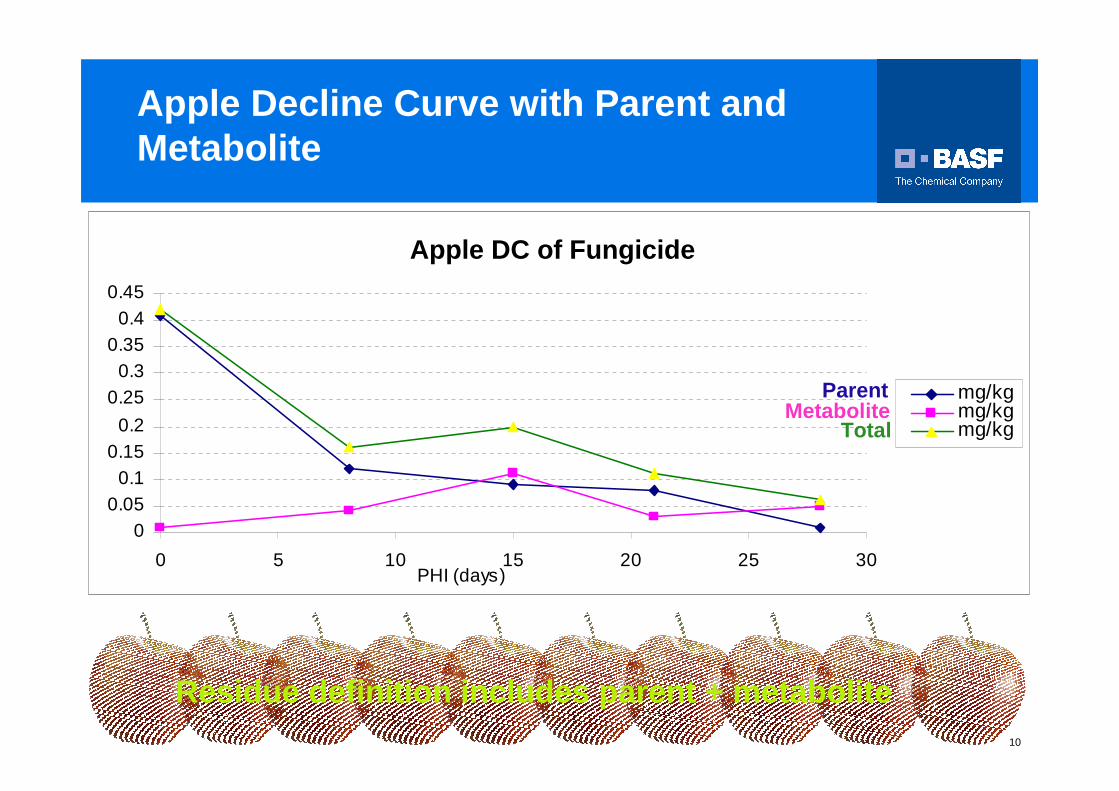
Residue definition includes parent + metabolite
Apple DC of Fungicide
Apple Decline Curve with Parent and Metabolite
ParentMetabolite
Total
11
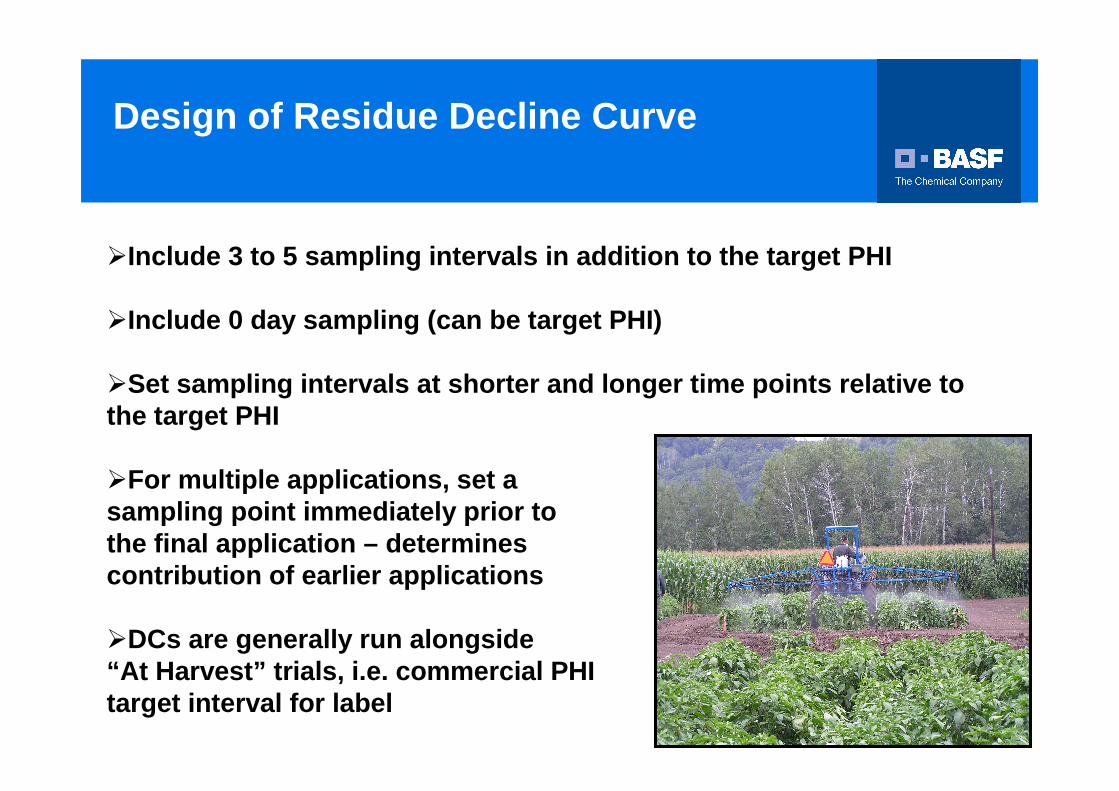
�Include 3 to 5 sampling intervals in addition to the target PHI
�Include 0 day sampling (can be target PHI)
�Set sampling intervals at shorter and longer time point s relative to the target PHI
�For multiple applications, set a sampling point immediately prior tothe final application – determinescontribution of earlier applications
�DCs are generally run alongside“At Harvest” trials, i.e. commercial PHItarget interval for label
Design of Residue Decline Curve
12
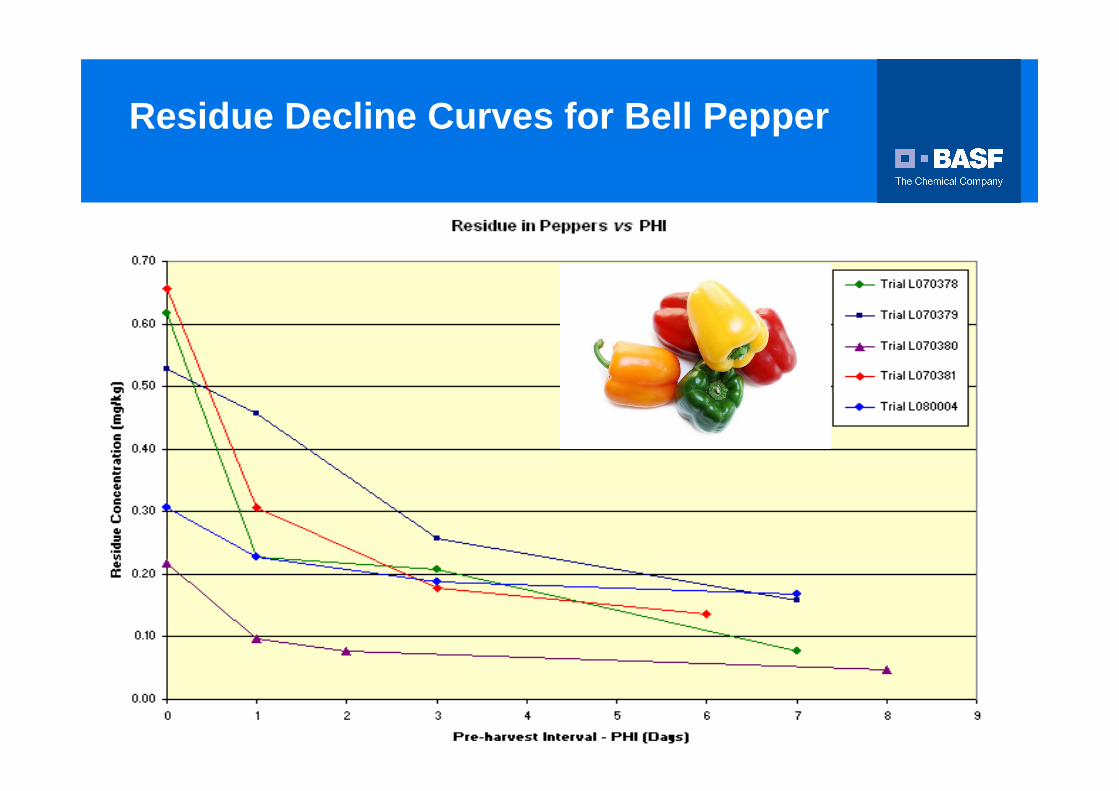
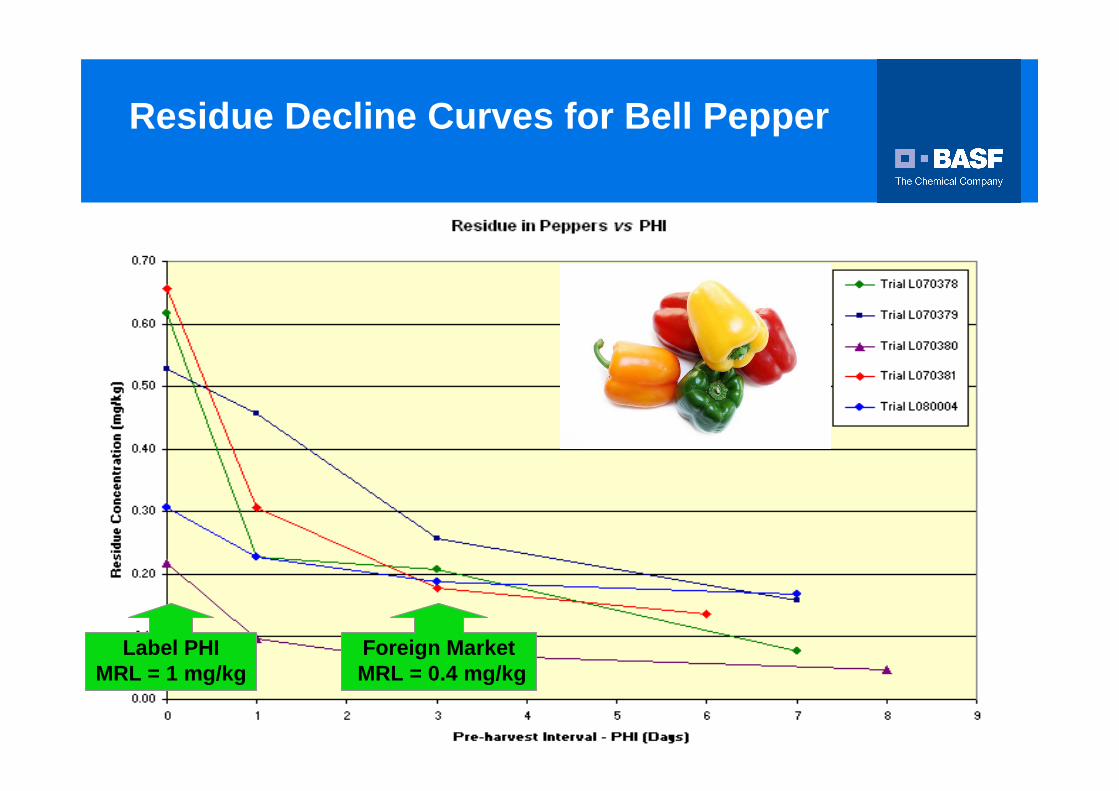
Residue Decline Curves for Bell Pepper
13
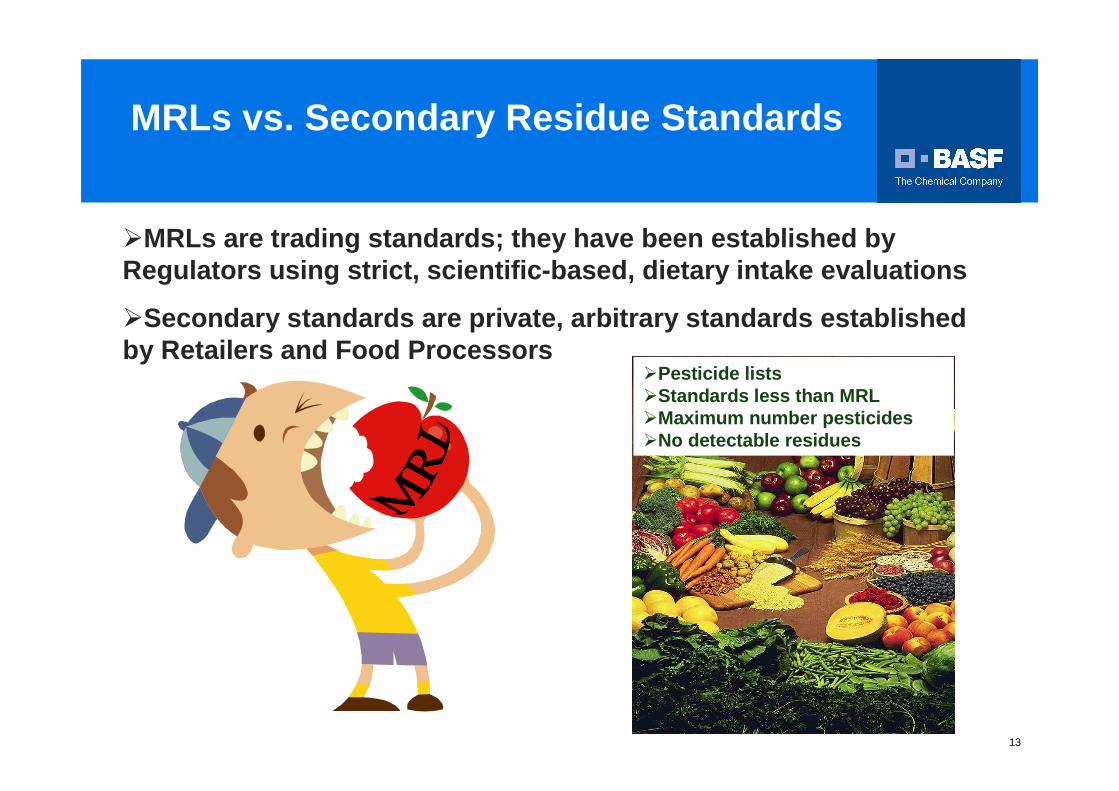
�MRLs are trading standards; they have been establish ed by Regulators using strict, scientific-based, dietary int ake evaluations
�Secondary standards are private, arbitrary standards es tablishedby Retailers and Food Processors
MRLs vs. Secondary Residue Standards
�Pesticide lists�Standards less than MRL�Maximum number pesticides�No detectable residues
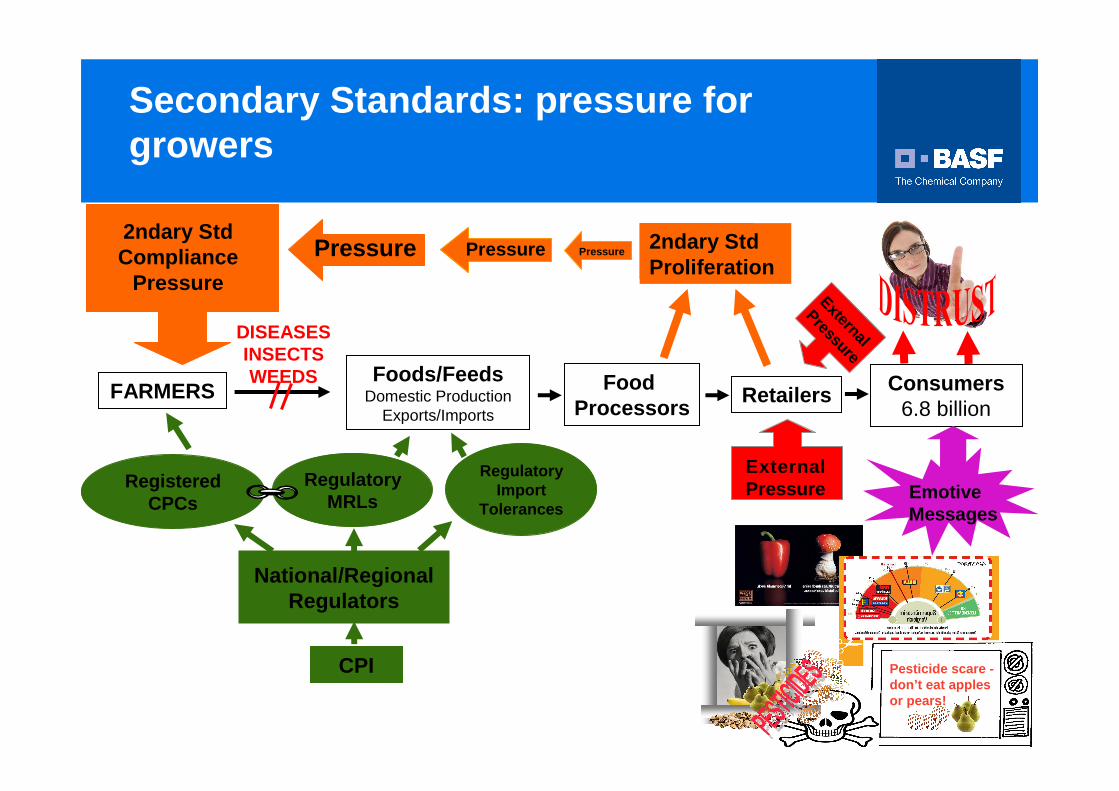
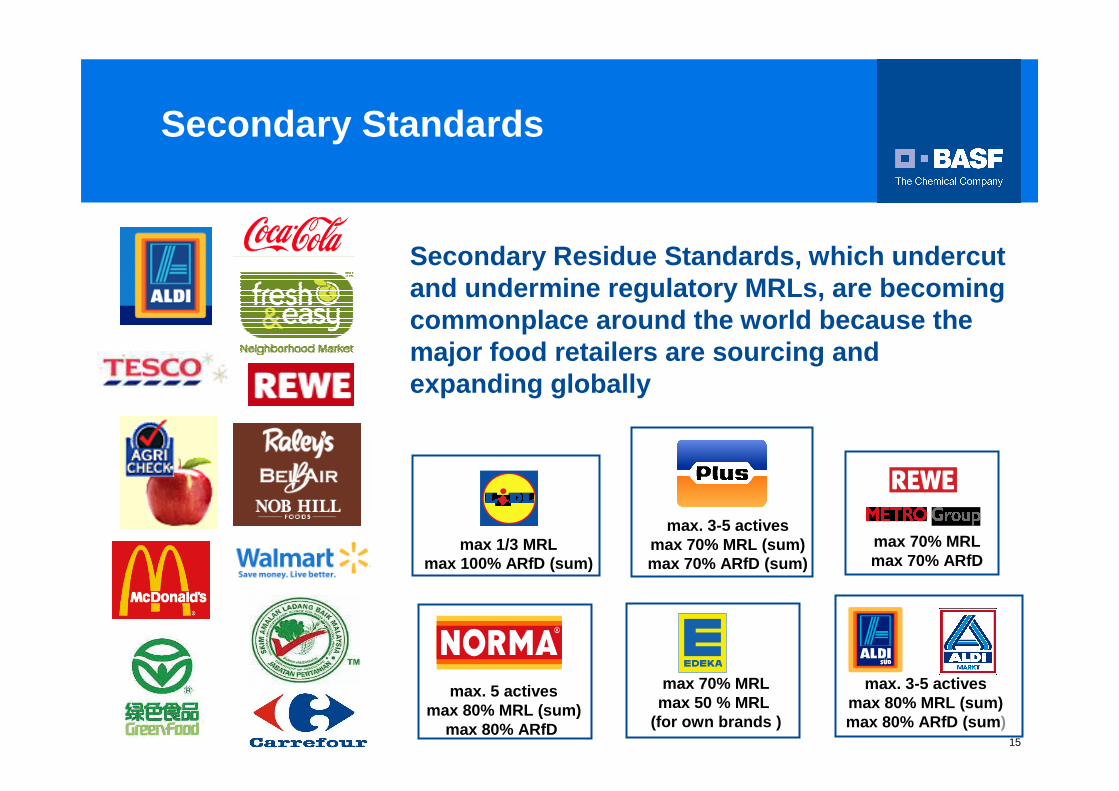
Secondary Residue Standards, which undercut and undermine regulatory MRLs, are becoming commonplace around the world because the major food retailers are sourcing and expanding globally
Secondary Standards
16
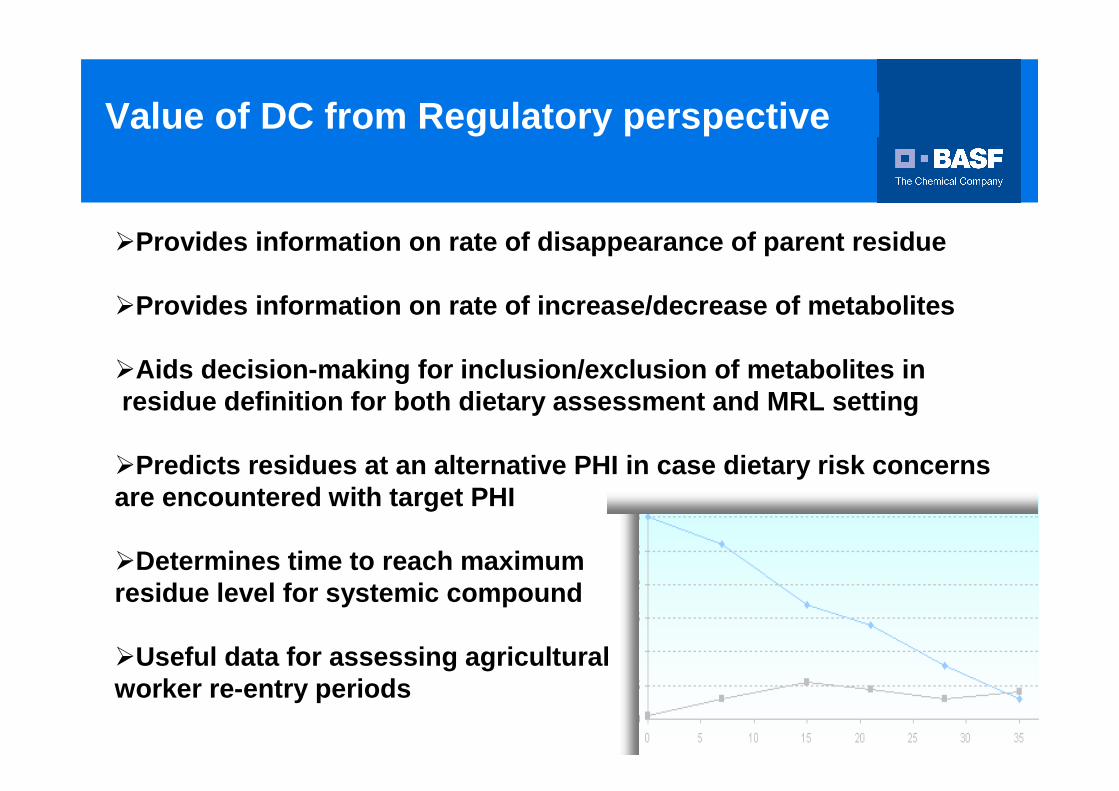
Value of DC from Regulatory perspective
�Provides information on rate of disappearance of parent residue
�Provides information on rate of increase/decrease of met abolites
�Aids decision-making for inclusion/exclusion of met abolites inresidue definition for both dietary assessment and MR L setting
�Predicts residues at an alternative PHI in case dieta ry risk concerns are encountered with target PHI
�Determines time to reach maximumresidue level for systemic compound
�Useful data for assessing agricultural worker re-entry periods
17
Value of DC from Grower/Exporter perspective
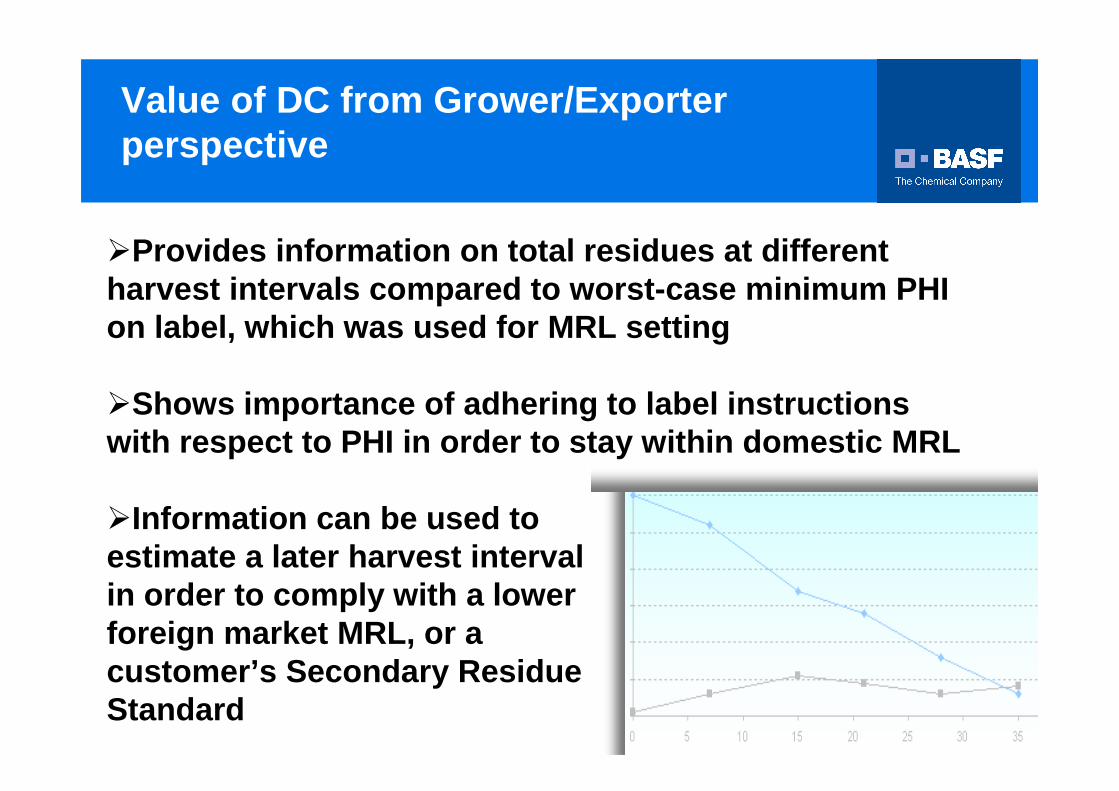
�Provides information on total residues at different harvest intervals compared to worst-case minimum PH I on label, which was used for MRL setting
�Shows importance of adhering to label instructions with respect to PHI in order to stay within domesti c MRL
�Information can be used toestimate a later harvest intervalin order to comply with a lowerforeign market MRL, or acustomer’s Secondary ResidueStandard
18
Residue Decline Curves for Bell Pepper
Label PHIMRL = 1 mg/kg
Foreign MarketMRL = 0.4 mg/kg
19
�Residue DC data are required for registration purposes by Regulatory Authorities
�DC data are helpful for estimating residues at range o f PHI intervals
�DC data are collected for harvested commodities at th e farm gate; residues decline during transit/shelf-life period
�Caution must be exercised in use of DC datasince residue data tend to show lots of variability!
�Analytical testing is always bestto confirm residue level
A few concluding remarks
20
…..and please support Globally Harmonized MRLs, they make a world of difference!
THANK YOU FOR YOUR ATTENTION
21
BACK-UP
22
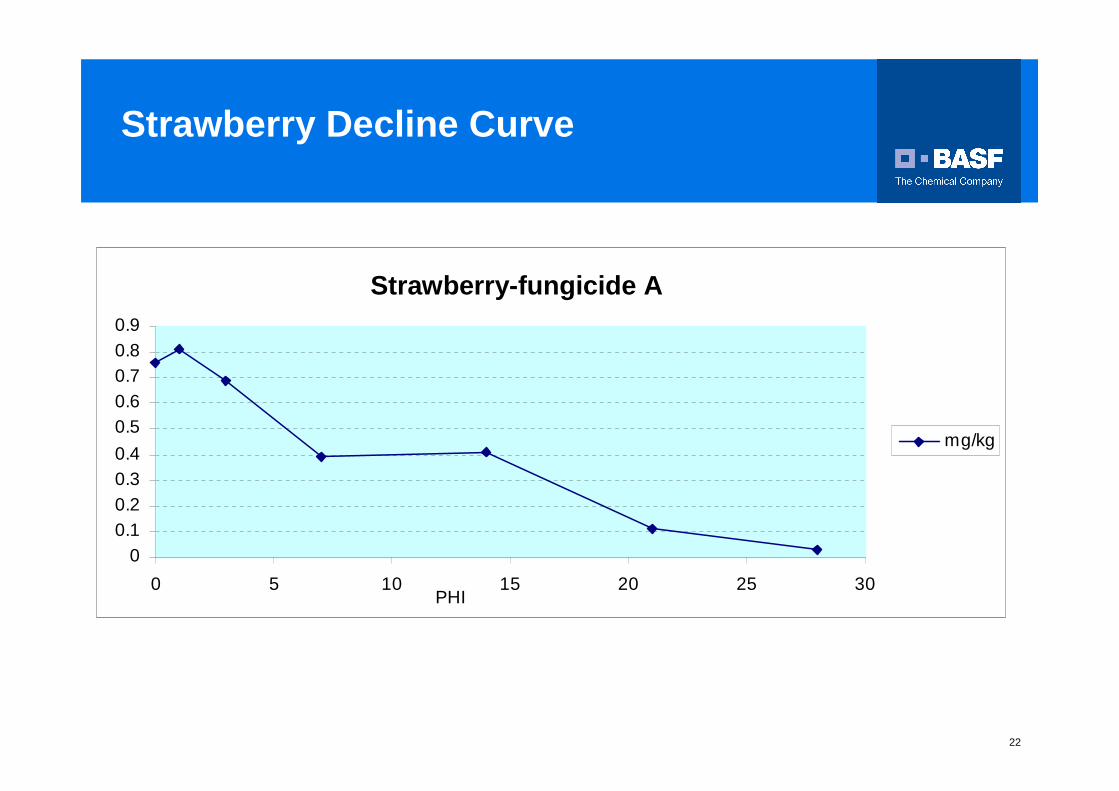
Strawberry Decline Curve
PHI
00.10.20.30.4
0.50.60.70.80.9
0 5 10 15 20 25 30
mg/kg
Strawberry-fungicide A
23
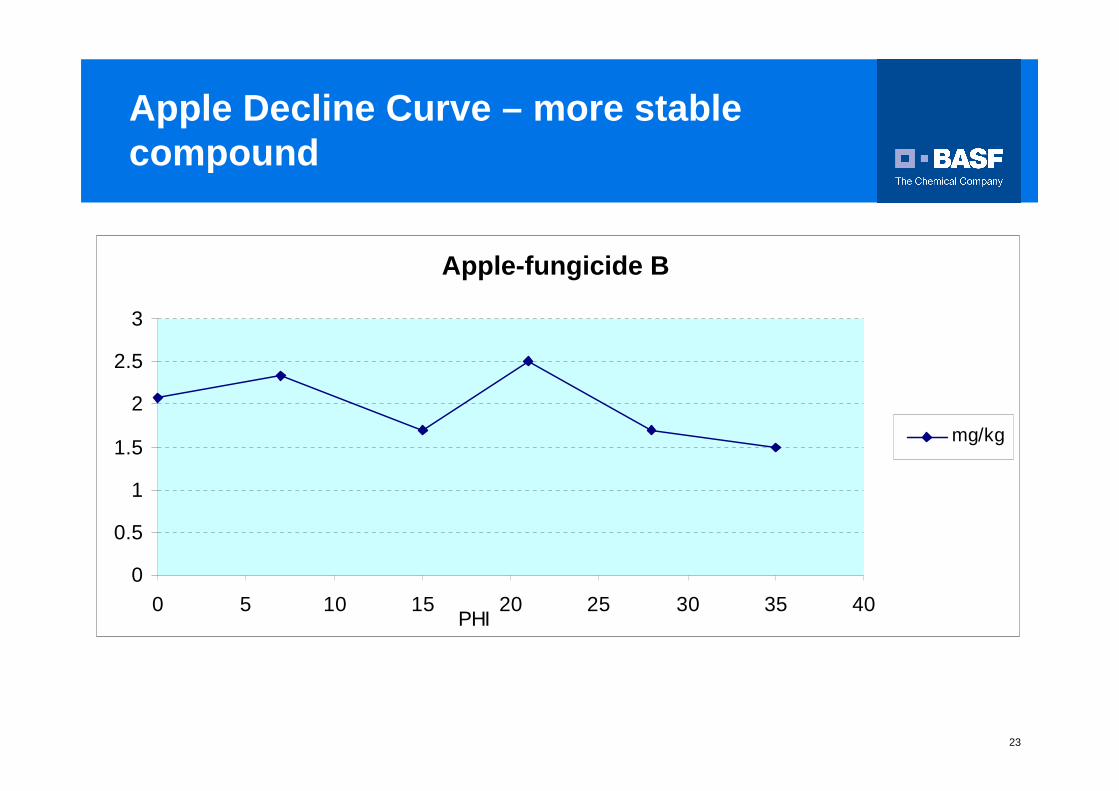
Apple Decline Curve – more stable compound
PHI
0
0.5
1
1.5
2
2.5
3
0 5 10 15 20 25 30 35 40
mg/kg
Apple-fungicide B
24
25
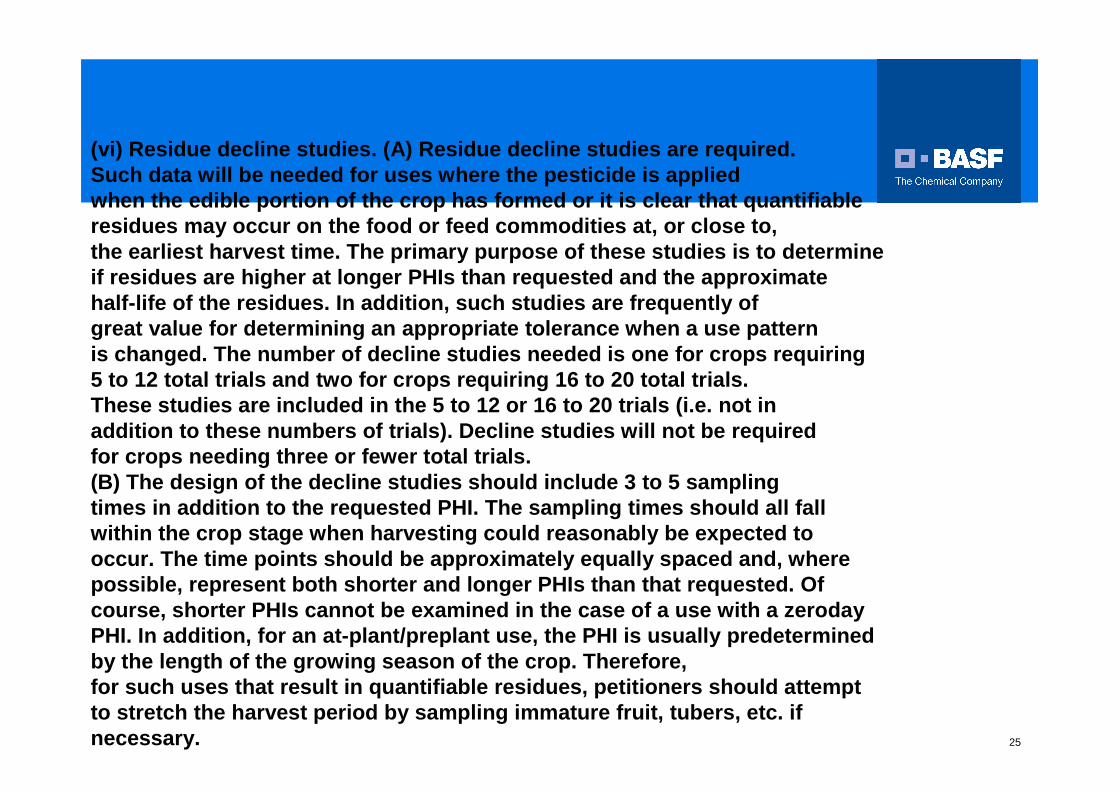
(vi) Residue decline studies. (A) Residue decline s tudies are required.Such data will be needed for uses where the pestici de is appliedwhen the edible portion of the crop has formed or i t is clear that quantifiableresidues may occur on the food or feed commodities at, or close to,the earliest harvest time. The primary purpose of t hese studies is to determineif residues are higher at longer PHIs than requested and the approximatehalf-life of the residues. In addition, such studie s are frequently ofgreat value for determining an appropriate toleranc e when a use patternis changed. The number of decline studies needed is one for crops requiring5 to 12 total trials and two for crops requiring 16 to 20 total trials.These studies are included in the 5 to 12 or 16 to 20 trials (i.e. not inaddition to these numbers of trials). Decline studi es will not be requiredfor crops needing three or fewer total trials.(B) The design of the decline studies should includ e 3 to 5 samplingtimes in addition to the requested PHI. The samplin g times should all fallwithin the crop stage when harvesting could reasona bly be expected tooccur. The time points should be approximately equa lly spaced and, wherepossible, represent both shorter and longer PHIs tha n that requested. Ofcourse, shorter PHIs cannot be examined in the case of a use with a zerodayPHI. In addition, for an at-plant/preplant use, the PHI is usually predeterminedby the length of the growing season of the crop. Th erefore,for such uses that result in quantifiable residues, petitioners should attemptto stretch the harvest period by sampling immature fruit, tubers, etc. ifnecessary.