88
2010 TECHNICAL REPORT FOR THE WATERBURY PROJECT, NE SASKATCHEWAN FOR CANALASKA URANIUM LTD. Prepared by Peter Daubeny, M.Sc., P.Geo August 2010 WAT2009-02
2010 TECHNICAL REPORT FOR THE WATERBURY PROJECT,
NE SASKATCHEWAN
FOR
CANALASKA URANIUM LTD.
Prepared by
Peter Daubeny, M.Sc., P.Geo August 2010
WAT2009-02

SUMMARY
The Waterbury Project is located in the east central portion of the Athabasca Basin, in the Province of Saskatchewan, Canada and is comprised of three mineral claims totalling 60.9 km2. The claims were acquired by staking in late 2004 and early 2005 and are held 100% by CanAlaska Uranium Ltd. of Vancouver BC. The Property covers portions of the Athabasca Basin which in the project area overlies basement rocks of the Mudjatik and Wollaston domains. Depth to Athabasca Basin unconformity on the property varies from 200 to 350 metres. The area of the claims has been intermittently explored for unconformity-type uranium deposits since at least 1978; and this work has included prospecting and mapping, boulder, lake and bog sampling, air and ground geophysical surveying and diamond drilling adjacent to or on ground now covered by the project area. This work culminated between the years 2006 and 2008 when CanAlaska completed GEOTEM and airborne magnetic surveys that covered the entire property and VTEM and magnetometer surveys that covered the north blocks of the property. This work was followed by a single line of moving loop UTEM, a 20-line Resistivity-IP survey and a three line fixed (step) loop transient-EM survey all on the North Block 1 and Resistivity-IP surveying on the South Block. The North Block 2 has seen resistivity and MaxMin surveys and two 3-hole diamond drilling programs. No work has been conducted on the property since 2008. Work completed to date has defined Fixed-Loop EM and/or resistivity anomalies on the North Block 1, VTEM anomalies on the North Block 2, and GEOTEM and/or resistivity anomalies on the South Block that are drill ready. This report summarizes the work that has been completed to date and recommends the following: Four drill holes testing Fixed Loop EM and/or resistivity anomalies on the
North Block 1. Three drill holes testing VTEM and magnetic anomalies on the North Block 2. Five drill holes testing GEOTEM and/or resistivity anomalies on the South
Block. In total 4200 metres of drilling are recommended at a projected cost of $1,552,000 and drill testing of these targets can be carried out beginning early in 2011.
WAT2009-02 ii

TABLE OF CONTENTS
1.0 INTRODUCTION....................................................................................................................1
2.0 PROPERTY DESCRIPTION AND LOCATION.................................................................1
3.0 ACCESS, CLIMATE, PHYSIOGRAPHIC AND INFRASTRUCTURE ...........................4
4.0 HISTORY .................................................................................................................................4
4.1 NORTH BLOCK 1 SUMMARY OF HISTORICAL DRILL RESULTS .......................................................8 4.2 NORTH BLOCK 2 SUMMARY OF HISTORICAL DRILL RESULTS .......................................................8 4.3 SOUTH BLOCK SUMMARY OF HISTORICAL GEOPHYSICAL SURVEYS AND DRILL RESULTS ...............8
5.0 GEOLOGICAL SETTING ...................................................................................................11
5.1 REGIONAL GEOLOGY.............................................................................................................11 5.2 PROPERTY GEOLOGY.............................................................................................................14
6.0 DEPOSIT TYPES ..................................................................................................................16
7.0 MINERALISATION .............................................................................................................21
8.0 EXPLORATION....................................................................................................................23
8.1 AIRBORNE GEOPHYSICAL SURVEYS .........................................................................................23 8.1.2 VTEM and airborne magnetic survey.............................................................................41
8.2 GROUND GEOPHYSICAL SURVEYS ...........................................................................................47 8.2.1 Moving loop UTEM survey - North Block 1 ...................................................................47 8.2.2 Resistivity – IP survey - Waterbury North Block 1 .........................................................47 8.2.3 FLTEM survey - Waterbury North Block 1.....................................................................48 8.2.4 Resistivity-IP survey - Waterbury North Block 2............................................................49 8.2.5 MaxMin IP survey - Waterbury North Block 2 ...............................................................49 8.2.6 Resistivity-IP survey; Waterbury South Block................................................................53 8.2.7 Geophysics – summary and conclusions.........................................................................53
9.0 DRILLING .............................................................................................................................57
9.1 SANDSTONE HOSTED CLAY ALTERATION IN CURRENT AND SOME HISTORIC DRILL HOLES............58 9.2 DOWN HOLE GAMMA PROBE SURVEYING OF WAT-001 TO WAT-006 .......................................60 9.3 SANDSTONE HOSTED URANIUM GEOCHEMISTRY ......................................................................61 9.4 WAT-001 TO WAT-006 GEOLOGY AND BASEMENT GEOCHEMISTRY .........................................63 9.5 DRILL RESULTS – SUMMARY AND CONCLUSIONS. .....................................................................66
10.0 SAMPLING METHOD AND APPROACH ...................................................................67
10.1 COMPOSITE SAMPLING - GENERAL METHOD............................................................................67 10.2 SAMPLING OF STRUCTURES, ALTERATION AND MINERALISATION...............................................68 10.3 SWIR SAMPLING AND ANALYSIS ..............................................................................................68
11.0 SAMPLE PREPARATION, ANALYSIS AND SECURITY.........................................68
12.0 DATA VERIFICATION...................................................................................................70
13.0 ADJACENT PROPERTIES.............................................................................................71
14.0 MINERAL PROCESSING AND METALLURGICAL TESTING..............................71
15.0 MINERAL RESOURCE AND RESERVE ESTIMATES.............................................72
16.0 OTHER RELEVANT DATA AND INFORMATION...................................................72
17.0 INTERPRETATIONS AND CONCLUSIONS...............................................................72
18.0 RECOMMENDATIONS ..................................................................................................78
19.0 REFERENCES..................................................................................................................80
20.0 CERTIFICATE OF AUTHOR ........................................................................................83
WAT2009-02 iii

LIST OF FIGURES
Figure 1. Project location and major mineral deposits in the area.................................3 Figure 2. Waterbury claim boundaries, historical drill holes and EM conductors and area mineral deposits......................................................................................................6 Figure 3. South Block Cameco step-loop time-domain EM grid, EM conductors and drill holes. ....................................................................................................................10 Figure 4. Geology of Athabasca Basin. .......................................................................12 Figure 5. Depth to unconformity, basement geology and Collins Bay Thrust. ...........13 Figure 6. Waterbury Project residual magnetic field. ..................................................15 Figure 7. Uranium deposit models...............................................................................20 Figure 8. Drill hole WAT-005 detail from gamma log................................................22 Figure 9. Sandstone hosted conductor. ........................................................................26 Figure 10. Unconformity related conductor.................................................................27 Figure 11. Basement hosted conductor........................................................................28 Figure 12. Intra-basement hosted conductor................................................................29 Figure 13. Target Zones and trace of GEOTEM basement conductors on AdTau......33 Figure 14. Target Zones and gradient magnetic field. .................................................34 Figure 15. Target Zone A.............................................................................................35 Figure 16. Target Zone B.............................................................................................36 Figure 17. Target Zone C.............................................................................................37 Figure 18. Target Zone D.............................................................................................38 Figure 19. Target Zone E. ............................................................................................39 Figure 20. Target Zone F. ............................................................................................40 Figure 21. South Block GEOTEM anomaly on vertical gradient magnetic image. ....43 Figure 22. North Block 1 VTEM anomalies and residual magnetic image.................44 Figure 23. North Block 2 VTEM anomalies on residual magnetic image...................45 Figure 24. North Block 2 regional magnetic setting...................................................46 Figure 25. North Block 1 inverted resistivity section for Line 8400E.........................50 Figure 26. North Block 1 FLTEM survey plan view...................................................51 Figure 27. North Block 1 FLTEM conductor and VTEM contours on 3D Resistivity at 300 metres depth. .........................................................................................................52 Figure 28. South Block basement 3D Resistivity at 300 meters a.s.l. .........................55 Figure 29. North Block 3D Inversion and Resistivity under lines 8600E and 9400 E 56 Figure 30. North Block 2 drill plan, roads, and topography. .......................................59 Figure 31. Sandstone hosted clay alteration for current and historical drill holes.......60 Figure 32. Smoothed gamma data for drill holes WAT-001 to WAT-006..................62 Figure 33. Drill hole WAT-001 basement radiometric anomalies. .............................64 Figure 34. North Block 1 proposed drill holes on Resistivity at 300 metres depth.....74 Figure 35. North Block 2 proposed drill targets. .........................................................75 Figure 36. Cross section for drill holes WAT001, WAT002 and WAT004................76 Figure 37. South Block proposed drill holes on resistivity at 300 metres. ..................77
WAT2009-02 iv

WAT2009-02 v
LIST OF TABLES Table 1. Tenure for mineral claims comprising the Waterbury Project property. .........2 Table 2. Selected mineral occurrences within the Waterbury Project area. ..................5 Table 3. List of assessment reports documenting work in the vicinity of Waterbury Project claim blocks.......................................................................................................7 Table 4. Overburden and unconformity depth for drill holes on or very near Waterbury Project claim blocks.....................................................................................7 Table 5. Alteration and mineralisation in DDH Q49-1..................................................8 Table 6. Alteration and mineralisation in Q11A series of drill holes. ...........................8 Table 7. Clay alteration and geochemistry of SOD and ROO series of drill holes .......9 Table 8. Uranium mines and major deposits of the Eastern Athabasca Basin. ..........16 Table 9. Dimensions of the alteration halos surrounding some uranium deposits in the eastern Athabasca Basin. .............................................................................................18 Table 10. Summary of work completed by CanAlaska Uranium Ltd on the Waterbury Claims. .........................................................................................................................23 Table 11. GEOTEM target areas by claim block.........................................................41 Table 12. Drill hole locations, orientation and pertinent depths..................................57 Table 13. Drill holes WAT-001 to WAT-006 summary of results..............................58 Table 14. Basal sandstone uranium and thorium enrichments in drill holes WAT-001 to WAT-006. ................................................................................................................61 Table 15. Coordinates of target recommended for drill testing ...................................78 Table 16. Cost estimates for recommended program. .................................................79
LIST OF APPENDIXES
Appendix I: Cross-sections for drill holes WAT-001 to WAT-006. Appendix II: Strip logs with lithology, geochemistry and down hole gamma data for
drill holes WAT-001 to WAT-006.

1.0 INTRODUCTION This technical report on the Waterbury Project was prepared at the request of CanAlaska Uranium Ltd. in accordance with National Instrument 43-101 F1 technical report standards of disclosure for minerals projects. This report provides a comprehensive summary of the work completed to date in the Waterbury Project area and makes recommendations for future work based on the results of that work. Information contained in this report was obtained from assessment reports, in house reports completed for CanAlaska Uranium Ltd. and information contained on the Government of Saskatchewan Energy and Resources website. The author visited the Waterbury Project area on September 10, 2009 and examined drill core from the 2006 and 2007 drill programs.
2.0 PROPERTY DESCRIPTION AND LOCATION
The Waterbury Project is located in Northern Saskatchewan near the eastern margin of the Athabasca Basin (Figure 1). The property is located in National Topographic System (NTS) map sheets 74-H-16 and 74-I-01 in UTM Zone 13 and is centred at approximately 104º15’W, 58º.05’N. The project is comprised of three separate mineral claims totalling 6,089 hectares ( Table 1). These claim blocks are located in an approximately 300 km2 area located midway between the Cigar Lake deposit and the McClean Lake mine. The Waterbury claims were acquired by ground staking in late 2004 and early 2005 and originally consisted of nine separate claim blocks. The number of blocks was reduced in early 2009 following an evaluation of the results from exploration completed over all blocks. Figure 1 shows the location and outline of the current claims with discarded claims shown in a stippled pattern. The Waterbury project claims are subject to the holder expending in assessment work between the 2nd and 10th year of ownership, $12.00 per hectare per year and after the 10th year $25.00 per hectare per year. Under the Crown Minerals Act SS 1984-85, c.C-50.2, the following exploration and development costs are acceptable as assessment work on a claim:
WAT2009-02 1

1. Stripping and trenching; 2. Drilling; 3. Geological, geophysical and geochemical surveys; 4. Prospecting; 5. Necessary travelling and transportation costs, up to 10% of the cost of
assessment work performed, and 6. Any other type of work approved by the Minister.
The Waterbury claims were acquired by ground staking whereby a post was erected at the corner of every claim block and the posts marked with the required information. The outer boundaries of each block were delineated by blazing trees, cutting underbrush, placing pickets or other approved methods. Prior to commencing work on exploration stage projects in this area of Saskatchewan, an Aquatic Habitat Protection Permit (#SHD-07-127) and a Miscellaneous Use Permit must be obtained from the Saskatchewan Ministry of Environment. The Miscellaneous Use Permit includes a Work Authorization, Temporary Work Camp construction authorization and a Forest Products use Permit. A request for a project review must also be sent and a permit or “Letter of Advise” obtained from the Federal Department of Fisheries and Oceans. Table 1. Tenure for mineral claims comprising the Waterbury Project property. Claim No. Block name Area
(Hectares) Effective date Expiry date
S-107965 Waterbury-North Block 3764 January 7, 2005 January 6, 2016
S-107967 Waterbury-North Block 2 1337 January 7, 2005 January 6, 2032
S-107999 Waterbury-South 988 January 28, 2005 January 27, 2022 Total: 6,089 -
WAT2009-02 2

Ì
ÌBrown
Bay
Kelly Bay
Bernick Lake
Brown Islands
Thorbu
rn Lak
eW a t e r b u r y L a k e
Thompson Lakes
Nicholson Island
Umpherville RiverS-107968
S-107966
S-107998
S-107839
S-107963
S-107964S-107965
S-107967
S-107999
Sand Lake Deposit
535000
535000
540000
540000
545000
545000
550000
550000
555000
555000
6420
000
6420
000
6425
000
6425
000
6430
000
6430
000
6435
000
6435
000
6440
000
6440
000
6445
000
6445
000
6450
000
6450
000
104°15'0"W
104°15'0"W58
°0'0"
N
58°0
'0"N
LegendClaims
Lapsed Claims
Ì Uranium Deposit
Roads
Contours
Rivers
Lakes
±
0 2.5 51.25Kilometres
Waterbury Project
UTM NAD 83. Zone 13 Scale: 1: 150 000
Date: Aug. 11, 2009 Drawn by: AS
Project Location and Major Mineral Deposits in the Area
NWT
AB
SK
AthabascaBasin
WaterburyProject
Fig No:1
NTS: 074H16, 074I01
Report: WAT2009-02
Points North 15 km

3.0 ACCESS, CLIMATE, PHYSIOGRAPHIC AND INFRASTRUCTURE
The Waterbury project area is located approximately 700 km northeast of Saskatoon. More specifically, individual claim blocks lie between 7.5 and 44 km south south-east of Points North Landing which can be accessed by Saskatchewan Highway 905 from La Ronge or via scheduled air service from Saskatoon and Prince Albert. Points North Landing serves as a staging area for much of the exploration in the northeast portion of the Athabasca Basin and is a base for float or ski-equipped bush planes and helicopters available for charter. Field work conducted by CanAlaska Uranium on the Waterbury Project has been carried out from this base.
The climate of the project area is continental and characterized by extreme temperatures. Sustained afternoon highs of 30º C are not uncommon during the summer months while winter temperatures may go as low as -50º C. Ice break-up on the lakes usually occurs late in May or early June and the freeze-up is typically in October. Line-cutting, geophysics and diamond drilling operations can be conducted year round and frozen lakes and ground stabilized by frost facilitates access to many properties during the winter months. That said the efficiency of winter work can be compromised by extreme cold in January and February. The summer climate is generally good for fieldwork, with ten to fifteen days of precipitation being expected during a normal field season. One half to 1 metre of snow accumulation can be expected over course of a normal winter season. The topography of the area is typical of the Athabasca Basin portion of the Canadian Shield and is characterized by rolling hills; and intervening lowlands, often with swamp, muskeg or standing water. Elevations in the project area range from 450 to 515 metres above sea level. Approximately 20% of the locale is covered by lakes, inclusive of the Waterbury North Claim Block which is itself almost entirely underlain by Waterbury Lake.
4.0 HISTORY
The area of the Waterbury Project lays approximately 2/3rds of the way along a northeast striking corridor that includes the Key Lake, McArthur River, Cigar, McClean, Collins Bay and Rabbit Lake mines and as such has seen an extensive exploration for uranium deposits over the last 40 years. This work has included at one time or another, almost every conceivable airborne and ground geophysical survey, as well as prospecting, water, soil, sediment, rock and boulder geochemical sampling and diamond drilling. These efforts have resulted in the discovery of a number of mineral occurrences (Figure 2); a select number of which are listed in Table 2.
WAT2009-02 4

Table 2. Selected mineral occurrences within the Waterbury Project area. Showing/deposit name (Saskatchewan Mineral Deposit Index #)
Location Approx. depth to unconformity
Number of drill holes, best intersection or deposit dimensions
Drill hole Q11A-006 (SMDI 2751)
1.0 km SE S107967
217 m (247 m a.s.l.)
13 DDH, best intersection 0.175% U3O8/4.3 m in pelite just below unconformity.
Drill hole Q12A-9 (SMDI 1969)
2.6 km ESE S107967
184 m (261 m a.s.l.)
5 DDH, best intersection 0.13% e U3O8 over 4.0 m including 0.83%/0.3 m eU3O8 hosted in pelite 14 m below unconformity.
Drill hole Q10-1 (SMDI 1740)
7 km N S107967
174 m (288 m a.s.l.)
9 DDH, best intersection 0.29% U3O8 /0.7 m, unconformity hosted
Drill hole Q8S-24 (SMDI 2551)
1.75 km N S107967
290 (176 m a.s.l.)
0.25% eU3O8/4.0 m, includes 14.8% Ni, 7.2% Co, 1.44% Cu, 1.14% As, and 0.16% Pb/1.1 m.
Drill hole Q27B-57 (SMDI 2696)
Between S107965 & S107967
290 (180 m a.s.l.)
4 DDH, 4511 ppm U/1.0 m in basal conglomerate.
Natona Bay (SMDI 2193)
Between S107965 & S107967
270 m (184 m a.s.l.)
22 DDH, 130×50×5 m pod, grades up to 22.17% U3O8/0.6 m, up to 12.0% Ni, 1.15% Co, 25.0% As, 13.7% Zn over 0.5 to 1.0 m
Sand Lake/Wolf Lake (SMDI 2253)
Between S107967 & S107999
150 m (312 m a.s.l.)
5.17 million lb. @ 2.3% U3O8, up to 22% U3O8/1.3 m.
Thorburn Lake Uranium Zone (SMDI 2716)
Between S107967 & S107999
163-225 m (295-248 m a.s.l.)
> 30 DDH, 200×20×44 m mineralized pod, up to 15% U3O8, locally massive Ni, As. Located in the Sand Lake trend.
Approximately 268 assessment reports document airborne surveys, surface exploration and diamond drilling in the Waterbury project area. Reports that detail the delineation of EM conductors or the completion of drill holes on or very near Waterbury project claim blocks are listed in Table 3. The depth of overburden and the depth to the Athabasca Group unconformity as determined for drill holes documented in these reports are listed Table 4.
WAT2009-02 5

!
!
!
!
!
!
!
!
!
!
!
!
!!
!!
!!
!!!!
!
!
!
!
!
!
!
!!
!
!
!
!!
!
!
!!
!
!
!
!
!
!
!
!
!
!
!
!
!
!
!
!!!!!!!!
!
!!
!!
!
! !
!!
!
!!!!!!!!!
!!
!!
!
!
!
!
!!
!
! !
!
!
!
!
!
!
!
!
! !
!
!!
!
!!
!
!
!
!
!
!
!
!
!
!
!
!!!
!!
!
!
!
!
!
!!
!!
!! !
!!! !!
!!
!
!!!
!
!! !!!!!
!
!!
!
!
!
!
!
!
!
!
!
!!
!
!!
!!
!
!
!
!
!! !! ! !
!!
!
! !
!!
!
!
!
!
!! !
!
! !! !!! !!
!
!! !
!
!
!
!!
!!!
!!
!
!!!
!!!
!
!!
!
!!!
!
!
!
!
!
!!
!
!
!
!
!
!
!!!
!!
! !
!!!
!
!!
!!
!
!
!!
!
!
!
!
!
!
!
!!!!!
!!
!!
!!!!!
!
!
!
!!
!
!!
!!
!
!
!
!
!
!
! !
!!
!
!
!
!
!!!
!!!
! !!!
!!
!
!
!
!
!
!
!
!
!
!
!
!
!
!!
!
!
!
!
!! !
!
!!!!!!!!!!!!
!
!
!
!
!
!
!!
!
!!
!
!
!
!!
!!
!
!
!
!
!!
!
!
!!!!
!
! !!
!!
!!
!!!
!
!!!!
!
!
!!!
!
!!!
!
!!
!!
!
!!
!
! !
!!!
!
!
!!!!!!!!!!
!!!
!
!!
!
!
!!!
!!!!!!!!
!
!! !! !!! !
!
!!!!!
!
!
!
!
!
!
!
!
!
!
!
!!
!
!!! !
!
!
!!!!!!!
!
!!!!!!!!!!
!
!!
!
!!!!!
!!!
!
!!
!!!!!!!
!
!!!!!
!!!
!
!
!
!!!!!
!
!!!
!
!
!
!
!
!
!
!
!!
!
!
!
!
!
!!
! !
! !
!
!
!!
!
!
!
!!
!
!
!!
!!!
!
!!!
!
!
!
!!
!
!
!
! ! !
!
!
!!!
!
!!
!
!
!
!
!!!
!!
!
!
!
!
!
!!
!
!
!
!
!
!!
!
!
!
!
!
!!!
!!!!
!
!
!!
!!
!
!
!
!
!
!
!
!
!
!
!
!
!!!
!
!
!
!!
!
!
!!
!
!
!
!!
!
!!
!
!
!
!
!
!
!
!!!!
Ì
#*
#*
#*
#*
#*
#*#*
#*
#*
#*
#*
#*
#*
!!!
!
!
!
!
!
!
!
!
!!
!
!! !
ROO-4-81ROO-3-81 ROO-2-81
SOD-255SOD-254
Q49-1
Q11-A
Q11A-3
Q11A-2Q11A-1Q11A-18
Sand Lake Deposit
2717
2716
2696
2694
2551
2478
2477
2253
2193
2144
20511725
535000
535000
540000
540000
545000
545000
550000
550000
555000
555000
6420
000
6420
000
6425
000
6425
000
6430
000
6430
000
6435
000
6435
000
6440
000
6440
000
6445
000
6445
000
6450
000
6450
000
104°15'0"W
104°15'0"W58
°0'0
"N
58°0
'0"N
LegendClaims
Lapsed Claims
Ì Uranium Deposit
#* Uranium Showings
! 2006/2007 Drill Holes
! Historical Drill Holes
Air Survey Conductors
Ground Survey Conductors
Lithology
MFd Manitou Falls
MFc Manitou Falls
MFb-u Manitou Falls
MFb-l Manitou Falls
RD Read Formation
±
0 2.5 51.25
Kilometres
Waterbury Project
UTM NAD 83. Zone 13 Scale: 1: 150 000
Date:Oct. 30, 2009 Drawn by: AS
Property Claims,Mineral Deposits, Historical Drill Holesand Air and Ground EM Conductors
Fig No:2
NTS: 074H16, 074I01
Report: WAT2009-02
CanAlaska Uranium Ltd.
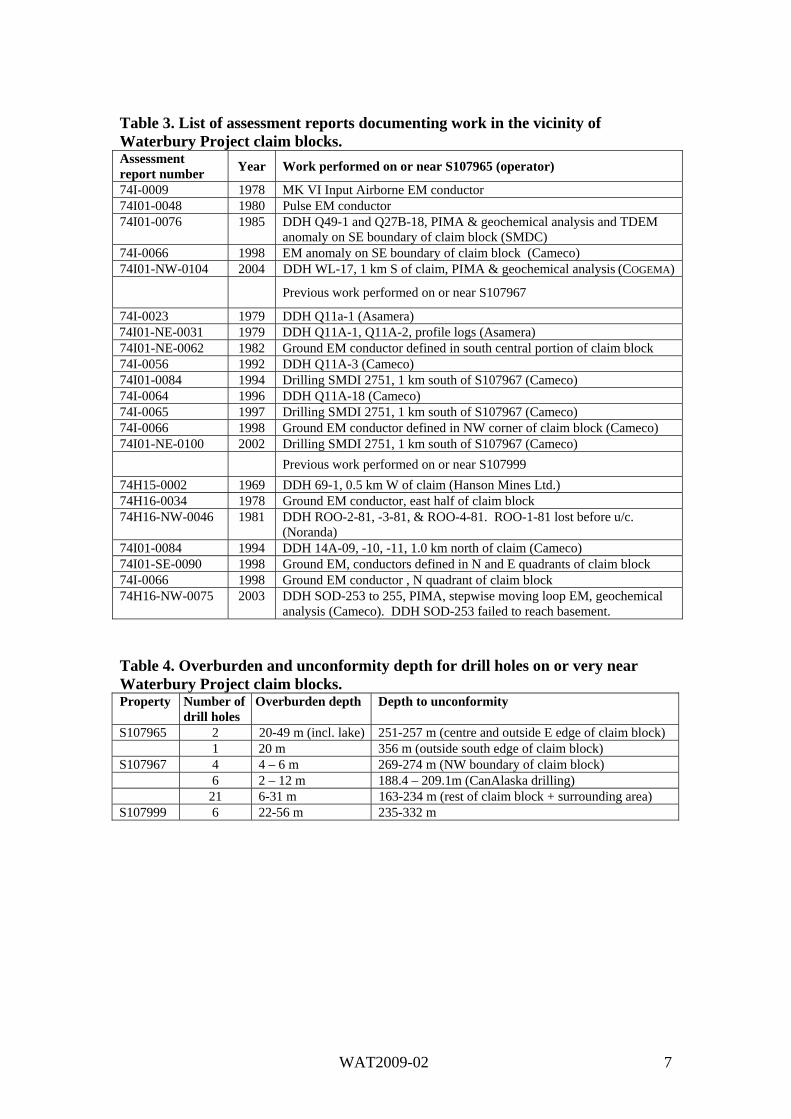
Table 3. List of assessment reports documenting work in the vicinity of Waterbury Project claim blocks. Assessment report number
Year Work performed on or near S107965 (operator)
74I-0009 1978 MK VI Input Airborne EM conductor 74I01-0048 1980 Pulse EM conductor 74I01-0076 1985 DDH Q49-1 and Q27B-18, PIMA & geochemical analysis and TDEM
anomaly on SE boundary of claim block (SMDC) 74I-0066 1998 EM anomaly on SE boundary of claim block (Cameco) 74I01-NW-0104 2004 DDH WL-17, 1 km S of claim, PIMA & geochemical analysis (COGEMA)
Previous work performed on or near S107967
74I-0023 1979 DDH Q11a-1 (Asamera) 74I01-NE-0031 1979 DDH Q11A-1, Q11A-2, profile logs (Asamera) 74I01-NE-0062 1982 Ground EM conductor defined in south central portion of claim block 74I-0056 1992 DDH Q11A-3 (Cameco) 74I01-0084 1994 Drilling SMDI 2751, 1 km south of S107967 (Cameco) 74I-0064 1996 DDH Q11A-18 (Cameco) 74I-0065 1997 Drilling SMDI 2751, 1 km south of S107967 (Cameco) 74I-0066 1998 Ground EM conductor defined in NW corner of claim block (Cameco) 74I01-NE-0100 2002 Drilling SMDI 2751, 1 km south of S107967 (Cameco)
Previous work performed on or near S107999
74H15-0002 1969 DDH 69-1, 0.5 km W of claim (Hanson Mines Ltd.) 74H16-0034 1978 Ground EM conductor, east half of claim block 74H16-NW-0046 1981 DDH ROO-2-81, -3-81, & ROO-4-81. ROO-1-81 lost before u/c.
(Noranda) 74I01-0084 1994 DDH 14A-09, -10, -11, 1.0 km north of claim (Cameco) 74I01-SE-0090 1998 Ground EM, conductors defined in N and E quadrants of claim block 74I-0066 1998 Ground EM conductor , N quadrant of claim block 74H16-NW-0075 2003 DDH SOD-253 to 255, PIMA, stepwise moving loop EM, geochemical
analysis (Cameco). DDH SOD-253 failed to reach basement. Table 4. Overburden and unconformity depth for drill holes on or very near Waterbury Project claim blocks. Property
Number of drill holes
Overburden depth Depth to unconformity
S107965 2 20-49 m (incl. lake) 251-257 m (centre and outside E edge of claim block) 1 20 m 356 m (outside south edge of claim block) S107967 4 4 – 6 m 269-274 m (NW boundary of claim block) 6 2 – 12 m 188.4 – 209.1m (CanAlaska drilling) 21 6-31 m 163-234 m (rest of claim block + surrounding area) S107999 6 22-56 m 235-332 m
WAT2009-02 7
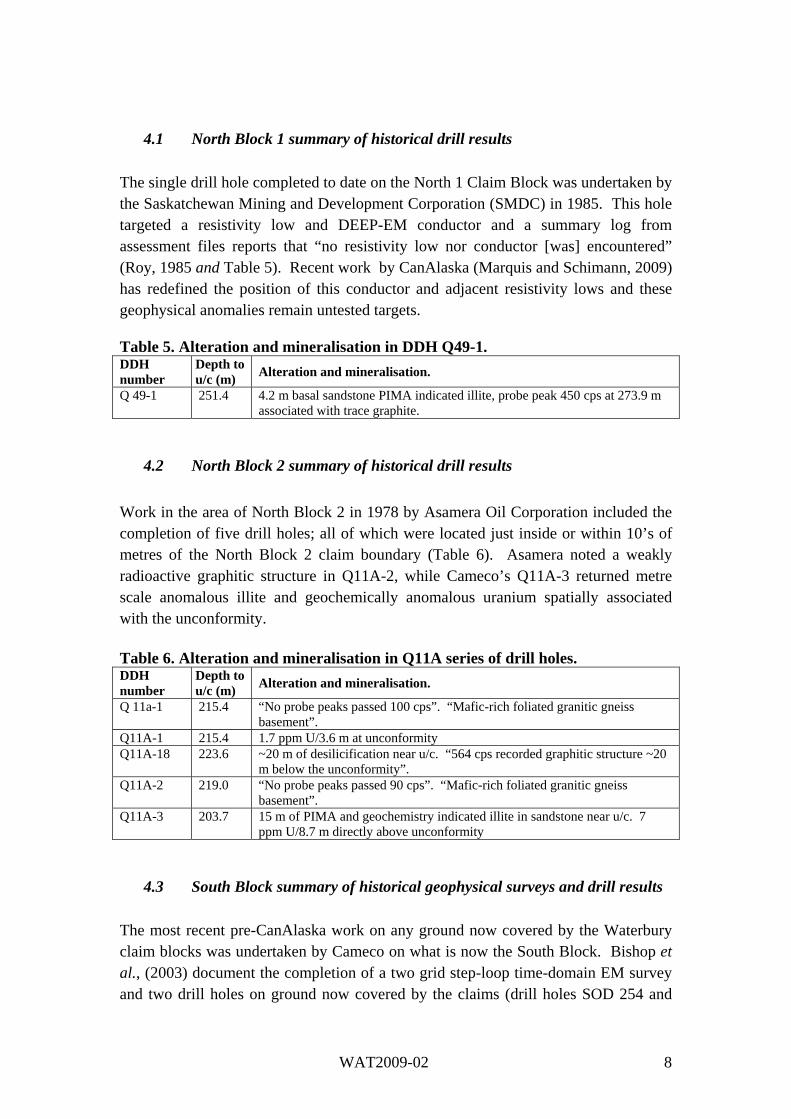
4.1 North Block 1 summary of historical drill results
The single drill hole completed to date on the North 1 Claim Block was undertaken by the Saskatchewan Mining and Development Corporation (SMDC) in 1985. This hole targeted a resistivity low and DEEP-EM conductor and a summary log from assessment files reports that “no resistivity low nor conductor [was] encountered” (Roy, 1985 and Table 5). Recent work by CanAlaska (Marquis and Schimann, 2009) has redefined the position of this conductor and adjacent resistivity lows and these geophysical anomalies remain untested targets. Table 5. Alteration and mineralisation in DDH Q49-1. DDH number
Depth to u/c (m)
Alteration and mineralisation.
Q 49-1 251.4 4.2 m basal sandstone PIMA indicated illite, probe peak 450 cps at 273.9 m associated with trace graphite.
4.2 North Block 2 summary of historical drill results
Work in the area of North Block 2 in 1978 by Asamera Oil Corporation included the completion of five drill holes; all of which were located just inside or within 10’s of metres of the North Block 2 claim boundary (Table 6). Asamera noted a weakly radioactive graphitic structure in Q11A-2, while Cameco’s Q11A-3 returned metre scale anomalous illite and geochemically anomalous uranium spatially associated with the unconformity. Table 6. Alteration and mineralisation in Q11A series of drill holes. DDH number
Depth to u/c (m)
Alteration and mineralisation.
Q 11a-1 215.4 “No probe peaks passed 100 cps”. “Mafic-rich foliated granitic gneiss basement”.
Q11A-1 215.4 1.7 ppm U/3.6 m at unconformity Q11A-18 223.6 ~20 m of desilicification near u/c. “564 cps recorded graphitic structure ~20
m below the unconformity”. Q11A-2 219.0 “No probe peaks passed 90 cps”. “Mafic-rich foliated granitic gneiss
basement”. Q11A-3 203.7 15 m of PIMA and geochemistry indicated illite in sandstone near u/c. 7
ppm U/8.7 m directly above unconformity
4.3 South Block summary of historical geophysical surveys and drill results
The most recent pre-CanAlaska work on any ground now covered by the Waterbury claim blocks was undertaken by Cameco on what is now the South Block. Bishop et al., (2003) document the completion of a two grid step-loop time-domain EM survey and two drill holes on ground now covered by the claims (drill holes SOD 254 and
WAT2009-02 8

255). A third drill hole (SOD-253) was abandoned before basement was reached (Figure 3). Drill hole SOD 254 intersected a basement section dominated by semi-pelite while the basement rock cut by hole SOD-255 consisted of granite. Drilling also showed a 60.1 metre offset in the unconformity between these two drill holes and anomalous amounts of basal sandstone hosted illite or chlorite alteration (Figure 3 and Table 7). Noranda Exploration (NPL) was responsible for the only other drill holes that have been completed on the South Block (Felix, (1981). This work predates PIMA and multi-element geochemical analysis however, drill logs detail narrow but strongly hematite ± clay altered structures hosting anomalous radioactivity (Table 7). One of these structures intersected in ROO-2-81 returned 0.12% U3O8/0.01 metres starting at 260.1 metres. The basement sections cut by the ROO series of holes all consist of gneiss and a lesser amount of pegmatite. Table 7. Clay alteration and geochemistry of SOD and ROO series of drill holes DDH number
Depth to u/c (m)
Clay alteration by PIMA (SOD series)
Other alteration and mineralisation.
SOD-253 Not completed to unconformity SOD-254 297.25 17.25 m of basal sandstone illite No anomalous unconformity U SOD-255 237.1 7.1 m of basal sandstone chlorite No anomalous unconformity U ROO-1-81 Not completed to unconformity. DDH number
Depth to u/c (m)
Alteration and mineralisation (ROO series)
ROO-1-81 Not completed to unconformity ROO-2-81 248.1 Strongly clay, hematite and chlorite altered pegmatite and biotite gneiss.
“Isolated bleb” of U graded 0.12% U3O8/0.1 m starting at 260.1 m. ROO-3-81 245.5 “Quite intense red ochrous hematite mineralisation” corresponds with 4 x
background gamma peak at 268 m. Biotite gneiss hosted. ROO-4-81 244.3 “Red ochrous hematite altered pegmatite, 3 x background radioactivity, at
275.7 m. Radioactivity appears controlled by hematitic mineralized fractures.
WAT2009-02 9

Waterbury Project
Drawn by: ASFig No:
3Report: WAT2009-02Date: Oct. 7, 2009
EM Conductor - strong
Loop Location
LEGEND
!SOD-240
±
0 500 1000 m
South Block Area with location ofCameco Step-loop time-domain EM Grid,
EM Conductors and Drill Holes
EM Conductor - weak
Historical Diamond Drill Hole
Stepwise Moving Loop TDEM
Roads
Winter Roads
Historical Claims
Power LinesLakes

5.0 GEOLOGICAL SETTING
5.1 Regional Geology
The Waterbury project area is underlain by the Athabasca Basin, which consists of essentially flat-lying un-metamorphosed sandstone, conglomerate, and siltstone of Paleoproterozoic age that was deposited in an inland sea on basement of older Precambrian rocks. The Basin is up to 1500 metres thick, occupies an area of about 100,000 km2 and underlies a large portion of northern Saskatchewan and a corner of north-eastern Alberta. The Basin is comprised of the Athabasca Group which unconformable overlies a well-developed basement regolith weathered from sub-Athabasca Group basement rocks. In the region of the Waterbury Project, these basement rocks belong to the Mudjatik and Wollaston domains of the Hearne Province and consist of Archean granitic gneiss which has itself been unconformable overlain by what is now highly metamorphosed Aphebian pelite and orthogneiss (Hoffman, 1990; Gilboy, 1983). The inferred boundary between the Wollaston and Mudjatik Domains trends north-eastward through the Waterbury Project area (Figure 4). The regional structural geology of the project area is dominated by an east northeast-trending fault zone that is likely the sub-Athabasca extension of the Collins Bay Thrust. This structure is responsible for abrupt offsets of up to 100 metres in the Athabasca Group unconformity and the overlying sandstone. Basement rocks along this trend have been further disrupted by numerous splays that branch off the main shear zone. At least three major uranium deposits and a number of uranium showings (>10) are spatially associated with this feature or associated with splays rooted in this structure. The location of the Collins Bay Thrust appears to have been controlled by graphitic lithologies present in the stratigraphy of the Wollaston Domain. Figure 5 depicts the basement geology of the Waterbury project area as interpreted from drill hole and regional magnetic data and the location of some of the uranium deposits in the area. Structural contours denoting the unconformity elevation above sea level were used to interpret the location of the Collins Bay Thrust.
WAT2009-02 11

Date: Aug 14, 2009 Drawn by: AS
Geology of Athabasca Basin
Report: WATG2009-02Fig No:
4After: EXTECH IV
Waterbury Project
A - Geological Map
B - Lithostratigraphic Section

Ì
Ì
Cigar Lake Mine
Sand Lake Deposit
S-107965S-107967
S-107999
150
200
250
350
100
300
400
400
300
300
400
200
400
350
250
300
300
200
350
400
400
530000
530000
535000
535000
540000
540000
545000
545000
550000
550000
555000
555000
560000
560000
565000
565000
570000
570000
6425
000
6425
000
6430
000
6430
000
6435
000
6435
000
6440
000
6440
000
6445
000
6445
000
6450
000
6450
000
6455
000
104°0'0"W
104°0'0"W
104°30'0"W
104°30'0"W58
°0'0
"N
58°0
'0"N
LegendÌ Uranium Deposit
Collins Bay Thrust Fault
Geology
Aphebian Metasediment
Archean Granite
Unconformity Depth a.s.l.
Faults
Claims
Athabasca Basin Edge
Lakes
±
0 2.5 51.25
Kilometres
Waterbury Project
UTM NAD 83. Zone 13 Scale: 1: 175 000
Date: Oct. 9, 2009 Drawn by: AS
Basement Geology showingLocation of the Collins Bay Thrustand Unconformity Depth (m a.s.l.)
Fig No:5
NTS: 74H15/16, 74I01/2, 64L04
Report: WAT2009-02
Collins Bay Thrust F
ault

5.2 Property Geology
Geologic Atlas of Saskatchewan interpreted geology shows that the Collins member (MFc) of the Manitou Falls Formation underlies the Waterbury project area. This member is bounded to the east by the Bird Member (MFb) and to the west by the Dunlop Member (MFd). Member MFa underlies all of these units at depth and Ramaekers et al. (2001) has described these units as follows:
MFd: medium-grained, well sorted bedded and laminated sandstone hosting clay intraclasts.
MFc: moderately to poorly sorted, ripple-cross-laminated sandstone hosting 1% intraclasts-rich layers and minor pebble layers less than 2.0 cm thick.
MFb: poorly sorted, medium- to coarse-grained, pebbly sandstone hosting frequent conglomerate beds over 2 cm thick.
MFa: medium to coarse grained, poorly sorted sandstone and grit beds containing <15% conglomerate.
The Geologic Atlas of Saskatchewan also shows three splays of the Tabbernor fault system striking essentially north-south through the Project area. Specifically splays are interpreted to cross the North 2 and South claim blocks. Interpreted magnetic lineaments suggest other faults trending N-S, E-W and NE-SW occur in basement rock that lies at depth beneath the Manitou Falls Formation. Geological Survey of Canada total field magnetic data covering the project area shows a pattern of high and low magnetic field intensity that is consistent with a pre-Athabasca Group basement composed of magnetic Archean granitic gneiss and intervening much less magnetic Mudjatik Domain Aphebian metasedimentary rocks (Figure 6). This pattern of magnetic highs and lows is particularly pronounced on the Waterbury North 2 claim block where this interpretation has been confirmed by drilling. The steep magnetic gradient that represents the contact between the Archean granitic and Aphebian metasedimentary rocks on the North 2 claim block trends from that claim block to the northeast where the contact is spatially associated with the McClean Lake and Sue deposits (Figure 6). Drill holes in the Waterbury project area have intersected basement lithologies at depths of between 163 metres near the eastern edge of North Block 2 to 356 metres near the western edge of North Block 1; and as deep as 332 metres on the South Block. Further drilling will likely intersect the unconformity at similar depths on these respective blocks. Overburden in this part of the Athabasca Basin is comprised of drumlins, other forms of basal till, lag deposits, eskers, outwash, minor lacustrine and aeolian deposits and muskeg. Overburden depths in drill holes on or near the North blocks range from 4 to 31 metres and overburden depths on South Block range from 22 to 56 metres (Table 4).
WAT2009-02 14

ÌSand Lake Deposit
535000
535000
540000
540000
545000
545000
550000
550000
555000
555000
6420
000
6420
000
6425
000
6425
000
6430
000
6430
000
6435
000
6435
000
6440
000
6440
000
6445
000
6445
000
6450
000
6450
000
104°15'0"W
104°15'0"W58
°0'0
"N
58°0
'0"N
LegendClaims
Lapsed Claims
Ì Uranium Deposit
±
0 2.5 51.25
Kilometres
Waterbury Project
UTM NAD 83. Zone 13 Scale: 1: 150 000
Date: Aug. 14, 2009 Drawn by: AS
Residual Magnetic Field
Fig No:6
NTS: 074H16, 074I01
Report: WAT2009-02
(superimposed on GSC Total Magnetic Field)
CanAlaska Uranium Ltd.

6.0 DEPOSIT TYPES
The unconformity deposits of the Eastern Athabasca Basin of northern Saskatchewan (Table 8) are the world’s largest storehouse of high-grade uranium resources. The average grade for some 30 unconformity deposits in the Athabasca Basin, including the two highest grade examples (Cigar Lake and McArthur River) is 1.97% U, which is four times the average grade (0.44% U) of (for example) Australian unconformity deposits (Jefferson et. al., 2006). Table 8. Uranium mines and major deposits of the Eastern Athabasca Basin.
Mine or deposit1 (total for all zones)
Tonne of ore Average grade (% U)
Total contained U (tonnes)
Collins Bay 3,317,000 1.83 24,400 Rabbit Lake 5,840,000 0.27 15,769 Eagle Point 1,502,000 1.54 51,150 McClean Lake 875,000 2.78 19,327 Cigar Lake 875,000 15.0 131,386 McArthur River 1,017,000 22.3 192,085
These deposits are classified as unconformity-associated and occur as pods, veins, and semi-massive replacements of pitchblende located close to the basal unconformity of the Proterozoic redbed Athabasca Basin and metamorphosed Paleoproterozoic supracrustal and intrusive basement rocks of the Archean aged Hearne Craton (Jefferson et. al., 2006). Developed in the Hearne basement rock which now lies directly beneath the unconformity is a variably preserved thickness of red haematitic, ± bleached clay-altered paleo-regolith which grades down through chlorite alteration to fresh basement gneiss. This paleo-weathering profile is likely to have contributed to the formation of chemical (redox) and/or physical traps for uraniferous hydrothermal fluids from which uranium deposits have been precipitated. Most of the known uranium deposits occur within a hundred metres of the Athabasca Basin unconformity and within 500 metres of the present-surface, making them accessible and attractive exploration targets. Deposits in the eastern part of the Athabasca Basin in Saskatchewan accounted for all of Canada’s uranium production and for approximately 23% of the world’s total uranium production in 2007 (InfoMine, 2009). The Athabasca basin uranium deposits have been subdivided based on their mineralogy into ‘simple’ dominantly basement hosted and ‘complex’ sandstone hosted types. Both styles of mineralisation are genetically associated with post Athabasca Group faults and with alteration halos consisting of clay, ± chlorite, ± dravite, ± hematite, ± silicification, ± desilicification (Jefferson et. al., 2006 and
1Compiled from Jefferson et. al., (2006).
WAT2009-02 16

Figure 7). However, the mineralogy of the end member styles is characterized by HREE /LREE ratios of greater than 1 for basement hosted deposits and HREE/LREE ratios of approximately 1 for sandstone hosted deposits. Sandstone hosted uranium mineralisation is also often accompanied by elevated values of some or all of Ni, Co, Pb, Cu, V, Mo, As ± Au and PGE’s. Basement deposits are completely or partially basement hosted, typically in or spatially associated with graphitic gneiss and calc-silicate units and may extend several tens to up to 500 metres from the unconformity downward along faults. Mineralisation is fracture or breccia hosted and composed of often-massive veins, pods and planar replacements of fine-grained nodular pitchblende. Typical mining grades for these deposits are 0.5 to 2% uranium with individual high-grade lenses of ore ranging from 1 to 2 metres in thickness and 3 to 5 metres in vertical dimension (e.g. Sue C and D; Wheatley et. al., 2006). The McArthur River mine which is developed on one of the largest and highest-grade deposits in the Athabasca Basin produces from pods of 20 to 25% uranium with dimensions of 100 metres or more in vertical extent, 90 metres in length and 50 metres in width (Jamieson and Spross, 2000). Basement hosted deposits typically have narrow, inverted alteration halos which parallel the sides of basement structures. Halos can grade from illite ± sudoïte directly adjacent to mineralisation through sudoïte ± illite to Fe-Mg chlorite ± sudoïte distal to mineralisation and adjacent to fresh basement rock (Quirt, 2003). Alteration associated with basement hosted deposits may not extend a significant distance into the sandstone above the deposit, though structural disruption of overlying sandstone from faults genetically related to mineralisation can be detectable in drill core. In contrast to basement hosted deposits, sandstone mineralisation is developed along the Athabasca Group unconformity, or less commonly in steeply oriented fractures above the unconformity. Deposit morphology consists of flattened elongate to linear ore bodies often characterized by a high-grade core (1-15% U3O8) surrounded by a lower grade halo (<1% U3O8). Examples are Cigar Lake, the Deilmann and Gaertner zones at Key Lake, Collins Bay A, B, and D zones, Sue A, B, and E, the Midwest deposit, and Cluff Lake D zone (Jefferson et. al., 2006). Dickite and minor kaolinite are the dominant clays of the regional digenetic assemblage in the eastern Athabasca Basin and against this background illite is diagnostic of sandstone hosted uranium mineralisation. Chlorite can also form a component of alteration halos and its occurrence is generally more proximal to mineralisation than illite. Chlorite alteration typically consists of a core of Mg (-Fe) chlorite within the larger sudoïte halo (i.e. the halo becomes more iron rich with proximity to an ore-body). Clay altered halos typically extend well beyond the limits of actual ore bodies and can also include varying amounts of kaolin, dravite and
WAT2009-02 17

hematite alteration along with silicification and/or desilicification (Sibbald et al., 1985 and Quirt and Wasyliuk, 2006). Table 9 lists examples of the dimensions of the alteration surrounding various eastern Athabasca deposits. Table 9. Dimensions of the alteration halos surrounding some uranium deposits in the eastern Athabasca Basin. Deposit name Illite halo
width Illite halo heightA
Scale of chlorite alteration Halo length
Cigar Lake 175 m 500 m 100 x 30 m >2 km McArthur River 200 m 500 m 10 x 50, locally 100 m >1.7 km Midwest Lake 175 m 180 m 2 km Collins Bay A 100 m Top of deposit essentially at basal till West Bear 70 m 100 m 350 m Dawn Lake 14 zone 75 m 75 m Sue AB 10 m 20 m 100 Sue C 25 m 75 m 250 Dawn Lake 334 pod 25 m 25 m Unconformity type U general
50 m 100 m Sudoïte occurs near the unconformity and proximal to structures up to 300 metres above ore bodies.
A In the examples given below, clay alteration extends from the deposit to the top of the sandstone column except for West Bear, Dawn Lake 14 zone and Sue A. BFault controlled bleaching and limonite alteration occurs on a tens of metre scale on either side and above the deposit.
The presence of illite and chlorite can be determined by Portable Infrared Mineral Analyser (PIMA) or Short Wave Infrared (SWIR)2 analysis and can also be calculated using K2O/Al2O3 and MgO/Al2O3 ratios respectively, as determined by normative geochemical analysis of rocks surrounding sandstone hosted deposits. Kaolinite, and dravite are determined by PIMA or SWIR analysis only (though dravite maybe visible) and hematite and silicification and desilicification are determined by core logging. CanAlaska Uranium Ltd. is exploring for unconformity-type uranium deposits within the Athabasca Basin. Based on above described geological models for these deposits, a uranium deposit underlying the Waterbury Project area will have some of the following geological characteristics: (1) proximity to the Athabasca basement unconformity either above or below it; (2) proximity to graphitic basement rocks; (3) strong structural controls; (4) extensive envelopes of clay alteration; (5) a zone of highly fractured, possibly desilicified sandstone coincident with and/or overlying a uraniferous zone; (6) envelopes of low grade uranium and; (7) envelopes of complex mineralogy and geochemistry (Ni, ± Co, ± As, ± B, ± Cu, ± M, ± Pb, ± Zn, ± Fe, ± V, ± Y, ± Ag, and rarely Au and PGE’s).
2 Clay determination by PIMA and SWIR analysis are essentially the same. SWIR analyses a broader spectra enabling the determination of a larger mineral suite.
WAT2009-02 18

Guides to further exploration on a property include graphitic units, faults and fracture zones in the basement and low-density zones of alteration that maybe developed in sandstone. Geochemical anomalies consisting of sandstone hosted clay and elements such as arsenic, nickel, boron, molybdenum cobalt and base metals maybe widely dispersed around uranium deposits and can also be used as vectors to potential mineralisation.
WAT2009-02 19

Date: Aug 14, 2009 Drawn by: AS
Deposit Models
Report: WAT2009-02
B - Examples of three end points for morphologyof unconformity associated uranium deposits
and associated alteration halosFig No:
7After: Jefferson et. al., 2006
Waterbury Project
A - Unconformity uranium deposit models

7.0 MINERALISATION
CanAlaska has completed six drill holes on the Waterbury claim block in winter 2006 and 2007. Uranium mineralisation intersected in one of these drill holes (WAT-005) is basement hosted, and consists of fracture controlled uranium mineralisation sampling of which has returned up to 324 ppm uranium over 0.6 metres. The mineralisation first appears approximately 16 metres below the unconformity and is hosted over the next 17 metres in eight zones that show up as spikes of close to or over 1000 counts per second on a plot of down hole gamma data from the hole (Figure 8). Coarse-grained pelitic gneiss hosting frequent decimetre scale pegmatitic form the host rock for this section. The entire section has been at least weakly altered by paleo-weathering and within this weathering profile, uranium occurs in discrete zones of brick-red hydrothermal hematite alteration overprinting weakly developed brittle faults or fracture zones that may in turn overprint ductile deformation. Apart from the anomalously deep weathering profile, the basement also hosts the occasional decimetre to metre scale bleached zones which are indicative of clay alteration. The uranium mineralisation intersected in WAT-005 is mineralogically “simple” and in this respect typical of Athabasca Basin basement hosted mineralisation. The highest grade sample (324 ppm U/0.6 metres) contains less than 7 ppm Pb, 7 ppm V, < 1 ppm Cu, < 2 ppm Co, < 10 ppm Ni and < 3 ppm Zn. The Athabasca Group column of the drill hole is also anomalous for the amount of limonite alteration, the number of low angle fractures and for a greater than average amount of angular conglomerate hosted within it. All of these features maybe related to syn to post genetic Athabasca Group structure in the vicinity of the drill hole. Such structures may be genetically linked to formation of uranium ore bodies.
WAT2009-02 21

Waterbury Project
Date: Aug. 14, 2009 Drawn by: AS
Detail from Gamma Logof Drill Hole WAT005
Fig No:8Report: WAT2009-02
WAT005 basement section to 260 meters
0
500
1000
1500
2000
2500
3000
210
211
213
214
216
217
219
220
222
223
225
226
227
229
230
232
233
235
236
238
239
240
242
243
245
246
248
249
251
252
254
255
256
258
259
261
Depth (m)
CPS
Unconformity at 214 metres

8.0 EXPLORATION
CanAlaska Uranium Ltd. conducted exploration on the Waterbury Project claim blocks beginning October of 2005 and continuing through to December 2007. These programs consisted of air and ground geophysical surveys and two three hole diamond drilling campaigns. This work is summarized in Table 10.
8.1 Airborne geophysical surveys
Airborne geophysical surveys were undertaken to detect EM conductors in and to define the magnetic signature of the basement rocks of the project area. Work began in 2005 with Fugro Airborne Surveys of Ottawa Ontario conducting a GEOTEM electromagnetic survey which covered all the claim blocks comprising the Waterbury project area at the time. This work was followed in April 2006 by a helicopter borne Time Domain Electromagnetic (VTEM) Survey undertaken by Geotech Ltd. of Aurora Ontario which covered the North 1 and 2 blocks. Magnetic data was collected during both of these surveys. Table 10. Summary of work completed by CanAlaska Uranium Ltd on the Waterbury Claims. Date Work conducted Authors Report title
October 2005
GEOTEM, all claims
GEOTEM Logistics and Operation Rpt Airborne Magnetic & GEOTEM Survey, Waterbury N & S 1 & 2, Athabasca Basin, Saskatchewan.
May 2006
GEOTEM interpretation ,all claims, 2005
Fugro Airborne Surveys, May 2006.
Basic EM Interpretation Report Airborne Magnetic & GEOTEM Survey; Waterbury N and South 1 and 2.
February 2006
GEOTEM, interpretation ,all claims
Condor Consulting
Report on the Processing and Analysis of a GEOTEM EM & Magnetic Survey
April 2006
Helicopter borne TDEM or VTEM North blocks 1 and 2
Geotech Ltd. Report on helicopter-borne TDEM survey
2006 VTEM-2 blocks, UTEM Grid 2- N Block 1. IP-Resistivity, MaxMin survey -Grid 1 N Block 2. 3 ddh on N Block 2.
Ali H. Alizadeh, Stefan B. Lopatka, Karl Schimann
2006 Drilling and Geophysics Report, On Waterbury project Saskatchewan
April 2006
S-107965 S.J.V. Consultants Ltd., B Chen, May 2006
Geophysical Report-moving loop UTEM-3 survey for CanAlaska Uranium/NW Minerals.
April 2006
3-D Resistivity L Devlin; SJ Geophysics Ltd.
Logistical Report 3D resistivity for CanAlaska/NW Minerals.
January to March 2006
3 D resistivity and MaxMin Surveys.
Logistics by L Devlin, Resistivity by B Chen May 2006.
Geophysical Rpt 3D Res and Max Min Surveys on the Waterbury Project for CanAlaska and NW Minerals.
2007 Linecutting 107999 Farshad Report on 2007 Line cutting and
WAT2009-02 23

Date Work conducted Authors Report title
Shirmohammad Geochemistry on the Waterbury Project, Saskatchewan
2007 Ddh 3 holes block II (S-107967)
Stefan Lopatka Ali-.Alizadeh
2007 Diamond Drilling Report on Waterbury Project, North Block 2, Saskatchewan, Canada.
Feb-April 2007
S-107965 Peter Walcott & Associates Ltd. July, 2007.
A Logistical Report on resistivity Surveying, Waterbury Property.
2007 EM data were collected on 3 lines over Waterbury Lake. (S-107965). Dec 12-22, 2007
S. Medcalf, D. Woods, Discovery Geophysics
Geophysical Report on a fixed (step) loop TEM survey, Waterbury Project; N Saskatchewan.
2007-2008
Resistivity, claim 107999; November 27 to December 12, 2007 and March 19 to 29, 2008.
Scott Medcalf, Report date: August 8, 2008
Logistical Rpt on a DC-Res Survey, Waterbury Project, Northern Saskatchewan.
2009 S-107967, S-107968, S-107999
Guy Marquis Karl Schimann
2009 Geophysics Report Waterbury project
8.1.1 GEOTEM and magnetic survey The Fugro Airborne GEOTEM electromagnetic and magnetic survey comprised a total of 1027 line kilometres and consists of data collected from 144 three hundred metre spaced lines and seven tie lines. Processing, analysis and interpretation of this data was undertaken by Condor Consulting Inc. and a number of targets deemed worthy of follow-up were developed (Irving, 2006). Four styles of conductors were recognized from the GEOTEM data.
1. Intra-sandstone conductors lie above the Athabasca Group unconformity and are normally flat-lying. They are interpreted to be the EM signature of conductive zone(s) resulting from thin water saturated clay seams hosted within the highly resistive sandstone dominated Athabasca Group sequence (Figure 9).
2. Unconformity related conductors are interpreted to straddle the unconformity.
Like intra-sandstone conductors, unconformity related conductors are predicted to be flat-lying. These conductors can be EM signature of water saturated massive clay alteration genetically related to uranium deposit and developed in stratigraphy lying above or sitting astride the unconformity. An unconformity related conductor can also be the EM response of a well developed and clay rich paleo-weatheringprofile (Figure 10).
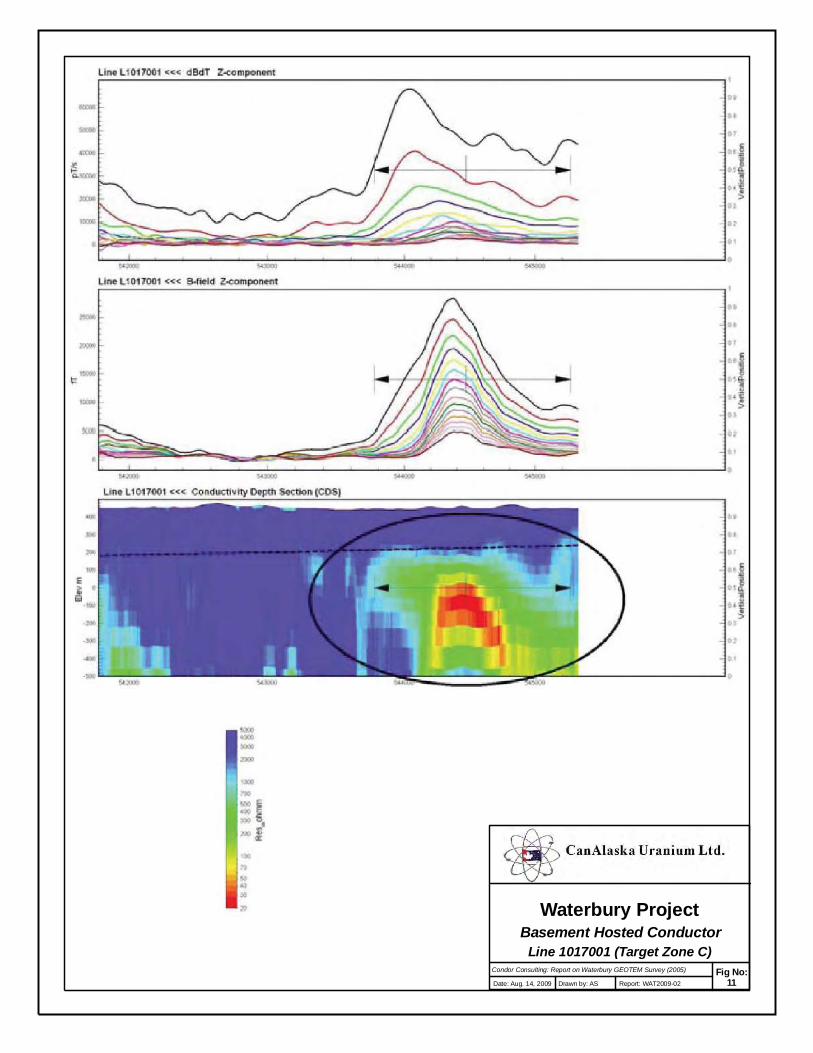
3. Basement conductors are interpreted to lie below the predicted unconformity
depth though the tops of these conductors extend to the unconformity. Basement conductors are most likely to be the EM signature of graphitic units comprising a portion of the basement section. Such conductors are usually moderately to steeply dipping (Figure 11).
WAT2009-02 24

4. Intra-basement conductors are similar to basement conductors except that the tops of the conductors are interpreted to lie from 200 to 400 metres below the unconformity (Figure 12).
WAT2009-02 25

Waterbury Project
Date: Aug. 14, 2009 Drawn by: AS
Sandstone Hosted Conductor
Fig No:9Report: WAT2009-02
Condor Consulting: Report on Waterbury GEOTEM Survey (2005)
Line 1014001 (Target Zone C, Block 1)

Waterbury Project
Date: Aug. 14, 2009 Drawn by: AS
Unconformity Related Conductor
Fig No:10Report: WAT2009-02
Condor Consulting: Report on Waterbury GEOTEM Survey (2005)
Line 1051001 (off Claim Block)
Waterbury Project
Date: Aug. 14, 2009 Drawn by: AS
Basement Hosted Conductor
Fig No:11Report: WAT2009-02
Condor Consulting: Report on Waterbury GEOTEM Survey (2005)
Line 1017001 (Target Zone C)

Waterbury Project
Date: Aug. 14, 2009 Drawn by: AS
Intra-basement Hosted Conductor
Fig No:12Report: WAT2009-02
Condor Consulting: Report on Waterbury GEOTEM Survey (2005)
Line 1025001 (Target Zone B)

8.1.1.1 GEOTEM survey results
EM results
Figure 13 shows Waterbury Project GEOTEM defined target areas superimposed on a plan view of interpreted basement conductors and a plot of AdTau3. Figure 14 shows the same target areas on a plot of the residual magnetic field which is itself superimposed on the GSC generated regional total magnetic field. The AdTau parameter in this context characterizes the decay of late-time channel response from the airborne EM signal. High AdTau values indicate the presence of strong conductors at depth. Condor Consulting selected the target zones described below following an examination of the processing outcomes and ranked the targets as priority 1 or priority 2. Figure 15 through to Figure 20 show ‘snap-shot’ images of AdTau and the ZS Tilt component of the magnetic field together with the profile of the line in the anomaly with the ‘best’ response. The GEOTEM survey covered a continuous area encompassing the North 1 and 2 claim blocks and target areas were defined in areas that lie both inside and outside these blocks. Targets located outside the boundaries of the current Waterbury claim boundaries are not considered in this report.
Magnetic survey results Figure 14 shows Waterbury target zones on a plot of the residual magnetic field from 2005 airborne magnetic survey, data from which was acquired in conjunction with the GEOTEM survey. Generally the magnetic fabric underlying the Waterbury property strikes from SW to NE. The pattern of the highs and lows visible in this data is typical of that produced by Archean granitoids and intervening Aphebian metasedimentary rocks that underlies this portion of the Athabasca Basin.
8.1.1.1.1 Waterbury North Block 1
Target Zone A consists of a one line moderate basement conductor located in a 2.7 kilometre long trend of moderate intra-basement conductors (Figure 15). Peak AdTau (in this context AdTau is calculated from the B-field Z component, with a threshold of 3 The AdTau value is a semi-quantitative measure of the conductivity of the subsurface and is calculated from the decay rate of the electromagnetic response for the latest time channels above a given noise level. The decay will be rapid for resistive areas resulting in low AdTau values; conversely decay will be slow in the presence of conductors and result in high values. In resistive areas, this results in the early channels being used, while in conductive zones, the late channels are generally utilized. This method contrasts with other commonly used methods that employ a fixed set of EM channels.
WAT2009-02 30
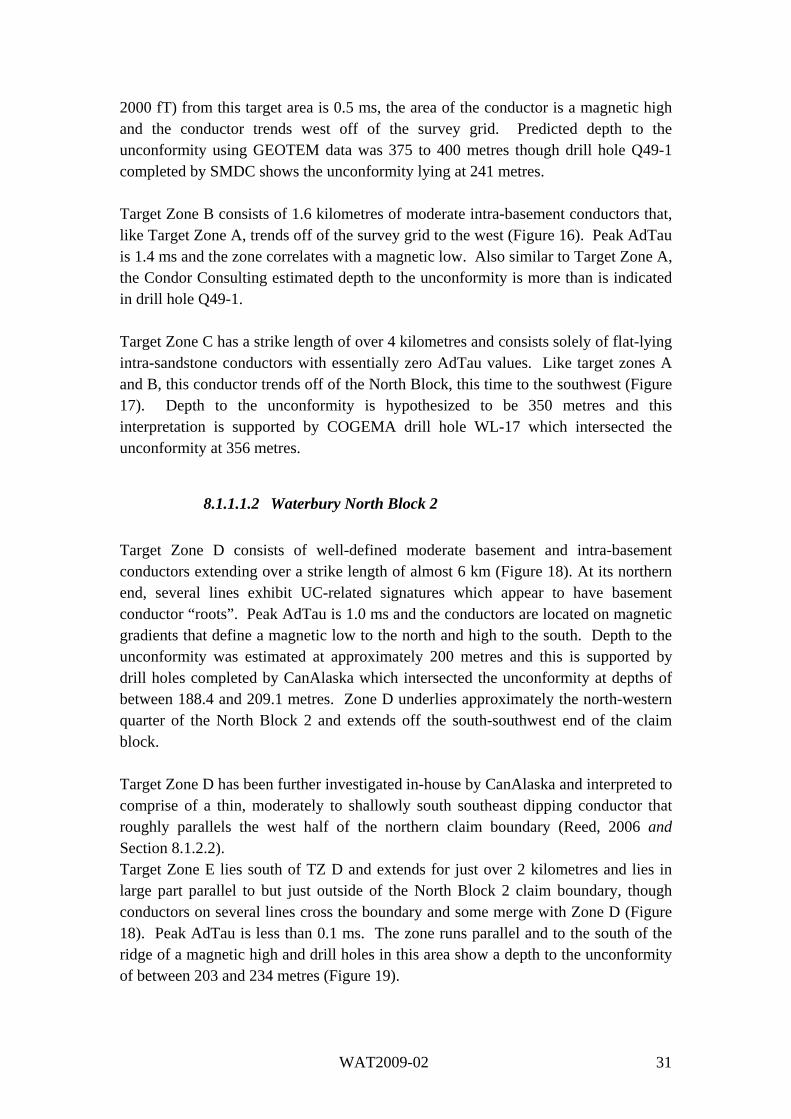
2000 fT) from this target area is 0.5 ms, the area of the conductor is a magnetic high and the conductor trends west off of the survey grid. Predicted depth to the unconformity using GEOTEM data was 375 to 400 metres though drill hole Q49-1 completed by SMDC shows the unconformity lying at 241 metres. Target Zone B consists of 1.6 kilometres of moderate intra-basement conductors that, like Target Zone A, trends off of the survey grid to the west (Figure 16). Peak AdTau is 1.4 ms and the zone correlates with a magnetic low. Also similar to Target Zone A, the Condor Consulting estimated depth to the unconformity is more than is indicated in drill hole Q49-1. Target Zone C has a strike length of over 4 kilometres and consists solely of flat-lying intra-sandstone conductors with essentially zero AdTau values. Like target zones A and B, this conductor trends off of the North Block, this time to the southwest (Figure 17). Depth to the unconformity is hypothesized to be 350 metres and this interpretation is supported by COGEMA drill hole WL-17 which intersected the unconformity at 356 metres.
8.1.1.1.2 Waterbury North Block 2
Target Zone D consists of well-defined moderate basement and intra-basement conductors extending over a strike length of almost 6 km (Figure 18). At its northern end, several lines exhibit UC-related signatures which appear to have basement conductor “roots”. Peak AdTau is 1.0 ms and the conductors are located on magnetic gradients that define a magnetic low to the north and high to the south. Depth to the unconformity was estimated at approximately 200 metres and this is supported by drill holes completed by CanAlaska which intersected the unconformity at depths of between 188.4 and 209.1 metres. Zone D underlies approximately the north-western quarter of the North Block 2 and extends off the south-southwest end of the claim block. Target Zone D has been further investigated in-house by CanAlaska and interpreted to comprise of a thin, moderately to shallowly south southeast dipping conductor that roughly parallels the west half of the northern claim boundary (Reed, 2006 and Section 8.1.2.2). Target Zone E lies south of TZ D and extends for just over 2 kilometres and lies in large part parallel to but just outside of the North Block 2 claim boundary, though conductors on several lines cross the boundary and some merge with Zone D (Figure 18). Peak AdTau is less than 0.1 ms. The zone runs parallel and to the south of the ridge of a magnetic high and drill holes in this area show a depth to the unconformity of between 203 and 234 metres (Figure 19).
WAT2009-02 31
8.1.1.1.3 Waterbury South Block
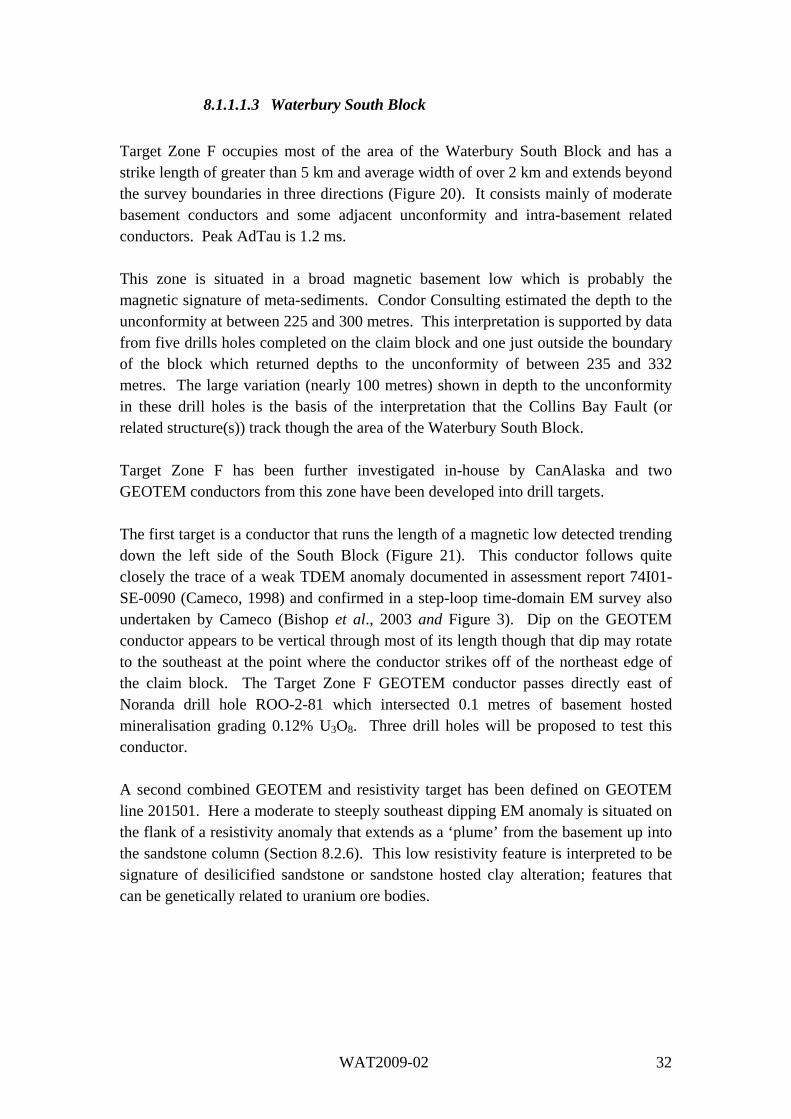
Target Zone F occupies most of the area of the Waterbury South Block and has a strike length of greater than 5 km and average width of over 2 km and extends beyond the survey boundaries in three directions (Figure 20). It consists mainly of moderate basement conductors and some adjacent unconformity and intra-basement related conductors. Peak AdTau is 1.2 ms. This zone is situated in a broad magnetic basement low which is probably the magnetic signature of meta-sediments. Condor Consulting estimated the depth to the unconformity at between 225 and 300 metres. This interpretation is supported by data from five drills holes completed on the claim block and one just outside the boundary of the block which returned depths to the unconformity of between 235 and 332 metres. The large variation (nearly 100 metres) shown in depth to the unconformity in these drill holes is the basis of the interpretation that the Collins Bay Fault (or related structure(s)) track though the area of the Waterbury South Block. Target Zone F has been further investigated in-house by CanAlaska and two GEOTEM conductors from this zone have been developed into drill targets. The first target is a conductor that runs the length of a magnetic low detected trending down the left side of the South Block (Figure 21). This conductor follows quite closely the trace of a weak TDEM anomaly documented in assessment report 74I01-SE-0090 (Cameco, 1998) and confirmed in a step-loop time-domain EM survey also undertaken by Cameco (Bishop et al., 2003 and Figure 3). Dip on the GEOTEM conductor appears to be vertical through most of its length though that dip may rotate to the southeast at the point where the conductor strikes off of the northeast edge of the claim block. The Target Zone F GEOTEM conductor passes directly east of Noranda drill hole ROO-2-81 which intersected 0.1 metres of basement hosted mineralisation grading 0.12% U3O8. Three drill holes will be proposed to test this conductor. A second combined GEOTEM and resistivity target has been defined on GEOTEM line 201501. Here a moderate to steeply southeast dipping EM anomaly is situated on the flank of a resistivity anomaly that extends as a ‘plume’ from the basement up into the sandstone column (Section 8.2.6). This low resistivity feature is interpreted to be signature of desilicified sandstone or sandstone hosted clay alteration; features that can be genetically related to uranium ore bodies.
WAT2009-02 32

Waterbury Project
Date: Aug. 14, 2009 Drawn by: AS
Target Zones and Traceof GEOTEM Basement Conductors
Fig No:13Report: WAT2009-02
Condor Consulting: Report on Waterbury GEOTEM Survey (2006)
on AdTau
0 7 143.5
Kilometres
1052
A
B
CD
E
F

Sand Lake Deposit
535000
535000
540000
540000
545000
545000
550000
550000
555000
555000
6420
000
6420
000
6425
000
6425
000
6430
000
6430
000
6435
000
6435
000
6440
000
6440
000
6445
000
6445
000
6450
000
6450
000
104°15'0"W
104°15'0"W58
°0'0
"N
58°0
'0"N
0 2.5 51.25
Kilometres
Waterbury Project
UTM NAD 83. Zone 13 Scale: 1: 150 000
Date: Aug. 17, 2009 Drawn by: AS
Target Zonesand Gradient Magnetic Field
Fig No:14
NTS: 074H16, 074I01
Report: WAT2009-02
(superimposed on GSC Total Magnetic Field)
A
B
C D
E
FLegend
Claims
Lapsed Claims
Uranium Deposit
Target ZoneA

Waterbury Project
Date: Aug. 17, 2009 Drawn by: AS
Target Zone A (Plan View)Section on Line 1026001
Fig No:15Report: WAT2009-02
Condor Consulting: Report on Waterbury GEOTEM Survey (2006)
A
A

Waterbury Project
Date: Aug. 17, 2009 Drawn by: AS
Target Zone B (Plan View)Section on Line 1031001
Fig No:16Report: WAT2009-02
Condor Consulting: Report on Waterbury GEOTEM Survey (2006)
B
B

Waterbury Project
Date: Aug. 17, 2009 Drawn by: AS
Target Zone C (Plan View)Section on Line 1014001
Fig No:17Report: WAT2009-02
Condor Consulting: Report on Waterbury GEOTEM Survey (2006)
C
C

Waterbury Project
Date: Aug. 18, 2009 Drawn by: AS
Target Zone D (Plan View)Section on Line 1047001
Fig No:18Report: WAT2009-02
Condor Consulting: Report on Waterbury GEOTEM Survey (2006)
D
D
L1047001

Waterbury Project
Date: Aug. 20, 2009 Drawn by: AS
Target Zone E (Plan View)Section on Line 1044001
Fig No:19Report: WAT2009-02
Condor Consulting: Report on Waterbury GEOTEM Survey (2006)
L1047001
E
E

Waterbury Project
Date: Aug. 20, 2009 Drawn by: AS
Target Zone F (Plan View)Section on Line 2014001
Fig No:20Report: WAT2009-02
Condor Consulting: Report on Waterbury GEOTEM Survey (2006)
F
F

8.1.1.2 GEOTEM target areas prioritized
Based on the strength and interpreted position of GEOTEM anomalies relative the unconformity, Condor Consulting defined three priority one and three priority two anomalies spread between the three Waterbury Project claim blocks. The descriptions of these anomalies are contained in Table 11. Table 11. GEOTEM target areas by claim block.
Anomaly Priority Position relative to u/c Comments
North 1 claim block
A Two Dominantly intra-basement with one line being a moderate basement conductor, correlates w/ magnetic high
B One Intra-basement conductors, correlates with magnetic low C Two Flat-lying intra-sandstone conductors
North 2 claim block
D One Well defined moderate basement and intra-basement conductors, N end exhibits u/c conductors, anomaly located on magnetic gradient.
E Two Intra-basement conductors mostly off claim block but merges in part with anomaly D. Spatially associated with magnetic high.
South claim block
F One Moderate basement conductors in magnetic lows with adjacent u/c and intra-basement conductors. Broad open-ended anomaly, underlies most of South claim block
CanAlaska has further investigated Target Zone B on the North Block 1, Target Zone D on the North Block 2 and Target Zone F on the South Block with various combinations of VTEM, Resistivity-IP surveying, and Fixed-Loop Transient EM surveying and developed drill targets based on this analysis (Section 18.0).
8.1.2 VTEM and airborne magnetic survey
The GEOTEM survey was followed by a Time Domain Electromagnetic Survey (helicopter borne TDEM or VTEM survey) which was undertaken between April 1st and 6th 2006. This survey covered the North blocks 1 and 2 and consisted of 220.2 line kilometres of EM and magnetic data acquired from 200 metre spaced lines and 25.8 line kilometres of data acquired from five tie lines. Magnetic data was collected in conjunction with the VTEM survey mirrors closely that of the magnetic data collected in concurrence with the GEOTEM survey. However, subtle differences in both data sets were scrutinized in to assist in picking drill targets.
WAT2009-02 41

8.1.2.1 VTEM anomalies - North Block 1
VTEM surveying on the North Block 1, which is located almost entirely within the confines of Waterbury Lake, identified a two basement conductors that trend approximately 070º across the central portion of the survey area. These conductors lie in target zone C defined in the GEOTEM survey. “Low amplitudes and attendant noise” make determination of the precise dip of these conductors difficult; however northerly dips of less than 45 degrees are indicated. Weakly conductive materials such as alteration clays or weakly distributed graphite or fault structures are hypothesized to be the source of these anomalies (Reed, 2006). These conductors follow the trace of magnetic gradients that define a magnetic low that underlies the centre of the survey area (Figure 22).
8.1.2.2 VTEM anomalies - North Block 2
The VTEM survey over the North Block 2 defined a thin, east-northeast striking, shallowly southeast dipping (~30º) conductor that runs the length of the magnetic low that underlies the northern eastern quarter of the claim block (Figure 23 and Target Zone D from the GEOTEM survey). This VTEM conductor was the target of six drill holes completed by CanAlaska during 2006 and 2007 and results from this drilling have been used to assist in the reinterpretation of the position of this conductor (Section 17.0). The magnetic data collected as part of the North Block 2 VTEM survey show a northeast striking adjacent magnetic low and magnetic high pair, the gradients for which on a district scale strike northeast where ultimately they define the edge of the granitic dome spatially associated with the McClean Lake deposits (Figure 24). .
WAT2009-02 42

!
!
!
!!!
!
8200
7400
7800
7000
8600
6200
6600
5000
9000
9400
5400
5800
9800
S-107999
6200
6600
5000
9000
9400
5400
5800
9800
8200
7400
7800
7000
8600
SOD-253SOD-255
SOD-254
ROO-4-81ROO-3-81 ROO-2-81
531000
531000
532000
532000
533000
533000
534000
534000
535000
535000
536000
536000
537000
537000
6423
000
6423
000
6424
000
6424
000
6425
000
6425
000
6426
000
6426
000
6427
000
6427
000
6428
000
6428
000
6429
000
6429
000
6430
000
6430
000
6431
000
6431
000
6432
000
6432
000
104°22'30"W
104°22'30"W58
°0'0"
N
58°0'
0"N
±
0 1 20.5
Kilometres
Waterbury Project
UTM NAD 83. Zone 13 Scale: 1: 40 000
Date: Oct 30, 2009 Drawn by: AS/TMS
South Block GEOTEM Anomaly on
Vertical Gradient Magnetic FabricFig No:
21NTS: 074I01
Report: WAT2009-02
LegendClaims
GEOTEM
EM Conductors -strong
EM Conductor - weak to mod
! Historical Drill Holes
2007 Resistivity-IP Lines
2008 Resistivity-IP Lines
Lakes
-0.23 -0.09 -0.02 0.07 0.23
nT/mMagnetic Vertical Derivative
ROO-1-78
CanAlaska Uranium Ltd.

Waterbury Project
Date: Aug. 24, 2009 Drawn by: AS
North Block 1VTEM Anomalies on RMI
Fig No:22Report: WAT2009-02
Condor Consulting: Report on Waterbury GEOTEM Survey (2006)
CanAlaska Uranium Ltd.

Fig23
North 2 Block: VTEM anomalies on RMI

Fig24
North 2 Block: Regional Magnetic Setting

8.2 Ground geophysical surveys
The Waterbury North 1 claim block has seen three ground geophysical surveys since being acquired by CanAlaska Uranium Ltd. The first survey consisted of a single line ‘reconnaissance’ moving loop UTEM survey undertaken in April 2006 by S.J.V Geophysics Ltd. This work was followed in February through April 2007 by a 20-line Resistivity-IP survey run by Walcott and Associates of Vancouver BC. Finally, a three-line fixed loop transient EM survey was conducted by Discovery Geophysics Inc. late in 2007 MaxMin and Resistivity surveys conducted by S.J.V Geophysics Ltd. were also run on the North Block 2 grid between January and March 2006 and a Resistivity-IP survey was completed by Discovery Geophysics Inc. on the South Block in two stages beginning in the fall of 2007 and completed in the late spring 2008.
8.2.1 Moving loop UTEM survey - North Block 1
Waterbury Project ground geophysical surveying was initiated with a 3-kilometre long 400 × 400 metre moving loop UTEM survey targeting GEOTEM and VTEM conductors on the North 1 claim block. This survey successfully detected one weak deep-source sheet-like EM conductor and a shallower flat conductor interpreted as the conductive response of lake sediments (Chen, 2006). For reference, the centre line of the 2006 moving loop UTEM survey is denoted by the orange line in Figure 26, Section 8.2.3.
8.2.2 Resistivity – IP survey - Waterbury North Block 1
Like the UTEM survey described above, the resistivity-IP survey on the Waterbury North Block 1 was undertaken to help further define drill targets on GEOTEM and VTEM anomalies. CanAlaska undertook in-house processing and interpretation of this data and Marquis and Schimann (2009) report on the survey parameters and details of the 2D and 3D modelling and QA/QC procedures. A depth slice of Resistivity at 300 metres a.s.l. Waterbury North Block 1 is shown in Figure 27 along with VTEM contours discussed in Section 8.2.3. Expected results from this survey include the detection of low resistivity lake sediments (shallowest layer of red and yellow in Figure 25) and the presence of a highly resistive layer of Athabasca Group sandstone overlying less resistive basement rocks. The unconformity between the Athabasca Group and the underlying basement is interpreted at the dashed line in Figure 25.
WAT2009-02 47

Unexpected results include an apparent offset in the unconformity, which shows up underlying the northern portion of the grid. The resistivity signature of the apparent down drop is shown in Figure 25 by the dotted line which extends down below the dashed line which represents the interpretation of a flat-lying unconformity. This down drop block also hosts VTEM conductors, evidence that when combined with its low magnetic signature (Figure 22) suggests Aphebian metasediments. Conversely, the interpreted higher portion of the basement is spatially associated with a magnetic high (observed in airborne magnetic data), and thus this feature maybe the magnetic signature of Archean Granite. Saskatchewan Mining and Development Corporation drill hole number Q49-1 was collared directly northeast of section 8400E intersected the basement at 203 metres a.s.l. This elevation is higher than some drill holes collared east of the North 1 claim block further suggesting that there is a paleo-topographic high in the unconformity (Figure 5). This feature would extend onto section 8400E south of approximately 112+00 north. An alternative interpretation of this feature is that the unconformity is relatively flat as expected; but that the basement rocks underlying the northern portion of the grid are highly resistive (i.e. unaltered) and have a resistivity signature similar to the sandstone that overlies them.
8.2.3 FLTEM survey - Waterbury North Block 1
A three line, 43.1 line-km Fixed Loop Transient EM or FLTEM (also called Step-Loop EM) survey was conducted by Discovery Geophysics Inc. during the period December 12th to 22nd 2007 (Figure 26). This survey defined a vertically dipping conductor the depth to the top of which on line 3W was interpreted to be 230 ± 80 metres (Medcalf, 2008). The depth to the unconformity in drill hole Q-49-1 located in the approximate centre of the three line survey was 251 metres. Figure 27 shows contoured VTEM data along with the results of CanAlaska in-house reprocessing of resistivity and step-loop TEM data. The Resistivity raster shows a slice of the resistivity model at a depth of 300 metres, which is approximately 50 metres below the unconformity. Resistivity is higher (>3000 ohm.m) at depth than is typical for Athabasca Basin basement lithologies, except for two small low resistivity zones located at the southern edge of the VTEM anomaly. These features are hypothesized to be the result of basement hosted hydrothermal alteration that appears to extend up in to the sandstone column and drill targets have been developed on these zones, or on the FLTEM anomalies that lie adjacent or trace through these zones (Section 18.0).
WAT2009-02 48
8.2.4 Resistivity-IP survey - Waterbury North Block 2
The potential [resistivity] component of IP data acquired on the North Block 2 was processed, inverted and modelled by SJ Geophysics of Delta BC (Devlin and Chen, 2006). Data collected from western 2/3rds of the grid was of poor quality due to acquisition problems (either poor current or poor potential contact due to frozen ground); however general features revealed by the subsequent modelling of that data are believed to be true. Two prominent low resistivity responses (< 1000 Ohm.m) appear flat-lying and are located approximately 300 metres below surface underlying the north portion of the grid. These resistivity anomalies correspond to magnetic lows defined from airborne magnetic data (Figure 23) and were interpreted to reflect the presence of metasedimentary rocks. This interpretation has now been confirmed by drilling. IP apparent chargeability data collected along with the potential data was beset with “poor decay curves” that was the result of highly resistive frozen overburden that impeded the transition and reception of IP signals. Data collected was considered of poor quality and no attempt was made to process it (Devlin and Chen, 2006).
8.2.5 MaxMin IP survey - Waterbury North Block 2
Profiles of the in-phase and quadrature components of a MaxMin survey were produced and analyzed and there are no responses indicative of conductive bodies at depth. The depth of penetration of a survey such as this run with a coil separation of 300 to 400 metres was likely 200 metres, which is also the approximate depth of the unconformity in the area. As a result, the lack of response to this survey does not rule out the presence of significant basement structures or conductors in the area.
WAT2009-02 49

Waterbury Project
Date: Aug. 26, 2009 Drawn by: AS
Block NorthResistivity Inversion Section
for Line 8400EFig No:
25Report: WAT2009-02
CanAlaska Uranium Ltd.

Metres
0 500 1000250
Waterbury Project
Date: Aug. 24, 2009 Drawn by: AS
FLTEM SurveyPlan View
Fig No:26Report: WAT2009-02
UTM NAD 83. Zone 13 NTS: 074H16, 074I01
S - 107965
LegendConductor Location
Grid Line
Loop Location
Centre Line of the 2006Moving LoopUTEM SurveyContour
Lake

S-107965
536000
536000
537000
537000
538000
538000
539000
539000
540000
540000
541000
541000
542000
542000
64
44
00
0
64
44
00
0
64
45
00
0
64
45
00
0
64
46
00
0
64
46
00
0
64
47
00
0
64
47
00
0
64
48
00
0
64
48
00
0
64
49
00
0
64
49
00
0
64
50
00
0
64
50
00
0
64
51
00
0
64
51
00
0
64
52
00
0
64
52
00
0
64
53
00
0
64
53
00
0
104°22'30"W
104°22'30"W58
°11'
15"N
58°1
1'15
"N
Legend
VTEM Contours
0.004
0.003
0.001
TEM Conductor Trace
Claims
±
0 1 20.5
Kilometres
Waterbury Project
UTM NAD 83. Zone 13 Scale: 1: 40 000
Date: Aug. 24, 2009 Drawn by: AS
North Block
Fig No:27
NTS: 074I01
Report: WAT2009-02
Wa t e r b u r y L a k e
FLTEM Conductor & VTEM Contourson 3D Resistivity @ 300 m Depth
Resistivity @ 300 m a.s.l.
CanAlaska Uranium Ltd.
8.2.6 Resistivity-IP survey; Waterbury South Block
Discovery Geophysics conducted a DC Resistivity-Induced Polarisation survey during the periods November 27th to December 12th 2007 and from March 19th to 29th 2008 (Medcalf, 2008). Figure 28 shows a slice of the 3D Resistivity model at 300 metres below surface and examples of resistivity sections are shown in Figure 29. Survey results show a typical section for the Athabasca Basin, with shallow low resistivity zones that can be attributed to lake sediments, and a high resistivity sandstone column that overlays low resistivity basement lithologies. Data shows good correlation between the unconformity and the tops of deep basement conductors detected by Cameco (northeast trending black lines in Figure 28) though less precise spatial correlation is seen between the GEOTEM data and resistivity (Marquis and Schimann, 2009). Two low resistivity features, on line 8600N and 9400N respectively, have been selected as drill targets (Figure 29). Both of these features consist of low resistivity plumes that extend from the basement though to the top of the Athabasca Group sandstone column. The target on line 8600N is flanked to the south by a GEOTEM and ground EM anomaly and a drill hole is proposed to test the resistivity feature at the location where the EM anomaly intersects the resistivity low on GEOTEM line 201501 (Figure 20). The target on line 9400N is the stronger of the two resistivity lows and a drill hole is proposed to test the centre of this feature.
8.2.7 Geophysics – summary and conclusions
CanAlaska has further investigated GEOTEM Target Zone B on the North Block 1, Target Zone D on the North Block 2, and Target Zone F on the South Block and developed drill targets on these anomalies (Section 18.0). North Block 1 On the North Block 1 an FLTEM survey has been used to refine the position of the GEOTEM conductor comprising Target Zone B and in conjunction with these results and the results from Resistivity surveying four drill targets have been defined. Two of these targets are comprised of coincidental Resistivity and FLTEM anomalies; a third is a test a FLTEM anomaly while a fourth is a test of a stand alone Resistivity anomaly.
WAT2009-02 53

North Block 2 GEOTEM survey coverage of the North Block 2 defined Target Zone D which includes a greater than two kilometre long conductor underlying the northwest area of that block. An interpretation of VTEM data covering that conductor has been tested by six drill holes and results from that drilling and Maxwell Plate modelling has been used to more precisely define the conductor’s location. Three drill holes are planned. One of these is targeted at the projected up dip (unconformity) edge of the conductor and spatially associated mineralisation intersected in WAT-005, while a second targets that conductor and mineralisation an equal distance down dip of that intersection. The third proposed drill hole targets a portion of 1200 metres of strike length left untested by previous drilling. South Block GEOTEM survey coverage of the South Block defined a four kilometre long conductor (Target Zone F) coincident with a magnetic low and some historic ground EM conductors. This data has been integrated with the results from Resistivity surveying to develop five drill targets.
WAT2009-02 54
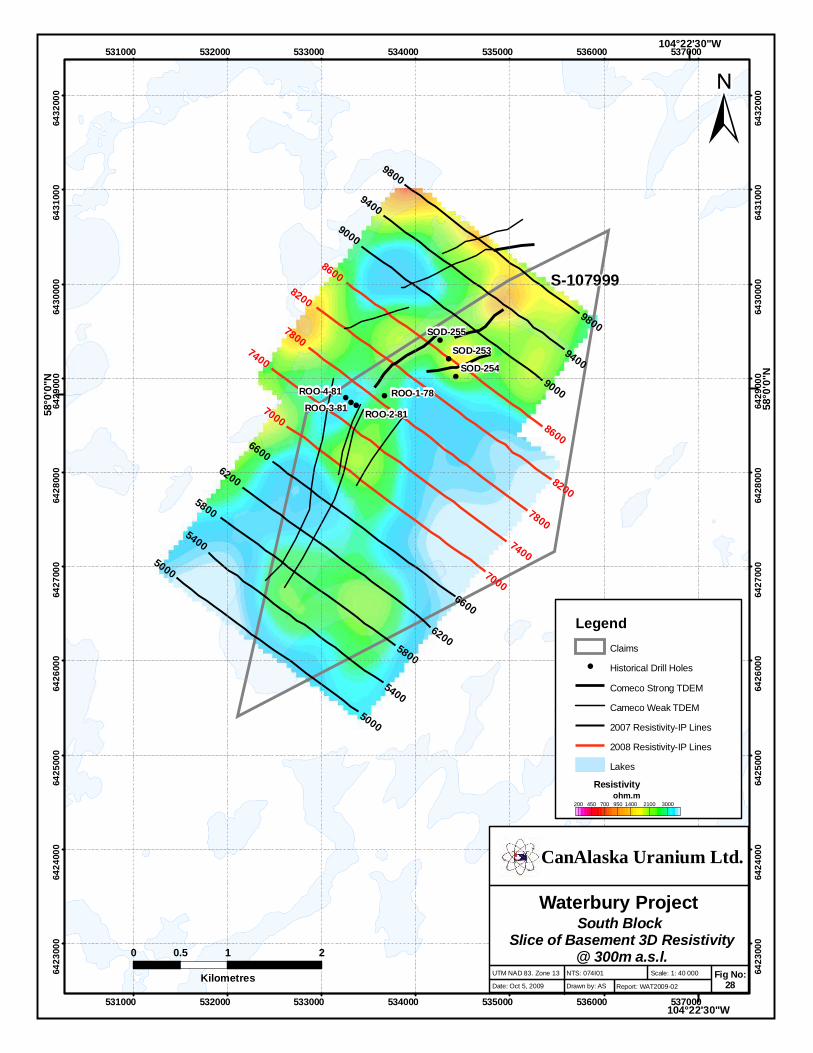
!
!
!
!!!
!
8200
7400
7800
7000
8600
6200
6600
5000
9000
9400
5400
5800
9800
S-107999
6200
6600
5000
9000
9400
5400
5800
9800
8200
7400
7800
7000
8600
ROO-4-81ROO-3-81 ROO-2-81
SOD-253SOD-255
SOD-254
531000
531000
532000
532000
533000
533000
534000
534000
535000
535000
536000
536000
537000
537000
6423
000
6423
000
6424
000
6424
000
6425
000
6425
000
6426
000
6426
000
6427
000
6427
000
6428
000
6428
000
6429
000
6429
000
6430
000
6430
000
6431
000
6431
000
6432
000
6432
000
104°22'30"W
104°22'30"W58
°0'0"
N
58°0'
0"N
±
0 1 20.5
Kilometres
Waterbury Project
UTM NAD 83. Zone 13 Scale: 1: 40 000
Date: Oct 5, 2009 Drawn by: AS
South Block Slice of Basement 3D Resistivity
@ 300m a.s.l.Fig No:
28NTS: 074I01
Report: WAT2009-02
LegendClaims
! Historical Drill Holes
Comeco Strong TDEM
Cameco Weak TDEM
2007 Resistivity-IP Lines
2008 Resistivity-IP Lines
Lakes
Resistivity200 450 700 950 1400 2100 3000
ohm.m
ROO-1-78
CanAlaska Uranium Ltd.

Waterbury Project
Date: Oct. 1, 2009 Drawn by: AS/TMS
South Block3D Inversion of Resistivity Data
under Lines 8600 and 9400EFig No:
29Report: WAT2009-02
CanAlaska Uranium Ltd.Line 8600E
Line 9400E

9.0 DRILLING
CanAlaska has carried out two drill programs on the Waterbury project; conducted during the winters of 2006 and 2007 respectively. In all, six diamond drill holes were completed for a total of 1962.5 metres. All of the holes targeted VTEM conductors on North Block 2. Accommodation for both drill programs was provided for at Points North Landing which is located approximately 35 kilometres north of the centre of the North 2 Block. Drill core was logged and is stored at a facility established along the Waterbury North 2 road access, 10.7 kilometres east of the Cigar Lake mine access road. UTM coordinates of the stored core are 550055 E and 6447420 N (Zone 13). Figure 30 shows the drill hole locations, road access and physiography and shows collar locations plotted along with VTEM anomalies and magnetic fabric. Table 12. Drill hole locations, orientation and pertinent depths. lists collar locations, orientations and defining depths of these holes while Table 13 summaries results from drilling by hole number. As expected for this portion of the Athabasca Basin, the drill holes intersected members “C” and “B” of the Manitou Falls Formation; the latter being marked by the first appearance of conglomerate generally 30 to 40 metres below surface. Unconformity elevations ranged between 265.9 and 279 metres above sea level, numbers that are not indicative of any major offsets in the unconformity in the area between the drill holes. Cross sectional views of drill holes WAT-001 to WAT-006, lithology, down hole probe data, and the uranium values obtained systematic down hole geochemical sampling are contained in Appendix I. Strip logs showing lithology, multi-element geochemistry and down hole gamma data for these drill holes are contained in Appendix II. Table 12. Drill hole locations, orientation and pertinent depths.
DDH # UTM E UTM N Collar
elevation (m)
Overburden depth (m)
Az (º)
Dip (º)
U/C depth (m)
U/C a.s.l. (m)
EOH (m)
WAT-001 553700 6446165 468.3 10.7 343 -68 217.1 266 337.4 WAT-002 553780 6445980 464.5 6.5 338 -70.6 207.3 269 328.3 WAT-003 552815 6445700 475.0 2.6 325 -69 223.8 266 339.2 WAT-004 553659.9 6446287.5 468.8 12.3 343 -70 211.0 267 317.6 WAT-005 554068.9 6446498.2 467.4 12.2 000 -70 214.4 271 333.0 WAT-006 554388.8 6446494.4 467.4 12.4 000 -70 203.3 279 308.8
WAT2009-02 57

Table 13. Drill holes WAT-001 to WAT-006 summary of results.
DDH # Basement Alteration Max U(total)
(ppm) Comments
WAT-001 Biotite gneiss, qtz-fsp peg
Ss hem + bleaching 197-217 m.
4.7 ppm U/0.4 m @ 203.5 m
2.6 m fault at 178.3 m. Weak graphite from u/c to 247 m.
WAT-002 Granitic gneiss, qtz-fsp peg
Ss hem + bleaching 170-207.3 m.
5 ppm U/0.5 m @ 217.5 m
No conductors
WAT-003 Granitic gneiss, qtz-fsp peg
Ss, no altn, bsmt chl from 243-248 m.
No significant U
No conductors intersected
WAT-004 Biotite gneiss, minor pelite, granite
Ss hem + bleaching 207-211m. Bsmt illite stringers 237-264 m.
Ss: 7 ppm U 211-212 m. Bsmt: 40 ppm U 260-264 m.
Regolith 211-237; locally 10-15 % graphite ± pyrite, no significant alteration.
WAT-005 Biotite gneiss, peg + granite
Ss wkly bleached 172-214.4 m. Bsmt kaolinite 241.8-252.5 m, hem 302-317 m.
Ss, none,; bsmt 324 ppm U/0.6 m @ 246.9 m.
Regolith 214.4-228 m; locally 3-5% graphite ± pyrite = conductor.
WAT-006 Biotite gneiss, granite, minor pelite
Ss limonite 35-50 m; bsmt no significant alteration.
Regolith 203-228 m; no conductor, significant alteration or mineralisation.
Ss 3 ppm U/5m @ 198 m; bsmt 11 ppm U/2m @ 310 m
9.1 Sandstone hosted clay alteration in current and some historic drill holes
Clay alteration in drill holes WAT-001 to WAT-006 was determined by SWIR analysis. Samples were collected at one metre intervals throughout drill holes though occasionally shorter sample intervals were employed to capture fracture hosted alteration or alteration in core proximal to the unconformity. These samples were labelled, dried and analysed on site. Illite alteration, defined as illite comprising ≥ 50% of clay species in an individual sample, was detected in the basal sandstone of five of the six drill holes completed during the Waterbury 2006-2007 drill programmes (Figure 31). Illite was not detected in the basal sandstone in drill hole WAT-004 and a minor amount of kaolinite capped the illite alteration intersected in WAT-001. Like illite, kaolinite can be a constituent of the alteration halos genetically associated with unconformity type uranium ore-bodies in the eastern Athabasca Basin (Wasyliuk, 2002). Figure 31 also depicts PIMA indicated clay alteration intersected in some historic drill holes. Results for drill holes Cameco completed in the South Block show a relatively thick intersection of illite in SOD-254 and seven metres of chlorite alteration in drill hole SOD-255. Also returned from SOD-255 were 20 metres of above background levels of illite alteration situated overlying the chlorite alteration. However illite concentrations were slightly less than 50% of the clay species in those individual samples. Generally chlorite can occur in an individual sample with illite and/or kaolinite though the relatively high temperatures required for the formation of chlorite generally preclude the presence of dickite. For reference, drill holes Q11A-3 and
WAT2009-02 58

!P
!P !P
P
P
P
²³
S-107967Core Storage
WAT006WAT005
WAT004
WAT003
WAT002
WAT001
549000
549000
550000
550000
551000
551000
552000
552000
553000
553000
554000
554000
555000
555000
556000
556000
557000
557000
558000
558000
644
300
0
644
300
0
644
400
0
644
400
0
644
500
0
644
500
0
644
600
0
644
600
0
644
700
0
644
700
0
6448
00
0
6448
00
0
644
900
0
644
900
0
104°5'0"W
104°5'0"W
104°10'0"W
104°10'0"W58
°10'
0"N
58°1
0'0"
N
Legend
Claims and Claims Number
!P 2007 Drill Holes
P 2006 Dril Holes
Drill Holes Surface Projection
²³ Core Storage
Drill Road
Contours
Lakes
Swamps
±
0 1 20.5
Kilometres
Waterbury Project
UTM NAD 83. Zone 13 Scale: 1: 40 000
Date: Oct 5, 2009 Drawn by: AS
North Block 2Drill Plan, Roads and Topography
Fig No:30
NTS: 74I01
Report: WAT2009-02
CanAlaska Uranium Ltd.

Q11A-18 are located at the northwest and northeast edges of the North Block 2 and drill hole Q49-1 is located on the centre of the North Block 1. SWIR defined clay alteration intersected during the current program are evidence that the hydrothermal processes associated with the formation of uranium ore bodies in the eastern Athabasca Basin were active in the areas of the Waterbury Project claim blocks. Drill holes SOD-254 and -255 stand out for hosting anomalous illite and chlorite alteration respectively; while drill holes WAT-003, -005 and -006 hosts somewhat less but still anomalous thicknesses of illite alteration.
Metres of basal sandstone hosted clay alteration by PIMA analysis for current and some historical Waterbury DDH
(illite and kaolinite ≥50% of clay species detected, chlorite ≥20% of clay species detected) .
0
2
4
6
8
10
12
14
16
18
20
SOD-254
SOD-255
Q11A-1
8
Q11A-3
Q 49-
1
WAT-0
01
WAT-0
02
WAT-0
03
WAT-0
04
WAT-0
05
WAT-0
06
Hole number
Me
tres
of
cla
y a
lte
rati
on
Kaolinite (PIMA)
Illite (PIMA)
Chlorite (PIMA)
Figure 31. Sandstone hosted clay alteration for current and historical drill holes.
9.2 Down hole gamma probe surveying of WAT-001 to WAT-006
Figure 32 shows down hole radiometric logs for the drill holes WAT-001 to WAT-006. These plots were prepared by smoothing the gamma cps data using a running 50 point moving average. This treatment removes some of the “noise” in the data but preserves the sometimes subtle increase above background that can denote anomalous radiation associated with the unconformity or basement hosted structures. The results of this analysis generally show subtle radiometric anomalies spatially associated with the Athabasca Group sandstone situated just above the unconformity. More discrete basement hosted anomalies are associated with 18 metre interval that
WAT2009-02 60

returned 12.9 ppm uranium beginning at 281 metres in WAT-001 and a 17 metre thick zone of fracturing and accompanying hematite alteration starting at 230 metres in WAT-005. A narrow shouldered sharp spike of 3489 cps returned from a biotite rich pegmatite located at 234.4 metres in drill hole WAT-001 has essentially been smoothed out by the moving average treatment of the data.
9.3 Sandstone hosted uranium geochemistry
Systematic sampling for geochemical analysis was also undertaken for all drill holes. Systematic samples are comprised of a chip of core taken every one metre over 18 metre intervals in the sandstone column, though sample intervals were tightened up to as little as 5 metres near the unconformity. Basement sections were sampled in a similar method though sample intervals were limited to nine metres. The unconformity-associated radiometric anomalies detected in the down hole logging appear to be the response to weak (partial digestion) uranium and thorium enrichments in these drill holes (Table 14). Regionally, the lower Manitou Falls Formation uranium content is ≤ 0.5 ppm (partial) while thorium averages 18 ppm. Table 14. Basal sandstone uranium and thorium enrichments in drill holes WAT-001 to WAT-006.
Drill hole number
Interval (m)
Uranium enrichment
(partial)
Thorium enrichment
WAT-001 190-217 0.8 ppm 28 ppm WAT-002 168-207 0.6 ppm 23 ppm WAT-003 201-223 0.7 ppm 34 ppm WAT-004 199-210 1.7 ppm 50 ppm WAT-005 200-214 2.0 ppm 62 ppm WAT-006 198-203 1.7 ppm 62 ppm
WAT2009-02 61

Waterbury Project
Date: Oct. 6, 2009 Drawn by: AS
Smoothed Gamma Datafor Drill Holes WAT001 to WAT006
Fig No:32Report: WAT2009-02
Drill holes WAT-001 to WAT-006 down hole gamma data smoothed
moving average of fifty 5-centimetre spaced readings.
0.0
1000.0
2000.0
3000.0
4000.0
5000.0
6000.0
-120-70-203080130180
Metres above and below unconformity
Min
or
tic
mar
ks =
200
cp
s
WAT-001
WAT-002
WAT-003
WAT-004
WAT-005
WAT-006
Unconformity
CanAlaska Uranium Ltd.

9.4 WAT-001 to WAT-006 geology and basement geochemistry
WAT-001 Drill hole WAT-001 was the first drill hole in what is now a three drill hole fence designed to test the VTEM conductor that strikes parallel to the magnetic low underlying the northeast corner of the claim block. The Athabasca Group column intersected in WAT-001 hosts approximately two-metre thick zones of moderate friability at 170 and 197 metres and a well-developed three-metre fault starting at 178 metres. Otherwise, the column was average looking though the basal conglomerate intersected just above the unconformity is, at four metres, somewhat thicker than usual. The paleo-weathering profile of WAT-001 is characterized by 48 metres of weak but continuous banded hematite alteration while the geology of the basement section is dominated by biotite gneiss hosting a minor amount of pegmatite. A light green chlorite altered radioactive pegmatite at 236.4 metres returned a peak gamma probe value of 3489 cps though a 0.7 metre split sample laid out over this interval failed to return any U, Th, or Ce anomalies. An 18 metre composite sample of gneiss returned 12.9 ppm uranium beginning at a depth of 281 metres. 371 ppm boron was also returned over this interval suggesting a hydrothermal source for the U mineralisation. Figure 33 shows the gamma probe results from this zone. Finally, weakly graphitic lithologies were intersected from near the unconformity of WAT-001 to a depth of 247 metres may be related to the VTEM conductor that was the target of this drill hole. WAT-002 Drill hole WAT-002 is situated behind WAT-001 and like WAT-001 was designed to test the North Block 2 VTEM conductor. Athabasca Group rocks intersected in WAT-002 are overall moderately hematite and limonite altered. Like drill hole WAT-001, the basement section of WAT-002 is biotite gneiss dominated though little in the way of geochemical or radiometric anomalies are associated with it. The paleo-weathering profile from WAT-002 consists of bands of weak to moderate hematite and chlorite alteration over the top 31 metres of the basement section.
WAT2009-02 63

Waterbury Project
Date: Oct. 6, 2009 Drawn by: AS
WAT001 Basement Radiometric Anomalies
Fig No:33Report: WAT2009-02
WAT-001 down hole gamma data detail
0
200
400
600
800
1000
1200
1400
265
267
269
270
272
274
275
277
279
280
282
284
286
287
289
291
292
294
296
297
299
301
303
304
306
308
309
311
313
314
316
Depth (m)
Cp
s
CanAlaska Uranium Ltd.

WAT-003 Drill hole WAT-003 tested the same VTEM conductor as WAT-001 and WAT-002 though at a locality one kilometre southwest of those first two drill holes. Average looking Athabasca Group sandstone was cut by this drill hole from the base of the casing to the unconformity at 223.8 metres though a 20 metre thick zone of low angle fractures and strong limonite alteration was centred at approximately 190 metres. The top of the basement section included approximately 40 metres of red zone paleo-weathering, while granitic looking biotite gneiss rounded out the remainder of the drill hole. WAT-004 Drill hole WAT-004 is the northern most hole of what is now a fence of three holes that includes WAT-001 and WAT-002. These drill holes were all targeted at the North Block 2 VTEM conductor. The hole intersected typical Athabasca Group rocks but for minor faulted zones hosted high in the drill hole; and weak bleaching and brick red coloured hydrothermal hematite directly above the unconformity. The red zone of the paleo-weathering profile extends over 41 metres from the unconformity to approximately 252 metres and a light coloured (weakly bleached?) pelite hosting chlorite and clay [paleo-weathered] altered fractures extends below the red zone to 265 metres. A 20 metre interval grading 31.5 ppm uranium covers the altered fracture zone and a four metre thick 3 to 10% graphite bearing ± conductive zone that lies beneath this fractured zone. An additional three metre wide graphite bearing ± conductive zone occurs beginning at 285.9 metres. WAT-005 Drill hole WAT-005 was collared approximately 460 metres northeast of the WAT-001, -002, -004 fence and was designed to test offsets in the VTEM response in the area and coincidental breaks in the magnetic fabric; both features interpreted to be the result of basement hosted faults. The drill hole intersected Athabasca Group sandstone which generally displayed an anomalous amount of limonite alteration and low angle fractures along with a relatively thick 9.5 metre, often coarse-clast, basal conglomerate.
WAT2009-02 65

Hematite dominated alteration of pelite comprises the paleo-weathering profile intersected in this drill hole and this alteration extends from the Athabasca Group unconformity at 214.4 metres to approximately 247 metres. Hosted over the lower 20 metres of this interval is a zone that includes disseminated graphite ± pyrite and a number of uraniferous fractures displaying hematite and clay altered envelopes. The best mineralised of these returned 324 ppm uranium over 0.6 metres. Pelitic gneiss hosting decimetre scale pegmatitic bands and less frequent metre scale intervals of granite form the host rock for the remainder of this drill hole. Based on modelling that suggests a 30º dip to the VTEM response that was the target of this drill hole and on the orientation of fractures in drill core from interval hosting the uranium mineralisation, it is likely that the true thickness of this zone is approximately 18 metres. WAT-006 Drill hole WAT-006 was collared 320 metres east of WAT-005 and like that drill hole was targeted at a weak VTEM response and discontinuities in the magnetic response that were hypothesized to be the signature of basement faults. The Athabasca Group intersection of this drill hole was characterized by the occasional low angle fractures and weak to moderate limonite alteration but otherwise average looking sandstone. The basement section of this drill hole included a paleo-weathering profile that extended approximately 14 metres below the unconformity at 214.4 metres and gray fine to medium-grained granitic gneiss to the end of the hole at 333.0 metres.
9.5 Drill results – summary and conclusions.
All of the CanAlaska drill holes completed to date on the Waterbury project intersected anomalous amounts of illite or kaolinite alteration and displayed radiometric anomalies spatially associated with the unconformity. The illite is attributed to hydrothermal alteration while the anomalous radioactivity appears to be the result of subtle uranium and/or thorium enrichments. The most encouraging results to come out of the current drill program were obtained from drill hole WAT-005 where 17 metres of basement hosted uranium mineralisation returned up to 324 ppm uranium over 0.6 metres in structurally controlled zones of secondary brick-red hydrothermal hematite alteration.
WAT2009-02 66

An 18 metre zone of anomalous basement hosted uranium geochemistry was also intersected in drill hole WAT-001. This zone is accompanied by boron suggesting that it too has a hydrothermal signature. All of these drill holes targeted the North Block 2 VTEM conductor though only two of these holes (WAT-001 and WAT-004) intersected graphite, none of which was strongly conductive. Recent modelling of the North Block 2 conductor suggests an orientation different than that assumed prior to the previous program being commenced. Based on this, good drill targets have been developed on the revised model, particularly in the vicinity of WAT-005 where a strongly anomalous uranium value has already been intersected.
10.0 SAMPLING METHOD AND APPROACH
10.1 Composite sampling - general method
Athabasca Group sandstone was sampled beginning at the top of each drill hole but below any Quaternary weathering, and continued down hole over continuous up to 18 metre intervals irrespective of alteration and lithological boundaries. Samples were composites comprised of approximately 4-cm long pieces of drill core taken every 1-metre over the sample interval. Composite sampling was discontinued at the top of principal geologic units (PGU’s) comprised of lithologies and/or alteration logged as being distinctive and spatially associated with the unconformity. PGU’s below the base of the composite sampling were sampled by splitting the core and sample intervals ranged from 2 metres to 10 centimetres. Efforts were made during the lay out of split samples to start or end sample intervals at major lithological or alteration boundaries. Unaltered [and unmineralised] basement rocks were also sampled by composite methods similar to those described for Athabasca Group rocks except sample intervals did not exceed nine metres. To ensure basement rock samples were representative of the rock type being sampled efforts were made to avoid including inhomogeneities such as pegmatite in the sampled material. The exception to this would be in compositionally banded gneissic rocks where sampling strived to be representative of the rock type as a whole. A more detailed description of the sampling procedure for anomalously altered or mineralized core is described below.
WAT2009-02 67

10.2 Sampling of structures, alteration and mineralisation.
Any Athabasca Group or basement stratigraphy exhibiting anomalous lithology, mineralogy, alteration, or structures, and where it was thought that sample results from which might help lead to the discovery of a uranium ore body, were sampled. These samples variously extended over the entire width of an anomalous interval, or might comprise a single sample representative of the anomalous interval. The decision on how much to sample depended on how much data was needed to further the search for uranium ore bodies. Sample lengths commonly varied from between 0.1 and 1.5 metres. The samples were split using a knife type core splitting tool and every attempt was made to ensure an even split. Intervals of poorly lithified core (i.e. core from desilicified or clay altered rock) were split using stainless steel kitchen utensils. Attempts were made to avoid including more than one lithology in any given sample interval and where this could not be avoided, the presence of multiple lithologies within a split sample interval was noted in the drill log. Intervals of missing core were logged as PGU’s or minor units and were not included in sample intervals.
10.3 SWIR sampling and analysis
Short wave Infrared mineral analysis (SWIR) was carried out during the 2006 and 2007 core logging program using a TerraSpec TSP 350 infrared spectrometre. Analysis of smooth fresh drill core surfaces was conducted at one metre intervals throughout all drill holes. Natural fractures were also analyzed to test for fracture controlled alteration. Dravite mineralisation in particular is often fracture controlled, especially where it is hosted in basement rocks, and its presence is indicative of hydrothermal alteration. Without the use of SWIR (or PIMA), fracture controlled dravite might not otherwise be detected as a few 100-ppm boron on a single fracture surface, will not show up as a boron enrichment in a metre scale split or composite sample.
11.0 SAMPLE PREPARATION, ANALYSIS AND SECURITY
Drill core from the year 2006 and 2007 drill programs was logged and split in facilities established along the Waterbury Project drill access road located approximately 10.7 kilometres in from the Cigar Lake road. After logging, core was cross piled adjacent to the logging facility in preparation for long term storage. The location of this facility in UTM coordinates is at 550055 E and 6447420 N (NAD-83). Samples from drill core were cut and prepared by CanAlaska staff or outside contractors who were trained and supervised by CanAlaska personal. Half of the cut
WAT2009-02 68

core was placed in individual sealed polyurethane bags and half-placed back in the original core box for permanent storage. All samples from the year 2006 and 2007 drill programs was shipped to Points North by CanAlaska personnel and then forwarded by freight truck in sealed plastic 5-gallon pails to appropriate accredited laboratories. Samples from the 2006 program were sent to ACME Analytical Laboratories of Vancouver BC for analysis by group 1DX and 1EX (ICP analysis after partial and total digestion respectively) with boron analysis by Na2O2 fusion. Year 2007 program sample analysis was conducted at the Saskatchewan Research Council Laboratories in Saskatoon using a major and trace element uranium exploration package also with boron added on (ICP4.3R partial digestion4 and ICP4.3 total digestion5 with boron by Na2O2 fusion). Generally Athabasca Group rocks are analysed after both partial and total digestion while basement rocks are analysed after total digestion only. All samples collected were subjected to a quality control procedure that ensured best practices in the handling, sampling, analysis and storage of the drill core and samples. Acme Analytical Laboratories has been assessed by the Standards Council of Canada and found to confirm with the requirements of ISO/IEC 17025 - General Requirements for the Competence of Mineral Testing and Calibration Laboratories; and is therefore recognized as an accredited Testing Laboratory. SRC Laboratories, which analysed samples from the 2007 program has been assessed by the Standards Council of Canada and found to confirm with the requirements of ISO/IEC 17025:2005 (CAN-P-4E) - General Requirements for the Competence of Mineral Testing and Calibration Laboratories; and is therefore also recognized as an accredited Testing Laboratory.
4 Analysis after partial digestion is conducted on samples of Athabasca Group sandstone and specifically analyses for uranium mineralisation that may have been introduced into the sandstone matrix post deposition of the Athabasca Group rocks and [presumably] contemporaneously with the formation of the Athabasca Basin related uranium deposits. 5 Analysis after total digestion reports both uranium that may have been introduced into a rock and uranium that may be bound in the crystal structure of U-bearing accessory minerals such as columbite, monazite and zircon.
WAT2009-02 69

12.0 DATA VERIFICATION
Dr. Karl Schimann P.Geo. directed the 2007 and 2008 exploration programs on the Waterbury Project. This author has every reason to believe that work completed by CanAlaska was done in a professional manner and met or exceeded generally accepted industry standards for quality control and quality assurance. Analytical controls on analysis preformed by Acme Analytical Laboratories on the year 2006 drill program core samples included insertion of blanks (analytical and method), duplicates and standard reference materials into the sequences of client samples to provide a measure of background noise, accuracy and precision. The following is quoted from their website (ACME, 2009). “QA/QC protocol incorporates granite or quartz sample-prep blank carried through all stages of preparation and analysis as the first sample(s) in the job. Typically an analytical batch will be comprised of 34 to 36 client samples, a pulp duplicate to monitor analytical precision, a -10 mesh reject duplicate to monitor sub-sampling variation (drill core only), a reagent blank to measure background and an aliquot of Certified Reference Material (CRM) or Inhouse Reference Material to monitor accuracy. In the absence of suitable CRMs Inhouse Reference Materials are prepared and certified against internationally certified reference materials such as CANMET and USGS standards where possible and will be externally verified at a minimum of 3 other commercial laboratories. Using these inserted quality control samples each analytical batch and complete job is rigorously reviewed and validated prior to release.” This author has verified with ACME Laboratories that QA/QC procedures in place during the analysis of samples from CanAlaska’s 2006 drill program were not materially different than those quoted above. Analytical controls on analysis preformed by Saskatchewan Research Council Laboratories on the year 2007 drill program core samples included insertion of blanks, standards and duplicates into the sequences of client samples to provide a measure of background noise, accuracy and precision. The following is paraphrased from their website (SRC, 2009). Instrumental QA/QC consists of insertion of two calibration blanks and two calibration standards with each group of samples. Analytical QA/QC consists of insertion of one blank, two QA/QC standards and one replicate (pulp) in each group of samples.
WAT2009-02 70

The in-house standards used to monitor the sample analysis are: ASR1, ASR2 (sandstones) CG-515, LS4 (Basement/Mineralized/Lake sediments)”
This author has verified with SRC Laboratories that QA/QC procedures in place during the analysis of samples from CanAlaska’s 2006 drill program were not materially different than those quoted above. In addition during the 2007 exploration program, CanAlaska inserted standards into the sample stream such that one standard was analyzed for approximately every 10 samples submitted. Results from the systematic reanalyses of samples and standards were examined to verify the effectiveness of the laboratory procedures. In general, blanks and standards indicate that the assays are of acceptable quality.
13.0 ADJACENT PROPERTIES The area of the Waterbury Project is home to a number of major uranium deposits including the Cigar Lake deposit, which lies approximately 11 kilometres southwest of the North 1 Claim Block and 11 kilometres northwest of South Claim Block respectively, and the Midwest, McClean and Rabbit Lake deposits that lie 15, 17 and 19 kilometres north, northwest, and northwest-northwest of the North 2 Claim Block respectively. In addition, a number of SMDI occurrences lie within the triangle formed by the Waterbury North 1, North 2 and South claim blocks. The most significant of these is the Sand Lake/Wolf Lake deposit (SMDI 2253) which lies midway between the Waterbury North 2 and South claim blocks. The Saskatchewan Mineral Deposit Index details for Sand Lake/Wolf Lake deposit list the deposit as being unconformity related and having a “preliminary ore reserve” calculation of 5.17 million pounds grading 2.3% U3O8. This calculation falls under the National Instrument 43-101 definition of a “historic estimate” meaning that this estimate was prepared prior to the implementation of NI 43-101 on February 1st, 2001 and does not conform to NI 43-101 standards. However, it is included in this report for reference, and to give an indication of the type and tenor of mineralisation that has been discovered outside the Waterbury Project claim blocks but otherwise in the general area of the Waterbury Project.
14.0 MINERAL PROCESSING AND METALLURGICAL TESTING
No mineral processing nor metallurgical testing were performed during the preparation of this report.
WAT2009-02 71

15.0 MINERAL RESOURCE AND RESERVE ESTIMATES
The Waterbury property does not contain any know mineral resources or reserves.
16.0 OTHER RELEVANT DATA AND INFORMATION
It is the authors’ opinion that there is no additional information or explanation necessary to make this technical report understandable and not misleading.
17.0 INTERPRETATIONS AND CONCLUSIONS.
Exploration work on the Waterbury project conducted by CanAlaska since 2005 includes airborne and ground geophysical surveys and diamond drilling in six holes totalling 1964.3 metres. This work has progressively upgraded the understanding and potential of the project and excellent drill targets have been defined on all three Waterbury project claim blocks. These targets are described below and shown in Figure 34 to Figure 37 as red dots representing the location of the target at the unconformity. Drill hole collars will different as drill holes are generally inclined to help cut stratigraphy and to accommodate down hole drill core orientation equipment Proposed targets NB1-1, NB1-2, NB1-3 and NB1-4 (North Block 1) On the Waterbury North Block 1 GEOTEM, VTEM, resistivity and FLTEM surveying have been used to define three EM conductors and spatially associated resistivity lows. These lows are interpreted to be either the signature of hydrothermal alteration or significant step or offset in the Athabasca Group unconformity. The resistivity lows and portions of the lows coincident with the FLTEM conductors represent very good drill targets and four drill holes by order of priority are proposed to test these anomalies. Proposed drill holes NB1-1 and NB1-2 are designed to test the FLTEM anomaly and adjacent Resistivity low on step-loop grid line 4. Proposed drill hole NB1-3 and one will test the coincident resistivity low and FLTEM anomaly on FLTEM line 2 while the fourth proposed hole will test the FLTEM conductor on line 3. This latter locality being located approximately 240 metres southwest of drill hole Q49-1. Figure 34 shows the trace of the plate models for each FLTEM line profile and the location of the proposed diamond drill holes on the 300 metre Resistivity depth slice.
WAT2009-02 72

Proposed targets NB2-1, NB2-2 and NB2-3 (North Block 2) Three drill holes are proposed for the North Block 2; targets for which have been developed from reinterpretations of VTEM data incorporating the results from recent drilling. The dB/dT decay curves and Conductive Depth Sections for North Block 2 VTEM anomalies are complex when examined on an individual line by line basis, and this likely contributed to an inadequate testing of this conductor during previous drilling. A reinterpretation of the VTEM data incorporating information obtained from that earlier drilling has led to the development of a model suggesting that the contact between the Aphebian metasediments and the Archean Granite (magnetic low and high respectively, Figure 35) is overturned to the north as shown on the section in Figure 36. On a district scale these contacts (which are actually structurally modified unconformities) often host anomalous radioactivity and this setting is host to a number of uranium ore bodies (specifically the Sue A to E deposits). Two drill holes (NB2-1 and NB2-2) are proposed to test this model and the mineralisation intersected in drill hole WAT-005. The first hole will test up dip of the WAT-005 mineralisation at its projection to the unconformity. The second will test down dip of this mineralisation close to its projection to the Archean contact. This fence may be extended if either of these drill holes is successful. The third proposed drill hole (NB2-3) will test the approximate centre of the 1200 metres of untested VTEM anomaly that remains on the property. Proposed targets SB-01 to SB-05 (South Block) On the South Block a GEOTEM defined conductor and data from Resistivity surveying has resulted in the development of five drill targets (Figure 37). Proposed drill hole SB-1 will target a GEOTEM anomaly where it crosses the flank of a resistivity low, while SB-2 will target a discrete Resistivity low. The last three proposed holes (SB-3, -4 and -5) will target a strong GEOTEM anomaly along 600 metres of strike length; the centre of this test being adjacent to a historical drill hole that returned of basement hosted mineralisation grading 0.12% U3O8/0.1 metres.
WAT2009-02 73

!
S-107965
Q49-1
536000
536000
537000
537000
538000
538000
539000
539000
540000
540000
541000
541000
542000
542000
6444
000
6444
000
6445
000
6445
000
6446
000
6446
000
6447
000
6447
000
6448
000
6448
000
6449
000
6449
000
6450
000
6450
000
6451
000
6451
000
6452
000
6452
000
6453
000
6453
000
104°22'30"W
104°22'30"W58
°11'15
"N
58°11
'15"N
±
0 1 20.5Kilometres
Waterbury Project
UTM NAD 83. Zone 13 Scale: 1: 40 000
Date: Oct. 28, 2009 Drawn by: TMS/AS
North Block 1Proposed Drill Holes on
Resistivity at 300 m DepthFig No:
34NTS: 074I01
Report: WAT2009-02
W a t e r b u r y L a k e
CanAlaska Uranium Ltd.
NB1-3
NB1-1
NB1-2NB1-4
Legend! Historical Drill Hole
Proposed Drill Holes
TEM conductor
Claims
Elevation contours
Lakes

!P
!P !P
P
P
P
S-107967
WAT006WAT005
WAT004
WAT003
WAT002
WAT001
549000
549000
550000
550000
551000
551000
552000
552000
553000
553000
554000
554000
555000
555000
556000
556000
557000
557000
558000
558000
6443
000
6443
000
6444
000
6444
000
6445
000
6445
000
6446
000
6446
000
6447
000
6447
000
6448
000
6448
000
6449
000
6449
000
104°5'0"W
104°5'0"W
104°10'0"W
104°10'0"W58
°10'
0"N
58°1
0'0"
N
LegendProposed Drill Holes
P 2006 Dril Holes
!P 2007 Drill Holes
Claims Location and Number
Drill Road
Contours
Swamps
Lakes
±
0 1 20.5
Kilometres
Waterbury Project
UTM NAD 83. Zone 13 Scale: 1: 40 000
Date: Aug 20, 2010 Drawn by: TMS/AS
North Block 2Proposed Drill Holes on AdTau
Fig No:35
NTS: 74I01
Report: WAT2009-02
CanAlaska Uranium Ltd.
NB2-2NB2-1
NB2-3

5536
00 E
5536
00 E
5537
00 E
5537
00 E
600 a.s.l.
6445
900
N64
4590
0 N
6446
000
N64
4600
0 N
6446
100
N64
4610
0 N
6446
200
N64
4620
0 N
6446
300
N64
4630
0 N
6446
400
N64
4640
0 N
6446
500
N64
4650
0 N
0 a.s.l.0 a.s.l.
200 a.s.l.200 a.s.l.
400 a.s.l.400 a.s.l.
600 a.s.l.
Fig No:36
0
500 1000
1500
2000
2500
3000
3500
0 2004006008001000
1200
0 200400600800
05101520
0510
0510152025303540
Lithology
U ppm
Bar Graph
Gamma Probe (cps)
Profile
LEGEND
Pegmatite
Graphitic Pelite
Granite Gneiss
Biotite Gneiss
MFb
MFc
Overburden
Granitic G
neiss
Biotite Gneiss
Biotite Gneiss
50 m
100
150
200
250
300
WAT001
50 m
100
150
200
250
300
WAT002
50 m
100
150
200
250
300
WAT004
Unconformity
Cross Section
WAT001-002-004
Waterbury Project
Scale 1 : 5000NAD83 / UTM zone 13N
Date: Feb. 10, 2010 Drawn by: AS Report: WAT2009-02
W
S
E
N
AZIMUTH = 159.7°
TOLERANCE +/- 42.1 m
SECTION TOP, BOT 557.20 m -14.69 m
EXTENTS 832 m 571.90 m
REF. PT. E, N 553690 m 6446200 m
SECTION SPECS:

!
!
!!!
!
8200
7400
7800
7000
8600
6200
6600
5000
9000
9400
5400
5800
9800
S-107999
6200
6600
5000
9000
9400
5400
5800
9800
8200
7400
7800
7000
8600
ROO-4-81ROO-3-81
ROO-2-81
SOD-255
SOD-254
532000
532000
533000
533000
534000
534000
535000
535000
536000
5360006424
000
6424
000
6425
000
6425
000
6426
000
6426
000
6427
000
6427
000
6428
000
6428
000
6429
000
6429
000
6430
000
6430
000
6431
000
6431
000
58°0
'0"N
58°0
'0"N
±
0 0.5 10.25Kilometres
Waterbury Project
UTM NAD 83. Zone 13 Scale: 1: 30 000
Date:Aug 20, 2010 Drawn by: TMS/AS
South Block Proposed Drill Holes on Resistivity
Fig No:37
NTS: 074I01
Report: WAT2009-02
ROO-1-81
CanAlaska Uranium Ltd.
SB-1
SB-2
SB-4
SB-3SB-5
LegendProposed Drill Holes
! Historical Drill Holes
GEOTEM
EM Conductors -strong
EM Conductor - weak to mod
2007 Resistivity-IP Lines
2008 Resistivity-IP Lines
Claims
Lakes

18.0 RECOMMENDATIONS
Twelve drill holes are proposed to test targets on the three claim blocks. Specifically, four drill holes are recommended to test coincidental EM and/or resistivity anomalies on the North Block 1, three drill holes are recommended to test anomalies from reinterpreted VTEM data on the North Block 2 and five drill holes are recommended to test EM and/or resistivity anomalies on the South Block. This proposed program comprises 4,200 metres of drilling. The locations of these proposed drill holes are shown on Figure 34, Figure 35, and Figure 37. UTM coordinates of the targets at the Athabasca Group unconformity and descriptions for these targets are listed in Table 15. Table 15. Coordinates of target recommended for drill testing Proposed
Hole # UTM
N UTM
E Target description Est. u/c
depth/EOH
North Block 1 NB1-1 537921 6449044 250/350 FLEM anomaly on Line 4, 1270N NB1-2 537941 6449261 250/350 Centre of resistivity anomaly NB1-3 540582 6450226 250/350 FLEM and coincidental resistivity anomaly on Line
2, 1780N NB1-4 539000 6449200 250/350 FLEM anomaly on Line 3,1470N North Block 2 NB2-1 554087 6446690 200/300 Mineralisation and graphite up dip of WAT-005
intersection. NB2-2 554087 6446483 200/300 Mineralisation and graphite down dip of WAT-005
intersection. NB2-3 552914 6446030 200/300 Centre of 1200 m untested VTEM anomaly South Block SB-1 534382 6429119 235/340 GEOTEM line 2015001 and corresponding
resistivity low, 117 m SE of SOD-255 SB-2 534932 6429842 235/335 Centre of resistivity ‘plume’. SB-3 533312 6428508 256/355 GEOTEM line # 2011001 SB-4 533462 6428761 247/350 GEOTEM line # 2012001, 236 m SE of ROO-2-81
(0.12% U3O8/0.1 m) SB-5 533676 6428980 242/340 GEOTEM line # 2013001
Budget estimate: The estimated cost for carrying out the proposed exploration program on the Waterbury Project is $1,552,000 and breakdowns of these expenses are contained in Table 16.
WAT2009-02 78

Table 16. Cost estimates for recommended program.
Category % Amount
General office; labour, travel management, audit and insurance
5.9% $83,500
Camp costs and operations 16.0% $225,500 Management travel 0.1% $2,000 Geology; core logging, compilation and reports 12.4% $175,500 Geochemistry; core and SWIR spectrometre 2.6% $37,000 Geophysics; CVV, probing, down hole TDEM 10.1% $143,000 Physical activity, line cutting, trail and road building 2.1% $30,000 Drilling; includes mob-demob, fuel, core orientation 48.3% $682,000 Environment and safety; reclamation, inspection, community 2.3% $32,500 Sub-Total 100% $1,411,000 Contingency 10% $ 141,000 TOTAL $1,552,000
WAT2009-02 79
19.0 REFERENCES Acme Analytical Laboratories, (2009), http://acmelab.com/services/quality-control/ Bishop, J., Bzdel, L., Wasyliuk, K., (2003). Saskatchewan Energy and Resources Assessment Report # 74H16-NW-0075, Cameco Corporation, Saskatoon, Saskatchewan. Chen, B., (2006). Geophysical Report-moving loop UTEM-3 survey for CanAlaska Uranium Ltd./North West Minerals Ventures Inc. S.J.V. Consultants Ltd., Delta, BC. Devlin, L. and Chen, B, (2006) Geophysical Report 3D Res and MaxMin Surveys on the Waterbury Project for CanAlaska Uranium Ltd. and NW Minerals. Gilboy, C.F. (1983): Geology of the Sub-Athabasca Basement, Pasfield Lake Area (74 I); in Summary of Investigations 1983: Saskatchewan Geological Survey, Sask. Dep. Miner. Resour., Misc. Rep. 83-4, 148p. Quaternary Geology of the Pasfield Lk Area (74-I), Open File 84-15 (1984). Hoffman, P. (1990): Subdivision of the Churchill Province and extent of the Trans-Hudson Orogen; in The Early Proterozic Trans-Hudson Orogen of North America, J.F. Lewry and M.R. Stauffer (eds.): Geological Society of Canada, Special Paper 37, pp.15-40. Infomine (2009). http://www.infomine.com/commodities/uranium.asp Irving, R., (2006). Report on Processing and Analysis of a GEOTEM EM & Magnetic Survey; Waterbury North, Waterbury South I, Waterbury South II; Athabasca Basin, Saskatchewan for CanAlaska Uranium Ltd/Northwest Mineral Ventures Inc., February, 2006. Jamieson, B.W., and Spross, J., 2000, The Exploration and Development of the High Grade McArthur River Uranium Orebody, Fachaufsatze, Erzmetall: Gesellschaft für Bergbau, Metallurgie, Rohstoff- und Umwelttechnik (GDMB), H14503, No. 7/8, p. 457-469. Jefferson, C.W. and Delaney, G. (2006): EXTECH IV: Geology and Uranium EXploration TECHnology of the Proterozoic Athabasca Basin, Saskatchewan , and Alberta; Geological Survey of Canada Bulletin 588, Saskatchewan Geological Society Special Publication 18 and Mineral Deposits Division (GAC) Special Publication 4, 644p. Felix, R., (1981). Saskatchewan Energy and Resources Assessment Report # 74H16-NW-0046, Bernick Lake area. Noranda Exploration Company (NPL), Toronto Ontario.
WAT2009-02 80
Marquis, G and Schimann, K. (2009). Geophysics Report; Waterbury project. Claim # S-107965, S-107967, S-107999. Saskatchewan, Canada. Internal report for CanAlaska Uranium Ltd., report # WAT2009-01, June 2009. Medcalf, S., (2008). Logistical Report on a DC-Res Survey, Waterbury Project, Northern Saskatchewan, for CanAlaska Uranium Ltd. Vancouver, BC. Date of work November 27 to December 12, 2007, and March 19 to 29, 2008. Date of report August 8, 2008 Medcalf, S., (2008). Geophysical Report on a Fixed Loop Transient EM Survey, Waterbury Project; Northern Saskatchewan, for CanAlaska Uranium Ltd. Vancouver, BC. Date of work December 12 to December 22, 2007. Date of report May 14, 2008. Quirt, D., H., (2003). Athabasca unconformity-type uranium deposits: one deposit type with many variations: Uranium Geochemistry 2003, International Conference, Nancy, France, April 13-16 2003, Proceedings, p. 309-312. Quirt, D., and Wasyliuk, K., (2006): Mineralogical Methods for Uranium Mineralisation in the Athabasca Basin; (slide 43 and 53). CIM 2006 Field Conference September 2006. Ramaekers, P., Yeo, G., and Jefferson, C.W. (2001): Preliminary overview of regional stratigraphy in the Late Paleoproterozoic Athabasca Basin, Saskatchewan and Alberta; in Summary of Investigations 2001, Volume 2: Saskatchewan Geological Survey, Sask. Energy Mines, Misc. Rep. 2001-4.2, p. 240-251. Reed, L.E., (2006): Notes on the Waterbury Airborne EM Surveying. Internal memo for CanAlaska Uranium Ltd. Roy, C., et. al, (1985). Saskatchewan Energy and Resources Assessment File Number: 74I01-0076; Waterbury Lake area. Saskatchewan Mining and Development Corporation, Saskatoon, Saskatchewan . Schreiner, B.T. (1984), Open File 84-15; Quaternary Geology of the Precambrian Shield (Pasfield Lake Area, NTS 74I), Saskatchewan. Sibbald, T.I.I. (1985): Geology and Genesis of the Athabasca Basin Uranium Deposits, in Macdonald, R., Sibbald, T.I.I., and Paterson, D.F., eds., Summary of Investigations, 1985, Saskatchewan Geological Survey: Saskatchewan Energy and Mines Miscellaneous Report 85 – 4, p. 153 – 156. Slimmon, W. L. (2005): EXTEC IV, Geologic Atlas of Saskatchewan: http://www.infomaps.gov.sk.ca/website/SIR_Geological_Atlas/viewer.htm SRCLaboratories(2009). http://www.src.sk.ca/html/labs_facilities/geo_labs/index.cfm Wasyliuk, K., (2002): Petrogenesis of the kaolinite-group minerals in the eastern Athabasca basin of northern Saskatchewan: Applications to uranium mineralisation; M. Sc. Thesis, University of Saskatchewan, Saskatoon, Saskatchewan,
WAT2009-02 81

Wheatley, K., Williamson, A., Wilson, S., Tourigny, G., and Breton, G., (2006): Geology of the McClean-Sue Deposits, Areva Resources Canada Ltd., short course presentation.
WAT2009-02 82


