88
© Copyright 2011 | First Data Corporation 2010 U.S. Gift Card Consumer Insights Study March 2011

© Copyright 2011 | First Data Corporation
2010 U.S. Gift Card Consumer Insights Study
March 2011

2| © Copyright 2011 | First Data Corporation 2| © Copyright 2011 | First Data Corporation
• Overview 3• Background 4• Study Objectives 5 • Methodology 6
• Key Insights 7• Open and Closed Loop Analysis 12• Purchasers 16• Influence on Purchase 25• Gift Card Mall 30• Receivers 34• Reloading 47• E-Gift Cards 57• Incentive Effectiveness 62• Demographics 67
• Ethnicity Analysis 72• Appendix 82
Table of Contents

3| © Copyright 2011 | First Data Corporation 3|
OVERVIEW
4| © Copyright 2011 | First Data Corporation 4| © Copyright 2011 | First Data Corporation
• First Data conducts an annual market survey (Consumer Insights Study) among gift card purchasers and receivers of both closed and open loop cards
• This important study:
• Began in 2001
• Identifies market and consumer gift card trends and consumer needs and preferences
• Provides information that is shared with First Data clients and is used to help enhance their gift card programs
Background

5| © Copyright 2011 | First Data Corporation 5| © Copyright 2011 | First Data Corporation
• The primary objective of the Consumer Insights Study is to examine market and consumer trends, as well as consumers’ needs and preferences, as they relate to gift cards. The results of the study:
• Quantify the percent of the United States and Canadian populations giving/receiving gift cards (in total and by demographics)
• Identify buying behaviors associated with gift card purchasing
• Examine the gift card decision-making process
• Compare purchase behavior from 2009 to 2010
• Additional objectives among gift card receivers include:
• Evaluate the impact that gift cards have on recipient
• Identify and quantify where recipients receive gift cards from and the total number of gift cards received
• Determine the average card amount received (by store type)
• Measure the incremental financial value that any changes in consumer buying behavior have on the merchant
• Quantify uplift (i.e., overspend) by merchant type
• Evaluate the effectiveness of innovative uses for gift cards such as e-gift cards and incentive gift cards
Study Objectives

6| © Copyright 2011 | First Data Corporation 6| © Copyright 2011 | First Data Corporation
• A 20-minute web-based survey, using the e-Rewards online panel
• First Data was not identified as the study sponsor
• Fielded: September 21-29, 2010
• Respondents must:
• Be 18 years of age of older, and have purchased or received a gift card in the past 12 months
• Sample size: 2,010
• Includes over-sample of African American, Hispanic, and Asian consumers to obtain 300 completes in each demographic segment for adjunct analysis
• Data weighted to US Census Current Population Study on: age, race, gender, and education
• Additional analysis:
• An identical study among Canadian consumers (n=400); results presented in a separate report
Methodology – United States

7| © Copyright 2011 | First Data Corporation 7|
KEY INSIGHTS

8| © Copyright 2011 | First Data Corporation 8| © Copyright 2011 | First Data Corporation
Key Findings Implications
Availability of occasion-based gift cards
drive purchase decisions for some
consumers 17% would not purchase a gift card if the
appropriate occasion-based design was
unavailable.
Incorporate occasion-based gift cards for
key occasions for your business
Gift card mall popularity has increasedWhile most consumers still purchase closed
loop gift cards at a specific store, purchases at
gift card malls has increased from last year
(38% to 46% currently).
Establish or expand partnerships with gift
card mall providers to increase sales.
Key Insights – Purchasing

9| © Copyright 2011 | First Data Corporation 9| © Copyright 2011 | First Data Corporation
Key Insights – Redemption Behavior
Key Findings Implications
Over a third of those receiving gift cards
indicate they changed their purchasing plans
because of the gift card. When redeeming their gift card, 25% purchased an item
they had not planned to spend money on, 8% bought a
more expensive version of an item they already planned to
buy, and 3% purchased an item from a store they don’t
normally shop at for such an item.
Gift cards provide your locations with incremental
customers and sales.

10| © Copyright 2011 | First Data Corporation 10| © Copyright 2011 | First Data Corporation
Key Findings Implications
Closed loop prepaid card reloaders
indicate they do so to receive rewards or
for the sake of convenience. Rewards - the main reason for reloading - has
increased from 15% to 25%.
For 18% reloading is more convenient than paying
with cash and another 8% indicate reloading is more
convenient than paying with credit or debit cards
Consider using rewards to promote
reloading.
Reloading via the Internet is the preferred
method for 30% of reloaders. Although in-store reloading is the preferred method
for 70% of reloaders, 30% prefer to reload online
Internet reloading is relevant and should be
considered to encourage gift card re-use.
Reloading encourages desired behaviors
including increased frequency of store
visits and additional spending per visit35% of reloaders report visiting the store more
frequently after reloading their card; 20% spend more
per visit
Reloading encourages your customers to
spend more money at your locations;
explore ways to position your gift card as
an everyday spending card.
Key Insights – Reloading Behavior

11| © Copyright 2011 | First Data Corporation 11| © Copyright 2011 | First Data Corporation
Key Insights – E-Gift Cards
Key Findings Implications
E-gift card adoption is in its early stages Only 12% of consumers have purchased an e-gift card,
while 14% have received one
Almost all recipients of an e-gift card (98%) received it via
e-mail.
Begin to develop and implement strategies for
distributing your gift card electronically.
Experiment with distributing cards through social
media sites, your own website and other
channels to learn more about e-gift card users
and optimizing high potential sales channels.
A significant percentage say they are likely to
send an e-gift card 25% of consumers indicate they are likely to send e-gift
cards, while 43% say they are unlikely.
Those most likely to send e-gift cards value the
immediacy of delivery, ease of e-mailing,
environmental friendliness, and ease of
redemption.

12| © Copyright 2011 | First Data Corporation 12|
OPEN LOOP AND CLOSED
LOOP ANALYSIS

13| © Copyright 2011 | First Data Corporation 13| © Copyright 2011 | First Data Corporation
Prevalence of Gift Cards: 2009 vs. 2010
• Over the past year, the popularity of giving gift cards has grown. The proportion of
consumers receiving a gift card in the past year has increased significantly since
2009, though purchasing has not seen as dramatic an increase.
Trend of Total Purchasing and/or Receiving
†
†
†
† Indicates a statistically significant difference between 2009 and 2010 at the 95% confidence level

14| © Copyright 2011 | First Data Corporation 14| © Copyright 2011 | First Data Corporation
Purchasers and Receivers: Closed vs. Open Loop
• Consumers are purchasing and receiving significantly more open loop gift cards this
year than in previous years. Closed loop cards are still more frequently purchased
and received than open loop ones, despite a slight decline in 2010.
Type of Card Purchased or Received: 2009 vs. 2010
Purchasers Receivers
† Indicates a statistically significant difference between 2009 and 2010 at the 95% confidence level
††

15| © Copyright 2011 | First Data Corporation 15| © Copyright 2011 | First Data Corporation
Overlap in the Type of Gift Card Purchased or
Received
• More respondents purchased open loop gift cards in 2010 as seen in significant
increases in the Open Loop Only and Both categories. The number of respondents
only purchasing closed loop cards decreased significantly.
• More consumers are receiving both closed and open loop gift cards, while the
number of respondents receiving only closed loop cards has dropped significantly.
% of Purchasers 2009 2010
Open Loop Only 11% 14%
Closed Loop Only 64% 56%
Both 25% 30%
% of Receivers 2009 2010
Open Loop Only 14% 15%
Closed Loop Only 58% 54%
Both 28% 31%
† Indicates a statistically significant difference between 2009 and 2010 at the 95% confidence level
†
†
†
†
†
16| © Copyright 2011 | First Data Corporation 16|
PURCHASERS

17| © Copyright 2011 | First Data Corporation 17| © Copyright 2011 | First Data Corporation
Purchasers: Number of Closed and Open Loop
Purchases
Number of Cards Purchased Per Buyer
• As with previous years, open loop purchasers tend to purchase only one card while
closed loop cards have a much more varied distribution.
• The total number of cards purchased has increased in 2010, as the average
numbers of both open and closed loop gift cards have increased.
Average # of Gift Cards Purchased
2009 2010
Total 4.7 5.1
Closed Loop 4.3 4.7
Open Loop 2.4 2.8
2010 Total Purchasers n=1539
† Indicates a statistically significant difference between 2009 and 2010 at the 95% confidence level

18| © Copyright 2011 | First Data Corporation 18| © Copyright 2011 | First Data Corporation
Occasions for Purchase: Closed Loop Cards
Trend in Purchase Occasion
Closed Loop
• The proportion of customers purchasing closed loop cards for a birthday has
increased significantly while purchases for Christmas remain unchanged from last
year.
†
† Indicates a statistically significant difference between 2009 and 2010 at the 95% confidence level
RECOMMENDATION
Provide card designs that align with peak
occasions for your business.

19| © Copyright 2011 | First Data Corporation 19| © Copyright 2011 | First Data Corporation
Person for Whom Gift Card was Purchased
Trends in % of Closed Loop Gift Cards Purchased
by Recipient & Card Type
• Significantly more people purchase closed loop gift cards for other family members
in 2010 than in 2009. Other, less dramatic changes can be found with purchases for
friends and siblings.
† Indicates a statistically significant difference between 2009 and 2010 at the 95% confidence level
†

20| © Copyright 2011 | First Data Corporation 20| © Copyright 2011 | First Data Corporation
Gift Cards to be Redeemed at the Location Where
Card was Purchased
40%
35%
26%
Purchasers Believing Receiver will Use Gift Card at the Same Location Where the Card was Purchased
Yes
It's Possible
No
• 40% of purchasers believe recipients will redeem their gift cards at the particular
merchant location the card was purchased from, while almost just as many say it’s
possible.

21| © Copyright 2011 | First Data Corporation 21| © Copyright 2011 | First Data Corporation
Advance Purchase Summary
Number of Days Between Gift Card Purchase Date
And Giving Date
• For both open and closed loop cards, half of respondents purchase gift cards within
a week of giving them.

22| © Copyright 2011 | First Data Corporation 22| © Copyright 2011 | First Data Corporation
Closed Loop Purchasing by Merchant Type
% of People Purchasing Cards for Merchant Type: Trended
• As with last year, specialty retail stores and discount stores remain the top locations
for closed loop gift card purchases. Fine Dining saw a significant increase over
2009.
† Indicates a statistically significant difference between 2009 and 2010 at the 95% confidence level
†

23| © Copyright 2011 | First Data Corporation 23| © Copyright 2011 | First Data Corporation
• Purchase share in 2010 is relatively unchanged compared to 2009, though a
significant increase has been found in the dollar share for Fine Dining
establishments.
Share of Dollars by Merchant Type
Share of Dollars by Merchant Type
† Indicates a statistically significant difference between 2009 and 2010 at the 95% confidence level
†
CONCLUSION
Competition across
verticals remains
strong.
RECOMMENDATION
Look for
opportunities to
differentiate your gift
card offerings.
24| © Copyright 2011 | First Data Corporation 24| © Copyright 2011 | First Data Corporation
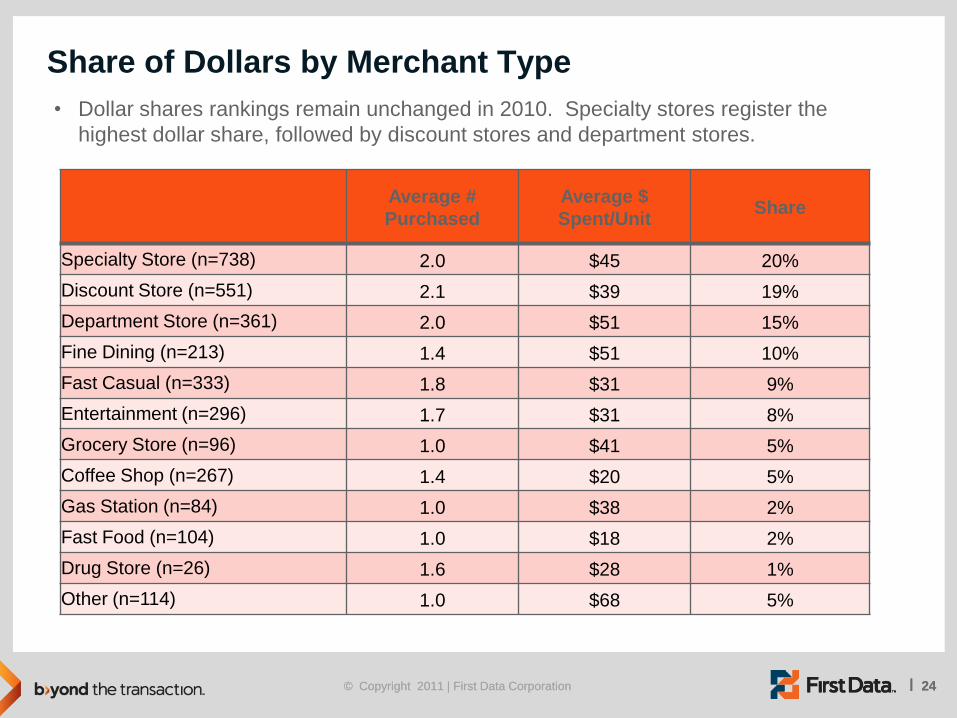
Share of Dollars by Merchant Type
Average #
Purchased
Average $
Spent/UnitShare
Specialty Store (n=738) 2.0 $45 20%
Discount Store (n=551) 2.1 $39 19%
Department Store (n=361) 2.0 $51 15%
Fine Dining (n=213) 1.4 $51 10%
Fast Casual (n=333) 1.8 $31 9%
Entertainment (n=296) 1.7 $31 8%
Grocery Store (n=96) 1.0 $41 5%
Coffee Shop (n=267) 1.4 $20 5%
Gas Station (n=84) 1.0 $38 2%
Fast Food (n=104) 1.0 $18 2%
Drug Store (n=26) 1.6 $28 1%
Other (n=114) 1.0 $68 5%
• Dollar shares rankings remain unchanged in 2010. Specialty stores register the
highest dollar share, followed by discount stores and department stores.

25| © Copyright 2011 | First Data Corporation 25|
INFLUENCES ON
PURCHASE
26| © Copyright 2011 | First Data Corporation
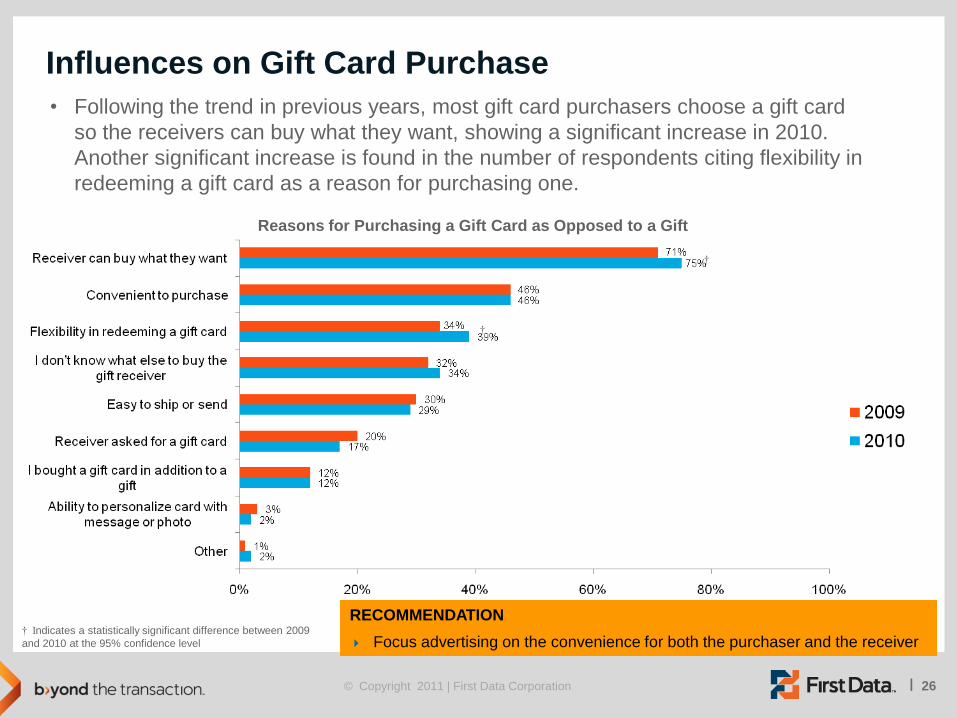
Influences on Gift Card Purchase
• Following the trend in previous years, most gift card purchasers choose a gift card
so the receivers can buy what they want, showing a significant increase in 2010.
Another significant increase is found in the number of respondents citing flexibility in
redeeming a gift card as a reason for purchasing one.
Reasons for Purchasing a Gift Card as Opposed to a Gift
† Indicates a statistically significant difference between 2009
and 2010 at the 95% confidence level
†
†
RECOMMENDATION
Focus advertising on the convenience for both the purchaser and the receiver

27| © Copyright 2011 | First Data Corporation
Importance of Card Designs on Buying Decisions
• 17% of consumers will not purchase a card from a merchant if an occasion-based
design is unavailable.
• 10% will not will not purchase a card from a merchant if an appealing design is
unavailable.
Importance of Card Designs on Buying Decisions
RECOMMENDATION
Provide card designs that align with peak occasions for your business.

28| © Copyright 2011 | First Data Corporation
Preferences for Gift Card Packaging and Add-ons
• The majority of purchasers use the packaging provided with the gift card, do not give
additional gifts with gift cards, and frequently give a greeting card when giving gift
cards.
RECOMMENDATION
Utilize greeting card area to promote gift cards
Consider carrying 1 or more premium carriers
that customers would pay for

29| © Copyright 2011 | First Data Corporation
Likelihood of Purchasing Gift Card if Item is Out-
of-Stock
• This year, half of the respondents are likely to purchase a gift card if an item is out-
of-stock. Also, a significant increase was found in those who say they are highly
likely to purchase a gift card compared to last year.
Likelihood of Purchasing Gift Card if Item is Out-of-Stock
† Indicates a statistically significant difference between 2009 and 2010 at
the 95% confidence level
†
2009: 46%
2010: 50%2009: 25%
2010: 24%
RECOMMENDATION
Include gift card displays with merchandise often bought as gifts
Use out-of-stock tags as a way to promote gift cards: “This item is
currently out of stock. Consider purchasing a gift card instead.”

30| © Copyright 2011 | First Data Corporation 30|
GIFT CARD MALL

31| © Copyright 2011 | First Data Corporation 31| © Copyright 2011 | First Data Corporation
Gift Card Purchase Location
• Gift card sales continue to shift away from merchants’ own stores and toward gift
card malls.
% of Purchasers who Bought from
Various Gift Card Locations
*Closed loop calculation: # of closed loop purchasers purchasing at least once from a gift card mall/total # of closed loop purchasers
*Open loop calculation: # of open loop purchasers purchasing at least once from a gift card mall/total # of open loop purchasers
†
†
† Indicates a statistically significant difference between 2009 and 2010 at the 95% confidence level
* Indicates a statistically significant difference between 2008 and 2009 at the 95% confidence level
ǂ Indicates a statistically significant difference between 2008 and 2010 at the 95% confidence level
†
ǂ
*
ǂ
ǂ
ǂ
RECOMMENDATION
Establish or expand relationships
with gift card mall providers to better
align with consumer behaviors and
preferences

32| © Copyright 2011 | First Data Corporation 32| © Copyright 2011 | First Data Corporation
Closed Loop Purchase Behavior: Gift Card Malls
• In the event that a particular gift card is not available at a gift card mall, fewer than
half of purchasers will end up buying the desired card – 44% will end up choosing
another gift card
If intended gift card is out-of-stock at the gift
card mall…
2009 2010
I’ll go directly to the store 31% 33%
I buy a card for the same type of store 29% 31%
I won’t purchase a gift card 19% 13%
I buy a completely different card 12% 13%
Buy the gift card online at the merchant’s website 10% 11%
†
† Indicates a statistically significant difference between 2009 and 2010 at the 95% confidence level

33| © Copyright 2011 | First Data Corporation 33| © Copyright 2011 | First Data Corporation
Location of Gift Card Mall by Card Type
• Significantly fewer people report purchasing gift cards from gift card malls located in
discount stores while significantly more people report purchasing gift cards from
malls in specialty retail stores. Other locations vary only slightly.
Location of Gift Card Mall by Card Type
† Indicates a statistically significant difference between 2009 and 2010 at the 95% confidence level
†
†

34| © Copyright 2011 | First Data Corporation 34|
RECEIVERS

35| © Copyright 2011 | First Data Corporation 35| © Copyright 2011 | First Data Corporation
Receivers: Volume of Closed and Open
• Significantly more receivers were given closed loop cards this year compared to last
and significantly fewer receivers were given open loop gift cards.
% of Open vs. Closed Loop Cards Received
† Indicates a statistically significant difference between 2009 and 2010 at the 95% confidence level
2010 Total Receivers n=1755
†
†

36| © Copyright 2011 | First Data Corporation 36| © Copyright 2011 | First Data Corporation
Trending: Average Number of Gift Cards
Received
† Indicates a statistically significant difference between 2009 and 2010 at the 95% confidence level
Trending: Average # of Gift Cards Received
• The average number of gift cards received has increased significantly in 2010. The
average number of closed loop gift cards has increased slightly, but the average
number of open loop cards remains relatively unchanged.
2010 Total Receivers n=1755

37| © Copyright 2011 | First Data Corporation 37| © Copyright 2011 | First Data Corporation
Trends in the Occasion for Which Closed Loop Gift Cards are
Received
Occasions Received: Closed Loop Gift Cards
• Birthdays and Christmas remain the most frequently cited occasions for receiving closed loop gift
cards. Incentive programs are growing in popularity as they were mentioned significantly more
frequently this year than last.
† Indicates a statistically significant difference between 2009 and 2010 at the 95% confidence level
†

38| © Copyright 2011 | First Data Corporation 38| © Copyright 2011 | First Data Corporation
Person from Whom Closed Loop Gift Card was
Received
Trends in % of Closed Loop Gift Cards Received
• Closed loop gift cards are often received from friends and various family members.
Significant increases were found in respondents receiving gift cards from other
family members and spouses.
† Indicates a statistically significant difference between 2009 and 2010 at the 95% confidence level
†
†

39| © Copyright 2011 | First Data Corporation 39| © Copyright 2011 | First Data Corporation
• This year, significant increases were found in the number of gift cards received from
both fast casual dining and fine dining, though specialty retail stores and discount
stores remain the most popular.
Closed Loop Receiving by Merchant Type
% of People Receiving by Merchant Type: Trended
†
†
† Indicates a statistically significant difference between 2009 and 2010 at the 95% confidence level

40| © Copyright 2011 | First Data Corporation 40| © Copyright 2011 | First Data Corporation
Average Gift Card Value by Merchant Type
• The average value of open loop gift cards received in 2010 has increased
significantly.
• Average card value received decreased for gas stations. Conversely, fine dining,
grocery store, and drug store card values are up significantly compared to last year.
Avg. Closed
Loop Card
Value
2009 = $39
2010 = $39
Avg. Open
Loop Card
Value
2009 = $59
2010 = $68
Average Dollar Value of Gift Cards Received by Merchant Type
† Indicates a statistically significant difference between 2009 and 2010 at the 95% confidence level
† †
†
† †

41| © Copyright 2011 | First Data Corporation
Gift Card “Overspend”
• The percentage of US respondents reporting spending more than the value of their
gift cards is the same as in 2009.
% of Respondents Spending More Than Original
Gift Card Value by Card Type
† Indicates a statistically significant difference between 2009 and 2010 at the 95% confidence level

42| © Copyright 2011 | First Data Corporation 42| © Copyright 2011 | First Data Corporation
Average Gift Card Overspend
• Department stores, grocery stores and discount stores have the highest average
overspend amounts among merchant types in the US.
*Small base size n<30; interpret with caution.

43| © Copyright 2011 | First Data Corporation 43| © Copyright 2011 | First Data Corporation
Relationship Between Issuing Merchant and
Receiver
• In some instances, gift cards can provide merchants with new customers. When
thinking about the gift card that was received most recently, 11% of gift card
receivers noted they had never or rarely visited the merchant’s locations.
% Receiving a Gift Card for a Store, Restaurant,
or Establishment that You…

44| © Copyright 2011 | First Data Corporation 44| © Copyright 2011 | First Data Corporation
Item Gift Card Was Redeemed For
• Over a third of gift card receivers changed their purchasing behavior because of the
gift card.
% Redeeming the Gift Card For…
2009: 40%
2010: 36%
† Indicates a statistically significant difference between 2009 and
2010 at the 95% confidence level
†
† †
RECOMMENDATIONS
Consumers tend to splurge when redeeming gift cards. Drive cardholders
back to your locations with advertising in the post-holiday periods.

45| © Copyright 2011 | First Data Corporation 45| © Copyright 2011 | First Data Corporation
Time Before Use of Gift Card
Time Before Gift Card is Used Up
• Gift cards for gas stations, grocery stores, and discount stores are redeemed most
quickly, typically within four weeks or less after they are received.

46| © Copyright 2011 | First Data Corporation 46| © Copyright 2011 | First Data Corporation
Gift Card Registration
• 25% of consumers have registered a gift card - the most common reason is to
protect against losing the card or having it stolen.

47| © Copyright 2011 | First Data Corporation 47|
RELOADING

48| © Copyright 2011 | First Data Corporation 48| © Copyright 2011 | First Data Corporation
Reloading Behavior
• Significantly more people report reloading gift cards in 2010
† Indicates a statistically significant difference between 2008 and 2009 at the 95% confidence level
†

49| © Copyright 2011 | First Data Corporation 49| © Copyright 2011 | First Data Corporation
Reasons for Not Reloading Gift Card
• Continuing the trend from previous years, the most common reason gift card users
cite for not reloading their card is that they have no need or interest.
• Significantly more users in 2010 report they would rather pay with cash than reload
their gift card, though it is still a small percentage of respondents.
† Indicates a statistically significant difference between 2009 and 2010 at the 95% confidence level
†
†
RECOMMENDATIONS
When a customer uses a gift card, have the cashier ask if they would like to reload the card
Make it clear that the card is reloadable and explain how to reload either on the card itself or on the packaging

50| © Copyright 2011 | First Data Corporation 50| © Copyright 2011 | First Data Corporation
Reasons for Reloading Gift Card
• Significantly more respondents cited joining a rewards program as the reason for
reloading a card in 2010. Convenience and discounts are also among other
frequently cited reasons.
†
†
†
RECOMMENDATIONS
When possible, offer incentives for reloading such as rewards or discounts
Emphasize the convenience of reloading and reusing gift cards

51| © Copyright 2011 | First Data Corporation 51| © Copyright 2011 | First Data Corporation
Reloading Behavior by Merchant Type: Closed
Loop
• The percentage of consumers reloading a Coffee Shop gift card has increased
significantly; Specialty Retail Store reloading declined significantly
% Reloading by Merchant Type
†
†

52| © Copyright 2011 | First Data Corporation 52| © Copyright 2011 | First Data Corporation
Average Amount Reloaded by Merchant Type
*Small base size n<30; interpret with caution.
• Discount stores have the highest average reload amount among merchant types

53| © Copyright 2011 | First Data Corporation 53| © Copyright 2011 | First Data Corporation
Reloading Preferences
• Although the majority of respondents prefer to reload gift cards in-store, a significant
percentage would rather reload online.

54| © Copyright 2011 | First Data Corporation 54| © Copyright 2011 | First Data Corporation
Reloading: Influence on Visit Frequency
• Most people who reload gift cards visit the merchant at least once a month. Of
those who have reloaded their cards, over a third indicate the card has led them to
visit the store more frequently.

55| © Copyright 2011 | First Data Corporation 55| © Copyright 2011 | First Data Corporation
Reloading: Influence on Average Purchase
Amount
• One-fifth of gift card purchasers report spending more per visit after reloading gift
cards.

56| © Copyright 2011 | First Data Corporation 56| © Copyright 2011 | First Data Corporation
Incentives Offered for Reload
• Just over half of consumers report not being offered an incentive for reloading their
gift cards. Among those who were offered incentives, free merchandise is the most
frequently cited offer.

57| © Copyright 2011 | First Data Corporation 57|
E-GIFT CARDS
E-Gift Card Definition
e-Gift cards are gift cards that you can purchase over the Internet and the account number is sent directly to
the recipient’s email address, mobile phone or sent via text message. e-Gift cards can be used just like regular
gift cards online or in the store. Benefits of e-Gift cards include: there is no card to lose, immediate delivery
and they are safer and better for the environment.

58| © Copyright 2011 | First Data Corporation 58| © Copyright 2011 | First Data Corporation
E-Gift Card Use
• Most consumers have never purchased or received e-gift cards. However, almost all
of those who have received one received it through e-mail.

59| © Copyright 2011 | First Data Corporation 59| © Copyright 2011 | First Data Corporation
Likelihood of Sending e-Gift Cards
• Although most people still prefer to give an actual gift card, the most commonly cited
reasons for sending e-gift cards are their immediate delivery and ease to give,
receive, and redeem.
RECOMMENDATION Consider selling virtual gift cards through your website or a social networking website to
learn about the virtual card channel and increase distribution of your card

60| © Copyright 2011 | First Data Corporation 60| © Copyright 2011 | First Data Corporation
48%
27%
26%
Interest in Receiving e-Gift Card
Interested
Neither interested or uninterested
Uninterested
Interest in Receiving e-Gift Cards
• Nearly half of respondents are interested in receiving an e-Gift card.

61| © Copyright 2011 | First Data Corporation 61| © Copyright 2011 | First Data Corporation
e-Gift Card Redemption
• The majority (43%) of consumers report they would redeem e-gift cards online if they
were to receive one. However, one quarter are not sure where they would go.

62| © Copyright 2011 | First Data Corporation 62|
GIFT CARDS AS
CONSUMER INCENTIVES

63| © Copyright 2011 | First Data Corporation 63| © Copyright 2011 | First Data Corporation
Incentives Received
• A large portion of consumers report never receiving a gift card as an incentive. Of
those who have received a gift card as an incentive or promotion, the majority report
getting a free card after purchasing a particular item.

64| © Copyright 2011 | First Data Corporation 64| © Copyright 2011 | First Data Corporation
Percent Receiving Incentives by Merchant Type
*Small base size n<30; interpret with caution.
• Department stores, specialty retail stores and discount stores are cited most often
for providing gift cards as incentives.

65| © Copyright 2011 | First Data Corporation 65| © Copyright 2011 | First Data Corporation
Mean Amount of Incentives by Merchant Type
*Small base size n<30; interpret with caution.
• Gas stations provide the highest average value in their gift card related incentives
while fast food and coffee shops offer the lowest average value.

66| © Copyright 2011 | First Data Corporation 66| © Copyright 2011 | First Data Corporation
Influence of Incentives
• Over half of consumers receiving an incentive report that receiving it altered their
purchasing intentions by either spending more (31%) or by purchasing something
that wasn’t originally intended (26%).
RECOMMENDATION
Consider investing in gift cards as consumer incentives to attract customers to your
stores, increase their average spend, and promote particular items

67| © Copyright 2011 | First Data Corporation 67|
DEMOGRAPHICS

68| © Copyright 2011 | First Data Corporation 68| © Copyright 2011 | First Data Corporation
Demographics
Total
Sample
Purchasers
(a)
Receivers
(b)
Both
(c)
Products Held
Checking account 97% 96% 96% 98%
Savings account 84% 79% 79% 87%ab
Debit card 86% 84% 86% 87%
Credit card 84% 87%b 75% 86%b
Use Direct Deposit
Yes 82% 77% 80% 83%
No 17% 23%c 20% 16%
Unsure 1% 0% 0% 1%
Lower case letters represent statistically significant differences at the 95% confidence level

69| © Copyright 2011 | First Data Corporation 69| © Copyright 2011 | First Data Corporation
Demographics
Total
Sample
Purchasers
(a)
Receivers
(b)
Both
(c)
Gender
Male 49% 52% 54%c 46%
Female 51% 48% 46% 54%
Race
Caucasian 68% 67% 67% 69%
African American/Black 11% 13% 14%c 10%
Hispanic American 14% 13% 13% 14%
Asian/Pacific Islander 5% 4% 5% 5%
Native American/Alaska Native 1% 1% 0% 1%
Other 1% 2% 1% 1%
Age
18-24 13% 8% 18%ac 11%
25-34 18% 10% 18%a 19%a
35-44 18% 18% 12% 21%b
45-54 19% 23% 17% 20%
55+ 32% 41%c 35%c 29%
Lower case letters represent statistically significant differences at the 95% confidence level

70| © Copyright 2011 | First Data Corporation 70| © Copyright 2011 | First Data Corporation
DemographicsTotal
Sample
Purchasers
(a)
Receivers
(b)
Both
(c)
Employment
Employed Full-Time 52% 46% 41% 57%ab
Employed Part-Time 14% 11% 15% 14%
Not employed at this time 12% 9% 20%ac 9%
Retired 21% 30%c 23%c 18%
Refused 1% 4% 1% 2%
Marital Status
Single, never married 30% 28% 38%c 28%
Married 53% 57%b 44% 55%b
Divorced or separated 12% 11% 11% 13%
Widowed 3% 3% 5% 3%
Refused 2% 1% 2% 1%
Education
Less than high school 1% 4% 0% 1%
Graduated high school 15% 19%c 18%c 13%
Some college 43% 40% 41% 44%
Graduated college 32% 28% 33% 32%
Post-graduate 9% 9% 8% 10%
Lower case letters represent statistically significant differences at the 95% confidence level
71| © Copyright 2011 | First Data Corporation 71| © Copyright 2011 | First Data Corporation
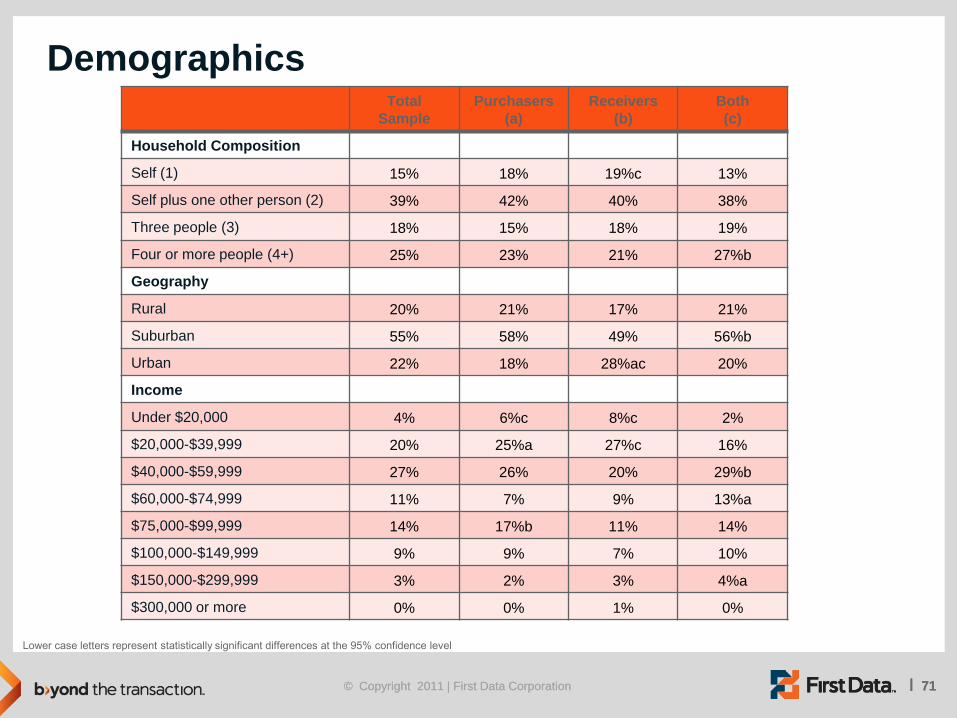
DemographicsTotal
Sample
Purchasers
(a)
Receivers
(b)
Both
(c)
Household Composition
Self (1) 15% 18% 19%c 13%
Self plus one other person (2) 39% 42% 40% 38%
Three people (3) 18% 15% 18% 19%
Four or more people (4+) 25% 23% 21% 27%b
Geography
Rural 20% 21% 17% 21%
Suburban 55% 58% 49% 56%b
Urban 22% 18% 28%ac 20%
Income
Under $20,000 4% 6%c 8%c 2%
$20,000-$39,999 20% 25%a 27%c 16%
$40,000-$59,999 27% 26% 20% 29%b
$60,000-$74,999 11% 7% 9% 13%a
$75,000-$99,999 14% 17%b 11% 14%
$100,000-$149,999 9% 9% 7% 10%
$150,000-$299,999 3% 2% 3% 4%a
$300,000 or more 0% 0% 1% 0%
Lower case letters represent statistically significant differences at the 95% confidence level

72| © Copyright 2011 | First Data Corporation 72|
ETHNICITY ANALYSIS

73| © Copyright 2011 | First Data Corporation 73| © Copyright 2011 | First Data Corporation
Average Number of Gift Cards Purchased
• Hispanics give more closed loop gift cards than any other ethnicity group. African
Americans give more open loop gift cards than other groups.
Average # of Gift Cards Purchased by Ethnicity
Lower case letters represent statistically significant differences at the 95% confidence level
*Includes
Caucasians, Native
Americans, and
other races
74| © Copyright 2011 | First Data Corporation 74| © Copyright 2011 | First Data Corporation
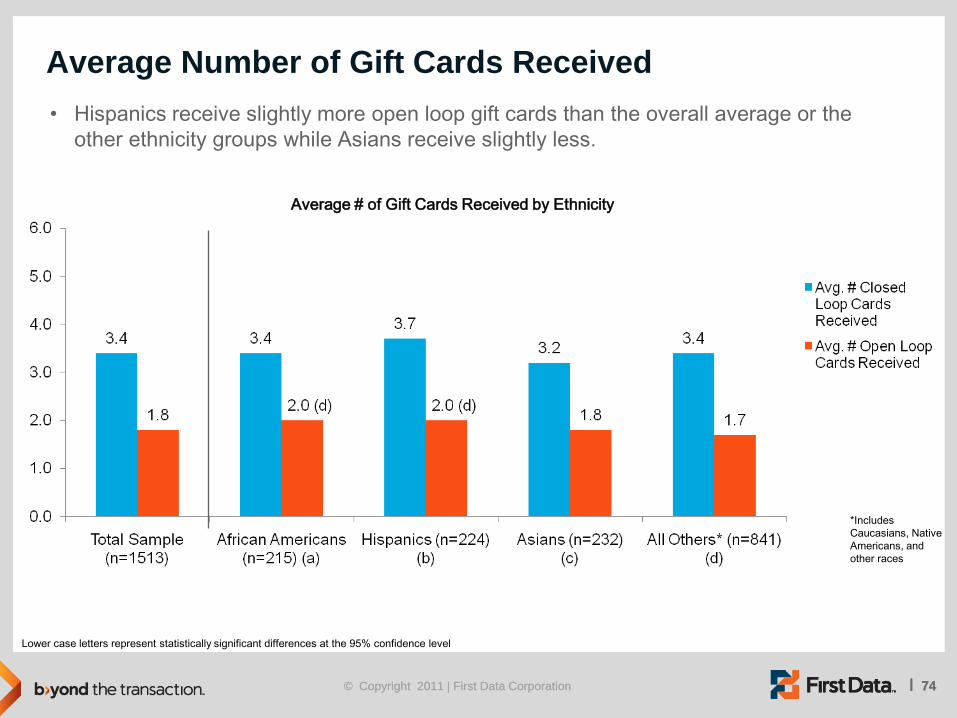
Average Number of Gift Cards Received
• Hispanics receive slightly more open loop gift cards than the overall average or the
other ethnicity groups while Asians receive slightly less.
Average # of Gift Cards Received by Ethnicity
*Includes
Caucasians, Native
Americans, and
other races
Lower case letters represent statistically significant differences at the 95% confidence level

75| © Copyright 2011 | First Data Corporation 75| © Copyright 2011 | First Data Corporation
Occasions for Purchase (Closed Loop)
• Hispanics purchased more gift cards for birthdays than other ethnic groups while the
All Others category did the same for Christmas.
Occasions for Purchase by Ethnicity (Closed Loop)
Total Sample
n=1344
African
Americans
n=179 (a)
Hispanics
n=203 (b)
Asians
n=193 (c)
All Others*
n=767 (d)
Birthday 65% 64% 75%ad 66% 62%
Christmas 50% 44% 42% 35% 54%abc
No special occasion 12% 12% 11% 16% 13%
Thank you gift 13% 11% 15% 20%bd 13%
Wedding 9% 13%d 16%d 9% 8%
Graduation 12% 18%d 20%d 16%d 9%
Mother’s Day 11% 16%d 17%d 11% 9%
Father’s Day 9% 9% 12% 6% 8%
Baby shower 8% 11% 12%d 10% 7%
Anniversary 4% 4% 3% 2% 5%
“Congratulations” 6% 6% 9%d 8% 5%
As a prize or incentive 6% 6% 9%d 3% 5%
Back-to-school 3% 3% 4% 2% 2%
Hanukkah 1% -- -- 0% 2%
Going away gift 1% 3% 0% 3%a 1%
Other holiday 8% 9% 10% 11% 8%
Lower case letters represent statistically significant differences at the 95% confidence level
*Includes Caucasians,
Native Americans, and
other races
RECOMMENDATION
Consider these
purchasing
preferences,
keeping your own
demographics in
mind, when
creating your
cards

76| © Copyright 2011 | First Data Corporation 76| © Copyright 2011 | First Data Corporation
Closed Loop Merchants
• Significantly more Hispanics purchase gift cards for discount stores than Asians and
the All Others category. Asians purchase more gift cards from coffee shops than
African Americans or Hispanics.
% of Purchases by Merchant Type & Ethnicity
Total
Sample
n=1344
African
Americans
n=179 (a)
Hispanics
n=203 (b)
Asians
n=193 (c)
All Others*
n=767 (d)
Discount Store 40% 45%c 47%cd 33% 39%
Specialty Retail Store 42% 34% 42% 43% 43%
Department Store 27% 37% 38%d 34% 24%
Fast Casual Restaurant 25% 21% 26% 19% 26%
Entertainment 23% 17% 28%a 19% 22%
Coffee Shop 20% 16% 21% 29%ad 20%
Fine Dining Restaurant 16% 17% 19% 14% 16%
Fast Food Restaurant 8% 12% 11% 6% 7%
Grocery Store 7% 6% 6% 7% 8%
Gas Station 6% 7% 3% 4% 7%b
Drug Store 2% 3% 1% 4%b 2%
Other 9% 8% 9% 13% 9%
Lower case letters represent statistically significant differences at the 95% confidence level
*Includes
Caucasians, Native
Americans, and
other races

77| © Copyright 2011 | First Data Corporation 77| © Copyright 2011 | First Data Corporation
Person For Whom Gift Card was Purchased (Closed Loop)
• Significantly more Asian purchasers buy closed loop gift cards for friends than African
Americans and the All Other category. Hispanic parents buy more closed loop gift cards
than Asian parents.
% of Gift Cards Purchased by Recipient & Ethnicity (Closed Loop)
Total
Sample
n=1344
African
Americans (a)
n=179
Hispanics
n=203 (b)
Asians
n=193 (c)
All Others*
n=767 (d)
Friend 38% 42% 50%d 58%ad 33%
Other family member 44% 44% 43% 38% 44%
Son/daughter 28% 28% 31%c 18% 29%c
Brother/sister 21% 21% 26% 18% 20%
Parent 24% 20% 27%c 13% 24%c
Spouse 11% 12% 12% 11% 10%
Co-worker 11% 15%d 20%d 18%d 8%
Self 11% 13% 8% 11% 11%
Friend of son/daughter 8% 12%d 14%d 9% 7%
Significant other 7% 11%c 8% 3% 6%
Teacher 3% 2% 3% 5% 3%
Business or store 2% -- 2% 2% 2%
Employer 2% 3% 4%d 7%d 1%
Other 4% 2% 1% 1% 6%abcLower case letters represent statistically significant differences at the 95% confidence level
*Includes
Caucasians, Native
Americans, and
other races

78| © Copyright 2011 | First Data Corporation 78| © Copyright 2011 | First Data Corporation
Method of Purchasing Gift Card by Ethnicity
• African Americans are more likely to purchase gift cards in person from gift card
malls, but less likely to purchase in person at the specific store than other ethnicities.
Method of Purchasing Closed Loop Gift Cards
Lower case letters represent statistically significant differences at the 95% confidence level*Includes Caucasians, Native Americans, and other races

79| © Copyright 2011 | First Data Corporation 79| © Copyright 2011 | First Data Corporation
Avg. Purchase Value by Merchant Type & Ethnicity
• African Americans and Hispanics tend to spend less on gift cards than Asians and
All Others except on cards for grocery stores.
Average Dollar Value of Gift Card by Merchant Type & Ethnicity
Total
Sample
n=1344
African
Americans
n=179 (a)
Hispanics
n=203 (b)
Asians
n=193 (c)
All Others*
n=767 (d)
Grocery Store $56 $60 c $65 cd $35 $55 c
Department Store $47 $47 $47 $53 abd $46
Fine Dining $54 $49 $61 ade $57 $52
Specialty Retail Store $43 $47 d $46 d $49 d $41
Gas Station $33 $24 $39 ad $47 abd $34 a
Discount Store $41 $41 $41 $40 $41
Fast Casual Dining $33 $34 d $37 d $38 $31
Entertainment $31 $33 b $29 $35 bd $31
Drug Store $32 $23 $25 a $34 ab $34 ab
Coffee Shop $21 $19 $21 $22 a $21 a
Fast Food $18 $21 d $20 d $21 d $17
Other $54 $53 $51 $54 $54
Lower case letters represent statistically significant differences at the 95% confidence level
*Includes
Caucasians, Native
Americans, and
other races

80| © Copyright 2011 | First Data Corporation 80| © Copyright 2011 | First Data Corporation
Closed Loop Gift Card “Uplift” by Demographics
• Hispanics are more likely to overspend than Asians and African Americans.
% of Respondents Spending More Than Original Gift
Card Value by Card Type & Ethnicity
Lower case letters represent statistically significant differences at the 95% confidence level
*Includes
Caucasians, Native
Americans, and
other races

81| © Copyright 2011 | First Data Corporation 81| © Copyright 2011 | First Data Corporation
Average Amount Spent Over Gift Card Value by
Merchant Type
• Asians tend to overspend more than African Americans, Hispanics, and All Others
except in discount stores, grocery stores, fine dining, and entertainment.
Total
Sample
n=1454
African
Americans
n=202 (a)
Hispanics
n=215 (b)
Asians
n=227 (c)
All Others*
n=809 (d)
Department Store $28 $29 d $32 d $34 d $25
Discount Store $25 $27 d $32 cd $23 $23
Specialty Retail Store $24 $30 d $26 d $31 d $22
Grocery Store $27 $20 $34 acd $23 $27 a
Gas Station $8 $4 $9 a $12 abd $8 a
Drug Store $10 $9 d $12 ad $22 abd $6
Fine Dining $24 $33 bd $27 d $30 d $23
Fast Casual Dining $16 $15 $17 d $21 abd $15
Fast Food $4 $7 bd $5 d $10 abd $4
Coffee Shop $6 $5 $8 ad $8 ad $5
Entertainment $13 $13 cd $18 acd $9 $12 c
Other $31 $46 $29 $38 bd $26 *Includes
Caucasians, Native
Americans, and
other racesLower case letters represent statistically significant differences at the 95% confidence level

82| © Copyright 2011 | First Data Corporation 82|
APPENDIX

83| © Copyright 2011 | First Data Corporation
Demographics by Card Type
Lower case letters represent statistically significant differences at the 95% confidence level
Gender Race
Male
(a)
Female
(b)
African
American/
Black
(a)
Hispanic
American
(b)
Asian/
Pacific
Islander
(c)
All Other
(d)
Purchasers
Purchased Closed Loop Only 58% 54% 44% 48% 55% 59%ab
Purchased Open Loop Only 15% 13% 24%d 17% 17% 13%
Purchased Both 27% 32%a 31% 35%d 28% 28%
Receivers
Received Closed Loop Only 57%b 50% 45% 50% 56% 55%a
Received Open Loop Only 15% 16% 20%d 18% 15% 14%
Received Both 28% 34%a 34% 32% 29% 31%

84| © Copyright 2011 | First Data Corporation
Lower case letters represent statistically significant differences at the 95% confidence level
Demographics by Card Type
Education
High school
or less
(a)
Some
college
(b)
Associates
degree (c)
Bachelor’s
degree
(d)
Post-
graduate
(e)
Purchasers
Purchased Closed Loop Only 73%bc 48% 57% 61%b 57%
Purchased Open Loop Only 10% 18% d 15% 9% 11%
Purchased Both 17% 34%a 28% 30%a 32%a
Receivers
Received Closed Loop Only 61% 51% 58% 52% 51%
Received Open Loop Only 15% 16% 12% 16% 13%
Received Both 24% 33% 29% 32% 36%

85| © Copyright 2011 | First Data Corporation
Lower case letters represent statistically significant differences at the 95% confidence level
Demographics by Card Type
Age
18-24
(a)
25-34
(b)
35-44
(c)
45-54
(d)
55+
(e)
Purchasers
Purchased Closed Loop Only 51% 48% 56%b 56%b 63%abcd
Purchased Open Loop Only 8% 12% 14%a 17%a 16%a
Purchased Both 41%cde 40%cde 30%e 27%e 21%
Receivers
Received Closed Loop Only 50% 44% 57%b 52%b 60%abd
Received Open Loop Only 9% 14% 15%a 21%abce 16%a
Received Both 41%cde 43%cde 28% 26% 24%

86| © Copyright 2011 | First Data Corporation
Lower case letters represent statistically significant differences at the 95% confidence level
Demographics by Card Type
Employment Marital Status
Employed
Full-Time
(a)
Employed
Part-Time
(b)
Not
employed
at this time
(c)
Retired
(d)
Single,
never
married
(a)
Married
(b)
Divorced
or
separated
(c)
Widowed
(d)
Purchasers
Purchased Closed Loop Only 52% 58% 55% 66%abc 56% 56% 56% 51%
Purchased Open Loop Only 17%bc 7% 12% 14%b 10% 16%a 15% 17%
Purchased Both 31%d 34%d 33%d 20% 34%b 28% 28% 32%
Receivers
Received Closed Loop Only 51% 50% 58%a 60%ab 52% 55% 55% 49%
Received Open Loop Only 18%bc 12% 8% 15%c 13% 15% 20%a 25%a
Received Both 31%d 38%ad 34%d 25% 36%bc 30%c 24% 26%
87| © Copyright 2011 | First Data Corporation
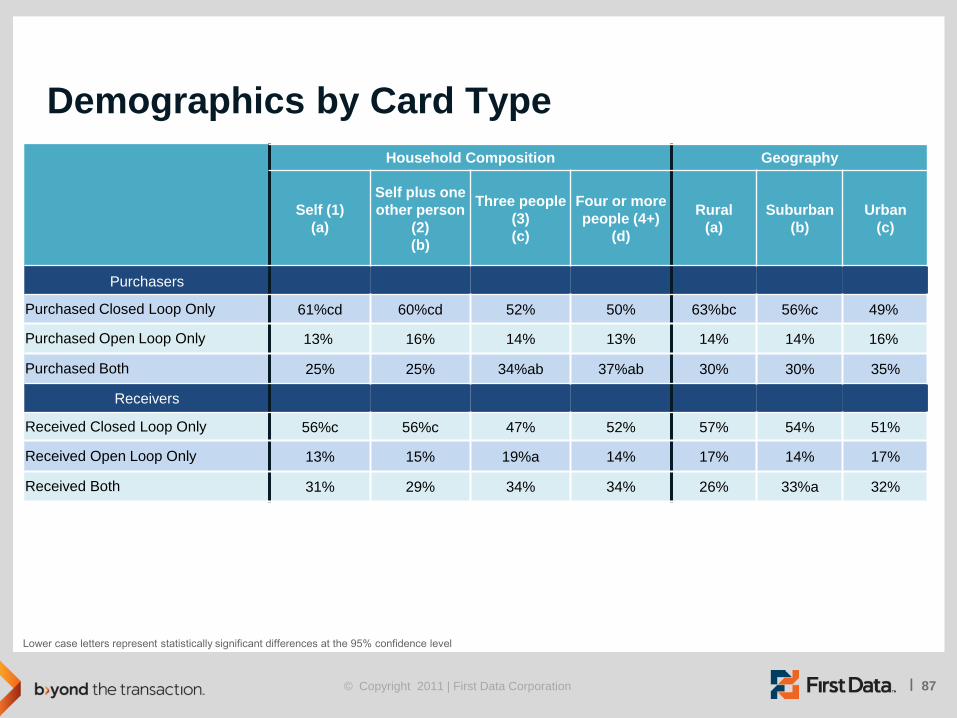
Demographics by Card Type
Lower case letters represent statistically significant differences at the 95% confidence level
Household Composition Geography
Self (1)
(a)
Self plus one
other person
(2)
(b)
Three people
(3)
(c)
Four or more
people (4+)
(d)
Rural
(a)
Suburban
(b)
Urban
(c)
Purchasers
Purchased Closed Loop Only 61%cd 60%cd 52% 50% 63%bc 56%c 49%
Purchased Open Loop Only 13% 16% 14% 13% 14% 14% 16%
Purchased Both 25% 25% 34%ab 37%ab 30% 30% 35%
Receivers
Received Closed Loop Only 56%c 56%c 47% 52% 57% 54% 51%
Received Open Loop Only 13% 15% 19%a 14% 17% 14% 17%
Received Both 31% 29% 34% 34% 26% 33%a 32%

88| © Copyright 2011 | First Data Corporation
Demographics by Card Type
Lower case letters represent statistically significant differences at the 95% confidence level
Income
Less than
50,000
(a)
$50,000-
$74,999
(b)
$75,000-
$124,999
(c)
$125,000+
(d)
Purchasers
Purchased Closed Loop Only 58%d 59%d 53% 45%
Purchased Open Loop Only 14% 15% 15% 14%
Purchased Both 28% 26% 33%b 41%ab
Receivers
Received Closed Loop Only 55% 54% 51% 52%
Received Open Loop Only 16% 15% 12% 18%
Received Both 29% 30% 38%ab 30%


