131
2011 Annual Puget Sound Energy SQI and Electric Service Reliability Report Filed on March 29, 2012

2011 Annual Puget Sound Energy
SQI and Electric Service Reliability Report
Filed on March 29, 2012

© 2012 Puget Sound Energy, Inc. All Rights Reserved
Permission of the Copyright owner is granted to users to copy, download, reproduce, transmit or distribute any part of this document provided that: (1) the user includes Puget Sound Energy's copyright notice on all copies, and (2) the materials are not used in any misleading or inappropriate manner. Furthermore, no portion of the attached work shall
be republished in printed or digital form without the written permission of the Copyright owner.

Contents 2011 Annual Puget Sound Energy SQI and Electric Service Reliability Report 3
Contents
1 Introduction ........................................................................................................................... 6 Executive Summary ................................................................................................................................................. 6 Overview of Performance ...................................................................................................................................... 8 Customer Notice of SQI Performance ............................................................................................................... 12 Changes in 2011 ..................................................................................................................................................... 12
Customer Satisfaction ............................................................................................. 14 2 UTC Complaint Ratio (SQI #2) .......................................................................................... 15
Overview ................................................................................................................................................................. 15 About the Benchmark ........................................................................................................................................... 15 Working to Prevent and Reduce UTC Customer Complaints ....................................................................... 17 Going Forward ....................................................................................................................................................... 17
3 Customer Access Center Transactions Customer Satisfaction (SQI #6)............................. 18 Overview ................................................................................................................................................................. 18 About the Benchmark ........................................................................................................................................... 18 Working to Uphold Customer Satisfaction with Customer Access Center Transactions .......................... 20 Going Forward ....................................................................................................................................................... 22
4 Field Service Operations Transactions Customer Satisfaction (SQI #8) ........................... 23 Overview ................................................................................................................................................................. 23 About the Benchmark ........................................................................................................................................... 23 Working to Uphold Customer Satisfaction with Field Service Operations Transactions .......................... 26 Going Forward ....................................................................................................................................................... 26
Customer Services .................................................................................................. 27 5 Customer Access Center Answering Performance (SQI #5) .............................................. 28
Overview ................................................................................................................................................................. 28 About the Benchmark ........................................................................................................................................... 28 Working to Uphold the Customer Access Center’s Answering Performance ............................................. 30 Going Forward ....................................................................................................................................................... 34
Operations Services ................................................................................................ 35 6 Gas Safety Response Time (SQI #7) ................................................................................... 36
Overview ................................................................................................................................................................. 36 About the Benchmark ........................................................................................................................................... 36 Working to Uphold Gas Safety Response Time ............................................................................................... 38 Going Forward ....................................................................................................................................................... 38

Contents 2011 Annual Puget Sound Energy SQI and Electric Service Reliability Report 4
7 Electric Safety Response Time (SQI #11) ........................................................................... 39 Overview ................................................................................................................................................................. 39 About the Benchmark ........................................................................................................................................... 39 Working to Decrease Electric Safety Response Time ...................................................................................... 41 Going Forward ....................................................................................................................................................... 41
8 Appointments Kept (SQI #10) ............................................................................................. 42 Overview ................................................................................................................................................................. 42 About the Benchmark ........................................................................................................................................... 43 Working to Maintain the Percentage of Appointments Kept ......................................................................... 44 Going Forward ....................................................................................................................................................... 44
9 Customer Construction Services Department and Service Provider Performance ............. 45 Customer Construction Services Department ................................................................................................... 45 Service Provider Index (SPI) Performance ........................................................................................................ 46 Actions Taken to Improve Customer Satisfaction with the New Customer Construction Process ........ 52 Going Forward ....................................................................................................................................................... 54
10 Service Guarantees ............................................................................................................... 55 Overview ................................................................................................................................................................. 55 2011 Service Guarantees Credits ......................................................................................................................... 56
Electric Service Reliability ..................................................................................... 58 11 SAIFI (SQI #4) .................................................................................................................... 60
Overview ................................................................................................................................................................. 60 What Influences SAIFI ......................................................................................................................................... 62 Historical Trends for SAIFI ................................................................................................................................. 63
12 SAIDI (SQI #3) .................................................................................................................... 65 Overview ................................................................................................................................................................. 65 What Influences SAIDI? ....................................................................................................................................... 67 Historical Trends for SAIDI ................................................................................................................................ 69
13 About Electric Service Reliability Measurements and Baseline Statistics .......................... 71 Overview ................................................................................................................................................................. 71 Baseline Year ........................................................................................................................................................... 72 Major Events ........................................................................................................................................................... 72 Areas of Greatest Concern ................................................................................................................................... 73 Customer Electric Reliability Complaints .......................................................................................................... 74 Working to Uphold Reliability ............................................................................................................................. 75 Going Forward ....................................................................................................................................................... 81

Contents 2011 Annual Puget Sound Energy SQI and Electric Service Reliability Report 5
Appendices ............................................................................................................. 84 A Monthly SQI Performance .................................................................................................... 85
Attachment A to Appendix A—Major Event and Localized Emergency Event Days (Affected Local Areas Only) ................................................................................................................................ 88 Attachment B to Appendix A—Major Event and Localized Emergency Event Days (Non-Affected Local Areas Only) ....................................................................................................................... 90 Attachment C to Appendix A—Gas Reportable Incidents and Control Time ........................................... 92
B Certification of Survey Results .............................................................................................. 94 C Penalty Calculation (Not Applicable for 2011) ..................................................................... 95 D Proposed Customer Notice (Report Card) ........................................................................... 96
2011 Service Quality Report Card ....................................................................................................................... 96 E Disconnection Results by Month ......................................................................................... 99 F Customer Service Guarantee Performance Detail ............................................................. 100 G Customer Awareness of Customer Service Guarantee ....................................................... 105 H Electric Reliability Terms and Definitions......................................................................... 107
Terms and Definitions ........................................................................................................................................ 107 I Electric Reliability Data Collection Process and Calculations .......................................... 111
Data Collection—Methods and Issues ............................................................................................................. 111 Change in Definitions and Calculations ........................................................................................................... 113 Areas of Greatest Concern ................................................................................................................................. 115 Exclusion Events.................................................................................................................................................. 115
J Current Year Electric Service Outage by Cause by Area ....................................................116 K Historical SAIDI and SAIFI by Area ...................................................................................118 L 1997-Current Year PSE SAIFI and SAIDI Performance by Different Measurements ........119 M Current-Year Commission and Rolling-Two-Year PSE Customer Electric Service
Reliability Complaints with Resolutions ............................................................................ 122 N Areas of Greatest Concern with Action Plan ..................................................................... 125 O Current Year Geographic Location of Electric Service Reliability Customer Complaints on
Service Territory Map with Number of Next Year’s Proposed Projects and Vegetation-Management Mileage .......................................................................................131

Chapter 1: Introduction 2011 Annual Puget Sound Energy SQI and Electric Service Reliability Report 6
1 Introduction
Executive Summary
As Washington state’s oldest and largest energy utility, with a 6,000-square-mile service territory stretching across 11 counties, Puget Sound Energy (PSE) serves more than 1 million electric customers and over 750,000 natural gas customers primarily in the Puget Sound region of Western Washington. PSE meets the energy needs of its customer base through incremental, cost-effective energy efficiency, procurement of sustainable energy resources and far-sighted investment in the energy-delivery infrastructure. PSE employees are dedicated to providing quality customer service and to delivering energy that is safe, dependable, efficient and environmentally responsible.
Background
PSE first implemented its Service Quality Index Program (the SQI Program) when the Washington Utilities and Transportation Commission (UTC) authorized the merger of Washington Natural Gas Company and Puget Sound Power & Light Company in 1997.1 The stated purpose of the SQI Program was to “provide a specific mechanism to assure customers that they will not experience deterioration in quality of service” and to “protect customers of PSE from poorly-targeted cost cutting.” The SQI Program has been further extended2 with various modifications to demonstrate PSE’s continuous commitment to customer protection and quality service.
Service Quality Index Program
The SQI Program includes three components:
• Customer Service Guarantee—The Customer Service Guarantee (CSG) provides for a $50 missed appointment credit3 for both natural gas and electric service. This guarantee became effective in 1997.4
• Restoration Service Guarantee—The Restoration Service Guarantee (RSG) provides for a $50 electric outage restoration credit to a qualified PSE electric customer.5 This guarantee was established in 2008.
1 Under consolidated Docket Numbers UE-951270 and UE-960195 2 Under consolidated Docket Numbers UE-011570, UG-011571, UE-072300 and UG-072301 3 As outlined in PSE’s tariff (Schedule 130) 4 Under consolidated Docket Numbers UE-951270 and UE-960195; the last update of the tariff was approved on January 26, 2000, under Docket Numbers UE-000027 and UG-000028. 5 The specific terms and application of the $50 electric outage restoration credit to a qualified customer are described in electric tariff Schedule 131. This guarantee was part of the SQI settlement agreement in Order 12 in consolidated Docket Numbers UE-072300 and UG-072301.

Chapter 1: Introduction 2011 Annual Puget Sound Energy SQI and Electric Service Reliability Report 7
• Service Quality Index (SQI)—PSE reports annually to the UTC on nine SQIs in this document. This document explains the SQIs, how they are calculated and PSE’s performance on each of the SQIs.
In addition to these three components, the SQI program also prescribes additional reporting requirements for PSE’s primary service providers. Several Service Provider Indices (SPIs) benchmark performances in areas of construction standards compliance, customer satisfaction reliability/service restoration and kept appointments. Finally, the SQI program includes PSE’s gas emergency response plans for outlying areas, which are filed concurrently with this Report as Attachment B to the annual UTC SQI and Electric Service Reliability filing.
SQI and Electric Service Reliability Report
This 2011 Annual Puget Sound Energy SQI and Electric Service Reliability Report meets the PSE’s SQI program reporting requirements6 and the electric service reliability reporting requirements set forth by the UTC.7,8
To facilitate external review of PSE’s SQI and Electric Service Reliability performance, the two areas were combined starting with the 2010 plan-year report.9
6 The performance benchmark, calculation and reporting of each of the Service Quality Indices (SQIs) in this Report reflect all modifications regarding SQI mechanics stipulated in the Twelfth Supplemental Order of Docket Numbers UE-011570 and UG-011571, Orders 1 and 2 of UE-031946, and Orders 12, 14, 16 and 17 of consolidated Docket Numbers UE-072300 and UG-072301. 7 The Electric Service Reliability section of this Report reflects all of PSE’s electric service reliability reporting requirements outlined in Docket No. UE-110060 and in the following sections of the electric service reliability WAC:
• WAC 480-100-388, Electric service reliability definitions • WAC 480-100-393, Electric service reliability monitoring and reporting plan • WAC 480-100-398, Electric service reliability reports
8 Two PSE commitments regarding the preparation of the Electric Service Reliability section, as outlined in Section F, Reporting of Customer Compliant Information, of Appendix D to Order 12 of consolidated Docket Numbers UE-072300 and UG-072301 (Section F), are also satisfied in this annual report. 1) Chapter 13, Customer Electric Reliability Complaints section describes how the customer complaint information is used in PSE’s circuit reliability evaluation. Appendix M details PSE’s actions to resolve these complaints. 2) Prior to the filing of each annual report, PSE has been inviting UTC Staff and Public Counsel to discuss the format and content of the Electric Service Reliability section since the adoption of Order 12. However, as agreed to by Public Counsel, UTC Staff and PSE at the March 13, 2012 meeting, an annual external review meeting of PSE’s reliability results prior to the filing is not required but if an external meeting on the format and content of PSE’s Electric Service Reliability section is called for by an external party or PSE, then Public Counsel should be invited. 9 The annual reporting of the Service Quality Index Program and the electric service reliability was due separately before the UTC by February 15 and March 31 of each year, respectively. To facilitate external review, PSE filed a petition in October 2010 to consolidate the two reporting requirements, among other petition requests. The UTC granted PSE’s petition in November 2010 (Order 17 of consolidated Docket Numbers UE-072300 and UG-072301) and the reporting consolidation became effective for the 2010 performance periods and after.

Chapter 1: Introduction 2011 Annual Puget Sound Energy SQI and Electric Service Reliability Report 8
Overview of Performance
The following table summarizes PSE’s 2011 SQI and Electric Service Reliability performance along with relevant service providers’ performance metrics and the two service guarantees.
Key Measurement Type of Metric Benchmark/Description 2011 Performance Results
Achieved
Customer Satisfaction
UTC Complaint Ratio Service Quality Index #2
No more than 0.40 complaints per 1,000 customers, including all complaints filed with the UTC
0.28
Customer Access Center Transaction Satisfaction
Service Quality Index #6
At least 90% satisfied (rating of 5 or higher on a 7-point scale)
95%
Field Services Operations Transaction Satisfaction
Service Quality Index #8
At least 90% satisfied (rating of 5 or higher on a 7-point scale)
96%
Service Provider Satisfaction—Pilchuck10
Service Provider Index #2A
At least 84% satisfied (rating of 5 or higher on a 7-point scale)
85%
Service Provider Satisfaction—Quanta Electric
Service Provider Index #2B
At least 77% satisfied (rating of 5 or higher on a 7-point scale)
81%
Service Provider Satisfaction—Quanta Gas11
Service Provider Index #2C
At least 84% satisfied (rating of 5 or higher on a 7-point scale)
87%
Customer Service
Customer Access Center Answering Performance
Service Quality Index #5
At least 75% of calls answered by a live representative within 30 seconds of request to speak with live operator
77%12
10 Pilchuck statistics are from January–March 2011. 11 Quanta Gas statistics are from April–December 2011. 12 Starting in the 2010 annual SQI reporting, the performance, result shown excludes calls abandoned within 30 seconds. The calculation change was proposed in PSE’s 2009 SQI annual report and agreed to by UTC staff and Public Counsel via their e-mails to PSE on April 1, 2010.

Chapter 1: Introduction 2011 Annual Puget Sound Energy SQI and Electric Service Reliability Report 9
Key Measurement Type of Metric Benchmark/Description 2011 Performance Results
Achieved
Operations Services—Appointments
Appointments Kept Service Quality Index #10
At least 92% of appointments kept
100%13
Service Provider New Customer Construction Appointments Kept—Pilchuck
Service Provider Index #3A
At least 98% of appointments kept
100%13
Service Provider New Customer Construction Appointments Kept—Quanta Electric
Service Provider Index #3B
At least 98% of appointments kept
100%13
Service Provider New Customer Construction Appointments Kept—Quanta Gas
Service Provider Index #3C
At least 98% of appointments kept
100%13
Customer Service Guarantee Service Guarantee #1
A $50 credit to customers when PSE fails to meet a scheduled SQI appointment
$14,400
Operations Services—Gas
Gas Safety Response Time Service Quality Index #7
Within 55 minutes from customer call to arrival of field technician
29 minutes
Secondary Safety Response Time—Pilchuck
Service Provider Index #4A
Within 60 minutes from first response assessment completion to second response arrival
51 minutes
Secondary Safety Response Time—Quanta Gas
Service Provider Index #4D
Within 60 minutes from first response assessment completion to second response arrival
53 minutes
Service Provider Standards Compliance—Pilchuck
Service Provider Index #1A
At least 95% compliance with site audit checklist points
99%
Service Provider Standards Compliance—Quanta Electric
Service Provider Index #1B
At least 97% compliance with site audit checklist points
99%
Service Provider Standards Compliance—Quanta Gas
Service Provider Index #1C
At least 97% compliance with site audit checklist points
99%
13 Appointments kept results shown are rounded to the nearest whole percentage per UTC order. Overall, in 2011 PSE and its service providers kept 99.8% of SQI appointments. The numbers of missed appointments by energy and service type are detailed in Appendix F: Customer Service Guarantee Performance Detail.

Chapter 1: Introduction 2011 Annual Puget Sound Energy SQI and Electric Service Reliability Report 10
Key Measurement Type of Metric Benchmark/Description 2011 Performance Results
Achieved
Operations Services—Electric
Electric Safety Response Time
Service Quality Index #11
Within 55 minutes from customer call to arrival of field technician
51 minutes
Secondary Safety Response and Restoration Time—Core-Hour—Quanta Electric
Service Provider Index #4B
Within 250 minutes from the dispatch time to the restoration of non-emergency outage during core hours
234 minutes
Secondary Safety Response and Restoration Time—Non-Core-Hour—Quanta Electric
Service Provider Index #4C
Within 316 minutes from the dispatch time to the restoration of non-emergency outage during non-core hours
273 minutes
Restoration Service Guarantee
Service Guarantee #2
A $50 credit to eligible customers when a power outage is longer than 120 consecutive hours
No qualified customer or outage event
Electric Service Reliability—SAIFI & SAIDI14
Total (all outages current year) Outage Frequency—System Average Interruption Frequency Index (SAIFI)
Reliability Power interruptions per customer per year, including all types of outage event
1.07 interruptions
Total (all outages five-year average) SAIFI
Reliability Five years average of the power interruptions per customer per year, including all types of outage event
1.29 interruptions
Non-Major-Storm (<5% customers affected) SAIFI
Service Quality Index #4
No more than 1.30 interruptions per year per customer
1.02 interruptions
IEEE Non-Major-Storm (TMED) SAIFI
Reliability Power interruptions per customer per year, excluding days exceeding the TMED threshold
1.02 interruptions
14 See the Electric Service Reliability section for the calculation and Appendix H: Electric Reliability Terms and Definitions for the definition of each of the measurements

Chapter 1: Introduction 2011 Annual Puget Sound Energy SQI and Electric Service Reliability Report 11
Key Measurement Type of Metric Benchmark/Description 2011 Performance Results
Achieved
Electric Service Reliability—SAIFI & SAIDI (cont.)
Total (all outages current year) Outage Duration—System Average Interruption Duration Index (SAIDI)
Reliability Outage minutes per customer per year, including all types of outage event
163 minutes
Total (all outages five-year average) SAIDI
Service Quality Index #3
No more than 320 minutes per customer per year
281 minutes
Non-Major-Storm (<5% customers affected) SAIDI
Reliability Outage minutes per customer per year, excluding outage events that affected 5% or more customers
144 minutes
IEEE Non-Major Storm (TMED) SAIDI
Reliability Outage minutes per customer per year, excluding days exceeding the TMED threshold
144 minutes
As shown in the preceding table, PSE met all its SQI benchmarks in 2011 and no SQI penalty is assessed. Detailed SQI performance results and supplemental information can be found in the following appendices:
• Appendix A: Monthly SQI Performance—This appendix details monthly PSE SQI performance and the relevant performance of PSE’s service providers. The attachments to the appendix provide information on the major outage event and localized electric emergency event days (SQI #11) and the natural gas reportable incidents and control time. This appendix has three attachments: − Attachment A to Appendix A—Major event and localized emergency event
days (Affected local areas only) − Attachment B to Appendix A—Major event and localized emergency
event days (Non-affected local areas only) − Attachment C to Appendix A—Gas reportable incident and control times
• Appendix B: Certification of Survey Results—The independent survey company, the Gilmore Research Group, certifies that all SQI-related customer surveys were conducted with applicable guidelines and the results are unbiased and valid
• Appendix C: Penalty Calculation (Not Applicable for 2011)—This appendix is intentionally left blank since it is not applicable for the 2011 performance period
• Appendix D: Proposed Customer Notice (Report Card)—This appendix presents PSE’s proposed 2011 Customer Service Performance Report Card, which is designed to inform customers of how well PSE delivers its services in key areas to its customers

Chapter 1: Introduction 2011 Annual Puget Sound Energy SQI and Electric Service Reliability Report 12
• Appendix E: Disconnection Results by Month—This appendix provides the number of disconnections per 1,000 customers for non-payment of amounts due when the UTC disconnection policy would permit service curtailment
• Appendix F: Customer Service Guarantee Performance Detail—This appendix details annual and monthly Kept Appointments and Customer Service Guarantee payments results by appointment type
• Appendix G: Customer Awareness of Customer Service Guarantee—This appendix discusses the ways PSE makes customers aware of its Customer Service Guarantee and the results of the survey
Customer Notice of SQI Performance
Appendix D: Proposed Customer Notice (Report Card) is PSE’s proposed customer notice of PSE’s 2011 SQI performance. After consultation with the UTC and the Public Counsel Section of the Washington State Attorney General’s Office, PSE will begin distributing the final SQI report card by June 30, 2012, as part of the customer billing package.
Changes in 2011
New Service Provider
In 2010, PSE embarked on a Request for Proposal (RFP) process for the natural gas construction and maintenance services that had been performed by Pilchuck. After careful evaluation, Quanta Services (doing business as InfraSource in the PSE service area) was selected. Transition from Pilchuck to Quanta was completed at the end of first quarter 2011. At that time, Quanta Services began performing all of PSE’s electric and natural gas construction and maintenance work.
The change of the service provider does not affect the SQI #10 performance or data collection process. See further details in the Changes to the Service Provider Program in 2011 section in the Chapter 9: Customer Construction Services Department and Service Provider Performance.
Chapter 1: Introduction 2011 Annual Puget Sound Energy SQI and Electric Service Reliability Report 13
Change in Data Reporting and Data Collection
Prior to May 2011, the gas emergency response time data (SQI #7) have been stored in an Access database. To enhance security and reliability, PSE added a SAP business warehouse mechanism to store the data in May 2011. There is no change in the calculation of SQI #7 Gas Safety Response Time. The transition of the data storage mechanism from Access to the SAP business warehouse does not have any effect on PSE’s performance or data accuracy. The Update in SQI #7 Process section in Chapter 6: Gas Safety Response Time (SQI #7) provides further discussions about the transition.

Customer Satisfaction 2011 Annual Puget Sound Energy SQI and Electric Service Reliability Report 14
Customer Satisfaction
Puget Sound Energy wants to know what customers expect of the utility’s performance and services in order to address customer concerns and improve customer satisfaction. One way PSE listens to customers is by conducting customer surveys. Customers are surveyed for a variety of reasons, including their opinions about PSE overall and about specific attributes including Customer Access Center (CAC) transactions and Field Service transactions. Complaints directed to PSE or the UTC and their resolution also are considered in working toward understanding what is most important to customers.
Another tool that helps PSE analyze customer feedback is PSE’s Escalated Complaint Management System (ECMS) that was implemented in 2010. ECMS enables greater analysis of complaint data so root causes of any customer dissatisfaction may be addressed more quickly. ECMS is discussed further in Chapter 2: UTC Complaint Ratio (SQI #2) under “Working to Prevent and Reduce UTC Customer Complaints.”
This section discusses the three customer satisfaction-related service quality indexes (SQIs).
• UTC Complaint Ratio (SQI #2) • Customer Access Center Transactions Customer Satisfaction (SQI #6) • Field Service Operations Transactions Customer Satisfaction (SQI #8)
See Chapter 9: Customer Construction Services Department and Service Provider Performance for discussion of customer satisfaction with PSE’s service providers.
Chapter 2: UTC Complaint Ratio (SQI #2) 2011 Annual Puget Sound Energy SQI and Electric Service Reliability Report 15
2 UTC Complaint Ratio (SQI #2)
Overview
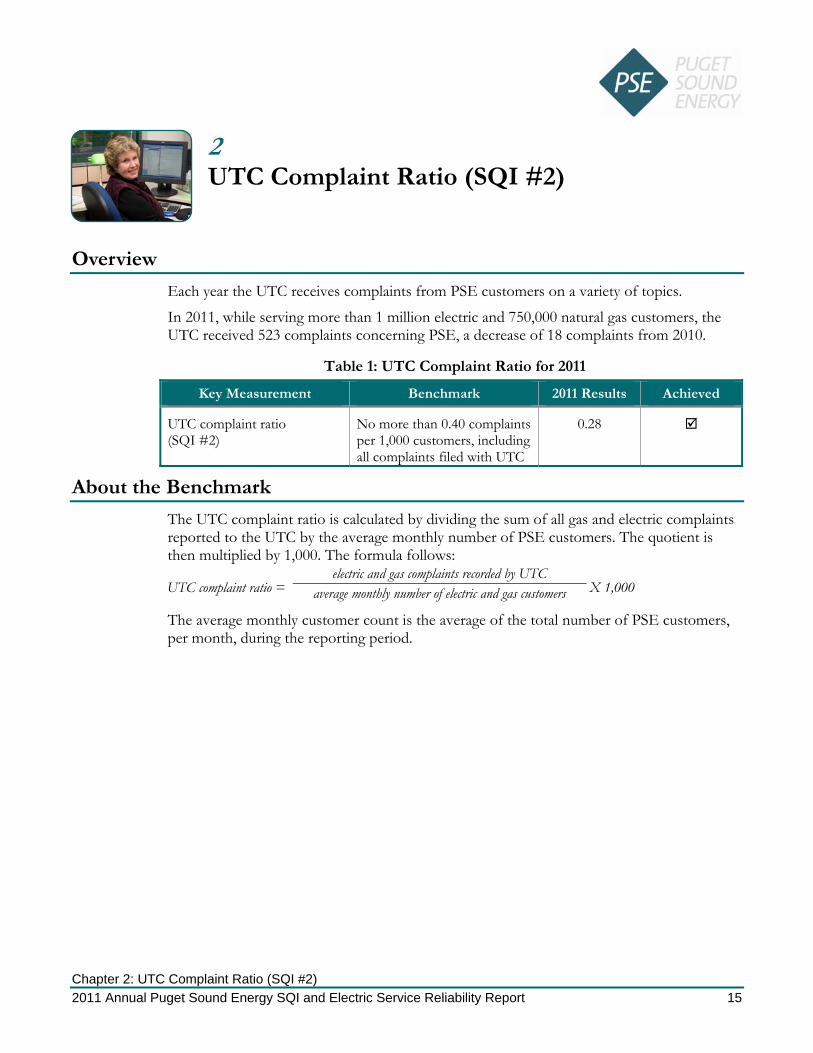
Each year the UTC receives complaints from PSE customers on a variety of topics.
In 2011, while serving more than 1 million electric and 750,000 natural gas customers, the UTC received 523 complaints concerning PSE, a decrease of 18 complaints from 2010.
Table 1: UTC Complaint Ratio for 2011
Key Measurement Benchmark 2011 Results Achieved
UTC complaint ratio (SQI #2)
No more than 0.40 complaints per 1,000 customers, including all complaints filed with UTC
0.28
About the Benchmark
The UTC complaint ratio is calculated by dividing the sum of all gas and electric complaints reported to the UTC by the average monthly number of PSE customers. The quotient is then multiplied by 1,000. The formula follows:
UTC complaint ratio = electric and gas complaints recorded by UTC
X 1,000 average monthly number of electric and gas customers
The average monthly customer count is the average of the total number of PSE customers, per month, during the reporting period.

Chapter 2: UTC Complaint Ratio (SQI #2) 2011 Annual Puget Sound Energy SQI and Electric Service Reliability Report 16
What Influences the UTC Complaint Ratio?
In 2011, complaints were distributed among seven complaint types. Although the volume changes from year to year, the distribution among the complaint types varies little. Disputed Bill and Disconnect complaint types comprised over 70 percent of the total received. This distribution has existed each year since 2008. See Table 2.
Table 2: Number of UTC Complaints by Type
Complaint Type
Complaints
2007 2008 2009 2010 2011
Construction 7 9 15 7 8
Customer service 58 34 45 33 38
Deposit 17 11 26 48 39
Disconnect 117 102 167 176 158
Disputed bill 184 235 319 219 209
High bill15 0 0 0 20 28
Quality of service 64 30 24 20 25
Other 37 21 26 18 18
Total 484 442 622 541 523
Historical Trend for the UTC Complaint Ratio
Each UTC complaint is individually assessed for unique attributes that may be indicators of opportunities to address processes for corrective and preventive actions. A daily status review is conducted related to total complaints received, any developing issues and closure rate. By analyzing each complaint individually, PSE can address the issues that first caused the complaints. Table 3 outlines the UTC complaint ratio from 2007 to 2011.
Table 3: UTC Complaint Ratio from 2007 to 2011
2007 2008 2009 2010 2011
Actual complaint ratio 0.27 0.25 0.34 0.30 0.28
Benchmark complaint ratio
0.50 complaints per 1,000 customers, including all complaints filed with UTC
0.40 complaints per 1,000 customers, including all complaints filed with UTC
15 The high bill category was added in 2010.

Chapter 2: UTC Complaint Ratio (SQI #2) 2011 Annual Puget Sound Energy SQI and Electric Service Reliability Report 17
Working to Prevent and Reduce UTC Customer Complaints
PSE works hard to address customer concerns so they do not become complaints. PSE staffs specially trained agents and supervisors to handle all customer concerns.
“Consumer Upheld” Complaints
Particular attention is paid to complaints that the UTC assessed as “Consumer Upheld.” These types of complaints identify potential process improvement opportunities for PSE. In 2011, they prompted
• Enhanced training for supervisors outside the Customer Care organization regarding their responsibilities in escalated complaints
• Improved document management processes allowing agents in the PSE Customer Access Center to provide more timely and accurate information to customers
The focus on root cause and prevention of “Consumer Upheld” complaints has resulted in a steady reduction of complaints with this disposition. See Table 4.
Table 4: Percentage of “Consumer Upheld” UTC Complaints
2007 2008 2009 2010 2011
Consumer Upheld 28% 26% 23% 16% 14%
Complaint Management
PSE’s Customer Access Center receives over 200,000 customer calls each month. More than 99 percent of the customer issues and concerns are addressed during the initial contact. On average, fewer than 400 contacts per month are escalated to a supervisor and less than 45 of these customer inquiries become a UTC complaint.
In 2010, PSE implemented the Escalated Complaint Management System that captures data concerning customer issues that were not addressed during the initial contact with PSE. ECMS enables PSE to spot complaint trends in their early stages, take preventive action sooner, and measure the effectiveness of PSE’s response.
In addition to using the ECMS, PSE trained a select group of agents to work with customers disconnected for non-pay to manage the reconnection process.
Going Forward PSE is identifying potential issues that could trigger customer complaints. The focus is on prevention of the cause of potential complaints through timely and accurate support for each customer. Areas of particular focus for 2012 include:
• Continued focus on support of the new Customer Information System (CIS) and enhancements to it. The CIS system is discussed in more detail in Chapter 3: Customer Access Center Transactions Customer Satisfaction (SQI #6)
• Continued focus on UTC “Consumer Upheld” complaints to identify root cause and establish preventive and corrective actions

Chapter 3: Customer Access Center Transactions Customer Satisfaction (SQI #6) 2011 Annual Puget Sound Energy SQI and Electric Service Reliability Report 18
3 Customer Access Center Transactions Customer Satisfaction (SQI #6)
Overview
Telephone calls to PSE go to the Customer Access Center. The CAC interfaces with the greatest number of customers and strives to establish and improve upon customer satisfaction.
Every month, the Gilmore Research Group, an independent research company, conducts telephone surveys with PSE customers and prepares monthly and semi-annual reports on customer satisfaction regarding CAC transactions. In 2011, these independent surveys found that more than 95 percent of customers surveyed were satisfied with CAC’s overall transaction performance (SQI #6).
Table 5: Customer Access Center Transactions Customer Satisfaction for 2011
Key Measurement Benchmark 2011 Results Achieved
Customer Access Center transactions customer satisfaction (SQI #6)
At least 90% satisfied (rating of 5 or higher on a 7-point scale)
95%
About the Benchmark
On a monthly basis, the Gilmore Research Group conducts phone surveys to customers who have made calls to PSE and asks the following question:
“Overall, how would you rate your satisfaction with this call to Puget Sound Energy? Would you say 7-completely satisfied, 1-not at all satisfied, or some number in between?”
A customer is considered to be satisfied if they responded 5, 6 or 7. The annual performance is determined by the monthly weighted average percent of satisfied customers. The formula for the monthly percentage follows:
Monthly percentage of satisfied customers =aggregate number of survey responses of 5, 6 or 7
aggregate number of survey responses of 1, 2, 3, 4, 5, 6 or 7

Chapter 3: Customer Access Center Transactions Customer Satisfaction (SQI #6) 2011 Annual Puget Sound Energy SQI and Electric Service Reliability Report 19
What Influences Customer Satisfaction with Customer Access Center Transactions?
A variety of influences are considered when rating customer satisfaction with the Customer Access Center’s transaction performance. The following attributes relate to customer service representatives (CSRs) while talking with the customers:
• Were polite • Were accommodating • Were professional and efficient • Listened carefully • Provided clear explanations • Were knowledgeable and helpful • Provided prompt service • Followed through on commitments discussed • Resolved the issue during the initial phone call • Answered all questions • Went the extra mile
Historical Trend for Customer Satisfaction with Customer Access Center Transactions
The following table shows customer satisfaction results from 2007 to 2011.
Table 6: Customer Access Center Transactions in Customer Satisfaction from 2007 to 2011
2007 2008 2009 2010 2011
Customer Access Center transactions customer satisfaction
92% 93% 93% 96% 95%
Benchmark 90% satisfied (rating of 5 or higher on a 7-point scale)

Chapter 3: Customer Access Center Transactions Customer Satisfaction (SQI #6) 2011 Annual Puget Sound Energy SQI and Electric Service Reliability Report 20
Working to Uphold Customer Satisfaction with Customer Access Center Transactions
Focus on Customer Service
Customer Access Center CSRs are provided with extensive coaching and training to continuously improve their performance in order to handle each customer inquiry with courtesy and adequately address the customer’s needs:
• CSRs answering customer calls are cross-trained in different disciplines to handle the vast variations of customer inquiries, including billing, emergencies, outages, web, correspondence, apartment inquiries and support (exception) queue.
• CSRs, as a group, are expected to maintain a minimum rating of 90 percent in customer satisfaction surveys as conducted by the Gilmore Research Group. The CSRs receive feedback based on the Gilmore ratings during their performance evaluation.
• Supervisors meet with each CSR for coaching sessions in order to build skills, reinforce strengths and identify future training needs.
• CSRs work to enhance customer relationships by making every effort to exceed the customer’s needs and expectations.
Quality Checks and Balances
To guarantee continuous customer satisfaction in the changing economy, processes in the Customer Access Center are constantly reviewed for accuracy, maintenance and necessary changes.
To ensure that CSRs continuously rank at the optimal level of performance a team of Quality Assurance (QA) analysts has been formed. The QA analysts continuously monitor larger processes. Monitoring involves process review, random call monitoring, coaching and performance trend reporting.
As a result of this effort the overall accuracy of the Disconnect Queue QA process has been improved by 10 percent and has provided the data needed to improve the coaching and feedback model to drive the fourth-quarter score to 94 percent.
A Performance Log has been deployed to capture and track customer compliments, concerns and issues on each agent. It is closely monitored by the leads and supervisors to ensure quality customer service. The Performance Log is able to generate reports to illustrate behavioral trends.
Chapter 3: Customer Access Center Transactions Customer Satisfaction (SQI #6) 2011 Annual Puget Sound Energy SQI and Electric Service Reliability Report 21
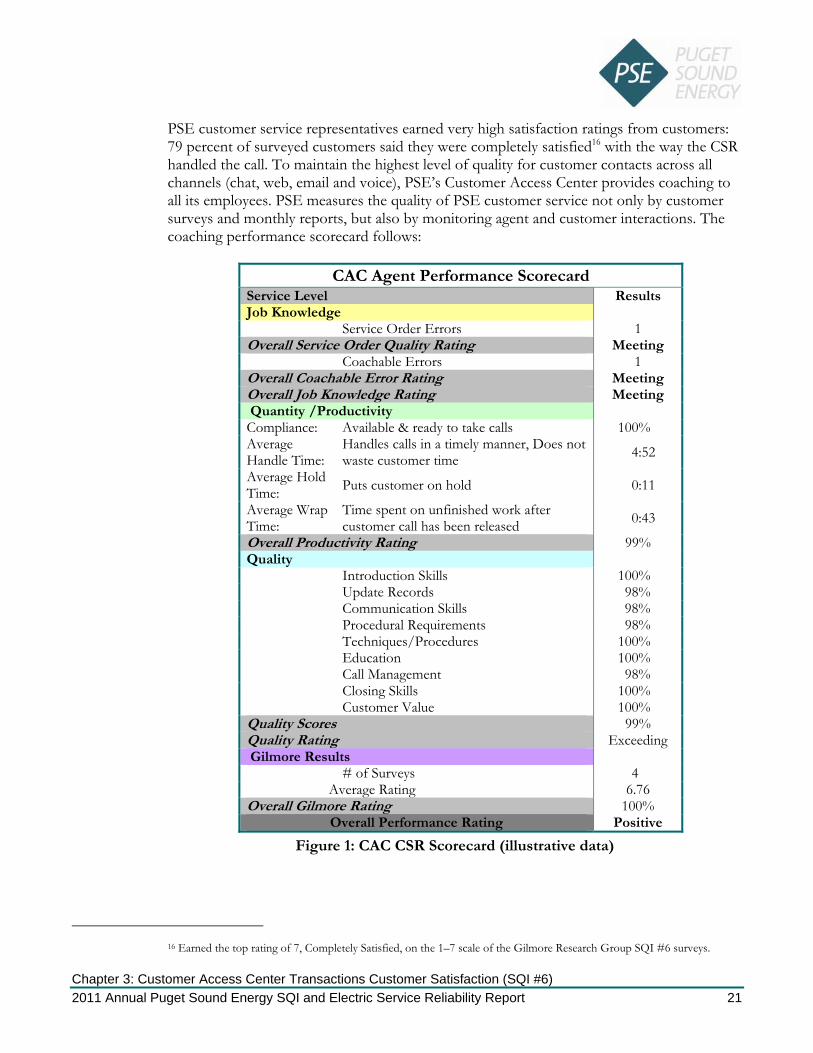
PSE customer service representatives earned very high satisfaction ratings from customers: 79 percent of surveyed customers said they were completely satisfied16 with the way the CSR handled the call. To maintain the highest level of quality for customer contacts across all channels (chat, web, email and voice), PSE’s Customer Access Center provides coaching to all its employees. PSE measures the quality of PSE customer service not only by customer surveys and monthly reports, but also by monitoring agent and customer interactions. The coaching performance scorecard follows:
CAC Agent Performance Scorecard Service Level Results Job Knowledge Service Order Errors 1 Overall Service Order Quality Rating Meeting Coachable Errors 1 Overall Coachable Error Rating Meeting Overall Job Knowledge Rating Meeting Quantity /Productivity Compliance: Available & ready to take calls 100% Average Handle Time:
Handles calls in a timely manner, Does not waste customer time 4:52
Average Hold Time: Puts customer on hold 0:11
Average Wrap Time:
Time spent on unfinished work after customer call has been released 0:43
Overall Productivity Rating 99% Quality Introduction Skills 100% Update Records 98% Communication Skills 98% Procedural Requirements 98% Techniques/Procedures 100% Education 100% Call Management 98% Closing Skills 100% Customer Value 100% Quality Scores 99% Quality Rating Exceeding Gilmore Results # of Surveys 4 Average Rating 6.76 Overall Gilmore Rating 100%
Overall Performance Rating Positive
Figure 1: CAC CSR Scorecard (illustrative data)
16 Earned the top rating of 7, Completely Satisfied, on the 1–7 scale of the Gilmore Research Group SQI #6 surveys.

Chapter 3: Customer Access Center Transactions Customer Satisfaction (SQI #6) 2011 Annual Puget Sound Energy SQI and Electric Service Reliability Report 22
PSE uses the performance scorecard to provide feedback to the CSR regarding positive behavior patterns, as well as those needing improvement. At the same time, CSRs provide feedback to the management team on the effectiveness of business processes and customers’ concerns. Ultimately, this enables PSE to make improvements to better serve customers.
Customer Access Center Earns Honorable Mention in Call Center Excellence Awards
The International Quality and Productivity Center awarded PSE’s Customer Access Center an honorable mention in the category “Best in Class Call Center with More than 200 Employees” at its Annual Call Center Excellence Awards ceremony June 15, 2011 in Las Vegas.
PSE’s Customer Access Center competed with entries submitted by companies throughout the world. Entries were judged on criteria such as customer satisfaction scores, response times, process improvements and efficiencies, and leveraging call center data to drive corporate strategic direction. PSE shared the honorable mention award with national companies Protection 1 and ING Direct USA.
The Call Center Excellence Awards program was created by the International Quality and Productivity Center to honor, recognize and promote the most innovative call center solutions and individuals each year. The program recognizes superior thinking, creativity and execution across the full spectrum of call center functions.
Going Forward
PSE recognizes that continuous improvements are required to maintain customers’ satisfaction with their PSE contact experience.
In 2011, PSE began the replacement of its Customer Information System and the new system deployment is anticipated in 2013. This system will appreciably update and upgrade the existing CIS and provide better tools to enhance customer experience. This is a significant investment and will require extensive training, change management and system changes. PSE is excited about the opportunity for a strong CIS system for the future.
Other 2012 areas of focus include:
• Expand the Quality Assurance audit process to be part of all larger processes. This expansion will assist in proactively improving Washington state regulatory compliance for accuracy and completeness of challenging processes.
• Evaluate additional ways to provide information on energy conservation and reduction of energy usage.
• Continue to promote customer participation in paperless web billing via enhancements to the PSE.com website.

Chapter 4: Field Service Operations Transactions Customer Satisfaction (SQI #8) 2011 Annual Puget Sound Energy SQI and Electric Service Reliability Report 23
4 Field Service Operations Transactions Customer Satisfaction (SQI #8)
Overview
The Gilmore Research Group, an independent research company, conducts telephone surveys with PSE customers who have called PSE that month and requested and received natural gas field service. In 2011, these surveys found that 96 percent of customers were satisfied with PSE’s Field Service Operations transaction performance. PSE met this SQI goal in 2011 and in every previous year.
Table 7: Field Service Operations Transactions Customer Satisfaction for 2011
Key Measurement Benchmark 2011 Results Achieved
Field Service Operations transactions customer satisfaction (SQI #8)
At least 90% satisfied (rating of 5 or higher on a 7-point scale)
96%
About the Benchmark
Every week, the Gilmore Research Group contacts randomly selected customers who have called PSE that month and requested and received natural gas field service. The firm prepares monthly and semi-annual reports on PSE’s Field Service Operations transaction performance.
Customers are asked a number of questions including the following question for SQI #8:
“Thinking about the entire service, from the time you first made the call until the work was completed, how would you rate your satisfaction with Puget Sound Energy? Would you say 7- completely satisfied, 1- not at all satisfied or some number in between?” A customer is considered to be “satisfied” if they responded 5, 6 or 7.
The annual performance is determined by the weighted monthly average of percent of satisfied customers. The formula for the monthly percentage follows:
Monthly percent of satisfied customers = aggregate number of survey responses of 5, 6 or 7
aggregate number of survey responses of 1, 2, 3, 4, 5, 6 or 7

Chapter 4: Field Service Operations Transactions Customer Satisfaction (SQI #8) 2011 Annual Puget Sound Energy SQI and Electric Service Reliability Report 24
What Influences Customer Satisfaction with Field Service Operations Transactions?
Many factors influence whether customers are satisfied with the natural gas field service transactions from PSE. These include whether the customer was satisfied with the customer service representative at the Customer Access Center when they called to make a service appointment and whether they were satisfied with the service performed on-site by the field technician.
Of the customers who requested natural gas field service, the most frequent reasons include customers who:
• Wanted to start or stop natural gas service • Suspected a natural gas leak or detected a natural gas odor • Had no heat or hot water, as if their furnace or water heater had quit working • Had a question about gas meters or service
Customer Satisfaction with Field Service Operations Phone Calls
Response to another question on the Gilmore Research Group gas field service survey indicated almost 96 percent of customers reported they had no trouble reaching a customer service representative, and the CSRs earned high ratings from customers (more than 97 percent were satisfied). Satisfied customers said the CSRs:
• Were courteous and friendly • Were helpful • Provided prompt service • Answered their questions • Said they would send someone right away
The customers who were less than satisfied suggested CSRs should:
• Be able to offer narrower appointment time frames • Have more information and be able to more fully answer questions • Resolve problems more quickly • Be more polite
The Customer Access Center management team also uses these findings to coach and train CAC employees to improve performance. While the types of disappointments mentioned by customers from 2010 to 2011 changed slightly, the number of customers satisfied with the way the CSR handled the case remained the same in 2011 compared to 2010.
Chapter 4: Field Service Operations Transactions Customer Satisfaction (SQI #8) 2011 Annual Puget Sound Energy SQI and Electric Service Reliability Report 25
Customer Satisfaction with Field Service Operations Transactions
Survey respondents were asked to rate their satisfaction with the natural gas field technician on several specific attributes. In general, PSE service technicians got high ratings from customers (at least 97 percent satisfied). Satisfied customers said the field technicians:
• Were friendly, courteous and polite • Were knowledgeable • Were prompt in coming to the problem area • Did a good job or fixed the problem • Were helpful • Were thorough
Satisfied customers also remarked that the technicians were professional, explained clearly what was being done and left sufficient information about the work. Customers (less than 11 percent) who gave less than a “7” rating were asked follow-up questions to determine why they were not completely satisfied. These customers said the field technicians:
• Did not fix the problem or complete the job in one trip • Were not knowledgeable or experienced
Customers who were less than completely satisfied also wanted technicians to:
• Be more knowledgeable • Arrive more quickly • Give better explanation/more information • Be friendlier
In 2011, 94 percent of customers said the technicians were able to arrive on a day and time that was convenient for the customer and 96 percent said the technician came within the time frame promised.
While the types of disappointments mentioned by customers from 2010 to 2011 remained relatively the same, the percentage of customers rating the Field Service technician’s completely satisfied (rating of 7) showed slight improvement from 86 percent in 2010 to 90 percent in 2011.

Chapter 4: Field Service Operations Transactions Customer Satisfaction (SQI #8) 2011 Annual Puget Sound Energy SQI and Electric Service Reliability Report 26
Historical Trend for Customer Satisfaction with Field Service Operations Transactions
The following table shows Field Service Operations transactions customer satisfaction from 2007–2011.
Table 8: Field Service Operations Transactions Customer Satisfaction from 2007 to 2011
2007 2008 2009 2010 2011
Field Service Operations transactions customer satisfaction
90% 91% 95% 96% 96%
Benchmark 90% satisfied (rating of 5 or higher on a 7-point scale)
Working to Uphold Customer Satisfaction with Field Service Operations Transactions
In 2011, PSE maintained a record-high customer satisfaction rating with Field Services Operations transactions. Some of the actions PSE has taken in 2011 are:
• PSE’s operations management team continues to: − Review specific information about service orders and take appropriate actions
where data indicates need for improvement − Coach and train employees to improve customer service − Thoroughly explain adjustments or repairs made to the customer’s appliance − Ensure customer’s concerns are met before leaving the premises
• Develop and utilize a new tool that tracks individual employee performance. Supervisors are able to review individual employee, workgroup and departmental metrics for each work task. This data assists supervisors in determining areas for improvement and focus on training and feedback.
Going Forward
PSE will continue to monitor customer satisfaction survey data and provide feedback to field service technicians to ensure a high level of customer service is maintained.
Additionally, PSE will continue to evaluate new tools and technologies that would enable a greater level of customer service and convenience.

Customer Services 2011 Annual Puget Sound Energy SQI and Electric Service Reliability Report 27
Customer Services
The first point of contact for most customers is PSE’s Customer Access Center. PSE devotes resources and implements creative but consistent solutions to help ensure that telephones are answered promptly, customer service representatives are well trained to appropriately handle customer requests, and customers are treated fairly and with respect with regard to disconnects for non-payment for services. To monitor and improve performance, PSE tracks many measures of customer service, including the number of calls that are answered by CSRs within 30 seconds.
This section discusses the Customer Access Center Answering Performance (SQI #5).
Chapter 5: Customer Access Center Answering Performance (SQI #5) 2011 Annual Puget Sound Energy SQI and Electric Service Reliability Report 28
5 Customer Access Center Answering Performance (SQI #5)
Overview
PSE maintains a Customer Access Center where customer service representatives answer calls promptly and attempt to provide customers with the information or help they seek, as well as providing help with emergencies 24/7/365.
The Customer Access Center’s goal is to answer 75 percent of calls within 30 seconds on an annual basis. This goal is achieved through continuous training on quality, efficient call handling and adherence to performance expectations.
In 2011, the CSRs answered 77 percent of the calls within 30 seconds of customer request.
Table 9: Customer Access Center Answering Performance for 2011
Key Measurement Benchmark 2011 Results Achieved
Customer Access Center answering performance (SQI #5)
At least 75% of calls answered by a live representative within 30 seconds of request to speak with live operator
77%
About the Benchmark
The Customer Access Center receives most of PSE’s customer inquiries and typically represents PSE to customers. A customer calling PSE has the option of going into an Interactive Voice Response (IVR) system, where they are able to perform self-serve transactions. At any time, the customer is able to press zero and be connected to a customer service representative. The Customer Access Center call answering performance is measured from the time the customer has initiated a request to speak with a CSR until the operator arrives on the line.
PSE is engaged in initiatives to ensure the Customer Access Center’s answering performance meets the performance benchmark of 75 percent. The annual performance is determined by the average of the 12 monthly call answering performance percentages. The calculation of the monthly answering performance is demonstrated through the following formula:
Monthly call answering performance =aggregate number of calls answered by a company rep within 30 seconds
aggregate number of calls received
Chapter 5: Customer Access Center Answering Performance (SQI #5) 2011 Annual Puget Sound Energy SQI and Electric Service Reliability Report 29
What Influences Customer Access Center Answering Performance?
PSE received about 4.5 million calls corporate wide in 2011. About half of these calls were customer-related issues, which were handled by customer service representatives.
Call volumes directly impact service level of the CAC answering performance. The types and volumes of incoming calls throughout the year vary and are influenced by many factors including the weather, economy, advertising and other consumer communications.
The 2011 total call volume increased slightly from 2010.
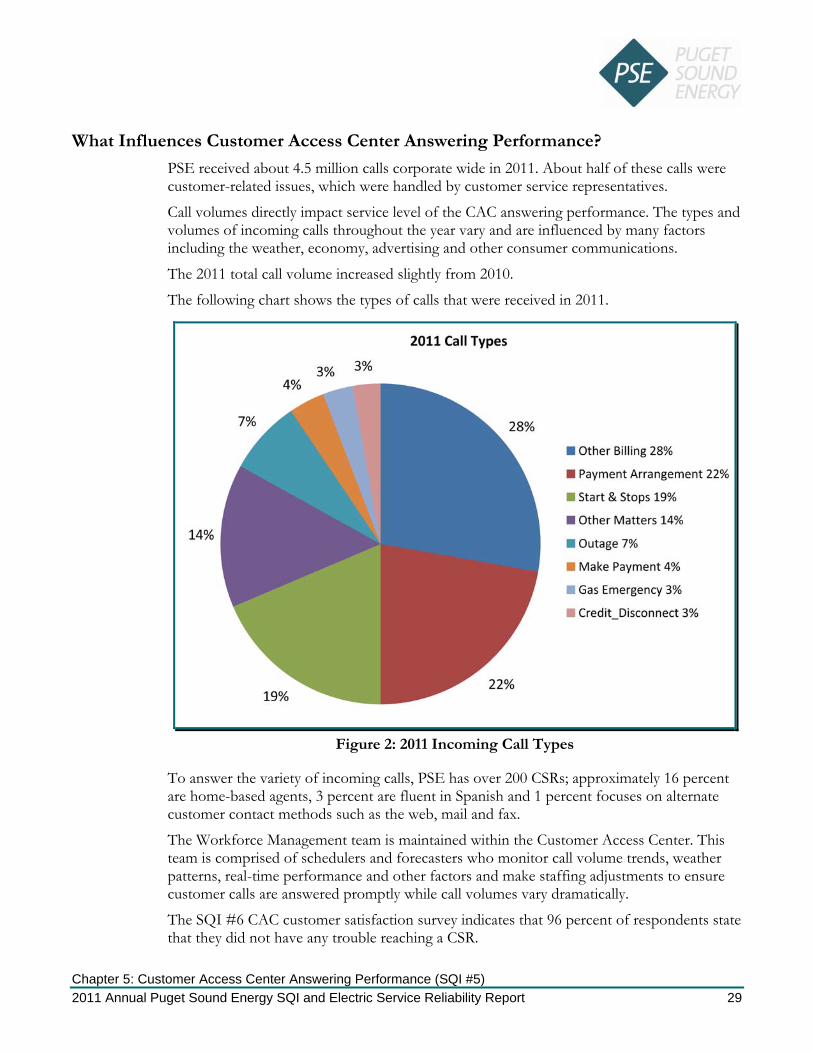
The following chart shows the types of calls that were received in 2011.
Figure 2: 2011 Incoming Call Types
To answer the variety of incoming calls, PSE has over 200 CSRs; approximately 16 percent are home-based agents, 3 percent are fluent in Spanish and 1 percent focuses on alternate customer contact methods such as the web, mail and fax.
The Workforce Management team is maintained within the Customer Access Center. This team is comprised of schedulers and forecasters who monitor call volume trends, weather patterns, real-time performance and other factors and make staffing adjustments to ensure customer calls are answered promptly while call volumes vary dramatically.
The SQI #6 CAC customer satisfaction survey indicates that 96 percent of respondents state that they did not have any trouble reaching a CSR.

Chapter 5: Customer Access Center Answering Performance (SQI #5) 2011 Annual Puget Sound Energy SQI and Electric Service Reliability Report 30
Historical Trend for Customer Access Center Answering Performance
The following table shows PSE’s Customer Access Center answering performance from 2007 to 2011.
Table 10: Customer Access Center’s Answering Performance from 2007 to 2011
2007 2008 2009 2010 2011
Customer Access Center Answering Performance
75% 77% 78% 78% 77%
Benchmark 75% of calls answered by a live representative within 30 seconds of request to speak with a live operator
Working to Uphold the Customer Access Center’s Answering Performance
The Customer Access Center strives to ensure that all CSRs are well-trained to efficiently perform their duties, ultimately providing better customer service.
To improve call answering performance, PSE’s Customer Access Center focuses on:
• Providing customers and Customer Access Center staff with technological tools, making their tasks more efficient and accurate.
• Improvements in recruiting, coaching, staffing, forecasting, training and work load management, including: − Hiring seasonal CSRs during peak months to support the high call volumes and
to mitigate the impact of labor and training costs. − Proactively scheduling CSRs based on upcoming weather events. − Maintaining a remote CSR program, through which customer service
representatives situated strategically throughout PSE’s service territory are able to respond quickly to customer calls during power outages.
− Establishing a partnership with an outside vendor to handle overflow calls during high call-volume periods.

Chapter 5: Customer Access Center Answering Performance (SQI #5) 2011 Annual Puget Sound Energy SQI and Electric Service Reliability Report 31
These actions have resulted in a more stable service level in 2010 and 2011 than in the previous two years as shown in the following graph.
Figure 3: 2008 to 2011 Customer Access Center Monthly Answering Performance
Technology Enhancements
PSE provides CSRs with technological tools that make their tasks easier to perform and more accurate.
• ImageVision creates the payment processing deposit file to send to the bank each morning. Upgrades to the ImageVision application server enhanced the processing speed, reliability and ability to recover from any hardware failure. This enhancement resulted in being able to process about 24 percent more payments by the morning deposit deadline. This efficiency expedites posting of customer payments onto their accounts.
• Phase 2 of the Cisco Systems implementation enhanced the system’s ability to route calls based on call times to the first available agent with the skill set to handle that particulate call type. The system can provide the CSRs a proactive notification on the call type they are about to receive.
• A professional voice talent has been used to improve the accuracy and quality of the Spanish prompts in the IVR phone system.
Chapter 5: Customer Access Center Answering Performance (SQI #5) 2011 Annual Puget Sound Energy SQI and Electric Service Reliability Report 32
• Workforce Management improvements: − The eWorkforce Management tool used by the Workforce Management team has
been enhanced to leverage an integrated approach to communications across the enterprise, enable more robust workforce planning capabilities, extend communication to employees through Microsoft Outlook and enhance workforce planning for back-office operations. This enhancement allows for real time adjustments to resources to ensure agents are available when customers are calling into specific queues.
− A back-office performance worksheet for forecasting and scheduling back-office operations has been implemented to provide a more efficient allocation of back-office staff, to meet service goals and better handle backlogs.
Outage Management System (OMS)
The vision of the Outage Management System is to better serve PSE’s electric customers by providing customers with more accurate outage information and responding to and resolving outages more rapidly. The project is currently in the software configuration phase. At the same time, needed electrical system asset information is being acquired or converted.
Customer Information System (CIS)
PSE has also kicked off the Customer Information System project which will replace outdated technology with a new CIS that will:
• Streamline customer interactions • Increase Customer Service efficiencies • Lay the foundation for future customer interactions (e.g., self-service and
information via mobile devices)
The project is currently in the blueprint (design) phase.

Chapter 5: Customer Access Center Answering Performance (SQI #5) 2011 Annual Puget Sound Energy SQI and Electric Service Reliability Report 33
Training Accomplishments
PSE promotes efficiency and excellent customer service through extensive training and process improvements. PSE continues to improve and monitor training to support enhanced CAC call performance.
• Modular Training—Modular training was implemented and consists of alternating one week in training with one week on the phones, closely assisted by the Customer Access Center leadership team. Using this method, new agents are able to assist with outage calls, start/stop services and billing related calls early in their training. This process helps to solidify agent’s knowledge and ability before they move on to more complex calls.
Abandoned Calls
Call abandonment is the term referring to when customers hang up before they reach a CSR. The Customer Access Center makes every effort to answer all incoming calls within 30 seconds.
Table 11 shows PSE’s five-year history of total incoming calls to CSRs from 1-888-Call-PSE and the number of calls abandoned by customers:
Table 11: Total Calls Requesting to Speak to a CSR and Abandoned Call History from 2007 to 2011
2007 2008 2009 2010 2011
Total calls requested to speak to a CSR
2,382,130 2,309,902 2,134,358 2,023,165 2,152,292
Calls abandoned 91,306 69,256 64,447 63,365 71,606
Percent abandoned 3.8% 3.0% 3.0% 3.1% 3.3%
Busy Calls
PSE’s phone system is configured with a backup system to handle overflow customer calls to 1-888-Call-PSE. Overflow calls from PSE’s main IVR system are routed to a separate IVR system provided by PSE’s phone service vendor that enables customers to contact PSE through a different channel. All 2011 customer calls to 1-888-Call-PSE either went through the main or the overflow backup system without encountering a busy signal.
Chapter 5: Customer Access Center Answering Performance (SQI #5) 2011 Annual Puget Sound Energy SQI and Electric Service Reliability Report 34
Going Forward
In 2012, PSE will:
• Expand the cross-training of the web functions to remote CSRs. Web functions include customer correspondence via PSE.com and email
• Continue to support the initiative of increasing paperless adoption through the following methods: − Consolidate PSE’s various web payment applications into a single platform that
will provide a consistent user experience and better adoption potential of e-billing (pay online and paperless)
− Add a mobile application that will provide customers another medium to view and pay their bill
• Deploy technology upgrades such as the Outage Management System and the Customer Information System
• Continue to monitor the IVR system for new programming options that would benefit the Customer Access Center and the customers
• Continue to search for process improvement opportunities and deliver robust, sustainable, measurable and improved outcomes

Operations Services 2011 Annual Puget Sound Energy SQI and Electric Service Reliability Report 35
Operations Services
PSE is committed to delivering safe and dependable electric and natural gas service. Many factors influence how dependable energy can be delivered.
Providing reliable electric service to homes and businesses is inherently more susceptible to changes in weather conditions than providing natural gas service, because heavy rainfalls, high winds, and snow and ice can easily cause damage to the power lines and equipment, disrupting electric service. Damage to power lines from trees is a key issue for PSE because PSE’s transmission lines average over 1,995 trees per mile, many more than other utilities. Natural gas service is less likely to be affected by most storms, but can be interrupted by excavation and natural disasters, such as earthquakes and flooding. In addition to the service interruption, gas leaks, low-hanging or downed power lines and other system equipment damage can pose serious safety risks. PSE has teams dedicated to responding quickly to electric and gas emergency situations and to restoring service to customers.
This section discusses the three Service Quality Indexes relating to operations services:
• Gas Safety Response Time (SQI #7) • Electric Safety Response Time (SQI #11) • Appointments Kept (SQI #10)
This section also discusses
• Customer Construction Services Department and Service Provider Performance • Service Guarantees
For information on the Electric Service Reliability measures SQI #3 SAIDI and SQI #4 SAIFI, see the Electric Service Reliability section.

Chapter 6: Gas Safety Response Time (SQI #7) 2011 Annual Puget Sound Energy SQI and Electric Service Reliability Report 36
6 Gas Safety Response Time (SQI #7)
Overview
The primary responsibility of PSE’s Gas First Response (GFR) team is to respond to natural gas emergencies. In 2011, PSE responded to about 22,800 calls concerning natural gas safety. These emergencies include reports of inside or outside odors, third-party damage to PSE’s system, leaks and carbon monoxide concerns. The GFR team also supports first-response organizations, such as fire departments. PSE has Gas First Responders located throughout its service territory. These technicians are available on a 24/7/365 basis. PSE’s ability to respond to these emergencies is tracked and reported in this chapter.
In addition, the GFR team performs various maintenance and inspection activities, adjusts and performs minor repairs on customer equipment and monitors excavation by contractors and others when it occurs near certain underground facilities.
In 2011, the overall average response time was 29 minutes, two minutes faster than last year and beating the benchmark. The following table reports the results for 2011.
Table 12: Gas Safety Response Time for 2011
Key Measurement Benchmark 2011 Results Achieved
Gas safety response time (SQI #7)
Average 55 minutes or less from customer call to arrival of field technician
29 minutes
About the Benchmark
The gas safety response time is calculated by logging the time each customer service call is created and the time the gas field technician arrives on site. The calculated response times for each service call are averaged for all emergency calls during the performance year to determine the overall annual performance.
Gas safety response time annual performance =sum of all natural gas emergency response times
annual number of natural gas emergency calls received
Chapter 6: Gas Safety Response Time (SQI #7) 2011 Annual Puget Sound Energy SQI and Electric Service Reliability Report 37
What Influences Gas Safety Response Time?
The response time for a typical safety-related customer request, such as if a gas leak is suspected, depends on a number of factors, including:
• Time of year • Time of day • Location of the incident and location of nearest available responder—especially if it
can only be reached by ferry, such as Vashon Island • Traffic conditions • Number of concurrent gas safety calls or system-wide emergencies
In case of a natural gas emergency, such as a ruptured gas main, firefighters and other emergency personnel may be the first to arrive. PSE works with the fire departments in PSE’s service area to train them in the appropriate practices for responding to natural gas emergencies. The training includes the proper method to turn off the natural gas to a building and evacuate occupants as well as an overview of PSE’s response coordination and procedures. Annually, more than 1,000 municipal first responders participate in PSE’s natural gas and electric safety training programs.
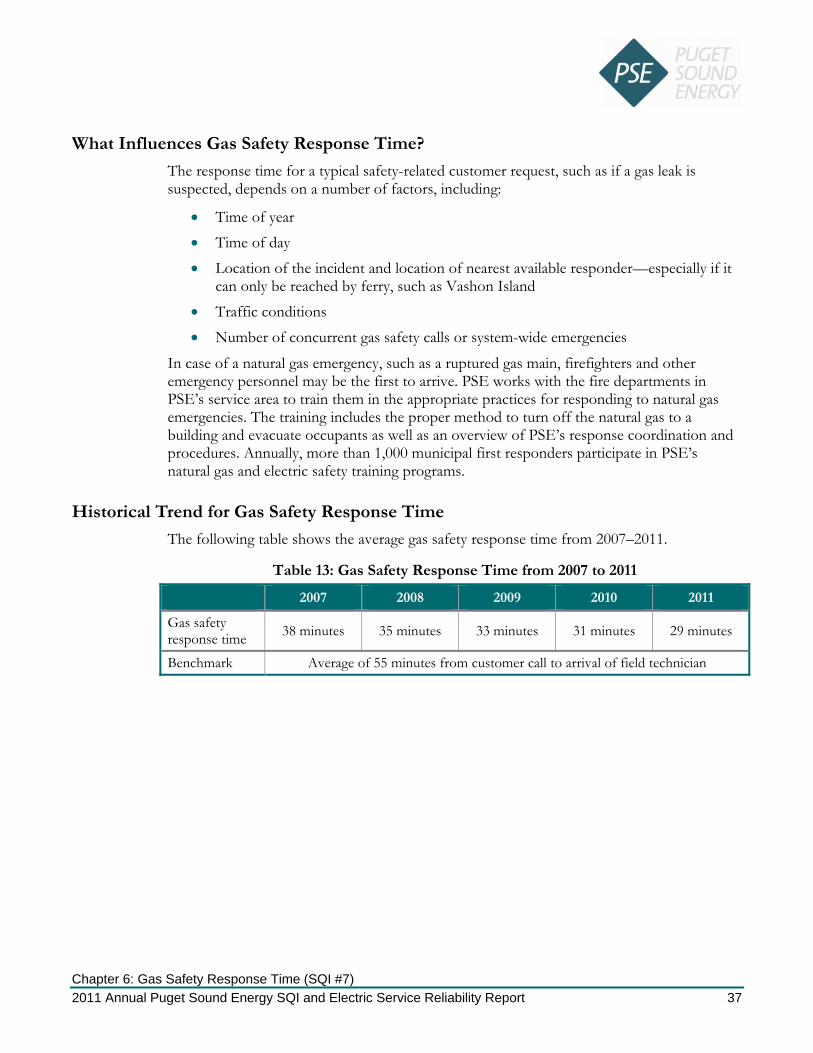
Historical Trend for Gas Safety Response Time
The following table shows the average gas safety response time from 2007–2011.
Table 13: Gas Safety Response Time from 2007 to 2011
2007 2008 2009 2010 2011
Gas safety response time 38 minutes 35 minutes 33 minutes 31 minutes 29 minutes
Benchmark Average of 55 minutes from customer call to arrival of field technician
Chapter 6: Gas Safety Response Time (SQI #7) 2011 Annual Puget Sound Energy SQI and Electric Service Reliability Report 38
Working to Uphold Gas Safety Response Time
PSE continues to work to maintain its gas safety response time at a level which meets or exceeds the SQI threshold by:
• Continued review of shift schedules to align personnel with trends in when emergencies are reported. This effort includes a studying of all emergencies and how call-out areas for after-hours call-outs are designed.
• Continued utilization of the Mobile Workforce Dispatch System with computer-aided dispatching, which enables PSE to better assign the available service technicians required in a gas safety situation and to determine the closest possible responder.
• Continued employee training efforts including new gas worker training, gas operator qualification training and new standards and procedures.
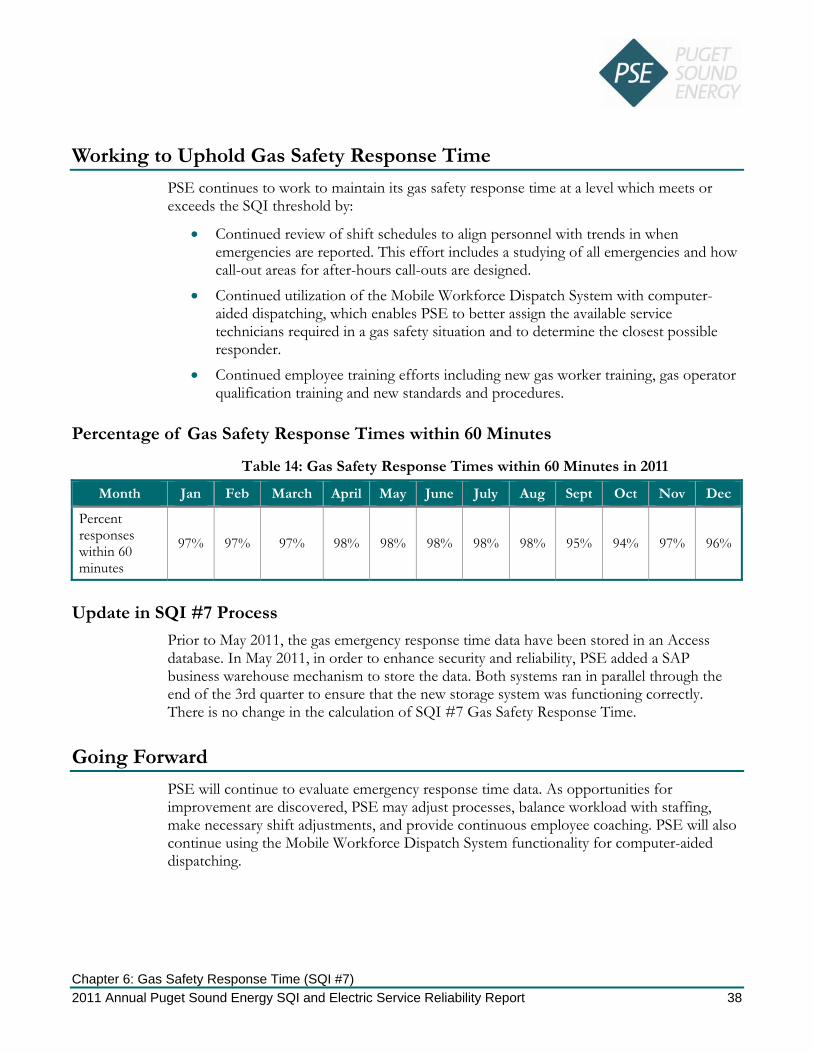
Percentage of Gas Safety Response Times within 60 Minutes
Table 14: Gas Safety Response Times within 60 Minutes in 2011
Month Jan Feb March April May June July Aug Sept Oct Nov Dec
Percent responses within 60 minutes
97% 97% 97% 98% 98% 98% 98% 98% 95% 94% 97% 96%
Update in SQI #7 Process
Prior to May 2011, the gas emergency response time data have been stored in an Access database. In May 2011, in order to enhance security and reliability, PSE added a SAP business warehouse mechanism to store the data. Both systems ran in parallel through the end of the 3rd quarter to ensure that the new storage system was functioning correctly. There is no change in the calculation of SQI #7 Gas Safety Response Time.
Going Forward
PSE will continue to evaluate emergency response time data. As opportunities for improvement are discovered, PSE may adjust processes, balance workload with staffing, make necessary shift adjustments, and provide continuous employee coaching. PSE will also continue using the Mobile Workforce Dispatch System functionality for computer-aided dispatching.
Chapter 7: Electric Safety Response Time (SQI #11) 2011 Annual Puget Sound Energy SQI and Electric Service Reliability Report 39
7 Electric Safety Response Time (SQI #11)
Overview
PSE’s Electric First Response (EFR) team has the primary responsibility of responding to electric outages and electric emergencies. Examples of the types of outages and emergency events that PSE responds to include downed wires, equipment failures, car-pole accidents, bird- and animal-related outages, trees or limbs on lines, third-party dig-ins and voltage problems.
EFR personnel are located throughout PSE’s service territory and are available to respond on a 24/7/365 basis. EFR’s priority is to ensure public and worker safety and then to restore service to customers. After addressing safety concerns, service restoration is made through temporary or permanent repairs or reconfiguration of the electric system. If the repair is beyond the capability of EFR personnel, construction crews are called in to make permanent repairs. PSE responded to more than 12,000 electric incidents in 2011.
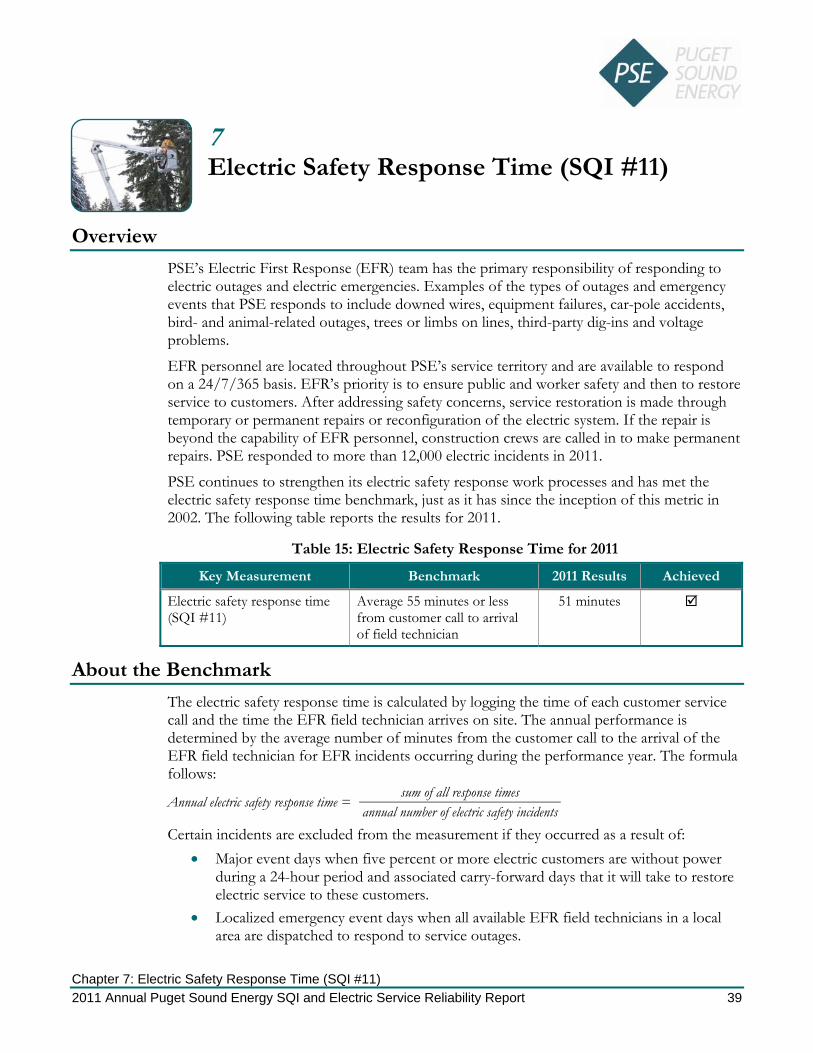
PSE continues to strengthen its electric safety response work processes and has met the electric safety response time benchmark, just as it has since the inception of this metric in 2002. The following table reports the results for 2011.
Table 15: Electric Safety Response Time for 2011
Key Measurement Benchmark 2011 Results Achieved
Electric safety response time (SQI #11)
Average 55 minutes or less from customer call to arrival of field technician
51 minutes
About the Benchmark
The electric safety response time is calculated by logging the time of each customer service call and the time the EFR field technician arrives on site. The annual performance is determined by the average number of minutes from the customer call to the arrival of the EFR field technician for EFR incidents occurring during the performance year. The formula follows:
Annual electric safety response time =sum of all response times
annual number of electric safety incidentsCertain incidents are excluded from the measurement if they occurred as a result of:
• Major event days when five percent or more electric customers are without power during a 24-hour period and associated carry-forward days that it will take to restore electric service to these customers.
• Localized emergency event days when all available EFR field technicians in a local area are dispatched to respond to service outages.

Chapter 7: Electric Safety Response Time (SQI #11) 2011 Annual Puget Sound Energy SQI and Electric Service Reliability Report 40
What Influences Electric Safety Response Time?
Electric safety response time is influenced by many factors, including:
• Number of electric safety responses—The number of electric safety events varies during the year and is typically higher during the storm season where response times may be longer.
• Time of day an event occurs—Events that occur outside of normal business hours often require call-out responses and may incur a greater response time. Events that occur in early morning or late afternoon may experience longer response times due to traffic conditions. More than 32 percent of outages in the 12 months that ended December 2011 occurred during the peak commute hours of 7 a.m.–10 a.m. and 4 p.m.–6 p.m.
• Weather conditions—PSE responds to electric incidents in all weather conditions. Response times can be lengthened by adverse driving conditions such as snow, ice, flooded streets, landslides or downed trees.
• Location of the emergency event—Some areas in PSE’s service territory can only be reached by ferry, bridge and border crossings or are remote and may require snow-machines or “walk-ins” to access.
• Location of the nearest, available responder—PSE’s approximately 80 EFR personnel live and work throughout PSE’s service territory and are readily available to respond to an outage or electric system incident. Although PSE has six operating bases, the majority of the time personnel respond directly from a field location, where they may be working on non-emergency or non-outage customer requests. For after-hours emergencies, they generally respond directly from their homes.
Historical Trend for Electric Safety Response Time
The following table shows average electric safety response time from 2007 to 2011.
Table 16: Average electric safety response time from 2007 to 2011
2007 2008 2009 2010 2011
Electric safety response time 52 minutes 55 minutes 51 minutes 52 minutes 51 minutes
Benchmark Average of 55 minutes from customer call to arrival of field technician

Chapter 7: Electric Safety Response Time (SQI #11) 2011 Annual Puget Sound Energy SQI and Electric Service Reliability Report 41
Working to Decrease Electric Safety Response Time
In 2011, PSE strengthened procedures and processes aimed at reducing electric safety response time. These efforts include:
• Finalized the Request For Information (RFI) process for a new first responder call out system to be implemented alongside the new Outage Management System (OMS).
• Adjusted first responder shift coverage in one region to bring the use of existing resources in line with outage occurrence trends.
• Increased emphasis on monthly performance updates with first responders throughout the year to foster greater focus on timely incident response.
• Added dedicated Systems Operator staff to improve incident response and communication with EFR field staff.
Going Forward
In 2012, PSE will continue its efforts to improve communication and coordination between field service personnel, system operators and dispatchers to reduce response time. The efforts include:
• Complete the Request for Proposal process with a selected group of call-out system software vendors, finalize selection of a system and begin first stages of implementation by the end of the year.
• Implement the Outage Management System technology, providing improved electric system information to increase efficiency in managing outage events and first response personnel.
• Continue to allocate System Operations resources to all regions during non-core business hours to improve timely deployment of first responders and outage communication.
• Continue to regularly analyze and optimize first responder shift scheduling to correspond with daily outage trends.
• Dispatch crews in parallel with servicemen on specific outages such as car-pole accidents and certain underground cable failures.

Chapter 8: Appointments Kept (SQI #10) 2011 Annual Puget Sound Energy SQI and Electric Service Reliability Report 42
8 Appointments Kept (SQI #10)
Overview
PSE provides its customers with a variety of scheduled service appointments including:
• Permanent service—Permanent natural gas service from an existing main or permanent secondary voltage electric service from existing secondary lines.
• Reconnection of existing service—Reconnection following move-out, move-in or disconnection for non-payment.
• Natural gas diagnostic service request—For water heater, furnace checkup, furnace not operating, other diagnostic or repair or follow-up appointments.
Other types of service, such as those involving safety, do not require scheduling and are performed on a 24/7/365 basis. These non-scheduled services include restoring electric service due to PSE outages or responding to a reported gas odor.
When a residential gas or electric customer requests a scheduled service, PSE provides the customer with either a guaranteed appointment date and time frame or a guaranteed commitment to provide service on or before a specified date.
In 2011, PSE achieved a result of 100% for this appointments kept metric. However this achievement did not mean PSE and its Service Provider kept all of the 126,156 appointments it made as the data is rounded to the nearest whole percentage per the UTC order. Data on missed appointments and other appointment information by service type is detailed in Appendix F: Customer Service Guarantee Performance Detail.
Table 17: Appointments Kept for 2011
Key Measurement Benchmark 2011 Results Achieved
Appointments kept (SQI #10) At least 92% of appointments kept
100%
For information on customer credits, see Chapter 10: Service Guarantees.

Chapter 8: Appointments Kept (SQI #10) 2011 Annual Puget Sound Energy SQI and Electric Service Reliability Report 43
About the Benchmark
The appointments kept SQI is calculated by dividing the number of appointments kept by the total number of appointments made. The formula follows:
Appointments kept = annual appointments kept
annual appointments missed + annual appointments kept
Appointments will be considered missed when PSE does not arrive during the time period or on the agreed upon date. The following are not considered missed appointments:
• The customer fails to keep the appointment. • The customer calls PSE to specifically request the appointment be rescheduled. • PSE reschedules the appointment because conditions at the customer site make it
impractical to perform the service. • The appointment falls during an SQI major event period.
Appointments that have been canceled by the customer, regardless of the customer’s reason, will be considered “canceled” appointments and are not counted as either kept or missed appointments.
Additional appointments to complete repairs are considered new appointments.
Historical Trend for Appointments Kept Performance
The following table shows the percentage of appointments kept from 2007–2011.
Table 18: Appointments Kept from 2007 to 2011
2007 2008 2009 2010 2011
Appointments kept 99% 99% 99% 100% 100%
Benchmark 92% of appointments kept
Chapter 8: Appointments Kept (SQI #10) 2011 Annual Puget Sound Energy SQI and Electric Service Reliability Report 44
Working to Maintain the Percentage of Appointments Kept
In 2011, PSE:
• Used mobile workforce tools to balance scheduled service work among workers and to identify and address issues that cause an appointment to be missed.
• Implemented processes to ensure reconnection requests received during non-business hours were scheduled and completed within 24 hours.
• Monitored and reviewed causes for missing appointments; provided regular feedback and coaching to PSE and service providers’ personnel.
Going Forward
PSE has consistently exceeded this metric with a rating at or near 100 percent. PSE will continue its current efforts to maintain its appointments-kept service results. PSE will:
• Continue to review the reasons for missed appointments and work to find solutions so that PSE can meet customer commitments.
• Implement software to streamline the electric residential reconnect process and improve efficiency.
Chapter 9: Customer Construction Services Department and Service Provider Performance 2011 Annual Puget Sound Energy SQI and Electric Service Reliability Report 45
9 Customer Construction Services Department and Service Provider Performance
Customer Construction Services Department
The Customer Construction Services Department partners with PSE’s service providers (Pilchuck and Quanta) who provide project management, design and construction services for most new customer construction projects.
The primary responsibility of PSE’s Customer Construction Services Department is to facilitate the provision of new and modified natural gas and electric service to prospective and new residential, commercial and industrial customers. The department manages four areas of service:
• New Customer Construction Support—Processes applications for new and modified natural gas and electric installations, schedules temporary electric services for new customer construction projects, initiates new customers’ accounts and reviews new customer construction payment requirements. New service inquiries come through phone calls, emails and faxes to these employees who guide customers through the construction process.
• Pre-Engineering Services—Provides gas and electric pre-construction new service application assistance to prospective customers. Prospective customers include individual homeowners, builders, developers and their contractors, electricians and gas equipment dealers. This work includes collaborating with customers to provide “ballpark” job cost estimates and assistance with PSE construction standards, tariff requirements and potential alternatives to unique project requirements.
• Contract Management Services—Manages and coordinates with PSE service providers who perform design, permitting and construction work on PSE’s behalf. Contract Management Services also works with PSE’s Rate Department to address rate and tariff clarifications, perform design audits and resolve customer concerns with service provider performance.
• Builder Relations—Focuses on enhancing relationships and communications with new home builders and building industry leaders while promoting energy efficiency opportunities.

Chapter 9: Customer Construction Services Department and Service Provider Performance 2011 Annual Puget Sound Energy SQI and Electric Service Reliability Report 46
Service Provider Index (SPI) Performance
In 2011, PSE monitored 62 important metrics to measure the performance of its primary natural gas and electric service providers (Pilchuck and Quanta). These metrics address standards compliance, customer satisfaction, reliability/service restoration, efficiency, budgeting and safety. Each measure is designed to monitor, stretch/challenge and improve PSE’s service. This section details the service provider metrics relevant to PSE’s SQI program.
Changes to the Service Provider Program in 2011
In 2010, PSE embarked on a Request for Proposal process for the natural gas construction and maintenance services that had been performed by Pilchuck. After careful evaluation, Quanta Services (doing business as InfraSource in the PSE service area) was selected. The transfer of work from Pilchuck to Quanta was completed at the end of first quarter 2011. At this time, Quanta Services began performing all of PSE’s electric and natural gas construction and maintenance work.
As a result of this change, service provider SPIs related to natural gas services were tracked for Pilchuck and Quanta Gas during the months of January, February and March but only for Quanta Gas for the rest of the year because Pilchuck was no longer performing these services for PSE.
Service Provider Indexes
The four service provider metrics relevant to PSE's SQI program are:
• Service provider standards compliance (SPI #1)—SPI #1A tracks standards compliance by Pilchuck, SPI #1B tracks standards compliance by Quanta Electric and SPI #1C tracks standards compliance by Quanta Gas.
• Service provider customer satisfaction (SPI #2)—SPI #2A tracks customer satisfaction with Pilchuck, SPI #2B tracks customer satisfaction with Quanta Electric and SPI #2C tracks customer satisfaction with Quanta Gas.
• Service provider appointments kept (SPI #3)—SPI #3A tracks appointments kept by Pilchuck, SPI #3B tracks appointments kept by Quanta Electric and #3C tracks appointments kept by Quanta Gas.
• Secondary safety response time (SPI #4)—SPI #4A tracks secondary safety response time by Pilchuck, SPI #4B tracks secondary safety response and restoration time by Quanta Electric for core hours, SPI #4C tracks secondary safety response and restoration time by Quanta Electric for non-core hours, and SPI #4D tracks secondary safety response time by Quanta Gas.
The benchmarks for each of the service providers are based on reasonably achievable improvement over past years’ performance.

Chapter 9: Customer Construction Services Department and Service Provider Performance 2011 Annual Puget Sound Energy SQI and Electric Service Reliability Report 47
Service Provider Standards Compliance (SPI #1)
Service providers must meet a minimum percent compliance with PSE’s site audit checklists (See Benchmarks in Table 19). All service providers met this SPI at 99 percent in 2011. The detailed 2011 results show:
• Pilchuck—99 percent • Quanta Gas—99 percent • Quanta Electric—99 percent
The following table shows service provider standards compliance over the past five years.
Table 19: Service Provider Standards Compliance from 2007 to 2011
2007 2008 2009 2010 2011
Pilchuck
Service provider standards compliance (SPI #1A)
98% 97% 99% 99% 99%
Benchmark 95% compliance with PSE’s site audit checklists
Quanta Gas
Gas service provider standards compliance (SPI #1C)
98% 98% 98% 98% 99%
Benchmark 97% compliance with PSE’s site audit checklists
Quanta Electric
Electric service provider standards compliance (SPI #1B)
97% 96% 98% 97% 99%
Benchmark 97% compliance with PSE’s site audit checklists

Chapter 9: Customer Construction Services Department and Service Provider Performance 2011 Annual Puget Sound Energy SQI and Electric Service Reliability Report 48
Customer Satisfaction (SPI #2)
In 2011, Pilchuck and Quanta Gas were required to achieve a minimum 84 percent satisfactory rating (rating of 5 or higher on the 7-point survey scale). Quanta Electric was required to meet a minimum 77 percent satisfactory rating on the same 7-point scale for new construction customers surveyed regarding contractor engineering and construction activities. The detailed 2011 results show
• Pilchuck—85 percent • Quanta Gas—87 percent • Quanta Electric—81 percent
The following table shows service provider customer satisfaction over the past five years.
Table 20: Service Provider Customer Satisfaction Performance from 2007 to 2011
2007 2008 2009 2010 2011
Pilchuck
Customer satisfaction performance (SPI #2A) 88% 86% 86% 88% 85%
Benchmark 83% 83% 84% 84% 84%
Quanta Gas
Customer satisfaction performance (SPI #2C) N/A N/A N/A N/A 87%
Benchmark N/A N/A N/A N/A 84%
Quanta Electric
Customer satisfaction performance (SPI #2B) 76% 77% 77% 79% 81%
Benchmark 78% 78% 75% 75% 77%
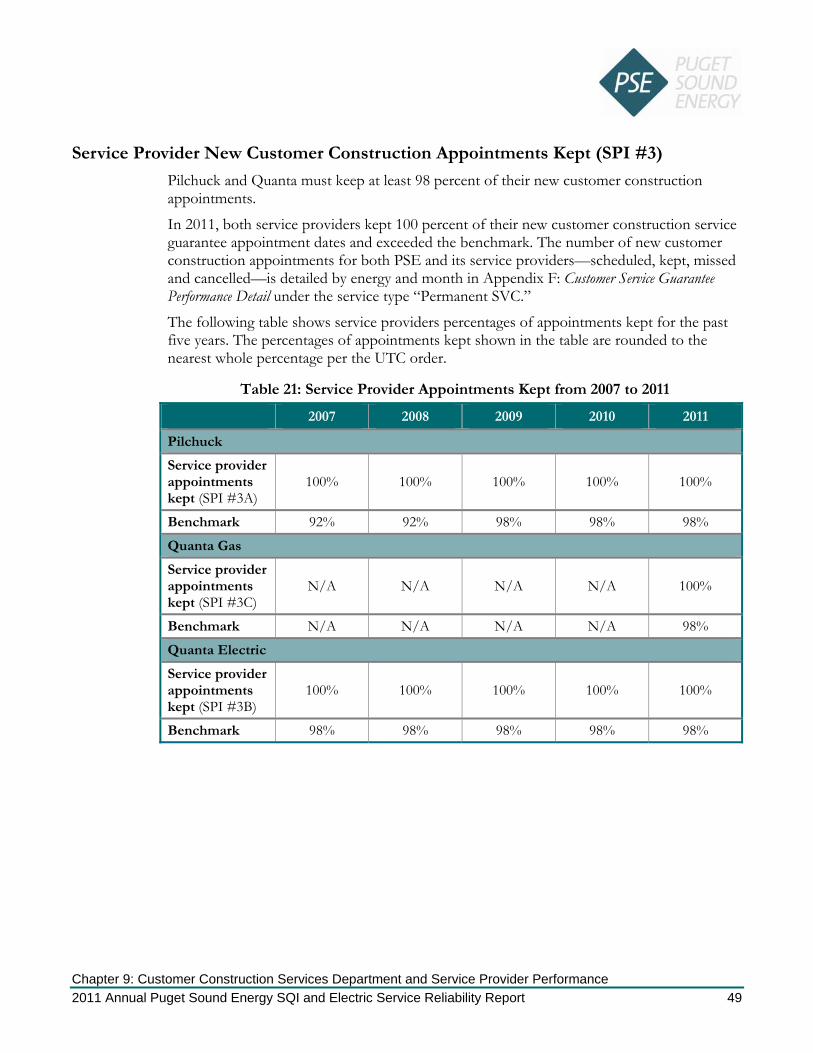
Chapter 9: Customer Construction Services Department and Service Provider Performance 2011 Annual Puget Sound Energy SQI and Electric Service Reliability Report 49
Service Provider New Customer Construction Appointments Kept (SPI #3)
Pilchuck and Quanta must keep at least 98 percent of their new customer construction appointments.
In 2011, both service providers kept 100 percent of their new customer construction service guarantee appointment dates and exceeded the benchmark. The number of new customer construction appointments for both PSE and its service providers—scheduled, kept, missed and cancelled—is detailed by energy and month in Appendix F: Customer Service Guarantee Performance Detail under the service type “Permanent SVC.”
The following table shows service providers percentages of appointments kept for the past five years. The percentages of appointments kept shown in the table are rounded to the nearest whole percentage per the UTC order.
Table 21: Service Provider Appointments Kept from 2007 to 2011
2007 2008 2009 2010 2011
Pilchuck
Service provider appointments kept (SPI #3A)
100% 100% 100% 100% 100%
Benchmark 92% 92% 98% 98% 98%
Quanta Gas
Service provider appointments kept (SPI #3C)
N/A N/A N/A N/A 100%
Benchmark N/A N/A N/A N/A 98%
Quanta Electric
Service provider appointments kept (SPI #3B)
100% 100% 100% 100% 100%
Benchmark 98% 98% 98% 98% 98%
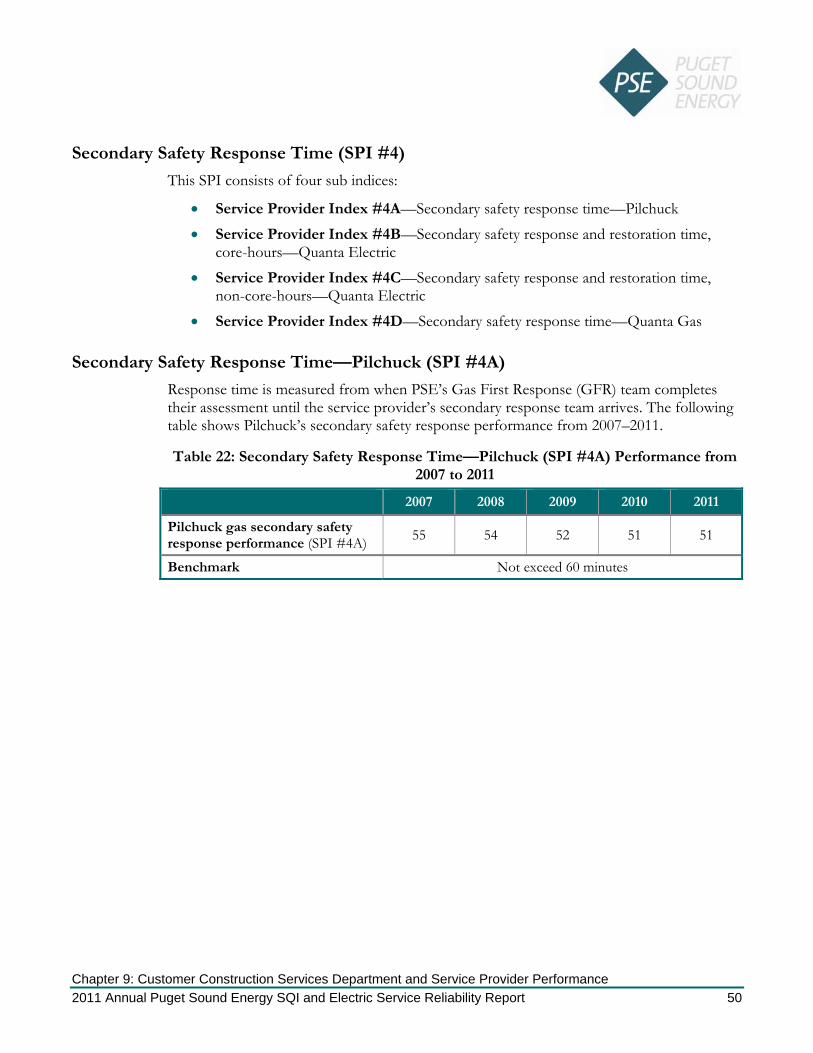
Chapter 9: Customer Construction Services Department and Service Provider Performance 2011 Annual Puget Sound Energy SQI and Electric Service Reliability Report 50
Secondary Safety Response Time (SPI #4)
This SPI consists of four sub indices:
• Service Provider Index #4A—Secondary safety response time—Pilchuck • Service Provider Index #4B—Secondary safety response and restoration time,
core-hours—Quanta Electric • Service Provider Index #4C—Secondary safety response and restoration time,
non-core-hours—Quanta Electric • Service Provider Index #4D—Secondary safety response time—Quanta Gas
Secondary Safety Response Time—Pilchuck (SPI #4A)
Response time is measured from when PSE’s Gas First Response (GFR) team completes their assessment until the service provider’s secondary response team arrives. The following table shows Pilchuck’s secondary safety response performance from 2007–2011.
Table 22: Secondary Safety Response Time—Pilchuck (SPI #4A) Performance from 2007 to 2011
2007 2008 2009 2010 2011
Pilchuck gas secondary safety response performance (SPI #4A) 55 54 52 51 51
Benchmark Not exceed 60 minutes

Chapter 9: Customer Construction Services Department and Service Provider Performance 2011 Annual Puget Sound Energy SQI and Electric Service Reliability Report 51
Secondary Safety Response and Restoration Time, Core-Hours and Non-Core-Hours—Quanta Electric (SPI #4B and SPI #4C)
Quanta Electric must respond and complete power restoration in less than 250 minutes on average during core hours, and less than 316 minutes on average during non-core hours.
Core hours are 7:00 a.m.–5:30 p.m., Monday through Friday, except holidays. In 2011, Quanta Electric had an average restoration time of 234 minutes during core hours, and an average restoration time of 273 minutes during non-core hours.
Restoration time is measured from the time a Quanta Electric crew is dispatched to the time the problem causing the interruption has been resolved and the line has been re-energized. Both the core-hours and non-core-hours measurements exclude emergency events and significant storm events.
The following table shows Quanta Electric’s average secondary safety response performance during core-hours and non-core-hours from 2007–2011.
Table 23: Secondary Safety Response and Restoration Time—Quanta Electric (SPI #4B & #4C) from 2007 to 2011
2007 2008 2009 2010 2011
Secondary Core-Hours, Non-Emergency Safety Response and Restoration Time (SPI #4B)
261 241 242 242 234
Core Hours Benchmark Not exceed 250 minutes
Secondary Non-Core-Hours, Non-Emergency Safety Response and Restoration Time (SPI #4C)
317 277 281 278 273
Non-Core Hours Benchmark Not exceed 316 minutes

Chapter 9: Customer Construction Services Department and Service Provider Performance 2011 Annual Puget Sound Energy SQI and Electric Service Reliability Report 52
Secondary Safety Response Time—Quanta Gas (SPI #4D)
Quanta Gas must respond within 60 minutes on average from PSE’s Gas First Response (GFR) assessment completion to the service provider’s secondary response arrival. In 2011, Quanta Gas had an average response time of 53 minutes. The following table shows Quanta Gas’s secondary safety response performance from 2007–2011. The 2007–2010 information is not available because Quanta Gas just began providing services for PSE in 2011.
Table 24: Secondary Safety Response Time—Quanta Gas (SPI #4D) Performance from 2007 to 2011
2007 2008 2009 2010 2011
Quanta Gas secondary safety response performance (SPI #4D)
N/A N/A N/A N/A 53
Benchmark Not exceed 60 minutes
Actions Taken to Improve Customer Satisfaction with the New Customer Construction Process
PSE surveyed over 900 randomly selected customers, builders, developers and electricians who have done business with PSE in 2011. The surveys showed that overall customer satisfaction improved slightly in 2011, with an average overall satisfaction rating of more than 87 percent compared, to an overall average of 82 percent in 2010.
PSE and its service providers have partnered to develop or advance the following process improvement initiatives to improve customer satisfaction with the overall new customer construction process:
• Renewed emphasis on Task Tracking to ensure it is being used effectively by the service providers and PSE personnel. Task Tracking is used to better understand time lines for specific tasks and communicate average time lines to the customer. Task Tracking has been expanded so that PSE and service provider representatives can view the history and status of a particular request or project. Customers are better served because they no longer have to restate their concern every time they call with either a question or a status check.
• Placed an informational video about the construction of temporary electric services on PSE.com in early 2011. It has received over 1,500 views from customers. The second construction video, on joint trench for both electric and natural gas services was posted to PSE.com in late 2011. A third video covering natural gas service construction will be posted on PSE.com in early 2012.
• Enhanced PSE.com content usability for new construction projects by improving navigation for easier access to information related to construction guidelines and installation requirements.
Chapter 9: Customer Construction Services Department and Service Provider Performance 2011 Annual Puget Sound Energy SQI and Electric Service Reliability Report 53
• Updated PSE’s Natural Gas and Electric Service Handbooks to increase customer understanding of the construction process and to improve customer satisfaction. These publications outline PSE’s processes and installation requirements to provide necessary information to new customers for a safe and efficient installation. New customer materials for switching to natural gas were completed in early 2011. This work will continue into 2012 to include more communication materials specific to those building new homes and new developments.
The following 2011 PSE initiatives were designed to improve builder and developer satisfaction:
• Met regularly on-site with builders to review construction standards and PSE processes to minimize the red tags that indicate a problem and can slow project completion.
• Produced and distributed regular issues of PSE Builder News to about 2,800 building industry associates as well as posted each newsletter to PSE.com and distributed to members of seven local home builder associations. The publication includes information on standards, tariff changes, energy efficiency and PSE new construction contact information.
• Participated as active members in seven local home builder associations and participated in about 110 association meetings, trade shows and educational events to increase operational understanding of PSE processes and to garner industry input.
Service Providers and Customer Construction Services Department Training
PSE conducts on-going training to target improvement in:
• Technical skills • Role definition and responsibilities • Customer communications
The training format includes classroom training, phone monitoring and coaching, job shadowing and field training. Activities include:
• Updating and maintaining a Quick Reference Guide on the internal Customer Construction Services Department website.
• Providing “phone pro” training. • Providing classroom training, using in-house gas and electric trainers. • Using customer inquiries and complaints to identify and focus training opportunities. • Providing training on basic process improvement steps and techniques to all
Customer Construction Services employees.

Chapter 9: Customer Construction Services Department and Service Provider Performance 2011 Annual Puget Sound Energy SQI and Electric Service Reliability Report 54
Going Forward
PSE has several new customer construction initiatives for 2012 including:
• Creating or enhancing new customer communication materials. • Participating in the development and implementation of Customer Information
System, Geospatial Information System and Outage Management System projects. • Emphasizing more thorough and comprehensive project management, including
better matching skill sets of project managers and engineers to project complexity. This improved project management should result in improved service to the customer.
• Refining the post construction audit to identify areas of weakness and provide coaching and training where needed.
In addition, Quanta Gas will be providing electronic hand-held devices to the field personnel to help reduce input redundancy and streamline the records process flow.

Chapter 10: Service Guarantees 2011 Annual Puget Sound Energy SQI and Electric Service Reliability Report 55
10 Service Guarantees
Overview
PSE offers two service guarantees to its customers: Customer Service Guarantee (Service Guarantee #1) and Restoration Service Guarantee (Service Guarantee #2).
Customer Service Guarantee
Customer Service Guarantee (CSG) is designed to give customers a $50 missed appointment credit if PSE or its service providers fails to arrive by the mutually agreed upon time and date to provide one of the following types of service:
• Permanent service—Permanent natural gas service from an existing main or permanent secondary voltage electric service from existing secondary lines.
• Reconnection—Reconnection following move-out, move-in or disconnection for non-payment.
• Natural gas diagnostic service request—For water heater, furnace checkup, furnace not operating, other diagnostic or repair or follow-up appointments.
This service appointment guarantee applies in the absence of major storms, earthquakes, supply interruptions or other adverse events beyond PSE’s control. In these cases, PSE will reschedule service appointments as quickly as possible.
The number of CSG by energy, service type, and month is detailed in Appendix F: Customer Service Guarantee Performance Detail. For additional detail on the promotion and communication of CSG, see Appendix G: Customer Awareness of Customer Service Guarantee.
Restoration Service Guarantee
Whenever a customer experiences a 120 consecutive-hour power outage, the customer may be eligible for a $50 Restoration Service Guarantee credit. The total annual payments are limited to $1.5 million, or 30,000 customers, payable to eligible customers who request such payment or report their outage on a first-come, first-served basis. The pledge is always applicable but will be suspended if PSE lacks safe access to its facilities to perform the needed assessment or repair work. To receive the RSG credit, affected customers must report the outage or request the credit within seven days of their service restoration.
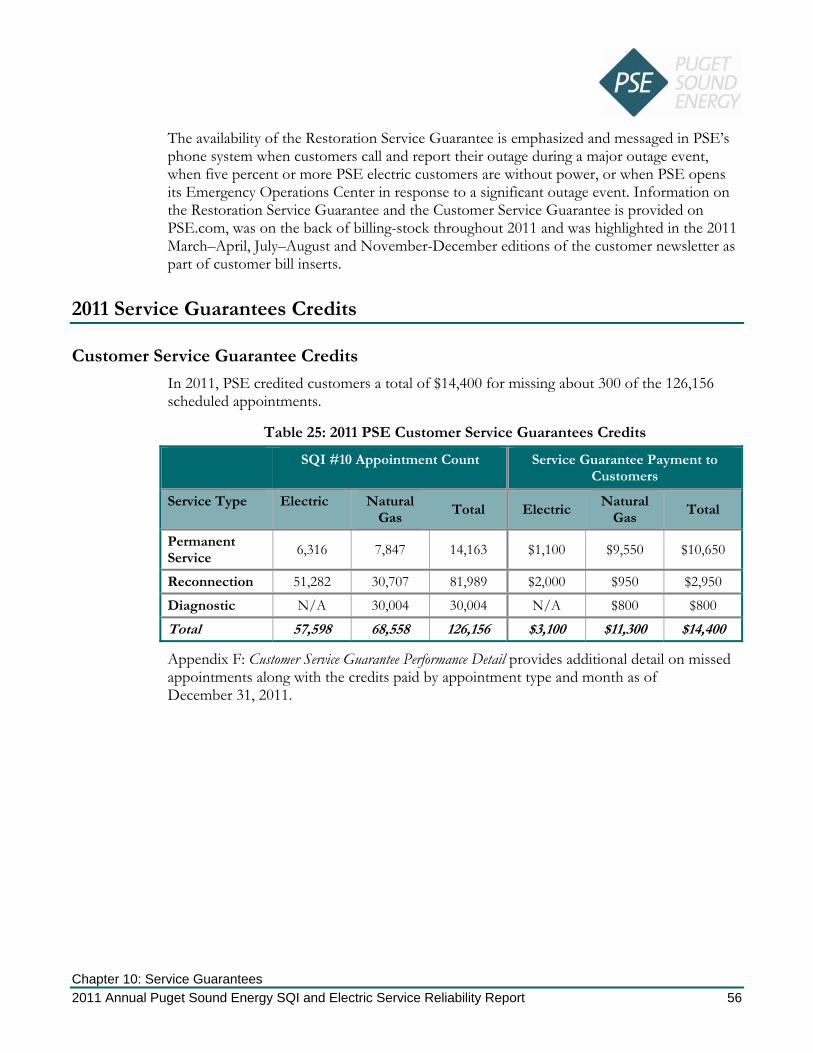
Chapter 10: Service Guarantees 2011 Annual Puget Sound Energy SQI and Electric Service Reliability Report 56
The availability of the Restoration Service Guarantee is emphasized and messaged in PSE’s phone system when customers call and report their outage during a major outage event, when five percent or more PSE electric customers are without power, or when PSE opens its Emergency Operations Center in response to a significant outage event. Information on the Restoration Service Guarantee and the Customer Service Guarantee is provided on PSE.com, was on the back of billing-stock throughout 2011 and was highlighted in the 2011 March–April, July–August and November-December editions of the customer newsletter as part of customer bill inserts.
2011 Service Guarantees Credits
Customer Service Guarantee Credits
In 2011, PSE credited customers a total of $14,400 for missing about 300 of the 126,156 scheduled appointments.
Table 25: 2011 PSE Customer Service Guarantees Credits
SQI #10 Appointment Count Service Guarantee Payment to Customers
Service Type Electric Natural Gas Total Electric Natural
Gas Total
Permanent Service
6,316 7,847 14,163 $1,100 $9,550 $10,650
Reconnection 51,282 30,707 81,989 $2,000 $950 $2,950
Diagnostic N/A 30,004 30,004 N/A $800 $800
Total 57,598 68,558 126,156 $3,100 $11,300 $14,400
Appendix F: Customer Service Guarantee Performance Detail provides additional detail on missed appointments along with the credits paid by appointment type and month as of December 31, 2011.

Chapter 10: Service Guarantees 2011 Annual Puget Sound Energy SQI and Electric Service Reliability Report 57
Service Provider Appointments Missed Penalties
The following table shows the number of new customer construction appointments missed by PSE service providers and the amount of penalties paid due to these missed appointments.
Table 26: Service Provider Missed Appointment Penalties for 2011
SQI #10 Missed Appointment Count
Missed Appointment Penalties
Service Provider Electric Natural Gas Total Electric Natural
Gas Total
Pilchuck N/A 17 17 N/A $850 $850
Quanta Gas (InfraSource)
N/A 161 161 N/A $8,050 $8,050
Quanta Electric 22 13 35 $1,100 $650 $1,750
Total 22 191 213 $1,100 $9,550 $10,650
Restoration Service Guarantee Credits
PSE is committed to review all prolonged outages that may trigger the Restoration Service Guarantee (RSG) and any customer requests of the RSG credit within 30 days of a request. During 2011, there was no outage event that lasted more than 120 consecutive hours, and no customer requested the RSG credit.

Electric Service Reliability 2011 Annual Puget Sound Energy SQI and Electric Service Reliability Report 58
Electric Service Reliability
Safe and reliable electric service is one of PSE’s paramount goals. Information in this report provides the Washington Utilities and Transportation Commission (UTC) and our customers with reliability metrics on the services that PSE provides its customers.
Information on electric reliability is provided by the traditional reliability metrics including the number and duration of outages as measured against the Service Quality Indices (SQIs) approved by the UTC in 1997. Additionally, customer concerns about service quality and reliability, received either firsthand or through the UTC, provide an important perspective of electric reliability.
The following chapters detail PSE’s System Average Interruption Frequency Index (SAIFI) and System Average Interruption Duration Index (SAIDI) performance and discuss the Washington State annual reliability reporting requirements and results for the 2011 calendar year.
In 2011, SQI SAIDI decreased by 2 percent when compared to 2010 results and PSE met the SQI SAIDI benchmark. Since the SQI SAIDI benchmark is based on the five year average methodology, the slight decrease is due to the 2011 Total Annual SAIDI results being lower than the year it replaced.
While PSE continues to meet the SQI SAIFI benchmark, SQI SAIFI increased by 19 percent when compared to 2010. The 2011 results for measurements with major outage event exclusion saw a decline in performance as compared 2010. Those measurements allow PSE to exclude days when the respective thresholds are exceeded which typically occur during major weather events. In 2011, PSE only experienced one major weather event but more minor weather events than in 2010. At the same time, during 2011, the total number of disruptions to customers decreased dramatically as indicated by SAIFITotal. See Appendix L: 1997-Current Year PSE SAIFI and SAIDI Performance by Different Measurements for more details.

Electric Service Reliability 2011 Annual Puget Sound Energy SQI and Electric Service Reliability Report 59
Annually, PSE participates in a benchmarking survey coordinated by the Institute of Electrical and Electronics Engineers (IEEE). IEEE collects information from participating utilities and documents performance based on an individual ranking (#1 being the best) and within four quartiles (first quartile being the best). In the 2010 IEEE survey of 109 member utilities, PSE ranked in the top 17 percent (1st quartile) and in the 46th percentile (2nd quartile) of SAIFI and SAIDI, respectively. PSE ranked better than in 2009, as PSE had a 7 percent and 14 percent improvement in SAIFI and SAIDI. The results of the 2011 IEEE survey are expected in August 2012.
While PSE believes that this annual report provides useful information to interested parties for a given calendar year, PSE cautions against putting too much emphasis on the usefulness of annualized metrics in concluding trends pertaining to system performance. Factors such as variation in weather, natural disasters and normal random variation in events such as third-party damage will all impact year-to-year comparison of system performance.
A single year’s result may not lend to adequate identification of the best solution for long-term improvement, and actions taken based on an annual snapshot may result in “band-aid” solutions that may not meet long-term objectives. Notwithstanding the limits of using the annual reports to assess year-to-year trends, PSE believes the annual snap-shots provide a useful view in context of the overall trends.
PSE’s electric system covers a nine county geographical area. Refer to Appendix O: Current Year Geographic Location of Electric Service Reliability Customer Complaints on Service Territory Map with Number of Next Year’s Proposed Projects and Vegetation-Management Mileage for a map of the service area.

Chapter 11: SAIFI (SQI #4) 2011 Annual Puget Sound Energy SQI and Electric Service Reliability Report 60
11 SAIFI (SQI #4)
Overview
For electric companies, maintaining a high level of reliability requires constant commitment. Supplying power depends on an interconnected network of generation, transmission and distribution systems to get power to homes and businesses. Most customer interruptions can be traced to trees and equipment failure.
The System Average Interruption Frequency Index (SAIFI) measures the number of outages or interruptions per customer per year. Most electric utilities use this measurement in reviewing the reliability of their electrical system, excluding major outage events that cause interruptions to a significant portion of their customer base.
About the Benchmark
SAIFI is calculated by adding up the number of customers experiencing a sustained outage of 60 seconds or longer during the reporting period and then dividing it by the average annual number of electric customers. The formula follows:
Annual SAIFI = Total annual customer interruptions
Average annual electric customer count
At PSE, for the purpose of measuring the SAIFI SQI, major outage events are excluded from the performance calculation. More details concerning major outage events are in the Major Events section of Chapter 13: About Electric Service Reliability Measurements and Baseline Statistics. The SQI SAIFI measurement is also referred to as SAIFI5%.
• 5% Exclusion SAIFI (SAIFI5%) (Non-major-storm SAIFI)—Excludes customer interruptions during a major event. Major events are defined as days when five percent or more of the electric customer base in a 24-hour period experiences power interruption and the days following (carried-forward days), until all those customers have service restored.
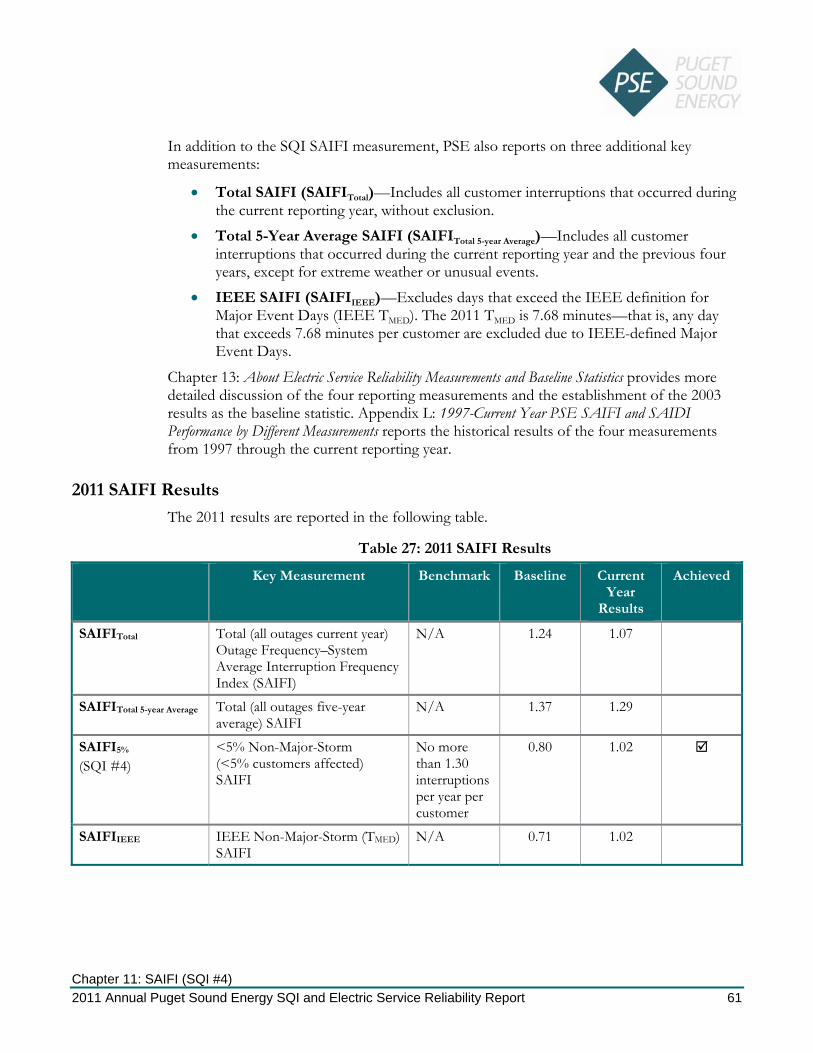
Chapter 11: SAIFI (SQI #4) 2011 Annual Puget Sound Energy SQI and Electric Service Reliability Report 61
In addition to the SQI SAIFI measurement, PSE also reports on three additional key measurements:
• Total SAIFI (SAIFITotal)—Includes all customer interruptions that occurred during the current reporting year, without exclusion.
• Total 5-Year Average SAIFI (SAIFITotal 5-year Average)—Includes all customer interruptions that occurred during the current reporting year and the previous four years, except for extreme weather or unusual events.
• IEEE SAIFI (SAIFIIEEE)—Excludes days that exceed the IEEE definition for Major Event Days (IEEE TMED). The 2011 TMED is 7.68 minutes—that is, any day that exceeds 7.68 minutes per customer are excluded due to IEEE-defined Major Event Days.
Chapter 13: About Electric Service Reliability Measurements and Baseline Statistics provides more detailed discussion of the four reporting measurements and the establishment of the 2003 results as the baseline statistic. Appendix L: 1997-Current Year PSE SAIFI and SAIDI Performance by Different Measurements reports the historical results of the four measurements from 1997 through the current reporting year.
2011 SAIFI Results
The 2011 results are reported in the following table.
Table 27: 2011 SAIFI Results
Key Measurement Benchmark Baseline Current Year
Results
Achieved
SAIFITotal Total (all outages current year) Outage Frequency–System Average Interruption Frequency Index (SAIFI)
N/A 1.24 1.07
SAIFITotal 5-year Average Total (all outages five-year average) SAIFI
N/A 1.37 1.29
SAIFI5%
(SQI #4) <5% Non-Major-Storm (<5% customers affected) SAIFI
No more than 1.30 interruptions per year per customer
0.80 1.02
SAIFIIEEE IEEE Non-Major-Storm (TMED) SAIFI
N/A 0.71 1.02

Chapter 11: SAIFI (SQI #4) 2011 Annual Puget Sound Energy SQI and Electric Service Reliability Report 62
What Influences SAIFI
PSE tracks outages by cause codes and groups the outage causes into three major categories: tree related, preventable and third party. System damage caused by trees and limbs impacted the most customers in 2011, as in previous years. Other major causes of outages within the other two categories include:
• Preventable − Equipment failures—In addition to equipment that ceases to operate
unexpectedly, this category also includes outages when a fuse properly operates to protect equipment when a branch or tree brushes against the line
− Bird or animal
• Third Party − Car-pole accidents − Scheduled outages for system maintenance or installation of new infrastructure
The following graph shows the common causes for outages in 2011 and their impact on customers across the four key measurements. As illustrated, tree-related outages drive the performance across the key measurements.
Common Outage Causes and Customer Impact across the Key Measurements
2011
-
200
400
600
800
1,000
1,200
1,400
1,600
Total Annual Total 5-YrAverage Annual
5% Exclusion IEEE
Cus
tom
ers
Inte
rrup
ted
(in th
ousa
nds)
Tree Related Preventable Third Party (Non-tree)
Figure 4: Common Outage Causes and Customer Impact Across the Key Measurements in 2011
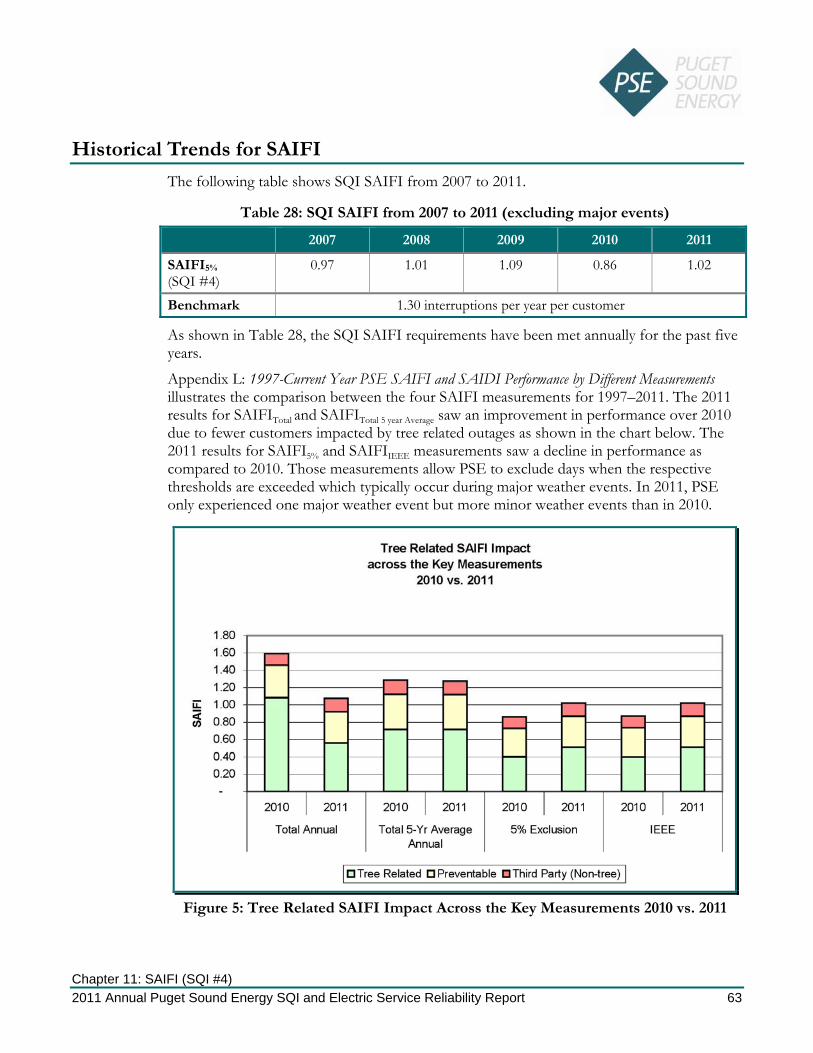
Chapter 11: SAIFI (SQI #4) 2011 Annual Puget Sound Energy SQI and Electric Service Reliability Report 63
Historical Trends for SAIFI
The following table shows SQI SAIFI from 2007 to 2011.
Table 28: SQI SAIFI from 2007 to 2011 (excluding major events)
2007 2008 2009 2010 2011
SAIFI5% (SQI #4)
0.97 1.01 1.09 0.86 1.02
Benchmark 1.30 interruptions per year per customer
As shown in Table 28, the SQI SAIFI requirements have been met annually for the past five years.
Appendix L: 1997-Current Year PSE SAIFI and SAIDI Performance by Different Measurements illustrates the comparison between the four SAIFI measurements for 1997–2011. The 2011 results for SAIFITotal and SAIFITotal 5 year Average saw an improvement in performance over 2010 due to fewer customers impacted by tree related outages as shown in the chart below. The 2011 results for SAIFI5% and SAIFIIEEE measurements saw a decline in performance as compared to 2010. Those measurements allow PSE to exclude days when the respective thresholds are exceeded which typically occur during major weather events. In 2011, PSE only experienced one major weather event but more minor weather events than in 2010.
Figure 5: Tree Related SAIFI Impact Across the Key Measurements 2010 vs. 2011
Chapter 11: SAIFI (SQI #4) 2011 Annual Puget Sound Energy SQI and Electric Service Reliability Report 64
Appendix K: Historical SAIDI and SAIFI by Area illustrates the 2009–2011 results by county under the four measurements. All counties except for Jefferson showed higher SAIFI5% and SAIFIIEEE measurements in 2011 than in 2010. However, six of the nine counties that PSE serves saw an improvement in SAIFITotal performance.
As described more fully in the Areas of Greatest Concern section of Chapter 13: About Electric Service Reliability Measurements and Baseline Statistics, PSE continues to focus on identifying projects that will affect SAIFI, while managing other aspects of system performance.
Chapter 12: SAIDI (SQI #3) 2011 Annual Puget Sound Energy SQI and Electric Service Reliability Report 65
12 SAIDI (SQI #3)
Overview
Providing reliable electric service is a top priority of electric companies. PSE’s maintenance programs, such as vegetation management and substation maintenance, capital investments and improving service personnel response, assessment and repair time are targeted to preventing or reducing the number and duration of outages. But in spite of PSE’s best efforts, sometimes power outages are simply unavoidable. Most outage minutes are caused by trees and vegetation. When the power does go out, PSE works around the clock to restore service as soon as possible.
The System Average Interruption Duration Index (SAIDI) measures the number of outage minutes per customer per year. Most electric utilities use this measurement in reviewing the reliability of their electrical system, excluding outage events that cause interruptions to a significant portion of their customer base due to extreme weather or unusual events.
SAIDI is similar to SAIFI, but SAIDI measures the duration of customer interruptions while SAIFI measures the number of customer interruptions.
About the Benchmark
SAIDI is calculated by adding up the outage minutes of all the customers that have been without power and then dividing by the average annual number of electric customers. The formula follows:
Annual SAIDI = Total annual customer outage minutes Average annual electric customer count
Starting in the 2010 reporting year, the UTC approved a revision to the SQI SAIDI benchmark to be the average of total customer minutes from the current reporting year and the previous four years. The new benchmark and performance calculation better reflects the overall customer experience regarding power restoration and more adequately measures PSE’s overall electric system reliability.
At PSE, the SQI SAIDI measurement is referred to as Total 5-Year Average SAIDI (SAIDITotal 5-year Average).
• Total 5-Year Average SAIDI (SAIDITotal 5-year Average)—Includes all customer-minute interruptions that occurred during the current reporting year and the previous four years, except for extreme weather or unusual events.17
17 Per Docket Number UE-072300, PSE can petition to exclude certain annual results or outage minutes from the annual performance calculation for the current year and years following that will be affected.

Chapter 12: SAIDI (SQI #3) 2011 Annual Puget Sound Energy SQI and Electric Service Reliability Report 66
In addition to the SQI SAIDITotal 5-year Average measurement, PSE also reports on three additional key measurements:
• 5% Exclusion SAIDI (SAIDI5%) (Non-major-storm SAIDI)—Excludes customer-minute interruptions during major events, where major events are defined as days when five percent or more of the electric customer base in a 24-hour period experiences power interruption and the days following (carried-forward days), until all those customers have service restored.
• Total SAIDI (SAIDITotal)—Includes all customer minute interruptions that occurred during the current reporting year, without exclusion.
• IEEE SAIDI (SAIDIIEEE)—Measures the number of customer-minute interruptions utilizing the IEEE standard 1366 methodology. Days that exceed the IEEE TMED are excluded. The 2011 TMED is 7.68 minutes—that is, any day that exceeds 7.68 minutes per customer is excluded due to IEEE-defined Major Event Days.
Chapter 13: About Electric Service Reliability Measurements and Baseline Statistics provides more detailed discussion of the four reporting measurements and the establishment of the baseline statistics. Appendix L: 1997-Current Year PSE SAIFI and SAIDI Performance by Different Measurements reports the historical results of the four measurements from 1997 through the current reporting year.
2011 SAIDI Results
The 2011 results are reported in the following table.
Table 29: 2011 SAIDI Results
Key Measurement Benchmark Baseline Current Year
Results
Achieved
SAIDITotal Total (all outages current year) Outage Frequency–System Average Interruption Duration Index (SAIDI)
N/A 532 163
SAIDITotal 5-year Average
(SQI #3) Total (all outages five-year average) SAIDI
No more than 320 minutes per customer per year
326 281
SAIDI5% <5% Non-Major-Storm (<5% customers affected) SAIDI
N/A 132 144
SAIDIIEEE IEEE Non-Major-Storm (TMED) SAIDI
N/A 107 144
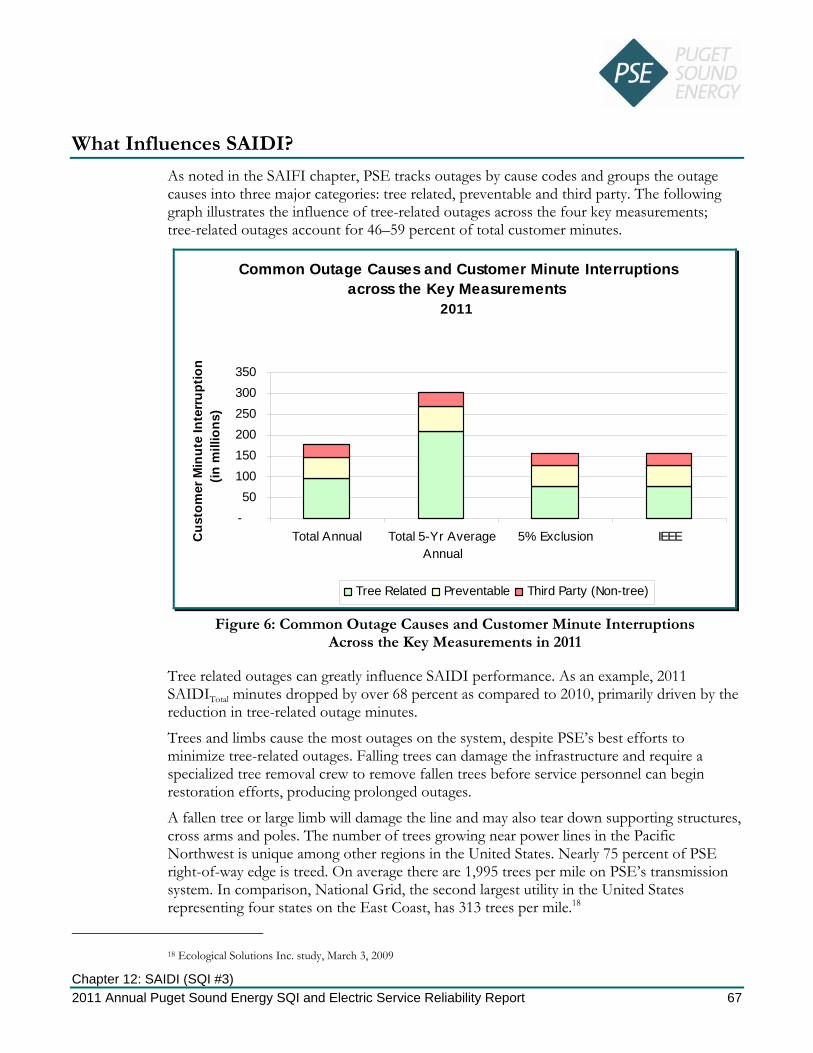
Chapter 12: SAIDI (SQI #3) 2011 Annual Puget Sound Energy SQI and Electric Service Reliability Report 67
What Influences SAIDI?
As noted in the SAIFI chapter, PSE tracks outages by cause codes and groups the outage causes into three major categories: tree related, preventable and third party. The following graph illustrates the influence of tree-related outages across the four key measurements; tree-related outages account for 46–59 percent of total customer minutes.
Common Outage Causes and Customer Minute Interruptions across the Key Measurements
2011
-50
100150200250300350
Total Annual Total 5-Yr AverageAnnual
5% Exclusion IEEECus
tom
er M
inut
e In
terr
uptio
n(in
mill
ions
)
Tree Related Preventable Third Party (Non-tree)
Figure 6: Common Outage Causes and Customer Minute Interruptions Across the Key Measurements in 2011
Tree related outages can greatly influence SAIDI performance. As an example, 2011 SAIDITotal minutes dropped by over 68 percent as compared to 2010, primarily driven by the reduction in tree-related outage minutes.
Trees and limbs cause the most outages on the system, despite PSE’s best efforts to minimize tree-related outages. Falling trees can damage the infrastructure and require a specialized tree removal crew to remove fallen trees before service personnel can begin restoration efforts, producing prolonged outages.
A fallen tree or large limb will damage the line and may also tear down supporting structures, cross arms and poles. The number of trees growing near power lines in the Pacific Northwest is unique among other regions in the United States. Nearly 75 percent of PSE right-of-way edge is treed. On average there are 1,995 trees per mile on PSE’s transmission system. In comparison, National Grid, the second largest utility in the United States representing four states on the East Coast, has 313 trees per mile.18
18 Ecological Solutions Inc. study, March 3, 2009

Chapter 12: SAIDI (SQI #3) 2011 Annual Puget Sound Energy SQI and Electric Service Reliability Report 68
High winds in the fall season increase the risk of tree limb failure in deciduous trees because the trees have not fully shed their leaves. The crown of a tree is less permeable when fully leafed; thus, there is a greater degree of limb breakage due to the “sail” effect. The fully leafed crown acts like a sail causing a higher degree of wind loading or pressure on branches and limbs and increases the potential for breakage.19
Response and Repair Time
Response and repair time also play an important factor to SAIDI. How long it takes to restore service depends on the complexity of the system, the number and types of system components damaged, the extent of the damage and the location of the problem. The number of outages occurring at one time can also impact the availability of repair personnel to respond, thus adding to outage minutes.
PSE tracks all outage events longer than sixty seconds. The outage length is composed of response, assessment and repair time. Response time, the time from when the customer or the Automated Meter Reading (AMR) system notifies PSE that an outage has occurred, until a service technician arrives at the site of the outage, is measured by SQI #11, Electric Safety Response Time. Response and repair time for service providers are also tracked and measured. See Chapter 7: Electric Safety Response Time (SQI #11) for more detail.
In 2010 the average response time was 52 minutes and in 2011 it was 51 minutes. The 5% exclusion major events, as well as localized emergency event days, are excluded from this metric.
PSE tracks a job completion metric with our electric maintenance and construction service provider to monitor the service provider crew performance. Pre-determined event types that are beyond the control of the service provider are either excluded from the metric or adjusted on a case-by-case basis. Examples include access issues and third-party constraints that might hamper the service provider’s ability to repair the outage in a timely manner. See Chapter 9: Customer Construction Services Department and Service Provider Performance for more detail.
Each of the Electric Safety Response Time metric (SQI #11) and the Service Provider Secondary Safety Response and Restoration Time metrics (SP Indices #4C and 4D) is designed to measure a specific part of PSE’s outage restoration effort which should not be compared with any of the SAIDI measures. The three response time metrics track different tasks of restoration and exclude specific outages therefore they are not comparable to each other.
19 The Effects of Pruning Type on Wind Loading of Acer Rubrum – E. Thomas Smiley and Brian Kane

Chapter 12: SAIDI (SQI #3) 2011 Annual Puget Sound Energy SQI and Electric Service Reliability Report 69
Historical Trends for SAIDI
The following table shows SQI SAIDI from 2007 to 2011. The 2007 through 2009 results use the benchmark that was established at the time. The 2010 and 2011 results use the revised benchmark that was approved for the 2010–2013 reporting years.
Table 30: SQI SAIDI from 2007 to 2011
2007 2008 2009 2010 2011
SAIDITotal 5-year Average
(SQI #3) 167 163 190 287 281
Benchmark 136 minutes per customer per year, excluding 5% major events
320 minutes per customer per year, all outage events
Appendix L: 1997-Current Year PSE SAIFI and SAIDI Performance by Different Measurements illustrates the comparison between the four SAIDI measurements for 1997-2011. Under the revised SQI SAIDI benchmark methodology and requirements, PSE’s performance met the annual benchmark between 1997 through 2011 with the exception of 2003. The 2011 results for SAIDITotal and SAIDITotal 5 year Average saw an improvement in performance as compared to 2010 because there was only one major storm in PSE's service territory during 2011.
The 2011 results for the SAIDI5% and SAIDIIEEE measurements saw a decline in performance as compared to 2010. Those measurements allow PSE to exclude days when the respective thresholds are exceeded which typically occur during major weather events. While PSE experienced only one major weather event in 2011, there were more minor weather events than in 2010 which led to the decline in these two measurements.
The chart that follows illustrates the impact of tree-related outages. Tree-related outages account for over 50 percent of all customer-outage minutes during the last five years, ranging from a high of 85 percent in 2010 to a low of 55 percent in 2009 and 2011. The large swing in minutes reflect the impact of major weather events experienced each year. While PSE makes efforts to reduce tree-related outages through the Vegetation Management and Tree Watch programs, it is cost-prohibitive to completely eliminate tree-related outages. The Working to Uphold Reliability section in Chapter 13: About Electric Service Reliability Measurements and Baseline Statistics describes PSE efforts to manage tree-related outages.

Chapter 12: SAIDI (SQI #3) 2011 Annual Puget Sound Energy SQI and Electric Service Reliability Report 70
Outage Causes
-
100
200
300
400
500
600
2007 2008 2009 2010 2011
Tota
l Ann
ual S
AIDI
Min
utes
Tree Related - Major Storms Tree Related - Non Storm Preventable Third Party (Non-tree)
Figure 7: Outage Causes
Appendix K: Historical SAIDI and SAIFI by Area illustrates the 2009–2011 results by county under the four measurements. All counties except for Whatcom saw an improvement in SAIDITotal in 2011. However, most counties had a decline in SAIDI5% and SAIDIIEEE performance in 2011, not surprising given that PSE had only one major weather event excluded but more minor weather events included than in 2010 under both criteria.
As described more fully in the Areas of Greatest Concern section of Chapter 13: About Electric Service Reliability Measurements and Baseline Statistics, PSE continues to focus on identifying projects that will affect SAIDI, while managing other aspects of system performance.
Chapter 13: About Electric Service Reliability Measurements and Baseline Statistics 2011 Annual Puget Sound Energy SQI and Electric Service Reliability Report 71
13 About Electric Service Reliability Measurements and Baseline Statistics
Overview
PSE, like most utilities, utilizes industry standard Electric Service Reliability indices to monitor its annual performance. PSE benchmarks itself against four key measurements, which provide a more complete representation of the overall electric customer service reliability. The standard formulas, as noted in the SAIFI and SAIDI chapters, are used to calculate each of the measurements but with one critical difference that showcases a particular area of electric service reliability performance. Each measurement is based on specific criteria:
• Total Annual − SAIFI—Measures all electric customer service interruptions that occurred during
a calendar year without any exclusion. − SAIDI—Measures total number of all electric customer outage minutes in a
calendar year without any exclusion.
• Total 5-Year Average Annual − SAIFI—Measures the rolling five-year average of all customer interruptions that
occurred during the current reporting year and the previous four years, except for extreme weather or unusual events.
− SAIDI—Measures the rolling five-year average of all customer minute interruptions from the current reporting year and previous four years, except for extreme weather or unusual events.
• 5% Exclusion − SAIFI—Measures the annual average number of customer interruptions
excluding major outage event days when five percent or more of customers are without power during a 24-hour period and the additional days needed to restore service to all those customers.
− SAIDI—Measures the total annual number of customer outage interruption minutes from the current year excluding major outage event days when five percent or more of customers are without power during a 24-hour period and the additional days needed to restore service to all those customers.

Chapter 13: About Electric Service Reliability Measurements and Baseline Statistics 2011 Annual Puget Sound Energy SQI and Electric Service Reliability Report 72
• IEEE1366 − SAIFI—Measures the annual average number of customer interruption utilizing
the IEEE standard 1366 methodology. Days with daily total SAIDI that exceed the IEEE TMED threshold values are excluded.
− SAIDI—Measures number of customer-minute interruptions utilizing the IEEE standard 1366 methodology. Daily SAIDI results that exceed the IEEE TMED threshold values are excluded.
The formula for calculating each of these measurements can be found in Appendix H: Electric Reliability Terms and Definitions.
Baseline Year
To meet UTC requirements, PSE established 2003 as its baseline year. While meeting the requirements, PSE would prefer to develop a baseline using multiple years, which mitigates the fluctuation of reliability statistics and proves more useful in trend analysis. PSE cautions against the usefulness of using a single year’s system performance data or information to attempt to assess year-to-year trends. Such trend analysis may not prove useful, and PSE feels there is limited usefulness in designating one specific year’s information as a “baseline.”
Major Events
In 2011, weather was relatively mild as PSE only experienced one major weather event that met both the 5% exclusion and IEEE exclusion criteria:
• A February wind event that affected customers in Kitsap and Jefferson Counties and Vashon Island
Typically, an event that meets the 5% Exclusion Major Event Day criteria will also exceed the IEEE TMED criteria. Since the initial reporting of the IEEE methodology in 2003, all 5% Exclusion Major Event Days have met the IEEE TMED criteria.
IEEE TMED is based on the customer minutes rather than the number of customers impacted. Therefore, if PSE experiences a weather event that is isolated to small geographic area or a less populated county, it is possible to have events that exceed the IEEE TMED but not meet the 5% exclusion criteria. There have been 18 such events since PSE has started reporting IEEE statistics in 2003.

Chapter 13: About Electric Service Reliability Measurements and Baseline Statistics 2011 Annual Puget Sound Energy SQI and Electric Service Reliability Report 73
Table 31: 2011 Comparison Between IEEE and 5% Exclusion Methods
IEEE TMED Exclusion Dates
Daily SAIDI
5% Customers Out Exclusion
Cause Span of 5% Customers Out Exclusion Dates
2/14/2011 18.79 5.28% Wind 2/14/2011 @ 1700 – 2/15/2011 @ 1100
The below table details the 2007 through 2011 IEEE TMED values, number of IEEE exclusion dates, number of 5% exclusion events and number of 5% exclusion event days. Since 2003, when PSE started reporting IEEE exclusions dates, 2011 was the first year that PSE experienced only one IEEE and 5% exclusion events.
Table 32: 2007 to 2011 Comparison of IEEE and 5% Exclusion Events
2007 2008 2009 2010 2011
IEEE TMED 6.87 7.36 6.95 7.21 7.68
Number of IEEE Major Event Days
7 4 7 10 1
Number of 5% Exclusion Major Events
4 1 2 6 1
Number of 5% Exclusion Major Event Days
16 5 4 20 2
Areas of Greatest Concern
The regional area planners study “area-of-concern” circuits and propose projects that will improve the reliability for those customers. These areas of greatest concern provide focus for the planner in developing electric system improvement projects; however, all areas are continually evaluated for electric service reliability improvement. To assist with identifying the highest priority projects for reliability, PSE focuses on the 50 worst-performing circuits over the past five years that consistently contributed the most customer-minute interruptions.
Each circuit is ranked by the total customer-minute interruptions seen by the circuit for each of the previous five years. The 50 worst-performing circuits are the circuits with the highest ranking. The percentage contribution of the 50 worst-performing circuits towards the total distribution customer-minute interruptions has decreased slightly, indicating that the system projects completed on the circuits has improved reliability.
Based upon reviewing the outage history, number of customers impacted, outage location and other factors, planners propose projects that are designed to improve reliability on these circuits. Appendix N: Areas of Greatest Concern with Action Plan details the 2010 and 2011 annual ranking of the 50 worst-performing circuits along with PSE’s completed or future plan for system improvements on each circuit.

Chapter 13: About Electric Service Reliability Measurements and Baseline Statistics 2011 Annual Puget Sound Energy SQI and Electric Service Reliability Report 74
Since annual outage data for the year is not typically finalized until the following mid-February, the planners identify and develop projects throughout the year. Some projects are approved and released throughout the year, and some may be identified for the following budget year.
In addition, PSE also evaluates the 50 worst-performing circuits based on “circuit SAIDI.” Circuit SAIDI measures the performance of individual circuits as experienced by the customers on those circuits. This tends to be a customer-centric view because customer density on the circuit has less influence on the measure.
The four regional planning teams—Whatcom/Skagit/Island, North King County, South King County, Pierce/Thurston/Kitsap/Jefferson—continually review the performance of the distribution system in their respective regions. Each team reviews the 50 worst-performing circuits in their regions in proposing reliability projects for the upcoming year that compete with other system-related projects for funding.
A discussion of the Total Energy System Planning (TESP) process that the planners use to have their proposed projects considered for funding can be found in Chapter 7 Delivery Infrastructure Planning of PSE’s 2011 Integrated Resource Plan at PSE.com.
In addition to the annual process as described above, new projects are identified and released for construction throughout the year. These projects can be a result of a new initiative such as the 10+ year reliability initiatives program, a municipality altering its infrastructure plans, new system performance issues or addressing a resource need for a given area.
Customer Electric Reliability Complaints
Customer concerns and complaints are additional indices that measure PSE’s success in delivering safe and reliable electric service. For the five years from 2007 through 2011, PSE has experienced a decrease or remained static in the numbers of outage-related complaints received either by PSE or the UTC.
In 2011, the UTC received 17 complaints relating to the reliability of PSE’s energy-delivery system. These complaints are shown in Appendix M: Current-Year Commission and Rolling-Two-Year PSE Customer Electric Service Reliability Complaints with Resolutions. See Table 39. During the rolling two-year period of 2010–2011, PSE received repeat complaints from 24 customers relating to reliability and power quality concerns. These complaints came through PSE’s complaint process as described in Appendix I: Electric Reliability Data Collection Process and Calculations and are shown in tabular form in Appendix M: Current-Year Commission and Rolling-Two-Year PSE Customer Electric Service Reliability Complaints with Resolutions. See Table 40. PSE continually investigates customer complaints and tracks ongoing service issues as they are communicated. Customers receive follow-up correspondence to discuss their concern, as well as plans for resolution. Each planner investigates the outage history surrounding each customer complaint, reviews the overall circuit reliability and then prepares an appropriate plan for resolution.

Chapter 13: About Electric Service Reliability Measurements and Baseline Statistics 2011 Annual Puget Sound Energy SQI and Electric Service Reliability Report 75
Depending on the nature of the circuit reliability, the plan for resolution could be continued monitoring of the circuit. Or a planner may propose projects which will improve the circuit reliability. The map in Appendix O: Current Year Geographic Location of Electric Service Reliability Customer Complaints on Service Territory Map with Number of Next Year’s Proposed Projects and Vegetation-Management Mileage summarizes the number of complaints by county for 2011.
Working to Uphold Reliability
To continually improve and provide reliable electric service throughout its service area, PSE reviews the cause of outages to better understand performance at the subsystem level. Appendix J: Current Year Electric Service Outage by Cause by Area details the outage causes in each county in 2011. It shows that trees (TF, TO, TV), birds and animals (BA) and equipment failures (EF) continue to be the primary reasons for outages in 2011 as in previous years. While the number of scheduled outages (SO) is significant, it is not considered a reliability concern because the scheduled outages are usually taken to perform system upgrades and maintenance, which results in higher system reliability. This section discusses the efforts PSE takes to reduce the number of outages and the overall duration of outages.
The map in Appendix O: Current Year Geographic Location of Electric Service Reliability Customer Complaints on Service Territory Map with Number of Next Year’s Proposed Projects and Vegetation-Management Mileage shows the number of reliability projects and vegetation mileage by county PSE has proposed for 2012.
Vegetation Management
The general increase in SAIFI and SAIDI indices over the past few years is attributed to the increasing outages related to vegetation. Trees remain a vital element of the region’s quality of life, but they are also a major cause of power outages for local homes and businesses. To mitigate trees and limbs falling into electric power lines, PSE performs vegetation maintenance based on a cyclical schedule. The maintenance program focuses on achieving a safe and reliable system. Vegetation Management involves a variety of practices and techniques designed to keep trees and limbs from coming in contact with power lines and causing outages. Less than 10 percent of tree-related outages are caused by tree growth, illustrating an effective Vegetation Management Program.20
Cyclical Programs
PSE spends more than $12.5 million annually on a systematic, cyclical vegetation-management program to reduce outages in its overhead electric distribution, high-voltage distribution and transmission systems.
20 Ecological Solutions Inc. October 2008 page 39

Chapter 13: About Electric Service Reliability Measurements and Baseline Statistics 2011 Annual Puget Sound Energy SQI and Electric Service Reliability Report 76
• Overhead distribution system—Usually trees are trimmed every four years for distribution lines in urban areas and every six years for lines in rural areas. − Those trees that are an imminent threat of falling into power lines (danger trees)
are removed in these rights-of-way or within 12 feet of the system at the same time that trees are trimmed.
− PSE usually completes roughly 2,000 miles of vegetation management on its distribution rights-of-way each year. Expanded efforts to meet new tree clearing requirements on transmission systems were completed in 2009 and efforts were made in 2010 to return to a four- and six-year distribution schedule. In 2011, PSE completed 1,997 miles of vegetation management. The maintenance cycle is planned to be back on schedule by 2013.
• High-voltage distribution system and cross-country transmission corridor system—Trees are trimmed every three years on PSE’s high-voltage distribution rights-of-way and annually in transmission corridors. Spray and mowing activities are performed and danger trees are removed along the edge of these corridors, typically within 12 feet of the system at the same time trees are trimmed. In 2011: − 564 miles of high-voltage distribution lines were maintained − 370 miles of transmission corridors were maintained under federal clearing
requirements − The danger-tree patrol of the high-voltage distribution system was completed
prior to the storm season on 1,762 miles of high-voltage line. The patrol identifies imminent hazard trees that could potentially fall during a wind storm. These trees are either trimmed or removed.
• Fast growing, undesirable species—Hot spotting and mid-cycle work and patrols occur yearly on the overhead distribution, high-voltage distribution and the transmission corridors to remove fast-growing, undesirable species of trees. − In 2011, a total of 300 miles were treated for undesirable trees.
TreeWatch Program
PSE also manages vegetation impacts with its TreeWatch program. Within this program, certified arborists work with communities and property owners to identify and remove “at-risk” trees on private property that are more than 12 feet away from power lines located beyond the limits of normal cyclical vegetation management standards. In 2011, the TreeWatch program addressed approximately 200 miles of transmission and high-voltage distribution lines and 120 miles of distribution lines. Over 11,000 trees were removed or pruned. In 2012, PSE plans to remove or prune another 15,000 off-right-of-way trees under the TreeWatch program. Our focus will be on those distribution circuits that continue to have tree-related outages, focusing on transmission, and high-voltage distribution lines.
Chapter 13: About Electric Service Reliability Measurements and Baseline Statistics 2011 Annual Puget Sound Energy SQI and Electric Service Reliability Report 77
Tree Replanting Program
PSE devotes about $500,000 each year to replanting trees and non-construction-related mitigation in PSE’s service area. In addition, to help customers improve system reliability, PSE has developed a vegetation planning guide called Energy Landscaping. The handbook helps customers evaluate landscaping opportunities and is a how-to for planting trees and shrubs and tree-care solutions. It also lists recommended trees and shrubs to plant near power lines.
Distribution, High-Voltage Distribution and Transmission Vegetation-Management Study
A vegetation-management study was conducted on PSE’s overhead electric transmission system by Ecological Solutions, Inc. The results validate that Puget Sound Energy’s pruning maintenance cycles are appropriate for the local tree growth rates. Additionally, the study illustrates that trees growing off the right-of-way are increasingly contributing to transmission system outages. The study concluded that 80 percent of tree-related outages are caused by trees from outside the right-of-way and 68 percent of trees that fail and cause outages are healthy trees. The study further suggests that outages caused by damage from healthy trees can only be addressed by reducing the electric system’s exposure to trees, which based upon species and quantities may be impractical in PSE’s case.21
The study also revealed that: one-third of all tree-related outages are due to limbs falling on lines and a tree with branches overhanging a power line is twice as likely to cause an outage as a tree that had its overhanging branches removed. The study recommended that all branches overhanging power lines be removed, resulting in a reduction of tree-related outages.
Targeted Reliability Improvements
Along with vegetation management to minimize tree-related outages, PSE has implemented other programs to reduce the frequency and duration of outages on the transmission and distribution systems with a particular focus on improving the reliability on the 50 worst-performing distribution circuits. These programs include replacing existing overhead distribution wire with tree wire to prevent tree limb outages, installing more sectionalizing devices, replacing aging infrastructure, installing covered wire and devices to prevent animal-related outages, and maintaining key equipment in substations.
Tree Wire
PSE works to reduce outages by installing “tree wire,” which is a tough, thick-coated power line capable of withstanding contact with tree branches that would otherwise cause an outage. In 2011, 25.8 circuit miles of tree wire was installed.
21 Ecological Solutions Inc 3/09 study

Chapter 13: About Electric Service Reliability Measurements and Baseline Statistics 2011 Annual Puget Sound Energy SQI and Electric Service Reliability Report 78
Reclosers
In 2008, a high-level roadmap was developed to improve reliability and identify cost-effective tactics for planning consideration. One effective tactic is the installation of reclosers. These devices are an improvement over conventional fuses. With a conventional fuse, a temporary fault, typically a branch brushing against the line, causes the fuse to blow open and de-energize the line. Service is not restored until a service technician patrols the line and manually replaces the blown fuse using a bucket truck.
In comparison, reclosers sense the fault on the power line and automatically attempt to re-energize the line. If the recloser no longer senses the fault, it will reclose and re-energize the line. If the fault is not temporary, the damaged section of the line can be isolated quickly with a gang-operated switch, which can be operated from the ground. Gang-operated switches provide the ability to simultaneously disconnect the three-phase lines rather than one phase at a time.
In 2011, 29 reclosers and 61 gang-operated disconnect switches were installed.
Substation Maintenance
Substations are the key hubs connecting high-voltage lines and the distribution lines that serve customers. Substations typically serve between 500 and 5,000 customers and contain major pieces equipment, technologies to monitor and operate the system and backup systems such as batteries. These important substations are inspected monthly. Maintenance programs are in place to ensure performance and efficiently maintain expensive equipment.
As PSE continues to add more infrastructure, such as new lines and distribution substations to serve new loads, the design criteria considers reliability measures as well. For example, adding a new substation requires the installation of the transmission and distribution lines; to enhance reliability and operational flexibility, the lines typically connect to adjacent substations. This enables the operational ability to shift customers to the neighboring substations during an outage.
SCADA
Supervisory Control and Data Acquisition (SCADA) is an important aspect of operating the system. SCADA is a system used for monitoring and controlling substation equipment that will enable faster restoration of power to the customers. In 2011, 16 distribution substations were upgraded with SCADA. Ninety-nine percent of PSE’s distribution substations have SCADA.

Chapter 13: About Electric Service Reliability Measurements and Baseline Statistics 2011 Annual Puget Sound Energy SQI and Electric Service Reliability Report 79
Aging Infrastructure
Cable Remediation
For an underground power-distribution system, age and moisture make buried cable vulnerable to failures and prolonged outages. Since 1989, PSE has managed a cable remediation program that considers two remediation options: silicone injection or cable replacement.
• Silicone injection extends the life of underground power cable for 20 years by restoring the cable’s insulating properties.
• Replacement installs a new system with an expected life that exceeds 30 years.
Based on a 2007 study, silicone injection is only economically viable on single phase installations. This is based on a full analysis of total life cycle costs that included current silicone injection costs, trenching costs, cable neutral condition and operational considerations. Since this time, approximately 10 percent of cables receive silicone injection and the remaining cables are replaced.
In 2011, 75 miles of cable was remediated. PSE’s cable remediation program prevented an estimated 2,390 outages in 2011.
Pole Test and Treat and Replacement Programs
In an overhead power system, the failure of a utility pole can cause an outage that could affect thousands of customers. To minimize the risk of such a large outage, PSE has a pole inspection and replacement program for both transmission and distribution wood poles. In 2011, there were 38 outages caused by a structural failure on the pole.
PSE assesses each pole’s condition by excavating around the base to determine the extent of below-ground decay and by boring into the pole to assess decay within the pole. The remaining strength of the pole is calculated based on the measurements of decay. Poles whose remaining strength still meets National Electric Safety Code (NESC) guidelines are treated with an internal fumigant, which extends its serviceable life, while those not meeting NESC guidelines are scheduled for replacement.
Industry data shows that the average serviceable life of a pole in the Pacific Northwest without remedial treatment is 43 years. Poles which have received routine treatment throughout their life last significantly longer; industry data suggests the average life could be 100 years or more. Transmission poles are inspected on a 10-year cycle; distribution poles are inspected on a 15-year cycle. In 2011, 17,306 poles were inspected and treated (10,132 distribution and 7,174 transmission) and 1,090 poles were replaced (737 distribution and 353 transmission).
Chapter 13: About Electric Service Reliability Measurements and Baseline Statistics 2011 Annual Puget Sound Energy SQI and Electric Service Reliability Report 80
Aging Overhead Infrastructure
Many of the tree-related outages result from the failure of smaller aging overhead wires, such as copper primary and open-wire secondary. These smaller wires break due to the impact of the failing branches leading to longer customer outages. PSE is replacing these smaller aging wires with larger steel-reinforced stranded-aluminum wires, per current standards, that will better withstand the impact of falling branches. The larger wires will also enable more customers to be served in the future, as well as improve reliability. In 2011, 23.7 miles of smaller diameter wire was replaced.
Substation Equipment Replacement Programs
Upgrades to the substations and equipment are important strategies for reliability. Specific types of equipment are proactively replaced under replacement programs to maintain system reliability, reduce operational costs and offset impacts from aging infrastructure. In 2011, one transmission breaker, 17 distribution breakers and one relay package were replaced and two Spill Prevention, Control, and Countermeasure (SPCC) and grounding projects were completed under these programs.
In 2011, PSE hired an independent consultant to review our aging infrastructure programs. The report concluded that while PSE's practices mirrored much of the industry there were opportunities for improvement. The key recommendation for improvement is to transition to an economic life strategy, which includes consequence costs in the calculation for end-of-life of the asset.
Wildlife
In 2011, there were over 1,200 bird and animal caused outages, the lowest number recorded in the last 10 years. Birds and other animals have historically caused nearly 2,000 outages annually; however, each of these outage events typically only impacts 30 to 45 customers per event. Since 2004, animal-and bird-related outages have been decreasing despite an increase in eastern grey squirrel populations.
In early 2000, PSE modified its construction standards to reduce the risk of animal-related outages. Today, all equipment poles are upgraded with bushing covers, cutout covers and covered jumpers when maintenance activities are performed. In addition, new transformers and other electrical equipment come equipped with bushing covers. New electric infrastructure projects that are located within avian-designated safe habitats are constructed to avian-safe standards.
PSE’s Avian Protection Program tracks all avian-related outages and retrofits mortality sites using avian-protection products and techniques to reduce the risk of repeat outages and avian mortality. The Program proactively adds avian protection to circuits that are identified as potential sites for an avian-caused outage or mortality. In 2011, the PSE Avian Protection Program completed 30 avian-protection retrofit projects, in response to over 155 bird mortalities, including 10 eagles, 46 swans and 13 raptors. Over 380 poles and spans were retrofitted to reduce risk of outages and avian mortalities.

Chapter 13: About Electric Service Reliability Measurements and Baseline Statistics 2011 Annual Puget Sound Energy SQI and Electric Service Reliability Report 81
Third-Party Outages
When a vehicle hits a utility pole or similar third-party events occur, some customers will likely lose power. As part of a continuous effort, PSE planners review the location of the poles whenever a car-pole incident causes an outage. The pole may be relocated if the pole is likely to be hit again.
Planned Outages
Scheduled outages, typically for connecting new or upgrading existing infrastructure, are the third leading cause of non-storm service interruptions. Unfortunately, service must be interrupted to safely connect new power lines or replace aging or damaged infrastructure. And the more improvements that are made, the more planned outages are necessary.
Response Time Initiative
PSE recognizes that the time it takes for a serviceman to arrive to the outage site, assess the damage, and determine the appropriate plan of action impact the length of time a customer is out of power. Starting in late 2010 and into 2011, PSE reviewed and evaluated the outage response process in order to further understand the drivers of response time. Results of the study indicated that there were varied factors that drove response time. PSE and its service provider continue to dispatch crews in parallel with servicemen on specific outages such as car-pole accidents and radial underground cable failures.
Going Forward
In 2012, PSE will continue its programs as described earlier. Specifically:
• Vegetation Management − Continue cycle maintenance with additional efforts to be back on schedule by
2013. − Remove or prune 15,000 off-right-of-way trees under the TreeWatch program,
again focusing on worst performing distribution circuits, transmission and high-voltage distribution lines.
− Conduct an aggressive tree trimming and overhanging branch reduction pilot study in the West Kitsap County area. The purpose of the pilot is to examine the effect of aggressive vegetation management on reliability relating to tree related outages. The circuit where this pilot study will occur is Chico-12, which has a history of tree-related outages and is one of the worst performing circuits in the company. The tree work is planned to be completed by fall 2012 and the impacts to reliability will be monitored annually.
Chapter 13: About Electric Service Reliability Measurements and Baseline Statistics 2011 Annual Puget Sound Energy SQI and Electric Service Reliability Report 82
• Targeted Reliability Improvements − 50 Worst-Performing Circuits—PSE will continue to monitor the performance
of the 50 worst-performing circuits as outlined in the Areas of Greatest Concern section of this chapter. Value-added projects will be developed to improve the reliability of these circuits. Appendix M: Current-Year Commission and Rolling-Two-Year PSE Customer Electric Service Reliability Complaints with Resolutions and Appendix N: Areas of Greatest Concern with Action Plan provide specific plans for system improvements on each circuit.
− Aging Infrastructure—PSE will continue the aging infrastructure programs such as cable remediation, and replacing failing poles and smaller overhead wires.
○ In addition to existing aging infrastructure programs, a 2012 initiative is currently underway to formalize PSE's assessment of risk to the transmission system due to aging breakers and transformers. This initiative is a result of the 2011 consultant’s study of PSE’s aging infrastructure programs. The initiative involves creating a model for assessing the equipment’s condition, determining projected failure rates of the equipment based on condition, assessing the consequence of failure in each incidence and assessing the system risk. The initiative will allow a systematic and repeatable measurement of system risk and assist in prioritizing work and establishing appropriate replacement rates.
− Distribution Sectionalizing Devices—PSE will continue to install additional sectionalizing devices on the distribution system to help minimize outages and outage times. These devices include reclosers, switches and fuses. Also, PSE will be evaluating and potentially piloting at least one recloser with communication for remote monitoring and control.
− Targeted Reliability Programs—PSE will continue to install covered conductor (tree wire) to prevent tree-limb outages and convert overhead lines to underground. Replacing failing poles and installing animal guards are incorporated in the scope of some of these projects as appropriate. This has a secondary benefit of preventing outages caused by wildlife.
− Substations—PSE will continue to install SCADA in the distribution substations based on specific benefit and cost. Also, PSE will be installing supervisory control of the feeder breakers and ampere readings on all three-phase breakers at critical distribution substations.
− Bellevue Central Business District (CBD) SCADA project—The distribution system in the City of Bellevue CBD is very dense. When an outage occurs, it takes time to access switches in parking garages and/or sidewalks within the downtown core to identify, isolate and restore power to the high-rise buildings. In a review of how other utilities serve similar loads there is an indication that the urban model of manual restoration should be replaced with remote SCADA switchgear to reduce the outage impact and to manage the system. This project is in year one of a five-year strategy to place SCADA switches into the CBD and to automate these as the systems develop.

Chapter 13: About Electric Service Reliability Measurements and Baseline Statistics 2011 Annual Puget Sound Energy SQI and Electric Service Reliability Report 83
• Outage Management System − PSE will establish an operational outage management system (OMS) by
October 1, 2012. The new OMS will enable PSE to more quickly pinpoint the sources of power outages, efficiently direct repair efforts and help the company more accurately predict restoration times during day-to-day operations.

Appendices 2011 Annual Puget Sound Energy SQI and Electric Service Reliability Report 84
Appendices
This section contains the following appendices:
• A: Monthly SQI Performance − Attachment A to Appendix A—Major Event and Localized Emergency Event Days
(Affected Local Areas Only) − Attachment B to Appendix A—Major Event and Localized Emergency Event Days
(Non-Affected Local Areas Only) − Attachment C to Appendix A—Gas Reportable Incidents and Control Time
• B: Certification of Survey Results • C: Penalty Calculation (Not Applicable for 2011) • D: Proposed Customer Notice (Report Card) • E: Disconnection Results by Month • F: Customer Service Guarantee Performance Detail • G: Customer Awareness of Customer Service Guarantee • H: Electric Reliability Terms and Definitions • I: Electric Reliability Data Collection Process and Calculations • J: Current Year Electric Service Outage by Cause by Area • K: Historical SAIDI and SAIFI by Area • L: 1997-Current Year PSE SAIFI and SAIDI Performance by Different Measurements • M: Current-Year Commission and Rolling-Two-Year PSE Customer Electric Service Reliability
Complaints with Resolutions • N: Areas of Greatest Concern with Action Plan • O: Current Year Geographic Location of Electric Service Reliability Customer Complaints on
Service Territory Map with Number of Next Year’s Proposed Projects and Vegetation-Management Mileage

Appendix A: Monthly SQI Performance 2011 Annual Puget Sound Energy SQI and Electric Service Reliability Report 85
A Monthly SQI Performance
Appendix A consists of Table 33 that provides monthly detail on the nine service quality indicators that are reported to the UTC.
It also contains the following attachments:
• Attachment A to Appendix A—Major Event and Localized Emergency Event Days (Affected Local Areas Only)
• Attachment B to Appendix A—Major Event and Localized Emergency Event Days (Non-Affected Local Areas Only)
• Attachment C to Appendix A—Gas Reportable Incident and Control Time
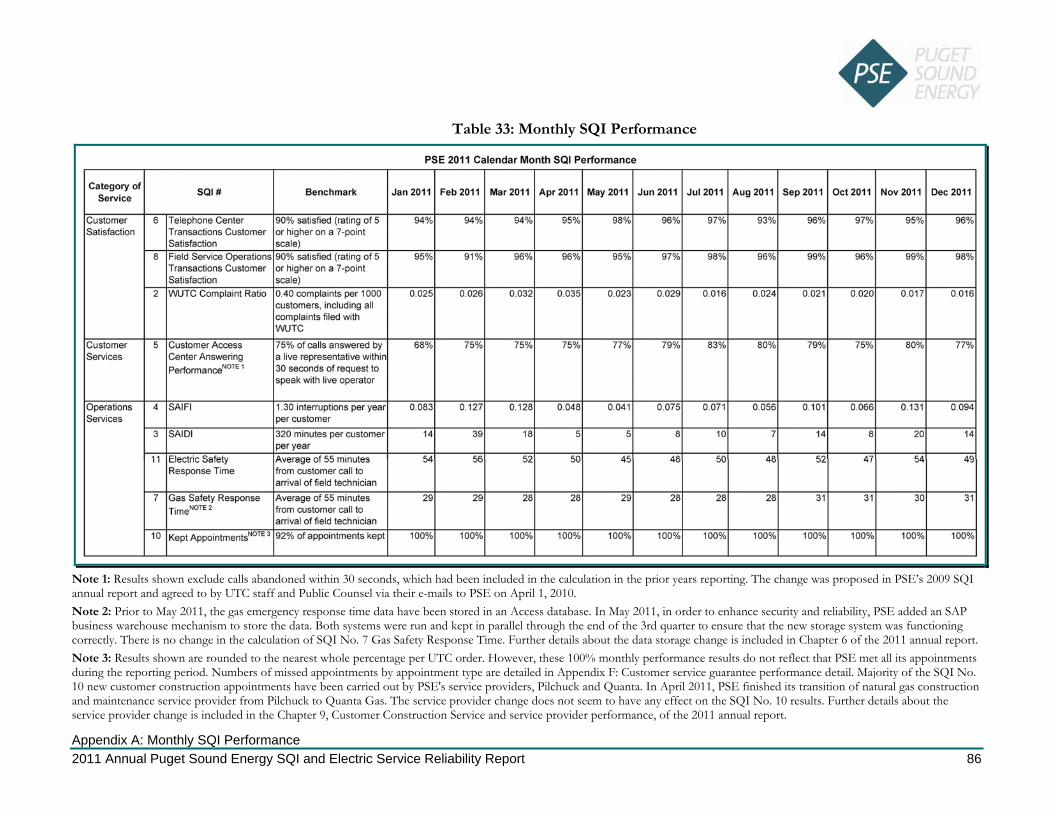
Appendix A: Monthly SQI Performance 2011 Annual Puget Sound Energy SQI and Electric Service Reliability Report 86
Table 33: Monthly SQI Performance
Note 1: Results shown exclude calls abandoned within 30 seconds, which had been included in the calculation in the prior years reporting. The change was proposed in PSE’s 2009 SQI annual report and agreed to by UTC staff and Public Counsel via their e-mails to PSE on April 1, 2010. Note 2: Prior to May 2011, the gas emergency response time data have been stored in an Access database. In May 2011, in order to enhance security and reliability, PSE added an SAP business warehouse mechanism to store the data. Both systems were run and kept in parallel through the end of the 3rd quarter to ensure that the new storage system was functioning correctly. There is no change in the calculation of SQI No. 7 Gas Safety Response Time. Further details about the data storage change is included in Chapter 6 of the 2011 annual report. Note 3: Results shown are rounded to the nearest whole percentage per UTC order. However, these 100% monthly performance results do not reflect that PSE met all its appointments during the reporting period. Numbers of missed appointments by appointment type are detailed in Appendix F: Customer service guarantee performance detail. Majority of the SQI No. 10 new customer construction appointments have been carried out by PSE's service providers, Pilchuck and Quanta. In April 2011, PSE finished its transition of natural gas construction and maintenance service provider from Pilchuck to Quanta Gas. The service provider change does not seem to have any effect on the SQI No. 10 results. Further details about the service provider change is included in the Chapter 9, Customer Construction Service and service provider performance, of the 2011 annual report.

Appendix A: Monthly SQI Performance 2011 Annual Puget Sound Energy SQI and Electric Service Reliability Report 87
Table 34: Monthly Service Quality Performance
Note 1: The 75% performance of Quanta Gas is not statistically meaningful as the sample size for Quanta Gas is too small due the timing of the survey and the service provider transition. Note 2: Pilchuck was replaced by Quanta Gas starting April 1, 2011; therefore there is no April–December Pilchuck result. Note 3: Results shown are rounded to the nearest whole percentage per UTC order. However, these 100% monthly performance results do not reflect that service providers met all the appointments during the reporting period. Numbers of missed appointments by appointment type are detailed in Appendix F: Customer Service Guarantee Performance Detail.

Appendix A: Monthly SQI Performance 2011 Annual Puget Sound Energy SQI and Electric Service Reliability Report 88
Attachment A to Appendix A—Major Event and Localized Emergency Event Days (Affected Local Areas Only)
This Attachment A to Appendix A provides detail on major event and localized emergency event days (Affected local areas only).
Note: EFR—Electric First Responder, PTO—Paid Time Off, STD—Short-Term Disability, SP—Service Provider

Appendix A: Monthly SQI Performance 2011 Annual Puget Sound Energy SQI and Electric Service Reliability Report 89
Note: EFR—Electric First Responder, PTO—Paid Time Off, STD—Short-Term Disability, SP—Service Provider

Appendix A: Monthly SQI Performance 2011 Annual Puget Sound Energy SQI and Electric Service Reliability Report 90
Attachment B to Appendix A—Major Event and Localized Emergency Event Days (Non-Affected Local Areas Only)
This Attachment B to Appendix A provides detail on major event and localized emergency event days (Non-affected local areas only).

Appendix A: Monthly SQI Performance 2011 Annual Puget Sound Energy SQI and Electric Service Reliability Report 91
+ PU '.JET SOUND ENERGY
Date Type of l ocal Alea Dur ation No. Event (D,,,)
3/212011 Wind Central South 1 31212011 Wind Sout h 1 3/1012011 Wind North 2 3/1012011 Wind South 2 3/1012011 Wind West 2
912512011 Wind Centri:l l South 2
912512011 Wind South 2 912512011 Wind West 2 912612011 Wind Central North 2
912612011 Wind Central South 2 912612011 Wind West 2
1112112011 Wind Central North 3 11 f21 f21J1 1 Wind Central South 3 11 f21 f2IJll Wind South 3 11 f24f2lJll Wind Central North 2
11 f24f2lJ 11 Wind Central South 2
11 f24f2lJ1 1 Wind South 2 11 f24f2lJl 1 Wind West 2 12125f2lJ11 Wind Central South 2
12125f21J1 1 Wind South 2
SQI NO. 11 SUPPLEMENTAL REPORTING LOCALIZED EMERGENCY EVENT DAYS NON·AFFECTED LOCAL AREAS ONLY
of Cllsto rna lS No. of Custom ers % of Custo mels No. of Outag e Affected in A rea Affected Ev e nts
1 ,680 230,264 0.7% 8 3 ,913 231 ,993 1.7% 19
2 ,678 188.007 1.4% 26 15 ,810 231,993 6.8% 26 6 ,364 139,915 4.5% 37
5,553 214,31]3 2.6% 2D 5,886 223,743 2.6% 21
774 139,970 0.6% 6
1,675 319}1? 0 .5% 23
3)1 21 4,308 0.1% 11 7,721 139,970 5.5% 35 7 ,125 320 ,475 2_2% 49 6,692 21 4,648 3.1% 29 4 ,936 224 ,232 2.2% 60 8 ,119 320 ,475 2_5% 13
129 21 4,648 0.1% 8
"" 224 ,232 0.4% 18 5 ,531 140 ,1 77 3_9% 14 4 ,883 214 ,840 2.3% 13
232 224,596 0.1% 13
Resolll ce Utili za tion
12
15 13 15 14
12
15 14
18
12
14
18
12
15 18
12
15 14
12
15
>5'4 Custome. Affected? (Yes/No)
No No No No No No No No No No No No No No No No No No No No
Ulli KU
Co mm ents

Appendix A: Monthly SQI Performance 2011 Annual Puget Sound Energy SQI and Electric Service Reliability Report 92
Attachment C to Appendix A—Gas Reportable Incidents and Control Time
This Attachment C to Appendix A provides detail on each gas reportable incident and response times.
Note: Report of the time duration from first arrival to control of gas emergencies, for incidents subject to reporting under the 2003 edition of WAC 480-93-200 and WAC 480-93-210, Order R-374, Docket Number UG-911261.
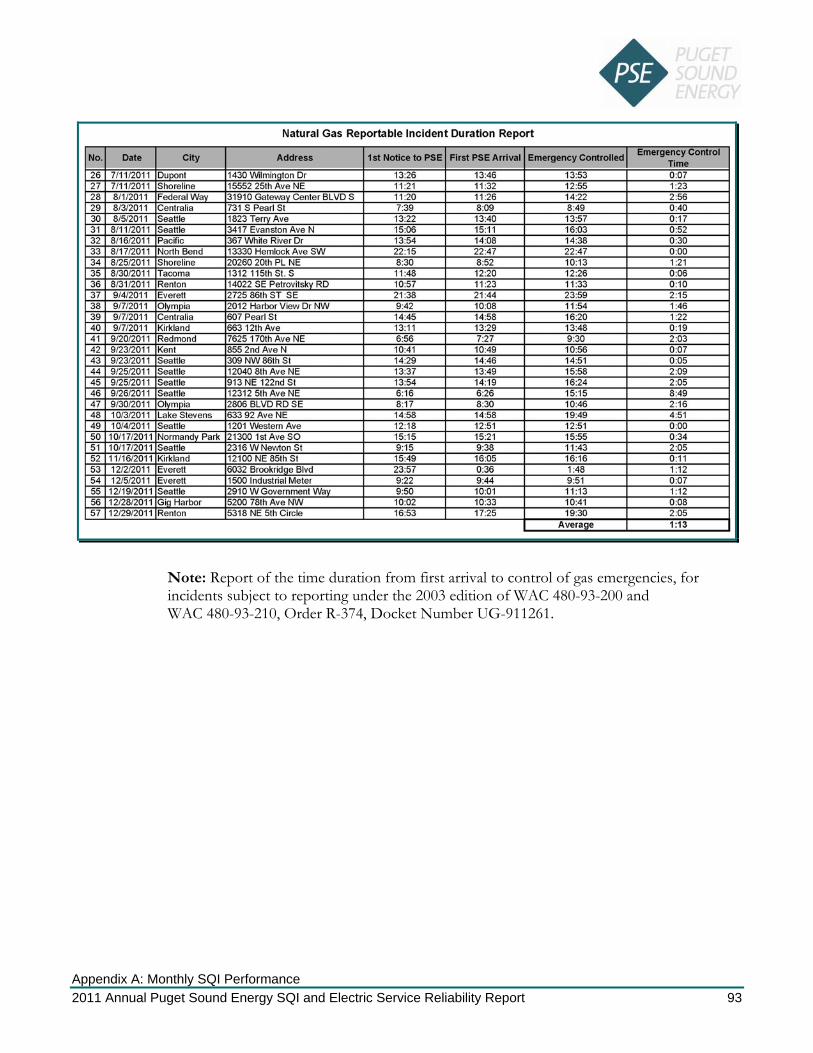
Appendix A: Monthly SQI Performance 2011 Annual Puget Sound Energy SQI and Electric Service Reliability Report 93
Note: Report of the time duration from first arrival to control of gas emergencies, for incidents subject to reporting under the 2003 edition of WAC 480-93-200 and WAC 480-93-210, Order R-374, Docket Number UG-911261.

Appendix B: Certification of Survey Results 2011 Annual Puget Sound Energy SQI and Electric Service Reliability Report 94
B Certification of Survey Results
Puget Sound Energy P.O. Box 97034 MS: EST-09E
THE GILMORE
RESEARCH GBr<2W
mAIGHT ANSil:RS
Bellevue, WA. 98009-9734
December 30, 2011
Dear Mr. Robert Yetter,
This letter constitutes certification by The Girmore Research Group that the attached report and the underlying surveys were conducted and prepared in accordance with the procedures established in Docket Nos. UE-01 1570and UG-01 -1571. These procedures, the data collection methods and the quality controls are consistent with industry practices and, we believe, ensure that the informa~ion produced in thesurvey~ is unbiased and valid.
, . We woulcj be glad to answer any questions -or provide any additional information that yQU may neee.
Sincerely,
'mU/L~ Dc:qpere The Gilmore Research Group
'21Q! 4th-Avenue S'" Flooz Seattle W A; -98l:21~23S2
Main: (206) 726-5555. F= (206) 726,,5620 .www.gilmo~rese\lo:h.com
Appendix C: Penalty Calculation (Not Applicable for 2011) 2011 Annual Puget Sound Energy SQI and Electric Service Reliability Report 95
C Penalty Calculation (Not Applicable for 2011)
This appendix is intentionally left blank since it is not applicable for the 2011 performance period.

Appendix D: Proposed Customer Notice (Report Card) 2011 Annual Puget Sound Energy SQI and Electric Service Reliability Report 96
D Proposed Customer Notice (Report Card)
2011 Service Quality Report Card

Appendix D: Proposed Customer Notice (Report Card) 2011 Annual Puget Sound Energy SQI and Electric Service Reliability Report 97
+ PUGET • SOUND
ENERGY
Each year Puget Sound Energy measures how well we deliver our services to you and all of our customers
in three key areas: Customer Satisfaction, Customer Services and Operations Services. Combined,
these areas represent nine specific service-quality indexes. Based on customer surveys and other
measurements, we match our pertonmance against a set of benchmarks. (See chart.)
2011 Performance Highlights In addition to meeting all nine of the service metrics, we are pleased to report improvements from the prior year in four of the measurements. The beller SCOfes included:
faster restoration of power outages
fewer customer complaints registered with the slate Utilities and Transportation Commission
faster response time to nalural-gas emergencies
faster response time to electric-service emergencies
Through our two Service Guarantees, we commit to keeping scheduled appointments and to restoring power outages as soon as we can. If we don't keep an appointment or if electric service is out for 120 consecutive hours or longer, subject to certain conditions, we provide a $50 on a customer's bill.
In 2011, we aedited customers a lotal of $14,400 for missing aboul 300 of our lolal 126,156 scheduled appoinlments. There were no qualifying outage events or customers in 2011 under the power restoration guarantee.
Our employees aim to continue their success in delivering and improving high standards of customer service to meet your expectations of us.
Puget Sound Energy 1-888-225-5773 • PSE.com
Uc ) Nf)
'Vt G
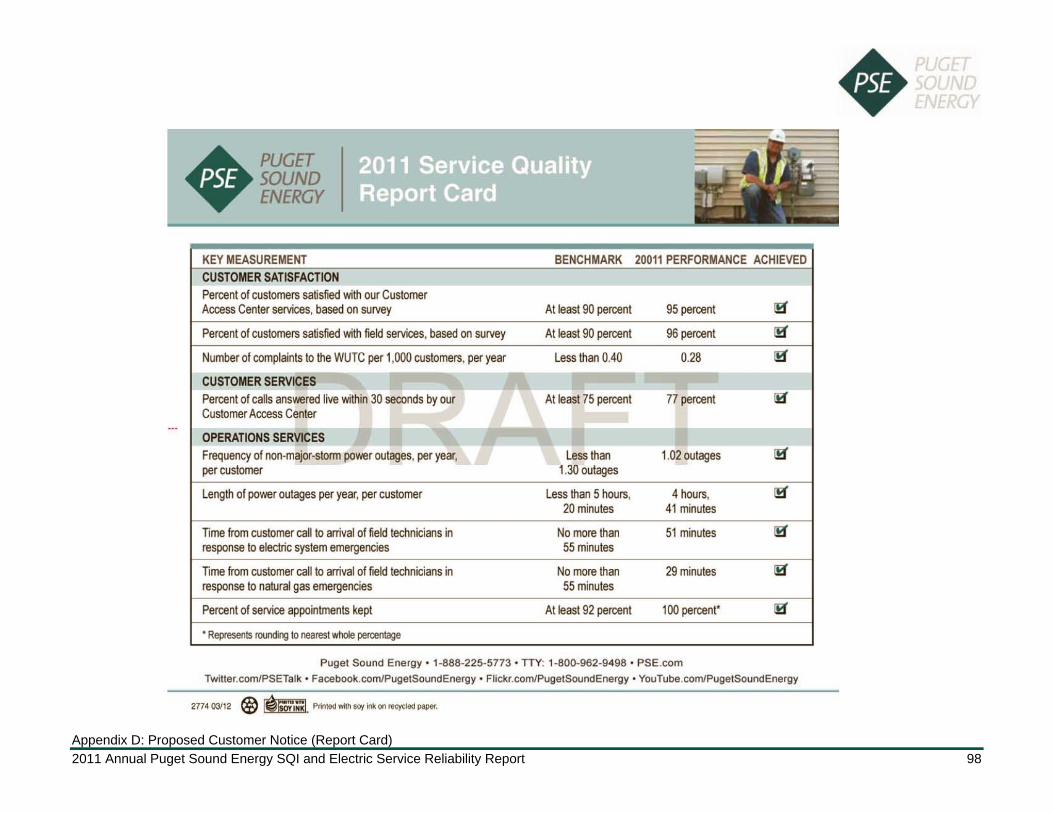
Appendix D: Proposed Customer Notice (Report Card) 2011 Annual Puget Sound Energy SQI and Electric Service Reliability Report 98
PUGET SOUND ENERGY
KEY MEASUREMENT CUSTOMER SATISFACTION Percent of customers satisfied -Mth our Customer Access Center services, based on survey
Percent of customers satisfied with field services, based on survey
Number of complaints to the WUTC per 1,000 customers, per year
CUSTOMER SERVICES Percent of calls answered live within 30 seconds by our Customer Access Center
OPERATIONS SERVICES Frequency of non-majer-storm power outages, per year, per customer
length of power outages per year, per customer
Time from customer call to arrival of field technicians in response to electric system emergencies
Time from customer call to arrival of field technicians in response to natural gas emergencies
Percent of service appointments kept
• Represents rounding to nearest whole percentage
BENCHMARK 20011 PERFORMANCE ACHIEVED
At least 90 percent 95 percent 9 At least 90 percent 96 percent 9
Less than 0.40 0.28 9
At least 75 percent 77 percent It!'
less than 1.02 outages 9 1.30 outages
less than 5 hours, 4 hoors, 9 20 minutes 41 minutes
No more than 51 minutes 9 55 minutes
No more than 29 minutes 9 55 minutes
At least 92 percent 100 percent' 9
Puget Sound Energy · 1·888·225· 5773 ' TTY: 1·800·962·9498 ' PSE .com
Twitter.comlPSETalk • Facebook.comlPugetSoundEnergy • Fl ickr.comlPugetSoundEnergy • YouTube.comlPugetSoundEnergy
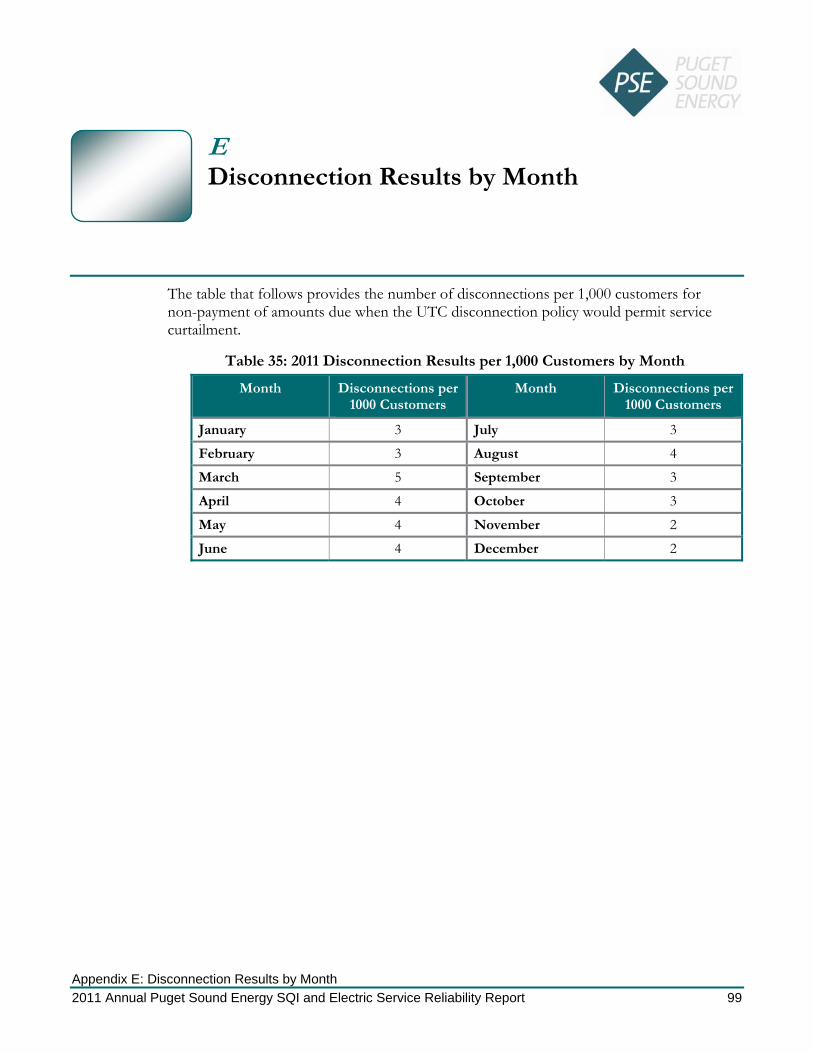
Appendix E: Disconnection Results by Month 2011 Annual Puget Sound Energy SQI and Electric Service Reliability Report 99
E Disconnection Results by Month
The table that follows provides the number of disconnections per 1,000 customers for non-payment of amounts due when the UTC disconnection policy would permit service curtailment.
Table 35: 2011 Disconnection Results per 1,000 Customers by Month
Month Disconnections per 1000 Customers
Month Disconnections per 1000 Customers
January 3 July 3
February 3 August 4
March 5 September 3
April 4 October 3
May 4 November 2
June 4 December 2

Appendix F: Customer Service Guarantee Performance Detail 2011 Annual Puget Sound Energy SQI and Electric Service Reliability Report 100
F Customer Service Guarantee Performance Detail
This appendix provides detail on SQI #10, Appointments Kept, performance and customer service guarantee payment by service type and month.

Appendix F: Customer Service Guarantee Performance Detail 2011 Annual Puget Sound Energy SQI and Electric Service Reliability Report 101
Note: Results shown are rounded to the nearest whole percentage per UTC order for performance calculation and comparison to the benchmark. However, these 100% monthly performance results do not reflect that PSE met all its appointments during the reporting period. There were 304 missed SQI appointments in 2011 as indicated in the “Total Missed” column.

Appendix F: Customer Service Guarantee Performance Detail 2011 Annual Puget Sound Energy SQI and Electric Service Reliability Report 102
Definition of the Categories
• Cancelled—Appointments cancelled by either customers or PSE • Customer Service Guarantee Payments—The total for the $50 Service Guarantee payments made to customers for each
missed approved appointment • Manual Kept—Adjusted missed appointments resulting from review by the PSE personnel • Missed Approved—Appointments missed due to PSE reasons and customers are paid the $50 • Missed Denied—Appointments missed due to customer reasons or due to major events • Missed Open—Appointments not yet reviewed by PSE for the $50 Service Guarantee payment • System Kept—Appointments in which PSE arrived at the customer site as promised • Total Appointments (Excludes Cancelled and Excused)—The total of Total Missed and Total Kept • Total Kept—The total number of Manual Kept and System Kept • Total Missed—The total number of Missed Approved, Missed Denied, and Missed Open

Appendix F: Customer Service Guarantee Performance Detail 2011 Annual Puget Sound Energy SQI and Electric Service Reliability Report 103
r---------~~,0and
To'" Appt,
Mocth , , , ,
J,0-1 IGas
~:~:~ Feb-II I ' , Feb-l1 Electrlc _ Feb-ll !
~:~" ; Gas I
~:;::: I E:ectr:C ~ Mac-I Gas
,
~;::~m ~;::i Gas
Ape-II TOI
~::::~ ~:::: ,~
Type I Missed Missed
,M Dec'"
,~ - -
_~ 42,,:'~OO~O ~2~ =x 2,739
1
5,386
679
I 4 ~~I -
"' '~' 4,
1,'~4
~I 4,98;
I~ '
-
-
I Details
Missed Total
Opec M'»" M'C",~ Sy'''m~ TO"~
- 4 3~ ~ 34; r-; ': ' ~i i *1
: 1 3 "8 ' 429 , 443. 1
: t::= 7 t:= ;::: 3,997 =472c=
-
_ 1-- 41--
4
64 !,;;; 2;:: 98 I I I .!Q; I
:; 5,::; - 5,:i~ - ", I 7~ 2~
I
: 5
" I
4
1 I
463 47
10,54 I 10,614 I
4,
1,668 ,672 611 654
~I ~I '1m 2,;;:
I
~ !,797
I
184
7" 138
Ulli
$801
~~; : ~:: :
~ $I~:
~;: :

Appendix F: Customer Service Guarantee Performance Detail 2011 Annual Puget Sound Energy SQI and Electric Service Reliability Report 104
, ,"g. , ", ,
.g. ",
:,p.~ ,
:,p. I" ,
, , ,
~" ,
, ... 'IE',,'e,
, 'eo· E""'o
2011 , 10 and ' To'aI App"
(E""'" 0,;"",,, Missed Missed Missed Total
','85 , 2"
,SVC 577
i r- -=±)It- ~ t SVC ' 65'
SVC 2,1&9
' 0,5
2,:
- ~ 50 1
4
4
·
·
·
·
·
--'---l- ~,
· " ·
I , Delaii. 1
, " a4 105 2 2 ,:;~
I
4," , :"
',87 ',88' 169
14
2
Appendix G: Customer Awareness of Customer Service Guarantee 2011 Annual Puget Sound Energy SQI and Electric Service Reliability Report 105
G Customer Awareness of Customer Service Guarantee
PSE undertook the following actions in 2011 to promote customer awareness of its Customer Service Guarantee program (the Guarantee).
1. Articles that publicized the Guarantee were included in 2011 in the following three issues of the “Energywise” customer newsletter: March-April, July-August, and November-December.
2. The text of the Guarantee appeared on the back of the bill-stock throughout 2011. 3. A description of the Guarantee has been in the natural gas and the electric customer
“rights and responsibilities” brochures since 2004. The brochures have been distributed to all new customers and existing customers upon request in 2011. Both natural gas and electric brochures are also posted on PSE.com.
4. PSE Customer Access Center continued to promote the Customer Service Guarantee in the following ways: − On relevant phone paths where a qualifying appointment will be generated, the
Access Center announcement invites customers to ask about PSE’s Customer Service Guarantee – before customers directly speak with an agent.
− Customer Access Center employees are provided with training and scripting on the Guarantee: “If we miss your customer service guarantee appointment under normal operating conditions, we will automatically credit your energy account with $50 – guaranteed”
− The Guarantee is included in PSE’s on-line Quick Reference Manual. This manual is accessible 24/7/365 on PSE’s intranet and is available to all customer services, gas field services, and new construction employees.
− Throughout 2011, the Customer Service Guarantee information was publicized every month in one issue of the weekly Customer Services newsletter as a reminder of the importance of providing Service Guarantee information to customers when applicable. The weekly Customer Services newsletter is distributed to all customer services personnel and many other PSE employees in various departments.
− The Company is taking measures to ensure that agents are trained on its policy to advise customers of the Guarantee before the end of any call in which an eligible appointment or commitment is made.
5. Other approaches used to inform customers of the Customer Service Guarantee include the natural gas and electric new service handbooks and brochures and the Company’s website, PSE.com.
The results of customer awareness surveys as assessed using two separate Gilmore Research Group’s surveys are presented in the following table.

Appendix G: Customer Awareness of Customer Service Guarantee 2011 Annual Puget Sound Energy SQI and Electric Service Reliability Report 106
Ulli
Customer Awareness of Customer Service Guarantee
I Jan.11 Feb.11 Mal_11 Apr.11 I May .11 I JUII_11 I Jul.11 Aug .11 Sep_11 Oct.11 I No .... _11 Oec.11 Tolal
CFS Surv ey =-t I Q26A. When you called 10 make the y" 42 42 40 42 :JJ 34 23 35 '" <JJ 41 40 2lJJ appointment for a service technician N. 111 116 109 118 162 131 I!! I 114 118 107 107 ~; 747 to come out, did the customer Don', Know 47 42 " I 40 I 18 1 35 1 " 46 1 44 1 52 48 233 seMce representative tell you about
Refused Response PSE $50 Service Guarantee? I 205[ >Dj 2ml 2m t 2m t 21ll 1 :JJ1I 1 Total Customers Surveyed 2m 2m 2m 2m 2m 1;;DJ
Q26C, Which of the following best I You ale gillen the $50 service I I 1 1 I
11 1 fits your unde rs tanding of how the guarantee if the rescheduled saMee guarantee works if a time causes you incon¥9niencQ, 16 21 13 13 10 , 5 14 11 10 12 79 scheduled appointment has to be
r Whenever PSE changes an &n 13 n
changed by PSE. appointment, you are given Ihe 'OJ 17 '" 11 18 10 28 21 19 114
You have no understanding or expectations about this part of
~~roice guarantee plan 140 135 104 96 )J 44 85 141 155 146 158 155 549 Don' Know 27 18 57 70 149 10<; 90 27 22 17 8 15 457 Refused Response
I 205[ >Dj 2ml ~t ~t ,
~1j ~ r----2m 1 1
1 Total Customers Surveyed 2m 2m 2m 2m 1;;DJ
0260. Did your appointment h a~e to l It occurred as planned ---L '~ '~ '';1- '';1 19~ 1 H'; I 171 If!3 185 If!3 191 193 1,135 be rescheduled or did it occur as It was rescheduled. 12 3 5 7 3 6 , 4 10 , 3 5 l5 planned?
Technician arrived but was late. 1 2 1 2 1 4 Don' Know 2 3 2 , 3 5 18 4 5 4 4 2 21 Refused Response 2 2 1 3 1 1 1 4 ~-Customers Surveyed 200 2m 2m 200 2m 2m 200 2m 2m :JJl 2m 2m 1;;DJ
026E Who init iated rescheduling Myself (Customer Init iated) , 1 5 4 1 3 1 4 1 3 8 5 3 4 :JJ your appointment? ugel Sound Energy (PSE)
2 1 In~iated , 2 3 2 4 2 3 1 15 Don' Know I I I 1 I I 1 I I 1 Refused Response
I 5171 31 ' I ,t 10 1 sr-I Total Customers Surveyed 12 3 4 3 5 l5
NCC Surv ey --L I ,,"-all . Are you aware of Puget Sound Yo. 75 75
Energy's $50 seroice guarantee to
~. 179 [ 1 179 179 meet scheduled work dates?
Refused Response t Don' Know 4 5 4
Total Customers Surveyed 258 1 I 262 258 . . .

Appendix H: Electric Reliability Terms and Definitions 2011 Annual Puget Sound Energy SQI and Electric Service Reliability Report 107
H Electric Reliability Terms and Definitions
Terms and Definitions
AMR—Automated Meter Reading system, which is a communication network capable of providing PSE with certain information pertaining to sustained outages automatically.
Area of Greatest Concern—An area targeted for specific actions to improve the level of service reliability or quality.
Cause Codes—Codes used to identify PSE’s best estimation of what caused a Sustained Interruption to occur. The codes are listed below:
Code Description Code Description
AO Accident Other, with Fires FI Faulty Installation
BA Bird or Animal LI Lightning
CP Car Pole Accident SO Scheduled Outage (was WR − Work Required)
CR Customer Request TF Tree − Off Right-of-Way
DU Dig Up Underground TO Tree − On Right-of-Way
EF Equipment Failure TV Trees/Vegetation
EO Electrical Overload UN Unknown Cause (unknown equipment involved only)
EQ Earthquake VA Vandalism
Commission Complaint—Any single-customer electric-service reliability complaint filed by a customer with the Washington Utilities and Transportation Commission (UTC).
Customer Complaint—Repeated Customer Inquiries relating to dissatisfaction with the resolution or explanation of a concern related to a Sustained Interruption or Power Quality. This is indicated by two or more recorded contacts in PSE’s customer information system during current and prior years, where by, after investigation by PSE, the cause of the concern is found to be on PSE’s energy-delivery system.
Customer Count—The number of customers relative to focus of topic or data. The source of the data will be the outage reporting system that is a part of SAP, PSE’s work management and financial information system.
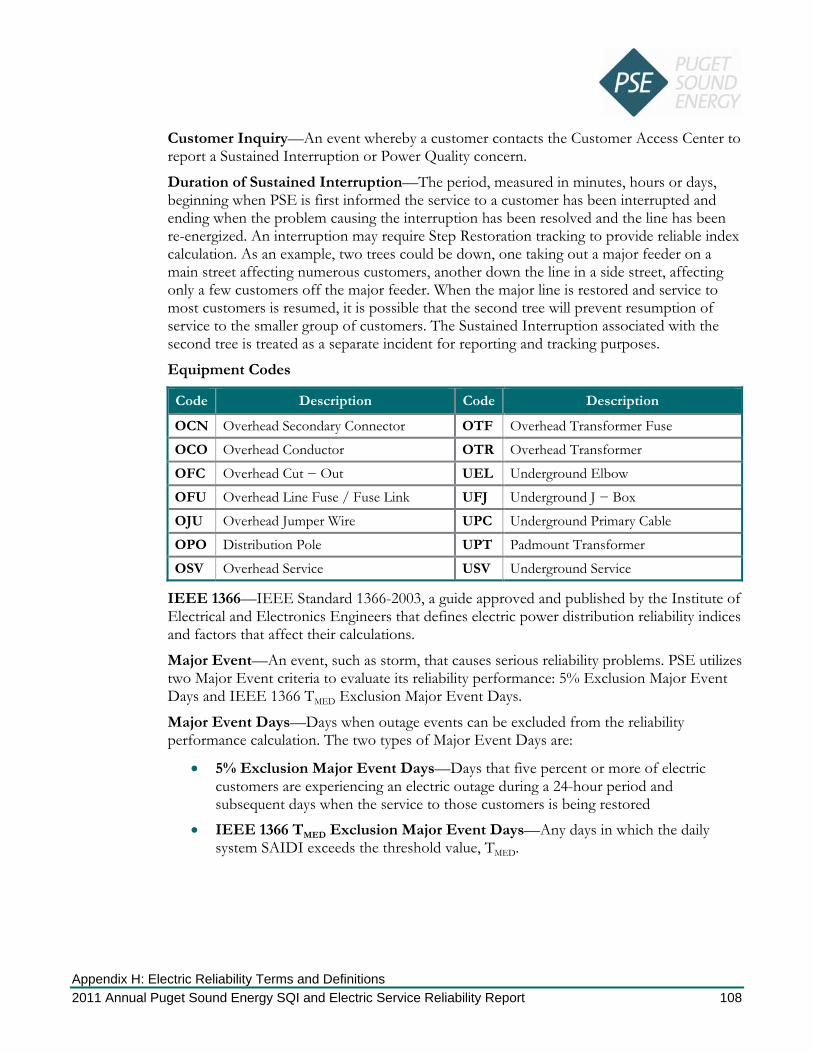
Appendix H: Electric Reliability Terms and Definitions 2011 Annual Puget Sound Energy SQI and Electric Service Reliability Report 108
Customer Inquiry—An event whereby a customer contacts the Customer Access Center to report a Sustained Interruption or Power Quality concern.
Duration of Sustained Interruption—The period, measured in minutes, hours or days, beginning when PSE is first informed the service to a customer has been interrupted and ending when the problem causing the interruption has been resolved and the line has been re-energized. An interruption may require Step Restoration tracking to provide reliable index calculation. As an example, two trees could be down, one taking out a major feeder on a main street affecting numerous customers, another down the line in a side street, affecting only a few customers off the major feeder. When the major line is restored and service to most customers is resumed, it is possible that the second tree will prevent resumption of service to the smaller group of customers. The Sustained Interruption associated with the second tree is treated as a separate incident for reporting and tracking purposes.
Equipment Codes
Code Description Code Description
OCN Overhead Secondary Connector OTF Overhead Transformer Fuse
OCO Overhead Conductor OTR Overhead Transformer
OFC Overhead Cut − Out UEL Underground Elbow
OFU Overhead Line Fuse / Fuse Link UFJ Underground J − Box
OJU Overhead Jumper Wire UPC Underground Primary Cable
OPO Distribution Pole UPT Padmount Transformer
OSV Overhead Service USV Underground Service
IEEE 1366—IEEE Standard 1366-2003, a guide approved and published by the Institute of Electrical and Electronics Engineers that defines electric power distribution reliability indices and factors that affect their calculations.
Major Event—An event, such as storm, that causes serious reliability problems. PSE utilizes two Major Event criteria to evaluate its reliability performance: 5% Exclusion Major Event Days and IEEE 1366 TMED Exclusion Major Event Days.
Major Event Days—Days when outage events can be excluded from the reliability performance calculation. The two types of Major Event Days are:
• 5% Exclusion Major Event Days—Days that five percent or more of electric customers are experiencing an electric outage during a 24-hour period and subsequent days when the service to those customers is being restored
• IEEE 1366 TMED Exclusion Major Event Days—Any days in which the daily system SAIDI exceeds the threshold value, TMED.

Appendix H: Electric Reliability Terms and Definitions 2011 Annual Puget Sound Energy SQI and Electric Service Reliability Report 109
Outage—The state of a system component when it is not available to perform its intended function due to some event directly associated with that component. For the most part, a component’s unavailability is considered an outage when it causes a sustained interruption of service to customers.
Power Quality—There are no industry standards that are broad enough to be able to define power quality or how and when to measure it. For purposes of this plan, power quality includes all other physical characteristics of electrical service except for Sustained Interruptions, including momentary outages, voltage sags, voltage flicker, harmonics and voltage spikes.
SAIDI—System Average Interruption Duration Index—This index is commonly referred to as customer-minutes of interruption (CMI) or customer hours, and is designed to provide information about the average time the customers are interrupted. The measurements used in PSE’s Plan and reporting include Total methodology (SAIDITotal), Total with five-year-rolling average methodology (SAIDITotal 5-year Average), 5% exclusion methodology (SAIDI5%), and IEEE methodology (SAIDIIEEE). The performance results for each of the measurement will be calculated according to the following:
SAIDITotal=∑ All customer interruption minutes Total number of customers served
SAIDITotal 5-year Average= Rolling five-year average of current year Annual SAIDITotal and prior four years Annual SAIDITotal results, excluding any exclusion that has been approved by the UTC. Exclusions will be replaced by preceding Annual SAIDITotal performance results until there are five years included in the calculation of current year SAIDI Total 5-year Average
SAIDI5%=∑ Customer interruption minutes during non-5%-Exclusion-Major-Event-Days Total number of customers served
SAIDIIEEE=∑ Customer interruption minutes during non-IEEE-1366-TMED-Exclusion-Major-Event Days Total number of customers served
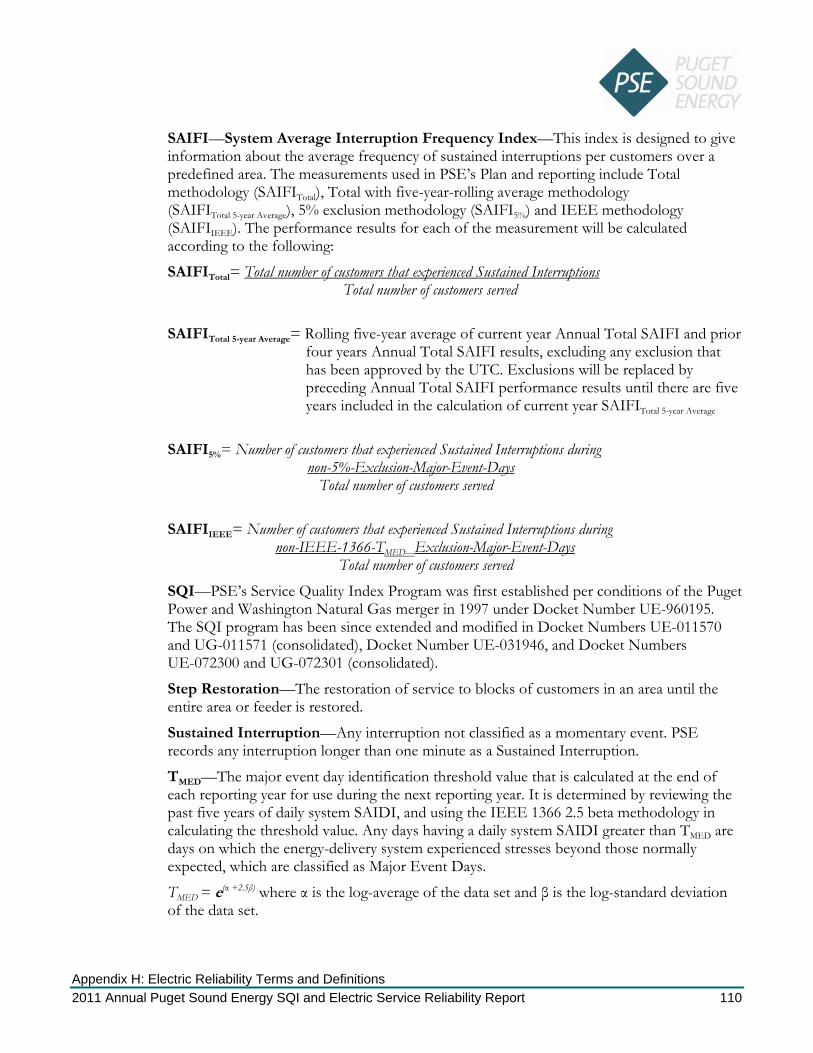
Appendix H: Electric Reliability Terms and Definitions 2011 Annual Puget Sound Energy SQI and Electric Service Reliability Report 110
SAIFI—System Average Interruption Frequency Index—This index is designed to give information about the average frequency of sustained interruptions per customers over a predefined area. The measurements used in PSE’s Plan and reporting include Total methodology (SAIFITotal), Total with five-year-rolling average methodology (SAIFITotal 5-year Average), 5% exclusion methodology (SAIFI5%) and IEEE methodology (SAIFIIEEE). The performance results for each of the measurement will be calculated according to the following:
SAIFITotal= Total number of customers that experienced Sustained Interruptions Total number of customers served
SAIFITotal 5-year Average= Rolling five-year average of current year Annual Total SAIFI and prior four years Annual Total SAIFI results, excluding any exclusion that has been approved by the UTC. Exclusions will be replaced by preceding Annual Total SAIFI performance results until there are five years included in the calculation of current year SAIFITotal 5-year Average
SAIFI5%= Number of customers that experienced Sustained Interruptions during non-5%-Exclusion-Major-Event-Days Total number of customers served SAIFIIEEE= Number of customers that experienced Sustained Interruptions during non-IEEE-1366-TMED—Exclusion-Major-Event-Days Total number of customers served SQI—PSE’s Service Quality Index Program was first established per conditions of the Puget Power and Washington Natural Gas merger in 1997 under Docket Number UE-960195. The SQI program has been since extended and modified in Docket Numbers UE-011570 and UG-011571 (consolidated), Docket Number UE-031946, and Docket Numbers UE-072300 and UG-072301 (consolidated).
Step Restoration—The restoration of service to blocks of customers in an area until the entire area or feeder is restored.
Sustained Interruption—Any interruption not classified as a momentary event. PSE records any interruption longer than one minute as a Sustained Interruption.
TMED—The major event day identification threshold value that is calculated at the end of each reporting year for use during the next reporting year. It is determined by reviewing the past five years of daily system SAIDI, and using the IEEE 1366 2.5 beta methodology in calculating the threshold value. Any days having a daily system SAIDI greater than TMED are days on which the energy-delivery system experienced stresses beyond those normally expected, which are classified as Major Event Days.
TMED = e(α +2.5β) where α is the log-average of the data set and β is the log-standard deviation of the data set.

Appendix I: Electric Reliability Data Collection Process and Calculations 2011 Annual Puget Sound Energy SQI and Electric Service Reliability Report 111
I Electric Reliability Data Collection Process and Calculations
Data Collection—Methods and Issues
This appendix discusses data collection methods and issues. It explains how the various data were collected. Changes in methods from prior reporting periods are highlighted and the impact of the new method on data accuracy is discussed.
Methods for Identifying when a Sustained Interruption Begins
The following methods are used to determine the beginning point of an interruption:
• A customer call to PSE’s Customer Access Center, either through the automated voice response unit or talking with a customer representative.
• A customer call to a PSE employee other than through the Customer Access Center. • Automated system information from PSE’s AMR system (may precede customer
call).
Possible Causes of Data Inconsistencies
• If service to a customer affected by a service interruption remains out after the interruption has been corrected, a follow-up call from the customer may be reported as a new incident.
• If, during restoration activities, service technicians need to create a larger outage, those customers affected by that larger outage may not be reported as a new incident.
• Data entry mistakes can create inconsistencies. • During large storms less time is spent recording accurate data up-front while more
effort is spent on restoring service.

Appendix I: Electric Reliability Data Collection Process and Calculations 2011 Annual Puget Sound Energy SQI and Electric Service Reliability Report 112
Methods to Specify When the Duration of a Sustained Interruption Ends
The following methods are used to determine the ending point of an interruption:
• PSE Service personnel will log the time when the problem causing the outage has been resolved.
Possible Causes of Data Inconsistencies
• Multiple layers of issues may be contributing to a Sustained Interruption for a specific customer as described in the definition of Duration of Sustained Interruption.
• Data entry errors can affect the accuracy of the information.
Recording Cause Codes
• Outage cause codes are reported by the PSE service technician responding to the outage location.
Possible Causes of Data Inconsistencies
• During large storms less time is spent recording accurate data up-front while more effort is spent on restoring service.
• Restoration efforts take precedence over pinpointing the exact cause and location of the outage, especially in cross-country terrain or in darkness.
• A series of outages affecting a group or groups of customers at the same time or approximate times with several causes are difficult to capture.
Recording and Tracking Customer Complaints
• The CSR in PSE’s Customer Access Center handling the call listens for key words and then categorizes the customer comments accordingly. − The CSR creates a request for the appropriate PSE personnel to contact the
customer and discuss their concerns. − All contact is tracked as an inbound client comment in PSE’s Customer
Information System (CIS) and counted as a Customer Inquiry for electric reliability reporting purposes.
− When two or more Customer Inquiries on outage frequency or duration and/or power quality have been recorded in the CIS from a customer during current and prior reporting years, these Customer Inquiries together will be considered as a PSE “Customer Complaint.”
Appendix I: Electric Reliability Data Collection Process and Calculations 2011 Annual Puget Sound Energy SQI and Electric Service Reliability Report 113
Possible Causes of Data Inconsistencies
• Data entry errors from the initial inquiry or during the feedback loop can affect the accuracy of the information.
• High volumes of customer inquiries, during storms for example, may increase likelihood of data entry errors.
Change in Definitions and Calculations
This section describes the methodology used in defining and calculating reliability metrics which are then used to evaluate performance. The UTC in WAC 480-100-398 (2) requires a utility to report changes made in this methodology including data collection and calculation of reliability information after the initial baselines are set. The utility must explain why the changes occurred and how the change is expected to affect comparisons of the newer and older information.
Change to Include the IEEE Methodology
In the 2004 Annual Electric Service Reliability Report, PSE indicated that starting in 2005, reliability metrics using the IEEE standard 1366 methodology as a guideline would be included. This change and other modifications for monitoring and reporting electric service reliability information were adopted by PSE in UE-060391. The purpose for moving to the IEEE standard 1366 methodology is to
• Provide uniformity in reliability indices • Identify factors which affect these indices • Aid in consistent reporting practices among utilities
TMED (Major Event Day Threshold) is the reliability index that facilitates this consistency. A detailed equation for calculating TMED is provided in Appendix H: Electric Reliability Terms and Definitions. While the IEEE guidelines provide a standard for the industry, companies can create a variety of definitions of an outage or sustained outage.
• PSE defines sustained outages as those lasting longer than one minute • IEEE defines a sustained outage to be longer than five minutes
PSE will continue to use the one minute definition as PSE believes that tracking shorter duration outages allows us to better monitor the performance of the electric system and subsequently assess potential system improvements. It is also consistent with the definition of an outage used in the SQI methodology.
Appendix I: Electric Reliability Data Collection Process and Calculations 2011 Annual Puget Sound Energy SQI and Electric Service Reliability Report 114
Changes for 2010 and Subsequent Years Reporting
In 2010, PSE met with the UTC staff to enhance the format of Electric Service Reliability report and the reliability statistics information provided. Specific enhancements included clarification of baseline statistics and detailed comparison of and expanded set of reliability metrics. This annual report reflects all these reporting enhancements and the SQI SAIDI performance and benchmark calculation changes approved by the UTC.
Baseline Data Reliability Statistics
Pursuant to the WAC Electric Service Reliability requirements, PSE establishes 2003 as its baseline year as the performance from the year was about average for each of the reliability measurements. However, PSE would rather develop a baseline using multiple years to mitigate the fluctuation of weather conditions and other external factors. PSE feels there is limited usefulness in designating one specific year’s information as a “baseline” and cautions against the use of a single year’s data to assess year-to-year system reliability trends.
Timing of Annual Report Filings
PSE will be reporting data and information on a calendar year basis. PSE’s annual Electric Service Reliability report will be filed as part of the annual SQI and Electric Service Reliability report with the UTC no later than the end of March of each year.22
Tree-Related Outage Codes
PSE conducted a review of tree-related outages and the use of the tree on-right-of-way (TO) and tree off-right-of-way (TF) cause codes on outage notifications. However, it was found that during an outage it was difficult for field personnel to accurately assess the correct use of TF and TO cause codes.
As a result, PSE created a new outage cause code, Trees/Vegetation (TV) and revised the tree-related outage coding process. After a tree-related outage has occurred on a transmission line or causes a complete distribution circuit outage, a certified arborist field-verifies if the tree was on- or off-right-of-way and the correct code is added to the outage notification. All other tree-related outages are coded as TV.
22 Order 17 of consolidated Docket Numbers UE-072300 and UG-072301, page 10, section 26

Appendix I: Electric Reliability Data Collection Process and Calculations 2011 Annual Puget Sound Energy SQI and Electric Service Reliability Report 115
Areas of Greatest Concern
This section of the annual reporting includes information on specific areas PSE is targeting for specific actions to enhance the level of service reliability. For 2011, PSE designates the Areas of Greatest Concern as the 50 worst-performing circuits23 over the previous five years that rank worst in terms of customer interruption minutes.
• Each circuit is first ranked by the annual total customer interruption minutes seen by the circuit for each of the previous five years.
• The yearly ranking results are then averaged to determine the overall 50 worst-performing circuits over the past five years.
The following information will be reported on each of these areas:
• Identification of each Area of Greatest Concern. • Explanation of the specific actions PSE plans to take in each Area of Greatest
Concern to improve the service in each area during the coming year.
Exclusion Events
Per Docket Number UE-072300, PSE can petition to exclude certain annual results or outage minutes from the performance calculation for the current year and years following that will be affected. PSE must demonstrate that event was unusual or exceptional and that PSE's level of preparedness and response was reasonable. The UTC has granted the following events to be considered extraordinary:
• Total SAIDI results for 2006
23 This is a change from the previous definition of Areas of Concern, which considered the trend in system performance based on circuits that exceed the SQI, number of customers affected by those circuits and the number of complaints.

Appendix J: Current Year Electric Service Outage by Cause by Area 2011 Annual Puget Sound Energy SQI and Electric Service Reliability Report 116
J Current Year Electric Service Outage by Cause by Area
This appendix details the 2011 Outage Cause by County. The color codes indicate which major outage category the outage cause is grouped into. The cause code definitions can be found in Appendix H: Electric Reliability Terms and Definitions.
Figure 8: Color Code Legend

Appendix J: Current Year Electric Service Outage by Cause by Area 2011 Annual Puget Sound Energy SQI and Electric Service Reliability Report 117
Table 36: Total Outages by Cause
Table 37: 5% Exclusion Outages by Cause

Appendix K: Historical SAIDI and SAIFI by Area 2011 Annual Puget Sound Energy SQI and Electric Service Reliability Report 118
K Historical SAIDI and SAIFI by Area
This appendix details the three-year history of SAIDI and SAIFI data by county.
Table 38: SAIDI and SAIFI Data for the Past Three Years by CountyNote
Note: Reported figures based on most current SAP outage data, as of January 2012

Appendix L: 1997-Current Year PSE SAIFI and SAIDI Performance by Different Measurements 2011 Annual Puget Sound Energy SQI and Electric Service Reliability Report 119
L 1997-Current Year PSE SAIFI and SAIDI Performance by Different Measurements
This appendix presents PSE SAIFI and SAIDI performance from 1997 through the current year using different measurements.

Appendix L: 1997-Current Year PSE SAIFI and SAIDI Performance by Different Measurements 2011 Annual Puget Sound Energy SQI and Electric Service Reliability Report 120
Figure 9: 1997–2011 SAIFI Performance by Different Measurements
Figure 10: 1997–2011 SAIFI Performance by Different Measurements

Appendix L: 1997-Current Year PSE SAIFI and SAIDI Performance by Different Measurements 2011 Annual Puget Sound Energy SQI and Electric Service Reliability Report 121
Figure 11: 1997–2011 SAIDI Performance by Different Measurements
Figure 12: 1997–2011 SAIDI Performance by Different Measurements

Appendix M: Current-Year Commission and Rolling-Two-Year PSE Customer Electric Service Reliability Complaints with Resolutions 2011 Annual Puget Sound Energy SQI and Electric Service Reliability Report 122
M Current-Year Commission and Rolling-Two-Year PSE Customer Electric Service Reliability Complaints with Resolutions
This appendix lists the current-year UTC and rolling-two year PSE customer electric service reliability complaints with resolutions.
Table 39: Current Year Commission Complaints

Appendix M: Current-Year Commission and Rolling-Two-Year PSE Customer Electric Service Reliability Complaints with Resolutions 2011 Annual Puget Sound Energy SQI and Electric Service Reliability Report 123
Table 40: Rolling-Two-Year PSE Customer Electric Service Reliability Complaints with Resolutions (Sorted by County)
ate 0 amp alnt
6 liND t /
No County Complaint Location Typo Circul i Response Action by PSE
Island Nov 2010 Greenbank Reliability Greenbank-13 Reported on 2010 report. A system project w~h estimated comple~on Nov 2010 no new inquiries in 2011 in 2012 will improve reliability . Ongoing
circuit monitoring and maintenance will continue.
2 Jefferson Sap 2010 Po" Reliability Discovery 8ay-12 Reported on 2010 report, Ongoing circuil monitoring and S. 2010 Townsel'ld no new i uiries in 2011 maintenance will continue.
3 Jefferson Sep 2010 Sequim Reliability Discovery Bay-13 Contacted customer to A system project w"h estimated completion Dec 2011 Power discuss concerns. in 2013 wil l provide additional reliability Dec20!! Quality improvement. Or1going circuit monitoring
alld maintenance will continue.
4 Jefferson Jul2010 Po" Power Hastings-12 Reported on 2010 report, Ongoing circuit monitoring and Sep 2010 Townsend Quality no new inquiries in 2011 mainlenance will continue.
Reliabili 5 Jefferson Dec 2010 Quilcene Reliability Silverdale-13 Contacted customer to Ongoing circuit monitoring and
Mar2011 discuss concerns. maintenance will continue. S King Nov 2011 Issaquah Reliability Goodes Comer-IS Contacted customer to Ongoing circuit monitoring and
Nov 2011 Power discuSS concerns. maintenance will continue. Qualit
7 King Oct 2011 Enumclaw Reliability Greenwater-lE) Contacted customer to Ongoing circuit monitoring and Nov 2011 discuss concerns. maintenance will continue.
S King Apr 2011 Woodinville Reliability Hollywood-23 Contacted customer to A system project with estimated completion Apr2011 discuss concerns. in 2012 will improve reliabil ity . Ongoing
circuit monitoring and maintenance will continue.
9 King Oct 2010 Kir1c.land Reliability Ingtewood-15 Contacted customer to Completed vegetation management in 2011 Feb 2011 discuss concerns. on the circuit. Ongoing circuit monitoring
arid maintenance will continue.
10 King Nov 2010 Federal Way Reliability Marine View-16 Reported on 2010 report, System project was completed in January Nov 2010 no new inquiries in 2011 2012 which will improve rel iability_ Ongoing
circuit monitoring and maintenance will continue.
11 King Nov 2010 Federal Way Reliability Marine View-16 Reported on 2010 report, A system project was completed in January Nov 2010 no new inquiries in 2011 2012 which will improve rel iability . Ongoing Nov 2010 circuit monitoring and maintenance will
continue.

Appendix M: Current-Year Commission and Rolling-Two-Year PSE Customer Electric Service Reliability Complaints with Resolutions 2011 Annual Puget Sound Energy SQI and Electric Service Reliability Report 124
aeo ompam •
(
UNO
No. County ComplaInt Locabon Type Cl rcu,t Response ActIon by PSE
" W,' Ii ; report. in January 2010 new inquiries in 2011 improve reliabil~y. Ongoing 2010 and maintenance will 2010 2010
2011 ill 2011
, ; 2010 new inquiries in 2011 reliability. Ongoing
and maintenance will
Ii ; ; system project w~h estimated
in 2012 will provide add~ional Ongoil'\9 circurt
al'ld maintenance will continue .
. "
Ii ;
" Ii ;
ill Ii ; " ; . Ongoing circuit
al'ld maintenance will contil'lue.
Ii ;
ill
"
; new inquiries in ill
Ii ; ill
Ii ; ; new inquiries in 2011 estimated
reliability. Ongoing circuit afld maintenance will continue.

Appendix N: Areas of Greatest Concern with Action Plan 2011 Annual Puget Sound Energy SQI and Electric Service Reliability Report 125
N Areas of Greatest Concern with Action Plan
This appendix details the areas of greatest concern with an action plan.
CMI refers to Customer Minutes of Interruptions.
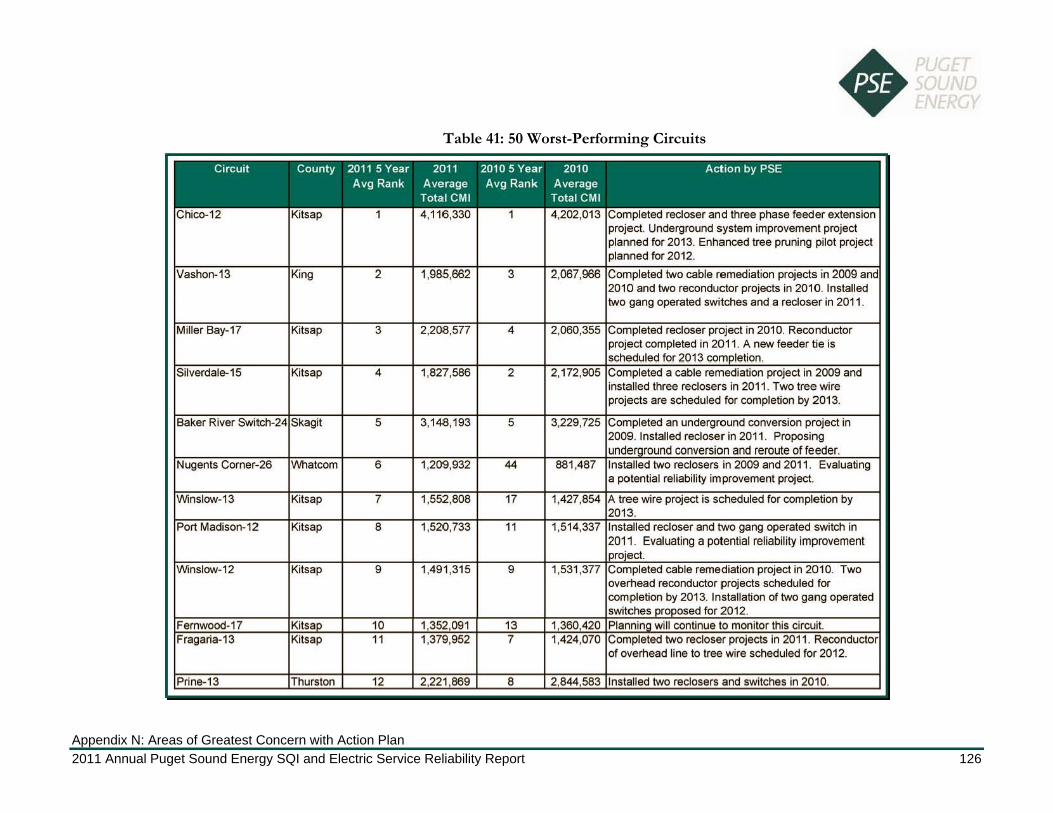
Appendix N: Areas of Greatest Concern with Action Plan 2011 Annual Puget Sound Energy SQI and Electric Service Reliability Report 126
Table 41: 50 Worst-Performing Circuits
CircUit County 20115Year 2011 2010 5 Year 2010 ActlonbyPSE
Chico-12 Kitsap
Vashon-13 King
Miller 8ay-17 Kitsap
Silverdale-15 Kitsap
Baker River Switch-24 Skagit
Nugents Comer-26 'Nhatcom
Winslow-13 Kitsap
Port Madison-12 Kitsap
\/Vinslow-12 Kitsap
Femwood-17 Kitsa Fragaria-13 Kitsap
Pri ne·13 Thurston
Avg Rank Average Avg Rank Average
2
3
4
5
6
7
8
9
10 11
12
Total eMt Total eMt
4,116,330
1,985,662 3
2,208,577 4
1,827,586 2
3,148,193 5
1,209,932 44
1,552 ,808 17
1,520,733 11
1,491 ,315 9
1 352 091 13 1,379,952 7
2221 869 8
4,202 ,013 Completed recloser and three phase feeder extension project. Underground system improvement project planned for 2013. Enhanced tree pruning pilot project planned for 2012.
2,067,966 Completed wo cable remediation projects in 2009 and 2010 and two reconductor projects in 2010. Installed two gang operated switches and a recloser in 2011 .
2,060,355 Completed recloser project in 2010. Reconductor project completed in 2011 . A new feeder tie is scheduled for 2013 com lelion.
2,172,905 Completed a cable remediation project in 2009 and installed three reclosers in 2011 . Two tree wire projects are scheduled for completion by 2013.
3,229,725 Completed an underground conversion project in 2009. Installed recloser in 2011 . Proposing unde round conversion and reroute of feeder.
881 ,487 Installed two redosers in 2009 and 2011 . Evaluating a potential reliability improvement project.
1,427,854 A tree wire project is scheduled for completion by 2013.
1,514,337 Installed recloser and two gang operated switch in 2011 . Evaluating a potential reliability improvement
ro·ect. 1,531,377 Completed cable remediation project in 2010. Two
overhead reconductor projects scheduled for completion by 2013. Installation of two gang operated switches m sed for 2012 .
1 360 420 Plannin will continue to monitor this circuit. 1,424,070 Completed two recloser projects in 201 1. Reconductor
of overhead line to tree wire sCheduled for 2012.
2,844 583 Installed two reclosers and switches in 2010.
Ulli KU

Appendix N: Areas of Greatest Concern with Action Plan 2011 Annual Puget Sound Energy SQI and Electric Service Reliability Report 127
Ci rcuit County 2011 5Year 2011 2010 5 Year 2010 Action by PSE Avg Rank Average Avg Rank Average
Total eMI Tolal eMI
13 1,368,480 6 1,797,188
"
significanlly improved with the addition substation. Installed a gang operated
2011. Reconductor of overhead feeder to wire is scheduled for completion by 2013.
to tree
100""",; ''''' 'w;;nl improve reliability. Substation dependent on area growth.
;
2012.
i is currently reviewing i reliability improvements
is currently
i anew . Construction dependent area growth.
Ulli KU

Appendix N: Areas of Greatest Concern with Action Plan 2011 Annual Puget Sound Energy SQI and Electric Service Reliability Report 128
; I
41
and potential reliability
one gang . A cable remediation project is
i cable
i i
project completed in line to tree wire project
;0 to tree wire
j i
recloser scheduled for
in 2009. Conversion job submitted in 2012.
Ulli KU

Appendix N: Areas of Greatest Concern with Action Plan 2011 Annual Puget Sound Energy SQI and Electric Service Reliability Report 129
CircUit County 20115Year 2011 20105Year 2010 Action by PSE
Blumaer-16
Yelm-27
Skykomish-25
Snoqualmie-13
Silverdale-16
Long Lake-21
Port Ludlow-16
Airport -23
Rose Hill-21
South Keyport-22
Longmire-22
Murden Cove-15
Port Madison-16
Thurston
Thurston
King
King
Kilsap
Kitsap
Jefferson
Avg Rank Average Avg Rank Average
44
45
46
47
48
49
50
Total eMI Total eM t
983,762
931 ,260
865,826
Not 011 2010 Top 50 Us!
35 1,083,989
Planning is currently reviewing and identifying lential reliabili im rovemenls ro"ects.
Installed spacers on feeder oul of substation in 2011
Not on 2010 Top SO Us! Planning is currently reviewing and identifying lentiat reliabilit im rovemenls ro"ects.
1,412,106 Not on 2010 Top SO Us! Planning is currently reviewing and identifying lentiat reliabilit im rovemenls ro"ects.
707,794 24 792,467 An autotransformer replacement project and a cable re laeeman! ro"ecl are tanned for 2012.
629,812 Not on 2010 Top 50 List Completed a tree wire project and two recloser
817,325 39
projects in 2011 . A tree wire project is planned for 2012.
855,642 Planning is currently reviewing and identifying tential reliabili im rovements ro·ects.
Thurston Not on 2011 Top 50 list 10 1,165,065 Completed reconductor of overhead line to tree wire in 2010.
King Not on 2011 Top 50 list 15
Kitsap Not on 2011 Top 50 list 18
Thurston Not on 2011 Top 50 List 31
Kitsap Not on 2011 Top 50 list 38
Kitsap Not on 2011 Top 50 list 41
879,681 Completed tree wire and recloser projects in 2009, underground feeder conversion project in 2010. Reconductor overhead line to tree wire pending com lelion of a transmission line ect.
1,448,338 Installed tlNo gang operated switches and replaced padmount switch in 2011 . The circui t has been reconfigured to better segregate load . A cable replacement project is planned for 2012. A feeder tie pro·ect is planned for 2013.
2,276,256 Portions of the underground feeder system were replaced from 2009-2011 and a second recloser and additional switches have been installed. Overhead reconductor to tree wire scheduled for 2012.
1,075,776 Installed five gang operated switches in 2011. The circuit has been reconfigured to better segregate load.
697 ,885 Completed one recloser project in 2010. Two cable replacement projects are planned for 2012. Planning is currently reviewing and identifying potential reliabili im rovements ro·ects.
Ulli KU

Appendix N: Areas of Greatest Concern with Action Plan 2011 Annual Puget Sound Energy SQI and Electric Service Reliability Report 130
I I
CIrcuIt County 20115 Year 2011 20105 Year 2010 ActIon by PSE Avg Rank Average Avg Rank Average
Total CMI Total CMI
Not on 2011 Top 50 Ust 45 793,267
~~~~~ gang operated switch and two reclo5efS
tree wire project is planned for 2013. The been reconfigured to better segregate the
one tree ,i one two gang operated switches in 2011. One tree project and two gang operated switches planned
Ulli KU
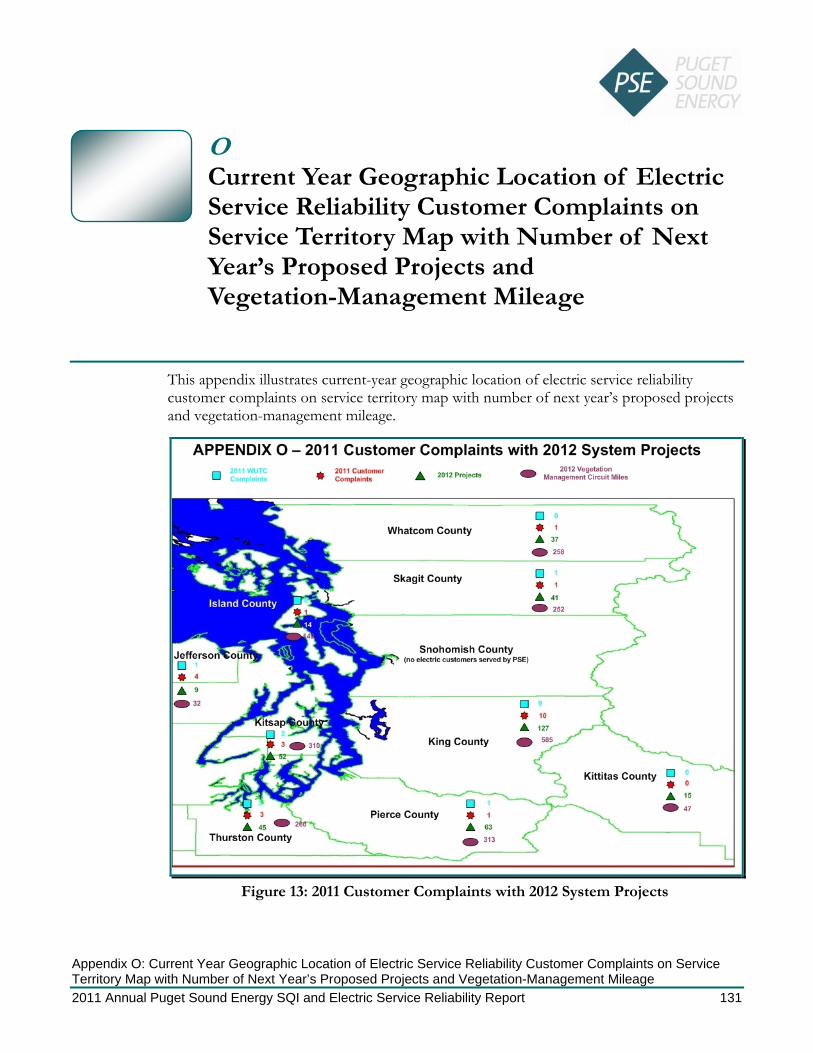
Appendix O: Current Year Geographic Location of Electric Service Reliability Customer Complaints on Service Territory Map with Number of Next Year’s Proposed Projects and Vegetation-Management Mileage 2011 Annual Puget Sound Energy SQI and Electric Service Reliability Report 131
O Current Year Geographic Location of Electric Service Reliability Customer Complaints on Service Territory Map with Number of Next Year’s Proposed Projects and Vegetation-Management Mileage
This appendix illustrates current-year geographic location of electric service reliability customer complaints on service territory map with number of next year’s proposed projects and vegetation-management mileage.
Figure 13: 2011 Customer Complaints with 2012 System Projects


