Page 1 of 25 Table of contents 1. Key points 2. Animated YouTube video 3. Introduction 4. National comparisons 5. Provision of unpaid care across English regions and Wales 6. English local authority comparisons - total unpaid care in 2011 and comparison with 2001 7. English local authority comparisons - provision of 50 or more hours of unpaid care by local authority and 2001 comparisons 8. English local authority comparisons - linkage of unpaid care with general health 9. Welsh Unitary Authority comparisons - a comparison of care provision between 2001-2011 10. Care provision for small area groupings in England and Wales 11. More Census analysis 12. Background notes Next release: To be announced Release date: 15 February 2013 Contact: Chris White [email protected]Article 2011 Census analysis: Unpaid care in England and Wales, 2011 and comparison with 2001 Analysis of how unpaid care is provided in England and Wales in 2011, with findings at regional and local authority level.
Transcript
Page 1 of 25
Table of contents
1. Key points
2. Animated YouTube video
3. Introduction
4. National comparisons
5. Provision of unpaid care across English regions and Wales
6. English local authority comparisons - total unpaid care in 2011 and comparison with 2001
7. English local authority comparisons - provision of 50 or more hours of unpaid care by local authority and 2001 comparisons
8. English local authority comparisons - linkage of unpaid care with general health
9. Welsh Unitary Authority comparisons - a comparison of care provision between 2001-2011
10. Care provision for small area groupings in England and Wales
2011 Census analysis: Unpaid care in England and Wales, 2011 and comparison with 2001Analysis of how unpaid care is provided in England and Wales in 2011, with findings at regional and local authority level.
Page 2 of 25
1.
2.
1. Key points
There were approximately 5.8 million people providing unpaid care in England and Wales in 2011, representing just over one tenth of the population.
The absolute number of unpaid carers has grown by 600,000 since 2001; the largest growth was in the highest unpaid care category, fifty or more hours per week.
Unpaid care has increased at a faster pace than population growth between 2001 and 2011 in England and Wales; the same is true in Wales and across all English regions other than London, where it decreased.
The provision of unpaid care is more than twice as high in Neath Port Talbot (14.6 per cent) than in Wandsworth borough (6.5 per cent), in 2011.
Most authorities experienced increases in unpaid care between 2001 and 2011.
Authorities with higher percentages of their population who are ‘limited a lot’ in daily activities also have higher levels of unpaid care provided.
2. Animated YouTube video
There is a short which accompanies this release.video about the provision of Unpaid Care in England and Wales
3. Introduction
The provision of unpaid care in England and Wales is becoming increasingly common as the population ages, with an expectation that the demand for care provided by spouses and adult children will more than double over the next thirty years . The provision of unpaid care is therefore an important social policy issue because it not 1
only makes a vital contribution to the supply of care, but can also affect the employment opportunities and social and leisure activities of those providing it. Carers are a socially and demographically diverse group and as the demand for care is projected to grow, people are increasingly likely to become providers of care at some point in their lives.
The importance of unpaid care was reflected by its inclusion as an item in both the 2001 Census and 2011 Census . The questions asked were the same in each census, therefore direct comparison over time on the 2
number of unpaid carers and the extent of care they provide is possible at national, regional and local level, and by level of area disadvantage.
Notes for introduction
Informal Care for Older People Provided by Their Adult Children: Projections of Supply and Demand to 2041 in England, Personal Social Services Research Unit.
The 2001 and asked whether you provided unpaid care to family 2011 Census forms (2.02 Mb Pdf)members, friends, neighbours or others because of long-term physical or mental ill health or disability, or problems related to old age and for how many hours per week.
The 2011 Census shows there are approximately 5.8 million people providing unpaid care in England and Wales, representing just over one tenth of the population (10.3 per cent); in 2001 it was 10.0 per cent). Of these, around 3.7 million provide 1-19 hours per week, 775,000 provide 20-49 hours and 1.4 million provide 50 hours or more unpaid care.
Figure 1: The breakdown of unpaid care categories for England and Wales
Source: Census - Office for National Statistics
Notes:
Percentages are rounded values to one decimal place.
Levels of unpaid care were higher in Wales than in England for all categories, so that in Wales more than 12 per cent of the population were providing some level of care in 2011; however, the provision of between 1 to 19 hours of unpaid care was similar in Wales (6.9 per cent) to that in England (6.5 per cent).
Since 2001, there has been an increase of approximately 600,000 people providing unpaid care in England and Wales, 30,000 of whom are in Wales, representing a percentage increase of 3.2 per cent. The growth in unpaid care was highest in the 50 hours or more category, where an additional 271,649 carers were providing this extent of care compared with 2001; in the 1-19 hours category the number of additional carers was 109,250, and in the 20-49 hours category there was an additional 201,542.
If people, on average, are providing towards the mid-range of hours per week in the 1-19 or 20-49 hour categories, and 50 hours in the 50 hours or more category, then this amounts to approximately 3.4 million working weeks of care provided based on a standard 37 hours working week and 17 million working days in a given week in 2011.
5. Provision of unpaid care across English regions and Wales
Figure 2: Provision of unpaid care across English regions and Wales, 2011
Source: Census - Office for National Statistics
Notes:
Percentages are rounded values to one decimal place.
Across English regions and Wales, the provision of between 1 and 19 hours was the most common level of care provided. London had the lowest percentage of unpaid carers and Wales the highest. London’s lower level of care provision is likely to be influenced by its younger age structure, the transient nature of its population and differences in household composition.
Wales had a higher percentage of people providing unpaid care overall than any English region at 12.1 per cent, and was highest in the categories 20-49 hours and 50 hours or more.
In England, as with and , a clear north-south divide exists with the highest percentages of general health disabilitycare provision being in the North West, North East, East and West Midlands. The only exception to this being Yorkshire and the Humber having a lower percentage than the South West. The relatively older age structure of the South West population is also likely to influence the underlying need for care compared with other southern regions such as the South East and London.
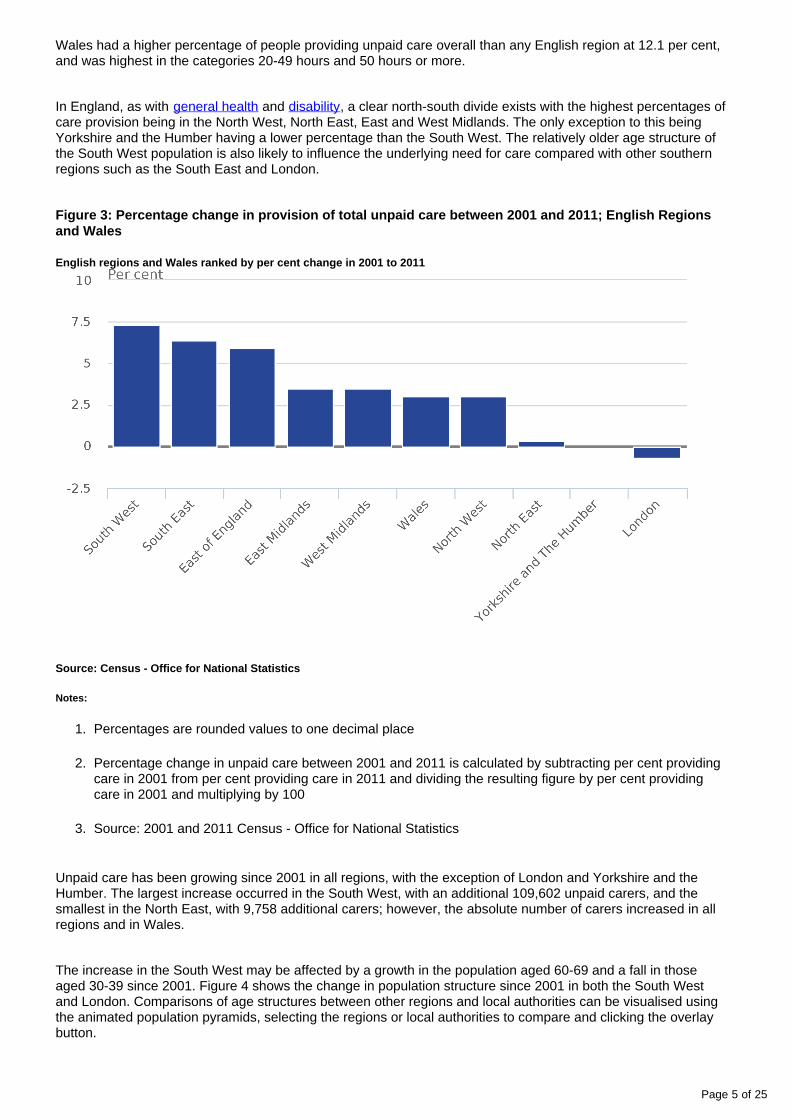
Figure 3: Percentage change in provision of total unpaid care between 2001 and 2011; English Regions and Wales
English regions and Wales ranked by per cent change in 2001 to 2011
Source: Census - Office for National Statistics
Notes:
Percentages are rounded values to one decimal place
Percentage change in unpaid care between 2001 and 2011 is calculated by subtracting per cent providing care in 2001 from per cent providing care in 2011 and dividing the resulting figure by per cent providing care in 2001 and multiplying by 100
Source: 2001 and 2011 Census - Office for National Statistics
Unpaid care has been growing since 2001 in all regions, with the exception of London and Yorkshire and the Humber. The largest increase occurred in the South West, with an additional 109,602 unpaid carers, and the smallest in the North East, with 9,758 additional carers; however, the absolute number of carers increased in all regions and in Wales.
The increase in the South West may be affected by a growth in the population aged 60-69 and a fall in those aged 30-39 since 2001. Figure 4 shows the change in population structure since 2001 in both the South West and London. Comparisons of age structures between other regions and local authorities can be visualised using the animated population pyramids, selecting the regions or local authorities to compare and clicking the overlay button.
Figure 4: Comparison of the South West region’s population age-structure with that of London's in 2011, with 2001 structure overlaid, by sex
Source: Census - Office for National Statistics
Notes:
Percentages are rounded values to one decimal place.
6. English local authority comparisons - total unpaid care in 2011 and comparison with 2001
There is a 6.8 per cent difference in the amount of unpaid care provided by the residents of North East Derbyshire (13.3 per cent) and Wandsworth (6.5 per cent). This means that twice as much care is being provided in North East Derbyshire when compared with Wandsworth (Figure 5).
Figure 5: Local authorities with highest and lowest provision of unpaid care, ranked by the total of all durations of care combined with duration specific categories
Source: Census - Office for National Statistics
Notes:
Percentages are rounded values to one decimal place.
Of the top ten authorities providing the least care overall, nine are London boroughs, eight of which are inner London boroughs. Those authorities whose usual residents provide the most unpaid care are more mixed in their regional make-up; the majority have significant rural based populations and only St. Helens and Sefton in the North West region are major urban settlements in the Department for the Environment, Food and Rural Affairs urban – rural classification. ( and Comparison with 2001 provides more Disability in England and Wales, 2011information).
There is a strong relationship between the percentage of an authority’s usual residents who are limited in daily activities and in the amount of unpaid care their residents provide; for example, four authorities in the top ten 1
with the highest percentage of unpaid carers (East Lindsey, Bolsover, West Somerset and Wyre) also feature in the .top ten authorities with the highest prevalence of disability
Differences in care provision are also present by a measure of area deprivation . Although Liverpool, the most 2
deprived local authority in England based on the , has a Indices of Deprivation 2010 average summary scoreyounger age structure than Hart, the least deprived, Liverpool has a higher percentage of unpaid carers.
was in Disability-free life expectancy 3 10 years higher for men in Hart than Liverpool (249.5 Kb Excel sheet)2007-09 suggesting care needs are likely to be manifesting at earlier ages in Liverpool which may explain the higher level of unpaid care in Liverpool despite its younger age structure. An which enables interactive mapinformation on the extent of unpaid care to be accessed for each local authority in England and Wales in 2001 and 2011 is available.
Another interesting question to ask is whether there is an unmet need for care, which could be related to the supply of care home facilities. The 2011 Census enumerated residents of medical and care establishments, which enables an assessment of how equally these facilities are distributed across local authorities. If there is an unmet need for care, it might be expected that the rate of medical and care establishment enumerations per 1000 population would be lower in those authorities where unpaid care levels are high.
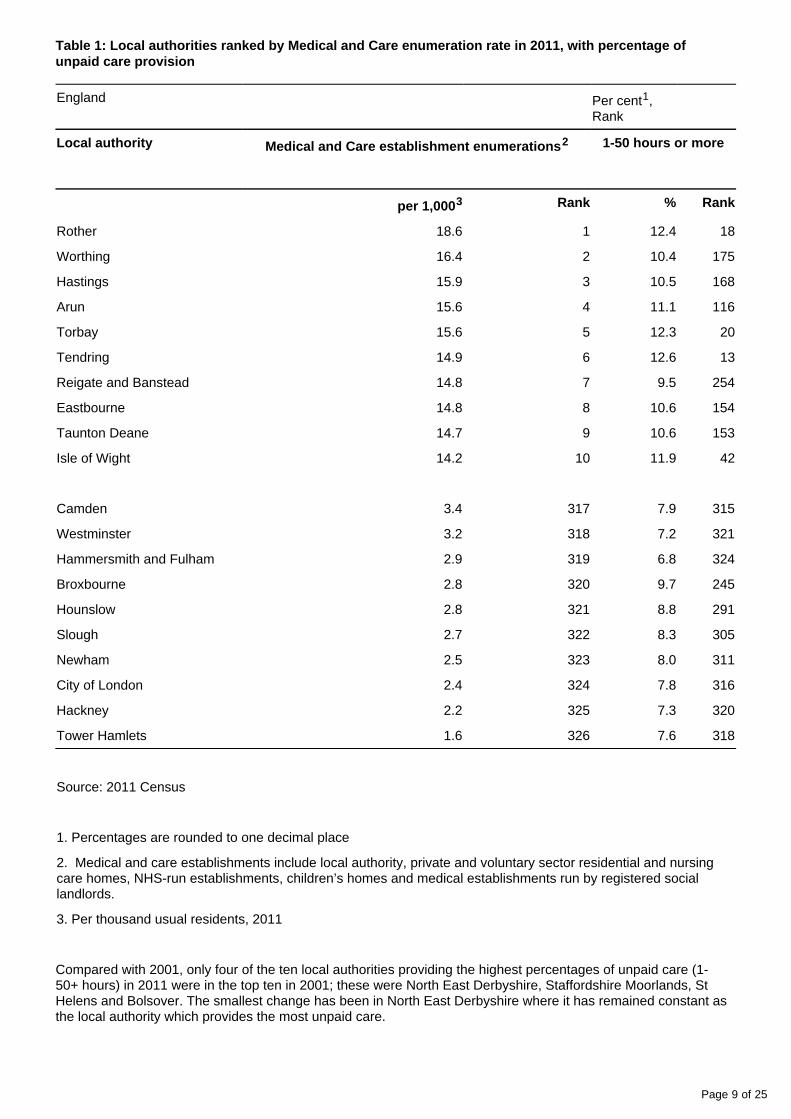
Rother has the highest medical and care enumeration rate (Table 1) and is ranked 18th highest on percentage of all care durations. However, North East Derbyshire had the highest percentage of unpaid carers, but its medical and care enumeration rank is 181st. The 2011 Census suggests that local authorities with the lowest medical and care establishment enumeration rate also have lower levels of unpaid care; however, among those with the highest rates, their unpaid care ranking is more contrasting.
Page 9 of 25
Table 1: Local authorities ranked by Medical and Care enumeration rate in 2011, with percentage of unpaid care provision
England Per cent , 1
Rank
Local authority Medical and Care establishment enumerations2 1-50 hours or more
per 1,0003 Rank % Rank
Rother 18.6 1 12.4 18
Worthing 16.4 2 10.4 175
Hastings 15.9 3 10.5 168
Arun 15.6 4 11.1 116
Torbay 15.6 5 12.3 20
Tendring 14.9 6 12.6 13
Reigate and Banstead 14.8 7 9.5 254
Eastbourne 14.8 8 10.6 154
Taunton Deane 14.7 9 10.6 153
Isle of Wight 14.2 10 11.9 42
Camden 3.4 317 7.9 315
Westminster 3.2 318 7.2 321
Hammersmith and Fulham 2.9 319 6.8 324
Broxbourne 2.8 320 9.7 245
Hounslow 2.8 321 8.8 291
Slough 2.7 322 8.3 305
Newham 2.5 323 8.0 311
City of London 2.4 324 7.8 316
Hackney 2.2 325 7.3 320
Tower Hamlets 1.6 326 7.6 318
Source: 2011 Census
1. Percentages are rounded to one decimal place
2. Medical and care establishments include local authority, private and voluntary sector residential and nursing care homes, NHS-run establishments, children’s homes and medical establishments run by registered social landlords.
3. Per thousand usual residents, 2011
Compared with 2001, only four of the ten local authorities providing the highest percentages of unpaid care (1-50+ hours) in 2011 were in the top ten in 2001; these were North East Derbyshire, Staffordshire Moorlands, St Helens and Bolsover. The smallest change has been in North East Derbyshire where it has remained constant as the local authority which provides the most unpaid care.
Page 10 of 25
Table 2 ranks the 10 authorities with the highest percentage increases and decreases in the provision of all durations of care between 2001 and 2011.
Table 2: Authorities ranked by the highest percentage increases or decreases in the provision of care between 2001 and 2011
England Per cent , Rank1
Local Authority 2011 (%)
2001 (%)
2011 (Rank)
2001 (Rank)
Change 2001-2011 (%)2
Change in carer number
Isles of Scilly 10.0 8.0 224 310 25.0 48
Eden 11.3 9.7 84 202 17.2 1,144
West Somerset 12.7 10.9 7 64 16.4 574
Purbeck 12.7 10.9 9 65 16.3 857
Gosport 9.9 8.6 230 293 15.5 1,631
Stevenage 10.2 8.8 198 277 15.4 1,518
Torbay 12.3 10.7 20 88 14.9 2,226
Teignbridge 12.1 10.6 29 104 14.4 2,234
East Lindsey 13.0 11.4 2 28 14.0 2,858
Fareham 10.6 9.3 146 240 14.0 1,798
Waltham Forest 8.2 8.6 308 289 -4.4 2,450
Bradford 9.8 10.3 242 138 -4.8 3,046
Southwark 7.2 7.6 322 319 -4.9 2,210
Sheffield 10.4 10.9 179 59 -5.0 1,315
Middlesbrough 10.2 10.8 196 74 -5.5 -445
Newham 8.0 8.5 311 297 -5.7 3,941
City of London 7.8 8.3 316 304 -6.2 -22
Newcastle upon Tyne 9.2 10.1 273 152 -9.0 -457
Barking and Dagenham
8.7 9.7 295 197 -10.3 281
Tower Hamlets 7.6 8.6 318 292 -11.1 2,559
Sources: 2001 Census, 2011 Census
1. Percentages are rounded to one decimal place
2. Percentage change in unpaid care between 2001 and 2011 is calculated by subtracting per cent providing care in 2001 from per cent providing care in 2011 and dividing the resulting figure by per cent providing care in 2001 and multiplying by 100.
Page 11 of 25
West Somerset and Purbeck had the biggest changes in rank from the 64th and 65th highest respectively in 2001 to the 7th and 9th highest in 2011 (Table 2). When ranking authorities on the basis of the percentage change in care provision, 271 authorities experienced increases and only 55 authorities experienced decreases. The Isles of Scilly had the highest percentage increase in unpaid care, but its population is small and therefore had only a modest change in absolute numbers. All 10 of the top providers of care in 2011 (Figure 5) have seen increases in the percentage of carers over the decade. Of these top 10 providers of care in 2011 the largest increase was in West Somerset, which saw a percentage increase of 16.4 per cent. East Lindsey, the authority with the highest percentage of people with activity limitations was among the top 10 authorities with the highest increases in care provided.
Authorities experiencing the largest falls were urban conurbations. However, as can be seen in table 2, although all experienced a percentage fall, in all but three cases, the absolute number of carers increased, because of increases in population size over the ten years. The northern cities of Newcastle-upon-Tyne, Sheffield and Bradford, and the town of Middlesbrough had the greatest fall in their ranking between 2001 and 2011 for the amount of care provided, but of these only Newcastle-upon-Tyne and Middlesbrough actually saw the absolute number of carers fall.
What these results show is that unpaid care has risen in the majority of authorities, and even in those which experienced a percentage fall, absolute numbers have increased in 320 authorities and decreased in only 6; in Birmingham the absolute number of unpaid carers increased by more than 9,000, while in Newcastle-upon-Tyne the number of unpaid carers fell by 457.
A comparison of unpaid care across all authorities in England in both 2011 and 2001 is shown in Map 1 and Map 2 respectively. The darker colours signify higher percentages and the lighter colours lower percentages with the ranges kept constant between 2001 and 2011. The key shows the number of authorities within each range in brackets.
The maps show a general increase in care provided across most English authorities, with the exception of London boroughs which are largely unchanged. Those areas with higher levels of unpaid care in 2001 were largely similar in 2011, but the extent of care increased. The coastal areas in the East of England, the South West and North West, and the central belt across the East Midlands have the highest concentrations of unpaid care in 2011 which is partly explained by higher concentrations of retired people in these authorities.
Page 12 of 25
Map 1: Prevalence of unpaid carers by local or unitary authority in England, 2011
Map 2: Prevalence of unpaid carers by local or unitary authority in England, 2001
An which enables information on the extent of unpaid care to be accessed for each local authority interactive mapin England and Wales in 2001 and 2011 is available.
Notes for English local authority comparisons - total unpaid care in 2011 and comparison with 2001
People with health problems or disabilities which are long-lasting and reduce a person’s ability to carry out the activities people usually do day-to-day, such as house keeping, cooking, paying bills, as well as self-care tasks such as washing and dressing without help. Other limitations include mobility difficulties, reaching, stretching and lifting objects, as well as sight, hearing and communication problems.
IMD Summary score rank is based on the average of LSOA ranks and takes account of material characteristics such as income, environment, housing quality, unemployment, access to services and education.
Disability-free Life Expectancy is an estimate of the average number of years a person would live without a long-standing illness or disability which limits daily activities if he or she experienced the specified population’s age-specific mortality and disability rates for that time period throughout the rest of his or her life.
7. English local authority comparisons - provision of 50 or more hours of unpaid care by local authority and 2001 comparisons
As shown above (Figure 5), there is twice as much total unpaid care provided by the residents of North East Derbyshire compared with the residents of Wandsworth. As care is often related to health problems and disabilities which limited daily activities, it is expected that unpaid care would be higher in those authorities with the highest prevalence of people who are ‘limited a lot’ in daily activities and have older age structures. Figure 6 plots the percentage of an authority’s usual residents who provide 50 hours or more care per week against its percentage of people who are ‘limited a lot’ in daily activities.
Figure 6: Per cent ‘limited a lot’ and per cent providing 50 hours or more unpaid care, by local authority in England in 2011
Source: Census - Office for National Statistics
Notes:
Percentages are rounded values to one decimal place.
Figure 6 shows a consistent increase in the highest levels of care provided (that is 50 or more hours per week) with increases in activity limitation. While this is to be expected, there is clearly an additional burden on relatives, friends and other informal carers in authorities with higher prevalence of activity limitations, such as East Lindsey and Knowsley and, therefore, greater reliance on unpaid carers to support the social care needs of its residents compared to authorities such as the London borough of Wandsworth.
There is a sizeable contrast in the age structure of Wandsworth and Knowsley (Figure 7), with Wandsworth having a relatively high proportion of its population in the 30-39 age group and relatively low population of state pension age. Conversely, Knowsley has a larger population of state pension age. Wandsworth’s population is also likely to be more transient and therefore less likely to have family links in the immediate vicinity, mitigating the likelihood of local care commitments. Knowsley’s population is more rooted, and has a higher proportion aged 45 and over, a population group at higher risk of both activity limitation and needing to provide care for family members and friends.
Figure 7: Age structure of Wandsworth's and Knowsley's usually resident population at 2011 Census, by sex
Source: Census - Office for National Statistics
Notes:
Percentages are rounded values to one decimal place.
In terms of the change in those providing 50 hours or more unpaid care between 2001 and 2011, Table 3 ranks authorities on the percentages of their respective usual resident populations which provide 50 hours or more unpaid care in 2011, including the highest and lowest ten. All authorities, other than the City of London, had a growth in absolute numbers. In East Lindsey, the highest authority in 2011 for 50 hours or more unpaid care, the absolute number of carers increased by almost 1,400. Of the top ten authorities, eight were concentrated in the northern regions or the East Midlands.
Conversely, those authorities with the smallest percentages in 2011 were located in London, the university centres of Oxford and Cambridge and the affluent authorities of Elmbridge and Hart. All these authorities had smaller increases in 50 hours or more unpaid care compared with 2001, but all other than the City of London experienced a growth in absolute numbers ranging from 336 unpaid carers in Hart to 822 in Lambeth.
Table 3: Authorities ranked by the highest percentages of 50 hours or more unpaid care provision in 2011 with the percentage of carers in 2001 and the change in unpaid carer numbers
England Per cent1
Local Authority 2011 (%)
2001 (%)
Change in carer number
East Lindsey 4.1 3.3 1,374
Knowsley 4.0 3.5 570
St. Helens 3.7 3.0 1,217
Halton 3.6 3.1 870
Blackpool 3.6 3.1 696
Torbay 3.6 2.8 1,102
Bolsover 3.5 3.5 206
Tendring 3.5 2.8 1,060
Sunderland 3.5 3.0 1,262
Rotherham 3.4 3.0 1,478
Elmbridge 1.4 1.2 431
Hart 1.4 1.1 336
Lambeth 1.4 1.3 822
Hammersmith and Fulham
1.4 1.2 555
Oxford 1.4 1.3 405
Wandsworth 1.3 1.2 758
Cambridge 1.3 1.1 340
Richmond upon Thames 1.3 1.1 475
Kensington and Chelsea 1.2 1.0 438
City of London 0.9 1.1 -12
Sources: 2001 Census, 2011 Census
1. Percentages are rounded to one decimal place
8. English local authority comparisons - linkage of unpaid care with general health
There is evidence in the literature to suggest that people providing unpaid care are at increased risk of depending on their age and place in the labour market which has a negative effect on their psychological stress
mental and emotional well-being. The general health question asked in the 2011 Census encompasses mental as well as physical aspects of health. Therefore the general health status of local authority populations is likely to be influenced by the level of unpaid care its population provides.
For example, North East Derbyshire has the highest proportion of people providing unpaid care in England and this local authority’s ranking on the percentage of its population in either ‘Very good’ or ‘Good’ general health was low in 2011, 293rd out of 326. East Lindsey had the highest proportion providing 50 hours or more unpaid care and it was ranked the lowest (326th) on general health. Whether this suggests care is affecting health or whether care is higher because levels of either ‘Very good’ or ‘Good’ general health are lower, and therefore there is greater need for care, is uncertain; Future data releases from the 2011 Census will enable the general health of carers by duration category to be measured, taking account of other contributing factors such as household structure, the distribution by age, gender, participation in the labour market and socio-economic position, and in the context of statutory care provision across administrative areas.
9. Welsh Unitary Authority comparisons - a comparison of care provision between 2001-2011
There are 22 Unitary Authorities in Wales ranging in population size and density. Cardiff has the largest population and Merthyr Tydfil the smallest.
In Wales in 2011 Neath Port Talbot was the authority with the largest percentage of its population providing unpaid care at 14.6 per cent, higher than any authority in England; Cardiff had the lowest at 10.1 per cent, representing a difference of 4.5 percentage points. The gap between authorities providing unpaid care in Wales is somewhat smaller than that in England.
Figure 8: Provision of unpaid care by duration category and unitary authority in Wales, 2011
1. Percentages are rounded values to one decimal place.
An which enables information on the extent of unpaid care to be accessed for each unitary interactive mapauthority in Wales in 2001 and 2011 is available.
The top five authorities whose usual residents provide the highest percentages of unpaid care are concentrated in the south of Wales, while authorities with their usual residents providing the least care are spread more widely (Table 4). The likely reasons for Cardiff’s lower unpaid care provision is its younger age structure; its lower percentage of the population with and the highest percentage of its population activity limitations reporting either
. Conversely, Neath Port Talbot had the highest percentage of its population ‘Very good’ or ‘Good’ general health, which has been shown previously in this short story to be connected with the level of reporting activity limitations
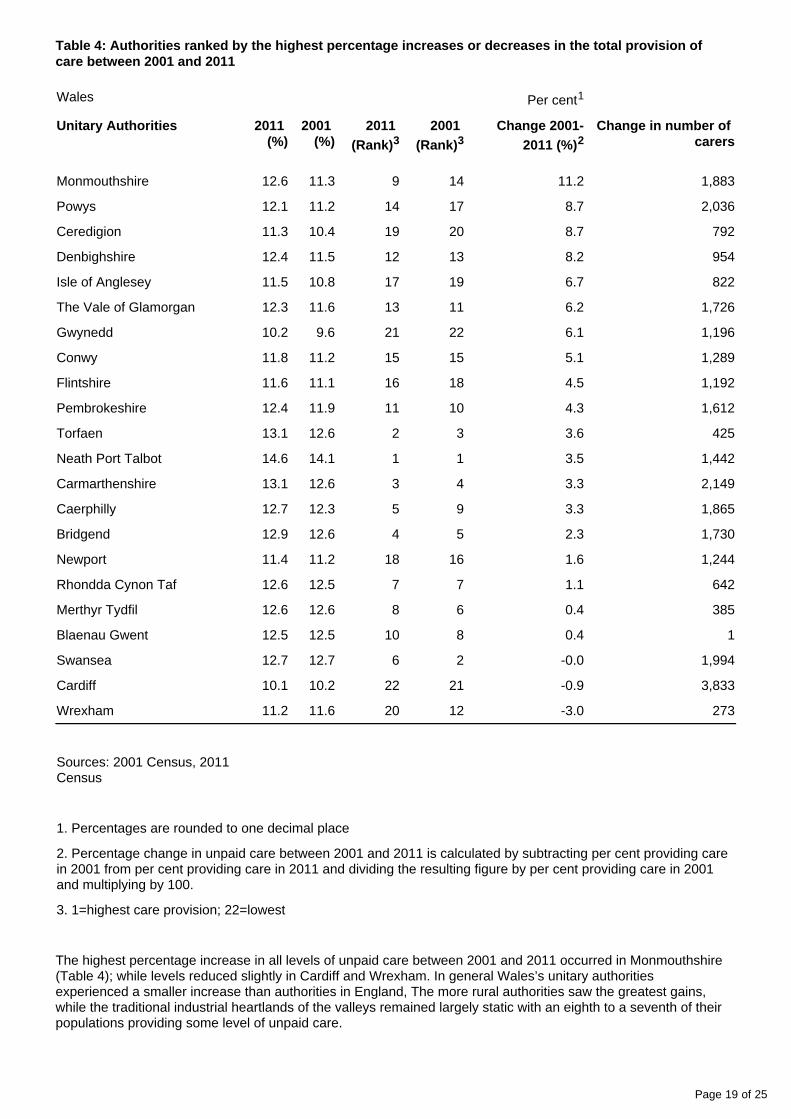
Table 4: Authorities ranked by the highest percentage increases or decreases in the total provision of care between 2001 and 2011
Wales Per cent1
Unitary Authorities 2011 (%)
2001 (%)
2011 (Rank)3
2001 (Rank)3
Change 2001-2011 (%)2
Change in number of carers
Monmouthshire 12.6 11.3 9 14 11.2 1,883
Powys 12.1 11.2 14 17 8.7 2,036
Ceredigion 11.3 10.4 19 20 8.7 792
Denbighshire 12.4 11.5 12 13 8.2 954
Isle of Anglesey 11.5 10.8 17 19 6.7 822
The Vale of Glamorgan 12.3 11.6 13 11 6.2 1,726
Gwynedd 10.2 9.6 21 22 6.1 1,196
Conwy 11.8 11.2 15 15 5.1 1,289
Flintshire 11.6 11.1 16 18 4.5 1,192
Pembrokeshire 12.4 11.9 11 10 4.3 1,612
Torfaen 13.1 12.6 2 3 3.6 425
Neath Port Talbot 14.6 14.1 1 1 3.5 1,442
Carmarthenshire 13.1 12.6 3 4 3.3 2,149
Caerphilly 12.7 12.3 5 9 3.3 1,865
Bridgend 12.9 12.6 4 5 2.3 1,730
Newport 11.4 11.2 18 16 1.6 1,244
Rhondda Cynon Taf 12.6 12.5 7 7 1.1 642
Merthyr Tydfil 12.6 12.6 8 6 0.4 385
Blaenau Gwent 12.5 12.5 10 8 0.4 1
Swansea 12.7 12.7 6 2 -0.0 1,994
Cardiff 10.1 10.2 22 21 -0.9 3,833
Wrexham 11.2 11.6 20 12 -3.0 273
Sources: 2001 Census, 2011 Census
1. Percentages are rounded to one decimal place
2. Percentage change in unpaid care between 2001 and 2011 is calculated by subtracting per cent providing care in 2001 from per cent providing care in 2011 and dividing the resulting figure by per cent providing care in 2001 and multiplying by 100.
3. 1=highest care provision; 22=lowest
The highest percentage increase in all levels of unpaid care between 2001 and 2011 occurred in Monmouthshire (Table 4); while levels reduced slightly in Cardiff and Wrexham. In general Wales’s unitary authorities experienced a smaller increase than authorities in England, The more rural authorities saw the greatest gains, while the traditional industrial heartlands of the valleys remained largely static with an eighth to a seventh of their populations providing some level of unpaid care.
Page 20 of 25
As in England, population growth partly explains the increase in the absolute number of carers between 2001 and 2011; in Cardiff, although there was a slight fall in the percentage of the population providing unpaid care, absolute numbers increased the most, with an additional 3,833 people providing unpaid care. In fact all unitary authorities in Wales had an increase in the absolute number of carers compared with 2001.
A comparison of unpaid care across all authorities in Wales both in 2011 and 2001 is shown in Map 3 and Map 4 respectively. The darker colours signify higher percentages and the lighter colours lower percentages with the ranges kept constant in 2001 and 2011. The key shows the number of authorities within each range in brackets. Different ranges are used in the Welsh maps so the shadings are not comparable with the English maps.
Map 3: Prevalence of unpaid carers by unitary authority in Wales, 2011
Map 4. Prevalence of unpaid carers by unitary authority in Wales, 2001
As in England, the maps demonstrate a general increase in the provision of unpaid care with Camarthenshire and Monmouthshire showing the most marked increases. The same pattern of higher concentrations in South Wales and lower concentrations in North Wales is maintained.
10. Care provision for small area groupings in England and Wales
The inequality that exists between populations is often explained in terms of area disadvantage. Measures of health status such as are shown to be more favourable in some life expectancy and health expectancygeographical locations than others and to be strongly patterned with material factors such as income, environment, housing quality, unemployment, access to services and education. These factors can be brought together into an index (such as the which can be applied to small areas such as English Indices of Deprivation
(LSOAs) to give a measure of relative material disadvantage experienced by a specific lower super output areasarea compared with other areas.
In order to present a picture of unpaid care and the scale of inequality that exists between population groupings, these small areas are amalgamated, on the basis of their relative level of disadvantage. The Index of Multiple Deprivation and in England, and the Welsh Index of Multiple Deprivation and in Wales, are 2004 2010 2005 2011used to group areas into tenths (deciles). Percentages of unpaid care are then calculated for these deciles.
In England there were 32,844 LSOAs with enumerated populations in 2011; use of the ONS Census Geography lookup file enables the total number of census LSOAs to be assigned an Indices of Deprivation 2010 score. LSOAs were then ranked according to their level of deprivation and grouped into tenths (deciles), with each decile consisting of approximately 3,284 LSOAs.
In Wales there were 1,909 LSOAs enumerated in the 2011 Census; the use of the ONS lookup file enables the total number of census LSOAs to be assigned a WIMD 2011 rank so that nine deciles in Wales consisted of 191 areas, and one decile 190 areas.
In England, the difference in the percentage of unpaid care between the most and least deprived areas is modest, with levels of care lower in the more deprived areas at both time points. Between 2001 and 2011, the level of care has remained largely flat among the three most deprived area deciles, but increases have occurred in the least deprived deciles (Figure 9).
Figure 9: Percent providing unpaid care by LSOA IMD deciles, England 2001 and 2011
Source: Census - Office for National Statistics
Notes:
Index of Multiple Deprivation 2004.
Index of Multiple Deprivation 2010.
In descending order of deprivation, i.e decile 1 represents the most deprived ten per cent of Lower Super Output Areas in England and decile 10 represents the least deprived ten per cent of Lower Super Output Areas in England.
In Wales percentages of unpaid care for each decile were higher than those in England (Figure 10). As with England, unpaid care was slightly lower in the more deprived deciles in both 2001 and 2011. Only decile 3 experienced a slight fall in unpaid care between 2001 and 2011, with the greatest increases occurring from the middle to the least deprived deciles.
Figure 10: Percent providing unpaid care by LSOA WIMD deciles, Wales 2001, 2011
Source: Census - Office for National Statistics
Notes:
Welsh Index of Multiple Deprivation 2005.
Welsh Index of Multiple Deprivation 2011.
In descending order of deprivation, i.e decile 1 represents the most deprived ten per cent of Lower Super Output Areas in England and decile 10 represents the least deprived ten per cent of Lower Super Output Areas in England.
Percentages are rounded to one decimal place.
Of interest is the lower level of provision of unpaid care in the more deprived deciles for the last two censuses in both England and Wales. This is surprising given that levels of either ‘Very good’ or ‘Good’ are general healthlower in the more deprived deciles and rates of are higher. A possible explanation for this could activity limitationbe that people in less deprived areas live longer, and therefore their populations are somewhat older and more at risk of surviving into states of dependency, whereas in the most deprived areas the mortality rate is higher.
Another potential influence is where care is being provided. Those living in less deprived areas could be providing care for people in more deprived areas, where need is likely to be greater, which would counter any relationship with deprivation. These uncertainties can only be untangled using more detailed census data tables following future releases of multivariate statistics.
Further analysis will be needed to support this provisional finding by comparing decile age structures and taking account of any future revisions to the and the English Indices of Deprivation, 2010 Welsh Index of Multiple
using 2011 Census data.Deprivation, 2011
11. More Census analysis
Census Analysis landing page
12. Background notes
Medical and care establishments include local authority, private and voluntary sector residential and nursing care homes, NHS-run establishments, children’s homes and medical establishments run by registered social landlords.
This publication follows the . The 2011 Census Population and Household Estimates for England & Walescensus provides estimates of the characteristics of all people and households in England and Wales on census day. These are produced for a variety of users including government, local and unitary authorities, business and communities. The census provides population statistics from a national to local level. This short story discusses the results at national, regional, local and small area level.
2001 Census data are available via the website. Relevant table numbers are Neighbourhood Statisticsprovided in all download files within this publication.
Interactive developed by ONS are also available to aid interpretation of the results.data visualisations
Future releases from the 2011 Census will include more detail in cross tabulations, and tabulations at other geographies. These include wards, health areas, parliamentary constituencies, postcode sectors and national parks. Further information on future releases is available online in the .2011 Census Prospectus
ONS has ensured that the data collected meet users' needs via an extensive 2011 Census outputs process in order to ensure that the 2011 Census outputs will be of increased use in the consultation
planning of housing, education, health and transport services in future years.
Any reference to local authorities includes both local and unitary authorities.
Some numbers and percentages throughout this report may not sum due to rounding.
ONS is responsible for carrying out the census in England and Wales. Simultaneous but separate censuses took place in Scotland and Northern Ireland. These were run by the National Records of Scotland (NRS) and the Northern Ireland Statistics and Research Agency (NISRA) respectively.
A person's place of usual residence is in most cases the address at which they stay the majority of the time. For many people this will be their permanent or family home. If a member of the services did not have a permanent or family address at which they are usually resident, they were recorded as usually resident at their base address.
All key terms used in this publication are explained in the . Information on the 2011 2011 Census glossary is also available.Census Geography Products for England and Wales
All census population estimates were extensively quality assured, using other national and local sources of information for comparison and review by a series of quality assurance panels. An extensive range of
were published alongside the first release in July quality assurance, evaluation and methodology papers2012 and have been updated in this release, including a Quality and Methodology Information (QMI)
.document (152.8 Kb Pdf)
The 2011 Census achieved its overall target response rate of 94 per cent of the usually resident population of England and Wales, and over 80 per cent in all local and unitary authorities. The population estimate for England and Wales of 56.1 million is estimated with 95 per cent confidence to be accurate to within +/- 85,000 (0.15 per cent).
Enquiries relating to these statistics should be made to:
Chris White Head of Health Analysis Public Policy Analysis Division
Office for National Statistics Cardiff Road Newport Wales NP10 8XG
We would welcome feedback on the content, format and relevance of this release. Please send feedback to the postal or email address above.
Follow ONS on and .Twitter Facebook
Details of the policy governing the release of new data are available from the Media Relations Office.
Details of the policy governing the release of new data are available by visiting www.statisticsauthority.gov. or from the Media Relations Office email: uk/assessment/code-of-practice/index.html media.relations@ons.