191
©2011 Charles Donald McGlynn ALL RIGHTS RESERVED

©2011
Charles Donald McGlynn
ALL RIGHTS RESERVED

AN ISLAND ENVIRONMENT: SALTWATER INTRUSION,
GROUNDWATER MANAGEMENT AND WATER
PRIVATIZATION IN CEBU
By
CHARLES D. MCGLYNN
A Dissertation submitted to the
Graduate School-New Brunswick
Rutgers, The State University of New Jersey
in partial fulfillment of the requirements
for the degree of
Doctor of Philosophy
Graduate Program in Geography
Written under the direction of
Dr. Robert Hordon
And approved by
_________________________________
_________________________________
_________________________________
_________________________________
_________________________________
New Brunswick, New Jersey
October, 2011
ii
ABSTRACT OF THE DISSERTATION
An Island Environment: Saltwater Intrusion, Groundwater Management and Privatization in Cebu
By
CHARLES DONALD MCGLYNN
Dissertation Director:
Dr. Robert M. Hordon
“A nation that fails to plan intelligently for the development and protection of its precious waters will be condemned to wither because of its short sightedness”
(Johnson 1968)
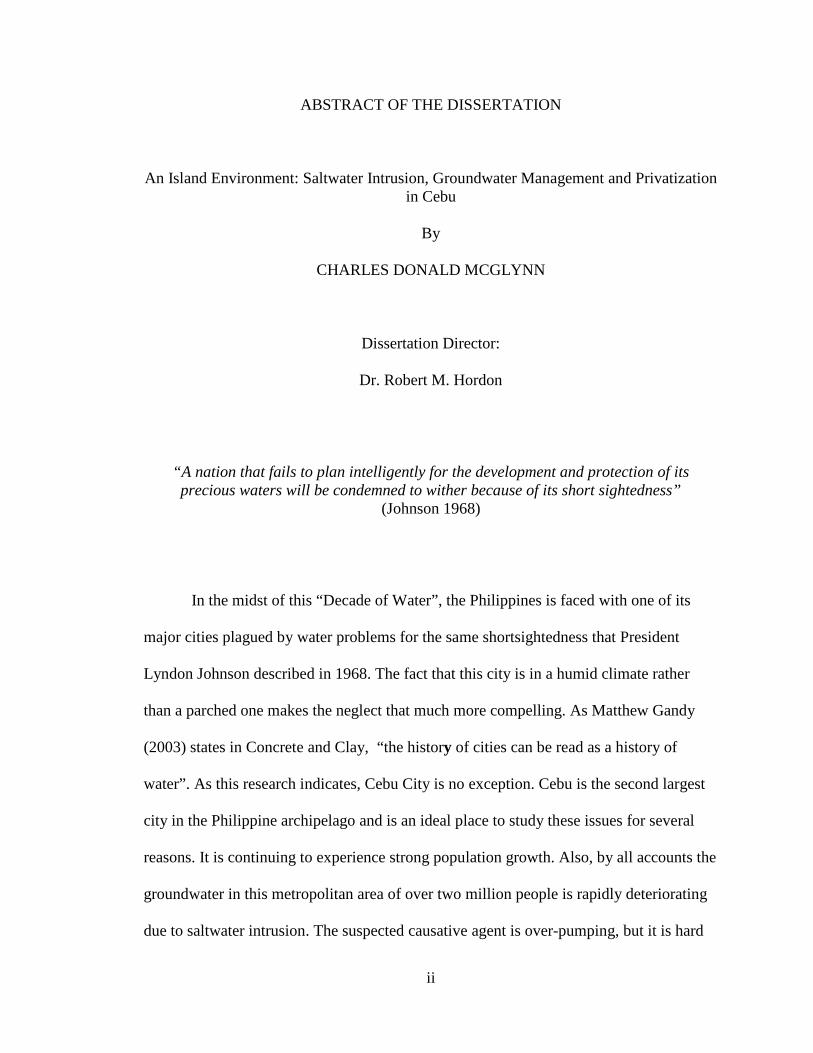
In the midst of this “Decade of Water”, the Philippines is faced with one of its
major cities plagued by water problems for the same shortsightedness that President
Lyndon Johnson described in 1968. The fact that this city is in a humid climate rather
than a parched one makes the neglect that much more compelling. As Matthew Gandy
(2003) states in Concrete and Clay, “the history of cities can be read as a history of
water”. As this research indicates, Cebu City is no exception. Cebu is the second largest
city in the Philippine archipelago and is an ideal place to study these issues for several
reasons. It is continuing to experience strong population growth. Also, by all accounts the
groundwater in this metropolitan area of over two million people is rapidly deteriorating
due to saltwater intrusion. The suspected causative agent is over-pumping, but it is hard

iii
to quantify because of incomplete records. It is estimated that withdraws from the
approximately 82,000 private wells equals the amount pumped by the Metropolitan Cebu
Water District’s (MCWD) 108 wells (Walag 2007).
On nearby Olango Island - part of provincial Cebu - about 90% of the wells are
saline. Cebu City itself appears headed for the same fate without active intervention. In
addition to salt water being drawn into the aquifer, water quality is also being degraded
by bacteriological and chemical contaminants that are being drawn down into the aquifer
due to the lack of sewage treatment (Walag 2007). This study is a practical foundation in
understanding the problems in metropolitan Cebu and the unique private response it has
generated. Because of these concerns most Cebuanos are now paying attention to the
water they drink.
“Usually we drink water without paying much attention to it. We know that water is important to our life, but because of its familiarity very rarely do we
consciously appreciate it.” (Emoto 2005)
iv
Acknowledgements
There are several individuals who have provided tools, comments and facilitated
this research. In the absence of these individuals, this work could not have been
completed. First, I would like to thank Dr. Robert Hordon without whose continued
guidance and direction this project could not have been completed. Dr. Hordon
graciously made his vast array of research material available to me along with his time
and energy on behalf of this effort. Dr. Hordon also spent countless hours reviewing the
many drafts that have resulted in this paper. Dr. Denyse Lemaire assisted greatly in
sorting through the data and notes from the two site visits and along with Dr. Hordon,
assisted in editing multiple drafts. Dr. Lemaire also provided vital geological advice and
information. My sister, Rita DiOrio was extremely generous with her time and ability to
assist in creating meaningful datasets and charts out of the raw survey data. Dr. George
Nieswand provided insight and offered technical details and guidance with regards to
water studies. Dr. Trevor Birkenholtz must be recognized for broadening this study to
include a human component. Dr. Birkenholtz also provided critical insight and guidance
with regards to properly preparing the human subjects application and the planning of the
second site visit to Cebu. Dr. Roger Balm offered assistance on the approach to human
subjects’ research in the months prior to the second site visit.
Rowan University professor and GIS expert John Reiser lent his skills to this
project and was instrumental in developing the maps that made the data come to life. Dr.
Fe Walag and her team at the University of San Carlos Water Resources Laboratory in
Cebu must be recognized. In 2007 and 2009-2010 I was given unlimited access to the
v
university’s archives, water sample logs and maps. Dr. Walag also helped me grasp the
increasing severity of Cebu’s saltwater intrusion and groundwater contamination. Cebu
City Councilman Arsenio Pacana’ s generous intercession resulted in wide access to city
officials, MCWD engineers and others. Councilman Pacana wrote letters and made phone
calls that gave me the ability to get a full perspective on the water situation in Cebu. Mr.
Lorenzo Tampus, Mrs. Madeline Tampus and Miss Michelle Atillo provided
transportation, translation services and offered their excellent knowledge of Cebu’s
barangays, terrain, trends in water consumption and more. Together they made it possible
to visit 153 households, industrial and city officials and more during the three week site
visits of 2007 and 2009-2010. Their insights and advice were well received and proved
crucial to the success of this effort. I also need to recognize my parents Charles and
Antoinette who have supported Jenny and I immeasurably, especially with regards to
helping solve the inevitable schedule conflicts that arise when two working parents are
raising active children.
To Jenny, Charlie, Matthew, Christa, Gabrielle, Melissa and Samantha, I hope
you are able to appreciate that in spite of the hardships, I have tried hard to balance our
family life while undertaking this challenge. To Jenny, I would not have been able to
complete this study without you at my side. Not only have you assisted me during the site
visits, but you also patiently kept our family intact during this long journey. This paper is
dedicated to your grandfather, Domingo Cabrera’s memory. He taught me much about
your homeland and gave me my first glimpse of Cebu’s water problems when he showed
me the polluted remains of the Buhisan River bed behind his home. I hope the results are
worthy of all good people around me upon whose assistance this paper was written.

vi
Table of Contents
Abstract of the Dissertation ii
Acknowledgements iv
Table of Contents vi
List of Tables ix
List of Illustrations x
List of Acronyms xiii
Chapter 1: Introduction 1
A. Locating Cebu City 1
B. Population growth in Cebu 3
C. Saltwater intrusion in Cebu: Background 5
Chapter 2: The Physical Setting of Cebu 6
A. Climatic conditions of Cebu 6
B. Geology and watersheds 9
Chapter 3: History of Cebu 11
A. Settlement origins 11
B. The period of Spanish rule 12
C. Economic foundations 13
D. Internal structure of Cebu City 16
Chapter 4: Administrative Subdivisions of Cebu 23
A. The Barangay 23
B. Population, size and boundary issues 24
vii
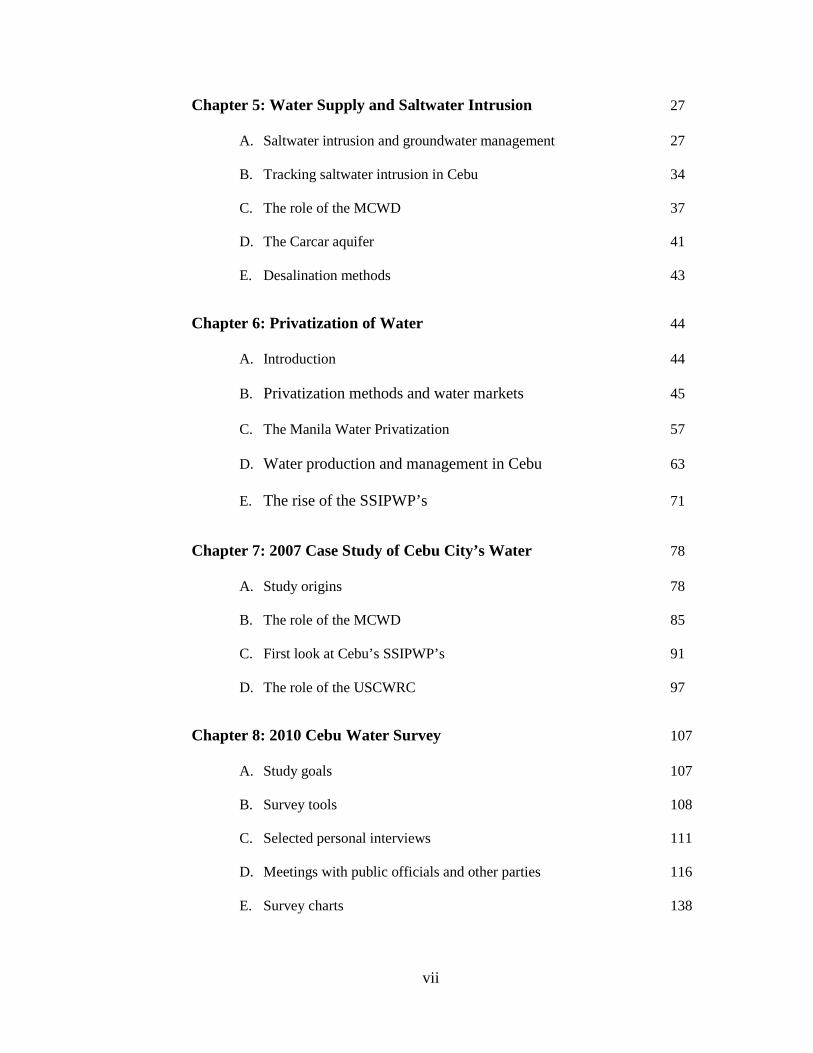
Chapter 5: Water Supply and Saltwater Intrusion 27
A. Saltwater intrusion and groundwater management 27
B. Tracking saltwater intrusion in Cebu 34
C. The role of the MCWD 37
D. The Carcar aquifer 41
E. Desalination methods 43
Chapter 6: Privatization of Water 44
A. Introduction 44
B. Privatization methods and water markets 45
C. The Manila Water Privatization 57
D. Water production and management in Cebu 63
E. The rise of the SSIPWP’s 71
Chapter 7: 2007 Case Study of Cebu City’s Water 78
A. Study origins 78
B. The role of the MCWD 85
C. First look at Cebu’s SSIPWP’s 91
D. The role of the USCWRC 97
Chapter 8: 2010 Cebu Water Survey 107
A. Study goals 107
B. Survey tools 108
C. Selected personal interviews 111
D. Meetings with public officials and other parties 116
E. Survey charts 138

viii
Chapter 9: Summary and Policy Recommendations 156
A. 1990 -2010 synopsis 156
B. Recommendations 161
Appendix 165
Bibliography 169
List of Interviews 173
Curriculum Vitae 176

ix
List of Tables
Table 5.1 Index of salinity and treatment options 43
Table 6.1 Types of Water Privatization 48
Table 6.2 Governance Model for Locally Provided Public Utility Services 50
Table 6.3 MWSS and MCWD comparison 70
Table 6.4 New Service Connections: MCWD 2007 74
Table 6.5 Water Volume Produced and Sold: MCWD 2007 74
Table 6.6 System Recovery Rate Percentage (SRR): MCWD 2007 75
Table 8.1 Desalination pros and cons 129
Table 8.2 2010 Water Survey Salinity Averages by City and Water Source 154

x
List of Illustrations
Figure 1.1 Study Area 2
Figure 1.2 Aerial view of metro Cebu 3
Figure 1.3 Population growth in Cebu 1990 - 2000 4
Figure 1.4 Projected population growth in Cebu: 2000 - 2040 4
Figure 2.1 Cebu monthly rainfall averages 6
Figure 2.2 Cebu monthly temperature averages 7
Figure 2.3 Cebu monthly humidity averages (percentage) 7
Figure 2.4 Topographic map of metropolitan Cebu City 10
Figure 3.1 Schematic for the Monterrazas de Cebu: “The Peaks” subdivision 17
Figure 3.2 New housing in barangay Busay 18
Figure 3.3 New housing amenities in barangay Busay 18
Figure 4.1 Differing boundary maps of central Cebu from the Philippine National Statistical Office (NSO) and the Philippine Bureau of Lands.
25
Figure 5.1 Freshwater – saltwater interface 29
Figure 5.2 Saltwater intrusion due to over-pumping 29
Figure 5.3 Saltwater intrusion in Cebu: 1979 35
Figure 5.4 Saltwater intrusion in Cebu: 1983 36
Figure 5.5 Saltwater intrusion in Cebu: 2000 (est) 36
Figure 5.6 The MCWD’s Buhisan Dam 38
Figure 5.7 Private “deep well” belonging to the Cabrera family 42
Figure 6.1 Cebu City Area 66
Figure 7.1 Metro Cebu water supply and demand 2010 82
xi
Figure 7.2 Metro Cebu projected water supply and demand 2020 83
Figure 7.3 Aqua Serv water purification franchise operation 93
Figure 7.4 Inside the Aqua Serv facility 93
Figure 7.5 ATM “automatic tubig machine” water dispenser and Agua Pura purified water
94
Figure 7.6 MNI water purification company 94
Figure 7.7 Inside MNI water purification facility
95
Figure 7.8 iPURE water purification company 95
Figure 7.9 Water delivery via bicycle cart in Mambaling 96
Figure 7.10 Water delivery via motorcycle cart in Labangon 96
Figure 8.1 Testing equipment for 2010 Cebu Water Survey 108
Figure 8.2 Cebu City Household Drinking Water Survey Data Form
109
Figure 8.3 MCWD high level reservoir in barangay Tisa 115
Figure 8.4 Hand-pump well in barangay Ermita 117
Figure 8.5 Rubber hose network in barangay Toong 118
Figure 8.6 Cebu City’s sole landfill in barangay Inayawan 119
Figure 8.7 MCWD pumping well in barangay Talamban 123
Figure 8.8 Guadalupe River in barangay San Nicolas 127
Figure 8.9 Waterfront home in barangay Ermita 133
Figure 8.10 Personal income and drinking water type in Cebu 138
Figure 8.11 Indoor plumbing and drinking water type in Cebu
139
Figure 8.12 Relationship between household piped water supply and water used for potable purposes
140

xii
Figure 8.13 Household water supply and belief that safe water is readily available 143
Figure 8.14 Household water supply and belief that water quality has deteriorated over the past decade
144
Figure 8.15 Percentage of homes with indoor plumbing broken down by water supply type
147
Figure 8.16 Non-potable water source broken out by socio-economic status 149
Figure 8.17 Purified water samples from the 2010 Water Survey 151
Figure 8.18 William Ochea at his manufacturing facility in barangay Marigondon 152
Figure 8.19 Children access purified water with the supplied plastic bags via a new dispenser in barangay Basak, Lapu-Lapu
153
Figure 8.20 2010 Water Survey Map: Average Salinity by Provider 155
Figure 9.1 New water meters installed by the MCWD in barangay Labangon
157
Figure 9.2 Damaged MCWD water distribution lines in open sewage canal in barangay Labangon
158
Figure 9.3 Partially submerged MCWD water distribution lines in open sewage canal
158
Figure 9.4 MCWD water-main in sewage canal in barangay Labangon 159
Figure 9.5 Private household water storage tower in barangay Busay 159
xiii
List of Acronyms
ADB Asian Development Bank
ASEAN Association of South East Asian Nations
AUICK Asian Urban Information Center of Kobe, Japan
CUSW Cebu Uniting for Sustainable Water
DNER Philippine Department of Environment and Natural Resources
KKLI Kampsax-Kruger Lahmeyer International
LGU Local Government Unit
LUWA Local Utilities and Water Administration
MCWD Metropolitan Cebu Water Department.
MEPZ Mactan Export Processing Zone
MEU Municipal Employees Union
MWSS Manila Metropolitan Waterworks and Sewage System
NAMRIA Philippine National Mapping and Resource Information Authority
NIPAS National Integrated Protected Areas System
NWRB Philippine National Water Resources Board
NWRWU Philippine National Water Resource Workers Union
PAG-ASA Philippine Atmospheric, Geophysical and Astronomical Services
PAWD Philippine Association of Water Districts
PGWI Philadelphia Global Water Initiative

xiv
PNSO Philippine National Statistical Office
SMBD Visayan San Miguel Bottling and Distribution plant
UNESCAP United Nations Economic and Social Commission for Asia and the Pacific
USCWRC University of San Carlos Water Resources Center
USGS United States Geological Survey
USTDA US Trade and Development Agency

1
Chapter 1: Introduction
A. Locating Cebu City
Cebu is the main island of Cebu Province which is comprised of Cebu, Bantayan
and Mactan islands, the Camotes island group and several other smaller islands such as
Olango. According to the National Statistics Office (NSO), Cebu Province has 3.85
million people. As defined by the Bureau of Land Location Monument (BLLM) No. 1,
Cebu Cadastral Survey, Cebu City is 10° degrees 17’ North Latitude and 123° 54’ East
Longitude. Cebu City is 365 miles south of Manila. The island of Cebu is bounded by the
Visayan Sea to the north, the Tañon Strait to the west, the Mindanao Sea to the south and
the Bohol Strait to the east. Cebu is the ninth largest in the 7,107 island archipelago; it is
134 miles long and 19 miles wide at its widest point (Barreveld 2006).
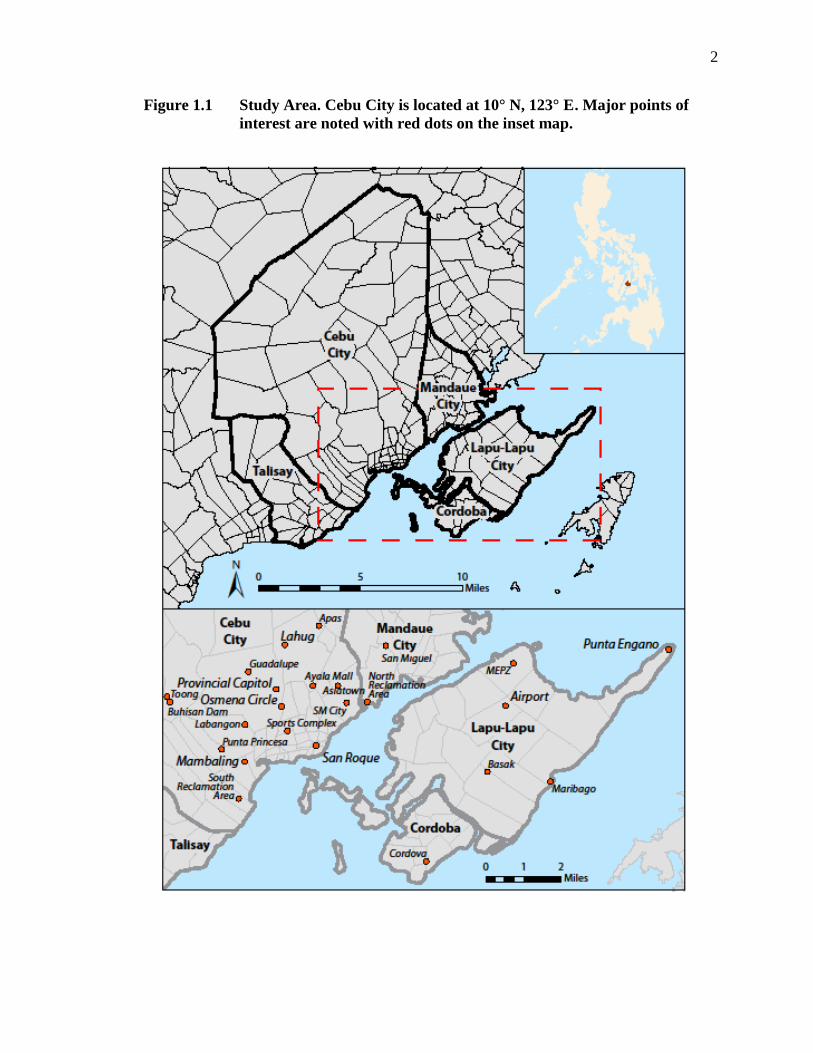
Metropolitan Cebu City is located in the middle of the eastern coast of the 1,706
sq. mi. island. It is comprised of four cities: Cebu City, Mandaue, Talisay and Lapu-
Lapu. The metro area also includes Cordoba and five other smaller municipalities. With
an annual growth rate of over 3%, Cebu City is the fastest growing municipality in the
region. Historically, metropolitan Cebu City has grown from about 15,000 people in 1900
to over 2 million today (Philippines 2010). Cebu City’s land area is 277 sq. mi. which is
broken down into rural areas totaling 224 sq. mi. and urban areas totaling 53 sq. mi. The
study area is illustrated in figure 1.1 and shown from the air in figure 1.2. An overlay
map illustrating Cebu and New Jersey for comparison purposes is located on page 168 in
the appendix.
.
2
Figure 1.1 Study Area. Cebu City is located at 10° N, 123° E . Major points of interest are noted with red dots on the inset map.

3
Figure 1.2 Aerial view of metro Cebu (north is at the top of the photograph) From the left: Cebu City, Mactan Island and Olango Island.
B. Population growth in Cebu
The people of the Philippines are largely of Malay descent but significant
influence has been left by many other races including Chinese, Spanish, Arabs and
Indians (Harper and Peplow 1991). In figures 1.3 and 1.4 Cebu’s rapid population growth
is illustrated. Until 1960 population was measured by the city. Since 1960 population
data has been collected at the barangay level and reported to the city for compilation. The
chart is showing growth in the Cebu metro area which includes Cebu City, its three
smaller adjacent cities, and six municipalities.

4
Figure 1.3 Population growth in Cebu: 1900 - 2000
Figure 1.4 Projected population growth in Cebu: 2000 - 2040
0
500,000
1,000,000
1,500,000
2,000,000
2,500,000
1900 1920 1960 1990 2000 2010
Metro Cebu Population Growth
0
1,000,000
2,000,000
3,000,000
4,000,000
5,000,000
6,000,000
7,000,000
2010 2020 2040
Metro Cebu Projected Population Growth

5
C. Saltwater intrusion in Cebu: Background
Saltwater intrusion was first noticed in Cebu during the early 1970’s but was
mostly treated as an academic curiosity. Beginning in the mid 1990’s, the steady advance
of the saltwater – freshwater interface began garnering serious attention. Even so,
relatively little was done short of closing wells and plumbing new ones further from the
coast. Shortly after salt water intrusion was first recorded in Cebu in 1973, the University
of San Carlos Water Resources Center (USCWRC) began monitoring the situation. They
have been a reliable principal agency dedicated to this task ever since.
In the meantime, the Metropolitan Cebu Water Department (MCWD) has
published readings on a couple of occasions, but their results do not correlate with those
of the USCWRC. The city’s barangays are a hodgepodge of MCWD’s 108 operational
wells and an estimated 25,000 private well connections. Poor record keeping and a lack
of regulation results in water consumption estimates fraught with a high margin for error
(Walag 2007).
On Olango Island – at the eastern margin of provincial Cebu - the saline intrusion
is so severe that residents who cannot afford to buy bottled water collect rainwater to
drink (Parras et al. 2001). Located between Olango and Cebu is Mactan Island, home of
Cebu’s international airport and the Mactan Export Processing Zone (MEPZ). This
island’s eastern shoreline is home to Cebu’s beach resorts and they are known to rely on
desalination plants to provide safe water for hotel guests (Walag 2007). Data from the
USCWRC (and confirmed by the 2010 survey) indicate that the saltwater – freshwater
interface is moving laterally east to west into Cebu City with increasing speed.
6
Chapter 2: The Physical Setting of Cebu
A. Climatic conditions of Cebu:
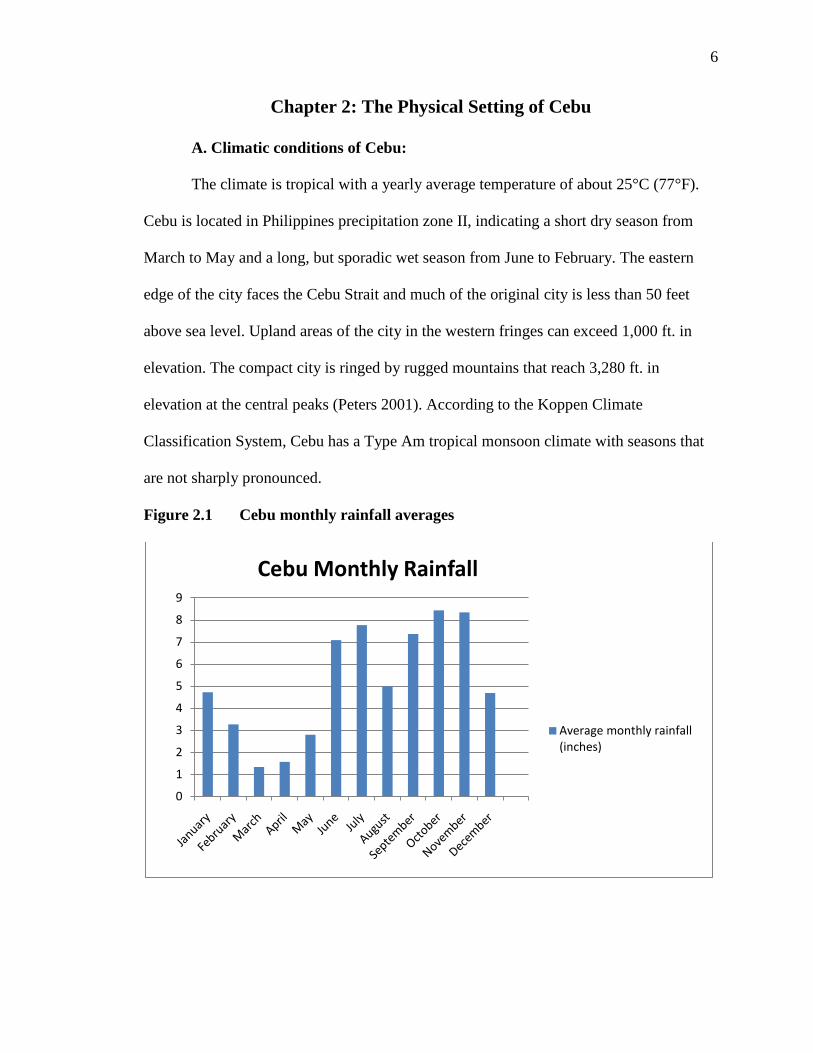
The climate is tropical with a yearly average temperature of about 25°C (77°F).
Cebu is located in Philippines precipitation zone II, indicating a short dry season from
March to May and a long, but sporadic wet season from June to February. The eastern
edge of the city faces the Cebu Strait and much of the original city is less than 50 feet
above sea level. Upland areas of the city in the western fringes can exceed 1,000 ft. in
elevation. The compact city is ringed by rugged mountains that reach 3,280 ft. in
elevation at the central peaks (Peters 2001). According to the Koppen Climate
Classification System, Cebu has a Type Am tropical monsoon climate with seasons that
are not sharply pronounced.
Figure 2.1 Cebu monthly rainfall averages
0
1
2
3
4
5
6
7
8
9
Cebu Monthly Rainfall
Average monthly rainfall (inches)
7
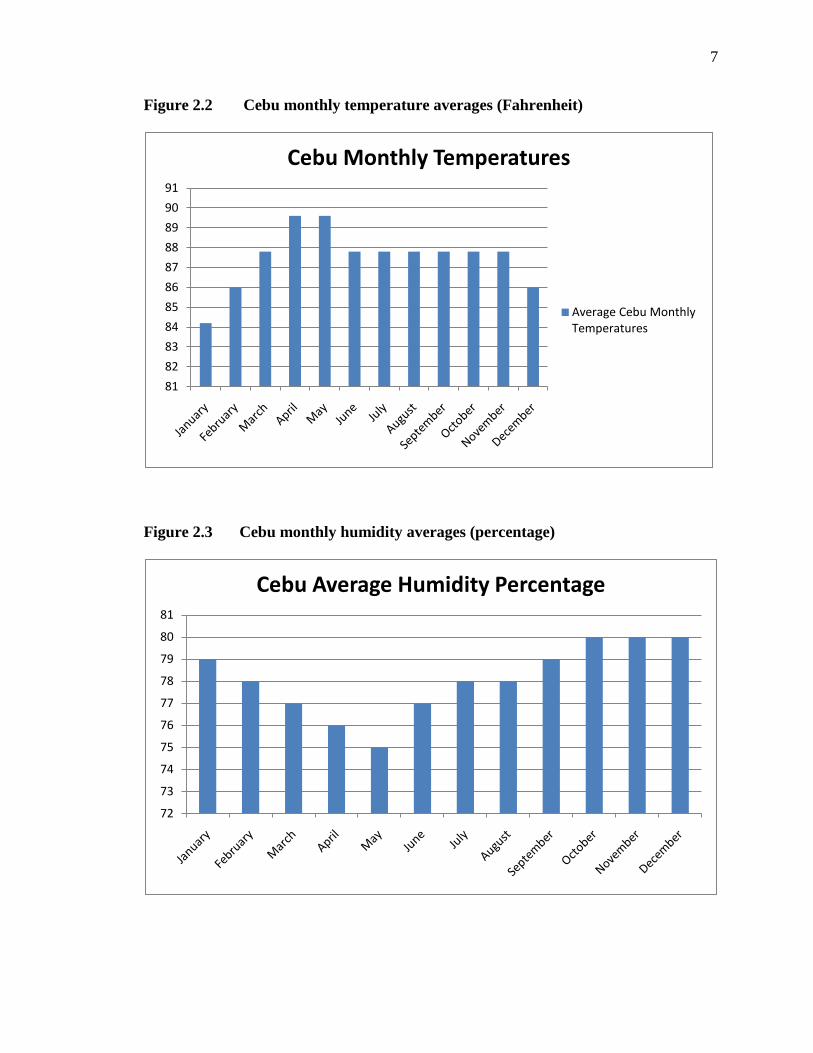
Figure 2.2 Cebu monthly temperature averages (Fahrenheit)
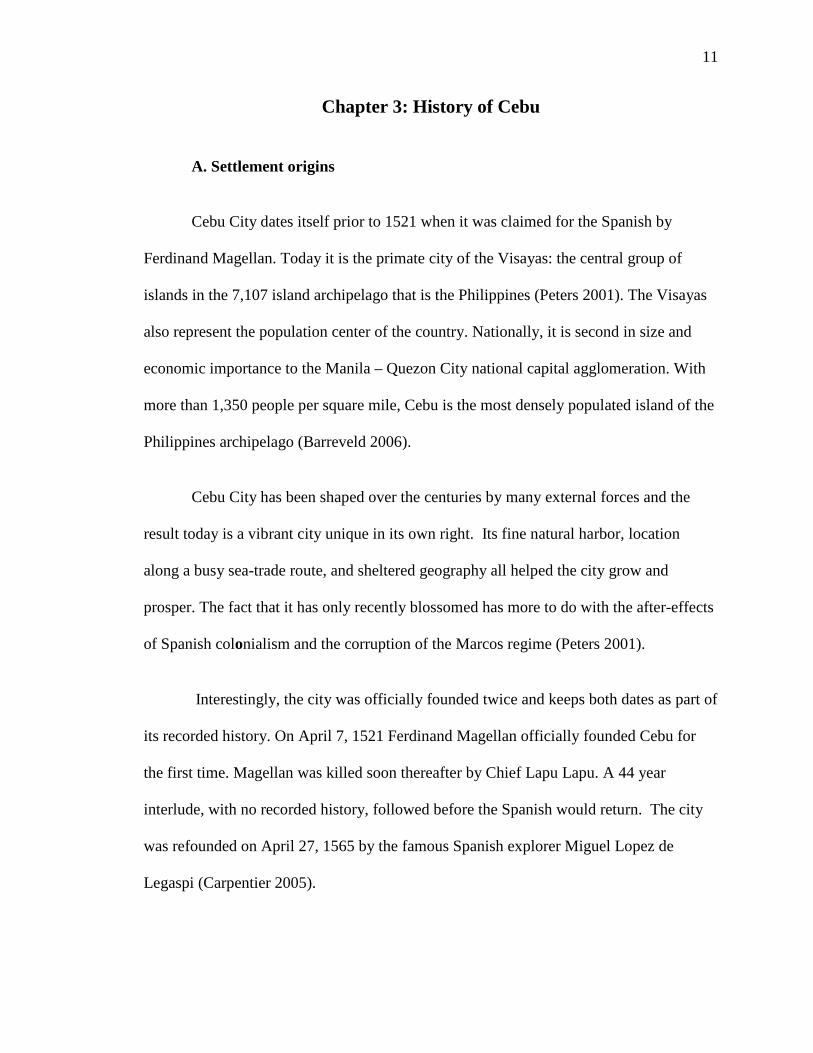
Figure 2.3 Cebu monthly humidity averages (percentage)
8182838485868788899091
Cebu Monthly Temperatures
Average Cebu Monthly Temperatures
72
73
74
75
76
77
78
79
80
81
Cebu Average Humidity Percentage

8
It is relatively dry from February through May and wet the rest of the year.
Overall, the city’s average annual precipitation is about 63 inches. Some upland areas
which are prone to heavier and more irregular rainfall average over 98 inches. Humidity
averages 76% and temperatures reach an average of 89.7 F during April and May. The
average wind velocity is about 6 mph from varying directions. From November to May
the amihan or northeast wind prevails. From June to September the hagabat or southwest
monsoon dominates. The typhoon season is from October to December.
On March 26, 1982 17.5 inches of rainfall (about 25% of the average yearly
precipitation) was recorded in a single day during Typhoon Bising at the Carmen, Cebu
recording station located at 1,132 ft. above sea level. Many other recording stations in the
city recorded rainfall amounts approaching 16 inches that day. The strongest typhoon (in
wind speed) to hit Cebu was Typhoon Ruping in 1991 with 177 mph sustained winds
(USCWRC 1995).
On average, 20 typhoons hit the Philippines annually, which is more than any
other country. The Philippine Atmospheric, Geophysical and Astronomical Services
(PAG-ASA) studies these storms in the Philippines and uses a four-level signal warning
system (Harper and Peplow 1991). Cebu’s location in the south-central Visayas with
larger islands surrounding it in all directions gives it shelter from most of the typhoons
and tropical storms that frequent the Philippines. Unlike Leyte, its larger neighbor to the
east, Cebu rarely bears the brunt of major storms. It is easy to see why this city was
already an important trading post before Ferdinand Magellan arrived there in 1521
(Barreveld 1995).

9
B. Geology and watersheds
Cebu City is also at the heart of the Philippines Islands themselves which run
nearly 1,250 mi north to south and about 680 mi east to west. The island chain is partly
volcanic and partly coral formation. The Philippines is geologically similar to the
Galapagos Islands and both also enjoy a very wide variety of plant and animal life.
Nearly 3,500 plant and animal species are found nowhere else (Barreveld 2006).
Cebu itself is a coral formation and while peaks in the volcanic islands to the
north and south reach nearly 10,000 ft. in elevation, Cebu’s highest peak is 3,323 ft. The
watershed of the metropolitan area is broken into three geologic formations: alluvial
sediments, igneous and sedimentary rocks. Among the sedimentary rocks is the highly
permeable Carcar limestone which serves as the primary aquifer for the metropolitan area
(Scholze 2002). Cebu is made up of structurally complex sedimentary and volcanic rocks
that have undergone various degrees of metamorphism. The three types of Soil in Cebu
City are: 1) The Mandaue Silt, characterizing most of the coastal plains from Mandaue
City in the north to Minglinanilla at the southern end of the metro area; 2) The Faraon
Clay, found in the middle part of the city, and 3) The Baguio Clay, found in the upland
areas and the watersheds of Mananga and Kotkot-Lusaran.
The harsh terrain and thin soils of Cebu do not favor agriculture even on its
slender coastal plain. Metro Cebu is hemmed in by the mountains and coastline that
surround it. The upland areas have even thinner soils and in some areas less forest cover
than the city itself (Carpentier 2005). The island chain is part of the Pacific Ring of Fire
and has 20 active volcanoes. Mounts Taal, Mayon and Pinatubo are the best known. The
region is affected by about 5 small earthquakes on an average day. The topography of

10
Cebu is rugged and mountainous. Over 70% of the land area has slopes at 17% or greater.
Most of the population is settled on Cebu’s narrow coastal plain (Carpentier 2005).
Figure 2.4 Topographic map of metropolitan Cebu City
11
Chapter 3: History of Cebu
A. Settlement origins
Cebu City dates itself prior to 1521 when it was claimed for the Spanish by
Ferdinand Magellan. Today it is the primate city of the Visayas: the central group of
islands in the 7,107 island archipelago that is the Philippines (Peters 2001). The Visayas
also represent the population center of the country. Nationally, it is second in size and
economic importance to the Manila – Quezon City national capital agglomeration. With
more than 1,350 people per square mile, Cebu is the most densely populated island of the
Philippines archipelago (Barreveld 2006).
Cebu City has been shaped over the centuries by many external forces and the
result today is a vibrant city unique in its own right. Its fine natural harbor, location
along a busy sea-trade route, and sheltered geography all helped the city grow and
prosper. The fact that it has only recently blossomed has more to do with the after-effects
of Spanish colonialism and the corruption of the Marcos regime (Peters 2001).
Interestingly, the city was officially founded twice and keeps both dates as part of
its recorded history. On April 7, 1521 Ferdinand Magellan officially founded Cebu for
the first time. Magellan was killed soon thereafter by Chief Lapu Lapu. A 44 year
interlude, with no recorded history, followed before the Spanish would return. The city
was refounded on April 27, 1565 by the famous Spanish explorer Miguel Lopez de
Legaspi (Carpentier 2005).
12
B. The period of Spanish rule
After Legaspi founded Cebu for the second time in 1565, the city endured 300
years of Spanish colonial rule before the Americans took over. The Spanish period was
marked by a tribute-based economy where Cebu, like the rest of the Philippines, was
plundered for the Spanish throne. The Spanish period was marked by colonial outposts
known as encomiendas. These were royal grants to administer villages while collecting
tribute and converting natives to Catholicism. This system changed Cebu and much of the
Philippines from an agrarian to a peasant society (Barreveld 2006).
As a result of the Spanish efforts at conversion, the city is a beacon of Christianity
in Asia with 94% of residents either Catholic or Protestant (Barreveld 2006). Christianity
is also evidenced in the ubiquitous Santo Nino’s statues (miniatures of the relic brought
by Magellan that resides in Cebu’s basilica today) that adorn jeepneys, homes,
businesses, and the crucifixes that sit atop the blackboards in the public schools.
During the late 19th century Spain’s empire was falling apart. Cebu was
dominated by Japanese and Chinese merchants at this time, a situation that remains
today. Colon street was a cobblestone avenue that the city was centered on. The adjacent
Parian district had been the focus of business and trading since at least the 1300’s. The
Parian district was the heart of the original small settlement inhabited by migrant Chinese
traders. This area is home to the busy Carbon Market today where fresh seafood and
fruits are sold in stalls and all manner of small storefronts in a chaotic and still vibrant
streetscape (Hicks 2001).
As a result of the Spanish-American War the Philippines exchanged colonizers.
The American period certainly proved beneficial in comparison. The Americans built
13
roads and bridges at a brisk pace and many islanders were eager to accept the democratic
ideals espoused by the Americans (Karnow 1989). After World War II the Philippines
were granted complete independence. The experience has been likened to 300 years in a
convent and 50 years in Hollywood. It was after this period that the Philippines could
finally develop their culture in their own unique way, blending the influence of the
Spanish, the Americans and various local customs (Karnow 1989). The Cebu Provincial
Capitol building is modeled after the U.S. Capitol because from the Americans the
Filipinos gained not only independence but also the foundation of government through
the consent. (Barreveld 2006).
Despite its small size in comparison to Manila, (which has a metro area
population of over 16 million), Cebu boasts many firsts. The University of San Carlos
that was built in 1595 is the first university in the Philippines. The Basilica Minore del
Santo Nino is the first church in the Philippines and remains the only basilica in East
Asia. Fort San Pedro is the Philippines oldest fort, and the only triangular one. Colon
Street is the oldest in the nation (Barreveld 2006).
C. Economic foundations
In explaining settlements, anthropologists and sociologists focus less on spatial
connections and more on function. They look at the degree to which settlements are
specialized and the degree of labor division that has taken place. As a geographer, I think
Cebu is better viewed spatially since it has always been a trading center and hub. Cebu is
roughly halfway between the super city Manila in the north and the major agricultural
regions and cities of Mindanao in the deep south. Luzon and Mindanao are the two

14
largest islands in the 7,107 island archipelago (Carpentier 2005). Cebu’s port function
and location along the key North - South shipping route and the lesser east-west routes
certainly give the city a regional locational advantage.
It has only been in the last three decades that Cebu has been transformed.
Industries today include tourism, electronics, food processing, furniture, garments,
musical instruments, and stone and shell craft. Cebu City is a regional educational center
with over 170,000 students at eleven universities including a teaching hospital, Cebu
Doctors Hospital. Education is also vital to the city’s economy. There is a strong market
for renting rooms to students since there is virtually no campus housing and many
students hail from other provinces. Tropical produce is still grown within the city but
there is no recorded history of a distinct agricultural district. Mango trees are abundant
and residents who are fortunate to own land with the trees bring fresh mangos to market.
(Walag 2007).
Major exports include watches (Timex), electronic components and wire harnesses
(Acer & Ford), photographic equipment (Canon), garments, furniture, audio & video
equipment, carrageen, fashion accessories, coconut oil, frozen shrimp, and vehicle and
machinery parts (Philippines 2010). Cebu has welcomed Japanese and Korean investment
in tourism and hospitality along with American and European investment into the
offshore Mactan Export Processing Zone (MEPZ) and the diverse Asiatown IT center in
barangay Lahug. During the 2010 site visit I met with Allan Raborar, a water purification
equipment supplier (who advertises his equipment as “western built”), he advised that
goods made for the western market are preferred over those made for sale in the
Philippines. Allan stated that many Asian manufacturers ship substandard goods to the
15
Philippines (ex. cell phones, cameras, TV’s…). Since so many Filipinos have relatives
abroad who send back goods (as well as cash remittances), it is not surprising that people
notice the difference in quality, especially when the brand is the same (Raborar 2010).
In terms of city tiers in the Philippines, Manila would be the sole first order city,
and Cebu the only second order city, with several third order cities and so forth. Manila
has the greatest availability of medical services, cultural attractions such as theatre and a
wider range of other goods and services. Educationally however, they appear to be
mighty equals. Much as New York came to dominate Philadelphia, Manila quickly
overshadowed Cebu as the nation’s primate city. Manila has a naturally larger harbor
and is located closer to key markets in Hong Kong, Singapore, and Japan. Manila also
has a much larger natural hinterland than Cebu due to its location on Luzon, the
Philippines largest island (Karnow 1989).
Cebu’s area of influence is actually pretty large given its size; it would encompass
the Visayas and Northern Mindanao where it draws students and business people from. In
the third world, mega cities often dominate with little national competition. Cebu City,
being a well established second tier, mid-size city, would be an exception. Cebu’s place
in the world is that of a growing regional center for telecommunications, specialized
manufacturing, and education. While it remains a distant second to Manila nationally,
regionally it is the primate city of the Visayas. Locally it is a market for island goods and
a center to visit for a wide array of goods and services. The city also is home to several
major beach resorts on neighboring Mactan Island which draw tourists primarily from
Korea, Japan and increasingly, China.

16
D. Internal structure of Cebu City
The internal structure of Cebu is a most interesting story. Although “public
transportation” is ubiquitous, it is accomplished via private jeepneys. Jeepneys are a
unique feature of the Philippines that descended from the World War II jeeps left behind
by the U.S. Army. The jeepneys operate as a private hybrid bus / taxi system that picks
up and drops off passengers anywhere along its fixed route (even in the middle of the
street) and foreigners are advised not to drive without understanding that normal traffic
conventions are not applicable here. The results are a city that has not developed like
others that followed transit trunks away from their cores. Cebu has expanded to the
hillsides in all directions fully with an amazing heterogeneity of density and activities.
The roads are a spider web that do not lend to development trails. There is precious little
open space in this compact city.
While the majority of jeepneys on the streets of Cebu today are more recent
conversions of Asian trucks, the fact that many of the original jeeps are still plying streets
some 65 years after the war ended is quite a testament to both their durability and the
resourcefulness of their owners (Barreveld 2004). This venerable truck has a role in
Cebu’s unique identity and internal structure. Cebu lacks the public transit systems that
result in spatial concentrations of people within walking distance of transit stops. Zoning
laws appear to be largely ignored. The result of these factors is a densely packed,
relatively homogenous city. All areas of this physically small city are quite accessible via
the unscheduled, yet connecting jeepneys. Connections can be made since they follow
their self assigned routes that are painted on the sides of the truck. This will show both
terminating points and occasionally a major destination like a mall or school that it is
17
along its route. The film “The Crying Ladies” (Unitel Pictures, Philippines) gives a good
visual image of how this system works in Manila. Until the about the turn of the century
jeepneys ruled the roads and generally only the downtown was frequently congested. The
side streets were wide open and plied mostly by bicyclists and pedestrians. Today, during
peak periods it has become difficult to find open side streets. This change is a result of a
growing middle class that is moving increasingly to car ownership. Jeepneys still provide
ample service to the lower middle class and the poor. The SRP expressway (north-south
coastal highway), a new road in Banawa and “flyovers” (overpasses) in Talamban and
Mandaue have not been enough to relieve the congestion.
The majority of Cebu City is mixed use and a surprisingly large middle class is
also noteworthy. Wealthier residents are often found in clusters in the elevated areas on
the edges of the densely populated lowlands, but even these areas often have some
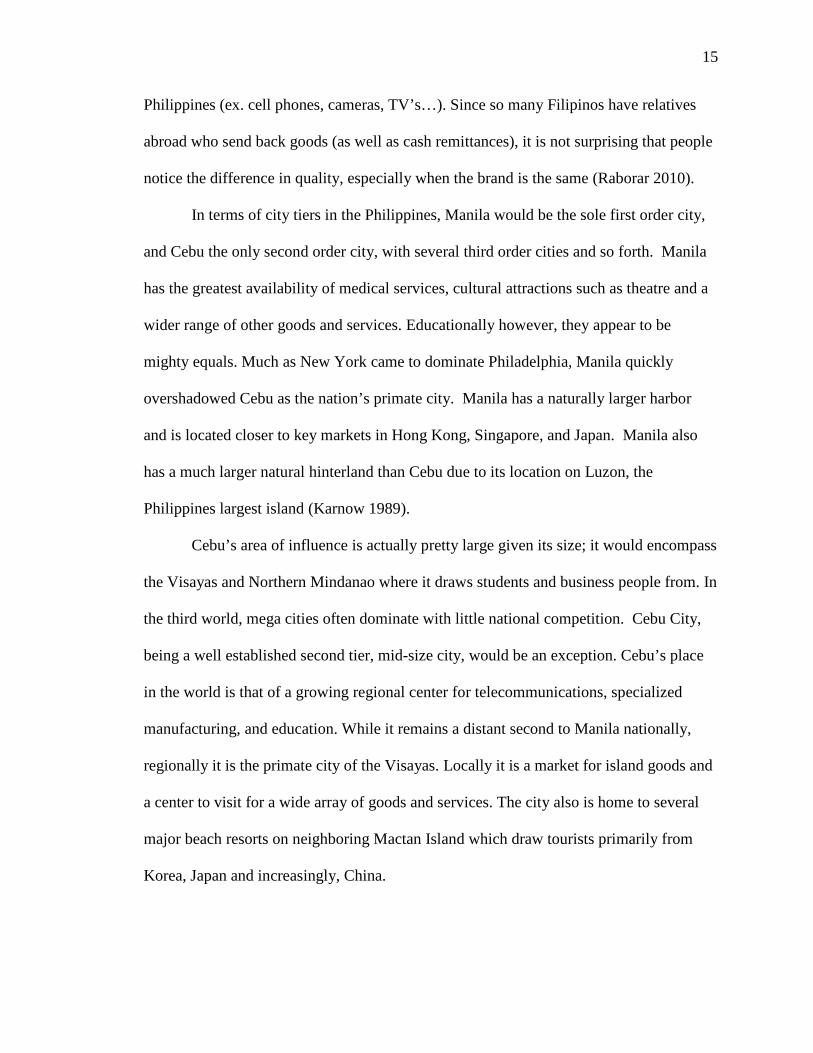
squatters and middle class nearby. The illustrations in figures 3.1 - 3.3 represent some of
the latest developments along the “edges” of the city.
Figure 3.1 Schematic for the Monterrazas de Cebu: “The Peaks” subdivision

18
Figure 3.2 New housing in barangay Busay
Figure 3.3 New housing amenities in barangay Busay

19
A wider phenomenon would be the expanding middle class buying up
neighboring properties in their own barangay and walling them in to create a compound
where extended family members live. During the 2007 and 2010 site visits I stayed in one
such family compound in barangay Labangon. The Asiatown IT center located near the
Ayala mall is home to call centers for companies such as Hewlett Packard, US Airways,
and ACER Computers of Taiwan. These companies come to Cebu because of its well-
educated, English speaking work force. It is also cheaper and much less congested than
Manila.
Overall the city seems to be moving in a polycentric direction as areas around the
universities, malls and IT center and Waterfront casino hotel become concentrated with
other business and restaurants. One might be tempted to try to match it with Latin
American urban models due to the long history of Spanish colonialism, but Cebu has no
history of strict land use and zoning and has never had any public transportation that
could focus residential settlement patterns radially as is common in Latin America
(Pacione 2009). It is still a heterogeneous city that has really only recently seen nodes
like the aforementioned IT centers and mall complexes develop.
The central business district is still quite vibrant. The opening of three mega-
malls (SM City, Ayala and Gaisano Country) have reduced congestion here but not
hollowed it like some American central city cores. The malls may have displaced some
of the Sari-Sari stores (home-based neighborhood grocery shops) that were once
ubiquitous in the barangays and traditionally supplied basic necessities including rice,
soap, medicine, and toiletries to nearby residents. In addition to the giant malls, the city is
now home to several smaller, new, open air centers. Advances in communication have
20
also changed the nature of the city. The internet is not found in many homes, but internet
cafes often running on old 486 PCs cater mostly to students and are easily found in most
barangays. The aforementioned endangered Sari-Sari stores are also apparently being
replaced by these cafés as well.
The millions of Filipinos abroad send remittances back and often visit with
“Balikbayan” packages of gifts from abroad (Barreveld 2006).The result of this influx of
wealth is a black market dollar economy and families fortunate to have a nurse or doctor
overseas are suddenly upwardly mobile and can start businesses like the internet cafes
and water purification companies that are sprouting up around the city.
The increasing presence of large multinational firms is having a positive effect on
salaries in Cebu. According to Michelle Atillo of barangay Labangon (who is an R.N.)
and has also worked for the Shangri-La resort, entry level jobs such as gas station
attendants and store clerks earn 100-150 pesos a day (approximately $2-3). Higher end
retail outlets pay up to 200 pesos a day. Registered Nurses here earn up to 275 pesos a
day. But skilled workers in the Asiatown IT center (including the call centers) earn up to
500 pesos a day (around $11). Katherine Atillo is an International Sales Professional at
the IT center and advised that such jobs are extremely competitive; only those with the
best English and highest test scores are considered (Atillo 2010).
There is also strong gender bias for many jobs, it is not uncommon to see signs
advertising work for “females age 21-25”. Agricultural work and informal jobs (ex.
domestic help) are at the bottom of the income scale. Miss Atillo (2010) said that such
work pays much less than even the 100 pesos that a gas attendant can earn. Most jobs are
six day a week assignments with Sundays off (most establishments are closed here on
21
Sundays). As for the cost of living, food is quite cheap, but in January 2010 gasoline was
sold at 38 pesos a liter ($3.22/gl) which although similar to the cost here is quite high
when one considers the difference in average incomes.
“The Queen City of the South” as Cebu is known nationally, is experiencing
explosive growth that may be due to the synergistic effects of a more simplified
regulatory framework than the capital region and a strong base of highly educated
English speaking young people. The post Marcos transformation of Cebu into a truly
international destination for tourists and multinational businesses has accelerated in
recent years. This duality is a major point of departure in comparison with third world
cities that tend to be either business or leisure oriented. Cebu’s ascendance has not been
without growing pains; the burgeoning metropolitan area of over two million people still
lacks sewage treatment facilities and this contributes heavily to its water quality
problems. The 2010 water samples that were collected confirm this.
During a visit to the island in May of 1987, the afterglow of the “people power”
revolution (that deposed President Marcos) was still strong. The country seemed to be in
a buoyant mood. At this time Cebu still had only one major hotel and its beach resorts
were quaint and locally owned. Under Marcos, corruption was rampant and the
investments that were made were largely focused on Manila and his home province of
Ilocano. From 1989 to 2001, I returned six times and the changes I noticed were largely
incremental. During four visits between 2003 and 2010 the city’s transformation has been
quite dramatic. New malls, hotels, beach resorts, and explosive growth in private auto
transportation have jammed the city’s narrow streets. The resorts replaced some quiet
fishing villages and a few native beach resorts. Infrastructure projects like the new four
22
lane suspension bridge to Mactan Island and a new coastal highway have also been
recently completed. The airport meanwhile got a brand new indoor terminal and jet
bridges to replace the decrepit stair trucks.
Politically the city has never had clout like it gained in the wake of the 2004
presidential election. Cebu City was the base of President Gloria Macapagal Arroyo’s
support. Ms. Arroyo won a close election thanks to an incredibly high turnout and strong
victory margins in the Visayas region and particularly in Cebu. She showed her
appreciation by holding her inauguration in Cebu. There was a quite a controversy as
many people felt that the inauguration should have stayed in Manila where it had been
since independence.

23
Chapter 4: Administrative Subdivisions of Cebu
A. The Barangay
The barangay is the basic administrative subdivision of the Philippines.
Barangays are under the administrative charge of cities. The comparable unit in the U.S.
would be the district or ward. Cities and towns in the Philippines are composed of
barangays. Metro Cebu has 172 barangays. The totals are as follows: Cebu City – 80,
Cordova – 13, Lapu-Lapu – 30, Mandaue – 27 and Talisay – 22 (Philippines 2010). Each
barangay elects its own officials and is responsible for its budget and master plan which it
files with the city government. Perhaps not surprisingly, wealthier barangays have been
home to much of the new construction that Cebu has witnessed in its western hills during
past two decades.
Historically, barangays were small communities made up of several families.
Over time these communities grew and more formed as settlements expanded. During the
period of Spanish rule, small barangays were often combined into towns with a barangay
punong (captain) whose duties included collecting taxes. Today barangays are governed
from the barangay hall. Elections are normally held every three years for barangay
positions such as tanod (police official) and kagawad (councilor) (Councils 2006).
Barangay governments are divided between two branches: the Punong (Executive) and
the Sangguniang (Legislative). Although the branches are intended to be equal in power,
the head of the Punong presides over the Sangguniang. The Sangguniang approves the
annual barangay budget, but they usually work in agreement with the Punong. Cebu City

24
has 80 barangays. They are grouped into the northern and southern districts of 46 and 34
barangays respectively (Barreveld 2006).
B. Population, size and boundary issues
In Cebu City barangays have an average population of 10,000 but the largest,
Guadalupe has a population of 72,000, while the smallest, Kalubihan, has only 1,147
residents (Councils 2006). Many of the poorer barangays are smaller with some
exceptions such as Ermita. The rural barangays also tend to be less wealthy with
exceptions such as Lahug. Some are physically very small such as barangays Lorega and
Mambaling at 32 and 35 acres each. Many of the mountain barangays are quite large by
comparison. For example Sudlon II and Tabunan are over 2,718 acres each (Association
of Barangay Councils 2006).
The administrative map shown in figure 4.1 illustrates radically different
barangay borders in Cebu’s rural western mountains. Maps from the Philippine National
Statistical Office (PNSO) in Manila and those of the Philippine Bureau of Lands do not
agree (Abella 2004). At least five different barangay maps have been identified by Dr.
Walag (2010) and her team at the USCWRC. The Philippine National Mapping and
Resource Information Authority (NAMRIA), the government agency in charge of issuing
or approving official maps in the Philippines, still cannot produce official maps for
Central Cebu. The USCWRC’s Water Remind project has completed surveys for
NAMRIA, but no decisions have been made public as of January 2010.

25
In addition to the border problems in Cebu’s mountain barangays, some of the
more developed hilly barangays are also prone to border disputes (Association of
Barangay Councils 2006). For example, Lahug and Apas both claim Camp Lapu-Lapu
and Lahug and Luz both claim the Waterfront Hotel. Cebu’s landmark hotel, The Marco
Polo hotel, is claimed by both Busay and Apas, but it has always been officially
considered part of Lahug. Tisa and Guadalupe have also had issues with the “ownership”
of the new subdivisions being built into the hills that both claim. Perhaps the most
surprising example of the boundary confusion us that Busay’s barangay hall is claimed
by barangay Apas (Clampano 2010)!
Figure 4.1 Differing boundary maps of central Cebu from the Philippine National Statistical Office (NSO) and the Philippine Bureau of Lands.
This is important because as mentioned earlier, these land issues directly affect
finances and political clout. This was discussed during meetings with Virgie Clampano
and Neila Aquino of the Cebu City Local Government Operations Office on January 5,

26
2010. The Local Government Unit’s (LGU) annual investment plan budget for Cebu’s
barangays is primarily based on its population and income and the officers verified that
boundary disputes are not uncommon, especially in the hilly areas of the city that were
formerly lightly populated and are now experiencing rapid growth. A copy of the 2006
barangay profiles book that details the area, population, finances and important economic
activities of each of Cebu City’s barangays was obtained (Association of Barangay
Councils 2006). As the water situation grows more dire it is conceivable that water rights
could become part of the disputes.
The water interconnect from the Buhisan dam pipeline goes directly through
Buhisan and Labangon without a local connection which is troublesome for some
residents. According to Dr. Walag, Cebu’s growth has resulted in more roads connecting
the small barangays of the interior with Cebu City’s large marketplace. This also helps
the water engineers because of the improved access to remote areas. But the problem of
multiple sets of boundaries within the watershed and water districts remains.

27
Chapter 5: Water Supply and Saltwater Intrusion
A. Saltwater intrusion and groundwater management
As populations grow, groundwater reserves are often threatened. While they are
larger and better protected than surface waters, they are not indestructible. Water tables
fluctuate seasonally and can show dramatic long term lowering when groundwater is
removed faster than the rate of natural recharge, a process known as groundwater mining
(Fetter 2001). Arid areas of the world from the American southwest to the countries of
the Middle East often suffer from this growing problem. Coastal cities worldwide must
face the additional threat of saltwater intrusion if they fail to manage their groundwater
properly. This is certainly the case in metropolitan Cebu.
Good water management should always be at the vanguard of metropolitan
planning. It is especially important when groundwater is utilized as the primary source to
supply drinking water in coastal areas (Todd 1980). In cities the world over the recipe is
the same - if you withdraw fresh water near the interface between the two bodies of
groundwater, the saltwater will move towards the point of the withdrawal. This is known
as up-coning. The rate of up-coning will be dependent upon several factors, primarily: the
type of aquifer, the rate of withdrawal, and the rate of natural recharge (Bear et al. 1999).
Ghyben and Herzberg discovered this relationship between freshwater layers lying above
heavier saltwater layers that are in hydraulic contact (Freeze and Cherry 1979). Dunne
and Leopold (1978) offer an easy way to grasp this concept with their explanation of the
saltwater/freshwater interface in their book, “Water in Environmental Planning”:
“In an unconfined aquifer near the sea, fresh groundwater occurs as a lens above the heavier sea water. The saline fluid may extend inland for about a kilometer. Because of the difference in density, the depth of fresh-water / sea water margin is approximately equal to 40 times the height of the water table above sea level… If

28
the water table is lowered by pumping, the cone of depression around the well is reflected in a rise in the boundary between fresh and salt water. Each meter decline in the water table, however, will cause a 40 meter rise of the lower boundary of the lens” (my emphasis) (Dunn and Leopold 1978)
This relationship is known as the Ghyben-Herzberg relation between fresh and
saline waters and was discovered by the aforementioned European researchers in the
early 20th century (Todd 1980). Their research was based on a simple model of a coastal
aquifer, in reality the saltwater interface is usually deeper than the Ghyben-Herzberg
model would suggest, but the fundamental ratio specified by Ghyben-Herzberg holds true
and the reality is that is for every one foot the aquifer head is drawn down via “over-
pumping,” the salt water-fresh water interface will march 40 feet towards the nearest
wellhead (Freeze and Cherry 1979).
Salt and other contaminants migrate into aquifers through different methods.
At lower velocities, diffusion is the primary force of operation while at higher velocities,
mechanical dispersion takes over. All groundwater contains salt, which usually comes
from dissolved rocks. The amounts range from the miniscule 25 ppm in some quartzite
springs to dense brines such as the Dead Sea with over 300,000 ppm. The heavy brines
are often associated with aquifers that show very little movement and salinity generally
increases with depth (Fetter 2001)
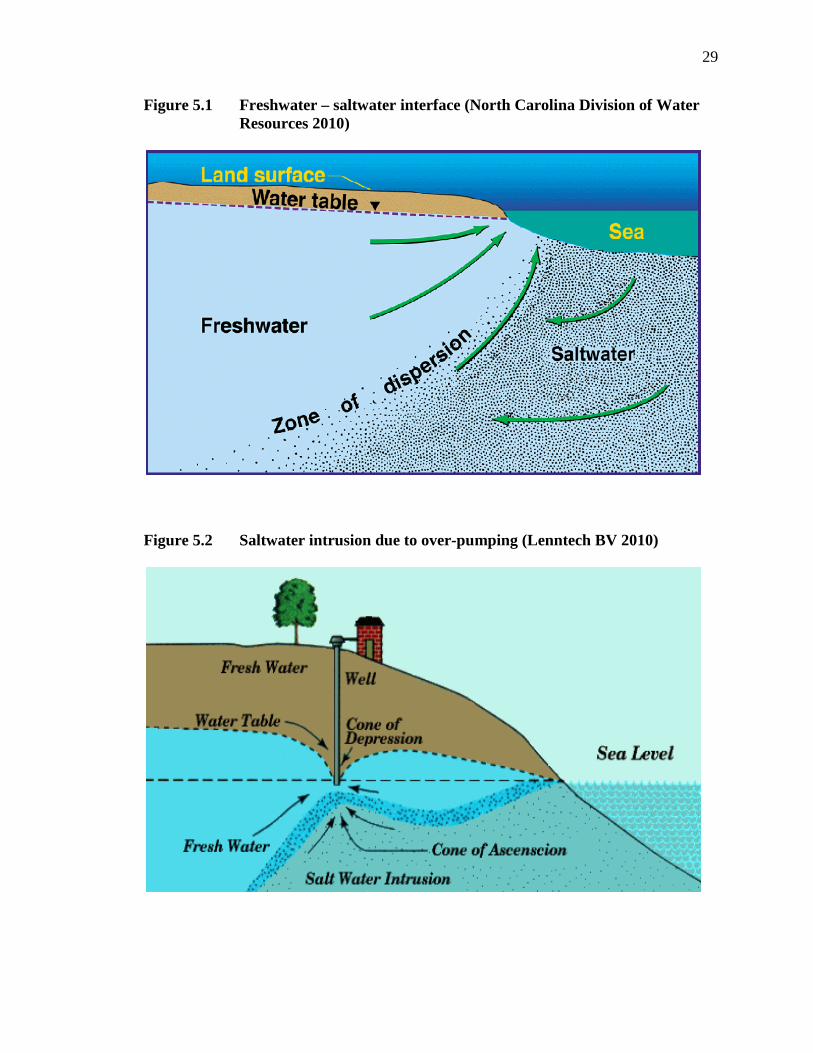
The illustrations in figure 5.1 and 5.2 offer a simplified look at the freshwater –
saltwater interface and mechanism of up-coning due to over-pumping. While this
phenomenon is largely found along the sea coast, it is not limited to coastal regions.
29
Figure 5.1 Freshwater – saltwater interface (North Carolina Division of Water Resources 2010)
Figure 5.2 Saltwater intrusion due to over-pumping (Lenntech BV 2010)
30
In arid locations groundwater withdrawals nearly always exceed the recharge rate
and the piezometric surface (upper limit of the aquifer) is lowered, sometimes
dramatically. Land subsidence can result and pumping costs in the form of electric
charges can rise dramatically. In coastal locations the drawdown (lowering) of the
piezometric surface can result in saltwater intrusion into the aquifer (Bear et al. 1999).
Once a well goes saline, options become limited. In most cases the well is simply
abandoned as the water is useless for drinking, agriculture, and most industrial processes.
The two foremost methods for desalting water are reverse osmosis - which works by
forcing water through a semi-permeable membrane that withholds molecules larger than
water, or flash distillation – which removes salt by heating the water to evaporate it and
then condensing it, leaving the salt behind (Bear et al. 1999). Both are used extensively in
arid areas such as the Middle East. In the U.S. reverse osmosis is used more often in part
due to lower energy consumption and associated reduced operating costs. Reverse
osmosis costs have dropped dramatically over the past two decades but it still costs much
more than untreated groundwater (Committee 2008).
Despite awareness of over-pumping in coastal areas as a causative agent for saline
intrusion, it continues to plague many cities worldwide. One alternative to expensive
reverse osmosis or flash distillation treatment is to insert a line of recharge wells using
water from storm runoff, treated sewage or other sources parallel to the coast (Bear et al.
1999). This can act as a buffer to halt further saline intrusion.
The saturated zone contains approximately 97% of earth’s unfrozen freshwater.
This water is stored in cavities within the underground rock formations. In most cases a
formation that is composed of more evenly sized rocks or grains (well sorted) will be
31
more porous and have a better yield than those that are not well sorted (Dunne and
Leopold 1978). Aquifers are bodies of groundwater that provide ample water for wells.
Aquifers have three main characteristics: good size, adequate drainable porosity, the
ability, through capillary action, to allow unrestricted flow towards a well.
Unconfined aquifers have direct access with the surface through pores in the soil.
They can recharge quickly. If a layer that blocks water flow (partially or completely) lies
over an aquifer, it is considered confined. Safe yield is defined as the annual amount of
water that can be drawn without degradation of the aquifer. It is often difficult to assess
before problems begin. The chemistry of rain water can be altered dramatically as it seeps
through the various sediments into the groundwater body along with whatever
contaminants are present on the surface (Dunne and Leopold 1978).
In cities where the spatial concentration of people complicates all manner of
needs, water concerns can quickly become critical. Not surprisingly in most cities, water
supply is not taken for granted; attempts to identify sources and manage them to create a
permanent source of drinking water for residents is a given. Coastal communities are
growing worldwide. U.N. estimates are that over 40 percent of the world’s population
lives within 100 kilometers of a coast. In the U.S. the figure is over 50% and coastal
populations continue to expand faster than the national average, exacerbating many
existing saltwater problems (Gandy 2002).
“It is common in the coastal plain to withdraw ground water from confined aquifers. Clay-rich sediments above and below the aquifer restrict vertical water flow. Water levels in wells tapping a confined aquifer rise to a level equivalent to the water pressure in the aquifer (potentiometric surface).” (North Carolina Division of Water Resources 2009)
32
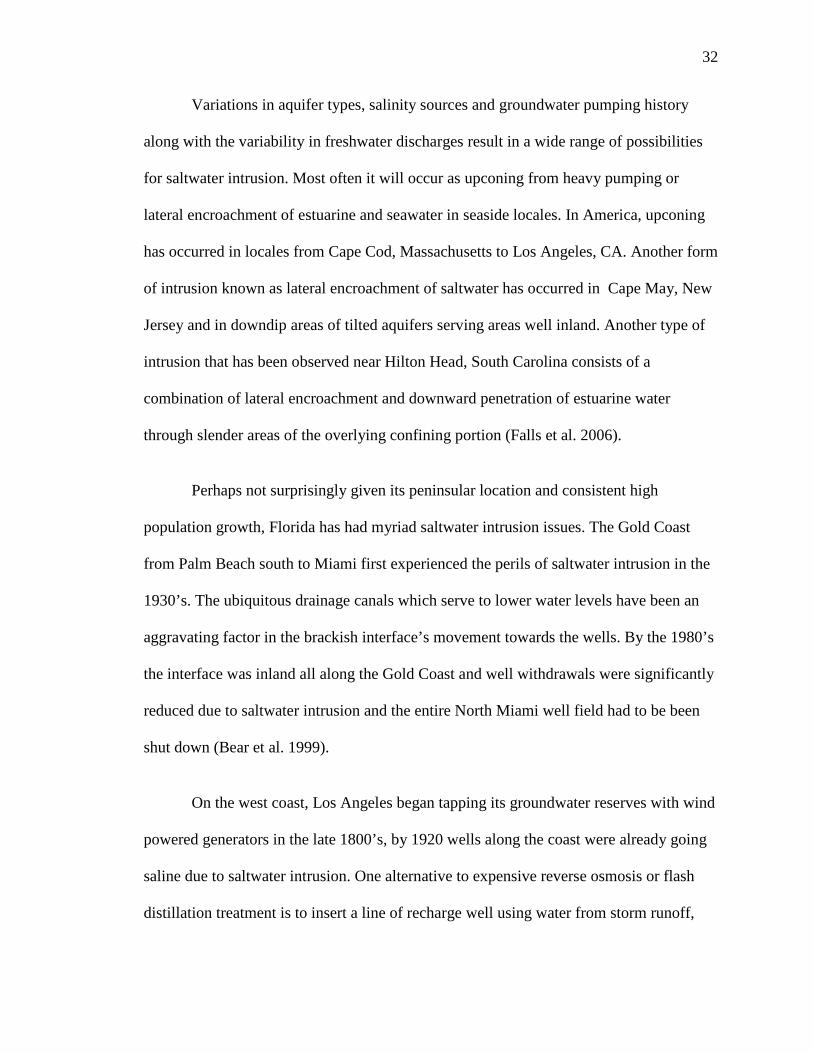
Variations in aquifer types, salinity sources and groundwater pumping history
along with the variability in freshwater discharges result in a wide range of possibilities
for saltwater intrusion. Most often it will occur as upconing from heavy pumping or
lateral encroachment of estuarine and seawater in seaside locales. In America, upconing
has occurred in locales from Cape Cod, Massachusetts to Los Angeles, CA. Another form
of intrusion known as lateral encroachment of saltwater has occurred in Cape May, New
Jersey and in downdip areas of tilted aquifers serving areas well inland. Another type of
intrusion that has been observed near Hilton Head, South Carolina consists of a
combination of lateral encroachment and downward penetration of estuarine water
through slender areas of the overlying confining portion (Falls et al. 2006).
Perhaps not surprisingly given its peninsular location and consistent high
population growth, Florida has had myriad saltwater intrusion issues. The Gold Coast
from Palm Beach south to Miami first experienced the perils of saltwater intrusion in the
1930’s. The ubiquitous drainage canals which serve to lower water levels have been an
aggravating factor in the brackish interface’s movement towards the wells. By the 1980’s
the interface was inland all along the Gold Coast and well withdrawals were significantly
reduced due to saltwater intrusion and the entire North Miami well field had to be been
shut down (Bear et al. 1999).
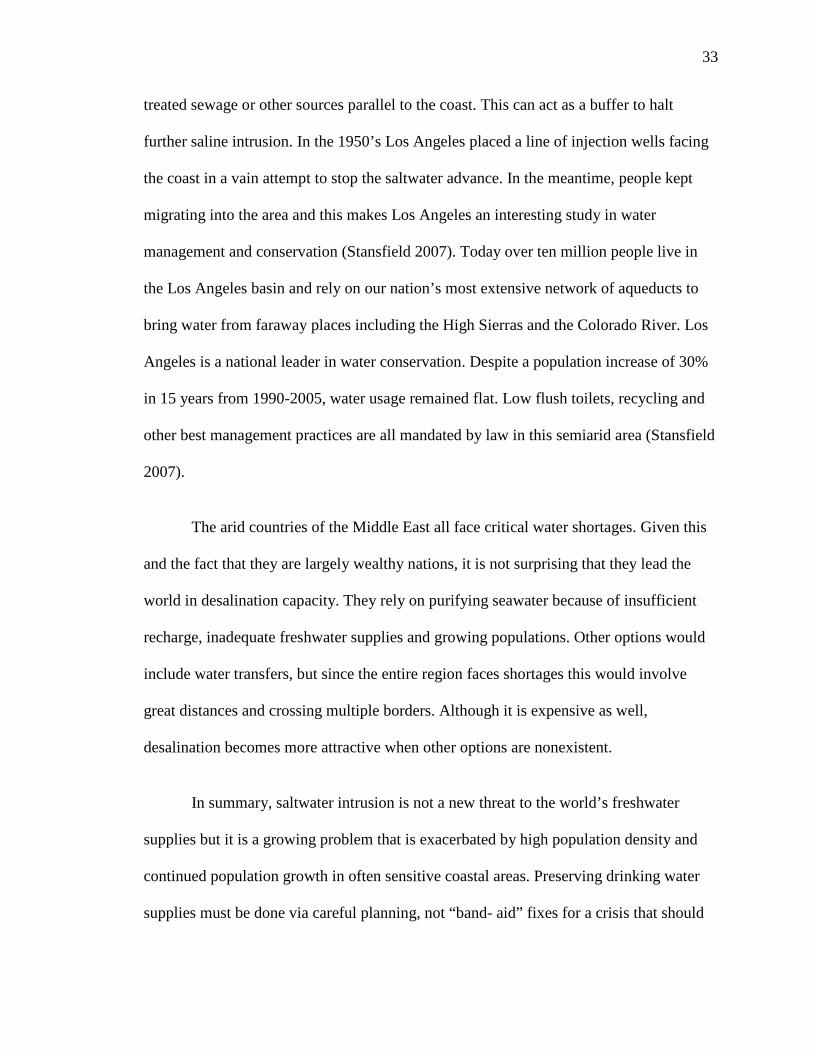
On the west coast, Los Angeles began tapping its groundwater reserves with wind
powered generators in the late 1800’s, by 1920 wells along the coast were already going
saline due to saltwater intrusion. One alternative to expensive reverse osmosis or flash
distillation treatment is to insert a line of recharge well using water from storm runoff,
33
treated sewage or other sources parallel to the coast. This can act as a buffer to halt
further saline intrusion. In the 1950’s Los Angeles placed a line of injection wells facing
the coast in a vain attempt to stop the saltwater advance. In the meantime, people kept
migrating into the area and this makes Los Angeles an interesting study in water
management and conservation (Stansfield 2007). Today over ten million people live in
the Los Angeles basin and rely on our nation’s most extensive network of aqueducts to
bring water from faraway places including the High Sierras and the Colorado River. Los
Angeles is a national leader in water conservation. Despite a population increase of 30%
in 15 years from 1990-2005, water usage remained flat. Low flush toilets, recycling and
other best management practices are all mandated by law in this semiarid area (Stansfield
2007).
The arid countries of the Middle East all face critical water shortages. Given this
and the fact that they are largely wealthy nations, it is not surprising that they lead the
world in desalination capacity. They rely on purifying seawater because of insufficient
recharge, inadequate freshwater supplies and growing populations. Other options would
include water transfers, but since the entire region faces shortages this would involve
great distances and crossing multiple borders. Although it is expensive as well,
desalination becomes more attractive when other options are nonexistent.
In summary, saltwater intrusion is not a new threat to the world’s freshwater
supplies but it is a growing problem that is exacerbated by high population density and
continued population growth in often sensitive coastal areas. Preserving drinking water
supplies must be done via careful planning, not “band- aid” fixes for a crisis that should
34
have been avoided through proper water supply management and planning.
Unfortunately, in the third world this is not always the case.
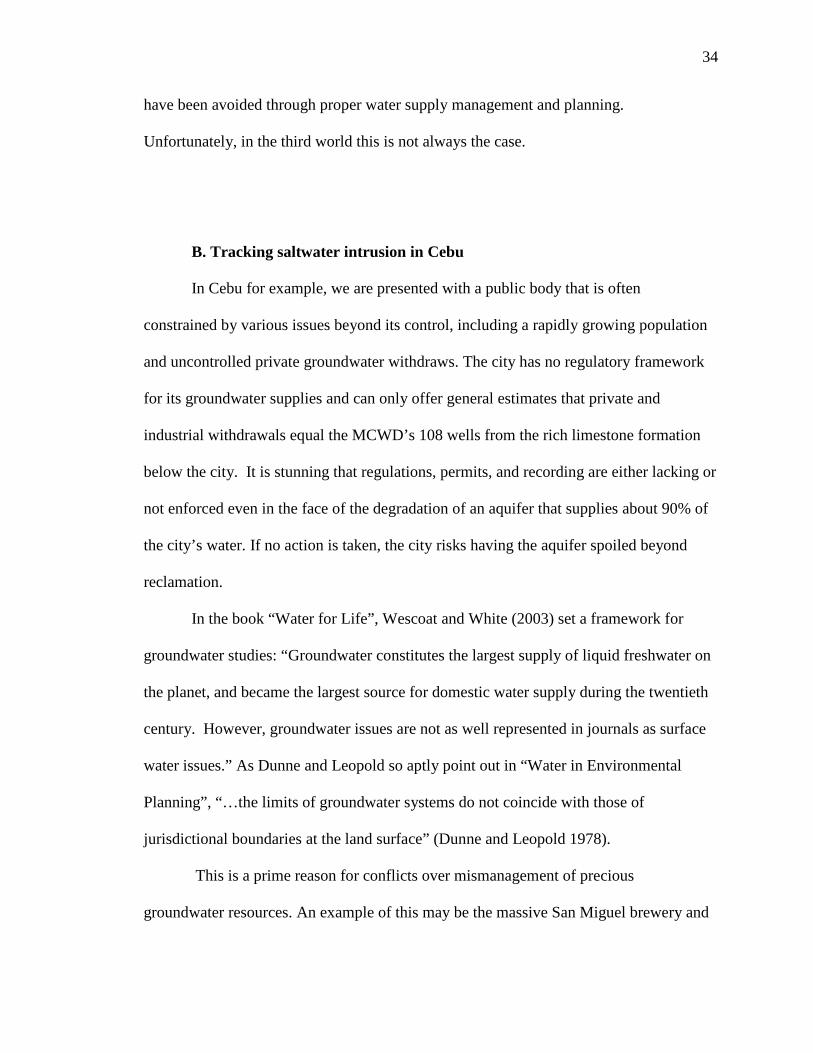
B. Tracking saltwater intrusion in Cebu
In Cebu for example, we are presented with a public body that is often
constrained by various issues beyond its control, including a rapidly growing population
and uncontrolled private groundwater withdraws. The city has no regulatory framework
for its groundwater supplies and can only offer general estimates that private and
industrial withdrawals equal the MCWD’s 108 wells from the rich limestone formation
below the city. It is stunning that regulations, permits, and recording are either lacking or
not enforced even in the face of the degradation of an aquifer that supplies about 90% of
the city’s water. If no action is taken, the city risks having the aquifer spoiled beyond
reclamation.
In the book “Water for Life”, Wescoat and White (2003) set a framework for
groundwater studies: “Groundwater constitutes the largest supply of liquid freshwater on
the planet, and became the largest source for domestic water supply during the twentieth
century. However, groundwater issues are not as well represented in journals as surface
water issues.” As Dunne and Leopold so aptly point out in “Water in Environmental
Planning”, “…the limits of groundwater systems do not coincide with those of
jurisdictional boundaries at the land surface” (Dunne and Leopold 1978).
This is a prime reason for conflicts over mismanagement of precious
groundwater resources. An example of this may be the massive San Miguel brewery and

35
bottling complex in Mandaue, Cebu. The unregulated and undoubtedly heavy water
withdraws to support this operation may be an aggravating cause of the salination of the
Carcar aquifer. But since the Mandaue operation lies just across the border from the city
proper, Cebu City cannot regulate groundwater withdrawals. Figures 5.3 and 5.4 were
compiled by the USCWRC (1985) and illustrate 40 parts per million (ppm) and 250 ppm
chloride lines in Cebu circa 1979 and 1983. In figure 5.5, the 250 ppm salinity line is
estimated as of the year 2000 using data the USCWRC collected but did not publish.
Note that the 250 ppm line in figure 5.5 tracks very close to the 40 ppm line of 1983.
Figure 5.3 Saltwater intrusion in Cebu: 1979
0000 - 40 ppm xxxx - 250 ppm
1979 Salinity Map

36
Figure 5.4 Saltwater intrusion in Cebu:1983
Figure 5.5 Saltwater intrusion in Cebu: 2000. This is an estimated line based on unpublished data from the USCWRC
0000 – 40 ppm xxxx – 250 ppm
1983 Salinity Map
2000 Salinity Map (est)
___ 250 ppm

37
C. The role of the Municipal Cebu Water Department (MCWD)
The MCWD is tasked with regulating groundwater usage from Cebu City’s
approximately 25,000 wells. The National Water Relations Board (NWRB) deputized the
MCWD to regulate Cebu’s groundwater usage to maintain a safe yield, but since the
MCWD is currently unable to handle this task, the degradation of the Carcar aquifer has
continued unabated (Clemente et al. 2001). Comprehensive well monitoring must be
established in Metro Cebu to determine the true amount of groundwater being withdrawn.
Once this is established, it can form the basis of a comprehensive groundwater
management plan for the city. The MCWD’s recent focus has been more on improving
the system recovery rate than any other single area. It has gone from 64% to 72% in this
decade according to Engineer Ronnel Magalso of the MCWD (Delco and Magalso 2007).
While Cebu’s groundwater has continued to increase in salinity, the MCWD
appears to have been in denial. In addition to citing a much higher standard for safety of
600 ppm chloride when the internationally accepted figure is 250 ppm (note: the chloride
limit in the U.S. under the Safe Drinking Water Act is 250 ppm), the MCWD also relies
solely on chlorination to disinfect the water from pathogens (Delco and Magalso 2007).
These pathogens are present in large degree due to the city’s lack of a sewerage system.
The creaky water pipes that are often found running through open sewage canals have
been observed on multiple occasions. This situation allows raw waste to be drawn in via
negative pressure each night when the city water supply runs out (Walag 2007). The lack
of any control measures beyond chlorination is an injustice that those who turn their taps
on first every day can attest to.

38
Chemical contamination is apparently not even considered, although there is
ample evidence that it must be present to some extent with the city’s high amount of
unregulated industries discharging into the open sewage canals and intermittently flowing
river beds. The Buhisan River used to flow continuously, but it has been impounded near
the city limits to provide about 5% of Cebu’s water supply (Delco and Magalso 2007).
Nitrates in Cebu have also risen from 5 mg/l in 1991 to 22 mg/l in 2000 according to the
University of San Carlos (Walag 2007).
The Buhisan dam has been rebuilt several times since it was first built with
American assistance in 1905. Today it is a modern structure that appears to be well
maintained. Figure 5.6 shows the dam with some of Cebu’s denuded hills in the
background in 2010. The home of the Cabrera family is nearby and was utilized by the
Japanese under Major Michaguchi as the command and control center for occupied Cebu.
Figure 5.6 The MCWD’s Buhisan Dam

39
The dichotomy in these quotes that Robin Broad and John Cavanagh (1993) open
“Plundering Paradise” with give a sense of the competing paradigms that is the
Philippines. Cebu can easily be substituted for the Philippines in each one.
“The beauty of the Philippines… A world you didn’t think still existed. But it does, right here in paradise…. Dazzling blue waters beckon to pristine white sands…. Where life is
idyll and smiles are dreamy.” Philippine Airlines Advertisement
“A plunder economy, that’s the post World War II Philippine history… plunder of seas, plunder of mines, plunder of forests.” Fr. Sean McDonagh, Irish Columban Missionary
From 1999 to 2001 Olaf Scholze (2002) of the Technical University of Hamburg-
Harburg, Germany attempted to model the saltwater intrusion in Cebu by measuring
electrical conductivity via depth-dependent sampling. Working with the researchers at
USC, Olaf and his team sampled 28 out of the city’s 108 public wells. The study
encountered many difficulties including: incomplete or missing well log data, problems
with well screens not being where they were supposed to be, no access to private wells,
and seasonal variations in recharge and groundwater flow (Scholze 2002). In addition to
the data problems faced by Mr. Scholze, Cebu’s border issue makes it difficult to assess
watershed boundaries. This makes every resource decision fraught with uncertainty and
thus serves to further delay watershed management action that needs to be expedited.
With the brewery complex located just north of the city and well inside of the salt
water intrusion line, it is hard to contemplate that there is no reporting system in place for
groundwater withdraws within the physically small metro area. Pierre Lacombe (2007)
of the United States Geological Survey (USGS) advised that the brewery must be treating
its well water because the yeast that is used in brewing beer is highly sensitive to salinity
and would be negatively affected at only 10 ppm, far less than any well in the metro area

40
can provide. It wasn’t possible to arrange a meeting with Salvador Abadesco, the
manager of the Visayan San Miguel Bottling and Distribution plant (SMBD).
Important questions regarding the amount of water drawn and treatment methods
were left unanswered. But the size of the facility and its location less than 2 miles from
the coastline lead to the unavoidable conclusion that groundwater withdraws must be
heavy and treatment for salinity must be taking place. According to the maps provided by
the USCWRC, the groundwater in the area surrounding the brewery tested above 250
ppm in all tests conducted by the USCWRC in the year 2000. In the surveys conducted
for this study in January, 2010 well water in Mandaue City tested at an extremely high
average of 901 ppm salinity.
Adjacent to the massive San Miguel brewery that employs over 3,000 people is a
large Coca Cola bottling plant. According to Officer in Charge (OIC) Engineer Ernesto
Delco (2007) of the MCWD, Coca Cola requested 317,040 gallons a day from the
MCWD in early 2007 which freed it from its reliance upon San Miguel (Delco and
Magalso 2007). This divestiture was confirmed during the 2010 site visit and it should be
noted that the San Miguel corporation contributes financially to the MWCD as well as
other civic organizations (Garces 2010).
It is surprising that regulations, permits, and recording are not required of the
private sector even in the face of the degradation of an aquifer that supplies over 90% of
the city’s water. If no action is taken, the city risks having the aquifer spoiled beyond
reclamation. According to a public report in 2003, people in Cebu City have begun
abandoning their wells and relying on prepaid water systems from a World Bank funded
initiative – US based World Water. The prices are high, Philippine Peso (PhP) 150 per
41
cubic meter of water, which amounts to more than $3 per cubic meter (Buenaventura
2005). This is indeed a stiff tariff in a country where per capita annual income is around
$2,000. Attempts to verify this report were made during the interviews of 2010;
regrettably, no one could be found who used World Water (or who had even heard of it).
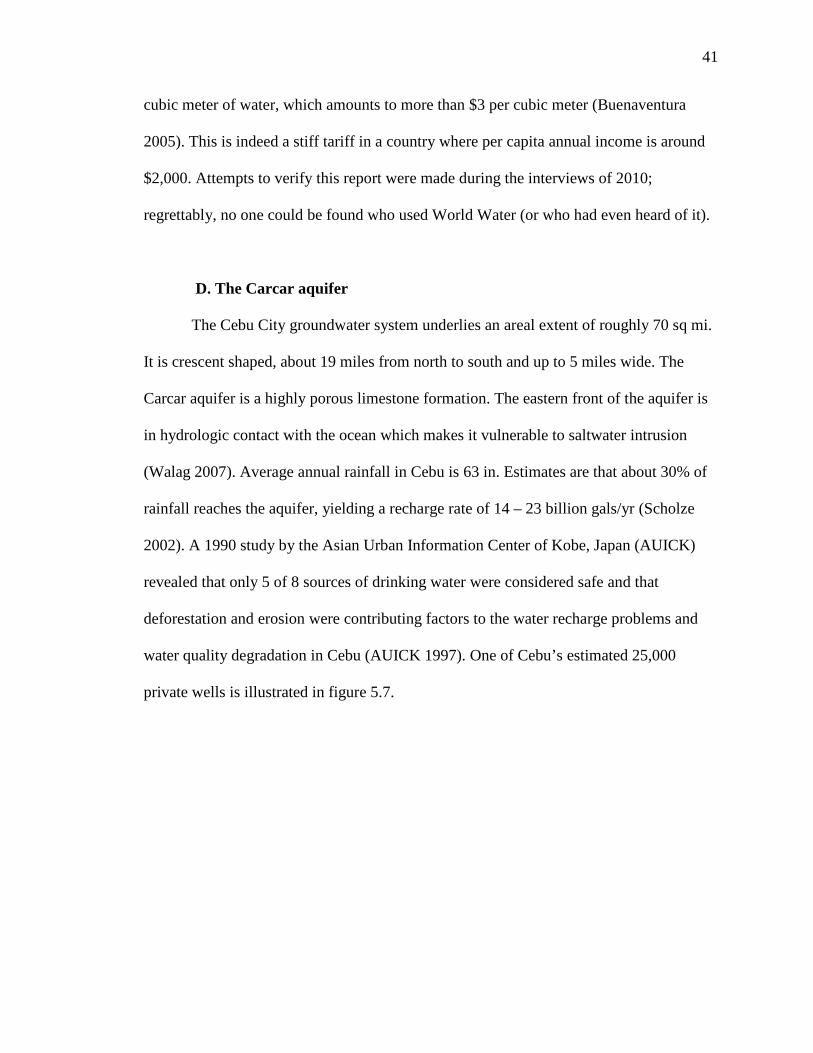
D. The Carcar aquifer
The Cebu City groundwater system underlies an areal extent of roughly 70 sq mi.
It is crescent shaped, about 19 miles from north to south and up to 5 miles wide. The
Carcar aquifer is a highly porous limestone formation. The eastern front of the aquifer is
in hydrologic contact with the ocean which makes it vulnerable to saltwater intrusion
(Walag 2007). Average annual rainfall in Cebu is 63 in. Estimates are that about 30% of
rainfall reaches the aquifer, yielding a recharge rate of 14 – 23 billion gals/yr (Scholze
2002). A 1990 study by the Asian Urban Information Center of Kobe, Japan (AUICK)
revealed that only 5 of 8 sources of drinking water were considered safe and that
deforestation and erosion were contributing factors to the water recharge problems and
water quality degradation in Cebu (AUICK 1997). One of Cebu’s estimated 25,000
private wells is illustrated in figure 5.7.
42
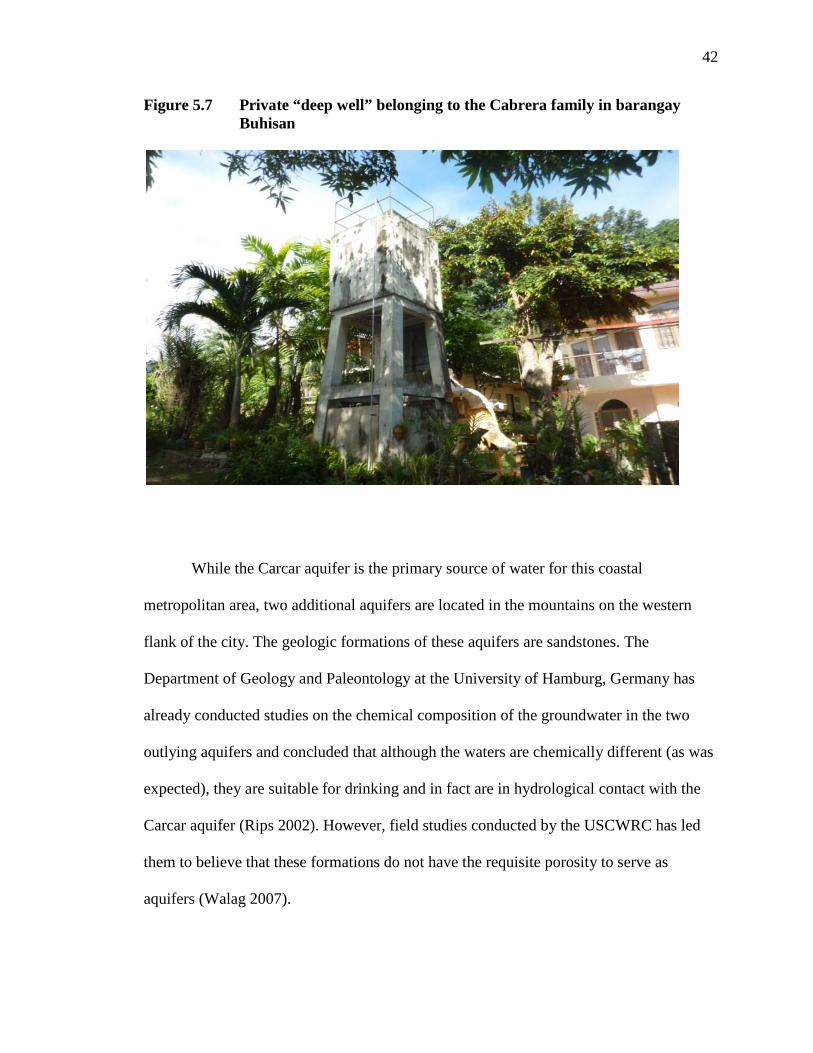
Figure 5.7 Private “deep well” belonging to the Cabrera family in barangay Buhisan
While the Carcar aquifer is the primary source of water for this coastal
metropolitan area, two additional aquifers are located in the mountains on the western
flank of the city. The geologic formations of these aquifers are sandstones. The
Department of Geology and Paleontology at the University of Hamburg, Germany has
already conducted studies on the chemical composition of the groundwater in the two
outlying aquifers and concluded that although the waters are chemically different (as was
expected), they are suitable for drinking and in fact are in hydrological contact with the
Carcar aquifer (Rips 2002). However, field studies conducted by the USCWRC has led
them to believe that these formations do not have the requisite porosity to serve as
aquifers (Walag 2007).

43
E. Desalination methods
As the Carcar aquifer continues to decline, desalination must be considered.
Around the world, integrated systems are often required to preserve water resources
quality. Simple disinfection methods such as chlorination and ultraviolet radiation -
which are relatively inexpensive and effective in eliminating microorganisms - cannot
resolve salinity or chemical contamination problems. Distillation and reverse osmosis
systems are the preferred methods to deal with the problems of excess salinity and
chemical contamination, but are quite expensive to construct and operate. Incorporation
of micro-filtration, nano-filtration and membrane processes are all stages in advanced
water treatment, but only reverse osmosis is a practical solution for dealing with water
shortages over the long haul (Matiuhin 2003). A salinity scale and corresponding
desalination methods are in Table number 5.1 .
Table 5.1 Index of salinity and treatment options:
Salinity < 3K ppm light brackish
3K–10K ppm brackish
10K - 35K ppm heavy brackish
> 35K ppm brines
Distillation N S P P Electrodialysis P S N P Reverse osmosis P P P S Ion exchange P
Key: P – Primary application S – Secondary application N – Not economically feasible It was observed during the 2007 site visit that reverse osmosis is the preferred
method of the small scale independent water operations in Cebu. The 2010 survey
confirmed this observation. Interviews revealed that the high performance of today’s
membrane technology and lower energy requirements in comparison with distillation
have played in a role in the dominance of reverse osmosis here (Raborar 2010).
44
Chapter 6: Privatization of Water
“If you can privatize water, you can privatize anything” (The Economist 1986)
A. Introduction
In 2002 the U.N. decreed that humans have a right to safe, sufficient and
affordable water for personal domestic use. But this did not imply that it must be
provided by the public sector. In fact, reaching international safe water goals is often
used by aid agencies to justify privatization. The poor are less able to afford the actual
cost of water which can make privatization problematic. The pricing rarely takes into
account the public health benefits of safe water. In economic terms externalities (like
pollution, disease, etc.) are hard to price and often their impact is undervalued as a result.
In South Africa though, a large outbreak of cholera in 2000 resulted in a unique response
to the hardship caused by these externalities. The rate structure for water was
subsequently altered to subsidize an “allowance” of 25 liters of free water for daily
personal use and up to 6,000 liters per month, per household.
In economics, opportunity cost refers to the fact that expenditures do not occur in
a vacuum. They have other hard to see effects because “other opportunities” are missed.
You cannot “do everything”. As an example, North Korea spends a great deal of its GDP
on its military. Those funds could have easily resulted in additional food supply for
millions. The same rationale applies to water supply. While water supply may seem to be
a simple public good, that quaint notion must be discarded. Supply and demand laws are
being increasingly applied to water. Water banking and water marketing are newer

45
elements of today’s water paradigm. While the supply and demand rationale can reduce
wasteful practices, it can also negatively affect access for at risk populations.
B. Privatization methods and water markets
Water supply is certainly part of political discourse and unfortunately the politics
of water are rarely transparent. The public is seldom alerted to the tradeoffs that are
constantly being made. Governments are not about to implicitly offer a menu of choices
when doing so might undermine a choice that has already been made. In the case of large
scale water privatization, the money and complexity are such that even if the media
unravels the machinations of such contracts they cannot be easily unwound without
heavy losses and possibly penalties as well.
Water is a critical resource, it has many unique characteristics and uses. The water
cycle means that it is constantly changing form and location. It is non-substitutable and as
a flow resource is much more complicated to manage than any fixed asset. The
consumption of water also increases with income and household consumption correlates
more strongly with income than with family size. Some difficulties the poor are faced
with regarding water are that fixed charges become a large burden for them (annual
connection fees, etc). A lack of land tenure often prevents investment in deep wells. The
informal ways they often rely upon to get water are more costly and may more likely
result in contamination.
46
Jessica Budds and Gordon McGranahan (2003) list the four traditional water
regimes as follows:
1) Publicly funded and administered water distribution which is the most common
arrangement;
2) State-aided monopoly with price controls;
3) State-aided natural monopoly with profit controls;
(4) State controlled franchises, leasing, or concession agreements;
Historically, many places relied on nascent private water systems, but market
failure became an issue in the United Kingdom and elsewhere as private control did not
result in safe water. The need for safety standards resulted in a shift to public control that
has remained dominant around the world ever since (Budds and McGranahan 2003). But
in recent decades previous knowledge about privatization has been pushed aside. The
Dublin Principles of 1992 support managing water as an economic good under the
rationale of conservation and efficiency, but tries to balance the right of humans to safe
water at an “affordable” cost” (Budds and McGranahan 2003).
During the 1990’s privatization efforts were constantly being made. State failure
replaced market failure as a conceptual framework on which this could be built. Under
this rubric water is a private, tradable good and that scarcity has been the result of
mismanagement by government entities. Privatization schemes took place at a dizzying
rate around the world with hotspots in Latin America and Asia where large cities with a
burgeoning middle class and often failing utilities seemed to offer the perfect void for
large multinational firms such as Bechtel and Lyonnaise Des Eaux to fill. But as Budds
and McGranahan (2003) also point out, despite the aforementioned promises of

47
privatization, the fact remains that areas least served by public regimes remain so under
private controls.
In the late 20th and early 21st centuries the global problem of water scarcity was
addressed through large scale privatization in many places. Whether the initial method
was a joint public – private venture or an outright takeover of the public body’s
responsibilities, privatization gained momentum around the world during the 1990’s and
early 2000’s. Each year seemed to bring more literature documenting this transition.
Although it was mostly in journals and periodicals, there are also books on the subject
such as “Approaches to Private Participation in Water Services” (World Bank 2006). The
books tend to do two things: recount past experiences such as the 1997 Manila water
privatization and critique them. Some, such as the above title, offer a framework which
policy makers could reference when contemplating this path.
The ideological shift from the government sector back to the private sector was
based on the assumption that governments waste resources because they do not need to
be concerned about the economic value since they do not face competition. The inherent
difficulties in applying market value to government work was a major concern of the
various New Deal programs in this country. The failure of communist economic systems
around the globe support this rationale. But, until the 1990’s, water privatization was
extremely hard to find in the third world.
With regards to water, USAID and the International Monetary Fund (IMF)
supported privatization through stipulations in aid agreements that would assist private
interests in the aid-giving countries. Although the aid contracts are usually structured to
be “pro-poor,” the worst off are often left out of the contract area. Smoky Mountain,
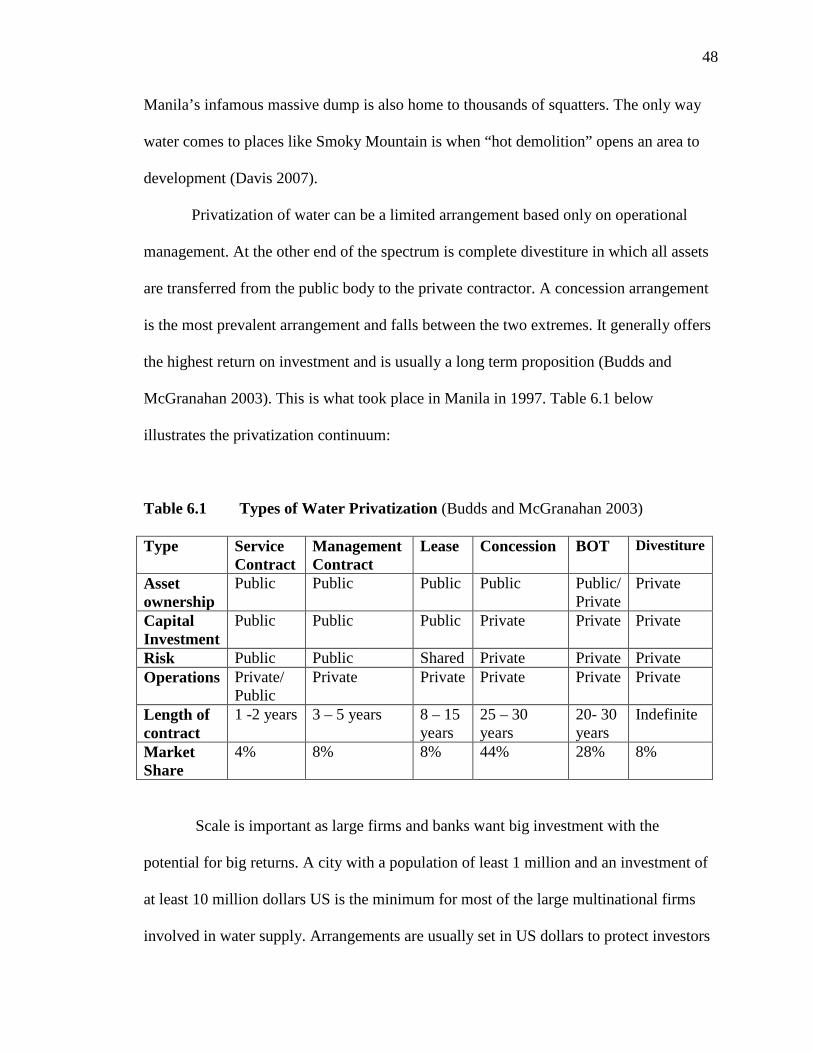
48
Manila’s infamous massive dump is also home to thousands of squatters. The only way
water comes to places like Smoky Mountain is when “hot demolition” opens an area to
development (Davis 2007).
Privatization of water can be a limited arrangement based only on operational
management. At the other end of the spectrum is complete divestiture in which all assets
are transferred from the public body to the private contractor. A concession arrangement
is the most prevalent arrangement and falls between the two extremes. It generally offers
the highest return on investment and is usually a long term proposition (Budds and
McGranahan 2003). This is what took place in Manila in 1997. Table 6.1 below
illustrates the privatization continuum:
Table 6.1 Types of Water Privatization (Budds and McGranahan 2003)
Type Service Contract
Management Contract
Lease Concession BOT Divestiture
Asset ownership
Public Public Public Public Public/ Private
Private
Capital Investment
Public Public Public Private Private Private
Risk Public Public Shared Private Private Private Operations Private/
Public Private Private Private Private Private
Length of contract
1 -2 years 3 – 5 years 8 – 15 years
25 – 30 years
20- 30 years
Indefinite
Market Share
4% 8% 8% 44% 28% 8%
Scale is important as large firms and banks want big investment with the
potential for big returns. A city with a population of least 1 million and an investment of
at least 10 million dollars US is the minimum for most of the large multinational firms
involved in water supply. Arrangements are usually set in US dollars to protect investors

49
from currency devaluations (Budds and McGranahan 2003). But the US dollar has come
under increasing pressure lately and China, Russia and Brazil have discussed bypassing
it. How this situation may affect future water investment deals is unknown at this time.
According to Jessica Budds and Gordon McGranahan (2003), some problems with state control include: 1) Handling rising per capita water use; 2) State MUA’s are protected from competition in labor; 3) Subject to short term politics and special interests i.e., trade unions asking for privileges; 4) Corruption and a lack of transparency.
For example, in Guayaquil, Ecuador 1,500 people on the government’s pay roll
had no show jobs. Of course New Jersey’s government has recently been in the news for
similar problems. Some of the opposition to privatization oppose all private property and
want true communal relations, but this is a minority position that does not enjoy popular
support. The Small Scale Independent Private Water Providers (SSIPWP) can be good
for the poor because by definition they have a personal relationship with the provider.
Small providers may also provide better service to the poor than a municipal or
large private company would offer. Lower income people generally do not have a strong
political voice that would be necessary to hold a large private or municipal them because
they can hold a small provider accountable. To survive, the small provider has to
maintain its good name locally. Lastly, customers are also more likely to demand good
service when they pay (even if the cost is subsidized) for it as opposed to a handout.
Table 6.2 below illustrates the various governance models for local public utilities.
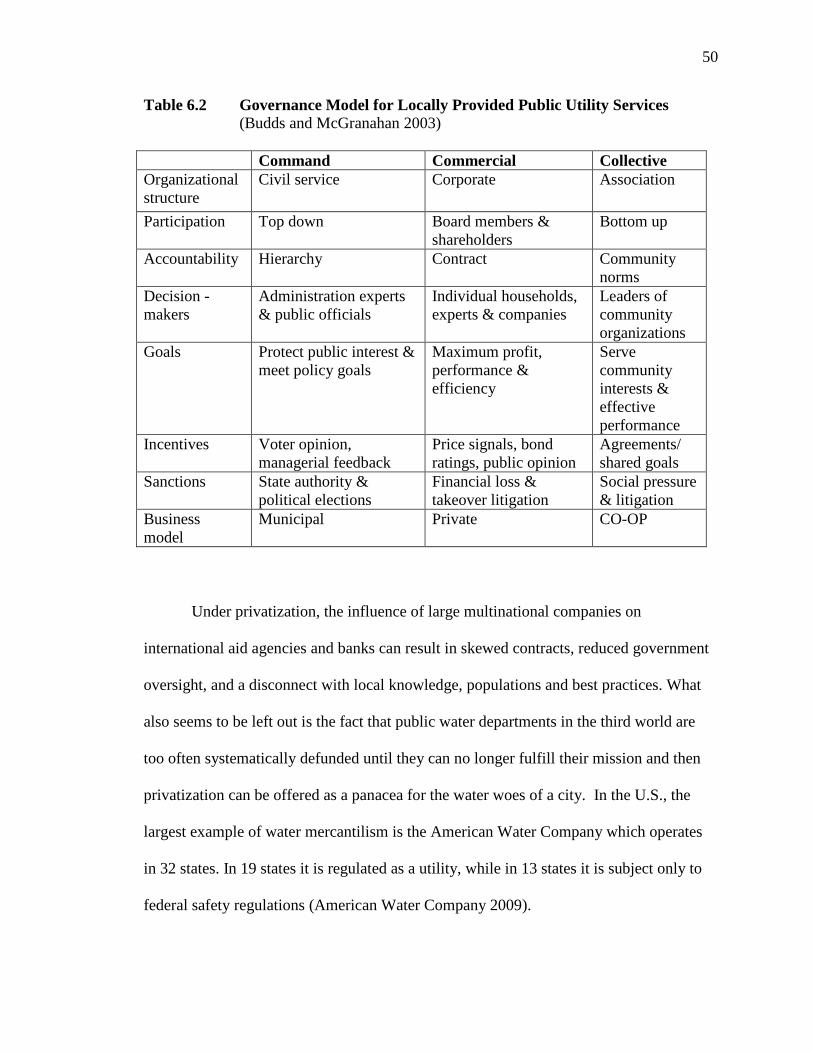
50
Table 6.2 Governance Model for Locally Provided Public Utility Services (Budds and McGranahan 2003) Command Commercial Collective Organizational structure
Civil service Corporate Association
Participation Top down Board members & shareholders
Bottom up
Accountability Hierarchy Contract Community norms
Decision -makers
Administration experts & public officials
Individual households, experts & companies
Leaders of community organizations
Goals Protect public interest & meet policy goals
Maximum profit, performance & efficiency
Serve community interests & effective performance
Incentives Voter opinion, managerial feedback
Price signals, bond ratings, public opinion
Agreements/ shared goals
Sanctions State authority & political elections
Financial loss & takeover litigation
Social pressure & litigation
Business model
Municipal Private CO-OP
Under privatization, the influence of large multinational companies on
international aid agencies and banks can result in skewed contracts, reduced government
oversight, and a disconnect with local knowledge, populations and best practices. What
also seems to be left out is the fact that public water departments in the third world are
too often systematically defunded until they can no longer fulfill their mission and then
privatization can be offered as a panacea for the water woes of a city. In the U.S., the
largest example of water mercantilism is the American Water Company which operates
in 32 states. In 19 states it is regulated as a utility, while in 13 states it is subject only to
federal safety regulations (American Water Company 2009).
51
In many American public systems major underground leaks go unrepaired
because there is no monetary loss associated with it. If these occurred in a piped system
that was supplying desalinated water, this would not be tolerated. Another factor that
cannot be ignored is the large up-front investment water supply requires. Privatization
can easily be considered corporate welfare when profit guarantees of 17% or more are
offered.
The low hanging fruit had been picked by the turn of the century and the mixed
results led to a sharp decline in investment outlays. As of now water privatization failed
to achieve the promises it offered and it also stalled in market penetration. According to
Jessica Budds and Gordon McGranahan (2003), the problem is not really due to the
inherent conflict between private and public providers, but because no arrangement has a
proven an ability to fully serve very low income areas. It is simply not economically
feasible to serve all households with piped water and sanitation.
The U.N. estimates that over 1 billion people lack safe drinking water and over 2
billion lack improved sewage. Most live in rural areas, but even in the major cities of the
third world cholera still exists along with amoebic dysentery and other intestinal diseases
that the very young and very old are especially vulnerable to. Externalities such as public
health benefits are often not considered (Budds and McGranahan 2003). The case for
water being a public good comes when the public health benefit to society is factored in.
Because of high infrastructure costs private water becomes a natural monopoly and
incentives are then to overprice and under produce. A natural monopoly exists when
total costs are lower when one company handles all production and returns increase to
scale. Most economists agree that this situation requires public regulation to prevent
52
overpricing and often justifies public ownership as well (Budds and McGranahan 2003).
But water is not a pure public good like national defense in the sense that unlike defense
it can be rivalrous and excludable. My excess use could impact your ability to consume.
While electric and telecommunication companies have become increasingly
unbundled as technology improved, the same cannot be said for water and sewer. The
basics of a physical piped connection from an elevated source to provide pressure have
not changed with technological improvements. With regards to sewerage, a large plant
site becomes part of the fundamental piped connection requirement. Any unbundling of
these services would involve huge costs and are thus highly unlikely. When water
privatization comes it uses the existing infrastructure although improvements may be
made. Perhaps because of the large plant requirement, sewerage has largely remained part
of the public domain. Worldwide about 5% of water and sewer providers are currently
private (Budds and McGranahan 2003).
In many cases the poor end up using informal vendors (as in Cebu) at rates that
can be 10 to 100 times the cost of a public provider. Because they cannot afford a
monthly payment they will only purchase small amounts of water. The private providers
are not necessarily price gouging, considering the difficult market segment they are
serving. By the middle of the last decade it was clear that the phenomenon has peaked
and had not delivered upon its promises. There is also a lot of risk involved as failed
efforts in Buenos Aires and Tucuman, Argentina, Cochabamba, Bolivia and Port of
Spain, Trinidad each showed when they reverted back to public control.
In Jakarta, Indonesia one major issue was that the design of the contract was
heavily biased. In this city of continued strong growth, only 56% had a water connection

53
and only 2% had sewerage under President Suharto (Bakker 2004). The metropolitan
population has grown from less than 2 million in 1950 to over 26 million today. Disease
outbreaks have been a constant in this tropical environment and Suharto’s collusion with
the two concessionaires (Thames Water and Suez) to deprive the government of revenue.
The 25 year contract signed in 1998 was stipulated to be paid in US dollars over concerns
about the devaluing of the Indonesian Rupiah. In 2001 the contract was modified to a
management contract with a stipulated 22% profit margin, but the fundamental setup was
designed plainly to serve the middle class (Bakker 2004). Like Cebu, in Jakarta most
residents rely on a variety of sources, technologies and modes of delivery for water.
Unlike Cebu however, there has been no explosion of SSIPWP’s.
An infamous privatization failure took place in Cochabamba, Bolivia. The
municipal water and sanitation company, SEMAPA was privatized in 1999, but due to
massive protests the project with Aguas del Tunari was cancelled in April 2000 (Bakker
2008). In each case a lack of transparency in the deals with the large multinational firms
(and the financing) was evident and perhaps not surprisingly, the consent of the public
was not forthcoming.
Cochabamba is the third largest city in Bolivia. Water from the public utility was
heavily subsidized and prices were lower than the actual cost of distribution. The
municipal provider SEMAPA had started well in 1967, but over time morphed into a
classic inefficient, statist patronage outfit with unresponsive management, overstaffing
and poor coverage. The public was ill served and unhappy with water available for only
about 4 hours a day, (in Cebu it is around 12 hours). Nearly half the population did not
have service and relied on informal sources of water of unknown quality.
54
The privatization that began with Law 2029 in Bolivia was controversial. Non-
SEMAPA customers included the farmers whose water rights were no longer guaranteed.
They began to organize immediately to fight Bechtel which was the face of Law 2029.
Cochabamba, Bolivia was the first major reversal of water privatization in Latin America.
In 1999 the IMF reportedly threatened to deny a $25 million loan unless the water system
was privatized. Water rights in this Andean city were subsequently sold to Aguas del
Tunari (AdT), a subsidiary of the U.S.-based transnational corporation Bechtel. Water
prices rose sharply and poverty-strapped Bolivians refused to pay. The union was given
shares in the company to gain acceptance of the layoffs and conversion of many full-time
positions to part-time. This phenomenon is not limited to the third world. In the early
1990’s these two-tiered labor contracts became commonplace in the U.S. airline industry
for example.
AdT charged a higher price that they claimed was in line with their costs. The
price increase for the poor was 43%. Middle class and commercial prices went up 60%.
Demonstrations and riots followed and several people died. Less than a year later the 40-
year contract was nullified. But misconceptions abounded. The effect of the rate increases
was widely exaggerated and some reports also ignored the fact that Bechtel did fix
several leaking water mains which ended rationing and allowed consumption to rise
(World Bank, 2006).
The Bolivian public water authority never extended its water network to the very
poorest and between 1989 and 1999 the percentage of households with connections to the
network in the growing city fell from 70 to 60%. Water was subsidized, but mainly

55
benefited the middle and upper classes. These groups did face the biggest price increases
from AdT and even so the poor still paid much more for unknown water quality from
trucks and handcarts. One major problem was that mayor Bonbon had connections with
companies that would profit from a dam and he insisted on an unnecessary dam which
added millions in extra cost. His financial backers pressured him to reject any deal
without a dam in it. AdT’s final deal included the dam. The local political environment
was tarred with patronage and vanity projects.
Under the return to SEMAPA the poor still paid about 10 times as much for water
as the rich. The mayor and the union were able to raise employment at SEMAPA by
300%, but despite the additional workforce, water is again rationed and no major new
supply connections have been completed. AdT sued in 2005 and the complex case has yet
to be resolved. The struggle is now between the consumers who want better water quality
and more availability and the union which wants to protect its power and benefits.
SEMAPA also retains debt that AdT had when they retook control ($ 18 billion).
SEMAPA has began earnest efforts at improvement, but it needs additional resources to
do so (World Bank, 2006).
The creation of markets for water is even more controversial. In 1999 Spain began
implementing water markets and banks to reduce the heavy state subsidy that goes to the
drier areas of Spain’s south and west. The rationale for water mercantilism in Spain was
that poor management by the state resulted in quality and access issues. Under this
framework, water becomes a tradable commodity rather than a public good and users are
simply customers, not citizens with rights. The creation and application of markets for

56
water remains contested and the vagaries of the hydrologic cycle offers no clarity.
Certainly the results of the Spanish experiment are not clear (Bakker 2002).
In 1993 the French firms Suez and Vivendi signed with Carlos Menem’s
Argentine government to take over water and sanitation in Buenos Aires from Obras
Santiarias de la Nation (OSN). The Menem regime was in the midst of privatizing a wide
range of functions. A major problem was the lack of transparency about the agreement,
poor infrastructure, and the Aguas continuation of OSN’s opaque tariff system (Loftus
and McDonald 2001). The union was given a 10% share in Aguas, but the layoff of 3,600
workers left many feeling betrayed. Trouble also came when the president exercised fiat
in bypassing regulators in allowing Aguas de Argentinas to raise rates and increase
profitability at will. (Some have speculated that the MWSS in Manila was set up for
privatization by raising rates prior to the bid. This made the utility a target of anger and
also made it easier for bids to be lower than costs).
The 1993 World Bank partnership with Argentina in privatizing Buenos Aires’
water supply took place only after then President Menem declared a state of economic
emergency. Argentine authorities agreed to a $90 million loan from the American
Development Bank (ADB) to privatize the Buenos Aires Water and Sewerage Networks.
They also rushed to declare the project a success, but tariff increases and service
disconnections (especially in low income neighborhoods) tell another story. The private
sector participation contract was suspended and ultimately revoked (Loftus and
McDonald 2001). Although improvements in childhood mortality were noted, the new
company Aguas Argentinas failed to reach many of the targets set by the agreement
before the contract was terminated in 2006. The episode remains controversial.

57
In 1995 a French consortium involving Suez and Vivendi signed a 30 year
agreement to privatize water in Argentina’s smallest province, Tucuman. But when the
price of water doubled, a popular revolt erupted. The ensuing payment boycott caused the
contract to be nullified in 1998. During the protest a new governor was elected who
opposed the privatization and encouraged the payment boycott. The water also went
brown during this period without a satisfactory explanation and 80% failed to pay.
Vivendi subsequently sued for $100 million. In the meantime the state regained control.
Vivendi later raised the suit to $535 million after the Tucuman government countersued
them. Vivendi is suing under the rights of the Argentine/French investment protection
treaty.
C. The Manila Water Privatization
Manila faced nearly the same situation a decade ago: a bloated bureaucracy that
ill served the public. The Manila Metropolitan Waterworks and Sewage System (MWSS)
was saddled with high costs which were passed on in the form of exorbitant rates. They
reacted glacially to the degradation of its principal aquifer and was unresponsive to calls
for action against saltwater intrusion. In 1994 that all changed. The idea was broached by
Biwater, a joint Malaysian-British venture to then Philippine President Ramos and
Secretary Vigilar. Within 3 years the Manila Water Concession was completed with a
very public and scrupulously transparent open bid. At the time it was the world’s largest
water privatization (Dumol 2000). Despite many difficulties and contentious issues the

58
contracts are still in place. A major reason for this may be the early efforts that were
made to ensure the process was open to the public.
The results in Manila were dramatic. A looming water crisis was averted at the
same time costs were reduced, marking the water utility’s transformation into a lean and
responsive unit. Service improved, rates went down and new sources of supply were
brought on line which alleviated the pressure on the primary aquifer. While the literature
on water privatization is sharply divided along ideological fault lines, the positive overall
impact on daily life in Manila was undeniable. Below are some quotes that Mark Dumol
(2000) cited in the Manila Water Concession that illustrate the MWSS’s alleged non-
responsiveness to the public it was sworn to serve and the resulting impact on peoples’
lives.
“As a water consumer, I used to live in area where the water could come on only between 10p.m. and 4a.m. Sometimes the water would be only for two hours. There were days, even when no repairs were being done, when there would be no water at all. In my present residence, I have water about 16 hours a day. Together with other water consumers, I dream of the day when I can have water at my faucet 24 hours a day. Obviously, as long as the government continued to distribute the Water, this was impossibility.” “Ducky Parades” 1/27/97 The Malaya
On February 4, 1997, Dahli Aspillera wrote in the Malaya:
“Good luck water privatization. Start by increasing the salaries of the good employees, and firing the lazy. Your management may finally bring water to the faucets at my home in Barangay Kapitolyo in Pasig. Because the family has been without daytime water for the past decade, the children had never seen water come out of their home faucets. One housemaid has the two hour chore at midnight to fill drums, pails, bottles with water. The faucet flows only between midnight and 4 a.m. in most of Baryo Kapitolyo. MWSS, you know that. Did you care?” “MWSS Administrator Angel Lazaro must be congratulated for a truly heroic act: putting together a credible privatization process that abolishes his own job. His best reward will be the freedom to return to the private sector where things are
59
always done more rationally. Contrary to the ignorant claims of demagogues, the privatization program is truly pro-poor. That is the ultimate joy.” “The Joy of Privatization”, Editorial, The Manila Standard, January 26, 1997
“In what is supposed to be the nations’ premier region, the MWSS has managed to provide water to only 65% of 11 million consumers for an average of just 16 hours a day. Its antiquated, leaking pipes cause regular outbreaks of diseases including cholera. It is time to give the private sector a crack at it.” “A Need for Safeguards,” Editorial, The Philippine Star, January 28, 1997 “The unfounded fears about privatization have been plumbed to exhaustion. It is now clearer in the public mind that privatization works… The results have been accepted by a water consuming public that is quietly convinced that no other arrangement could possibly be worse than the present service. Many families depend on water rationed by the bucket which costs many times more than even prevailing water rates. It is the poor that bear the greatest economic burden of bad water service…” “Privatization Works” Alex Magno, The Manila Standard January 28, 1997 “The most welcome and biggest blessing for Metro Manila’s 10 million people from the Ramos government this year is the privatization of the Metropolitan Waterworks and Sewerage System.” Vic del Fierro, Philippine Daily Inquirer January 24, 1997
In short, the result of Manila’s privatization was initially quite positive. Costs
were reduced and services improved, marking the water utility’s transformation into a
lean and responsive unit. Service became reliable as rates dropped and new sources of
supply were brought on line. This alleviated some of the pressure on the primary aquifer
(David 1998). But as Manila also proved, privatization should not be viewed as a
panacea; problems with it still abound. In the Philippines the initially acclaimed MWSS
privatization is now scorned by some. The initial 1997-98 bid rate of Philippine Peso
(PhP) 2.32 (about 5 cents US in 1997) which was down from the MWSS’ rate of PhP
8.78 (about 20 cents US) proved fleeting. As the chart in Table 6.1 shows, today’s rate is
nearly three times that amount (but is still slightly less than consumers pay for municipal
water in Cebu).

60
Several increases have brought the tariff in Manila to PhP 24.43 / m3 currently.
The program has been decried locally as anti-poor since its rates are higher than the local
water authority’s. But even these “low” rates are not enough to offset the debt service on
the first phase of the US Trade and Development Agency (USTDA) loan (Vasquez
2005). Some local officials are suspicious of these expensive projects. It seems that if a
development agency and international banks are involved, the true beneficiary may well
be the multinational companies that get the contracts for such work. The Asian
Development Bank (ADB) appears conflicted on the issue. While publicly promoting
reducing poverty and increasing access to resources, they also often have a financial stake
in the outcomes such as the $250 million (US) the MWSS owed the ADB prior to
privatization (Buenaventura 2005).
Before the privatization in 1997 the Metropolitan Waterworks and Sewerage
System of Manila (MWSS) was responsible for providing domestic and industrial water
in the Manila metropolitan area which includes Makati and Quezon City. Like the
MWSS, the MCWD has been accused by the National Water Resources Board of failing
in its mission to provide safe, affordable and reliable water to the residents they serve
(Walag 2007). Engineer Ernest Magalso (2007) claimed that in Manila the real cost is 60
pesos/m3 (he did not explain where that figure came from) and that the dramatic price
increase in Manila is a major source of the present discontent there. However, as shown
in Table 6.1 the figures that were provided by the USCWRC do not correspond to this
claim. According to Eng. Magalso (2007), water privatization has been broached in
various forms and venues and the Municipal Employees Union (MEU) remains
adamantly opposed to such a move.
61
While a public utility’s incentive is to keep the public happy with low prices, this
encourages overuse. Public providers are often deemed as inefficient and corrupt and
private participation through neo-liberal reforms seeks to correct that situation via the
efficiency of privatization and resulting market prices. The reality is that privatization is
not automatically more efficient, less corrupt or more competent. Privatization is
certainly not an automatic fix and as with any intervention or change in the status quo
many times new and unforeseen problems crop up as well. (Note: Based on field work
during the 2010 visit there are no formal discussions or proposals to privatize the
MCWD, but the subject remains a topic of great intrigue in Cebu.)
Using the poor cannot justify privatizing water or keeping it public (Budds and
McGranahan 2003). Simple, low cost filter technology has proven to be invaluable in
reducing diarrheal illness yet this proven methodology remains drastically underused. If
filter technology was promoted the way mosquito bed nets have been employed to
combat malaria, the lives saved would improve on the former at a similar cost. For the
500 million people who are served by private providers the results are often similar to
those served by public providers, some are good, bad and everywhere in between. Since
the world’s most impoverished slums rarely have public or private service (and neither is
likely to connect these places), the filter technology would at least be a cost effective way
for donors to help.
It depends on the conditions and the ability of the provider. In Manila the Ayala
corporation has done an admirable job managing the east zone of the super-city , while in
the western zone, Maynilad Water has struggled mightily and changed ownership in
2007. One problem that became immediately apparent was the “dive bid” where a bidder

62
offers a low bid to get the contract then renegotiates a much higher rate whose costs are
passed on to the public. This also happened in Manila.
Neither company could provide service at the bid price and each renegotiated
their agreement. This illustrates another potential problem of privatization, the fact that
the indebted third world nations that are the target of bidders and the international banks
and aid agencies are often woefully unprepared to negotiate a good deal for their
constituents. It is not simply a matter of concerns about corruption; transparency itself
does not guarantee a fair agreement. Part of the problem is the subsidies that often part of
municipal systems. When that subsidy disappears it does not matter who is in charge,
people will be unhappy with rate increases.
Of course problems with safety are not limited to the third world. In Walkerton,
Ontario seven people died of E-coli contamination due to mismanagement of the
disinfection system over a holiday weekend in 2000. The employees of the public utility
had no formal training and had falsified records (including chlorine residuals) for years.
Prime Minister Harris immediately blamed the previous administration for loosening
environmental controls as part of budgetary cutbacks in the 1990’s, but the commission
report blamed Harris himself along with the employees of the plant and the Ontario Clean
Water Commission was placed in charge of the cleanup of the Walkerton system
(Prudham 2004).
“Our drinking water, for instance, becomes a nature / society hybrid the moment humans
employ some device to extract, purify and / or deliver it.” (Birkenholtz 2006) Dr. Birkenholtz (2006) also refers to the unintended consequences that often
result from new technology. In many cases the solving of one problem leads to
63
unexpected new issues. For example, tube wells are employed to alleviate water scarcity,
but the results in Rajasthan, India and elsewhere, including the American Great Plains,
indicate that scarcity returns when groundwater is over produced. The secondary scarcity
can prove more problematic than the initial because of the adaptations to the additional
water supply which would include the turning over of additional soil in semi-arid areas.
The problem has thus been recast to include soil loss as well as economic dislocation.
Another consideration that Birkenholtz (2006) cites is that lower income households are
more likely to have greater water needs due to household production (including animal
husbandry) that would not fit into a “normal” locational analysis based on population
density or other social norms.
Historically, markets have not worked in areas where a large capital investment
results in a natural monopoly. This situation resulted in regulated municipal providers of
electricity, telecommunications, water and sanitation in most of the developed world. But
especially in the last 20 years worldwide, hundreds of privatization schemes like that of
the MWSS have bloomed as the concept of state failure replaced that of market failure
(Bakker 2002). It remains to be seen if the paradigm is shifting once again, but the
evidence points toward the end of this era of privatization in the third world.
D. Water production and management in Cebu
The MCWD’s gross annual revenues exceed 1 billion pesos, (over 23 million
dollars in 2007) and the company maintains 2.5 million pesos (58 thousand dollars in
2007) worth of assets. The MCWD’s self measurements include:
• System Recovery
64
• Total Production
• Billable Volume (water sales)
• Number of Service Connections
According to engineers Delco and Magalso (2007), the MCWD has only
experienced rare problems with e-coli, nitrates, and iron in some areas. The agency
indicated that chlorination is the only treatment and that no testing for industrial
chemicals such as benzene or trichloroethylene is undertaken by the MCWD. The
MCWD is also working with Japanese consultants on a proposed desalination plant to
provide safe “not too expensive” water for the 40-odd companies in the Mactan Export
Processing Zone (MEPZ). This water is projected to cost PhP 68.03 per cubic meter when
the plant comes on line. The MCWD currently supplies the MEPZ with water (that tested
at 899 ppm salinity in 2010) at PhP43 per cubic meter (Delco and Magalso 2007).
The Ayala Corporation of the Philippines even proposed a massive engineering
project in 2007 to pipe water 30 kilometers under Cebu Strait from nearby Bohol Island.
The Bohol-Cebu Water Interconnection Project was a proposal that involved the
construction of a technically unprecedented 30 kilometer (18.6 mi) pipeline under the
Cebu Strait which is a narrow body of water separating Cebu and Bohol. It would have
supplied water to Cebu from Bohol’s Inabanga River. The pipeline could have assured
Cebu City adequate water for years to come, but when the plans were made public the
Boholanos resisted the plan strongly. The Ayala Corporation has now proposed to tap the
Carmen River to the north of Cebu City and bring water in via pipeline. According to Fr.
van Engelen (2010) the concept is sound and the cost is reasonable, but the offer has been
rejected by the MCWD for political reasons.

65
On March 21, 2007 MCWD General Manager Armando Paredes reported that
after nearly a decade of wrangling, the PhP 2 - billion (over $46 million) project
spearheaded by the privately held Manila Water Company (Ayala subsidiary) was
officially dead (Delco and Magalso 2007). Barangay Buhisan is in an interesting situation
because the upland district with the dam and large reservoir is not served by the MCWD.
Instead, the dam's transmission line passes through Buhisan on its way to the treatment
plant at Tisa. The engineers explained that the line cannot be tapped because it would
deliver raw surface water. A treatment plant would be required in order to service these
western portions of Cebu City.
The MCWD has never built a treatment plant further up line that could service
Buhisan because the return on investment was not determined to be acceptable. This
situation is unlikely to be remedied in the near future. As a result, even though residents
would like MCWD’s service, the MCWD has not responded to them. Recently, the
MCWD has begun a study of a pipeline connection from barangay Labangon back up to
barangay Buhisan. Buhisan and Toong are mountain barangays with increasingly rugged
terrain heading north and west. They are also low income barangays. This combination
does not make them prime candidates for MCWD infrastructure investment. In figure 6.1
below Buhisan is located at the left side next to barangay Toong, Labangon is located
south-east of Buhisan.

66
Figure 6.1 Cebu City Area, selected points of interest highlighted.
As of 2010 no connection exists and none is under construction. According to Mr.
Delco (2007) the MCWD has set an ambitious goal of providing 70% coverage by 2012,
but based on the results of the 2010 Water Survey this goal is unrealistic and will not be
met. The only new areas being brought on-line are small upscale housing developments.
Many areas (especially low income) remain unconnected.
There are 500 water districts in the Philippines and since the Manila privatization
in 1997 some in the national congress are pushing for more privatization. The MCWD is
considered to be a very large provider and the Cebu City water district is in the top 10
nationally. Mr. Delco claims that the MCWD is a healthy service provider and that
although he has heard rumors about privatization, in his opinion it is not something that
should be pursued in Cebu. In support of Mr. Delco’s position on privatization, Mr.
Magalso cited the Maynilad Water Corp. which has the concession for western Manila
including Makati and is plagued by poor service and currently losing over 60% of its
supply to theft and leakage. The Manila Water Corp. which has the concession in the
67
eastern half of Manila has a better service record and reduced losses from 50% in 1997 to
about 40% in 2007. Unlike the contentious situation in Manila, the engineers agree that
most residents of Cebu City are satisfied with the MCWD’s service (Delco and Magalso
2007).
Privatization of a municipal supplier such as the MCWD is an undeniably loaded
term that has polarized the supporters on each side of the paradigm. Trust often suffers in
such an environment. The 1997 event in the Manila-Quezon City agglomeration seems to
have done little to settle the issue, even within the Philippines. But it may be though that
mere contemplation of privatization spurs a reluctant municipal body dealing with a
difficult situation into decisive action.
As occurred in Manila, people may rejoice initially when services improve. But
when the time comes for the investors to begin recouping their investment, rates go up;
service sometimes suffers as was the case in Manila with Maynilad (the private
concessionaire managing the western half of the metro area) and an exasperated public
often has little recourse. In Manila the 14 year experiment has evolved into two very
different outcomes. The Ayala subsidiary, Manila Water has performed well by all
accounts in its eastern metro concession. In the western zone, Maynilad has faced heavy
criticism for its poor performance (contract rates are the same in both zones). It remains
to be seen what the actual result in overall access to safe and adequate drinking water is.
It is also unclear what the true nature of the relationships being formed is.
Undoubtedly the prospect of a captive market and government guarantees of
return on investment (ROI) stokes the interest of multinational firms able to handle the
initial investment. In any event, establishing property rights (including water rights) in
68
riparian areas is notoriously difficult due to conditions including tidal accretion where the
land surface gradually builds up or avulsion in which a section of land is washed away. In
either event the size of a given parcel of land can be changed and at the regional or global
level, water management remains an elusive goal.
As Balm (1996) underscores, environmental hazard response (whatever the threat)
is tied to the resilience and resourcefulness of the people under threat and a higher the
standard of literacy can be a response indicator. Like Cebu, Malta has been plagued by
overpopulation relative to its resources and seawater intrusion. Unlike Cebu, Malta does
not have an agricultural hinterland. But more importantly the Maltese made the
commitment early on to invest in desalination technology and seem to be always one step
ahead of potential threats to their environment. For centuries the Japanese have also
thrived while under an array of risks and difficulties; like the Maltese they have a highly
urban society and a complex, layered response system that acts as a bulwark for this
ancient nation.
In Cebu these nascent mechanisms of resilience while not as fully developed as
those of Malta and Japan are nonetheless evidenced by the now ubiquitous water
purification enterprises. The response in Cebu, while not as coordinated as many others,
still appears to support Roger Balm’s (1996) resilience thesis. Although it may be easy to
examine environmental threats from their troublesome potential, these unsettling events
can prove to be a vehicle for creative acclimatization (Balm 1996).
In Cebu this response has come from small entrepreneurs that utilize varying
technologies to offer customers purified drinking water. This seemingly unique form of
privatization is documented in the 2010 Cebu Water Study. Table 6.3 on page 70 is a

69
comparison between the water systems of metro Manila and metro Cebu. Although the
water systems differ widely in size and source (surface / groundwater) , they do have a
few things in common including a similar price and an inability to meet demand on a 24
hour basis.

70
Table 6.3 MWSS and MCWD comparison MWSS MCWD
Jurisdiction
Metro Manila: 8 cities and 29 municipalities Metro Cebu: 3 cities and 5 municipalities
Metro Population (Year 2010) 16.5 Million 2 Million
Served Population 8 Million 450,000
Demand & Supply
Estimated water demand (Year 2000) 3,800 million liters per day (MLD) 254 million liters per day
Present water supply capacity (2010) 4,000 MLD 130 MLD
Projected increase of water demand (Year 2025)
8,000 MLD 520 MLD
Proposed increase of supply capacity through water supply projects
4,900 MLD by Year 2024 418 MLD by Year 2025
Water source Angat Dam 108 Production wells and limited surface water sources
Performance Assessment
Average hours of water availability 16 hours/day 14 hours/day
Ratio of non-revenue water 60% 38%
No. of personnel per 1000 connections 9 6—7
Estimated groundwater extraction 970,000 m3/day or 80% more than the natural recharge
234,000 m3/day or 60% more than the natural recharge
Average Price of Water (PhP/ m3) 24.43 PhP PhP 25

71
E. The rise of the Small Scale Independent Private Purified Water Providers
The newest, fastest growing and most flexible water providers are small scale
independent private purified water providers (SSIPWP). They were present in every
barangay that was visited in Cebu City during the period 2007 – 2010. They serve the
immediate neighborhood by purifying and bottling tap water that is already brackish and
/or bacteriologically unsafe. They rely largely on multi-stage systems that often include
UV or ozone and carbon block stages to supplement reverse osmosis (RO) technology.
Studies have shown that these small private ventures can help fill the demand for
water in areas or for segments of the populace that the municipal suppliers cannot
adequately serve. Indications are that a high percentage of the Asian urban poor still do
not have access to water and sanitation services from water utilities. As of 2001, less than
50% of Asia’s urban population had access to a water utility connection. In Metro Cebu it
is less than 40% (World Bank 2006).
Some local officials and citizen advocate groups are suspicious of large municipal
privatization efforts. They are concerned that when such large amounts of money are
involved that service, quality and access issues will be relegated to an afterthought.
Contrary to that model, Cebu is one of several Asian mid-sized cities where small, private
water providers thrive (World Bank 2006). But in Cebu these providers have taken small
scale to a new level as they are overwhelmingly mom and pop operations. The private
purification operations in some cases were financially staked by relative’s remittances
from abroad. The 16-21 stage RO systems cost between $4,000 and $5,000. No
statistical data exists on their water source, but it is known that some are relying on
private wells while others are connected to the MCWD (Walag 2007).

72
The SSIPWP’s in Cebu are not network providers supplying areas that a
municipal provider cannot reach with unfiltered water. In Cebu the SSIPWP’s distribute
purified water in containers from a single cup (or baggie) up to 5 gallon refillable
containers. In the last three years hundreds have cropped up throughout the city as its
water supply continued to degrade and the MCWD did not respond to the degradation of
its water quality. The MCWD has focused on improving its system recovery rate (loss)
and upgrading metering devices to reduce losses. It also moved into a first class new
office building downtown.
Daniel Bennett, an economics professor at Brown University, argues that
providing affordable drinking water in Cebu has led to increased disease because
sanitation has not been addressed and is therefore taken for granted, resulting in
outbreaks (Bennett 2007). As will be discussed later though, the results of the 2010 Water
Survey do not support Mr. Bennett’s conclusions. According to the ADB, cheap water
also promotes waste and still does not guarantee the impoverished access. To combat the
vulnerable from being cut-off or left out, they recommend water utilities develop
“innovative pricing” to match consumers with their ability to pay (World Bank 2006).
The USCWRC in Cebu issued a press release on October 27, 2004 citing that
“excessive water extraction, too much infrastructure construction and wanton
encroachment of human settlements in areas designated as watersheds ravaged coastal
aquifers” (USCWRC 2004). On February 9, 2006 the USCWRC declared that “The
condition of Cebu’s water supply is very critical. The groundwater is pumped from
aquifers which are in hydraulic contact with the ocean… this means a considerable
deterioration of groundwater quality” (University of San Carlos 2006).

73
In recent years the MCWD has focused on improving its finances through better
revenue collection and adding new service connections. New service connections
increased by nearly 6,000 from 2006 to 2007 and the system recovery rate (SRR) which
is the percentage of water produced that is paid for, increased from 61% to 72% from
1999 to 2007 (and is up nearly 20% since 1988). Tables 6.4 – 6.6 on the following pages
are quite revealing. They illustrate the growth in service connections and the rising SRR.
But water production hasn’t budged since the Mananga infiltration project came
on-line. This is in no doubt due to the fact that despite the additional pumping wells, the
Carcar aquifer has reached maximum production. As mentioned previously, the MCWD
still runs out of water on a nightly basis. This situation also results in false meter readings
due to the pressure fluctuations and resultant complaints. This is clear evidence that Dr.
Fe Walag and the USCWRC’s assumptions and recommendations regarding the limits of
the Carcar aquifer are indeed factual and should be heeded. The results of the 2010 Cebu
Water Survey also confirm these suppositions and will be explored in the following
chapters.

74
Table 6.4 New Service Connections: MCWD 2007
Table 6.5 Water Volume Produced and Sold: MCWD 2007
0
2000
4000
6000
8000
10000
12000
2000 2001 2002 2003 2004 2005 2006 2007
Inst
alls
Year
Service Connections Installed
0
10
20
30
40
50
60
70
80
2000 2001 2002 2003 2004 2005 2006 2007Year
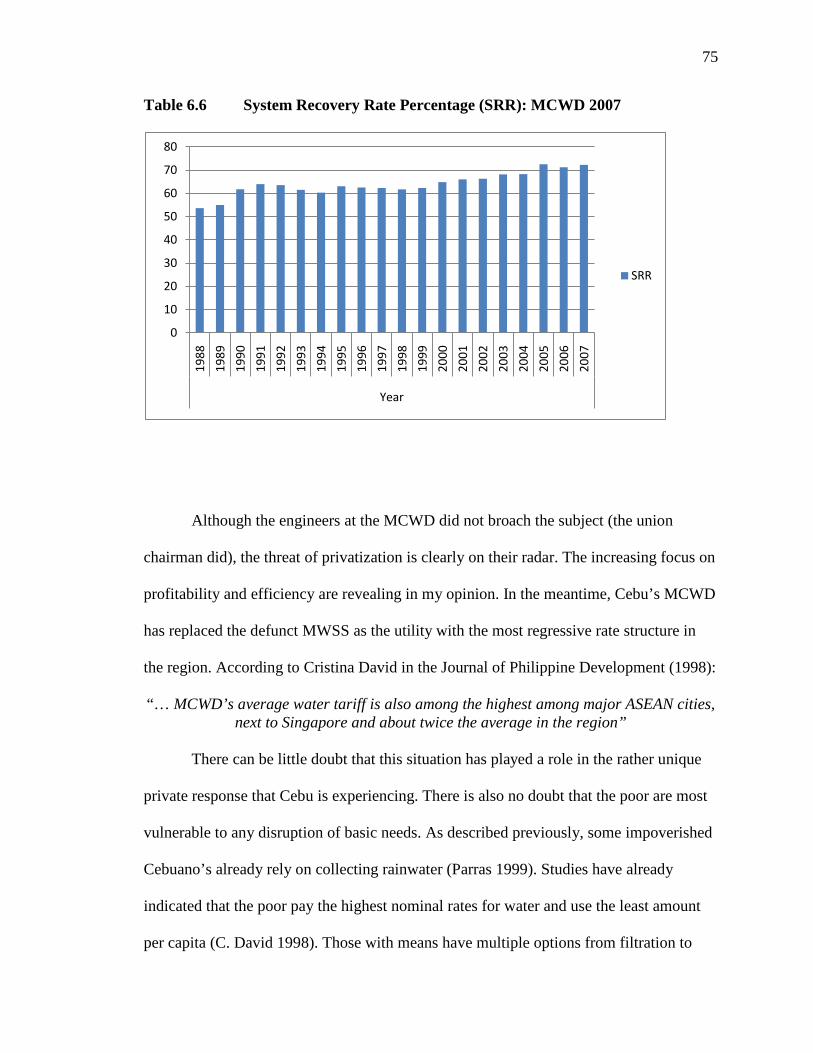
75
Table 6.6 System Recovery Rate Percentage (SRR): MCWD 2007
Although the engineers at the MCWD did not broach the subject (the union
chairman did), the threat of privatization is clearly on their radar. The increasing focus on
profitability and efficiency are revealing in my opinion. In the meantime, Cebu’s MCWD
has replaced the defunct MWSS as the utility with the most regressive rate structure in
the region. According to Cristina David in the Journal of Philippine Development (1998):
“… MCWD’s average water tariff is also among the highest among major ASEAN cities, next to Singapore and about twice the average in the region”
There can be little doubt that this situation has played a role in the rather unique
private response that Cebu is experiencing. There is also no doubt that the poor are most
vulnerable to any disruption of basic needs. As described previously, some impoverished
Cebuano’s already rely on collecting rainwater (Parras 1999). Studies have already
indicated that the poor pay the highest nominal rates for water and use the least amount
per capita (C. David 1998). Those with means have multiple options from filtration to
0
10
20
30
40
50
60
70
80
1988
1989
1990
1991
1992
1993
1994
1995
1996
1997
1998
1999
2000
2001
2002
2003
2004
2005
2006
2007
Year
SRR
76
bottled water as the main aquifer becomes saline. In locales like Cebu the extent of
poverty and the structure of the municipal providers are such that it is quite common for
the poor to be severely underserved (Conan 2002). The site visits and surveys conducted
for this study confirm Mr. Conan’s assertions.
The trend toward privatization has slowed dramatically in last several years. Risks
were underestimated and profits on paper proved harder to realize on the ground. As
Budds and McGranahan (2003) point out, the cities and locales most in need of additional
potable water are often the least attractive candidates and the regional and national trends
all show that privatization was always concentrated in wealthier and more urban locales.
Current economic conditions do not favor large investment either and the heated debate
may be moot. Many multinational companies are withdrawing from the water sector that
they so boldly entered in part due to favorable loan conditions. The new cost - benefit
analysis includes the lower returns, currency concerns and consideration of civil
resistance that can be very strong. In poor countries the “unprofitable customers,” (as
privatization calls them), have already been returned to the public domain. This is not
great either, reform is still needed, but the age old question remains as to how can
efficiency and accountability be achieved without a profit motive?
It is easy to support reform through consumers having greater control, but much
harder to offer concrete ways to get there. Many admit that bureaucratic sloth and
inefficiency are rampant in the public sector. Porto Allegre, Brazil is a fine example of
public participation that does work. It boasts a 99.5 % rate of access to quality water and
84% to sewers. All excess revenues (beyond cost) are reinvested. An innovative rising
block tariff in which low income households get 10 cubic meters of water for the price of

77
4 is also employed (Viero 2003). Given the constant struggle around water in the third
world, this model is worth consideration.
The true source of most discontent with privatization is probably tied to groups
with a political voice (not the urban poor). When subsidies are removed, economic pain
will be felt and people will respond. Even though water remains a sensitive issue in light
of the high profile failures around the world, many governments still think some form of
privatization is the best way to proceed and it will be interesting to see if large scale
privatization comes back into favor. Either way, the critical issues of water supply and
management are not going away. In fact water concerns are going to necessarily increase
as the global population and standard of living rises.

78
Chapter 7: 2007 Case Study of Cebu City’s Water
A. Study origins
Amazingly for a city in such a humid location, Cebu City appears headed for the
same fate as coastal locales in the arid Middle East. Ideally, sound management strategy
would prevail, but absent the ability to monitor private groundwater withdrawals, this is
not possible. Industrial users are already treating their water in some cases (including
neighboring Mactan Island) and others are drawing water via pipeline from deep, inland
wells (Walag 2007). One thing is certain, Cebu’s water supply rests on a precipice and
continued inaction will certainly result in the irreversible loss of the aquifer (David
1998). Since it is not surprising in this day and age that saltwater intrusion is an
omnipresent threat to the coastal freshwater supply, one might reasonably expect sound
management strategies in major urban coastal outposts. Because as Metropolitan Cebu is
discovering, intrusion can be surprisingly rapid.
But how did this situation arise? What are the health risks and who bears them in
the current situation? What does the future hold for the citizens of Cebu who are all
stakeholders in this drama? This study answers many of these questions and offers
insights into those that cannot be addressed here. In Cebu the private sector is doing quite
well selling bottled water to all who can afford it, but is this really the solution? While
governments in the developing world often struggle with providing for citizens health and
safety, participatory governance offers the poor and marginalized a voice and some
negotiation. Cebu Uniting for Sustainable Water (CUSW) is actively working with civic
leaders on these issues in Cebu. CUSW is a “citizen’s initiative and a multisectoral
movement for water resources management and watershed protection” that attempts to

79
get stakeholders a chance to participate in decisions affecting their water supply. CUSW
works with 138 organizations and 23 section groups (Hafner et al.2005).
When this study was first conceptualized, it was strictly aimed at understanding
the recent acceleration of the brackish interface into Metro Cebu’s groundwater and
mapping suspected areas of over-pumping. As the study developed however, it became
apparent that a human dimension to the prescient issue of aquifer management was
required. This linkage will contribute to both bodies of work and give fresh insight into
the difficulties Cebuano’s are facing. The Carcar aquifer was once a richly productive
treasure that offered a bountiful yield to the city above it. But what began with saltwater
intrusion around 30 years ago has metastasized into a menace that has overwhelmed the
MCWD’s ability to respond. In its place the private sector has nimbly moved in to meet
the needs of most, but this informal hodgepodge of private business may not be in
position to ensure the safe water for the nearly two million people in the Cebu
Metropolitan Area who need it.
While sodium is necessary for our bodies to maintain the balance of fluids, too
much sodium has many adverse effects. Amounts vary by person, but high blood pressure
and kidney problems are well known negative effects of excess sodium in our diets and
Cebu City has epidemic problems with both ailments (Walag 2007). This study is focused
on understanding the recent acceleration of the brackish interface into Metro Cebu’s
groundwater, the private response to it and public attitudes towards the various principles
involved in this saga. There is little doubt that major commercial and industrial interests
will continue to get (and treat) the water they require, but meanwhile most residents that
were surveyed are relying on the small, privately owned water purifying operations that
80
have blossomed throughout the metropolitan area. At the same time, the legions for
whom bottled water is an unreachable luxury are left collecting rainwater to drink or
risking their health drinking from wells or the public supply.
This research contributes to the growing body of work on groundwater pumping
optimization in saltwater-intruded coastal areas and sheds light on an apparently unique
form of privatization. Contrary to the well known major municipal privatizations of the
last two decades, the existing utility in Cebu has not been systematically de-funded in
order to justify a contract with a private vendor. Here the city’s entrepreneurs have
bypassed the municipal provider on their own initiative. I think it is important that serious
attention be focused on this local adaptation to the ever present urban dilemma of
providing for safe and sufficient water.
During two recent visits in 2007 and 2010, nearly two months were spent
documenting the situation in Cebu, conducting interviews, sampling the water, and
meeting with officials from the Philippine Department of Environmental Resources
(DENR), The University of San Carlos Water Resources Department (USCWRC) and the
Metropolitan Cebu Water Department (MCWD), residents, business owners, and other
civic leaders.
The thread running through Cebu’s water situation is that of a serious problem
with major long term ramifications for the city and region that is not being managed
aggressively by the government. Inaction at the city and regional level has left a void that
is being filled by the private sector. This is not how the third world privatization schemes
typically take place. There are apparently no major international institutions and investors
here driving this, just an ineffectual municipal body and a populace that is bypassing it
81
for health and safety reasons. History will decide if what is happening so quickly in Cebu
foreshadows a paradigm shift or is just a historical curiosity. But it is undeniable that
right now Cebu City has become dubiously distinct due to the inaction of its municipal
water department in the face of a tragic fouling of its primary water resource, the Carcar
aquifer. The charts in figures 7.1 and 7.2 were published by the USCWRC and illustrate
the gravity of Cebu’s water woes. As of now, Cebu is at maximum production from the
Carcar aquifer and the other sources in the metro area are not nearly as large. Currently,
the Carcar aquifer is producing 42.6 million m3/ year (11.2 billion gallons) while demand
is 79.9 million m3/ year (21.1 billion gallons). The Buhisan Dam and Mananga River
impoundment provide an additional 10 million m3/ year, but the total is still about 25
million m3/ year short. This is the reason water runs out every evening. The beach resorts
on neighboring Mactan Island are already desalinating water to meet their needs. The
2020 projection is sobering; demand in Cebu is expected to reach 107.8 million m3/ year
with the only increase in supply coming from wells south of the metro area which are
expected to provide 14.6 million m3 / year and a projected near quadrupling of Mactan’s
desalination capacity from 2.2 to 8.6 million m3 / year.
If these figures are accurate, capacity will increase by 23.2 million m3/ year while
demand will rise by 28.9 million m3/ year. The water deficit will increase from 37.2
million m3/ year to 42.9 million m3/ year; which is more than double the maximum
output of the Carcar aquifer. What is left out of the charts is the possibility that
production from the overstressed aquifer will simply collapse due to the over-pumping
and contamination. It is that scenario that keeps Dr. Fe Walag (2007) of the USCWRC up
at night.

82
Figure 7.1 Metro Cebu water supply and demand 2010

83
Figure 7.2 Metro Cebu projected water supply and demand 2020
84
In “The Aid Trap”, Glenn Hubbard and William Duggan describe the often
disappointing results of large international aid projects that are often contacted with large
multinational firms. They compare this with better results obtained through microfinance
efforts in the third world and propose reforms aligned with observed success (Hubbard
and Duggan 2009). The Philadelphia Global Water Initiative (PGWI) fits this model of
small targeted success. Tony Bartolomeo is CEO of Pennoni Associates, a civil
engineering company that is involved with major infrastructure projects around the globe.
He is also a founding member of the PGWI which issued a statement on water issues, as
follows:
“The Philadelphia Global Water Initiative is a group of interested organizations and individuals committed to helping to meet the UN Millennium Development Goals for water/sanitation throughout the world. It includes the University of Pennsylvania, Philadelphia Water Department, Water for People, Aqua America, Pennoni Associates, US Environmental Protection Agency, Uhl, Baron, Rana and Associates, the United Nations Association – Greater Philadelphia Chapter, and Meta Quality of Life Improvement Foundation. It has over 160 members and is always interested in welcoming more.” (PGWI 2008)
In an interview on December 10, 2008 Mr. Bartolomeo discussed water supply
issues in the third world and PGWI’s efforts to develop self-managed water supplies at
selected locations. PGWI is currently working on projects on three continents and has a
good track record of working with small communities to develop sustainable water
supplies and then turning over control to local organizations once the technical and
engineering work is complete. This approach is at odds with NGO sponsored
privatization efforts that are often focused on major utilities and large capital
investments. Although in Cebu the water providers would seem to have a lot in common
with PGWI and the microfinance model described by Hubbard and Duggan (2009), the

85
situation is unique in the fact that the small providers are all privately financed “for
profit” ventures.
It was determined that the private purifiers should be investigated as well after
noticing their explosive growth during visits between 2003 and 2005. A site visit was
made to Cebu in July 2007 to collect data, institutional information, and to investigate the
saltwater intrusion and local coping strategies. The site visit revealed that only a small
percentage of people admitted to drinking tap water, though many used it to cook with
and most relied on it for wash water.
The Honorable Arsenio C. Pacana, City Counselor of Cebu City, was instrumental
is gaining access to the MCWD’s downtown headquarters. Mr. Pacana is passionate
about securing safe and sufficient water for his constituents. His letter to Mr. Saul
Monticello, Chairman of the MCWD requesting him to provide me with any and all
assistance resulted in a series of meetings. MCWD Secretary Anna Marie Trasmonte
scheduled meetings with Benji Alonso Gabriel from the strategic planning department.
Mr. Gabriel was very helpful in describing the MCWD’s scope and basic mission. Mr.
Gabriel also set up follow-up appointments with the MCWD’s operational management
team.
B. The role of the MCWD
Additional appointments were set with Engineer Ernie Delco, the MCWD’s
Assistant General Manager for Operations, and Engineer Ronnel Magalso, the Officer in
Charge (OIC) of the Environment and Natural Resources Division at the MCWD’s main
office in downtown Cebu on July 23, 2007. The engineers advised that the MCWD’s

86
service area includes all of Cebu City, the northern suburbs of Liloan and Consolacion,
and the southern suburbs of Talisay and Compostella, and most of Mactan Island. The
Carcar aquifer is a naturally productive water body devoid of solution channels and large
cracks. The MCWD’s current plans (2007) included carefully searching for locations for
additional wells to be drilled into the Carcar aquifer (Delco and Magalso 2007).
In Cebu plans have been to discussed for several years to add 50,000 m3 / day to
the current supply. This is to be accomplished by additional wells and surface water.
Wells are usually preferred because groundwater is cheap compared to dams, but with the
Carcar already overstressed, this is not advisable. There are many private companies now
trying to access parts of the MCWD’s service area concession. The Ayala Water Co. has
a small distribution system and a case in The Philippine court system currently. The
Ayala Corporation's deal with the city of Carmen. Cebu is also being price challenged
(Van Engelen 2010).
Cebu City Mayor Thomas Osmena was opposed to reimbursing Ayala for its
expenses to study Cebu’s water supply. In 2007 Ayala Corporation was still seeking
$40,000 for its initial investment and was offering to sell the MCWD water in the 20-25
peso/m3 range (Van Engelen 2010). The MCWD’s position is that there should be some
reimbursement to level the playing field because smaller companies are coming in to bid
after all of the engineering work and studies have been done without having concerns
about recouping this investment and thus can underbid a company that is willing to make
the investment in time and money in locating these additional water supply sources
(Delco and Magalso 2007). Cebu is blessed with a fine productive aquifer of fractured
limestone. Japan’s International Corporation Agency has recently donated 2.5 million

87
pesos (about 50 thousand dollars at the current exchange rate) for water supply studies in
Cebu (Delco and Magalso 2007).
Important metrics that the MCWD is concerned with are gross and niche demand.
The niche demand consists of people and business that would want to be connected to the
MCWD, but are in areas without available connections. This is approximately 25% of
the population. The MCWD considers it its mission to service these people eventually. In
terms of demand vs. population, 40% of the people in Cebu are served by the MCWD,
but the addition of industrial users raises the MCWD’s share to about 50%. Interestingly,
the Coca Cola Co. of the Philippines requested 12,000 m3/day from the MCWD. Coca
Cola subsequently separated their operations from the San Miguel company and joined
the MCWD’s network (Delco and Magalso 2007).
The MCWD provides 60 meters of pressure above sea level. Water pressure is
only a problem in elevated barangays of the service area such as Tisa, Lahug, Banilad
and Guadalupe. In these higher elevations of the city, the MCWD relies on booster
pumps to extend its network. But even with the pumps, upland areas are plagued with
pressure problems (Delco 2007). Around 2003 independent bottlers began cropping up all
over the city. The percentage of residents using them was not known by the MCWD.
With regards to the lack of water pressure at night, the MCWD indicated that there was
no need for 40 psi at night and that 8-10 psi should suffice. The agency lowers the
pressure deliberately to refill their tanks and for system maintenance. One of the main
tasks of the MCWD is reducing losses due to theft and leakage. Losses were estimated at
50% in 1988 and were reduced to 28% by 2007 (Delco and Magalso 2007).

88
Based on their (MCWD) data, the 50 ppm salt water line had reached 4 km inland
as far as barangay Guadalupe by the year 2000. This water is still considered fresh by the
MCWD and is only treated for sanitary reasons with chlorine. (Note that tests by the
USCWRC in 2000 and those conducted for this study in 2010 show much greater
intrusion). The MCWD is in agreement with Dr. Walag and the USCWRC that there is
no way to discern the up-coning intrusion from the lateral movement of the salt water
line, but the agency differs with respect to the movement of the saltwater / freshwater
interface. The MCWD’s records from its monthly observations at its barangay Guadalupe
well field show no additional intrusion since 1988. According to the MCWD, ambient
levels are really the same. The average depth of the MCWD’s wells is 70 meters and the
base of the Carcar limestone formation is estimated to be approximately 200 meters from
the surface. The MCWD’s data shows that that the salt water line is stable in the wells of
this field. This again is in stark contrast to records from the USCWRC and tests
conducted for this study in 2010. The MCWD does admit that it is dealing with saltwater
intrusion of its wells on Mactan Island (Delco and Magalso 2007).
The salinity maps that were obtained from the USCWRC do not agree with the
information provided by the MCWD’s engineers. These maps clearly indicate the
saltwater line moving sharply inland with accelerating speed (Walag 2007). The
observations made in 2010 correspond with the USCWRC data. In response the MCWD
advised that it was working on its own updated salinity maps and planned to publish them
in 2008 (Delco and Magalso 2007). This was inquired about in 2010 and according to the
MCWD’ s Victor Chiong (2010) no such maps have been published by the MCWD.
89
All other groundwater withdraws are supposed to be reported, but few businesses
or residential users comply, and many illegal pumping stations are in operation as well.
The Philippine National Water Resources Board (NWRB) still has no office in Cebu
despite the fact that it is the second biggest city in the nation. It is the MCWD’s position
that managing groundwater supplies depend on government regulation of the private
sector (Delco and Magalso 2007). It is estimated that private wells match the MCWD’s
groundwater withdraws. It is impossible to know due to the lack of reporting in Cebu
(Delco and Magalso 2007). Under these circumstances one would think that the city
would require (and enforce) some kind of annual report on private groundwater
withdrawals.
The MCWD has become much more efficient in recent years. In 2003 the
MCWD's averaged about 350 new household connections a month. But they were
determined to increase this number to better meet the demand created by Cebu’s rapid
growth. The MCWD made three important changes to their business model in 2004: they
simplified application requirements, reduced down payments, and opened up areas that
had been off-limits to new customers. The effects were dramatic as connections soared to
1,500 per month. This was accomplished without increasing manpower. The MCWD also
added more wells in Talamban and Mandaue which generate 1,320,860 gallons of water
daily. In 2006 they increased output at their Jaclupan facility from 5,283,441 gallons /
day to 7,925,161 gallons / day by correcting technical problems that had plagued
operations there. The result was that water sales increased 12% while production
increased 5%. The MCWD measures efficiency through its Systems’ Recovery Rate
(SRR). In 2003 the SRR was approximately 64%; by 2007 it had reached 71%. This

90
achievement did not simply come from cutting costs, but also from generating additional
volume of approximately 10 million m³ of water annually (Delco and Magalso 2007).
The MCWD reports that on Mactan Island only three of its 108 wells are saline
and only two have been abandoned (Delco and Magalso 2007). This also does not
correspond to measurements taken by the USCWRC (Walag 2007). The MCWD states
that no injection wells have been employed and none are contemplated. Engineer
Magalso (2007) did confirm what was witnessed in the field, that many residents whose
wells are brackish use this water for washing and sanitary systems.
The MCWD’s Mananga Phase I Facility is located along the Mananga River in
the mountains southwest of the city. The facility contains a diversion weir and a
sedimentation and infiltration basin. The production facility is actually a well field
located adjacent to the Mananga River surface impoundment. According to the MCWD’s
engineers, classifying this water supply is tricky because by design, the groundwater that
is being pumped has infiltrated from the river. Instead of a dam on the river, a separate
surface water impoundment structure was built. Since this water is not impounded in a
surface reservoir it is included with the groundwater tally. It is important to understand
given the lofty production increases noted above that during the dry season, when some
streams stop flowing, production can be reduced by over 66% (Delco and Magalso 2007).
Large portions of the Philippines experienced drought conditions during the 2007
rainy season and again in 2010. The capital region was especially hard hit in 2007 and
water rationing took place in Manila and Cebu. The worst drought on record for Cebu
was in 1997 during the El Nino phenomenon which lasted 8 months. In 2005 the island
also experienced a minor drought. In these situations the cause is usually that the low

91
pressure system that sets up over the Philippines in the rainy season is pushed further
south and often centers itself on Mindanao, leaving areas to the north such as Cebu and
Manila dry or with insufficient rainfall. Although many people in the area believe that
droughts are becoming more common, according to Dr. Walag (2007) the reality is that
the increased population and corresponding demand for water have made every drought a
major inconvenience for residents.
C. First look at Cebu’s SSIPWP’s
A look at the streetscape of Cebu reveals that the Small Scale Independent Private
(Purified) Water Providers are a major presence throughout the metro area. In addition to
the ubiquitous SSIPWP operation signs, individuals hawking purified water in small bags
or bottles are a common sight on city streets. Field research was also done in Cebu
beginning in 2007 to document the SSIPWP’s. Field observations indicated that many
such operations were home based owner-operator set-ups and that it is not uncommon for
multiple operations to be located on a single street. Peso 1-5 automated purified
dispensers can also be found as well as vendors plying the busy streets carrying 20 ml
bottles of purified water.
One unique variety is ATM water (Alkaline Tubig Machine), a brand that
advertises itself as health water. After filtration, the equipment adds colloidal silver
which is antibacterial, potassium and magnesium. The finished water product has a pH of
8.5 which is claimed to bebeneficial for all manner of health problems. Both Cebu City
locations were out of service in July, 2007 and in January, 2010. The main office of
Solarex Water Technologies in Manila indicated that they charge a 495,000 peso

92
($11,000) franchise fee and that their product is very popular in Manila. This may be true,
but it appears to have failed to gain traction in Cebu.
There is another ATM brand that stands for “automated tubig machine”. This
ATM was one of the first SSIPWP’s in the city and appears to be thriving. They have
placed units in several barangays that dispense purified water by the cup. Aqua Serve is a
full service franchise operation that operate bottling and refilling stations. Figures 7.3 –
7.8 illustrate some of these operations in various barangays of Cebu. These providers
have continued to thrive even in the face of increasing competition.
All but two of the SSIPWP’s that were observed used reverse osmosis (RO) as
their primary filtration method. Some had carbon block units on the front end and various
sediment filters as well. The two that did not use RO relied on distillation as the primary
filtration method. Without exception, restaurants provide filtered water and ice. The
residence for my site visit was on Tres de Abril Street in barangay Labangon. This
household also relied on 5 gallon purified water dispensers from the Pure Drops
company, a local bottler. The household only used tap water (which was from the
MCWD) for washing. The photographs in figures 7.3 through 7.8 on the following pages
illustrate a few of these facilities. Most suppliers advertise “free delivery” which can
come via various methods as illustrated in figures 7.9 and 7.10 on page 96.
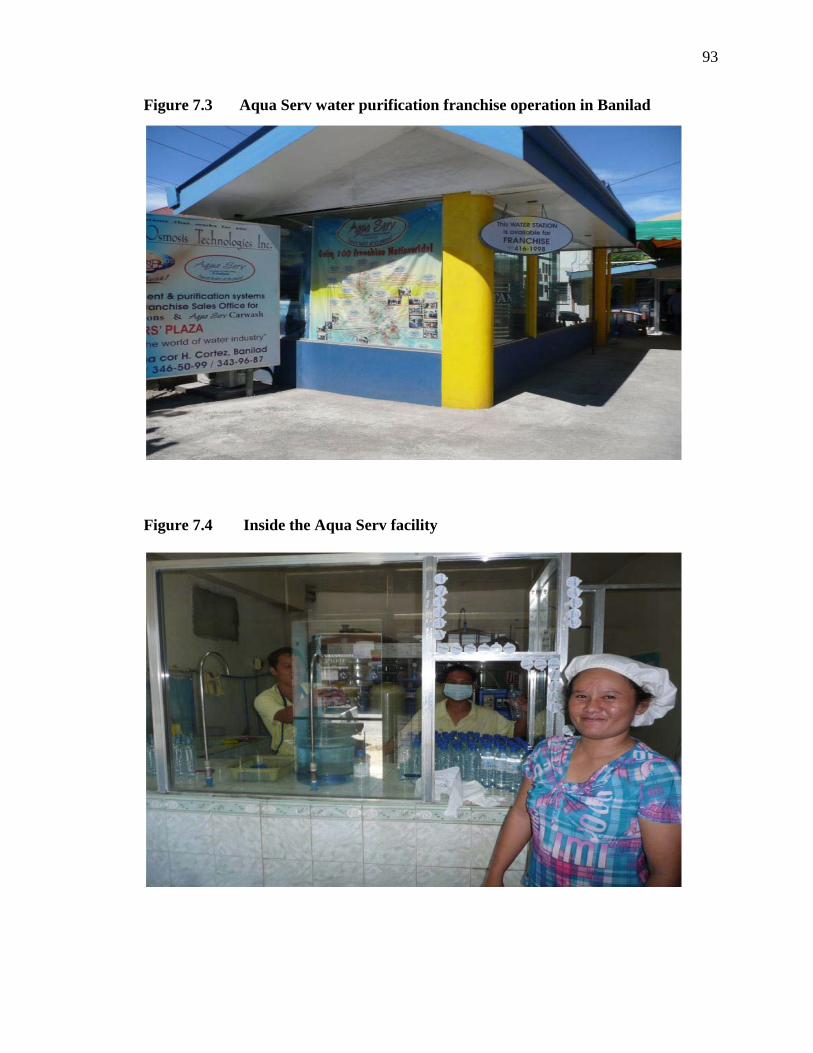
93
Figure 7.3 Aqua Serv water purification franchise operation in Banilad
Figure 7.4 Inside the Aqua Serv facility

94
Figure 7.5 ATM “automatic tubig machine” water dispenser and Agua Pura purified water operation in barangay Labangon
Figure 7.6 MNI water purification company in barangay Busay

95
Figure 7.7 Inside MNI water purification facility
Figure 7.8 iPURE water purification company in barangay Punta Princesa

96
Figure 7.9 Water delivery via bicycle cart in barangay Mambaling
Figure 7.10 Water delivery via motorcycle cart in barangay Labangon

97
Personal interviews indicate that many of these startups have been assisted by
“balikbayan” remittances from Filipinos working abroad. In any event, a major shift has
occurred in a relatively brief amount of time. Today the vast majority of the city’s
residents rely on purified drinking water where only a few years ago bottled water was
consumed largely by tourists. Today the urban poor are the only identifiable group not
relying on purified water for drinking purposes, although there were some signs of
residents of the slums near the ancient Carbon marketplace that appeared to be using old,
well worn 5 gallon containers.
D. The role of the USCWRC
Meetings with the University of San Carlos Water Resources Department
(USCWRC) staff took place on a daily basis in 2007 to look at records and collect data.
USCWRC staff members Malou Pialago and Juana de la Cruz were particularly helpful
during these sessions. Meetings with Engineer and Dr. Fe Walag (assistant director) of
the USCWRC who is also the local hydrologist were also conducted. In 2004 she began
working with Dr. Gero Hillmer from the Technical University of Hamburg (Germany) on
updating the geologic maps of the Carcar aquifer which date back to oil and mineral
explorations in 1951. According to Dr. Walag (2007) they have been conducting field
inspections with the goal of getting a good measurement on the interface between the
Carcar’s limestone formation and the inland formations surrounding it.
Questions were raised with Dr. Walag concerning issues such as how the
USCWRC worked with the MCWD on Cebu City’s water issues, what their mission was
and how might the metropolis be able to meet its future water needs given its existing
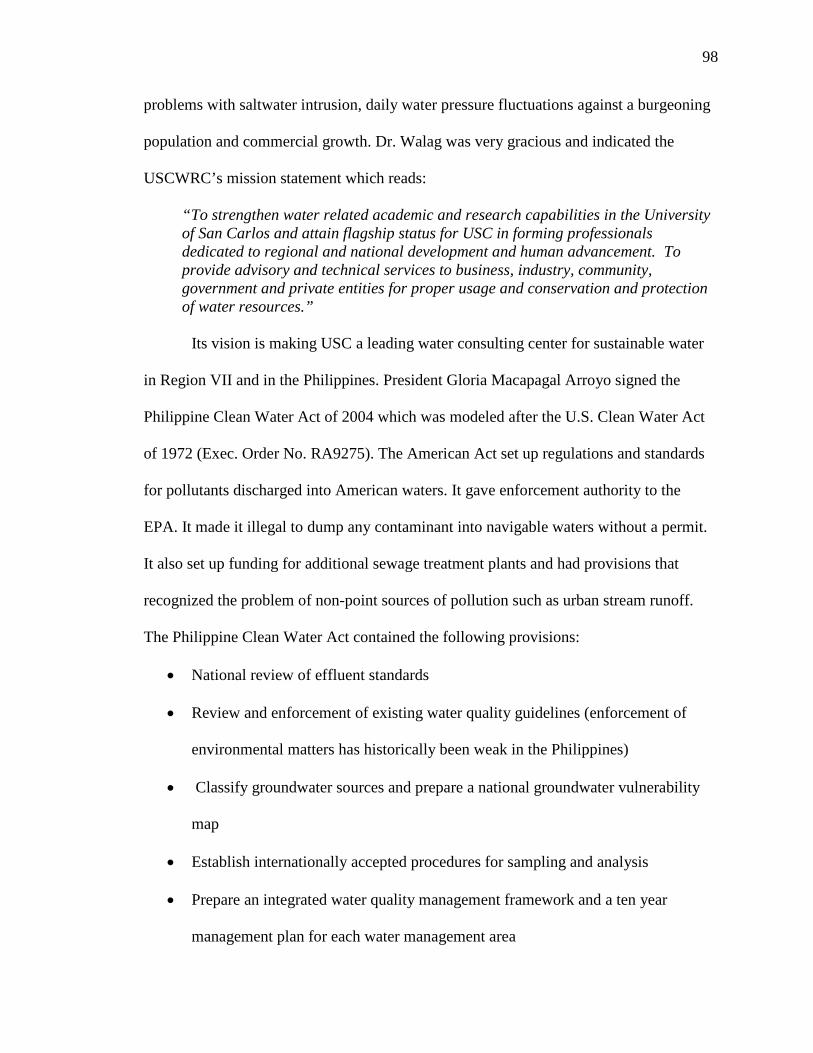
98
problems with saltwater intrusion, daily water pressure fluctuations against a burgeoning
population and commercial growth. Dr. Walag was very gracious and indicated the
USCWRC’s mission statement which reads:
“To strengthen water related academic and research capabilities in the University of San Carlos and attain flagship status for USC in forming professionals dedicated to regional and national development and human advancement. To provide advisory and technical services to business, industry, community, government and private entities for proper usage and conservation and protection of water resources.”
Its vision is making USC a leading water consulting center for sustainable water
in Region VII and in the Philippines. President Gloria Macapagal Arroyo signed the
Philippine Clean Water Act of 2004 which was modeled after the U.S. Clean Water Act
of 1972 (Exec. Order No. RA9275). The American Act set up regulations and standards
for pollutants discharged into American waters. It gave enforcement authority to the
EPA. It made it illegal to dump any contaminant into navigable waters without a permit.
It also set up funding for additional sewage treatment plants and had provisions that
recognized the problem of non-point sources of pollution such as urban stream runoff.
The Philippine Clean Water Act contained the following provisions:
• National review of effluent standards
• Review and enforcement of existing water quality guidelines (enforcement of
environmental matters has historically been weak in the Philippines)
• Classify groundwater sources and prepare a national groundwater vulnerability
map
• Establish internationally accepted procedures for sampling and analysis
• Prepare an integrated water quality management framework and a ten year
management plan for each water management area

99
These are lofty goals and should eventually lead to a better environment in the
Philippines. Currently however, implementation and enforcement remain spotty at best.
The water problems in Cebu go beyond supply issues and saltwater intrusion. Some of
the MCWD’s major failures including prior contamination issues including e-coli that
were documented in the local Sun Star daily paper in 1998 and 1999. Waste lines run
from homes and business’ to the open canals that lead to rivers and the nearby ocean. The
major shopping malls Ayala and SM City have private sewerage systems, but for the rest
of the city the storm drain and sewer is the same canal. Larger homes have septic
systems, but this can be even worse for the water supply because they are designed to
leak. They are sold as “maintenance free” (which is impossible for a septic system) due to
the lack of regulations and enforcement (Walag 2007). Properly functioning septic
systems need to be pumped out periodically, except apparently in Cebu City where they
just leak from the bottom into the limestone aquifer.
The USC Water Resources Laboratory periodically tests the water supply for heavy
metals, e-coli, amoebic dysentery and other contaminants, but not salinity. Salinity
monitoring is handled by Father Herman van Engelen, PhD, Dr. Walag and the
USCWRC group. The University of San Carlos Water Remind project expanded its area
of selected wells for monitoring as part of the groundwater classification and ten year
management plan in 2006. It also collected samples to monitor salt water intrusion, but
never published the results. Dr. Walag (2010) stated that the project had been turned over
to the MCWD and offered no reason for this. The Water Remind project had also been
tasked with utilizing local geo-referencing data to develop its own maps and replace the
American GIS maps still in use.
100
The USCWRC concurs with the MCWD’s estimates that demand already outstrips
their available supply. Dr. Walag (2007) stated that most establishments and many
residents pump and store water so that they are not affected when the MCWD shuts off
its supply pipes each night around 10PM. Long before 10 PM, water pressure from
MCWD taps often drops precipitously. In addition to the inconvenience of the nightly
shutdown, the resulting negative water pressure within the supply lines draws in dirt and
sediment that appear when the taps are first used in the morning.
Dr. Walag (2007) indicated that although the MCWD chlorinates it water supply, she
boils it before using. The MCWD’s pipelines can often be found sitting in the waste
canals. Colon Street, the oldest street in the Philippines, is an example of this awful
situation. The often decrepit, leaky pipes thus have a direct hydraulic connection to
contamination that becomes unavoidable when the MCWD shuts of its supply line each
night, resulting in the negative pressure situation. In addition, she stated that she does not
use the water from the ubiquitous purified dealers because most use reverse osmosis
which removes nearly all of the waters’ beneficial minerals along with its contaminants.
Dr. Walag attended a water bottler conference and asked if they could return the basic
electrolytes to the purified water after removing the contaminants. The purification
equipment manufacturers had no answer and apparently were not happy about the
question (Walag 2007).
Through the efforts of Dr. Walag and Dr. van Engelen, the USCWRC joined with the
University of North Carolina, Chapel Hill on a population study investigating water
quality and infant mortality in Cebu. John Bresco, a sanitary engineer from UNC came to
Cebu to study children’s’ health from birth through age 11 in various barangays and
101
compared the health data to the water quality in the various barangays. The study titled
“The Cebu Longitudinal Health and Nutrition Survey” began in 1983 with follow-ups
through 1999. Part of the study was to correlate water sources used to feed infants with
infant diarrhea.
The field staff visited water sources in the 33 barangays that comprised the study
area. A water source form was employed to track the exact location of the source, its type
and owner. Water sources were found to be varied with 294 respondents using hand-
pumps, 185 connected to the MCWD’s lines, 119 relying on springs and other free
flowing sources, 106 using open dug wells, 63 using privately owned electric pumps and
using industrial wells. The USCWRC and the Department of Environmental Engineering
at UNC went out and got the technical information for each pump and borehole, plotted
this data and did follow up tests for pathogens for three years. As part of the survey
women were asked about the amount of water their households fetch and use per day,
their in-house facilities for the storage of drinking water, and their usual mode of excreta
disposal. The results of the study of 2,355 infants in Cebu confirmed a strong association
between water quality, household and community sanitation and diarrhea. They conclude
that diarrhea could be reduced by over 42% with improved sanitation and another 40%
with better water quality. This data was summarized in a technical article (VanDerslice
and Briscoe 1994).
The European Union and the United States rely on chemical oxygen demand (COD)
to measure water quality. In the Philippines the Department of Environmental Resources
(DENR) will not accept this internationally accepted measurement even though it is a
better indicator of pollution than the older Biological Oxygen Demand BOD test which

102
simply measures how fast organisms use up oxygen. The DENR still relies on the BOD
test in which clean rivers should show a level less than 2 ppm and 10 ppm indicates
heavy contamination. The more accurate COD test used here and in Europe directly
measures organic compounds in the water. It is expressed in mg/liter. The COD
measurements are more reliable than BOD results. This is another area in which the
USCWRC is pushing for change (Walag 2007).
The USCWRC also tests various wells throughout the city for salinity, but many are
old and of uncertain construction and depth. This situation makes it nearly impossible to
determine if the saltwater intrusion is due to upcoming or lateral intrusion although it is
believed to be a mix of both. The old records will not help either because of the poor
construction of the wells. There is a need to set up a new testing protocol if they hope to
correct for this factor and determine the rate of upconing and or lateral intrusion. The
USCWRC is actively looking for good partners to assist at least financially and perhaps
technically as well. They will certainly need to validate any new data they collect. Iron
and chloride baseline or natural values need to be established as well. This is another area
where the USCWRC differs from the MCWD. The MCWD’s data on salt water intrusion
was compiled by consultants and sets a higher standard for salinity (Delco and Magalso
2007).
Additional sources of sodium chloride would be from cooking, industrial use, and
disposal of desalinated water. Large quantities of briny wastewater may come from the
San Miguel bottling plant and major resorts which are known to employ reverse osmosis
filtration as well as the hundreds of independent bottlers located throughout the

103
metropolis. The efficiency of the sedimentary formation in trapping this excess chloride
is critical.
In addition to the desalting plants at the San Miguel and Coca Cola bottling plants,
desalting plants are currently employed in all of the major newer resorts and industrial
centers of Mactan Island. Some of the older, smaller resorts are supplied by the MCWD
(Walag 2007). It is believed that like the desalting plants at the Mandaue bottling plants,
the Mactan operations utilize brackish water and discharge their briny wastewater into the
sea. Although no monitoring currently takes place, the strong current is believed to
disperse the brine enough to avoid a precipitous rise in the salinity of the coastal waters.
A desalination plant was installed at the Tinggo reef diving center at Olango Island but
failed to work because the membrane employed was designed to process brackish water,
but Olango’s groundwater is believed to be close to that of seawater in salinity (Walag
2007).
A one year study of Olango Island’s aquifer by the USCWRC revealed that the
entire lens is heavily infiltrated now. This is no surprise to the residents who have been
relying on rainwater or bottled water imported from Cebu City. The saline groundwater
is still used in residential sanitary systems. A grant from Shell Oil has provided funding
for solar powered pumps. The USCWRC is in the process of geo-referencing the wells
now ahead of any possible future desalting plant. The proposed pipeline to Mactan could
eventually reach Olango. Olango is also a major sanctuary for migratory birds transiting
between Siberia to Australia. The project is currently on hold however due to the
MCWD’s lawsuit that will be heard by the Supreme Court of the Philippines (Van
Engelen 2010).

104
The Ayala corporation which operates the 5-story Ayala shopping mall in Lahug
has contracted with Carmen Water of Carmen Cebu (about 25 km north of Cebu City) to
run a supply pipeline to Mactan Island. Carmen Cebu is home of Natures Spring, the
largest spring water provider in the region. In addition to the free flowing spring that
Nature Spring owns, indications are that the lightly populated coastal area has an
abundant supply of quality groundwater (Van Engelen 2010). In 2007 a Philippine court
ruled in favor of Ayala. The ruling made it clear that the MCWD does not have sole
ownership of the water franchise rights on Mactan Island. Additionally, residents of Lapu
Lapu city on Mactan voted themselves independent of Cebu City in July 2007. Ayala
Corporation will now be able to negotiate directly with municipal authorities of Mactan,
but the MCWD still wants to be able to dictate the price, citing its existing infrastructure
interests. The contentious issue has become politically charged. The National Board of
Water Resources is geo- referencing wells now for the first time and is coordinating with
local authorities on getting pumping data from private companies as well. Up to now the
municipalities and water authorities have relied on good faith estimates of water
consumption from private companies (Van Engelen 2010).
The USCWRC has reached out to the MCWD to coordinate on water supply
research concerns and handles many survey projects for them currently. It helped the
MCWD establish a water usage model for its service area. The USCWRC has offered to
train MCWD personnel to handle some of the basic data collection activities, but have
been constrained because the MCWD doesn’t permit its employees to work outside of
their M-F, 8-5 shifts. The USCWRC has also offered to cover the overtime for after
hour’s activities, but according to Dr. Walag (2010) the MCWD would not budge.
105
The USCWRC’s indirect mandate is research. Some praise for former President
Marcos was actually offered because his administration put in place the first laws on
research management; his failure however, was to foresee the need for a good monitoring
system. For example, the new secretary of the DENR is the mayor of Manila who has no
environmental background (Walag 2010). This system of political appointees must
change if the Philippines is ever to get a handle on conservation of its natural resources.
Fr. van Engelen’s vision for the USCWRC has certainly come to fruition as the
USCWRC remains the only private water resource center in the Philippines. The MCWD
must build a strong relationship with them to succeed in its mission to provide adequate,
safe drinking water to the residents of its rapidly growing service area.
In 2007 Dr. Walag requested that I make a formal proposal to do a study of water
supply sources, quality and attitudes towards privatization. Her personal assistance and
resources of the USCWRC were also offered. This was to include one engineer and one
community relations officer that would assist in collecting survey data. Although such an
offer could not be accepted as this research is the foundation of this study, it was
gratifying that Dr. Walag and her staff thought that this was a worthy undertaking and
one deserving of their support and expertise.
To understand the risks Cebu’s water may pose to vulnerable populations, a
meeting was scheduled with Fr. Daniel Elemia (2007), the pastor of Our Lady of Lourdes
RC church in Punta Princesa, Cebu City. Fr. Elemia also directs the children’s feeding
program at Our Lady of Lourdes. This program began in 1994 and serves hundreds of
families in Punta Princesa and the neighboring barangays of Buhisan, Labangon and
Mambaling. He had recently returned from Lahore, Pakistan where he was tasked by the
106
church of setting up a sister program for the small but growing Catholic Church in
Lahore. Conversations with Fr. Daniel Elemia were initiated to see how these poor
families coped with the deterioration of their water supply. Although Fr. Elemia had no
data on their household water supply, he did confirm problems with the MCWD’s lack of
pressure and periodic contamination issues. In his home in barangay Mabolo he relies on
delivered purified water since a severe bout of gastroenteritis in 2006. The church and the
feeding program at Punta Princesa are connected to the MCWD, but have considered
switching over to purified water for their drinking water needs (Elemia 2007).
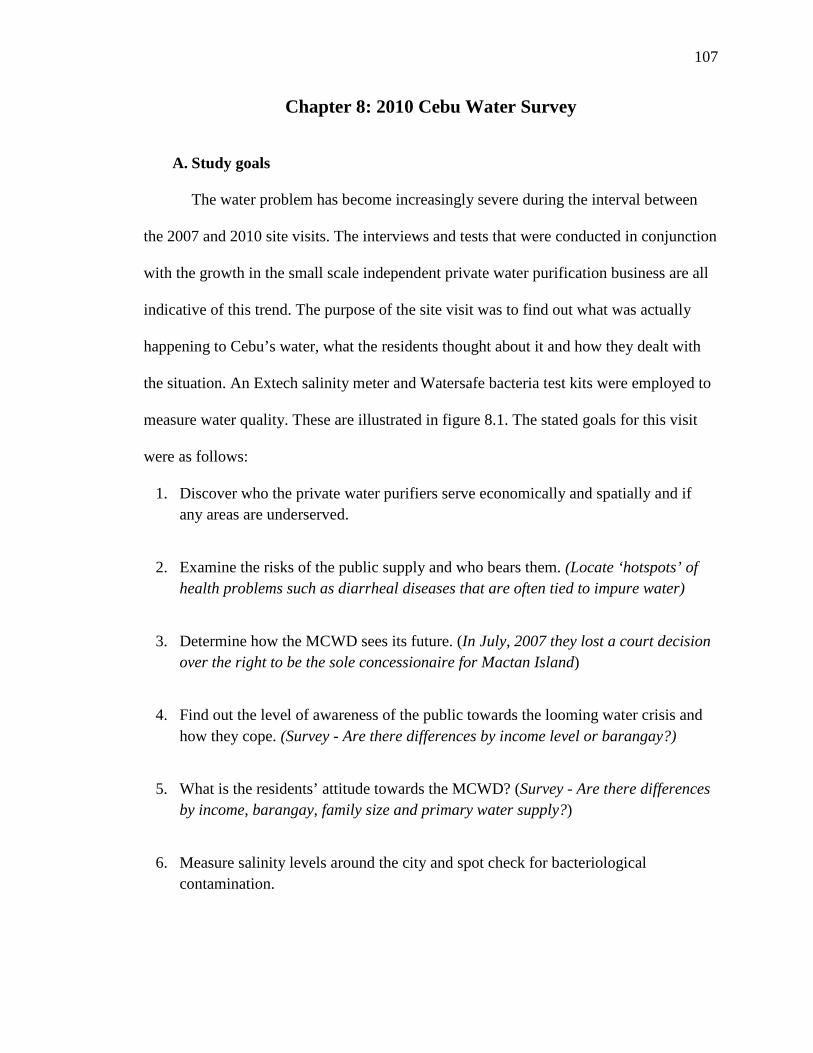
107
Chapter 8: 2010 Cebu Water Survey
A. Study goals
The water problem has become increasingly severe during the interval between
the 2007 and 2010 site visits. The interviews and tests that were conducted in conjunction
with the growth in the small scale independent private water purification business are all
indicative of this trend. The purpose of the site visit was to find out what was actually
happening to Cebu’s water, what the residents thought about it and how they dealt with
the situation. An Extech salinity meter and Watersafe bacteria test kits were employed to
measure water quality. These are illustrated in figure 8.1. The stated goals for this visit
were as follows:
1. Discover who the private water purifiers serve economically and spatially and if any areas are underserved.
2. Examine the risks of the public supply and who bears them. (Locate ‘hotspots’ of
health problems such as diarrheal diseases that are often tied to impure water)
3. Determine how the MCWD sees its future. (In July, 2007 they lost a court decision
over the right to be the sole concessionaire for Mactan Island)
4. Find out the level of awareness of the public towards the looming water crisis and
how they cope. (Survey - Are there differences by income level or barangay?)
5. What is the residents’ attitude towards the MCWD? (Survey - Are there differences
by income, barangay, family size and primary water supply?)
6. Measure salinity levels around the city and spot check for bacteriological
contamination.

108
B. Survey Tools
Figure 8.1 Testing equipment for 2010 Cebu Water Survey
The “Cebu City Household Drinking Water Survey” was designed to investigate the
study’s concerns and gain a comprehensive look at water consumption and attitudes in
Cebu City and its metro area. A sample survey form follows in figure 8.2 below:

109
Figure 8.2 Cebu City Household Drinking Water Survey Data Form
Barangay:
Respondent Name:
1. Household Information: House_________ Apt__________
Name Age Sex Relationship to head of household
Ed. Main Occupation Other
1
2
3
4
5
6
7
8
9
10
11
12
Interviewer: Date:
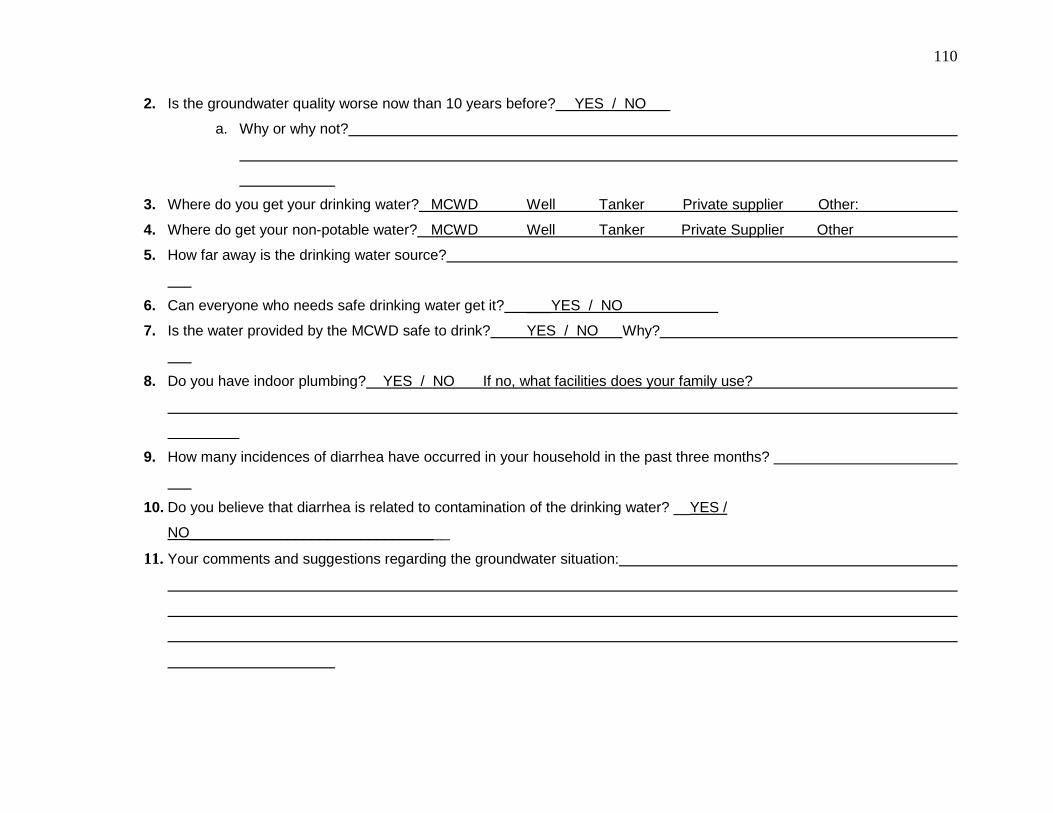
110
2. Is the groundwater quality worse now than 10 years before? YES / NO
a. Why or why not?
3. Where do you get your drinking water? MCWD Well Tanker Private supplier Other:
4. Where do get your non-potable water? MCWD Well Tanker Private Supplier Other
5. How far away is the drinking water source?
6. Can everyone who needs safe drinking water get it? ___YES / NO
7. Is the water provided by the MCWD safe to drink? YES / NO Why?
8. Do you have indoor plumbing? YES / NO If no, what facilities does your family use?
9. How many incidences of diarrhea have occurred in your household in the past three months?
10. Do you believe that diarrhea is related to contamination of the drinking water? __YES /
NO________________________________
11. Your comments and suggestions regarding the groundwater situation:

111
The survey included 153 households from 50 barangays. The results indicate that
substantial numbers in all demographic groups rely on the SSIPWP’s for their drinking
water needs at least some of the time. It also revealed that over 60% of residents with
MCWD service believe the groundwater has not deteriorated over the past ten years
while only about 41% of residents who rely on the SSIPWP’s agree. Salinity was high in
all parts of the metro area. The highest numbers were recorded in the barangays of
Mactan Island, but even at the Philippine Army’s base Camp Lapu-Lapu in barangay
Apas which is located near the outcrop of the Carcar Aquifer and is elevated several
hundred feet, well water tested at 484 ppm.
C. Selected personal interviews
Question #3 “Is the groundwater quality worse now than 10 years before?”
The most frequent complaint was that there has been an increase in population (which
is true) and in pollution. Michelle Atillo (2010) (who provided lodging in the family
home in barangay Labangon) said that the water is worse now due to a lot more houses
using deep wells and sewage also contaminating the water. They had multiple water
sources on their property which also has rental units that cater to students. One source is a
rainwater cistern that they use to water plants inside. This water tested at 22 ppm salinity.
The MCWD water at the house tested at 340 ppm. They only drink purified water and
Water Market is their current supplier, which tested at 16 ppm for salinity. They also

112
keep Natures Spring bottled water in the refrigerator and it tested at 13 ppm. The ph was
7 (this would prove to be true in all areas of the city).
Analiza Cobol (2010) of barangay Pusok, Lapu Lapu city, said that the water is worse
now “due to the increase in population, improper disposal of garbage and other
chemicals” She also remarked in the comments section of the form that “the groundwater
situation is not that safe because no proper maintenance from the government, the
pollution in our environment is getting worse”. The Cobol family’s well water tested at
927 ppm salinity. Antonio Oliver (2010) who lives nearby in barangay Ibo said that
“there are more residents in our place now” and that “the government must establish safe
drinking water for the people, especially the poor (like himself) who cannot afford to buy
bottled water”. Mr. Oliver does not have indoor plumbing and drinks water from a well
50 meters away (retrieving with pails); this water tested at 922 ppm salinity.
Willie Bryan Ybanez (2010) of barangay Labogon, Mandaue drinks bottled water
from Aqua de Oro that tested at 78 ppm. His household supply comes via Cebu City
tanker truck and tested at 525 ppm. His comments included statements that the MCWD’s
water is not safe because “lots of pipelines leak”, he also stated that the water has gotten
worse because lots of garbage and toxic materials had been thrown everywhere and most
people lack discipline to control each waste”. Mr. Ybanez is a factory worker and
believes that “government agency don’t have enough program to pursue the safety and
the importance of a clean environment. Water is life and we have to discipline ourselves
before we get contaminated”.
April Awa of Labangon has well water that tested at 467 ppm but drinks purified
water from Divine Drops that tested at 78 ppm. She said she would like to know if bottled

113
water is really pure. Sonya Tumalon of barangay Marigondon, Lapu Lapu owns “Sonya’s
Sari-Sari” store. Her family drinks CC brand purified water which was tested at 6 ppm.
The store (which is attached to the small house) has MCWD water that tested at 382 ppm.
She said the water in Lapu Lapu is salty and not clean without a purifier. She said she is
not sure if the MCWD water is safe so that is why she drinks purified water. She sells
bags (approximately 7 ounces) for 1 peso (about 2 cents) and purified water from CC
brand at 7 pesos (about 15 cents) for a 16 ounce bottle which may or may not be chilled
since her small refrigerator is also used to store eggs and other perishable foods. The
chilled MCWD water that she bags is more popular and comes from a fountain that she
owns.
Editha de la Calzada (2010) lives in Dumulog, Talisay with her family of 8 and drinks
water from their “deep well” that was tested at 464 ppm; she said the water is the same
and there are “no problems with water”. It was later determined that the term “deep
well” means tube well as opposed to an open or dug well. Josephina Macabale (2010) and
her family of barangay Tabunok switched to “mineral water” (purified water) in 2008.
They used to drink from their “deep well” but stopped two years ago because of the stains
and taste of rust. The water from their well appeared a bit cloudy and tested at 607 ppm.
Federita Labajo (2010) of Tabunok and his wife drink from their well which tested at 864
ppm. He said they feel safe and thankful to have this water that they have had for 50
years with no amount of sickness.
Mrs. Paz Quintanes (2010) of barangay Guadalupe said that the water has gotten
worse and that “you can taste and even smell the chemicals added to the water”. She also
said that the (MCWD) underground pipes must be renovated because bacteria is getting

114
in and making people sick. Her house has MCWD service that tested at 353 ppm, but
drink only purified water from Plain Drops which was tested at 16 ppm. Philip Rubi
(2010) of barangay Mabolo has MCWD service that tested at 358 ppm. He and his family
drink it, but sometimes they buy purified water from So-Fine which is a franchise
operation that Philip is familiar with. He said that prices are down by about half in the
past couple of years. Purchase receipts confirm this. Philip said that despite the intense
competition and low prices, the water purification operations are still making money. So-
Fine has its own well so they do not incur any charge for the water they draw.
Leonora Abelgas (2010) of barangay Toong believes the water has gotten worse, but
she cannot afford purified water. When it floods she sometimes boils drinking water. The
water source for most in this poor rural mountain barangay is a hose provided by the
barangay. There is no jeepney service here due to the elevation and grade. Children walk
to school and this small place is isolated in every sense. The barangay well tested at 330
ppm for salinity. In barangay Busay, which is also a poor mountain barangay, a meeting
was held with Julieta Arcayan (2010) whose home has no plumbing (it is a simple shack
of about 50 square feet at most). She has two small children ages 2 and 4, and they
usually get their water from the Buhisan river about a half a kilometer downhill. They
had no water in the house when I arrived. It is very hard for her husband to get water
from the river and climb back to their home so he only goes once a day. She said that she
believes the water is worse now and that they won’t drink from the river when it rains.
During the rains they ask homeowners in a nearby upscale new subdivision (which is not
yet completed) if they can fill a bucket from their hose. The subdivision has a private
water supply network that depends on wells.

115
The water was tested at Dina Sanchez’s (2010) residence in barangay Tisa. She
has MCWD water and a hand pump. The MCWD water had TDS 322 ppm while the well
was 483 ppm. The MCWD was negative for bacteria, but the well tested positive for
coliform bacteria. Oyang Cabrera (2010) who cares for the home states that the family
drinks purified water that is delivered by Natures Spring. The MCWD water is used for
non-potable needs and the hand pump is used to water their plants. They do not report
any problems with diarrhea. Oyang Cabrera is a resident of Tisa Hills (not far from the
MCWD’s high level reservoir which is shown in figure 8.3) who stated that when
applying for connection to the MCWD you must attend a water seminar. In the seminar
you are informed that the MCWD’s water is chlorinated and safe. The seminar also
covers billing and tips for reducing consumption. Her water test results were 377 ppm
salinity for her MCWD connection and 684 ppm salinity for her deep well that she uses
for watering her plants.
Figure 8.3 MCWD high level reservoir in barangay Tisa

116
In barangay Marigondon on Mactan Island contact was made with Melitona
Babatuan (2010) who has an open well that he uses for washing and cooking. He drinks
distilled water purchased locally. The water tested negative for bacteria but the salinity
was 896 ppm. Several other households in the area were sampled, including Jennifer
Geares (2010) whose well tested at 774 ppm salinity. Another site visit was made at the
Catholic Hermitage is barangay Elaang, Mandaue City. A meeting with Father Cef
Eleccione (2010) took place. He indicated that well water causes skin rashes and diarrhea
and that they no longer drink water from their well which was tested at 525 ppm salinity.
The hermitage buys purified water from IRAS filling station that was tested at 87 ppm.
Father Eleccione stated that most people believe that diarrhea comes from contaminated
food and it is hard to convince them otherwise. He also said that the Ayala Corporation
has recently purchased land in the watersheds surrounding Cebu, including springs in
Lahug and Lusaran. He said he has learned this from mountain farmers in the area.
D. Meetings with public officials and other parties
A series of meetings were also held with officials from various private and public
institutions to better understand the problems and possible responses. One such meeting
was held with Major Oliver Tampus (2010) of the Philippine Army at Camp Lapu-Lapu.
The base is in barangay Apas which is located in the western hills overlooking Cebu City.
He states that severe deforestation (which has been well documented to be an island-wide
problem) leads to excess runoff and the loss of the already thin, fragile soils. The result is
that it has become impossible to reforest Cebu. He was interested in having his water
tested since they rely on deep wells at the base.
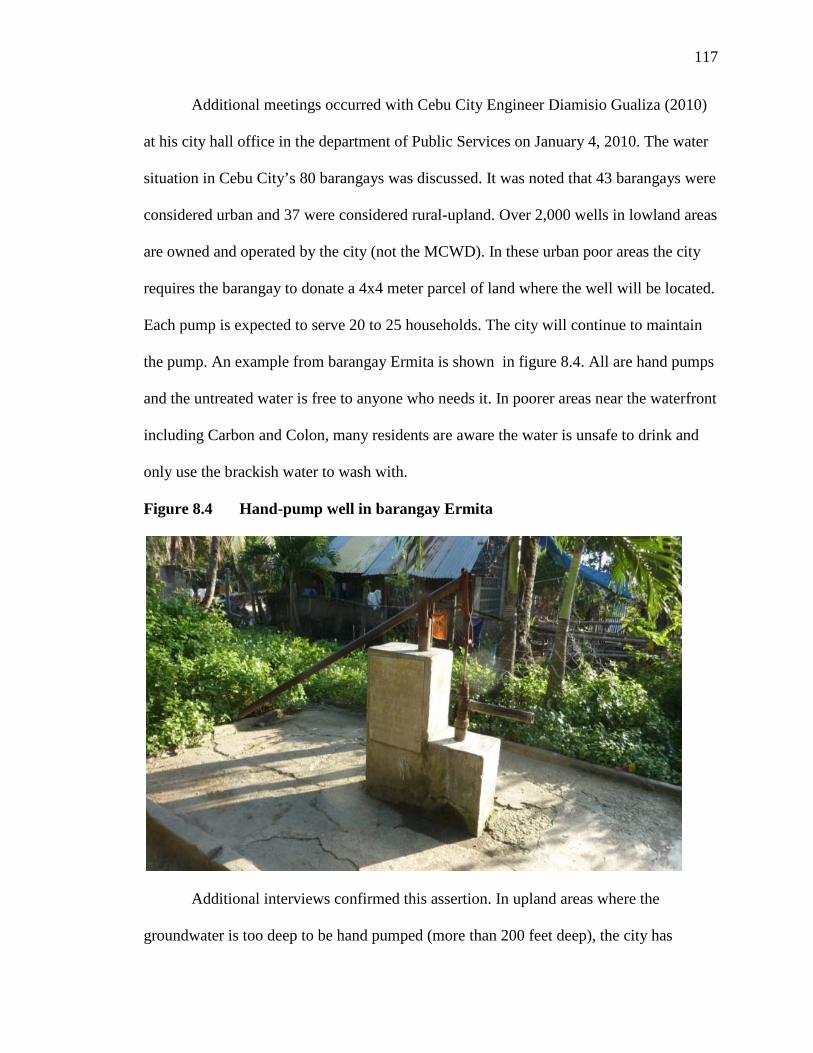
117
Additional meetings occurred with Cebu City Engineer Diamisio Gualiza (2010)
at his city hall office in the department of Public Services on January 4, 2010. The water
situation in Cebu City’s 80 barangays was discussed. It was noted that 43 barangays were
considered urban and 37 were considered rural-upland. Over 2,000 wells in lowland areas
are owned and operated by the city (not the MCWD). In these urban poor areas the city
requires the barangay to donate a 4x4 meter parcel of land where the well will be located.
Each pump is expected to serve 20 to 25 households. The city will continue to maintain
the pump. An example from barangay Ermita is shown in figure 8.4. All are hand pumps
and the untreated water is free to anyone who needs it. In poorer areas near the waterfront
including Carbon and Colon, many residents are aware the water is unsafe to drink and
only use the brackish water to wash with.
Figure 8.4 Hand-pump well in barangay Ermita
Additional interviews confirmed this assertion. In upland areas where the
groundwater is too deep to be hand pumped (more than 200 feet deep), the city has

118
developed mountain springs (artesian wells) in upland areas of the city that are not served
by the MCWD. The city water department constructs reservoirs and a limited number of
distribution outlets. There are no “house to house” connections. Instead there are
standpipes located on most blocks that serve approximately 10 families. In the upland
city water districts west of barangay Talamban rubber hose lines are employed. These
are sometimes seen hanging from trees across stream beds. They could easily mistake
them for electrical bundles from a distance.
Figure 8.5 Rubber hose network in barangay Toong
If no artesian source can be developed, the Public Service department will provide
a tanker truck that residents can bring their jugs and drums to store water in. This bulk
water is sold at 10 pesos (22 cents) per 200 L (one drum). This water is purchased from
the MCWD at a discount rate. In times of drought or flood the department provides this
water at no charge. In some cases old kerosene cans are used to store water. The MCWD

119
shares the burden of serving the poor within the city also has its own water truck that it
sends to mountain barangays. However, it sells bulk water to residents at 30 pesos (66
cents) per 200 L drum. While the MCWD charges more, it does offer service 7 days a
week (Gualiza 2010).
The most immediate threat facing the city is that its sole landfill in Pardo,
barangay Inawayan has reached capacity. It appeared to be overflowing during a site visit
which also indicated that its location is so close to the high level reservoir that it
precludes further expansion. Already garbage is being burned by residents and this adds
to the particulate pollution problem in the traffic choked city as illustrated in figure 8.6.
Figure 8.6 Cebu City’s sole landfill in barangay Inayawan
120
A meeting with the MCWD’s union chairman Victor Chiong (2010) at the
MCWD’s downtown headquarters was held on January 5, 2010. He was happy to hear
about the study that was being conducted and was particularly interested in the test
results and in learning about attitudes towards the MCWD. Concerns about the unofficial
relationship between the Ayala corporation and the MCWD and fears that they may be
working towards privatization since Ayala was one of the partners involved in the 1997
Metropolitan Manila Water and Sewerage (MWSS) privatization were raised (Chiong
2010). On a positive note, Ayala’s Manila operation has improved service levels in its
concession (while the other Manila concessionaire has not performed nearly as well).
Mr. Chiong was concerned with water quality and access and was not sure that
privatization will do anything to improve either of these areas. He also said that his
concerns about a pending deal are purely speculation and that he has no proof that any
deal is in the works. But other sources suggested that they too had heard that Ayala was
interested in the MCWD. Mr. Chiong has also come to view the USCWRC’s work as
compromised because they perform contract work for Ayala and other multinational
companies. He was quite surprised when he witnessed me test the MCWD’s water at his
office at 364 ppm salinity. He was not aware of such testing run by the MCWD, just that
they chlorinate the water and that they are generally satisfied with its quality and safety.
Comments were also made about the Lagtang and Mananga River project in
barangay Talisay near Minglanilla where the river is impounded to allow more water to
percolate into the ground, including a well field of 15 wells located around the basin; the
water is then pumped to the high level reservoir. This was an Asian Development Bank
(ADB) loan project and according to Mr. Chiong (2010), it is the first time in Asia that
121
surface water was impounded for the purpose of promoting infiltration and thus using
impoundments to augment a groundwater source. When the water is pumped to the high
level reservoir, it is mixed with water from the Buhisan reservoir and other groundwater.
The water is then chlorinated before distribution. The ADB works directly with the
national government of the Philippines and currently is undertaking a second feasibility
study on providing sewerage for Cebu. The Japanese government has funded a separate
study on people’s attitudes toward sewage treatment and waste disposal options.
Mr. Chiong (2010) is also president of the National Water Resource Workers
Union which is part of the 20 million member Public Services International Workers
Union which is active in 168 countries through 658 federations. In the Philippines there
are 489 local water districts which are part of the Philippine Association of Water
Districts (PAWD). Less than 10% (38) of which are unionized. At the national level Mr.
Chiong aims at doubling the percentage of unionized districts. He states that there is little
resistance to unionization but that most workers are not aware of their rights. At the
MCWD he is focused on relations with management and improving the MCWD’s
performance.
In addition to his duties at the MCWD and PAWD, Mr. Chiong is also a speaker
for the Public Services International Workers Union. He also has liaisons with policy
makers at the regional and national level and candidly states that unless the MCWD
improves its service and product they will not be able to fight privatization. The 2010
program is in integrated water resource management and the benchmarks are to be
coordinated with Baguio City from March 2010 through December 2010. Cebu is one of

122
five local water districts in the Philippines using ADB funding for improving labor
standards, transparency, accountability and worker participation in planning.
Many aspects of the MCWD’s operation were discussed, including the
controversial situation in Mactan where a 2007 Philippine supreme court decision
affirmed the city’s right to seek additional sources of water. The MCWD sought to treat
Mactan as part of its Cebu City concession. To supply residents of Mactan Island with
water, the MCWD buys bulk water from the Mactan Rock Corporation which treats water
via reverse osmosis. Based on the tests that were run for Mactan residents, this treatment
is either very ineffective or not operational. Mr. Chiong said that the joint operation of
the Water Remind Project with the USCWRC has been taken over by the MCWD due to
the USCWRC’s increased contract workload. At the conclusion of this meeting, he
expressed interest in the results of the water tests and interviews that were being
conducted as part of this study (Chiong 2010).
Additional surveys were made in barangay San Roque, a low income area near the
water, some of which is on reclaimed land. Drums were being filled with a hose from the
house of a person with an MCWD connection. Most people here do not have indoor
plumbing and according to a resident named June they buy water for washing and
cooking. Some including June do not drink this water; she estimates maybe half of those
who are really poor will drink it, but she does not trust it and only cooks and washes with
this water. She has a dispenser and is supplied by Nature’s Spring with drinking water.
The home of Michael Avila (2010) in barangay Guadalupe had water which
tested at 431 ppm salinity based on a well of about 130’ depth. Guadalupe is an affluent
barangay located in the southwestern hills of the city about 200’ above sea level. Mr.

123
Avila uses manganese to purify his water from bacteria and this treated well water is used
for washing and cooking. Their drinking water is supplied by SSIPWP Agua Vita. Agua
Vita’s water tested at 7 ppm for salinity.
A meeting with the director of the USCWRC, Fr. Herman van Engelen (2010)
was held on January 6, 2010. He vehemently disagrees with the MCWD that 650 ppm
can be considered safe drinking water. Father van Engelen was interested in how this
study of Cebu’s water developed. He was advised that previous visits between 2003 and
2007 showed big changes such as the SSIPWP’s cropping up all over the city and a
decision to proceed further was made. In its advisory role, the USCWRC has come out
against drilling new wells into the already strained Carcar aquifer. About 100 new
pumping wells were added by the MCWD since 2007, including the one illustrated in
figure 8.7 which is adjacent to the University’s Talamban campus.
Figure 8.7 MCWD pumping well in barangay Talamban

124
Father van Engelen (2010) recounted how the city originally asked the German
Kampsax-Kruger Lahmeyer International (KKLI) in the early 1980’s to study the
Luzaran river basin. The plan to tap into the Luzaran was never implemented and instead
the city kept drilling new wells in spite of the recommendation by KKLI that the Carcar
was already stressed and no new wells should be added to the metro area’s approximately
80,000 existing ones. Fr. Herman van Engelen is now on the Ayala company’s board of
directors and indicated that Ayala Corporation has tendered offers to the city of Cebu to
supply water to the MCWD at a cost that would be lower than the MCWD can provide;
however Mayor Thomas Osmena vetoed the idea. No reason was given, but water has
become quite political in recent years.
Recently the Ayala nature park opened on land coveted by the city for office and
retail space. It is one of many conflicts between the administration and the company.
According to published reports, Ayala has rights to supply Cebu and has offered an
unsolicited proposal to supply 35,000 m3 / day to the city for 25 pesos m3 at 40 m
elevation. The city refused this bulk water offer even though the MCWD would have
fully retained its distribution concession and the cost was lower than the MWCD
currently charges. Mayor Osmena believed the cost was too high. When a member of
Cebu United for Sustainable Water (a local advocacy group known as CUSW) expressed
outrage over the mayor’s refusal of the proposal based on cost when the rate was less
than the MCWD’s current rate (and involved no other costs to the MCWD), the meeting
was abruptly adjourned (van Engelen 2010).
With regards to the MCWD’s takeover of the Water Remind Project, Fr. Van
Engelen disputed Mr. Chiong’s claims and said the project ties were severed as relations
125
between the MCWD and the USCWRC became strained over the USCWRC’s work for
Ayala Corp. The Water Remind Project is apparently on hold at the MCWD since no
updates or newsletters have been published since the MCWD took control of it. He
maintains that the USCWRC is a neutral party (not interested in privatization) and that
his position on the Ayala Corp. board of directors does not compromise the USCWRC’s
mission. The MCWD is apparently concerned because of the USCWRC’s relationship
with Ayala and other private companies that they perform contract work for. The MCWD
believes that privatization is what is really at stake (van Engelen 2010).
The USCWRC works on behalf of any interested party and will provide data and
conduct studies upon request. The USCWRC believes that Cebu’s water crisis will be
addressed at the institutional level because the unregulated private system that has been
the market’s response is not necessarily adequate. The lack of regulation of these
providers (along with water in general) is not in the public’s interest. Father van Engelen
also suggested that a major point of contention between the Mayor’s office, the Ayala
Corp. and the USCWRC is that while the city and some in the business community
wanted condos to be developed in an upland area identified as important for watershed
protection, the Ayala Corp. (which owned the land in question) preserved the land as a
park (at a financial loss) instead.
Further discussions focused on possible options for Cebu including building a
massive reverse osmosis or distillation treatment plant. This could be financed through
the ADB or maybe even the Japanese Official Development Assistance agency which
backed the construction of the Fernan Marcel Bridge connecting Cebu to Mactan. The
ADB is already involved in a feasibility study for a sewage treatment plant. The best
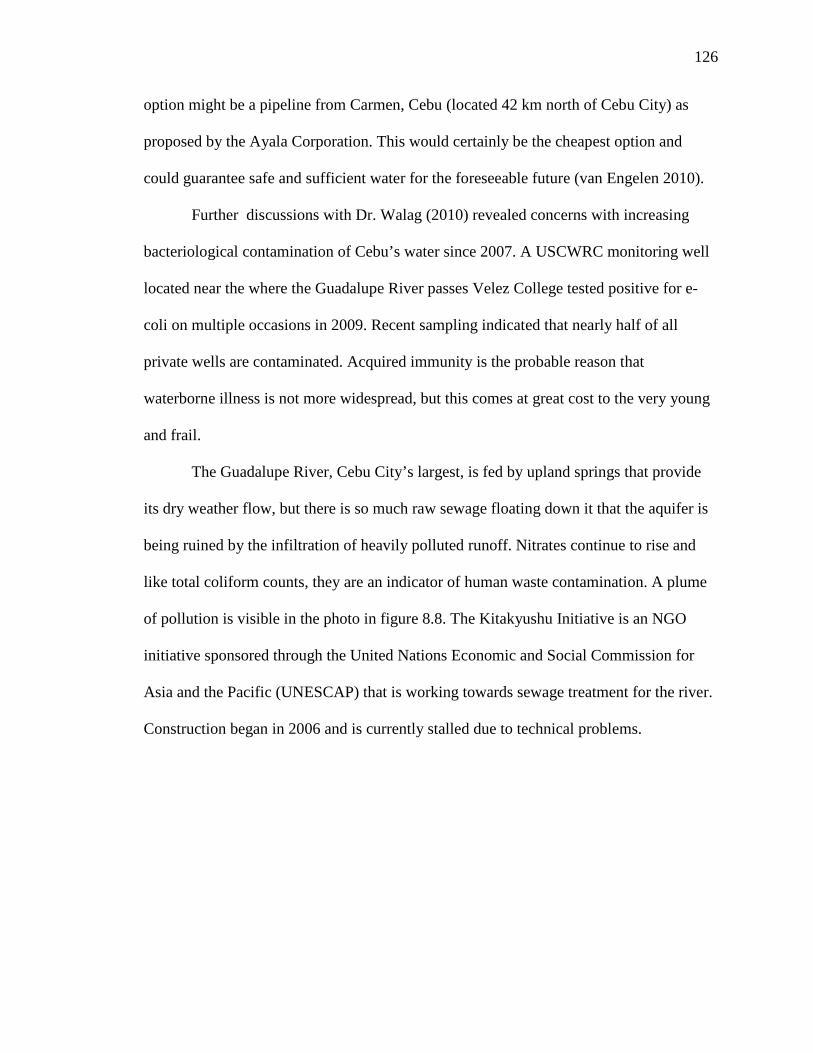
126
option might be a pipeline from Carmen, Cebu (located 42 km north of Cebu City) as
proposed by the Ayala Corporation. This would certainly be the cheapest option and
could guarantee safe and sufficient water for the foreseeable future (van Engelen 2010).
Further discussions with Dr. Walag (2010) revealed concerns with increasing
bacteriological contamination of Cebu’s water since 2007. A USCWRC monitoring well
located near the where the Guadalupe River passes Velez College tested positive for e-
coli on multiple occasions in 2009. Recent sampling indicated that nearly half of all
private wells are contaminated. Acquired immunity is the probable reason that
waterborne illness is not more widespread, but this comes at great cost to the very young
and frail.
The Guadalupe River, Cebu City’s largest, is fed by upland springs that provide
its dry weather flow, but there is so much raw sewage floating down it that the aquifer is
being ruined by the infiltration of heavily polluted runoff. Nitrates continue to rise and
like total coliform counts, they are an indicator of human waste contamination. A plume
of pollution is visible in the photo in figure 8.8. The Kitakyushu Initiative is an NGO
initiative sponsored through the United Nations Economic and Social Commission for
Asia and the Pacific (UNESCAP) that is working towards sewage treatment for the river.
Construction began in 2006 and is currently stalled due to technical problems.

127
Figure 8.8 Guadalupe River in barangay San Nicolas
A meeting with Cebu City councilman Arsenio Pacana (2010) was held and it was
stated that the city government believes that the USCWRC is doing good work on the
groundwater situation and is conducting further studies on water supply and sanitation
feasibility. The councilman then made arrangements for a meeting with Cebu City
engineer Paul Villaretti (2010) to discuss the city’s master plan. Mr. Villaretti is also a
member of the National Water Resource Board (NWRB) and indicated that legally the
city has no responsibility with regards to watershed protection. While he does not totally
agree with this situation, the NWRB has custodial responsibilities nationwide and can
deputize cities and water districts to act on its behalf.
128
Mr. Villaretti ranked his concerns as follows:
1) Solid waste management (the city’s sole landfill has just reached maximum capacity)
2) Housing (but he added that “solving it” would create even more demand – is it
ever really solved then?)
3) Water, without any action, it would become critical within the next 10 years.
He indicated that there was no visionary concept for sustainability here and water
management in Cebu City is mostly about financial issues. He indicated that one good
result of Cebu City’s focus on finances is that a healthy cash flow should result in more
sustainable development. On the negative side though, the water districts’ fixation with
debt schedules and collections can take the focus off of service and quality. For example,
while the MCWD is fiscally sound and has received awards for its balance sheet, they
only serve about 50% of the metro area. The Local Utilities and Water Administration
(LUWA) is supposed to be a technical organization but often acts more like a bank, as the
recent scandal in Ronda, Cebu shows where the Mayor is accused of attempting to get a
P10 million loan for a water project that the town council was not made aware of. An
example of extraneous spending would be their P100 million ($2,250,000) new
headquarters that opened in 2001.
With regards to Manila, Mr. Villaretti said the city relies on surface water for about
60% of its needs which has allowed its groundwater system to remain stable. Despite this
fact, Manila has had much publicized issues with its water that have not been completely
resolved despite the 1997 privatization of the MWSS. In contrast, Cebu’s undeniable
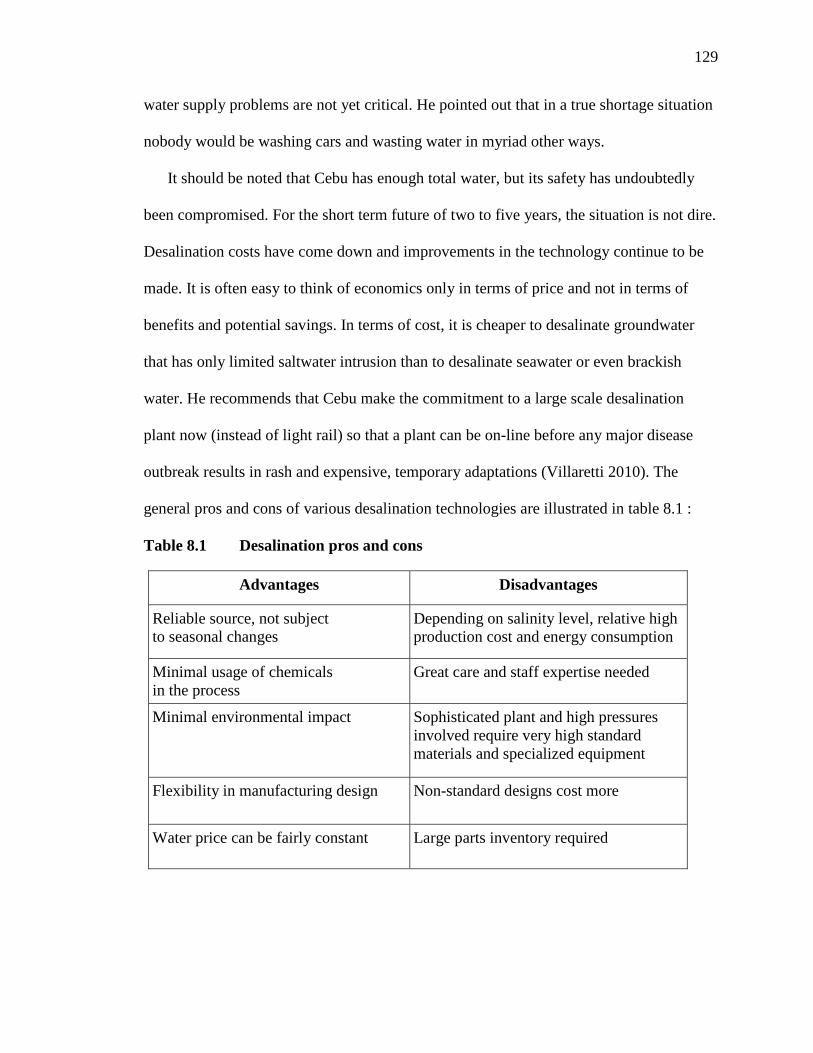
129
water supply problems are not yet critical. He pointed out that in a true shortage situation
nobody would be washing cars and wasting water in myriad other ways.
It should be noted that Cebu has enough total water, but its safety has undoubtedly
been compromised. For the short term future of two to five years, the situation is not dire.
Desalination costs have come down and improvements in the technology continue to be
made. It is often easy to think of economics only in terms of price and not in terms of
benefits and potential savings. In terms of cost, it is cheaper to desalinate groundwater
that has only limited saltwater intrusion than to desalinate seawater or even brackish
water. He recommends that Cebu make the commitment to a large scale desalination
plant now (instead of light rail) so that a plant can be on-line before any major disease
outbreak results in rash and expensive, temporary adaptations (Villaretti 2010). The
general pros and cons of various desalination technologies are illustrated in table 8.1 :
Table 8.1 Desalination pros and cons
Advantages Disadvantages
Reliable source, not subject to seasonal changes
Depending on salinity level, relative high production cost and energy consumption
Minimal usage of chemicals in the process
Great care and staff expertise needed
Minimal environmental impact Sophisticated plant and high pressures involved require very high standard materials and specialized equipment
Flexibility in manufacturing design
Non-standard designs cost more
Water price can be fairly constant Large parts inventory required
130
According to Mr. Villaretti, the MCWD is not convinced of the need for
desalination because it lacks foresight. He suspects that 95% of Cebuano’s are drinking
purified water from one of the SSIPWP’s and that since the overwhelming majority is
able to get safe water there is no great outcry for an increase in supply. It is his personal
view that water is not really a critical problem because Cebu is in a humid area
surrounded by water and that solutions would be readily found if proper discussions and
planning were undertaken by the institutions involved in water distribution and
infrastructure. Mr. Viallaretti also said that he used to be a member of Cebu Uniting for
Sustainable Water and that they are concerned with the watershed, but that the group was
becoming too much like a cult that wanted to protect the watershed at all costs. This
extremism in his view caused him to leave the group. He said once it becomes a religion
something has gone wrong. He said that many in the environmental movement think that
mother earth is more important than man himself and this kind of thinking often displaces
the sober appreciation of environmental problems that would be more productive.
The doomsday water shortage scenario is not subscribed to by Mr. Villaretti. He
advised that he feels this way because Cebu receives an average of 1.6 million m3 of
rainfall (about 63”) a year with only rare droughts like the ones in 1994 and 2007. His
concerns are that while the hydrology of the aquifer is very good, that good fortune is
being turned into a disadvantage since nearly 100% of the city’s water supply comes
from it. The city has failed to seriously pursue additional sources of supply as its growth
continues unabated. Estimates are that as early as 1994 the Carcar was being overdrawn
(pumping out more water than is recharged) by about 50,000 m3 per year. It should be

131
noted that he admitted that estimates are rough due to the lack of data from the wells
(Villaretti 2010).
Pursuant to Presidential Proclamation Nos. 581 and 932, the Mananga, Kotkot,
and Lusaran watersheds in Cebu, Philippines were proclaimed as major watersheds in the
country, thus making these areas an environment protected zone. However, the
population in these watersheds continues to increase despite the new designation. The
question becomes one of governance. From the lack of groundwater withdrawal
recording and monitoring to industrial effluent that is unaccounted for, it seems that good
governance is lacking.
It is Mr. Villaretti’s belief that the planning office he directs should have much
more ability to affect positive change than they actually do. He has been restricted
politically since Mayor Osmena directed him to focus on transportation issues instead of
water supply concerns. This corresponds with what Father van Engelen of the USCWRC
stated about the lack of protection for the public interest by City Hall. Instead he said that
some private purifiers and NGO’s monitor the quality of water delivered by the MCWD.
Some NGO’s are protectionist people and that when they got the National
Integrated Protected Areas System (NIPAS) signed by presidential decree that the
affected watersheds became totally protected which removed any control from the local
government. These protectionist groups want to depopulate the watersheds which Mr.
Villaretti believes is impractical, while management people like himself would prefer that
people should be trained on how to use water in a sustainable manner instead of being
dislocated. At least the Philippine Department of Environment and Natural Resources has
both groups (protectionist and management) represented. The NIPAS act provided
132
specific areas for human settlement to be allowed in the area mentioned (Mananga,
Kotkot and Lusaran watersheds). Whether the residents are situated in the designated
areas remains to be proven.
A meeting was held with Edgar Salsado (2010) of Island Banca Cruise company
in barangay Punta Engano, Mactan, Cebu. His water is supplied by the Mactan Rock
corporation via tanker truck (and is then pumped to their overhead tank) that tested at 875
ppm salinity. The employees were not aware of this prior to my test, but had already
stopped drinking it due to the taste and fear of its safety. Instead, they rely on purified
water from Pure Serv that tested at 61 ppm salinity . In nearby barangay Pusok, Dr.
Fatima Menguito DOM (dentist) had water supplied by the MCWD’s pipe network which
tested at 677 ppm salinity. Dr. Menguito and her staff drink purified water from Aquasoft
that tested at 17 ppm salinity.
A meeting with Angelita Secuya (2010) of the Cebu City chapter of the Knights
of Columbus in their barangay Santo Nino office was conducted. The office relies on
purified water from Sparkling Drops which tested at 17 ppm salinity. The tap water is
from the MCWD and tested at 338 ppm. Ms. Secuya suggested that it would be useful to
go to some of the squatter settlements down by the piers and witness the conditions there
while testing their water (Secuya 2010). A subsequent site visit to barangay Ermita
revealed that the MCWD line passes by and few residents have a connection. The
residents that were contacted did not have a connection and relied on the neighborhood
pump well which could be quite a walk depending on where you live. Some said that they
bring buckets to a family that has an MCWD connection to get drinking water. There
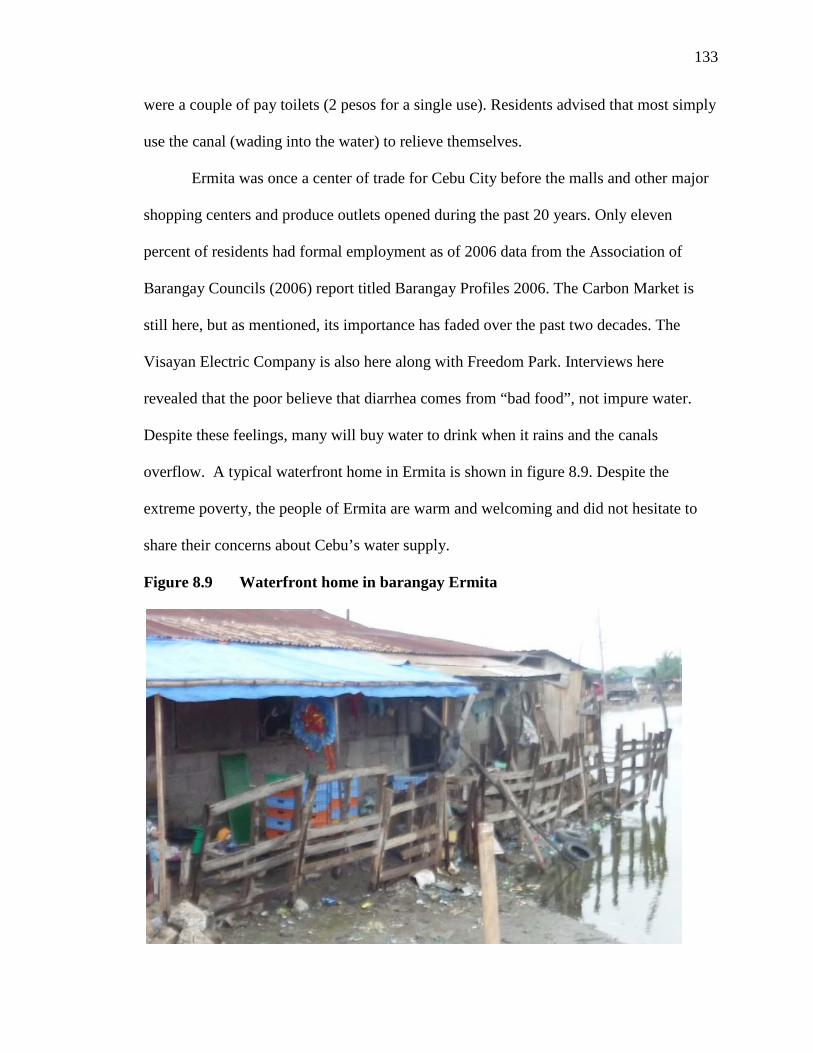
133
were a couple of pay toilets (2 pesos for a single use). Residents advised that most simply
use the canal (wading into the water) to relieve themselves.
Ermita was once a center of trade for Cebu City before the malls and other major
shopping centers and produce outlets opened during the past 20 years. Only eleven
percent of residents had formal employment as of 2006 data from the Association of
Barangay Councils (2006) report titled Barangay Profiles 2006. The Carbon Market is
still here, but as mentioned, its importance has faded over the past two decades. The
Visayan Electric Company is also here along with Freedom Park. Interviews here
revealed that the poor believe that diarrhea comes from “bad food”, not impure water.
Despite these feelings, many will buy water to drink when it rains and the canals
overflow. A typical waterfront home in Ermita is shown in figure 8.9. Despite the
extreme poverty, the people of Ermita are warm and welcoming and did not hesitate to
share their concerns about Cebu’s water supply.
Figure 8.9 Waterfront home in barangay Ermita
134
Louella Lucino (2010) is the Director of Interior and Local Government for the
Philippines district 7 which includes Cebu and the rest of the central Visayan Islands
(Bohol, Negros Oriental and Siquijor). In her role of insuring local compliance with
national directives, she indicated that she is aware of the water problems in metro Cebu
and believes that kidney disease is epidemic here due to the excess salt in the water. Her
job often takes her around the region including frequent trips to Bohol, Negros and Leyte,
but that when she is in Cebu she only drinks purified water.
Girlie Garces (2010), San Miguel Corporation’s Director of Human Relations in
Cebu, advised that San Miguel is a very responsible corporate citizen and her duties
include community outreach. San Miguel sponsors school teams and other projects at the
barangay level. Garces is also a board member of the CUSW and was aware that salt
water intrusion has reached Mandaue where San Miguel’s operations and regional
headquarters are located. In addition to its namesake beer, San Miguel also produces a
multitude of malt beverages, soft drinks and even purified water under its Magnolia
brand. San Miguel Corp. used to produce Wilkins Purified Water for Coca Cola before
Coca Cola of the Philippines divested itself from San Miguel and moved to the MCWD
for service.
Water for their brewery and soft drink operations comes from nearby barangay
Cabancalan, that is located about three kilometers from Mandaue. Cabancalan is a
cavernous area famous for its running water. Cabancalan has some 80 wells while
neighboring (and much larger) Mandaue has only 27. Salinity levels of the wells in
Cabancalan that the plant relies on or the treatment methods employed by San Miguel
135
were not disclosed. The 2010 Water Survey did reveal that wells in Mandaue were highly
saline.
The SSIPWP’s were discussed, the main concern of Director Garces was that
nobody is watching or regulating if and how these used 19 liter containers (that are now
mixed and matched all over the metro area) are cleaned. Some are used to store liquids
other than water and then possibly re-enter the supply chain. Similar concerns for the
water quality of the SSIPWP’s was expressed. While most locations appear to go out of
their way to ensure that their purification equipment is easily visible, this wise marketing
technique does not ensure the quality of the product (Garces 2010).
A meeting was held with A + Enterprises owner Allan Raborar (2010) to discuss
his company’s water filtration systems. A written quote was provided for a system that
would allow an individual to become a standalone purified water provider for 195,000
pesos ($4,333) and installed in 2 to 3 days for 15,000 pesos ($333). A copy of the quote
can be found in the appendix. Mr. Raborar stated that since there is no regulation of these
providers, some run their systems beyond their design capability which results in
incomplete filtration. This is especially true when they advertise UV disinfection, that
disinfection requires time and direct contact with the radiation. The in-line lamps often
employed for this purpose cannot kill all the organisms in the water if the flow is too fast.
However in the A+ Enterprises system, the UV lamps are located in the holding tank
instead of the cheaper “in-line” units others employ. Locating the lamp system in the
holding tank ensures complete disinfection even if the output is at the maximum that the
system can provide. Mr. Raborar also advised during a meeting that in addition to

136
vendors pushing water through faster than the design specs that nobody checks to see
how often filters are replaced either (Raborar 2010).
A field trip was made to the mountain barangays of Toong, Busay and Upper
Busay. The residents contacted did not have MCWD service though some in Busay say
that there was limited service in the lower elevations. They relied on networks of flexible
hose provided by private and municipal (the barangay) suppliers. In all three barangays,
connections were sporadic. Some residents climbed down steep hills to the Buhisan River
to get water by the pail. Others went to developments who would allow them to get a
certain amount of water free from a hose. A few had private wells. In the wealthier parts
of these barangays, residents often had wells and elevated holding tanks.
Since the negative effects of poor water quality are felt most by the very young, a
meeting was held with Primi Atillo (2010) of Our Lady of Lourdes Parish’s children’s
feeding program at the parish offices in barangay Punta Princesa, Cebu. The parish
supports anywhere from 150 to 250 children at any given time. They rely on MCWD
water which tested at 332 ppm salinity. Ms. Atillo stated that the parish believes the
MCWD’s water is safe and that they have not encountered problems with diarrhea.
Gladys Gica (2010) is a supervisor at the Imperial Palace hotel in Maribago, Cebu
(the eastern shore of Mactan Island). It was indicated that the hotel desalinates water
from its own “on-site” well. This water was tested at 152 ppm salinity and it is used as
tap water in the hotel. The hotel also supplies bottled water on request.
Cebu Uniting for Sustainable Water is a citizens group that promotes sustainable
water development for metro Cebu. CUSW president Mr. Casiano Q. Catapang (2010)
confirmed that the metro area is 90% dependent on groundwater from the Carcar aquifer.
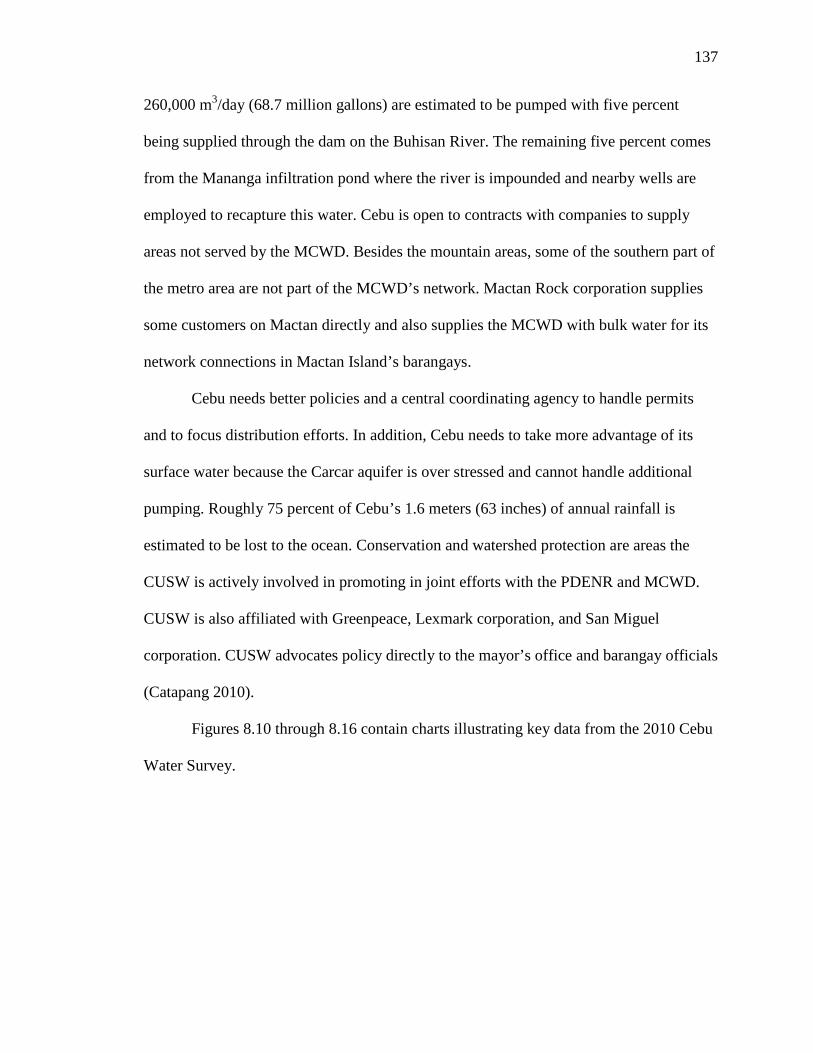
137
260,000 m3/day (68.7 million gallons) are estimated to be pumped with five percent
being supplied through the dam on the Buhisan River. The remaining five percent comes
from the Mananga infiltration pond where the river is impounded and nearby wells are
employed to recapture this water. Cebu is open to contracts with companies to supply
areas not served by the MCWD. Besides the mountain areas, some of the southern part of
the metro area are not part of the MCWD’s network. Mactan Rock corporation supplies
some customers on Mactan directly and also supplies the MCWD with bulk water for its
network connections in Mactan Island’s barangays.
Cebu needs better policies and a central coordinating agency to handle permits
and to focus distribution efforts. In addition, Cebu needs to take more advantage of its
surface water because the Carcar aquifer is over stressed and cannot handle additional
pumping. Roughly 75 percent of Cebu’s 1.6 meters (63 inches) of annual rainfall is
estimated to be lost to the ocean. Conservation and watershed protection are areas the
CUSW is actively involved in promoting in joint efforts with the PDENR and MCWD.
CUSW is also affiliated with Greenpeace, Lexmark corporation, and San Miguel
corporation. CUSW advocates policy directly to the mayor’s office and barangay officials
(Catapang 2010).
Figures 8.10 through 8.16 contain charts illustrating key data from the 2010 Cebu
Water Survey.
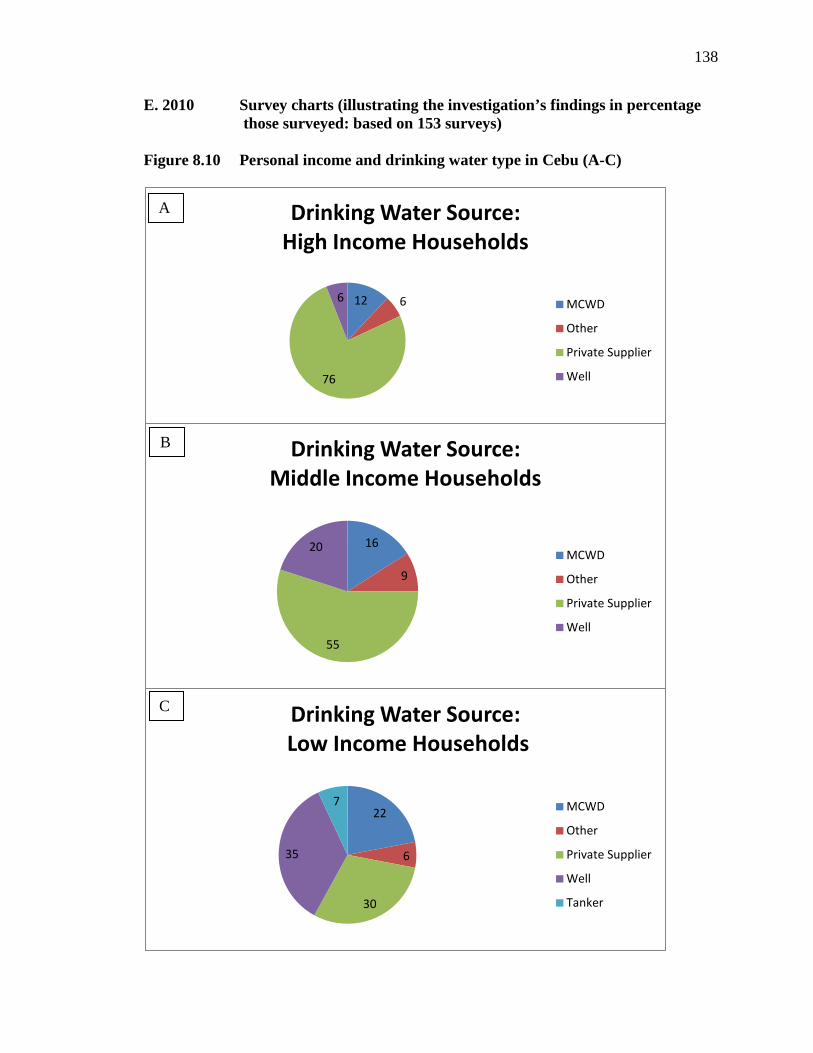
138
E. 2010 Survey charts (illustrating the investigation’s findings in percentage those surveyed: based on 153 surveys) Figure 8.10 Personal income and drinking water type in Cebu (A-C)
12 6
76
6
Drinking Water Source:High Income Households
MCWD
Other
Private Supplier
Well
16
9
55
20
Drinking Water Source:Middle Income Households
MCWD
Other
Private Supplier
Well
22
6
30
35
7
Drinking Water Source:Low Income Households
MCWD
Other
Private Supplier
Well
Tanker
A
B
C
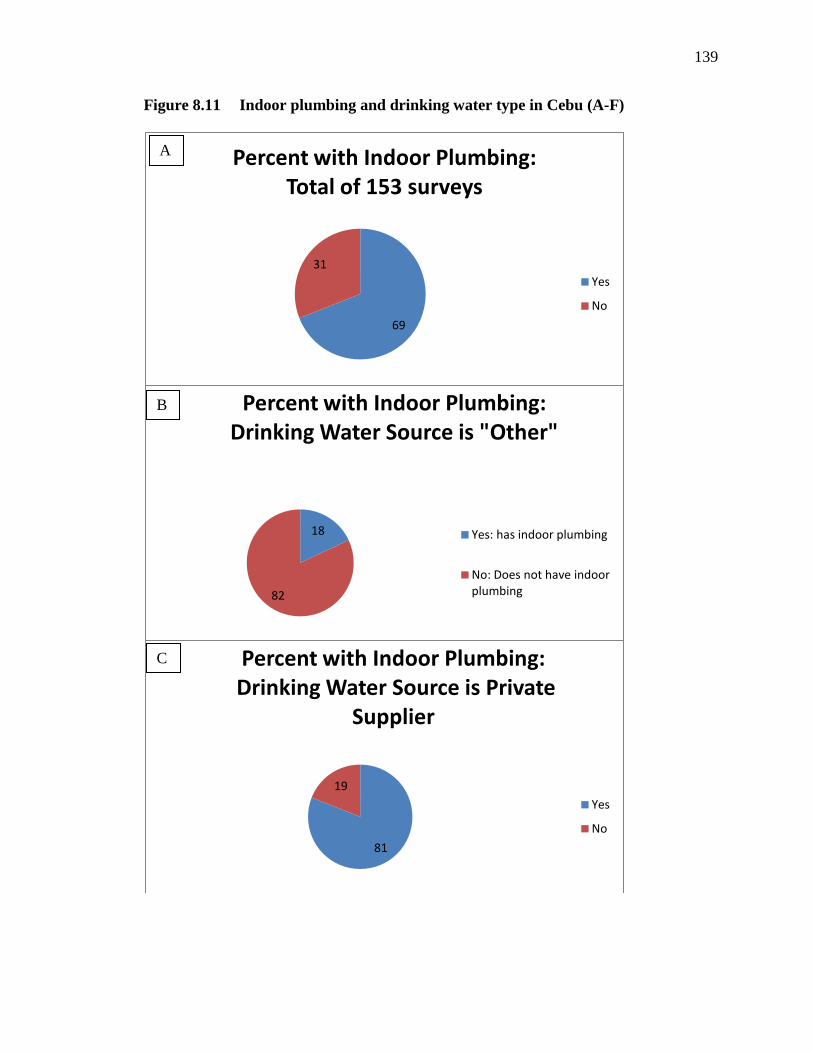
139
Figure 8.11 Indoor plumbing and drinking water type in Cebu (A-F)
69
31
Percent with Indoor Plumbing: Total of 153 surveys
Yes
No
18
82
Percent with Indoor Plumbing: Drinking Water Source is "Other"
Yes: has indoor plumbing
No: Does not have indoor plumbing
81
19
Percent with Indoor Plumbing:Drinking Water Source is Private
Supplier
Yes
No
C
B
A

140
40
60
Percent with Indoor Plumbing:Drinking Water Source is Tanker
Yes
No
64
36
Percent with Indoor Plumbing:Drinking water source is MCWD
Yes
No
70
30
Percent with Indoor Plumbing:Drinking water source is Well
Yes
No
F
E
D

141
Overall 70% of survey respondents have indoor plumbing while 30% do not. Those
whose drinking water source is “other” or “tanker” were the only groups in which a
majority of respondents did not have indoor plumbing.
The next series of charts in figure 8.12 indicate that while about half of homes
with an MCWD connection or a well drink purified water, only 25% of those whose
water supply is not piped do so. The “not piped” group includes the categories of “other”
and “tanker” and these categories are generally associated with lower socio-economic
status. It is important to note that even among this group, only 62% drink the water that is
provided to them at no charge. 38 percent use the private purifiers or get water from
someone who has a well or an MCWD connection. Even though the water provided by
the city or the MCWD via tanker trucks tested similarly to the MCWD’s piped water, the
perception is that this water is of inferior quality.
Figure 8.12 Relationship between household piped water supply and water used for potable purposes (A-C)
11
45
1
43
Household Drinking Water Source: For homes with wells
MCWD
Private Supplier
Tanker
Well
A

142
41
52
14 2
Household Drinking Water Source: For homes with MCWD service
MCWD
Private Supplier
Tanker
Well
Other
6
62
25
7
Household Drinking Water Source:For homes whose water supply is not piped
MCWD
Other
Private Supplier
Well
B
C
143
Many of these lower income households reflected in chart “C” above rely on the
MCWD, well water, and even purified water from wealthier relatives and neighbors.
Some get drinking water from tanker trucks provided by the municipal government or the
MCWD.
The following series of charts shown in figure 8.13 illustrate how residents feel
about the availability of safe drinking water broken out by the household’s non-potable
water source. The blue (yes) portion of the charts indicate the percentage answering yes
to the question “Can everyone who needs safe drinking water get it?” Overall, 60% of
households feel safe drinking water is available while 40% disagree. The highest
percentage was among those who drink purified water with well owners the most positive
group and those relying on tanker service or other methods or obtaining water the least
positive at 50%.
Figure 8.13 Household water supply and belief that safe water is readily available (A-C)
5050
Households whose water supply is tanker or other
Yes No
A

144
Another question that was asked in the household survey was whether residents
felt that the quality of Cebu’s groundwater had deteriorated during the past decade. This
question revealed more dramatic differences in opinion based on the household water
supply. The responses to the question “Is the groundwater quality worse now than 10
years before?” revealed that over 83% of households relying on tanker service felt this
way while only 36% of households with an “other” connections agreed. MCWD
customers and well owners were more evenly divided on this question.
60
40
Households with MCWD service
Yes No
66
34
Households with wells
Yes No
B
C

145
It is surprising that residents are so divided on this question in light of the 2010
survey results that revealed a dramatic drop in water quality from the USCWRC’s tests
performed a decade ago.
Figure 8.14 Household water supply and belief that water quality has deteriorated over the past decade (A-D)
52
48
Households with MCWD Service
Yes
No
58
42
Households with wells
Yes
No
A A
B

146
The next series of charts shows the percentage of households with indoor
plumbing by their primary water source. The charts show that most residents with wells
and/or MCWD service had indoor plumbing, while most residents who relied on tanker-
delivered water and those whose water supply is “other” did not have indoor plumbing.
83
17
Households using tanker service
Yes No
36
64
Households with "other" as water supply
Yes No
C
D
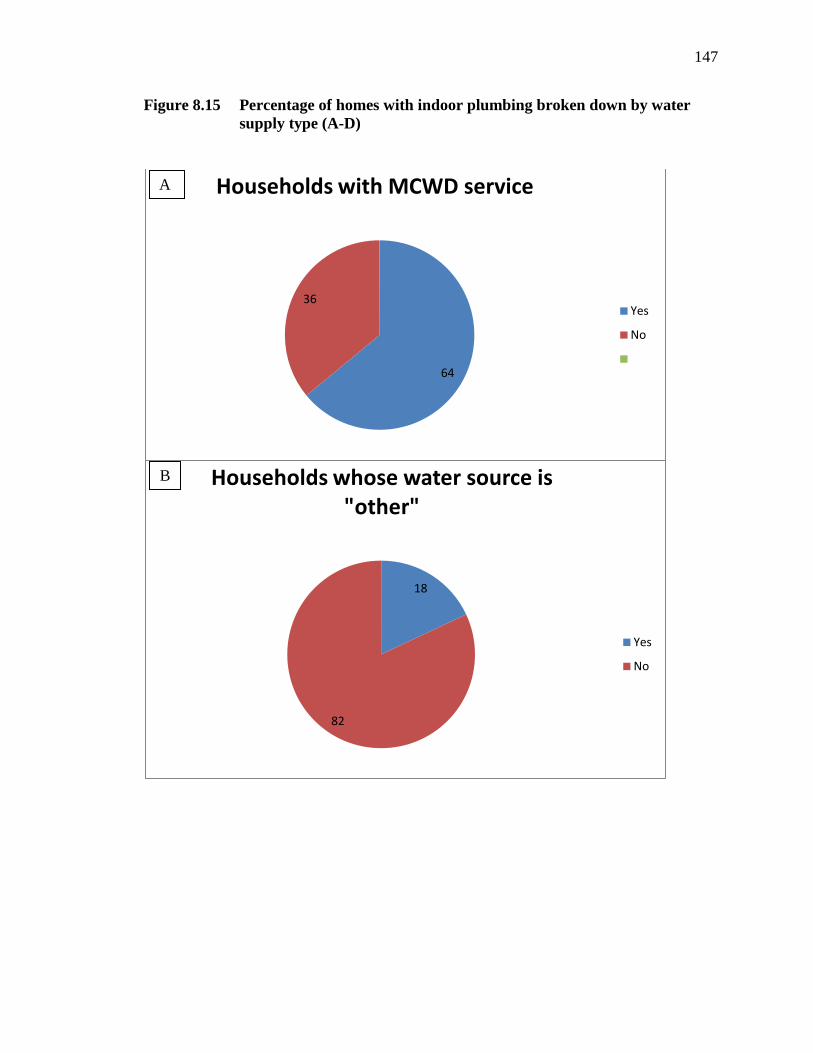
147
Figure 8.15 Percentage of homes with indoor plumbing broken down by water supply type (A-D)
64
36
Households with MCWD service
Yes
No
18
82
Households whose water source is "other"
Yes
No
A
B

148
.
The final series illustrates the relationship between income and primary source of
water used for non-potable purposes including cooking. Many households have more
than one source of water, some use a dug well just for watering plants, others drink their
well water and wash with MCWD water and so forth. Although the MCWD’s water and
many wells are potable, this survey is performed because most residents are no longer
drinking primarily from these sources, although most still wash with it. As shown , some
40
60
Households with tanker service
Yes
No
70
30
Households with wells
Yes
No
C
D
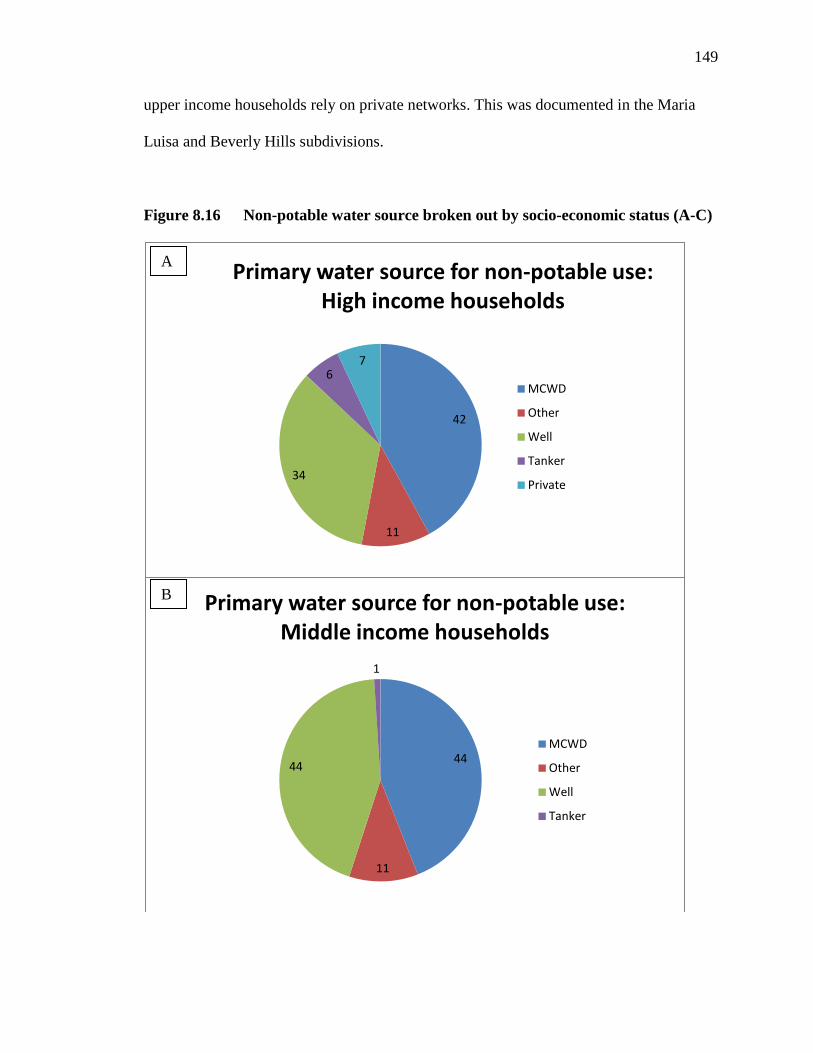
149
upper income households rely on private networks. This was documented in the Maria
Luisa and Beverly Hills subdivisions.
Figure 8.16 Non-potable water source broken out by socio-economic status (A-C)
42
11
34
67
Primary water source for non-potable use: High income households
MCWD
Other
Well
Tanker
Private
44
11
44
1
Primary water source for non-potable use: Middle income households
MCWD
Other
Well
Tanker
A
B

150
The survey results indicated by figure 8.16 above show that even though most
residents now access the private purifiers for their drinking water needs, only a small
percentage of high income households wash with it.
In addition to the residential surveys, other meetings with business and institutional
water providers and users were made during the 2010 site visit. They included schools,
churches, public officials, business and civic leaders. Some of the new SSIPWP’s (that
started operations after an earlier visit in August of 2007) are Agua Avel, Natural Fresh,
Viva!, Sese Aqua Safe and Water Market. Figure 8.17 shows a group of samples from
various providers that were taken during the 2010 Water Survey.
36
10
49
5
Primary water source for non-potable use: Low income households
MCWD
Other
Well
Tanker
C
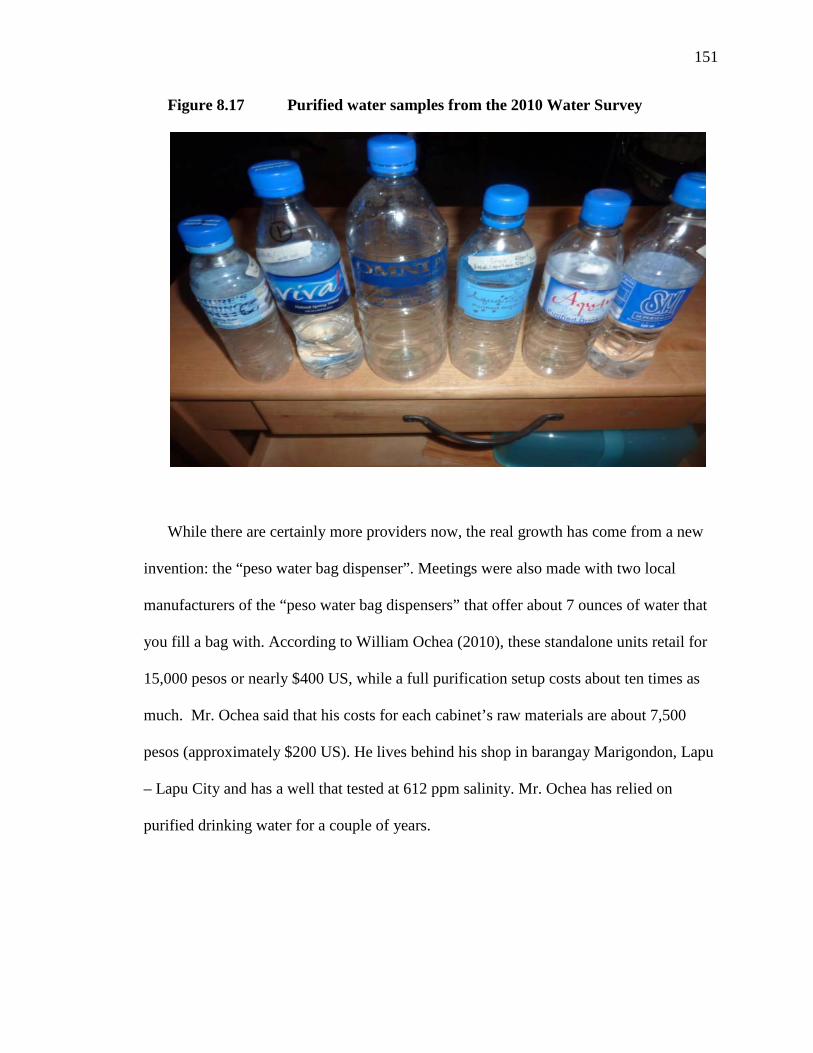
151
Figure 8.17 Purified water samples from the 2010 Water Survey
While there are certainly more providers now, the real growth has come from a new
invention: the “peso water bag dispenser”. Meetings were also made with two local
manufacturers of the “peso water bag dispensers” that offer about 7 ounces of water that
you fill a bag with. According to William Ochea (2010), these standalone units retail for
15,000 pesos or nearly $400 US, while a full purification setup costs about ten times as
much. Mr. Ochea said that his costs for each cabinet’s raw materials are about 7,500
pesos (approximately $200 US). He lives behind his shop in barangay Marigondon, Lapu
– Lapu City and has a well that tested at 612 ppm salinity. Mr. Ochea has relied on
purified drinking water for a couple of years.

152
Figure 8.18 William Ochea at his manufacturing facility in barangay Marigondon
This is the latest innovation of the small scale providers in Cebu that has grown
exponentially since they were introduced in 2007. In 2007 there were only a handful of
machines by the two companies ATM and Peso Express. Those early units dispensed
water, but you had to provide the cup. They did not grow, instead local manufacturers
took over with a lower cost product that opened the door to a wider gamut of
entrepreneurs that could consequently serve a wider customer base (more of the urban
poor are now serviced).
The free tubular plastic baggies provided can by tied off for transport as many street
vendors do and resell the bags for 5 pesos while a small bottle of water costs 10 pesos.
Another change from 2007 is that the delivery market is maturing with only a dozen or so
new operators. The big growth has been in these dispensers that are not limited to the less
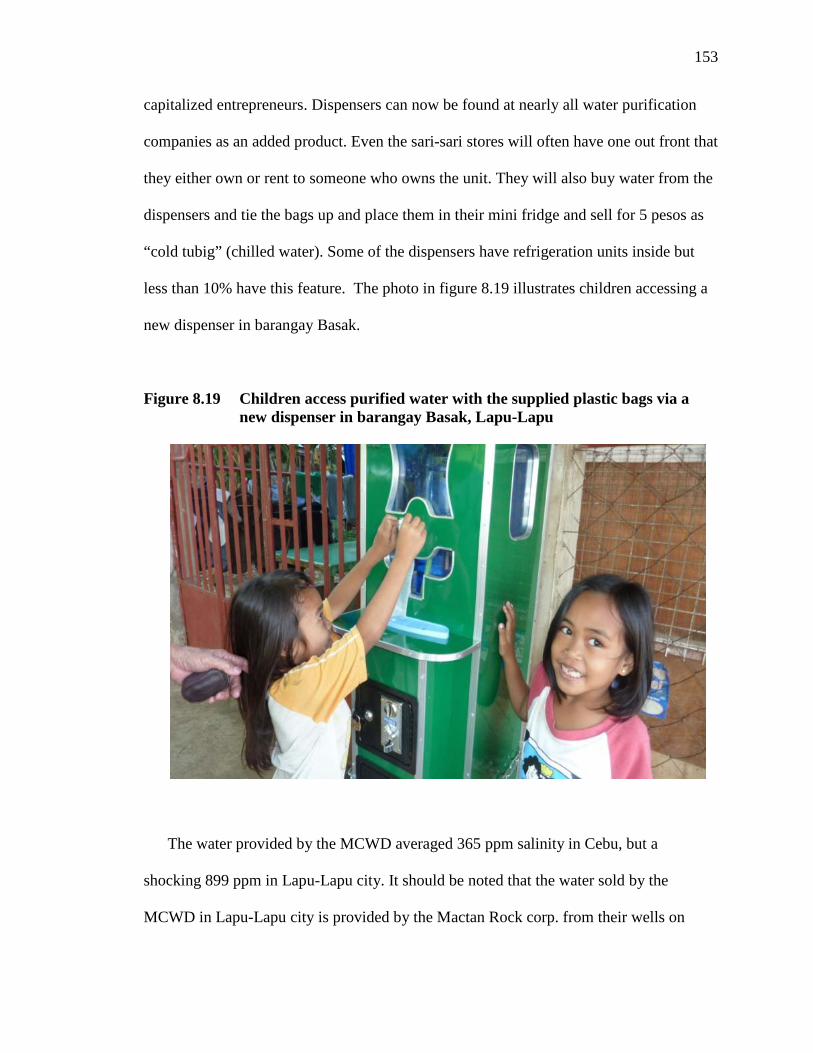
153
capitalized entrepreneurs. Dispensers can now be found at nearly all water purification
companies as an added product. Even the sari-sari stores will often have one out front that
they either own or rent to someone who owns the unit. They will also buy water from the
dispensers and tie the bags up and place them in their mini fridge and sell for 5 pesos as
“cold tubig” (chilled water). Some of the dispensers have refrigeration units inside but
less than 10% have this feature. The photo in figure 8.19 illustrates children accessing a
new dispenser in barangay Basak.
Figure 8.19 Children access purified water with the supplied plastic bags via a new dispenser in barangay Basak, Lapu-Lapu
The water provided by the MCWD averaged 365 ppm salinity in Cebu, but a
shocking 899 ppm in Lapu-Lapu city. It should be noted that the water sold by the
MCWD in Lapu-Lapu city is provided by the Mactan Rock corp. from their wells on
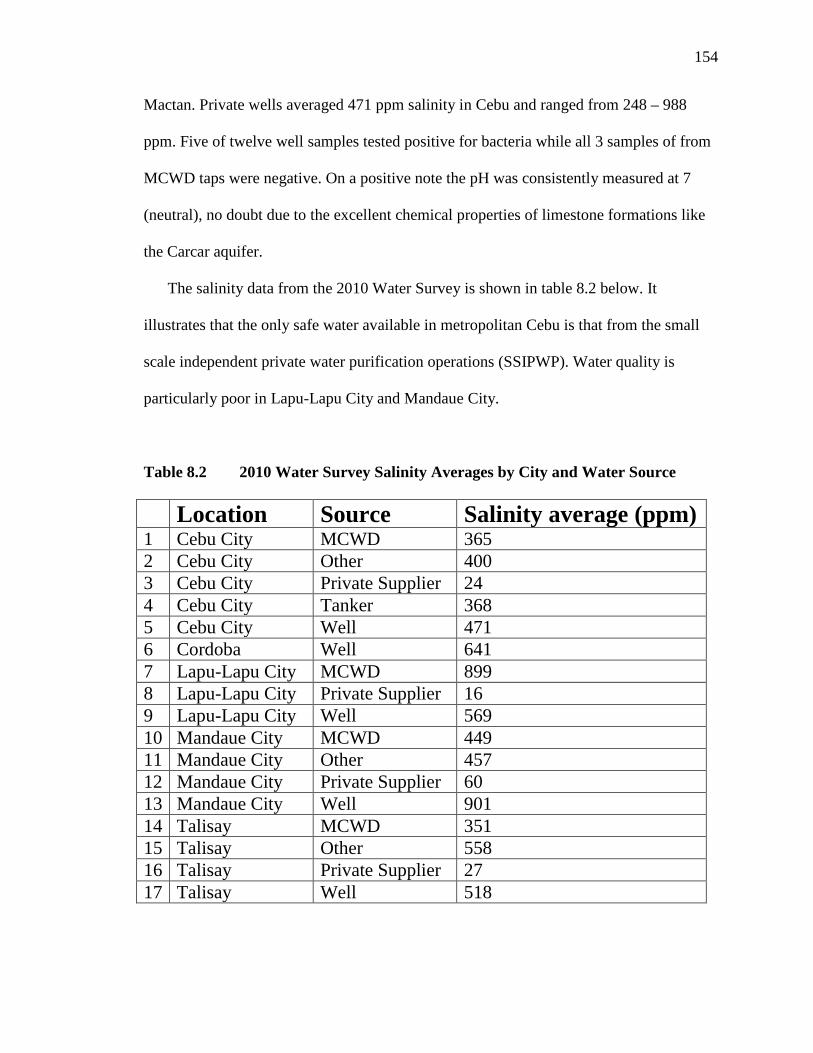
154
Mactan. Private wells averaged 471 ppm salinity in Cebu and ranged from 248 – 988
ppm. Five of twelve well samples tested positive for bacteria while all 3 samples of from
MCWD taps were negative. On a positive note the pH was consistently measured at 7
(neutral), no doubt due to the excellent chemical properties of limestone formations like
the Carcar aquifer.
The salinity data from the 2010 Water Survey is shown in table 8.2 below. It
illustrates that the only safe water available in metropolitan Cebu is that from the small
scale independent private water purification operations (SSIPWP). Water quality is
particularly poor in Lapu-Lapu City and Mandaue City.
Table 8.2 2010 Water Survey Salinity Averages by City and Water Source
Location Source Salinity average (ppm) 1 Cebu City MCWD 365 2 Cebu City Other 400 3 Cebu City Private Supplier 24 4 Cebu City Tanker 368 5 Cebu City Well 471 6 Cordoba Well 641 7 Lapu-Lapu City MCWD 899 8 Lapu-Lapu City Private Supplier 16 9 Lapu-Lapu City Well 569 10 Mandaue City MCWD 449 11 Mandaue City Other 457 12 Mandaue City Private Supplier 60 13 Mandaue City Well 901 14 Talisay MCWD 351 15 Talisay Other 558 16 Talisay Private Supplier 27 17 Talisay Well 518
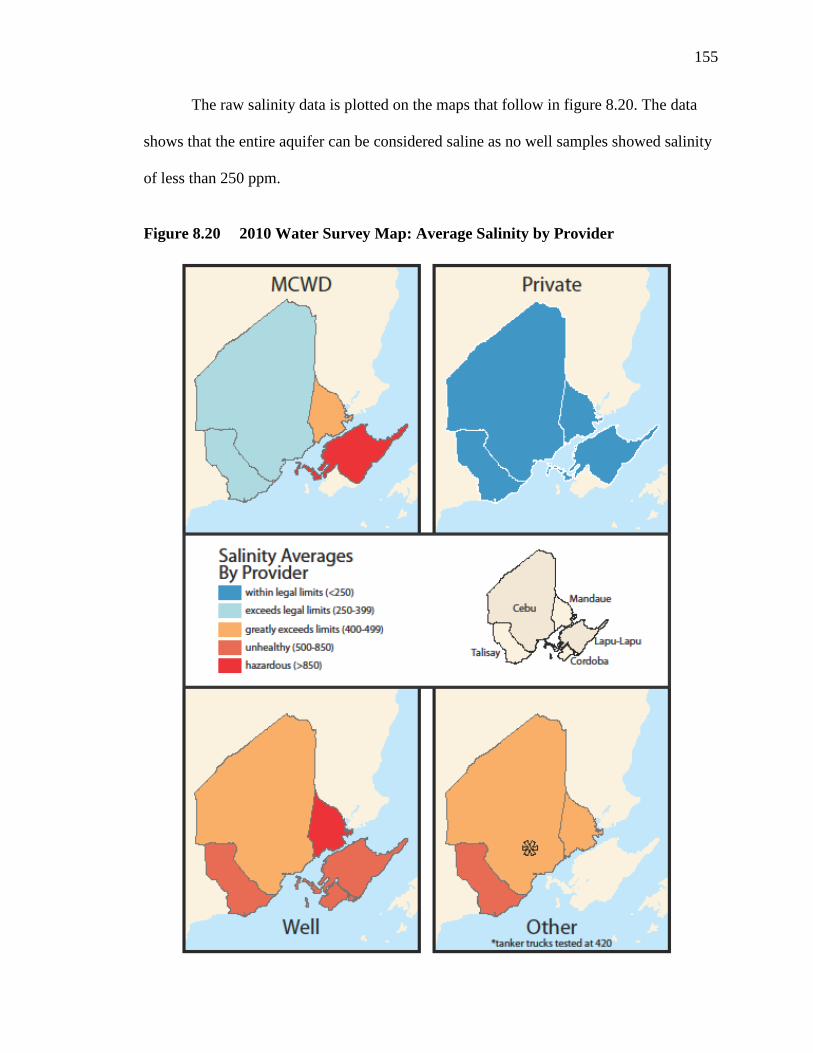
155
The raw salinity data is plotted on the maps that follow in figure 8.20. The data
shows that the entire aquifer can be considered saline as no well samples showed salinity
of less than 250 ppm.
Figure 8.20 2010 Water Survey Map: Average Salinity by Provider

156
Chapter 9: Summary and Policy Recommendations
A. 1990 – 2010 synopsis
Cebu has changed much in the last two decades with new hotels, shopping malls,
international call centers, and manufacturing plants. The daily brownouts have long
ended as Asia Electric added capacity with a new power plant. The Cebu Energy
Development Corporation came on-line in March 2010 and Cebu City now has enough
power that it is self sufficient and the Visayan regional grid (with major plants on
neighboring Negros) would only be drawn from during an emergency.
Two decades ago there was only one international quality hotel, the Cebu Plaza
(now renamed the Marco Polo), that advertised spring water (including its ice cubes). In
the 1980’s and 90’s jeepneys ruled the roads and only the main thoroughfares were
heavily congested. The side streets were often wide open and plied by bicyclists, taxis
and pedestrians. Today much of the time most roads are quite crowded as the growing
middle class has increasingly moved to car ownership. Jeepneys still provide service, but
the overall amount of traffic is much greater and the mix of vehicles is very different.
Cebu needs to address its water supply and quality for the well being of its
inhabitants. While tourists may not be affected since major hotels and resorts supply
guests with treated water, it cannot continue to ignore the plight of residents who have
neither safe nor sufficient water to meet their daily needs. The 2010 Water Survey results
show that saltwater intrusion has accelerated greatly during the past decade and is now
joined by bacteriological contamination. Although chemical analysis was not part of this
study, there is good reason to believe that the Carcar aquifer has also become spoiled
with volatile organic chemicals due to the high amount of unregulated industrial effluent
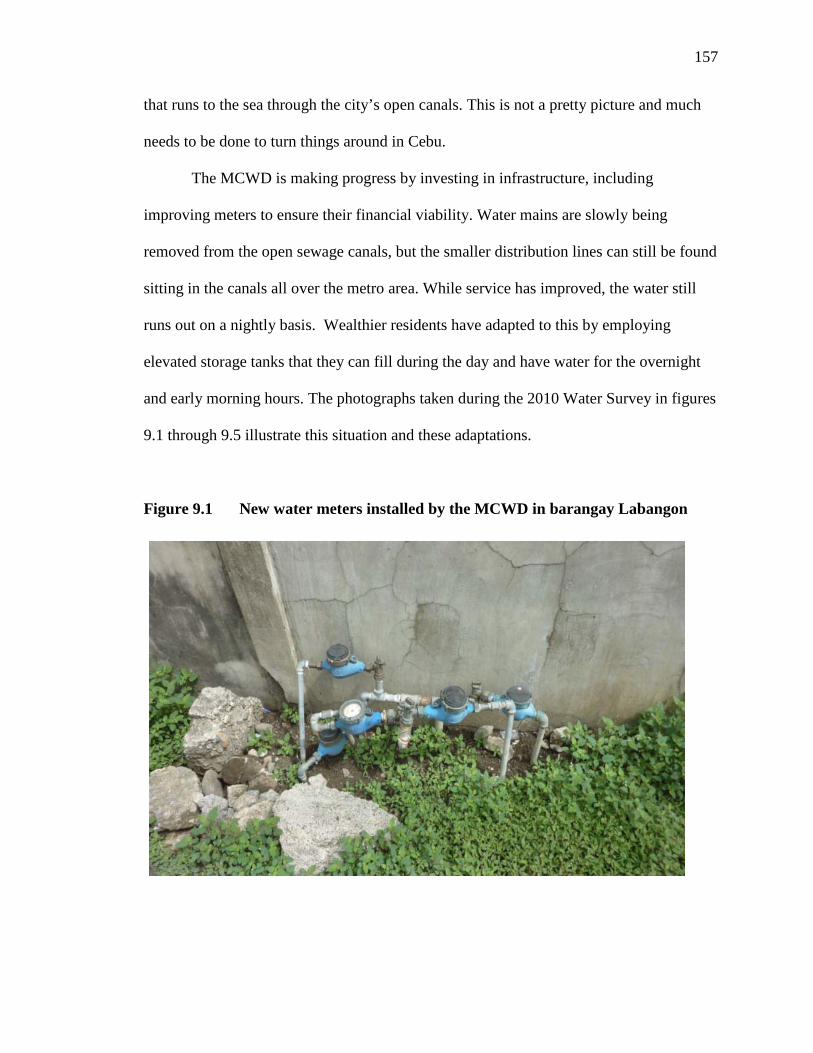
157
that runs to the sea through the city’s open canals. This is not a pretty picture and much
needs to be done to turn things around in Cebu.
The MCWD is making progress by investing in infrastructure, including
improving meters to ensure their financial viability. Water mains are slowly being
removed from the open sewage canals, but the smaller distribution lines can still be found
sitting in the canals all over the metro area. While service has improved, the water still
runs out on a nightly basis. Wealthier residents have adapted to this by employing
elevated storage tanks that they can fill during the day and have water for the overnight
and early morning hours. The photographs taken during the 2010 Water Survey in figures
9.1 through 9.5 illustrate this situation and these adaptations.
Figure 9.1 New water meters installed by the MCWD in barangay Labangon

158
Figure 9.2 Damaged MCWD water distribution lines in open sewage canal in barangay Labangon
Figure 9.3 Partially submerged MCWD water distribution lines in open sewage canal

159
Figure 9.4 MCWD water-main in open sewage canal in barangay Labangon
Figure 9.5 Private household water storage tower in barangay Busay

160
The salinity problem is too big for the financial ability of the MCWD and thus
the city needs to act aggressively to pursue outside sources and/or desalination due to the
accelerating deterioration of the Carcar aquifer. The entrepreneurial spirit has served the
city well so far, but if the Carcar continues to degrade it may become unsafe to even
shower in water pumped from it, whether it comes from a private well or the MCWD.
The MCWD has a dedicated staff and sound management, but it is
undercapitalized and appears to be behind the curve of events that have seen hundreds of
private purifiers crop up around the city. Certainly if Cebu wants to be known as a world
class city, it needs a sewer system and tap water that is safe and sufficient. The lack of a
sewer system and the damming of the Buhisan and Mananga impoundment have only
caused more stress on the Carcar as wastes percolate down to the shallow water table.
The squatter neighborhoods in the reclamation areas and generally near the
waterfront are teeming with transplants from around the country seeking an opportunity
in the country’s second largest city and economic zone. Many work on the docks in light
manufacturing and as household help. They often perform undesirable jobs just as many
immigrants from the lower end of the socio-economic scale have done throughout
history. The 2010 Water Survey largely showed that these people do not have the means
to rely on SSIPWP’s for their drinking water, although the results also indicated some
will buy it sporadically (when they can afford it).
The fundamental issues that Cebu is faced with include saltwater intrusion and
bacteriological contamination of its groundwater reserves. These are not unique
problems; they often come hand in hand with population and economic growth. In the
mid 1980’s Cebu hired consultants who proposed development of the Mananga River via

161
a dam, reservoir and tunnel connection to Cebu as a lower cost alternative for increasing
the supply of freshwater to Cebu (C. David 1998). No action was taken and no funds
were ever allocated for such a plan. In hindsight, even if city officials and the MCWD
had supported the initiative the city would still need additional supply. In May of 2010
the new mayor elect, his honorable Michael L. Rama, said that securing additional water
was high on his agenda and that Danao has great potential to augment the city’s supply.
Danao is located about 20 km north of Liloan and 40 km north of Cebu City. It is a place
with a colorful history and is known as the “gun town” of the Philippines where skilled
craftsmen produce high quality firearms (Peters 2001). But while this additional supply
would be beneficial, it is not enough to meet Cebu’s needs. It is unclear whether
privatization would provide Cebu the same benefits that Manila realized, but the fact is
that the status quo is not a viable option. The MCWD must face these problems without
delay or be forced to accept outside help in whatever form it comes.
B. Recommendations
After over five years of research into this problem, the unavoidable conclusion is
that Cebu can no longer delay action on the supply side. Conservation is never a bad idea,
but for such a rapidly growing city that already consumes 100% of the water the Carcar
aquifer can provide on a daily basis it cannot be the immediate focus. Repeated tests and
surveys indicate that the SSIPWP’s are doing a great job of providing safe and affordable
water in all parts of the metro area. There are several problems with continued sole
reliance on them though. There is no independent monitoring of them and the observed
high quality could change in some locations without public knowledge. As the aquifer

162
continues to degrade disease outbreaks may occur in populations that do not rely solely
on treated drinking water. Finally these stand-alone operations do not address the need to
increase the overall water supply and with existing supplies already tapped out, rationing
may become necessary with continued population pressure.
The MCWD is staffed by competent and dedicated personnel, but its vision for
the future is in question. It is understandable that the MCWD is opposed to any sort of
privatization. As MCWD union chairman Victor Chiong (2010) stated “…privatization is
an assault on the security of tenure of civil servants and their union's security”. The
union’s official position is that privatization in Manila and abroad resulted in high water
rates and poor water quality. Politics may be constraining their ability to invest in
additional supply outside of additional injection wells into the overstressed Carcar
aquifer. The Ayala Corporation appears to have a good record providing water in Metro
Manila. Given the fact that Cebu has only 10% of Manila’s population and is quite small
physically as well, Ayala may be in a position to assist in building the necessary
infrastructure to augment Cebu’s water supply. This of course depends on many political
and legal hurdles being cleared, not the least of which is the MCWD’s concession rights
and determination to remain independent.
After careful review of the most readily available options including large scale
desalination, it is the opinion of this author that the best long term solution for Cebu
would be to access additional supply via Ayala Corporation’s proposed Carmen-Cebu
bulk water transfer project. This would sharply raise the MCWD’s capacity and is
considered to be the most feasible investment in bulk supply for Cebu. The 25-year
project (at an estimated cost of P2 billion) would require the construction and operation

163
of water facilities that would boost the MCWD’s supply by 50,000 m3/day. Carmen is 45
km (28 miles) north of Cebu City and water would be piped from Carmen's Cantumog-
Luyang River to Cebu. A helpful factor is Carmen’s situation of being water rich and
lightly populated. This additional supply would dwarf the tentative agreement the
MCWD made with the city of Danao for 5,000 m3/day.
For the short term, supply must be increased incrementally to relieve pressure on
the Carcar aquifer. Although it is relatively small, the Danao project would be a good
starting point. The next logical step would be an investment in a scalable reverse osmosis
facility. This could also be pursued relatively quickly. The cost of reverse osmosis
continues to drop as membrane technology advances. Taken together these two steps
should give the city time to complete the bulk water transfer project without a crisis.
When it comes on line the increased supply should ensure the Cebu will be able to
meet the rising demand of the growing population. But in the meantime the city also
needs to address the quality of water that the urban poor rely on since they cannot afford
purified water. The lower income barangays should retain access to their free public wells
and tanker deliveries, but residents should be warned not to rely on this water for
drinking. There are several inexpensive options that would prove beneficial in any
cost/benefit analysis that includes the public health benefit of safe drinking water. A
subsidy could be offered to supply purified drinking water or bottled water from the
MWCD. Another option would be something akin to the LIFESAVER 20,000 jerrycan
which provides 20,000 liters of water before requiring a new filter. Replacement filters
cost less than $150 which results in a cost of less than 1 cent per liter (.07 cents / l); this
converts to 3.15 Philippine pesos per liter which is far cheaper than the MCWD average
164
tariff of 25 pesos per liter. The results of the water quality tests and household surveys in
2010 indicate increasing contamination and public awareness of the problem. The private
purifiers are providing high quality drinking water, but this only underscores the need for
urgent action to protect the Carcar aquifer.
At this time in its history, Cebu radiates with optimism and growth. For this
optimism to be justified and to realize its economic potential, the city must act on a
comprehensive water supply and conservation plan to save its aquifer. It is without
question that those who are most endangered by Cebu’s inability to manage withdrawals
are the urban poor. This basic public health requirement must be fulfilled. In the absence
of a coordinated response to managing its watershed, the hodgepodge of private water
purifiers may only delay the day of reckoning and leave many residents facing ever
increasing health hazards. As Dr. Fe Walag of the USCWRC stated in 2007 “they (the
private water purifiers) may prove to be a band aid if the Carcar aquifer that supplies over
90% of the city’s water is damaged beyond redemption” (Walag 2007).
A chemical analysis of the Carcar aquifer needs to be completed to determine if
more treatment measures need to be considered along with the identified need for
additional supply. Further studies should also include periodic checks for coliform
bacteria from a wide sampling of private wells. This is beyond the scope of this study, but
fortunately there are experienced and capable engineers at the MCWD and the USCWRC
who could perform such work. These two vital organizations, whose relations have
become strained as the water crisis deepened in recent years, must forge a new
relationship based on mutual trust and goodwill for the greater good of this fine city.
Their work is too important for anything less.

165
Appendix
Figure A1: System quote from A + Enterprises:
January 14, 2010 Mr. Chuck McGlynn Labangon, Cebu City Sir: We are pleased to offer you our quotation for a 3000 GPD Skid-mount Man-Automatic Model water purification system for Labangon, Cebu City, for your consideration subject to the terms and conditions stated , as follows: P-3000e Water Purification System, 16-stage complete custom system for water refilling station operations with all booster pumps made of stainless steel, manual backwash multimedia filter & granulated carbon, digital auto-backwash/regeneration ion exchanger, high-capacity R.O. pre-filter, R.O.unit, product storage tank with UV, ozonator, polishing filters, water meter, filling faucets, wash faucet…
One(1) unit Raw water stainless steel booster pump complete with bladder pressure tank & accessories.
One(1) unit Multimedia filter(1cu.ft.) with manual backwash for removal of
sediments. One(1) unit Granulated activated carbon( 1cu.ft.) with manual backwash for
removal of dissolved chemicals, color, offensive odor and unpleasant taste. Yearly cost: P 3,000+ (including labor)
Two(2) units High-capacity R.O. pre-treatment to protect the R.O. unit from clogging. Acts as a polishing sediment filter. Cost of replacement 10micron filter: approx. P200.00/ 2 months the other is a 1 micron washable filter and will be replaced only when needed.
One(1) unit Sodium-cycle Cation exchanger (2.5 cu.ft.) Digital auto-backwash
w/ 80L brine tank.. for removal of hardness minerals dissolved in the water. Protects the R.O. from scale build-up. Cost of salt: P7.00/cubic meter.
One(1) unit Energy saving polyamide Brackish Water Reverse Osmosis unit
(for high TDS water) with low pressure protection, pressure regulator, pressure gauge, 1Hp motor with bolt-type pump head. Cost of replacement: P 14,000.00 unit only.
One(1) unit In-tank UV for product tank for disinfection. Replacement cost of
lamp: P3,000
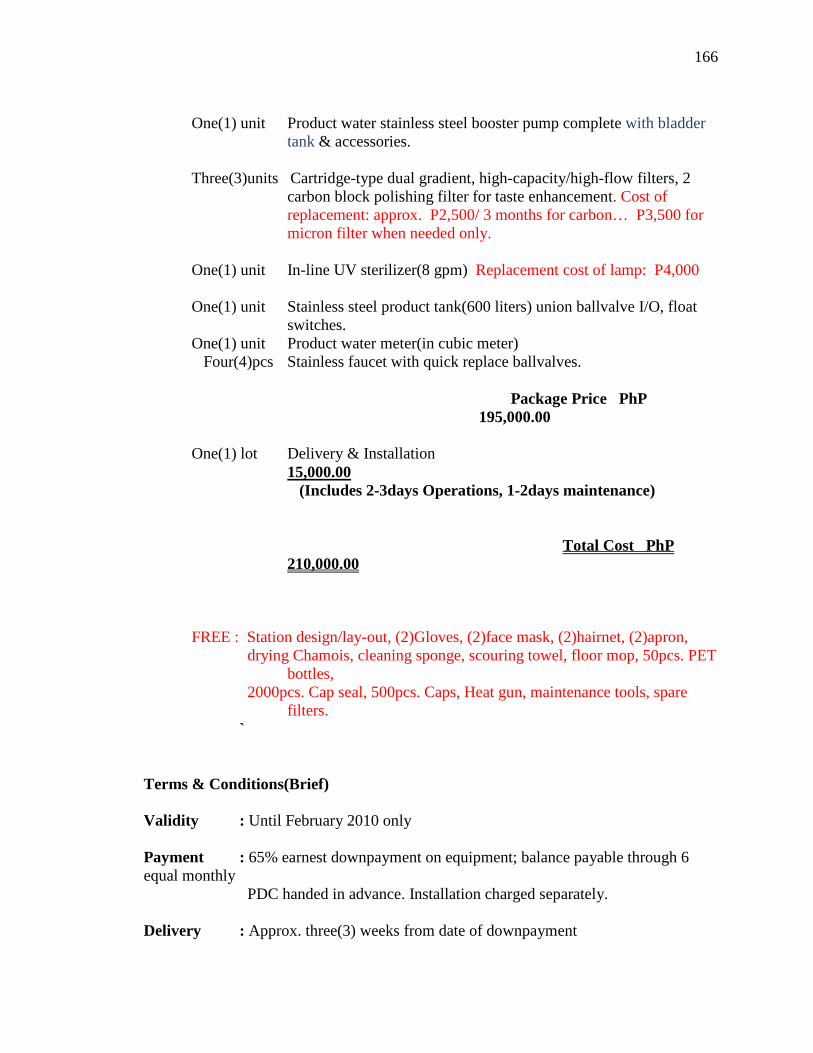
166
One(1) unit Product water stainless steel booster pump complete with bladder
tank & accessories. Three(3)units Cartridge-type dual gradient, high-capacity/high-flow filters, 2
carbon block polishing filter for taste enhancement. Cost of replacement: approx. P2,500/ 3 months for carbon… P3,500 for micron filter when needed only.
One(1) unit In-line UV sterilizer(8 gpm) Replacement cost of lamp: P4,000 One(1) unit Stainless steel product tank(600 liters) union ballvalve I/O, float
switches. One(1) unit Product water meter(in cubic meter)
Four(4)pcs Stainless faucet with quick replace ballvalves.
Package Price PhP 195,000.00
One(1) lot Delivery & Installation
15,000.00 (Includes 2-3days Operations, 1-2days maintenance) Total Cost PhP
210,000.00 FREE : Station design/lay-out, (2)Gloves, (2)face mask, (2)hairnet, (2)apron, drying Chamois, cleaning sponge, scouring towel, floor mop, 50pcs. PET
bottles, 2000pcs. Cap seal, 500pcs. Caps, Heat gun, maintenance tools, spare
filters. ` Terms & Conditions(Brief) Validity : Until February 2010 only Payment : 65% earnest downpayment on equipment; balance payable through 6 equal monthly
PDC handed in advance. Installation charged separately. Delivery : Approx. three(3) weeks from date of downpayment

167
Installation : Ten(10) days from date of delivery including testing. Warranty : Full warranty against factory defects, direct replacement of defective item(s) within stated warranty periods, fares/accommodations/etc . charged to clients acct. Three(3) years on Resin, Multi media & FRP vessels, Two(2) years on all PE filter housing & storage tank, the rest is One(1) year excluding consumables. Limitations : Only Fares, Accommodations are charged to client’s account for scheduled check- ups/visits/6th month cleaning/replacements… on the first year. Unscheduled servicing will be charged a fee accordingly. We hope you’ll find our offer competitive and do business with you in the weeks ahead. Sincerely, Allan F. M. Raborar

168

169
Bibliography
Abella, Francisco D. "Chaos in the Boundaries of the Water Remind Area." Water Reminder 1 (Winter 2004): 21. Print.
American Water Company. Annual Report. Rep. Voorhees, NJ: American Water, 2009.
Print. Association of Barangay Councils. Barangay Profiles 2005 - 2006: A Guide to Cebu City
Barangays. Cebu City: Association of Barangay Councils, 2006. Print. AUICK. Migration and Family Planning - Third Round In-Depth Study. Research
Reports. Asian Urban Information Center of Kobe, 1997. Web. 20 Feb. 2011. Bakker, Karen. "From State to Market?: Water Mercantilización in Spain." Environment
and Planning A 34.5 (2002): 767-90. Print. Bakker, Karen. "The Ambiguity of Community: Debating Alternatives to Private-Sector
Provision of Urban Water Supply." Water Alternatives 1.2 (2008): 236-52. Print Barreveld, Dirk J. Cebu: Leisure and Business Paradise in the Pacific. Mandaue: Arcilla,
1995. Print. Bear, Jacob, A. Cheng, S. Sorek, D. Ouazar, and I. Herrera. Seawater Intrusion in
Coastal Aquifers Concepts, Methods and Practices. AA Dordrecht: Springer Verlag, 1999. Print.
Bennett, Daniel. Clean Water Makes You Dirty: Water Supply and Sanitation in the
Philippines. Rep. Providence: Brown UP, 2007. Print. Broad, Robin, and John Cavanagh. Plundering Paradise: the Struggle for the
Environment in the Philippines. Berkeley: University of California, 1993. Print. Buenaventura, Mae V. "Women and Water Privatization." Jubilee South Asia Pacific
(Dec. 2005). Print. Carpentier, Daniel. Your Guide to Cebu: Philippines. Cebu City, Philippines: PDP
Digital, 2005. Print. Clemente, Roberto S., Ramon P. Abracosa, Cristina C. David, Arlene B. Inocencio, and
Guillermo Q. Tabios. "Metro Manila and Metro Cebu Groundwater Assessment." Philippine Institute for Development Studies (2001): 1-43. Print.
Committee on Advancing Desalination Technology, National Research Council.
Desalination: a National Perspective. Washington, D.C.: National Academies, 2008. Print.

170
Conan, Herve A. The Role of Small Scale Water Providers in Serving the Poor. Rep.
Osaka, Japan: Asian Development Bank, 2002. Web. David, Cristina C., Arlene B. Inocencio, Roberto S. Clemente, Ramon P. Abracosa, and
Francisco M. Largo. "Urban Water Pricing: The Metro Manila and Metro Cebu Cases." Philippine Institute for Development Studies PN 9.8 (2000). Print.
David, Cristina C. "Water in Metro Cebu: The Case for Institutional Reforms." Journal of
Philippine Development 46th ser. XXV.2 (1998): 229-52. Print. Dumol, Mark. The Manila Water Concession: a Key Government Official's Diary of the
World's Largest Water Privatization. Washington, DC: World Bank, 2000. Print. Dunne, Thomas, and Luna B. Leopold. Water in Environmental Planning. San Francisco:
W. H. Freeman, 1978. Print. Emoto, Masaru. The True Power of Water: Healing and Discovering Ourselves.
Hillsboro, OR: Beyond Words Pub., 2005. Print. Exec. Order No. RA9275, 3 C.F.R. (2004). Print.
Falls, Fred, Camille Ransom, James E. Landmeyer, Eric J. Reuber, and Lucy E. Edwards. Hydrogeology, Water Quality, and Saltwater Intrusion in the Upper Floridan Aquifer in the Offshore Area near Hilton Head Island, South Carolina, and Tybee Island, Georgia, 1999–2002. Rep. no. Scientific Investigations Report 2005—5134. Columbia: USGS, 2006. Print.
Fetter, C. W. Applied Hydrogeology. Upper Saddle River, NJ: Prentice Hall, 2001. Print.
Florendo, Abe. Postcards from Cebu. Philippines: Zee Publications, 2004. Print.
Freeze, Allan R., and John A. Cherry. Groundwater. Englewood Cliffs, NJ: Prentice-Hall, 1979. Print.
Gandy, Matthew. Concrete and Clay: Reworking Nature in New York City. Cambridge,
MA: MIT, 2002. Print. Hafner, Jim, Mary Schlarb, and Liberty Pinili. "Community-based Natural Resource
Conflict Management: The Case of Watershed Planning in Metro Cebu, the Philippines." Cornell International Institute for Food, Agriculture and Development (2005): 19-38. Print.
Harper, Peter, and Evelyn S. Peplow. Philippines Handbook. Chico, CA, USA: Moon
Publications, 1991. Print.
171
Hicks, Nigel. This Is the Philippines. London: New Holland, 2001. Print.
Hubbard, Glenn, and William R. Duggan. The Aid Trap: Hard Truths about Ending Poverty. New York: Columbia Business School Pub., 2009. Print.
Johnson, Lyndon B. "Letter to the President of the Senate and to the Speaker of the
House Transmitting an Assessment of the Nation's Water Resources." Letter to Congress. 18 Nov. 1968. MS. Washington, D.C.
Karnow, Stanley. In Our Image: America's Empire in the Philippines. New York:
Random House, 1989. Print. Lenntech BV. "Seawater Intrusion." Lenntech Water Treatment Solutions. Web. 11 Nov.
2010. <http://www.lenntech.com/images/gw-sewater-intrusion2.gif>. Loftus, Alexander J., and David A. McDonald. "Of Liquid Dreams: a Political Ecology
of Water Privatization in Buenos Aires." Environment and Urbanization 13.2 (2001): 179-99. Print.
North Carolina Division of Water Resources. "What Is Ground Water?" North Carolina
Division of Water Resources. Web. 3 May 2009. <http://www.ncwater.org/Education_and_Technical_Assistance/Ground_Water/What/>.
Pacione, Michael. Urban Geography: a Global Perspective. London: Routledge, 2008.
Print. Parras, Diane A. "At Olango, Challenge Spells Opportunity." Overseas Feb. 1999: 2.
Web. Parras, Diane A. "Coastal Resource Management in the Philippines: a Case Study in the
Central Visayas Region." Journal of Environment and Development 10.1 (2001): 80-103. Print.
Parras, Diane A., Maria F. Portigo, and Alan White. "Resource Management in Olango
Island, Cebu: the Challenges and Opportunities." Tambuli: A Publication for Coastal Management Practitioners 4.August (1998): 1-44. Web.
Peters, Jens. Philippines Travel Guide. Bremen, Germany: J. Peters Publications, 2001.
Print. PGWI. "Board of Directors." Philadelphia Global Water Initiative. Web. 10 Dec. 2008.
<http://www.pgwi.org/board.php>. Philippines. City of Cebu. Statistics. Facts and Figures. Census. Web. 4 Aug. 2009.
172
Rips, M. EGS XXVII General Assembly, Nice. 2002. Harvard Abstracts. Web.
Scholze, Olaf. "Protection of the Water Supply of Metropolitan Cebu in Consideration of the Saline Intrusion into Coastal Aquifers Because of Global Warming of Earth's Atmosphere." Proc. of 17th Salt Water Intrusion Meeting, Delft, the Netherlands. Technical University of Hamburg-Harburg, 2002. 489-95. Print.
Todd, David Keith. Groundwater Hydrology 2nd ed. New York: Wiley, 1980. Print.
United States Geological Survey. "USGS Ground-Water Resources Program (GWRP): Freshwater-Saltwater Interactions along the Atlantic Coast." USGS Water Resources of the United States. Web. 07 Mar. 2011. <http://water.usgs.gov/ogw/gwrp/saltwater/salt.html>.
University of San Carlos. Water Resources Center. Coastal Aquifers Ravaged. Cebu:
University of San Carlos, 2004. Print. University of San Carlos. Water Resources Center. Statement on Water Supply. USC
Water Resources Center. 9 Feb. 2006. Web. USCWRC, comp. Cebu Island Rainfall Data. Vol. 2. Cebu, Philippines: University of
San Carlos Water Resource Center, 1985. Print. Van Derslice, James, and John Briscoe. "Environmental Interventions in Developing
Countries: Interactions and Their Implications." American Journal of Epidemiology 141.2 (1994): 135-44. Print.
Vasquez, L. Profiting from People’s Lives: Metro Manila’s Water Privatization Saga.
Rep. Manila: Asia Pacific Movement on Debt and Development, 2005. Print. Water for All: Water Briefs (Should Asia's Urban Poor Pay for Water?). Rep. Kobe,
Japan: Asian Development Bank, 2006. Print. Water in Asian Cities: Utilities' Performance and Civil Society Views - Manila. Rep.
Kobe, Japan: Asian Development Bank, 2004. Print. Wescoat, James L., and Gilbert F. White. Water for Life: Water Management and
Environmental Policy. Cambridge: Cambridge UP, 2003. Print. The World Bank. Approaches to Private Participation in Water Services - A Toolkit. Rep.
Washington: World Bank, 2006. Print. World Health Organization. "Twenty-ninth Session." Committee on Economic, Social
and Cultural Rights. Geneva: United Nations, 2002. Web.

173
List of Interviews Abelgas, Leonora. "2010 Water Survey." Personal interview. 5 Jan. 2010.
Arcayan, Julieta. "2010 Water Survey." Personal interview. 12 Jan. 2010.
Atillo, Michelle. "2010 Water Survey." Personal interview. 31 Dec. 2009.
Atillo, Primi. "Meeting at Our Lady of Lourdes Parish Offices." Personal interview. 15 Jan. 2010.
Avila, Michael. "2010 Water Survey." Personal interview. 5 Jan. 2010.
Babatuan, Melitona. "2010 Water Survey." Personal interview. 12 Jan. 2010.
Cabrera, Oyang. "2010 Water Survey." Personal interview. 3 Jan. 2010.
Cabrera, Oyang. "2010 Water Survey." Personal interview. 14 Jan. 2010.
Catapang, Casiano P. "2010 Water Survey." Telephone interview. 15 Jan. 2010.
Chiong, Victor. "Meeting at Municipal Cebu Water Department (MCWD)." Personal interview. 4 Jan. 2010.
Clampano, Virgie. "2010 Water Survey." Personal interview. 7 Jan. 2010.
Cobol, Analiza. "2010 Water Survey." Personal interview. 4 Jan. 2010.
De La Calzada, Editha. "2010 Water Survey." Personal interview. 8 Jan. 2010.
Delco, Ernest, and Ronnel Magalso. "Meeting with MCWD Engineers." Personal interview. 30 July 2007.
Eleccione, Father Cef. "Metting at Catholic Hermitage." Personal interview. 11 Jan.
2010. Elemia, Daniel. "Meeting with Director of Our Lady of Lourdes Children's Feeding
Program." Personal interview. 25 July 2007. Garces, Girlie. "Meeting at San Miguel Corp. Mandaue Plant." Personal interview. 13
Jan. 2010. Geares, Jennifer. "2010 Water Survey." Personal interview. 12 Jan. 2010.
Gica, Gladys. "Meeting at Cebu Imperial Palace Hotel." Personal interview. 15 Jan. 2010.
174
Gualiza, Engineer Diamisio. "Meeting at Cebu City Management and Planning Office" Personal interview. 4 Jan. 2010.
Labajo, Federita. "2010 Water Survey." Personal interview. 8 Jan. 2010.
Lacombe, Pierre. "Meeting with USGS Hydrologist at West Trenton Office." Personal interview. 23 Feb. 2007.
Lucino, Louella. "Meeting with Philippine Department of Interior Region 7 Director."
Personal interview. 12 Jan. 2010. Macabale, Josephina. "2010 Water Survey." Personal interview. 8 Jan. 2010.
Ochea, William. “2010 Water Survey.” Personal interview. 2 Jan. 2010.
Oliver, Antonio. "2010 Water Survey." Personal interview. 4 Jan. 2010.
Pacana, Arsenio. "Interview with Cebu City Councilor." Personal interview. 12 Jan. 2010.
Quintanes, Paz. "2010 Water Survey." Personal interview. 8 Jan. 2010.
Raborar, Allan F. "Meeting with A+ Enterprises Owner." Personal interview. 14 Jan. 2010.
Rubi, Philip. "2010 Water Survey." Personal interview. 5 Jan. 2010.
Salsado, Edgar. "2010 Water Survey." Personal interview. 6 Jan. 2010.
Sanchez, Dina. "2010 Water Survey." Telephone interview. 14 Jan. 2010.
Secuya, Angelita. "2010 Water Survey." Personal interview. 6 Jan. 2010.
Stansfield, Charles. "Meeting with Dr. Charles Stansfield." Personal interview. 2 Mar. 2007.
Tampus, Major Oliver. "Meeting Camp Lapu Lapu." Personal interview. 11 Jan. 2010.
Van Engelen, Herman. "Meeting with the President of the University of San Carlos Water Resource Center." Personal interview. 5 Jan. 2010.
Villaretti, Paul. "Meeting with Cebu City Civil Engineer." Personal interview. 11 Jan.
2010. Walag, Fe. "Meeting with Director of University of San Carlos Water Resources Center."
Personal interview. 26 July 2007.

175
Walag, Fe. "Follow-up Meeting with Director of University of San Carlos Water
Resources Center." Personal interview. 5 Jan. 2010. Ybanez, William B. "2010 Water Survey." Personal interview. 4 Jan. 2010.

176
Curriculum Vitae
Charles McGlynn
Education BA 1986 Geography, Rowan University, Glassboro, NJ MA 1997 Geography, Rutgers University, New Brunswick, NJ PhD 2011 Rutgers University Geography Program Employment History 2005 – 2011 Assistant Professor (2008-2011), Adjunct Professor (2005-2008), Department of Geography, Rowan University 1990-2007 Customer Service Manager, American Airlines, Philadelphia, PA


