Northwestern Division Spill at Chief Joseph Dam with Flow Deflectors Columbia Basin Water Management Division Reservoir Control Center Water Quality Team December 2011 2011 DISSOLVED GAS AND WATER TEMPERATURE REPORT
Transcript
Northwestern Division
Spill at Chief Joseph Dam with Flow Deflectors Columbia Basin Water Management Division Reservoir Control Center Water Quality Team December 2011
2011 DISSOLVED GAS AND
WATER TEMPERATURE
REPORT
This page is purposely left blank for duplex printing.
2011 DISSOLVED GAS AND WATER TEMPERATURE REPORT
COLUMBIA RIVER BASIN
December 2011
Water Quality Unit Reservoir Control Center, Columbia Basin Water Management Division
U. S. Army Corps of Engineers Northwestern Division Portland, Oregon
Including Material Provided by: Portland District – US Geological Survey (Portland Office)
Walla Walla District – US Geological Survey (Pasco Office) Seattle District – Columbia Basin Environmental.
Corps of Engineers’ Engineering Research and Development Center Fish Passage Center
i
2011 TOTAL DISSOLVED GAS AND WATER TEMPERATURE REPORT
COLUMBIA RIVER BASIN
Table of Contents Table of Contents ................................................................................................................. i List of Tables ...................................................................................................................... iii List of Appendices .............................................................................................................. iii List of Acronyms ................................................................................................................ iv Terminology .......................................................................................................................... v Part 1 Program Description ........................................................................................ 1
1.0 Introduction .................................................................................................... 1 1.1 Clean Water Act and Endangered Species Act .............................................. 2 1.1.1 General ........................................................................................................... 2 1.1.2 Corps’ Goals .................................................................................................. 2 1.1.3 Biological Opinions ....................................................................................... 3 1.1.3.1 Background .................................................................................................... 3 1.1.3.2 USFWS and NOAA Fisheries BiOps ............................................................ 3 1.1.4 TDG Standards ............................................................................................... 3 1.1.5 TDG TMDL Progress .................................................................................... 6 1.1.6 Operating Guidelines ..................................................................................... 6 1.1.7 Changes in Spill Management Policy for Chief Joseph Dam ........................ 7
Part 2 Program Operating Conditions ............................................................................... 7 2.1. Water Year Runoff Conditions ...................................................................... 7 2.1.1 Weather .......................................................................................................... 7 2.1.2 Streamflow ................................................................................................... 10 2.1.3 Reservoir Operation ..................................................................................... 11 2.1.3.1 General ......................................................................................................... 11 2.1.3.2 Flood Control ............................................................................................... 11 2.1.3.3 Total River Flows ......................................................................................... 12 2.1.3.4 Chief Joseph Dam Operations ...................................................................... 14 2.1.3.5 7Q10 Flow .................................................................................................... 17
Part 3 Water Quality Monitoring ............................................................................ 19 3.1 Fixed Monitoring Stations ........................................................................... 19 3.2 Monitoring Plan of Action ........................................................................... 19 3.3 Changes in the FMS ..................................................................................... 19 3.4 Malfunctioning Gauge Occurrences ............................................................ 20 3.5 QA/QC on FMS ........................................................................................... 20 3.5.1 Walla Walla District QA/QC ....................................................................... 20 3.5.2 Portland District QA/QC .............................................................................. 21 3.5.3 Seattle District QA/QC ................................................................................ 22
Part 4 Fish Spill Program ......................................................................................... 22 4.1 Spill .............................................................................................................. 22 4.1.1 Fish Operations Plans ................................................................................... 23 4.1.2 Spring Creek Hatchery Spill ........................................................................ 23
ii
4.1.3 Fish Test Operations .................................................................................... 23 4.1.4 Long Term Turbine Outages ........................................................................ 24 4.1.5 Voluntary Spill ............................................................................................. 25 4.1.6 Involuntary Spill .......................................................................................... 26 4.2 SYSTDG Model ........................................................................................... 28 4.2.1 Highlights from the Statistical Evaluation of SYSTDG .............................. 28 4.2.2 2011 Improvements Made to SYSTDG: ...................................................... 29 4.3 TDG Monitoring Studies ............................................................................. 30
Part 5 Instances of TDG Exceeding WQS ............................................................... 30 5.1. TDG Instance Calculation Methods ............................................................. 30 5.2 TDG Instances - ODEQ/WDOE Calculations ............................................. 30 5.2.1 110 percent TDG Instances .......................................................................... 30 5.2.2 115 percent and 120 percent TDG Instances ............................................... 30 5.2.3 TDG Instances in Oregon............................................................................. 31 5.2.4 Instances of TDG Exceeding 125 percent WQS .......................................... 32 5.2.5 7Q10 Flows Days ......................................................................................... 33 5.2.6 Comparison of Annual TDG Instances ........................................................ 34 5.2.7 Types of Daily TDG Instances ..................................................................... 34 5.2.8 Recurring High TDG Instances .................................................................... 35 5.2.8.1 Bonneville Dam Tailwater ........................................................................... 35 5.2.8.2 McNary Dam Tailwater ............................................................................... 36 5.2.8.3 Chief Joseph Dam Forebay .......................................................................... 36 5.2.8.4 Camas/Washougal ........................................................................................ 36 5.3 TDG Instances - Washington Calculations .................................................. 37 5.3.1 115 percent and 120 percent TDG Instances ............................................... 37 5.3.2 Comparison of Calculation Methods ........................................................... 38
Part 6 Water Temperature ....................................................................................... 38 6.1 State Water Quality Standards for Temperature .......................................... 38 6.2 Daily Water Temperature Exceedances ....................................................... 40 6.3 Dworshak Operations ................................................................................... 42 6.4 Water Temperature Modeling ...................................................................... 43
Part 7 Gas Bubble Trauma Monitoring .................................................................. 43 7.1 Biological Monitoring .................................................................................. 43
iii
List of Tables Table 1 Columbia River Basin Percent Precipitation WY 2011 Table 2 Columbia River Flow WY 2011 Table 3 Spill Shift Flow Rates and Resultant 12-Hour Average Percent TDG Table 4 Dates When 7Q10 Flows Were Exceeded in 2011 Table 5 2011 FOPs Spill Operations Table 6 2005 - 2011 Spill Seasons Number of TDG Instances Exceeding WQS Table 7 2011 Spill Season Number of TDG Instances Exceeding ODEQ WQS Table 8 Number of Days When 7Q10 Flows Were Exceeded in 2011 Table 9 2005 - 2011 Annual Comparison of TDG Instances Exceeding WQS Table 10 2005 - 2011 Spill Seasons Types and Number of TDG Instances Table 11 2011 Comparison of High 12-hour Average TDG Calculation Methods Table 12 2008 - 2011 Comparison of High 12-hour Average TDG Calculation Methods Table 13 State Temperature Water Quality Standards the Lower Snake River Table 14 State Temperature Water Quality Standards the Lower Columbia River Table 15 State Temperature Water Quality Standards the Colville Confederated Tribes Table 16 2005 - 2011 Number of Days with 24-hour Average Above 68oF Table 17 2011 Daily Average Temperature Information List of Figures Figure 1 2011 Water Supply Forecast at The Dalles Figure 2 2011 Bonneville Dam Flow and Spill Figure 3 2011 Ice Harbor Dam Flow and Spill Figure 4 2011 Chief Joseph Dam Flow and Spill Figure 5 2011 Grand Coulee Dam Flow and Spill Figure 6 2011 Lower Granite Dam Flow and Spill List of Appendices Appendix A Monitoring Stations* Appendix B Corps of Engineers 2010-14 Dissolved Gas Monitoring Plan of Action* Appendix C Fish Operations Plans* Appendix D Fish Operations Plan Spill Appendix E Court Reports With Hourly Spill, Flow, and TDG* Appendix F Percent TDG Instance Tracking Appendix G Statistical Evaluation of SYSTDG* Appendix H Dworshak Operations Appendix I Walla Walla District TDG Report* Appendix J Portland District TDG Report - USGS Data Series Report* Appendix K Seattle District TDG Report* Appendix L Gas Bubble Trauma Monitoring and Data Reporting Appendix M TDG TMDL Note: Appendices with * are provided electronically and not in hard copy. They can be found at http://www.nwd-wc.usace.army.mil/tmt/wqnew/tdg_and_temp/2011/
iv
List of Acronyms The following acronyms are used throughout this report. BiOp Biological Opinion BPA Bonneville Power Administration Cfs cubic feet per second Corps U.S. Army Corps of Engineers CRT Columbia River Treaty DCP data logger/controller ESA 1973 Endangered Species Act FCOP Flood Control Operating Plan FCRPS Federal Columbia River Power System FMS fixed monitoring station FPE fish passage efficiency FOP Fish Operations Plan FPIP Fish Passage Implementation Plan FPP Fish Passage Plan GBT gas bubble trauma kcfs thousand cubic feet per second kaf thousand acre feet LCA Libby Coordination Agreement Maf million acre-feet MOP minimum operating pool NMFS National Marine Fisheries Service (also, NOAA Fisheries) NOAA Fisheries National Oceanic and Atmospheric Administration, Fisheries NWRFC Northwest River Forecast Center NWF National Wildlife Federation NWPC Northwest Power and Conservation Council ODEQ Oregon Department of Environmental Quality PUDs Public Utility Districts QA quality assurance QC quality control RCC Reservoir Control Center RO regulating outlet ROCASOD Record of Consultation and Summary of Decision ROD Record of Decision RPA Reasonable and Prudent Alternative (from the Biological Opinion) SW spillway weir SSARR Streamflow Synthesis and Reservoir Regulation model TDG total dissolved gas TMT Technical Management Team TMDLs Total Maximum Daily Loads
v
USFWS United States Fish and Wildlife Service Reclamation United States Bureau of Reclamation USGS United States Geologic Service VARQ Variable Q, a variable flow associated with Libby flood control WDOE Washington Department of Ecology WQS Water Quality Standards WQT Water Quality Team WY water year Terminology The US Army Corps of Engineers (Corps) has noted different agencies applying various definitions to common terminology. The following are the Corps’ definitions used throughout this report. FCRPS Action Agencies: The three federal agencies responsible for the operation of the FCRPS are the Corps, Reclamation, and BPA. Involuntary Spill: Spill that occurs when there are:
1. Hydrologic conditions and river flows that exceed the hydraulic capacity of hydro-power generation facilities; or
2. Market for the electricity generated from the hydro power system is less than produced by the current river flow.
Other causes of involuntary spill include: activities necessary to safely manage dam facilities such as passing debris, scheduled or unscheduled turbine unit outages, or other operational and/or maintenance activities. Lack of Load: The condition where there is a lack of market for electricity generated. Percent TDG: Percent of total dissolved gas saturation or concentration in the water body. Reserves: The amount of generation capacity above the amount currently in use that is always and immediately ready when needed to maintain system reliability. SSARR: The Streamflow Synthesis and Reservoir Regulation (SSARR) model is an operational hydrologic model of a river system used for flood control studies, planning studies, and daily streamflow forecasting. Spill cap: Spill caps are the maximum spill that can occur to meet the high 12-hour percent TDG average to meet the applicable state water quality standards, generally, 115 percent in the forebay or 120 percent in the tailwater.
vi
Spill Priority List: A list that provides the order of dams that spill for lack of load conditions. TDG Instance: Instances occur when TDG levels exceed state standards and applicable waivers and rule adjustments. TMT: The Technical Management Team is an interagency technical group responsible for making recommendations on operations for fish to the federal agency with authority to operate FCRPS projects. This group is comprised of representatives from sovereign entities including five Federal agencies (Bonneville Power Administration (BPA), Bureau of Reclamation (Reclamation), NOAA Fisheries, US Fish and Wildlife Service (USFWS), Corps, four states (Idaho, Oregon, Montana, and Washington), and participating Tribes. Unit Outage: A unit outage is a period of time when a generating unit cannot be in operation because of maintenance or repairs. Voluntary Spill: Operational decision to pass water through a dam spillway, or spill to assist juvenile salmon and steelhead migration through the Federal Columbia River Power System (FCRPS). Voluntary spill is used to decrease the residence time of juvenile salmon and steelhead in the forebay of mainstem dams through the lower Columbia and Snake rivers. Spill is also used at Dworshak Dam to provide additional water for flow augmentation and to improve temperature conditions in the lower Snake River. The amount of voluntary spill is adjusted so that the resulting percent TDG associated with spill are consistent with applicable state water quality standards, and may be limited by in-river flow.
1
Part 1 Program Description 1.0 Introduction This report describes the US Army Corps of Engineers’ (Corps) Columbia River Basin spill and water quality monitoring program for 2011 and covers the Columbia and Snake River dams located in Washington, Idaho and Oregon. This report was developed to meet the Corps’ water quality program reporting responsibilities related to the Oregon Department of Environmental Quality (ODEQ) Total Dissolved Gas (TDG) waiver, the Washington Department of Ecology (WDOE) TDG rule adjustment and the 2002 and 2003 TDG Total Maximum Daily Loads (TMDLs) for the lower Columbia and lower Snake rivers. This report provides information requested by ODEQ and WDOE including weather, flow and runoff conditions for the spill season, spill quantities and durations, quantities of water spilled for fish versus spill for other reasons for each dam, information regarding project operations, data from the physical and biological monitoring programs, description and results of any biological or physical studies of spillway structures and prototype fish passage devices, and progress on implementing measures contained in the lower Columbia and Snake rivers TDG TMDL documents. This report also includes documentation on the performance of the TDG monitoring system, and the 2010 BiOp, Reasonable and Prudent Alternative (RPA) Actions 4, 15, 26, 29 and 32. The following is a list of the appendices included in this report. Note: Appendices with * are provided electronically on the website at: http://www.nwd-wc.usace.army.mil/tmt/wqmew/tdg_and_temp/2011.
• Appendix A* - General overview of the monitoring system with information on the fixed monitoring stations (FMS).
• Appendix B *- Dissolved Gas Monitoring Plan of Action for 2010 – 2014, updated in 2011.
• Appendix C *- Fish Operations Plans (FOP) for 2011 spill season. • Appendix D - Reports on the FOP spill volumes for 2011. • Appendix E *- 2011 monthly Court Reports filed with the Court during spill
season. This appendix contains graphs of flow, spill and high 12-hour percent TDG average along with variance tables.
• Appendix F - Summary of TDG instance types when TDG levels exceed state WQS.
• Appendix G* - Detailed evaluation of the SYSTDG model performance during the 2011 spill season.
• Appendix H - Dworshak summer operations. • Appendix I* - Walla Walla District report on the Quality Assurance/Quality
Control (QA/QC) review for TDG and temperature monitoring gauges at Lower Granite, Little Goose, Lower Monumental, Ice Harbor, and McNary dams.
• Appendix J *- Portland District report on the QA/QC review for TDG and temperature monitoring gauges at John Day, The Dalles, Bonneville, and the Warrendale and Camas/Washougal sites.
• Appendix K* - Seattle District report on the QA/QC review for TDG and temperature monitoring gauges at Chief Joseph Dam.
• Appendix L - Gas Bubble Trauma Monitoring and Data Reporting by the Fish Passage Center.
• Appendix M - TDG TMDL implementation summary providing an overview of the status of the Corps’ TDG TMDL activities.
1.1 Clean Water Act and Endangered Species Act 1.1.1 General TDG and water temperature are primary water quality parameters monitored in the mainstem Columbia and Snake rivers in the states of Idaho, Oregon and Washington. TDG may be influenced by dam water management operations (e.g. water released over the dam spillways, releases through the powerhouses and other facilities, and forebay and tailwater water surface elevations) as well as environmental factors including water temperature and wind conditions. Voluntary spill is monitored at the following Corps’ Columbia River basin dams:(Bonneville, The Dalles, John Day, McNary, Chief Joseph, Ice Harbor, Lower Monumental, Little Goose, Lower Granite, and Dworshak.) In coordination with the Bureau of Reclamation (Reclamation), the Corps also monitors and sets spill caps for Grand Coulee Dam. Dam operating data and water quality monitoring data are reviewed daily as part of the process of setting spill caps to maintain TDG levels within the 115 and 120 percent TDG criteria. The Corps tracks instances when TDG and temperature criteria are exceeded relative to state standards and applicable waivers and rule adjustments; and when feasible, actions are taken to meet the criteria. The monitoring performed by the Corps’ Reservoir Control Center (RCC) is part of a larger interagency water quality monitoring system operated by the Corps that also includes the Reclamation and the Washington Public Utility District (PUD) monitoring systems (as conducted by Douglas County PUD, Chelan County PUD, and Grant County PUD). 1.1.2 Corps’ Goals The Corps’ policy is to comply with WQS to the extent practicable regarding nationwide operation of water resources projects. The general policy is summarized in the Corps Digest of Water Resources Policies and Authorities, Engineering Pamphlet 1165-2-1, Section 18-3.b, page 18-5 dated July 30, 1999 which states:
Although water quality legislation does not require permits for discharges from reservoirs, downstream water quality standards should be met whenever possible. When releases are found to be incompatible with state standards they should be studied to establish an appropriate course of action
3
for upgrading release quality, for the opportunity to improve water quality in support of ecosystem restoration, or for otherwise meeting their potential to best serve downstream needs. Any physical or operational modification to a project (for purposes other than water quality) shall not degrade water quality in the reservoir or project discharges.
1.1.3 Biological Opinions 1.1.3.1 Background With the listing of certain Snake River salmonids in 1991 under the Endangered Species Act (ESA), the Corps implemented a variety of operational and structural measures to improve the survival of listed stocks; several actions include operations that have an effect on water quality. Providing spill for passage of ESA listed juvenile salmon has been a part of the biological opinions addressing actions to improve salmon survival since the initial listings in 1991. Water management operations to reduce water temperature in the lower Snake River for the benefit of listed Snake River fall Chinook salmon have also been an objective of the biological opinions. For this reporting period, the ESA biological opinions (BiOp) that the Corps is implementing are the 2000 USFWS FCRPS Biological Opinion and the 2008/2010 NOAA Fisheries FCRPS Biological Opinion. 1.1.3.2 USFWS and NOAA Fisheries BiOps USFWS 2000 BiOp According to the USFWS 2000 BiOp for the FCRPS, operational and structural changes are to be made to reduce uncontrolled spill and the effects of high TDG at lower Columbia River dams if it is determined that bull trout are affected by the FCRPS. NOAA Fisheries 2008 and 2010 FCRPS BiOps The 2008/2010 NOAA Fisheries FCRPS BiOp (2008/2010 BiOp) RPA includes operations that have an effect on water quality: RPA Actions 4, 15, 26, 29 and 32. For the 2011 fish migration season, the U.S. District Court of Oregon ordered the Federal agencies to operate the FCRPS in accordance with the 2011 Spring and Summer Fish Operations Plans (FOP), which are provided in Appendix C. The FCRPS BiOps may be found at the following website: http://www.salmonrecovery.gov/BiologicalOpinions/FCRPS/2010SupplementalFCRPSBiOp.aspx 1.1.4 TDG Standards The following are the applicable TDG water quality standards as currently approved by the Confederated Tribes of the Colville Reservation and the states of Idaho, Oregon, and Washington. Confederated Tribes of the Colville Reservation TDG Standards: 4-8-5(e): The Water Quality Standards herein established for the TDG shall not apply when the stream flow exceeds the seven (7) day, ten (10) year frequency flood.
4-8-6 (b) (3) (E): Total Dissolved Gas shall not exceed 110 percent of saturation at any point of sample collection. State of Idaho: IDAPA 58.01.02-250- 01(b): The total concentration of dissolved gas not exceeding one hundred ten percent (110%) of saturation at atmospheric pressure at the point of sample collection. State of Oregon: OAR 340-041-0031:
• Waters will be free from dissolved gases, such as carbon dioxide, hydrogen sulfide, or other gases, in sufficient quantities to cause objectionable odors or to be deleterious to fish or other aquatic life navigation, recreation, or other reasonable uses made of such water.
• Except when streamflow exceeds the ten-year, seven-day average flood, the concentration of TDG relative to atmospheric pressure at the point of sample collection may not exceed 110 percent of saturation. However, in hatchery-receiving waters and other waters of less than two feet in depth, the concentration of TDG relative to atmospheric pressure at the point of sample collection may not exceed 105 percent of saturation.
OAR 340-041-104(3): Total Dissolved Gas. The Commission may modify the total dissolved gas criteria in the Columbia River for the purpose of allowing increased spill for salmonid migration. The Commission must find that:
(a) Failure to act would result in greater harm to salmonid stock survival through in-river migration than would occur by increased spill;
(b) The modified total dissolved gas criteria associated with the increased spill provides a reasonable balance of the risk of impairment due to elevated total dissolved gas to both resident biological communities and other migrating fish and to migrating adult and juvenile salmonids when compared to other options for in-river migration of salmon;
(c) Adequate data will exist to determine compliance with the standards; and
(d) Biological monitoring is occurring to document that the migratory salmonid and resident biological communities are being protected;
(e) The Commission will give public notice and notify all known interested parties and will make provision for opportunity to be heard and comment on the evidence presented by others, except that the Director may modify the total dissolved gas criteria for emergencies for a period not exceeding 48 hours;
(f) The Commission may, at its discretion, consider alternative modes of migration.
5
The Corps received a TDG waiver on June 24, 2009 from the State of Oregon effective for the 2011-2014 spill seasons from April1 – August 31. The Environmental Quality Commission approved a modification to the 110 percent total dissolved gas water quality standard for voluntary spill at McNary, John Day, The Dalles and Bonneville dams on the lower Columbia River, subject to the nine conditions. Two operational conditions are highlighted for the purposes of this report:
(iii) Spill must be reduced when the average TDG concentration of the 12 highest hourly measurements per calendar day exceeds 120 percent of saturation in the tailraces of McNary, John Day, The Dalles, and Bonneville dams monitoring stations.
(iv) Spill must be reduced when instantaneous TDG levels exceed 125 percent of saturation for any 2 hours during the 12 highest hourly measurements per calendar day in the tailraces of McNary, John Day, The Dalles, and Bonneville dams monitoring stations.
State of Washington: WAC 173-201A-200(1)(f): Aquatic life total dissolved gas criteria. TDG is measured in percent saturation. Table 200 (1)(f) lists the maximum TDG criteria for each of the aquatic life use categories.
TABLE 200 (1)(f) Aquatic Life Total Dissolved Gas Criteria in Fresh Water
(i) The water quality criteria established in this chapter for TDG shall not apply when the stream flow exceeds the seven-day, ten-year frequency flood. (ii) The TDG criteria may be adjusted to aid fish passage over hydroelectric dams when
Category Percent Saturation Char Spawning and Rearing Total dissolved gas shall not exceed
110 percent of saturation at any point of sample collection.
Core Summer Salmonid Habitat
Same as above.
Salmonid Spawning, Rearing, and Migration
Same as above.
Salmonid Rearing and Migration Only
Same as above.
Non-anadromous Interior Redband Trout
Same as above.
Indigenous Warm Water Species
Same as above.
6
consistent with a department approved gas abatement plan. This plan must be accompanied by fisheries management and physical and biological monitoring plans. The elevated TDG levels are intended to allow increased fish passage without causing more harm to fish populations than caused by turbine fish passage. The following special fish passage exemptions for the Snake and Columbia rivers apply when spilling water at dams is necessary to aid fish passage: • TDG must not exceed an average of 115 percent as measured in the forebays of the next downstream dams and must not exceed an average of 120 percent as measured in the tailraces of each dam (these averages are measured as an average of the twelve highest consecutive hourly readings in any one day, relative to atmospheric pressure); and • A maximum TDG one hour average of 125 percent must not be exceeded during spillage for fish passage. On June 30, 2010, WDOE approved the gas abatement plan, submitted March 22, 2010. Two conditions are highlighted for the purpose of this report:
1) This approval shall extend through the end of February 2015 and apply to Corps’ dams on the Columbia and Snake rivers in Washington State.
2) This approval allows spill to increase the dissolved gas levels above 110 percent of saturation to aid fish passage, but not to exceed 125 percent of saturate as a one-hour average. Gas saturation may not exceed 120 percent in the tailrace and 115 percent in the forebay of the next downstream dam as measured by the highest 12-hour, consecutively- averaged value in any one day.
1.1.5 TDG TMDL Progress The ODEQ waiver and the WDOE rule adjustment request an update on the progress of implementing actions recommended in the “TMDL for the Lower Columbia River Total Dissolved Gas (Sept 2002),” and the “TMDL for the Lower Snake River Total Dissolved Gas (April 2003),” reports. Appendix M provides the status of the Corps’ TDG TMDL implementation activities. 1.1.6 Operating Guidelines The Corps’ RCC Water Quality Unit is responsible for monitoring the TDG and water temperature conditions in the forebay and the tailwater of the Columbia and Snake River dams, and selected river sites. The Corps’ District water quality staff operates and maintains the water quality gauges at the FMSs. In accordance with the Corps’ Northwestern Division operational water management guidelines, spill levels and spill patterns at the dams are monitored and changed so that TDG levels are consistent with the applicable state WQS. Both ODEQ and WDOE modified their WQS during the last five years. Prior to 2006, ODEQ and WDOE specified the method of calculating the “daily percent TDG” as an average of the 12 highest hourly readings in a given day at the forebay and the tailrace. For the purposes of this report, this method is referred to as the “ODEQ/WDOE method.”
7
In November 2006, WDOE changed the method of calculating percent TDG to “an average of the twelve highest consecutive hourly readings in any one day.” For the remainder of this report, this method is referred to as the “WDOE method.” Part 5 of this report provides detailed information on the TDG instances using the ODEQ/WDOE and WDOE methods with an evaluation and comparison of these two methods. In 2008 ODEQ determined that the 115 percent TDG standard and forebay gauges were no longer a component of the waiver. As a result, ODEQ applies the state water quality standards to tailwater gauges only using the average of the 12 highest hourly readings in a given day. (See Part 5.2.3 for more information.) Some of the changes to the WQS were not implemented in 2011 because the Corps was operating under a Court Order to continue implementation of spill as was done in recent years (2007 through 2010). The Corps continued using forebay gauges and calculating the 12-hour average using the ODEQ/WDOE method during the 2011 spill season. Adjustments were made to the upstream dam spill caps1
to maintain TDG levels at or below 115 percent in the forebay, and 120 percent in the tailwater.
1.1.7 Changes in Spill Management Policy for Chief Joseph Dam In order to better manage high system TDG levels in the Columbia River during the 2011 spill season, the Corps modified the spill management process for Chief Joseph Dam. The spill priority list, which identifies project priority for involuntary spill, was changed to move Chief Joseph Dam up on the list. The purpose of this change was to utilize the Chief Joseph Dam flow defectors as a tool to reduce the high TDG levels coming from Grand Coulee Dam. Spill was managed to attempt to achieve 120 percent TDG in the tailwater or 115 percent TDG in the Wells Dam forebay to the extent possible. This change was coordinated with regional sovereigns and the Chief Joseph Dam operational data is included in this report and Appendices D, F, and G. For more information regarding Chief Joseph Dam operations see Part 2.1.3.4. Part 2 Program Operating Conditions 2.1. Water Year Runoff Conditions This part provides an overview of the water year runoff and reservoir operations, including a description of the weather, streamflow, and reservoir operations. 2.1.1 Weather The 2011 water year (over the 12-month period beginning in October 2010), was slightly above average in precipitation as shown in Table 1. The cumulative precipitation as reported by the Northwest River Forecast Center (NWRFC) for water year 2011 was 106
1 The spill cap evaluation typically includes review of the water volume, water elevation (where applicable), powerhouse and spillway characteristics (where applicable), current and future special operations, current TDG levels in the forebay and tailwater, water temperatures, short- and long-term weather forecasts, and SYSTDG modeling.
8
percent of average (1971 to 2000) in the Columbia River above Grand Coulee Dam, 111 percent of normal in the Snake River above Ice Harbor Dam, and 109 percent of normal in the Columbia River above The Dalles Dam. In October 2010 a persistent jet stream over the northwest U.S. and southwest Canada brought a series of low pressure systems to the area pushing the monthly precipitation to above normal for much of the region and causing some of flooding in western Washington. In November 2010 the low pressure trough continued to reside over the western U.S. and Canada for much of the month bringing cold air down from the arctic into the region and keeping temperatures cooler than normal. Precipitation was near normal for the period for most of the region with the exception of southern British Columbia where precipitation was slightly below average. In December 2010, unsettled upper level flow kept weather showery and temperatures near normal for the first week of December. By the second week, southwesterly upper level flow set up over the region bringing above normal temperatures and precipitation. With moist conditions in place, a cold front that came during the middle of the second week produced heavy rain and snow through much of the region west of the Cascade Mountains. Runoff associated with this event brought high water to much of the area and broke many daily precipitation records. Later in the month, a low pressure system kept weather unsettled and temperatures below normal. The end-of-month (January 1) water supply forecast for The Dalles for the runoff period (April – August) was 90 Maf, which is shown in Figure 1.
FIGURE 1 2011 Water Supply Forecast at The Dalles
9
January 2011 started off cold with northerly upper level flow pushing cold continental air through much of southern British Columbia. This cold air and clear conditions helped strengthen the inversion and brought very cold temperatures to many valley areas. By the second week of the month, high pressure began to build over the southern half of the basin bringing warmer and drier than normal conditions to the region. The end-of-month water supply forecast measured at The Dalles for the runoff period (April – August) was 92 Maf. February started out warm on the west side of the Cascades and cooler on the east. These conditions changed quickly as temperatures dropped and progressive upper level flow brought cold temperatures and some heavy precipitation to the region. Conditions remained stormy throughout the remainder of the month. The end-of-month water supply forecast at The Dalles for the runoff period (April – August) was 93 Maf. The stormy conditions of February continued through the month of March, with above average precipitation and near normal temperatures. The March end-of-month water supply forecast increased somewhat for the runoff period (April – August) to 101 Maf at The Dalles. However, during the month of April, the jet stream brought a cold low pressure system over the northwest U.S. and southern British Columbia. Temperatures were well below normal and many daily and seasonal records were broken. Systems were often wet as well bringing above average rain and snow to the region. This increase in precipitation resulted in a corresponding increase in the end-of-month water supply forecast for the runoff period (April – August) to 113 Maf at The Dalles. The April weather conditions continued through the month of May, with above average precipitation and snow. This further increased the May end-of-month water supply forecast for the runoff period (April – August) at The Dalles to 126 Maf. In June, the jet stream moved north up into British Columbia but still brought cool wet storms to southern British Columbia and the northwest U.S. Fairly widespread accumulating snow continued through the region through the third week of the month. Generally warmer conditions prevailed during the last week of the month, melting snow and increasing flows in many rivers. The final June water supply forecast at The Dalles reached 128 Maf. Through most of July, an upper level low pressure trough resided over the eastern Pacific Ocean and into British Columbia, Washington and Oregon. This kept cool conditions through the region and brought higher than normal precipitation to British Columbia. Gulf-moisture wrapped around the four corners region and brought showers and thunderstorms to parts of the eastern Cascades and inter-mountain west. Temperatures were generally around normal and precipitation was above normal. In August, a large scale low pressure trough over the eastern Pacific Ocean helped keep a high pressure ridge over most of the northwest U.S. and southern British Columbia. Southeast Idaho and northwest Wyoming received above normal precipitation as well, due
10
to strong monsoonal flow into this region from the desert southwest, adding to flows in the Snake River. The rest of the Columbia River Basin saw dry and warm conditions, which persisted through the month of September.
TABLE 1 Columbia River Basin Percent Precipitation
WY 2011
Note: Percent precipitation as percentage of the 1971-2000 average. 2.1.2 Streamflow The NWRFC April 1, 2011 forecast of January through July runoff for the Columbia River above The Dalles Dam was 117 Maf, however, the actual observed runoff volume was 137 Maf. This value is high compared to the historical average (1971-2000) January-July runoff volume of 107 Maf. The WY 2011 daily average unregulated stream flow in the basin above The Dalles Dam was above average and approximately 51 percent higher than WY 2010 average flow, which was 79 percent of normal. Table 2 provides WY 2011 average monthly unregulated streamflow and the percentage of the 1971-2000 average monthly flows for the Columbia River at Grand Coulee and The Dalles dams. Unregulated flows provide a general perspective on the water supply for that month or year from rainfall or snow melt. The average monthly unregulated inflows during spring runoff were highest in June 2011; 155 percent of average at The Dalles Dam. The WY 2011 total runoff volume at The Dalles Dam was 166 Maf, which is 120 percent of the 1971-2000 average.
Unregulated flows have been adjusted to exclude the effects of regulation provided by storage reservoirs.
2.1.3 Reservoir Operation The following overview of reservoir operations includes a description of flood control, operations, total river flows, and 7Q10 Flows. 2.1.3.1 General The WY 2011 began with Grand Coulee Dam storage at 97 percent full. Projected water supply forecasts increased rapidly in April and May for The Dalles as shown in Figure 1. The final water supply was above average across the Columbia Basin (April-August runoff of 128 Maf as measured at The Dalles which is 133 percent of normal), and the shape of the runoff included one large, long peak starting the first week of April and continuing through the end of July. This resulted in a broad regulated peak in the system with flows at Bonneville Dam being about 500 kcfs for several weeks as shown in Figure 2. Generally, objectives included: reaching the upper rule curve elevation on or about April 10 at the U.S. storage projects; refill on, or about June 30; and, drafting reservoirs to summer draft limits. The spring flow objectives were met at Priest Rapids, McNary Dam, and Lower Granite Dam. The summer flow objectives were met at McNary Dam and Lower Granite Dam. 2.1.3.2 Flood Control The NWRFC 2011 water supply forecasts were significantly above normal across the Columbia River Basin, Upper Columbia Basin, and the Snake River Basin. Inflow
Unregulated Flow, cfs % of Average Unregulated Flow, cfs % of AverageOctober 2010 49,734 111 86,538 105
forecasts and reservoir regulation modeling were performed weekly throughout the winter and spring. The FCRPS dams were operated to their specified flood control elevations based on the information available during the season. This included the treaty projects operating to the May 2003 Flood Control Operating Plan (FCOP) except for Libby Dam, which operated to VARQ drafts. The unregulated peak flow (based on the Corps’ system regulation model (SSARR) at The Dalles Dam, was estimated at 769 kcfs on June 15, 2011, and a regulated peak flow of 498 kcfs occurred on June 4, 2011 as measured at the USGS gauge at The Dalles, Oregon. The unregulated peak stage at Vancouver, Washington, was calculated to be 25.5 feet on June 16, 2011, and the highest observed stage was 17.4 feet on June 1, 2011. 2.1.3.3 Total River Flows System flows were much higher in 2011 than in recent years due to the larger runoff volume. This resulted in higher releases and more spill at many of the hydro projects as demonstrated in the three examples shown below: Bonneville for the lower Columbia, Ice Harbor for the lower Snake and Chief Joseph for the middle Columbia reach. Daily average total river flows on the lower Columbia River, as measured at Bonneville Dam, from April 1 through August 31, ranged from 160 kcfs to 507 kcfs, averaging 335 kcfs (see Figure 2). Daily average flow remained high from May 13 through July 29, which resulted in involuntary spill at Bonneville of almost 200 kcfs for close to three months in addition to the voluntary spill for fish passage of approximately 100 kcfs. Flows began to recede in late July and continued a steady recession until the end of August when flows reached 160 kcfs.
FIGURE 2 2011 Bonneville Dam
Flow and Spill
Note: Daily powerhouse capacities provided by BPA Duty Schedulers.
On the lower Snake River, as measured at Ice Harbor Dam, daily average total river flow from April 1 through August 31, ranged from 32 kcfs to 216 kcfs averaging 114 kcfs (see Figure 3). Daily average flow remained high from May 14 through July 12, resulting in involuntary spill ranging from 30 to 60 kcfs for two months in addition to 27.8 to 66.1 kcfs of voluntary spill. Flows began to recede in late July and continued a steady recession until the end of August when flows reached 32 kcfs.
FIGURE 3 2011 Ice Harbor Dam
Flow and Spill
Note: Daily powerhouse capacities provided by BPA Duty Schedulers.
Daily average total river flows on the mid-Columbia River, as measured at Chief Joseph Dam, from April 1 through August 31, ranged from 39 kcfs to 277 kcfs, averaging 176 kcfs (see Figure 4). Flows began to drop in late July and continued a steady recession until the end of August when flows reached 39 kcfs.
Note: Daily powerhouse capacities provided by BPA Duty Schedulers.
2.1.3.4 Chief Joseph Dam Operations The main objective of modifying operations at Chief Joseph Dam in 2011 was to minimize system wide TDG levels. In 2011, high flows in the Columbia River basin resulted in large quantities of spill and elevated TDG levels throughout the system. An effective mechanism to manage the high system TDG levels was to preferentially utilize the Chief Joseph spillway with flow deflectors, which were effective in reducing percent TDG that were being produced at Grand Coulee Dam. Two actions were taken to help moderate the high system TDG levels and the impact on the river system: (1) initiating the Spill Shift between Grand Coulee Dam and Chief Joseph Dam; and, (2) shifting other system reserves or lack of load operations to Chief Joseph Dam by moving the project up the spill priority list. Implementation of the Spill Shift at Chief Joseph Dam from May 16 through June 24 reduced percent TDG by maximizing the available power generation at Grand Coulee Dam and reducing spill through the outlet tubes, and concurrently reducing power generation at Chief Joseph Dam resulting in an increase in spill. When required releases from Grand Coulee Dam exceed power plant capacity or BPA’s request for generation, the excess flow must be released either through the outlet tubes or over the drum gates (spillway). When the forebay elevation is less than about 1266 feet2
2 Drum gate spill at elevations greater than 1265.5 ft even though very small amounts; 5 kcfs at 1266 and 16 kcfs at 1267 per gate.
, flow in excess of planned power operations is passed through the outlet tubes, a series of 40 conduits with outlets located on
the spillway face at elevations 1050 and 1150 feet. When the forebay elevation is greater than about 1266 feet, Grand Coulee Dam can pass this additional flow over the drum gates. The intent of the Spill Shift was to avoid spill via the Grand Coulee outlet tubes, which produce high percent TDG (documented in a field study conducted by the Bureau of Reclamation (Frizell, 1997)). Once Grand Coulee Dam elevations were sufficient to use the drum gates, TDG production was reduced. Shifting other system reserves to Chief Joseph Dam also aided in TDG management of the Columbia River. With the shift of other hydro project power reserves3
to Chief Joseph Dam, additional spill at Chief Joseph Dam could be utilized to provide additional degassing of percent TDG from Grand Coulee Dam. Normally, Grand Coulee Dam carries roughly half of the system-wide reserves in the Northwest. From Mid-May to the end of June 2011, Chief Joseph Dam carried reserves that normally would have been carried at Grand Coulee Dam plus the reserves for other power facilities in the system to maximize Grand Coulee Dam power generation (as approximately 84 kcfs of powerhouse hydraulic capacity was unavailable due to maintenance outages). This resulted in a reduction of Chief Joseph’s powerhouse generation.
These two actions were extremely important and effective for system TDG management in 2011. The Grand Coulee forebay elevation was below 1267 feet from February 24 through June 24 while flows through the project ranged from 80 kcfs to 270 kcfs (See Figure 5). As noted, during this period a significant portion of the Grand Coulee powerhouse was out of service, curtailing its electrical generation capacity and reducing turbine output and thus requiring increased spill through the outlet tubes. As Figure 5 shows, Grand Coulee’s powerhouse capacity from April 1 through August 31 ranged from 137 kcfs and 253 kcfs, with an average of 176 kcfs compared to a full powerhouse capacity of 280 kcfs if all of its turbines are operating. Between May 16 and June 24 (delineated in Figure 5 by the black box), when these actions were implemented, the resulting flows through Chief Joseph Dam ranged from 143 kcfs to 277 kcfs with an average of 228 kcfs (see Figure 4). This shifting of Grand Coulee Dam and other system reserves to Chief Joseph Dam took advantage of the degassing properties of the flow deflectors at Chief Joseph Dam and provided an overall reduction in TDG levels. Calculating the actual TDG reduction at the Grand Coulee Dam tailwater due to the implementation of these two actions is difficult because considerable outlet tube spill still occurred at Grand Coulee Dam between May 16 and June 24. Even after initiating these two actions that reduced the outlet tube spill at Grand Coulee Dam by 30 to 40 kcfs, spill still ranged from 20 kcfs to 100 kcfs during this period. This resulted in tailwater percent TDG that ranged from 117 to 144. This makes the actual TDG reduction in Grand Coulee’s tailwater from this operation somewhat uncertain; however, it is likely that some TDG reduction occurred as TDG levels generated from the Grand Coulee outlet tubes reached a high of 144 percent TDG while releases from the Chief Joseph spillway at this time were 124 percent - a 20 percent reduction (see Table 3). The following website provides the high 12-hour average percent TDG during 2011: 3 Power reserve is generating capacity that is available within a short interval of time to meet demand in case a generator goes down or there is another disruption in supply.
TABLE 3 Spill Shift Flow Rates and Resultant 12-Hour Average Percent TDG
GCL = Grand Coulee, CHJ = Chief Joseph, WEL = Wells
2.1.3.5 7Q10 Flow When flows exceed the 7Q10 criteria (the average peak annual flow for seven consecutive days that has a recurrence interval of ten years), the Colville, Oregon and Washington’s TDG criteria do not apply. The 7Q10 flow criteria and the respective daily average flows for the Corps’ Columbia River Basin dams are shown on Table 4. In 2011, river flows exceeded the 7Q10 flow criteria as measured at the Corps’ dams on the lower Columbia River and at Chief Joseph Dam from May 17 to June 25, with a total of three days when flows exceeded 7Q10 criteria on the lower Snake River. The gray highlighted days represent when the 7Q10 flow criteria were exceeded.
Part 3 Water Quality Monitoring 3.1 Fixed Monitoring Stations TDG and water temperature are monitored throughout the Columbia River Basin via the fixed monitoring station (FMS) gauges. There are a total of 42 FMSs in the U.S. portion of the Columbia River Basin and 28 are operated by the Corps. Reclamation, and Chelan and Grant County PUDs each operate four stations. Two stations are operated by the Douglas County PUD. The Corps’ Portland, Seattle, and Walla Walla Districts operate and maintain the FMSs in the Columbia and lower Snake River basins. Portland District is responsible for eight FMSs on the lower Columbia River from John Day Dam to Camas-Washougal. The Seattle District is responsible for two FMSs in the upper Columbia Basin at Chief Joseph. Walla Walla District is responsible for 15 FMSs in the lower Snake River and Clearwater River basins, and at McNary Dam on the Columbia River. Appendix A contains detailed information on the Corps’ FMS system and a map of their locations. 3.2 Monitoring Plan of Action The 2010-2014 Dissolved Gas Monitoring Plan of Action was updated for 2011. It summarizes the Corps’ roles and responsibilities with dissolved gas and temperature monitoring and identifies channels of communications with other cooperating agencies and interested parties. The Plan of Action summarizes what to measure, how and when to take the measurements, and how to analyze and interpret the resulting data. The Monitoring Plan of Action is provided as Appendix B of this report. 3.3 Changes in the FMS There were two changes to the Corps’ TDG monitoring system during 2011 as a result of the high river flow conditions:
1) John Day Dam tailwater FMS (JHAW) NEMA electronic box was moved to higher ground.
2) Bonneville Dam tailwater FMS (CCIW) NEMA electronic box was moved to higher ground.
Both the John Day Dam tailwater and the Bonneville Dam tailwater FMSs suffered damage during the high spring flows. During the monitor replacements, the NEMA electronic boxes were moved to higher ground to protect them from future damage. The NEMA electronics boxes were placed on new concrete foundations, the cable conduits were replaced, and new communications cables were installed from the boxes to the submerged instrumentation. The Corps moved the Chief Joseph tailwater TDG probe outside of the pipe in May 2011 to investigate the responsiveness of this monitor. Previously during the 2009 spill test, data suggested the probe responded very slowly when in the tailwater pipe. From June 9 to June 26, the Chief Joseph Dam tailwater probe was moved back inside of the conduit for protection during the high flows. During this time, it again appeared that the probe readings were not responding to changes in spill flow rates. As a result, the probe was re-deployed outside of the conduit, and a second (temporary) TDG logger was placed inside the conduit from June 26 to August 8 to compare the measurements inside the pipe to those measured outside the pipe. This test found that there was little difference in the percent
20
TDG measured between the two probes. (The median TDG saturation difference was 0.5mm Hg, with a 10th percentile and 90th percentile range of -1mm Hg to 3mm Hg.) Additional details regarding this analysis are provided in Appendix K. 3.4 Malfunctioning Gauge Occurrences During 2011 there were five occurrences affecting 99 days where a FMS gauge malfunctioned due to various reasons as shown in Table F-7 (Appendix F). Four occurrences resulted in missing data. One resulted in elevated percent TDG ranging from approximately 149 to 156 percent. The Bonneville Dam tailwater gauge was destroyed by the high river flows and this lack of data contributed 91 malfunctioning gauge-days, which was the majority of the 99 total days. Malfunctioning gauge TDG instances are noted as a Type 2a instance in Tables F-2, F-3A and F-3B (Appendix F) to indicate when a TDG instance from a malfunctioning gauge occurred and appeared as part of the real-time operational review. Table F-2 (Appendix F) is based on raw data and is populated during real-time operations. Tables F-4 through F-6 (Appendix F) do not include the malfunctioning gauge data since these tables provide statistical information on hourly TDG levels. 3.5 QA/QC on FMS The 2010 BiOp, RPA Action 15, calls for “real-time monitoring and reporting of TDG and temperatures measured at fixed monitoring sites.” The Corps’ Districts operate the FMS according to the monitoring Plan of Action and prepare annual performance reports for the FMS operation. The 2011 reports are included as Appendices J, K and L. Highlights from these reports are provided below. 3.5.1 Walla Walla District QA/QC Walla Walla District is responsible for maintaining and operating the forebay and tailwater TDG FMS stations at Dworshak, Lower Granite, Little Goose, Lower Monumental, Ice Harbor, and McNary dams. This work is performed through a cooperative agreement with the Kennewick office of the USGS. The highlights of the Walla Walla District QA/QC report are:
• Data completeness for TDG data received averaged 96.9 percent for the fifteen monitoring sites in the 2011(nine seasonal and six year-round).
• The TDG data sets were within one percent TDG of the expected value on the
basis of calibration data, replicate quality-control measurements in the river, and comparison to ambient river conditions at adjacent sites.
• Data received from the individual sites ranged from 83.0 percent to 100.0 percent
complete. See Table 8 in Appendix I for individual gauge data completeness information. With the exception of the Dworshak tailwater FMS (DWQI), these results exceed the data quality criteria for data completeness. Table 11 (Appendix I) describes the individual causes for missing data.
21
• The TDG sensors were removed from the field after 3 or 4 weeks of deployment and calibrated in the laboratory.
• All 175 in-situ field checks of TDG sensors with a secondary standard were
within ±1.0 percent TDG after 3 to 4 weeks of deployment in the river.
• The fifteen seasonal and annual FMS stations were calibrated every 3 weeks between April 2011 and August 2011. From September 2010 through March 2011, the six annual FMS stations were calibrated at 4-week intervals.
• All 189 of the field checks of barometric pressure were within ±1 mm Hg of a
secondary standard, and 171 out of 176 (97 percent) water-temperature field checks were all within ±0.2°C.
The full detailed QA/QC report on the Walla Walla District gauges can be found in Appendix I. 3.5.2 Portland District QA/QC Portland District is responsible for maintaining and operating the forebay and tailwater gauges at John Day, The Dalles and Bonneville dams. This work is performed through a contract with the Oregon Water Science Center of the USGS. The highlights of the Portland District QA/QC report are:
• Data completeness for TDG data received averaged 99.7 percent for the eight monitoring sites in the 2011.
• The TDG data sets were within one percent TDG of the expected value on the
basis of calibration data, replicate quality-control measurements in the river, and comparison to ambient river conditions at adjacent sites.
• Data received from the individual sites ranged from 34.9 percent (Bonneville
Dam tailwater) to 100.0 percent complete. See Table 2 (Appendix J) for individual gauge data completeness information. These results exceed the data quality criteria for data completeness, except for the Bonneville Dam tailwater FMS, which was destroyed by high water and rendered inaccessible. Table 3 (Appendix J) provides the causes for missing data.
• The TDG sensors were removed from the field after 3 or 4 weeks of deployment
and calibrated in the laboratory.
• All but 4 of the 66 in-situ field checks of TDG sensors with a secondary standard were within ±1.0 percent TDG after 3 to 4 weeks of deployment in the river.
• The eight FMSs were calibrated every 3 weeks, except from October 2010
through March 2011, when they were calibrated at 4-week intervals.
22
• All 66 of the field checks of barometric pressure were within ±1 mm Hg of a secondary standard, and water-temperature field checks were all within ±0.2°C.
The full detailed QA/QC report on the Portland District gauges can be found in Appendix J. 3.5.3 Seattle District QA/QC Seattle District is responsible for maintaining and operating the forebay and tailwater TDG FMS stations at Chief Joseph Dam. The highlights of the Seattle District QA/QC report are:
• Data completeness for TDG data received ranged from 98.2 percent at the Chief Joseph tailwater station (CHQW) to 99.8 percent at the forebay station (CHJ). Data completeness for temperature data ranged from 98.3 percent at the CHJ forebay station to 99.9 percent at the CHQW tailwater station. Missing data were largely due to DCP malfunctions and programming problems.
• For TDG data, at the CHQW tailwater station a total of 75 hours were rejected due to erroneous barometric pressures. At the CHJ forebay station no TDG data were rejected. No temperature data were rejected at stations CHJ and CHQW.
• The TDG sensors were removed from the field after 2 weeks of deployment and
calibrated in the laboratory.
• A total of 22 out of 29 (76 percent) in-situ field checks of total dissolved gas sensors with a secondary standard were within ±10 mm Hg after 2 weeks of deployment in the river.
• A total of 25 out of 29 (86 percent) in-situ field checks of barometric pressure
were within ±2 mm Hg of a secondary standard, and 29 out of 29 (100 percent) water temperature field checks were all within ±0.2°C.
The full detailed QA/QC report on the Seattle District can be found in Appendix K. Part 4 Fish Spill Program 4.1 Spill Operation of the FCRPS to meet multiple purposes can result in instances of percent TDG exceeding the state water quality standards. In 2011, the Corps provided voluntary spill for fish passage consistent with the 2010 BiOp and the 2011 Spring and Summer FOPs. Part 4 provides detailed information on the implementation of the spill for fish program, as well as involuntary spill (e.g. lack of powerhouse capacity, transmission constraints, etc.). .
23
4.1.1 Fish Operations Plans The 2011 Spring and Summer FOPs provided in Appendix C describe specific fish operations implemented this year and are summarized in Table 5.
TABLE 5
2011 FOPs Spill Operations
4.1.2 Spring Creek Hatchery Spill In 2008, the Corps, BPA, NOAA Fisheries and the USFWS entered into a Memorandum of Agreement regarding Spring Creek National Fish Hatchery fish production reprogramming. Under the Memorandum of Agreement, a portion of the annual production was moved to the Bonneville Hatchery, on Tanner Creek below Bonneville Dam, thereby eliminating the need to release fish in March from Spring Creek National Fish Hatchery and the resultant requests for spill at Bonneville Dam. As a result, there were no spill operations in March 2011 for Spring Creek National Fish Hatchery fish releases. This agreement is in effect from 2009 through 2013. 4.1.3 Fish Test Operations There are many planned fish tests during any spill season and for the purposes of this report, only fish tests that have special spill operations are discussed. These research studies are developed and coordinated through the Anadromous Fish Evaluation Program Studies Review Work Group with NOAA Fisheries providing concurrence on the final study plan. For more information on all planned fish tests, see Appendix A of the annual Fish Passage Plan at http://www.nwd-wc.usace.army.mil/tmt/.
Project Planning Dates A & B Time Spill Amount Lower Granite April 3 - June 20 24 hours per day 20 kcfs Lower Granite June 21-August 31 24 hours per day 18 kcfs Little Goose April 3 - August 31 24 hours per day To the spill cap up to 30% of project outflow
Lower Monumental April 3 - June 20 24 hours per day To the spill cap Lower Monumental June 21-August 31 24 hours per day 17 kcfs
Ice Harbor April 3 - April 27 0500-1800 45 kcfs during the dayIce Harbor April 3 - April 27 1800-0500 To the spill cap
Ice Harbor April 28 - July 13 24 hours per day Alternating between to the spill cap up to 30% vs. 45 kcfs during the day/spill cap at night
Ice Harbor July 13 - August 31 0500-1800 45 kcfs during the dayIce Harbor July 13 - August 31 1800-0500 To the spill capMcNary April 10 - June 19 24 hours per day To the spill cap up to 40% of project flow McNary June 20-August 31 24 hours per day To the spill cap up to 50% of project flow John Day April 10 - April 27 24 hours per day To the spill cap up to 30% of project outflow
John Day April 27 - July 20 24 hours per day To the spill cap up to 30% vs. 40% of project outflow
John Day July 20 - August 31 24 hours per day To the spill cap up to 30% project outflowJohn Day April 10 - August 31 24 hours per day Minimum spill is 25% of project outflow
The Dalles April 10 - August 31 24 hours per day To the spill cap or 40% of project outflowBonneville April 10 - June 15 24 hours per day To the spill cap up to 100 kcfs
Bonneville June 16 - July 20 24 hours per day Alternating between 95 kcfs /95 kcfs vs. 85 kcfs during the day/121 kcfs at night
Bonneville July 21 - August 31 24 hours per day 75 kcfs during the day/GC at nightBonneville April 10 - June 20 24 hours per day Minimum spill is 75 kcfsBonneville June 21 - August 31 24 hours per day Minimum spill is 50 kcfs
B - No voluntary spill from April 3 to May 31 in years when forecasted seasonal average flows are less than 65 kcfs on the Snake River.
A - No voluntary spill from April 10 to June 14 in years when forecasted seasonal average flows are less than 125 kcfs.
Two fish/spill studies with special spill operations were planned in 2011 to evaluate fish passage and survival during different spill levels:
1. John Day Fish Passage and Survival Evaluation Test - two treatment spill test from April 27 through July 20. The spill operation randomly alternated spill in two day blocks of 30 percent vs. 40 percent of total river flow for 24 hours per day.
2. Bonneville Fish Passage and Survival Test - two treatment spill test from June 16 to July 20. The spill operation randomly alternated spill in two day blocks of 85 kcfs during daytime hours and 121 kcfs at night vs. a constant 95 kcfs for 24 hours per day.
The John Day study was implemented from April 27 through May 16 when high flows prevented the continuation of the test. The Bonneville fish/spill study was cancelled because of the high total river flows. 4.1.4 Long Term Turbine Outages Unit outages can affect the spill volume at the dams by causing additional involuntary spill.4
There were six long-term (greater than one month) unit outages on the lower Snake River and fourteen long-term unit outages on the lower Columbia River:
• Lower Granite: There were four units out of service at Lower Granite for long term outages: Unit 3 was out of service for generator field ground from January 2010 to May 31, 2011 and cavitations repair from August 1 through November 28, 2011. Unit 4 was out of service for exciter replacement from August 1 through October 28. Unit 5 was out of service for stator ground from March 9 through May 4. Unit 6 was out of service for exciter replacement from July 5 through October 8. From August 1 to August 9, a scheduled powerhouse outage occurred and during this outage, the Corps discovered an oil leak at transformer T1-B, which required an additional full powerhouse outage from August 15 to August 17. Once the oil leak was repaired, another full powerhouse outage occurred on August 19 in order to bring the transformer back online.
• Little Goose: Unit 6 was out of service for transformer busing failure from May 8
through June 21. • Ice Harbor: Unit 4 was out of service for oil leak repair from November 2010
through May 12.
• Grand Coulee: 12 unit outages at Grand Coulee Dam for one month or longer during the April 1 through August 31, 2011. The large number of outages reduced
4The information contained in this section includes outages that occurred during the period covered in this report, and identifies outages outside of the reporting period. Not all outages described in this section actually have or will result in spill or elevated TDG levels, but are included for informational purposes.
25
the GCL powerhouse capacity by at least 84 kcfs and the other short term outages resulted in further powerhouse capacity reduction. Three units were out the entire period: units 7 and 9 were undergoing stator repairs; and unit 24 was undergoing its 6-year maintenance. Unit 19 was out from May through August and unit 20 was out from April through May for GDACS installation and WECC testing respectively. Units 2, 5, 10, 11, 13, 16 and 18 were all out of service for at least a month for WECC testing, GDACS installation, or other maintenance.
• McNary: Four units were out of service for a month or longer. Unit 2 was out
from July 2010 through June 2011 for a stator rewinds. Unit 7 was out beginning in July 2010 and will continue through June 2014 for a stator rewind. Unit 1 was out of service from June 30, 2011 and will continue through February 28, 2012 for stator rewind. Unit 10 was out from June 22, 2011 and will continue through February 28, 2012 for a stator rewind.
• John Day: Two units were out of service for a month or longer. Unit 11 was out of service from April 1, 2011 and will continue to June 2012 for an overhaul. Unit 15 was out of service from March 27, 2011 and will continue to July 20 for a five year overhaul.
• The Dalles: Six units were out of service for a month or longer. Units 19 - 22
were out of service for powerhouse roof replacement from July 25 to September 23, 2011. Unit 10 was out of service for their five year overhaul from April 11 to June 9. Unit 17 was out of service for their five year overhaul from July 5 to September 23, 2011.
• Bonneville: Two units were out of service for a month or longer. Unit 15 was out
of service from June 15 through August 23, 2011 for its four year overhaul. Unit 11 has been out of service for the last three years for structural cracks and failed winding and the return to service date is unknown.
4.1.5 Voluntary Spill The 2011 Spring and Summer Fish Operations Plans (FOP) establish voluntary spill levels for juvenile fish passage at the four lower Snake and four lower Columbia River dams during the juvenile fish migration season; generally April through August. The FOPs were developed in collaboration with regional sovereigns and are consistent with spill operations specified for juvenile fish passage in NOAA Fisheries' 2010 Supplemental BiOp. The documents were submitted to the Court and subsequently adopted into Court Orders. The fish passage (voluntary) spill called for in the 2011 Spring and Summer FOPs was to occur from April 3 to August 31 at the lower Snake River dams, and from April 10 to August 31 at the lower Columbia River dams. However, because total river flows were unusually high, continuous involuntary spill began on March 30 at six of the eight projects. As coordinated with ODEQ and WDOE, tracking TDG instances for this report starts on April 1.
26
2011 had 164,901 kaf FOP spill which is the most of the last 12 years see Table D-13 (Appendix D). McNary Dam had the largest volume of FOP spill resulting in 40,500 kaf . The Dalles Dam had the second most FOP spill resulting in 32,149 kaf see Table D-12 (Appendix D). The amount of voluntary spill rate for each dam is shown in Figures D-1 through D-8 and listed in Tables D-1 through D-8 (Appendix D). Additionally, weekly graphs with FOP spill for April through August are included in the monthly reports to the Court, which is Appendix E found at http http://www.nwd-wc.usace.army.mil/tmt/wqnew/tdg_and_temp/2011/. For more information, the FOP spill can be compared to the percent TDG shown in Appendix E, which contains graphs of spill, flow, and TDG. During most spill seasons, both voluntary and involuntary spill on the lower Columbia and Snake rivers, occur even during a low water year (e.g. 2001). However, 2011 was an extremely high water year compared to the previous 12 years. Table D-13 (Appendix D) provides the annual total dam outflow volume and the average twelve-year total outflow volume. Table D-10 (Appendix D) shows the above average voluntary (labeled FOP Spill) and involuntary spill at each dam during the 2011 spill season. 4.1.6 Involuntary Spill Due to high flows, involuntary spill occurred at Chief Joseph Dam, the four lower Columbia River dams, and the four lower Snake River dams for a minimum of two months. Involuntary spill began on January 18 at McNary Dam which was the earliest of all the lower Columbia dams. Ice Harbor Dam began involuntary spill on March 28 and the other six lower Columbia and lower Snake River dams began involuntary spill on March 30. Involuntary spill at Chief Joseph Dam occurred for 10 days in April and from May 13 through July 25. Involuntary spill operations prior to April 1 are not included in this report. Bonneville Dam had the largest volume of involuntary spill occurring 82 days during spill season resulting in 18,867 kaf see Table D-12 (Appendix D). McNary Dam had the second most involuntary spill occurring 111 days during spill season resulting in 14,663 kaf. John Day Dam had involuntary spill for 86 days resulting in 6,851 kaf. The Dalles Dam had involuntary spill for 64 days resulting in 6,801 kaf. Involuntary spill occurred at Bonneville Dam from April 1 to April 10; from May 13 to July 16, and then intermittent involuntary spill from July 16 through July 29 (See Figure 1). Typically, Bonneville Dam is among the dams with the most involuntary spill during a spill season, primarily because of these factors:
(1) The constant FOP spring spill rate of 100 kcfs; and, (2) Maximum powerhouse capacity of only 200 kcfs during spill season.
Consequently, when the lower Columbia River total river flow exceeds 300 kcfs, involuntary spill occurs at Bonneville Dam. McNary, John Day and The Dalles dams spill a percent of the total river flow, so as the total river flow increases; spill at these projects also increases. At Bonneville Dam, FOP spill is a constant at 100 kcfs. As a result,
27
Bonneville Dam can have involuntary spill before any of the other lower Columbia River dams. Lower Granite Dam had the most involuntary spill of the lower Snake River dams with involuntary spill occurring 105 days during spill season resulting in 6,478 kaf see Table D-8 (Appendix D). This is primarily the result of these factors:
(1) The constant FOP spring spill operation of 20 kcfs; and (2) The number of unit outages.
Lower Granite Dam’s 20 kcfs FOP spring spill operation is lower than Little Goose, Lower Monumental and Ice Harbor dams, which spill either a percent of the total river flow or to a spill cap. As a result, Lower Granite Dam has involuntary spill before any of the other lower Snake River dams. This is especially true when Lower Granite Dam had several units out of service as it did this year (see Part 4.1.6 for more details). Lower Granite Dam had continuous involuntary spill from April 1 to April 27; from May 8 through 9 and from May 12 to July 11. Figure 6 shows that Lower Granite Dam also had involuntary spill for almost three weeks in August due to a full powerhouse outage.
FIGURE 6 2011 Lower Granite Dam
Flow and Spill
Note: Daily powerhouse capacities provided by BPA Duty Schedulers.
Little Goose Dam had the second most involuntary spill of any of the lower Snake River dams with involuntary spill occurring 61 days during spill season resulting in 5,012 kaf (see Table D-12, Appendix D). Ice Harbor Dam had the third most involuntary spill of the lower Snake River dams with involuntary spill occurring 76 days during spill season resulting in 4,443 kaf. Lower Monumental Dam had the least involuntary spill of any of
Daily PH Capacity in kcfs Fish Passage Spill in kcfs
28
the lower Snake River dams with involuntary spill occurring 62 days during spill season resulting in 4,073 kaf. The FOP spill tables in Appendix D indicate amounts spilled at the lower Columbia River and Snake River dams. As Table D-11 (Appendix D) shows, actual spill rates were significantly higher than the estimated FOP spill rate because of the large amount of involuntary spill that occurred with the high runoff experienced in 2011. The impact of high flows on TDG levels was significant because of the magnitude and duration of the high flows and the shape of the runoff. The January through July percent of normal runoff at The Dalles Dam was 133 percent of normal (1971 - 2000), significantly above average. A high number of daily instances occurred during June and July because the runoff was significantly above average and persisted for a long time. As a result, there were 792 TDG instances system-wide, with the following instance types:
• 637 Type 1 condition instances (flows in excess of powerhouse capacity); • 52 Type 1a condition instances (outages of hydro power equipment) • 64 Type 2a condition instances (malfunctioning FMS gauge) • 39 Type 3 condition instances (TDG exceedances due to uncertainties when using
best professional judgment, SYSTDG model and forecasts). Table F-3A and Table F-3B (Appendix F) provide more detailed information on TDG instances for the lower Snake River and lower Columbia River projects respectively. Part 5 of this report provided more detailed information on dam specific TDG instances. 4.2 SYSTDG Model The SYSTDG model is used to forecast the TDG levels on the Columbia and lower Snake River FCRPS dams, to assist in setting daily spill caps, and evaluate various spill operations. The SYSTDG model estimates the percent TDG resulting from dam operations on the Columbia River from Grand Coulee Dam to Bonneville Dam, also on the lower Snake River from Lower Granite Dam to the confluence with the Columbia River, and from Dworshak Dam on the Clearwater River to its confluence with the Snake River. 4.2.1 Highlights from the Statistical Evaluation of SYSTDG A statistical evaluation of SYSTDG’s performance was conducted to assess how well the model estimated percent TDG and the following are the highlights:
1. The predictive errors computed for SYSTDG in 2011 compared favorably with estimates from previous years despite the extremely high water year modeled. In most cases the TDG production equations that were established for a much lower range of conditions still accurately predicted the percent TDG.
2. Lower Monumental and McNary dams TDG production equations under
estimated the percent TDG during the high flows. These results highlight a need to update the SYSTDG exchange equations for these projects.
29
3. The performance of the SYSTDG model in the mid-Columbia River from
Grand Coulee Dam through Wells Dam deserved considerable attention due to the generation of extremely high TDG pressures resulting from the Grand Coulee Dam regulating outlet releases. SYSTDG tends to overestimate the Wells forebay TDG pressures but the Well’s Dam predictions tracked consistently with the percent TDG released from Chief Joseph Dam.
4. The John Day spillway TDG equation performed well except at flows over
200 kcfs where percent TDG approached 130.
5. The 2010 TDG production study determined that the impacts of The Dalles spillway training wall on TDG exchange equation were small and therefore the TDG production equation will not need to be updated.
4.2.2 2011 Improvements Made to SYSTDG: The 2011 high flows and spill provided the opportunity to collect the information needed to update the TDG production equations in SYSTDG for several projects. The high water year played an important role in achieving the following five improvements to SYSTDG this year:
1. The Grand Coulee Dam TDG production equation was updated for regulating outlet operation as recommended in the 2010 statistical evaluation. The updated equation is based on the 2011 observed data and spill operations and is a function of the spill, powerhouse flow, and TDG content of powerhouse releases.
2. The Chief Joseph Dam TDG production equation was updated based on observed data and spill operations.
3. The Dworshak Dam TDG production equation was updated as recommended in the
2010 statistical evaluation. The updated equation addressed spill from the regulating outlet and spillway and was based on observed data and spill operations.
4. The McNary Dam TDG production equation was updated as recommended in the 2010 statistical evaluation. The updated equation that addressed the spillway weir operation was based on observed data and spill operations.
5. SYSTDG for the Camas Washougal gauge was improved for accuracy as recommended in the 2010 statistical evaluation. The wind degassing coefficients were reinstated to levels used during the 2009 season to reduce the bias in the predicted TDG pressures at this gauge. The impact of increasing the background degassing coefficient resulted in the most accurate prediction of TDG pressures at CWMW ever documented by the SYSTDG model.
30
4.3 TDG Monitoring Studies TDG monitoring studies are included as actions associated with the TDG TMDL and to update the SYSTDG model. During the 2010 spill season a TDG monitoring study was conducted at John Day Dam. The study was to evaluate the impacts of the installation of Bay 20 spillway flow deflector on the interaction of the powerhouse and spillway flows, the TDG generation impact of the John Day spillway weir, and whether the tailwater FSM was representative of river conditions. Part 5 Instances of TDG Exceeding WQS During 2011, most of the TDG instances occurred when the powerhouse capacities were exceeded. As shown in Figures 1, 2, 4 and 5, total river flows exceed powerhouse capacities on the lower Columbia and lower Snake rivers resulting in large amounts of involuntary spill and high numbers of TDG instances. Part 5 discusses the TDG instances. 5.1. TDG Instance Calculation Methods Calculations and reporting in Part 5 are consistent with the calculation methods adopted in 2007 and described in Part 1.1.7 of this report. Unless otherwise specified, all TDG instances discussed in this report use the ODEQ/WDOE calculation method. 5.2 TDG Instances - ODEQ/WDOE Calculations 5.2.1 110 percent TDG Instances In 2011, TDG instances were tracked using the Colville Confederated Tribes WQS of 110 percent in the forebay and tailwater of the Chief Joseph Dam in the middle Columbia River. Table F-6 (Appendix F) shows that there were 2,558 hourly TDG instances in the Chief Joseph Dam tailwater and 2,360 hourly TDG instances in the Chief Joseph forebay. The maximum percent TDG for the Chief Joseph Dam was 141 in the forebay and 124 in the tailwater. 5.2.2 115 percent and 120 percent TDG Instances Table 6 provides a summary of TDG instances for 2005 through 2011 spill seasons. As indicated in Table 6, there were 792 TDG instances in 2011 (excluding 279 days when flows exceed 7Q10 criteria.). This value represents the highest number of instances since recording began in 1999. High flows resulted in 18 of 19 gauges with TDG instances in June and July. Bonneville Dam tailwater, McNary Dam tailwater, Chief Joseph Dam forebay and the Camas-Washougal gauges had the most TDG instances in 2011 and Lower Granite Dam forebay was the only gauge without TDG instances.
31
TABLE 6 2005 - 2011 Spill Seasons
Number of TDG Instances Exceeding WQS
*Does not include days when 7Q10 flows were exceeded (see Table 8)
5.2.3 TDG Instances in Oregon ODEQ requested Table 7 identifying TDG instances that occurred at the dams covered by the ODEQ TDG waiver. In 2011, there were 325 TDG instances at a monitoring location in Oregon (excluding 279 days when flows exceed 7Q10 criteria.) The TDG instances are approximate 23 percent of 1,386 possible spill days (9 gauges x 154 days), from April 1 through August 31. Bonneville Dam tailwater gauge had the highest number of TDG instances; 73 out of 154 possible spill days. The Corps began tracking TDG instances on April 1 even though involuntary spill began earlier at all the dams included in the Oregon waiver. For example, in 2011 McNary Dam started involuntary spill on January 18. Table 7 also documents the number of TDG instances that occurred between April 1 and April 10, as requested by ODEQ.
Total Number of Instances 792 234 308 515 99 575 69 324
Fixed Monitoring Stations 8 Year Average
32
TABLE 7 2011 Spill Season
Number of TDG Instances Exceeding ODEQ WQS
5.2.4 Instances of TDG Exceeding 125 percent WQS During the 2011 spill season, there were 3,174 instances (excluding days when 7Q10 flow were exceeded) of hourly TDG exceeding either the ODEQ or WDOE standards of 125 percent TDG (a one hour standard by WDOE, and a two hour standard by ODEQ). Table F-4 (Appendix F) provides information on the range and number of hours over 125 percent TDG. In 2011 there were a very high number of instances above the hourly 125 percent TDG compared to the last ten years as shown in Table F-5 (Appendix F). Involuntary spill due to high runoff resulted in all 3,174 hours of 125 percent TDG instances above the ODEQ or WDOE standards. Aspects of the high runoff that influenced the instances of the two/one-hourly criteria were: (1) duration of the runoff; (2) shape of the runoff; and, (3) the volume of the runoff. Additional discussion and breakdown of those 3,174 instances is as follows. Thirteen of the 19 Columbia and lower Snake River FMSs exceeded the hourly value of 125 percent TDG. The number of hours over 125 percent TDG ranged from 6 hours at John Day Dam forebay to 679 hours at Lower Monumental Dam forebay. The highest hourly TDG reading was 142 percent at both Little Goose Dam tailwater. Graphs of the 12-hour percent TDG for the lower Snake and Columbia River dams shown in Appendix D illustrate the impact of involuntary spill levels on TDG during the freshet period. More detailed information on dam specific TDG instances of the 125 percent TDG standard is provided in Appendix D. A table of the high 12-hour TDG averages is provided at the end of each monthly Court report found in Appendix E.
In 2011, there were special spill operations to pass debris but due to the high flows, additional spill for passing debris did not contribute to the total number of instances above 125 percent TDG. For example, on May 17, from 1000 to 1100 hours, there was a debris spill at Lower Granite Dam. TDG was already at 129 percent and with the additional spill for debris, TDG rose to 132 percent. 5.2.5 7Q10 Flows Days During 2011, flows on the lower Columbia River resulted in 29 to 36 days when the 7Q10 flow criteria were exceeded at a project as compared to only three days on the lower Snake River when flows exceeded 7Q10 criteria (see Table 4). The 7Q10 flow criteria applied to both the forebay and tailwater for each project and at the Camas/Washougal gauge. As a result, there were 342 days when 7Q10 flows were exceeded on the Columbia and Snake Rivers (see Table 8).
McNary Forebay 29McNary Tailwater 30John Day Forebay 33
John Day Tailwater 36The Dalles Forebay 29
The Dalles Tailwater 29Bonneville Forebay 31
Bonneville Tailwater 31Camas/Washougal 31
Total Number of 7Q10 Days 342
34
5.2.6 Comparison of Annual TDG Instances Table 9 shows the number of daily instances of TDG above the WQS in 2011 was above the seven-year average (excluding days when 7Q10 flows were exceeded). This high number is attributed to the high flows, 133 percent compared to the average normal runoff in this timeframe. The 2011 instance data also includes 50 instances at the Chief Joseph forebay and three instances at the Chief Joseph tailrace which were not included in previous years. Table 9 shows that TDG gauges exceeded WQS on 27 percent of the spill days during 2011, which was the highest percentage during the last seven years.
TABLE 9 2005 - 2011 Annual Comparison of
TDG Instances Exceeding WQS
5.2.7 Types of Daily TDG Instances Beginning in 2003, ODEQ and TMT requested the Corps track the causes of instance where percent TDG exceeded WQS. Table F-1 (Appendix F) provides a listing of the three causes or instance types. The Corps tracked the daily TDG instance types for the forebay and tailwater of each of the Corps’ FCRPS dams during the 2011 spill season. Each type of instance represents conditions that cause daily average percent TDG to exceed WQS. The 2011 tracking results compared with prior years are summarized in Table 10. Daily and by-dam detail can be found in Appendix F. The daily instance type designation given to each TDG instance is based on the Corps’ determination of causation. During the 2011 spill season, there were a total 792 instances (excluding days when 7Q10 flows were exceeded) out of 2,926 gauge-days in which the TDG levels were above the TDG criteria. This value is significantly higher than the seven-year average of 370 instances. There were 637 instances of a Type 1 condition, which the Corps could not
Note: 2005: Number of spill days are based on 18 gages X 153 days from April 1 - August 31 Note: 2006-2010: Number of spill days based on 8 gages x 151 days plus 9 gages x 144 days.
(2006-2009: Spill season started Apr 3 for lower Snake River and April 10 for lower Columbia River).
1 The Dalles Jan-Jul Avg (1971-2000) =107.3 MAF
Normal
Runoff at TDA1
Percent of Days Consistent With
TDG Standard (%)Year
Days in Spill
Season2
Number of Days of
Instances
Percent of Days Exceeding TDG Standard (%)
2 Days in Spill Season based on number of gauges x days in spill season. Note: 2011: Number of spill days based on 19 gages x 154 days (spill started April 1).
35
prevent due to the unusually high river flows. There were 64 instances of a Type 2a instance, which are associated with malfunctioning FMS gauges. The unusually high flows destroyed the Bonneville Dam tailwater TDG gauge, resulting in the majority of the 64 Type 2a TDG instances. There were only 39 instances of a Type 3 instance, which are associated with uncertainties when using best professional judgment. Certain types of TDG instances, such as Types 1 and 2a, associated with high flows and malfunctioning gauges respectively, occur every year and are a normal part of reservoir operations. Efforts continue to reduce daily instances when possible.
TABLE 10 2005 - 2011 Spill Seasons
Types and Numbers of TDG Instances
5.2.8 Recurring High TDG Instances There are four TDG gauges that were difficult to manage and avoid TDG instances during 2011 spill season: Bonneville Dam tailwater; McNary Dam tailwater; Chief Joseph Dam forebay; and Camas/Washougal. Typically, Camas/Washougal and Bonneville Dam tailwater are among the TDG gauges with the most TDG instances each year but it is uncommon for McNary Dam tailwater and Chief Joseph Dam forebay gauges. The following is a discussion about each of these high TDG instance gauges. 5.2.8.1 Bonneville Dam Tailwater The Bonneville Dam tailwater gauge had a total of 73 TDG instances (see Table 6) during 2011 spill season. There were 31 days when 7Q10 flows were exceeded. Bonneville Dam tailwater has an average of 35 TDG instances per year over the last seven years which is the third highest amount among the FCRPS TDG gauges. As indicated on Table F-3B (Appendix F), the 73 TDG instances were classified as 59 Type 2a instances, 11 Type 1 and three Type 3 instances. The majority of TDG instances being classified as Type 2a indicates that the malfunctioning of the Bonneville Dam tailwater gauge which is a direct result of the gauge being damaged due to high flows. For
7 Year Average 2011 2010 2009 2008 2007 2006 2005 TYPE
# DEFINITION
270 637 166 191 421 5 441 29 1TDG levels exceed the TDG standard due to exceeding powerhouse capacity at run-of-river projects resulting in spill above the BiOp fish spill levels.
14 52 1 1 1 1 45 0 1aPlanned and unplanned outages of hydro power equipment including generation unit, intertie line, or powerhouse outages.
2 0 0 1 1 0 13 0 2TDG exceedances due to the operation or mechanical failure of non-generating equipment.
14 64 7 17 11 0 1 1 2aMalfunctioning FMS gauge, resulting in fewer TDG or temperature measurements for setting TDG spill caps.
69 39 60 98 81 93 75 39 3TDG exceedances due to uncertainties when using best professional judgment, SYSTDG model and forecasts.
370 792 234 308 515 99 575 69 Totals
36
a more detailed discussion on the Bonneville Dam tailwater gauge malfunction, see Parts 3.3 and 3.4. 5.2.8.2 McNary Dam Tailwater The McNary Dam tailwater gauge had a total of 54 TDG instances (see Table 6) during 2011 spill season. There were 30 days when 7Q10 flows were exceeded. McNary Dam tailwater gauge has an average of 54 TDG instances per year over the last seven years which is the seventh highest amount among the FCRPS TDG gauges. As indicated on Table F-3B (Appendix F), the 54 TDG instances were classified as 49 Type 1 instances, four Type 2a and one Type 3. The majority of TDG instances being classified as Type 1 indicates that the unusually high flows were the predominate factor influencing the number of TDG instances at this gauge. McNary Dam has the smallest powerhouse capacity of the lower Columbia River dams and as a result began to involuntarily spill on January 18 and continued through July 22, which is longer than any of the other eight projects discussed in this report. 5.2.8.3 Chief Joseph Dam Forebay The Chief Joseph Dam forebay gauge had a total of 50 TDG instances (see Table 6) during 2011 spill season. There were 29 days when 7Q10 flows were exceeded. 2011 is the first year that TDG instances were tracked for the Chief Joseph Dam forebay gauge so consequently no past history on TDG instances at this gauge is available. As indicated on Table F-3B (Appendix F), the 50 TDG instances were classified as 47 Type 1a instances, two Type 1 and one Type 2a. The majority of TDG instances being classified as Type 1a indicates that unit outages at Grand Coulee Dam were the predominate factor influencing the number of TDG instances at this gauge. There were several unit outages at Grand Coulee Dam that resulted in the powerhouse capacity being reduced from 280 kcfs to approximately 182 kcfs. As a result of its reduced powerhouse capacity and higher than normal total river flows, Grand Coulee Dam began involuntarily spill through the outlet tubes on May 13 and continued through June 24 which generated TDG between 130 and 144 percent. After June 24, Grand Coulee Dam continued to involuntarily spill through the drumgates (which generate less TDG) until July 25. 5.2.8.4 Camas/Washougal The Corps continues to use the Camas/Washougal gauge as part of the court ordered operations. The Camas/Washougal FMS represents a theoretical forebay for the lowest reach of the Columbia River. The Camas/Washougal gauge had a total of 48 TDG instances (see Table 6) during 2011 spill season. There were 31 days when 7Q10 flows were exceeded. Camas/Washougal gauge has an average of 49 TDG instances per year over the last seven years which is the highest amount among the FCRPS TDG gauges. As indicated on Table F-3B (Appendix F), the 48 TDG instances were classified as 40 Type 1 instances and 8 Type 3. The majority of TDG instances being classified as Type 1
37
indicates that the unusually high flows was the predominate factor influencing the number of TDG instances at this gauge. Bonneville Dam had a reduced powerhouse capacity due to unit outages and as a result, Bonneville Dam began to involuntarily spill on May 13 and continued through July 16. 5.3 TDG Instances - Washington Calculations Part 5.3 provides the detail tracking of the Washington method of calculating TDG instances. 5.3.1 115 percent and 120 percent TDG Instances The revised Washington WQS require the new method of calculating the average of the 12 highest consecutive hours beginning in 2008. The Corps calculated the number of TDG instances for the 2011 spill season (excluding 7Q10 days) using this method for comparison purposes and the results are summarized in Table 11.
5.3.2 Comparison of Calculation Methods As Table 11 indicates, there were 39 more TDG instances using the WDOE method compared to the ODEQ/WDOE method. This suggests the WDOE method is the more stringent of the two methods. As Table 12 shows, this is a consistent trend observed over the last four years. From 2008 to 2011, there was an average of 40 more TDG instances using the WDOE method than the ODEQ/WDOE method, primarily at the forebay gauges. Table 11 shows the forebay gauges most affected by switching to the WDOE method. The tailwater gauges were also impacted, but to a lesser degree. Comparing the differences between the two methods over the last four years highlights that there are five TDG gauges that consistently have the largest difference in number of TDG instances between the two methods and they are:
1. Camas/Washougal 2. Bonneville Dam forebay 3. Little Goose Dam forebay 4. Ice Harbor Dam forebay 5. Lower Monumental Dam forebay
In 2011, the Little Goose Dam forebay had the largest difference of seven TDG instances between the two methods. The Camas/Washougal gauge had the second largest difference of six TDG instances between the two methods.
TABLE 12 2008 – 2011 Spill Seasons TDG Instances
Comparison of WDOE and ODEQ/WDOE Methods
Part 6 Water Temperature This part provides information regarding the state and tribal WQS, 2011 temperature data, information regarding Dworshak operations and water temperature modeling. 6.1 State Water Quality Standards for Temperature The water temperature standards for the lower Columbia and Snake rivers as defined by the states of Idaho, Oregon, Washington and Colville Confederated Tribes are shown in Tables 13, 14 and 15.
TABLE 13 State Temperature Water Quality Standards
the Lower Snake River
TABLE 14 State Temperature Water Quality Standards
the Lower Columbia River
Projects Washington Standard Idaho Standard
Lower Granite Dam, Snake River, RM 107.5; AND
Little Goose Dam, Snake River, RM 70.3; AND
Lower Monumental Dam, Snake River, RM 41.6; AND
Ice Harbor Dam, Snake River, RM 9.7
“Temperature shall not exceed 1-day maximum of 20°C (68oF) due to human activities. When natural conditions exceed 1-day maximum of 20°C (68oF) no temperature increases will be allowed which will raise the receiving water temperature by greater than 0.3°C (0.5oF) nor shall such temperature increases, at any time exceed t=34/(T+9).” WAC 173-201A-602
Water temperatures 22oC or less with a maximum daily average of no greater than 19oC. IDAPA 58.01.02-250-02 (b)
Project Washington Standard Oregon Standard
McNary Dam. Columbia River, RM 292.0; AND
“Temperature shall not exceed a 1-day maximum of 20°C (68oF) due to human activities. When natural conditions exceed a 1 day maximum of 20°C (68oF) no temperature increases will be allowed which will raise the receiving water temperature by greater than 0.3°C (0.5oF) nor shall such temperature increases, at any time exceed 0.3oC (0.5oF) due to a single source or 1.1°C (2.0oF) due to all such activities combined.” WAC 173-201A-602
“Unless superseded by the natural conditions, the temperature criteria for State waters supporting salmonid and steelhead spawning use is as follows: The seven-day-average maximum temperature of a stream identified as having a migration corridor use may not exceed 20.0 degrees Celsius (68.0 degrees Fahrenheit).” OAR 340-041-0028, Section 4(d).
John Day Dam, Columbia River, RM 215.6; AND
Bonneville Dam, Columbia River, RM 146.1; AND
The Dalles Dam, Columbia River, RM 191.5
40
TABLE 15
State Temperature Water Quality Standards the Colville Confederated Tribes
6.2 Daily Water Temperature Exceedances The following is a summary of actual water temperatures in comparison to these WQS.5
Table 16 provides a seven year comparison of the number of days that a gauge recorded temperatures above 68oF on a daily average from 2005 through 2011. Table 17 provides more detail information of when and where the daily average temperatures exceeded 68oF. As Table 17 shows, 2011 had 586 days in which temperature exceeded the WQSs, less than the seven year average of 870 gauge-days. Water temperatures were noticeably cooler than average, which can be expected with above average flows. The three FCRPS gauges that recorded temperatures above 68oF most frequently were: Anatone, John Day Dam tailwater, and The Dalles Dam tailwater gauges. The Anatone gauge had 53 days that exceeded 68oF, the highest number in 2011, and a comparison of previous years shows this is a consistent trend for the Anatone gauge. John Day Dam tailwater gauge had 49 days that exceeded 68oF, the second highest number in 2011, and a comparison of previous years shows this is a consistent trend for this gauge. The Dalles Dam tailwater gauge had 46 days that exceeded 68oF, the third highest number in 2011, and a comparison of previous years shows this is a consistent trend for this gauge.
5 This information reports only the number of days the temperature exceeded the WQS, not the amount the temperature exceeded the WQS
Project Washington Standard Colville Confederated Tribe StandardFrom Northern Reservation Boundary to Chief Joseph Dam, Columbia River, RM 545.1
“Temperature shall not exceed 18° C (64.4 F) due to human activities. When natural conditions exceed 18° C (64.4 F) no temperature increases will be allowed which will raise the receiving water temperature by greater than 0.3° C (0.5 F). Incremental temperature increases resulting from point source activities shall not, at any time, exceed t=28/T+7). Incremental increase resulting from nonpoint source activities shall not exceed 2.8° C (5.4 F).” WAC 173-210A-130(21) and WAC 173-201A-030(2)
Temperature shall not exceed 18.0 C (freshwater) and 16.0 C (saline water) due to human activities. Temperature increases shall not, at any time, exceed t=28/(T+7) (freshwater) or t=12/(T-2) (saline water). Colville Tribe Standard 4-8-6(b)(3)(F):
41
TABLE 16
2005 – 2011 Number of Days with 24-hour Average Above 68oF
* Gauges that were disconnected for the winter.
Table 16, shows the number of days that daily average water temperatures were above 68oF in 2011. Table 17 provides the date that water temperatures at a particular gauge began to exceed 68oF, when water temperature at a particular gauge no longer exceeded WQS and the total number of days that water temperatures were above 68oF per gauge during April 1 through September 30, 2011.
Fixed Monitoring Stations 2011 2010 2009 2008 2007 2006 20057 Year Average
2011 Daily Average Temperature Information (April 1 - September 30)
* Gauges that were disconnected for the winter.
Note: N/A means not applicable since temperatures did not exceed 68oF. 6.3 Dworshak Operations The 2010 BiOp, RPA Action 4 calls for specific actions at Dworshak Dam during the salmon migration to meet temperature objectives for the lower Snake River. Appendix H contains a summary of the Dworshak Dam operations for flow augmentation and temperature moderation. Dworshak reservoir outflows were managed to maintain water temperatures at Lower Granite Dam tailwater below 68oF as shown on Figure H-1 (Appendix H). These operations began on July 12 and continued through September 22, when the Dworshak reservoir elevation reached 1520 ft. These operations resulted in a peak discharge rate of 14.6 kcfs and a total volume of 1.70 Maf from July 12 through September 22. The average discharge rate for the summer period was 11.9 kcfs. During that period, Dworshak Dam
released the maximum kcfs to avoid exceeding 110% TDG (14.6 kcfs), and the release temperatures were as cold as possible (45oF). Seasonal average release temperatures during flow augmentation season from 2000-2011 are shown on Figure H-2. Dworshak Dam operations were coordinated at TMT meetings eight times during July through September 2011, as shows on Table H-1(Appendix H). There was one short period from August 5 to 7 in which the tailwater temperature at Lower Granite Dam ranged from 67.6 to 68.1 for 8 hours, but the daily average only reached 67.8oF. The Lower Granite Dam tailwater daily average temperature did not exceed 68oF during 2011. 6.4 Water Temperature Modeling The 2010 BiOp, RPA Action 15 calls for the following: Expand water temperature modeling capabilities to include the Columbia River from Grand Coulee Dam to Bonneville Dam to better assess the effects of operations or flow depletions on summer temperatures. Portland District has contracted the development of three CE-QUAL-W2 water temperature models in the lower Columbia River at McNary, John Day and Bonneville reservoirs. These three models are scheduled to be developed and calibrated by spring of 2012. Seattle District has initiated development of a CE-QUAL-W2 water temperature model for the Chief Joseph Dam reservoir (Lake Rufus Woods). This model is scheduled to be developed and calibrated by spring of 2012. Reclamation is developing a CE-QUAL-W2 water temperature model in the upper Columbia River at the Grand Coulee reservoir (Lake Roosevelt). This model is scheduled to be developed and calibrated by spring of 2012. Additionally, Reclamation has completed the hydrosurvey to update the Lake Roosevelt bathymetry. Part 7 Gas Bubble Trauma Monitoring 7.1 Biological Monitoring The Fish Passage Center provides a summary of the gas bubble trauma monitoring results collected in 2011, which is included as Appendix L. The following is a summary of those results. The monitoring of juvenile salmonids in 2011 for gas bubble trauma was conducted at mid-Columbia, lower Columbia and lower Snake River sites. Fish were collected and examined for signs of GBT at Bonneville Dam and McNary Dam on the lower Columbia River, and at Rock Island Dam on the mid-Columbia River. The Snake River monitoring sites were Lower Granite Dam, Little Goose Dam, and Lower Monumental Dam.
44
Sampling occurred two days per week at the Columbia River sites and one day a week at each of the Snake River sites during the time period that spill was implemented. The goal of the sampling program was to sample 100 salmonids of the most prevalent species (limited to Chinook and steelhead) during each day of sampling at each site, with the proportion of each species sampled dependent upon their prevalence at the time of sampling. Yearling Chinook and steelhead were sampled through the spring at all the sampling sites. Beginning in late May/early June when subyearling Chinook became the predominant species in the smolt collections, the program shifted from sampling yearling Chinook and steelhead to sampling subyearling Chinook through the end of August. Examinations of fish were done using variable magnification (6x to 40x) dissecting scopes. The eyes and unpaired fins were examined for the presence of bubbles. The bubbles present in the fins were quantified using a ranking system based on the percent area of the fins covered with bubbles as shown in Table L-1 (Appendix L). In 2011, a total of 15,302 juvenile salmonids were examined for GBT at all sampling sites from April 7 through August 31 see Table L-2 (Appendix L). Signs of GBT were observed in the fins of 382, or 2.5 percent of all fish sampled at all sites see Table L-3 (Appendix L). Of those fish with fin signs of GBT, 367 exhibited non-severe signs (rank of 1 or 2) of fin GBT where less than 25 percent of the fin area was covered with bubbles, and 15 exhibited severe signs (rank of 3 or 4) where more than 25 percent of the fin area was covered with bubbles. Thus, of those fish with GBT, 3.8 percent were classified as severe, equivalent to 0.1 percent of all fish sampled at all sites in 2011. Table L-4 (Appendix L) compares the 2011 estimates of the overall percentage of fish with signs of GBT to past years’ estimates. The action criteria for GBT is established as 15 percent of all sampled fish showing any signs of GBT, or 5 percent of all sampled fish showing signs greater than rank 1. In 2011, both action criteria for GBT were exceeded at Little Goose Dam see Figure L-3 (Appendix L). Sampled fish exhibited signs of GBT during May, but both the prevalence and severity of GBT signs increased during early June to a maximum of 14 percent on June 13. During this time period, stream flows had increased rapidly in the Snake River and the hydraulic capacity at the upstream Lower Granite Dam was very limited due to turbines being out of service. Consequently, percent TDG in the Lower Granite Dam tailrace began to exceed the TDG limit of 120 percent on May 14, increased to a high above 132 percent on May 26, and continued to exceed the 120 percent limit in the tailrace until July 7. The action criteria for GBT were also exceeded at Lower Monumental Dam see Figure L-4 (Appendix L). Both the incidence and severity of GBT (up to rank 3) began to increase in late May due to a full powerhouse outage upstream at Little Goose Dam from May 24 through June 1 that exacerbated already high TDG levels in the Little Goose tailrace (up to 139 percent on May 27). These high TDG levels from Little Goose Dam exceeded the 120 percent criteria until July 1. Lower Columbia River TDG levels were also higher than in past years, though GBT instances were far less frequent than in the Snake River. Forebay TDG levels at McNary
45
Dam rarely exceeded 120%, which was reflected in a low percentage of fish observed with signs of GBT see Figure L-5 (Appendix L). Similarly, lower TDG concentrations in the lower Columbia River were reflected by a low frequency of GBT in fish sampled at Bonneville Dam see Figure L-6 (Appendix L). Mid-Columbia River juvenile salmonids sampled at the Rock Island Dam exhibited the highest frequency of GBT observed in the FCRPS during 2011 see Figure L-7 (Appendix L). The percentage of fish showing signs of GBT began to increase in late May as TDG levels increased with the operation of Grand Coulee Dam for flood control. The frequency and severity of GBT observed at Rock Island Dam peaked in early June and persisted through June 23. In summary, the BiOp Spill Program that was implemented in 2011 incorporated data on TDG levels throughout the FCRPS in order to minimize impacts on juvenile salmonids. The GBT monitoring program complemented the TDG data in the system-wide management of TDG. In 2011, extremely high river flows and occasional limitations on hydraulic capacity resulted in several instances of high TDG levels that were reflected in the increased frequency and severity of GBT in sampled fish in the lower Snake River and mid-Columbia River. In all of these instances, the FCRPS was spilling involuntarily, thus the levels of TDG were not able to be maintained with the criteria, and the resulting levels of GBT were unavoidable.


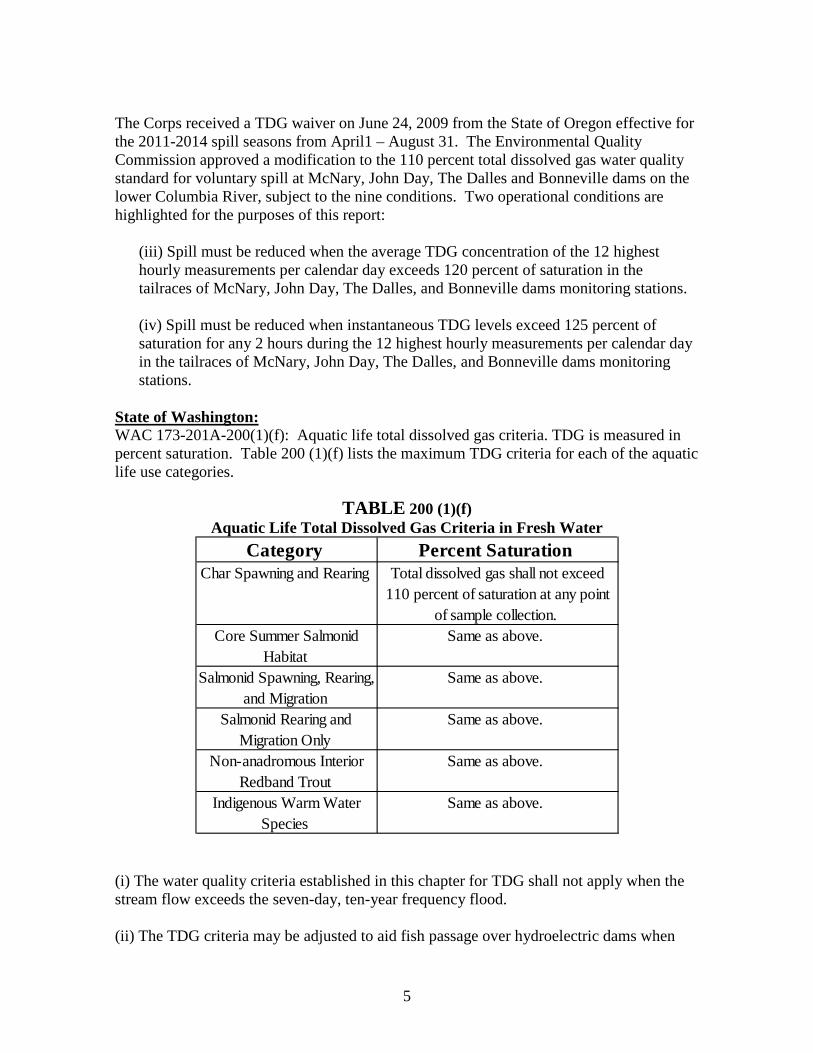


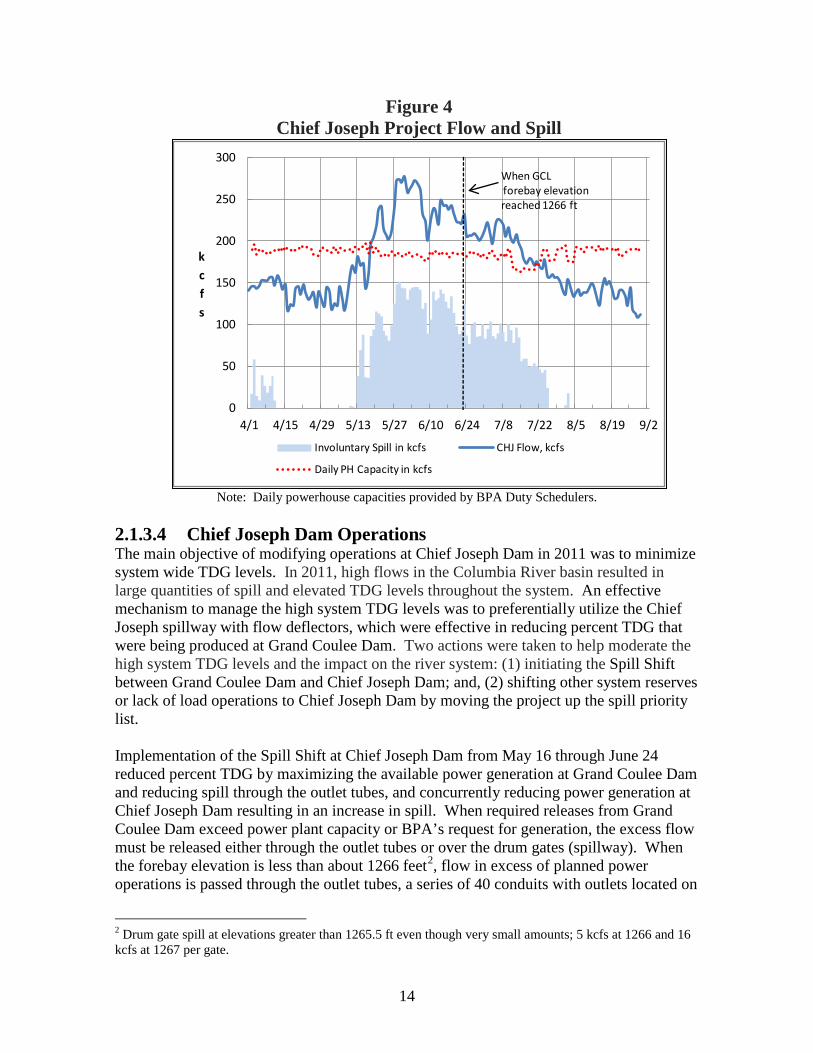


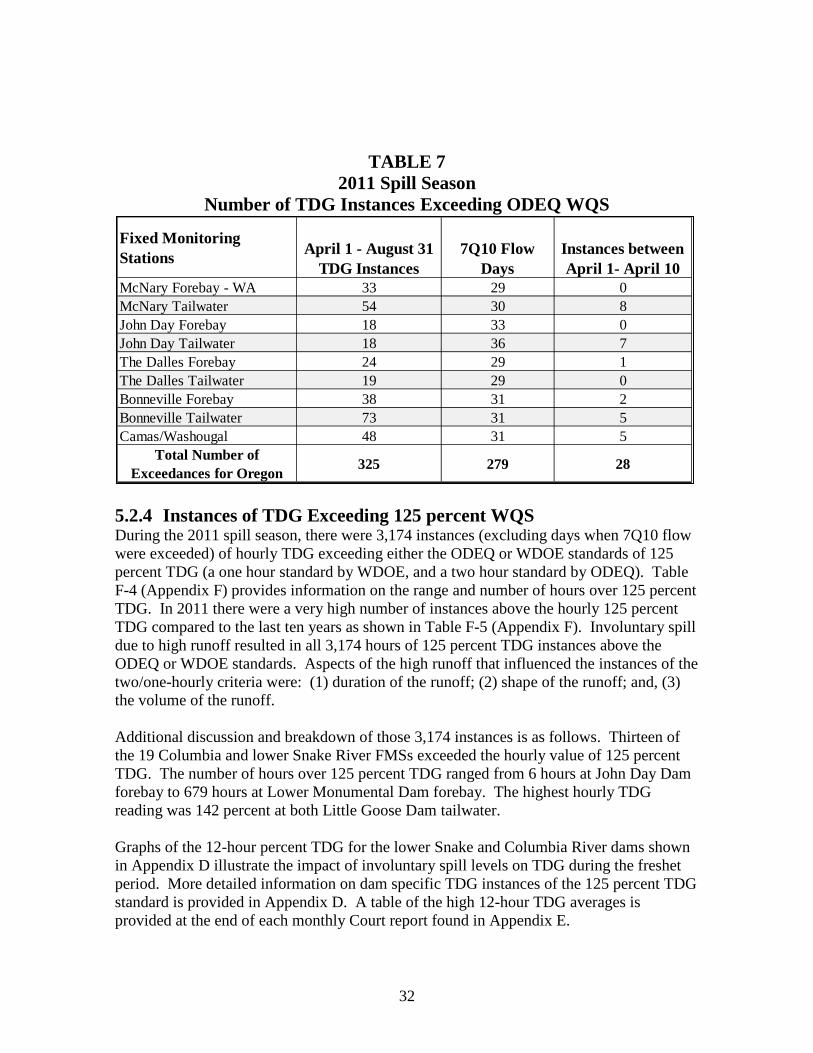
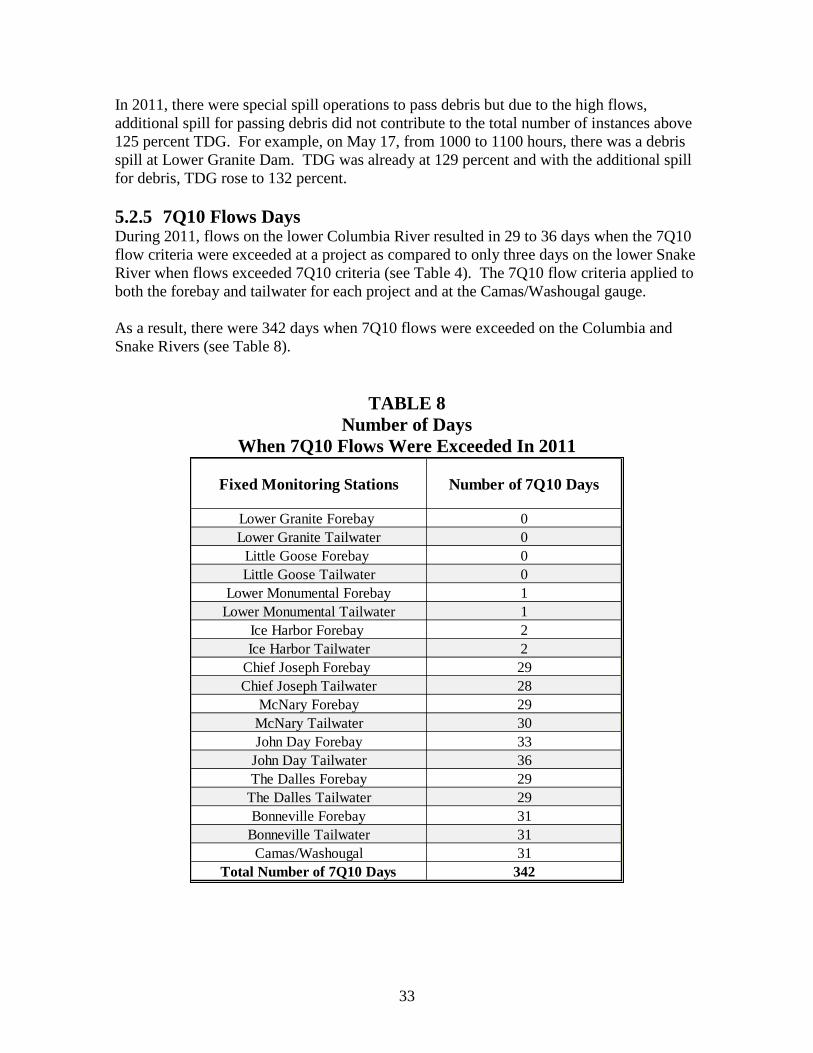


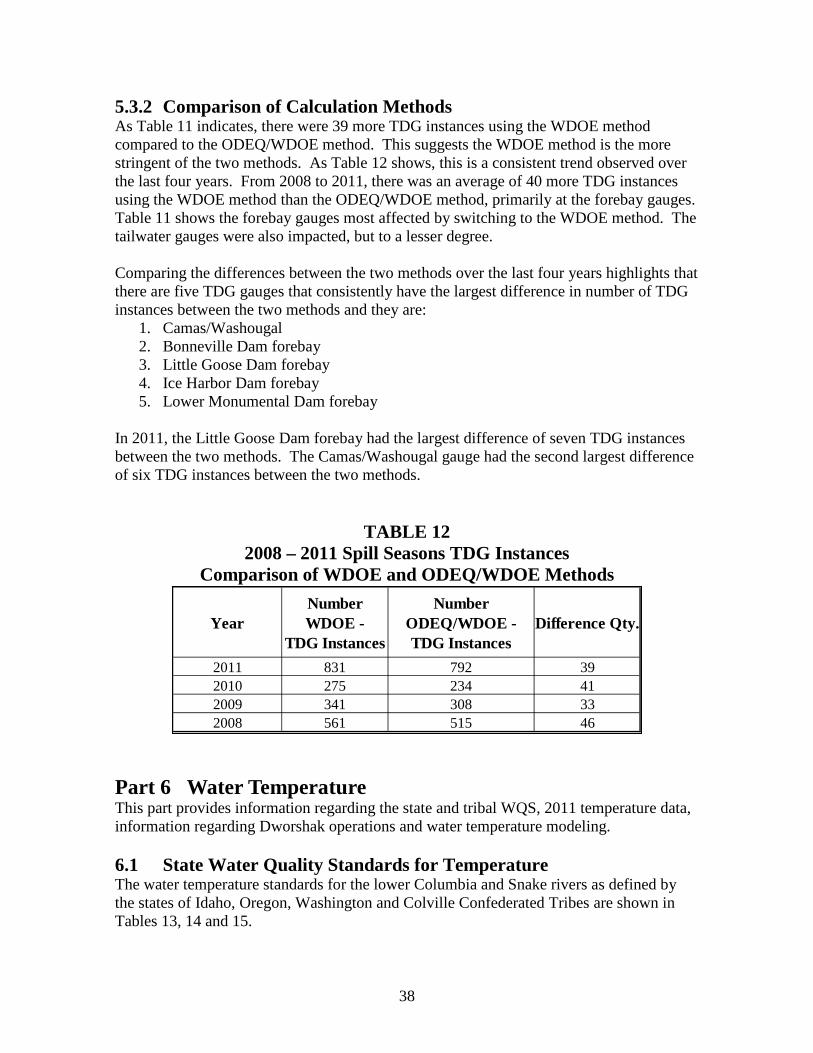


![EFFECTS OF TEMPERATURE AND DISSOLVED LiClO4 ONradoslav/RBogoslovov_UNLV[2005].pdf · iii ABSTRACT Effects of Temperature and Dissolved LiClO4 on the Viscoelastic and Dynamic Properties](https://static.documents.pub/doc/80x56/5b9eb43e09d3f204248c2942/effects-of-temperature-and-dissolved-liclo4-on-radoslavrbogoslovovunlv2005pdf.jpg)


