41
SURVEILLANCE REPORT www.ecdc.europa.eu Legionnaires’ disease in Europe 2011
| Date post: | 15-Feb-2019 |
| Category: |
Documents |
| Upload: | nguyendiep |
| View: | 218 times |
| Download: | 0 times |
SURVEILLANCE REPORT
SURVEILLANCE REPORT
www.ecdc.europa.eu
Legionnaires’ disease in Europe
2011

ECDC SURVEILLANCE REPORT
Legionnaires’ disease in Europe 2011
ii
This report of the European Centre for Disease Prevention and Control (ECDC) was coordinated by Julien Beauté and Emmanuel Robesyn. Contributing authors Andrew J. Amato-Gauci; Birgitta de Jong; Denis Coulombier; Lara Payne Hallström; Johanna Takkinen; Dana Ursut and Phillip Zucs
Acknowledgements We would like to thank all ELDSNet members for their hard work and dedication in reporting national Legionnaires’ disease data and reviewing this report: Gabriela El Belazi, Christine Hain, Robert Muchl, Daniela Schmid, Reinhild Strauss, Günther Wewalka (Austria), Olivier Denis, Sophie Maes, Denis Piérard, Sophie Quoilin (Belgium); Lili Marinova, Iskra Tomova (Bulgaria); Ioanna Gregoriou, Avgi Hadjilouka, Despo Pieridou Bagatzouni (Cyprus); Vladimir Drasar, Irena Martinkova (Czech Republic); Kåre Mølbak, Søren Anker Uldum (Denmark); Irina Dontsenko, Rita Peetso (Estonia); Outi Lyytikäinen, Silja Mentula (Finland); Dounia Bitar, Christine Campese, Didier Che, Sophie Jarraud (France); Bonita Brodhun, Christian Lück (Germany); Georgia Spala, Emanuel Velonakis (Greece); Judit Krisztina Horváth, Katalin Kaszas, Ildikó Ferenczné Paluska (Hungary); Haraldur Briem, Guðrún Sigmundsdóttir, Olafur Steingrimsson (Iceland); Mary Hickey, Joan O’Donnell (Ireland); Maria Grazia Caporali, Maria Luisa Ricci, Maria Cristina Rota (Italy); Jelena Galajeva (Latvia); Migle Janulaitiene, Simona Zukauskaite-Sarapajeviene (Lithuania); Paul Reichert (Luxembourg); Zahra Graziella, Jackie Maistre Melillo, Tanya Melillo Fenech (Malta); Petra Brandsema, Ed Ijzerman, Leslie Isken, Daan Notermans, Wim Van Der Hoek (Netherlands); Katrine Borgen, Dominique A. Caugant, Karin Ronning (Norway); Hanna Stypulkowska-Misiurewicz (Poland); Teresa Maria Alves Fernandes, Teresa Marques (Portugal); Daniela Badescu, Gratiana Chicin (Romania); Danka Simonyova, Margita Spalekova (Slovak Republic); Darja Kese, Maja Sočan (Slovenia); Rosa Cano-Portero, Carmen Pelaz Antolin (Spain); Görel Allestam, Margareta Löfdahl (Sweden); Oliver Blatchford, Martin Donaghy, Giles Edwards, Tim Harrison, Falguni Naik, Nick Phin, Alison Potts, Brian Smyth (United Kingdom).
Suggested citation: European Centre for Disease Prevention and Control. Legionnaires’ disease in Europe, 2011. Stockholm: ECDC; 2013.
Stockholm, April 2013
ISBN 978-92-9193-453-9
ISSN 1977-6497
doi 10.2900/78974
Catalogue number TQ-AR-13-001-EN-C
© European Centre for Disease Prevention and Control, 2013
Reproduction is authorised, provided the source is acknowledged

SURVEILLANCE REPORT Legionnaires’ disease in Europe, 2011
iii
Contents Abbreviations ................................................................................................................................................ v Executive summary ........................................................................................................................................ 1
All notified cases ....................................................................................................................................... 1 Travel-associated Legionnaires’ disease ...................................................................................................... 1
1. Background ............................................................................................................................................... 2 2. Methods .................................................................................................................................................... 3
2.1 The European Legionnaires’ Disease Surveillance Network ...................................................................... 3 2.2 Data collection .................................................................................................................................... 3 Data analysis ............................................................................................................................................ 5
3. Results ...................................................................................................................................................... 6 3.1 Legionnaires’ disease (comprehensive notifications) ............................................................................... 6 3.2 Travel-associated Legionnaires’ disease ............................................................................................... 24 3.3 Event-based surveillance .................................................................................................................... 31
4. Discussion ............................................................................................................................................... 32 5. Conclusion ............................................................................................................................................... 33 References .................................................................................................................................................. 34
Figures Figure 1. Number and rates per million of notifications of Legionnaires’ disease in the EU/EEA* by year of reporting, 1995–2011 .................................................................................................................................................... 7 Figure 2. Reported cases of Legionnaires’ disease by month of onset, EU/EEA, 2011 (n=4 891) ............................ 7 Figure 3. Reported cases of Legionnaires’ disease by week of onset, EU/EEA, 2005-2011 (n=38 538) ................... 8 Figure 4. Notification rate of community-acquired Legionnaires’ disease, EU/EEA, 2011 (n=2 642) a ................... 13 Figure 5. Reported clusters of Legionnaires' disease and average number of cases per cluster, by year of reporting, EU/EEA, 2005–2011 (n=754) ........................................................................................................................ 15 Figure 6. Reported clustering of Legionnaires' disease by month of onset, EU/EEA, 2011 (n=2 876) .................... 15 Figure 7. Case-fatality ratio by month of onset, EU/EEA, 2011 (n=3 335) .......................................................... 18 Figure 8. Distribution of sampling sites testing positive for Legionella, EU/EEA, 2011 (n=201) ............................ 23 Figure 9. Number of travel-associated cases of Legionnaires’ disease reported to ELDSNet, 1987-2011 ............... 24 Figure 10. Number of accommodation site visits associated with travel-associated cases of Legionnaires’ disease per destination country, EU/EEA, 2011 (n=843) .............................................................................................. 28 Figure 11. Number of accommodation site visits associated with travel-associated cases of Legionnaires’ disease per destination country, worldwide, 2011 (n=1 087) ....................................................................................... 29 Figure 12. Number of standard clusters of travel-associated Legionnaires’ disease per destination area (NUTS 2), EU/EEA, 2011 (n=66) ................................................................................................................................... 30 Figure 13. Number of standard clusters of travel-associated Legionnaires’ disease per destination country, worldwide, 2011 (n=82) ............................................................................................................................... 31
Tables Table 1. Completeness of reporting for a selection of variables, 2009-2011 ......................................................... 6 Table 2. Reported cases and notifications of Legionnaires’ disease per million, by reporting country, EU/EEA, 2011 9 Table 3. Distribution of reported cases and notifications of Legionnaires’ disease per million by gender and age group, EU/EEA, 2011.................................................................................................................................... 10 Table 4. Reported cases of Legionnaires’ disease by country and reported setting of infection, EU/EEA, 2011 ...... 11 Table 5. Reported community-acquired and healthcare-associated cases and notifications of Legionnaires’ disease per million by reporting country, EU/EEA, 2011 .............................................................................................. 12 Table 6. Reported cases of Legionnaires’ disease by reported setting of infection and age group, EU/EEA, 2011 .. 13 Table 7. Reported cases of Legionnaires’ disease by reported setting and comparison with 2008-2010 average, EU/EEA, 2011 .............................................................................................................................................. 14 Table 8. Reported community-acquired cases of Legionnaires’ disease by reporting country and comparison with 2008–2010 average, EU/EEA, 2011 ............................................................................................................... 14 Table 9. Reported clustering of Legionnaires’ disease by reporting country, EU/EEA, 2011 .................................. 16 Table 10. Reported clustering of Legionnaires’ disease, by setting, EU/EEA, 2011 .............................................. 16 Table 11. Reported outcomes of Legionnaires’ disease and case fatality by reporting country, EU/EEA, 2011 ....... 17 Table 12. Reported case-fatality of Legionnaires’ disease by gender and age group, EU/EEA, 2011 ..................... 18
Legionnaires’ disease in Europe, 2011 SURVEILLANCE REPORT
iv
Table 13. Reported case-fatality of Legionnaires’ disease by setting, EU/EEA, 2011 ............................................ 18 Table 14. Reported diagnostic methods, EU/EEA, 2011 (more than one method per case possible) ..................... 19 Table 15. Reported laboratory methods by reporting country, EU/EEA, 2011 (more than one method per case possible) ..................................................................................................................................................... 19 Table 16. Reported Legionnaires’ disease cases with culture confirmation by reporting country, EU/EEA, 2011 ..... 20 Table 17. Reported culture-confirmed cases of Legionnaires' disease and Legionella isolates by species, EU/EEA, 2011 ........................................................................................................................................................... 20 Table 18. Reported culture-confirmed cases of Legionnaires' disease and L. pneumophila isolates by serogroup, EU/EEA, 2011 .............................................................................................................................................. 21 Table 19. Reported monoclonal subtype for L. pneumophila serogroup 1 isolates, EU/EEA, 2011 ........................ 21 Table 20. Environmental follow-up status of reported cases of Legionnaires’ disease by reporting country, EU/EEA, 2011* ......................................................................................................................................................... 22 Table 21. Legionella findings of environmental investigations by reporting country, EU/EEA, 2011* ..................... 22 Table 22. Number of travel-associated cases of Legionnaires’ disease by reporting country, 2009-11* ................. 25 Table 23. Reported diagnostic methods TALD, EU/EEA, 2011 (more than one method per case possible) ............ 26 Table 24. Number and proportion of domestic travel visits among travel associated Legionnaires’ disease cases in EU/EEA countries a, b .................................................................................................................................... 27

SURVEILLANCE REPORT Legionnaires’ disease in Europe, 2011
v
Abbreviations CFR Case-fatality ratio CI Confidence interval ECDC European Centre for Disease Prevention and Control EEA European Economic Area ELDSNet European Legionnaires’ Disease Surveillance Network EU European Union EWGLINET European Working Group for Legionella Infections IQR Interquartile range LD Legionnaires’ disease MAb Monoclonal antibodies NUTS Nomenclature of Territorial Units for Statistics PCR Polymerase chain reaction PR Prevalence ratio TALD Travel-associated Legionnaires’ disease TESSy The European Surveillance System UAT Urinary antigen test


SURVEILLANCE REPORT Legionnaires’ disease in Europe, 2011
1
Executive summary This surveillance report is based on Legionnaires’ disease (LD) surveillance data collected for 2011. The surveillance is carried out by the European Legionnaires’ Disease Surveillance Network (ELDSNet) and coordinated by the European Centre for Disease Prevention and Control (ECDC) in Stockholm. Data were collected by nominated ELDSNet experts for each European country and electronically reported to The European Surveillance System (TESSy) database.
The surveillance data are from two different schemes: the first scheme covers all cases reported from European Union (EU) Member States, Iceland and Norway; and the second scheme covers all travel-associated cases of Legionnaires’ disease (TALD), both foreign and domestic travel, including reports from countries outside the EU.
The aims of these two schemes differ. The main objectives of collecting data on all nationally reported cases of LD are:
• to monitor trends over time and to compare them across Member States • to provide evidence-based data that is more relevant and reliable when taking public health decisions and
actions at an EU and/or Member State level • to monitor and evaluate prevention and control programmes targeting LD at the national and European
level • to identify population groups at risk and in need of targeted preventive measures • to contribute to assessing the burden of LD on the population using such data as disease prevalence and
mortality • to generate hypotheses on (new) sources, modes of transmission and groups most at risk and identify
needs for research.
The surveillance of TALD aims primarily at identifying clusters of cases that may not otherwise have been identified at the national level, before initiating timely investigation and control measures at the accommodation sites associated with the cases in order to prevent further infections.
All notified cases In 2011, 4 897 cases of all passively notified LD were reported by EU Member States, Iceland and Norway. The number of notifications per million inhabitants was 9.7 which represented a 22% decrease compared to the previous year. Six countries (France, Italy, Spain, Germany, Netherlands and the United Kingdom) accounted for 83% of all notified cases. The number of notifications ranged from 0 per million inhabitants in Bulgaria to 22.1 per million in Denmark. Most cases were community-acquired (67%) while 24% were travel-associated and 7% were linked with healthcare facilities. People over 50 years of age accounted for 77% of all cases. The male-to-female ratio was 2.7. The case-fatality ratio was 10% in 2011, similar to previous years. Most cases (77%) were confirmed by urinary antigen test. L. pneumophila and its serogroup 1 were the most commonly identified pathogens, accounting for 96% of all cases and 85% of culture-confirmed cases, respectively.
Priority should be given to helping countries with notification rates below one per million inhabitants to improve both diagnosis and reporting of LD.
Travel-associated Legionnaires’ disease In 2011, 763 cases of TALD were reported by 18 EU/EEA countries and the United States of America. This was 12% less than the 864 cases reported in 2010 and continued the decreasing trend observed since 2007. Four countries (France, Italy, the Netherlands and the UK) reported 72% of all TALD cases. The male–to-female ratio was 2.6 and the median age 61 years at date of onset. A total of 82 (standard1) clusters were detected. The largest cluster (12 cases) occurred in Italy. Legionella spp. were detected at 60 (62%) of the accommodation sites associated with clusters for which an investigation was carried out. The names of seven accommodation sites in EU Member States were published on the ECDC website after local control measures were reported to have been inadequate by the national contact point.
In 2011, 45 % (n=37) of all detected standard clusters of travel-associated Legionnaires’ disease could not have been detected without the existence of ELDSNet.
1 Clusters associated with only one accommodation site.

Legionnaires’ disease in Europe, 2011 SURVEILLANCE REPORT
2
1. Background Legionnaires’ disease (LD) is the severe form of an infection due to gram-negative bacteria, Legionella spp., which are found in freshwater environments worldwide [1]. The disease is not transmitted from person-to-person but through inhalation of contaminated aerosols or aspiration of contaminated water. Known risk factors for LD include increasing age, male gender, smoking, chronic lung disease, diabetes and various conditions associated with immunodeficiency [2]. Most cases (≈70%) are community-acquired and sporadic [3]. Studies suggest that the incidence of LD may be higher under certain environmental conditions such as warm and wet weather [4–6].
Legionnaires’ disease is notifiable in all EU and EEA countries but is thought to be underreported for two main reasons. Firstly, it is underdiagnosed by clinicians who only rarely test patients for LD before empirically prescribing broad-spectrum antibiotics that are likely to cover Legionella spp. Secondly, some health professionals fail to notify cases to health authorities [1].
The situation in Europe is therefore complex, with a broad range of notification rates across countries reflecting both the quality of the national surveillance system and the local risk for LD. Some countries (e.g. France, Italy or the Netherlands) have already assessed their systems’ sensitivity, mainly through capture-recapture studies, and showed improvement over time [7–9]. In other countries such as Greece, a study using TALD notification and tourism denominator data strongly suggested substantial under-ascertainment [10]. In eastern and south-eastern countries (e.g. Bulgaria, Poland or Romania), the numbers of cases reported have remained very low and are unlikely to reflect the true burden of LD [3,11]. Differences in laboratory practice may also partly explain these differences in notification rates [3,11].
Since 2010, the surveillance of LD in Europe has been operated by ELDSNet under the coordination of ECDC. Two distinct LD surveillance systems are currently in place. One is based on an annual passive reporting of all LD cases, the other on the daily reporting of TALD cases. Since some countries are unable to link the TALD cases reported daily and those reported annually, it is not yet possible to merge the two databases.
The first annual Legionnaires’ disease surveillance report published by ECDC reported the data collected in 2009 [11]. This is the third annual report presenting the analysis of disaggregated LD surveillance data in Europe and the second annual report covering both surveillance systems [3].

SURVEILLANCE REPORT Legionnaires’ disease in Europe, 2011
3
2. Methods 2.1 The European Legionnaires’ Disease Surveillance Network Coordinated by ECDC, ELDSNet involves all 27 EU Member States, Iceland and Norway. The network aims at identifying relevant public health risks, enhancing prevention of cases through detection of clusters and monitoring epidemiological trends. The latter objective includes the annual collection, analysis and reporting of all LD cases reported during the previous year.
2.2 Data collection 2.2.1 Legionnaires’ disease (comprehensive notifications) Data collected by nominated ELDSNet members in each European country were electronically reported to the TESSy database following a strict protocol. The deadline for 2011 data submission was 30 April 2012. The data extraction was done on 1 June 2012. All LD cases in 2011 meeting the European case definition (see box below) were included. Travel-associated Legionnaires’ disease cases with a history of travelling abroad were reported by their country of residence. Cases were to be classified as travel-associated if they had stayed at an accommodation site away from home during their incubation period of two to ten days prior to falling ill. Cases were to be reported as having formed part of a cluster if they had been exposed to the same source as at least one other case with their dates of onset no more than two years apart.

Legionnaires’ disease in Europe, 2011 SURVEILLANCE REPORT
4
EU case definition of Legionnaires’ disease [12]
Clinical criteria:
Any person with pneumonia.
Laboratory criteria for case confirmation:
At least one of the following three:
• Isolation of Legionella spp. from respiratory secretions or any normally sterile site;
• Detection of Legionella pneumophila antigen in urine;
• Legionella pneumophila serogroup 1 specific antibody response.
Laboratory criteria for a probable case:
At least one of the following four:
• Detection of Legionella pneumophila antigen in respiratory secretions or lung tissue e.g. by DFA staining using
monoclonal-antibody derived reagents;
• Detection of Legionella spp. nucleic acid in a clinical specimen;
• Legionella pneumophila non-serogroup 1 or other Legionella spp. specific antibody response;
• Legionella pneumophila serogroup 1, other serogroups or other Legionella spp.: single high titre in specific serum
antibody.
Epidemiological criteria:
At least one of the following two epidemiological links:
• Environmental exposure;
• Exposure to the same common source.
Case classification
Possible case
NA
Probable case
Any person meeting the clinical criteria AND at least one positive laboratory test for a probable case OR an epidemiological link.
Confirmed case
Any person meeting the clinical and the laboratory criteria for case confirmation.
2.2.2 Travel-associated Legionnaires’ disease Individual cases of TALD are actively reported to ECDC on a daily basis by the case’s country of residence via TESSy. Case reports include age, gender, date of onset of disease, method of diagnosis and travel information for the different places where the case had stayed from two to ten days prior to onset of disease. Only cases that have stayed at a commercial accommodation site are reported, therefore cases of LD that have visited relatives or friends are not reported here. After receiving the report, each new case is classified as a single case or as part of a cluster, according to the definitions agreed by the network:
• a single case: a person who stayed at a commercial accommodation site in the two to ten days before onset of disease; the site has not been associated with any other case of Legionnaires’ disease in the previous two years.
• a cluster: two or more cases who stayed at the same commercial accommodation site in the two to ten days before onset of disease, and whose onsets were within the same two-year period.

SURVEILLANCE REPORT Legionnaires’ disease in Europe, 2011
5
If there are three cases or more with onset of disease within the same three-month period, this is called a ‘rapidly evolving cluster’ and a summary report is sent to tour operators. When a cluster is detected, an investigation is required at the accommodation site and preliminary results from the risk assessment and initiation of control measures should be reported back by nationally nominated contact points to ELDSNet, within two weeks of the alert, using the standard operating procedures Form A. Form B is then used to report the results of environmental sampling and the control measures applied to the site back to ELDSNet within a further four weeks, allowing six weeks in total for all investigations to be completed. If the forms are not returned within the deadlines, or they report that actions and control measures are unsatisfactory, ECDC publishes the details of the sites associated with the cluster on its website, and tour operators are informed about the accommodation sites being published. If a cluster is associated with more than one accommodation site, it is noted as a ‘complex cluster’ and all cluster sites within it are subject to the same investigation procedures as described above.
2.2.3 Event-based surveillance On a daily basis, ECDC also identifies and monitors health threats through epidemic intelligence activities from a broad range of both formal and informal sources. These potential threats are documented and monitored by using a dedicated database and a standard protocol. Experts evaluate and select threats that may require further attention by the nationally nominated contact points and surveillance systems depending on their importance and potential impact on the health of EU citizens. More details on tools used for threat detection and threat communication can be found on the ECDC webpage dedicated to epidemic intelligence2.
Data analysis 2.3.1 Legionnaires’ disease (comprehensive notifications) Cases reported without any laboratory method specified or epidemiological link were excluded from the analysis. Since countries use diverse dates for national statistical purposes, TESSy collects the so-called ‘date used for statistics’ which can be the date of onset, diagnosis or notification. Only cases with a date used for statistics in 2011 were included in the analysis. Since environmental investigations are the responsibility of Member States, we restricted the analysis to domestic cases for those variables relating to these investigations.
The distribution of all cases and the subset with a fatal outcome were described by relevant independent variables. Continuous variables were summarised as medians with interquartile ranges (IQRs [Q1–Q3]) and compared across strata by using the Mann-Whitney U test. Prevalence ratios were calculated to test possible associations between categorical variables. Prevalence ratios were presented with their 95% confidence intervals assuming a Poisson distribution. Age-standardised rates were calculated using the direct method and the average age structure of the EU population for the period 2000–2010.
2.3.2 Travel-associated Legionnaires’ disease We performed the analysis of the TALD data reported on a daily basis at the level of cases, of travel visits and accommodation sites, and of clusters. All reported cases with a date of onset in 2011 were included in the analysis. Furthermore, we included all travel records of the included cases. When the country of residence was identical to the destination country, the travel was considered domestic. The cluster analysis was done on all clusters detected in 2011. We summarised the information presenting frequencies and proportions. We tabulated the data, made a histogram for the number of TALD cases over time and made maps to represent the geographic distribution. Most frequencies were mapped at country level (EU/EEA and worldwide); however standard cluster frequencies within the EU were mapped at NUTS 2 level.
2 http://ecdc.europa.eu/en/activities/epidemicintelligence/Pages/Activities_EpidemicIntelligence.aspx

Legionnaires’ disease in Europe, 2011 SURVEILLANCE REPORT
6
3. Results 3.1 Legionnaires’ disease (comprehensive notifications) 3.1.1 Cases Case validation and data completeness In 2011, 4 897 cases were reported by 28 countries (Iceland did not report). All cases met the inclusion criteria.
Data completeness was similar to previous years (Table 1). Of note, the proportion of cases reported with their place of residence is increasing but remains low. The proportion of cases for which a sequence type was reported also increased slightly but only marginally.
Table 1. Completeness of reporting for a selection of variables, 2009-2011
Variable 2009 %
2010 %
2011 %
Date of onset (complete date) 96 95 98 Outcome (not reported as unknown) 68 69 70 Cluster (not reported as unknown) 70 63 60 Cluster Id a (not missing) 100 83 100 Probable country of infection b (not missing) 97 93 94 Place of residence (not missing) 0 11 14 Sequence type (not missing) 1 1 3 Setting of infection (not missing or reported as unknown) 89 89 87 Environmental investigation (not reported as unknown) 40 33 36 Legionella found c (not missing or reported as unknown) 94 96 92 Positive sampling site d (not missing or reported as unknown) 88 73 83
a Completeness determined in cases reported to have formed part of a cluster. b Completeness determined in cases reported to have been imported. c Completeness determined in cases reported to have prompted an environmental investigation. d Completeness determined in cases for which positive findings in an environmental investigation were reported.
Case classification and notification rate Of the 4 897 notified cases, 4 430 (90%) were classified as confirmed and the remaining 467 (10%) as probable. Probable cases included six cases with epidemiological link only (five from Austria and one from Ireland). Of 467 probable cases, 166 (36%) were reported by Germany. The total number of notifications per million inhabitants was 9.7 in 2011 which represented a 22% decrease compared with the previous year. The 2011 notification rate was the lowest observed since 2005 (Figure 1).

SURVEILLANCE REPORT Legionnaires’ disease in Europe, 2011
7
Figure 1. Number and rates per million of notifications of Legionnaires’ disease in the EU/EEA* by year of reporting, 1995–2011
*EWGLINET member countries not belonging to the EU/EEA were excluded for 1995–2008.
Seasonality and geographical distribution Date of onset was reported for 4 891 cases. The distribution of cases by month of onset showed a peak from June to September (Figure 2). Compared with the distribution observed over the past four years, notifications decreased by 17% during the second half of 2011 but the average of 100 cases reported per week remained unchanged (Figure 3).
Figure 2. Reported cases of Legionnaires’ disease by month of onset, EU/EEA, 2011 (n=4 891)
0
2
4
6
8
10
12
14
0
2000
4000
6000
8000
n / million n n n/million
0
250
500
750
Jan Feb Mar Apr May Jun Jul Aug Sep Oct Nov Dec
num
ber
of c
ases
2011 2007-2010 average

Legionnaires’ disease in Europe, 2011 SURVEILLANCE REPORT
8
Figure 3. Reported cases of Legionnaires’ disease by week of onset, EU/EEA, 2005-2011 (n=38 538)
Notification rates ranged from 0 per million inhabitants in Bulgaria to 22.1 per million in Denmark (Table 2). The three largest reporting countries accounted for 59% of all cases (France, Italy and Spain) and the six largest for 83% (France, Italy, Spain, Germany, Netherlands and the United Kingdom). With the exception of Germany, these countries were the main drivers of the decrease observed in 2011. Of note, the notification rate in Latvia increased seven-fold as compared with 2010. Age-standardised notification rates did not differ substantially from crude notification rates.
0
50
100
150
200
250
300
Num
ber
of c
ases
n 52 weeks moving average

SURVEILLANCE REPORT Legionnaires’ disease in Europe, 2011
9
Table 2. Reported cases and notifications of Legionnaires’ disease per million, by reporting country, EU/EEA, 2011
Country Cases (n)
Population (n)
Notification rate (n/million)
2010-2011 difference
%
Age-standardised notification rate
(n/million) Denmark 123 5 560 628 22.1 -8 21.4 Latvia 49 2 229 641 22.0 724 21.5 Malta 9 417 617 21.6 48 21.1 Slovenia 44 2 050 189 21.5 -24 20.5 Netherlands 311 16 655 799 18.7 -33 18.1 France 1 170 65 048 412 18.0 -24 17.9 Italy 1 001 60 626 442 16.5 -19 14.5 Spain 706 46 152 926 15.1 -39 14.8 Sweden 127 9 415 570 13.5 26 12.9 Austria 101 8 404 252 12.0 26 11.4 Luxembourg 6 511 840 11.7 -41 11.7 Portugal 89 10 636 979 8.4 -30 8.0 Germany 634 81 751 602 7.8 -8 6.9 Belgium 79 10 951 266 7.2 -12 6.9 Czech Republic
57 10 532 770 5.4 5.3
Estonia 7 1 340 194 5.2 5.1 UK 251 62 435 709 4.0 -34 4.0 Hungary 37 9 985 722 3.7 -38 3.6 Finland 9 5 375 276 1.7 -63 1.5 Greece 18 11 309 885 1.6 100 1.5 Ireland 7 4 480 858 1.6 -37 2.0 Slovakia 7 5 435 273 1.3 75 1.3 Cyprus 1 804 435 1.2 0.6 Lithuania 2 3 244 601 0.6 0.5 Poland 18 38 200 037 0.5 -50 0.0 Romania 1 21 413 815 0.0 0 0.0 Bulgaria 0 7 504 868 0.0 -100 0.0 Total EU 27 4 864 502 476 606 9.7 -22 9.2 Norway 33 4 920 305 6.7 -32 6.9 Total EU/EEA 4 897 507 396 911 9.7 -22 9.2

Legionnaires’ disease in Europe, 2011 SURVEILLANCE REPORT
10
Age and gender The median age at date of onset was 61 years (IQR 51–73). It was significantly higher in females (64 years, IQR 53–77) than in males (60 years, IQR 50–71) (p<0.0001). Notification rates increased with age (Table 3). People older than 50 years accounted for 3 783 (77%) of 4 885 cases with known age. In all age groups, LD was more common in males, with an overall male-to-female ratio of 2.7. The male-to-female ratio peaked at 4.4 in those 80 years of age and older.
Table 3. Distribution of reported cases and notifications of Legionnaires’ disease per million by gender and age group, EU/EEA, 2011
Age (years)
Males Females Total Sex ratio (male/female) Cases
(n) Notif. rate (n/million)
Cases (n)
Notif. rate (n/million)
Cases (n)
Notif. rate (n/million)
0-19 15 0.3 10 0.2 25 0.2 1.4 20-29 63 1.9 32 1.0 95 1.4 1.9 30-39 197 5.5 59 1.7 256 3.6 3.3 40-49 559 14.7 167 4.4 726 9.6 3.3 50-59 853 25.7 276 8.0 1 129 16.7 3.2 60-69 801 30.9 305 10.7 1 106 20.3 2.9 70-79 619 35.1 264 11.6 883 21.9 3.0 ≥ 80 385 76.3 280 17.5 665 31.6 4.4 Total 3 492 14.3 1 393 5.4 4 885 9.7 2.7
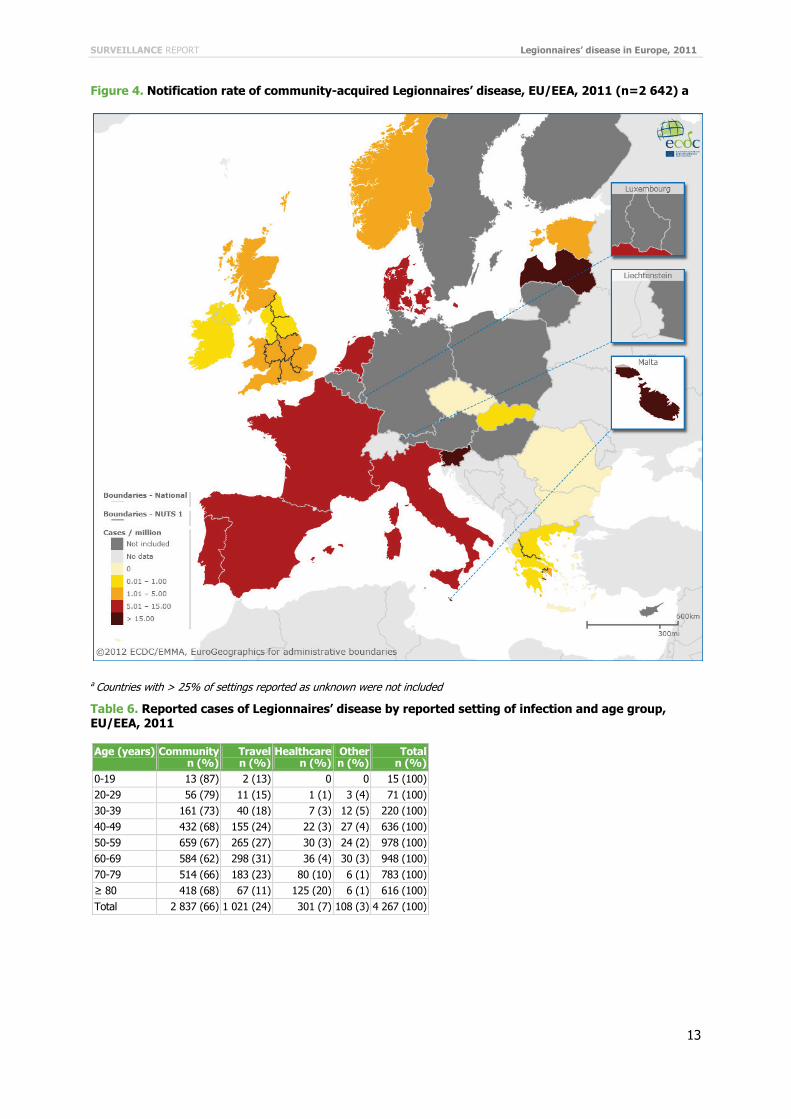
Settings Of 4 277 cases with reported setting of infection, 2 846 (67%) were reported as community-acquired (Table 4). In 2011, travel and healthcare-associated cases accounted for 24% and 7% of the total, respectively. The remaining cases (3%) were reported with other probable setting of infection. Across countries, this distribution varied widely, but in countries with a relatively high notification rate (above 15 cases per million), no country had less than 50% of community-acquired cases. Of note, this also applied to northern countries such as Denmark, Latvia and the Netherlands with community-acquired cases accounting for 54%, 84% and 50%, respectively. When restricting the analysis to community-acquired cases, three groups of countries emerged: those with a high notification rate (Latvia, Malta and Slovenia), those with a medium (5 to 15 cases per million) notification rate (Denmark, France, Italy, Netherlands, Portugal and Spain) and the remaining ones with a low notification rate (Table 5). Central and south-eastern European countries had the lowest notification rates (Figure 4). Denmark, France and Italy had relatively high notification rates for healthcare-associated cases (nosocomial and other healthcare settings). The proportion of healthcare-associated cases increased with age while the proportion of travellers peaked in 50 to 69 year-olds (Table 6). The decrease observed in 2011 was mostly driven by a decreased number of community-acquired cases as compared with previous years (-20% compared to the 2008–2010 average) (Table 7). Interestingly, travel-associated cases were less affected, especially cases reported with a travel history abroad which showed a slight increase. The six largest reporting countries notified 89% of community-acquired cases in 2011 (Table 8). In almost all these countries, with the notable exception of Germany, a substantial decrease in the number of community-acquired cases reported was observed. This decrease was of particular importance in Spain and the UK who reported 33% and 49% fewer cases, respectively.

SURVEILLANCE REPORT Legionnaires’ disease in Europe, 2011
11
Table 4. Reported cases of Legionnaires’ disease by country and reported setting of infection, EU/EEA, 2011
Country Community n (%)
Nosocomial n (%)
Other healthcare n (%)
Travel abroad n (%)
Domestic travel n (%)
Other n (%)
Total n (%)
Austria 43 (64) 1 (1) 0 21 (31) 2 (3) 0 67 (100) Belgium 11 (69) 1 (6) 0 4 0 0 16 (100) Czech Rep. 0 4 (7) 0 7 (12) 1 (2) 45 (79) 57 (100) Denmark 61 (54) 8 (7) 4 (4) 38 (33) 3 (3) 0 114 (100) Estonia 4 (57) 2 (29) 0 1 (14) 0 0 7 (100) Finland 0 0 0 5 (100) 0 0 5 (100) France 749 (64) 70 (6) 54 (5) 60 (5) 185 (16) 52 (4) 1 170 (100) Germany 144 (46) 24 (8) 5 (2) 112 (36) 26 (8) 0 311 (100) Greece 9 (53) 2 (12) 0 0 5 (29) 1 (6) 17 (100) Hungary 6 (38) 8 (50) 0 0 2 (13) 0 16 (100) Ireland 1 (14) 0 1 (14) 4 (57) 1 (14) 0 7 (100) Italy 772 (77) 64 (6) 28 (3) 9 (1) 121 (12) 7 (1) 1 001 (100) Latvia 41 (84) 0 0 3 5 0 49 (100) Malta 8 (89) 0 0 0 0 1 (11) 9 (100) Netherlands 154 (50) 1 (<1) 2 (1) 138 (44) 15 (5) 1 (<1) 311 (100) Poland 0 1(33) 0 2 (67) 0 0 3 (100) Portugal 76 (92) 4 (5) 0 2 (2) 0 1 (1) 83 (100) Romania 0 0 0 1 (100) 0 0 1 (100) Slovakia 4 (57) 2 (29) 0 1 (14) 0 0 7 (100) Slovenia 41 (95) 1 (2) 0 1 (2) 0 0 43 (100) Spain 611 (87) 1 (<1) 2 (<1) 9 (1) 83 (12) 0 706 (100) UK 99 (41) 11 (5) 0 120 (49) 14 (6) 0 244 (100) Total EU 27 2 834 (67) 205 (5) 96 (2) 538 (13) 463 (11) 108 (3) 4 277 (100) Norway 12 (36) 0 0 21 (64) 0 0 33 (100) Total EU/EEA 2 846 (67) 205 (5) 96 (2) 559 (13) 463 (11) 108 (3) 4 277 (100)
a Cyprus, Lithuania and Sweden did not report setting of infection

Legionnaires’ disease in Europe, 2011 SURVEILLANCE REPORT
12
Table 5. Reported community-acquired and healthcare-associated cases and notifications of Legionnaires’ disease per million by reporting country, EU/EEA, 2011
Country Community-acquired Healthcare-associated Cases
(n) Notification rate (n/million) Cases
(n) Notification rate (n/million)
Slovenia 41 20.0 1 0.5 Malta 8 19.2 0 0.0 Latvia 41 18.4 0 0.0 Spain 611 13.2 3 0.1 Italy 772 12.7 92 1.5 France 749 11.5 124 1.9 Denmark 61 11.0 12 2.2 Netherlands 154 9.2 3 0.2 Portugal 76 7.1 4 0.4 Austria 43 NAa 1 NAa
Estonia 4 3.0 2 1.5 Germany 144 NAa 29 NAa
UK 99 1.6 11 0.2 Belgium 11 NAa 1 NAa
Greece 9 0.8 2 0.2 Slovakia 4 0.7 2 0.4 Hungary 6 NAa 8 NAa
Ireland 1 0.2 1 0.2 Czech Republic 0 0.0 4 0.4 Finland 0 NAa 0 NAa
Poland 0 NAa 1 NAa
Romania 0 0.0 0 0.0 Total EU 27 2 834 5.9 301 0.6 Norway 12 2.4 0 0.0 Total EU/EEA 2 846 5.9 301 0.6
a Not applicable where > 25% of settings unknown
SURVEILLANCE REPORT Legionnaires’ disease in Europe, 2011
13
Figure 4. Notification rate of community-acquired Legionnaires’ disease, EU/EEA, 2011 (n=2 642) a
a Countries with > 25% of settings reported as unknown were not included
Table 6. Reported cases of Legionnaires’ disease by reported setting of infection and age group, EU/EEA, 2011
Age (years) Community n (%)
Travel n (%)
Healthcare n (%)
Other n (%)
Total n (%)
0-19 13 (87) 2 (13) 0 0 15 (100) 20-29 56 (79) 11 (15) 1 (1) 3 (4) 71 (100) 30-39 161 (73) 40 (18) 7 (3) 12 (5) 220 (100) 40-49 432 (68) 155 (24) 22 (3) 27 (4) 636 (100) 50-59 659 (67) 265 (27) 30 (3) 24 (2) 978 (100) 60-69 584 (62) 298 (31) 36 (4) 30 (3) 948 (100) 70-79 514 (66) 183 (23) 80 (10) 6 (1) 783 (100) ≥ 80 418 (68) 67 (11) 125 (20) 6 (1) 616 (100) Total 2 837 (66) 1 021 (24) 301 (7) 108 (3) 4 267 (100)

Legionnaires’ disease in Europe, 2011 SURVEILLANCE REPORT
14
Table 7. Reported cases of Legionnaires’ disease by reported setting and comparison with 2008-2010 average, EU/EEA, 2011
Setting 2011 n (%)
2008–2010 average n (%)
Difference %
Community 2 846 (67) 3 541 (69) -20 Travel abroad 559 (13) 536 (11) 4 Domestic travel 463 (11) 537 (11) -14 Nosocomial 205 (5) 307 (6) -33 Other healthcare 96 (2) 129 (3) -25 Other 108 (3) 51 (1) 112 Total 4 277 (100) 5 100 (100) -16
Table 8. Reported community-acquired cases of Legionnaires’ disease by reporting country and comparison with 2008–2010 average, EU/EEA, 2011
Country 2011 n (%)
2008–2010 average n (%)
Difference %
Italy 772 (27) 936 (26) -18 France 749 (26) 911 (26) -18 Spain 611 (21) 909 (26) -33 Netherlands 154 (5) 191 (5) -19 Germany 144 (5) 133 (4) 8 UK 99 (3) 194 (5) -49 Other countries 317 (11) 268 (8) 18 Total 2 846 (100) 3 541 (100) -20
Time to diagnosis Both date of onset and date of diagnosis were available in only 18% of cases (880/4 897). The median time from date of onset to diagnosis was six days (IQR 3–8).
3.1.2 Clusters Frequency and size Of 2 950 cases with known cluster status, 204 (7%) were reported as part of a cluster. The information on cluster status was missing in 40% of all cases (Table 9). A cluster identifier was provided for 188 cases forming 102 clusters which resulted in an average size of 1.8 cases per cluster (Figure 5). After a steady increase from 2008 to 2010, the average cluster size decreased again in 2011. The largest cluster reported in 2011 occurred in Corfu, Greece, with 12 cases reported by the UK. The next largest was an outbreak in Lazise, Italy, involving 11 cases. In both instances, the number of cases as identified in the annual dataset is an underestimation since some cases were reported without cluster identifier [13,14].

SURVEILLANCE REPORT Legionnaires’ disease in Europe, 2011
15
Figure 5. Reported clusters of Legionnaires' disease and average number of cases per cluster, by year of reporting, EU/EEA, 2005–2011 (n=754)
Time and location The proportion of clustered cases peaked in July–August (Figure 6). The percentage of clustered cases was moderately correlated to the number of cases (Pearson coefficient = 0.58). The proportion of cases which belonged to clusters was on average 5% with important differences among countries, ranging from 0 to 57% of cases in Ireland (Table 9).
Figure 6. Reported clustering of Legionnaires' disease by month of onset, EU/EEA, 2011 (n=2 876)
0
1
2
3
4
5
0
50
100
150
2005 2006 2007 2008 2009 2010 2011
Case
s pe
r cl
uste
r
Num
ber
of c
lust
ers
Clusters Cases per cluster
0%
5%
10%
15%
0
100
200
300
400
Jan Feb Mar Apr May Jun Jul Aug Sep Oct Nov Dec
Clus
tere
d ca
ses
Num
ber
of c
ases
Cases Clustered cases (%)

Legionnaires’ disease in Europe, 2011 SURVEILLANCE REPORT
16
Table 9. Reported clustering of Legionnaires’ disease by reporting country, EU/EEA, 2011
Country Clusters n
Clustered n (%)
Sporadic n (%)
Unknown n (%)
Total n
Cluster ratio a
% Austria 0 0 7 (7) 94 (93) 101 NA b
Belgium 0 0 0 79 (100) 79 NA Cyprus 0 0 0 1 (100) 1 NA Czech Rep. 0 0 4 (7) 53 (93) 57 NA Denmark 3 6 (5) 0 117 (95) 123 NA Estonia 0 0 7 (100) 0 7 0 Finland 0 0 0 9 (100) 9 NA France 0 0 0 1 170 (100) 1 170 NA Germany Unknown 11 (2) 620 (98) 3 (<1) 634 2 Greece 2 2 (11) 16 (89) 0 18 11 Hungary 0 0 37 (100) 0 37 0 Ireland 3 4 (57) 3 (43) 0 7 57 Italy 28 44 (4) 957 (96) 0 1 001 4 Latvia 4 10 (20) 39 (80) 0 49 20 Lithuania 0 0 2 (100) 0 2 0 Luxembourg 0 0 4 (67) 2 (33) 6 NA Malta 0 0 9 (100) 0 9 0 Netherlands 35 48 (15) 0 263 (85) 311 NA Norway 0 0 33 (100) 0 33 0 Poland 0 0 18 (100) 0 18 0 Portugal 2 7 (8) 82 (92) 0 89 8 Romania 0 0 1 (100) 0 1 0.0 Spain 18 42 (6) 664 (94) 0 706 6 Slovakia 1 1 (14) 6 (86) 0 7 14 Slovenia 0 0 44 (100) 0 44 0 Sweden 0 0 0 127 (100) 127 NA UK 13 29 (12) 193 (77) 29 (12) 251 13 Subtotal c 71 150 (5) 2 731 (94) 32 (1) 2 913 5 Total 109 204 (4) 2 746 (56) 1 947 (40) 4 897 NA
a Denominator: cases with known cluster status b Not applicable where >25% of cluster status unknown c Includes only countries where <25% of cluster status unknown
Setting of infection The proportion of cases reported as part of a cluster was the highest in domestic travellers, followed by those travelling abroad (Table 10). Travel-associated cases (domestic and abroad) were eight times more likely to be part of a cluster than cases occurring in other settings (PR 8.3, 95% CI 6.2–11.1).
Table 10. Reported clustering of Legionnaires’ disease, by setting, EU/EEA, 2011
Setting Total cases reported Clusters Clustered cases Cluster size n % n n % (case/cluster)
Community 1 825 71 18 46 3 2.6 Domestic travel 258 10 47 69 27 1.5 Travel abroad 321 12 42 74 23 1.8 Nosocomial 119 5 5 11 9 2.2 Other healthcare 36 1 1 2 6 2.0 Other 10 0 0 0 0 Total 2 569 100 113 202 8 1.8
SURVEILLANCE REPORT Legionnaires’ disease in Europe, 2011
17
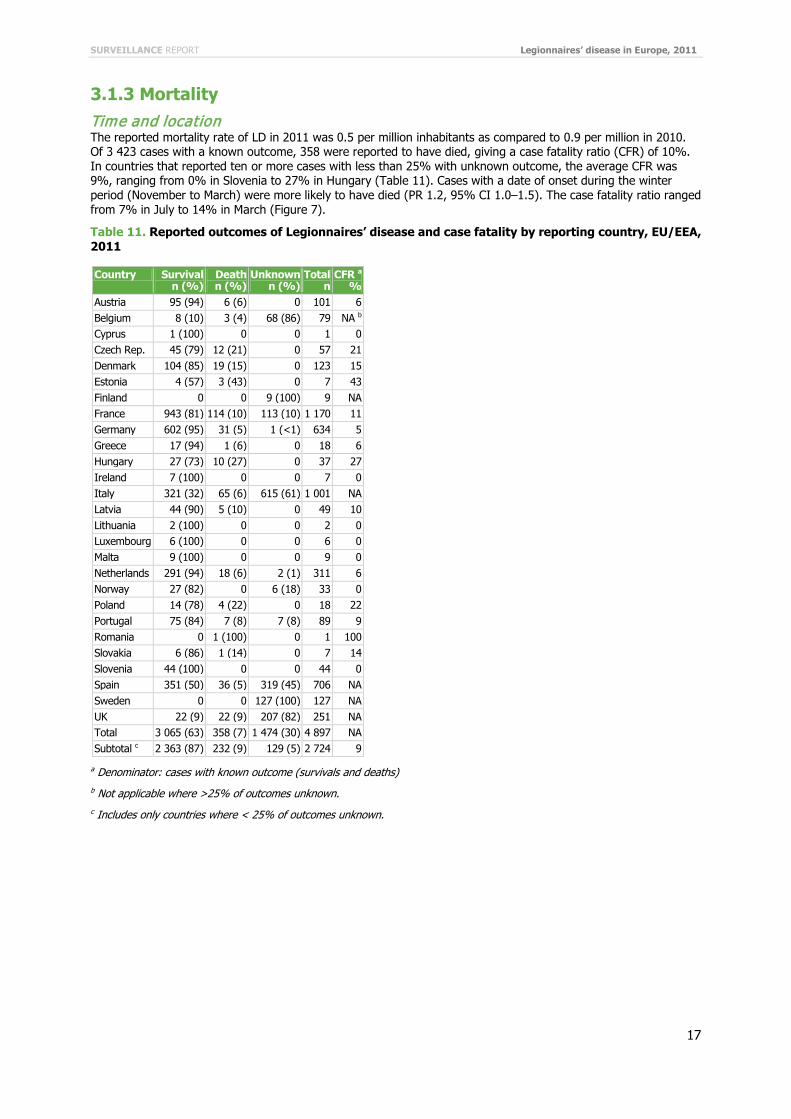
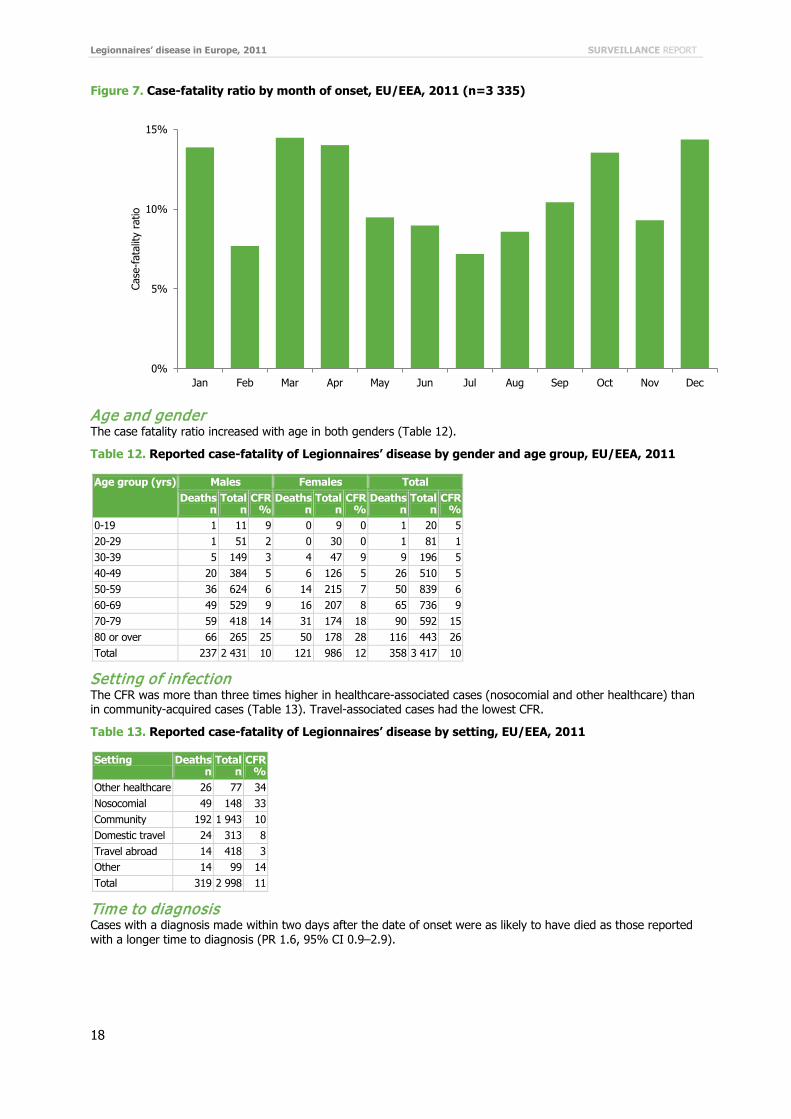
3.1.3 Mortality Time and location The reported mortality rate of LD in 2011 was 0.5 per million inhabitants as compared to 0.9 per million in 2010. Of 3 423 cases with a known outcome, 358 were reported to have died, giving a case fatality ratio (CFR) of 10%. In countries that reported ten or more cases with less than 25% with unknown outcome, the average CFR was 9%, ranging from 0% in Slovenia to 27% in Hungary (Table 11). Cases with a date of onset during the winter period (November to March) were more likely to have died (PR 1.2, 95% CI 1.0–1.5). The case fatality ratio ranged from 7% in July to 14% in March (Figure 7).
Table 11. Reported outcomes of Legionnaires’ disease and case fatality by reporting country, EU/EEA, 2011
Country Survival n (%)
Death n (%)
Unknown n (%)
Total n
CFR a
% Austria 95 (94) 6 (6) 0 101 6 Belgium 8 (10) 3 (4) 68 (86) 79 NA b
Cyprus 1 (100) 0 0 1 0 Czech Rep. 45 (79) 12 (21) 0 57 21 Denmark 104 (85) 19 (15) 0 123 15 Estonia 4 (57) 3 (43) 0 7 43 Finland 0 0 9 (100) 9 NA France 943 (81) 114 (10) 113 (10) 1 170 11 Germany 602 (95) 31 (5) 1 (<1) 634 5 Greece 17 (94) 1 (6) 0 18 6 Hungary 27 (73) 10 (27) 0 37 27 Ireland 7 (100) 0 0 7 0 Italy 321 (32) 65 (6) 615 (61) 1 001 NA Latvia 44 (90) 5 (10) 0 49 10 Lithuania 2 (100) 0 0 2 0 Luxembourg 6 (100) 0 0 6 0 Malta 9 (100) 0 0 9 0 Netherlands 291 (94) 18 (6) 2 (1) 311 6 Norway 27 (82) 0 6 (18) 33 0 Poland 14 (78) 4 (22) 0 18 22 Portugal 75 (84) 7 (8) 7 (8) 89 9 Romania 0 1 (100) 0 1 100 Slovakia 6 (86) 1 (14) 0 7 14 Slovenia 44 (100) 0 0 44 0 Spain 351 (50) 36 (5) 319 (45) 706 NA Sweden 0 0 127 (100) 127 NA UK 22 (9) 22 (9) 207 (82) 251 NA Total 3 065 (63) 358 (7) 1 474 (30) 4 897 NA Subtotal c 2 363 (87) 232 (9) 129 (5) 2 724 9
a Denominator: cases with known outcome (survivals and deaths) b Not applicable where >25% of outcomes unknown. c Includes only countries where < 25% of outcomes unknown.
Legionnaires’ disease in Europe, 2011 SURVEILLANCE REPORT
18
Figure 7. Case-fatality ratio by month of onset, EU/EEA, 2011 (n=3 335)
Age and gender The case fatality ratio increased with age in both genders (Table 12).
Table 12. Reported case-fatality of Legionnaires’ disease by gender and age group, EU/EEA, 2011
Age group (yrs) Males Females Total Deaths
n Total
n CFR
% Deaths
n Total
n CFR
% Deaths
n Total
n CFR
% 0-19 1 11 9 0 9 0 1 20 5 20-29 1 51 2 0 30 0 1 81 1 30-39 5 149 3 4 47 9 9 196 5 40-49 20 384 5 6 126 5 26 510 5 50-59 36 624 6 14 215 7 50 839 6 60-69 49 529 9 16 207 8 65 736 9 70-79 59 418 14 31 174 18 90 592 15 80 or over 66 265 25 50 178 28 116 443 26 Total 237 2 431 10 121 986 12 358 3 417 10
Setting of infection The CFR was more than three times higher in healthcare-associated cases (nosocomial and other healthcare) than in community-acquired cases (Table 13). Travel-associated cases had the lowest CFR.
Table 13. Reported case-fatality of Legionnaires’ disease by setting, EU/EEA, 2011
Setting Deaths n
Total n
CFR %
Other healthcare 26 77 34 Nosocomial 49 148 33 Community 192 1 943 10 Domestic travel 24 313 8 Travel abroad 14 418 3 Other 14 99 14 Total 319 2 998 11
Time to diagnosis Cases with a diagnosis made within two days after the date of onset were as likely to have died as those reported with a longer time to diagnosis (PR 1.6, 95% CI 0.9–2.9).
0%
5%
10%
15%
Jan Feb Mar Apr May Jun Jul Aug Sep Oct Nov Dec
Case
-fat
ality
rat
io
SURVEILLANCE REPORT Legionnaires’ disease in Europe, 2011
19
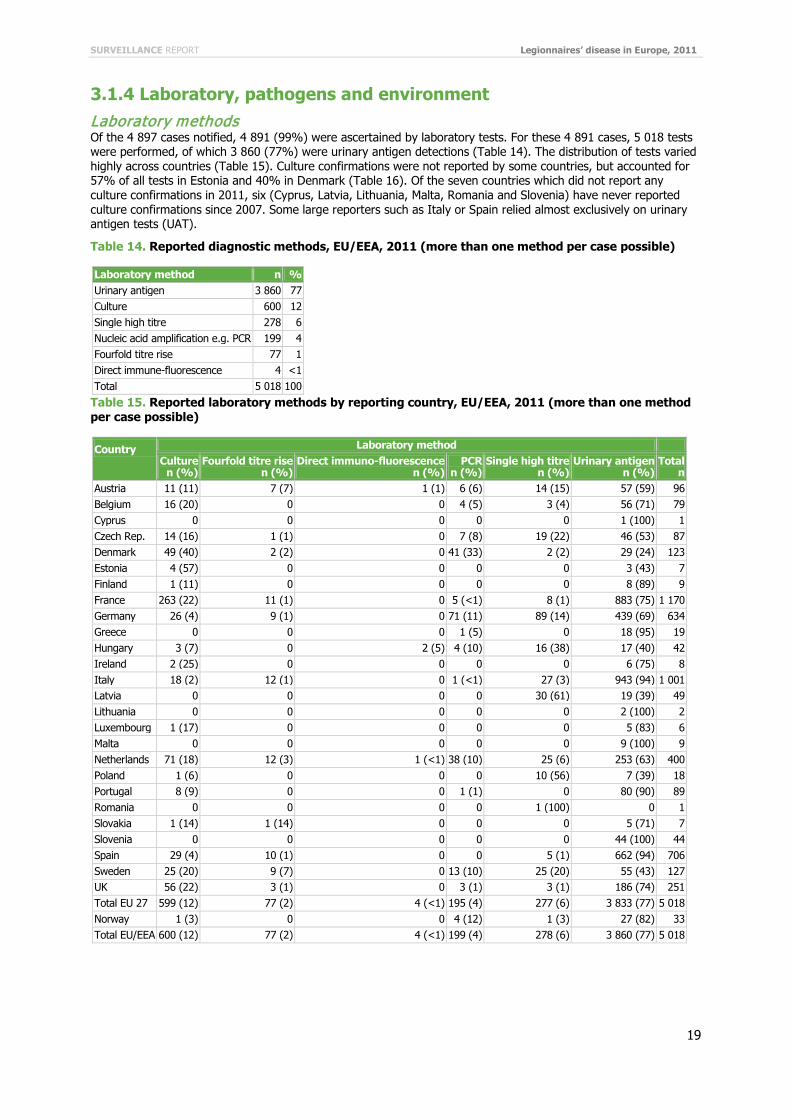
3.1.4 Laboratory, pathogens and environment Laboratory methods Of the 4 897 cases notified, 4 891 (99%) were ascertained by laboratory tests. For these 4 891 cases, 5 018 tests were performed, of which 3 860 (77%) were urinary antigen detections (Table 14). The distribution of tests varied highly across countries (Table 15). Culture confirmations were not reported by some countries, but accounted for 57% of all tests in Estonia and 40% in Denmark (Table 16). Of the seven countries which did not report any culture confirmations in 2011, six (Cyprus, Latvia, Lithuania, Malta, Romania and Slovenia) have never reported culture confirmations since 2007. Some large reporters such as Italy or Spain relied almost exclusively on urinary antigen tests (UAT).
Table 14. Reported diagnostic methods, EU/EEA, 2011 (more than one method per case possible)
Laboratory method n % Urinary antigen 3 860 77 Culture 600 12 Single high titre 278 6 Nucleic acid amplification e.g. PCR 199 4 Fourfold titre rise 77 1 Direct immune-fluorescence 4 <1 Total 5 018 100
Table 15. Reported laboratory methods by reporting country, EU/EEA, 2011 (more than one method per case possible)
Country Laboratory method Culture
n (%) Fourfold titre rise
n (%) Direct immuno-fluorescence
n (%) PCR
n (%) Single high titre
n (%) Urinary antigen
n (%) Total
n Austria 11 (11) 7 (7) 1 (1) 6 (6) 14 (15) 57 (59) 96 Belgium 16 (20) 0 0 4 (5) 3 (4) 56 (71) 79 Cyprus 0 0 0 0 0 1 (100) 1 Czech Rep. 14 (16) 1 (1) 0 7 (8) 19 (22) 46 (53) 87 Denmark 49 (40) 2 (2) 0 41 (33) 2 (2) 29 (24) 123 Estonia 4 (57) 0 0 0 0 3 (43) 7 Finland 1 (11) 0 0 0 0 8 (89) 9 France 263 (22) 11 (1) 0 5 (<1) 8 (1) 883 (75) 1 170 Germany 26 (4) 9 (1) 0 71 (11) 89 (14) 439 (69) 634 Greece 0 0 0 1 (5) 0 18 (95) 19 Hungary 3 (7) 0 2 (5) 4 (10) 16 (38) 17 (40) 42 Ireland 2 (25) 0 0 0 0 6 (75) 8 Italy 18 (2) 12 (1) 0 1 (<1) 27 (3) 943 (94) 1 001 Latvia 0 0 0 0 30 (61) 19 (39) 49 Lithuania 0 0 0 0 0 2 (100) 2 Luxembourg 1 (17) 0 0 0 0 5 (83) 6 Malta 0 0 0 0 0 9 (100) 9 Netherlands 71 (18) 12 (3) 1 (<1) 38 (10) 25 (6) 253 (63) 400 Poland 1 (6) 0 0 0 10 (56) 7 (39) 18 Portugal 8 (9) 0 0 1 (1) 0 80 (90) 89 Romania 0 0 0 0 1 (100) 0 1 Slovakia 1 (14) 1 (14) 0 0 0 5 (71) 7 Slovenia 0 0 0 0 0 44 (100) 44 Spain 29 (4) 10 (1) 0 0 5 (1) 662 (94) 706 Sweden 25 (20) 9 (7) 0 13 (10) 25 (20) 55 (43) 127 UK 56 (22) 3 (1) 0 3 (1) 3 (1) 186 (74) 251 Total EU 27 599 (12) 77 (2) 4 (<1) 195 (4) 277 (6) 3 833 (77) 5 018 Norway 1 (3) 0 0 4 (12) 1 (3) 27 (82) 33 Total EU/EEA 600 (12) 77 (2) 4 (<1) 199 (4) 278 (6) 3 860 (77) 5 018

Legionnaires’ disease in Europe, 2011 SURVEILLANCE REPORT
20
Table 16. Reported Legionnaires’ disease cases with culture confirmation by reporting country, EU/EEA, 2011
Country No culture confirmation n (%)
Culture confirmation n (%)
Total n
Estonia 3 (43) 4 (57) 7 Denmark 74 (60) 49 (40) 123 Ireland 5 (71) 2 (29) 7 Czech Republic 43 (75) 14 (25) 57 Netherlands 240 (77) 71 (23) 311 France 907 (78) 263 (22) 1 170 UK 195 (78) 56 (22) 251 Belgium 63 (80) 16 (20) 79 Sweden 102 (80) 25 (20) 127 Luxembourg 5 (83) 1 (17) 6 Slovakia 6 (86) 1 (14) 7 Finland 8 (89) 1 (11) 9 Austria 90 (89) 11 (11) 101 Portugal 81 (91) 8 (9) 89 Hungary 34 (92) 3 (8) 37 Poland 17 (94) 1 (6) 18 Spain 677 (96) 29 (4) 706 Germany 608 (96) 26 (4) 634 Norway 32 (97) 1 (3) 33 Italy 983 (98) 18 (2) 1 001 Cyprus 1 (100) 0 1 Greece 18 (100) 0 18 Lithuania 2 (100) 0 2 Latvia 49 (100) 0 49 Malta 9 (100) 0 9 Romania 1 (100) 0 1 Slovenia 44 (100) 0 44 Total 4 297 (88) 600 4 897
Pathogens Of 600 culture-confirmed cases, 575 (96%) were due to L. pneumophila (Table 17). Its Serogroup 1 represented 507 (85%) of 600 culture-confirmed cases (Table 18). Half of the 87 isolates that were subtyped using monoclonal antibodies (MAb) were Allentown/France and Philadelphia subtypes (Table 19). The distribution of MAb 3/1 positive and negative subtypes was very similar to that observed in Helbig’s pan-European study [15]. In addition, seven countries (Austria, Belgium, Czech Republic, Denmark, The Netherlands, Portugal and the UK) reported results of sequence typing for 164 cases, of which 96% were culture-confirmed (158/164).
Table 17. Reported culture-confirmed cases of Legionnaires' disease and Legionella isolates by species, EU/EEA, 2011
Species Culture-confirmed cases n %
L. pneumophila 575 96 L. longbeachae 2 <1 L. bozemanii 6 1 L. micdadei 3 1 L. species unknown 14 2 Total 600 100

SURVEILLANCE REPORT Legionnaires’ disease in Europe, 2011
21
Table 18. Reported culture-confirmed cases of Legionnaires' disease and L. pneumophila isolates by serogroup, EU/EEA, 2011
Culture-confirmed cases with L. pneumophila Serogroup n % 1 507 88 2 6 1 3 12 2 4 3 1 5 3 1 6 8 1 7 3 1 8 2 <1 9 1 <1 10 4 1 12 1 <1 14 1 <1 Mixed 1 <1 Unknown 23 4 Total 575 100
Table 19. Reported monoclonal subtype for L. pneumophila serogroup 1 isolates, EU/EEA, 2011
Monoclonal subtype n % Philadelphia 19 22 Allentown/France 25 29 Benidorm 15 17 Knoxville 12 14 Subtotal MAb 3/1 positive a 71 71 Oxford/OLDA 6 7 Camperdown 1 1 Bellingham 9 10 Subtotal MAb 3/1 negative 16 16 Total 87 100
a Monoclonal types are grouped as having, or not having, the virulence associated epitope recognized by the MAb 3/1 (Dresden Panel).
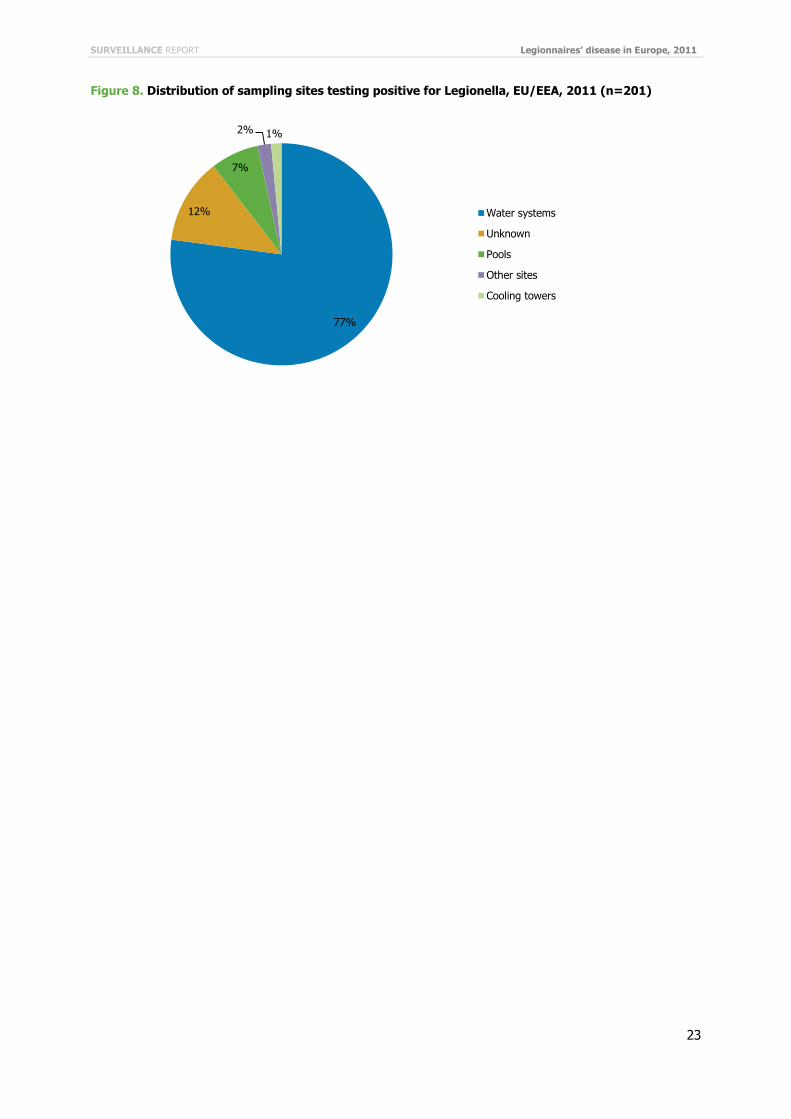
Environment Environmental investigation status was available for 1 547 (42%) of 3 718 cases known not to have travelled abroad within the incubation period (Table 20). An investigation was carried out in 316 (20%) of these 1 547 cases with known status. Such investigations were more likely in culture-confirmed (PR 3.5, 95% CI 2.9–4.2) and in fatal cases (PR 1.3, 95% CI 1.0–1.7). Legionella was detected in 164 (52%) of 316 investigations for which environmental findings were reported (Table 21), with 201 sampling sites testing positive: 155 (77%) water systems (44 hot water systems, 14 cold water systems and 97 non-specified water systems), 14 (7%) pools, 3 cooling towers (1%) and 4 (2%) other sampling sites (Figure 8). For 25 (12%) of those 201 investigations with positive findings, the sampling site was missing or unknown. In 12 (7%) of the 164 cases with positive environmental findings, isolates could be matched to clinical isolates.

Legionnaires’ disease in Europe, 2011 SURVEILLANCE REPORT
22
Table 20. Environmental follow-up status of reported cases of Legionnaires’ disease by reporting country, EU/EEA, 2011*
Country Investigation No investigation Status unknown Total n % n % n % n
Austria 36 78 3 7 7 15 46 Belgium 1 8 0 11 92 12 Czech Rep. 29 58 20 40 1 2 50 Denmark 12 16 0 64 84 76 Estonia 3 50 3 50 0 6 France 0 0 1 110 100 1 110 Germany 0 0 199 100 199 Greece 0 0 17 100 17 Hungary 5 31 11 69 0 16 Ireland 2 67 1 33 0 3 Italy 27 3 965 97 0 992 Latvia 38 83 8 17 0 46 Malta 9 100 0 0 9 Netherlands 56 32 109 63 8 5 173 Norway 0 0 12 100 12 Poland 1 100 0 0 1 Portugal 17 21 64 79 0 81 Slovakia 3 50 3 50 0 6 Slovenia 0 42 100 0 42 Spain 40 6 0 657 94 697 UK 37 30 2 2 85 69 124 Total 316 8 1 231 33 2 171 58 3 718
*Cases with setting reported as unknown or travel abroad were not included
Table 21. Legionella findings of environmental investigations by reporting country, EU/EEA, 2011*
Country Detection No detection Result unknown Total n % n % n % n
Austria 18 50 14 39 4 11 36 Belgium 1 100 0 0 1 Czech Rep. 26 90 3 10 0 29 Denmark 12 100 0 0 12 Estonia 3 100 0 0 3 Hungary 5 100 0 0 5 Ireland 1 50 1 50 0 2 Italy 14 52 13 48 0 27 Latvia 20 53 18 47 0 38 Malta 3 33 6 67 0 9 Netherlands 13 23 35 63 8 14 56 Poland 1 100 0 0 1 Portugal 6 35 9 53 2 12 17 Slovakia 2 67 1 33 0 3 Spain 16 40 16 40 8 20 40 UK 23 62 14 38 0 37 Total 164 52 130 41 22 7 316
*Cases with setting reported as unknown or travel abroad were not included
SURVEILLANCE REPORT Legionnaires’ disease in Europe, 2011
23
Figure 8. Distribution of sampling sites testing positive for Legionella, EU/EEA, 2011 (n=201)
77%
12%
7%
2% 1%
Water systems
Unknown
Pools
Other sites
Cooling towers

Legionnaires’ disease in Europe, 2011 SURVEILLANCE REPORT
24
3.2 Travel-associated Legionnaires’ disease 3.2.1 Cases Notifications ELDSNet received reports of 763 cases of TALD with date of onset in 2011. This was 12% less than the 864 cases reported in 2010 and continued the decreasing trend observed since 2007 (Figure 9).
Figure 9. Number of travel-associated cases of Legionnaires’ disease reported to ELDSNet, 1987-2011
Cases were reported from 18 EU/EEA Member States and the United States. The latter reported five cases, associated with accommodation sites in the EU. Of all TALD cases, 619 (81%) were reported in decreasing order of frequency by the following five countries: France, Italy, the Netherlands, the United Kingdom and Spain (Table 22).
0
200
400
600
800
1000
87 88 89 90 91 92 93 94 95 96 97 98 99 00 01 02 03 04 05 06 07 08 09 10 11
Num
ber
of c
ases
Year
SURVEILLANCE REPORT Legionnaires’ disease in Europe, 2011
25
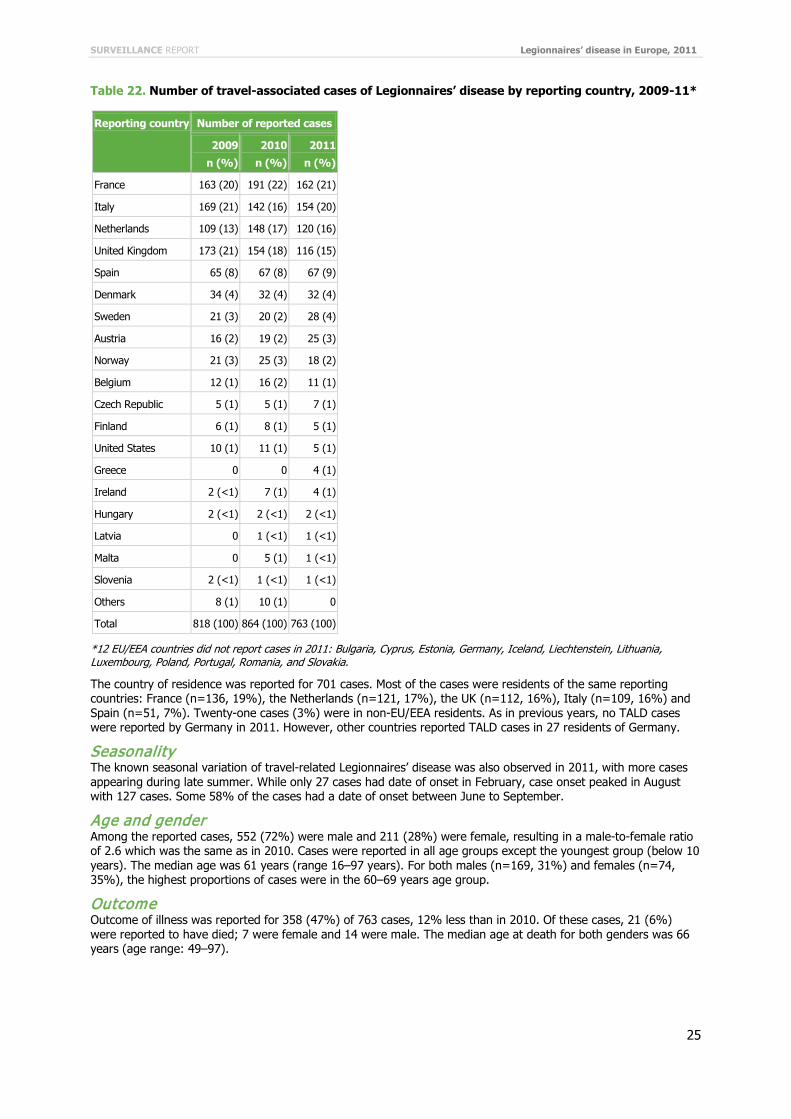
Table 22. Number of travel-associated cases of Legionnaires’ disease by reporting country, 2009-11*
Reporting country Number of reported cases
2009
n (%)
2010
n (%)
2011
n (%)
France 163 (20) 191 (22) 162 (21)
Italy 169 (21) 142 (16) 154 (20)
Netherlands 109 (13) 148 (17) 120 (16)
United Kingdom 173 (21) 154 (18) 116 (15)
Spain 65 (8) 67 (8) 67 (9)
Denmark 34 (4) 32 (4) 32 (4)
Sweden 21 (3) 20 (2) 28 (4)
Austria 16 (2) 19 (2) 25 (3)
Norway 21 (3) 25 (3) 18 (2)
Belgium 12 (1) 16 (2) 11 (1)
Czech Republic 5 (1) 5 (1) 7 (1)
Finland 6 (1) 8 (1) 5 (1)
United States 10 (1) 11 (1) 5 (1)
Greece 0 0 4 (1)
Ireland 2 (<1) 7 (1) 4 (1)
Hungary 2 (<1) 2 (<1) 2 (<1)
Latvia 0 1 (<1) 1 (<1)
Malta 0 5 (1) 1 (<1)
Slovenia 2 (<1) 1 (<1) 1 (<1)
Others 8 (1) 10 (1) 0
Total 818 (100) 864 (100) 763 (100)
*12 EU/EEA countries did not report cases in 2011: Bulgaria, Cyprus, Estonia, Germany, Iceland, Liechtenstein, Lithuania, Luxembourg, Poland, Portugal, Romania, and Slovakia.
The country of residence was reported for 701 cases. Most of the cases were residents of the same reporting countries: France (n=136, 19%), the Netherlands (n=121, 17%), the UK (n=112, 16%), Italy (n=109, 16%) and Spain (n=51, 7%). Twenty-one cases (3%) were in non-EU/EEA residents. As in previous years, no TALD cases were reported by Germany in 2011. However, other countries reported TALD cases in 27 residents of Germany.
Seasonality The known seasonal variation of travel-related Legionnaires’ disease was also observed in 2011, with more cases appearing during late summer. While only 27 cases had date of onset in February, case onset peaked in August with 127 cases. Some 58% of the cases had a date of onset between June to September.
Age and gender Among the reported cases, 552 (72%) were male and 211 (28%) were female, resulting in a male-to-female ratio of 2.6 which was the same as in 2010. Cases were reported in all age groups except the youngest group (below 10 years). The median age was 61 years (range 16–97 years). For both males (n=169, 31%) and females (n=74, 35%), the highest proportions of cases were in the 60–69 years age group.
Outcome Outcome of illness was reported for 358 (47%) of 763 cases, 12% less than in 2010. Of these cases, 21 (6%) were reported to have died; 7 were female and 14 were male. The median age at death for both genders was 66 years (age range: 49–97).

Legionnaires’ disease in Europe, 2011 SURVEILLANCE REPORT
26
3.2.2 Clinical microbiological analysis In accordance with the European case definition [12], 715 TALD cases (94%) were classified as confirmed and 48 as probable. Of the 715 confirmed cases, 50 (7%) were diagnosed by culture of the organism (10 % in 2009, 6% in 2010). Of the 50 culture-confirmed cases, 41 were also diagnosed by urinary antigen detection. In total, in 706 (93%) of 763 cases, UAT was performed. None of the cases were confirmed only by L. pneumophila serogroup-1-specific antibody response. Of the 48 probable cases, 21 were diagnosed by polymerase chain reaction (PCR) as the only method of diagnosis, six by a non-serogroup-1-specific antibody response as the only method, 18 by a single high antibody titre as the only method, one by immune-fluorescence and two by undefined methods. Of all laboratory methods used, 84% UAT, 6 % culture and 6% PCR (Table 23).
Table 23. Reported diagnostic methods TALD, EU/EEA, 2011 (more than one method per case possible)
Laboratory method n %
Urinary antigen 706 84
Culture 50 6
Single high titre 25 3
Nucleic acid amplification e.g. PCR 50 6
Fourfold titre rise 8 1
Direct immune-fluorescence 1 <1
Total 840 100
In 616 cases (81%), L. pneumophila serogroup 1 was reported as the causative microorganism. In three further cases, serogroup 10 was reported and in six cases a mix of serogroups. One case was reported to have been caused by L. longbeachae. In the remaining cases, the pathogen was unknown or not reported.
Monoclonal subtyping results were reported for 28 cases (4%). Subtype Allentown/France accounted for ten cases, Benidorm and Philadelphia each accounted for six cases, Knoxville for four cases and Oxford/OLDA and Bellingham for one case each.
Seven countries reported the sequence type for 21 cases (3%): eight from Denmark, four from Austria, three from Sweden, two each from UK and the Czech Republic, and one each from France and the Netherlands. For comparison, in 2010 only three countries reported the sequence type for a total of 13 cases (2%).
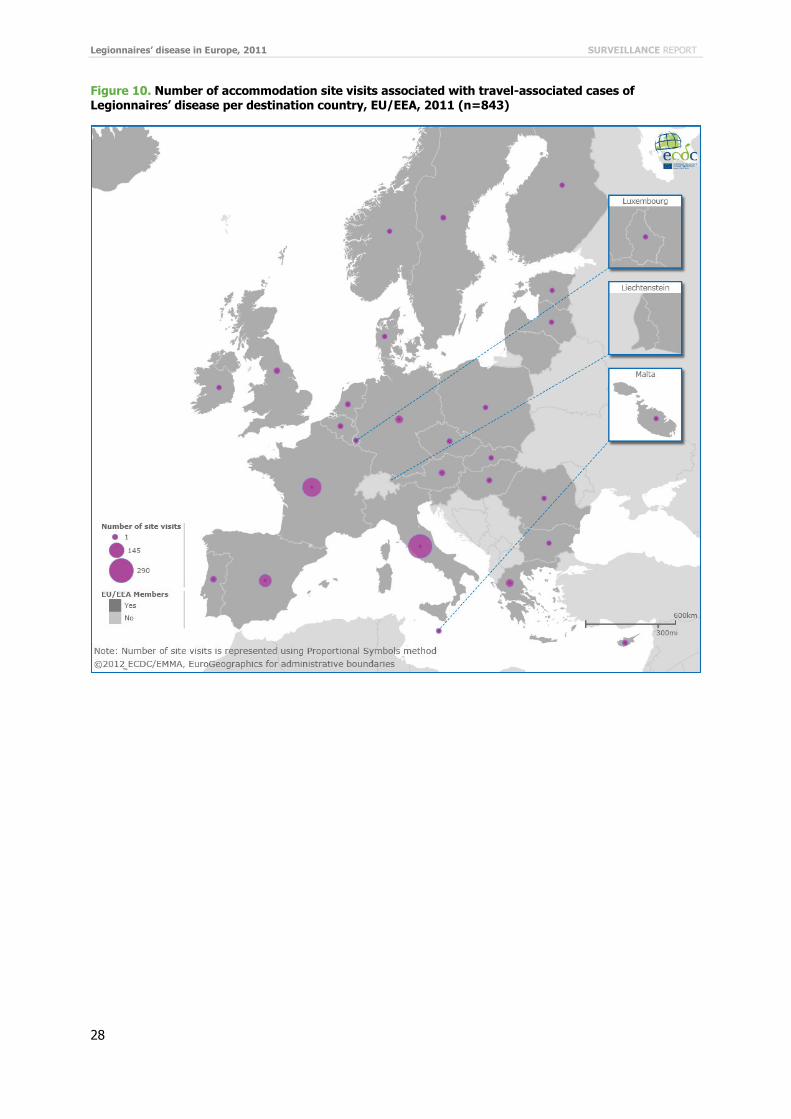
3.2.3 Travel: visits and sites The 763 reported TALD cases had made 1 087 visits to commercial accommodation sites around the world. Of 763 cases, 621 (81%) travelled within the EU/EEA (489 cases visiting only one country and 132 more than one country); 127 (17%) cases travelled outside the EU/EEA (94 to a single country and 33 to more than one country); six cases went to both EU/EEA and non-EU/EEA destinations and nine cases were associated with cruise ships. Altogether, the cases had visited 64 countries in the 2–10 days before the date of onset. The three destination countries with the most TALD-associated accommodation sites were Italy (n=290, 27%), France (n=210, 19%), and Spain (n=113, 10%). The 61 remaining destination countries had each less than 50 accommodation sites associated with TALD.
Of the 1 034 travel visits for which the accommodation type was reported, 79% involved hotels, 9% camping sites, 6% apartments, 1% ships and 5% other types. Three visits were reported to have been to a private (but commercially rented out) accommodation and 15 visits involved stays on board ships.
The proportion of domestic travel varied widely across Member States, ranging from 4% in Denmark and Norway to 100% in Greece, Hungary and Romania (Table 24).
SURVEILLANCE REPORT Legionnaires’ disease in Europe, 2011
27
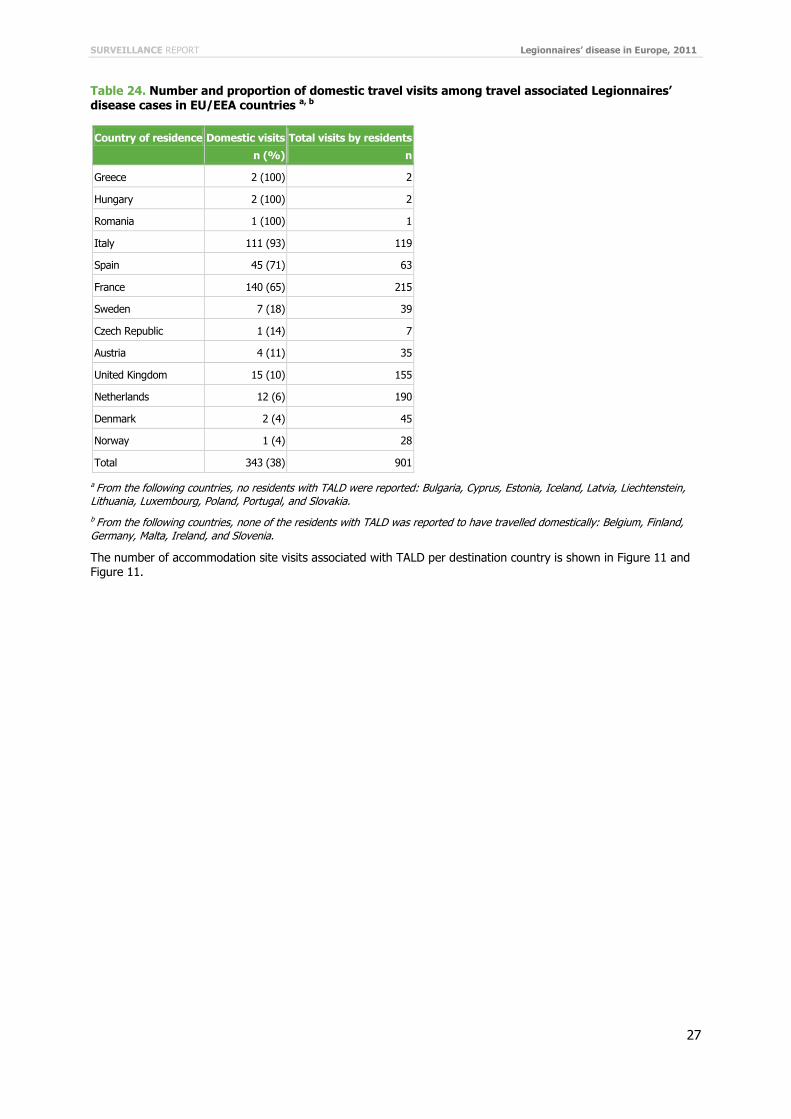
Table 24. Number and proportion of domestic travel visits among travel associated Legionnaires’ disease cases in EU/EEA countries a, b
Country of residence Domestic visits
n (%)
Total visits by residents
n
Greece 2 (100) 2
Hungary 2 (100) 2
Romania 1 (100) 1
Italy 111 (93) 119
Spain 45 (71) 63
France 140 (65) 215
Sweden 7 (18) 39
Czech Republic 1 (14) 7
Austria 4 (11) 35
United Kingdom 15 (10) 155
Netherlands 12 (6) 190
Denmark 2 (4) 45
Norway 1 (4) 28
Total 343 (38) 901
a From the following countries, no residents with TALD were reported: Bulgaria, Cyprus, Estonia, Iceland, Latvia, Liechtenstein, Lithuania, Luxembourg, Poland, Portugal, and Slovakia. b From the following countries, none of the residents with TALD was reported to have travelled domestically: Belgium, Finland, Germany, Malta, Ireland, and Slovenia.
The number of accommodation site visits associated with TALD per destination country is shown in Figure 11 and Figure 11.
Legionnaires’ disease in Europe, 2011 SURVEILLANCE REPORT
28
Figure 10. Number of accommodation site visits associated with travel-associated cases of Legionnaires’ disease per destination country, EU/EEA, 2011 (n=843)

SURVEILLANCE REPORT Legionnaires’ disease in Europe, 2011
29
Figure 11. Number of accommodation site visits associated with travel-associated cases of Legionnaires’ disease per destination country, worldwide, 2011 (n=1 087)
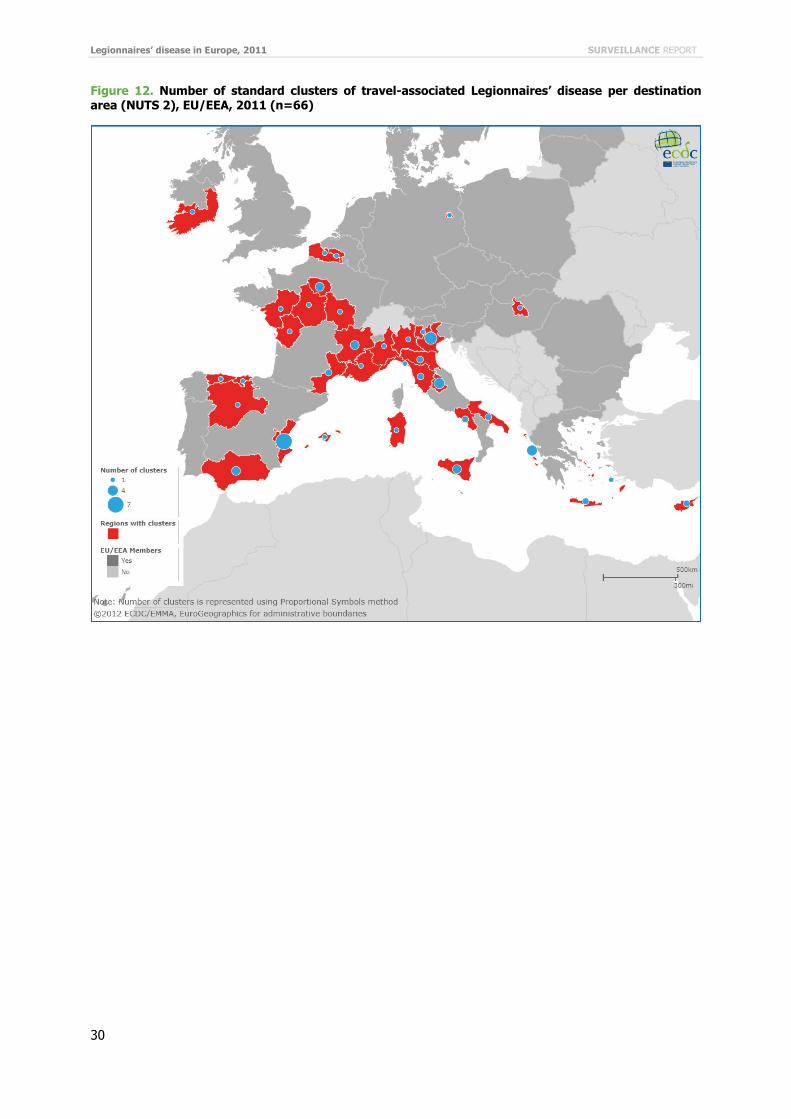
3.2.4 Clusters In 2011, 82 new standard clusters were detected, 66 in EU Member States and 16 outside the EU. In addition, there were also seven complex clusters, six in EU Member States and one outside the EU. Altogether, 229 TALD cases were involved in clusters during 2011. There were clusters in 11 EU countries and 11 non-EU countries. The largest cluster involved 12 cases, all with date of onset in 2011 associated with one Italian hotel, which formed part of an outbreak involving other accommodation sites [13]. Italy was associated with the highest number of clusters, at 28, followed by France and Spain with 15 and 14 clusters, respectively.
In 37 clusters (45%), the first two reported cases were from different countries and would not have been detected (in a timely manner or not at all) without ELDSNet.
During 2011, 19 rapidly evolving cluster reports, including updates, were sent to tour operators. The locations of these clusters were Cyprus (n=1), France (n=1), Greece (n=3), Italy (n=11), Spain (n=1), and Turkey (n=2).
The number of TALD clusters per country is shown in Figure 12 and Figure 13.
Legionnaires’ disease in Europe, 2011 SURVEILLANCE REPORT
30
Figure 12. Number of standard clusters of travel-associated Legionnaires’ disease per destination area (NUTS 2), EU/EEA, 2011 (n=66)

SURVEILLANCE REPORT Legionnaires’ disease in Europe, 2011
31
Figure 13. Number of standard clusters of travel-associated Legionnaires’ disease per destination country, worldwide, 2011 (n=82)
3.2.5 Investigations and publication In 2011, 97 Form B’s were returned to ELDSNet, reporting the detection of legionella in 60 accommodation sites (62%). Form B’s were also returned by four non-EU/EEA countries (Andorra, South Africa, Thailand, and Turkey) on a voluntary basis. ELDSNet sent 45 summary reports to tour operators, including updates: 26 regarding non-EU/EEA clusters and 19 regarding rapidly evolving clusters (see 2.2.2).
For seven cluster sites within the EU/EEA (Italy 4, France 2, Greece 1), Form B was not received in due time or stated uncertainty regarding the control measures taken. The names and locations of those seven accommodation sites were published on the ECDC website.
3.3 Event-based surveillance In 2011, seven threats related to Legionnaires’ disease were monitored by ECDC. The largest outbreak was associated with travel to the town of Lazise, Veneto, Italy in July and August. Seventeen cases, which included residents from five EU countries were reported. The source of the outbreak could not be identified [13]. A second large outbreak was associated with travel to Corfu, Greece in September and October 2011. Of 16 cases reported, 15 were British residents. Epidemiological investigation and microbiological analysis suggested that several accommodation sites were involved as sources of infection [14].

Legionnaires’ disease in Europe, 2011 SURVEILLANCE REPORT
32
4. Discussion With a 22% decrease from 2010, the notification rate of all cases of LD in the EU/EEA in 2011 has reached the lowest level since 2004. Interestingly, this decrease occurred mostly in the second half of the year. As in previous years, a limited number of countries reported the majority of LD cases with France, Italy, Spain, Germany, the Netherlands and the United Kingdom accounting for 83% [3,11]. This proportion was even higher when restricting the analysis to community-acquired cases with 89% of cases reported by the same countries. Since community-acquired cases accounted for 70% of all LD cases, the decrease observed in the number of these cases (-20% compared to the 2008-2010 average) accounted for most of the decrease in the overall notification rate. Among the six largest reporting countries, only Germany reported more cases in 2011 than in previous years. The average number of community-acquired cases reported by the remaining EU/EEA countries also increased. Of note, the decreased number of community-acquired cases reported in 2011 was particularly pronounced in the UK with fewer than half the number of cases compared to the 2008–2010 average. One hypothesis would be that the general environmental conditions did not favour the growth of Legionella spp. across most of Western Europe during 2011. Countries who usually report low case numbers (including Germany [16]) were less affected. These countries are still ‘catching up’ with notification rates far below what would be expected. However, some exceptions should be noted, such as the yet unexplained 2011 increase in sporadic community-acquired cases in Latvia [17]. The impact of environmental conditions on LD incidence in Europe could be further explored, if cases’ place of residence were reported more consistently with subnational geocoding.
Interestingly, the number of TALD cases contributed less to the decrease in notifications and the number of cases reported with a travel history abroad remained stable. The majority of cases reported with a history of domestic travel (84%) were reported by France, Italy and Spain. If some specific environmental conditions affected those countries which impacted on the number of community-acquired LD, one would indeed expect some effect on the number of cases reported with internal travel. It is more difficult to interpret the number of cases reported with a travel history abroad because that number is influenced by other factors like the surveillance system of the reporting countries.
As in previous years, TALD cases were more likely to be reported as part of a cluster [3,11]. This is likely due to the active daily surveillance of TALD cases and the systems in place making it relatively easy to link a TALD case to an accommodation site. Nevertheless, it is also possible that the current definition of a cluster is too sensitive (two cases with dates of onset no more than two years apart) and artificially inflates the number of TALD clusters.
The information available in the comprehensive database could not provide the full picture for the two largest outbreaks detected in 2011. Data completeness of cluster identifiers would need further improvement.
At 9%, the CFR in 2011 was very similar to that observed in previous years [3]. As in 2010, two of the main reporting countries (Italy and Spain) had a high proportion of cases reported with unknown outcome.
L. pneumophila serogroup 1 remained the most commonly identified pathogen causing LD. In 2011, 22% of environmental investigations were reported with unknown results. It is surprising since this was well documented in previous years with less than 4% of unknown results in 2009 and 2010 [3,11]. As in previous years, only a limited number of strains could be subtyped. Finally, a very limited number of isolates could be matched with environmental samples, underlining the difficulty to definitively link cases to environmental findings.
In 2011, like LD in general, the number of reported TALD cases was the lowest since 2004. It was 12% lower than 2010 and 20% lower than 2007, when the network notified 947 TALD cases, the highest count since the network started to collect data in 1987. Like LD in general, TALD data also show a large variation in notification rates across the EU/EEA, with over 80% of cases being reported by five countries and no cases reported by a considerable number of other countries, making under-diagnosis and underreporting - a likely explanation, but further investigation is needed. As in previous years, 45% of new standard clusters could have been detected through ELDSNet. The data also indicate that in almost two thirds of accommodation sites investigated Legionella was detected in the water systems. Furthermore, in all but seven clusters control measures were implemented. This demonstrates the added value of ELDSNet as an important contributor in protecting the health of citizens in the EU/EEA and other collaborating countries.

SURVEILLANCE REPORT Legionnaires’ disease in Europe, 2011
33
5. Conclusion Although under-reporting remains an issue in most EU/EEA countries, LD still remains an important cause of both morbidity and mortality. The decrease observed in 2011 in Western Europe may have been linked to specific environmental conditions unfavourable to the growth of Legionella spp. The collection of geographical information at a sub-national level could validate such hypotheses in the future. Nevertheless, in most eastern and south-eastern countries, under-ascertainment remains a considerable problem which may need to be targeted more specifically, taking into account each country’s needs and resources. For example, in countries with notification rates below one per million inhabitants, cross-sectional prevalence studies at major university hospitals could raise awareness of the disease among local clinicians.
Despite all these challenges, ELDSNet has proven its effectiveness with the daily surveillance of TALD and early detection and follow-up of clusters. In addition, this network’s activities have helped to create one of the largest LD databases worldwide. Given its public health implications, it would probably be useful to evaluate the validity of the current cluster definition.
Legionnaires’ disease in Europe, 2011 SURVEILLANCE REPORT
34
References 1. Fields BS, Benson RF, Besser RE. Legionella and Legionnaires’ disease: 25 years of investigation. Clin. Microbiol. Rev.
2002 Jul;15(3):506–26.
2. Marston BJ, Lipman HB, Breiman RF. Surveillance for Legionnaires’ disease. Risk factors for morbidity and mortality. Arch. Intern. Med. 1994 Nov 14;154(21):2417–22.
3. European Centre for Disease Prevention and Control. Legionnaires’ disease surveillance in Europe, 2010 [Internet]. Stockholm: ECDC; 2012. Available from: http://www.ecdc.europa.eu/en/publications/Publications/SUR-Legionnaires-disease-surveillance-2010.pdf
4. Karagiannis I, Brandsema P, van der Sande M. Warm, wet weather associated with increased Legionnaires’ disease incidence in The Netherlands. Epidemiol. Infect. 2009 Feb;137(2):181–7.
5. Hicks LA, Rose CE Jr, Fields BS, Drees ML, Engel JP, Jenkins PR, et al. Increased rainfall is associated with increased risk for legionellosis. Epidemiol. Infect. 2007 Jul;135(5):811–7.
6. Ricketts KD, Charlett A, Gelb D, Lane C, Lee JV, Joseph CA. Weather patterns and Legionnaires’ disease: a meteorological study. Epidemiol. Infect. 2009 Jul;137(7):1003–12.
7. Van Hest NA, Hoebe CJ, Den Boer JW, Vermunt JK, Ijzerman EP, Boersma WG, et al. Incidence and completeness of notification of Legionnaires’ disease in The Netherlands: covariate capture-recapture analysis acknowledging regional differences. Epidemiol. Infect. 2008 Apr;136(4):540–50.
8. Rota MC, Cawthorne A, Bella A, Caporali MG, Filia A, D’Ancona F. Capture-recapture estimation of underreporting of legionellosis cases to the National Legionellosis Register: Italy 2002. Epidemiol. Infect. 2007 Aug;135(6):1030–6.
9. Nardone A, Decludt B, Jarraud S, Etienne J, Hubert B, Infuso A, et al. Repeat capture-recapture studies as part of the evaluation of the surveillance of Legionnaires’ disease in France. Epidemiol. Infect. 2003 Aug;131(1):647–54.
10. Beauté J, Zucs P, de Jong B. Risk for Travel-associated Legionnaires’ Disease, Europe, 2009. Emerging Infect. Dis. 2012 Nov;18(11):1811–6.
11. European Centre for Disease Prevention and Control. Legionnaires’ disease surveillance in Europe, 2009 [Internet]. Stockholm: ECDC; 2011. Available from: http://ecdc.europa.eu/en/publications/Publications/1109_SR_Legionnaires%27%20disease_Europe_2009.pdf
12. Commission Decision of 28 April 2008 amending Decision 2002/253/EC laying down case definitions for reporting communicable diseases to the Community network under Decision No 2119/98/EC of the European Parliament and of the Council. [Internet]. [cited 2011 Dec 6]. Available from: http://eurlex.europa.eu/LexUriServ/LexUriServ.do?uri=OJ:L:2008:159:0046:01:EN:HTML
13. Rota M, Scaturro M, Fontana S, Foroni M, Boschetto G, Trentin L, et al. Cluster of travel-associated Legionnaires disease in Lazise, Italy, July to August 2011. Euro Surveill. [Internet]. 2011 [cited 2012 Mar 16];16(40). Available from: http://www.ncbi.nlm.nih.gov/pubmed/21996379
14. Maini R, Naik F, Harrison T, Mentasti M, Spala G, Velonakis E, et al. Travel-associated Legionnaires disease in residents from England and Wales travelling to Corfu, Greece, August to October 2011. Euro Surveill. [Internet]. 2012 [cited 2012 Oct 1];17(32). Available from: http://www.ncbi.nlm.nih.gov/pubmed/22913938
15. Helbig JH, Bernander S, Castellani Pastoris M, Etienne J, Gaia V, Lauwers S, et al. Pan-European study on culture-proven Legionnaires’ disease: distribution of Legionella pneumophila serogroups and monoclonal subgroups. Eur. J. Clin. Microbiol. Infect. Dis. 2002 Oct;21(10):710–6.
16. Brodhun B, Buchholz U. [Epidemiology of Legionnaires’ disease in Germany]. Bundesgesundheitsblatt Gesundheitsforschung Gesundheitsschutz. 2011 Jun;54(6):680–7.
17. Rozentale B, Bormane A, Perevosčikovs J, Lucenko I, Brila A. Increase of cases of legionellosis in Latvia, 2011. Euro Surveill. [Internet]. 2011 [cited 2012 May 28];16(45). Available from: http://www.ncbi.nlm.nih.gov/pubmed/22114976


