25
2.011 Geostrophic Currents Prof. A. Techet April 25, 2006

2.011 Geostrophic Currents
Prof. A. TechetApril 25, 2006

Geostrophic Balance (Horizontal)
• Region: the mid-ocean, below surface layer and above bottom Ekman layers
• The horizontal pressure gradients almost exactly equal the Coriolis force resulting from the horizontal currents.
• This balance holds over distances greater than tens of meters and on time scales longer than several days and is goodwithin a few parts per thousand.

Hydrostatic Balance (Vertical)
• Vertical pressure gradient is directly related to the weight of the water (gravity) within a few parts per million!
• For a non-moving ocean in static equilibrium, pressure is related to gravity and density as:

Geostrophic Equations
• Assuming Steady flow (d/dt = 0) • Friction is negligible • Gravity is only external force • Vertical velocities are negligible (w << u, v)• Then the NSEs reduce to
where

Geostrophic Equations
• These equations can be rewritten as follows:
Velocities:
Pressure p(z):
Note: ζ can vary in x and y so pressure is a fcn of x,y, and z!
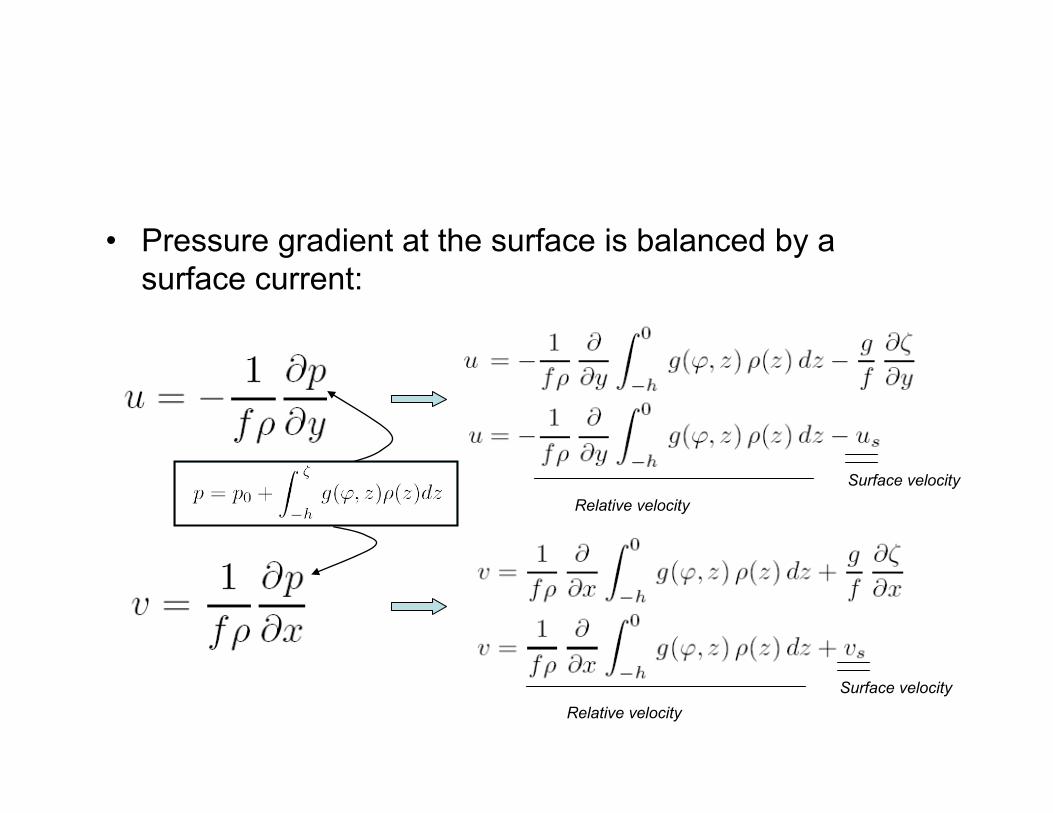
• Pressure gradient at the surface is balanced by a surface current:
Surface velocity
Surface velocity Relative velocity
Relative velocity
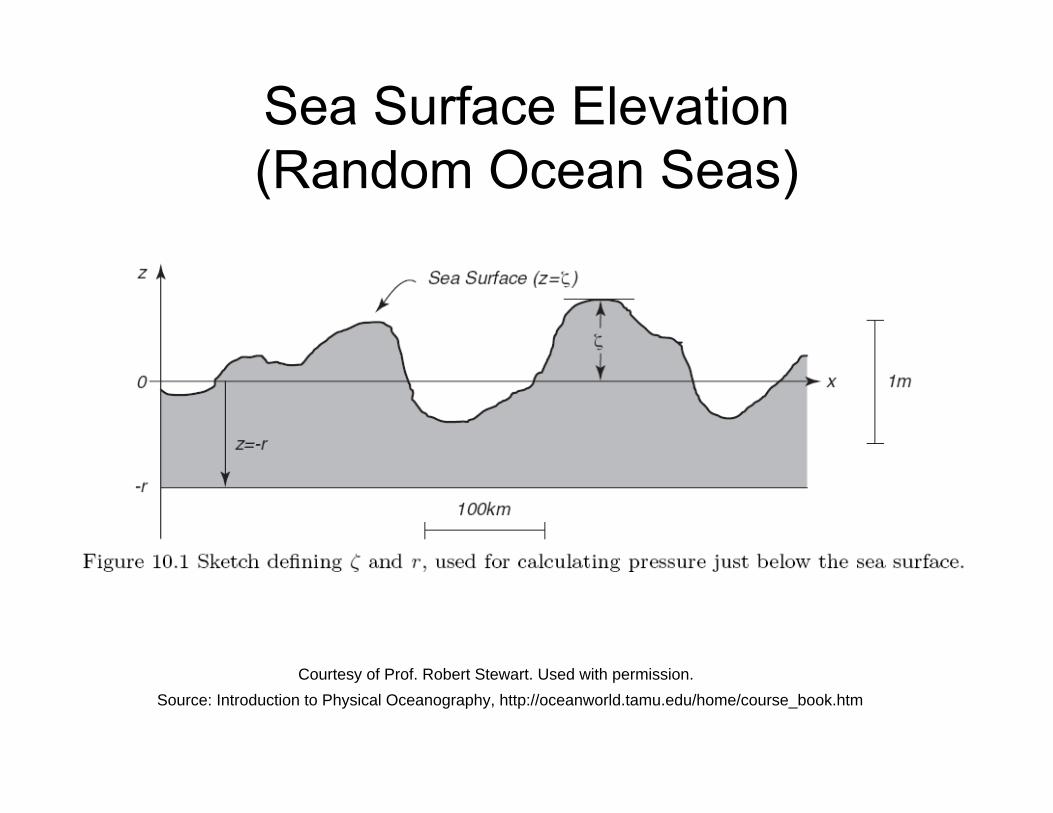
Sea Surface Elevation (Random Ocean Seas)
Courtesy of Prof. Robert Stewart. Used with permission. Source: Introduction to Physical Oceanography, http://oceanworld.tamu.edu/home/course_book.htm

Surface Geostrophic Current
• Surface current is related to surface elevation:
• From satellite data we can get the surface currents from the surface topology

Satellite Measurement of Currents • The height of the sea surface, ζ, is the height of the sea
surface relative to a particular level surface coincidentwith the ocean at rest. (This surface is the Geoid)
• Since we can measure the surface topography fromsatellites we can thus calculate the slope of the surfaceand in turn the surface geostrophic currents.
• Typical slopes are ∂ζ/∂x ≈ 1–10 microradians for v = 0.1–1.0 m/s at mid latitudes.
Courtesy of Prof. Robert Stewart. Used with permission.Source: Introduction to Physical Oceanography, http://oceanworld.tamu.edu/home/course_book.htm

Satellite Altimetry
• The first systems, carried on Seasat, Geosat, ers–1, and ers–2 were designed to measure week-to-weekvariability of currents.
• Topex/Poseidon, launched in 1992, was the first satellite designed to make the much more accuratemeasurements necessary for observing the permanent(time-averaged) surface circulation of the oceans, tides,and the variability of gyre-scale currents. (replaced by Jason in 2001, retired completely in early 2006)
• The geoid was not well known locally before about 2004 so altimeters were usually flown in orbits that have anexactly repeating ground track.
• Topex/Poseidon and Jason fly over the same ground track every 9.9156 days.
What can we measure with Satellites?
• By subtracting sea-surface height from one traverse of the ground track from height measured on a later traverse, changes in topography can be observed without knowing the geoid.
• The geoid is constant in time, and the subtraction removes the geoid, revealing changes due to changing currents, such as mesoscale eddies, assuming tides have been removed from the data
• The great accuracy and precision of the Topex/Poseidon and Jason altimeter systems allow them to measure the oceanic topography over ocean basins with an accuracy of ±5 cm. This allows them to measure:
– Changes in the mean volume of the ocean – Seasonal heating and cooling of the ocean – Tides – The permanent surface geostrophic current system – Changes in surface geostrophic currents on all scales – Variations in topography of equatorial current systems such as those associated
with El Nino

Courtesy of Prof. Robert Stewart. Used with permission.Source: Introduction to Physical Oceanography, http://oceanworld.tamu.edu/home/course_book.htm

Courtesy of Prof. Robert Stewart. Used with permission.
Source: Introduction to Physical Oceanography, http://oceanworld.tamu.edu/home/course_book.htm

Geopotentials
• Geoid is a level surface and considered a surface of constant potential
• Consider the work done in moving a mass m by a distance
hh perpendicular to a levelsurface.
• The work required is W = mgh, gand the change of potentialenergy per unit mass is gh.
• Thus level surfaces are surfaces of constant geopotential, wherethe geopotential is Work = mgh
M
M
M
M
M
Φ = gh

Find Geostropic Currents1. Calculate the slope of a constant pressure surface
relative to a surface of constant geopotential. 2. Calculate the change in pressure on a surface of
constant geopotential. Such a surface is called a geopotential surface.
Courtesy of Prof. Robert Stewart. Used with permission.Source: Introduction to Physical Oceanography, http://oceanworld.tamu.edu/home/course_book.htm

Calculate the slope
• Oceanographers usually calculate the slope of constant-pressure surfaces.
• The important steps are: – Calculate differences in geopotential (Φ A − Φ B) between two constant
pressure surfaces (P1, P2) at hydrographic stations A and B. This is similar to the calculation of ζ of the surface layer.
– Calculate the slope of the upper pressure surface relative to the lower.
– Calculate the geostrophic current at the upper surface relative to the current at the lower. This is the current shear.
– Integrate the current shear from some depth where currents are known to obtain currents as a function of depth. For example, from the surface downward, using surface geostrophic currents observed by satellite altimetry, or upward from an assumed level of no motion.
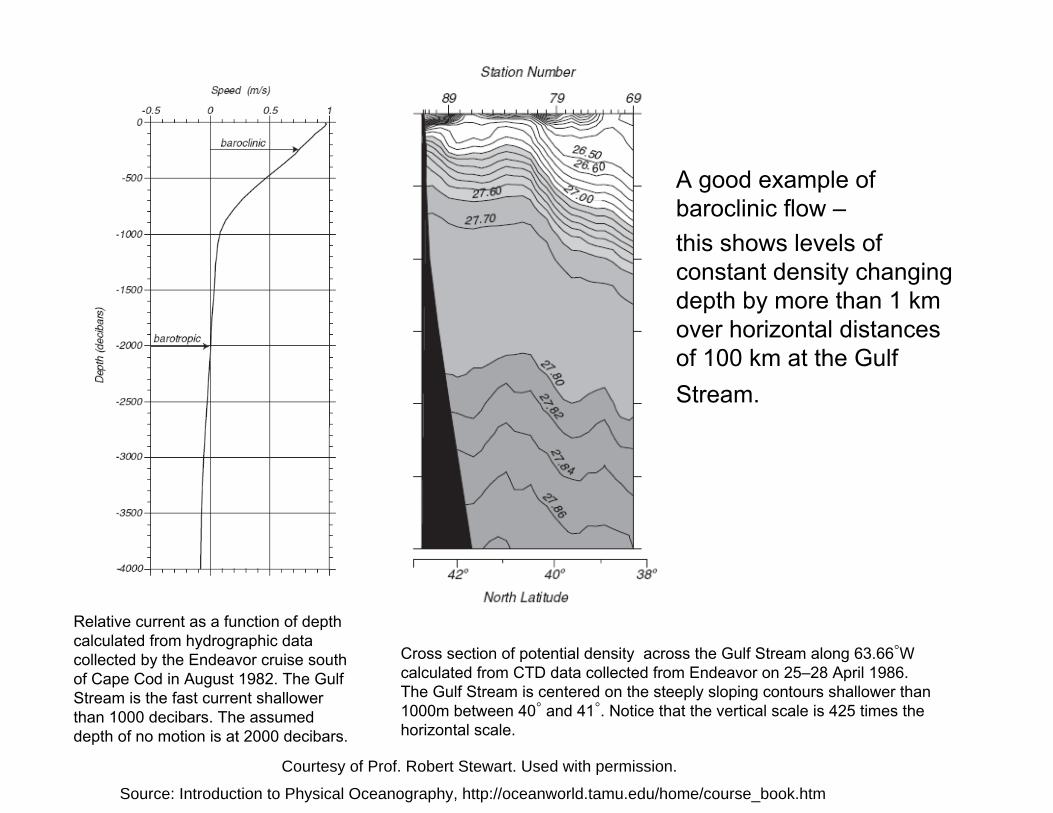
Baroclinic vs. Barotropic Flows
• Barotropic flow occurs when levels of constant pressurein the ocean are always parallel to the surfaces ofconstant density. – Note, some authors call the vertically averaged flow the
barotropic component of the flow. – It has been noted that Barotropic is used in so many different
ways that the term is meaningless and should not be used.
• Baroclinic flow occurs when levels of constant pressureare inclined to surfaces of constant density. In this case,density varies with depth and horizontal position. – Baroclinic flow varies with depth, and the relative current can be
calculated from hydrographic data. – Note, constant-density surfaces cannot be inclined to constant-
pressure surfaces for a fluid at rest.
•
•
A good example of baroclinic flow – this shows levels of constant density changing depth by more than 1 km over horizontal distances of 100 km at the Gulf Stream.
Relative current as a function of depth calculated from hydrographic data collected by the Endeavor cruise south Cross section of potential density across the Gulf Stream along 63.66◦W of Cape Cod in August 1982. The Gulf calculated from CTD data collected from Endeavor on 25–28 April 1986. Stream is the fast current shallower The Gulf Stream is centered on the steeply sloping contours shallower than than 1000 decibars. The assumed 1000m between 40◦ and 41◦. Notice that the vertical scale is 425 times the depth of no motion is at 2000 decibars. horizontal scale.
Courtesy of Prof. Robert Stewart. Used with permission.
Source: Introduction to Physical Oceanography, http://oceanworld.tamu.edu/home/course_book.htm

Disadvantage of Calculating Currents from Hydrographic Data
• Currents calculated from hydrographic data have been used to make maps of ocean currents since the early20th century. Nevertheless, it is important to review thelimitations of the technique. 1. Hydrographic data can be used to calculate only the current
relative to a current at another level. 2. The assumption of a level of no motion may be suitable in the
deep ocean, but it is usually not a useful assumption when the water is shallow such as over the continental shelf.
3. Geostrophic currents cannot be calculated from hydrographic stations that are close together. Stations must be tens of kilometers apart.

Limitations of the GeostrophicEquations
• The geostrophic balance is not perfect. • If it were, the flow in the ocean would never change because the
balance ignores any acceleration of the flow. • Important limitations of the geostrophic assumption are:
1. Geostrophic currents cannot evolve with time because the balance ignores acceleration of the flow. Acceleration dominates if the horizontal dimensions are less than roughly 50 km and times are less than a few days. Acceleration is negligible, but not zero, over longer times and distances.
2. The geostrophic balance does not apply within about 2◦ of the equator where the Coriolis force goes to zero because sinϕ → 0.
3. The geostrophic balance ignores the influence of friction.
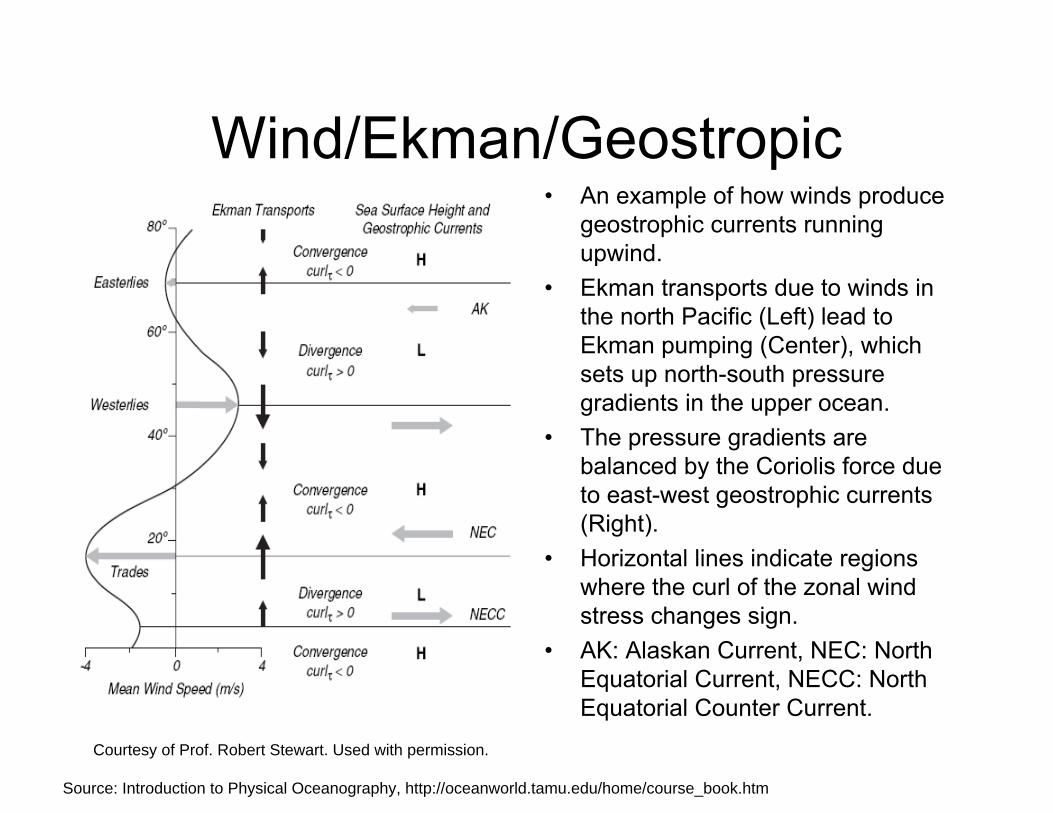
Wind/Ekman/Geostropic• An example of how winds produce
geostrophic currents running upwind.
• Ekman transports due to winds in the north Pacific (Left) lead to Ekman pumping (Center), which sets up north-south pressure gradients in the upper ocean.
• The pressure gradients are balanced by the Coriolis force due to east-west geostrophic currents (Right).
• Horizontal lines indicate regions where the curl of the zonal wind stress changes sign.
• AK: Alaskan Current, NEC: North Equatorial Current, NECC: North Equatorial Counter Current.
Courtesy of Prof. Robert Stewart. Used with permission.
Source: Introduction to Physical Oceanography, http://oceanworld.tamu.edu/home/course_book.htm

Lagrangian Measurements of Currents
• Lagrangian – Measurements in space and time following a specific particle of fluid
• Lagrangian techniques track the position of a drifter that follows a water parcel either on the surface or deeper within the water column.
• The mean velocity over some period is calculated from the distance between positions at the beginning and end of the period divided by the period.
• Errors are due to: – Errors in determining the position of the drifter. – The failure of the drifter to follow a parcel of water. We assume the
drifter stays in a parcel of water, but external forces acting on the driftercan cause it to drift relative to the water.
– Sampling errors. Drifters go only where drifters want to go. And drifters want to go to convergent zones. Hence drifters tend to avoid areas ofdivergent flow.

Satellite tracked drifters
• Satellite systems, especially System Argos, use radio signals transmitted from surface buoys to determine the position of the buoy.
• The satellite S receives a radio signal from the buoy B.
• The time rate of change of the signal, the Doppler shift F, is a function of buoy position and distance from the satellite’s track.
• The recorded Doppler signal is transmitted to ground stations E, which relays the information to processing centers A via control stations K.
Courtesy of Prof. Robert Stewart. Used with permission.
Source: Introduction to Physical Oceanography, http://oceanworld.tamu.edu/home/course_book.htm

Pop-Up Floats (ALACE)• Autonomous Lagrangian Circulation
Explorer (alace) floats are designed to cycle between the surface and some predetermined depth.
• The drifter spends ~10 days at depth, and periodically returns to the surface to report its position and other information using the Argos satellites
• The drifter thus combines the best aspects of surface and neutrally-buoyant floats.
• It is able to track deep currents, it is autonomous of acoustic tracking systems, and it can be tracked anywhere in the ocean by satellite.
• The maximum depth is near 2 km, and the drifter carries sufficient power to complete 70 cycles to 1,000 m or 50 cycles to 2,000 m.
Courtesy of Prof. Robert Stewart. Used with permission.
Source: Introduction to Physical Oceanography, http://oceanworld.tamu.edu/home/course_book.htm
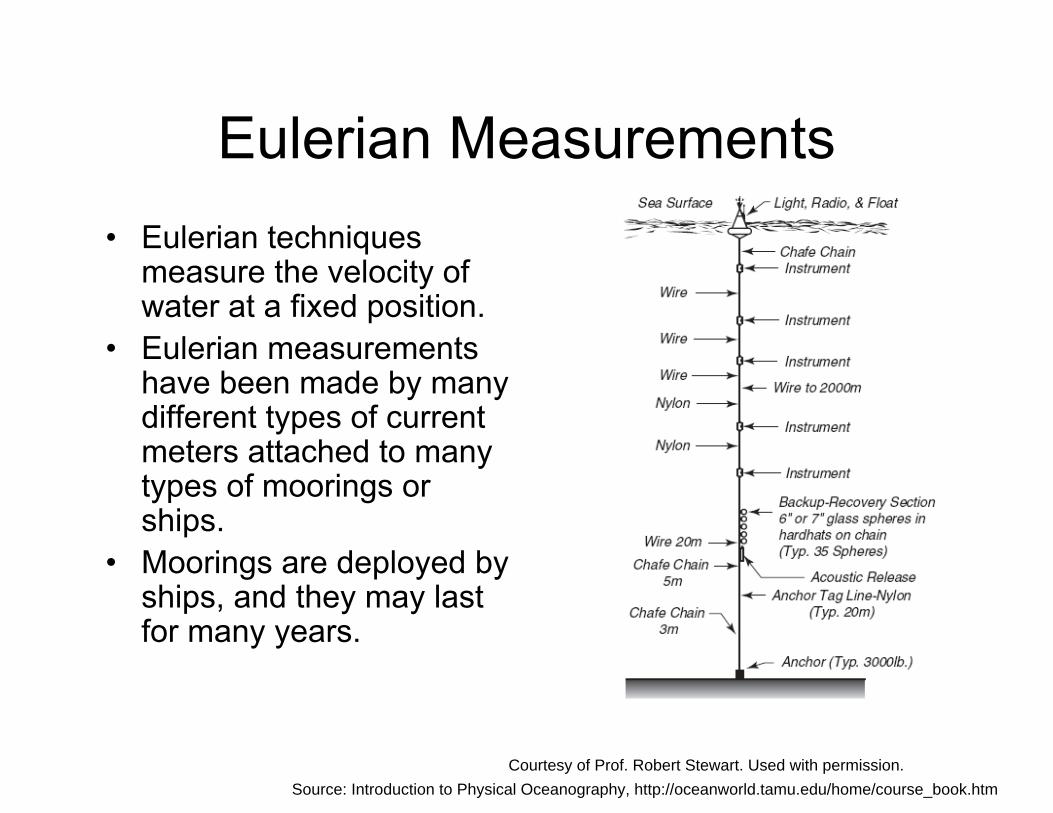
Eulerian Measurements
• Eulerian techniques measure the velocity ofwater at a fixed position.
• Eulerian measurements have been made by manydifferent types of currentmeters attached to manytypes of moorings orships.
• Moorings are deployed by ships, and they may lastfor many years.
Courtesy of Prof. Robert Stewart. Used with permission.Source: Introduction to Physical Oceanography, http://oceanworld.tamu.edu/home/course_book.htm


