216
LEAD COMMISSIONER DRAFT REPORT 2011 INTEGRATED ENERGY POLICY REPORT CALIFORNIA ENERGY COMMISSION DECEMBER 2011 CEC‐100‐2011‐001‐LCD Edmund G. Brown Jr., Governor

LEAD COMMISSIONER DRAFT REPORT
2011 INTEGRATED ENERGY POLICY REPORT
CALIFORNIA ENERGY COMMISSION DECEMBER 2011
CEC‐100‐2011‐001‐LCD Edmund G. Brown Jr., Governor

CALIFORNIA ENERGY COMMISSION
Robert B. Weisenmiller, Ph.D. Chairman James D. Boyd Vice Chair Karen Douglas, J.D. Carla Peterman Commissioners Robert P. Oglesby Executive Director Barbara Byron Jennifer Campagna Nicholas Fugate David Hungerford Mike Jaske Chris Kavalec Doug Kemmer Suzanne Korosec Kae Lewis Che McFarlin Garry O’Neill Jim Page Heather Raitt Cynthia Rogers Consuelo Sichon Gabriel D. Taylor David Vidaver Primary Authors Lynette Green Project Manager Donna Parrow Project Secretary Suzanne Korosec Program Manager

ACKNOWLEDGEMENTS
The California Energy Commission would like to acknowledge the contributions of the following Energy Commission staff in the preparation of the 2011 Integrated Energy Policy Report.
OFFICES OF THE COMMISSIONERS Eileen Allen Kevin Barker Catherine Cross
Marlena Elliot Cathy Graber Galen Lemei
Kathleen McDonnell Sarah Michael Tim Olson
EXECUTIVE OFFICE Susan Glick Gloria Guthrie
MEDIA OFFICE Susanne Garfield Carol Robinson Michael Wilson
DEPUTY DIRECTORS Panama Bartholomy Sylvia Bender
Terry O’Brien Pat Perez
Laurie ten Hope
STAFF CONTRIBUTORS Jim Adams Rizaldo Aldas Jennifer Allen Sarah Allred Al Alvarado Grace Anderson Aniss Bahreinian Beverly Bastian Avtar Bining Martha Brook Denny Brown Beth Chambers Darcie Chapman Kristy Chew Betty Chrisman Matt Coldwell Miki Crowell Ann Crisp Paula David Len Davisson Christopher Dennis Pamela Doughman Tovah Ealey Devi Eden Ryan Eggers David Flores Sandra Fromm Jesse Gage
Claire Laufenberg Gallardo Pedro Gomez Saul Gomez Angela Gould Lorraine Gonzalez Judy Grau Mike Gravely Karen Griffin Alicia Guerra Eli Harland Mark Hesters Candace Hill David Hungerford Mike Jaske Mike Kane Chris Kavalec Linda Kelly Joel Klein Eric Knight Andrea Koch Don Kondoleon Mark Kootstra Pramod Kulkarni Laura Lawson Eugenia Laychak Matt Layton Mike Leaon Kae Lewis
Rachel MacDonald Aleecia Macias Pierre Martinez John Mathias Alan Mattes Bob McBride Che McFarlin Michael McGuirt Kasiana McLenaghan Jim McKinney Ross Miller Katie Moore Marla Mueller Payam Narvand Sherrill Neidich Joy Nishida John Nuffer Michael Nyberg Joe O’Hagan Ean O’Neill Jim Page Jamie Patterson Bill Pennington Fernando Piña Ivin Rhyne Ken Rider Larry Rillera

STAFF CONTRIBUTORS (cont’d) Rachel Salazar Gordon Schremp Prab Sethi Margaret Sheridan David Siao Robin Smutny‐Jones Linda Spiegel Amanda Stennick Brian Stevens Peter Strait
Shaelyn Strattan Gene Strecker Sarah Taheri Angela Tanghetti Ruben Tavares Gabe Taylor Marylou Taylor Chris Tooker Ysbrand van der Werf Eric Veerkamp
Casey Weaver Gail Wiggett Malachi Weng‐Gutierrez Lisa Worrall Jenny Wu Rick York Gary Yowell Zhiqin Zhang Gerald Zipay Kate Zocchetti

i
PREFACE
Senate Bill 1389 (Bowen, Chapter 568, Statutes of 2002) requires the California Energy Commission to prepare a biennial integrated energy policy report that contains an assessment of major energy trends and issues facing the state’s electricity, natural gas, and transportation fuel sectors and provides policy recommendations to conserve resources; protect the environment; ensure reliable, secure, and diverse energy supplies; enhance the state’s economy; and protect public health and safety (Public Resources Code § 25301[a]). The Energy Commission prepares these assessments and associated policy recommendations every two years as part of the Integrated Energy Policy Report. Preparation of the Integrated Energy Policy Report involves close collaboration with federal, state, and local agencies and a wide variety of stakeholders in an extensive public process to identify critical energy issues and develop strategies to address those issues.

ii
iii
ABSTRACT
The 2011 Integrated Energy Policy Report provides a summary of priority energy issues currently facing California. The report provides strategies and recommendations to further the state’s goal of ensuring reliable, affordable, and environmentally responsible energy sources for its citizens. Energy topics covered in the report include progress toward statewide renewable energy targets and issues facing future renewable development; efforts to increase energy efficiency in existing and new buildings; progress by utilities in achieving energy efficiency targets and potential; improving coordination among the state’s energy agencies and streamlining power plant licensing processes; results of preliminary forecasts of electricity, natural gas, and transportation fuel supply and demand; future energy infrastructure needs; the need for research and development efforts to support statewide energy policies; and issues facing California’s nuclear power plants.
Keywords: California Energy Commission, clean energy, combined heat and power, renewable, California Clean Energy Future, Clean Energy Jobs Plan, Bioenergy Action Plan, electricity demand, natural gas assessment, transportation forecast, Public Interest Energy Research Program
Please use the following citation for this report:
California Energy Commission, 2011. 2011 Integrated Energy Policy Report. Publication Number: CEC‐100‐2011‐001‐LCD.

iv

v
TABLE OF CONTENTS
Executive Summary ................................................................................................................................... 1
Introduction .............................................................................................................................................. 21
CHAPTER 1: Renewable Electricity Status and Issues ....................................................................... 28
CHAPTER 2: Achieving Cost‐Effective Energy Efficiency for California: Assembly Bill 2021 Progress Report .......................................................................................................................................................... 51
CHAPTER 3: Achieving Energy Savings in California Buildings ..................................................... 58
CHAPTER 4: California’s Clean Energy Future .................................................................................. 70
CHAPTER 5: Power Plant Licensing Lessons Learned ...................................................................... 79
CHAPTER 6: Energy Commission Natural Gas Assessment ............................................................ 85
CHAPTER 7: Electricity and Natural Gas Demand Forecast ............................................................ 99
CHAPTER 8: California’s Electricity Infrastructure .......................................................................... 112
CHAPTER 9: Transportation Energy Forecasts and Analysis ......................................................... 135
CHAPTER 10: Benefits from the Alternative and Renewable Fuel and Vehicle Technology Program ................................................................................................................................................... 152
CHAPTER 11: Bringing Energy Innovation to California Through the Public Interest Energy Research Program .................................................................................................................................. 165
CHAPTER 12: 2011 Bioenergy Action Plan ........................................................................................... 175
CHAPTER 13: Nuclear Issues and Status Report on Assembly Bill 1632 Report Recommendations .................................................................................................................................. 183
Acronyms ................................................................................................................................................ 204

vi
LIST OF FIGURES Figure 1: Renewable Generation for California and Renewables Portfolio Standard Goals ......... 30 Figure 2: DRECP Area ............................................................................................................................. 35 Figure 3: Henry Hub Daily Spot Market Natural Gas Prices ............................................................ 88 Figure 4: Henry Hub Annual Average Natural Gas Spot Market Prices ......................................... 90 Figure 5: Marginal Gas Supply Curves for National Cases ............................................................... 91 Figure 6: EIA Annual Energy Outlook 2011, Annual Average Henry Hub Spot Market Prices .. 93 Figure 7: Statewide Annual Electricity Consumption ...................................................................... 102 Figure 8: Statewide Annual Noncoincident Peak Demand ............................................................. 103 Figure 9: Statewide Employment Projections .................................................................................... 105 Figure 10: Statewide Peak Impacts of Self‐Generation ..................................................................... 107 Figure 11: Statewide Committed Consumption Efficiency and Conservation Impacts .............. 110 Figure 12: PEV Public Charging Infrastructure Deployment by California Region..................... 146 Figure 13: Annual Petroleum Displacement From PEVs (Gallons) ................................................ 157 Figure 14: Annual Petroleum Reductions Biofuel Production Projects (Gallons) ........................ 159 Figure 15: Annual Petroleum Displacement From Natural Gas Trucks (Gallons) ....................... 160 Figure 16: Integrated Classroom Lighting System ............................................................................ 168 Figure 17: Concentrating Photovoltaic System .................................................................................. 169
LIST OF TABLES
Table 1: In‐State Renewable Capacity and Generation (2010) ........................................................... 29 Table 2: Preliminary Targets for 8,000 Megawatts of New Renewable Capacity by 2020 ............. 31 Table 3: Proposed Regional DG Targets by 2020 ................................................................................. 32 Table 4: California’s Renewable Energy Potential .............................................................................. 33 Table 5: IOUs’ and Publicly Owned Utilities’ 2009 and 2010 Savings and Expenditures ............. 53 Table 6: Estimated Potentials for Publicly Owned Utilities (Excluding SMUD and LADWP) ..... 55 Table 7: PG&E High Demand Day Gas Requirements and Sources ................................................. 97 Table 8: Comparison Statewide Electricity Demand Forecast Comparison .................................. 101 Table 9: Statewide End‐User Natural Gas Forecast Comparison .................................................... 103 Table 10: Electricity Consumption From Self‐Generation (GWh) ................................................... 108 Table 11: Generation Project Development Timeline ....................................................................... 119 Table 12: Comparison of Forecasts of California ISO 2020 Peak Demand ..................................... 125 Table 13: OTC Capacity With Compliance Deadlines in or Before 2020 ........................................ 126 Table 14: Programs for Small CHP ...................................................................................................... 133 Table 15: Program Investments by Fuel Type .................................................................................... 153 Table 16: ARFVT Program Funding Impact on Alternative Fueling Stations and Alternative Vehicle Deployment in California ....................................................................................................... 154 Table 17: Annual Petroleum, GHG, and Criteria Emission Reductions by 2020 – Low Case ..... 163 Table 18: Annual Petroleum, GHG, and Criteria Emission Reductions by 2020 – High Case .... 163 Table 19: In‐State Biofuel Production (millions gge) ......................................................................... 179 Table 20: Biopower Generation Used to Meet California Load ....................................................... 181

1
EXECUTIVE SUMMARY
Energy remains a key component of California’s economy, the eighth largest in the world. To support the state’s economy, California government remains committed to developing strong policies and programs to promote investments in clean energy and energy efficiency that can be a key component of job growth and economic recovery. Past and current government policies and programs have made California a national leader in energy efficiency and the production of renewable energy and provided concrete benefits to the state’s citizens. California’s efficiency standards for homes and appliances have saved customers $56 billion in energy costs over the last 30 years and helped keep California’s per capita electricity consumption relatively constant while use in the rest of the United States has increased 40 percent. California is also the leading producer of renewable energy in the United States with nearly 16 percent of electricity supplies coming from renewable resources in 2010. Government policies and programs to support solar energy have also contributed to significant cost reductions for solar photovoltaic panels; according to the National Renewable Energy Laboratory, the per‐watt price for solar modules has dropped from $22 in 1980 to under $3 today.
Governor Jerry Brown’s Clean Energy Jobs Plan emphasizes the importance of investments in clean energy as a central element of rebuilding California’s economy. According to a recent Ernst & Young, LLP, analysis, in the first quarter of 2011 alone California received $637 million in venture capital investment for clean tech companies, representing 56 percent of national investments in the clean tech industry. These kinds of investments create jobs: a 2011 Brookings Institution report concluded that, nationally, four of the five fastest growing clean tech segments between 2003 and 2010 were in renewable energy and added about 50,000 jobs in the solar thermal, solar photovoltaic, wind power, biofuels, fuel cell production, and smart grid industries.
As California’s energy sector continues to grow in size and complexity, policy makers must strike a delicate balance between often competing priorities. To provide the foundation for California’s energy policy decisions, every two years the California Energy Commission prepares an integrated energy policy report, as directed by Senate Bill 1389 (Bowen, Chapter 568, Statutes of 2002). The report assesses major energy trends and issues in California’s electricity, natural gas, and transportation fuel sectors. This draft 2011 Integrated Energy Policy Report discusses issues facing the state’s energy sectors and provides recommendations to ensure reliable, affordable, and environmentally sound supplies of electricity, natural gas, and transportation fuels to meet the needs of the state’s economy and growing population.
Topics covered in this report include:
• The use of preferred resources like energy efficiency and renewable energy to meet statewide electricity needs.
• Coordination among state agencies to implement state energy policies.
• Efforts to streamline power plant permitting processes while protecting the environment.

2
• Assessments of electricity, natural gas, and transportation fuel demand, infrastructure needs, and market trends.
• Research and development needed to maintain California’s global leadership in the development of innovative energy technologies and strategies.
• Issues facing California’s nuclear power plants in the wake of events at Fukushima, Japan.
California’s Renewable Electricity Goals
California continues to be a leader in the development and use of renewable energy resources like wind, solar, geothermal, biomass, and small hydroelectric. The state currently has more than 9,000 megawatts of renewable generating capacity on‐line, with estimated technical potential of 18 million megawatts of additional resources. In 2010, renewable electricity represented nearly 16 percent of statewide retail sales, and signed and pending utility contracts for new renewable facilities could deliver enough energy to achieve California’s 33 percent by 2020 Renewables Portfolio Standard target.
Governor Jerry Brown’s Clean Energy Jobs Plan emphasizes the importance of investments in renewable energy as a central element of rebuilding California’s economy. According to a recent Ernst & Young, LLP, analysis, in the first quarter of 2011 California received $637 million in venture capital investment for in clean tech companies, representing 56 percent of national investments in the clean tech industry. These kinds of investments create jobs: a 2011 Brookings Institution report concluded that, nationally, four of the five fastest growing clean tech segments between 2003 and 2010 were in renewable energy and added about 50,000 jobs in the solar thermal, solar photovoltaic, wind power, biofuels, fuel cell production, and smart grid industries.
The Governor’s plan envisions adding 20,000 megawatts of new renewable generating capacity by 2020, including 8,000 megawatts of large‐scale renewable facilities as well as 12,000 megawatts of localized or distributed generation. Achieving these goals will require an intensive effort among energy agencies, utilities, industry, and environmental and ratepayer advocates to address challenges to future development.
Challenges identified in the Energy Commission’s 2011 report Renewable Power in California: Status and Issues include: environmental, land use, and permitting; transmission and distribution infrastructure requirements; integration of variable renewable resources while maintaining grid reliability and safety; investment and financing needs; cost issues; continuation of energy‐related research and development; coordination with local governments; environmental justice; and workforce development.
To address these challenges, the Energy Commission will work closely with other agencies and stakeholders to develop a renewable strategic plan in 2012. The goal is to identify specific strategies to overcome major challenges to developing renewable generating facilities and integrating those facilities into the state’s electricity system while maintaining the state’s commitment to providing reliable, affordable, and environmentally benign energy for
3
businesses and residents. Five high‐level strategies that will form the basis for the renewable strategic plan include: (1) prioritizing geographic areas for development; (2) evaluating costs and benefits of renewable projects; (3) minimizing interconnection costs and time; (4) promoting incentives for projects that create in‐state benefits; and (5) promoting and coordinating existing financing and incentive programs for critical stages in the renewable development continuum.
California’s Continuing Commitment to Energy Efficiency Energy Efficiency in New and Existing Buildings Energy efficiency remains California’s top priority for meeting new electricity needs and is a key strategy for increasing jobs and reducing greenhouse gas emissions from the electricity sector. California’s commitment to energy efficiency through programs and standards has resulted in the lowest per capita electricity use of any state in the nation, and the state’s building and appliance standards have saved consumers more than $56 billion in electricity and natural gas costs.
Governor Brown’s Clean Energy Jobs Plan calls for adopting a plan and timeline for achieving “zero net energy” homes and businesses, increasing the energy efficiency in existing structures built before the advent of building standards, adopting stronger appliance standards, increasing public education and enforcement, and providing energy performance information to commercial investors and home buyers prior to building purchases.
The Energy Commission, the California Public Utilities Commission (CPUC), and the California Air Resources Board (ARB) have adopted a goal of achieving zero net energy building standards by 2020 for residential buildings and 2030 for commercial buildings. A zero net energy building consumes only as much energy on an annual basis as can be generated with an on‐site renewable energy system. This goal is articulated in the joint agency California Clean Energy Future, the ARB’s Climate Change Scoping Plan, and the CPUC’s Long‐Term Energy Efficiency Strategic Plan. To help achieve this goal, the Energy Commission regularly updates its building efficiency standards to reflect new technologies and strategies with the goal of achieving 20 to 30 percent energy savings in each triennial update. The Energy Commission also collaborates with the CPUC and utilities to provide incentives for builders to meet voluntary “reach standards” that are higher than the mandatory standards.
Appliance efficiency standards also contribute to energy savings in buildings. The Energy Commission estimates that in 2010 appliance efficiency standards saved 18,761 gigawatt hours of electricity, representing nearly 7 percent of California’s electric load, and saved California consumers about $2.6 billion (assuming an average rate of 14 cents per kilowatt/hour). The Energy Commission is working to identify appliance types that should be included in new standards, particularly electronics and other devices plugged into electrical outlets (“plug load”) that represent an increasing portion of California’s energy use. The Energy Commission is also developing standards for the estimated 58 million battery chargers sold each year in California. Once implemented, these standards will annually save state ratepayers an estimated $306 million and provide electricity savings of more than 2,000 gigawatt hours, enough to power 350,000 homes. They will also eliminate 1 million metric tons of carbon emissions.

4
More than half of California’s 13 million residential units and more than 40 percent of commercial buildings were built before implementation of the state’s Building Energy Efficiency Standards. These existing buildings provide a tremendous opportunity for low‐cost energy savings, reducing greenhouse gas emissions in the electricity and natural gas sectors, and creating jobs. Assembly Bill 758 (Skinner, Chapter 470, Statutes of 2009) directed the Energy Commission to develop, adopt, and implement an ongoing, comprehensive, statewide program to reduce energy consumption in existing buildings. Efforts by the Energy Commission, the CPUC, local governments, and utilities to coordinate residential and commercial building retrofit programs under the Energy Upgrade California™ brand are providing the foundation for the AB 758 program.
Next steps are to complete needs assessments for both residential and nonresidential buildings, identify what must be done in program component areas (including lessons learned from pilot programs), and develop action plans for moving forward with AB 758 program development. The Energy Commission will also work with the CPUC to emphasize joint efforts to achieve improved compliance with building and appliance standards to ensure that energy efficiency measures and equipment are properly installed and delivering savings. For appliance efficiency compliance, the Energy Commission will develop regulations to implement Senate Bill 454 (Pavley, Chapter 591, Statutes of 2011), which allows the Energy Commission to adopt an enforcement process for violations of appliance efficiency regulations and impose civil penalties of up to $2,500 for each violation. Development of this process is consistent with the direction in the Governor’s Clean Energy Jobs Plan to increase enforcement of efficiency standards.
Energy Efficiency Potential and Targets To further the state’s goal of achieving all cost‐effective energy efficiency, Assembly Bill 2021(Levine, Chapter 734, Statutes of 2006) requires the Energy Commission, in consultation with the CPUC, to develop statewide energy efficiency potential estimates and targets for California’s investor‐owned and publicly owned utilities and report on progress toward these targets in the Integrated Energy Policy Report. In August 2011, the Energy Commission staff released the Achieving Cost‐Effective Energy Efficiency for California 2011–2020 report, which summarizes utility progress and recommends how to improve publicly owned utility efficiency efforts.
The CPUC established specific energy savings goals for California’s investor‐owned utilities in 2008 which are updated in each three‐year energy efficiency program cycle. For 2010, investor‐owned utilities reported 4,607 gigawatt hours of annual energy savings and 837 megawatts of peak savings for 2010, which exceeded the CPUC 2010 savings goals of 2,276 gigawatt hours and 502 megawatts. Reported natural gas savings were 46 million therms, just short of the CPUC’s natural gas goals for 2010 of 48 million therms. These are self‐reported savings that have not yet been evaluated by third‐party evaluators.
Publicly owned utilities in 2010 achieved 74 percent of the 2010 energy savings target, spending $123 million on energy efficiency programs, a 15 percent decrease from 2009 and the first decline since 2006. Energy and peak savings also declined for the first time since 2006, with
5
publicly owned utilities providing 523 gigawatt hours of electric energy savings, a decrease of 19 percent from 2009, and 94 megawatts of peak savings, 20 percent less than in 2009. The decline is largely due to the completion of a large lighting program at Los Angeles Department of Water and Power. Moreover, despite difficult economic conditions in 2010, mid‐sized and small utilities performed reasonably well in both efficiency spending and savings.
The Achieving Cost‐Effective Energy Efficiency for California 2011–2020 report estimates 9,525 gigawatt hours of economic savings potential (the percentage of technical potential that is cost‐effective) for the publicly owned utilities for 2011‐2020, which is 136 percent higher than the economic potential estimate from 2007 for the decade 2007‐2016. However, this target does not represent the largest publicly owned utility contributors to California’s utility energy savings because a revised potential study was not provided by the Sacramento Municipal Utility District, and neither revised savings potential nor targets were provided by the Los Angeles Department of Water and Power. Together, these two publicly owned utilities represented about 58 percent of net annual savings from all publicly owned utilities in 2010.
While the forecasts of several individual utilities meet the AB 2021 goal of 10 percent savings over 10 years goal, the combined publicly owned utility targets reach only 6.8 percent savings from forecasted 2020 base energy use. For most utilities, market savings potentials were calculated using a 50 percent customer measure incentive level. Additional modeling indicated that when a 75 percent incentive level is used, nearly all utilities meet the 10 percent consumption reduction goal contained in AB 2021. This indicates that the POUs can meet the consumption reduction goal but may require a higher level of program effort and budget than they factored into their targets.
Improved Coordination Among California’s Energy Agencies
Recognizing the growing interdependencies among the state’s energy and environmental agencies, in 2010 the Energy Commission, the ARB, the California Environmental Protection Agency (Cal/EPA), the CPUC, and the California Independent System Operator (California ISO) developed a vision, implementation plan, and roadmap to achieve a clean energy future for California. The California’s Clean Energy Future: Overview, released in September 2010, focuses on 2020, with consideration of the state’s goal to reduce greenhouse gas emissions to 80 percent below 1990 levels by 2050. The agencies plan to update the document to reflect significant developments since its release, including the passage of legislation to enact the 33 percent Renewables Portfolio Standard and Governor Brown’s leadership in energy policy.
The Overview focuses on four elements for achieving the state’s 2020 electricity and natural gas goals, which include reducing peak energy demand through efficiency, demand response, and installation of distributed generation; increasing the amount of renewable energy in the state’s portfolio by achieving the 33 percent by 2020 Renewables Portfolio Standard; ensuring that sufficient transmission and distribution infrastructure will be available to meet renewable goals and greenhouse gas emission reduction targets; and using supporting processes, including cap and trade, to provide opportunities for lower‐cost greenhouse gas emission reductions and advancements in emerging technologies.

6
As part of the California’s Clean Energy Future process, agencies are jointly preparing publicly available “metrics” to show progress toward meeting the policies identified in the Overview. Draft metrics were presented at a workshop in July 2011 for the following areas: greenhouse gas emissions; energy efficiency savings for investor‐owned and publicly owned utilities; demand response levels; renewable electricity generation; installed capacity for all electricity generating resources in California; potential for additional combined heat and power facilities; energy storage additions; transmission expansion; and electric vehicles. Based on input from the workshop and written comments, the agencies plan to add metrics on jobs; private investment from new transmission and renewable projects; reliance on coal; resource flexibility to provide reliability; and the 12,000 megawatt goal for localized renewable generation. Metrics and other data references will be posted on the California Clean Energy Future website and periodically updated to reflect new information.
California’s Licensing Process for Thermal Power Plants
Since 1996, the Energy Commission has licensed 16,635 megawatts of electricity generating capacity that is currently operating and delivering energy to California customers. In 2010, the Energy Commission licensed more than 4,000 megawatts of solar thermal projects and more than 3,000 megawatts of natural gas plants that are in the pre‐construction and construction phases. Many of the solar thermal plants were pursuing American Recovery and Reinvestment Act funding which required projects to meet specific deadlines, requiring the Energy Commission’s permitting process to be completed in an expedited timeframe, and coordinated with the Bureau of Land Management for projects on federal land.
In December 2010, the Energy Commission initiated an Order Instituting Informational Proceeding on lessons learned during the licensing of both the American Recovery and Reinvestment Act solar projects and the natural gas‐fired power plants reviewed during 2009 and 2010. Following the initial scoping workshop, Energy Commission staff began analyzing the permitting process to identify challenges to effective environmental review and facility licensing. The intent is to develop proposed changes to eliminate these challenges and streamline the permitting process without compromising transparency and effective participation. This effort includes comparison of Energy Commission environmental documents with those of other state and local jurisdictions to identify effective strategies in drafting environmental analyses. In addition, staff is reviewing the information and data gathering process to ensure that changes balance the need for information with the ability to draft the staff assessment in a timely manner. Efforts are also underway to improve the docketing process and implement an e‐filing process, which should increase the ease of submitting documents and reduce transaction costs for applicants.
During 2012, the Energy Commission’s lessons learned proceeding will provide white papers and public workshops on a variety of issues that will be used to develop recommendations for Energy Commission consideration. Depending on the nature of the recommendations, the Energy Commission may adopt an Order Instituting Rulemaking proceeding for updating and augmenting the rules and regulations that guide and define the Energy Commission power plant licensing process.
7
The Energy Commission is also working closely with federal, state, and local agencies to speed permitting and improve environmental outcomes through the Desert Renewable Energy Conservation Plan and the Bureau of Land Management’s Draft Solar Programmatic Environmental Impact Statement. The Desert Renewable Energy Conservation Plan planning effort covers about 22 million acres of federal and non federal land in the Mojave and Colorado Deserts of Southern California. The effort brings together a large and diverse stakeholder group to develop conservation strategies that identify and map areas for renewable energy project development and areas for long‐term natural resource conservation. The Draft Solar Programmatic Environmental Impact Statement is intended to establish a solid foundation for long‐term planning for solar energy development on public lands in California and five other western states. This effort will promote better, smarter licensing of utility‐scale solar projects while avoiding or minimizing conflicts with wildlife, cultural, and historical resources.
California’s Natural Gas Assessment
Natural gas is a significant contributor to California’s energy supply. The electricity sector uses about half of all natural gas in the state, and natural gas‐fired power plants will play an important role in supporting renewable integration. In the long term, natural gas‐fired plants will be used in combination with energy efficiency and renewable power plants to replace baseload generation from retiring coal‐fired and possibly nuclear power plants. In the transportation sector, natural gas is used as a transportation fuel and to make additives for cleaner‐burning gasoline. Natural gas also continues to be a major energy supply source for residential, commercial, and industrial end uses such as cooking, space heating, and fueling boilers and process heaters.
Natural Gas Prices and Market Trends Because of the importance of natural gas in California’s energy supply, policy makers need to be aware of future natural gas price and market trends. For example, the California policy to ʺimplement all cost‐effective energy efficiencyʺ requires a cost‐effectiveness analysis of potential energy efficiency measures and programs. Because of the complexities and uncertainties associated with natural gas markets, it is neither feasible nor particularly useful to make single‐point forecasts of future gas prices and other market activities. However, information about expected future gas prices and other effects of gas extraction, transportation, and use is needed for analysis and decision‐making.
Natural gas is a heavily traded commodity in a market characterized by inherent volatility. Over the last decade, daily spot market prices for natural gas traded at Louisiana’s benchmark Henry Hub have spiked several times. The winter periods of 2000‐2001 and 2003‐2004 saw prices spike to $10.00 per million British thermal units (MMBTU) and $18.00/MMBTU, respectively. In September 2005, hurricanes Katrina and Rita caused natural gas production wells in the Gulf Coast to be shut down, which lowered available supply and caused prices to spike to over $15.00/MMBTU. However, since late 2008, daily spot market prices have trended lower (in the $4.50 to $5.00 range) and only once did prices increase above $6.00 (in 2009). These lower trends were due in part to the economic recession and reduced overall demand for natural gas, and in part due to large amounts of shale gas becoming technically and

8
economically recoverable at relatively low costs. Over the period from April 2010 to April 2011, Henry Hub daily spot prices averaged $4.15/MMBTU.
The Energy Commission staff draft 2011 Natural Gas Market Assessment: Outlook explores how a plausible range of assumptions about underlying United States natural gas supply and demand conditions might affect the long‐term annual average market price of natural gas. Staff analyzed four cases: (1) a business‐as‐usual reference case; (2) a high gas price case that assumes higher demand and more constrained, higher cost resources; (3) a low gas price case that assumes lower gas demand and less constrained, lower cost gas resources; and (4) a constrained shale gas case that assumes higher gas operation and maintenance costs to ensure that development is environmentally acceptable.
The Henry Hub annual average spot price in the high gas price case reaches $6.00/MMBTU by 2018 (12 years before the reference case hits that mark) and somewhat levels off below $6.80/MMBTU (in 2010 dollars) by 2030. The case projects that shale will be the marginal source of natural gas for the next 10 years and beyond. The higher environmental compliance costs assumed in the constrained shale gas case puts the resulting prices in between the reference and high gas cost cases, as expected. The low gas price case Henry Hub prices hover around $5.00/MMBTU through 2024, increasing to about $5.30/MMBTU afterward (in 2010 dollars).
Participants in the 2011 IEPR proceeding cautioned that staff’s range of future annual average Henry Hub spot market prices might be too narrow. Cases from other natural gas market assessments do show a wider range of possible future gas prices than those of the Energy Commission. Ideally, the assumptions and methods used in these cases are transparent enough for staff to assess their plausibility and compare them to the Energy Commission cases, and, as a result, draw useful insights. For example, cases developed in the U.S. Energy Information Administration’s Annual Energy Outlook 2011 (AEO 2011) may present a more useful picture of the potential range in annual average prices (between $5.00 and $8.50 in 2010 dollars). However, the process for developing these cases affects how they are interpreted and compared to others; four outlying AEO 2011 cases are less likely than other cases because they were constructed by moving away from the currently “expected” value for those assumptions.
Considering the possibility and consequences of both high and low price outcomes helps guard against one‐sided biases. Decisions based on assumptions of low future gas prices could have negative consequences if gas prices turn out to be high, and vice versa. Users of natural gas price estimates must choose, based on their level of risk tolerance, the most prudent gas price estimate for their purpose. This results in a more robust decision with a better chance of performing acceptably over a wide range of possible futures. The Energy Commission’s natural gas market assessment provides important information that informs these purpose‐specific decision analyses.
Potential Impacts of San Bruno Incident On September 9, 2010, a high‐pressure natural gas transmission pipeline owned by Pacific Gas and Electric Company (PG&E) exploded under a neighborhood street in San Bruno, California, killing eight people and destroying 37 homes. The CPUC and the National Transportation

9
Safety Board (NTSB) both launched investigations into the explosion, and the Energy Commission transferred unspent Public Interest Energy Research Program funds to the CPUC for safety research. The CPUC initially ordered pressure reductions and subsequently ordered PG&E to reduce operating pressures on lines of similar vintage and characteristics to the failed segment. In June 2011, the CPUC directed PG&E, Southern California Gas, San Diego Gas & Electric, and Southwest Gas to pressure test or replace all pipelines, which is expected to take several years. Until this is complete, pressure levels may be reduced to 20 percent below maximum allowable operating pressure.
The Energy Commission has closely monitored the testing schedule and operating pressures for any impacts on service to natural gas consumers, including the natural gas‐fired power plants that California relies on for about 42 percent of its electricity. Pressure reductions could result in less natural gas being delivered, which in a high‐demand period could result in curtailments to gas service. Pressure reductions also reduce operating flexibility, which may require customers to more closely match their deliveries of gas into the PG&E system with their daily usage. Also, hydrostatic testing means taking a pipeline segment out of service for several days, and, if testing causes the pipeline to fail, the line remains out of service while it is replaced.
PG&E has reported no curtailments to customers as a result of reducing the operating pressure. As a result of tighter balancing tolerances, some generators have asked the California ISO if they will be reimbursed for costs, but the Energy Commission has detected no impact on gas market prices paid by Californians as a result of the tighter balancing. PG&E has had two segments fail hydrostatic testing, but in each case, as long as testing occurs outside high‐demand periods, PG&E should have the ability to reroute natural gas to continue service to customers, including gas‐fired generating plants. The Energy Commission is working with its sister agencies to provide information and contingency planning support to address any potential outages during the testing.
Energy Commission staff also analyzed the effect of flow reductions due to lower operating pressures on what is known as the “backbone” portion of PG&E’s gas transmission system. The key conclusion is that curtailments should be avoided, even if less gas is able to flow over backbone capacity, with more reliance on gas from underground storage. This underscores the importance of filling not only PG&E storage but also independent storage to make up for the constrained backbone capacity on days when colder than average conditions occur.
PG&E is requesting expedited review of proposed pipeline pressure restoration on key Bay Area lines before winter. A formal report on hydrotesting efforts and preliminary results was the subject of an evidentiary hearing on November 22; the CPUC is expected to make a decision by December 15, 2011.
California’s Electricity and Natural Gas Demand Forecast
The Energy Commission’s long‐term forecast of electricity and natural gas demand is used in many venues: as the foundation for policy recommendations to the Governor and Legislature through the Integrated Energy Policy Report; as a yardstick by which to measure the utilities’ need

10
for new generation resources in the CPUC’s Long‐Term Procurement Planning proceeding; as a reference point in the ARB’s AB 32 Scoping Plan; as a benchmark for assessing the state’s progress toward meeting its Renewables Portfolio Standard; as a baseline for estimating potential energy efficiency savings; and as input into the Energy Commission’s assessment of electricity infrastructure needs and annual resource adequacy proceedings addressing capacity needed to meet peak electricity demand.
In 2010, Californians consumed about 272,300 gigawatt hours of electricity; natural gas consumption, excluding fuel for electricity generation, represented almost 12,700 million therms. The Energy Commission staff draft Preliminary California Energy Demand Forecast: 2012‐2022, released in August 2011, estimates that by 2022, California’s electricity consumption will reach between 313,493 and 332,514 gigawatt hours. This represents an annual average growth rate of between 1.18 percent (low case) and 1.68 percent (high case). For natural gas, average annual growth rates range from 0.7 percent in the low case to 0.94 percent in the high case. By 2022, natural gas consumption is expected to reach between 13,773 and 14,175 million therms.
Economic projections are one of the key inputs to the demand forecast. For the draft Preliminary California Energy Demand Forecast: 2012‐2022, staff used three sets of economic projections from Moody’s Economy.com and IHS Global Insight with scenarios that captured the highest and lowest projected levels of economic growth. Staff found that despite the economic uncertainty surrounding the current recession (for example, when and how California will recover), alternative scenarios show a relatively narrow band by the end of the forecast period. This narrowing tends to reduce the differences among the forecast energy scenarios later in the forecast period, all else being equal.
As California’s economy recovers and changes, it is critically important that the Energy Commission adapt its demand forecasting models to reflect those changes. Staff will consider incorporating such factors in future forecasts while continuing to engage with a variety of economic and demographic experts. In addition, given the Governorʹs policy goals for combined heat and power and distributed generation and the recent qualifying facility settlement to combined heat and power, future IEPRs will provide a more comprehensive assessment of the status of combined heat and power in California. As part of this effort, the staff will be developing scenarios for this technology for the revised forecast.
The staff draft Preliminary California Energy Demand Forecast: 2012‐2022 continues the long‐standing practice of distinguishing between two types of “reasonably‐expected‐to‐occur” savings—committed and uncommitted. Committed efforts include authorized utility programs, finalized building and appliance standards, and other policy initiatives that have implementation plans, firm funding, and a design that can be technically assessed to determine probable future impacts. Committed savings also include price and market effects, which represent savings from rate increases and other market effects not related directly to standards and programs. These savings are incorporated directly into the forecast. Uncommitted savings—which, while plausible, have a great deal of uncertainty surrounding the method,

11
timing, and relative impact of their implementation—are considered separately within the forecast.
During the 2009 IEPR cycle, at the request of the CPUC, staff began to assess the impacts of incremental uncommitted energy efficiency policy initiatives. Some initiatives considered uncommitted in 2009 are now incorporated in the committed forecast, including Assembly Bill 1109 (Huffman, Chapter 534, Statutes of 2007) and the 2010 Title 24 Building Code Revisions. In addition, the forecast extends uncommitted analysis to publicly owned utilities. Uncommitted efficiency initiatives in the 2011 forecast include utility programs beyond 2012, further updates to state building and appliance standards, and the CPUC’s Big Bold Energy Efficiency Initiatives. Assuming various levels of commitment to these policies and three scenarios for uncommitted efficiency savings – high, medium, and low – by 2022 consumption in the mid demand case would be reduced 3.3 percent if adjusted by the low savings scenario and 6.2 percent using high incremental uncommitted savings. For peak, reductions range from 4.8 percent to 9.5 percent.
The CPUC’s new energy efficiency potential and goals study is expected to be completed in late summer 2012. This schedule does not allow the results of the study to be fully incorporated in the revised or final adopted IEPR demand forecasts, but CPUC staff intends to use interim study results to recommend changes to the incremental uncommitted efficiency impacts developed from the 2008 Goals Study. Thus, the uncommitted results will likely differ in the revised and adopted IEPR forecasts compared to the preliminary forecasts.
California’s Electricity Infrastructure Needs
Maintaining reliable supplies of electricity requires balancing a variety of state policy goals and mandates. Because of the long timelines involved in building power plants and transmission lines, decisions must be made well in advance of new generation and transmission infrastructure needs. These decisions are complicated by a number of factors, including electricity demand growth; potential retirement of large amounts of generating capacity due to age or as a result of state policies on water use in power plants; limited availability of emission offsets for replacement generating facilities; retirement or divestiture of coal‐fired generation serving California; and achievement of state policy goals for increased use of preferred resources like energy efficiency, renewable resources, distributed generation, combined heat and power, and energy storage.
Of particular concern is the potential retirement of power plants that use once‐through cooling. In October 2010, the State Water Resources Control Board adopted a policy for reducing the impacts on marine and estuarine environments from the use of once‐through cooling in power plants. The policy applies to 14,755 megawatts of existing gas‐fired generation and may require 13,300 megawatts of this to comply with the policy by 2020. Most owners of California’s aging power plants are choosing to retire those plants rather than make expensive investments in alternative cooling technologies, causing a need for new generating capacity to satisfy peak electricity demands and maintain appropriate reserves.

12
At the same time mitigation of once‐through cooling is increasing the demand for new power supplies, air quality constraints are restricting the development of fossil fuel power plants. This conflict is especially apparent in the South Coast Air Basin. To satisfy local capacity requirements and help integrate variable renewable generation, the region will need to replace some older generating capacity with dispatchable, flexible fossil power plants when existing once‐through cooling plants retire. While energy efficiency, distributed generation, combined heat and power, and energy storage at the levels envisioned by state policy could reduce the need for dispatchable fossil generation in the South Coast Air Basin and other parts of the state, it is unclear to what extent they will do so.
Assembly Bill 1318 (V. Manuel Perez, Chapter 285, Statutes of 2009) requires the ARB to develop a report, in consultation with various agencies including the Energy Commission, to assess the need for new power plant capacity in South Coast Air Basin and how needed offsets compare to available amounts. The report will also examine whether changes in rules and other permitting mechanisms are needed to allow power plants to be developed while safeguarding air quality. The AB 1318 project has been underway since spring 2010, and, as of this writing, the ARB anticipates developing a draft AB 1318 report by the end of 2011, with a final report to the Legislature in the spring of 2012.
The potential divestiture or retirement of more than 15,000 MW of fossil generation requires an assessment of how much replacement capacity will be needed to assure electric system reliability and ease the transition to a low‐carbon electricity sector through 2020 and beyond. While California’s energy needs will be increasingly met by renewable resources over the next decade, the existing system requires threshold amounts of such capacity to ensure system and local reliability. Given load growth, enough capacity from in‐state gas‐fired resources must be available to meet systemwide capacity requirements. In addition, gas‐fired generating capacity is needed in specific geographic areas to meet local capacity requirements. Finally, gas‐fired generation will be needed to provide the operational characteristics to integrate large amounts of renewable resources while maintaining reliability.
While energy agencies can each make their own decisions about portions of new infrastructure that will be needed, there is no overarching mechanism to ensure that all the energy and environmental agencies come to common decisions. The Energy Commission believes that a new interagency mechanism should be developed to coordinate broader policy decisions that are beyond the focus of a single agency. The new mechanism should build on the existing evidence‐based agency processes that exist today, but focus on decision making.
California’s Transportation Fuel Demand and Infrastructure Needs
California’s industries, commercial businesses, households, transit agencies, and government all rely on transportation fuels for movement of goods and people over highways, rail, waterways, and air. Transportation fuels also provide energy for off‐road, industrial, agricultural, commercial, military, and recreational uses. All sources of energy for transportation come with economic, environmental, security, and infrastructure dimensions. While petroleum fuels refined from crude oil are currently the dominant transportation energy source in California,

13
state and federal policies and regulations have been implemented to decrease petroleum use to reduce greenhouse gas emissions and increase energy independence.
Transportation Fuel Demand Energy Commission staff has developed scenarios of transportation energy demand and , as well as analyses of the effects on supply and demand of a variety of federal and state policies and regulations. These scenarios are not intended to be explicit predictions of the future, but instead explore the potential range, magnitude, and direction of trends in energy use and price, vehicle purchase, and supply and infrastructure requirements under a wide array of uncertain future conditions. The forecasts will intent is to allow policy makers to better anticipate challenges and opportunities for implementing significant changes being proposed to the transportation energy system and its related markets and to reach statewide alternative transportation fuel goals.
In 2010, consumption of gasoline, diesel and jet fuel declined 7.2 percent from 2006 levels, with petroleum dependence declining by 9.8 percent over the same period due to the increased use of ethanol in gasoline. Data for 2011 indicate that gasoline and diesel consumption for the first seven months of 2011 were down 2.0 and 2.1 percent respectively from 2010. This results from the combination of sustained high fuel costs, low economic growth, declines in the value of real estate and equities, and continued high unemployment.
Staff estimates the forecast of gasoline consumption in the Low Petroleum Demand Scenario to decline 15.6 percent from 2009 to 12.5 billion gallons by 2030. In the High Petroleum Demand Scenario, gasoline consumption grows by 3.6 percent by 2030 to 15.3 billion gallons. For diesel consumption, staff forecasts consumption of 4.0 billion gallons by 2030 in the Low Petroleum Demand Scenario, or an increase of 22.3 percent from 2009. In the High Petroleum Demand Scenario, which assumes a higher rate of economic growth, total annual diesel consumption is forecasted at 4.8 billion gallons, an increase of 50.4 percent from 2009 levels.
Consumption of alternative fuels, however, is expected to rise. Staff estimates that electric vehicle sales could increase to a cumulative number of 440,000 in 2020 and as many as 1.4 million in 2025. Additional analysis will be conducted to estimate the number of battery electric and plug‐in electric vehicles and total electricity consumption. Consumption of natural gas for transportation is expected to increase at a compound annual rate of more than 2.8 percent. Staff also expects increased consumption of ethanol from one or more sources of between 2.2 and 3.2 billion gallons by 2030. The national Renewable Fuels Standard 2 (RFS2) requirement for ethanol consumption creates a challenge and affects California’s efforts to fulfill its state policy goals, including the Low Carbon Fuel Standard, petroleum reduction goals and Bioenergy Action Plan goals. Uncertainties about the options to supply low carbon biofuels (from the Midwest U.S., Brazil, or California sources), the availability of adequate numbers of flexible fuel vehicles, the need and cost of refueling facilities, the potential to increase gasoline blends to E15 and California consumer demand for vehicles and fuel create complexity in estimating ethanol consumption. U.S. EPA’s continual waivers of RFS2 requirements to produce a minimum amount of advanced or cellulosic biofuels jeopardize California’s efforts to develop low carbon

14
biofuels from agricultural, forestry and urban waste residue and some purpose‐grown nonfood crops.
Transportation Infrastructure Needs – Alternative Fuels Demand for biofuels in the United States is expected to grow due to the Renewable Fuels Standard II mandates, while the demand in California is forecast to grow at an even higher rate due to the Low Carbon Fuel Standard. Certain biofuels (ethanol in low level blends, biodiesel, renewable diesel, and renewable gasoline) will require only modest fueling infrastructure investment and little to no modifications to motor vehicles to enable greater use. However, electricity, natural gas, and hydrogen are examples of alternative transportation energy that will require significant investment in fueling infrastructure and vehicles that run on these fuels over the next several years.
California’s infrastructure to receive, distribute, and blend ethanol is robust and adequate to accommodate a continued growth of ethanol use over the next several years. Although California’s biodiesel infrastructure is currently inadequate to accommodate widespread blending of biodiesel, with sufficient lead time (12 to 24 months) modifications could be undertaken and completed to enable an expansion of biodiesel use.
For electric vehicles, significant public and private investments are being made in California’s electric charging infrastructure. The federal government’s economic stimulus funds, matched with Energy Commission program funds and other private and public funds, are providing the charging infrastructure to support the deployment of plug‐in electric vehicles in California.
Primary barriers to the penetration of natural gas vehicles (NGVs) are the lack of a widespread fueling infrastructure and the costs required to upgrade aging existing facilities and install new fueling stations. Today, the use of NGVs is largely limited to medium‐ and heavy‐duty vehicles, which can use compressed natural gas (CNG)/liquefied natural gas (LNG) stations on a regular route. The Energy Commission has allocated funding to upgrade existing sites and install new natural gas fueling infrastructure closely tied to identifiable needs such as those of school districts and local governments, long‐haul LNG goods movement corridors, and pairing new CNG stations with high‐volume fleets that intend to convert from diesel to CNG. This funding will support 20 new stations and/or existing station upgrades.
Transportation Infrastructure Needs – Conventional Fuels California’s 20 refineries processed more than 1.7 million barrels per day of crude oil in 2010. Most of this crude oil must be imported by marine vessel, historically from Alaska and a variety of foreign sources. California oil production has fallen 47.2 percent since 1985, and staff estimates a range of future decline of between 2.2 and 3.1 percent per year. Staff expects crude oil imports compared to 2010 levels to rise by between 22 million and 104 million barrels per year by 2030.
Oil imports at the high end of the range will require expanded capability to receive crude oil imports within the next four to five years to ensure sufficient supplies of transportation fuels. Staff believes there is sufficient existing spare import capability that the low estimate for

15
imports could be met. There are two crude oil import infrastructure projects proposed in Southern California that are at early stages of development, Berth 408 at Pier 400 in the Port of Los Angeles and Berth T126 at Pier Echo in the Port of Long Beach. Based on Energy Commission analysis, the Southern California market should require construction of only one of these crude oil import facilities over the forecast period, not both.
California’s Investments in Alternative Fuels and Vehicles
In 2007, Assembly Bill 118 (Núñez, Chapter 750, Statutes of 2007) created two programs to support development of alternative and renewable fuels and vehicles to help attain the state’s greenhouse gas emission reduction goals. The Energy Commission’s Alternative and Renewable Fuel and Vehicle Technology Program (ARFVT), budgeted at about $100 million per year through 2015, supports development and deployment of alternative and renewable fuels and advanced transportation technologies. The ARB’s Air Quality Improvement Program (AQIP), with an annual budget of $30 million to $40 million, supports development and deployment of zero‐emission and reduced‐emission light‐duty vehicles and trucks.
Assembly Bill 109 (Núñez, Chapter 313, Statutes of 2008) amended the ARFVT and directed the Energy Commission to evaluate the efforts and benefits of the program every two years. The first such evaluation, to be released in 2012, will describe funded projects and report on progress toward achieving project goals and expected benefits. The program invests in a wide variety of alternative and renewable fuels, including electric drive, biomethane, diesel substitutes, ethanol, natural gas, propane, and hydrogen, and funds workforce training. To date the Energy Commission has funded 86 projects totaling $198.4 million.
As a result of the ARFVT, California now has the largest network of electric vehicle charging systems and hydrogen fueling stations in the country. Compared to 2009‐2010 levels, the program has more than doubled the number of E85 fueling stations in the state and has added 20 natural gas stations. In addition, program investments will add more than 1,400 alternative vehicles to the California fleet. Two‐thirds of program funding is targeted toward commercial deployment and production projects, with one‐third allocated to research, demonstration, and development projects. The program also leverages state investments with private financing and other public funding sources, with leveraged funds ranging from a minimum of $320 million to a high estimate of $384 million.
Staff developed low‐ and high‐range scenarios to assess the potential benefits from the projects funded through the ARFVT Program and estimate alternative fuel increase (and resulting petroleum fuel decrease) for each fuel type, which is then used to calculate estimated reductions in greenhouse gas and air pollutant emissions. Program investments in electric drive technologies, biofuels production, diesel substitutes, natural gas medium‐ and heavy‐duty vehicles, and hydrogen fueling stations will contribute toward estimated petroleum reductions of 372.4 million to 1.2 billion gallons per year in 2020. These are significant reductions given that current petroleum fuel consumption in California totals roughly 18.8 billion gallons per year.

16
Expected reductions in greenhouse gas emissions and criteria pollutants are also significant. In 2008, total on‐road greenhouse gas emissions were estimated at 163.3 million tonnes of CO2e (carbon dioxide equivalent). The ARFVT Program’s investments will result in greenhouse gas emission reductions ranging from 2.5 million CO2e (low case) to 9.1 million CO2e (high case) in 2020, and in reductions in criteria pollutants such as volatile organic compounds, carbon monoxide, nitrogen oxides, and particulate matter.
The program has begun to make a positive impact in fulfilling several state policy goals. Development and commercialization of the 78 projects funded to date have the potential to displace up to 4 percent of the estimated petroleum fuel demand in 2020 and reduce up to 4 percent of the estimated business as usual greenhouse gas emissions from transportation in that same year. Commercialization of California biofuel projects funded by ARFVT could provide 8 percent to 40 percent of estimated biofuel consumption in 2020.
The ARFVT Program also includes a workforce development and training component that will increase the industry’s ability to manufacture low‐emission vehicles and components, produce alternative fuels, build fueling infrastructure, and service and maintain fleets and manufacturing equipment. To date, partnerships with workforce training agencies – including the Employment Development Department, the California Community Colleges Chancellor’s Office, and the Employment Training Panel – have resulted in grants and contracts to train more than 5,326 individuals.
California’s Progress on Bioenergy Goals
California’s first Bioenergy Action Plan was published in 2006 to implement Executive Order S‐06‐06, which set goals for the production and use of electricity and fuels made from biomass, including plant and animal residues from farms, forests, and urban areas, as well as crops grown specifically for energy production. Goals included having the state produce a minimum of 20 percent of its biofuels within California by 2010, 40 percent by 2020, and 75 percent by 2050, and having biomass for electricity represent 20 percent of the state’s Renewables Portfolio Standard targets.
Despite the state’s policies to promote renewable energy and bioenergy, progress has been slow. In March 2011, the Energy Commission adopted the updated 2011 Bioenergy Action Plan, which provides an update on progress toward the state’s bioenergy goals. In‐state biofuel production in 2010 represented only 5.6 percent of California’s biofuel demand, far below the 20 percent goal. On the electricity side, the biopower share of renewable electricity generation in California decreased from 20 percent in 2008 to 17 percent in 2010. However, in‐state biopower generation is expected to increase in the short term when three in‐state coal facilities complete full fuel conversion to biomass by the end of 2012, adding more than 100 MW of biopower capacity to the grid. Additional biopower capacity has recently been proposed as the remaining existing coal facilities consider converting to biomass by 2015. In addition, the Energy Commission expects that some facilities that shut down due to low short‐run avoided cost energy prices in 2009 and 2010 will restart if contract renegotiations are successful. While new

17
projects are being proposed, they are not expected to contribute significant generation in the next two years.
Strategies identified in the 2011 Bioenergy Action Plan to help accelerate the state’s progress on achieving bioenergy targets include:
• Reauthorization of the Public Goods Charge to fund public interest energy research and provide incentives to existing and emerging bioenergy technologies.
• Continued evaluation of bioenergy feedstocks and markets to promote technologies, programs, and policies needed to enhance biofuels development.
• Development of in‐state biogas/biomethane for pipeline injection and on‐site use, including a review of regulatory and legislative hurdles.
• Greater coordination among permitting agencies to streamline and expedite permitting.
• Review of interconnection requirements for distributed generation and biomethane projects, biogas quality standards, and identifying and implementing necessary revisions to regulations that will increase access to the electricity transmission and distribution grid and natural gas pipelines for bioenergy projects.
• Providing incentives that reflect the benefits of biomass, such as expanded feed‐in tariffs, support for repowering aging biopower facilities, feedstock incentives, environmental adders, more favorable power purchase agreements, and research and development grants.
• Development of sustainable feedstock standards and waste utilization targets for biomass resources to ensure that biomass utilization supports California’s goals for renewable energy, the Low Carbon Fuel Standard, recycling, and economic development.
• Development of a plan and program to address the costs associated with the collection and transport of biomass residues in order to lower costs.
• Regular meetings of the Working Group to improve agency coordination and collaboration.
California’s Public Interest Energy Research Program
The invention and application of new technologies are a major driver of economic progress. However, private sector firms understandably tend to focus their research and development activities on projects that benefit their individual firms and bottom lines. In contrast, government research activities are targeted toward benefiting entire industries as well as society as a whole.
Over the last 14 years, the Energy Commission’s Public Interest Energy Research (PIER) Program has funded energy‐related research that responds to market needs and supports the state’s energy policy goals. The program funds research across a broad spectrum of energy areas, including energy efficiency, renewable energy, advanced electricity technologies, energy‐related environmental protection, transmission and distribution, and transportation technologies.

18
To further the state’s goal of achieving all cost‐effective energy efficiency savings, PIER‐funded research supported technologies and strategies now included in the 2008 Building Efficiency Standards such as residential cool roofs to reduce air‐conditioning use, requirements to improve energy performance of air handlers and duct systems, and more efficient kitchen and underground pipe insulation. In addition, requirements in the 2007 and 2010 Appliance Efficiency Standards for external power supplies and flat‐screen televisions resulted directly from PIER‐funded research. Overall, these measures will produce estimated annual energy savings of more than $1 billion for California electric and natural gas ratepayers when fully implemented.
In addition to supporting the building and appliance standards, PIER funds research that successfully brings products to the marketplace. For example, PIER support for Adura® Technologies contributed to the development of a breakthrough wireless lighting control network that creates energy savings of up to 70 percent. Another example is a PIER‐funded demonstration of an innovative cooling system developed by Federspiel Controls (now Vigilent Systems) in eight data centers throughout California that reduced energy use for cooling by 19 to 78 percent, saving about $240,000 annually.
Since its creation in 1996, the PIER Program has also helped California increase its use of renewable energy. PIER‐funded projects have helped renewable technologies reach maturity and achieve faster market penetration, ultimately leading to more renewable energy in the state’s electricity portfolio. One example is a new concentrating photovoltaic system developed by GreenVolts, Inc., which was originally funded by the PIER Program and is now in full production with six installations in California and Arizona and several additional sites under development, including a 2.5 megawatt facility under construction in Byron, California. These projects resulted in 100 jobs at GreenVolts, 20 manufacturing jobs, and more than 30 jobs for various installation contracts.
The PIER Program also supports technologies to better manage and operate the electric grid. Current grid‐monitoring systems may only report on grid status every four seconds. PIER‐funded synchrophasor measurement systems – which provide information to grid operators up to 30 times per second – are now being used by the California ISO to help foresee and prevent power outages. In January 2008, one such system alerted the California ISO to unusual grid oscillations that were causing grid instability, leading to shutdown of a power line to avoid a major blackout. Prior to installation of this system, the grid operator probably would not have detected the irregularity. In the future, synchrophasor technologies are expected to save electricity consumers from $210 million to $370 million per year by avoiding expensive power outages and $90 million per year in reduced electricity costs.
The PIER Program is also instrumental in bringing additional venture capital investments to California. Since 1999, the PIER‐funded Energy Innovations Small Grant has provided $30 million to awardees who went on to garner more than $1.4 billion in subsequent investment, including $1.3 billion in private, nonutility investment. Products developed through these grants are worth $1.3 billion to the private sector – more than 40 times the initial investment of

19
PIER funds – and create jobs and other economic benefits for the state. In addition, in 2010 the PIER Program successfully leveraged more than $500 million in federal stimulus funding under the American Recovery and Reinvestment Act of 2009 and $900 million in private investment funds using only $20 million of PIER Program funding.
Energy Commission staff is evaluating methods to improve and refine how public benefits are assessed from PIER‐funded projects and the overall program. The PIER Program developed a programwide approach to benefit and cost assessment that includes integrating benefits assessment into work plans and databases, evaluating interviews and surveys, identifying required benefits metrics, and requiring researchers to provide follow‐on reports on these metrics.
A major challenge facing the PIER Program is the expiration on January 1, 2012, of the state’s Public Goods Charge to support energy‐related research and development. There is support from the Governor and key legislative leaders to continue the Public Goods Charge, and the CPUC recently issued a proposed decision in its rulemaking on this issue to continue collecting funds on an interim basis pending a final decision in a later phase of the proceeding. If funding is not reauthorized, however, the state will lose a valuable source of funding support for businesses, clean energy technology innovation and development, leveraged investment in California, job creation, energy‐related environmental research, and increased electricity reliability.
California’s Nuclear Power Plants
In 2010 nuclear power provided 15.7 percent of California’s in‐state electricity generation, and 11.1 percent of the entire California power mix (which includes out‐of‐state imports). This electricity generation comes from three plants: the Diablo Canyon Power Plant (Diablo Canyon) and the San Onofre Generating Station (SONGS) in California, and the Palo Verde nuclear power plant in Arizona. These nuclear power plants are important to California’s electricity supply and meeting California’s greenhouse gas emissions reduction goals and policies for climate change reduction. However, Diablo Canyon and SONGS are older plants located near major earthquake faults and have significant inventories of spent nuclear fuel stored onsite.
In 2008, the Energy Commission issued an assessment of California’s nuclear power plants as required by Assembly Bill 1632 (Blakeslee, Chapter 722, Statutes of 2006). The report provided an independent scientific assessment of the seismic hazard and plant vulnerabilities at Diablo Canyon and SONGS, and made recommendations for additional studies that should be completed and required as part of the Diablo Canyon and San Onofre’s license renewal feasibility studies and review.
The Nuclear Regulatory Commission issues operating licenses for commercial power reactors for up to 40 years and allows 20‐year license extensions with no limit on the number of renewals. The operating licenses for California’s nuclear plants will expire in 2022 (SONGS Units 2 and 3), in 2024 (Diablo Unit 1), and in 2025 (Diablo Unit 2). Pacific Gas and Electric Company submitted a license renewal application for Diablo Canyon on November 24, 2009, to

20
continue operations until 2044/2045, and the Nuclear Regulatory Commission has postponed its license renewal proceeding by 52 months to allow time for PG&E to complete additional seismic studies. Southern California Edison has not yet applied for renewal and will continue to assess options for the timing of license renewal filings. The Nuclear Regulatory Commission issued license renewals for Palo Verde Units 1, 2, and 3 on April 1, 2011.
A major concern for California is whether the license reviews adequately address issues relevant to the state. Nuclear Regulatory Commission license renewal criteria include aging plant issues and environmental impacts related to an additional 20 years of plant operation, but excludes issues such as seismic vulnerability, plant vulnerability to terrorist attacks, and the adequacy of emergency evacuation plans. Several California officials have requested the Nuclear Regulatory Commission to address additional issues of concern including safety, seismic and tsunami hazards, emergency response plans and evacuation timeliness, plant security, and spent fuel storage. However, the Nuclear Regulatory Commission ultimately determined that the existing regulatory process was sufficient and that they consider these issues on an ongoing basis in connection with their oversight of operating reactors.
Concerns about nuclear plant safety and reliability have increased with the recent large earthquakes in Japan. In 2007, a major earthquake resulted in a loss of nearly 8,000 megawatts of power at the Kashiwazaki‐Kariwa nuclear power plant in Japan, with most of its units remaining shut down four years after the event. In March 2011, a 9.0 magnitude earthquake in northern Japan and an estimated 40‐foot tsunami at the Fukushima Daiichi plant site resulted in spent fuel meltdowns at three of the plant’s six reactors, overheating and damage to spent fuel storage pools, explosions and fires, large‐scale releases of radioactive materials to the environment, and the evacuation of an estimated 80,000 people.
In July 2011, the Energy Commission and the CPUC conducted a joint public workshop on the implications of the Fukushima Daiichi accident for California’s nuclear power plants and the utilities’ progress in carrying out the recommendations made in the Energy Commission’s AB 1632 report. Issues discussed included seismic and tsunami hazards, spent fuel pool safety, potential station blackouts, long‐term power outage, and emergency response planning. Based on events in Japan, comments received at the joint workshop, and other considerations, the Energy Commission, in consultation with the CPUC, has developed a set of specific recommendations to address issues with California’s nuclear power plants, including completion of seismic studies; improvements in spent fuel storage and safety; lessons learned from the station blackout at Fukushima; new generation or transmission facilities needed to maintain reliability in the event of a long‐term outage; adequacy of emergency response planning; and efforts to improve safety culture.
21
d
encourage
nce,
crease investments in clean energy and energy efficiency to
cy
l and
Introduction As the United States recovers from the recent economic recession, it is more important than ever that California continue to pursue clean energy policies and development. Not only does clean energy provide environmental benefits, but it also increases energy security and stimulates economic growth. Because clean energy tends to rely more on domestic energy resources, it is more environmentally sustainable and less vulnerable to the highs and lows of global economic activity. Clean energy projects also generate job growth in local communities, often in those hit hardest by the recession. According to a 2011 report by Next 10, from 1995 to 2009 the energy generation sector created the most jobs in California’s green economy, adding nearly 20,000 jobs.1 Nationally, a 2011 Brookings Institution report concluded that the clean economy employs more workers than the fossil fuels and biotech industries, with four of the five fastest growing clean tech segments in renewable energy that added about 50,000 jobs in the solar thermal, solar photovoltaic, wind power, biofuels, fuel cell production, and smart griindustries.2
The California Energy Commission continues to support policies and programs that investments in expanded and updated energy infrastructure and innovative energy technologies that will create jobs, build 21st century businesses, increase energy independeand protect public health.3 Many of the state’s energy policies, including aggressive 2020 greenhouse gas (GHG) emission reduction targets, increased energy efficiency standards for buildings and appliances, the 33 percent by 2020 Renewables Portfolio Standard (RPS), zero net energy buildings, and the Low Carbon Fuel Standard support a transition away from fossil fuel dependency and toward clean energy development. In addition, Governor Jerry Brown’s Clean Energy Jobs Plan notes the need to inhelp rebuild California’s economy.4
The 2011 Integrated Energy Policy Report (2011 IEPR) discusses a range of issues facing California’s electricity, natural gas, and transportation fuel sectors. The report provides an overview of issues in the following areas: renewable energy; energy efficiency; increased agencoordination and improved planning processes; forecasted electricity and natural gas supply and demand; electricity infrastructure needs; transportation demand and alternative fue
1 Next 10, Many Shades of Green: Diversity and Distribution of California’s Green Jobs, January 2011, http://www.next10.org/next10/publications/green_jobs/2011.html.
2 Muro, Mark, Jonathan Rothwell, Devashree Saha, The Brookings Institution Metropolitan Policy
_economy.pdProgram, Sizing the Clean Economy: A National and Regional Green Jobs Assessment, July 2011, http://www.brookings.edu/~/media/Files/Programs/Metro/clean_economy/0713_cleanf.
3 http://www.jerrybrown.org/Clean_Energy.
4 http://www.jerrybrown.org/Clean_Energy.
22
y‐related research and development; bioenergy goals; and
GHG emission reductions. In October 2011, ’s
,
at both the grid and ental
for Energy Commission staff and activities related to the RPS
te
vehicle development; energCalifornia nuclear power plant issues.
Renewable Energy California’s RPS target, originally established in 2002, was expanded in 2011 to 33 percent by2020. To support that target, Governor Brown’s Clean Energy Jobs Plan set a goal of adding 20,000 megawatts (MW) of renewable generating capacity by 2020, including 12,000 MW of localized electricity generation – small, on‐site residential and business systems and intermediate‐sized energy systems close to existing consumer loads and transmission lines – as well as 8,000 MW of large‐scale wind, solar, and geothermal energy systems. In addition, renewable energy is also a key strategy in achievingthe California Air Resources Board adopted final cap‐and‐trade regulations as part of the stateAssembly Bill 32 Climate Change Scoping Plan.5
Under Governor Brown’s direction, the Energy Commission is preparing a renewable plan to “expedite permitting of the highest priority generation and transmission projects.” In December2011, the Energy Commission released the Renewable Power in California: Status and Issues reportwhich identifies high level strategies to support renewable development. These strategies will be the basis for a comprehensive renewable strategic plan that will be developed as part of the 2012 Integrated Energy Policy Report Update. The draft 2011 IEPR includes a summary of the Renewable Power in California: Status and Issues report including issues that must be addressed to ensure that California meets its renewable energy goals. Issues include environmental sensitivities, planning, and permitting; transmission; renewable integration distribution levels; investment and financing; cost; research and development; environmjustice; coordination with local governments; and workforce development.
An additional challenge is the expiration of the Public Goods Charge (PGC) to support renewable energy that is set to expire January 1, 2012. If the PGC is not reauthorized or continued in some fashion, state incentive programs such as the New Solar Homes Program, the Emerging Renewables Program, and the Existing Renewables Program will be unfunded, andalternative funding will be neededimplementation, RPS eligibility certification, and the regional renewable energy certificatracking and registry system.
There is support from the Governor and key legislative leaders to continue the PGC for renewable energy programs; in a September 26, 2011, letter to California Public Utilities Commission (CPUC) President Michael Peevey, Governor Brown requested the CPUC to take action to “ensure that programs like those supported b y the Public Goods Charge are instituted
5 The regulation sets a statewide limit on sources responsible for 85 percent of California’s greenhouse gas emissions and establishes a price signal needed to drive long‐term investment in cleaner fuels and more efficient use of energy.

23
any ng in
the
2 of the proceeding, which will address sign, oversight, and administrative questions. The CPUC is expected cision in December 2011.
ergy
iew of results from the Energy
ciency
– and hopefully at their current levels.”6 The letter also noted that, “we cannot afford to letof these job‐creating programs lapse.” In response, the CPUC established a rulemakiOctober 2011 to address funding and program issues related to the renewable energy and research, development, and demonstration portions of the expiring PGC funding.7
The first phase of the proceeding is addressing appropriate funding levels for renewable and research programs and how funds should continue to be collected. On November 15, 2011, CPUC issued a proposed Phase 1 decision instituting the Electric Program Investment Charge(EPIC) to collect funds on an interim basis for renewables and research, development, and demonstration programs. Rates and allocations for the EPIC will be at the same levels as the current PGC. Funds will be placed in balancing accounts and not disbursed until authorized by the CPUCʹs final decision at the conclusion of Phasemore detailed program deto act on Phase 1 of the de
Energy Efficiency California’s energy resource “loading order” guides the state’s energy decisions and requires meeting new electricity demand first with energy efficiency. As part of this commitment, Assembly Bill 2021 (Levine, Chapter 734, Statutes of 2006) established several important enefficiency policies, including a statewide commitment to cost‐effective and feasible energy efficiency. AB 2021 requires the CPUC and the Energy Commission to identify potentiallyachievable cost‐effective electric and natural gas energy efficiency savings and set goals for investor‐owned utilities (IOUs) and publicly owned utilities to achieve this potential.8 As required by AB 2021, the draft 2011 IEPR provides an overvCommission’s evaluation of publicly owned utilities’ progress toward meeting targets and 2010revised energy efficiency potential estimates and targets.9
Another statewide commitment to reducing electricity demand is to increase energy effiin California’s new and existing buildings. The Energy Commission recognizes that more efficient residential and commercial buildings will contribute significantly to achieving California’s clean energy and GHG emission reduction goals. State policies like Assembly Bill 32 (Nunez, Chapter 488, Statutes of 2006) and California’s Clean Energy Future initiative
6 http://gov.ca.gov/news.php?id=17237.
2057 California Public Utilities Commission, Order Instituting Rulemaking 11‐10‐003, October 6, 2011, http://docs.cpuc.ca.gov/published/Final_decision/145392.htm#P60_1 .
8 The terms for energy efficiency “targets” and “goals” are used interchangeably. There is an established convention (at least since 2004) that the CPUC and IOUs use the term “goals.” Publicly owned utilities have adopted the term “targets” since that is the term used in AB 2021.
9 California Energy Commission, Achieving Cost Effective Energy Efficiency for California: 2011‐2020 Draft Staff Report, available at: http://www.energy.ca.gov/2011publications/CEC‐200‐2011‐007/CEC‐200‐2011‐007‐SD.pdf.
24
ts in existing buildings. The ds in increasing efficiency
.
In
e
gencies
ome challenges, thereby accelerating progress on the
at d”
streamlining the Energy Commission’s siting process. The
its
support the state’s efforts to achieve all cost‐effective energy efficiency in buildings. In addition, AB 758 (Skinner, Chapter 470, Statutes of 2009) directed the Energy Commission to develop, adopt, and implement a comprehensive program to reduce energy consumption in existing buildings, including regulations for energy ratings and improvemendraft 2011 IEPR discusses the role of building and appliance standarin new and existing buildings as well as progress toward implementing the AB 758 program
Improved Coordination and Planning Processes Addressing challenges to future clean energy development will require close collaboration among the state’s energy agencies. This collaboration is already occurring through an interagency effort known as California’s Clean Energy Future (CCEF), which includes the Energy Commission, the CPUC, the California Independent System Operator (California ISO),the California Air Resources Board, and the California Environmental Protection Agency. September 2010, the agencies released the California’s Clean Energy Future Overview, which describes the elements needed to meet the state’s ambitious clean energy goals and points thway toward new investments in energy efficiency, increased use of renewable resources, transmission, and smart grid applications. The overall goal of CCEF is to ensure the awork together to identify their policy interdependencies, prevent duplication, and increase communication and coordination to overcstate’s clean energy policies. This effort committed the agencies to review and revise recommended strategies and specified targets on a biennial basis. This 2011 IEPR provides aninterim status report on CCEF activities.
To improve the Energy Commission’s power plant licensing process, in December 2010 the Energy Commission initiated an Order Instituting Informational (OII) Proceeding regarding “lessons learned” during the licensing of solar thermal and natural gas‐fired power plants during 2009 and 2010. The OII proceeding began with a scoping workshop in December 2010, which stakeholders provided focused comments on addressing challenges with power plantlicensing. The staff used this feedback in analyses that constitute the core of a “lessons learneself‐assessment for improving anddraft 2011 IEPR provides an overview of the initial findings from that assessment. Staff will continue to examine critical issues and will hold workshops through 2012, with a final staff report and findings to follow.
The Energy Commission is improving and streamlining other planning processes as well. Interms of electricity resource planning, the Energy Commission is moving the release dates ofbiennial Natural Gas Assessment and California Energy Demand forecast to improve coordination and timing with the CPUC Long‐Term Procurement Plan (LTPP) and the California ISO’s Transmission Plan. Traditionally, the Energy Commission has conducted assessments and forecasts during odd‐numbered years to develop policies for the IEPR. 10 Releasing the results in
10 As required by SB 1389 (Bowen and Sher, Chapter 568, Statutes of 2002), see: http://www.energy.ca.gov/energypolicy/documents/sb_1389_bill_20020915_chaptered.pdf.

25
a better fit with other agencies’ processes. Consequently, ergy Commission’s natural gas assessment s, with comprehensive forecast results to be
11 natural gas issues
d
human
20 than previously expected, and this is also true for the mid and high cases
s on
e need to mitigate impacts on marine and estuarine
d
even‐numbered years will still allow the Energy Commission to present policy findings in the IEPR Updates and may also providethe draft 2011 IEPR summarizes the status of the Enand the electricity and natural gas demand forecastincluded in the 2012 IEPR Update.
Energy Assessments and Forecasts Natural gas continues to play an essential role in meeting the state’s energy demand and for various end uses in the residential, commercial, and industrial sectors. Natural gas power plants, with some modifications, will also be important for helping integrate intermittent renewable energy resources into the electricity system. The Energy Commission staff draft 20Natural Gas Market Assessment: Outlook reflects comprehensive analyses ofwhich will affect California’s infrastructure and energy supply needs, and includes discussionsof natural gas uncertainties, potential price vulnerability, managing risks, and an update on potential impacts of the September 2011 San Bruno pipeline incident.11
The Energy Commission staff draft Preliminary California Energy Demand Forecast 2012‐2022, released in August 2011, describes preliminary forecasts for electricity consumption, peak, annatural gas demand for California as a whole and for each major utility planning area withinthe state.12 The analysis characterizes the effects of economic and demographic trends, behavior, emerging technologies, state and federal policies, and California’s diverse climatic and geographic landscape on current and future energy needs. Staff used three preliminarydemand scenarios (high, mid, low). For natural gas, all three scenarios predict greater consumption in 20for electricity. The draft 2011 IEPR presents an overview of these preliminary findings and discusses the effects on future energy demand from economic conditions, self‐generation, and energy efficiency.
To support energy planning processes, the Energy Commission provides objective analysithe state’s electricity and natural gas infrastructure needs and related environmental issues. The draft 2011 IEPR outlines the status of assessments being conducted by the Energy Commissionand an interagency team related to thenvironments of the use of once‐through cooling (OTC) technologies in older power plants anthe difficulty in licensing new replacement generating capacity given the scarcity of emissionoffsets for new fossil power plants.
11 California Energy Commission, 2011 Natural Gas Market Assessment: Outlook, draft staff report, September 2011, http://www.energy.ca.gov/2011publications/CEC‐200‐2011‐012/CEC‐200‐2011‐012‐SD.pdf
12 Kavalec, Chris, Tom Gorin, Mark Ciminelli, Nicholas Fugate, Asish Gautum, and Glen Sharp, Preliminary California Energy Demand Forecast, 2012‐2022, California Energy Commission, CEC‐200‐2011‐011SD, available at: http://www.energy.ca.gov/2011publications/CEC‐200‐2011‐011/CEC‐200‐2011‐011‐SD.pdf.

26
ctric
he discusses how these uncertainties affect electricity planning by the state’s
um
re to nd
Renewable Fuel Standard (RFS). The draft 2011 IEPR provides an overview of key ndated clean transportation energy
raft the
re an expanded fueling infrastructure, and job creation. Early
roleum consumption and
The draft 2011 IEPR also discusses major uncertainties affecting estimates of the natural gas‐fired generation needed to support integration of variable energy resources and maintain system and local reliability. Uncertainties include demand growth (including future elevehicle penetration), potential retirement of generation units using OTC, renewable energydevelopment (especially renewable distributed generation), the need for dispatchable generation to provide ancillary services in support of renewable resource integration, the composition of new gas‐fired generation, and development of combined heat and power. Tdraft 2011 IEPR energy agencies and how to account for these in planning assumptions during the current planning cycle.
For the transportation sector, the Energy Commission has developed preliminary long‐term projections of California transportation energy demand to support its analysis of petrolereduction and efficiency measures, introduction and commercialization of alternative fuels, integration of energy use and land‐use planning, and transportation fuel infrastructure requirements. Projections describe what must be added to the state’s existing infrastructusupport increased petroleum imports and what must be built to support future renewable aalternative fuel demand. A key part of this analysis focuses on California’s progress and challenges in meeting state and federal mandates for reducing petroleum dependency andaddressing climate change – specifically, the state’s Low Carbon Fuel Standard (LCFS) and the federalfindings on issues the state must address if it is to meet magoals.
Alternative Fuel and Vehicle Development The development of innovative technologies is crucial for meeting California’s bioenergy and other clean energy goals. The Energy Commission’s Alternative and Renewable Fuel and Vehicle Technology Program, created by the Legislature in 2007, provides funding to develop and deploy alternative and renewable fuels and advanced transportation technologies to help attain the state’s climate change, petroleum reduction, and energy security policies. The d2011 IEPR provides a high‐level status report on funded projects and expected benefits, withfull evaluation (Benefits Report for the Alternative and Renewable Fuel and Vehicle Technology Program) to be released in 2012. Early findings show that program funding has led to moalternative fuel vehicles on the road,estimates also find that these projects will lead to reduced petdecreased GHG emissions by 2020.
Energy-Related Research and Development The Energy Commission’s Public Interest Energy Research (PIER) Program has been supportingresearch on and development of clean energy technologies since 1996.13 Through the PIER
13 Public Resources Code Section 25620.1.

27
ate
nding for search on January 1, 2012. As discussed earlier, the CPUC has opened a
PGC to fund research, development, and
s.
‐06 s
1 Bioenergy Action Plan rating progress; challenges that have affected ese challenges.
Program, the Energy Commission has developed and helped bring to market energy technologies that provide environmental benefits, greater system reliability, and lower system costs. The draft 2011 IEPR provides an overview of the program’s vital role in advancing electricity and natural gas technologies to market acceptance, and in funding projects that crejobs and attract investments to California. It also provides examples of PIER‐funded products and technologies that have greatly advanced California’s clean energy policy and economic goals. A major issue facing the PIER Program is the expiration of authority to collect fupublic interest energy reproceeding to evaluate continuation of thedemonstration efforts.
Progress on Bioenergy Goals California’s first Bioenergy Action Plan was published in 2006 to implement Executive Order S‐06‐06, which set goals for (1) producing a minimum of 20 percent of California’s biofuels within the state by 2010, 40 percent by 2020, and 75 percent by 2050; and (2) satisfying 20 percent of thestate’s Renewables Portfolio Standard targets with electricity generated from biomass resourceIn March 2011, the Energy Commission adopted the updated 2011 Bioenergy Action Plan, which provides an update on progress toward the state’s bioenergy goals.14 Executive Order S‐06also required the Energy Commission to report on progress toward the state’s bioenergy goalin the IEPR. The draft 2011 IEPR provides an overview of the 201including progress to date; objectives for acceleprogress; and recommendations to overcome th
California’s Nuclear Power Plants In 2010, nuclear power provided about 16 percent of California’s in‐state electricity generation and 11.1 percent of the entire California power mix. While California’s two nuclear plants are an important factor in maintaining California’s electricity reliability and meeting climate change goals, the state has significant concerns regarding nuclear waste transport, storage, and public safety issues relating to emergency situations. The draft 2011 IEPR describes new seismic and tsunami concerns in the wake of the March 2011 earthquake and tsunami in Japan that disabled the Fukushima Daiichi Nuclear Plant. It also provides the status of the utilities’ progress on safety recommendations outlined in the Energy Commission’s AB 1632 Report.15
14 2011 Bioenergy Action Plan, California Energy Commission, prepared for the Bioenergy Working Group, available at: http://www.energy.ca.gov/2011publications/CEC‐300‐2011‐001/CEC‐300‐2011‐001‐CTF.PDF.
15 California Energy Commission and MRW & Associates, Inc., An Assessment of California’s Nuclear Power Plants: AB 1632 Report, November 2008, http://www.energy.ca.gov/2008publications/CEC‐100‐2008‐009/CEC‐100‐2008‐009‐CMF.PDF.

28
CHAPTER 1: Renewable Electricity Status and Issues California has used renewable energy – energy from natural resources like sunlight, wind, rain, and the earth’s heat – to help meet its electricity needs for more than a century. Renewable electricity provides many economic and environmental benefits including local jobs in clean tech and construction industries; revenues from property and sales taxes; energy independence from using local energy sources and fuels rather than imported natural gas; reduced fossil‐fuel generation that has negative impacts on air and water quality; and reduced greenhouse gas emissions from the electricity sector to help meet state climate change goals. California has been a leader in expanding its consumption of renewable energy since the late 1970s when, under Governor Jerry Brown’s first administration, the California Public Utilities Commission ordered utilities to establish standard offers for buying electricity from alternative suppliers (“qualifying facilities”) at cost‐based rates, with the price equal to the buyer’s full avoided cost. By 1991, these standard contracts resulted in more than 11,000 megawatts (MW) of qualifying facilities on‐line in California, about half of which used renewable resources.
Now, Governor Brown is putting forth new and expanded targets. In his Clean Energy Jobs Plan, the Governor is emphasizing the importance of investing in renewable energy as a central element of rebuilding California’s economy. The Governor directed the Energy Commission to prepare a plan to “expedite permitting of the highest priority [renewable] generation and transmission projects” to support investments in renewable energy that will create new jobs and businesses, increase energy independence, and protect public health. In December 2011, the Energy Commission released the Renewable Power in California: Status and Issues report, which describes the current status of renewable development in California and identifies challenges to meeting the state’s renewable goals. This chapter summarizes that report and outlines high‐level strategies to be included in a comprehensive strategic plan for renewable energy in California that will be developed as part of the 2012 Integrated Energy Policy Report Update.
California’s Renewable Electricity Targets and Status In 2002, the California Legislature established the Renewables Portfolio Standard (RPS) to diversify the electricity system and reduce growing dependence on natural gas. At that time, the target was to increase the amount of renewable electricity in the state’s power mix to 20 percent by 2017, which was subsequently accelerated to 2010 by legislation passed in 2006. In 2011, the RPS was further revised and expanded to require that renewable electricity should equal an average of 20 percent of the total electricity sold to retail customers in California during the compliance period ending December 31, 2013, 25 percent by December 31, 2016, and 33 percent by December 31, 2020. To support these RPS targets, Governor Brown’s Clean Energy Jobs Plan calls for adding 20,000 MW of new renewable capacity by 2020, including 8,000 MW of large‐scale wind, solar, and geothermal as well as 12,000 MW of localized generation close to consumer loads and transmission and distribution lines.

29
California appears to be on track to achieve the 20 percent by 2013 RPS target, with nearly 16 percent of statewide retail sales coming from renewable generation in 2010.16 In‐state renewable generation represented about 75 percent of total renewable generation from more than 9,900 megawatts of renewable generating capacity (Table 1).
Table 1: In-State Renewable Capacity and Generation (2010)
Renewable Resource
Utility-Scale
Capacity (MW)
Wholesale Distributed Generation
Capacity (MW)
Distributed Generation
Capacity (MW)
Total Capacity
(MW)
Total Generation
(GWh)
Biomass 1,070 458 25 1,553 5,745Geothermal 2,521 127 0 2,648 12,740Small Hydro 315 989 0 1,304 4,441Solar 408 82 953 1,443 908Wind No data No data 8 3,027* 6,172Total 4,314 1,656 986 9,975 30,005* Includes 3,019 MW of utility scale and wholesale distributed generation wind capacity; based on California ISO data on wind projects located in the California ISO and the California Energy Commission’s “CEC-1304 QFER Database, California Power Plant Database.” http://energyalmanac.ca.gov/electricity/web_qfer/ for wind projects located outside the California ISO.
Source: California Energy Commission, Renewable Power in California: Status and Issues, December 2011.
For the 33 percent by 2020 target, Energy Commission staff estimates that the state will need renewable generation in the range of 35,300 gigawatt hours (GWh) to 47,000 GWh in addition to generation expected from existing facilities. Utility contracts signed and pending to date are expected to deliver enough energy to reach the upper bound of this range if most or all of the contracted renewables are built and generating by 2020 (Figure 1).
However, this estimate includes a number of short‐term contracts that may not be renewed, as well as existing facilities that may retire due to age or contract expiration, which could reduce the contribution from existing facilities. There is also risk of contract failure; data from the Energy Commission’s IOU contract database indicates that since the start of the RPS program, about 30 percent of long‐term RPS contracts (10 years or more) approved by the California Public Utilities Commission (CPUC) have been cancelled. The contract failure rate increases to about 40 percent if contracts that have been delayed are also considered, and, at the September 14, 2011, workshop on the draft Renewable Power in California: Status and Issues report, two utilities indicated that they currently assume a contract failure rate of 40 percent.17 This suggests
16 Depending on the source of data, total renewable generation figures vary between 15 and 16.5 percent of statewide retail sales from renewable generation in 2010. Renewable procurement and generation sources include: The Power Source Disclosure Program, CPUC RPS Compliance Filings, Energy Commission RPS Tracking, and the Energy Commission’s Total System Power.
17 Transcript of the September 14, 2011, Integrated Energy Policy Report workshop on the Draft Renewable Power in California: Status and Issues report, comments by Valerie Wynn, Pacific Gas and Electric
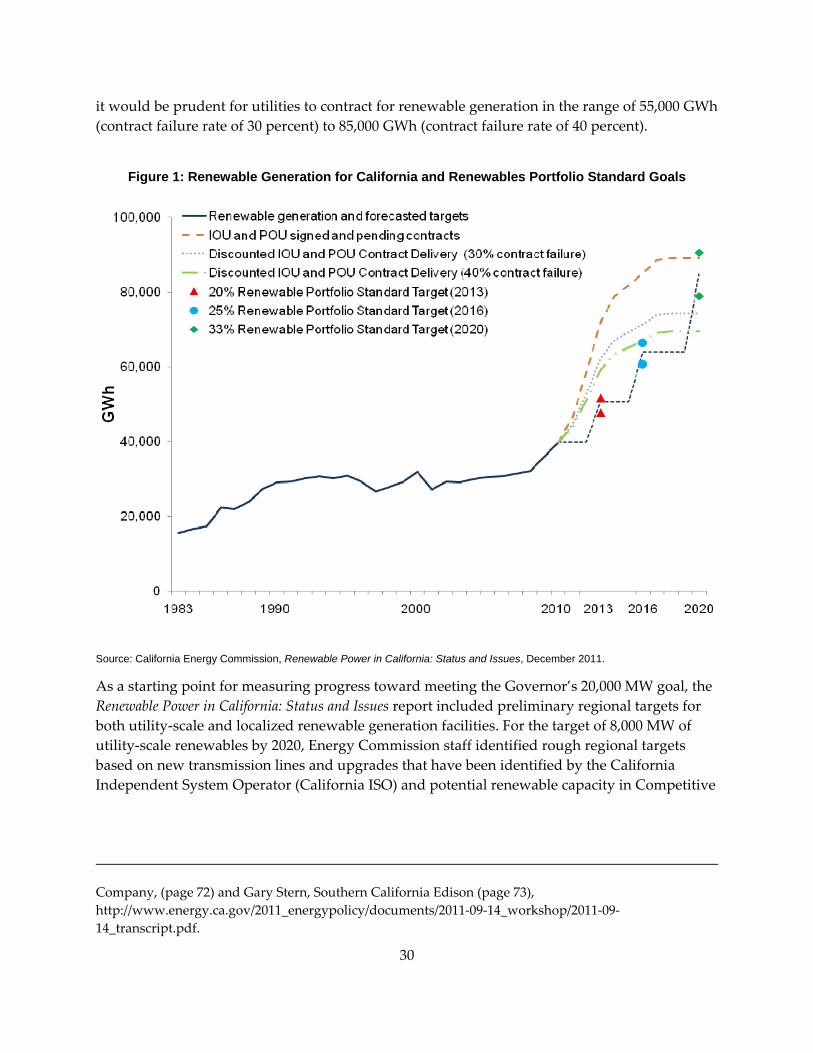
it would be prudent for utilities to contract for renewable generation in the range of 55,000 GWh (contract failure rate of 30 percent) to 85,000 GWh (contract failure rate of 40 percent).
Figure 1: Renewable Generation for California and Renewables Portfolio Standard Goals
Source: California Energy Commission, Renewable Power in California: Status and Issues, December 2011.
As a starting point for measuring progress toward meeting the Governor’s 20,000 MW goal, the Renewable Power in California: Status and Issues report included preliminary regional targets for both utility‐scale and localized renewable generation facilities. For the target of 8,000 MW of utility‐scale renewables by 2020, Energy Commission staff identified rough regional targets based on new transmission lines and upgrades that have been identified by the California Independent System Operator (California ISO) and potential renewable capacity in Competitive
Company, (page 72) and Gary Stern, Southern California Edison (page 73), http://www.energy.ca.gov/2011_energypolicy/documents/2011‐09‐14_workshop/2011‐09‐14_transcript.pdf.
30

31
Renewable Energy Zones (CREZ) identified through the Renewable Energy Transmission Initiative (RETI) that would be served by those lines and upgrades (Table 2).18
If these new lines and upgrades are permitted, built, and operating before 2020, they could allow generation from more than 16,000 MW of additional renewable capacity to flow across those lines. In 2010, state and local entities issued permits for roughly 9,000 MW of new renewable capacity, about 8,000 MW of which is associated with the new lines and upgrades. This indicates that another 8,000 MW of renewable capacity could be sited in the CREZ associated with these lines in the future.
Table 2: Preliminary Regional Targets for 8,000 Megawatts of New Renewable Capacity by 2020
Identified Transmission Line (s) CREZ Served
Total Additional Transmission Capacity with
New/Upgraded Lines (MW)
2010 Permitted Generating Capacity
Associated with New/Upgrades (MW)
Additional Transmission
Project Capacity (MW)
Sunrise Powerlink Imperial North and South, San Diego South
1,700 760 940
Tehachapi and Barren Ridge Renewable Transmission Projects
Tehachapi, Fairmont 5,500 2,810 2,690
Colorado River, West of Devers, and Path 42 Upgrade
Riverside East, Palm Springs, Imperial Valley
4,700 1,825 2,875
Eldorado-Ivanpah, Pisgah-Lugo, and Coolwater-Jasper-Lugo
Mountain Pass, Pisgah, Kramer 2,450 1,470 980
Borden-Gregg Westlands 800 145 655
South of Contra Costa Solano 535 155 380
Carrizo-Midway Carrizo South, Santa Barbara 900 800 100
TOTAL 8,620
Source: California Energy Commission, Renewable Power in California: Status and Issues, December 2011.
For the 12,000 MW target, Energy Commission staff developed preliminary regional targets for localized generation, defined as renewable distributed generation (DG) projects 20 MW and smaller that are interconnected to the distribution or transmission grid (Table 3). The analysis
tml.
18 RETI was initiated in 2007 as a joint effort among the CPUC, the Energy Commission, the California ISO, utilities, and other stakeholders. Primary goals were to identify transmission projects needed to accommodate California’s renewable energy goals; promote designation of corridors for future transmission line development; and make transmission and generation siting and permitting easier. The RETI process identified about 30 CREZs throughout the state most likely for cost‐effective and environmentally benign generation development with corresponding transmission interconnections and lines. Renewable Energy Transmission Initiative Phase 2B Report, April 2010, http://www.energy.ca.gov/reti/documents/index.h

32
was technology neutral and included solar, biomass, geothermal, wind, fuel cells using renewable fuel, and small hydropower. The analysis also assumed that renewable DG capacity installed since 2007 will count toward meeting the 12,000 MW goal. California currently has 2,642 MW of renewable DG capacity installed as of June 2011, and, if existing state programs to support renewable DG are fully successful, the state could add 5,400 MW of additional capacity in the next five to eight years. Given the trend of declining costs for solar photovoltaic (PV) technologies, the Energy Commission believes the focus should be on developing the “low‐hanging fruit” in the next few years. Meanwhile, the state should focus on reforming permitting and interconnection processes so that subsequent development of renewable DG installations can take advantage of cost reductions and improved regulatory structures in later years.
Table 3: Proposed Regional DG Targets by 2020
Region Behind the Meter (all technologies)
Wholesale Undefined (mix of behind the meter and wholesale)
Total
Central Coast 280 90 0 370
Central Valley 830 1590 0 2,420
East Bay 420 30 0 450
Imperial 50 90 0 140
Inland Empire 480 430 0 910
Los Angeles (city and county) 970 860 2170 4,000
North Bay 220 0 0 220
North Valley 120 50 0 170
Sacramento Region 410 170 220 800
San Diego 500 50 630 1,180
SF Peninsula 480 10 310 800
Sierras 30 40 0 70
Orange 420 10 40 470
Total 5,210 3,420 3,370 12,000Source: California Energy Commission, Renewable Power in California: Status and Issues, December 2011.
Post‐2020, additional investments in renewable generation may be needed to replace generation expected to decline over the course of the next decade, such as generation from expiring coal contracts. Generation from a number of these contracts, which currently represents about 10 percent of total generation serving California, is expected to decline by 61 percent between 2010 and 2020 due to constraints imposed by the Emission Performance Standard.19 Remaining coal
19 The Emission Performance Standard prohibits California utilities from renegotiating or signing new contracts for baseload generation that exceeds 1,100 lbs of Carbon Dioxide Equivalent (CO2e) emission per MWh. A number of contracts with coal generation facilities that exceed the Emission Performance Standard will expire within the decade and cannot be renewed with another long‐term contract.
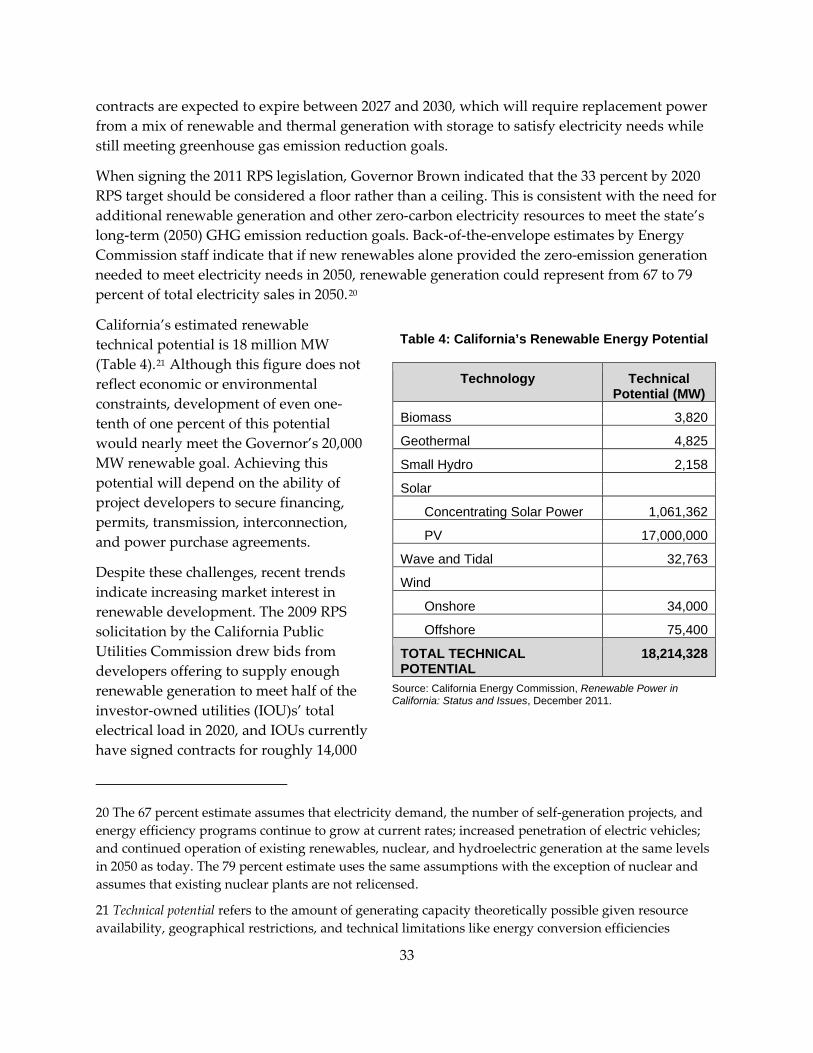
contracts are expected to expire between 2027 and 2030, which will require replacement power from a mix of renewable and thermal generation with storage to satisfy electricity needs while still meeting greenhouse gas emission reduction goals.
When signing the 2011 RPS legislation, Governor Brown indicated that the 33 percent by 2020 RPS target should be considered a floor rather than a ceiling. This is consistent with the need for additional renewable generation and other zero‐carbon electricity resources to meet the state’s long‐term (2050) GHG emission reduction goals. Back‐of‐the‐envelope estimates by Energy Commission staff indicate that if new renewables alone provided the zero‐emission generation needed to meet electricity needs in 2050, renewable generation could represent from 67 to 79 percent of total electricity sales in 2050.20
California’s estimated renewable technical potential is 18 million MW (Table 4).21 Although this figure does not reflect economic or environmental constraints, development of even one‐tenth of one percent of this potential would nearly meet the Governor’s 20,000 MW renewable goal. Achieving this potential will depend on the ability of project developers to secure financing, permits, transmission, interconnection, and power purchase agreements.
Table 4: California’s Renewable Energy Potential
Technology Technical Potential (MW)
Biomass 3,820
Geothermal 4,825
Small Hydro 2,158
Solar
Concentrating Solar Power 1,061,362
PV 17,000,000
Wave and Tidal 32,763Despite these challenges, recent trends indicate increasing market interest in renewable development. The 2009 RPS solicitation by the California Public Utilities Commission drew bids from developers offering to supply enough renewable generation to meet half of the investor‐owned utilities (IOU)s’ total electrical load in 2020, and IOUs currently have signed contracts for roughly 14,000
Wind
Onshore 34,000
Offshore 75,400
TOTAL TECHNICAL POTENTIAL
18,214,328
Source: California Energy Commission, Renewable Power in California: Status and Issues, December 2011.
20 The 67 percent estimate assumes that electricity demand, the number of self‐generation projects, and energy efficiency programs continue to grow at current rates; increased penetration of electric vehicles; and continued operation of existing renewables, nuclear, and hydroelectric generation at the same levels in 2050 as today. The 79 percent estimate uses the same assumptions with the exception of nuclear and assumes that existing nuclear plants are not relicensed.
21 Technical potential refers to the amount of generating capacity theoretically possible given resource availability, geographical restrictions, and technical limitations like energy conversion efficiencies
33

34
MW of new renewable capacity. In 2010, state and local entities issued permits for 9,435 MW of renewable capacity, and another 26,000 MW is being tracked in various permitting processes.22 The California ISO’s Interconnection Queue includes about 57,000 MW of renewable capacity, and there are 450 active interconnection requests for DG systems in the Wholesale Distribution Access Tariff queue totaling about 5,200 MW.
Issues Affecting Future Renewable Development in California The Renewable Power in California: Status and Issues report identified a variety of issues that will affect the amount of renewable capacity ultimately developed, including environmental, planning, and permitting; transmission; grid‐ and distribution‐level integration; investment and financing; cost; research and development (R&D); environmental justice; local government coordination; and workforce development. The report also discussed past and current efforts to address these challenges, which must be overcome to achieve California’s renewable energy targets and goals.
Planning and Permitting Issues For utility‐scale renewable plants, the primary planning and permitting challenges are environmental/ land use issues and fragmented and overlapping permitting processes. Renewable facilities can have a variety of environmental and land use impacts depending on location and technology. Because the majority of new renewable development is proposed in the California desert, the Renewable Power in California: Status and Issues report focused on desert environmental impacts. These include impacts on sensitive plant and animal species, water supplies and waterways, and cultural resources like areas of historical or ethnographic importance. There are also land use concerns because the majority of desert lands in California are owned by the federal government and managed for multiple uses, including recreation, wildlife habitat, livestock grazing, and open space.
In terms of the permitting process, a variety of federal, state, and local agencies have licensing authority for different types of utility‐scale renewable projects. This can lead to inconsistent environmental reviews and standards and variation in the extent of environmental evaluation, interpretation of results, and mitigation requirements. The result is that developers may have to satisfy more than one set of conditions, submit duplicate information, or face delays while agencies resolve their differences.
For renewable DG facilities, widely varying codes, standards, and fees among local governments with jurisdiction over these projects are a challenge for developers trying to meet permitting requirements. In addition, developers must get permit approvals from multiple local entities like fire departments, building and electric code officials, and local air districts, which can lead to duplication and inefficiency in the permitting process. Also, many local jurisdictions
22 California Energy Commission, see: http://www.energy.ca.gov/33by2020/documents/renewable_projects/Tracking_Report_for_Renewable_Projects.pdf.

do not have energy elements in their general plan or zoning ordinances to guide renewable development, and may only have environmental screening and review processes in place for large‐scale renewables, not DG projects.
The state’s Renewable Energy Action Team (REAT) is developing the Desert Renewable Energy Conservation Plan (DRECP) to help minimize environmental impacts of renewable projects in the desert.23 The DRECP’s role is to identify areas in the Mojave and Colorado Desert regions suitable for renewable energy project development and areas that will contribute to the conservation of sensitive species and natural communities. The DRECP encompasses roughly 22 million acres in Kern, Inyo, Los Angeles, San Bernardino, Riverside, San Diego, and Imperial counties (Figure 2). It will promote development of solar thermal, utility‐scale solar PV, wind, and other forms of renewable energy along with associated infrastructure like transmission lines.
35
Other efforts to improve permitting for utility‐scale and DG renewable projects include:
Figure 2: DRECP Area
Source: California Energy Commission, Renewable Power in California: Status and Issues, December 2011.
• The REAT published the multidisciplinary Best Management Practices and Guidance Manual: Desert Renewable Energy Projects in December 2010, which helps project developers design projects that minimize environmental impacts. 24
23 Executive Order S‐14‐08, November 2008, directs state agencies to create comprehensive plans to prioritize regional renewable projects based on renewable resource potential and protection of plant and animal habitat. The Energy Commission and the California Department of Fish and Game signed a memorandum of understanding formalizing a Renewable Energy Action Team to implement and track progress of this effort. See Desert Renewable Energy Conservation Plan website at http://www.drecp.org.
24 Renewable Energy Action Team, Best Management Practices and Guidance Manual: Desert Renewable Energy Projects, December 2010, http://www.drecp.org/documents/index.html.

36
• The Energy Commission’s Public Interest Energy Research (PIER) Program is funding research to help reduce the environmental impacts of renewable energy facilities, including strategies to diminish the effects of desert solar and wind projects on sensitive species. For more information about the role of the PIER Program, please see Chapter 11.
• The Energy Commission initiated an Order Instituting Informational Proceeding in December 2010 to evaluate lessons learned during the licensing of large‐scale renewable facilities in 2010 with the goal of identifying new and innovative approaches to future planning and permitting (see Chapter 5).
• The U.S. Department of Energy’s (U.S. DOE) Solar America Cities Program provided funding for cities that promote solar power and streamline interaction between local government and residents.
• The U.S. DOE’s SunShot Initiative provides funding to encourage cities and counties to streamline and digitize permitting processes and to develop innovative information technology systems, local zoning and building codes, and regulations.
• California’s Assembly Bill X1 13 (V. Manuel Perez, Bradford, and Skinner, Chapter 10, Statutes of 2011), passed in 2011, requires the Energy Commission to, upon appropriation, provide $7 million in grants to qualified counties for developing or revising rules and policies (including general plan elements, zoning ordinances, and a natural community conservation plan) to promote the development of eligible renewable energy resources.
• Many jurisdictions are supporting renewable DG by identifying permitting barriers, developing expedited permitting processes, offering online permits for solar PV systems, and offering permit fee waivers for solar and wind projects. The California County Planning Directors Association is also coordinating a multi‐stakeholder effort to draft a model ordinance for solar electric facilities for cities and counties across the state.
Transmission Issues The primary transmission issues identified in the Renewable Power in California: Status and Issues report are the need to ensure interconnection of renewable generation projects, particularly those receiving federal stimulus funding; the need for coordinated land use and transmission system planning; and better use of the existing grid.
There are 13 major transmission projects that are critical for interconnecting and delivering the renewable generation needed to meet California’s 33 percent by 2020 renewable mandate.25 Six projects are licensed or under construction, while the remaining seven do not yet have active licensing applications. Many of these projects are needed to interconnect renewable generation projects that received funding through the American Recovery and Reinvestment Act (ARRA),
tml
25 For a list of projects and detailed description of project status, see California Energy Commission, Renewable Power in California: Status and Issues, December 2011, http://www.energy.ca.gov/2011_energypolicy/documents/index.h .
37
which are essential to achieving the state’s renewable goals. In addition, the state needs to strengthen the north‐south 500 kV “backbone” system to address bottlenecks arising from Southern California desert renewable energy resource areas and Central and Northern California load centers.
The second transmission issue is the need to streamline and coordinate transmission planning processes to build the most appropriate transmission projects to connect renewable resources while ensuring proper land use and environmental considerations. Currently, identification of transmission routing issues and constraints does not begin until after the “wires” planning process is complete. This lengthens the transmission development process and increases the risk that approved projects will not be developed because of environmental issues. Stakeholders also identified the lack of transparent and consistent assumptions and processes used by transmission planning organizations as an issue that makes it difficult to participate effectively in planning processes.
The third transmission issue is how to make better use of the existing transmission grid. Currently, proposed projects are based on existing need as demonstrated by individual interconnection requests. Allowing projects to be upsized beyond what is needed could provide unused capacity for future use, maximizing the value of land associated with already necessary transmission investment and avoiding future costlier upgrades to accommodate additional renewable development. There is also need for additional research to identify technologies that can improve the performance of the existing transmission system.
RETI is a statewide land use planning process intended to improve transmission planning by identifying transmission projects needed to meet the state’s renewable energy goals. 26 RETI identified nearly 30 CREZs throughout the state most likely for cost‐effective and environmentally benign generation development with corresponding transmission interconnections and lines. This process led directly to the collaborative land use planning occurring in the DRECP, and energy agencies are working together to ensure integration of land‐use planning from the DRECP into the California ISO’s annual transmission planning process.
Other efforts to improve transmission planning include:
• The California Transmission Planning Group, formed in 2009, is working to address California’s transmission needs in a coordinated manner by developing a conceptual statewide transmission plan that identifies the necessary transmission infrastructure to meet the state’s 33 percent by 2020 RPS goal.
26 For more information about RETI, see: http://www.energy.ca.gov/reti/.

38
• The California ISO has revised its transmission planning process to include transmission upgrades needed to meet California’s policy mandates, with the 2010‐2011 Transmission Plan focusing on the RPS mandate in identifying policy‐driven transmission projects.
• The California ISO received a one‐time waiver from the Federal Energy Regulatory Commission to exempt upgrades associated with renewable projects receiving federal stimulus funding from further study in the 2010‐2011 transmission planning process to allow generators to meet the construction start date of December 31, 2010.
Efforts to promote better use of the existing transmission grid include:
• The DRECP has a goal to support consolidation of renewable development, including transmission infrastructure, rather than scattered “leapfrog” development.
• The PIER Program has funded a wide variety of projects related to improving the performance of the existing transmission system. These include research to increase the carrying capacity of existing lines, reduce instabilities that are causing some transmission connections to be operated thousands of MW below maximum capacity, and develop transmission cables that can be operated at higher temperatures and allow more power to be transferred over existing transmission rights‐of‐way.
Integration Issues Grid-level Integration Maintaining reliable operation of the electric system with high levels of intermittent resources will require regulation to follow real‐time ups and downs in generation output, voltage, or frequency caused by changes in generation or load; ramping generation from other units to follow potential up or down swings in wind or solar generation; spinning reserves27 to provide standby power as needed, and replacement power for outages. System operators will also need strategies to address potential overgeneration issues that occur when there is more generation than there is load to use it and to improve forecasting of wind and solar technologies so they know how much variability to plan for.
Complementary technologies like natural gas‐fired power plants, energy storage, and demand response provide various choices for flexible and rapid response for renewable integration. Natural gas units can provide quick startup, rapid ramping, regulation, spinning reserves, and energy when intermittent resources are not available. However, a challenge is the need to modify revenue streams to cover the incremental costs of shifting the use of these units from providing maximum energy production to providing flexible products, as well as potential environmental impacts from cycling these units more frequently.
df
27 Spinning reserve is the on‐line reserve capacity that is synchronized to the grid system and ready to meet electric demand within 10 minutes of a dispatch instruction by the California ISO. See: http://www.caiso.com/docs/2003/09/08/2003090815135425649.p .
39
Energy storage can provide a variety of integration services, but additional evaluation is needed about cost‐effectiveness, appropriate targets, and specific technologies to determine which can provide the rapid response and operational flexibility needed to provide regulation and load following.28 Demand response – having electricity customers reduce their consumption at critical times or in response to market prices – can also play an important role by providing short‐term load reductions and combining smaller loads to provide regulation or ramping through automatic controls that turn individual loads up or down as needed. Here, too, there is need for additional evaluation to determine how existing utility demand response programs might be used to provide renewable integration services.
Efforts to address grid‐level integration issues include:
• The California ISO is working to improve its forecasting techniques to reduce uncertainty and the amount of standby capacity that will be needed to compensate for variations between generation and load.
• Formal planning for adding cost‐effective energy storage to the electric system began with the passage of Assembly Bill 2514 (Skinner, Chapter 469, Statutes of 2010) which directed the CPUC and publicly owned utilities to evaluate the need for and benefits of cost‐effective and viable energy storage systems, and determine appropriate targets by October 2013.
• Demand response is being used throughout the United States for ancillary services, and the California ISO offers two demand response products that are laying the foundation for the role of demand response in renewable integration efforts. The California ISO is also scheduled to implement a regulation energy market in spring 2012 that will allow demand response and energy storage to submit bids to provide ancillary services.
• The CPUC is evaluating integration costs as part of its Long‐Term Procurement Plan proceeding for various scenarios.
• The Energy Commission’s PIER Program is funding a wide array of projects intended to develop better forecasting tools for wind and solar generation, develop and demonstrate energy storage technologies, identify ways that demand response can support renewable integration, and develop the smart grid of the future.
Distribution-Level Integration There are also issues with integrating large amounts of renewable DG into the distribution system, which brings power from substations to consumers. Much of today’s distribution system still uses designs, technologies, and strategies that were developed to meet the needs of
28 Load following is a utilityʹs practice of adding additional generation to available energy supplies to meet moment‐to‐moment demand in the distribution system served by the utility or keeping generating facilities informed of load requirements to insure that generators are producing neither too little nor too much energy to supply the utilityʹs customers. See: http://www.energyvortex.com/energydictionary/load_following.html.
40
mid‐20th century customers and move electricity in only one direction. The distribution system needs to be modernized and use technologies that easily allow for two‐way flow of electricity as well as improved communication technologies, better protection systems, uniform standards, cyber security measures, and inverter standards. There are also process challenges associated with the increasing number of requests for interconnection and the need to reduce the complexity, expense, and length of time associated with that process.
Efforts to improve distribution‐level integration include:
• In September 2011, the CPUC opened a proceeding on interconnection‐related issues to review rules and regulations governing interconnecting generation and storage resources to IOU distribution system.29
• California utilities are already modernizing their distribution systems by replacing equipment at the end of its useful life with new equipment that often has more advanced communication and functional capabilities. This modernization is likely to increase as a result of Senate Bill 17 (Padilla, Chapter 327, Statutes of 2009) which requires utilities to develop smart grid deployment plans.
• The CPUC has established the Renewable Distributed Energy Collaborative working group to help address interconnection issues.
• Fast‐track processes are available within each of the state’s interconnection processes to streamline interconnection of smaller projects, and utilities are providing information on their websites to help developers identify locations on the distribution grid where projects can be interconnected more quickly and at lower cost.
• The Energy Commission and the California ISO funded a study on renewable DG integration in Germany and Spain to identify strategies that can be applied to California’s system.30
• Research funded through the PIER Program is focused on predicting the impacts of DG on distribution circuits, and developing smart grid and battery storage technologies that can support integration at the distribution level.
Investment and Financing Issues The primary financing challenge identified in the Renewable Power in California: Status and Issues report was the need to ensure adequate financing at critical stages of renewable project development. In particular, there are funding gaps at the R&D and early commercial stages.
29 California Public Utilities Commission, see: http://docs.cpuc.ca.gov/PUBLISHED/FINAL_DECISION/144161.htm#P60_1197.
30 Karin Corfee, D. Korinek, C. Hewicker, M. Pereira Morgado, H. Ziegler, J. Zillmer and D. Hawkins, KEMA, Distributed Generation in Europe, California Energy Commission, Renewable Energy Office. Expected to be available December 2011.

41
Private companies are often reluctant to invest in R&D to accelerate clean energy innovation due to the higher price of clean energy technologies, knowledge spillover risks, technology and policy uncertainty, the scale and long time horizon of many clean energy projects, and lack of widespread enabling clean energy infrastructure. Although overall R&D investment in the United States has grown annually by 6 percent, investment in energy‐related research is about $1 billion less than a decade ago, with the private sector’s share of energy R&D investment declining from nearly half in the 80s and 90s to about 25 percent today. At the early commercial stage, firms have traditionally used private equity, debt, and tax equity markets to provide financing, but since the financial crisis these options are either impractical given economic conditions, depend on government incentives to function well, or do not provide sufficient returns for investors.
Efforts to address financing issues include:
• National government laboratories are performing cutting‐edge research on a variety of clean energy technologies, and the federal Advanced Research Projects Agency – Energy funds high‐risk, high reward technologies to bridge the gap between basic energy research and industrial application.
• Other federal government support mechanisms include tax incentives such as the business energy investment tax credit and the renewable production tax credit as well as accelerated depreciation of renewable energy assets and loan and bond financing programs.
• State incentives include programs to support renewable DG, including the California Solar Initiative (CSI), the Emerging Renewables Program (ERP), the New Solar Homes Partnership (NSHP), the Self‐Generation Incentive Program, and net energy metering, as well as sales and use tax exclusions under California’s Advanced Transportation and Alternative Sources Manufacturing Sales and Use Tax Exclusion Program. 31
• The PIER Program provided roughly $179 million for renewable energy research between 1997 and 2010, including seed funding for technology incubators that accelerate the growth and development of clean technologies.
• California’s Innovation Hub initiative leverages research parks, technology incubators, universities, and federal laboratories to provide an innovation platform for startup companies, economic development organizations, business groups, and venture capitalists.
• The CPUC’s Renewable Auction Mechanism streamlines the procurement process for developers, utilities, and regulators by allowing bidders to set their own price, providing a
ables/emerging_renewables/i.htm,
.
31 See: http://www.gosolarcalifornia.ca.gov/, http://www.energy.ca.gov/renewndex.html, http://www.cpuc.ca.gov/PUC/energy/DistGen/netmeteringand http://www.treasurer.ca.gov/caeatfa/sb71/index.asp

42
standard contract for each utility, and allowing projects to be submitted to the CPUC through an expedited regulatory review process.32
• Tools like feed‐in tariffs provide a relatively guaranteed revenue stream, reduce transaction costs, and help support low‐cost private financing. In February 2008, the CPUC made feed‐in tariffs available for the purchase of up to 480 MW of renewable generating capacity from small facilities (1.5 MW or less). Senate Bill 32 (Negrete McLeod, Chapter 328, Statutes of 2009) increased eligible project size to 3 MW, and Senate Bill X1 2 (Simitian, Kehoe, and Steinberg, Chapter 1, Statutes of 2011) made additional amendments including how the feed‐in tariff price would be determined. CPUC Rulemaking 11‐05‐005 is implementing these changes, with a CPUC staff proposal released in October 2011 for comments due in early November 2011.33
Funding for programs like the NSHP, the ERP, and the PIER Program, which help overcome financing challenges, expires at the end of 2011 and will be unfunded in the future if the Public Goods Charge or alternate source of funding is not reauthorized. The CPUC’s proposed ruling on November 15, 2011, keeps this funding in place on an interim basis until the CPUC concludes the second phase of the proceeding and makes a final decision.
Cost Issues Renewable technologies have a wide range of costs depending on the technology. Historically, technologies like solar thermal electric and solar PV were thought to have levelized costs greater than those of conventional generation. However, recent contract bids show that this is changing. According to the Energy Commission’s IOU contract database, the majority of solar thermal power tower technology contracts signed and pending are below the 2009 Market Price Referent (MPR), a proxy for the levelized cost of a new 500‐megawatt natural gas combined cycle. For utility‐scale renewable projects, the Energy Commission, California ISO, and CPUC are continuing to work together to evaluate transmission and renewable integration costs. While costs of both appear significant, they are certainly not insurmountable.
Renewable DG projects were once considered more costly due to higher transaction costs and lack of economies of scale. Now, standardization of contract terms and the way PV is manufactured and sold are reducing bids for DG systems, as shown by advice letters filed by Pacific Gas and Electric (PG&E) and Southern California Edison (SCE) with the CPUC stating that all contracts signed under their PV programs are also below the MPR. It is likely that there will be significant changes in the market in the next five to ten years as DG systems become more cost competitive. While distribution system upgrades and modernization could be significant depending on the location of DG projects and the pace at which they are deployed, there are a variety of efforts underway to identify optimal locations for such projects and develop the smart grid technologies needed to facilitate integration into the distribution system.
32 See: http://www.cpuc.ca.gov/PUC/energy/Renewables/hot/Renewable+Auction+Mechanism.htm.
33 See: http://www.cpuc.ca.gov/PUC/energy/Renewables/hot/sb2_1x.htm.

43
In any discussion of the costs of renewable technologies, it is important to recognize that renewables provide important benefits that have not been adequately quantified, such as the value of having a diverse portfolio of generating resources that reduces costs and risk to ratepayers, business and economic development benefits, reduced dependence on natural gas and vulnerability to natural gas supply shortages or price spikes, and reduced GHG emissions.
Research and Development Issues Continued public sector investment in energy‐related R&D is an important tool to help address many of the challenges facing California’s renewable industry. The Energy Commission’s PIER Program has funded a wide variety of research to identify ways to address the environmental impacts of renewable energy facilities; develop technologies to improve the performance of the state’s transmission and distribution systems; promote integration of renewable generating technologies at both the transmission and distribution level through the development of smart grid, energy storage, and demand response technologies; and reduce renewable technology costs while improving efficiency. With increasing levels of renewable resources in California’s electricity mix, continued research will be required in each of these areas to provide the technological advancements needed to support the state’s clean energy policy goals. Statutory collection of funding to support the PIER Program is slated to sunset at the end of 2011 without action by the state Legislature to reauthorize the state’s Public Goods Charge.
Environmental Justice Issues Environmental justice (EJ) is defined in California law as “the fair treatment of people of all races, cultures, and incomes with respect to the development, adoption, implementation, and enforcement of environmental laws, regulations, and policies.” The Energy Commission has considered EJ issues in its power plant licensing process since 1995, including reaching out to community members, identifying areas potentially affected by emissions or other environmental impacts, determining where there are significant populations of minority or low‐income residents in an area potentially affected by proposed projects, and determining whether there may be a disproportionate effect on minority or low‐income populations. However, EJ organizations have concerns about the types of power plants that will be built to meet increased electricity demand and replace aging power plants and plants that may retire as a result of the State Water Resources Control Board’s policy on the use of once‐through cooling in power plants, particularly in the southern part of the state which has some of the worst air quality in the nation. There are also concerns about the types of fossil generation that may be built to support renewable integration, including flexible natural gas turbines (“peakers”) that are less efficient than baseload resources and have increased emissions that may impact the communities in which they will be located.
EJ communities do see the value of renewable generating resources, particularly renewable DG such as rooftop PV, in their communities. Rooftop PV in urban environments can provide value to these communities by reducing the health and environmental impacts of fossil‐fueled power and increasing economic revitalization and creation of local green jobs. However, rooftop solar is not always accessible to these communities due to the high upfront cost of these systems. In addition, many residents of EJ communities live in multiunit residential rental properties whose

44
landlords may not see any benefits for allowing solar system construction, especially in situations where they are paying for the systems and additional wiring while tenants are receiving the benefits of reduced energy costs.
Efforts to help offset the costs of installing rooftop PV on affordable and low‐income housing include:
• The Energy Commission’s NSHP offers affordable housing projects higher incentives than standard market‐rate housing projects. Of the overall 400 MW goal for the entire NSHP program, 36 MW will be made available for new affordable housing during the 10‐year program.34 As already noted, this program relies on funding from the state’s Public Goods Charge. This funding will remain in place on an interim basis due to the CPUC’s November 15, 2011, proposed ruling.
• Under the California Solar Initiative, the CPUC has two programs, the Single‐Family Affordable Solar Homes Program and the Multifamily Affordable Solar Housing Program. The goals of these programs include improving energy use and the quality of affordable housing through use of solar and energy efficiency technologies and decreasing electricity use and costs without increasing monthly household expenses for residents. Programs provide solar incentives for qualifying affordable housing in the service territories of PG&E, SCE, and San Diego Gas & Electric.35
• The nonprofit Grid Alternatives Solar Affordable Housing Program provides training to install solar electric systems for low‐income homeowners.36 This program began in 2004 and as of August 2011 has installed 1,145 solar electric systems in partnership with low‐income families throughout California. These systems represent nearly 3 MW of generating capacity and are reducing each family’s electric bills by about 75 percent. Grid Alternatives has also trained nearly 7,000 community volunteers and job trainees on the theory and practice of solar electric installation.
• The “Solar for All California” program, implemented by the California Department of Community Services and Development using funding from the Low Income Home Energy Assistance Program.37 This program has a goal of installing 1,000 new PV systems on single‐ and multifamily low‐income homes throughout California by October 2011. As of October
34 Go Solar California website, http://www.gosolarcalifornia.ca.gov/affordable/nshp.php.
35 California Public Utilities Commission, CSI Single‐Family Affordable Solar Homes Program website, http://www.cpuc.ca.gov/PUC/energy/Solar/sash.htm, and CSI Multifamily Affordable Solar Housing Program website, see: http://www.cpuc.ca.gov/puc/energy/solar/mash.htm.
36 Grid Alternatives website, see: http://www.gridalternatives.org/impact‐numbers.
37 California Department of Community Services and Development, Solar For All California website, see: http://www.csd.ca.gov/AboutUs/Solar%20For%20All%20California.aspx.

45
2011, the program has installed 379 single‐family systems and has approved an additional 448 single‐family systems and nine projects that will benefit 660 multifamily units.
• The Los Angeles Department of Water and Power (LADWP) recently relaunched its Solar Incentive Program with applications accepted beginning September 1, 2011. As part of the program, LADWP staff has been asked to investigate more options for making solar affordable to low income customers with the goal of developing leasing options and other proposals for lower income households.38
Local Government Coordination Issues Renewable development at the local level will be an essential component of the state’s efforts to meet the goal of adding 12,000 MW of DG by 2020, which will be permitted at the local level. Local governments are closely involved in land use decisions, environmental review, and permitting for a wide range of renewable projects. Many local governments face constraints due to decreased staffing as a result of the economic downturn, limited expertise about renewable technologies, and lack of energy elements in their general plans and ordinances that could delay the processing of permits for renewable facilities, but many local jurisdictions are also showing strong leadership and innovation in promoting renewable energy development. The state needs to work closely with local governments to understand their needs and provide assistance where possible to help expedite the permitting and installation of renewable DG projects as well as renewable utility‐scale projects that are under local jurisdiction.
There are several initiatives underway to streamline and standardize permitting processes for renewable DG projects:
• Through its Solar America Communities program, the U.S DOE in 2007 selected 25 U.S. cities, six of which are in California, as “Solar America Cities.” 39 This unique federal‐local partnership initiative aims to identify barriers to greater adoption of solar technologies and develop solutions to those barriers.
• As part of the overall strategy to reduce barriers to the adoption of solar technologies and to stimulate market growth, DOE has funded the Solar America Board for Codes and Standards to improve building codes, utility interconnection procedures, and product standards, reliability, and safety.40
• The DOE’s $12.5 million “SunShot Initiative: Rooftop Solar Challenge” aims to reduce the administrative costs for PV systems.41 This is a national competition for local and regional
38 Los Angeles Department of Water and Power, “LADWP to Relaunch Solar Incentive Program with Revised Incentive Levels and Streamlined Customer Service,” press release, August 2, 2011, see: http://www.ladwpnews.com/go/doc/1475/1153343/.
39 For a list of the 25 Solar America Cities, see: http://solaramericacommunities.energy.gov/.
40 Solar America Board for Codes and Standards, see: www.solarabcs.org.
41 http://www.eere.energy.gov/solarchallenge/.

46
teams of government, utilities, installers, and others to “compete for funds to implement their plan to reduce administrative barriers to residential and small commercial solar PV installations by streamlining, standardizing, and digitizing administrative processes.”42
• The Energy Commission’s Energy Aware Planning Guide provides information for local governments to use in encouraging DG in their jurisdictions and suggests a wide variety of implementation strategies to promote DG projects.43
Workforce Development Issues As investment in the clean energy economy expands, there is increased need for a coordinated approach to workforce training that is closely aligned with labor demand. While growth in clean tech segments of the economy like wind, solar photovoltaics, and smart grid is creating demand for workers and there are a number of workforce training programs in place, the fragile economy has made employers hesitant about taking on more employees. This has resulted in low placement rates for some of these programs. In addition, expiration of federal stimulus funding for workforce development may make it difficult for community colleges, trade associations, and other training providers to continue their clean energy training curricula in the future.
Efforts to address workforce development challenges include:
• In 2010, a survey by the Center for Energy Efficiency and Renewable Technologies (CEERT) indicated that thousands of workers will be needed between 2010‐2015 to build power plants being proposed in Southern California, with hundreds of operations and maintenance jobs needed for the next 20‐30 years. CEERT also estimates that construction jobs to build 2,000 PV projects totaling 6,000 MW over a 10‐year period would create a monthly average of 10,400 jobs. 44
• The Clean Energy Workforce Training Program, the largest state‐sponsored green jobs training program in the nation, is training workers needed to operate large‐scale renewable power plants and install PV systems. The program also provides grants that will establish community college and other training programs as part of established curricula, which will provide the basis for long‐lasting and sustainable changes in clean energy workforce training in California.45
42 http://www1.eere.energy.gov/solar/pdfs/rooftop_solar_challenge.pdf.
43 California Energy Commission, Energy Aware Planning Guide, February 2011, http://www.energy.ca.gov/2009publications/CEC‐600‐2009‐013/CEC‐600‐2009‐013.PDF, Section C.2.2.
44 Center for Energy Efficiency and Renewable Technologies, presentation to Inter‐Solar North America, olar‐NA.pdf.
Workforce Training Program, ee: http://www.energy.ca.gov/cleanenergyjobs/.
July 12, 2011, http://www.ceert.org/PDFs/reports/110712_DG‐Jobs_CEERT_InterS
45 For more information on the Clean Energys

47
• The Clean Energy Workforce Training Program also has an interagency agreement with the Employment Training Panel which provided $4.5 million in grants for career advancement training. Grantees train incumbent workers in clean energy skills while also meeting a 90‐day employment retention period after the training is completed. The program is set to train nearly 3,000 incumbent workers.
• The Green Innovation Challenge Grant program is helping community college students in the Bay Area learn the skills to perform after‐market repairs and maintenance to electric and alternative fuel vehicles; helping the San Diego region to develop college‐level curriculum and certificates for workers in the biofuel industry; and helping to train PV solar installers, system designers, and marketing professionals.
• SBX1 1 (Steinberg, Chapter 2, Statutes of 2011) will provide up to $8 million in funding annually to the Superintendent of Public Instruction to implement and administer a grant program to fund clean energy partnership academies in public schools for grades 9‐12. The partnership academies, which serve primarily at‐risk students, will focus on preparing students for careers in energy and water conservation, renewable energy, pollution reduction, and similar technologies.
• The PIER Program invested $12 million in the California Partnership Academies’ Green/Clean Initiative to build clean energy career pathways for students in grades 10‐12. 46 This effort funded about 60 programs through the California Department of Education that integrated academic and career technical education, business partnerships, mentoring, and internships with a focus on green careers such as green buildings, sustainable design, and green engineering.
• The PIER Program provided cost‐share funding that helped leverage ARRA funding for the California State University, Sacramento, to develop a clean energy workforce curriculum for the electric power sector, specifically targeted toward training needed for jobs being created in smart grid applications. The PIER Program also sponsored research on the need for a National Center for the Clean Energy Workforce to provide a clearinghouse for information on best practices and technical assistance to translate this information into practical changes in workforce development strategies.
Public Leadership Issues California has the potential to develop renewable energy systems on state‐owned buildings, properties, and rights‐of‐way to help meet the state’s renewable energy goals, create green jobs, and reduce greenhouse gas emissions and other harmful air pollutants. These investments will also reduce energy costs in state buildings and create new revenue for state government through the lease of vacant or unused land. State leadership will also demonstrate the benefits
46 Funding for this effort was appropriated by Assembly Bill 519 (Budget Committee, Chapter 757, Statutes of 2008).

48
of renewable DG and help encourage larger‐scale deployment throughout the state and across the country.
A number of state agencies entered into a memorandum of understanding in December 2010 to promote the development of renewable energy projects on state properties. As part of that effort, the Energy Commission staff released a report in April 2011 that identified current development of renewable on state properties, barriers and solutions to future deployment, opportunities for further development, and recommended next steps. The Energy Commission is updating and finalizing this report with the intent of releasing it in late 2011.
Based on its inventory of state properties to identify opportunities for deployment of renewable DG systems, Energy Commission staff recommended a target of 2,500 megawatts of new renewable generating capacity on state properties by 2020.
Efforts underway by various state agencies that will contribute toward meeting these targets include:
• The Department of General Services (DGS) tracks energy use at state buildings to measure progress toward reducing energy consumption 20 percent by 2020 as called for by Executive Order S‐20‐04. DGS also released 3 requests for proposals to develop PV on state buildings, facilities, and university campuses. The first solicitation resulted in the installation of 4.25 MW, the second awarded power purchase agreements for 21 MW, and the third solicitation is expected to result in about 30 MW, for a total of about 55 MW.
• California Department of Transportation (Caltrans) is pursuing the installation of PV along the California highway system consistent with Governor Brown’s support of the California Solar Highway. One project in Santa Clara County is in development. Caltrans has also identified 70 state‐owned structures for installation of PV panels; 55 of those facilities are generating energy with the remainder expected to be producing energy by the end of fiscal year 2011‐2012.
• The Department of Water Resources (DWR) is evaluating several renewable energy projects, including developing small hydro generation in the State Water Project and assessing feasibility for a test project for in‐aqueduct hydrokinetic generation. DWR is also negotiating with the University of California on a PV demonstration project along the California aqueduct and next to one of its pumping plants, and is negotiating a power purchase agreement for wind energy with an annual output of almost 144 GWh.
• California’s fairgrounds have installed solar PV at 26 of the 74 state fairgrounds ranging in size from 41 kW to 1 MW, with a total installed capacity of 6.5 MW.
• The Department of Forestry and Fire Protection will continue to explore the feasibility of biomass facilities at conservation camps.
• The Department of Corrections and Rehabilitation (CDCR) has two operational 1 MW PV ground‐mounted solar arrays at state prisons with contracts to expand to nearly 9 MW. CDCR also has power purchase agreements for 3 additional sites, for a total of 21.5 MW at

49
five sites, and is reviewing proposals for an additional 14 locations. CDCR’s next solar effort will include sites that can be considered for wholesale generation, combined with providing on‐site power to the prisons for systems ranging from 1 to 20 MW. CDCR is also implementing roof‐mounted PV for several new building construction projects as well as a request for information for wind resource opportunities.
• The State Lands Commission manages thousands of acres of “school lands” as a revenue source for the State Teachers’ Retirement System. Unlike the other agencies, the State Lands Commission is focusing on utility‐scale development rather than DG. It has approved leases for renewable energy projects on these lands and is considering applications for new projects.
• As part of its effort to reduce greenhouse gas emission levels to year 2000 levels by 2014 and 1990 levels by 2020, the University of California has set aggressive energy efficiency targets, and has made substantial investments in combined heat and power plants. As of September 2011, the University of California had 8.4 MW of onsite PV installed or under construction, and an additional 6.2 MW of biogas‐powered generation.
Recommendations Building on the Energy Commission’s study, numerous public workshops, and the input of stakeholders from various communities and industries throughout California, the Energy Commission proposes five overarching strategies to guide the state as it works toward achieving the 33 percent RPS mandate, the 12,000 MW DG goal, and promoting economic recovery and job creation through investments in the clean energy sector:
1. Identify and prioritize geographic areas in the state for both renewable utility‐scale and distributed generation development. Priority areas should have high levels of renewable resources, be located where development will have the least environmental impact, and be close to planned, existing, or approved transmission or distribution infrastructure. Prioritization should also include increasing efforts between state and local agencies to coordinate local land‐use planning and zoning decisions that promote the siting and permitting of renewable energy‐related infrastructure.
2. Evaluate the cost of renewable energy projects beyond technology costs – including costs associated with integration, permitting, and interconnection – and their impact on retail electricity rates. This evaluation shall be coupled with a value assessment that could potentially lead to monetizing the various system and non‐energy benefits attributable to renewable resources and technologies, particularly those benefits that enhance grid stability and reduce environmental and public health costs.
3. Develop a strategy that minimizes interconnection costs and time, and also minimizes integration costs and requirements at the distribution level (such as use of remote telemetry and other smart grid technologies) and the transmission level (such as improved forecasting, the development of an energy imbalance market, and procurement of dispatchable renewable generation), and that strives for cost reductions
50
and improvements to integration technologies, including storage, demand response, and the best use of the state’s existing natural gas‐fired power plant fleet.
4. Promote incentives for renewable technologies and development projects that create in‐state jobs and support in‐state industries, including manufacturing and construction. In implementing this strategy, the state should evaluate how current renewable energy policies and programs are affecting in‐state job growth and economic activity and identify which renewable technologies rely on supply chains that provide the best opportunities for California businesses.
5. Promote and coordinate existing state and federal financing and incentive programs for critical stages including research, development, and demonstration; precommercialization; and deployment. In particular, the state should maximize the use of federal cash grants and loan guarantee programs by prioritizing the permitting and interconnection of California‐based renewable energy projects (and their associated transmission or distribution infrastructure) vying for federal stimulus funds.
Detailed implementation strategies and action items will be developed in the upcoming 2012 Integrated Energy Policy Report Update proceeding to provide further guidance on specific activities in which various state and local entities can engage to successfully carry out these high‐level strategies in the near, medium, and long term.

51
CHAPTER 2: Achieving Cost-Effective Energy Efficiency for California: Assembly Bill 2021 Progress Report This chapter summarizes the Energy Commission staff report Achieving Cost‐Effective Energy Efficiency for California 2011–2020 including key points from the report, progress on utilities’ energy efficiency savings and measurement and verification efforts, and policy recommendations.47
California has demonstrated a strong commitment to cost‐effective energy efficiency for the last 30 years with the adoption of progressive policies, programs, and activities. In 2003, the state’s first Energy Action Plan established the state’s loading order, calling for electricity needs to be met first with increased energy efficiency and demand response. Assembly Bill 32 made customer‐side energy efficiency a key strategy for reducing greenhouse gas emissions to 1990 levels by 2020.
In 2005, Senate Bill (SB) 1037 (Kehoe, Chapter 366, Statutes of 2005) made energy efficiency a priority strategy for electric utilities to meet their resource needs. SB 1037 requires the California Public Utilities Commission (CPUC) and the Energy Commission to identify potentially achievable cost‐effective electric and natural gas energy efficiency savings and set goals for investor‐owned utilities (IOUs) to achieve this potential.48 Both agencies must review the procurement plans to ensure the consideration of energy efficiency and other cost‐effective supply options. In addition, SB 1037 requires all publicly owned utilities, regardless of size, to report annually to their customers and to the Energy Commission investments in energy efficiency programs.
Assembly Bill (AB) 2021 (Levine, Chapter 734, Statutes of 2006) added more specific legal directions for increasing California’s energy efficiency programs. AB 2021 requires each publicly owned utility to:
• Beginning in 2007 and every three years thereafter, identify all potentially achievable cost‐effective electricity energy savings. Using the efficiency potential estimates, establish annual targets for energy efficiency savings for the next 10‐year period.
• Report on program cost‐effectiveness and third‐party energy evaluation, measurement, and verification (EM&V) of program savings.
47 California Energy Commission, 2009 AB 2021 Progress Report: Achieving Cost‐Effective Energy Efficiency for California, December 2010, http://www.energy.ca.gov/2010publications/CEC‐200‐2010‐006/CEC‐200‐2010‐006.PDF.
48 The terms for energy efficiency “targets” and “goals” are used interchangeably. There is an established convention (at least since 2004) that the CPUC and IOUs use the term “goals.” PUBLICLY OWNED UTILITIESs have adopted the term “targets” since that is the term used in AB 2021.

52
AB 2021 directs the Energy Commission to:
• Include a summary of the publicly owned utilities’ savings and evaluation, measurement, and verification (EM&V) studies in the Integrated Energy Policy Report (IEPR).
• In consultation with the CPUC as the regulator of IOUs energy efficiency programs, provide a triennial statewide estimate of energy efficiency potential and targets for a 10‐year period.
• Provide recommendations to publicly owned utilities, Legislature, and the Governor of possible improvements by the publicly owned utilities.
In response to AB 2021, the Energy Commission released the fifth annual staff report, Achieving Cost‐Effective Energy Efficiency for California 2011–2020 (2011 AB 2021 Progress Report), on August 28, 2011. The following section provides an overall summary of the utilities’ progress on energy efficiency program savings, EM&V reporting, and a more detailed description of setting energy efficiency targets, followed by recommendations for improvement of these efforts.
Staff Assessment of Utilities’ Progress Investor-Owned Utilities’ Progress The IOUs administer efficiency programs under the CPUC’s Decision 09‐09‐047, which approved the IOUs’ efficiency program portfolios for 2010–2012 with a total budget of $3.1 billion. The combined IOUs reported 4,607 gigawatt hours (GWh) of annual energy savings, 837 megawatts (MW) of peak savings, and 46 million therms of natural gas savings in 2010, which exceeded their 2010 CPUC‐mandated goals. The 2010 natural gas savings fell just a bit short of the CPUC’s natural gas goals for 2010.
The 2010 IOU savings numbers are still ex ante savings, that is, self‐reported savings that have not been verified by third‐party evaluators. Beginning with the 2006‐2008 program implementation cycle, the CPUC instituted a more comprehensive process for capturing, retaining, and reporting ex post evaluation results. However, the CPUC’s 2006‐2008 (plus 2009) EM&V results, which show a significant difference between reported and evaluated savings for this period, have proven to be controversial and remain in dispute. The IOUs reported achieving 151 percent of their energy savings goals during 2009; however, the evaluation report indicated that the utilities achieved 140 percent of their goals for that period.
A new CPUC Potential and Goals Study for efficiency is underway, expected to be complete in late summer 2012. The results of this study will be incorporated into the next AB 2021 report to be released in 2014.
Publicly Owned Utilities’ Progress In 2010, all publicly owned utilities combined spent a total of $123 million on energy efficiency programs, a 15 percent decrease from 2009 and the first drop in energy efficiency program spending since 2006 (Table 5). Likewise, both energy and peak savings declined for the publicly owned utilities for the first time since 2006. In 2010, the 39 reporting publicly owned utilities provided 523 GWh of electric energy savings, a decrease of 19 percent from 2009. The publicly owned utilities achieved 74 percent of their 2010 energy savings target set in 2007. The decline
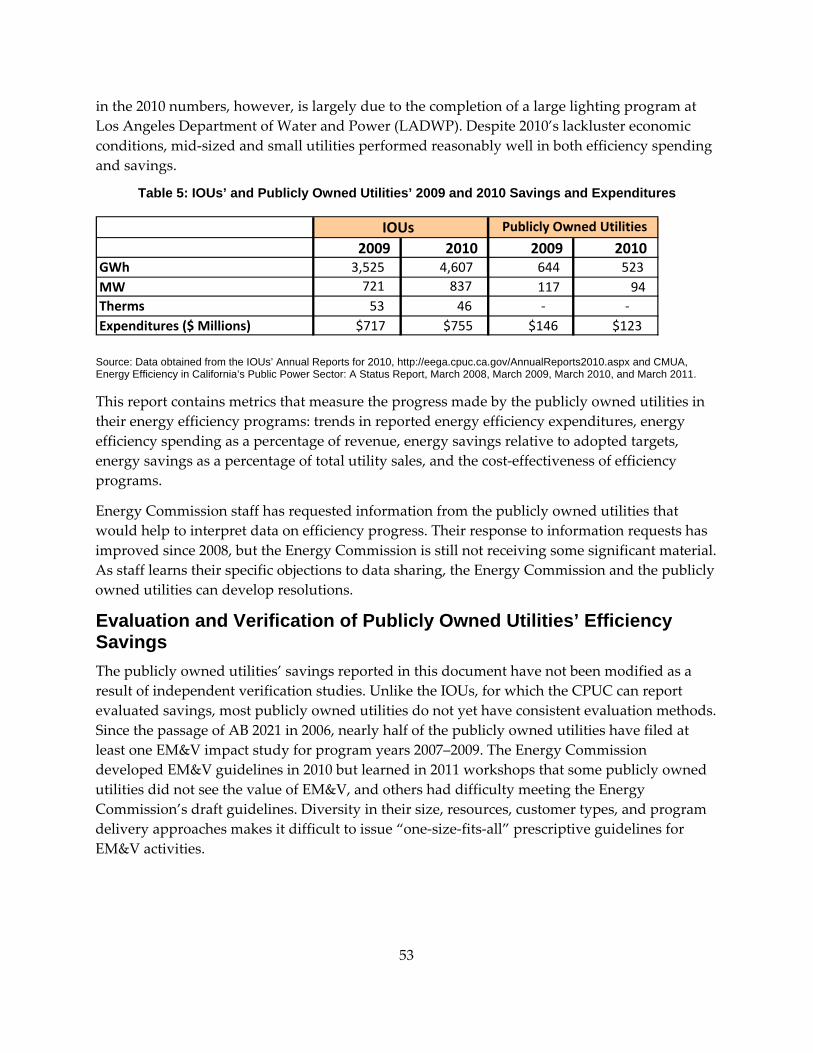
in the 2010 numbers, however, is largely due to the completion of a large lighting program at Los Angeles Department of Water and Power (LADWP). Despite 2010’s lackluster economic conditions, mid‐sized and small utilities performed reasonably well in both efficiency spending and savings.
Table 5: IOUs’ and Publicly Owned Utilities’ 2009 and 2010 Savings and Expenditures
2009 2010 2009 2010 GWh 3,525 4,607 644 523MW 721 8 37 117 9 4 Therms 53 4 6 ‐ ‐ Expenditures ($ Millions) $717 $755 $146 $123
IOUs Publicly Owned Utilities
Source: Data obtained from the IOUs’ Annual Reports for 2010, http://eega.cpuc.ca.gov/AnnualReports2010.aspx and CMUA, Energy Efficiency in California’s Public Power Sector: A Status Report, March 2008, March 2009, March 2010, and March 2011.
This report contains metrics that measure the progress made by the publicly owned utilities in their energy efficiency programs: trends in reported energy efficiency expenditures, energy efficiency spending as a percentage of revenue, energy savings relative to adopted targets, energy savings as a percentage of total utility sales, and the cost‐effectiveness of efficiency programs.
Energy Commission staff has requested information from the publicly owned utilities that would help to interpret data on efficiency progress. Their response to information requests has improved since 2008, but the Energy Commission is still not receiving some significant material. As staff learns their specific objections to data sharing, the Energy Commission and the publicly owned utilities can develop resolutions.
Evaluation and Verification of Publicly Owned Utilities’ Efficiency Savings The publicly owned utilities’ savings reported in this document have not been modified as a result of independent verification studies. Unlike the IOUs, for which the CPUC can report evaluated savings, most publicly owned utilities do not yet have consistent evaluation methods. Since the passage of AB 2021 in 2006, nearly half of the publicly owned utilities have filed at least one EM&V impact study for program years 2007–2009. The Energy Commission developed EM&V guidelines in 2010 but learned in 2011 workshops that some publicly owned utilities did not see the value of EM&V, and others had difficulty meeting the Energy Commission’s draft guidelines. Diversity in their size, resources, customer types, and program delivery approaches makes it difficult to issue “one‐size‐fits‐all” prescriptive guidelines for EM&V activities.
53

54
Status of Statewide Estimate of Energy Efficiency Potential and Targets for 2011-2020 AB 2021 requires publicly owned utilities to develop estimates of energy efficiency potential and targets on a triennial basis. Due to the unavailability of certain data, the Energy Commission could not set the statewide efficiency estimates for all utilities with the method directed in AB 2021. After the passage of AB 2021, the Energy Commission coordinated 10‐year savings targets in December 2007 for both the IOUs and publicly owned utilities. In 2007, all the utilities had a recent potential study and set of approved targets and goals from which to develop the statewide savings potential estimate. In 2010–2011, however, the IOUs did not have revised potential estimates and goals available, Sacramento Municipal Utility District (SMUD) did not have a revised potential study, and LADWP did not have revised savings potential or targets. As a result, the 2011–2020 efficiency target includes 32 percent of all publicly owned utilities’ savings and 6 percent of all California’s utility savings.49 While this estimate includes the substantial majority of the publicly owned utilities, it does not represent the largest contributors to California’s utility energy savings.50
The California Municipal Utilities Association (CMUA) coordinated 36 medium‐sized and small utilities that used the California Energy Efficiency Resource Assessment Model to develop technical, economic, and market‐level savings potentials. Taken together, SB 1037 and AB 2021 require targets to be cost‐effective, feasible, and reliable. Target criteria were developed for these attributes and used in this evaluation. Methodological criteria were developed and used in the evaluation of the models and inputs.
Technical efficiency potential represents the complete penetration of efficiency measures where they are technically feasible. The estimate of technical energy savings potential is 10,693 GWh from 2011‐2020. This estimate represents 33 percent of base energy consumption in 2020 and is 96 percent higher than the 2007 estimate of technical potential estimated for the decade 2007‐2016 (Table 6). Economic efficiency potential is that percentage of technical potential that is cost‐effective. The economic savings potential estimated for the publicly owned utilities in the 2010 study is 9,525 GWh for 2011–2020, or 29 percent of base energy consumption. This estimate of economic potential is 136 percent higher than the 2007 estimate of economic potential for the decade 2007–2016.
The most significant level of efficiency potential is market savings potential, which is the percentage of economic potential that results when program designs, customer preferences, and market conditions are assessed. With a few exceptions, the publicly owned utilities used the
49 This is based on 2009 data from Achieving All Cost‐Effective Energy Efficiency for California: An AB 2021 Progress Report, December 2010, CEC‐200‐2010‐006, available at: http://www.energy.ca.gov/2010publications/CEC‐200‐2010‐006/CEC‐200‐2010‐006.PDF.
50 LADWP is working on a potential and target study with Global Energy Partners; its original due date was during fall 2010. SMUD does not have current plans to revise its efficiency potential estimate.

55
market potential as their revised targets for 2011–2020. For the 36 utilities, the market potential was 23 percent of their economic potential. In the initial target setting in 2007, these same utilities derived targets (that is, market potential) that were roughly 50 percent of their economic potential. In general, while the 2010 estimate of technical and economic potential differed greatly from the levels developed in 2007, the targets derived by the utilities, and approved by their governing boards, were very similar.
Table 6: Estimated Potentials for Publicly Owned Utilities (Excluding SMUD and LADWP)
Energy Potential – GWh Demand Potential – MW Technical Economic Market Technical Economic Market Current Analysis (2010), 2011-2020 10,693 9,525 2,143 2,861 2,283 526
Previous Analysis (2007), 2007-2016 5,460 4,038 2,109 732 507 302
Note: Excludes LADWP and SMUD.
Source: KEMA, Inc., POUs’ Revised Energy Efficiency Potential and Targets, July 2010, CEC-200-2008-007-SF, May 2011.
While the forecasts of some individual utilities achieve 10 percent savings over 10 years, the combined publicly owned utilities’ targets do not meet the AB 2021 consumption reduction goal, reaching 6.8 percent savings from forecasted 2020 base energy use. Only 3 of the 36 publicly owned utilities individually meet the 10‐year goal, with 2 others falling only slightly short.
For most utilities, market savings potentials were calculated using a 50 percent customer measure incentive level. Additional modeling indicated that when a 75 percent incentive level is used, nearly all utilities meet the 10 percent consumption reduction goal. This indicates that the publicly owned utilities can meet the consumption reduction goal of AB 2021 but may require a higher level of program effort and budget than most of them factored into their targets.
Recommendations Information Requested to Interpret Efficiency Progress • The most important data needed by staff to evaluate annual savings is the E3 Reporting
Tool, which calculates savings potential for each publicly owned utility based on specific assumptions. In 2011, the publicly owned utilities stated that the reason for withholding the data tool was to protect customer identities. The Energy Commission is not interested in individual customers and is willing to accommodate an aggregation or redaction adjustment of the E3 Tool.
• The Energy Commission requests data by March 2012 on utility energy efficiency expenditures with other uses of Public Goods Charge (PGC) funding: low‐income, research and development, and renewable energy projects.
• Staff requests that publicly owned utilities provide information by March 2012 on the role of energy efficiency in integrated resource planning in 2009. The 2009 and 2010 CMUA Status Reports identified utilities that were allocating funds to efficiency programs beyond their

56
PGC funding, but there is no indication that this allocation results from an integrated resource assessment. While some publicly owned utilities have performed recent integrated resource assessments, they usually treat efficiency as a load adjustment, not an equally comparable supply resource.51
Publicly Owned Utility Efficiency Evaluation, Measurement, and Verification • The publicly owned utilities should continue with their current plans for 2011 EM&V
studies, especially the Southern California utilities that are working on their first EM&V studies since 2007. The Energy Commission is especially interested in working through the impact study process with LADWP staff because of the magnitude of their savings.
• The Energy Commission will engage with publicly owned utilities to develop versions of revised EM&V guidance documents, tools, and services appropriate for the three groups. These groups are stratified by these criteria: magnitude of savings, capacity to perform and manage EM&V studies, and program need for specific evaluation information. The Energy Commission will sponsor two EM&V workshops each year to increase agency and publicly owned utilities’ understanding of practical EM&V; the next workshops will occur in 2012.
Publicly Owned Utility Potential Estimates and Target Process in 2010–2011 • IOU goals will not be revised or approved until 2012.52 The Energy Commission is
coordinating with the CPUC post‐2013 potential and goals process. The goal of both agencies is to better align the efficiency planning process of the IOUs and publicly owned utilities. The Energy Commission should identify these AB 2021 schedule issues, discuss them with the utilities and CPUC, and, if necessary, recommend an adjustment to the triennial deadline for statewide potential estimates and targets.
• While AB 2021 required all publicly owned utilities to submit revised efficiency potential estimates and targets by June 1, 2010, neither SMUD nor LADWP was in full compliance by that date. In the future, revisions of potential and targets should anticipate AB 2021 deadlines.
• Estimates of technical savings potential for the publicly owned utilities in 2010 were substantially greater than those of 2007. The model used by the publicly owned utilities’ consultant (Navigant) for estimating potential in 2010 was different from the model used by their 2007 consultant (Rocky Mountain Institute). There must be some continuity in method from one revision to the next to make sense of changes in potential estimates. If publicly owned utilities do not use the California Energy Efficiency Resource Assessment Model in the next potential study cycle, they should provide an accounting of method and data changes from one triennial revision to the next to maintain transparency in the process.
f.
f
51 See public utility websites for their integrated resource plans; for example, LADWP’s is at: http://www.ladwp.com/ladwp/cms/ladwp014239.pd
52 Scope and schedule for the revised IOUs’ post‐2013 efficiency potential study and goals is available at: http://www.iepec.org/CPUC%20RPF%20021511.pd .
57
• The Energy Commission requires more documentation from the publicly owned utilities to understand the assumptions behind the potential estimates and energy efficiency targets adopted. Utilities should provide the Energy Commission with the version of the model that they used to calculate targets. The publicly owned utilities should document the ways in which they customized the model and the reasons for the customization.
• The analysis of energy efficiency potential and adopted targets clearly showed that some publicly owned utilities were more aggressive in pursuing energy efficiency than others to meet their load. The efficiency potential analysis showed that, for most utilities, providing higher customer incentives (of at least 75 percent) would achieve an important goal of AB 2021 by increasing savings sufficiently to reduce energy consumption by 10 percent in 2020.

58
CHAPTER 3: Achieving Energy Savings in California Buildings This chapter summarizes the Energy Commission staff report Achieving Energy Savings in California Buildings: Saving Energy in Existing Buildings and Achieving a Zero‐Net‐Energy Future.53 The overview contains key points from the report, including background, strategies, and challenges in achieving the state’s energy efficiency and climate change goals, and recommendations to help accelerate progress.
California has a long history of leadership in delivering the economic, environmental and energy system reliability benefits that derive from its energy efficiency standards and programs. Expansion and acceleration of energy efficiency initiatives are at the forefront of the state’s energy policy goals and mandates. The state’s ongoing efforts to achieve all cost‐effective energy efficiency in buildings are pivotal for achieving the state’s goals for job creation, economic development, and environmental protection:
• The Energy Action Plan has guided California energy policy since the California Energy Crisis of 2000‐2001 and is designed to improve energy system reliability and manage costs. The plan established the principle of following the “loading order” for new generation resources, directing that growth in energy needs must be met first by cost‐effective energy efficiency improvements.
• The Global Warming Solutions Act (Assembly Bill 32 [Núñez, Chapter 488, Statutes of 2006]) has been the foundation of California’s efforts over the past five years to address climate change by reducing greenhouse gas (GHG) emissions to the state’s 1990 level by 2020. The adopted AB 32 Scoping Plan recommended expanding and strengthening building and appliance standards and energy efficiency programs aimed at existing buildings. 54 The Energy Commission’s 2007 Integrated Energy Policy Report concluded that climate change is the most important environmental and economic challenge of the century; GHG emissions are the largest contributors to global warming; and California’s ability to slow the rate of GHG emissions depends first on energy efficiency.
• California’s Clean Energy Future (CCEF) Initiative is a collaborative effort of the state’s energy and environmental agencies and the California ISO to advance carbon‐cutting innovation and green job creation. It articulates the importance of new investments in
f.
53 California Energy Commission, Achieving Energy Savings in California Buildings: Saving Energy in Existing Buildings and Achieving a Zero‐Net‐Energy Future, July 2011, CEC‐400‐2011‐007‐SD, available at: http://www.energy.ca.gov/2011publications/CEC‐400‐2011‐007/CEC‐400‐2011‐007‐SD.pd
54 California Air Resources Board, Climate Change Scoping Plan: A Framework for Change, December 2008, page 16.

59
energy efficiency, as well as in electricity transmission, smart grid applications, and increased use of renewable resources.55
• Governor Brown’s Clean Energy Jobs Plan (2010)56 advocates focusing on renewable energy and energy efficiency technologies to achieve California’s economic recovery and growth goals, creating more than half a million green jobs. In the area of building efficiency, the plan calls for:
o Adopting stronger appliance standards for lighting, consumer electronics, and other products.
o Creating new efficiency standards for new buildings.
o Adopting a plan and timeline for achieving “zero net energy” homes and businesses through the building standards by integrating high levels of energy efficiency with onsite renewable electricity generation.
o Increasing public education and enforcement efforts so that the gains promised by California’s efficiency standards are realized.
o Making existing buildings more efficient, especially the half of California homes that were built before the advent of modern building standards.
o Providing energy performance information to commercial investors and homebuyers by requiring disclosure prior to the purchase of the building or home.
To respond to these policy expectations, the Energy Commission and other agencies are collaborating on strategies to achieve extensive energy savings in newly constructed and existing buildings, benefiting all Californians by reducing energy costs and the environmental and climate impacts of buildings.
Goals and Strategies for Newly Constructed Buildings Zero Net Energy Buildings The Energy Commission, California Air Resources Board (ARB), and the California Public Utilities Commission (CPUC) have adopted the policy goal, consistent with existing statutory authority, to achieve zero net energy (ZNE) building standards by 2020 for residential buildings and 2030 for commercial buildings through the 2008 Energy Action Plan, 2007 IEPR, and the 2008 California Long‐Term Energy Efficiency Strategic Plan. The CCEF initiative and Governor Brown’s Clean Energy Jobs Plan also identify ZNE as a priority goal.
55 The California Air Resources Board, California Public Utilities Commission, the Energy Commission, and California Environmental Protection Agency are partnering with the California ISO to ensure Californiaʹs continued leadership in clean technology over the coming decade. See California’s Clean Energy Future: An Overview on Meeting California’s Energy and Environmental Goals in the Electric Power Sector in 2020 and Beyond, available at http://www.cacleanenergyfuture.org/.
56 Governor Jerry Brown, see: http://www.jerrybrown.org/Clean_Energy.

60
A ZNE building has zero net energy consumption. Consistent with the loading order, the goal is to minimize energy use as much as technologically possible through cost‐effective efficiency measures, and then generate the balance of the building’s energy needs with onsite renewable electricity generation such as solar photovoltaic systems or wind‐driven electricity generators. The substantial energy efficiency improvements built into ZNE buildings contribute also to maintaining and improving the building’s comfort and functionality.
While the ZNE idea is straightforward, translating the policy into standards, guidelines, and incentive structures requires collaboration between agencies and stakeholders. To maximize the alignment of ZNE with California energy system reliability and policy goals, the Energy Commission recommends the use of metrics that account for the societal value of energy, including the critical impact of avoiding peak demand and the value of avoided carbon emissions, and other energy system costs. These components are well‐addressed in the time‐dependent valuation of energy concept used by the Energy Commission for its efficiency standards and the CPUC for its valuation of efficiency program savings.
Building Energy Efficiency Compliance and Reach Standards California’s mandatory Building Energy Efficiency Standards (Building Standards) are fundamentally performance standards that establish an “energy budget” for the entire building as an alternative to prescriptive requirements for individual components. This affords California builders, designers, and contractors the flexibility to achieve energy efficiency in buildings using a wide array of measures that fit their construction goals and meet the standards at the lowest cost.
The Building Standards are an important strategy for meeting the ZNE goal, as each subsequent standards update (done on a three‐year cycle) will progressively raise the bar by requiring increased energy‐saving features in building designs and equipment. Using cost effective efficiency requirements, the Energy Commission’s goal is to achieve a 20 to 30 percent energy savings for each triennial Building Standards update. As an initial step, the 2013 Building Standards will address high‐efficacy building envelopes, lighting, and heating, cooling and water heating systems, and energy demand response management technologies.
No matter how much demand is reduced, however, some amount of onsite generation will be required. As part of its policy setting responsibility under Senate Bill 1 (Murray, Chapter 132, Statutes of 2006) and its management responsibility for the New Solar Home Partnership, the Energy Commission developed standards and tools for achieving high‐performance rooftop photovoltaic (PV) systems. These standards and tools are designed to promote high efficiency solar energy system components, effective installation practices, and calculation and demonstration of expected system performance. They will serve as the foundation for considering upcoming building standards for rooftop PV systems.
The joint agency strategy for achieving the ZNE goals calls for establishing not only mandatory standards in each triennial update of the Building Standards, but also voluntary “Reach Standards.” The Reach Standards further a “market pull strategy” by establishing higher standards than required, which can be used to inform the development of minimum standards

61
in subsequent cycles. These Reach Standards are often met by a substantial portion of newly constructed buildings, demonstrating their feasibility, cost‐effectiveness, and value in the market. In developing these standards, the Energy Commission collaborates with the CPUC and the utilities’ new construction programs to incentivize builders to meet the Reach Standards. In addition, they are included as voluntary measures in the state’s California Green Building Standards Code (Title 24, Cal. Code Regulations, Part 11).
Other governmental agencies incorporate the Reach Standards as locally‐mandated requirements in their regulations and programs. For example, local governments are including them in local green building and energy ordinances, and the California Tax Credit Allocation Committee has incorporated these standards in its regulations governing qualification for federal and state tax credits for affordable housing projects. Several benefits accrue when a substantial portion of the marketplace constructs buildings that meet the Reach Standards. Industry gains expertise in delivering greater building efficiency. Also, costs tend to decline for the more efficient features as they become mainstream rather than premium and as suppliers and installers compete to provide them.
Strategies for Existing Buildings More than half of California’s 13 million residential units and more than 40 percent of the commercial buildings were built before 1978, when the state first implemented Building Standards. These existing buildings, and the rest built under previous vintages of the Building Standards, provide a huge opportunity for low‐cost energy savings. The AB 32 Scoping Plan concluded that improving the energy efficiency of existing residential and commercial buildings is the most important way to reduce GHG emissions in the electricity and natural gas sectors. The CPUC’s Long‐Term Energy Efficiency Strategic Plan set major goals for achieving deep, whole building energy savings in existing residential and commercial buildings. Efficiency improvements in existing buildings are also a priority goal of both the CCEF initiative and Governor Brown’s Clean Energy Jobs Plan.
The Legislature at several points in time has directed the Energy Commission to develop policies and programs to pursue improved efficiency in existing buildings, including to develop a statewide Home Energy Rating System Program (Senate Bill 1922 [Lewis, Chapter 553, Statutes of 1994]), develop and report to the Legislature recommendations for improving the energy efficiency of existing buildings in California (Assembly Bill 549 [Longville, Chapter 905, Statutes of 2001]), investigate options and develop a plan to decrease peak electricity demand for air conditioners across the state (Assembly Bill 2021 [Levine, Chapter 734, Statutes of 2006]), and establish a program requiring nonresidential building owners to benchmark the energy use of their buildings in comparison to other similar buildings and disclose the benchmarking data and ratings to prospective buyers, lessees and lenders (Assembly Bill 1103 [Saldaña, Chapter 533, Statutes of 2007] and Assembly Bill 531 [Saldaña, Chapter 323 , Statutes of 2009]). Building on this prior legislation, Assembly Bill 758 (Skinner, Chapter 470, Statutes of 2009) directed the Energy Commission to develop, adopt, and implement an ongoing, comprehensive, statewide

62
program to reduce energy consumption in existing buildings, including the adoption of regulations for energy ratings and improvements in existing buildings.
This comprehensive portfolio of programs is required to implement a variety of complementary techniques, applications, and practices to achieve greater energy efficiency in homes and businesses. AB 758, for example, authorizes (among other things) the program to provide:
• Energy assessments to identify and recommend opportunities for saving energy use in individual buildings,
• Energy efficiency financing options and other financial incentives,
• Information and education to property owners to help them implement energy efficiency improvements, and
• Systematic workforce training to ensure that workers employed to provide the services needed under the program will be well trained and supported to deliver high‐quality work.
The Energy Commission is required to evaluate the most effective ways to report the energy assessment results and efficiency improvement recommendations to the property owners, including prioritizing the energy efficiency improvements and determining how different types of financial incentives and financing can be used to accomplish the improvements. The bill also directs the Energy Commission to evaluate the appropriate methods to inform and educate the public about the need for and benefits of making energy efficiency improvements.
AB 758 calls for the Energy Commission to develop and implement the program in collaboration with the CPUC and industry stakeholders. The CPUC is directed to investigate the ability of investor‐owned utilities to provide financing to their customers for energy‐efficiency improvements and to report to the Legislature the utilities’ progress of the utilities in implementing the program.
Contemporaneously with the passage of AB 758, the federal government passed the American Recovery and Reinvestment Act. American Recovery and Reinvestment Act (ARRA) funding provided California additional resources to develop and conduct programs aimed at saving energy, creating jobs, and contributing to California’s economic recovery through energy efficiency upgrade projects in existing buildings. The Energy Commission designed the ARRA‐funded programs to incorporate the same approaches that were called for by AB 758 as a way to pilot those approaches. The ARRA programs emphasized collaborations of local governments and industry to deliver energy assessments, ratings, efficiency improvements, and quality assurance. ARRA also funded the nation’s largest workforce development effort, meshing the well‐established state and local workforce development infrastructure with statewide efforts to implement energy efficiency upgrades in existing buildings.
In an unprecedented collaboration, the Energy Commission, CPUC, local governments, and utilities came together to closely coordinate residential and commercial building upgrade programs under the Energy Upgrade California™ brand. The collaborative pilot programs provided a number of components authorized by AB 758, including:

63
• Public Awareness and Outreach
• Workforce Development
• Financing Options and Financial Incentives (Rebates)
• Energy Performance Ratings and Disclosure
• Efficiency Recommendations and Improvements (including Quality Assurance)
Major efforts have occurred all over California to implement and pilot each of these AB 758 program components. These efforts leveraged the ARRA funding to collaborate on the details of delivering energy efficiency upgrades in existing buildings. In the area of clean energy financing options, for example, the ARRA‐funded programs have allowed California to establish revolving loan programs that will remain in operation after the ARRA funding ceases,, provide loan loss reserves to encourage lenders to provide financing for energy efficiency upgrades, and pilot Property Assessed Clean Energy (PACE) financing in concert with local property assessments. On August 2, 2011, Governor Brown signed Assembly Bill X1 14 (Skinner, Chapter 9, Statutes of 2011), authorizing the State Treasurer to administer a new $50 million program to provide loan loss reserves for energy upgrades consistent with Energy Commission guidelines. This new program represents a major opportunity for the Energy Commission, State Treasurer’s Office, CPUC, and other partners to create financing solutions for building owners wanting to implement energy upgrade projects.
The Energy Commission’s next steps are to complete needs assessments for both residential and nonresidential buildings, identify what must be done in each of AB 758’s program component areas (taking advantage of the lessons learned from the ARRA piloting), and develop action plans for moving forward with AB 758 program development. The AB 758 program will be developed in three distinct but overlapping phases. Phase 1 (2010‐2012) will develop an infrastructure development and implementation plan; Phase 2 (2012‐2014) will cover market development and partnerships; and Phase 3 (2014‐2015) will cover statewide ratings and upgrades requirements. 57 Particular work areas include recommending improvements to the Home Energy Rating System program, developing the Commercial Building Energy Asset Rating System (BEARS), and building strategies for effective rating, labeling, and disclosure of energy‐efficiency information. Attention will also focus on improving compliance with and enforcement of California’s Building Energy Efficiency Standards requirements for alterations of existing buildings. As a condition for accepting ARRA State Energy Program funding, each state’s governor committed to putting advanced state energy codes into effect (such as the Energy Commission’s 2008 and subsequent Building Energy Efficiency Standards) and developing approaches to achieve high levels of compliance with those Standards.
AB 758 directed the Energy Commission and the CPUC to collaborate on how to best deliver financing, and to design utility programs for upcoming funding cycles to advance the comprehensive AB 758 program.
57 http://www.energy.ca.gov/ab758/.

64
Efficiency Improvements in Appliances The Appliance Efficiency Standards (Appliance Standards) are another strategy for reducing energy use in newly constructed and existing buildings. While permanently installed equipment and appliances are a substantial part of the building’s energy use,58 electronics and other devices plugged into outlets make up a growing portion of California’s energy use. Unfortunately, the energy use (and thus the true cost) of appliances and electronic devices is often invisible to the consumer, and manufacturers lack the direct incentive (of having to pay for the energy their products consume) to design products that use energy efficiently.
The Energy Commission’s Appliance Standards can address this issue by setting cost‐effective minimum efficiency requirements for appliances, electronics, and other devices. These efficiency standards set the bar at a level that affects only the least efficient products. Since 1976, the Energy Commission has adopted standards covering a wide range of appliances, including all major household appliances, air conditioners, furnaces, and water heaters. In many instances, California standards have subsequently been adopted as national standards by the United States Department of Energy (U.S. DOE).
Historically, California’s energy efficiency standards have resulted in significant reductions in energy consumption. The Energy Commission estimates that appliance efficiency standards adopted between 1976 through 2005 saved 18,761 gigawatt hours (GWh) in 2010. 59 This represents 6.7 percent of California’s electric load and is roughly the amount of energy produced by California’s two largest power plants. At an average rate of 14 cents per kilowatt hour, appliance efficiency regulations saved California consumers about $2.68 billion in 2010.
Despite the success of appliance efficiency standards, the amount of energy consumed by devices plugged in by building occupants (“plug load”) has been climbing rapidly.60 ,61 To address these growing plug loads, the Energy Commission has initiated and completed several
s.cfm.
58 The breakdown of 2009 annual household electricity consumption by end use is: lighting, 22 percent; refrigerators and freezers, 20 percent; television, computer, and office equipment, 20 percent; air conditioning, 7 percent; pools and spas, 7 percent; dishwasher and cooking, 4 percent; laundry, 4 percent; space heating, 2 percent; water heating, 3 percent; and miscellaneous, 11 percent. California Energy Commission, 2009 California Residential Appliance Saturation Study, October 2010, page 3, http://www.energy.ca.gov/2010publications/CEC‐200‐2010‐004/CEC‐200‐2010‐004‐ES.PDF
59 Program forecasted for 2020 will grow to 27,116 GWh a year. This would represent 8.6 percent of projected load in 2020. At the current rate of 14¢ per kilowatt hour, this would save the state about $3.8 billion for 2020. See: http://www.energy.ca.gov/2009_energypolicy/index.html.
60 C.D. Barley, C. Haley, R. Anderson, and L. Pratsch, November 2008, Building America System Research Plan for Reduction of Miscellaneous Electrical Loads in Zero Energy Homes, National Renewable Energy Laboratory and U.S. Department of Energy, NREL/TP‐550‐43718, page 5.
61 U.S. Energy Information Administration, March 28, 2011, Share of Energy Used by Appliances and Consumer Electronics Increases in U.S. Homes, http://www.eia.gov/consumption/residential/reports/electronic

65
rulemakings covering products such as televisions, external power supplies (EPS), DVD players, and compact audio devices. These regulations provide minimum efficiency or maximum power use requirements for more than 26 million unit sales per year (TV: 4 million 2010, EPS: 20.6 million 2005, DVD: 1.5 million, compact audio: 1.1 million). The Energy Commission is also developing standards for the estimated 58 million battery chargers sold (2009) in California per year. The estimated energy savings for battery charger standards is 2,000 GWh per year62, of which 1,600 GWh will be attributable to reduced residential plug load energy demand and 400 GWh toward reduced commercial plug load energy demand. The battery charger standards will improve the efficiency of a wide range of plug loads, such as laptop computers, power tools, electric toothbrushes, cell phones, and mp3 players.
The Energy Commission is developing a new scoping order to identify the appliance types that should be included in new standards, and to upgrade levels of existing standards. Stakeholder proposals have identified up to 8,000 GWh in potential savings from new standards. Proposals include computers and computer servers, linear fluorescent fixtures, and outdoor lighting as key opportunities for new Appliance Standards.
Improvements to Lighting Efficiency Lighting is the largest electrical load in both homes and businesses, accounting for 35 percent of commercial annual electricity use and 22 percent of residential annual use. Assembly Bill 1109 (Huffman, Chapter 534, Statutes of 2007) requires an 11 percent reduction in electricity consumption from residential lighting and an 8.6 percent reduction from commercial lighting. Achieving these goals would reduce California’s total electricity use by more than 6 percent.
Since the passage of AB 1109, the U.S. DOE has adopted new federal standards for general service fluorescent lamps and incandescent reflector lamps. California has exercised its discretion to implement the federal standards one year ahead of the federal schedule. The Energy Commission has also gone beyond the scope of the federal standards by adopting new standards for metal halide and portable luminaires, updated lighting efficiency, and design and use standards in the 2008 Building Energy Efficiency Standards, and will further address lighting efficiency in upcoming triennial updates. The above initiatives will advance the state’s progress in meeting the AB 1109 residential lighting mandates. However, the challenge of meeting commercial lighting and outdoor lighting mandates must be addressed through additional standards developed in collaboration with the lighting industry, consumers, the CPUC, and the state’s utilities.
Light‐emitting diode (LED) lamps are a promising example for advancing beyond current mandatory lighting standards. LEDs have enormous energy savings potential given their
62 Future savings estimated to be achieved in one year after the entire stock of appliances that are covered by the standards meet the requirements of the standards. This would happen in a future year after all such appliances that were manufactured prior to the effective date of the standards are no longer in use because they have reached the end of their useful lives.

66
inherent efficiency at converting electricity to light. However, a number of challenges regarding cost, quality, and efficacy must be addressed. Rapid advancements in LED technology have led to a proliferation of products in a growing range of applications at lower prices. Research at the California Lighting Technology Center (CLTC) has revealed large variations in quality across a number of performance parameters, including light quality and longevity, which could reduce consumer acceptance of the technology. As with early efforts to bring compact fluorescent lamps to market, when similar performance quality issues severely dampened consumer demand, there is a risk that barriers to wide acceptance of LEDs could result if California consumers have negative experiences with low‐performing products. To address this risk, the Energy Commission is working with CLTC engineers, industry, and the CPUC to develop product quality specifications for LEDs that could serve as a basis for future utility incentive programs.
Achieving Better Compliance With Standards Compliance with Building Standards is much better for new construction than for alterations to existing buildings, primarily because alterations are frequently made without the required permits. Without the oversight of local building officials, energy efficiency codes are rarely followed. For example, less than 10 percent of contractors pull building permits and abide by legal requirements for change outs of furnaces and air conditioners. In general, local building departments have limited resources for enforcing building codes, especially those beyond minimum health and safety protections. The lack of compliance with standards can result in defective construction and installation, including improper installation of wall and duct insulation, HVAC systems, and other efficiency measures, all of which can drive up energy costs for home and building owners.
Widespread noncompliance with appliance regulations also has been brought to light through complaint filings by competing manufacturers and retailers as well as energy efficiency advocates and others. Recent market surveys reveal high rates of noncompliance with the Appliance Standards, finding large numbers of ineligible products being offered for sale in stores, through catalogs, and over the internet. Addressing the issue of noncompliance has been extremely difficult because the Energy Commission has had limited authority to take enforcement actions against noncompliant manufacturers, distributors, and retailers. If an appliance was found to be noncompliant with a standard, the Energy Commission could conduct an administrative hearing to remove it from the database (if it were improperly certified). However, the Energy Commission was required to petition the Attorney General to seek injunctive or other relief from a court to forbid the sale of an appliance. This administrative process could take up to 190 days, and court actions can take many months or years.
On October 8, 2011, Governor Brown signed Senate Bill 454 (Pavley, Chapter 591, Statutes of 2011) into law, which will help address the challenge with widespread noncompliance by manufacturers and retailers. The legislation allows the Energy Commission to adopt an enforcement process for violations of appliance efficiency regulations, and impose civil penalties of up to $2,500 for each violation. The bill establishes the Appliance Efficiency
67
Enforcement Subaccount within the Energy Resources Program Account, where civil penalty funds will be deposited that can then be spent upon appropriation by the Legislature for public education and enforcement of the appliance efficiency standards.
The Energy Commission will use the following criteria in assessing a civil penalty:
• The nature and seriousness of the violation
• The number of violations
• The persistence of the violation
• The length of time over which the violation occurred
• The willfulness of the violation
• The violator’s assets, liabilities, and net worth
• The harm to consumers and to the state from the amount of energy wasted because of the violation
Following these criteria will ensure that the Energy Commission imposes only appropriate penalties against violators based on specific circumstances. By providing this authority to the Energy Commission, the Legislature has helped ensure a level playing field for all regulated manufacturers.
Recommendations Newly Constructed Buildings • The Energy Commission and CPUC should work jointly on developing a definition of ZNE
that incorporates the societal value of energy (consistent with the time dependent energy valuation approach used for California’s Building Energy Efficiency Standards).
• The Energy Commission should adopt triennial building standards updates that increase the energy efficiency of newly constructed buildings by 20‐30 percent in every triennial update to achieve ZNE standards for newly constructed homes by 2020.
• The Energy Commission should adopt reach standards for newly constructed buildings that provide best practices energy efficiency levels for the marketplace to strive for and serve as a means to pull the industry rapidly to the level needed to achieve ZNE goals. The Energy Commission, CPUC, local governments, and builders should collaborate to encourage the building industry to reach these advanced energy efficiency levels in a substantial segment of the market through industry‐specific training and financial incentives.
• The Energy Commission and CPUC should coordinate future investor‐owned utility “new construction‐related” programs with the Energy Commission’s efforts to meet the ZNE goals through triennial updates of mandatory and reach standards. By offering incentives for achieving reach standards, providing technology demonstration and development, and conducting pilot programs for demonstrating ZNE solutions, new technologies and building practices will be integrated into upcoming triennial updates of the Building Standards quicker and with more success.

68
• The Energy Commission, CPUC, builders, and other stakeholders should collaborate to accomplish workforce development programs to impart the skills necessary to change building practice to accomplish ZNE in newly constructed buildings.
Existing Buildings • The Energy Commission and CPUC should coordinate future investor‐owned utility energy
efficiency portfolios with the programs and rules developed in the Energy Commission’s AB 758 proceeding. The Energy Commission should develop an asset rating system for nonresidential buildings that can be used to rate the energy efficiency of commercial properties and provide owners and potential buyers with information about the energy efficiency of the buildings they own or are considering for lease or purchase. This will help drive market demand for efficiency. The Energy Commission also should consider how the cost‐effectiveness of options to achieve greater energy efficiency in those buildings can be addressed in conjunction with building asset ratings. The Energy Commission and CPUC should collaborate to pilot the implementation of the rating system through education and financial incentives.
• The Energy Commission should review ARRA pilot programs to identify lessons learned and opportunities for improvements in rating systems, financial products, workforce development, consumer education, and program coordination.
• The CPUC, the Energy Commission, the State Treasurer, and other agencies should collaborate with local governments, the financial industry, and other stakeholders to promote the availability of financing products for the upgrade of all building sub‐sectors.
• The Energy Commission should focus significant resources during the next Building Standards update on efficiency improvements in building additions and alterations.
Appliance Efficiency Standards • The Energy Commission should adopt appliance standards that focus on reducing plug
loads to enable California’s ZNE goals to be achieved.
• The Energy Commission should continue to adopt standards for appliances that represent the most significant statewide energy savings potential.
• The Energy Commission and CPUC should collaborate on research to identify the most cost‐effective opportunities for new appliance standards and to reevaluate existing standards to identify the most cost‐effective opportunities for updates to achieve greater energy savings.
• The Energy Commission and CPUC should jointly develop a roadmap to meet the lighting energy savings mandated by AB 1109, including new appliance and building efficiency standards and market transformation programs to achieve higher levels of energy efficiency than required by standards.
• The Energy Commission should collaborate with industry to develop reach standards for appliances that set higher expectations in California for the quality and performance of key appliances.
• The Energy Commission and CPUC should collaborate to develop voluntary LED quality performance standards.

69
• The Energy Commission should engage in DOE proceedings that are developing federal test methods and appliance standards.
Compliance With Standards • The Energy Commission should immediately begin developing regulations to implement
the enforcement authorities provided by SB 454 to increase compliance with the Appliance Standards.
• The Energy Commission and CPUC should emphasize joint efforts to achieve improved compliance with the Building and Appliance Standards.
70
CHAPTER 4: California’s Clean Energy Future This chapter provides a status report on the California’s Clean Energy Future (CCEF) joint agency collaborative effort. Recognizing the growing interdependencies among the state’s energy and environmental agencies, the California Air Resources Board (ARB), California Environmental Protection Agency (Cal/EPA), California Energy Commission, California Public Utilities Commission (CPUC), and California Independent System Operator (California ISO) developed a vision, implementation plan, and roadmap to achieve a clean energy future for California.63 Launched in 2010, the planning effort focuses on 2020, with consideration of the goal to reduce greenhouse gas (GHG) emissions to 80 percent below 1990 levels by 2050.64
The purpose of the CCEF effort is to:
• Compile existing policy goals to support interagency planning and management,
• Identify policy interdependencies, key milestones, and delivery risks to improve communications and cooperation,
• Use adaptive management practices “to identify policy overlaps, conflicts, unanticipated or unintended consequences, and to make necessary trade‐offs and course corrections.”65
The California’s Clean Energy Future: Overview (Overview) outlines the agencies’ vision for 2020. The agencies released the planning document in September 2010, but it has not yet been updated to reflect the goals of the Brown Administration. The agencies plan to refresh their planning efforts to reflect significant developments since its release, such as the passage of legislation to enact the 33 percent Renewables Portfolio Standard (RPS). Future planning efforts will also reflect findings coming from the Governor’s Conference on Local Renewable Energy Resources, the Energy Commission’s report on Renewable Power in California: Status and Issues, and the Energy Commission’s IEPR and Renewable Strategic Plan that will be developed in 2012.
The Overview focuses on four elements for achieving the state’s 2020 electricity and natural gas goals, with the first being energy demand. As currently drafted, the agencies target reductions of 5,000 to 8,100 MW on peak by 2020 with advancements in efficiency and demand response. This is in addition to the 2,300 MW (on‐peak) committed energy efficiency savings already included in the 2009 demand forecast. The current version also calls for installing 5,000 MW of distributed generation (DG) by 2020, although the agencies recognize Governor Brown calls for 12,000 MW of localized renewable generation by 2020.
The second element is energy supply. The Overview envisions achieving a 33 percent RPS while maintaining reliability needs and meeting environmental goals, such as phasing out once
.
63 These documents are available at www.cacleanenergyfuture.org.
64 Executive Order S‐03‐05, http://gov.ca.gov/news.php?id=1861.
65 California’s Clean Energy Future, 2010, Overview, page 2, http://www.cacleanenergyfuture.org/2821/282190a82f940.pdf

71
though cooling in power plants. The agencies put forward a goal of developing at least one utility scale carbon capture and storage facility in California by 2020.
The third element is transmission, distribution, and operations. The agencies envision a coordinated effort for planning and permitting to ensure that sufficient transmission and distribution level infrastructure will be available to meet renewable goals and GHG reduction targets. Investments in advanced metering and smart grid will empower customers to use energy more efficiently. Through agency supported pilot studies, the agencies are targeting 1,000 MW of additional storage capacity by 2020 to promote renewable integration.
The fourth element is additional supporting processes, including cap and trade, to provide opportunities for lower cost GHG reductions and advancements in emerging technologies. The Overview also recognizes that alternative fuel vehicles and electrification of the transportation sector in particular, will be a central component to energy security and reduced GHG emissions. The Overview calls for California to “develop the infrastructure and operational capabilities necessary to absorb a targeted 1,000,000 fully electric and plug‐in hybrid‐electric vehicles (PHEV) by 2020.” In addition to efforts to reduce GHG emissions, California will need to plan for and adapt to actual changes in climate, such as temperature and precipitation changes and other impacts affecting energy supply and demand. Finally, the plan calls for engaging California’s institutions and residents as partners in achieving these goals.
On July 6, 2011, the Energy Commission held an IEPR workshop jointly with the ARB, Cal/EPA, California ISO, and CPUC to discuss updates to the California Clean Energy Future planning document. Updates provide an opportunity for incorporating new policy developments and identifying any areas that need course correction. The agencies anticipate the planning updates to include:
• 33 percent Renewables Portfolio Standard (RPS) legislation Senate Bill (SB) x1 2 (Simitian, Chapter 1, Statutes of 2011‐12 First Extraordinary Session).
• The goals in the Governor’s Clean Energy Jobs Plan, including:
o 12,000 MW of localized energy by 2020.
o 8,000 MW of large‐scale renewable and associated transmission lines.
o Develop 6,500 MW of combined heat and power (CHP) over the next 20 years.
o Metrics and data references to indicate progress toward achieving California’s clean energy goals and indicate opportunities for the CCEF agencies to propose course corrections.
At the workshop, the IEPR Committee requested comments from stakeholders and the public on seven draft metrics and four draft data references and received 21 sets of comments. The Committee also asked whether other metrics should be added. While the agencies could not reflect all the comments in the metrics, the discussion below highlights the changes made in response to stakeholder input. At the workshop, staff discussed seven draft metrics and four

72
data references. In response to stakeholder comment, staff plans to add five additional metrics. The seven draft metrics presented at the workshop are as follows:
1. GHG Emissions: The metric presented at the workshop shows historical and forecasted GHG emissions from 2000 to 2020. Emission forecasts provide a reference for assessing the effect of GHG reduction measures. In response to stakeholder comments, staff plans to revise this metric to include information on GHG intensity, such as GHG emissions per capita and per gross state product, as suggested by Sempra. Other revisions include: adding a business as usual projection (per Environmental Defense Fund), and providing a graphic showing progress of GHG emission reductions for all sectors included in Assembly Bill 32 (Nunez, Chapter 488, Statutes of 2006) (per Natural Resources Defense Council [NRDC] and Southern California Edison [SCE]).
2. Energy Efficiency: This metric presented at the workshop shows California investor‐owned utilities’ (IOUs) and publicly owned utilities energy savings from 2006 to 2010. The metric also shows the IOUs’ annual energy savings, peak savings, and natural gas savings in comparison with the goals set by the CPUC. For the publicly owned utilities, the metric shows net annual energy savings and net peak savings as reported by the utilities in comparison with efficiency goals set by the Energy Commission. Stakeholder comments on this metric included NRDC’s suggestion to show indicators of net benefits of energy efficiency programs and energy efficiency codes and standards. Sempra suggested adding an indication of the energy intensity of existing and new buildings. Bevilacqua‐Knight Inc. supports adding the savings expected from zero net energy strategies included in the California Energy Efficiency Strategic Plan. 66 Staff plans to revise the metric to provide indicators of cost effectiveness for utility energy efficiency portfolios, the energy intensity standards for California homes constructed after 2001, progress toward zero net energy homes, and energy savings from building codes and standards.
3. Demand Response: Demand response generally refers to a reduction in customers’ electricity consumption over a given time interval in response to a price signal, other financial incentives, or a reliability signal. The demand response metric presented at the workshop provides a historical view of the estimated levels of demand response for the IOUs from 2009 through 2011, and a projection to 2020, which assumes broad deployment of advanced metering infrastructure. Staff plans to modify this metric as more information becomes available through the CPUC’s Smart Grid Rulemaking.
4. Renewable Energy: The metric presented at the workshop shows the amount of renewable generation for California, excluding large hydro, from 1983‐2009 and estimates of the amount of renewable generation needed to meet the 2013, 2016, and 2020 RPS targets. Data are also provided showing historical generation by fuel type. Since the RPS calls for
66 California Energy Commission, July 6, 2011, workshop, comments available at: http://www.energy.ca.gov/2011_energypolicy/documents/2011‐07‐06_workshop/comments/.

73
a specified percentage of retail sales served with renewable energy, the metric shows a range for the amount of renewable energy needed to meet the RPS target based on factors that can affect retail sales, including energy efficiency, self‐generation, and CHP, as well as expected levels of economic and population growth. There is also a graphic for new renewable projects under contract with the IOUs to show their progress in meeting development milestones, such as securing financing, obtaining necessary permits, beginning construction, and commencing commercial operations.67
Comments from stakeholders included a suggestion by the Sierra Club to add information on project failure by procurement program (SB 32, California Solar Initiative, Renewable Auction Mechanism, feed‐in tariff). Pacific Gas and Electric (PG&E) suggested adding indicators related to the CCEF goal that “a significant fraction of renewables will be dispatchable.”SCE asked staff to clarify the impact of recontracting on progress toward RPS goals. In response to comments, staff plans to add information on progress for each procurement mechanism and information to track dispatchable renewable resources. Also, staff will revise the information on approved and pending RPS contracts to show only contracts for new resources.
5. Installed Capacity: This metric presented at the workshop shows on‐line, nameplate capacity for all electricity generation resources in California by technology from 2001 to 2010.68 If all contracts for new large‐scale renewable energy facilities in California succeed, they will add more than 8,000 MW. In response to Independent Energy Producers’ (IEP) suggestion to show growth rates, staff plans to revise the metric to show that contracts for large renewable resources in California are scheduled to come on‐line at an average annual growth rate of 17 percent per year from 2010‐2016.
The CCEF includes a goal to add 1,000 MW of energy storage by 2020. In response to comments calling for more information about storage, staff plans to show that about 2,800 MW of pumped hydropower were on‐line in 2010 in California. Nine additional projects in California with a combined capacity of 4,900 MW have received licenses from the Federal Energy Regulatory Commission. The goal to add 1,000 MW of new storage would be met if about 20 percent of the licensed capacity completes environmental permitting and comes on line by 2020. Several hundred megawatts of distributed electricity storage facilities may come on‐line by 2020 as well, depending on various factors. For example, one factor is the outcome of the CPUC’s Assembly Bill 2514 proceeding (OIR R.10‐12‐007), which will determine whether and how the CPUC should further encourage storage. Other examples include the eligibility of storage for
67 As presented in the Division of Ratepayer Advocates’ Green Rush: Investor‐Owned Utilities’ Compliance with the Renewables Portfolio Standard, February 2011.
68 Nameplate capacity is the maximum possible output from a generation facility under specific conditions as designated by the manufacturer.

74
incentives, the results of utility storage demonstration projects, the cost of storage, and rate structure developments that could make storage more attractive.
Staff plans to revise the metric to show estimates of CHP potential and a goal of adding about 6,200 MW of CHP by 2032. To achieve the goal, staff estimates that CHP would need to grow about 4.7 percent per year from 2012‐2022.
Sempra stated that even if the energy efficiency goals are met, the goals for new electricity facilities cannot be met because supply would exceed demand for electricity.69 In response to this comment, staff plans to expand the discussion of the interaction of goals for high levels of energy efficiency and the Governor’s goals for renewable energy and CHP.70
6. Transmission Expansion: Twelve transmission projects are underway in the California ISO’s footprint that will provide sufficient capacity for the state to achieve the 33 percent RPS.71 The metric tracks the approval status, capacity, and expected on‐line date of these projects.
2.pdf
69 http://www.energy.ca.gov/2011_energypolicy/documents/2011‐07‐06_workshop/comments/Sempra_Energy_Utilities_Companies_Comments_on_Joint_A_2011‐07‐20_TN‐61463.pdf.
70 If existing renewable energy facilities 20 MW and smaller (about 2,700 MW of wholesale and customer‐side DG) are counted toward the 12,000 MW goal for localized renewable energy resources, the Governor’s goals would add about 17,300 MW of new renewable energy facilities by 2020 and 1,000 MW of new energy storage. Using CPUC input assumptions, the California ISO study on 33 percent RPS (completed for the CPUC 2010 Long‐Term Procurement Proceeding) modeled “base load case” scenarios adding about 17,500 MW to 20,800 MW of new renewable facilities by 2020. The scenarios assumed a large amount of energy efficiency (more than 18,000 GWh) was achieved by 2020 beyond the levels included in the 2009 energy demand forecast. (https://www.pge.com/regulation/LongTermProcure2010‐OIR/Testimony/CAISO/2011/LongTermProcure2010‐OIR_Test_CAISO_20110701_212930.pdf, Exhibit 3, Table 6.) The CHP goal extends to 2032, and depending on the renewable resource mix, the amount of energy efficiency achieved, and replacement of gas‐fired power plants in California that use OTC, achievement of the CHP goal may not begin in earnest until after 2020. “Post 2020, additional investments in renewable generation may be needed to replace generation expected to decline over the course of the next decade, such as generation from expiring coal contracts. Generation from a number of these contracts, which currently represents about 10 percent of total generation serving California, is expected to decline by 61 percent between 2010 and 2020 due to constraints imposed by the Emission Performance Standard. Remaining coal contracts are expected to expire between 2027 and 2030, which will require replacement with a mix of renewable and thermal generation with storage to satisfy electricity needs while still meeting greenhouse gas emission reduction goals.” http://www.energy.ca.gov/2011publications/CEC‐150‐2011‐002/CEC‐150‐2011‐00 .
71 The number of transmission projects (12) differs from the 13 projects identified in Chapter 1 because this metric includes only projects within the California ISO balancing authority area.

75
7. Electric Vehicle (EV): The metric presented at the workshop shows actual sales‐to‐date of EVs in California and a scenario of anticipated sales under the Zero Emission Vehicle program and the potential sale of 1 million EVs consistent with the CCEF goal. For the Zero Emission Vehicle program, the metric reflects anticipated cumulative sales for both battery EVs and PHEVs. In response to stakeholder comments, staff plans to add information on efforts underway to advance deployment of infrastructure needed for the expanded use of plug in electric vehicles in California.
In addition to the metrics, staff presented four “data references” that provide supporting information for the metrics. The data reference on energy demand shows statewide electricity and natural gas consumption from 1990 to 2008 by end‐use sector and shows electricity consumption by county. Staff also provided data on non‐coincident statewide net peak72 demand for 1990 to 2009, reflecting an aggregation of peaks that often occur at different times in different planning areas. In addition, staff provided data on coincident statewide peak demand, which is the peak demand for California at the same point in time.
A second data reference is for the state’s energy reserve margin. A reserve margin is a measure of the amount of electricity imports and in‐state generation capacity available over average peak demand conditions. The metric shows available reserve margins in comparison to California’s 15 to 17 percent planning reserve target. The planning reserve margin target is intended to assure sufficient electricity supplies can meet real‐time operating reserve requirements and ensure that outages occur no more frequently than one‐day‐in‐ten‐years.
A third data reference is the “system average rate,” which is calculated by dividing the annual revenue requirement of the IOUs by their annual retail sales. This metric provides a normalized basis for assessing trends in utility costs over time, but it does not necessarily reflect actual rates or trends in those rates experienced by different customer classes.
Finally, the fourth data reference provides information to track compliance with regulations to phase out once‐through cooling (OTC) at 19 power plants in California. Of these, 16 plants totaling roughly 17,000 MW are in the ISO Balancing Area Authorities, and 3 are in the Los Angeles Department of Water and Power Balancing Area Authorities. Compliance dates for the power plants range from 2010 to 2024. Staff added a description of the technologies and strategies that were part of the submitted OTC implementation plans in response to comments from NRDC.
Based on input from the workshop and written comments, the CCEF agencies plan to add the following metrics:
• Jobs: This metric will provide a rough measure of job creation as result of CCEF renewable and efficiency initiatives. This approach will take into account comments from stakeholders
72 Net peak is total electricity demand at peak on the customer side, plus utility transmission and distribution losses, minus peak demand met by self‐generation.

76
73
The analysis will estimate gross job creation and attempt to estimate job losses or jobs avoided. This analysis will be in terms of a “job‐year,” which is a full‐time job that lasts one full calendar year and includes estimates of direct, indirect,74 and induced75 jobs. Estimated job‐year creation between 2011 and 2020 for energy efficiency expenditures and various renewable planning scenarios ranges from about 361,000 to 424,000.
The estimated number of job‐years created per technology (MW developed) will based on data from the National Renewable Energy Laboratory’s Jobs and Economic Development Impact model and analysis by Max Wei, Daniel Kammen, and others at the University of California, Berkeley Energy Resources Group, to synthesize the existing literature on job creation. These factors will be applied to scenarios in the CPUC’s Long‐Term Procurement Proceeding and projects under contract to estimate job creation for various scenarios. The scenario with the highest DG deployment is expected to result in the largest number of new jobs in California. Staff also estimate job‐year creation that result from public and investor‐owned utilities spending on energy efficiency programs in California, assuming a constant level of spending in these programs at the 2010 level through 2020.
• Private Investment: This will provide a rough indication of the level of private investment from new transmission and renewable projects. For transmission, the total anticipated investment is on the order of $7.15 billion. The cost estimates are collected from interconnection studies and public filings.
Estimated private investment in renewable will be based on instant cost, generally referred to as “overnight cost” or “initial capital expenditures,” for building a new power plant. Instant cost includes component, land, development, and permitting costs. It also includes connection equipment costs such as for transmission and environmental control. The instant cost is the most significant driver for the levelized cost of electricity, but it does not include the costs incurred during construction. Installed cost includes not only the instant costs, but also the costs associated with the time it takes to build a power plant, such as the effort in securing construction loans. Applying instant cost figures to the total amount of megawatts
73 Sempra warned, ʺThe variable baseline of what jobs would have been created if California’s energy dollars had been spent on less expensive conventional energy plus general consumer spending from that savings on energy is highly debatable and speculative.ʺ http://www.energy.ca.gov/2011_energypolicy/documents/2011‐07‐06_workshop/comments/.
74 Indirect jobs from efficiency projects, for example, occur within the firms that supply construction materials.
75 The increased spending in the general economy from wages and profits of direct and indirect jobs and reduced energy expenses of households and businesses leads to increases in general employment levels and induced jobs.

77
installed in California, staff estimates that private investment in renewable energy facilities is about $710 million in 2010 with about $3.8 billion for 2011. An investment of about $3.3 billion is expected in 2012.
• Reliance on Coal: This will track reliance on coal to meet California’s electricity demand. CMUA, Center for Energy Efficiency and Renewable Technologies, American Lung Association (ALA), NRDC, and Sierra Club supported tracking the reduction of coal and natural gas to generate electricity used in California.76 The metric will show that the electricity generated from coal and petroleum coke plants is expected to decline by 60 percent (17,800 GWh) and the associated greenhouse gas emissions are expected to drop from about 30 million tons of carbon dioxide equivalent (CO2e) to 12 million tons between 2010 and 2020. The decline in coal contract deliveries is due to the constraints imposed by the Emission Performance Standard (Senate Bill 1368, Perata, Chapter 598, Statutes of 2006). The Emission Performance Standard prohibits California utilities from renegotiating or signing new contracts for baseload generation that exceeds 1,100 lbs of CO2e emission per MWh. Several contracts with coal generation facilities that exceed the Emission Performance Standard will expire within the decade and cannot be renewed with another long‐term contract. Some qualifying facility contracts for small power plants located in California that use coal and petroleum coke are slated to expire through the decade, but some owners are renegotiating contracts for an early termination or considering repowering to burn natural gas or biomass fuels.
• Resource Flexibility for Reliability: The agencies will add a metric on resource flexibility for reliability in response to comments from the California Municipal Utilities Association (CMUA), IEP, and SCE supporting an indicator of the flexibility of system operations. The metric will show that the resource flexibility needs increase with declining availability of nongeneric resource capacity due to the once‐through cooling retirements and the increasing amounts of variable renewable energy resources coming on line. This metric will show the forecast for additional nongeneric77 resource capacity requirements to manage the changes based on 2020 renewable portfolio scenarios.78 The metric will show both upward
p/2011‐07‐
n
76 Energy Commission, July 6, 2011, IEPR workshop, transcript, http://www.energy.ca.gov/2011_energypolicy/documents/2011‐07‐06_worksho06_transcript.pdf, pages 44, 63‐64, 75, 108, 157.
77 Generic capacity would be that required to support energy requirements, as well as spinning and non‐spinning operating reserves. Nongeneric capacity includes resources used for ramping, regulation reserve, and load following, as well as for voltage or inertia support when specifically needed in excess of energy requirements.
78 Track I Direct Testimony of Mark Rothleder on behalf of the California Independent System Operator in CPUC Rulemaking proceeding R.10‐05‐006 https://www.pge.com/regulation/LongTermProcure2010‐OIR/Testimony/CAISO/2011/LongTermProcure2010‐OIR_Test_CAISO_20110701_212930.pdf. See also Integration of Renewable Resources‐Operational Requirements and Generation Fleet Capability at 20% RPS at: http://www.caiso.com/2804/2804d036401f0.pdf and Draft Technical Appendices for Renewable Integratio

78
and downward flexibility requirements. Upward flexibility is provided by resources that are capable of responding to centralized automatic generation controls to increase output as needed to address balancing and load‐following requirements. Conversely, downward flexibility involves resources capable of decreasing output.
• 12,000 MW goal for localized renewable generation. As presented at the July 6 workshop, the installed capacity metric included information about renewable DG 20 MW and smaller (customer self‐generation and wholesale), but staff plans to make DG a separate metric to reflect more clearly the Governor’s 12,000 MW goal for localized renewable generation.
Metrics and data references will be posted on the CCEF website. The agencies will be updating them periodically to reflect new information.
Studies ‐ Operational Requirements and Generation Fleet Capability at: http://www.caiso.com/282d/282d85c9391b0.pdf.

79
CHAPTER 5: Power Plant Licensing Lessons Learned The Energy Commission’s power plant licensing process was established in 1974 to provide a comprehensive “one‐stop” process for permitting thermal power plants 50 MW or larger. Currently the process takes about 12 to 18 months and includes an independent environmental and engineering assessment called a staff assessment (SA). The Energy Commission staff publishes the SA, working collaboratively with federal, state, and local agencies as well as Tribal governments. The assessment is the functional equivalent of a draft environmental impact report and includes all proposed mitigation that would be required by other state and local permits except for the Energy Commission’s jurisdiction. In addition to developing the SA, the 12‐ to 18‐month review period includes public workshops, exchange of data through a formal discovery period, evidentiary hearings, publication of the proposed and final decisions, and a final approval hearing.
In December 2010, the Energy Commission’s Siting Committee initiated an Order Instituting Informational (OII) Proceeding on “lessons learned” during the licensing of American Recovery and Reinvestment Act (ARRA) solar projects and natural gas‐fired power plants reviewed during 2009 and 2010. The OII Lessons Learned proceeding commenced with a scoping workshop attended by various stakeholders, including project proponents, project interveners, environmental organizations, local government officials, advocacy organizations, elected officials, and the general public. Stakeholders provided oral and written comments relevant to the licensing process that were primarily focused on the following topics:
• Timing/coordination with federal permits for large solar projects located on federal lands managed by the Bureau of Land Management (BLM)
• Staff’s information requirements to develop the SA, such as:
o The length of the SA and the complexity of the mitigation
o The confusing intervention process and the cumbersome document filing procedures
o Restrictions on communication between Energy Commission staff and the applicant on substantive issues
o Local agency and public participation in the planning and permitting of large solar projects
• Siting process consistency between different solar project proceedings, including cumulative analyses determinations and definitions that affect significant impact determinations and associated mitigation
• California Environmental Quality Act (CEQA)/National Environmental Protection Act joint review and alternatives analyses coordination
In the months following the initial scoping workshop, Energy Commission staff has undertaken (or will undertake) a process to assess challenges to effective environmental review and facility licensing. Staff also will develop proposed changes to eliminate these challenges, which will help streamline the process without compromising transparency and effective participation. As

80
described below, staff is reviewing three subareas: development/drafting of the SA, evidence and hearings, and the public process. Also described below are strategies for updating the state’s policy on water consumption in power plants and how such changes could improve the licensing process and environmental conditions.
In addition, staff involved in the OII is closely following the separate but related Desert Renewable Energy Conservation Plan and Programmatic Environmental Impact Statement processes to ensure that the OII lessons learned effort builds on other renewable energy and land use assessments.
Siting Process Development and Drafting the Staff Assessment The Energy Commission faces a challenge with the increased length and complexity of SAs and conditions of certification. This was especially true during 2010, when the Energy Commission reviewed several large solar projects – often jointly with the BLM – as part of the ARRA initiative. To help address this issue, staff is evaluating whether the SA can be “pared down” or better formatted in future proceedings, while still meeting the requirements of CEQA and Energy Commission regulations. Staff is comparing Energy Commission environmental documents to those of other state and local jurisdictions to identify effective strategies in drafting environmental analyses. This comparative analysis will help determine if staff documents are within the scope and depth of other agencies’ environmental documents, or if Energy Commission documents are outliers. The Energy Commission is under different mandates and requirements from local authorities, including its all‐encompassing license, which folds other jurisdictional determinations into its own “one‐stop shop process” and ultimately affects the content of SAs and Energy Commission decisions.
Besides reviewing other jurisdictions’ environmental documents, another prominent strategy that has transpired as part of the OII Lessons Learned Proceeding is staff training, which is already improving the overall quality of the SA and oral testimony at evidentiary hearings. The training is increasing the consistency between technical sections in the SA and clarifying staff member roles in the project review and document drafting.
Another siting process challenge is the amount of data required upfront in a project application versus what information could be provided during the discovery phase. Ideally, the project proponent (applicant) should file a well‐developed project application for certification (AFC) and provide near complete data sets at the time of the AFC’s filing, so that staff can efficiently determine the project impacts and develop appropriate mitigation measures to offset these impacts to less‐than‐significant levels. For various reasons, however, applicants are often unable to submit key components of their proposed project at the time of the AFC filing and have trouble providing the necessary information early, not only for data adequacy purposes, but during the discovery phase of the 12‐month process. Staff is reviewing the information and data gathering process to ensure that any changes will balance the need for information with the ability to draft the SA in a timely manner.

81
A major cause of past project‐licensing delays is from the proponent making significant changes to the project during staff’s review and preparation of the SA. While changes often result in reducing the project’s environmental impacts, changes that occur well into the process require reassessment for each technical analysis, causing delay. It is not uncommon to see major project changes in such critical areas as cooling technology, water source, gas line routes, transmission line routes or facility layouts late in the process, all of which cause delays. Projects that come in as complete as possible following the best practices guidelines should be able to complete the licensing process faster and with fewer mitigation costs, thereby assuring project proponents, investors, regulators, and the public of a project’s viability and certainty in terms of its integration into the larger electrical system.
In addition, efforts are underway to improve the docketing process and to implement an e‐filing process, which should increase the ease of submitting documents and reduce transaction costs for applicants.
Evidence and Hearings The Energy Commission is making a concerted effort to review the evidentiary hearing process and development of the hearing record. Staff is in the process of answering the following questions:
• Are evidentiary hearings always needed?
• When a hearing is required, can the proceeding be more focused?
• What evidence is admissible versus what can be relied on for a decision?
• Does the public find the process user‐friendly?
The goal is to create a process that is flexible enough to allow uncontested projects a more informal process while maintaining a formal hearing structure for projects with significant environmental issues or controversy.
Public Process The Energy Commission’s siting regulations require that “all hearings, presentations, conferences, meetings, workshops and site visits shall be open to the public” [emphasis added] (Cal. Code Regs., tit. 20, § 1710) and that “all meetings shall be noticed…” no less than ten days in advance (Cal. Code Regs., tit. 20, § 1718). However, section 1710 (h) allows an applicant to “... formally exchange information or discuss procedural issues with Energy Commission staff without a publicly noticed workshop.” This means that the Energy Commission has to notice any discussions related to substance (for example, mitigation) and hold a workshop.
The Energy Commission and other stakeholders question these particular meeting restrictions, since staff does not make the decisions, and these restrictions are typically greater than those on staff at other agencies (such as the CPUC). As expected, most intervenors have traditionally opposed relaxing the existing noticing requirements, as they take the position that staff is already working too closely with the applicant. Staff expects this issue to be a discussion topic at future workshops.
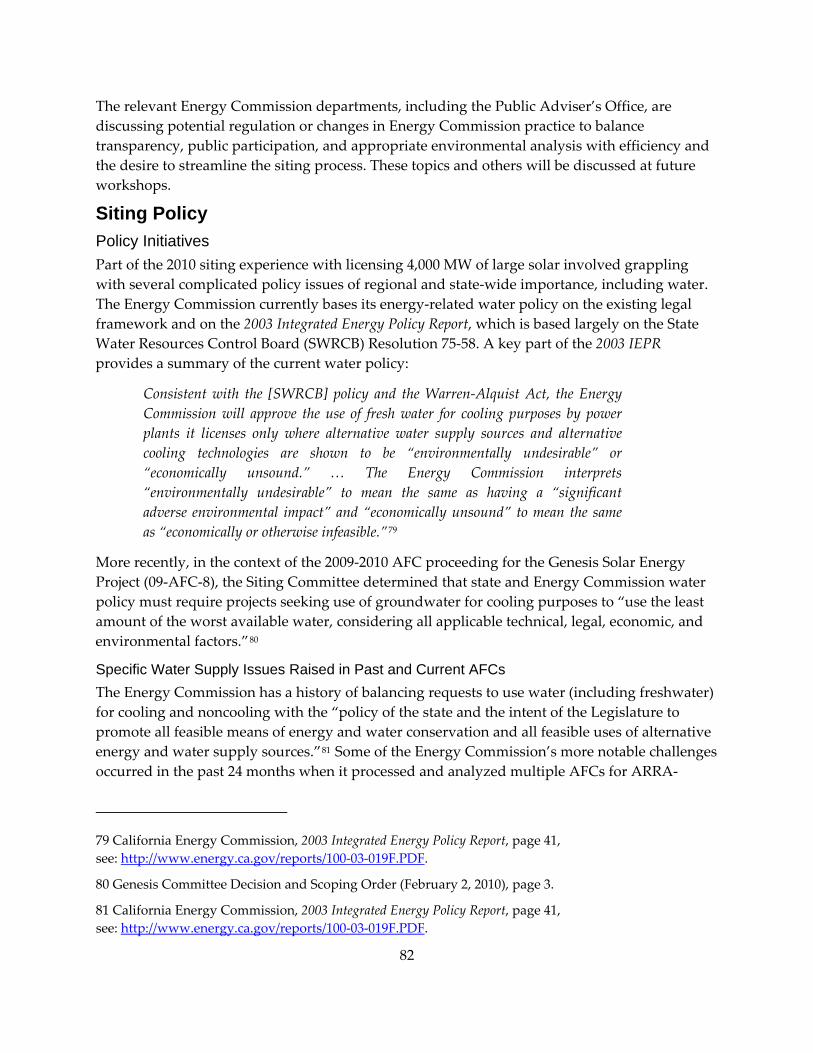
82
The relevant Energy Commission departments, including the Public Adviser’s Office, are discussing potential regulation or changes in Energy Commission practice to balance transparency, public participation, and appropriate environmental analysis with efficiency and the desire to streamline the siting process. These topics and others will be discussed at future workshops.
Siting Policy Policy Initiatives Part of the 2010 siting experience with licensing 4,000 MW of large solar involved grappling with several complicated policy issues of regional and state‐wide importance, including water. The Energy Commission currently bases its energy‐related water policy on the existing legal framework and on the 2003 Integrated Energy Policy Report, which is based largely on the State Water Resources Control Board (SWRCB) Resolution 75‐58. A key part of the 2003 IEPR provides a summary of the current water policy:
Consistent with the [SWRCB] policy and the Warren‐Alquist Act, the Energy Commission will approve the use of fresh water for cooling purposes by power plants it licenses only where alternative water supply sources and alternative cooling technologies are shown to be “environmentally undesirable” or “economically unsound.” … The Energy Commission interprets “environmentally undesirable” to mean the same as having a “significant adverse environmental impact” and “economically unsound” to mean the same as “economically or otherwise infeasible.”79
More recently, in the context of the 2009‐2010 AFC proceeding for the Genesis Solar Energy Project (09‐AFC‐8), the Siting Committee determined that state and Energy Commission water policy must require projects seeking use of groundwater for cooling purposes to “use the least amount of the worst available water, considering all applicable technical, legal, economic, and environmental factors.”80
Specific Water Supply Issues Raised in Past and Current AFCs The Energy Commission has a history of balancing requests to use water (including freshwater) for cooling and noncooling with the “policy of the state and the intent of the Legislature to promote all feasible means of energy and water conservation and all feasible uses of alternative energy and water supply sources.”81 Some of the Energy Commission’s more notable challenges occurred in the past 24 months when it processed and analyzed multiple AFCs for ARRA‐
F79 California Energy Commission, 2003 Integrated Energy Policy Report, page 41, see: http://www.energy.ca.gov/reports/100‐03‐019F.PD .
80 Genesis Committee Decision and Scoping Order (February 2, 2010), page 3.
81 California Energy Commission, 2003 Integrated Energy Policy Report, page 41, see: http://www.energy.ca.gov/reports/100‐03‐019F.PDF.

83
eligible solar projects (including whether the use of groundwater for power plant cooling, industrial, or construction purposes is a reasonable use or reasonable method of use of water).
There is no clear directive prohibiting the use of fresh water for power plant cooling, or for industrial and construction purposes, nor is there a clear allowance to use brackish or high total dissolved solids (TDS) water for these uses. Even brackish and high TDS water can be suitable for municipal or domestic supply, depending on the totality of the circumstances. Many desert groundwater basins are not managed in accordance with a groundwater management plan, and there is limited information for conducting accurate modeling. This puts a precious resource at significant risk when there is no coordinated plan of basin operation unless the Energy Commission applies a very conservative set of conditions to ensure protection. This can make desert renewable energy projects expensive and thus affect consumer electricity rates.
The state has mandated water conservation goals (for example, Pub. Resources Code § 25008) and an increase in the use of recycled water (State Water Resources Control Board Recycled Water Policy, Resolution No. 2009‐0011 [May 14, 2009]), yet many projects licensed by the Energy Commission in the past continue to use significant volumes of relatively fresh water. Alternative supplies are becoming available, and the Energy Commission can play a role in meeting the water use reduction targets.
The beneficial uses of water and the prospect of power plants consuming groundwater, freshwater, or recycled water may adversely impact, frustrate, or prevent the use of these water sources by new residential subdivisions, commercial, or other industrial purposes in the future, (and vice versa).
Developing New Water Policy The following options are for the Siting and IEPR Committees to consider for helping improve the power plant licensing process in relation to water consumption:
• Eliminate the distinction between cooling and noncooling uses of water by power plants.
• Promote best management practices or establish a hierarchy of water use options (for example, dry cooling plus recycled water for all nonpotable uses; recycled water for both cooling and all other nonpotable uses; high TDS water; and so forth), as opposed to firm requirements.
• Determine conformity of the Energy Commission’s water policy on a case‐by‐case basis.
• Change data adequacy regulations; for example, provide information sufficient for detailed showing of economic (in) feasibility of dry cooling, recycled water use, zero liquid discharge, and so forth.
• Examine water use efficiency/cycles of concentration and combinations of technology that make the most sense and identify them as a priority.
• Establish firm thresholds for water use by power plants; for example, efficiency standards (maximum acre‐feet per Year [AFY] per MW); or, alternatively, require that water use be as efficient as possible.

84
• Universally proscribe the use of evaporation ponds.
• Universally require the use of recycled water for cooling, mirror washing, and other industrial purposes.
• Universally require the use of dry cooling.
• Adopt a policy of requiring recycled water except where 1) there are feasible alternatives and 2) the recycled water is demonstrated to be used for current or future needs.
• Groundwater adjudications shall not be a substitute for an independent staff evaluation of a project’s groundwater impacts.
• Proscribe any water use that causes impacts to the Delta or Colorado River water supplies.
• Declare that water – regardless of quality – that is deep inside an aquifer and not being used (even indirectly) by people, plants, or animals, cannot be used by power plants and must be saved.
Proposed Draft New Water Policy The Energy Commission plays a mandatory and critical role in implementing and promoting the state’s water policies and goals. Vested with exclusive authority to license all thermal solar power plants in California 50 MW or greater, the Energy Commission is a leader in protecting the physical environment by regulating, among other things, the ability of power facilities to consume any water.
Since the adoption of the water policy in the 2003 IEPR, the Energy Commission has permitted the use of groundwater for cooling purposes in only two cases – the Blythe Energy Project Phase II (520 MW) and the Abengoa Mojave Solar Power Project (250 MW). In other cases, the Energy Commission has permitted the use of groundwater for noncooling where water conservation measures would completely mitigate the project’s impacts to groundwater basins. Given California’s dynamic water conditions and the increasing number of energy projects being developed in the desert, the Energy Commission needs to update the 2003 IEPR water policy statement.
Next Steps The OII “Lessons Learned” proceeding will continue drafting various white papers and the scheduling of public workshops, leading up to a process of publishing draft recommendations for the Committee and Energy Commission’s consideration on the topics discussed above. Depending on the nature of the recommendations, there is the possibility that the Energy Commission may adopt an Order Instituting Rulemaking proceeding, for updating and augmenting the rules and regulations that guide and define the Energy Commission’s Siting, Transmission, and Environmental Protection Division and its work.

85
CHAPTER 6: Energy Commission Natural Gas Assessment This chapter summarizes the Energy Commission’s staff draft 2011 Natural Gas Market Assessment: Outlook that was prepared in support of the draft 2011 IEPR.82 The Energy Commission, California Environmental Protection Agency, California Air Resources Board (ARB), California Public Utilities Commission (CPUC), and the California Independent System Operator (California ISO) recognize that natural gas plays a significant and ongoing role in California’s energy supply, especially for electricity generation and for meeting the state’s clean energy and environmental goals. Natural gas resources will continue to be essential in meeting California’s energy demand, and procurement and resource adequacy programs will deliver resources needed for system and local reliability requirements and system operational needs.
Natural gas will play a role in supporting renewable integration, and therefore the existing thermal power plant fleet will have to be modified to provide increased operational flexibility, ramping capability and regulation services, lower operating limits, and more frequent start/stop operation. This modification will allow the state to integrate substantial amounts of intermittent renewable generation while generating the least amount of greenhouse has (GHG) emissions. State agencies and the California ISO will develop the appropriate procurement and market rules to provide the revenues for implementing these changes and for covering additional operating and maintenance costs.
Future Role of Natural Gas in California’s Economy and Energy Supply California must retire, repower, replace, and/or mitigate once‐through cooling (OTC) thermal power plants to improve coastal and estuarine environmental quality as required by the State Water Resources Control Board. A major challenge with this transition is that these older power plants are typically located in transmission‐constrained areas that require local generation. Remotely located renewable resources can provide some of the needed replacement capacity but will require new or upgraded transmission lines to deliver electricity to the load centers. The advantage is that the new (or repowered) facilities (for example, solar thermal power plants) are more efficient than those they replace, which will help reduce GHG emissions.83
Over the long term, new natural gas‐fired power plants (including combined heat and power plants), combined with energy efficiency and central station and distributed renewable
82 California Energy Commission, 2011 Natural Gas Market Assessment: Outlook, draft staff report, September 2011, http://www.energy.ca.gov/2011publications/CEC‐200‐2011‐012/CEC‐200‐2011‐012‐SD.pdf
83 California Energy Commission, California’s Clean Energy Future, An Overview on Meeting California’s Energy and Environmental Goals in the Electric Power Sector in 2020 and Beyond, CEC‐100‐2010‐002, page 5.

86
generation, will replace baseload generation from retiring coal‐fired and possibly nuclear power plants. Complex economic, environmental, and public safety issues make the magnitude and timing of these power plant retirements uncertain. The use of natural gas as a transportation fuel in compressed natural gas vehicles, and as a feedstock to make methanol additives for cleaner‐burning gasoline, may give natural gas a “bridging” role in attaining CCEF goals. However, the penetration of natural gas in the transportation sector is also uncertain. The relatively short lead time for licensing gas‐fired power plants positions them as a viable option to mitigate such contingencies.
Due to its thermal efficiency and relatively clean combustion, natural gas will continue as a significant energy supply source for residential, commercial, and industrial end uses such as cooking, space heating, and to fuel boilers and process heaters. In the longer term, the role of natural gas in these sectors may diminish as energy efficiency and conservation, renewable substitutes such as solar thermal or biogas applications, and electrification become more cost‐effective or play a larger role in meeting the state’s climate change goals. While natural gas serves as a feedstock to manufacture plastics, fertilizers, antifreeze, pharmaceuticals, and fabrics, additional factors besides energy and environmental policies will determine future demand for these end uses.
Natural Gas Uncertainties Whether by choice or necessity, natural gas will play a significant role in California’s energy future. This conclusion prompts the following basic questions:
• To what extent will California’s future energy supply include natural gas—what might be the demand for natural gas?
• What will be the cost to California of this demand for natural gas—at what price might it be available?
• What can be done to understand and to manage the risks associated with this role of natural gas in California’s energy supply?
Most parties agree that it is not feasible to make single‐point forecasts of future gas prices and other market activities, and that it may not be particularly useful. This is a necessary consequence of the gas market’s complexity, large menu of competing options for actions, and deep uncertainties about future underlying conditions that are beyond anyone’s control.
The Energy Commission does not expect the forecast to predict the future but does expect it to be informative about possible futures. Exploring possible future gas market outcomes under a wide range of plausible underlying conditions is useful for understanding the consequences of policy choices. By providing a range of conditional estimates of outcomes, this approach can decrease the chance of being unpleasantly surprised by a future not considered and the negative consequences resulting from actions taken under conditions that did not materialize.
Despite the inability of anyone to accurately predict future gas market outcomes, many people – including California’s public policy makers – need to make decisions based on an expectation of what those outcomes might be. For example, the California policy to ʺimplement all cost‐

87
effective energy efficiencyʺ requires a cost‐effectiveness analysis of potential energy efficiency measures and programs. So, having some expectation of future gas prices (and other effects of gas extraction, transportation, and use) is a requirement of this analysis and decision‐making.
Staff is improving the analytical process on an ongoing bases and has committed to using its models to develop insights rather than simply quantitative results; comparing results of staff model runs to other relevant studies; evaluating alternative scenarios or futures using different sets of assumptions; explaining both what is known and unknown; and making every attempt to present the results fully and clearly.
Exploring California’s Potential Gas Price Vulnerability The Energy Commission, participants in the 2011 IEPR proceeding, other government agencies, academic institutions, and energy consultants provided a natural gas market assessment that provides an understanding of the potential consequences of California’s role for natural gas. The following section discusses what some of these assessments have revealed about the plausible ranges of natural gas prices for California.
Natural gas is a heavily traded commodity in a market characterized by inherent volatility. Over the last decade, daily spot market prices for natural gas traded at Louisiana’s benchmark Henry Hub have spiked several times. Figure 3 shows the prices over the past decade, in current year or nominal dollars. The winter periods of 2000‐2001 and 2003‐2004 saw prices spike to $10.00 per million British thermal units (MMBTU) and $18.00/MMBTU, respectively. Cold weather, which increased demand and put upward pressure on prices, triggered these increases. In September 2005, hurricanes Katrina and Rita caused natural gas production wells in the Gulf Coast to be shut in, which lowered available supply and caused prices to spike to over $15.00/MMBTU.
Since late 2008, daily spot market prices have trended lower (in the $4.50 to $5.00 range) and only once did prices increase above $6.00 (in 2009). The lower prices following the 2008 price spike can be explained by two factors. The late‐2008 economic recession reduced overall demand for natural gas, especially in the industrial and power generation sectors. This lower natural gas demand had a negative effect on prices. Secondly, large amounts of shale gas are now becoming technically and economically recoverable at relatively low costs. This injection of shale gas into the market increased the supply of gas available to consumers and thus helped to lower the price. Over the last year (April 2010‐April 2011), Henry Hub daily spot prices have averaged $4.15/MMBTU.
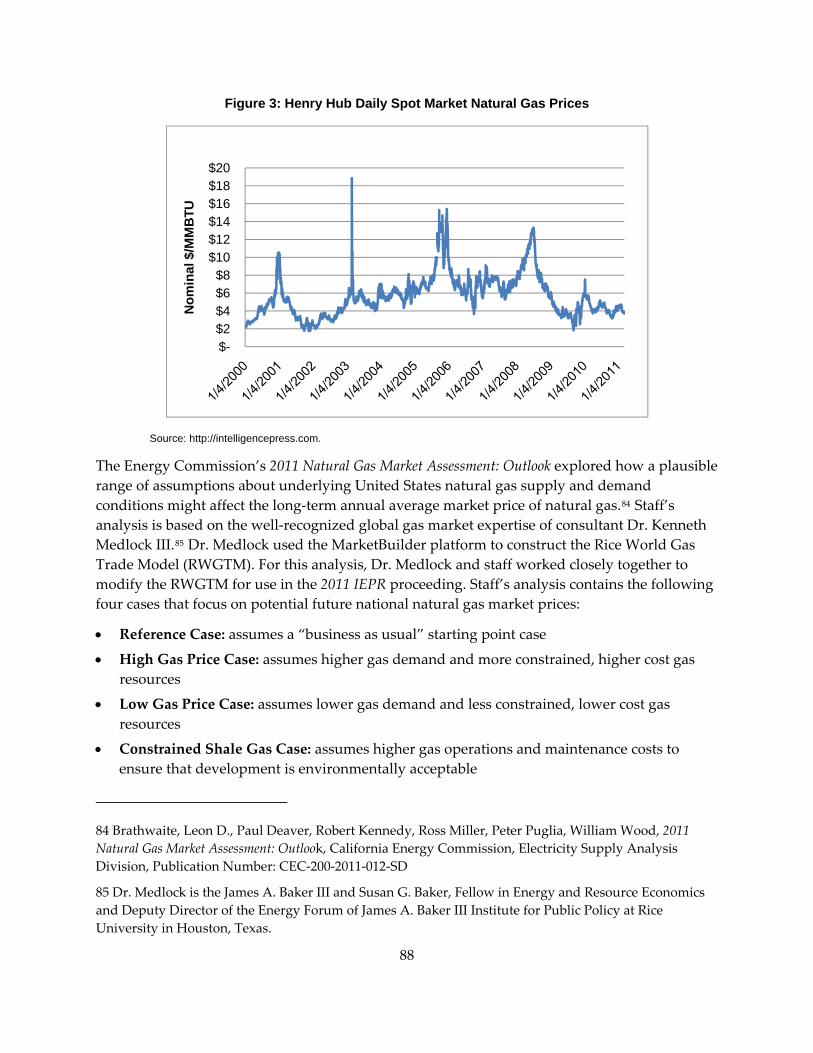
Figure 3: Henry Hub Daily Spot Market Natural Gas Prices
$-$2 $4 $6 $8
$10 $12 $14 $16 $18 $20
Nom
inal
$/M
MB
TU
Source: http://intelligencepress.com.
The Energy Commission’s 2011 Natural Gas Market Assessment: Outlook explored how a plausible range of assumptions about underlying United States natural gas supply and demand conditions might affect the long‐term annual average market price of natural gas.84 Staff’s analysis is based on the well‐recognized global gas market expertise of consultant Dr. Kenneth Medlock III.85 Dr. Medlock used the MarketBuilder platform to construct the Rice World Gas Trade Model (RWGTM). For this analysis, Dr. Medlock and staff worked closely together to modify the RWGTM for use in the 2011 IEPR proceeding. Staff’s analysis contains the following four cases that focus on potential future national natural gas market prices:
• Reference Case: assumes a “business as usual” starting point case
• High Gas Price Case: assumes higher gas demand and more constrained, higher cost gas resources
• Low Gas Price Case: assumes lower gas demand and less constrained, lower cost gas resources
• Constrained Shale Gas Case: assumes higher gas operations and maintenance costs to ensure that development is environmentally acceptable
84 Brathwaite, Leon D., Paul Deaver, Robert Kennedy, Ross Miller, Peter Puglia, William Wood, 2011 Natural Gas Market Assessment: Outlook, California Energy Commission, Electricity Supply Analysis Division, Publication Number: CEC‐200‐2011‐012‐SD
85 Dr. Medlock is the James A. Baker III and Susan G. Baker, Fellow in Energy and Resource Economics and Deputy Director of the Energy Forum of James A. Baker III Institute for Public Policy at Rice University in Houston, Texas.
88

89
Key input assumptions for the Reference Case, highlighting those assumptions that change in at least one of the changed cases, include the following:
• Average annual growth rate in U.S. gross domestic product is 2.7 percent.
• The marginal cost curve for gas supplies reflects year 2011 vintage state of knowledge about the underlying gas resource base and production technologies.
• Average annual rate of “learning” improvement in gas technology is 1 percent.86
• Shale gas development in New York is constrained per current moratorium.
• Iran, Iraq, and Venezuela do not enter the market until 2020.
• Liquefied natural gas exports are allowed to occur.87
• Pipeline capacity additions are allowed to occur.
• The future power generation mix for U.S. states follows current trends based on U.S. Energy Information Administration (EIA) state level historical data except renewable generation:
o California meets its existing RPS target in 2020,
o Other states with an RPS meet targets five years late,
o Growth of renewable generation in states without RPS targets follows past trends.
The High Gas Price Case made plausible assumptions that would move natural gas market prices higher than in the Reference Case. On the demand side, the economy is growing strongly (at 3.5 percent annually), while 55,000 MW of retiring coal‐fired power plants and a slowing of renewable generation programs are leading to increased natural gas demand for electric generation. On the supply side, some jurisdictions are restricting the development of natural gas resources, particularly shale formations. Also, in places where production continues, safety concerns over hydraulic fracturing, water use and disposal, and other potential impacts are causing environmental compliance costs to rise.
Technology development dominates the Low Gas Price Case. On the demand side, the economy is weak, with annual Gross Domestic Product growth capped at 2.1 percent. All states with RPS programs are complying on time, thereby reducing the need for gas‐fired generation. On the supply side, environmental concerns are decreasing as technological developments allow deployment of adequate environmental mitigation without significant overall cost increases. Jurisdictions that restricted natural gas development are starting to ease regulations. Technology learning improvements increase to 2.5 percent annually.
86 “Learning improvement” means increased productivity achieved through practice, self‐perfection, and minor innovations.
87 The phrase “allowed to occur” here means that their occurrence is not prohibited and that the feature may appear in a result in any case, dependent on the model’s evaluation of the feature’s commercial viability given the endogenous outlook for gas prices (past, present, and future) in that case.
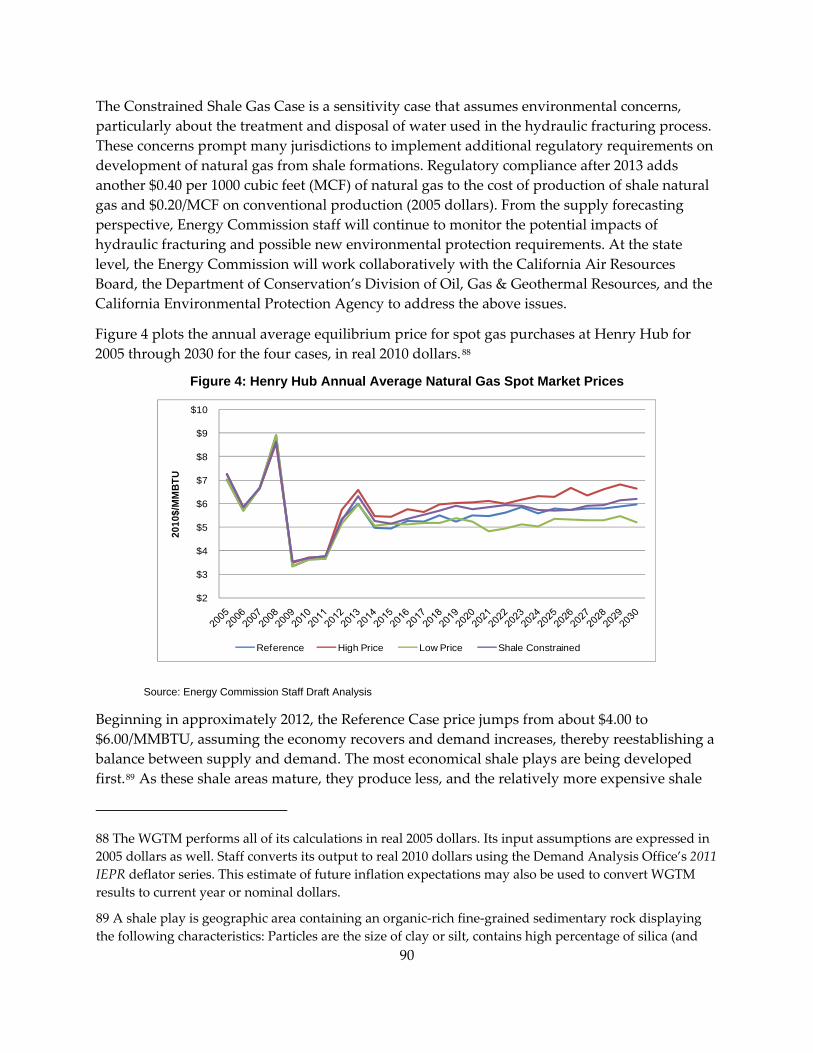
The Constrained Shale Gas Case is a sensitivity case that assumes environmental concerns, particularly about the treatment and disposal of water used in the hydraulic fracturing process. These concerns prompt many jurisdictions to implement additional regulatory requirements on development of natural gas from shale formations. Regulatory compliance after 2013 adds another $0.40 per 1000 cubic feet (MCF) of natural gas to the cost of production of shale natural gas and $0.20/MCF on conventional production (2005 dollars). From the supply forecasting perspective, Energy Commission staff will continue to monitor the potential impacts of hydraulic fracturing and possible new environmental protection requirements. At the state level, the Energy Commission will work collaboratively with the California Air Resources Board, the Department of Conservation’s Division of Oil, Gas & Geothermal Resources, and the California Environmental Protection Agency to address the above issues.
Figure 4 plots the annual average equilibrium price for spot gas purchases at Henry Hub for 2005 through 2030 for the four cases, in real 2010 dollars. 88
Figure 4: Henry Hub Annual Average Natural Gas Spot Market Prices
$2
$3
$4
$5
$6
$7
$8
$9
$10
2010
$/M
MBT
U
Reference High Price Low Price Shale Constrained
Source: Energy Commission Staff Draft Analysis
Beginning in approximately 2012, the Reference Case price jumps from about $4.00 to $6.00/MMBTU, assuming the economy recovers and demand increases, thereby reestablishing a balance between supply and demand. The most economical shale plays are being developed first.89 As these shale areas mature, they produce less, and the relatively more expensive shale
88 The WGTM performs all of its calculations in real 2005 dollars. Its input assumptions are expressed in 2005 dollars as well. Staff converts its output to real 2010 dollars using the Demand Analysis Office’s 2011 IEPR deflator series. This estimate of future inflation expectations may also be used to convert WGTM results to current year or nominal dollars.
89 A shale play is geographic area containing an organic‐rich fine‐grained sedimentary rock displaying the following characteristics: Particles are the size of clay or silt, contains high percentage of silica (and
90

plays start bringing supply to market. Beyond 2015, the price remains fairly flat, growing from about $5.00/MMBTU to just under the $6.00/MMBTU by 2030 (in 2010 dollars).
The Henry Hub annual average spot price in the High Gas Price Case reaches $6.00/MMBTU by 2018 (12 years before the Reference Case hits that mark) and somewhat levels off below $6.80/MMBTU (in 2010 dollars) by 2030. The case projects that shale will be the marginal source of natural gas for the next 10 years and beyond. The higher environmental compliance costs assumed in the Constrained Shale Gas Case puts the resulting prices in between the Reference and High Gas Cost cases, as expected. The Low Gas Price Case Henry Hub prices hover around $5.00/MMBTU thru 2024, increasing to about $5.30/MMBTU afterward (in 2010 dollars).
Participants in the 2011 IEPR proceeding cautioned that staff’s range of future annual average Henry Hub spot market prices might be too narrow—that future prices could possibly be higher or lower. El Paso offered a case that is lower than staff’s Reference Case until 2017 but higher afterward. Staff and other parties generally agree that a significant contributing factor to staff’s narrow price range is the underlying assumption that the gas resource marginal supply curves are all relatively flat and remain so, even across the cases that modify them significantly.
Figure 5 illustrates how staff’s assumptions about marginal gas supply curves differ between 2007 IEPR and 2011 IEPR Reference Cases.
Figure 5: Marginal Gas Supply Curves for National Cases
0.00
2.00
4.00
6.00
8.00
10.00
12.00
14.00
16.00
0 200 400 600 800 1000 1200 1400 1600 1800
Mar
gin
al C
ost,
20
05
$ -
20
06
$ p
er T
hou
san
d C
ubi
c Fe
et
Cumulative Reserve Additions, Trillion of Cubic Feet
Reference Case (IEPR 2007) Approx. HiPrice Case (2011)
Reference Case (IEPR 2011) LoPrice Case (IEPR 2011)
Source: California Energy Commission Staff Draft Analysis
sometimes carbonates), is thermally mature, has hydrocarbon‐filled porosity and low permeability, is distributed over a large area, and economic production requires fracture stimulation.
91

92
The curves represent the summation of all of the different supply curves for each natural gas play. The significant increase in gas supply reflects staff’s recently gained knowledge about North American shale gas resources – that much more natural gas is available (and accessible at lower cost) than previously thought.
Both Reference Case curves make use of an “expected value” assessment of the quantities of recoverable gas resources (proved reserves plus a “P50”assessment of growth in known reserves and undiscovered resources). By industry convention, the P50 assessments mean there is a 50 percent probability that at least this much gas is recoverable from that play using current technology. To increase the spread of resulting gas prices, additional cases might be run, which assume higher probability but lower resource amounts (such as P75 or P90 cases) and lower probability but higher resource amounts (such as P25 or P10). Interpreting the result of these cases should be done carefully, however, as this method effectively introduces a one‐sided bias into the resource assessment.90
Staff’s marginal costs in the supply curves assume an overall finding and development cost environment that is about equal to the average costs observed over the past 30 years (in real dollars). To increase the spread of resulting gas prices, staff can run additional cases that assume higher or lower than average cost environments. Given that this assumption is held constant throughout the modeling time horizon, it is problematic to run the model assuming either very high or very low sustained long‐term cost environments, as such conditions have not been observed in the industry. Again, careful attention would be required in interpreting the results of such cases.
Figure 5 also shows the cumulative effect on the Reference Case’s marginal gas supply curve from changes in assumptions in the High and Low Gas Price cases (moving the supply curves to the left and right, respectively). The Constrained Shale Gas case uses the same marginal supply curve as the Reference Case. Its higher environmental mitigation costs are added to variable operating costs, which are not included in the supply curves. Assuming a wider range of environmental mitigation costs, or other variable operating costs, would be another way to increase the spread of resulting model prices.
Cases from other natural gas market assessments do show a wider range of possible future gas prices than those of the Energy Commission’s. Ideally, the assumptions and methods used in these cases are transparent enough for staff to assess their plausibility and compare them to the Energy Commission cases, and, as a result draw useful insights. The U.S. Energy Information Administration’s Annual Energy Outlook 2011 (AEO 2011) is a source of such useful comparisons.
Figure 6 compares annual average Henry Hub spot market prices for staff’s Reference Case and High and Low Gas Price cases to the AEO 2011 Reference Case and four other cases specifically
90 Some plays will be discovered to have more resources than the expected value and some fewer. The preferred method of simulating this would be to run the model stochastically, randomly drawing from the probability distribution of each resource curve, cumulating the results within the model.
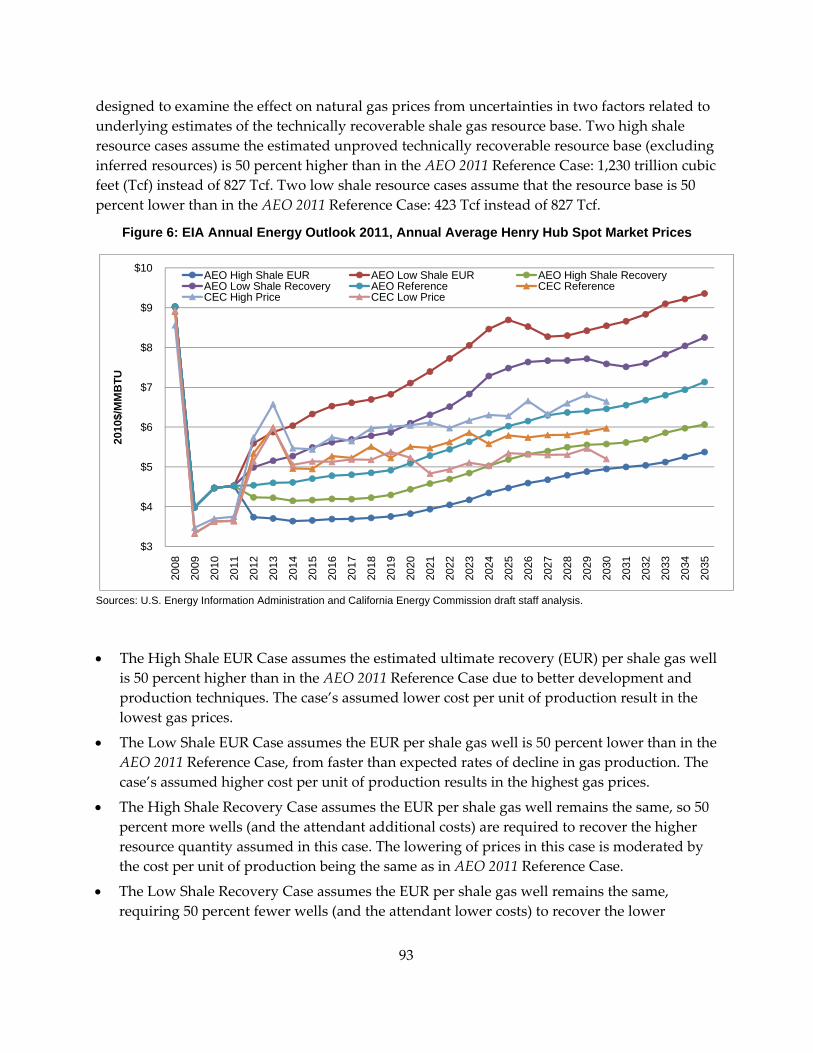
designed to examine the effect on natural gas prices from uncertainties in two factors related to underlying estimates of the technically recoverable shale gas resource base. Two high shale resource cases assume the estimated unproved technically recoverable resource base (excluding inferred resources) is 50 percent higher than in the AEO 2011 Reference Case: 1,230 trillion cubic feet (Tcf) instead of 827 Tcf. Two low shale resource cases assume that the resource base is 50 percent lower than in the AEO 2011 Reference Case: 423 Tcf instead of 827 Tcf.
Figure 6: EIA Annual Energy Outlook 2011, Annual Average Henry Hub Spot Market Prices
$3
$4
$5
$6
$7
$8
$9
$10
2008
2009
2010
2011
2012
2013
2014
2015
2016
2017
2018
2019
2020
2021
2022
2023
2024
2025
2026
2027
2028
2029
2030
2031
2032
2033
2034
2035
2010
$/M
MB
TU
AEO High Shale EUR AEO Low Shale EUR AEO High Shale RecoveryAEO Low Shale Recovery AEO Reference CEC ReferenceCEC High Price CEC Low Price
Sources: U.S. Energy Information Administration and California Energy Commission draft staff analysis.
• The High Shale EUR Case assumes the estimated ultimate recovery (EUR) per shale gas well is 50 percent higher than in the AEO 2011 Reference Case due to better development and production techniques. The case’s assumed lower cost per unit of production result in the lowest gas prices.
• The Low Shale EUR Case assumes the EUR per shale gas well is 50 percent lower than in the AEO 2011 Reference Case, from faster than expected rates of decline in gas production. The case’s assumed higher cost per unit of production results in the highest gas prices.
• The High Shale Recovery Case assumes the EUR per shale gas well remains the same, so 50 percent more wells (and the attendant additional costs) are required to recover the higher resource quantity assumed in this case. The lowering of prices in this case is moderated by the cost per unit of production being the same as in AEO 2011 Reference Case.
• The Low Shale Recovery Case assumes the EUR per shale gas well remains the same, requiring 50 percent fewer wells (and the attendant lower costs) to recover the lower
93

94
resource quantity assumed in this case. The raising of prices in this case is also moderated by the cost per unit of production being the same as in AEO 2011 Reference Case.
The range of Henry Hub prices from the AEO 2011 cases bound the range of prices in staff’s cases. The explanations for all of these cases are fairly consistent. The more extreme AEO 2011 cases illustrate the effects on prices from changing assumptions related to gas resource supply curves. Stakeholders suggested staff’s analysis did not stress this enough. While Figure 6 may provide a more useful picture of the potential range for annual average prices (between $5.00 and $8.50 in 2010 dollars), the process for developing these cases affects how they are interpreted and compared to others. The four outlying AEO 2011 cases are less likely to be observed than the other cases, simply because they were constructed by moving away from the currently “expected” value for those assumptions.
Managing Potential Natural Gas Risks Given the significant role of natural gas in California, any decision involving an expectation of future energy prices or avoided energy costs will require an assumption about future natural gas prices.91 Model‐based natural gas market assessments can provide conditional estimates of these prices, but their utility depends on a transparent description of assumptions, an understanding of their inherent limitations, a useful design for alternative cases, and a reflective interpretation and use of results.
Considering the possibility and consequences of both high and low price outcomes helps guard against one‐sided biases. Generally, when using a conditional estimate, it is prudent to examine the potential consequences of using one estimate for a specific purpose should the future estimate turn out to be different. This is especially true when the experts have no defensible argument for one estimate being more likely to occur than another (although outcomes not deemed “most likely” will still occur). For example, decisions based on assumptions that future gas prices will be low could have significant negative consequences if gas prices turn out to be high, and vice versa. The consequences depend on the specific use of the conditional estimates, whether it is an individual using the estimate to purchase a more energy efficient furnace, or a utility assessing the cost‐effectiveness of a proposed energy efficiency program.
The users’ own assessments of potential regret associated with their use of available alternative estimates may help them choose, based on their level of risk tolerance, the most prudent gas price estimate. What results is a decision that has a better chance of performing acceptably over a wide range of possible futures. Gas market analysts can advise these purpose‐specific decision
91 For example, natural gas price assumptions can be key to understanding how to measure cost‐effective energy efficiency measures and programs (and what consumers may choose to do); what it costs to add renewable central station or distributed generation to the energy portfolio; the value of carbon allowances; the value of Renewable Energy Credits; the cost of using more natural gas in vehicle fuel compliance with the LCFS; the cost of electricity if gas is on the margin during hours when EVs are being recharged; and how consumers will perceive the cost of gas pipeline system retrofits/upgrades.

95
analyses but cannot conduct them, as they require knowledge and details about the specific uses of the estimates and how consequences play out.92 ,93
Potential Effects of the Gas Pipeline Explosion in San Bruno On September 9, 2010, a 30‐inch‐diameter, high pressure natural gas transmission pipeline exploded under a neighborhood street in San Bruno, California. The explosion of Line 132, owned by Pacific Gas and Electric (PG&E), killed 8 people and destroyed 37 homes. In addition to the tragic loss of lives and destruction of a neighborhood, the explosion resulted in a temporary evacuation, longer‐term community disruption, and widespread concerns regarding public safety. The CPUC and the National Transportation Safety Board (NTSB) both launched investigations into the explosion. The Energy Commission responded by transferring Public Interest Energy Research Program funds to the CPUC, making them available for safety research, and by offering assistance to the CPUC, California Independent System Operator (California ISO), and PG&E. As discussed below, the Energy Commission is closely monitoring for potential impacts to natural gas service or markets that might result from pressure reductions or lines being taken out of service for testing as the CPUC and the gas utilities work to assure the safety of California’s pipeline system.
The CPUC initially ordered pressure reductions as an immediate response to the explosion. Then, in January, the NTSB announced that the failed segment of Line 132 has been longitudinally seamed, contrary to PG&E’s records showing the segment was seamless. As a result, the NTSB encouraged – and the CPUC ordered – PG&E to begin searching for “traceable, verifiable, and complete” records to confirm the features and maximum allowable operating pressure (MAOP) of its pipelines in “High Consequence Areas” (HCAs). The CPUC also ordered PG&E to reduce operating pressures on lines of similar vintage and characteristics to Line 132 located in HCAs by 20 percent below the MAOP.
The CPUC expanded this in June when it issued an order as part of Order Instituting Rulemaking 11‐02‐019 into new pipeline safety rules, directing PG&E, Southern California Gas, San Diego Gas & Electric, and Southwest Gas to pressure test or replace all pipelines, not just those in HCAs, for which the operators do not have “traceable, verifiable, and complete” records of MAOP. This testing is expected to take several years. Until this is complete, pressure levels may be reduced to 20 percent below MAOP.
92 For example, the question of which energy efficiency measure is cost‐effective is about the conditional estimates of the proposed measure’s cost and performance as much as it is about the cost of the fuel their success may avoid.
93 For a discussion of how a regret analysis can help users of forecasts manage their risks of using forecasts that turn out to be inaccurate, see Looking Before Leaping: Are Your Utility’s Gas Price Forecasts Accurate? Ken Costello, National Regulatory Research Institute, May 2010. http://www.nrri.org/pubs/gas/NRRI_gas_price_forecasting_may10‐08.pdf.

96
PG&E then lowered operating pressures on several additional pipeline segments based on its June 30 “Class Location Study.” The Class Location Study found that several of PG&E’s pipelines were misclassified, leading to those pipeline segments operating at too high a pressure given the pipeline segment’s proximity to homes and businesses.
The Energy Commission has closely monitored the testing schedule and operating pressures for any impacts on service to natural gas consumers, including the natural gas‐fired power plants that California relies on for about 41.9 percent of its electricity. Such impacts could occur based on three key factors. First, reducing operating pressure in a pipeline effectively reduces the amount of natural gas that can be delivered through that pipeline in a given period. Such reductions, in a high demand period could lead to curtailments in gas service and are analyzed further below. To date, PG&E has reported no curtailments to customers as a result of reducing the MAOP by 20 percent on some of its pipelines. Second, lower pressures reduce PG&E’s daily operating flexibility. This flexibility is embodied in what PG&E calls “pipeline system inventory.” The inventory describes a minimum and maximum amount of natural gas that PG&E needs in the pipeline system to meet demand. Normally the range between the minimum and maximum is 600 million cubic feet (MMcf). With the additional pressure reductions necessitated by the findings of the Class Location Study, PG&E’s 600 MMcf per day permissible inventory swing has become only 200 MMcf per day. PG&E has therefore, since around July 1, been issuing high and low inventory Operational Flow Orders (OFO) simultaneously, on the same day. This means that customers must more closely match their deliveries of gas into the PG&E system with their daily usage. This situation is likely to prevail until PG&E is able to return those segments to their prior MAOP. While generators have asked the California ISO if they will be reimbursed for costs incurred as a result of the tighter balancing tolerances, and some third‐party balancing service agreements may have been modified, staff has detected no impact on gas market prices paid by Californians as a result of the tighter balancing.
Third, hydrostatic testing means taking pipeline segment out of service for several days. If the test causes the pipeline to fail, then it must be replaced, during which time the segment remains out of service. To date, PG&E has had two segments fail hydrostatic testing: one near Bakersfield on Line 300A and one near Woodside on Line 132. (PG&E also discovered via testing a leak on Line 132 in Palo Alto). In each of these cases, and as long as the testing continues to occur outside of high demand periods, PG&E should have the ability to reroute natural gas to continue service to nearby customers, including gas‐fired electricity generating plants. The Energy Commission is working with its sister agencies to provide information and contingency planning support to address any potential outages during the testing.
Energy Commission staff analyzed the impact that flow reductions due to lower operating pressures (on what is known as the “backbone” portion of PG&E’s transmission system). 94 At
94 This analysis is fully described in Chapter 5 of 2011 Natural Gas Market Assessment: Outlook, Leon Brathwaite, 200‐2011‐012SD, see: http://www.energy.ca.gov/2011publications/CEC‐200‐2011‐012/CEC‐200‐2011‐012‐SD.pdf.

97
their worst, PG&E’s flow reductions amounted to a loss of about 500 MMcf/d. Staff first looked at whether the reduced flows would affect PG&E’s ability to fill underground gas storage during summer months. Analysis showed that PG&E should be able to inject into storage most, if not all, of the gas it needs to protect service to core customers even with the reduced operating pressures and lower gas flows. As discussed at September’s IEPR Committee Workshop on natural gas, noncore customers would be prudent to use available backbone capacity to inject as much gas as possible into storage.
Staff then looked at whether the reduction in lower backbone transmission availability could affect the state’s ability to meet monthly projected natural gas demand. The analysis suggests that PG&E’s natural gas capacity reserve margin could be pushed to very close to zero in December and January, even under normal weather conditions, without using higher than average storage withdrawals. PG&E has since been able to increase operating pressure on several segments, increasing this reserve margin.
Finally, staff looked at what would happen under “Winter Peak Day” (WPD) conditions. The capability to serve WPD demand and a comparison to two cold days with demand close to WPD from December 2009 are shown in Table 7 on the following page. The key conclusion is that curtailments should be avoided even if less gas is able to flow over backbone capacity with more reliance on gas from underground storage. This underscores the importance of filling not only PG&E storage, but independent storage to make up for the constrained backbone capacity on days colder than average conditions occur.
This analysis does not look at potential local area curtailments. PG&E is requesting expedited review of proposed pipeline pressure restoration on key Bay Area lines before winter. A formal report on hydrotesting efforts and preliminary results is scheduled for an evidentiary hearing on November 22; the CPUC is expected to make a decision by December 15, 2011.

98
Table 7: PG&E High Demand Day Gas Requirements and Sources
MMcf/d Dec 8, 2009 Recorded
Dec 9, 2009 Recorded
Winter Peak Day Forecast
from 2010 California Gas
Report1
Demand
Core 2,840 2,926 2850
Industrial 677 692 420
Electric Generation 551 528 1000
Off-System 27 68 0
Total 4,095 4,214 4,270
Capacity & Supply
Redwood 901 809 1,800/2
Baja 1,031 1,051 733
Silverado (CA Production) 120 120 130
PG&E Storage 1,344 1,228 1,100
Independent Storage 699 1,006 507
Total 4,095 4,214 4,270
Source: Compilation of data reported on PG&E Pipe Ranger, California Gas Report, and staff analysis.
1 The capacity and supply data shown are Energy Commission staff projections, updated for PG&E notices of expected capacity availability on its Pipe Ranger website. See: http://www.pge.com/pipeline/operations/pipeline_maintenance/foghorn.shtml.
2 Ruby Pipeline feeds into the Redwood path. PG&E has noted in previous California Gas Reports that under very cold conditions it often sees a diminution in supply delivered to the California border. Achieving deliveries of 1,800 MMcf/d on a cold day seems reasonable given the new supply offered from Ruby.

99
CHAPTER 7: Electricity and Natural Gas Demand Forecast Measuring California’s energy use is the essence of a much broader analysis conducted every two years as part of the Integrated Energy Policy Report (IEPR). This chapter summarizes the Energy Commission staff’s Preliminary California Energy Demand Forecast 2012‐2022.95 The analysis characterizes the effects of economic and demographic trends, human behavior, emerging technologies, state and federal policies, and California’s diverse climatic and geographic landscape on current and future energy needs. The chief product of this work is the California Energy Demand (CED) forecast of electricity and natural gas consumption over the next 10 years.
Californians consumed around 272,300 gigawatt hours (GWh) of electricity in 2010. Natural gas consumption, excluding fuel for electricity generation, reached almost 12,700 million therms that same year. Forecasts of expected growth in energy demand underlie California’s efforts to develop effective policy, conserve natural resources, protect the environment, and promote public health and safety while ensuring adequate energy supplies and economic growth. To that end, the Energy Commission’s long‐term forecast appears in many venues: as the foundation for policy recommendations to the Governor and Legislature through the IEPR; as a yardstick by which to measure the utilities’ need for new generation resources in the California Public Utilities Commission’s (CPUC) Long‐Term Procurement Planning proceeding; as a reference point in the Air Resources Board’s AB 32 Scoping Plan; as a benchmark for assessing the state’s progress towards meeting its Renewables Portfolio Standard (RPS); as a baseline for estimating energy efficiency savings potential; and as input into the Energy Commission’s infrastructure needs assessment.
The forecast is also used by the CPUC and the California ISO in annual Resource Adequacy proceedings addressing capacity needs, which depend on projected peak demand. Demand for electricity varies over time with daily, weekly, and seasonal cycles and fluctuates even within a given hour. It is generally lower at night and on weekends and holidays, with the maximum usually occurring on hot summer weekday afternoons. Expected peak demand is a critical factor in electricity and transmission planning, since it determines generation and transmission capacity requirements.
Such an analysis cannot be conducted in isolation. The Energy Commission augments its own expertise with input from other government agencies, utilities, advocacy groups, and consultants. Regular meetings of the Demand Analysis Working Group, formed by the Energy
f
95 Kavalec, Chris, Tom Gorin, Mark Ciminelli, Nicholas Fugate, Asish Gautum, and Glen Sharp, Preliminary California Energy Demand Forecast, 2012‐2022, 2011, CEC‐200‐2011‐011SD, available at: http://www.energy.ca.gov/2011publications/CEC‐200‐2011‐011/CEC‐200‐2011‐011‐SD.pd .
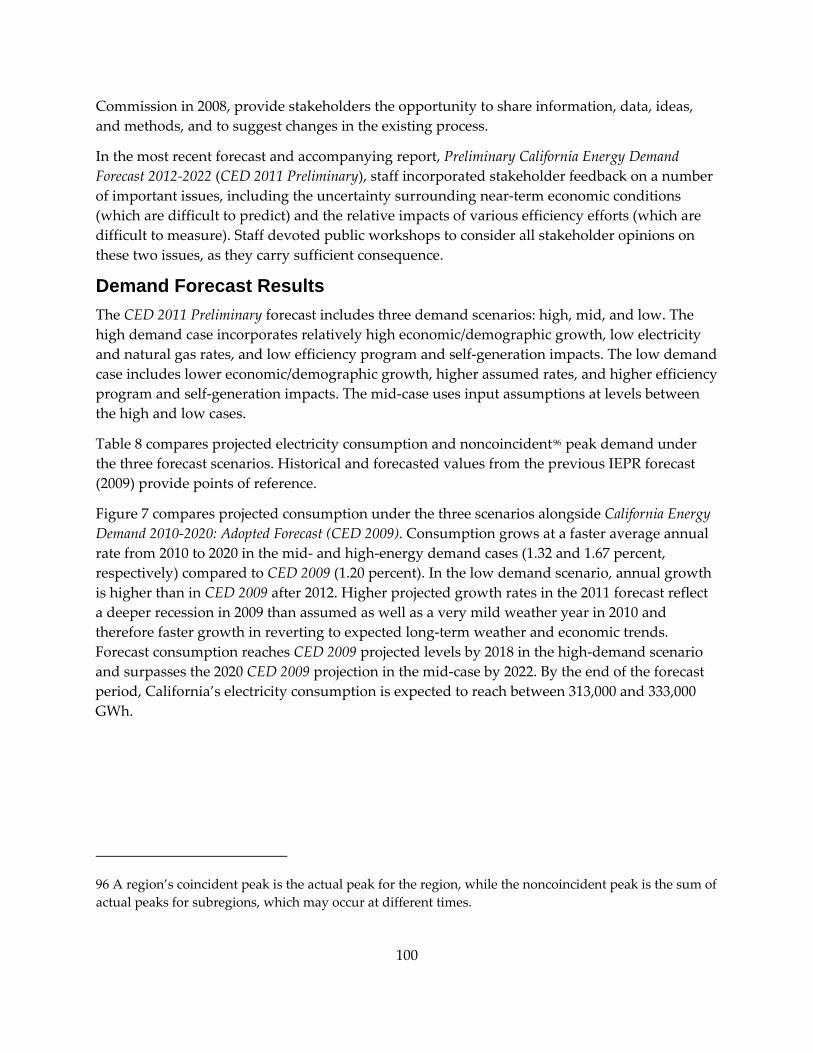
100
Commission in 2008, provide stakeholders the opportunity to share information, data, ideas, and methods, and to suggest changes in the existing process.
In the most recent forecast and accompanying report, Preliminary California Energy Demand Forecast 2012‐2022 (CED 2011 Preliminary), staff incorporated stakeholder feedback on a number of important issues, including the uncertainty surrounding near‐term economic conditions (which are difficult to predict) and the relative impacts of various efficiency efforts (which are difficult to measure). Staff devoted public workshops to consider all stakeholder opinions on these two issues, as they carry sufficient consequence.
Demand Forecast Results The CED 2011 Preliminary forecast includes three demand scenarios: high, mid, and low. The high demand case incorporates relatively high economic/demographic growth, low electricity and natural gas rates, and low efficiency program and self‐generation impacts. The low demand case includes lower economic/demographic growth, higher assumed rates, and higher efficiency program and self‐generation impacts. The mid‐case uses input assumptions at levels between the high and low cases.
Table 8 compares projected electricity consumption and noncoincident96 peak demand under the three forecast scenarios. Historical and forecasted values from the previous IEPR forecast (2009) provide points of reference.
Figure 7 compares projected consumption under the three scenarios alongside California Energy Demand 2010‐2020: Adopted Forecast (CED 2009). Consumption grows at a faster average annual rate from 2010 to 2020 in the mid‐ and high‐energy demand cases (1.32 and 1.67 percent, respectively) compared to CED 2009 (1.20 percent). In the low demand scenario, annual growth is higher than in CED 2009 after 2012. Higher projected growth rates in the 2011 forecast reflect a deeper recession in 2009 than assumed as well as a very mild weather year in 2010 and therefore faster growth in reverting to expected long‐term weather and economic trends. Forecast consumption reaches CED 2009 projected levels by 2018 in the high‐demand scenario and surpasses the 2020 CED 2009 projection in the mid‐case by 2022. By the end of the forecast period, California’s electricity consumption is expected to reach between 313,000 and 333,000 GWh.
96 A region’s coincident peak is the actual peak for the region, while the noncoincident peak is the sum of actual peaks for subregions, which may occur at different times.

101
Table 8: Comparison Statewide Electricity Demand Forecast Comparison
Consumption (GWh)
CED 2009
(December 2009)
CED 2011 Preliminary High (August 2011)
CED 2011 Preliminary Mid (August 2011)
CED 2011 Preliminary Low (August 2011)
1990 228,473 227,586 227,586 227,586 2000 264,230 260,408 260,408 260,408 2010 280,843 272,342 272,342 272,342 2015 299,471 296,821 292,286 286,100 2020 316,280 321,268 310,462 305,932 2022 -- 332,514 318,396 313,493
Average Annual Growth Rates 1990-2000 1.46% 1.36% 1.36% 1.36% 2000-2010 0.61% 0.45% 0.45% 0.45% 2010-2015 1.29% 1.74% 1.42% 0.99% 2010-2020 1.20% 1.67% 1.32% 1.17% 2010-2022 -- 1.68% 1.31% 1.18%
Non-Coincident Peak (MW)
CED 2009 (December 2009)
CED 2011 Preliminary High (August 2011)
CED 2011 Preliminary Mid (August 2011)
CED 2011 Preliminary Low (August 2011)
1990 47,521 47,520 47,520 47,520 2000 53,703 53,703 53,703 53,703
2010* 62,459 60,455 60,455 60,455 2015 66,868 66,569 65,701 64,246 2020 71,152 72,006 69,818 68,498 2022 -- 74,220 71,280 69,738
Average Annual Growth Rates 1990-2000 1.23% 1.23% 1.23% 1.23% 2000-2010 1.52% 1.23% 1.23% 1.23% 2010-2015 1.37% 1.19% 1.19% 1.19% 2010-2020 1.31% 1.95% 1.68% 1.22% 2010-2022 -- 1.76% 1.45% 1.26%
Historical values are shaded. *The 2011 forecasts use 2010 weather-normalized peak rather than actual to estimate growth
tSource: California Energy Commission
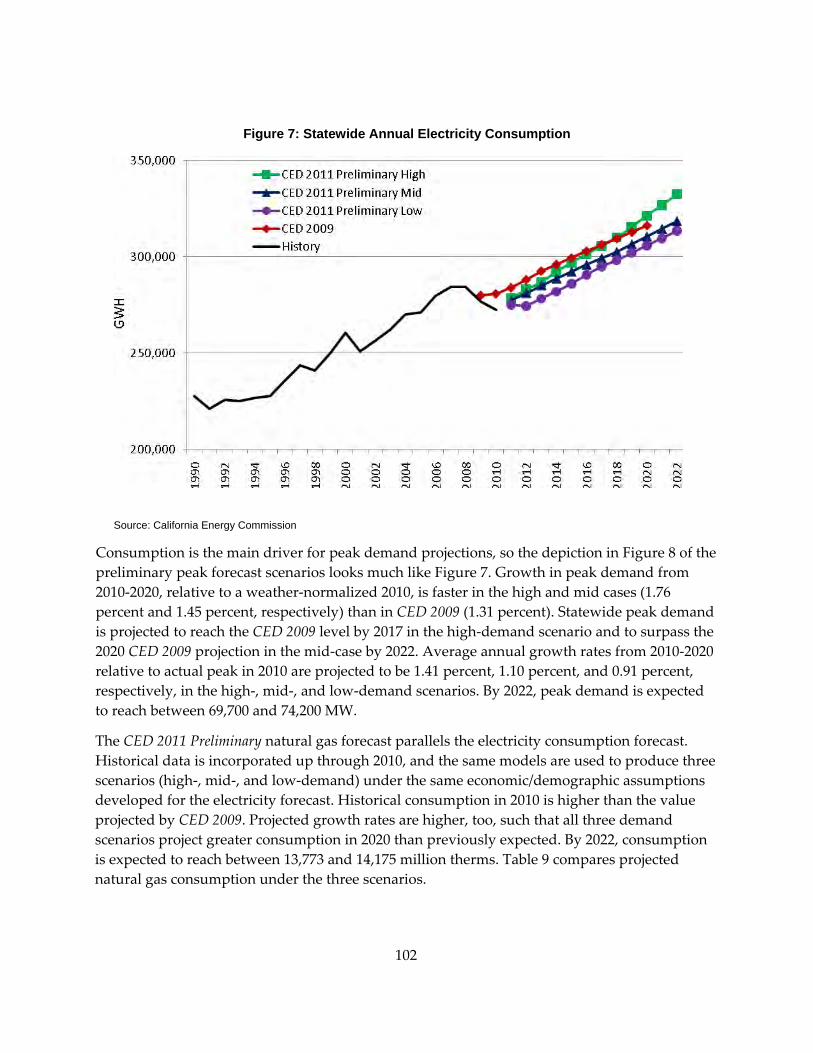
Figure 7: Statewide Annual Electricity Consumption
Source: California Energy Commission
Consumption is the main driver for peak demand projections, so the depiction in Figure 8 of the preliminary peak forecast scenarios looks much like Figure 7. Growth in peak demand from 2010‐2020, relative to a weather‐normalized 2010, is faster in the high and mid cases (1.76 percent and 1.45 percent, respectively) than in CED 2009 (1.31 percent). Statewide peak demand is projected to reach the CED 2009 level by 2017 in the high‐demand scenario and to surpass the 2020 CED 2009 projection in the mid‐case by 2022. Average annual growth rates from 2010‐2020 relative to actual peak in 2010 are projected to be 1.41 percent, 1.10 percent, and 0.91 percent, respectively, in the high‐, mid‐, and low‐demand scenarios. By 2022, peak demand is expected to reach between 69,700 and 74,200 MW.
The CED 2011 Preliminary natural gas forecast parallels the electricity consumption forecast. Historical data is incorporated up through 2010, and the same models are used to produce three scenarios (high‐, mid‐, and low‐demand) under the same economic/demographic assumptions developed for the electricity forecast. Historical consumption in 2010 is higher than the value projected by CED 2009. Projected growth rates are higher, too, such that all three demand scenarios project greater consumption in 2020 than previously expected. By 2022, consumption is expected to reach between 13,773 and 14,175 million therms. Table 9 compares projected natural gas consumption under the three scenarios.
102
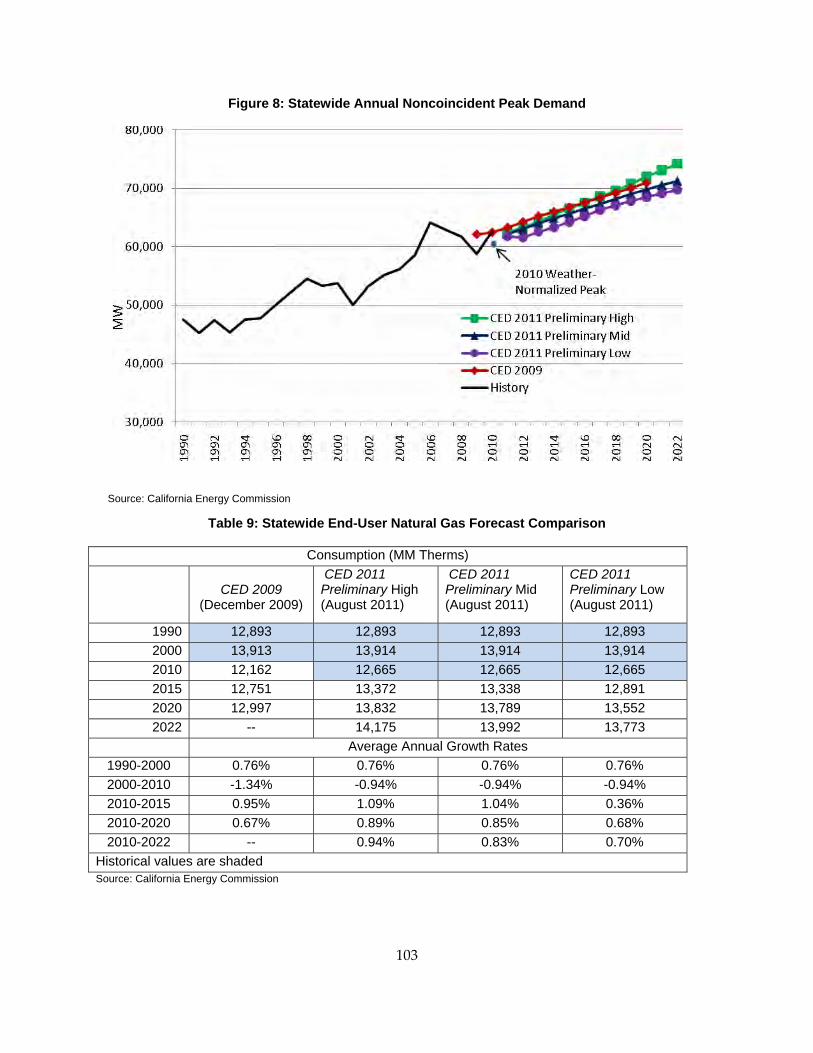
Figure 8: Statewide Annual Noncoincident Peak Demand
Source: California Energy Commission
Table 9: Statewide End-User Natural Gas Forecast Comparison
Consumption (MM Therms)
CED 2009
(December 2009)
CED 2011 Preliminary High (August 2011)
CED 2011 Preliminary Mid (August 2011)
CED 2011 Preliminary Low (August 2011)
1990 12,893 12,893 12,893 12,893 2000 13,913 13,914 13,914 13,914 2010 12,162 12,665 12,665 12,665 2015 12,751 13,372 13,338 12,891 2020 12,997 13,832 13,789 13,552 2022 -- 14,175 13,992 13,773
Average Annual Growth Rates 1990-2000 0.76% 0.76% 0.76% 0.76% 2000-2010 -1.34% -0.94% -0.94% -0.94% 2010-2015 0.95% 1.09% 1.04% 0.36% 2010-2020 0.67% 0.89% 0.85% 0.68% 2010-2022 -- 0.94% 0.83% 0.70%
Historical values are shaded Source: California Energy Commission
103

104
Modifications to Forecast Methodology Additional consumption data became available after publication of the 2009 Integrated Energy Policy Report. The CED 2011 Preliminary adjusted the timeline so that 2010 is the historical base year and the forecast horizon extends to 2022, compared to 2020 in CED 2009. Beyond this routine adjustment, staff made several significant modifications to the 2011 IEPR demand forecast methodology.
For one, staff developed the major economic sectors—residential, commercial, and industrial—by combining the Energy Commission’s traditional end‐use models and a new econometric approach (created by staff in 2011). Additionally, staff developed peak projections using its Hourly Electricity Load Model and a new econometric model. Staff made adjustments to results from existing models based on the econometric estimations. For example, price elasticities estimated in the residential and industrial econometric models replaced previous end‐use elasticities. Recommendations from a recent evaluation of the demand model methodology motivated staff to develop a robust, multi‐resolution modeling approach to demand forecasting.
Staff forecasted residential adoption of photovoltaic (PV) systems and solar water heaters using a predictive model rather than a trend analysis (as in previous forecasts). The new method is based on estimated payback periods and cost‐effectiveness determined by upfront costs, energy rates, and various incentive levels. Staff developed scenarios using varied assumptions about electricity rates and new home construction.
Finally, CED 2011 Preliminary incorporates potential global climate change impacts more comprehensively. The Energy Commission demand forecasting process typically models these impacts by adjusting upward the number of cooling and heating degree days in the forecast period, based on the historical ratio of degree days in the last 12 years to that of the last 30 years. The result of this adjustment is an increase in the projected amount of cooling and a decrease in heating relative to the historical period. This correction attempts to account for the likelihood of a general warming trend.
However, temperatures assumed in the peak forecast (an average of daily temperatures over a 30‐year period) are not affected by the adjustment, so the forecast may not fully capture the impact on peak demand of possibly more frequent heat storm weather events, in the form of higher maximum temperatures in a given year. Therefore, using climate change scenarios for maximum temperatures developed by the Scripps Institute, staff applied these to the peak econometric model (which includes a coefficient for maximum temperature) and used the projected climate change impacts to adjust the existing end‐use peak model results.
The CED 2011 Preliminary describes these changes, along with forecast results and modeling methodologies, in much greater detail. 97
97 Kavalec, Chris, Tom Gorin, Mark Ciminelli, Nicholas Fugate, Asish Gautum, and Glen Sharp, 2011, op cit.

Energy and the Economy Economic projections are one of the key inputs to the demand forecast. For the CED 2011 Preliminary forecast, staff examined multiple economic and demographic scenarios. The intent was to quantify the impacts from a reasonable range of assumptions on electricity demand. Staff selected three sets of economic projections from Moody’s Economy.com and IHS Global Insight. Staff chose scenarios that captured the highest and lowest projected levels of economic growth.
Figure 9 shows historical and projected levels for nonagricultural employment, a key economic driver of the commercial and industrial forecasts. A comparison of the projections illustrates consistent expectations about the future of California’s economy. Each case assumes California will experience a period of rapid growth as the economy begins to recover from the 2008 crisis, followed by a return to modest long‐term growth at rates similar to those seen in recent history.
Figure 9: Statewide Employment Projections
Source: California Energy Commission
The most significant discrepancy between these economic projections lies in the duration of the recession and in the timing and rate of the recovery. Energy consumption trends with employment and other economic indicators, so these transitions are important factors, particularly in characterizing energy use over the next few years. Despite a great deal of economic uncertainty surrounding the current recession (for example, when and how California will recover), the alternative scenarios show a relatively narrow band by the end of the forecast period. This narrowing tends to reduce the differences among the forecast energy scenarios later in the forecast period, all else being equal.
Traditional indicators such as employment, personal income, and population are important, but are not the only economic factors that could affect the forecast. On January 19, 2011, the Energy
105

106
Commission hosted a public workshop where several expert economists, researchers, policy makers, and business owners discussed ways in which the future of California’s economy may deviate from its historical pattern. Staff considered some key points made during the discussion:
• The substantial drop in housing prices may affect migration patterns, specifically increasing in‐migration. It is likely that California will not experience the same pattern of depressed population growth as seen in previous recessions.
• Changes to average home size and location may have a significant effect on demographic drivers.
• Over the coming decade, climate change may introduce constraints on water supplies.
• Alternative indicators, such as personal debt, may become more valuable at providing insight into energy consumption patterns.
As California’s economy recovers and changes, it is critically important that the Energy Commission adapts its demand forecasting models appropriately. Staff will consider incorporating such factors in future IEPR forecasts while continuing to engage with a variety of economic and demographic experts.
Self-Generation Impacts The CED 2011 Preliminary forecast includes the impacts of on‐site distributed generation (DG) used in large‐scale facilities and of the major incentive programs designed to promote self‐generation. The forecast uses a trend analysis to project self‐generation, except in the case of residential PVs and solar water heaters, where it uses a new predictive model. The incentive programs include:
• Emerging Renewables Program (ERP): This program is managed by the Energy Commission.
• California Solar Initiative (CSI): This program is managed by the CPUC.
• Self‐Generation Incentive Program (SGIP): This program is managed by the CPUC.
• New Solar Homes Partnership (NSHP): This program is managed by the Energy Commission.
• Utility Incentives: Administered by publicly‐owned utilities such as Sacramento Municipal Utility District (SMUD), LADWP, IID, Burbank Water and Power, City of Glendale, and City of Pasadena.
The general strategy of the ERP, CSI, SGIP, and NSHP programs is to encourage demand for self‐generation technologies, such as PV systems, with financial incentives until the market increases and achieves economies of scale and decreases the capital costs. The extent to which consumers see real price declines will depend on the interplay of supplier expectations, the future level of incentives, and demand as manifested by the number of states or countries offering subsidies.

Figure 10 shows historical and expected peak impacts of self‐generation, which are projected to reduce peak load by over 3,000 MW by 2022. Historical impacts were revised downward because some self‐generation data was found to be misclassified, so CED 2009 projections begin well above estimates of historical impacts. Higher projections for PV peak impacts in both the residential and commercial sectors drive total self‐generation peak above CED 2009 levels by 2020 in all three scenarios. The temporary flattening of the curves after 2016 corresponds to expiration of the CSI program.
Figure 10: Statewide Peak Impacts of Self-Generation
Source: California Energy Commission
Table 10 shows historical and projected statewide electricity consumption from self‐generation, and is broken out into PV and non‐PV applications. For traditional combined heat and power (CHP) technologies, self‐generation is assumed constant, so that retired CHP plants are replaced with new ones with no net change in generation in the current forecast. Given the Governorʹs policy goals for CHP and DG and the recent qualifying facility settlement to CHP, in future IEPRs there will be a more comprehensive assessment of the status of CHP in California. As part of this effort, the staff will be developing scenarios for this technology for the revised forecast. Growth in non‐PV self‐generation comes mainly from recent increases in the application of fuel cells and other low emissions technology, projected forward.
107

108
Table 10: Electricity Consumption From Self-Generation (GWh)
1990 2000 2010 2015 2020 2022
Non-Photovoltaic Self-Generation 8,242 9,179 9,651 10,366 10,852 11,065
Photovoltaic, Low Demand 3 10 1,110 3,063 4,691 6,060
Photovoltaic, Mid Demand 3 10 1,110 2,874 4,118 5,290
Photovoltaic, High Demand 3 10 1,110 2,817 3,894 4,896
Total Self-Generation, Low Demand 8,245 9,189 10,761 13,429 15,543 17,125
Total Self-Generation, Mid Demand 8,245 9,189 10,761 13,488 14,945 16,329
Total Self-Generation, High Demand 8,245 9,189 10,761 13,429 14,716 15,924
Source: California Energy Commission
Energy Efficiency Impacts California’s energy policy identifies energy efficiency as the “resource of first choice” for meeting California’s future energy needs. As such, efficiency codes and standards, programs, and other policies play a central role in California’s energy procurement and transmission plans and are a strategic element in the state’s greenhouse gas emission reduction goals. Unlike other resources that are deployed to meet demand, energy efficiency reduces consumption and is therefore considered in the demand forecast, either embedded directly within the forecasting models or as an incremental effect subtracted from the model output. In both cases, staff is ensuring that the demand forecast reflects reasonable levels of efficiency from a comprehensive set of efforts expected to occur.
The CED 2011 Preliminary forecast continues the long‐standing practice of distinguishing between two types of “reasonably‐expected‐to‐occur” savings—committed and uncommitted. Committed efforts to reduce demand include authorized utility programs, finalized building and appliance standards, and other policy initiatives that have implementation plans, firm funding, and a design that can be technically assessed to determine probable future impacts. Committed savings also include price and market effects, which represent savings from rate increases and other market effects not related directly to standards and programs. These savings are incorporated directly into the forecast. Uncommitted savings—which, while plausible, have a great deal of uncertainty surrounding the method, timing, and relative impact of their implementation—are considered separately within the CED 2011 Preliminary analysis.
The Energy Commission developed the demand forecasting models in a way that facilitates the inclusion of building and appliance efficiency standards. The models distinguish among vintages of floor space, housing, and equipment. As a new building or piece of equipment is
109
added, the model assumes its energy use characteristics meet – at a minimum – the applicable standards. Following the effective implementation date, standards gradually affect an increasingly larger proportion of the total building and appliance stock. Each cycle of progressively tightened standards can be evaluated to determine the additional energy savings contributed from each vintage of standards by comparing model outputs.
Measuring the impacts of utility programs poses a greater challenge, as customer participation is voluntary and is motivated by a complex set of interactive effects. Also, customers may replace appliances well before the end of their usefulness, and while data may be available on the efficiency of new appliances, the reference level of efficiency is often unknown for the replaced appliances.
To better measure program impacts, staff leveraged the CPUC’s most recent efforts to measure utility program savings. The Energy Division’s evaluation‐based estimates of program savings from the 2006‐2008 program cycle, as well as additional evaluation for 2009 programs, represent the most thorough and comprehensive effort to date. This unprecedented level of detailed evaluation data, however, applies only to programs implemented within the last four years. Therefore, staff modeled the uncertainty surrounding the performance of future programs using scenario analysis.
Because a clear, consistent record of evaluated efficiency program achievements is not readily available, at least not prior to the 2006‐2008 CPUC energy efficiency program cycle, there is a great deal of uncertainty around any estimate of historical program impacts. This uncertainty, along with uncertainty around attribution of savings among standards, programs, and price effects, has been the subject of debate in recent Demand Analysis Working Group meetings. Some parties have insisted that Energy Commission demand forecasts incorporate historical program impacts that are vastly underestimated and/or credit too much savings to standards and price effects, especially before 1998. A recent staff paper summarizes the positions of various parties. 98
Staff believes that the forecasting process yields reasonable estimates of total savings but acknowledges and shares concerns voiced by stakeholders about savings attribution. Therefore, the CED 2011 Preliminary provides no attribution among the three sources (programs, codes and standards, and price and market effects) except for estimates of standards impacts. In other words, it provides no specific estimates of program and price effects. Staff will continue to work with stakeholders on these issues, with the goal of showing attribution for at least some years in future reports. Figure 11 shows total historical and projected committed efficiency savings from the three sources starting in 1990. Annual totals are relative to conditions in 1975, before that state implemented the first efficiency standards.
98 California Energy Commission, Electricity Supply Analysis Division, Chris Kavalec, Energy Efficiency Program Characterization in Energy Commission Demand Forecasts: Stakeholder Perspectives and Staff Recommendations. Staff Paper, August 2011, CEC‐200‐2011‐010‐SD, available at: http://www.energy.ca.gov/2011publications/CEC‐200‐2011‐010/CEC‐200‐2011‐010‐SD.pdf.

Figure 11: Statewide Committed Consumption Efficiency and Conservation Impacts
Source: California Energy Commission
Beyond these committed impacts, the CPUC, Energy Commission, California Air Resources Board, and the Legislature have set efficiency goals without approval of specific program designs or authorization of actual program funding levels. Staff must consider long‐term utility savings goals, future updates to Title 20 and Title 24 codes and standards, and statewide policy initiatives in determining incremental uncommitted energy efficiency impacts – impacts that are in addition those already included in the baseline forecast.
During the 2009 IEPR cycle, at the request of the CPUC, staff began to assess the impacts of incremental uncommitted energy efficiency policy initiatives. Staff included policy initiatives in the analysis similar to those originally evaluated by Itron and adopted by the CPUC in the 2008 Energy Efficiency Goals Update Report (2008 Goals Study).99 The incremental uncommitted analysis for CED 2011 Preliminary also relies on the 2008 Goals Study but is updated to account for the passage of time. Therefore, some initiatives considered uncommitted in 2009 are now incorporated in the committed forecast (Figure 11 includes estimated savings). The newly committed initiatives include Assembly Bill 1109 (Huffman, Chapter 534, Statutes of 2007) and the 2010 Title 24 Building Code Revisions. In addition, the CED 2011 Preliminary extends uncommitted analysis to publicly owned utilities. The uncommitted efficiency initiatives in CED 2011 Preliminary include:
99 Itron, Inc. Assistance in Updating the Energy Efficiency Savings Goals for 2012 and Beyond, adopted by CPUC in 2007.
110

111
• Utility programs beyond 2012, including residential, commercial, and industrial.
• Further updates to state Title 20 and 24 standards along with updated federal appliance standards.
• The CPUC’s Big Bold Energy Efficiency Initiatives.
As in the 2008 Goals Study, CED 2011 Preliminary assumed various levels of commitment to these policies to create three different scenarios of uncommitted efficiency savings—high, medium, and low. By 2022, consumption in the mid‐demand case would be reduced 3.3 percent if adjusted by the low savings scenario and 6.2 percent using high incremental uncommitted savings. For peak, the reductions range from 4.8 percent to 9.5 percent, higher than consumption because the end uses targeted by these initiatives tend to have higher‐than‐average peak‐to‐energy‐consumption ratios.
Combining the high demand case with the low incremental uncommitted efficiency scenario and the low‐demand case with the high efficiency scenario gives a range of “managed” forecasts. Statewide, adjusted consumption ranges from around 294,000 GWh to 322,000 GWh, compared to 313,000 GWh to 332,000 GWh for unadjusted consumption. For peak demand, the adjusted range is 63,000 MW to 71,000 MW, compared to the unadjusted range of 70,000 MW to 74,000 MW. In these adjusted mid‐ and low‐demand cases, peak demand begins to drop slightly by the end of the forecast period. Peak demand in the low case drops slightly below the actual 2010 statewide (noncoincident) level.
The CPUC’s new Potential and Goals Study is underway and is expected to be completed in late summer 2012. This schedule does not allow the study to be fully incorporated in the revised or final adopted IEPR demand forecasts, but CPUC staff intends to use interim study results to recommend changes to the incremental uncommitted efficiency impacts developed from the 2008 Goals Study. Thus, the uncommitted results will likely differ in the revised and adopted IEPR forecasts compared to the preliminary.

112
CHAPTER 8: California’s Electricity Infrastructure Part One: Once-Through Cooling and Assembly Bill 1318 This chapter of the 2011 Integrated Energy Policy Report provides an update on progress made by the Energy Commission and other energy agencies on OTC mitigation and related emission offsets concerns (Part One) as well as a status report on Energy Commission electricity infrastructure activities (Part Two). This summary also highlights some challenges facing energy and environmental agencies for resolving some key issues, provides the next steps, and makes a recommendation for going forward.
Reducing the impacts on the marine and estuarine environments from the use of OTC technologies in older power plants and the scarcity of emission offsets for new fossil power plants are two of the most important challenges facing the electricity generating industry. To reduce impacts, many of the owners of California’s aging power plants are choosing to retire rather than make capital investments in the facility, causing a need for new capacity to satisfy peak demand and appropriate reserves.100 However, licensing new power plants is difficult, given the scarcity and corresponding cost of offsets required to avoid harmful impacts on air quality. Even repowering at the site of an aging power plant has its challenges. So, while OTC mitigation is increasing the demand for new power plants, air quality constraints are restricting the development of fossil fuel power plants. This complexity is especially apparent in those areas of the state where existing air quality fails to satisfy ambient standards. The South Coast Air Basin, for example, is experiencing the full effects of these opposing forces. To satisfy local capacity requirements (LCR) and help integrate variable renewable generation, the region will have to replace some of its older capacity with dispatchable, flexible fossil power plants when existing OTC power plants retire. The 2009 Integrated Energy Policy Report discussed the South Coast Air Basin’s situation in detail and made recommendations to address the challenges, but uncertainties continue.
OTC is a form of power plant turbine condenser cooling technology that was considered conventional design when steam boiler power plants were built in California in the 1950s through the 1970s. This technology pumps water from a source (ocean, estuary, river, or lake) through a steam turbine condenser and then returns it to the source. The problem is that fish and small marine mammals are impinged and can suffocate and die on screens designed to keep them and people out of the water intake structure. In addition, smaller organisms are entrained in the cooling machinery itself and killed by turbulence, the pump, or the temperature increase of the water. The federal Clean Water Act, Section 316(b), has long required existing power plants or other industrial facilities to reduce these environmental impacts, but the United States Environmental Protection Agency (U.S. EPA) and state agencies
100 Many power plants will be “repowered,” meaning they will essentially be torn down and a new one constructed on the same site. Some power plants are attempting to “refit” by modifying ocean water intake structures to reduce environmental impacts sufficient to satisfy the OTC policy.

113
have been slow to act due to industry resistance to costly refits. In response to delays in U.S. EPA actions, the State Water Resources Control Board (SWRCB) undertook developing its own OTC mitigation policy and adopted a final policy in May 2010, which became effective on October 1, 2010.
For many years, local air quality districts, with some oversight from California Air Resources Board (ARB) and U.S. EPA, have developed and administered air quality mechanisms to prevent harmful impacts to air quality from new industrial facilities. Under these mechanisms, new facilities have had to “offset” their emissions by shutting down existing sources (or using offsets from previously shutdown sources), thus reducing overall net emissions and actually improving air quality. Yet, while the offset mechanism creates an incentive for older, inefficient, and unprofitable industrial facilities to retire, the amount of emission offsets that can be created by this approach in any one region may be diminishing. In the South Coast Air Basin, where South Coast Air Quality Management District (SCAQMD) administers the air quality permitting and attainment programs, commercially available offsets have essentially disappeared for some criteria pollutants, since few existing power plants and refineries are willing to shut down just to provide offsets to new development.
This section provides a progress report and highlights some key challenges as these two topics are resolved in the electricity policy and planning processes of energy and environmental agencies.
OTC Mitigation The SWRCB’s adopted OTC mitigation policy incorporates the recommendations jointly proposed in 2009 by the Energy Commission, California Public Utilities Commission (CPUC), and California Independent System Operator (California ISO). The May 2010 OTC mitigation policy essentially has two dimensions – stringency of mitigation and compliance timing. SWRCB determined that evaporative cooling towers (roughly a 93 percent reduction of water usage compared to OTC) should be established as a performance benchmark. Recognizing that compliance would probably result in the shutdown of existing power plants, and not wishing to threaten reliability, SWRCB established compliance dates for specific power plants based on an initial review of the time horizon needed to get replacement infrastructure on‐line.101 Further, the OTC policy allows the interagency advisory committee (that includes the three energy agencies) to propose revisions to these dates, if necessary. In effect, the compliance date is adaptive to the progress made by the energy agencies in pursuing multiple elements of state energy policy and getting specific replacement infrastructure ready to replace an OTC power plant.
101 The SWRCB’s action applies primarily to fossil fuel plants using OTC. California’s two nuclear power plants, Diablo Canyon and San Onofre, also use OTC and will be subject to SWRCB action, but they will be on different, still ‐to‐be‐defined schedules for compliance. During 2012, the California ISO will continue studying the electricity system effects of OTC phase out at the nuclear plants.

114
Since the state adopted the policy, there have been two struggles to revise compliance dates for power plants owned by Los Angeles Department of Water and Power (LADWP). In December 2010, SWRCB tabled LADWP’s effort to extend the compliance schedule for any combined cycle power plant or power plant that, once repowered, eliminates use of ocean water. On July 19, 2011, SWRCB modified the OTC policy (based on another proposal made by LADWP) to include: (a) an acceleration of two power plant repowering projects, and a delay in the remainder of LADWP’s repowering projects, compared to the compliance dates in the May 2010 OTC policy, and (b) broadening criteria for accepting compliance dates for any generator beyond 2022 that will entirely eliminate the use of ocean water for cooling, even as makeup for evaporative cooling towers. The delayed compliance dates for the three LADWP power plants are regarded as placeholders and will be examined again in 2012‐2013 through mechanisms established in the policy.
The state required all generators to submit implementation plans on April 1, 2011, showing how they intended to comply with the OTC policy. Many generators provided plans conditional upon action by others. For example, most generator owners said they intended to repower if a CPUC‐jurisdictional load‐serving entity (LSE) could obtain a long‐term power purchase agreement (PPA); this presumes the CPUC will authorize procurement authority and establish oversight that leads to such a PPA. Absent a PPA, no generator was willing to invest the money required to repower or refit intake structures to comply, thereby resulting in a plant shutdown. Some said matching the CPUC/LSE procurement mechanism with the existing SWRCB OTC compliance date for their power plant required the CPUC to establish procurement authority and provide direction to LSEs as part of a final decision in the 2010 Long Term Procurement Plan (LTTP) – R.10‐05‐006.
Whether the CPUC does this, which would translate into opportunities to repower existing OTC capacity, depends upon finding a need for new dispatchable fossil power plants. Two likely justifications exist. One is the need to add capacity from highly flexible advanced single cycle or combined cycle power plants that can start and stop readily, and ramp over a wide range easily, to help to integrate solar and other intermittent renewables. Another is the need to add capacity in local capacity areas, or in even more narrowly drawn subareas, to assure local reliability given the limitations of the transmission system for meeting customer loads from remote power plants.
The California ISO prepared an unpublished power flow/stability study for the CPUC 2010 LTPP proceeding (R. 10‐05‐006) in the spring of 2011 that demonstrated little need for new capacity in the 2020 time horizon, in part because of the relatively low load forecast (modified down further by demand‐side policy impacts) caused by the extended slowdown of California’s economy. No comparable power flow investigation of LCR in the 2012‐2020 period was entered into the record of the 2010 proceeding.102 Southern California Edison Company did submit
102 The joint proposal of the Energy Commission, CPUC, and California ISO to SWRCB, supporting the 2020 OTC compliance dates for most Southern California OTC power plants, did not contemplate intensive analysis of long‐term local capacity area requirements until the 2012 LTPP cycle.

115
results in its testimony using a more simplistic model developed by the CPUC, Energy Commission, and California ISO as a “screening” tool to understand the timing implications of alternative assumptions that would affect the viability of various OTC retirement dates.103 The California ISO is undertaking further studies of local capacity requirements, and intends to publish the results in late 2011 or early 2012 as part of its 2011/12 Transmission Planning Process.
While the state is intently focused on OTC retirement and the analyses required for determining the need for dispatchable, fossil power plants that existing merchant generators want to develop, several uncertainties are making it difficult to justify new capacity commitments at this time. It is likely that the state will require another round of generator implementation plans at some point in the future.104
Constrained Emission Offsets in South Coast Air Basin Recognizing the necessity for limited amounts of additional fossil power plant development, SCAQMD adopted rules that would provide special mechanisms to permit new power plants. Rule 1309.1 – the Priority Reserve – would have allowed access to air district internal account credits (“offsets”) for a limited amount of new power plant development. However, these newly adopted rules were overturned by a 2010 court decision. Thus, SCAQMD is relying on a different rule provision for new power plant projects. Rule 1304(a)(2) provides air district internal account offsets for new replacement power plants using advanced gas turbine technologies to the extent their capacity does not exceed that of retired existing power plants. This rule allows for the repowering of old OTC power plants in order to develop dispatchable, fossil power plants needed within South Coast Air Basin.
Two recent events illustrate how Rule 1304(a)(2) can work. In one case, NRG Energy (NRG) could not obtain the increment of offsets required for its repowering project at El Segundo Units 1‐2, since the new plant’s capacity exceeded that of the retired units. The Rule 1304(a)(2) exemption did not cover all of the capacity of the new power plant. Eventually, NRG decided to retire Unit 3, in addition to Units 1 and 2, to eliminate its need to secure emission reduction credits in the commercial market for the difference in capacity between the new power plant and that of retired Units 1‐2. Another innovative example is Edison Mission Energy’s (EME) emission reduction credits for its recently licensed Walnut Creek power plant which is under construction in the City of Industry in Los Angeles County. After numerous failed attempts to purchase offsets because commercial emission reduction credits were unattainable, EME
. 103 See spreadsheet tool and narrative description of inputs for the December 23, 2010, version at: http://www.caiso.com/planning/Pages/TransmissionPlanning/Default.aspx
104 The Statewide Advisory Committee on Cooling Water Intake Structures, established as a formal advisory body to the SWRCB as part of the OTC policy, recommended in its July 5, 2011, resolution (2011‐0001) that the SWRCB obtain additional implementation plan information from all generators. SACCWIS expanded its justification for needing further information from generator owners in its report to SWRCB dated September 29, 2011.

116
purchased and retired Huntington Beach Units 3‐4 from AES Corporation to use the exemption from offsets allowed by Rule 1304(a)(2) for Walnut Creek. Both power plants, long held up by offset issues, obtained Rule 1304 offsets in spring 2011 and broke ground in June 2011.
All of the merchant generators and municipal utilities in the South Coast Air Basin affected by the OTC policy are proposing Rule 1304(a)(2) as the path to repowering, whether onsite, as per the El Segundo example, or in the form of two separate sites, as per the Walnut Creek example.105 What is unclear about these expectations is whether SCAQMD’s bank of internal credits can, or should, provide the offsets to satisfy U.S. EPA New Source Review (NSR) requirements to allow replacement of all existing power plants, rather than limiting internal account offsets to those facilities actually required for system reliability.106 Assembly Bill 1318 (V. Manuel Perez, Chapter 285, Statutes of 2009) requires that ARB develop a report, in consultation with various agencies including the Energy Commission, to assess the need for new power plant capacity in South Coast Air Basin and how needed offsets compare to available amounts. The report will also examine whether recommendations are needed for changes in rules and other permitting mechanisms to allow power plants to be developed while safeguarding ambient air quality. The AB 1318 project has been underway since spring 2010.107
The OTC policy and offsets for replacement projects is not the only issue posed by new regulatory changes. In 2011, SCAQMD adopted Rule 1325 to address NSR requirements for particulate matter (PM2.5). It implements a new federal rule that had not received wide attention in California. Unlike NSR rules for other criteria pollutants, Rule 1325 does not allow covered entities to be exempt from providing offsets through Rule 1304(a)(2). Rule 1325 is written to apply only to the largest facilities that either already exist or might be developed within South Coast Air Basin; however, this probably means that it applies to very large multi‐unit power plant facilities like Haynes, Alamitos, and Redondo Beach, as well as several Los Angeles Basin refineries.
The rule introduces numerous uncertainties, but an unusual one is the lack of clarity regarding which entities are covered. Applicability is dictated by reference to PM2.5 emissions, or its
105 All of the generator owners with plants in the South Coast Air Basin explicitly cite SCAQMD Rule 1304 (a)(2) in their implementation plan submittals to SWRCB of April 1, 2011.
106 Although Rule 1304(a)(2) exempts power plant owners from provision of some criteria pollutant offsets to the extent that new capacity does not exceed retired capacity, SCAQMD must provide the “missing” offsets from its internal bank of credits to satisfy U.S. EPA NSR requirements. Simply, SCAQMD enters as a “credit” the emission reductions associated with the retirement of the existing power plant and enters as a “debit” the potential to emit of the new power plant. The usual rules governing the computation of these credits and debits apply. Generally, some net reduction in the balance in the internal bank is to be expected as a result of new power plants “using up” limited credits.
107 The ARB and Energy Commission (2011 IEPR Committee) conducted a workshop on February 15, 2011, at SCAQMD’s headquarters in Diamond Bar, California, to obtain public input about the draft AB 1318 project workplan.

117
nitrogen oxide or sulfur oxide precursors, exceeding 100 tons per year. PM2.5 is measured by an emission test method not widely used in California; therefore, until facilities conduct a source test using the specified method, it will be unclear whether the rule applies to them or their proposed modifications. Also, the rule includes ambiguous provisions relating to a facility’s historical emissions and potential to emit that can encumber modifications affecting only one or a few units at a multiunit power plant.108 In short, SCAQMD’s adoption of Rule 1325, which is more restrictive than the new federal rules it implements, will likely affect the largest power plant facilities in South Coast Air Basin, but to what extent remains to be determined.
The AB 1318 project, largely consisting of the interagency team established for OTC purposes and joined by ARB, is assessing the need for capacity in South Coast Air Basin, how emissions from new capacity match available offsets (or internal bank credits), and whether to develop rule and permitting mechanism changes. This effort has been slowed by the extraordinary analytic effort needed to identify renewable integration requirements for the mandated 33 percent renewable target by 2020, by the parallel assessment of transmission system upgrades needed to interconnect this renewable development to the bulk transmission system, and by the need to extend assessment of local capacity area requirements out to a 10‐year horizon in a manner sensitive to the prospective impacts of demand‐side and supply‐side policy initiatives. 109 Although delayed compared to original time schedules, the analytic work is underway jointly by the Energy Commission, CPUC, and California ISO to support possible modification to OTC compliance dates. The California ISO expects to release its LCR assessments as part of the 2011/12 transmission planning process in late 2011. As of this writing, ARB anticipates developing a draft AB 1318 report that incorporates these assessments and estimates of offsets needed by new capacity in South Coast Air Basin by the end of 2011, with a final report to the Legislature in the spring of 2012.
Challenges A fundamental issue that must be faced is the potential conflict between state policy goals and electric system reliability. As noted elsewhere in this report, the California Clean Energy Future (CCEF) effort brings together the policy goals of the state and its agencies and the reliability
108 As an example, in acquiring the permit for repowering Haynes Units 5‐6, LADWP accepted a 100‐tons‐per‐year PM2.5 cap on the entire Haynes power plant. Discussion with LADWP representatives reveal that they do not yet fully understand how this may constrain options for repowering other Haynes units in the future.
109 According to existing CPUC decisions and California ISO tariff requirements for the CPUC/ISO resource adequacy program, LSEs only are required to satisfy local capacity area requirements one year into the future. California ISO prepares the studies that create these regulatory requirements and also publishes a three‐ and five‐year ahead study, but its uses are only informational and advisory. California ISO does not routinely prepare 10‐year ahead local capacity area studies and is developing its capability to do, so specifically as part of the AB 1318 project in conjunction with the Energy Commission and CPUC.

118
mission mandated by state and federal requirements on the California ISO. Both must be accomplished satisfactorily.
A clear example of the potential conflict is the expected impact of aspirational goals for energy efficiency and other demand‐side policy initiatives. The incremental energy efficiency assessment prepared by the Energy Commission in the 2009 IEPR, and used with minor modifications in the CPUC’s 2010 LTPP rulemaking, shows roughly 2,000 MW of load reduction in the California ISO’s L.A. Basin local reliability area. Presumably, such a major load reduction would reduce the amount of OTC capacity needing to be replaced, either through repowering of existing OTC units or by construction of new power plants in the Western L.A. Basin subarea. A question that follows is: Should the impacts of these policy initiatives be presumed to happen even though they have not yet been committed to through funding of energy efficiency programs or adoption of tighter building standards on new construction, or adoption of more stringent appliance efficiency standards? Failure of the Legislature to reauthorize the Public Goods Charge that funds a substantial portion of IOU energy efficiency program activities and growing concern about increasing electricity rates to pay for policy goals are legitimate reasons to question whether the state will achieve energy efficiency goals at the level or pace previously desired. 110 The CPUC has recently initiated a proceeding to consider major redesigns of IOU programs, illustrating that reliance upon previous goals may not accurately reflect future activity.111
Table 11 reproduces the expected time frame for power plant development as presented to the California ISO Board in August 2011. The timeframe emphasizes that decisions need to be made soon if major new generation projects are to be operational by 2020. The California ISO staff concluded that the state needs to commit to some amount of power plant development now. Waiting to be sure that incremental energy efficiency (and other demand‐side policies impacts) that would reduce the need for new power plant development should be counted upon means that the infrastructure will not be ready in time if it turns out to be necessary. As a result, reliability standards would not be satisfied, and various contingencies, if encountered, would result in higher probabilities of loss of load, or greater extent of loss of load, or both.
110 The ARB’s AB 32 Scoping Plan, adopted in December 2009, or the CPUC’s electricity energy efficiency goals, adopted in 2008 by D.08‐07‐047, set high targets. In its 2008 LTPP rulemaking, the CPUC/ED popularized the concept of “deliverability risk assessment” to characterize this dilemma – what portion of aspirational goals should be used to determine actual generation resource additions needed to satisfy reliability standards in light of the risk of program impact shortfall risks?
111 R.09‐11‐014, Assigned Commissioner’s Ruling and Scoping Memo Regarding 2013‐2014 Bridge Portfolio and Post‐Bridge Planning, Phase IV, October 25, 2011.

Table 11: Generation Project Development Timeline
2012 2013 2014 2015 2016 2017 2018 2019 2020Long-Term Procurement Proceeding
Request For Offers Design
Request For Offers and Contracting
Interconnection and Permit Preparation
Permitting
Construction
Source: California ISO, Casey memo to California ISO Board, 8/18/2011
Renewable integration assessments and extensions of local capacity requirements out to 10‐year time horizons are not fully mature analytic activities, so it is not yet apparent to what extent preferred resource types (energy efficiency, demand response, distributed generation [DG], combined heat and power generators, and storage), occurring at the levels identified in the CCEF vision statement or Governor Brown’s 2010 jobs/energy plan, reduce the need for dispatchable fossil generation. Analyses underway will reduce that uncertainty, shifting focus to the hard policy choices that have to be made in light of the benefits and costs of the choices.
Next Steps The state must complete analyses and make certain policy decisions before a clear path forward exists for retiring and/or repowering aging power plants.
Analyses The interagency team must complete two remaining key analytic steps to accomplish the emission offset mechanism review as required by AB 1318. In preparing these analyses, the interagency team addressed numerous uncertainties by designing a “bounding” assessment that would lead to the largest and smallest credible amounts of offsets required. First, the interagency team must complete its initial assessment of LCR out to the 10‐year time horizon for at least South Coast Air Basin, and ideally some other areas of SP26.112 ,113 Replacement
112 Although San Diego and Ventura areas are outside the South Coast Air Basin, thus the administrative requirements to provide offsets under SCAQMD rules do not apply to such capacity, these areas are linked to South Coast Air Basin electrically both for zonal and even local capacity area requirements. Options exist in which capacity development in San Diego or Ventura areas can substitute for capacity in the Western L.A. Basin. Further, transmission system changes (new lines or selective upgrades of existing lines) could reduce the extent of transmission‐constrained local areas.
119

120
infrastructure has already been identified and is in the planning/permitting pipeline for most OTC power plants in the rest of the state. Second, the team must complete its translation of the new capacity identified in these reliability‐oriented studies into projected emissions for various criteria pollutants that would have to be offset in the permitting processes. These offset requirements will be compared against existing offsets available for power plants to use.
The interagency team plans to accomplish both steps so that the ARB can include a preliminary analytic result in the draft AB 1318 project report. The report would undergo appropriate public review and management oversight in the early months of 2012. Since these initial results will likely reveal a wide range of required capacity additions and offsets, the interagency staff may have to identify the most likely portion of this range during the first three quarters of 2012, due to its relevance to policy decisions and so that the CPUC’s 2012 LTPP proceeding can issue appropriate procurement authority to the investor‐owned utilities (IOUs) by the end of 2012. Such a decision would put the timeline of Table 11 into motion.
Although these analyses are highly overlapping with review of OTC power plant compliance dates for Southern California, there are also OTC issues in other portions of the state outside the South Coast Air Basin. More than 3,000 MW of fossil OTC capacity is operating along the central California coastline with current OTC compliance dates between 2015 and 2017. No viable plans to replace this capacity on this schedule are apparent. The interagency OTC technical team has identified further needed assessments to determine whether all of this capacity can be retired without creating reliability issues.
Policy Decisions Five interacting sets of policy decisions must be made once the analysis provides a range of offset requirements:
• Energy agencies (Energy Commission and CPUC) and SCAQMD have some influence over the extent that load reductions resulting from demand‐side policy initiatives should be relied upon for reliability planning purposes, thus reducing demand and hence the need for power plant development. For example, should these agencies concur with the California ISO in discounting incremental energy efficiency entirely, or should they assume some minimum level of load reduction from future programs?
• Energy agencies (Energy Commission and CPUC), local land‐use agencies, and the Legislature have some influence over resource development strategies, perhaps still implemented through competitive market mechanisms, which affect the extent of renewable development to satisfy local capacity area requirements. Governor Brown’s renewable DG goals are reshaping the thinking about remote versus local resource development, which could affect the need for central station power plants in urbanized areas to satisfy the local capacity component of reliability standards.
113 Path 26 is the limiting transmission path between Northern and Southern California, so SP26 refers to the region “south of Path 26” within the California ISO balancing authority area.

121
• The California ISO and transmission owners have an ability to influence the extent to which local capacity area requirements can be diminished through transmission system development, upgrades, and modifications.114 Is it feasible for the California ISO to focus IOU attention on transmission system upgrades that would reduce LCR requirements and provide greater geographic flexibility for generation additions?
• SCAQMD, ARB, and the Legislature have some ability to make power plant offset requirements and permitting more or less stringent while respecting ambient air quality standards. Will SCAQMD and the Legislature be willing to make modifications to regulations or laws if supported by the energy agency analyses?
• SWRCB has the ability to shift OTC compliance dates to affect the timing of existing power plant retirement and development of replacement capacity requiring offsets. Will SWRCB be willing to delay compliance dates, when doing so allows demand‐side policies to defer fossil generation or enables greater use of remote renewable generation dependent upon transmission development?
Numerous agencies are involved in making these decisions and there is no overarching mechanism, other than a desire for good government and respect for reliability, to motivate cooperation. The initial track record of energy agency cooperation is good for developing a proposal for preliminary schedules and periodic review of compliance dates, along with SWRCB’s acceptance of this approach in its OTC mitigation policy. The AB 1318 effort has broadened the OTC focus to address the offset issues, which are at the heart of any “solution.” The energy agency technical team has managed to find ways of apportioning analytic work based on the competencies of their respective staff and availability of resources. More entities must become involved as the issues turn to assessing criteria pollutant offsets needed and available and how to devote scarce amounts among competing interests. Devising common planning assumptions and better integration of planning processes is one means of getting multiple agencies “on the same page.” The state agencies have embarked upon improved coordination of efforts through the CCEF process, but tighter coordination will be needed to surmount the challenges of OTC mitigation while satisfying ambient air quality standards.
Conclusion The analyses in progress will bring an abundance of improved information about the long‐term need for new power plant capacity to replace OTC units for satisfying LCR, given various assumptions about the future. The next round of analyses planned for late 2011 and early 2012 will provide additional information about the extent to which capacity needed for renewable integration is incremental to that needed for LCR purposes. It will also inform assumptions used in the AB 1318 effort to estimate future offsets in South Coast Air Basin for power plants that must be located in areas subject to SCAQMD’s permitting requirements.
114 For example, the Tehachapi Transmission project, mainly thought of as a means to bringing wind power into load centers, also has the consequence of greatly reducing local capacity area requirements in the Ventura/Big Creek and L.A. Basin load pockets.

122
While the CPUC (IOU procurement authority, IOU demand‐side program funding, transmission line CPCN approval), the California ISO (transmission project justification and electricity market design assessments), and the Energy Commission (thermal power plant licensing) can make their own decisions about portions of the infrastructure that will be needed through time, there is no overarching mechanism to ensure that all of the energy and environmental agencies can come to consistent decisions. 115
• A new interagency mechanism should be developed to coordinate broader policy decisions that are inappropriate to the more narrow focus of a single agency. The new mechanism should build from the existing evidentiary‐based agency processes that exist today but focus on decision‐making.
Part Two: Status on Energy Commission Electricity Infrastructure Activities California’s commitment to reduce GHG emissions to 20 percent of 1990 levels by 2050116 requires developing demand‐side resources (for example, energy efficiency and demand response programs), retiring or divesting high emission generation, and developing renewable and other zero‐ or low‐carbon resources. To this end, California has placed energy efficiency at the top of the state’s loading order117 and requires the utilities to limit long‐term investments to power plants that meet the Emission Performance Standard (EPS). As a result, the Energy Commission expects more than 2,060 MW of capacity and 17, 600 gigawatt hours (GWh) of energy to be divested between now and 2019,118 reducing the share of California’s electricity needs met by contracts with/ownership of coal‐fired generation from roughly 10 percent to less than 4 percent. In addition, California’s Renewables Portfolio Standard means that greater amounts of renewable energy will be needed over the longer term to realize GHG reduction
115 CPUC D.10‐06‐018 declined to adopt a multi‐year forward capacity market structure, but encouraged the Energy Commission, CPUC, and California ISO to develop a multi‐year forward capacity needs assessment capability.
116 Executive Order S‐3‐05, June 1, 2005, available at: http://gov.ca.gov/news.php?id=1861.
117 See State of California Energy Action Plan (2003), page 2, available at: http://www.energy.ca.gov/energy_action_plan/2003‐05‐08_ACTION_PLAN.PDF. Also see State California Energy Action Plan II, September 21, 2005, available at:
of
Fhttp://www.energy.ca.gov/energy_action_plan/2005‐09‐21_EAP2_FINAL.PD .
118 This includes the expiration of relationships with the Boardman (OR), Four Corners (NM), Reid Gardner (NV) and Navajo (AZ) coal plants, reduced procurement from the Intermountain (UT) facility and the expiration of contracts with 11 in‐state qualifying facilities (totaling 324 MW) that burn coal or petroleum coke.
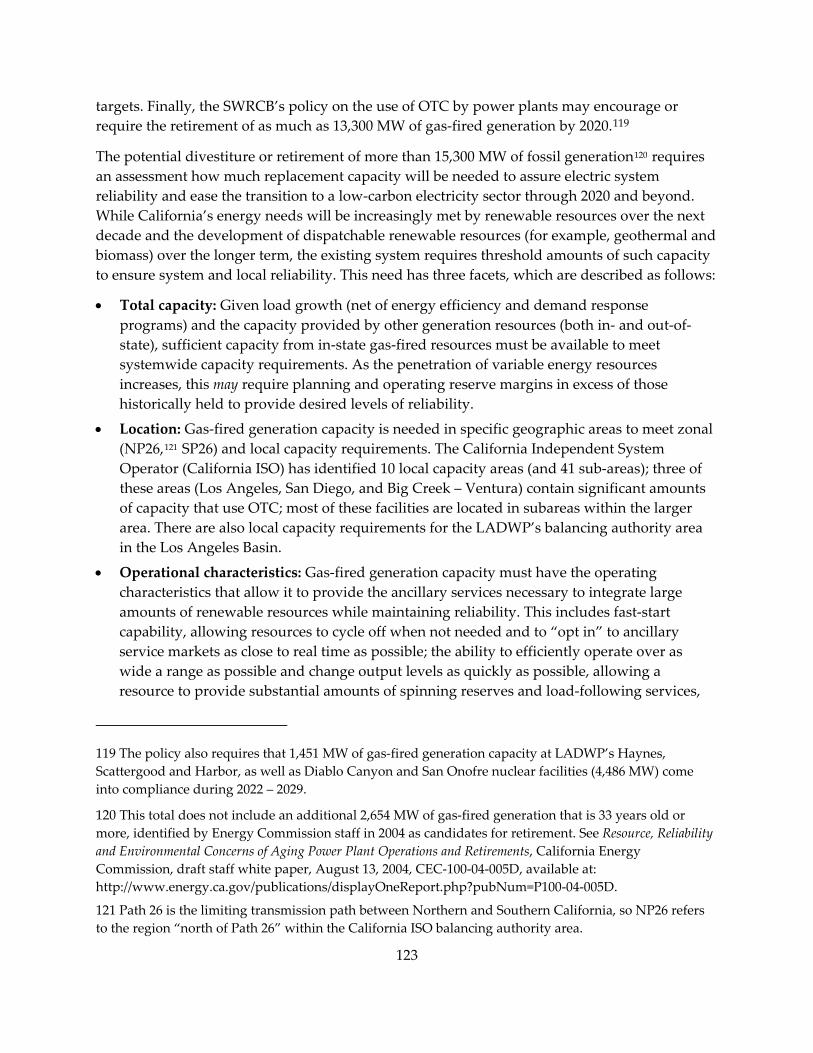
123
targets. Finally, the SWRCB’s policy on the use of OTC by power plants may encourage or require the retirement of as much as 13,300 MW of gas‐fired generation by 2020.119
The potential divestiture or retirement of more than 15,300 MW of fossil generation120 requires an assessment how much replacement capacity will be needed to assure electric system reliability and ease the transition to a low‐carbon electricity sector through 2020 and beyond. While California’s energy needs will be increasingly met by renewable resources over the next decade and the development of dispatchable renewable resources (for example, geothermal and biomass) over the longer term, the existing system requires threshold amounts of such capacity to ensure system and local reliability. This need has three facets, which are described as follows:
• Total capacity: Given load growth (net of energy efficiency and demand response programs) and the capacity provided by other generation resources (both in‐ and out‐of‐state), sufficient capacity from in‐state gas‐fired resources must be available to meet systemwide capacity requirements. As the penetration of variable energy resources increases, this may require planning and operating reserve margins in excess of those historically held to provide desired levels of reliability.
• Location: Gas‐fired generation capacity is needed in specific geographic areas to meet zonal (NP26,121 SP26) and local capacity requirements. The California Independent System Operator (California ISO) has identified 10 local capacity areas (and 41 sub‐areas); three of these areas (Los Angeles, San Diego, and Big Creek – Ventura) contain significant amounts of capacity that use OTC; most of these facilities are located in subareas within the larger area. There are also local capacity requirements for the LADWP’s balancing authority area in the Los Angeles Basin.
• Operational characteristics: Gas‐fired generation capacity must have the operating characteristics that allow it to provide the ancillary services necessary to integrate large amounts of renewable resources while maintaining reliability. This includes fast‐start capability, allowing resources to cycle off when not needed and to “opt in” to ancillary service markets as close to real time as possible; the ability to efficiently operate over as wide a range as possible and change output levels as quickly as possible, allowing a resource to provide substantial amounts of spinning reserves and load‐following services,
119 The policy also requires that 1,451 MW of gas‐fired generation capacity at LADWP’s Haynes, Scattergood and Harbor, as well as Diablo Canyon and San Onofre nuclear facilities (4,486 MW) come into compliance during 2022 – 2029.
120 This total does not include an additional 2,654 MW of gas‐fired generation that is 33 years old or more, identified by Energy Commission staff in 2004 as candidates for retirement. See Resource, Reliability and Environmental Concerns of Aging Power Plant Operations and Retirements, California Energy Commission, draft staff white paper, August 13, 2004, CEC‐100‐04‐005D, available at: http://www.energy.ca.gov/publications/displayOneReport.php?pubNum=P100‐04‐005D.
121 Path 26 is the limiting transmission path between Northern and Southern California, so NP26 refers to the region “north of Path 26” within the California ISO balancing authority area.

124
and operation under automated generation control, allowing the resource to provide regulation services.122 In addition, gas‐fired generation resources vary in their provision of inertia, needed to provide voltage support and stabilize the system when sudden component outages cause changes in frequency.
The 2011 IEPR Scoping Order calls for an assessment of needed additions to California’s electricity infrastructure to transition to a low‐carbon future while maintaining resource adequacy and reliability.123 Other discussions have taken place regarding infrastructure needs, including transmission to support central‐station renewables and upgrades to the distribution system to allow for the development of large amounts of distributed generation (DG).
This chapter of the draft 2011 IEPR discusses the major uncertainties that affect estimates of the needed gas‐fired generation for facilitating the integration of variable energy resources over the coming decade while maintaining system and local reliability. These uncertainties include:
• Demand growth,
• Potential retirement of generation units that use once‐through cooling.
• Renewable energy development, especially renewable DG,
• The need for dispatchable generation capacity to provide ancillary services in support of renewable resource integration.
• The necessary composition of new gas‐fired generation, including its ability to provide inertia.
• Combined heat and power development,
The remainder of this chapter discusses how these uncertainties affect electricity planning and the analysis needed during the current planning cycle to develop planning assumptions in their presence.
Demand Growth The California ISO integration studies and the CPUC’s Long‐Term Procurement Proceeding (CPUC LTPP) are using the 2009 IEPR demand forecast and associated estimates of the capacity
a
f
122 For a discussion of the services provided by gas‐fired generation, see: Framework for Evaluating Greenhouse Gas Implications of Natural Gas‐Fired Power Plants in California, consultant report, MRW & Associates, LLC, December 2009, CEC‐700‐2009‐009‐F, available at: http://www.energy.ca.gov/2009publications/CEC‐700‐2009‐009/CEC‐700‐2009‐009‐F.PDF. Fordiscussion of the role gas‐fired generation plays in integrating variable energy resources, see chapter 5 of Renewable Power in California: Status and Issues, August 2011, CEC‐150‐2011‐002, available at: http://www.energy.ca.gov/2011publications/CEC‐150‐2011‐002/CEC‐150‐2011‐002.pd .
123 California Energy Commission, Committee Revised Scoping Order, 2011 Integrated Energy Policy Report proceeding (Docket 11 IEP 1), March 30, 2011, page 6.

value of uncommitted energy efficiency in their analyses of infrastructure needs.124 The Energy Commission completed the forecast in late 2009 and, therefore, relied on historical data only through 2008 and economic projections that are now more than two years old. The Energy Commission staff has prepared a preliminary forecast for the draft 2011 IEPR but will not complete the final forecast until February 2012, accompanied by uncommitted demand‐side management (DSM) scenarios. This schedule allows further resolution of forecasting issues and use of updated economic and DSM assumptions.
Meanwhile, the IOUs have included in their LTTP filings an IOU case (the IOU Common Case) using an alternative, higher, demand forecast with lower uncommitted demand side impacts. Table 12 compares the peak demand forecast for 2020 for the base and DSM impacts.
Table 12: Comparison of Forecasts of California ISO 2020 Peak Demand
Required for LTPP (2009
IEPR Unmanaged
IOU Common Case for
LTPP
Preliminary 2011 IEPR Forecast
2011/2012 Transmission
Planning Process
CPUC Required
HighCPUC
Required LowUnmanaged CAISO Peak Demand 55,298 60,853 54,566 55,298 60,828 49,768 Uncommitted Energy Efficiency 5,687 4,275 NA - 5,687 5,687 New CHP 819 578 NA - 819 819 CAISO Peak net of EE and CHP 48,792 56,001 NA 55,298 54,322 43,262 Demand Response 5,145 4,490 NA NA 5,145 5,145 Sources: CPUC Rulemaking 10-05-006; PG&E, SCE, and San Diego Gas & Electric (SDG&E) System Resource Plan; Joint IOU Supporting Testimony, July 1, 2011, p. A-44 and workpapers. California ISO 2011/2012 Transmission Planning Process, Unified Planning Assumptions and Study Plan, Final – May 20, 2011.Energy Commission 2012-2022 Preliminary Staff Electricity and Natural Gas Demand Forecast, coming in fall 2011.
Notes: Unmanaged forecast for the CPUC Required case uses the 2009 IEPR demand forecast (CEC-100-2009-012-CMF, December 2, 2009) and uncommitted DSM from the mid-case in Incremental Impacts of Energy Policy Initiatives Relative to the 2009 Integrated Energy Policy Report adopted demand; use of demand response impacts in the 2011/2012 TPP remains under consideration.
Two of the most significant uncertainties regarding demand growth are economic assumptions and demand‐side impacts. The preliminary demand forecast is 1.4 percent lower than the 2009 IEPR forecast because the effects of the recession have been more severe than previously predicted. Conversely, the IOU Common Case demand forecast is 7 percent higher than the 2009 IEPR.
In addition to higher growth in the base forecast, the IOU Common Case forecast assumes lower impacts from energy efficiency, self‐generation, and demand response programs. The difference of 1,400 megawatts (MW) in energy efficiency is because the IOUs have found that some programs are not cost‐effective and found issues associated with replacement of program
124 “Uncommitted” energy efficiency refers to programs that have yet to be funded nor perhaps even designed but whose funding and implementation can be reasonably expected to occur for planning purposes. Failure to consider uncommitted energy efficiency in planning can lead to the financing and construction of surplus generation capacity at ratepayer expense.
125
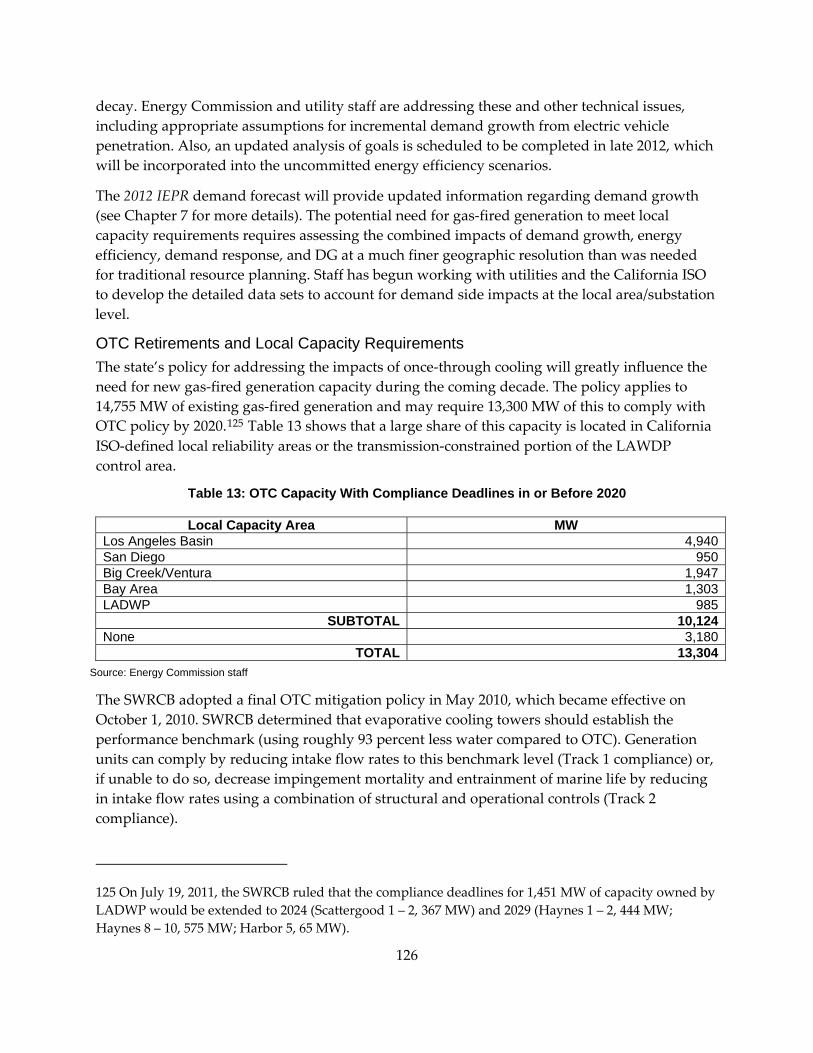
126
decay. Energy Commission and utility staff are addressing these and other technical issues, including appropriate assumptions for incremental demand growth from electric vehicle penetration. Also, an updated analysis of goals is scheduled to be completed in late 2012, which will be incorporated into the uncommitted energy efficiency scenarios.
The 2012 IEPR demand forecast will provide updated information regarding demand growth (see Chapter 7 for more details). The potential need for gas‐fired generation to meet local capacity requirements requires assessing the combined impacts of demand growth, energy efficiency, demand response, and DG at a much finer geographic resolution than was needed for traditional resource planning. Staff has begun working with utilities and the California ISO to develop the detailed data sets to account for demand side impacts at the local area/substation level.
OTC Retirements and Local Capacity Requirements The state’s policy for addressing the impacts of once‐through cooling will greatly influence the need for new gas‐fired generation capacity during the coming decade. The policy applies to 14,755 MW of existing gas‐fired generation and may require 13,300 MW of this to comply with OTC policy by 2020.125 Table 13 shows that a large share of this capacity is located in California ISO‐defined local reliability areas or the transmission‐constrained portion of the LAWDP control area.
Table 13: OTC Capacity With Compliance Deadlines in or Before 2020
Local Capacity Area MW Los Angeles Basin 4,940San Diego 950Big Creek/Ventura 1,947Bay Area 1,303LADWP 985
SUBTOTAL 10,124None 3,180
TOTAL 13,304Source: Energy Commission staff
The SWRCB adopted a final OTC mitigation policy in May 2010, which became effective on October 1, 2010. SWRCB determined that evaporative cooling towers should establish the performance benchmark (using roughly 93 percent less water compared to OTC). Generation units can comply by reducing intake flow rates to this benchmark level (Track 1 compliance) or, if unable to do so, decrease impingement mortality and entrainment of marine life by reducing in intake flow rates using a combination of structural and operational controls (Track 2 compliance).
125 On July 19, 2011, the SWRCB ruled that the compliance deadlines for 1,451 MW of capacity owned by LADWP would be extended to 2024 (Scattergood 1 – 2, 367 MW) and 2029 (Haynes 1 – 2, 444 MW; Haynes 8 – 10, 575 MW; Harbor 5, 65 MW).

127
There exists substantial uncertainty about when and how units will comply with the OTC policy. Owners filed compliance plans on April 1, 2011, but only a handful provided firm plans for the retirement and replacement of existing capacity.126 These include the following:
• Dynegy believes that its Moss Landing 1 – 2 units (1,020 MW) are already in compliance; the SWRCB must rule upon this contention.
• The owners of 10 units at 5 facilities totaling 4,737 MW are considering compliance through the use of structural and operational controls (Track 2).127 It is uncertain, however, that (a) such measures can bring the units into compliance, and (b) that if they result in compliance, they will allow enough operational flexibility to provide ancillary services or do so on a scale that yields a revenue stream sufficient to warrant the necessary investment. Planning entities will work with the SWRCB over the coming months to determine if imposing structural and operational controls is a compliance option for these resources. Where Track 2 compliance is likely to be infeasible (for either of the above reasons), planners should consider their retirement and the need to replace them as a planning assumption.
Merchant owners indicated that much of the existing capacity will be retired, with replacement capacity being built only if they can procure long‐term power purchase agreements. While studies have indicated the need for capacity in subareas containing El Segundo, Huntington Beach, and Encina,128 the state must refine estimates of LCR through 2020. The LCR process has historically focused on near‐term (one to three years) needs. During this planning cycle, the Energy Commission, CPUC, and the California ISO will develop long‐run LCR estimates in conjunction with assisting the SWRCB in implementation of its OTC policy and assessing emission reduction credit needs in the South Coast Air Quality Management District (SCAQMD) under AB 1318 (V. Manuel Perez, Chapter 285, Statutes of 2009).129
126 Contra Costa 6 – 7 (674 MW) will be replaced by Marsh Landing (760 MW nameplate), expected to come on line in 2013. El Segundo 3 (335 MW) will be replaced by new units (560 MW) at the same site, expected to come on line in 2015. LADWP is replacing Haynes 5 – 6 (535 MW) and Scattergood 3 (450 MW) with roughly equivalent amounts of capacity in 2013 and 2015, respectively.
127 Morro Bay (650 MW), Mandalay (430 MW), Ormond Beach (1,516 MW), Encina 4 – 5 (628 MW) and Moss Landing 6 – 7 (1,510 MW).
128 The California ISO’s 2013 – 2015 Local Capacity Technical Analysis indicates local capacity requirements in 2015 as follows: the El Nido subarea (in which El Segundo is located) of the Los Angeles Basin needs 511 MW (net of existing qualifying facilities); the Ellis subarea (in which Huntington Beach is located) of the Los Angeles Basin needs 468 MW; the Encina subarea (in which Encina is located) of San Diego needs 20 MW.
129 For a more detailed discussion of interagency efforts related to OTC and emission reduction credits in the Los Angeles Basin, see Part One of this chapter.
128
More than 2,650 MW of aging, non‐OTC gas‐fired power plants in California are candidates for retirement. Some are owned by publicly owned utilities and will likely be replaced,130 but a majority of these are merchant‐owned.131 In addition, newer plants without contracts or market revenues to cover going‐forward costs may be at risk, as capacity factors may be well below those anticipated when the plant was brought on‐line.
Renewable Energy Development As California increases its reliance on renewable energy, the amount of dependable capacity provided by renewable resources will also increase.132 The dependable capacity provided by new renewable resources and its location will affect the amount and location of dependable capacity needed from new dispatchable gas‐fired generation to meet system and local capacity requirements. The composition of renewable resources with respect to technology and location will affect the need for dispatchable gas‐fired generation to provide ancillary services and inertia.
CPUC staff proposed four RPS scenarios in the 2010 LTPP proceeding. The dependable capacity associated with each scenario is different, with the most dramatic difference being that of the environmentally constrained portfolio, which assumes the development of DG on a scale proposed by the Governor’s Clean Energy Jobs Plan.133 Under the posited assumptions, DG resources are accorded no dependable capacity value on the supply‐side of load‐resource assessments.134 Planning entities need to arrive at consensus regarding (a) the potential range of DG development during the current planning cycle, (b) the allocation of said development to customer‐ and utility‐side of the meter resources, and (c) the effective dependable capacity value of each. The 2012 IEPR demand forecast needs to make adjustments to account for DG on the customer‐side of the meter and to allocate both sets of resources to balancing authority and local capacity areas. Finally, the scenarios should consider revisions that incorporate
130 Units totaling 437 MW at El Centro, Olive, Broadway, and Grayson.
131 Pittsburg 7, Etiwanda 3‐4, Coolwater 1‐4, and Long Beach 1‐4, totaling 2,217 MW.
132 “Dependable capacity” here refers to the share of nameplate capacity that can be assumed to be available at the time of the system or local capacity area peak and, thus, available to meet resource adequacy requirements and assumed for planning purposes. For resources in the California ISO balancing authority, this is equivalent to net qualifying capacity.
133 Two of the scenarios proposed by the CPUC (trajectory, cost‐constrained) contain 2,436 MW (nameplate) of new DG beyond that which is embedded in the 2009 IEPR demand forecast. The time‐constrained scenario contains 5,305 MW; the environmentally‐constrained scenario 9,633 MW.
134 DG that is consumed on site or sold “over the fence” is treated as a demand‐side resource, requiring an adjustment to the demand forecast; DG exported for wholesale is treated as a supply resource.

129
information and analysis from the Desert Renewable Energy Conservation Plan and Federal Programmatic Environmental Impact Statement‐adopted land use policies.135
The Energy Commission’s Electricity Supply Analysis Division, the CPUC, and the California ISO will work together during the coming months to develop an appropriate set of planning assumptions related to DG development.
Renewable Integration Needs Increased reliance on variable energy resources requires that dispatchable generation resources be available to balancing authorities in real time to provide additional regulation and load‐following services to make up for differences in forecasted and actual output.136 As OTC resources retire, new dispatchable resources may be necessary. In addition, the quantity of replacement capacity necessary may result in a planning reserve margin in excess of the 15 – 17 percent historically deemed necessary for desired levels of reliability.
The California ISO’s recent studies of renewable integration concluded that the state does not need new dispatchable gas‐fired generation for meeting the 33 percent by 2020 Renewables Portfolio Standard (RPS) if certain conditions are met. These conditions include:
• That load growth net of uncommitted energy efficiency, other DSM programs, and self‐generation is consistent with the CPUC’s “mid‐case” assumptions for use in the 2010 Long‐term Procurement Proceeding. According to the California ISO, if 2020 loads are 10 percent higher (the CPUC’s “high case”), then 2,600 MW of new gas‐fired generation will be necessary.137
• That California ISO can reduce load forecast error and that California ISO/scheduling coordinators can reduce wind and solar forecast error. If not addressed, the state will need increased amounts of dispatchable capacity to integrate large quantities of variable energy resources.
• The proposed changes in the California ISO’s market rules will increase the willingness and ability of existing generation to provide additional ancillary services and less pure energy;
135 See the California Energy Commission comments on the California ISO 2011 – 2012 Transmission Planning Process, July 15, 2011, available at: http://www.caiso.com/Documents/CaliforniaEnergyComments_RenewablePortfolioAssumptions_2011‐2012TransmissionPlanningProcess.pdf.
136 For a discussion of the relationship between variable energy resources an ancillary services needs, see chapter 5, Grid‐level Integration Issues, in Renewable Power in California: Status and Issues, August 2011, CEC‐150‐2011‐002; for definitions of these and other ancillary services see page 108 of the same document.
137 See the memorandum to the California ISO Board of Governors from Keith Casey, Vice President for Market and Infrastructure and Development, August 18, 2011, available at: http://www.caiso.com/Documents/110825BriefingonRenewableIntegration‐Memo.pdf.
130
the provision of these services is not limited by contract or cost conditions or permit restrictions.
• Reduced imports used for resource adequacy may require additional, existing in‐state resources to provide energy, reducing their ability to provide ancillary services when needed.
In addition, the California ISO’s renewable integration studies for 2020 do not consider local capacity requirements and assume continued operation of selected OTC capacity (Moss Landing 1 – 2) and availability of imports of more than 16,000 MW. The latter assumption yields a planning reserve margin in 2020 in excess of 17 percent. A different set of assumptions regarding local capacity requirements and available generation resources would possibly yield a need for new dispatchable capacity.
The settlement reached in the CPUC’s 2010 LTPP proceeding recognized that there is insufficient information for accurately estimating needed dispatchable capacity for integrating variable energy resources to meet the state’s RPS. The Energy Commission anticipates that the CPUC’s 2012 LTPP proceeding will evaluate this information and develop planning assumptions.
The Technological Characteristics of Gas-Fired Generation There is substantial uncertainty regarding the quantity and technological characteristics of new gas‐fired generation needed for meeting planning reserve margins, providing ancillary services for integrating large quantities of renewable resources, and providing sufficient inertia so as to maintain system stability in the face of component failures under extreme load and import conditions.
The system may require a share of new gas‐fired generation exclusively to meet system, zonal, and local capacity requirements. As energy demand equals or exceeds 95 percent of forecasted peak demand only a handful of hours per year, these needs can be met with peaking resources. The system may also need gas‐fired generation to provide ancillary services to support integration of new wind and solar resources; as discussed earlier, this requires combined cycle and hybrid generators that can cycle on and off and operate over a wide range of output. The Energy Commission will hold an IEPR workshop during the first quarter of 2012 to discuss the ability of new gas‐fired generation to provide ancillary services.
The system may also need dispatchable gas‐fired generation to provide inertia, especially in Southern California. The 2009 IEPR first highlighted this issue in discussions during the proceeding.138 The inertia provided by internal generation limits the imports into Southern
,
138 Committee Workshop on the Potential Need for Emission Reduction Credits in the South Coast Air Quality Management District, September 24, 2009, see: http://www.energy.ca.gov/2009_energypolicy/documents/index.html#092409. For a discussion of inertia and the role it plays in reliability, see Renewable Power in California: Status and Issues, August 2011CEC‐150‐2011‐002, pp. 115‐6. Also see Joseph H. Eto, et al, December 2010, Use of Frequency Response

131
California. This inertia requirement is binding during very high levels of demand in Southern California in the summer; while imports rise with demand, internal generation is needed to provide inertia. This constraint can also be binding during low load hours (early morning) in the spring – the low levels of internal generation during these hours can limit the ability to import abundant, low‐cost hydro and coal‐fired generation. 139
Generation resources that use OTC provide a significant share of the inertia needed by the system. The retirement of OTC resources may require replacement capacity (largely gas‐fired) to provide a similar amount of inertia. While solar thermal resources can provide substantial amounts of inertia, wind resources provide very little (if any), and solar photovoltaics do not provide any at all. Therefore, the shift from solar thermal to solar photovoltaic development may increase the need for inertia from new gas‐fired resources.
The need for inertia from new generation resources has implications for the type and location of new gas‐fired generation. The provision of inertia requires generators to be synchronous to the grid (“spinning”). To the extent that incremental amounts of inertia are needed in a large number of hours, new power plants should be load‐following; for example, they should be designed for dispatch and operation at low levels of output, rather than peaking resources.140 New gas‐fired resources would also have to be located within the boundaries of the area affected by the Southern California Import Transmission nomogram.141
Studies are underway to help understand the future needs of the transmission grid. The California ISO is conducting a study with General Electric on frequency response and system inertia as part of the Renewable Integration Analyses. This study is expected to be completed in fall 2011. The California ISO also is conducting analyses as a member of the inter‐agency working group providing assistance to the ARB and SWRCB.
ailable f
Metrics to Assess the Planning and Operating Requirements for Reliable Integration of Variable Renewable Generation, Ernest Orlando Lawrence Berkeley National Laboratory, LBNL‐4142E, avat: http://www.ferc.gov/industries/electric/indusact/reliability/frequencyresponsemetrics‐report.pd .
f
139 The amount of inertia needed in Southern California is indicated by the East of River/Southern California Import Transmission nomogram, developed to ensure sufficient reactive margin and inertia in the Southern California system for critical contingencies. This nomogram indicates the amount of inertia needed given electricity demand in and electricity imports into Southern California. Generation located near the Arizona and Nevada border can be located outside the area in which resources contribute inertia to meet Southern California Import Transmission requirements, instead serving only as additional imports.
140 Gas‐fired generators designed for load‐following also provide more inertia on a per‐MW basis than peaking resources.
141 California ISO, Operating Procedures Index List, November 2011, available at: http://www.caiso.com/2b66/2b66c2ce4f3c0.pd .

132
Combined Heat and Power Development California has set targets for efficient combined heat and power (CHP), which can reduce GHG emissions by jointly producing electricity and capturing waste heat to power industrial, commercial, and institutional processes (with less fuel than would be required separately).142 The ARB’s AB 32 Scoping Plan143 called for the development of 4,000 MW of new CHP by 2020 as a strategy for reducing GHG emissions by 6.7 million‐metric tons (MMT). Governor Brown’s Clean Energy Jobs Plan calls for the development of 6,500 MW of new CHP by 2030.
The CPUC’s qualifying facility (QF) settlement144 adopts the Scoping Plan target, allocating it based on retail sales to the state’s large IOUs (4.3 MMT), energy service providers and community choice aggregators (0.5 MMT), and the state’s publicly owned utilities (1.9 MMT).145 The settlement establishes a near‐term target of 3,000 MW for entities under CPUC jurisdiction, but this capacity includes not only new CHP, but the renewal of QF contracts due to expire during the next three years. From 2015 onward, “CHP request for offers” will procure more CHP to the extent that the GHG emissions reduction target has not been met.
The planning assumptions used in the CPUC’s 2010 LTPP proceeding146 reflect a commitment to both maintaining existing CHP and developing new projects. The proceeding assumes the retention of existing CHP (totaling 5,233 MW)147 though the planning period (2020). It assumes new CHP in place by 2020 is roughly half of the 4,000 MW originally targeted by the ARB.148
nt
142 There are nearly 1,200 active CHP projects in California totaling more than 8,800 MW, with nearly 90 percent of this capacity coming from systems greater than 20 MW. CHP has significant additional market potential, as high as 6,200 MW, despite significant barriers to entry; see Combined Heat and Power Market Assessment, ICF International, Inc., April 2010, CEC‐500‐2009‐094‐F, available at: http://www.energy.ca.gov/2009publications/CEC‐500‐2009‐094/CEC‐500‐2009‐094‐F.PDF. A significashare of existing projects produce for on‐site consumption only; the loads and capacity embodied in this self‐generation are not included in load and resource accounting tables compiled and used by state energy agencies.
143 California Air Resources Board, Climate Change Scoping Plan, December 2008.
144 D.10‐12‐035, issued December 21, 2010, in A.08‐11‐011, modified by D.11‐07‐010 (July 14, 2011) and D.11‐10‐016 (October 6, 2011).
145 Parties to the QF settlement note that the CPUC does not have jurisdiction over publicly owned utilities but assert it can set GHG emissions reduction targets for the IOUs, ESPs, and CCAs.
146 For the CHP assumptions proposed for use by CPUC staff in the 2010 LTPP proceeding, see the CHP tab of the spreadsheet posted on December 7, 2010, at: http://www.cpuc.ca.gov/PUC/energy/Procurement/LTPP/ltpp_history.htm.
147 The 3,513 MW are on the supply‐side, representing expected exports to the grid during the peak hour. Another 1,720 MW is on the demand side, reflecting on‐site consumption during the peak hour adjusted upward to account for transmission and distribution losses of 7.7 percent.
148 The 4,000 MW is reduced to 3,742 MW to account for new CHP assumed in the Energy Commission demand forecast. This number is then halved (to 1,871 MW) with 936 MW on both the supply‐ and

133
The amount of new CHP developed through 2022 will depend upon a number of factors; the impact of the QF settlement is only one consideration. Although many existing CHP generators provide GHG reductions compared to the benchmark established in the QF settlement, some do not. The IOUs will meet their share of the emissions reduction target in part by terminating contracts with CHP resources that fail to meet the benchmark, resources that may or may not continue to operate. New CHP that elects to participate in utility request for offers will not only have to meet the GHG emission benchmark, but provide energy and capacity in a least‐cost, best fit manner, thereby competing with conventional resources.149 While the settlement maintains a must‐take obligation for CHP up to 20 MW in size, it has been more difficult to develop small CHP despite programs designed to encourage its development. Table 14 summarizes these programs and their yield to date.
Table 14: Programs for Small CHP
Technology Program Cap
Capacity to Date (MW)
Installed Capacity
CHP (MW)
Number of CHP
Projects
AB 1969 FIT* Small Hydro, CHP, PV 750 MW 38.5 17.1 16AB 1613***** CHP Only N/A 0 0 0
Self-Generation Incentive Program***
Wind, Fuel-Cells, Gas Turbines, IC Engines, Microturbines, Energy Storage
Limit Based on Program Funding 191 171 337
CHP/QF Settlement** CHP Only 3,000 MW SMUD FIT Solicitation**** Solar & CHP 0-100 100 0 0* AB 1969 was revised by SB 32, subsequent development is included.
** The 3,000 MW is divided among the three IOUs based on load served. (1,387 for PG&E, 1,402 for SCE, and 211 for SDG&E) In addition, there is a GHG reduction target that may require additional capacity to be procured, but that amount is unknown at this time.***The SGIP Proposed Decision brings back the inclusion of internal combustion engines, gas turbines, and microturbines that were all dropped from the program in 2008.
****Capacity is not yet in place, but the program is fully subscribed (30 projects total, all solar).
***** Program is still pending due to controversy over contract terms. A resolution resolving these issues will be heard at a CPUC business meeting on November 10, 2011.
Discussions with CHP generators and developers indicate that continued regulatory uncertainty and the lack of resolution on the high costs associated with standby charges and departing load fees negatively affect private sector CHP investment decisions in California. The largest barrier, especially for large CHP developers, continues to be uncertainty relating to GHG regulations and costs under AB 32. Others include local permitting issues, CHP program delays due to slow implementation and prolonged legal conflicts, and long waits for interconnection.
demand sides, in keeping with ARB assumptions. Slightly more than 80 percent of this (1,505 MW) is allocated to the California ISO balancing authority area; the remainder is assumed to be developed in the four other balancing authority areas in the state.
149 See Section 6.9 of the QF settlement agreement.

134
Energy Commission staff has commissioned an update of the 2009 Public Interest Energy Research (PIER)‐funded Combined Heat and Power Market Assessment, expected to be completed by December 2011.150 This analysis will provide information for projections regarding potential ranges of CHP development in aggregate, as well as information on potential CHP development in local capacity areas, and thus the residual need for new, conventional gas‐fired generation both system wide and in local areas. Staff also plans to produce a white paper on CHP development and related issues in early 2012 and is working with CPUC staff to assess the potential disposition of existing CHP projects under the QF settlement. This body of work, along with input from stakeholders in the 2012 IEPR proceeding, will provide information for assessments of likely CHP development through 2022 and the policy measures that will incent development during this period and for reaching 2030 targets.
150 ICF International, Inc., Combined Heat and Power Market Assessment, (CEC 500‐2009‐094‐F, April 2010), available at: http://www.energy.ca.gov/2009publications/CEC‐500‐2009‐094/CEC‐500‐2009‐094‐F.PDF.
135
CHAPTER 9: Transportation Energy Forecasts and Analysis This chapter provides a brief background and analysis of transportation energy issues with an emphasis on challenges that have the potential to impact the availability and market price of transportation fuels over the near to mid‐term. California’s transportation energy sector provides citizens and businesses with the means and mobility for many essential activities. Industry, commercial businesses, households, transit agencies, and government all rely on transportation energy and expect that needed supplies will be available for movement of goods and people over highways, rail, waterways, and air. Transportation fuels also provide energy for off‐road, industrial, agricultural, commercial, military, and recreational uses.
Any source of energy for transportation purposes has economic, environmental, security, and infrastructure dimensions. Petroleum fuels refined from crude oil, currently the dominant transportation energy source in California and globally, have historically had many advantages. These include high energy content, portability, storability, established vehicle fleet and equipment stock, and established refining, transportation, storage, and distribution infrastructure. Until recently, petroleum was a lower‐priced and well‐supplied source of fuels; however, these advantages appear to be eroding. While petroleum will be available far into the future and markets will fluctuate, higher prices may be a permanent feature of future fuels markets and offer greater incentives for increased use of alternative and renewable fuels. Petroleum use raises other considerations, since it is the source of about 40 percent of state GHG emissions, as well as other air, water, and land pollutants. Also, California relies heavily on foreign imports of petroleum from geopolitically sensitive areas, which can create significant supply and price vulnerabilities. As a consequence of these undesirable characteristics, state and federal policies and regulations have been implemented to reduce future petroleum use.
There are three general strategies for reducing petroleum use: 1) increasing fuel efficiency in the fleet of vehicles, engines, aircraft, and vessels; 2) using non‐petroleum fuels; and 3) changing land use and urban design to reduce vehicle travel. One common challenge among these approaches is developing new infrastructure, vehicle technologies, and markets. While existing systems still serve a need, the new systems are proposed to avert negative impacts from continuing business‐as‐usual trends. Moreover, while alternative strategies have many benefits, they also come with their own sets of economic, technical, and policy challenges.
Transportation Energy Demand & Policy Impacts To better understand the impacts of potential future trends in transportation energy use, the Energy Commission staff has developed two scenarios of transportation energy demand and fuel prices, as well as analyses of the impacts on supply and demand of a variety of federal and state policies and regulations. These scenarios are not intended to be explicit predictions of the future, but rather to explore the potential range, magnitude, and direction of trends in energy use and price, vehicle purchase, and supply and infrastructure requirements under a wide array of uncertain future conditions. Ideally, this will enable policy makers to better anticipate

136
challenges and opportunities for implementing the significant changes being proposed to the transportation energy system and its related markets, as well as our ability to reach the goals set by such policy guiding documents as the Bioenergy Action Plan, the State Alternative Fuels Plan, various Integrated Energy Policy Reports, and regulations such as the Low Carbon Fuel Standard (LCFS).
The transportation energy planning scenarios make assumptions about important variables such as fuel prices, demographics, the economy, and the impacts of existing rules and policies, such as AB 1493 (Pavley, Chapter 200, Statutes of 2002), the revised Corporate Average Fuel Economy standards, and the Zero Emission Vehicle (ZEV) mandates. The forecasting tools used to simulate these scenarios, however, do not account for the impacts of all existing or proposed regulations. Staff modified the preliminary model‐generated forecasts to assess the effects of several significant regulatory standards, in particular the federal Renewable Fuels Standards II (RFS2) and California’s LCFS, among others, under a variety of assumptions.
Transportation Energy Demand – Historical & Forecast Over the last several years, California’s total transportation energy and travel demand has steadily declined, primarily the consequence of high prices and a prolonged economic downturn. Specifically, the consumption of gasoline, diesel and jet fuel has declined from an aggregate total of 23.2 billion gallons in 2006 to 21.5 billion gallons in 2010. This represents a 7.2 percent decline in consumption. However, the decline in petroleum dependence over the same period of time has been even greater at 9.8 percent. This additional drop is due to the increased use of ethanol in gasoline. Data for 2011 indicate that gasoline and diesel consumption for the first seven months of 2011 were down 2.0 and 2.1 percent, respectively, from 2010. This weakness results from the combination of sustained high fuel costs, low economic growth, and continued high unemployment (which stood at 11.9 percent as of September 2011 for California) leading to less movement of goods and people.
Forecasts of California’s petroleum, renewable, and alternative transportation fuel demand generation by Energy Commission staff are based on scenarios of High and Low Petroleum Demand. Staff’s “Preliminary Forecasts” for these two scenarios are not adjusted for the effects of the Federal RSF2, whereas the “Final Forecasts” are. The unadjusted forecast for gasoline use in the “Low Petroleum Demand Scenario” falls 4.2 percent from 2009 to 14.2 billion gallons by 2030, largely as a result of high fuel prices, efficiency gains, and competing fuel technologies. In the “High Petroleum Demand Scenario”, assumptions such as the recovering economy and lower relative fuel prices lead to gasoline consumption growing 15.8 percent to 17.1 billion gallons in 2030, again unadjusted for RFS2. However, for California obligated parties (refiners, importers, and blenders) to comply with RFS2 ethanol consumption requirements, staff concludes that its gasoline consumption forecast would need to be modified to reflect greater consumption of ethanol. Since staff assumed that ethanol blended in gasoline will be capped at 10 percent, satisfying the RFS2 obligations will require substantial increases in the use of ethanol, such as additional E85, expansion of ethanol blended gasoline to E15 levels or aggressive development of low carbon biofuel production in California and other states. All of

137
these options face difficulties and additional analyses should assess the potential impacts of all of these options and combinations of options.
After adjusting for the impact of California’s RFS2 proportional share obligations, staff estimates the final forecast of gasoline consumption in the Low Petroleum Demand Scenario to decline 15.6 percent from 2009 to 12.5 billion gallons by 2030. This is substantially lower than the Preliminary Estimate prior to RFS2 compliance and, as noted, is primarily the result of increased ethanol consumption through one or more options to fulfill RFS compliance. The final RFS2 adjusted annual gasoline consumption estimate in the High Petroleum Demand Scenario increases to about 16 billion gallons by 2030, an 8 percent increase from 2009.
The RFS2 has only a modest impact on forecasted diesel demand in California. In the Preliminary Forecast, total annual diesel consumption in the Low Petroleum Demand Scenario increases to 4.1 billion gallons by 2030, largely because of continued economic growth and freight movement. Adjusting for RFS2 proportional share obligations reduces the final diesel consumption forecast slightly in this scenario to 3.9 billion gallons by 2030, or an increase of 22.3 percent from 2009. In the High Petroleum Demand Scenario, which assumes a higher rate of economic growth, total unadjusted annual diesel consumption increases to 5.0 billion gallons by 2030. Adjusting for RFS2 proportional share obligations reduces diesel consumption to 4.8 billion gallons, an increase of 50.4 percent from 2009 levels.
The RFS2 requirements present California with a dilemma on how to make a commitment to a sizeable amount of ethanol and also fulfill multiple state policy objectives such as the Low Carbon Fuel Standard, petroleum displacement goals, and Bioenergy Action Plan goals. All of the options to increase ethanol use face numerous challenges and involve some unintended consequences to fulfill the RFS2 requirement. The U.S. EPA’s continual waivers of RFS2 requirements that obligated parties produce a minimum amount of advanced or cellulosic biofuels jeopardizes California’s efforts to develop low carbon biofuels from agricultural, forestry and urban waste residue and some purpose grown crops.
Available forecasts for electric vehicles vary widely both in magnitude and the split between plug‐in hybrid electric vehicles (PHEVs) and full electric vehicles (FEVs). These differing projections reflect considerable variation in assumptions that can be made about the technology, including consumer acceptance, vehicle attributes and costs, fuel prices, manufacturer plans, vehicle use (especially vehicle miles traveled), and energy efficiency ratios compared to gasoline vehicles. Energy Commission staff forecasts incorporate current fuel efficiency standards, RFS2, and ZEV mandate, but do not estimate potential effects of the LCFS program on EV populations. Between 2009 and 2025, various forecasts show that electric vehicle growth will increase rapidly, largely the result of substantial, cumulative market penetration of PHEVs and FEVs, ranging from 440,000 vehicles in 2020 to 1.4 million vehicles by 2025. Future analysis will be needed to evaluate and confirm the amount of electricity consumed by electric vehicles and the number of PHEVs and FEVs.
Staff forecasts annual transportation consumption of natural gas to increase at a compound annual rate of over 3 percent to between 243 million and 256 million gasoline gallon equivalents

138
by 2030, a range of 87 to 96 percent above 2009 levels. Staff did not project hydrogen fuel cell vehicle (FCV) population or fuel use in this analysis because the 2009 California Vehicle Survey did not ask for consumer response to these types of vehicles. Surveys of automakers conducted by the Energy Commission and ARB staff projected estimates of about 50,000 FCVs by 2017.
Staff’s electric and natural gas fuel demand and vehicle projections were the focus of considerable oral and written comments by stakeholders; staff intends to further assess the wide range of uncertainties associated with these forecasts in future staff reports. Moreover, future consumer travel and vehicle choice surveys will be conducted collaboratively between the Energy Commission, the ARB, and Caltrans to develop more widely vetted and consistent forecasts.
Federal Regulation - Renewable Fuels Standard (RFS2) The RFS2 permits a maximum volume of corn ethanol and mandates specific volumes of cleaner or more advanced biofuels. These volume mandates apply to all petroleum fuel producers nationwide. In California, the likely effect of RFS2 and LCFS combined will be greater consumption of lower carbon intensity (CI) ethanol. Energy Commission staff forecast that 2.7 to 3 billion gallons of increased volumes of ethanol from one or more options will be required by 2030. Increased consumption of E85 as one option is contingent upon availability of adequate numbers of vehicles, refueling facilities, appropriate fuel supplies, and California consumer demand for vehicles and fuel. Vehicle manufacturers would need to build more Flexible Fuel Vehicles (FFV) to consume the greater E85 volumes.
In order to realize this RFS2‐adjusted forecast, California’s retail fueling infrastructure may require the installation of between 1,300 and 13,000 E85 dispensers by 2022 depending on total demand and dispenser throughput. The estimated average cost per E85 dispensing unit, including installation and permitting of tank, dispenser, and appurtenances at 23 existing stations funded by the Alternative and Renewable Fuel and Vehicle Technology Program was about $330,000. Retail gas station owners and operators have no obligations under the RFS2 regulations to offer E85 for sale and little to no financial incentive to make an investment of this size. The difficulty facing station owners to consistently set the retail price of E85 low enough (relative to gasoline), while still making a profit, may be hard to overcome. The challenge comes about because consumers who use E85 in their FFVs will experience between 23 and 28 percent lower fuel economy compared to gasoline that contains only 10 percent ethanol. This means that a retail station owner would need to price E85 at least 23 percent lower than gasoline (E10). Recently, California E85 wholesale prices were calculated to be 20.2 percent lower than E10 in 2009, 24.3 percent lower during 2010, and 16.4 percent lower during the first 8 months of 2011. Ethanol prices over the last couple of years have not been low enough to provide a sufficient discount to enable retail sellers of E85 to consistently offer this fuel for sale to the public at a low enough discount to compensate for the decreased fuel economy.
The need to use more advanced types of ethanol to help achieve compliance with the RFS2 and LCFS regulations could necessitate increased use of new types of ethanol, such as sugarcane ethanol from Brazil and cellulosic ethanol both of which may command an additional price

139
premium compared to traditional corn‐based ethanol. This would decrease the likelihood that E85 could be competitively marketed in California on a consistent and widespread basis without the use of even lower retail tax treatment and/or ongoing price discounting by petroleum suppliers that would need to supply ethanol for E85 at prices that induce owners of flexible‐fuel vehicles to use E85. There is an increased risk that some or all of the elements necessary for significant penetration of E85 will not come to pass, complicating the ability of obligated parties in California to comply with the RFS2 mandates.
However, the LCFS does provide strong incentives for producers of low carbon‐intensity ethanol to price their products competitively. This is because of a number of reasons, including the LCFS provisions that provide greater credits for lower CI fuels and the lack of an expiration date on the credits. Because of this, ARB anticipates that E85 may play a significant role in pathways that LCFS regulated parties will likely take to comply with both the LCFS and RFS2 requirements.
Increased use of advanced biofuels will help mitigate the need for substantial volumes of E85. Some advanced biofuels, such as sugarcane and cellulosic ethanol, have price structures that currently price them above corn ethanol. However, this effect could be moderated because the carbon intensities (CIs) for U.S. produced corn ethanol have become considerably lower than originally anticipated as U.S. producers find ways to lower their production carbon footprint. This will result in increased value for LCFS credits based on lower CI ethanol, including lower CI corn ethanol. This will be particularly true as the LCFS compliance standards become more stringent, making lower CI fuels even more attractive since they generate more credits. Substantial U.S. and California investments in low CI ethanol and other fuels would further offset initial price differentials for the lower CI ethanol. Indeed, there are indications that such substantial investments have been occurring. It is anticipated that such investments will continue to occur if California through the Energy Commission’s Alternative and Renewable Fuel and Vehicle Technology Program maintains its leadership role in transforming the transportation fuels sector and consistently sends clear market signals that provides investors with certainty.
The second challenge associated with the RFS2 is the ability of the biofuels industry to provide sufficient quantities of cellulosic biofuels necessary to achieve compliance with the federal annual minimum target volumes. Further technological advances are needed to overcome higher production costs relative to the costs for conventional biofuels such as corn‐based ethanol. As a consequence, the U.S. EPA has had to downgrade the minimum cellulosic fuel requirements by 94 percent between 2010 and 2012. Staff has elected to use a lower projection of cellulosic fuel availability than the minimum standards set forth by Congress. Staff’s proportional share RFS2 compliance analysis incorporated the cellulosic biofuel projections provided by the Energy Information Administration (EIA). A continuation of the slow pace of progress for commercialization of large volumes of cellulosic ethanol may present challenges for meeting California’s LCFS towards the end of the decade. Energy Commission and ARB staff will continue to coordinate on these scenarios to refine them and identify additional
140
scenarios that can be used to meet the LCFS goals beyond 2017‐2018 and to anticipate the various challenges that may arise.
Another set of concerns about the higher mandated levels of biofuel use prescribed by the RFS2 include effects on water use and water quality. A study sponsored by the National Academies of Science has identified several areas of uncertainty with regard to such impacts, including amount of added irrigation needed to provide mandated biofuels, types and amounts of fuel feedstocks required, additional fertilizer and pesticide requirements for feedstock crops,
potential changes in farming methods, and water requirements of biorefineries.151 Cellulosic feedstocks may have the potential to reduce some of these impacts. Staff should continue to monitor research into these subject areas, including any that are specific to California, and incorporate findings into future reports.
State Regulation - Low Carbon Fuel Standard The LCFS requires a 10 percent reduction in the average carbon intensity (or CI), as measured by both direct and indirect life cycle carbon emissions) of California transportation fuel between 2010 and 2020.152 Staff has prepared case analyses to assess the feasibility of compliance with the LCFS using various types of biofuels and LCFS credits for transportation electricity and natural gas. Prices were projected for all of the biofuels included in the analysis and generally show an increase in value throughout the forecast due to an assumed rising value for fuels that have lower carbon intensities than traditional biofuels.
Compliance with LCFS throughout the entire forecast period will evolve over time and present challenges not yet examined. It should be noted that 2011 is the initial year of CI reductions under any of the cases examined and it is difficult to forecast with accuracy compliance with the LCFS over the long‐term. For these cases, Energy Commission staff assumed that all uses of electricity and natural gas for transportation purposes would generate carbon credits for regulated parties. However, this assumption is dependent on ARB completing its assessment of what portion of existing transit electricity use may be eligible for credits and at what levels. Aggregate statewide compliance with the standard is achieved when the quantity of carbon credits (as measured in metric tonnes) yielded from the use of biofuels, electricity and natural gas exceeds the quantity of carbon deficit generated from petroleum‐based gasoline and diesel fuel.
The main challenges associated with the LCFS are: ensuring that production and delivery to California of sufficient quantities of low‐CI biofuels are ramped up to help achieve compliance in the later years of the program.
151 National Academies of Science, Water Implications of Biofuels Production in the United States, 2008; available at http://www.nap.edu/catalog.php?record_id=12039
152 Please see the California Air Resources Board website that contains background information and regulations at: http://www.arb.ca.gov/fuels/lcfs/lcfs.htm
141
Biofuel Availability Staff analyses for LCFS compliance cases assume that LCFS compliance feasibility through 2017 was accomplished through the use of up to 50 percent of the nation’s available supply of cellulosic gasoline forecast by EIA.153 If up to 50 percent of the other cellulosic biofuels (cellulosic ethanol and cellulosic diesel) forecast by EIA to be available in the United States were also used in California, compliance with the LCFS could be extended through 2019. A continuation of the slow pace of progress for commercialization of large volumes of cellulosic ethanol may present challenges for meeting California’s LCFS toward the end of the current compliance period. The Energy Commission’s Alternative and Renewable Fuel and Vehicle Technology Program (ARFVTP) has awarded $45 million to co‐fund the initial stages of 17 biofuel projects in California that could produce up to 600 million gallons of advanced biofuels by 2020 if full scale commercialization occurs in each project.
The diesel scenarios depend, in part, on relatively large quantities of renewable diesel from inedible tallow and biodiesel from corn oil. For example, staff has assumed that 50 percent of the feedstock that is theoretically available is used to produce these two types of biofuels and all of this production is sold to California for use in the LCFS program. Staff has calculated in Case 3 that 22 percent of the carbon credits generated by 2017 would be obtained from renewable diesel alone, underscoring their importance for compliance, assuming credits are not sufficiently available in the market.
There are several challenges to any reliance on higher biodiesel blends. The challenges include: ensuring adequate volumes of specific fuel types; need for ensuring infrastructure compatibility with higher biodiesel concentrations; and manufacturer vehicle engine warranty concerns for biodiesel blends in excess of 10 percent. While these considerations present challenges to the increased use of biodiesel, particularly at the higher blends, sufficient time, testing and investments are expected to address these concerns. ARB also has identified the potential for increased oxides of nitrogen NOx emissions in higher biodiesel blends, but has expressed its intent to address and mitigate this potential when it pursues a rulemaking to establish standards for biodiesel and renewable diesel in late 2012.
The final challenge for biofuel availability has to do with Brazilian ethanol. Energy Commission scenario analysis shows that California could be using over 1 billion gallons of Brazilian ethanol by 2016, which is nearly 75 percent of the record for Brazilian exports to the world during 2008 of 1.35 billion gallons. In this scenario, nearly 11 percent of the credits generated during 2016 are from Brazilian ethanol. These historical figures are all pre‐LCFS, so it remains to be seen to what
153 During the November 14 workshop, staff incorrectly noted during the LCFS presentation that “Cellulosic fuel availability increased to 50 percent of U.S. supply” as one of the assumptions for Case 3. The correct assumption should have read “Cellulosic gasoline availability increased to 50 percent of U.S. supply.” See slide 4 from the following link: http://www.energy.ca.gov/2011_energypolicy/documents/2011‐11‐14_workshop/presentations/Schremp‐LCFS.pdf
142
extent Brazilian ethanol production can be ramped up. Energy Commission and ARB staff will continue to monitor volumes of biofuels coming into California to ensure that adequate steps are taken to bring in sufficient quantities of advanced biofuels.
Biofuel Costs Transportation fuel costs for consumers and businesses are forecast to continue rising because of higher crude oil prices. To the extent some biofuels may be more expensive to produce than the petroleum and renewable fuels they displace, at least in the early years of the RFS2 and the LCFS, consumers and businesses may be impacted. For example, the estimated price to deliver Brazilian ethanol to California has averaged about one dollar more per gallon greater than ethanol delivered to California from the Midwest during 2010 and about $1.50 per gallon greater154 compared to ethanol delivered to California from the Midwest during the first eight months of 2011. The federal import tariff and ad valorem tax is scheduled to expire at the end of 2011 which could decrease the cost of importing Brazilian ethanol to California beginning in 2012. Given the historic variation in the price of Brazilian ethanol, and the uncertainty of future tariffs, it is difficult at this time to make reliable projections on future impacts on fuel prices.
Although there are no prices yet for transactions involving cellulosic ethanol, the RFS2 program has a well‐established credit trading platform that provides some insight into the potential incremental costs of this type of biofuel compared to traditional corn‐based ethanol. Between January and August 2011, cellulosic ethanol RIN credits have averaged approximately $1.00 more when compared to traditional ethanol. This translates into a price of roughly $200 per ton of carbon credits produced, attributable to the federal RFS2 program alone.
Biodiesel is another example of a biofuel that currently costs more than conventional diesel. Its increased use in California is a natural result of the RFS2 volume mandates and the LCFS will benefit from that increased use because of biodiesel’s reduced GHG emissions. Prices of biomass based biodiesel (such as soy biodiesel) have averaged nearly $3.00 more per gallon when compared to petroleum‐based diesel fuel during 2011. California regulated parties may prefer to avoid the use of soy biodiesel due to the higher carbon intensity of that fuel and focus demand on biofuels that use corn oil and used cooking oil as feedstocks. These other types of biofuels may command an even higher premium than soy biodiesel. The extent to which those biofuels may cost more is unknown since there is no LCFS credit trading platform currently active that would establish a range of carbon values in the marketplace that could be used to estimate incremental costs for these lower CI biofuels. It should be noted that ARB staff’s proposed regulatory amendments to be considered at its December 2011 Board hearing contain provisions for reporting of prices for credit transactions, so staff will have a better idea of carbon intensity values as the market matures.
154 The current higher cost of Brazilian ethanol is, in part, due to an import tariff imposed by the United States. This form of protectionism increases the cost of supplying ethanol to the United States market by at least 60 cents per gallon and is a type of trade challenge not applied to other types of foreign imports such as crude oil, gasoline, jet fuel, and diesel fuel.

143
The above discussion notwithstanding, substantial investments in advanced biofuels can significantly increase the volumes of such fuels being delivered into California. That would have the benefit of lowering prices of these advanced biofuels, thereby mitigating and offsetting the effects noted above. The ARFVTP is one source of funding to stimulate development of California biofuel production plants. ARB staff has committed to evaluating improvements and refinements in the LCFS program with the express intent of incentivizing the substantial increase in advanced biofuel and alternative fuel production.
Expansion of Similar Standard Outside of California California is the only state with an active LCFS program. However, 22 other states are developing or considering LCFS programs that equate to 3.7 times the quantity of gasoline consumed in California and 7.2 times the quantity of diesel fuel consumed in California during 2009. One possible result is that the incremental demand for the same type of biofuels used to comply with California’s LCFS program could increase if any other region of the United States carried out implementation of an LCFS‐like program. This could increase competition and raise the market‐clearing prices of these biofuels for California, if the volume of biofuels does not increase accordingly. This is an area of fundamental importance and uncertainty; i.e. will increased demand for different types of biofuels increase fuel prices or induce production of these fuels at levels where economies of scale can mitigate the price effects of higher demand, and over what time period will adjustments occur?
Next Steps Staff will continue to assess compliance feasibility scenarios as part of its continuing analytical efforts associated with the current IEPR and beyond. This additional work will include an assessment of the potential impacts of price changes for biofuels on LCFS compliance costs and the potential sources and likelihood of excess credit generation. Further work will be undertaken to assess the potential costs of compliance with both the RFS2 and the LCFS. Additionally, the California Air Resources Board has proposed revisions to the LCFS regulations regarding the handling of high carbon intensity crude oil that may affect overall LCFS compliance and the Energy Commission staff will work with ARB staff in their assessments of those provisions.
Finally, it should be noted that ARB’s initial implementation period for the LCFS was projected up to 2020, with plans to revisit the program before then to consider long‐term refinements to ensure the program can sustain/maintain CI reductions beyond 2020. Moreover, the LCFS regulation itself mandates a minimum of two formal program reviews, with the opportunity for ARB staff to conduct additional informal program reviews. These program reviews will help ensure that the LCFS program is monitored closely and, to the extent necessary, adjustments can be made to the program to ensure long‐term sustainability. Energy Commission staff will work closely with ARB during these formal and informal reviews.

144
Transportation Energy Infrastructure Requirements Renewable and Alternative Fuels Supply and Infrastructure Demand for biofuels in the United States is expected to grow due to the RFS2 mandates, while the demand in California is forecast to grow at an even higher rate due to the LCFS. Certain biofuels (ethanol in low level blends, biodiesel, renewable diesel, and renewable gasoline) will require only modest fueling infrastructure investment and little to no modifications to motor vehicles to enable greater use. However, electricity, natural gas, and especially hydrogen are examples of alternative transportation energy that will require billions of dollars of investment in fueling infrastructure and initially higher prices for vehicles that run on these fuels over the next several years. The challenges faced by these types of alternative fuel technologies may restrict the extent of penetration in the transportation sector, absent continued and expanded government assistance to help defer some of these incremental costs. Although natural gas prices have declined to a substantial advantage over petroleum fuels and the cost of off‐peak electricity, taking into account the greater efficiency of electric vehicle energy use, is very competitive with gasoline prices, the high retail price of hydrogen will also need to be overcome for expansion of FCV markets over the near to mid‐term. The ARFVTP incentive program can facilitate the development and use alternative fuels through co‐funding of projects in public/private partnerships. It should be noted that the Clean Fuels Outlet program indicates the program is feasible for hydrogen stations at prices for hydrogen ranging from approximately two or three times that of gasoline.
Ethanol Infrastructure California ethanol use is widespread and blended with gasoline at a concentration of 10 percent by volume. The state’s infrastructure to receive, distribute and blend ethanol is robust and adequate to accommodate a continued growth of ethanol use over the next several years. Foreign sources of ethanol (from Brazil and Caribbean Basin Initiative countries) are expected to play a more pivotal role for both RFS2 and LCFS compliance and have recently reappeared with deliveries of Brazilian ethanol to Florida and to California from El Salvador during July 2011. However, the inability of Brazil to routinely provide sufficient incremental exports of ethanol to the United States may require additional swapping of Midwest ethanol in exchange for Brazilian ethanol. Domestic fuel costs could rise, with no corresponding decline in total global carbon emissions; in fact, the increased tanker traffic could raise emissions. Much of Brazilian sugarcane has been recently diverted from ethanol production to sugar production because of attractive global sugar prices, which has already increased Midwest exports of ethanol to Brazil. Thus, there are multiple factors that may impact the global distribution of ethanol.
Rail imports have accounted for about 91 percent of California ethanol supply over the last seven years, followed by marine imports (5 percent) and in‐state production (4 percent). There were no marine imports of ethanol during 2010 due to unfavorable economics in foreign source countries. However, marine imports could increase in the future if California transitions to greater use of lower carbon intensity ethanol from Brazil or Caribbean Basin Initiative countries. There are two pathways for foreign ethanol to enter California: marine vessels directly from Brazil and rail shipments from another marine terminal outside California. A proposed
145
Sacramento renewable fuels hub terminal, if constructed, could greatly increase the marine ethanol import capability of Northern California and be more than sufficient to receive Brazilian ethanol over the near to mid‐term period. Alternatively, ethanol from Brazil could be imported through the Houston ship channel and transferred to rail cars before delivery to California. Kinder Morgan has examined this business development scenario and could complete the necessary modifications in less than six months upon gaining sufficient client commitments.
Biodiesel Infrastructure Biodiesel use has been minimal in California and the RFS2 mandates will not compel a significant increase in biodiesel demand. However, the LCFS is expected to result in greater biodiesel use due to the quantity of carbon credits that can be generated under the program. Unlike ethanol, California’s biodiesel infrastructure is not nearly as developed and will need to be expanded to accommodate widespread blending of biodiesel. However, with sufficient lead time (12 to 24 months), modifications could be undertaken and completed to enable an expansion of biodiesel use. Indeed, Kinder Morgan has already undertaken steps to accommodate increased biodiesel volumes by converting all CARB diesel tanks at its Colton facility for use in storing and blending B5 by mid‐2012. A limited number of other terminals may follow suit, although the number of such facilities is unknown at this time. The majority of biodiesel use in California is believed to originate from production facilities located within the state. Approximately 5.4 million gallons of biodiesel were used as transportation fuel during 2010, less than 7 percent of the state’s biodiesel production capacity. California’s RFS2 obligations for biomass‐based diesel can be met by the 16 existing biodiesel production facilities in California. However, the increased demand for biodiesel under various LCFS scenarios will require quantities that exceed the state’s production capacity, necessitating imports from either domestic or foreign sources, which appear adequate to meet these needs and could be delivered in rail cars. These scenarios also may compel expansion of biodiesel production in California. Most distribution terminals would also need to be modified so that the biodiesel could be received and transferred to segregated storage tanks at the terminals, work that could require a minimum of 18 to 24 months to complete.
Retail diesel fuel dispensers and underground storage tanks are certified to handle diesel fuel that contains biodiesel at concentrations of up to 5 percent by volume, but not up to 20 percent. However, the California State Water Resources Control Board (SWRCB) has issued a temporary variance from this restriction. Assuming biodiesel fuel blends in California do not exceed 20 percent, required retail station modifications should be negligible. According to original equipment manufactures’ statements on the National Biodiesel Board website, 18 vehicle models sold in the U.S. accept B5, 15 accept B20, and four accept B100.
Electric Vehicle Infrastructure Plug‐in electric vehicles (PEVs) will play an increasing role in the future transportation mix. Significant public and private investments are being made in California’s electric charging infrastructure. The Federal Government’s economic stimulus funds, matched with Energy Commission program funds and other private and public funds, are providing the charging

146
infrastructure to support the deployment of PEVs in California. Figure 12 summarizes the planned deployment of PEV charging infrastructure in four strategic regions.
Figure 12: PEV Public Charging Infrastructure Deployment by California Region
Region Existing Planned
Public/Commercial Stations
Public/Commercial Points
DC Fast Charge Stations
Battery Switch
S.F. Bay Area 96 916 55 5 Los Angeles 237 972 San Diego 16 1,452 60
Sacramento 56 494 Other 28 3 2 Total 433 3,837 117 5
Sources: California Energy Commission and Nissan. Information based on estimates of known deployments planned through 2013.
The consulting firm ICF International estimates that in the early market years, roughly 95 percent of charging will take place at home or at fleet facilities. However, a major challenge is that while the actual charging panels may take only a few hours to install, the overall residential charging infrastructure may still face a costly and protracted permitting, installation, and inspection process. To help overcome this issue, the California PEV Collaborative has identified actions, including the development of on‐line tools and increased information dissemination, which can help standardize and consolidate the technical and administrative processes. The Energy Commission also is providing up to $2 million in grant funding to support regional plans to support PEV readiness under the ARFVT Program.
Natural Gas Vehicle Infrastructure Primary barriers to the penetration of natural gas vehicles (NGVs) are the lack of a widespread fueling infrastructure and the costs required to upgrade aging existing facilities and install new fueling stations. Today, the use of NGVs is largely limited to medium‐ and heavy‐duty vehicles, which can use CNG/LNG stations on a regular route. Ford Motor Company and other manufacturers plan to offer a suite of light duty natural gas vehicles for 2012 and beyond, including vans, wagons, pickups, and utility vehicles. Currently there are 140 public and 424 private CNG fueling stations and 13 public and 19 private LNG sites in the state. The Energy Commission has allocated funding to upgrade existing sites and install new natural gas fueling infrastructure closely tied toward identifiable needs, such as those of school districts and local governments, long‐haul LNG goods movement corridors, and pairing new CNG stations with high‐volume fleets that intend to convert from diesel to CNG. This funding will support 20 new stations and/or existing station upgrades.
According to the Board of Equalization, California users consumed about 27 million gallons of propane for transportation fuel in 2010. Propane can be a by‐product of either natural gas processing or petroleum refining; however, current research is showing promise in the production of propane from renewable resources, such as sugarcane and corn. Propane is very attractive in terms of pricing compared to both diesel and gasoline. There are about 228 propane fueling stations already in place for vehicles in California. These numbers can be expanded with
147
the addition of fuel capacity, a tank pump, and metering equipment at virtually any propane distributor or station in California, for between $37,000 and $52,000 per site. Propane can play an especially significant role in rural communities, where it is already widely available. The primary obstacles to further adoption of propane as a transportation fuel are vehicle availability, incremental vehicle costs, and ARB propane quality certification. At this time, there are four light‐duty vehicles certified by the U.S. EPA and ARB. The incremental cost for purchasing a light‐duty propane vehicle ranges from $7,500 to $10,400.
Hydrogen Vehicle Infrastructure Currently, there are roughly 250 hydrogen FCVs operating in California, but only 15 were registered with the California Department of Motor Vehicles (DMV) in 2009. The 2011‐2012 Investment Plan for the Alternative and Renewable Fuel and Vehicle Technology Program identifies high fuel and vehicle costs as a major challenge for this technology. It also states that vehicle production and fueling infrastructure are still at a pre‐commercial stage. However, costs are decreasing for both vehicles and fuel infrastructure. Discussions between original equipment manufacturers (OEMs) and Energy Commission staff indicate the costs of FCVs have declined to the $100,000 mark and several OEMs plan to lease vehicles to the public at more publicly attractive lease rates. The Energy Commission has also seen the infrastructure cost per fueling station decrease, from a range of $3 million to $6 million to a range of $1 million to $2.5 million, over only a few years. Through a competitive solicitation released in June 2010, 11 stations that were strategically located in areas where automakers have committed to significant numbers of FCV deployments were awarded $15.7 million by the Energy Commission to develop fueling infrastructure.
In 2009, the ARB began investigating the possible modification of their Clean Fuels Outlet regulation to address the lack of fueling infrastructure available for vehicles meeting the ZEV Regulation. The current regulation requires that certain owner/lessors of retail gasoline stations equip an appropriate number of their stations with clean alternative fuels. The regulation does not require retail outlets for a designated clean fuel until the number of designated clean fuel vehicles projected to be certified on that fuel reaches 20,000 in a given year. Owner/lessors would be removed from the regulation language and a new definition added for ‘refiner/importers,’ which includes companies that produce in or import into California 500 million gallons or more of gasoline per calendar year. Proposed amendments would modify the regulation to apply only to dedicated clean fuel vehicles that operate on ZEV fuels. Once implemented, the regulation would pertain only to hydrogen and fuel cell vehicles; however, in the future it could be applied to electricity for plug‐in hybrids and BEVs depending on the outcome of a BEV needs assessment.
Petroleum Supply and Infrastructure California’s 20 refineries processed more than 1.7 million barrels per day of crude oil in 2010. Most of this crude oil must be imported by marine vessel, historically from Alaska and a variety of foreign sources.

148
Crude Oil Import Outlook The quantity of crude oil imported into California is determined by the rate of decline of California oil production, processing capacities and operating rates of refineries. California oil production has fallen 47.2 percent since 1985 and staff estimates a range of future decline of between 2.2 and 3.1 percent per year. In contrast to historical trends of gradually increasing state refinery oil processing capacity, staff now estimates that capacity in the future will range from flat to declining, largely as a result of declining demand for gasoline. Staff expects crude oil imports compared to 2010 levels to rise by between 22 million and 104 million barrels per year by 2030. At the high end, this increase is solely the result of declining California crude oil production, since refining capacity remains fixed. The forecast for the low end is driven primarily by the assumption of declining refining capacity, reducing the need for crude oil supply.
Staff believes higher oil imports will require expanded marine import within the next four to five years. California’s marine import infrastructure for crude oil can receive a little more than 400 million barrels per year. Since waterborne imports of crude oil during 2010 amounted to nearly 376 million barrels, there should be sufficient existing spare import capability that the low estimate for imports could be met. However, petroleum marine terminals in the Ports of Los Angeles and Long Beach operate under long‐term leases with staggered expiration dates and have periodically come under pressure either to be shuttered or relocated to make way for other types of port commercial activity. Moreover, “spare” import capacity should also be viewed as a type of insurance policy to ensure continuity of operations during potential natural or human‐caused contingencies, which applies not just to crude oil, but all petroleum and renewable fuel import capacity.
Currently, there are two crude oil import infrastructure projects proposed in Southern California that are at early stages of development, Berth 408 at Pier 400 in the Port of Los Angeles and Berth T126 at Pier Echo in the Port of Long Beach. Based on Energy Commission analysis, the Southern California market should only require construction of one of these crude oil import facilities over the forecast period, not both.
High Carbon Intensity Crude Oils The ARB has included provisions in the existing LCFS that regulates the use of new crude oil types that have significantly higher carbon intensities associated with their production when compared to the average mix of crude oil used by refineries in California during 2006. These types of crude oils are referred to as High Carbon Intensity Crude Oils (HCICO) and can include crude oil that is sourced from: bitumen mines; crude oil upgraders; fields that use thermally enhanced oil recovery techniques; and countries that have excessive flaring of natural gas associated with their crude oil production operations. As originally proposed, the HCICO provisions had the potential to affect crude oil selection decisions, increase refinery operating costs, and cause a portion of the imported crude oil to be from sources from greater distances, a phenomenon referred to as “crude shuffling.” Staff has been concerned that California refiners might not use potential HCICOs due to the difficulty of offsetting the carbon deficit incurred

149
from their use and questioned whether HCICO requirements would induce oil producers outside of California to invest in projects to reduce the carbon intensity of their operations.
ARB staff recently released proposed amendments to simplify and enhance the HCICO provisions with a “California Average Crude CI” approach. This approach involves the establishment of a baseline crude CI based on a specified baseline year; relative to the CI standard, a “baseline deficit” would be charged to all regulated parties for CARBOB and CARB diesel because the baseline crude CI is expected to be above the CI standard. The annual average crude CI would then be calculated for each year, starting in 2013, to reflect the overall CI of the crude oil that is delivered to and processed by California refiners in a given year. If the annual average crude CI does not exceed the baseline crude CI in a given year, the California producers would not realize an “incremental deficit” – just the baseline deficit. ARB staff has also proposed regulatory provisions to strengthen incentives for instituting innovative technologies such carbon capture and sequestration (CCS).
The proposed amendments to the LCFS were released for public comment at the end of October 2011. The staff has proposed these amendments for its Board’s consideration at the ARB’s December 16, 2011, hearing. Depending on public comments as well as Board direction that ARB staff receives and ongoing development of the HCICO provisions by staff, it is likely that there will be additional changes staff will propose for supplemental comments after the December 2011 hearing. Energy Commission staff will continue to work with ARB staff to evaluate potential impacts of the HCICO provisions as those provisions continue to evolve to achieve optimal results for the environment and public health while providing the petroleum refining and marketing industry with additional flexibility.
Energy Security Energy security in transportation fuels policy has received greater attention in recent years. Energy security can be defined in many ways: for instance, as a peculiar vulnerability of excessive reliance on foreign crude oil imports, or more generally on imports of any fuel or feedstock from foreign sources, including non‐petroleum fuels. This might take the form of reliance on countries that are not currently on especially good terms with the United States, but it might also hinge on dependence on sources that are risky geopolitically, economically, or from other potential disruptions or supply limitations.
All else being equal, diversification of sources of supply adds to energy security, if it equates to additional sources of supply to meet a given demand. If, however, diversification occurs as a result of limiting supply from some existing or potential sources through sanctions or regulations then the energy security implications are more uncertain. If energy markets are inhibited from procuring lowest cost supplies, the first direct impact would be economic. Should the proposed policy actions limit foreign sources, and avoid fair trade issues, there might be positive balance of trade effects that could offset higher direct costs. In some cases, diversification might viewed as an insurance policy against potential disruptions that might occur for a variety of reasons, but even prudent insurance is not free.

150
Staff’s analysis has raised some issues that have energy security considerations. The LCFS appears to incentivize California regulated parties to pursue biofuels that have lower carbon intensities than the traditional corn‐based ethanol sourced from numerous domestic producers located throughout several states. Energy Commission staff analysis shows that this current reliance on a diverse supply of domestic ethanol may need to shift to one that significantly increases demand for Brazilian sugarcane‐based ethanol. On the other hand, reliance on Brazilian sugarcane is not the only strategy that can be employed by regulated parties under the LCFS. There’s a host of responses industry may choose, including bringing in lower CI corn ethanol, which is the approach they are currently employing, and it will likely continue to play an important role for the next several years. Indeed, corn ethanol production processes registered with ARB indicate CIs that are significantly lower than anticipated at the onset of the LCFS.
Another example is that of crude oil refined from Canada’s oil sands resources, a potential HCICO. Energy security might arguably be enhanced by developing Canada as an increased source of crude oil for California refiners, as current sources are predominately Middle Eastern and Latin American. Also, lengthy tanker trips for Canadian crude oil to less regulated East Asian refineries may result in more greenhouse gas emissions. However, achieving energy security and GHG reductions are not mutually exclusive. As noted previously, ARB staff has recently proposed amendments to the existing LCFS regulation’s HCICO provisions. ARB staff anticipates that those proposed changes, if adopted, would increase refiners’ flexibility in securing a variety of crude oils, including HCICOs from Canadian oil sands. Further, the proposed amendments include important incentives that would recognize petroleum producers’ efforts to employ innovative strategies to reduce GHG emissions, even from HCICOs, including carbon sequestration and other innovative technologies. Energy Commission staff should continue to work with ARB staff to ensure that the goals of energy security and carbon reduction are both advanced as these proposed HCICO amendments are considered.
Challenges and Opportunities California faces several challenges and offers multiple opportunities to meet alternative fuel and carbon reduction goals in the transportation sector , including:
1. Uncertainties in forecasting what future levels of alternative and renewable vehicle purchases and fuel use will be attained;
2. Questions about the impact of RFS2 on California’s ability to accomplish energy security objectives through diversifying transportation fuel supply and increasing alternative fuel options.;
3. Availability of sufficient low carbon biofuels to comply with the LCFS at a reasonable cost to California consumers;

151
4. Uncertainties of whether increased demand for different types of biofuels will increase fuel prices or induce production of these fuels to levels where economies of scale can mitigate the price effects of higher demand;
5. High initial investments required for infrastructure and vehicles to bring substantial electricity, natural gas, and hydrogen fueled technologies into the transportation sector, technologies that could go a long way to achieving LCFS compliance;
6. Facilitating the development and use of alternative fuels and vehicles in California through incentives such as the ARFVTP and local air district funding programs and federal incentives.
7. Balancing renewable fuel and carbon reduction goals with energy security and other policy objectives.
The Energy Commission’s forecasting and analytical units have attempted to estimate current and future transportation energy use for a range of technologies under a wide variety of assumptions. This work will continue, including consumer vehicle purchase and travel behavior surveys, vehicle and fuel demand modeling for multiple transportation energy technologies, and renewable fuel, carbon reduction, and energy security policy analysis, with the intentions of continuing to broaden interagency collaboration and stakeholder contributions. A variety of forums will be considered to make information publicly available on this important underlying technical analysis.
Further, the ARFVT Program (AB 118, Nunez, Chapter 750, Statutes of 2007), discussed in the next chapter, has enabled considerable strides to be made in deploying alternative, renewable, and advanced transportation technologies in California. These include electric drive, biomethane, diesel substitutes, ethanol, natural gas, propane, and hydrogen technologies. Program investments have incentivized 4,375 public and residential electric charging sites, 85 E85 refueling sites, 20 natural gas stations, and 11 hydrogen fueling sites, as well as 1437 electric and natural gas cars and trucks, leading to substantial petroleum, greenhouse gas, and air pollution reduction benefits.

152
CHAPTER 10: Benefits from the Alternative and Renewable Fuel and Vehicle Technology Program This chapter provides a summary of projects funded through the Energy Commission’s Alternative and Renewable Fuel and Vehicle Technology Program (ARFVT Program) and expected benefits from petroleum and greenhouse gas (GHG) emissions reductions, as well as economic benefits, and some of the challenges.
The California Legislature created the ARFVT Program in 2007 through passage of Assembly Bill 118 (Núñez, Chapter 750, Statutes of 2007). The statute authorized the Energy Commission to develop and deploy alternative and renewable fuels and advanced transportation technologies to help attain the state’s climate change policies. AB 118 similarly authorized the ARB to develop the Air Quality Improvement Program (AQIP) to support development and deployment of zero emission and reduced emission light duty vehicles and trucks.155 The Energy Commission’s ARFVT Program has a budget of about $100 million annually, while the ARB’s AQIP has a budget of $30 million to $40 million annually.
The Legislature amended the ARFVT Program with Assembly Bill 109 (Núñez, Chapter 313, Statutes of 2008), which requires the Energy Commission to evaluate the efforts and benefits of the program every two years. The Energy Commission will prepare and release the first of these evaluations (the Benefits Report) in 2012, which will list the funded projects; report progress in achieving project goals and expected benefits, including contributions toward reducing GHG emissions and petroleum dependency in California; identify challenges facing the projects; and make recommendations intended to overcome those challenges.
Through the ARFVT Program, the Energy Commission is providing incentives to accelerate the development and deployment of clean, efficient, low‐carbon alternative fuels and technology projects that will help reduce California’s use and dependence on petroleum transportation fuels and increase the use of alternative and renewable fuels and advanced vehicle technologies. The Energy Commission produces an investment plan or update for each funding cycle to establish priorities and guide program funding allocations. This public process entails public workshops and features a multi‐stakeholder Advisory Committee, which includes representatives from industry trade associations, academic institutions, nongovernmental, environmental, public health, and alternative energy organizations, labor, and other state energy and environmental agencies.
This summary provides a status report on the funded projects and expected benefits. It describes increases in the numbers of fueling infrastructure (including electric charging) and vehicles between 2009 (the baseline year for the program) and 2011. It also estimates a range of
155 Air Resources Board, 2010 Biennial Report to the Legislature on the AB 118 Air Quality Improvement Program, January 2011, available at: http://www.arb.ca.gov/research/apr/reports/January‐2011‐aqiprogram‐report.pdf.

153
total potential petroleum reduction and GHG emissions reductions for each major fuel category – electric drive, natural gas, biofuels, and hydrogen – between 2010 and 2020. Finally, it summarizes job creation and workforce training benefits to California that result from the funding.
Summary of Program Funding The Energy Commission has developed and adopted three investment plans since 2008 that guide $362 million in total funding for the first four years of the ARFVT Program. Table 15 shows the distribution of funding from the first investment plan for fiscal years 2008‐2009 and 2009‐2010 according to primary fuel category, plus funding for workforce development and program support. Using funds from this first investment plan, plus a portion of funds from the second investment plan, the Energy Commission has funded 86 projects totaling $198.4 million to date.
Table 15: Program Investments by Fuel Type
Fuel Type and Program Area Total Funding Encumbered by July 2011 ($ millions)
No. of Projects
Electric Drive 62.4 31.5156 Biomethane157 36.8 10 Diesel Substitutes 8.1 8 Ethanol158 19.1 7 Gaseous Fuels (Natural Gas and Propane) 31.3 13.5159 Hydrogen160 22.7 5 Workforce Development 15.8 3 Program Support161 2.1 8 Totals 198.4 86
Source: California Energy Commission
The ARFVT Program emphasizes projects in the commercial deployment phase of technology development but has also funded a number of vehicle and fuel projects in the research/feasibility, development and demonstration phases. The program has allocated two‐thirds of its funding (totaling $128.9 million) for fiscal years 2008 to 2010 to commercial
156 One agreement provides funds for both electric drive and natural gas infrastructure.
157 This includes an interagency agreement for biofuels feedstock evaluation.
158 Project count includes the California Ethanol Producer Incentive Program’s previous offers to four potential recipients as one project.
159 The ARFVT Program’s gaseous fuels vehicle incentive program is listed as three projects: natural gas vehicle incentives, propane school bus incentives, and non‐bus propane vehicle incentives. To date, sixteen dealerships or manufacturers made reservations for these incentives.
160 Includes an interagency agreement with the Division of Measurement Standards within the California Department Food and Agriculture for the development of retail standards for hydrogen.
161 Includes technical support contracts, memberships, cosponsorships, and a vehicle preferences survey.

154
deployment and production projects and about 23 percent to precommercial demonstration, research, and development projects.
AB 118 directs the Energy Commission to leverage state public investments against private financing and other public funding sources. Non‐ARFVT Program contributions to the 86 projects range from a minimum of $320.6 million to a high estimate of $384 million, for a funding ratio of 1:1.6 to 1:2. The largest public funds leveraged by the program thus far have been the federal dollars available through the American Recovery and Reinvestment Act (ARRA) of 2009. The ARFVT Program funded nine projects totaling $36.5 million that received a total of $105.3 million in ARRA funding. The South Coast Air Quality Management District, Bay Area Air Quality Management District, San Diego Air Pollution Control District, and San Joaquin Valley Air Pollution Control District have also partnered in funding projects supported by the program.
Increases in Alternative Fueling Infrastructure and Vehicles Between 2008 and 2011 An early indicator that California’s fuel and vehicle markets are shifting toward alternative and renewable fuels and advanced vehicle technologies is the growth of key alternative fuel vehicle and infrastructure sectors. Although still in its early years, the ARFVT Program is playing a crucial role in accelerating this progress (as indicated in Table 16 below). California now has the largest networks of electric vehicle (EV) charging systems and hydrogen fueling stations in the country.
Table 16: ARFVT Program Funding Impact on Alternative Fueling Stations and Alternative Vehicle Deployment in California
Fuel Area
Existing 2009-2010 Baseline Levels
Additions from ARFVT Program Funding
Percent Increase
Alternative Fueling Infrastructure
Electric 1,270 charging stations
4,375 charging stations (public and
residential)162
244%
E85 39 fueling stations 85 fueling stations 118% Natural Gas 443 fueling stations 20 stations 5% Hydrogen 6 public fueling
stations163 (plus 5 more under
construction)
11 fueling stations
100%
Alternative Fuel Vehicles
Electric Cars 13,268 379 3% Electric Trucks 1,409 160 11% Natural Gas Trucks 13,995 898 6%
Source: Extrapolated from 2009 Department of Motor Vehicles data, plus actual deployment data. Electric truck and natural gas trucks extrapolated from 2009 data.
162 Based on project estimates for all electric vehicle supply equipment funded with ARFVT Program or match funds.
163 Based on Energy Commission and ARB staff estimates. Public accessibility of these stations may vary.
155
Estimated Petroleum, GHG, and Air Pollution Reduction Benefits From ARFVT Program Investments California’s shift to a transportation system that is less dependent on petroleum fuels and more reliant on a suite of lower carbon alternative fuels and vehicles will take time and require substantial investments from the private and public sectors. The ARFVT Program investments of $198.4 million will produce tangible benefits over time, but it is a modest investment compared to the billions of dollars that car and truck manufacturers and fuel producers are investing in next generation electric and fuel cell vehicles (FCVs), natural gas‐fueled trucks, and sustainable, low‐carbon biofuels.
Methods and Analytic Approach It is likely that market dynamics for alternative fuels and vehicles will continue to be uncertain because of new technology breakthroughs and evolving state regulations. Moreover, the ARFVT Program is in its initial phase, and most of the funded projects have only begun their construction or implementation. Accordingly, the following series of analyses illustrates a low and high range of potential petroleum reduction and GHG emissions benefits resulting from the fuels and technologies supported by initial ARFVT Program investments in electric drive, natural gas, biofuels, and FCVs for the period from 2010 to 2020. The low‐range scenarios reflect challenging market and technology conditions and continued high initial incremental costs for emerging alternative fuels and vehicles when compared to petroleum‐based fuels and vehicles. The high range scenarios reflect optimal market conditions, a robust regulatory regime that obligates market participants to consume or fund low‐carbon fuel and vehicles, higher costs for petroleum‐based fuels, and continuing reductions in production and retail costs for alternative fuels and vehicles.
Staff calculated the estimates of alternative fuel increase (and resulting petroleum displacement) for each fuel type first and subsequently calculated the corresponding GHG and air pollutant reductions based on these numbers. Data for the analyses comes directly from ARFVT Program awardees, vehicle manufacturer surveys, the ARB, and published reports. The analyses for electric drive and FCVs are based primarily on vehicle deployment forecasts and surveys developed by industry or third‐party stakeholders. The analyses for biofuels are based primarily on information provided by program awardees, regarding both their immediate expectations and their plans for expansion, while the analysis for natural gas is based on a combination of these methods.
The Energy Commission cannot and does not claim exclusive responsibility for the full extent of the potential benefits in these technology categories. Rather, these analyses are intended to show how the range of investments from the ARFVT Program can contribute to the commercialization and market acceptance of next generation vehicles and fuels.
Electric Drive Vehicles – Estimated Benefits The increased deployment of plug‐in electric vehicles (PEV) in California will improve air quality by reducing criteria pollutants, address climate change by reducing GHG emissions, advance energy security by reducing dependence on petroleum, and stimulate the California
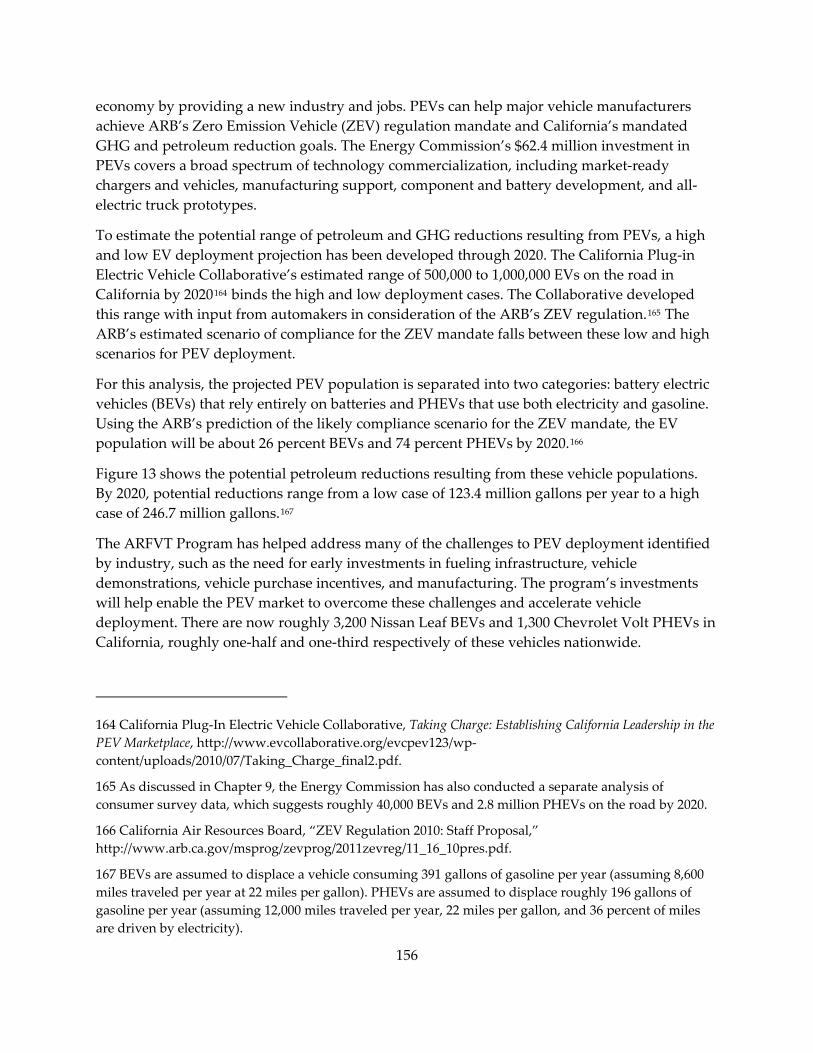
156
economy by providing a new industry and jobs. PEVs can help major vehicle manufacturers achieve ARB’s Zero Emission Vehicle (ZEV) regulation mandate and California’s mandated GHG and petroleum reduction goals. The Energy Commission’s $62.4 million investment in PEVs covers a broad spectrum of technology commercialization, including market‐ready chargers and vehicles, manufacturing support, component and battery development, and all‐electric truck prototypes.
To estimate the potential range of petroleum and GHG reductions resulting from PEVs, a high and low EV deployment projection has been developed through 2020. The California Plug‐in Electric Vehicle Collaborative’s estimated range of 500,000 to 1,000,000 EVs on the road in California by 2020164 binds the high and low deployment cases. The Collaborative developed this range with input from automakers in consideration of the ARB’s ZEV regulation.165 The ARB’s estimated scenario of compliance for the ZEV mandate falls between these low and high scenarios for PEV deployment.
For this analysis, the projected PEV population is separated into two categories: battery electric vehicles (BEVs) that rely entirely on batteries and PHEVs that use both electricity and gasoline. Using the ARB’s prediction of the likely compliance scenario for the ZEV mandate, the EV population will be about 26 percent BEVs and 74 percent PHEVs by 2020.166
Figure 13 shows the potential petroleum reductions resulting from these vehicle populations. By 2020, potential reductions range from a low case of 123.4 million gallons per year to a high case of 246.7 million gallons.167
The ARFVT Program has helped address many of the challenges to PEV deployment identified by industry, such as the need for early investments in fueling infrastructure, vehicle demonstrations, vehicle purchase incentives, and manufacturing. The program’s investments will help enable the PEV market to overcome these challenges and accelerate vehicle deployment. There are now roughly 3,200 Nissan Leaf BEVs and 1,300 Chevrolet Volt PHEVs in California, roughly one‐half and one‐third respectively of these vehicles nationwide.
164 California Plug‐In Electric Vehicle Collaborative, Taking Charge: Establishing California Leadership in the PEV Marketplace, http://www.evcollaborative.org/evcpev123/wp‐content/uploads/2010/07/Taking_Charge_final2.pdf.
165 As discussed in Chapter 9, the Energy Commission has also conducted a separate analysis of consumer survey data, which suggests roughly 40,000 BEVs and 2.8 million PHEVs on the road by 2020.
166 California Air Resources Board, “ZEV Regulation 2010: Staff Proposal,” http://www.arb.ca.gov/msprog/zevprog/2011zevreg/11_16_10pres.pdf.
167 BEVs are assumed to displace a vehicle consuming 391 gallons of gasoline per year (assuming 8,600 miles traveled per year at 22 miles per gallon). PHEVs are assumed to displace roughly 196 gallons of gasoline per year (assuming 12,000 miles traveled per year, 22 miles per gallon, and 36 percent of miles are driven by electricity).
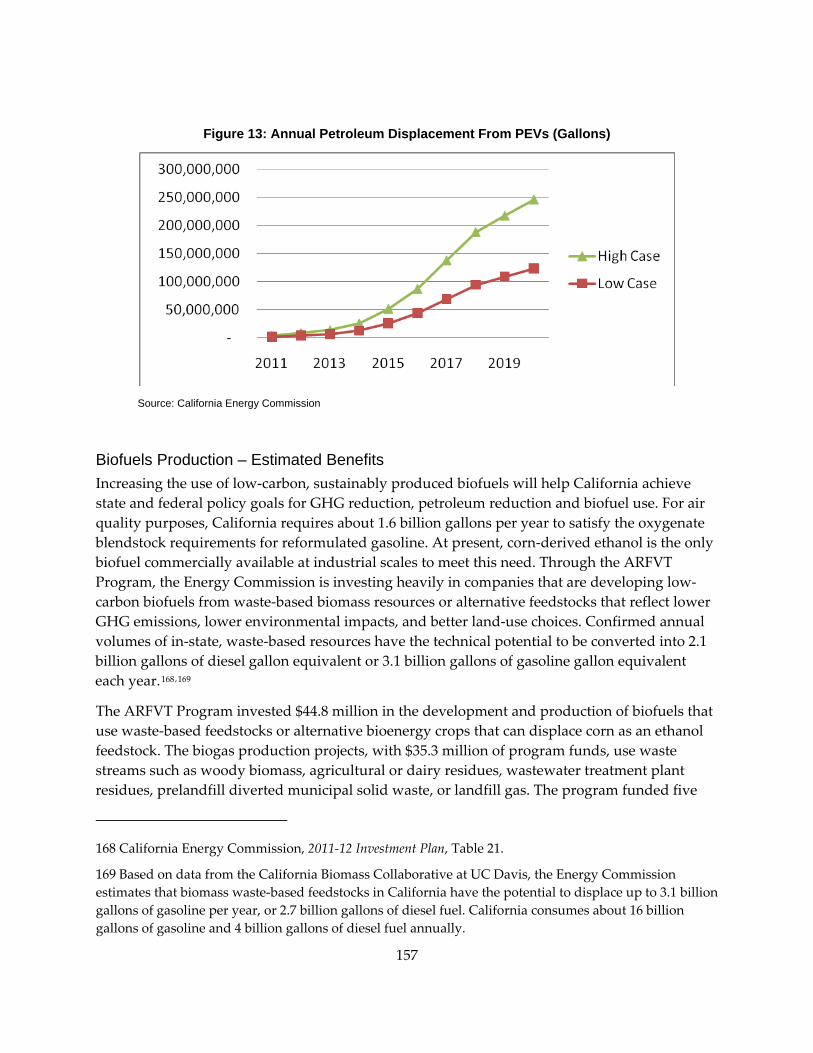
Figure 13: Annual Petroleum Displacement From PEVs (Gallons)
Source: California Energy Commission
Biofuels Production – Estimated Benefits Increasing the use of low‐carbon, sustainably produced biofuels will help California achieve state and federal policy goals for GHG reduction, petroleum reduction and biofuel use. For air quality purposes, California requires about 1.6 billion gallons per year to satisfy the oxygenate blendstock requirements for reformulated gasoline. At present, corn‐derived ethanol is the only biofuel commercially available at industrial scales to meet this need. Through the ARFVT Program, the Energy Commission is investing heavily in companies that are developing low‐carbon biofuels from waste‐based biomass resources or alternative feedstocks that reflect lower GHG emissions, lower environmental impacts, and better land‐use choices. Confirmed annual volumes of in‐state, waste‐based resources have the technical potential to be converted into 2.1 billion gallons of diesel gallon equivalent or 3.1 billion gallons of gasoline gallon equivalent each year.168 ,169
The ARFVT Program invested $44.8 million in the development and production of biofuels that use waste‐based feedstocks or alternative bioenergy crops that can displace corn as an ethanol feedstock. The biogas production projects, with $35.3 million of program funds, use waste streams such as woody biomass, agricultural or dairy residues, wastewater treatment plant residues, prelandfill diverted municipal solid waste, or landfill gas. The program funded five
168 California Energy Commission, 2011‐12 Investment Plan, Table 21.
169 Based on data from the California Biomass Collaborative at UC Davis, the Energy Commission estimates that biomass waste‐based feedstocks in California have the potential to displace up to 3.1 billion gallons of gasoline per year, or 2.7 billion gallons of diesel fuel. California consumes about 16 billion gallons of gasoline and 4 billion gallons of diesel fuel annually.
157

158
diesel substitute production projects at $4.3 million, three of which use waste streams as feedstocks, while the other two are testing or demonstrating algae‐based feedstocks. Three advanced ethanol awards, funded with $5.4 million, include the state’s first cellulosic ethanol pilot production facility using agricultural waste feedstocks, the first commercial feasibility evaluation of sweet sorghum as a potential bioenergy crop, and an important feasibility evaluation of sugar beets coupled with agricultural residues to produce a carbon neutral mix of ethanol and biogas. These types of projects reduce GHG emissions by a high percentage (typically 75‐85 percent) compared to the petroleum baseline.
This analysis estimates the high and low range of biofuels production potential for the 17 ARFVT Program projects funded to date. The estimates come directly from the grant proposals and follow‐up surveys and interviews with each company or public agency.
The estimated petroleum reduction by 2020 from these 17 biogas, diesel substitutes, and advanced ethanol development and production projects ranges from 124.1 million gallons to 632.8 million gallons (Figure 14). In the high case, the rapid growth after 2015 represents the shift of several funding recipients from precommercial work into commercial‐scale production. Since this analysis only includes projects funded by the ARFVT Program to date, it represents a conservative estimate of the true biofuel production potential within the state. For comparison, the in‐state capacity for ethanol production is nearly 241 million gallons per year (of which 170 million gallons per year is currently online), while the in‐state capacity for biodiesel production is roughly 85 million gallons per year (from which less than 5.5 million gallons were produced in 2010). 170 ,171
Natural Gas Vehicles and Fueling Infrastructure – Estimated Benefits The medium‐ and heavy‐duty transportation sector represents a prime opportunity for the development and rollout of alternative fuel vehicles. The current fleet of such trucks totals about 632,000, about 4r percent of the state’s total vehicle fleet, yet they account for about 16 percent of total fuel consumption and GHG emissions. Natural gas vehicles are an attractive alternative to medium‐ and heavy‐duty fleet owners and operators who have concerns with the cost of diesel fuel resulting from price volatility and the economic downturn, as well as compliance with air quality standards. Additionally, natural gas vehicles have been shown to have GHG reductions of between 11 and 16 percent compared to their diesel counterparts. If using waste‐derived biomethane instead of conventional natural gas, however, these vehicles can achieve GHG reductions of roughly 85 percent below diesel counterparts.
170 Schremp et al. 2011. Transportation Energy Forecasts and Analyses for the 2011 Integrated Energy Policy Report. California Energy Commission. CEC‐600‐2011‐007‐SD.
171 Smith, Charles, Miles Roberts, Jim McKinney. 2011. 2011‐2012 Investment Plan for the Alternative and Renewable Fuel and Vehicle Technology Program. Commission Report. California Energy Commission, Fuels and Transportation Division. Publication Number: CEC‐600‐2011‐006‐CMF.

Figure 14: Annual Petroleum Reductions Biofuel Production Projects (Gallons)
Source: California Energy Commission
The ARFVT Program’s investments in new natural gas applications for medium‐ and heavy‐duty vehicles has helped increase the number of natural gas‐powered vehicles on the road and the growth rate of the overall vehicle population. The ARFVT Program has directed investments toward developing and deploying new natural gas vehicle technologies, addressing established business needs, and expanding California’s current medium‐ and heavy‐duty natural gas fleet. To date, the program has funded the deployment of 898 medium‐ and heavy‐duty natural gas vehicles. In addition, the program has funded the production of technologies that will increase the availability of natural gas engines for specialized fleet applications. The ARFVT Program has also funded an additional 19 compressed and liquefied natural gas (LNG) fueling stations, which will further promote the adoption of medium‐ and heavy‐duty natural gas vehicles.
The Energy Commission developed two scenarios for the rollout of medium‐ and heavy‐duty natural gas vehicles in California through 2020. The low scenario represents a “business‐as‐usual” environment, which incorporates the 898 vehicles funded by the ARFVT Program, and the growth rate remains relatively steady.172 The high scenario represents estimated new vehicle sales, as reported by awardees and based on expected fleet adoption rates. This scenario assumes the awardees’ vehicle sales are units sold in addition to the expected normal population growth for the industry, and assumes the existence of optimal market conditions
172 Vehicle counts from Energy Commission analysis of Department of Motor Vehicle data.
159

allowing for the sale of all vehicles available from the manufacturer. The petroleum displacement associated with these scenarios is presented in Figure 15.173
Figure 15: Annual Petroleum Displacement From Natural Gas Trucks (Gallons)
Source: California Energy Commission
Hydrogen Fuel Cell Vehicles – Estimated Benefits FCVs that use hydrogen as fuel are a prominent prospect for encouraging the deployment of alternative fuels. One of the greatest benefits of FCVs is that they emit no GHG emissions or air pollutants from the tailpipe. Like the other alternative fuel vehicle technologies, they can also reduce California’s dependence on foreign imports of crude oil since hydrogen can be derived from domestic sources.
One major challenge to ensuring the deployment of these vehicles is the development of sufficient fueling infrastructure. To meet the needs of anticipated FCVs, the Energy Commission provided funding for 11 new and upgraded hydrogen fueling stations. The total cost per station ranged from $2 million to $3 million, a significant drop from the range of $3 million to $6 million per station from just a few years earlier. All of these stations are located in regions
173 The duty cycles for medium‐ and heavy‐duty trucks are much more variable than for light‐duty vehicles, so the amount of petroleum displaced by an individual natural gas truck will also vary. Under the low scenario, natural gas vehicles are assumed to displace 4,750 gallons of diesel per year (based on historical averages). The incremental increase under the high scenario assumes that natural gas trucks expand into heavier‐duty cycles, displacing 10,750 gallons per year.
160
161
identified by automakers as high‐priority, early‐adopter markets. Once constructed, these stations will represent about 73 percent of the statewide public fueling capacity.
A low case and high case for FCV deployment can be derived from the ARB’s ZEV regulation and automaker surveys. Under the low case, the cumulative number of FCVs increases to 30,200 by 2020, displacing approximately 11.2 million gallons of gasoline per year. According to surveys of major automakers, the number of in‐state FCVs will expand rapidly in the current decade, from roughly 250 in 2011 to more than 50,000 by 2017. Accordingly, the ARB has developed a scenario for 2017‐2020, based on automakers’ compliance with the ZEV regulation, in which the total on‐road number of light‐duty FCVs within California will reach approximately 124,000 by 2020.174 This equates to roughly 45.2 million gallons of gasoline per year displaced by FCVs by 2020.
By providing fueling infrastructure early on, the Energy Commission’s investments help ensure a rise in vehicle populations, to a point where private infrastructure suppliers can independently finance and construct additional stations to serve the increased numbers of vehicles.
Estimated Petroleum Reduction Benefits The total estimated petroleum reduction associated with the fuels and vehicle technologies supported by the 86 ARFVT Program‐funded projects range from roughly 374.9 million to 1.2 billion gallons per year in 2020. This estimated potential petroleum reduction cannot be directly attributed the program’s investment but should be considered as the range of future benefits in a market influenced by ARFVT Program funding. To put these estimates in context, current petroleum fuel consumption in California totals roughly 18.8 billion gallons per year.
Estimated GHG and Air Pollution Reduction Benefits The petroleum reductions by alternative fuels and vehicle technologies (mentioned above) also serve as the basis for determining the estimated GHG emission and air pollution reductions associated with these fuels and technologies. Accordingly, the benefits associated with electric drive, hydrogen, and natural gas trucks still represent the overall market‐level benefits of these alternative fuels that are supported by the ARFVT Program, while the benefits associated with biofuel production represent the projects (and their possible expansions) that are directly funded by the ARFVT Program.
To calculate GHG emission reduction benefits, the amount of fuel displaced is multiplied by the relative carbon intensity for each alternative fuel type, as provided by the Low Carbon Fuel Standard.175 This calculation incorporates an energy efficiency ratio for electric drive and FCVs
174 ARB, Staff Report: Initial Statement of Reasons, Advanced Clean Cars, 2012 Proposed Amendments to the Clean Fuels Outlet Regulation. Released December 8, 2011.
175 Where appropriate, the Energy Commission applied estimates of carbon intensity for projects that use fuel pathways not explicitly established by the LCFS.

162
to account for the greater efficiencies of PEVs and FCVs in translating fuel energy (in joules) into miles traveled.176 GHG emissions are reported in carbon dioxide equivalents (CO2e).
Staff uses a similar approach for calculating urban criteria pollutant reductions. The amount of fuel displaced by each alternative fuel type is multiplied by the relative criteria pollutant reduction of that alternative fuel against a petroleum baseline.177 Estimated criteria pollutants include volatile organic compounds (VOC), carbon monoxide, nitrogen oxide (NOx), and particulate matter of 10 micron in diameter (PM10).
Looking forward to 2020, the low case estimate for annual petroleum displacement, GHG emission reductions, and reductions in criteria air pollutants are summarized in Table 17. This includes 374.9 million gallons of petroleum fuels displaced, 2.5 million metric tonnes of CO2e GHG emissions reduced, and 10,855 metric tonnes of urban air pollutants reduced each year by 2020. Table 18 presents the high case, with 1.2 billion gallons of petroleum fuels displaced, 9.3 million metric tonnes of CO2e GHG emissions reduced, and 24,371 metric tonnes of urban air pollutants reduced each year by 2020.
These benefits are strong indicators of progress in attaining several of the state’s policy goals for 2020. For example, the Energy Commission and ARB adopted a goal of reducing petroleum fuel use to 15 percent below 2003 levels by 2020.178 By 2020, the Energy Commission anticipates gasoline and diesel fuel demand of approximately 14 billion gallons and 4 billion gallons, respectively.179 The petroleum displacement from the fuels and technologies summarized in this report, ranging from 374.9 million gallons to 1.2 billion gallons, would represent a roughly two to six percent displacement of petroleum fuels in 2020.
Similarly, the state has a goal of reducing GHG emissions to 1990 levels by 2020. According to the ARB’s Scoping Plan for AB 32 (Núñez, Chapter 488, Statutes of 2006), the transportation sector is expected to be responsible for 189.3 million metric tons of CO2e GHG emissions by then.180 If achieved, the range of 2.5 million metric tonnes to 9.3 million metric tonnes of CO2e
176 The energy efficiency ratio for electric drive is assumed to be 2.6, and the EER for fuel cell vehicles is assumed to be 2.3. This is roughly comparable to ratios established by the ARB.
177 TIAX, LLC. 2007. Full Fuel Cycle Assessment: Well‐to Wheels Energy Inputs, Emissions, and Water Impacts, California Energy Commission. CEC‐600‐2007‐004‐REV.
178 California Energy Commission and Air Resources Board, Reducing California’s Petroleum Dependence, Joint Agency Report, August 2003, P600‐03‐005, available at: http://www.energy.ca.gov/reports/2003‐08‐14_600‐03‐005.PDF.
179 Schremp et al. Transportation Energy Forecasts and Analyses for the 2011 Integrated Energy Policy Report, California Energy Commission, CEC‐600‐2011‐007‐SD. See the ranges between the “Low Petroleum Demand Scenario” and “High Petroleum Demand Scenario” for gasoline in Table 3‐5 and for diesel fuel in Table 3‐7.
180 Air Resources Board, Supplement to the AB 32 Scoping Plan FED, http://www.arb.ca.gov/cc/scopingplan/document/final_supplement_to_sp_fed.pdf.
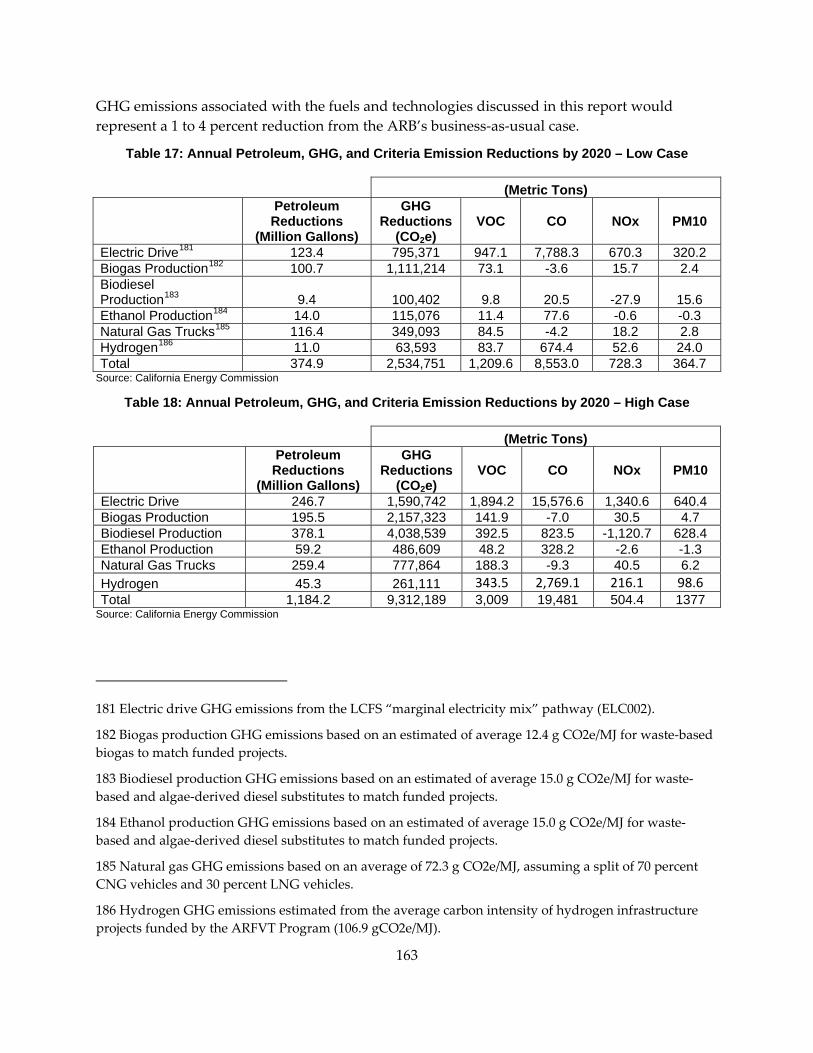
163
GHG emissions associated with the fuels and technologies discussed in this report would represent a 1 to 4 percent reduction from the ARB’s business‐as‐usual case.
Table 17: Annual Petroleum, GHG, and Criteria Emission Reductions by 2020 – Low Case
(Metric Tons)
Petroleum Reductions
(Million Gallons)
GHG Reductions
(CO2e) VOC CO NOx PM10
Electric Drive181 123.4 795,371 947.1 7,788.3 670.3 320.2 Biogas Production182 100.7 1,111,214 73.1 -3.6 15.7 2.4 Biodiesel Production183 9.4 100,402 9.8 20.5 -27.9 15.6 Ethanol Production184 14.0 115,076 11.4 77.6 -0.6 -0.3 Natural Gas Trucks185 116.4 349,093 84.5 -4.2 18.2 2.8 Hydrogen186 11.0 63,593 83.7 674.4 52.6 24.0 Total 374.9 2,534,751 1,209.6 8,553.0 728.3 364.7
Source: California Energy Commission
Table 18: Annual Petroleum, GHG, and Criteria Emission Reductions by 2020 – High Case
(Metric Tons)
Petroleum Reductions
(Million Gallons)
GHG Reductions
(CO2e) VOC CO NOx PM10
Electric Drive 246.7 1,590,742 1,894.2 15,576.6 1,340.6 640.4 Biogas Production 195.5 2,157,323 141.9 -7.0 30.5 4.7 Biodiesel Production 378.1 4,038,539 392.5 823.5 -1,120.7 628.4 Ethanol Production 59.2 486,609 48.2 328.2 -2.6 -1.3 Natural Gas Trucks 259.4 777,864 188.3 -9.3 40.5 6.2 Hydrogen 45.3 261,111 343.5 2,769.1 216.1 98.6 Total 1,184.2 9,312,189 3,009 19,481 504.4 1377
Source: California Energy Commission
181 Electric drive GHG emissions from the LCFS “marginal electricity mix” pathway (ELC002).
182 Biogas production GHG emissions based on an estimated of average 12.4 g CO2e/MJ for waste‐based biogas to match funded projects.
183 Biodiesel production GHG emissions based on an estimated of average 15.0 g CO2e/MJ for waste‐based and algae‐derived diesel substitutes to match funded projects.
184 Ethanol production GHG emissions based on an estimated of average 15.0 g CO2e/MJ for waste‐based and algae‐derived diesel substitutes to match funded projects.
185 Natural gas GHG emissions based on an average of 72.3 g CO2e/MJ, assuming a split of 70 percent CNG vehicles and 30 percent LNG vehicles.
186 Hydrogen GHG emissions estimated from the average carbon intensity of hydrogen infrastructure projects funded by the ARFVT Program (106.9 gCO2e/MJ).

164
s
to
re,
t will serve to increase the market acceptance of alternative
orce
,
ents
training
interagency agreements have also secured more an $13 million in nonstate matching funds.
Finally, the state’s Bioenergy Action Plan sets a target of meeting 40 percent of the state’s biofuel demand (or roughly 820 million gasoline gallons equivalent) with in‐state production by 2020.187 The combined biofuel production estimates discussed in this report, ranging from 123 million gallons to 632 million gallons by 2020, represents a significant step toward fulfilling thigoal.
Workforce Training Benefits Workforce development and training are critical elements in the Energy Commission’s efforts develop California’s clean transportation market. A trained workforce is required to develop and respond to new technologies, improve efficiencies, minimize waste, and reduce the cost ofproduction. A well‐trained workforce will be critical to the industry’s ability to manufacture low‐emission vehicles and components, produce alternative fuels, build fueling infrastructuservice and maintain fleets and manufacturing equipment, and provide information for on‐going innovation and refinement thafuels and new vehicle technologies.
The Energy Commission has allocated $15.8 million in program funding to support workfdevelopment and training in the first two investment plans for the ARFVT Program. The Energy Commission used the funds to establish interagency agreements with California’s topworkforce training agencies, including the Employment Development Department (EDD) at $4.5 million, the California Community Colleges Chancellor’s Office (CCCCO) at $4.5 millionand the Employment Training Panel (ETP) at $6.8 million. The interagency agreements have been structured to fund alternative fuel and low‐emission vehicle specific training, as a portion of the partner agencies’ broader workforce projects. The EDD and ETP interagency agreemdeliver workforce training, while the EDD and CCCCO interagency agreements provide workforce training development support activities, including surveying industry training needs, assessing existing training programs and resources, developing curriculum andmaterials, instructor training, and regional industry cluster support planning grants.
To date, EDD and ETP have awarded 8 regional training grants, 4 regional industry cluster planning grants, and 12 direct employer training contracts to train more than 5,326 individuals. The grants and contracts awarded through theth
187 O’Neill, Garry, John Nuffer, Draft 2011 Bioenergy Action Plan, California Energy Commission, Efficiency and Renewables Divisjion, March 2011, CEC‐300‐2010‐012‐SD.

165
is
liability.
CHAPTER 11: Bringing Energy Innovation to California Through the Public Interest Energy Research Program This chapter of the draft 2011 IEPR provides an overview of the Public Interest Energy Research (PIER) Program. The research portfolio continues to evolve and be flexible to address current energy and economic challenges to enhance the benefits to customers – the organizations, businesses, governmental agencies, residents, and others that make up California’s energy marketplace.
Over the last 14 years, the PIER Program has responded to market needs and the state’s energy policy goals. The program initially focused on research involving individual components and has progressed to emphasize integration of multiple energy technologies to maximize synergies and benefits. As an example, there are now energy research, development, and demonstrations (RD&D) involving large‐scale integration of energy efficiency, renewable energy such as residential photovoltaics, and consumer technologies such as electric vehicles to build a smart grid that ensures reliability.
The Public Goods Charge (PGC) that provided funding for energy research and development ends on December 31, 2011, and there is no current legislation to continue collecting the PGC. However, the Governor and key legislative leaders support continuing this charge.188 In addition, the CPUC issued an Order Instituting Rulemaking 11‐10‐003 “to determine whether and how the [CPUC] should act to preserve funding for the public benefits associated with renewables and RD&D activities previously provided by the electric system benefits charges.”189 The Energy Commission expects renewed research funding next year, but if thdoes not happen, the state will lose a valuable source of funding support for businesses, cleanenergy technology innovation and development, job creation, energy‐related environmental research, and increased electricity re
PIER Program Makes a Difference The PIER program contributes to advancing electricity and natural gas technologies that may not have otherwise led to market acceptance. For example, the PIER Program was instrumental in bringing distributed generation (DG) to the California market. In 1996, the market structure did not support the interconnection of photovoltaic and other DG. Since that time, PIER‐funded research established interconnection rules and standards,190 and helped establish benefits and
237. 188 Press release of Governor Brown’s letter to CPUC President Peevey, September 26, 2011, http://gov.ca.gov/news.php?id=17
lynette189 California Public Utilities Commission, OIR 11‐10‐003.
190 California Rule 21 Generating Facility Interconnections; Institute of Electrical and Electronics Engineers (IEEE) 1547 – Series of Interconnection Standards; and Underwriters Laboratories (UL) 1741 ‐

166
devices to make DG practical and safe. For example, in 2003 PIER‐funded research with Reflective Energies helped overcome interconnection barriers associated with combined technologies, such as net‐metered and non‐net‐metered systems and network distribution system interconnection, and DG equipment certification requirements.
Contributions to Job Growth and Private Investment in the Clean Energy Economy By investing in innovative, energy‐related RD&D projects, the PIER Program attracts and grows businesses and creates jobs. Below are some of the PIER Program’s success stories in the area of job creation:
• Jobs Created From Successful Research Projects: Significant job growth occurs when research results in the selling of advanced technologies in the marketplace. PIER Program staff interviewed representatives of 10 companies who attributed the creation of 1,342 jobs at least in part to PIER funding. These jobs created an additional 3,903 jobs as the firms and employees purchased goods and services, according to an estimate using IMPLAN®, a widely recognized economic impact assessment program.
• Venture Capital Investment and Jobs From PIER‐Funded Small Grants: Since the PIER‐funded Energy Innovations Small Grant (EISG) began in 1999, awardees have garnered more than $1.4 billion in subsequent investment, including $1.3 billion in private, non‐utility investment. PIER‐funded research has significantly contributed to the development of products worth $1.3 billion to the private sector – more than 40 times the $30 million than the EISG program invested. These new companies or new lines of business create private sector output and jobs.
Energy RD&D Successes and Breakthroughs Improving the Status Quo Through Energy Efficiency The Energy Commission develops California’s energy efficiency standards for appliances (California Code of Regulations, Title 20, Sections 1601 through 1608) and buildings (Title 24, Part 6). PIER‐funded research plays a key role in developing and providing supporting data to justify the energy efficiency standards. For example, the 2008 Building Efficiency Standards used results of PIER‐funded research, including a compliance credit for residential cool roofs to help reduce air conditioning use; heating, ventilation, and air‐conditioning (HVAC) fan efficiency requirements to improve the energy performance of air handlers and duct systems; an attic duct model to evaluate the interaction of all measures that affect the heat flow in the attic, and more efficient kitchen and underground pipe insulation. In addition, the 2010 Appliance Efficiency Standards included requirements for flat‐screen televisions and the 2007 Appliance Efficiency Standards included requirements for external power supplies – all of these resulted directly from PIER‐funded research. Overall, these seven measures will produce an estimated
Inverters, Converters, Controllers and Interconnection System Equipment for Use With Distributed Energy Resources.

167
annual cost savings of more than $1 billion for California electric and natural gas ratepayers when fully implemented.
For the upcoming 2013 Building Efficiency Standards, PIER‐funded research is contributing to potential measures for vent cooling using outside air, hot water distribution systems for centrally locating hot water heaters and pipe insulation, HVAC controls, economizers for small commercial systems, daylighting, and lighting.
In addition to the research associated with supporting the standards, the PIER program funded breakthrough energy research that successfully brought products to the marketplace. For example, the PIER Program’s recent support of a small business called Adura® Technologies contributed to the development of a wireless lighting control network that creates energy savings up to 70 percent. This breakthrough in lighting control is a perfect technology for building retrofits that led Adura to receive $20 million in subsequent venture capital. Another example is an initial PIER‐funded demonstration of an innovative cooling system for data centers developed by Federspiel Controls (now Vigilent Systems). This led to this company receiving an American Recovery and Reinvestment Act grant to install the technology in eight data centers throughout California. In just these data centers, the technology was able to reduce cooling energy use by 19 to 78 percent or about $240,000 annually.
The PIER Program has supported several energy‐efficient products and technologies that help reduce electricity, natural gas, and water consumption; save money for California consumers; and improve the environment. The following systems are now available in the marketplace:
• Integrated office and classroom lighting systems (Figure 16)
• Hybrid smart wall switch and luminaire for hotels
• Bilevel stair well and corridor lighting
• Smart lighting controls for exterior lighting
• Advanced evaporative air conditioners for California climate
• Radiant floor cooling
• Under‐floor air distribution systems
• Cool Roof materials for residential
• Hybrid optimized water heaters
• Advanced solar water heating components and distribution systems
• Commercial cooking equipment for restaurants
• Reverse Annulus Single‐Ended Radiant Tube (RASERT)
• Electrodialysis for tartrate stabilization in wine‐making processes
• Advanced gas‐fired drum dryer for food processing
• Cooling control technology with wireless network sensors
• ThermoSorber Gas‐Fired Hot Water Heat Pump
• Ultra‐low, nitrogen oxides (NOx) burner control technology for boilers
Figure 16: Integrated Classroom Lighting System
Photo Credit: Finelite
Breaking Barriers to Achieve California’s Renewables Portfolio Standard Since its creation in 1996, the PIER Program has helped California increase its use of renewable energy. The program performed initial resource assessments to help determine California’s resource potential so that developers could find the best locations to site their renewable energy systems. PIER‐funded research focused on wind and solar technology development, solar forecasting, and further assessments of California’s solar, wind, geothermal, and biomass resources. Helping renewable technologies reach maturity led to faster market penetration, and ultimately to more renewable energy in the state’s overall electricity portfolio.
The PIER Program has continued to refine its focus and support the state’s increasingly aggressive renewable energy policies, such as the RPS, the California Solar Initiative, and the Million Solar Roofs program. In the mid‐ to late 2000s, the PIER Program initiated the Intermittency Analysis Project that evaluated transmission constraints to renewable energy development and recommended interconnection solutions. In 2009, the PIER Program initiated the Renewable Energy Secure Community (RESCO) program, which is helping communities overcome renewable energy deployment and integration challenges. The RESCO program is providing technical solutions – such as local energy action plans and pilot projects – so that communities can rely more on locally available renewable resources tailored to community resources and preferences.
The PIER Program’s Energy‐Related Environmental Research is helping the state address concerns relating to the environmental impact of energy production on air quality, water resources, terrestrial resources, and climate change. In particular, this research is assisting with sound practices for permitting renewable and nonrenewable generation.
One of the most daunting barriers renewable energy project developers face at every level is the high upfront costs. A way to address this challenge is by developing lower‐cost and higher efficiency generation technologies. Additionally, innovative applications for waste by‐products can result in additional benefits that translate into cost savings. For example, PIER program
168

participant GreenVolts, Inc., developed a new concentrating photovoltaic (CPV) system with low‐cost installation, low‐cost manufacturability, technical performance improvements, minimal ground footprint, and comprehensive “system” delivery. This new CPV system will speed the deployment and adoption of CPV technology in various applications. Originally funded by the PIER program, Green Volts received $40 million in venture capital funds to demonstrate and commercialize the product. The technology is now in full production, with six installations in California and Arizona (totaling 400 kilowatts) and several sites in development ranging in size from 200 kilowatts to 1 megawatt. A 2.5‐megawatt operation is under contruction in Byron, California. The development of these projects resulted in 100 jobs at Green Volts, 20 manufacturing jobs, and more than 30 jobs for various installation contracts. Figure 17 shows one of GreenVolt’s CPV installations.
Figure 17: Concentrating Photovoltaic System
Photo Credit: GreenVolts, Inc.
The PIER Program has supported the following renewable energy projects to help overcome barriers that limit the deployment and integration of renewable energy into California’s grid:
• Powerlight Corporation’s photovoltaic (PV) Tracker, a photovoltaic tracker system
• Advanced Energy Recovery System (AERS) converting onion waste to clean biogas, which feeds fuel cells
• Tecogen Inc.’s combined heat and power system coupled with inverter‐based technology
• Clean Energy Systems’ turbine using oxy‐combustion technology
• Improved forecasting for variable solar and wind generation projects to optimize development and operation of the transmission grid system.
• UC Davis West Village, a multi‐use zero net energy community using on‐site renewables and efficiency to optimize distributed energy resources
169
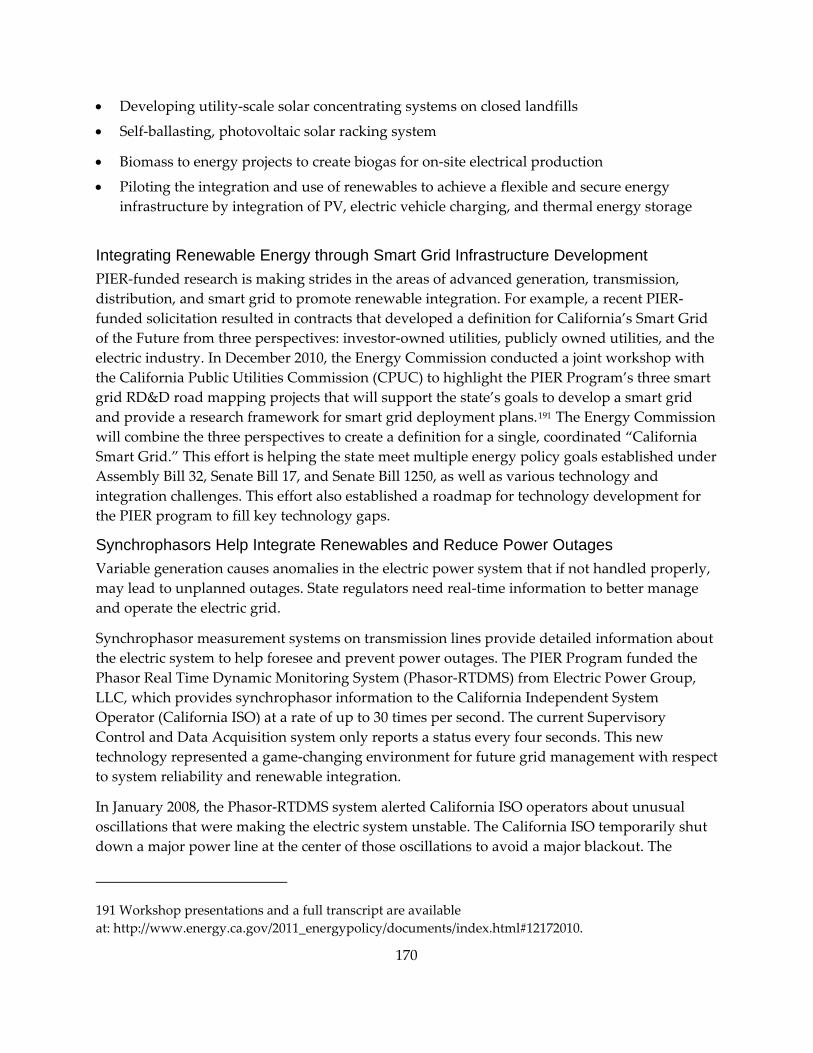
• Developing utility‐scale solar concentrating systems on closed landfills
• Self‐ballasting, photovoltaic solar racking system
• Biomass to energy projects to create biogas for on‐site electrical production
• Piloting the integration and use of renewables to achieve a flexible and secure energy infrastructure by integration of PV, electric vehicle charging, and thermal energy storage
Integrating Renewable Energy through Smart Grid Infrastructure Development PIER‐funded research is making strides in the areas of advanced generation, transmission, distribution, and smart grid to promote renewable integration. For example, a recent PIER‐funded solicitation resulted in contracts that developed a definition for California’s Smart Grid of the Future from three perspectives: investor‐owned utilities, publicly owned utilities, and the electric industry. In December 2010, the Energy Commission conducted a joint workshop with the California Public Utilities Commission (CPUC) to highlight the PIER Program’s three smart grid RD&D road mapping projects that will support the state’s goals to develop a smart grid and provide a research framework for smart grid deployment plans.191 The Energy Commission will combine the three perspectives to create a definition for a single, coordinated “California Smart Grid.” This effort is helping the state meet multiple energy policy goals established under Assembly Bill 32, Senate Bill 17, and Senate Bill 1250, as well as various technology and integration challenges. This effort also established a roadmap for technology development for the PIER program to fill key technology gaps.
Synchrophasors Help Integrate Renewables and Reduce Power Outages Variable generation causes anomalies in the electric power system that if not handled properly, may lead to unplanned outages. State regulators need real‐time information to better manage and operate the electric grid.
Synchrophasor measurement systems on transmission lines provide detailed information about the electric system to help foresee and prevent power outages. The PIER Program funded the Phasor Real Time Dynamic Monitoring System (Phasor‐RTDMS) from Electric Power Group, LLC, which provides synchrophasor information to the California Independent System Operator (California ISO) at a rate of up to 30 times per second. The current Supervisory Control and Data Acquisition system only reports a status every four seconds. This new technology represented a game‐changing environment for future grid management with respect to system reliability and renewable integration.
In January 2008, the Phasor‐RTDMS system alerted California ISO operators about unusual oscillations that were making the electric system unstable. The California ISO temporarily shut down a major power line at the center of those oscillations to avoid a major blackout. The
170
0. 191 Workshop presentations and a full transcript are available at: http://www.energy.ca.gov/2011_energypolicy/documents/index.html#1217201

California ISO probably would not have detected this oscillation irregularity before the installation of the Phasor‐RTDMS product. This event demonstrated the clear benefit of having this technology solution available for grid management.
The PIER Program expects synchrophasor technology to save future electricity consumers about $210 million to $370 million per year in avoided outage costs and $90 million per year in reduced electricity costs. Support from the Energy Commission and the United States Department of Energy was essential to this research. Without PIER Program leadership, synchrophasor and associated development would not have progressed to where it is today, would not be tailored to California needs, and California might face serious problems integrating renewable generation and electric vehicles.
The PIER Program funded research in the following areas to develop a smart grid infrastructure and support renewable integration:
• Demand response as a spinning reserve
• Solar and wind forecasting
• Electric vehicle‐to‐grid services
• Microgrids
• Distribution upgrades and monitoring
• Utility‐scale energy storage
• Real‐time grid reliability management Improving the Safety of Natural Gas Pipelines The PIER program responds to energy issues that are of concern to Californians, such as safety and reliability. The PIER program is funding projects to support research on the safety and security of the state’s natural gas system infrastructure, as California is the second largest natural gas‐consuming state in the United States, making this a priority issue. The growing demand for natural gas and the aging natural gas pipeline infrastructure pose significant challenges for the state’s natural gas users. The state needs public interest energy research to explore opportunities and apply new and emerging technologies that provide innovative options for natural gas pipeline integrity, operations, and safety.
Events following the September 2010 natural gas explosion in a Pacific Gas and Electric’s (PG&E) pipeline in San Bruno led to two PIER‐funded projects to help improve gas pipeline evaluation and monitoring. One project will develop a baseline assessment of current technologies used in California to manage pipeline integrity and safety including current methods to prevent, detect, and respond to pipe leaks and/or ruptures. Another project will design, build, and test a family of next‐generation Micro‐Electromechanical Systems (MEMS) devices that measure pressure, inspect seam welds, and detect corrosion in natural gas pipes with wireless communications for condition‐based monitoring. These prototype devices can operate inside regular pipes during normal operations to monitor pipeline safety and integrity.
171

The Evolving PIER Program Over the years, the PIER program has continually evolved through improved accountability and transparency and by encouraging active stakeholder engagement.
Policy Advisory Board and Advisory Groups The PIER Program convened three publicly noticed Policy Advisory Board (PAB) meetings over the past year to increase public participation and to provide more transparency in PIER Program planning. The PAB includes Legislative members, energy agencies, utilities, and environmental, consumer, and business organizations.
The Energy Commission also formed three Policy Advisory Groups (PAGs) to augment the PAB and focus on three research program areas – Energy Efficiency, Renewable Energy, and Smart Infrastructure. The PAGs review and ensure relevancy of the PIER Program’s research initiatives to the marketplace, find synergy and end‐user opportunities, and avoid research duplication. Staff held public workshops in June 2011 with each PAG to discuss the proposed research initiatives for the upcoming fiscal year (2011‐2012). The workshops brought together utilities, researchers, manufacturers, end users, and policy makers from state agencies, federal agencies, and the public. The results of the meetings provided information for the PIER Program’s future research portfolio and solicitations.
RD&D Benefits Assessment Energy Commission staff is evaluating methods to improve and refine how public benefits are assessed from PIER‐funded RD&D projects and the overall program. The PIER program developed a programwide approach to benefit and cost assessment, which includes integrating benefits assessment elements into work plans and databases, evaluating interviews and surveys, identifying required benefits metrics, and requiring researchers to provide a subsequent report on these metrics.
For example, in the first quarter of 2011, the Energy Commission calculated that PIER‐funded research activities directly created 2,128 jobs. These jobs are assigned to projects providing the full time equivalent (FTE) of 970 job‐years. Analysis using IMPLAN® estimates that these 2,128 jobs lead to 1,250 indirect jobs, where the entities doing the work have to purchase goods and services, and 2,180 induced jobs, where business owners and employees purchase goods and services. About 5,600 people were employed at least part‐time over the course of these PIER‐funded contracts. Based on the FTE job‐years worked, the IMPLAN model estimates state and local governments collected $2.3 million in taxes.
Public Outreach The Energy Commission has considerably streamlined the report and publication process for project fact sheets to disseminate important research results to the public. To communicate the program’s successes, the Energy Commission published a brochure, PIER: How Public Research
172

Powers California,192 along with many fact sheets, reports, and other brochures targeting success in specific topic areas such as smart infrastructure, overcoming renewable energy barriers, and efficiency projects.
In August 2011, the PIER Program held a Venture Capital Forum in Sacramento to increase levels of California venture capital market investments in PIER‐funded emerging technologies. The goal of the forum was to learn from venture capitalists how they evaluate prospective technologies, how to better invest and leverage PIER funds, and how to encourage higher levels of venture capital investment in PIER‐funded technologies to help bolster the path to market. Because of the success of this forum, the program plans to have additional forums in the future.
On the Horizon The PIER Program is committed to working with stakeholders and policy makers to tackle ongoing energy issues associated with the Renewables Portfolio Standard, Zero Net Energy buildings, smart grid implementation, environmental barriers to renewable energy implementation, and the Governor’s goal for DG. Staff will also continue to fine‐tune the administration of the PIER Program with the goal of maximizing its value to California residents.
In November 2011, the PIER program released a solicitation for the Industrial, Agricultural, and Water – Emerging Technologies Demonstration Grant Program II. The PIER program is also planning to release the following five solicitations before the end of 2011:
• Buildings Efficiency Systems and Technologies (BEST)
• Environmental Issues Related to Clean Energy Systems
• Renewable Energy Secure Communities (RESCO)
• Hybrid Generation and Fuel‐Flexible Distributed Generation
• Liquefied Natural Gas Vehicle Infrastructure Improvement Research and Development
While the Energy Commission is confident that research funding will emerge next year, if this does not happen, the agency will have to discontinue vital research and impartial evaluation, and will lose coordination of energy RD&D that benefits the entire state.
Recommendations The Energy Commission recommends that California continue funding public interest energy research that helps meet state energy goals. Advancing energy RD&D activities in California will attract new businesses, create jobs, and allow California companies and research institutions to compete for and successfully attain federal funds.
173
192 California Energy Commission, PIER: How Public Research Powers California, CEC‐500‐2011‐030‐BR, July 2011.

The Energy Commission recommends continuing to manage a public interest energy research program in California because it advocates for Californians by acting as impartial evaluator when providing RD&D funding to California researchers. The Energy Commission also has the unique ability to select and coordinate research across various types of researchers (private businesses, institutional, government agencies, and so forth) to maximize the effectiveness of the program.
Furthermore, the Energy Commission recommends the following for a renewed PIER Program:
• Prepare a Five‐Year Strategic Investment Plan with active stakeholder engagement, which is guided by state energy policy and would achieve a balanced portfolio of investments including technology demonstrations and the more fundamental and applied research.
• Design metrics around strategic plan objectives that are tangible, quantifiable, and measureable. The metrics when combined with periodic evaluations will help refine programs, increase program effectiveness, make tough decisions to drop ineffective program elements, and develop credible evidence that communicates the value of the program to stakeholders.
• Increase outreach and awareness of RD&D projects and results by holding workshops, research forums and conferences, press events, and other activities with the public and stakeholders.
Conclusion The state should continue funding public interest energy research. The PIER program plays a critical role in providing jobs and innovations for California by helping startup businesses move technologies from demonstration to deployment and meet state policy goals.
As administrator of the PIER Program, the Energy Commission will ensure that research informs and follows state energy policy, provides solutions for California’s future energy problems, and provides benefits to Californians. The Energy Commission remains committed to continuing this clean energy‐incubator program.
174

CHAPTER 12: 2011 Bioenergy Action Plan This chapter (1) summarizes the Energy Commission’s 2011 Bioenergy Action Plan,193 prepared for the Bioenergy Interagency Working Group (Working Group) and adopted in March 2011, and (2) outlines current activities and priorities of the Working Group during 2011. The summary includes key points from the report, background information, objectives for achieving state bioenergy goals, challenges, key findings and recommendations, and action items to be taken in the next two years.
In 2006, Executive Order S‐06‐06 established targets for the production and use of electricity and fuels made from biomass, including plant and animal residues from farms, forests, and urban areas, as well as crops grown specifically for energy production. Goals included having the state produce a minimum of 20 percent of its biofuels within California by 2010, 40 percent by 2020, and 75 percent by 2050, and having biomass for electricity represent 20 percent of the state’s Renewables Portfolio Standard targets. The Executive Order also directed state agencies to work together to advance biomass programs in California while providing environmental protection and mitigation. The Bioenergy Interagency Working Group 194 published the first Bioenergy Action Plan in 2006 with recommendations on how to meet in‐state bioenergy policy goals.
Bioenergy is energy produced from biomass in the form of electricity (biopower), renewable gas (biogas, biomethane, or synthetic natural gas), or liquid transportation fuels (biofuels). California has abundant biomass resources from the state’s agricultural, forest, and urban waste streams. Increased bioenergy production could provide the state with several economic, environmental, and reliability benefits. For example, bioenergy creates clean energy jobs, enhances rural economic development, and promotes local economic stability. It can also help the state meet its climate change targets and ensure a more stable supply of energy by reducing the state’s dependence on imported fossil fuels. Biopower can increase grid reliability because it is not intermittent and can therefore support the current “baseload” or other continuous energy demand.
Despite the state’s policies to promote renewable energy and bioenergy, progress on the state’s bioenergy targets has been slow. Following publication of the first Bioenergy Action Plan, new bioenergy facilities were proposed and constructed; some idle facilities were re‐started. However, by 2011, most of these biopower capacity gains were lost due to adverse market
175
193 The full report can be accessed at: http://www.energy.ca.gov/2011publications/CEC‐300‐2011‐001/CEC‐300‐2011‐001‐CTF.PDF.
194 The Working Group consists of the following agencies: California Energy Commission, Air Resources Board, California Environmental Protection Agency, California Resources Agency, California Department of Food & Agriculture, Department of Forestry and Fire Protection, Department of General Services, Integrated Waste Management Board, California Public Utilities Commission, Water Resources Control Board.

conditions, high fuel costs, and in some cases, competition with fossil fuels. Lower cost renewables may also make it difficult for biomass to compete in the RPS competitive bid process. However, biopower should be able to compete in the new Renewable Auction Mechanism, since the program is designed to separate bids into different product types (such as base load, intermittent peak, and intermittent off peak).
As part of the 2011 Plan, Energy Commission staff developed five objectives to help accelerate the state’s progress on achieving bioenergy targets by building on the successes and lessons learned from the 2006 Plan. The five objectives are:
• Encourage increased bioenergy production at existing facilities.
• Promote and expedite the construction of new bioenergy facilities.
• Promote and encourage the integration of bioenergy facilities.
• Fund research and development.
• Remove statutory hurdles and streamline the regulatory process.
Developing the potential for new energy production in each objective will require overcoming many of the challenges facing the industry. The challenges to bioenergy have been discussed through workshops and forums held by the Energy Commission, California Integrated Waste Management Board (now CalRecycle), the California Department of Food and Agriculture, the Department of Forestry and Fire Protection (CAL FIRE), ARB, State Water Resources Control Board, the California Biomass Collaborative, the United States Environmental Protection Agency (U.S. EPA), industry groups, and others for many years. Through these forums, developers, stakeholders, and state and federal agencies have identified missed opportunities and challenges to increased bioenergy development in the state.
Key Findings and Recommendations The 2011 Plan identifies a number of key findings on how the challenges have affected the state’s progress on the bioenergy. The 2011 Plan also finds that biomass is an abundant resource that can help the state achieve clean energy goals, but aggressive actions must be taken to increase biomass use. The findings are as follows:
• California has abundant biomass resources from the state’s agricultural, forest, and urban waste streams. Increasing the state’s bioenergy production will help California achieve the state’s waste reduction, renewable energy, and climate change goals with a sustainable and dependable resource.
• Bioenergy has many benefits, both as a renewable energy source and an alternative disposal option for biomass. The benefits of bioenergy include displacing fossil fuels with a dependable renewable resource, providing distributed energy near demand, reducing greenhouse gas emissions, and providing green jobs in rural communities. The use of biomass has added benefits to surrounding communities by providing agriculture, industry, and forestry an alternative disposal option for biomass residues, indirect jobs needed to
176

collect and transport the biomass, reduced demand on landfills, and improved water quality and ecosystem health.
• Market‐based pricing mechanisms for electricity, transportation, and waste management do not currently consider all of the benefits bioenergy provides to local communities.
• The state should continue the Public Goods Charge funding for Public Interest Energy Research and for supporting existing and emerging bioenergy technologies to help commercialize new technologies, improve efficiency and emission characteristics, and address feedstock supply challenges.
• Electric grid and natural gas pipeline interconnection challenges have inhibited the development of distributed biomass electricity and biogas projects. California must address these challenges to increase development of bioenergy projects.
• The cost to collect and transport biomass feedstock remains an economic challenge to the development of bioenergy projects in California.
• Regulatory uncertainty continues to reduce options to finance projects in the predevelopment stage, further inhibiting the development of bioenergy and other distributed energy projects.
• Efforts to streamline the permitting process, especially for anaerobic digesters using dairy and urban waste, continue to be supported by state agencies, local air districts, regional water control boards, and the U.S. EPA. However, additional actions will be needed by the Bioenergy Interagency Working Group and the Legislature to streamline permitting for distributed energy projects.
The 2011 Plan makes recommendations to support the key findings and help provide solutions to the challenges facing the bioenergy industry. The following recommendations are supported by members of the Working Group:
• Action is needed by the California Public Utilities Commission to collect funds to support continuation of the Energy Commission’s public interest research program and to provide incentives to existing and emerging bioenergy technologies. Members of the Working Group support funding to support a new bioenergy commercialization program to develop agricultural, forestry, and urban bioenergy projects.
• Increased development of biofuels is important to fulfill goals established by the Low Carbon Fuels Standard and the AB 118 program. The state should continue to evaluate bioenergy feedstocks, markets and to promote technologies, programs, and policies needed to enhance biofuels development.
• The Bioenergy Interagency Working Group members should revisit restrictions to the development of in‐state biomethane and current utility tariffs restricting the injection of landfill gas into the state’s natural gas pipeline system.
177
• Permitting agencies need to better coordinate in the permitting process to reduce the timeframe and costs to developers. The Working Group will take additional steps to expedite permits through programmatic environmental impact reports and creating a web‐based portal for permit contacts. The Working Group recommends the Legislature consider options to streamline the state’s permitting process to further expedite permits in California.
• The California Public Utilities Commission should review the interconnection requirements for DG and biomethane projects, biogas quality standards, and identify and implement necessary revisions to regulations that will increase access to the electricity transmission and distribution grid and natural gas pipeline for bioenergy projects.
• The economics of biomass development should be enhanced through a series of state incentives that recognize the benefits of biomass. These incentives could include, but are not limited to, expanding feed‐in tariffs, support for repowering aging biopower facilities, feedstock incentives, environmental adders, more favorable power purchase agreements, and research and development grants.
• The development of sustainable feedstock standards and waste utilization targets for biomass resources to ensure that its use supports California’s renewable energy, the Low Carbon Fuel Standard, recycling goals, and economic development goals.
• Develop a plan and program to reduce the cost of collection and transportation of biomass residues.
• Convene regular meetings of the Working Group to continue agency coordination and collaboration.
• In cooperation with other state agencies, the Energy Commission should continue to monitor progress toward achieving the state’s bioenergy goals through the Working Group.
Status of Biofuels In 2010, California consumed roughly 1 billion gallons of biofuels (gge), primarily as ethanol blended into gasoline as an oxygenate. Federal and state policy mandates will necessitate an increase in the consumption of renewable fuels for transportation in California. Biofuel development is more completely addressed in Chapter 9 on Transportation.
California has 150 million gge of annual ethanol production capacity, with less than 50 million gge produced in 2010. When the ethanol blend in California reformulated gasoline increased to 10 percent in 2010, the state’s total ethanol use grew to nearly 1.5 billion gallons. However, California ethanol facilities contributed less than 4 percent of the state’s needs in 2010. Since 2000, five corn ethanol refineries have been built in California. All five of these plants were idle for most of 2009 and 2010 due to adverse market conditions. Only one of these corn ethanol refineries produced fuel in 2010 with two more coming on‐line in the first half of 2011. Total in‐state biodiesel capacity is capable of producing 100 million gge per year. However, less than 5.7 million gge were produced in 2010. Table 19 summarizes the biofuel production and capacity in California. Biofuel consumption is expected to grow over the next decade.
178

In‐state biofuel production will make up just 5.6 percent of California’s estimated 1 billion gge biofuel demand in 2010, far below the biofuel goal of 20 percent (200 million gge).
Table 19: In-State Biofuel Production (millions gge)
2006 2007 2008 2009 2010
Ethanol Production i 27.7 27.7 90.4 20.1 <50
Biodiesel Production i 20.8 18.6 12.4 7.3 5.7
Total In-State Biofuel Production i 48.5 46.3 103 27.4 <55
Total Biofuel Consumption ii 659 652 702 680 1,017
Percent In-State Production to Total Biofuel Consumed 7.4% 7.1% 14.6% 4.0% <5.5%
i. Source: California Energy Commission
ii. Source: California Energy Commission staff analysis of Board of Equalization taxable gasoline figures.
Over the past two years, the Energy Commission, through its ARFVT Program, has begun investing in new projects to develop and deploy additional in‐state biofuel production projects. To date, the Energy Commission has invested roughly $64 million toward biofuel production, fueling infrastructure, and related projects. This represents just over one third of the total ARFVT Program awards.
Of the $64 million allocated toward biofuels projects, $45 million has gone toward projects that will accelerate or expand the production of next‐generation biofuels. These 17 projects will utilize waste‐based feedstocks or alternative bioenergy crops (such as sugar beets, sweet sorghum, and algae), rather than corn or soy. While the carbon intensity of the resulting fuels will vary, they will typically range from 70 percent to 85 percent below the diesel and gasoline baseline.
Most of these projects are still in their early stages, but the Energy Commission’s survey of awardees indicates their potential for market growth. The survey responses included a low and high range for the projects’ market entrance and expansion, which ranged from a total of 123 million to 632 million gallons per year of petroleum displacement (either gasoline or diesel fuel) from new biofuel production by 2020. If achieved, this level of production would represent a significant step toward achieving the goal of having 40 percent (or roughly 820 million gge) of in‐state biofuel consumption coming from in‐state resources by 2020. 195
195 O’Neill, Garry, John Nuffer, Draft 2011 Bioenergy Action Plan, California Energy Commission, Efficiency and Renewables Division, CEC‐300‐2010‐012‐SD, available at: http://www.energy.ca.gov/2010publications/CEC‐300‐2010‐012/CEC‐300‐2010‐012‐SD.PDF.
179

Status of Biopower and Biogas In 2010, most of the biopower in California was generated from solid‐fuel biomass and landfill gas. Other biopower sources include dairy digesters, solid‐fuel thermochemical conversion facilities, organic waste digesters, and wastewater digesters.
Since 2006, 22 new biopower facilities were built in California (15 landfill gas and 7 digester facilities), representing 44 MW of generating capacity. Although no new solid‐fuel biomass facilities were constructed, four idle facilities restarted, including an idle coal facility converted to biomass.
Cofiring biomass or biogas at conventional power plants has been a growing trend since 2008. Three in‐state coal facilities have begun cofiring with biomass and have plans to convert to biomass as their sole energy resource by 2012. These facilities will contribute 130 MW of renewable capacity to the grid. Two additional coal facilities have indicated an interest in switching to renewable feedstocks, although the Energy Commission does not have an expected start date on the conversion. If successful, these facilities could add another 80 MW of renewable capacity. The conversions of in‐state coal facilities will significantly reduce greenhouse gas emissions, allow the facilities to continue generating combined heat and power, and retain well‐paying jobs in economically depressed communities. In addition, 10 in‐state natural gas power plants began cofiring with pipeline biomethane produced and injected into the interstate natural gas pipeline out‐of‐state, with an effective capacity of 90 MW.
By the end of 2010, nine solid‐fuel biomass facilities were idle, representing 100 MW. The facilities have idled for a various reasons, such as poor economic conditions in the lumber industry and low contract prices for energy. Seven dairy manure digesters also idled because of financial difficulties and, in some instances, difficulties meeting San Joaquin Valley Air Pollution Control District nitrogen oxide (NOx) emission standards with purchased equipment. The capacity idled since 2006 is 100 MW.
Biopower generation increased 10 percent from 2006 through the end of 2010. Much of the generation increase came from out‐of‐state biopower facilities and in‐state biomass cofiring at coal and biogas burned in natural gas facilities, and restarted solid‐fuel biomass facilities. While the total generation used to meet California load has increased since 2006, in‐state biopower generation has remained level. The biomass share of renewable electricity generation in California has decreased from 20 percent to 17 percent.
In‐state biopower generation is expected to increase in the short term as three in‐state coal facilities complete full fuel conversion to biomass by the end of 2012, adding more than 100 MW of biopower capacity to the grid. Additional biopower capacity has recently been proposed as the remaining existing coal facilities look to convert to biomass by 2015. In addition, the Energy Commission expects that a small number of facilities that shut down due to low short‐run avoided cost energy prices in 2009 and 2010 will restart if contract renegotiations are successful. While new projects are being proposed, they are not expected to contribute significant generation in the next two years.
180

Opportunities exist at public works projects, municipal wastewater treatment plants, and landfills to collect and capture fugitive methane emissions. At this time, much of this potential energy resource is flared due to difficulties obtaining air permits and meeting air quality standards in some California air districts, and the economics of power generation. While on‐site power generation may not be possible because of increases air pollutants compared to flaring, cleaning and upgrading this gas to meet pipeline or transportation fuel standards would allow beneficial use of this resource for energy production.
Table 20: Biopower Generation Used to Meet California Load
2006 2007 2008 2009 2010
In-State Biopower Generation (GWh) 5,735 5,398 5,720 5,940 5,745
Out-of-State Biopower Generation (GWh) 550 838 657 885 1,149
Total Biopower Generation (GWh) 6,285 6,236 6,377 6,825 6,894
Total Renewable Generation (GWh) 32,215 32,314 32,532 35,791 39,796
Percent of Renewable Generation 19.5% 19.3% 19.6% 19.1% 17.3%
Source: California Energy Commission Total System Power
Progress on Implementing the 2011 Bioenergy Action Plan The 2011 Bioenergy Action Plan was intended to be updated and refreshed as needed to adapt to changing conditions. Actions underway and completed are listed below.
Actions Underway Action: Governor’s Office and the Bioenergy Interagency Working Group are developing the 2012 Bioenergy Action Plan.
Action 1.1: Develop a website to provide local governments with permitting, planning, and technical assistance documents for siting and developing new renewable facilities.
Lead agency: Energy Commission New completion date: March 31, 2012
This action was changed to develop a program to offer planning and permitting assistance to local permitting agencies. The new completion date reflects the need to hold a stakeholder workshop in early 2012.
Action 1.2: Develop a comprehensive website to provide new project developers with permitting guidance, links, and contacts to permitting agencies.
Lead agency: Energy Commission New completion date: March 31, 2012 (to fit in with the work plan of Action 1.1.)
181

This action will be included in the development of the Local Government Assistance Program in Action 1.1.
Action 2.5: Increase energy production from urban‐derived biomass.
Lead agency: Energy Commission New completion date: March 31, 2012
The Energy Commission will work with CalRecycle to determine the process by which source separated urban‐derived biomass (the organic fraction of solid waste) can be identified from other municipal solid waste for it to be considered biomass for the RPS. If necessary, the Energy Commission will clarify biomass eligibility in the RPS Eligibility Guidebook. This action is in the implementation phase; however, the task is being incorporated into the next round of RPS Guidebook revisions at the end of 2011.
Actions Completed Action 2.6 (a): The Program Environmental Impact Report for Anaerobic Digestion of Organic Waste was completed, certified, and submitted to the State Clearinghouse in June 2011. This document is designed to expedite the permitting on anaerobic digestion projects within California.
Action 2.6 (g): CalRecycle has updated guidance documents that outline how CalRecycle regulations are applied to anaerobic digesters and the statutory requirements that CalRecycle and local enforcement agencies have regarding anaerobic digesters when solid waste is used as a feedstock.
Action 5.4: This action involved monitoring changes to federal bioenergy policies and regulations. In May 2011, U.S. EPA issued a stay delaying the effective date of the standards for major source boilers and commercial and industrial solid waste incinerators (also referred to as the Boiler MACT rules). The stay will allow the agency to reconsider the rules in light of new data.
182

CHAPTER 13: Nuclear Issues and Status Report on Assembly Bill 1632 Report Recommendations This chapter discusses the implications of recent events in Japan for California’s nuclear plants regarding seismic and tsunami hazards, spent fuel pool safety, potential station blackouts, liability coverage, long‐term power outages, and emergency response planning.
In 2010, nuclear power provided 15.7 percent of California’s in‐state electricity generation, and 11.1 percent of the entire California power mix (which includes out‐of‐state imports).196 This electricity generation comes from three plants: the Diablo Canyon Power Plant (Diablo Canyon) and the San Onofre Generating Station (SONGS) in California, and the Palo Verde nuclear power plant in Arizona.197 These nuclear power plants are important to California’s electricity supply and meeting California’s greenhouse gas emissions reduction goals and policies for climate change reduction. However, Diablo Canyon and SONGS are older plants located near major earthquake faults and have significant inventories of spent nuclear fuel stored onsite. Concerns about their safety and reliability have increased with the recent large earthquakes in Japan.
In 2007, a major earthquake resulted in a subsequent loss of nearly 8,000 MW of power at the Kashiwazaki‐Kariwa nuclear power plant in Japan, with most of its units remaining shut down four years after the event. This event followed the California Legislature’s passage in 2006 of AB 1632, which required the Energy Commission to assess the vulnerability of California’s major baseload plants to a major earthquake or plant aging.198 As required by Assembly Bill 1632 (Blakeslee, Chapter 722, Statutes of 2006), the Energy Commission completed An Assessment of California’s Nuclear Power Plants: AB 1632 Report (AB 1632 Report) in 2008, which provided an independent scientific assessment of the seismic hazard and plant vulnerabilities at Diablo Canyon and SONGS.199
183
196 See: http://energyalmanac.ca.gov/electricity/index.html, Electricity Generation by Resource Type (1997 – 2010, Excel file).
197 Diablo Canyon is located near San Luis Obispo and is owned by Pacific Gas and Electric (PG&E). SONGS is located near San Clemente on land leased from the U.S. Marine Corps at the north end of Camp Pendleton. It is co‐owned by Southern California Edison, San Diego Gas & Electric, and Riverside Public Utilities. The Palo Verde nuclear power plant, located near Phoenix, Arizona, and partially owned by SCE, the Los Angeles Department of Water and Power, and a consortium of Southern California municipal utilities.
198 PG&E, 2010a, Diablo Canyon Power Plant, Responses to Kashiwazaki‐Kariwa Nuclear Power Station Lessons Learned, March 10, 2010.
199 California Energy Commission and MRW and Associates, An Assessment of California’s Nuclear Power Plants: AB 1632 Report, CEC‐100‐2008‐009‐CMF; and AB 1632 Assessment of California’s Operating Nuclear Plants: Final Consultant Report, CEC‐100‐2008‐005‐F, available at: http://www.energy.ca.gov/ab1632/documents/.

That year, Pacific Gas and Electric (PG&E) announced that the United States Geological Survey (USGS) had discovered the Shoreline Fault less than a mile offshore from Diablo Canyon. The USGS concluded it is possible Diablo Canyon could experience larger and more frequent earthquakes than previously thought. To help resolve this and other uncertainties, the Energy Commission’s 2008 IEPR Update recommended that PG&E and Southern California Edison Company (SCE) complete enhanced seismic and tsunami hazard and plant vulnerability studies including using three‐dimensional seismic reflection mapping and other advanced techniques to supplement seismic research at the plants.200
On March 11, 2011, a magnitude 9.0 earthquake and tsunami in Japan knocked out power at the Fukushima Daiichi nuclear plant in Japan, resulting in reactor meltdowns, explosions, fires, and widespread radioactive contamination. Although a 9.0 magnitude earthquake from a subduction zone is not thought to be possible near Diablo Canyon and SONGS, the incident heightened concerns about seismic and tsunami hazards as well as safety issues for California’s coastal nuclear plants. On July 26, 2011, two Commissioners from the Energy Commission and two from the CPUC jointly conducted a public workshop on the implications of the Fukushima Daiichi accident for California’s nuclear power plants and the utilities’ progress in carrying out the AB 1632 Report recommendations.201 Three panels of experts representing PG&E, SCE, state and federal agencies, the nuclear industry, and public interest groups participated in this workshop along with members of the public. In addition, the utilities prepared responses to 2011 IEPR Committee data requests on nuclear issues.202
Events at Fukushima Daiichi and Implications for California Nuclear Plants The 9.0 magnitude earthquake on March 11, 2011, in northern Japan and an estimated 40‐foot tsunami at the Fukushima Daiichi plant site resulted in spent fuel meltdowns at three of the plant’s six reactors, overheating and damage to spent fuel storage pools, explosions and fires, large‐scale releases of radioactive materials to the environment, and the evacuation of an estimated 80,000 people. The Japanese Government rated the crisis at a Level 7, the highest possible level on the international scale for evaluating the seriousness of nuclear reactor incidents—equivalent to the 1986 Chernobyl plant accident in the Ukraine. The policy decisions resulting from the lessons learned studies from these events will shape the next few decades of nuclear energy policies throughout the world.
184
200 California Energy Commission, 2008 Integrated Energy Policy Report Update, CEC‐100‐2008‐CMF, available at: http://www.energy.ca.gov/2008_energypolicy/index.html.
201 See the meeting notice, agenda, transcripts, panel submittals, and public comments for the July 26, 2011, workshop at: http://www.energy.ca.gov/2011_energypolicy/documents/index.html#07262011.
202 Utility responses to the 2011 IEPR Data Request on Nuclear Issues can be found at: http://www.energy.ca.gov/2011_energypolicy/documents/data_nuclear_power_plants/.

Fukushima demonstrated that extraordinary and extreme events can pose unexpected challenges for nuclear plants. Historically, the Nuclear Regulatory Commission’s (NRC) emergency guidelines (instituted in the 1990s) for nuclear plants, including the Severe Accident Mitigation Guidelines, have been voluntary and not part of its program overseeing reactor safety.203 After Fukushima, however, the NRC established a task force to evaluate what lessons might apply to the safety of U.S. reactors and instructed NRC plant inspectors to conduct immediate, independent assessments of each plant’s level of emergency preparedness. NRC’s regional and resident inspectors found several deficiencies at Diablo Canyon.204
The Fukushima events will likely cause increased industry vigilance and expanded federal government oversight of nuclear power plant safety. In 2011, NRC’s Near‐Term Task Force issued Post‐Fukushima recommendations for enhancing reactor safety and a priority list of actions.205 The NRC Chairman, Gregory Jaczko, has urged an expedited timeline to work through the recommendations, but the industry is asking for more time to assess the lessons learned from Fukushima and the cost to plant owners from making the recommended changes.206 There is no consensus yet among NRC Commissioners regarding the need for expedited action.207
Seismic and Tsunami Hazards The recent earthquakes that affected the Fukushima Daiichi plant in March 2011, and the North Anna plant in Virginia on August 23, 2011, exceeded the levels assumed in plant designs and underscored the importance of updating seismic hazard estimates for reactor sites.208 As of 10 weeks after the earthquake, no significant safety concerns from the earthquake have been identified at North Anna. The earthquake affecting Fukushima was a magnitude 9.0 compared to the plant design of magnitude 7.9. An international study combining monitoring data from
185
203 Nuclear Regulatory Commission, NRC Inspection Manual, Temporary Instruction, 2515/184, issued April 29, 2011, see: http://pbadupws.nrc.gov/docs/ML1111/ML11115A053.pdf.
204 Natural Resources Defense Council, Tom Cochran, July 26, 2011, IEPR workshop on California Nuclear Power Plant Issues.
205 Nuclear Regulatory Commission, Recommendations for Enhancing Reactor Safety in the 21st Century: Near‐Term Task Force Review of Insights from the Fukushima Dai‐ichi Accident, July 12, 2011.
206 Reuters, “Analysis: After Fukushima, Glacial Change Seen for U.S. Nuclear,” July 11, 2011, Roberta Rampton and Eileen O’Grady.
207 Bloomberg, “Jaczko Votes for NRC Fukushima Report, Spurns Calls to Delay,” August 10, 2011, Brian Wingfield.
208 On August 23, 2011, following an earthquake, the two‐reactor North Ana nuclear plant in Virginia shut down. The dry cask storage containers during the earthquake moved several inches. The earthquake exceeded design parameters for the plant. NRC is asking Dominion to demonstrate to the Energy Commission that no functional damage occurred to features necessary for continued operation without undue risk to the health and safety of the public. The NRC will complete a safety evaluation regarding restart of the plant.

around the world to estimate the scale and fate of radioactive emissions from Fukushima indicated that there was structural damage to the plant and radioactive material releases following the earthquake even before the tsunami hit.209 The majority of faults in California are not considered capable of generating a magnitude 9.0 earthquake.210 However, the significant uncertainties regarding geologic conditions near Diablo Canyon and SONGS warrant additional seismic studies.
For SONGS, the largest uncertainty for determining seismic hazard and plant vulnerability pertains to the offshore (and potentially onshore) thrust fault systems.211 The existing seismic network in Southern California has few monitoring stations near SONGS. Therefore, detailed studies similar to those that led to the discovery in 2008 of the Shoreline Fault near Diablo Canyon are not possible. Similarly, the existing global positioning system (GPS) network in Southern California has few stations near SONGS, and no ocean floor GPS monitoring stations are in the vicinity of the plant.212
For Diablo Canyon, the largest uncertainty is the seismic hazard potential for the plant’s identified fault systems. The existing seismic monitoring network in Northern California has numerous onshore stations in and around Diablo Canyon. However, there are no offshore stations west of the Hosgri and Shoreline faults. Sea floor seismometers west of these faults would greatly increase the ability to accurately locate known and unknown offshore faults by determining the precise locations of earthquake (most often micro‐earthquakes) epicenters.
To better understand crustal strain in the offshore environment, permanent GPS monitoring stations should be placed on the offshore sea floor. Offshore GPS stations are needed to measure crustal strain to better understand where the sea floor is deforming/moving. The USGS has determined that the recent identification of new faults and reinterpretation of known faults
186
209 Stohl, A., P. Seibert, G. Wotawa, D. Arnold, et. al, “Xenon‐133 and Caesium‐137 Releases into the Atmoshere from the Fukushima Dai‐ichi Nuclear power Plant: Determination of the Source Term, Atmospheric Dispersion, and Deposition”, Atmos. Chem. Phys. Discuss., 11, 28319‐28394, 2011, www.atmos‐chem‐phys‐discuss.net/11/28319/2011/doil:10.5194/acpd‐11‐28319‐2011.
210 California Coastal Commission, Mark Johnsson, presentation at Energy Commission’s July 26, 2011, workshop.
211 United States Geological Survey, William Ellsworth, “Overview of Earthquake Hazards in California and Current Research Aimed at Reducing Uncertainty,” presentation at Energy Commission’s July 26, 2011, workshop.
212 United States Geological Survey, William Ellsworth, “Overview of Earthquake Hazards in California and Current Research Aimed at Reducing Uncertainty,” presentation at Energy Commission’s July 26, 2011, workshop.

indicate the need for further work to better understand the seismic hazards of the Central Coast.213
For years, scientists considered the Hosgri Fault as the dominant source of seismic shaking that could affect Diablo Canyon. Then the San Simeon earthquake in 2003 demonstrated the potential of strong seismic shaking on previously unidentified blind thrust faults in the region. Identification of the Los Osos Fault indicated a San Simeon‐style earthquake could occur very near or beneath the plant. The USGS’ analysis of earthquake epicenters near Diablo Canyon led to the discovery of the previously unknown Shoreline Fault directly offshore from the plant in 2008. The USGS is also examining whether the Hosgri Fault is continuous with the San Simeon‐San Gregorio Fault and ultimately tied into the San Andreas Fault in Bolinas. The results of these studies could change the magnitude of the maximum probable earthquake on the Hosgri Fault. Similarly, studies are being conducted to assess the continuity (as opposed to segmentation) of the Shoreline Fault and its potential connection to the Hosgri Fault increasing the likelihood that an earthquake rupture may simultaneously occur along both faults.
The NRC’s Task Force has noted an increased understanding of seismic hazards within the United States and is recommending an upgrade of the design basis and flooding protection of structures, systems, and components (SSCs) for each operating reactor (with a re‐evaluation of the design basis every 10 years). The NRC is reviewing the adequacy of seismic safety margins at all U.S. plants with PG&E’s and SCE’s participation.214 The additional seismic studies for Diablo Canyon and SONGS, as recommended by the AB 1632 Report, will contribute to these updated seismic evaluations.
Spent Fuel Pool Safety Due to the unavailability of offsite storage or disposal facilities, most spent fuel is stored at reactors in cooling ponds in far greater densities than original plant designs and in significantly less protected buildings than the reactor cores. In 2003, an independent study of safety issues associated with spent fuel pool storage raised concerns about the trend toward higher‐density spent fuel storage in pools and the possibility that under certain conditions in which the water is drained from a pool, the fuel could overheat, ignite the fuel cladding, and release large
187
213 United States Geological Survey, William Ellsworth, recommended at the July 26, 2011, workshop research for improved understanding of seismic hazard affecting the Central Coast including high‐resolution bathymetry (marine), LIDAR (land) aeromagnetic surveys, marine and land gravity surveys, new and reviewing old oil industry’s seismic reflection surveys, adding land‐based and ocean bottom seismic stations, detailed geologic investigations to establish slip rates and to date fault offsets, adding land and ocean floor GPS, high‐resolution seismic surveys and sampling marine deposits.
214 Nuclear Regulatory Commission, Draft Generic Letter 2011‐XX (GI‐199), “Seismic Risk Evaluations for Operating Reactors,” issued for public comment on September 1, 2011, Agencywide Documents; Access and Management System (ADAMS) Accession No. ML111710783 “Implications of Updated Probabilistic Seismic Estimates in Central and Eastern United States on Existing Plants.”

188
fire
storage.217
quantities of radioactive materials.215 The National Academies in 2006 at the request of Congress completed a study on spent fuel safety and security and reported on the risks of a from overheated spent fuel in storage pools and the potential release of large quantities of radioactive materials. They concluded that dry cask storage is inherently safer and has security advantages over wet pool storage.216 A high‐priority measure would be to equip spent fuel pools with low‐density racks for spent fuel
International researchers examining worldwide radiation monitoring stations found that the Unit 4 spent fuel pool at Fukushima played a significant part in the widespread release of radioactive materials to the environment.218 Fukushima’s spent fuel pools were not fully loaded,219 whereas Diablo Canyon stores about four times more spent fuel than it was designed for.220 SONGS has a spent fuel pool storage capacity that is nearly double that of the original storage capacity.221
An option for California’s nuclear plants is to expedite the transfer of the older spent fuel from pools into dry storage casks (which are passively safe).222 The Energy Commission’s 2008 IEPR recommended that PG&E and SCE return the spent fuel pools to open racking arrangements as soon as feasible. PG&E has not performed any studies on this issue, and SCE is evaluating whether to modify the rate for moving SONGS’ spent fuel from the pools into dry cask storage.
Another issue at Fukushima, as noted by the NRC Task Force, was that the plant’s operators had great difficulty understanding the condition of the spent fuels pools during the accident because the instrumentation was lacking or not functioning properly.223 To address
215 Robert Alvarez, “Reducing the Hazards from Stored Spent Power‐Reactor Fuel in the United States,” Science and Global Security 11, 1‐51, 2003.
216 National Research Council, Safety and Security of Commercial Spent Nuclear Fuel Storage, National Academies Press, 2006.
217 Clark University, Center for Risk and Security, Gordon Thompson, “Potential Radioactive Releases From Commercial Reactors and Spent Fuel,” June 2005, Worcester, Massachusetts, CRS Discussion Paper 2005‐003.
218 Geoff Brumfiel and Nature Magazine, “Fukushima Nuclear Plant Released Far More Radiation than Government Said,” Scientific American, October 25, 2011, http://www.scientificamerican.com/article.cfm?id=fukushima‐nuclear‐plant‐release4d‐more‐radiation‐government‐said.
219 Allison Macfarlane, “The Overlooked Back End of the Nuclear Fuel Cycle”, Science, Vol. 333, September 2, 2011, pp. 1,225‐1,226.
220 California Energy Commission, IEPR workshop transcripts, July 26, 2011, page 97.
221 Southern California Edison, Response to IEPR Data Request, August 8, 2011.
222 Allison Macfarlane, “The Overlooked Back End of the Nuclear Fuel Cycle,” Science, Vol. 333, September 2, 2011, pp. 1,225‐1,226.
223 Noted by NRC’s Task Force.

instrumentation issues, the NRC Task Force is recommending that nuclear power plants provide sufficient safety‐related instrumentation and seismically protected systems that will supply additional cooling water to spent fuel pools when necessary, and provide at least one electrical power system to operate spent fuel pool instrumentation and pumps at all times. PG&E reported that Diablo Canyon’s spent fuel pool monitoring instruments that indicate abnormally high or low water temperatures and/or water level in the pool are not environmentally qualified and are subject to failure in a harsh temperature or radiation environment.224 Similarly, SCE reported that under severe accident conditions, the spent fuel pool monitors or instrumentation may not be available and reliable, but plant operators could be deployed to confirm water level and temperature, provided that radiological conditions allow the entry into the spent pool building.225
Station Blackout The Fukushima accident resulted from what is considered to be an extreme event – a station blackout. A station blackout is a loss of off‐site alternating current (AC) power and then a subsequent failure of onsite emergency back‐up power to support cooling and emergency safety systems in the reactor and spent fuel pools. Emergency crews at Fukushima following the station blackout and loss of emergency cooling struggled to stop a core meltdown from occurring at the plant.226 After the earthquake, the Fukushima plant lost all offsite AC power to the six units and then had to transfer the electrical power to the onsite emergency diesel generators. The tsunami struck about 40 minutes later, flooding the electrical equipment rooms and thereby disabling the generators. At that point, the plant relied solely on direct current (DC) power from the station batteries. However, the batteries eventually drained, leaving the station without power.
Diablo Canyon and SONGS have emergency backup diesel generators with cross ties, as well as underground tanks holding a seven‐day diesel fuel supply. At Diablo Canyon, most of the electrical switch gear and batteries are located 85 feet above sea level. Since SONGS is located on the Marine Corps Base, it has backup resources for handling a station blackout. SCE and PG&E are reviewing their preparation for an extended station blackout and/or loss of emergency cooling.
The NRC requires that plants be capable of cooling the reactor core and maintaining containment integrity for the duration of four to eight hours. 227 However, NRC does not address the impact from certain external hazards, such as seismic and flooding, or from naturally
189
224 Pacific Gas and Electric, Response to 2011 IEPR Data Request, June 9, 2011, page 13.
225 Southern California Edison, Comments on Committee Workshop on California Nuclear Power Plant Issues, August 8, 2011, question B.03.
226 Mirsky, Steve, “Nuclear Experts Explain Worst‐Case Scenario at Fukushima Power Plant,” Scientific American, March 12, 2011.
227 Nuclear Regulatory Commission, “Enhancing Reactor Safety in the 21st Century,” page 33, July 2011.

occurring events leading to the loss of onsite or offsite power. The NRC Task Force recommends that the NRC strengthen station blackout mitigation capability at all operating and new reactors for design‐basis and beyond‐design‐basis external events (for example, floods, hurricanes, earthquakes, tornadoes, tsunamis). It is also recommending that plant emergency plans address prolonged station blackouts and events involving multiple reactors.
Nuclear Plant Liability Coverage Japan’s nuclear accident highlighted a possible concern with liability coverage, as recent compensation estimates show the Fukushima Daiichi nuclear plant disaster will cost at least $39 to $52 billion, not including plant decommissioning costs and other factors.228 A major consideration in estimating liability claims is damage to agriculture, fisheries, and businesses and the cost of relocating thousands of people in the evacuation zones. The U.S. Price‐Anderson Act coverage limits public liability claims from a nuclear power plant incident to roughly $12.6 billion.229 The act covers bodily injury, sickness, disease or resulting death, or offsite property damage caused by nuclear material at the defined location.230 ,231 Since U.S. homeowner insurance policies do not cover nuclear‐related damages, it is unclear whether individuals affected by a nuclear accident will be sufficiently covered or reimbursed for damages under the Price‐Anderson Act. According to SCE, complainants would be required to prove damages and to adjudicate claims in state court.
Replacement Power and Reliability One of the lessons learned from Fukushima is the need to ensure replacement power and grid reliability in the event of a long‐term outage. PG&E reports that it maintains adequate reserves to replace power from a unit if an outage lasts longer than 90 days.232 For prolonged outages, PG&E would provide replacement power from a mix of its own resources, market purchases, and procurement.233 PG&E does not expect that a long‐term outage at Diablo Canyon would
190
228 Scientific American, “Panel Sees Nuke Disaster Compensation at $39‐$52 Billion: Nikkei,” September 26, 2011.
229 Nuclear Regulatory Commission, see: http://www.nrc.gov/reading‐rm/doc‐collections/fact‐sheets/funds‐fs.html.
230 Pacific Gas and Electric, Comments on the July 26, 2011, Committee Workshop on California Nuclear Plant Issues, August 9, 2011, Docket 11‐IEP‐1J, pp. 12‐13.
231 The Price‐Anderson Act, enacted in 1957, was designed to ensure adequate funds would be available for public liability claims for personal injury and property damage in the event of a nuclear accident at a commercial nuclear power plant. The limit of liability for a nuclear accident is now more than $12 billion. The NRC’s fact sheet on Price‐Anderson Act coverage is available at: http://www.nrc.gov/reading‐rm/doc‐collections/fact‐sheets/funds‐fs.html.
232 Pacific Gas and Electric, Response to 2011 IEPR Nuclear Data Request, Docket 11‐IEP‐1J, page 12, August 9, 2011.
233 Pacific Gas and Electric, Response to 2011 IEPR Nuclear Data Request, Docket 11‐IEP‐1J, page 31, June 9, 2011.
require additional transmission facilities to maintain voltage support or system or local reliability. They evaluated resource options, including gas‐fired combined cycle plants, energy efficiency, renewable energy, and integrated coal gasification with carbon capture and sequestration, for replacing Diablo Canyon’s roughly 2,200 MW capacity.234 It does not anticipate needing new facilities for transmission support, grid stability, or local reliability from an extended shutdown of Diablo Canyon, although the replacement facilities may require additional transmission.
SONGS is located between two major load centers and is an integral part of the Southern California transmission system. A shutdown of SONGS restricts power flows coming from out‐of‐state, and a prolonged shutdown could cause serious grid reliability shortfalls unless the state improves the transmission system infrastructure.235 SCE concluded that an unplanned long‐term outage at SONGS would harm electric system reliability in Southern California, especially in the SCE and SDG&E service territories.236 Under moderate to heavy electricity loads, SCE would likely implement controlled rolling blackouts in the short term to reduce stress on the electric grid. Further, SCE concluded that significant investment is required for new transmission and generation to replace SONGS.
Although the 2008 IEPR Update highlighted the need to improve electricity planning and reliability assessments to fully understand the reliability risks and other consequences of lengthy, unplanned outages at these nuclear plants, these assessments have not been completed. As the Energy Commission stated then, the overall supply/demand balance in the Western interconnection is an important determinant of the impacts of a sudden, unplanned outage. Replacement power costs and other impacts will be higher if western resource surpluses are small, and replacement power costs and other impacts will be lower if there are extensive surpluses. 237 Which of these conditions can be expected in future years is highly uncertain. To the extent that replacement generation might be found to be needed, the type of replacement power would be the subject of further analysis and include such considerations as the lead times needed for planning, permitting, regulatory approval, and construction of facilities, as well as any potential environmental impacts and mitigation requirements for new replacement generation.
191
l
234 Pacific Gas and Electric, Diablo Canyon Power Plant License Renewal Prepared Testimony, Chapter 4, “Replacement Energy Costs,” Volume 1 of 3, January 29, 2010.
235 California Energy Commission, 2008 Integrated Energy Policy Report, page 74, available at: http://www.energy.ca.gov/2008_energypolicy/index.htm .
236 Southern California Edison, Comments on 2011 IEPR Committee Workshop on California Nuclear Plant Issues, page 10, August 8, 2011.
237 California Energy Commission, AB 1632 Report, pp. 19‐24, available at: http://www.energy.ca.gov/2008publications/CEC‐100‐2008‐009/CEC‐100‐2008‐009‐CMF.PDF.

In light of the extended outages (years) at nuclear power plants in Japan following major earthquakes in 2007 (Kashiwazaki) and in 2011 (Fukushima Daiichi), a comprehensive and updated analysis of the impacts and mitigation of unexpected, long‐term, unplanned outages at one or both of California’s nuclear plants is needed. Such an analysis would include an assessment of options for their replacement and the impacts of their shutdown (for example, reliability) and would involve multiple California agencies, particularly the California ISO. The California ISO is uniquely capable of examining the impact on electricity reliability of extended outages given its day‐to‐day operation of the electric grid for most of the state. Further, the CPUC would play a critical role in authorizing PG&E and SCE to secure additional capacity suitable for mitigating a sudden unplanned, extended outage of Diablo Canyon and SONGS. The Energy Commission also would play a role in providing the other energy agencies and the public energy supply and demand forecasts.
Emergency Response Planning Large‐scale radioactive materials releases from the Fukushima Daiichi nuclear plant along with high levels of radiation surrounding the plant resulted in mandatory evacuations, affecting people out to about 46 miles from the site.238 The estimated contamination area is 2,000 square kilometers (200,000 hectares).239 Following the earthquake, the NRC issued a travel advisory to evacuate American citizens out to 50 miles.240 Although the NRC has not recommended any changes in the current regulatory framework for emergency preparation, the Fukushima event emphasized the importance of reviewing the adequacy of emergency response planning at Diablo Canyon and SONGS.
The NRC is working with federal, state, and local authorities on a revised emergency preparedness rule. The NRC and Federal Emergency Management Agency require two emergency planning zones (EPZs) around commercial nuclear power plants: (1) a 10‐mile EPZ where exposure to a radioactive plume would likely occur; and (2) a 50‐mile EPZ for monitoring and protecting the public from secondary radiation exposure from contaminated food, milk, and surface water. Roughly 7.4 million people live within a 50‐mile radius of SONGS, and about 842,000 people live within a 50‐mile radius of Diablo Canyon.
PG&E recently examined how potential earthquake damage to roads and bridges around Diablo Canyon could affect evacuation plans. The study concluded that little or no damage would likely occur to the majority of bridges and roadways serving as evacuation routes. 241 Overall, PG&E found that the estimated evacuation time did not exceed what would be
192
238 Tom Cochran, PowerPoint slides, presentation at Energy Commission’s July 26, 2011, IEPR workshop, page 7.
239 Arjun Makhijami, transcripts from July 26, 2011, IEPR workshop, page 214.
240 Ibid
241 Pacific Gas and Electric, Response to 2011 IEPR Nuclear Data Request, June 9, 2011, page 9.
unacceptable.242 SCE periodically reviews the roadways surrounding SONGS and has concluded they are adequate for emergency personnel access and for evacuation during an emergency.
In light of the long‐range contamination and lessons learned from Fukushima and NRC’s recommended 50‐mile evacuation zone for U.S. citizens in Japan, both California plants must re‐evaluate the adequacy of current evacuation and emergency response plans. In addition, the California Department of Health Services and Lawrence Livermore National Laboratory should consider the possibility of multireactor events in their radiation dose pathway assessments. PG&E noted that it will consider the impacts from multiple events,243 while SCE reports to have procedures to handle multiple extreme events such as earthquake and flooding.
Nuclear Waste Issues For decades, the United States has planned to eventually dispose of spent fuel in a permanent federal waste repository and forgo reprocessing due to nuclear weapons proliferation concerns. In 2010, however, the Obama Administration, in conjunction with the U.S. DOE, has taken important steps to terminate the license application process for a waste repository at Yucca Mountain, Nevada, citing a lack of public acceptance and a political stalemate surrounding the site. Even if Yucca Mountain again becomes a disposal option, an additional site must be found, as the United States already has more nuclear waste than a Yucca Mountain‐type repository can hold.
Diablo Canyon and SONGS have generated about 2,839 metric tons of spent nuclear fuel or together about 94 metric tons annually. Through their current 40‐year license period, both plants will generate about 4,228 metric tons of spent nuclear fuel. Through possible 20‐year plant license extensions, they will generate another 2,140 for a total of 6,368 metric tons if they obtain 20‐year license extensions. Until the United States develops a repository or away‐from‐reactor storage facility, this waste will continue to accumulate.
Spent fuel storage issues include the safety of long‐term storage of high burn‐up fuels and how these fuels might affect the integrity of fuel and fuel cladding, especially in corrosive marine environments, as well as the long‐term storage costs. PG&E has not performed cost/benefit studies for long‐term storage at Diablo Canyon and has assumed spent fuel will be stored onsite until the federal government removes it. PG&E has developed a dry storage facility to store the waste away from the reactor but plans to rely on pool storage for spent fuel generated during a 20‐year license extension.
The federal government’s Blue Ribbon Commission is rethinking the national policy for waste management and recently recommended a new waste management plan that calls for
193
242 California Energy Commission, transcripts from July 26, 2011, IEPR workshop, page 105.
243 California Energy Commission, transcripts from July 26, 2011, IEPR workshop, page 100.

developing one or more national geologic disposal facilities and one or more consolidated interim spent fuel storage facilities.
Plant Safety Issues It is essential that plants establish and maintain a work environment where management and employees are dedicated to putting safety first. The NRC conducts annual safety assessments of the nation’s nuclear power plants, including Diablo Canyon and SONGS. The third consecutive assessment of Diablo Canyon found that the plant is still facing human performance issues regarding identifying and resolving problems.244 NRC found that PG&E has made some progress in this area, but more work is needed. PG&E completed a safety culture survey in February 2011.
Diablo Canyon, since 1988, has had an independent safety committee, established by the CPUC as part of a settlement agreement reached by CPUC’s Division of Ratepayer Advocates, California’s Attorney General, and PG&E. PG&E testified that the Diablo Canyon Independent Safety Committee (DCISC) is providing independent safety oversight to make certain that PG&E is examining the right things in assessing the lessons learned from Fukushima.245 SONGS does not have an independent safety committee. The DCISC, as recommended by the 2009 IEPR, completed an assessment in 2011 of the reactor pressure vessel integrity and pressurized thermal shock at Diablo Canyon in the context of seismic hazards. It concluded that the plant can operate out to 60 years, if relicensed, without the pressurized thermal shock posing a threat to plant safety that would violate NRC regulations.
For many years, SONGS has been under NRC scrutiny for failure to address several longstanding safety culture issues. On March 2, 2010, the NRC issued SONGS a “Chilling Effect” letter in response to employees expressing difficulty or inability to use the corrective action program, a lack of knowledge or mistrust of the Nuclear Safety Concerns Program, a substantiated case of a supervisor creating a chilled work environment in their work group, and a perceived fear of retaliation for raising safety concerns. During 2009, the NRC received an elevated number of safety conscious work environment allegations from SONGS. The NRC conducted focus group interviews with about 400 workers in 2010 and found ʺa continued degradation in the safety‐conscious work environment.ʺ The NRC advised SCE that these results potentially affect several safety‐critical areas concerning human performance. The NRC has raised this issue in seven consecutive safety assessment periods. However, in September 2011 following NRC’s inspections at SONGS and a significant reduction in safety culture allegations in 2010 and 2011, NRC determined that SCE has made reasonable progress in addressing the worker safety culture issues. 246 NRC will continue to monitor work environment
194
244 NRC letter to Mr. Conway, Annual Assessment Letter for Diablo Canyon, March 4, 2011.
245 Loren Sharp, testimony at July 26, 2011, 2011, IEPR workshop.
246 NRC letter to Peter Dietrich, SONGS, September 6, 2011.

conditions at SONGS. SCE has stated that it is committed to preserving and improving a strong safety culture at SONGS and encouraging workers to raise nuclear safety concerns.
Progress in Completing AB 1632 Report Recommendations The CPUC and the Energy Commission determined that Diablo Canyon and SONGs should complete the AB 1632 Report‐recommended studies as required for the license renewal feasibility studies and review.247 In June 2009, the CPUC directed PG&E and SCE to complete these studies so that the CPUC can meet its obligations to ensure plant reliability and, in turn, grid reliability, in the event of a prolonged or permanent outage.248 This section summarizes progress on these recommendations and studies.
Seismic Studies Update PG&E and SCE have provided periodic updates to the Energy Commission and the CPUC regarding their research plans, and preliminary results of their AB 1632 Report‐recommended studies, including seismic research efforts and updates.
Diablo Canyon PG&E completed a study of the Shoreline Fault in January 2011 for the NRC, which asserted that (based on newer seismic information) the plant can withstand more severe shaking than estimated when the plant was designed in 1977.249 As required, PG&E will conduct additional seismic studies to identify the association between the Shoreline and Hosgri Faults and evaluate the existence/configuration of the southern continuation of the Shoreline Fault. PG&E also intends to install submarine seismometers to enhance the understanding of the locations of coastal zone earthquakes and install GPS monitoring stations to measure crustal strain in the offshore environment. In addition, PG&E will use the updated Uniform California Earthquake Rupture Forecast (UCERF) model to better understand seismic hazards at the plant.250
SONGS Throughout the operating history of SONGS 2 and 3, SCE has periodically assessed the adequacy of seismic safety margins based on new information. In 2010, SCE updated the SONGS probabilistic seismic hazard analysis (PSHA).251 The results are comparable to the 1995 PSHA, indicating that the SONGS seismic hazard risk has not changed. SCE’s ongoing Seismic Hazard Analysis Program periodically reviews and updates SONGS’ seismic hazards, and SCEʹs advisory board of seismic experts reviews the plant’s seismic information and identifies
195
247 The 2009 IEPR, letters from Michael Peevey, President, CPUC, June 25, 2009, to Peter Darbee, President and CEO of PG&E and Alan Fohrer, Chairman and CEO.
248 Ibid.
249 Original estimates based on the Hosgri Fault.
250 The updated model, UCERF‐3, will include the Shoreline Fault and other new seismic data.
251 Southern California Edison, Southern California Edison’s Evaluation of California Energy Commission AB 1632 Report Recommendations, February 2011.

the need for additional research. SCE plans to use the most recent UCERF database to complete the seismic studies,252 the results of which will be provided to the NRC as part of its regulatory process.
To decrease the seismic uncertainty at Diablo Canyon and SONGS, USGS and California Geological Survey scientists have recommended additional studies to identify active faults and determine seismic potential and the recency of faulting.253 ,254 They are working in cooperation with other experts on the revised UCERF‐3 model, which may consider the possibility that faults can rupture together if there is less than a five kilometer gap between their endpoints.
Tsunami Studies Update Diablo Canyon is located on top of a high coastal bluff at an elevation of 85 feet above mean sea level. PG&E’s plant design basis is for a combined tsunami, storm wave, and tidal wave height of about 35 feet.255 Tsunami Inundation Maps show the plant to be outside the tsunami inundation zone.256 In 2010, PG&E published a study of tsunami hazard for Diablo Canyon,257 which considered the combined effects of tsunamis, storms, and tides and included the effects of submarine landslides, which were not specifically considered in the Diablo Canyon licensing analyses. While this study was done in a different manner than previous analyses, it did not identify new hazard information that warranted inclusion into the Diablo Canyon design and license basis. PG&E concluded that a deterministic approach that combines the tsunami generated by a rare local submarine landslide with a large storm wave would lead to an unreasonably rare combination of events.
SCE and NRC evaluated the tsunami runup and inundation for SONGS during plant licensing. More recent assessments conclude that, “…large local‐source tsunamis could be generated by mechanisms other than those considered during licensing for SONGS Units 2 and 3, the basis
196
252 Southern California Edison, Committee Workshop on California Nuclear Power Plant Issues, Responses to Questions for July 26 Energy Commission Workshop, Energy Commission Docket No. 11‐1EP‐1J, August 8, 2011.
253 United States Geological Survey, William Ellsworth, Overview of Earthquake Hazards in California and Current Research Aimed at Reducing Uncertainty, Presentation to 2011 Integrated Policy Report Committee – Nuclear Issues Workshop, June 13, 2011.
254 California Geological Survey, Chris Wills, presentation at the Energy Commission’s July 26, 2011, IEPR workshop, http://www.energy.ca.gov/2011_energypolicy/documents/2011‐07‐26_workshop/presentations/.
255 Pacific Gas and Electric, comments at the July 26, 2011, IEPR workshop, page 10.
256 Recently released by the California Emergency Management Agency, California Geological Survey, and the University of Southern California.
257 Pacific Gas and Electric, Methodology for Probabilistic Tsunami Hazard Analysis: Trial Application for the Diablo Canyon Power Plant Site (PTHA), April 2010, available at: http://peer.berkeley.edu/tsunami/tasks/task‐1‐tsunami‐hazard‐analysis/.
for the 1995 SCE report.” However, SCE reports that no local run‐up studies based on these mechanisms are widely agreed upon, and certainly none for the SONGS site. The University of Southern California, in conjunction with the California Emergency Management Agency, is preparing tsunami runup maps for San Diego County, but they are not currently available.258 The potential for landslide‐generated tsunamis is uncertain, and SCE reports that additional studies are required to evaluate how such tsunamis may affect SONGS. It seeks approval of funding to perform additional seismological and tsunami studies, as recommended by the Energy Commission in the AB 1632 Report.259
In February 2011, SCE presented an updated tsunami hazard analysis to the CPUC and the Energy Commission.260 ,261 The map provides a “credible upper bound” to the potential tsunami inundation for any location along the Southern California coastline. At SONGS, the map indicates a maximum tsunami inundation elevation of 17 to 20 feet above sea level or an equivalent elevation of 19.9 to 22.9 feet above lower low water.262 SCE has concluded that SONGS is protected, with the top of the wall 7.1 to 10.1 feet higher than the credible upper bound elevation of tsunami inundation, and with the North Industrial Area protected by 5.3 to 8.3 feet of sea wall above the inundation elevation.
Studies of Seismic Vulnerability of Plant Components In March 2010, a PG&E report evaluated the probability of a prolonged post‐earthquake outage at Diablo Canyon from damaged nonsafety‐related structures, systems, and components (SSC). The report concluded that all of the SSCs are designed to the appropriate seismic criteria263and meet the required Design Earthquake and Double Design Earthquake criteria for accident mitigation or safe shutdown. The SSCs were found to withstand a 7.5 magnitude earthquake on the Hosgri Fault.
197
258 California Coastal Commission, Mark Johnsson, The Tohoku Earthquake of March 11, 2011: A Preliminary Report on Implications for Coastal California, March 24, 2011.
259 Southern California Edison, Response to Questions for July 26, 2011, Workshop, August 8, 2011, page 3.
260 Letter to Michael Peevey, President of the CPUC, “SCE’s Evaluation of Energy Commission AB 1632 Report Recommendations,” Appendix 2, February 2, 2011.
261 National Oceanic and Atmospheric Administration, California Geological Survey, California Office of Emergency Services and the University of Southern California Tsunami Research Center, “Tsunami Inundation Map for Emergency Planning,” published June 1, 2009.
262 The average of the lower low water height of each tidal day observed over the National Tidal Datum Epoch.
263 Enercon Services, Inc., Seismic Assessment of Diablo Canyon Power Plant Non‐Safety Related Structures, Systems, and Components, March 2010.

SCE completed a study to identify any “important‐to‐reliability,” nonsafety‐related SSCs that could cause a prolonged outage at SONGS from a seismic event.264 The study evaluated those required for power generation, which are considered important to reliability. Additionally, SCE evaluated the nonpower block buildings needed to support power generation. SCE conducted further evaluation to assess the seismic capacity of offshore discharge conduits and reported on their findings in August 2011.265
SCE has not performed studies of the fragility of nonsafety‐related SSCs when relocated for refueling or plant maintenance but did perform studies for plant operating conditions.
License Renewal NRC issues operating licenses for commercial power reactors for up to 40 years and allows 20‐year license extensions with no limit on the number of renewals. The operating licenses for California’s nuclear plants will expire in 2022 (SONGS Units 2 and 3), in 2024 (Diablo Unit 1), and in 2025 (Diablo Unit 2). PG&E submitted a license renewal application for Diablo Canyon on November 24, 2009, to continue operations until 2044/2045. In June 2011, the NRC issued the Safety Evaluation Report for the license renewal application.266 NRC has postponed its license renewal proceeding by 52 months to allow time for PG&E to complete the additional seismic studies. SCE has not yet applied for renewal and will continue to assess options for the timing of CPUC and NRC license renewal filings.267 NRC issued license renewals for Palo Verde Units 1, 2, and 3 on April 1, 2011.
A major concern is whether the license reviews adequately address issues relevant to California (including seismic vulnerability). The NRC license renewal review process determines whether a plant meets the NRC license renewal criteria, including aging plant issues and environmental impacts related to an additional 20 years of plant operation. However, the process consistently excludes issues such as seismic vulnerability, plant vulnerability to terrorist attacks, and the adequacy of emergency evacuation plans.
198
f
264 Southern California Edison letter, “Evaluation of California Energy Commission AB 1632 Report Recommendations,ʺ submitted to the CPUC and Energy Commission on February 2, 2011; See section on ʺSeismic Reliability Evaluationʺ with an appendix providing the study titled, Seismic Reliability Study of San Onofre Generating Station Non‐Safety‐Related Structures, Systems, and Components.
265 Southern California Edison in a letter to Michael Peevey dated August 9, 2011, regarding its assessment of the conduits’ seismic capacity concluded that the offshore discharge conduits “would be expected to maintain their integrity under the SONGS review level earthquake and would not be the cause of a prolonged outage.”
266 Nuclear Regulatory Commission, Safety Evaluation Report Related to the License Renewal of Diablo Canyon Nuclear Power Plant, Units 1 and 2, June 2, 2011, available at: http://pbadupws.nrc.gov/docs/ML1115/ML11153A103.pd .
267 Southern California Edison is a member of STARS (Strategic Teaming and Resource Sharing), which has reserved application submittal dates for late 2012 and fall 2013.
Several California officials have requested the NRC to address a broader range of issues during nuclear power plant license renewal reviews that are of concern for California’s operating plants. These issues include post‐Fukushima safety issues, seismic and tsunami hazards, emergency response plans and evacuation timeliness, plant security, and spent fuel storage. NRC ultimately determined that the existing regulatory process was sufficient and that it considers these issues on an ongoing basis in connection with their oversight of operating reactors.268
California has a legitimate role in license renewal decisions in its broad authority to set electricity generation priorities based on economic, reliability and environmental concerns. Both utilities must obtain CPUC approval to pursue license renewal before receiving California ratepayer funds to cover the costs of the NRC license application process. In addition, the California Coastal Commission must review the project for consistency with the federal Coastal Zone Management Act.
The CPUC considers whether it is in the best interest of ratepayers for the nuclear plants to continue operations another 20 years. Its proceedings address issues that are important to electricity planning but are not included in NRC’s license renewal review, such as the cost‐effectiveness of license renewal compared with alternatives. In letters to PG&E and SCE in June 2009, the CPUC stressed that the utilities must address in their feasibility assessments all issues raised in the AB 1632 Report and that this information is needed to allow the CPUC to properly undertake its obligations under AB 1632 to ensure plant reliability and, in turn, ensure grid reliability in the event Diablo Canyon or SONGS has a prolonged or permanent outage.269 The adequacy and timeliness of the utilities completing the AB 1632 Report‐recommended studies are critical to the CPUC’s ability to make these decisions. However, the utilities’ recent progress reports indicate they are not on schedule to complete the additional AB 1632 Report recommended seismic hazard studies until 2013 (PG&E) and 2015 (SCE) at the earliest.
Recommendations In light of the accidents and/or plant shutdowns following earthquakes at Fukushima Daiichi (2011), Kashiwazaki‐Kariwa (2007), and at the North Anna nuclear plant (August 23, 2011) and other considerations, the Energy Commission, in consultation with the CPUC, recommends the following:
Seismic Issues • PG&E should provide in a timely manner to the Energy Commission, the CPUC, and the
Independent Peer Review Panel (IPRP) the technical details and any significant updates of their proposed seismic hazard study plans and findings for Diablo Canyon.
199
268 Letter to Senator Dianne Feinstein from NRC Chairman Gregory Jackzo, August 10, 2011.
269 Letter from CPUC to Alan Fohrer, CEO of Southern California Edison, June 25, 2009; Letter from CPUC to Peter Darbee, CEO of Pacific Gas and Electric, June 25, 2009.

• PG&E should submit to the Atomic Safety and Licensing Board (ASLB), as part of PG&E’s final seismic report to the ASLB in the Diablo Canyon license renewal proceeding, the findings and recommendations from the California IPRP on PG&E’s seismic studies. These studies include PG&E’s onshore and offshore seismic studies funded by CPUC Decision 10‐08‐003. The CPUC should establish a SONGS IPRP, comparable to Diablo Canyon’s IPRP, to review SONGS’ seismic safety studies recommended in the 2008 IEPR Update. SCE should include the IPRP’s evaluations, findings, and recommendations in their seismic hazard analyses and submittals to the NRC. California’s IPRPs for PG&E’s and SCE’s seismic studies for Diablo Canyon and SONGS should coordinate their seismic hazard evaluations.
• SCE should include greater representation on their SONGS’ Seismic Advisory Board of independent seismic experts with no current or prior professional affiliation with utilities, including SCE or PG&E, or their consultants. The composition of SCE’s SONGS’ Seismic Advisory Board of independent seismic experts should exclude those with a continuing affiliation with SCE.
• PG&E and SCE should provide updates on their progress in completing the AB 1632 Report‐recommended seismic studies to the Energy Commission as part of the 2012 IEPR Update.
Spent Fuel Pool and Independent Spent Fuel Storage Installation Safety and Security • PG&E and SCE should investigate adding safety‐related instrumentation (capable of
withstanding design basis natural phenomena) to monitor in the control room key spent fuel pool parameters, e.g., water level, temperature, and radiation levels, during a severe accident in which radiation levels within the spent fuel pool building are unsafe.
• To reduce the volume of spent fuel packed into storage pools, and consequently the radioactive material available for dispersal in the event of an accident or sabotage, PG&E and SCE, as soon as practicable, should transfer spent fuel from pools into dry casks, while maintaining compliance with NRC spent fuel cask and pool storage requirements and report to the Energy Commission in the 2012 IEPR Update on their progress.
• PG&E and SCE should evaluate, as part of the 2012 IEPR Update, the potential long‐term impacts of spent fuel storage in pools versus dry cask storage of higher burn‐up fuels in densely packed pools, and the potential degradation of fuels and package integrity during long‐term wet and dry storage and transportation offsite.
Station Blackout • SCE and PG&E should report to the Energy Commission, as part of the 2012 IEPR Update,
on progress made in addressing the lessons learned from the station blackout at Fukushima and how well‐equipped their plants are to withstand safely a station blackout lasting longer than seven days. This includes reporting on arrangements for accessing emergency backup generation and fuel, responding to multiple unit events, seismically and flooding protected equipment, and addressing the lessons learned from Fukushima and the Arizona/ Southern California power outage on September 8, 2011.
200
• PG&E and SCE should report to the Energy Commission on the adequacy of trained people, equipment, and external support, including written agreements, for providing emergency power equipment and fuel for handling an extended station blackout.
Nuclear Plant Liability Coverage • PG&E and SCE should report to the Energy Commission, as part of the 2012 IEPR Update,
on the adequacy of Price‐Anderson Act liability coverage for a severe event at Diablo Canyon or SONGS resulting in large offsite releases of radioactive materials. They should include cost estimates for replacement power and reimbursement for off‐site public health impacts and environmental and economic damage, (for example, decontamination costs and the potential impacts on agriculture, water supplies, food products, tourism, and businesses from the event).
Replacement Power and Reliability • To support long‐term energy and contingency planning, the California ISO (with support
from PG&E and SCE) should report to the Energy Commission as part of its IEPR and the CPUC as part of the CPUC’s Long‐Term Procurement Plan on what new generation and/or transmission facilities would be needed to maintain system and/or local reliability in the event of a long‐term outage at Diablo Canyon, SONGS, or Palo Verde. The utilities should report to the CPUC on the estimated costs of these facilities.
• As a contingency in the event that Diablo Canyon and SONGS experience a long‐term outage following a major seismic or other event, the Energy Commission, CPUC, and California ISO, in cooperation with PG&E and SCE, should further evaluate: (1) the uncertainties of a long‐term loss of electricity from these plants, (2) the extent to which existing resources have an energy supply capability beyond that used in normal market conditions, and (3) the need for new resources or different types of resources to satisfy any remaining energy gap. If necessary, the long‐term planning and procurement process at the CPUC should be modified to ensure that any replacement resources found necessary through these studies are acquired in a timely manner.
Emergency Response Planning • The CPUC should approve funding for Cal EMA, in cooperation with the affected counties,
to evaluate the adequacy of current evacuation and emergency response plans, emergency planning zones, and training for Diablo Canyon and SONGS, given the Fukushima accident and NRC’s recommended 50‐mile evacuation zone for U.S. citizens in Japan. This review should include the adequacy of plans for dealing with prolonged station blackouts (for example, powering communications equipment), multiple or multiunit events at one site, increased population densities and traffic flow configurations near the plants, and the possible loss of access roads and evacuation routes in a major event, such as an earthquake or flooding.
201

• The California Department of Public Health should evaluate the adequacy of equipment, staffing, aerial plume monitoring, and models for dealing with two‐unit events at the Diablo Canyon or SONGS sites involving radioactive releases.
Fukushima Lessons Learned • PG&E and SCE should report to the Energy Commission, as part of the 2012 IEPR Update,
and the CPUC on their progress and estimated costs in carrying out the recommendations of the NRC Near‐Term Fukushima Task Force Report.
• PG&E and SCE should report to the Energy Commission, as part of the 2012 IEPR Update, on the adequacy of resources, training, and equipment to cope with severe plant events including a station blackout combined with natural or manmade events (earthquake, flooding, fires, or terrorist attack); for example, the availability of (1) seismically robust and flood protected essential safety systems and equipment; (2) suitably shielded, ventilated, and well‐equipped facilities needed for the workers to manage the accident; (3) ability to respond to multiple events and multiple‐unit events, and (4) trained onsite and offsite responders for a long‐term station blackout or loss of all heat sinks.
• The NRC should expeditiously move forward on the Post‐Fukushima Task Force recommendations, particularly the urgent recommendations.
Relicensing • To help ensure plant reliability and minimize costs, PG&E and SCE should complete the
remaining AB 1632 Report‐recommended seismic studies and make their findings available for consideration by the Energy Commission, CPUC, California Coastal Commission, and the NRC during their reviews of PG&E’s (and SCE’s, if they apply) license renewal application(s) and related certificates. SCE should not file a license renewal application with the NRC without prior approval from the CPUC.
• Since the regulatory changes and requirements recommended by the NRC Near‐Term Task Force on Fukushima could result in higher costs, for example, seismic retrofits, PG&E and SCE should provide cost estimates to the CPUC for complying with NRC’s requirements and the costs of potential replacement power in the event of an extended outage. The CPUC should consider these additional costs during its license renewal evaluations for Diablo Canyon (and SONGS, if SCE applies for license renewal).
• The NRC should delay its decisions on license renewal applications pending completion of the post‐Fukushima lessons learned studies. NRC’s license renewal review for Diablo Canyon and SONGS (if SCE applies for license renewal) should examine updated site‐specific information on seismic and tsunami hazards, emergency preparedness and evacuation timeliness, lessons learned from Fukushima, spent fuel storage options, and plant security. NRC should delay license renewal reviews to allow for consideration of findings from Fukushima studies.
202

Plant Safety • PG&E and SCE should report, as part of the 2012 IEPR Update, on their efforts to improve
the safety culture at Diablo Canyon and SONGS and on the NRC’s evaluation of these efforts and overall plant performance.
• The CPUC should consider establishing a SONGS Independent Safety Committee, modeled after the Diablo Canyon Independent Safety Committee, to provide an independent review of SONGS’ safety, performance, and follow‐up to the lessons learned from the Fukushima Daiichi plant accident.
Continuing Activities • The Energy Commission will continue to monitor reviews of Diablo Canyon and SONGS by
the NRC and the Institute of Nuclear Power Operations; in particular, the Energy Commission will monitor plant performance and safety culture at both plants.
• The Energy Commission will continue to monitor the federal waste management program and represent California in the Yucca Mountain licensing proceeding (in the event this proceeding resumes) to protect California’s interests regarding potential groundwater and spent fuel transportation impacts to the state.
• The Energy Commission will continue to participate in United States Department of Energy and state regional planning activities for nuclear waste transportation.
• The Energy Commission will continue to update information on the comprehensive, “cradle‐to‐grave” or life‐cycle economic and environmental impacts of nuclear energy generation compared with alternatives. These include impacts from uranium mining, reactor construction, fuel fabrication, reactor operation, maintenance and repair; reactor component replacement and disposal; spent fuel storage, transport and disposal; decommissioning; and “beyond design basis” accidents including an extended station blackout lasting longer than assumed.
203
Acronyms AB Assembly Bill AEO 2011 Annual Energy Outlook 2011 AFC Application for Certification AQIP Air Quality Improvement Program ARB California Air Resources Board ARFVT Program Alternative and Renewable Fuel and Vehicle Technology Program ARRA American Recovery and Reinvestment Act BEVs battery electric vehicles BLM Bureau of Land Management Cal/EPA California Environmental Protection Agency CAL FIRE The Department of Forestry and Fire Protection California ISO California Independent System Operator Caltrans California Department of Transportation CCCCO California Community Colleges Chancellor’s Office CCEF California Clean Energy Future CED California Energy Demand CEERT Center for Energy Efficiency and Renewable Technologies CEQA California Environmental Quality Act CHP combined heat and power CNG compressed natural gas CO2e carbon dioxide equivalent CMUA California Municipal Utilities Association CPUC California Public Utilities Commission CREZ competitive renewable energy zones CSI California Solar Initiative CLTC California Lighting Technology Center DG distributed generation Diablo Canyon Diablo Canyon Power Plant DRECP Desert Renewable Energy Conservation Plan DSM demand‐side management E10 10 percent ethanol EDD Employment Development Department EJ environmental justice EME Edison Mission Energy Energy Commission California Energy Commission EIA Energy Information Administration EM&V evaluation, measurement, and verification EPS external power supplies EPZs emergency planning zones ERP Emerging Renewables Program
204

ETP Employment Training Panel EUR estimated ultimate recovery EV electric vehicle FCV fuel cell vehicles FFV flexible fuel vehicle FTD Fuels and Transportation Division FTE full‐time equivalent gge gallons of biofuels GHG greenhouse gas GPS global positioning system GWh gigawatt hour(s) HCICO High Carbon Intensity Crude Oils HVAC heating, ventilation, and air conditioning IEP Independent Energy Producers IEPR Integrated Energy Policy Report IOUs investor‐owned utilities IPRP Independent Peer Review Panel LADWP Los Angeles Department of Water and Power LCFS Low Carbon Fuel Standard LCR local capacity requirements LED light emitting diode LNG liquefied natural gas LSE Load‐serving entity LTPP Long‐Term Procurement Plan MCF 1000 cubic feet of natural gas MMBTU million British thermal units MMcf million cubic feet MMT million metric tons MPR Market Price Referent MW megawatt(s) NOx nitrogen oxide NGV natural gas vehicles NHSM Non‐Hazardous Secondary Materials NRC Nuclear Regulatory Commission NRDC Natural Resources Defense Council NRG NRG Energy NSHP New Solar Home Partnership NSR New Source Review OEMs original equipment manufacturers OIR Order Instituting Rulemaking OII Order Instituting Informational OTC once‐through cooling PAGs PIER Advisory Groups
205
206
PGC Public Goods Charge PEV plug‐in electric vehicle PG&E Pacific Gas and Electric PHEV plug‐in hybrid electric vehicle PM10 particulate matter of ten micron diameter PM2.5 particulate matter 2.5 PIER Public Interest Energy Research Phasor‐RTDMS Phasor Real Time Dynamic Monitoring System PPA power purchase agreement PSHA probabilistic seismic safety margins PV photovoltaic QF qualifying facility R&D research and development RD&D research, development, and demonstration REAT Renewable Energy Action Team RESCO Renewable Energy Secure Community RETI Renewable Energy Transmission Initiative RFS Renewable Fuel Standard RFS2 Renewable Fuels Standards II RPS Renewables Portfolio Standard RWGTM Rice World Gas Trade Model SA Staff Assessment SB Senate Bill SCAQMD South Coast Air Quality Management District SCE Southern California Edison Company SDG&E San Diego Gas & Electric SGIP Self‐Generation Incentive SMUD Sacramento Municipal Utility District SONGS San Onofre Nuclear Generating Station SSCs structures, systems, and components SWRCB State Water Resources Control Board Tcf trillion cubic feet TDS total dissolved solids UCERF Uniform California Earthquake Rupture Forecast‐2 U.S. DOE United States Department of Energy U.S. EPA United States Environmental Protection Agency USGS United States Geological Survey VOC volatile organic compounds ZEV Zero Emission Vehicle ZNE zero‐net‐energy


