Board of Governors of the Federal Reserve System ____________________________________________________________________________________ 2011 Interchange Fee Revenue, Covered Issuer Costs, and Covered Issuer and Merchant Fraud Losses Related to Debit Card Transactions March 5, 2013
trillion in the United States during 2011. These numbers represent a 24 percent increase in debit
card volume and a 27 percent increase in debit card value from 2009. Of the 46.7 billion
transactions, 63 percent were signature-based and 37 percent were PIN (personal identification
number)-based. In 2011, prepaid cards represented 2.43 billion transactions, or about 5 percent
of all debit card transactions, valued at $83.6 billion.
In the fourth quarter of 2011 (the portion of the reporting period in which the interchange
fee standard was in effect), 36 percent of all debit card transactions were processed by issuers
that were exempt from the interchange fee standard. During this period, 82 percent of prepaid
transactions were exempt from the interchange fee standard. For covered issuers, interchange
fees for all transactions averaged 24 cents per transaction, a 52 percent decrease from the 50 cent
average received by covered issuers during the first nine months of 2011. Over all transactions,
exempt issuers received an average interchange fee of 43 cents per transaction, a 4 percent
decline from the 45 cents per transaction average during the first nine months of 2011.
3
The payments and incentives that networks pay to issuers fell for covered issuers after the
interchange fee standard went into effect. Payments and incentives to covered issuers in 2011
averaged 2.8 cents per transaction before the standard went into effect but only 1.5 cents per
transaction during the fourth quarter of 2011. Payments and incentives to exempt issuers were
relatively flat, averaging 1 cent before October 1, 2011, and 1.2 cents after that date. Payments
and incentives to acquirers and merchants averaged 0.7 cent for the year. The average incentive
payment per transaction was generally higher for signature networks than for PIN networks,
regardless of the recipient.
Network fees paid by acquirers to networks averaged 5.4 cents per transaction in 2011.
After the interchange fee standard went into effect, covered issuers paid an average of 3.2 cents
per transaction in network fees and exempt issuers paid an average of 6.3 cents. These fee levels
were not materially different from what the issuers paid before the standard went into effect.
Signature networks charged higher network fees on average than PIN networks.
The Board estimated fraud losses to all parties (merchants, cardholders, and issuers) to be
$1.38 billion in 2011. Signature transactions accounted for $1.13 billion of those losses while
PIN accounted for $204 million. Prepaid card fraud losses were $51 million. The incidence of
debit card fraud was 0.3 percent of transactions, down from 0.4 percent in 2009. Card-not-
present and counterfeit card fraud continue to be the most common types of debit card fraud
reported. Issuers bore 60 percent, merchants bore 38 percent, and cardholders bore 2 percent of
debit card fraud losses. The distribution of fraud losses differed significantly by authentication
method, with issuers bearing virtually all PIN debit fraud losses (96 percent) and slightly more
than half (54 percent) of signature debit fraud losses. Merchants continued to bear the majority of
card-not-present losses, and issuers bear most of the counterfeit card fraud losses.
4
Authorization, clearing, and settlement (ACS) costs, excluding fraud losses, for covered
issuers averaged 5 cents per transaction in 2011. ACS costs varied greatly across respondents,
however, with the median issuer having an average ACS cost of 11 cents but the issuer at the 75th
percentile having an average ACS cost of more than 36 cents. The issuers with the highest debit
card transaction volumes generally had the lowest ACS costs per transaction. Conversely,
issuers with the smallest debit card programs generally had much higher ACS costs per
transaction. Issuers that responded to both the 2009 and 2011 data collections typically reported
that ACS costs per transaction were lower in 2011 than in 2009.
In 2011, fraud-prevention and data security costs averaged 1.9 cents per transaction for
covered issuers, with the median issuer averaging slightly less than 1.5 cents per transaction.
Costs for cardholder inquiries not related to fraud averaged 4.4 cents per transaction for covered
issuers.
The 2011 survey had many first-time respondents, most of which had small debit card
programs and high ACS costs per transaction. These issuers were typically branches of foreign
banking organizations or large financial institutions that have minimal retail banking operations.
These new respondents tended to skew upward average ACS costs across covered issuers.
Sixty-seven percent of covered issuers had average ACS costs below the 21 cent
interchange fee standard. These issuers accounted for 99.7 percent of covered issuer
transactions.
II. Background
Section 920 of the Electronic Fund Transfer Act (as added by Section 1075 of the Dodd-
Frank Wall Street Reform and Consumer Protection Act) requires the Board to disclose every
5
two years “aggregate or summary information concerning the costs incurred, and the interchange
transaction fees charged or received, by issuers or payment card networks in connection with the
authorization, clearing, or settlement of electronic debit transactions as the Board considers
appropriate and in the public interest.”1 The Act, as amended, authorizes the Board to collect
such information from issuers and payment card networks as may be necessary to implement the
debit card interchange fee standards required under that section.
The Board conducted its first data collection in 2010, collecting data from payment card
networks and issuers for the calendar year 2009. The Board published a report containing
summary information from its first data collection in June 2011 when it issued Regulation II
(Debit Card Interchange Fees and Routing, 12 CFR part 235).2 The information from the first
data collection included in the report assisted the Board in developing the rule.3 Regulation II
establishes an interchange fee standard under which no issuer with consolidated assets of $10
billion or more may charge or receive an interchange fee for an electronic debit transaction
greater than 21 cents plus 5 basis points times the value of that transaction. An issuer that is
subject to the standard may be eligible to receive up to an additional 1-cent adjustment to the
interchange fee it charges or receives if the issuer meets certain fraud-prevention standards.4
Government-administered payment programs and certain reloadable general-use prepaid cards
are exempt from this interchange fee limitation.
Regulation II also prohibits all issuers and networks from restricting the number of
networks over which electronic debit transactions may be processed to fewer than two 1 Electronic Fund Transfer Act § 920(a)(3)(B), 12 USC § 1693o-2(a)(3)(B). 2 The report published in June 2011 and the surveys used in that report are available at http://www.federalreserve.gov/paymentsystems/regii-data-collections.htm. 3 See Final Rule, 76 FR 43394 (Jul. 20, 2011). 4 The Board issued the fraud-prevention adjustment as an interim final rule, which went into effect on October 1, 2011. 76 FR 43478 (Jul. 20, 2011). The Board subsequently issued the final fraud-prevention adjustment rule (also a one-cent per transaction adjustment), which went into effect on October 1, 2012. 77 FR 46258 (Aug. 3, 2012).
unaffiliated networks, and from inhibiting a merchant's ability to direct the routing of an
electronic debit transaction over any network that the issuer has enabled to process it. The
interchange fee standard (including the fraud-prevention adjustment) and the prohibition on
inhibiting merchant routing choice became effective on October 1, 2011. For issuers, the
prohibitions on restricting the number of networks over which transactions may be processed
became effective on April 1, 2012, for most debit cards.
In early 2012, the Board surveyed payment card networks that process debit card
transactions and issuers that are subject to the interchange fee standard in Regulation II. All
respondents were asked to report data for calendar year 2011. The Board requested comment on
proposed survey instruments.5 After reviewing the comments received, the Board finalized a
modified version of the survey instruments.6
The fifteen networks that process debit card transactions completed the payment card
network survey.7 The network survey asked for information related to the volume and value of
debit card transactions, interchange fees charged by networks to merchant acquirers and paid to
issuers, payments and incentives paid by networks to both issuers and acquirers, and network
fees charged by networks to both issuers and acquirers. The network survey asked respondents,
where possible, to break out the information by issuers subject to the interchange fee standard
and issuers exempt from the interchange fee standard. The Board used data from the network
5 76 FR 57037 (Sept. 15, 2011). 6 76 FR 79184 (Dec. 21, 2011). The 2011card issuer and payment card network surveys are available at http://www.federalreserve.gov/paymentsystems/regii-data-collections.htm. 7 Three networks had both signature and PIN (personal identification number) networks. In these cases, the networks were asked to submit separate responses for their signature and PIN networks. Thus, there were 18 total responses to the network survey.
survey for this report and for its report published in May 2012 on the average interchange fees
received by both exempt and non-exempt issuers by payment card network.8
The debit card issuer survey was completed by 131 financial institutions.9 These
institutions included bank and thrift holding companies with assets of at least $10 billion;
independent commercial banks, thrifts, and credit unions with assets of at least $10 billion; and
FDIC-insured U.S. branches and agencies of foreign banking organizations with worldwide
assets of at least $10 billion.10 The issuer respondents ranged from the largest debit card issuers
in the country to issuers with sizeable assets but very small debit card programs.
The debit card issuer survey asked for information related to the volume and value of
debit card transactions processed; costs of authorization, clearing, and settlement (ACS costs);
certain costs associated with a particular debit card transaction that are not ACS costs; fraud-
prevention and data security costs; and interchange fee revenue. The survey also asked for
information regarding the incidence of debit card fraud and associated fraud losses absorbed by
issuers and cardholders, and fraud losses charged back to merchant acquirers.
In general, the surveys instructed respondents to provide the requested information
separately for signature debit and PIN debit operations. Prepaid card operations were considered
separately from signature and PIN debit operations in the debit card issuer survey but treated as a 8 The report on average interchange fees is available at http://www.federalreserve.gov/paymentsystems/regii-average-interchange-fee.htm. 9 The Board distributed surveys to holding companies of covered financial institutions. The Board initially contacted 279 financial institutions. Participation was mandatory for institutions that had debit card programs in 2011. Institutions that indicated that they did not have a debit card program in 2011 were not required to complete a survey. Institutions that did not have debit card programs were typically either foreign banking organizations or other financial institutions with large nonbank affiliates that do not provide retail banking services. 10 Assets were computed using the Consolidated Financial Statements for Bank Holding Companies (FR Y-9C; OMB No. 7100-0128), the Consolidated Reports of Condition and Income (Call Reports) for independent commercial banks (FFIEC 031 & 041; OMB No. 7100-0036) and for U.S. branches and agencies of foreign banks (FFIEC 002; OMB No. 7100-0032), the Thrift Financial Reports (OTS 1313; OMB No. 1550-0023) for thrift holding companies and thrift institutions, and the Credit Union Reports of Condition and Income (NCUA 5300/5300S; OMB No. 3133-0004) for credit unions. The ownership structure of banking organizations was established using the FFIEC’s National Information Center structure database.
8
subcategory of signature and PIN debit operations in the payment card network survey. For
purposes of the surveys, a signature debit card program provides access to funds in a
cardholder’s asset account for point-of-sale or other purchase transactions through use of a debit
card, payment code, or other device, in which the access is not authenticated through the use of a
PIN. A PIN debit card program provides access to funds in a cardholder’s asset account for
point-of-sale or other purchase transactions through use of a debit card, payment code, or other
device, in which the access is generally authenticated through the use of a PIN. Cards that can
access only ATM networks and cannot be used to make point-of-sale transactions were excluded
from the survey.
The survey requested information on general-use prepaid cards, which are cards or other
payment codes or devices that are (1) issued on a prepaid basis in a specified amount, whether or
not that amount may be increased or reloaded, in exchange for payment and (2) redeemable upon
presentation at multiple unaffiliated merchants for goods or services. The debit card issuer
survey did not distinguish between general-use prepaid cards that were exempt from the
interchange fee standard from those that were not exempt.11
III. Card Use12
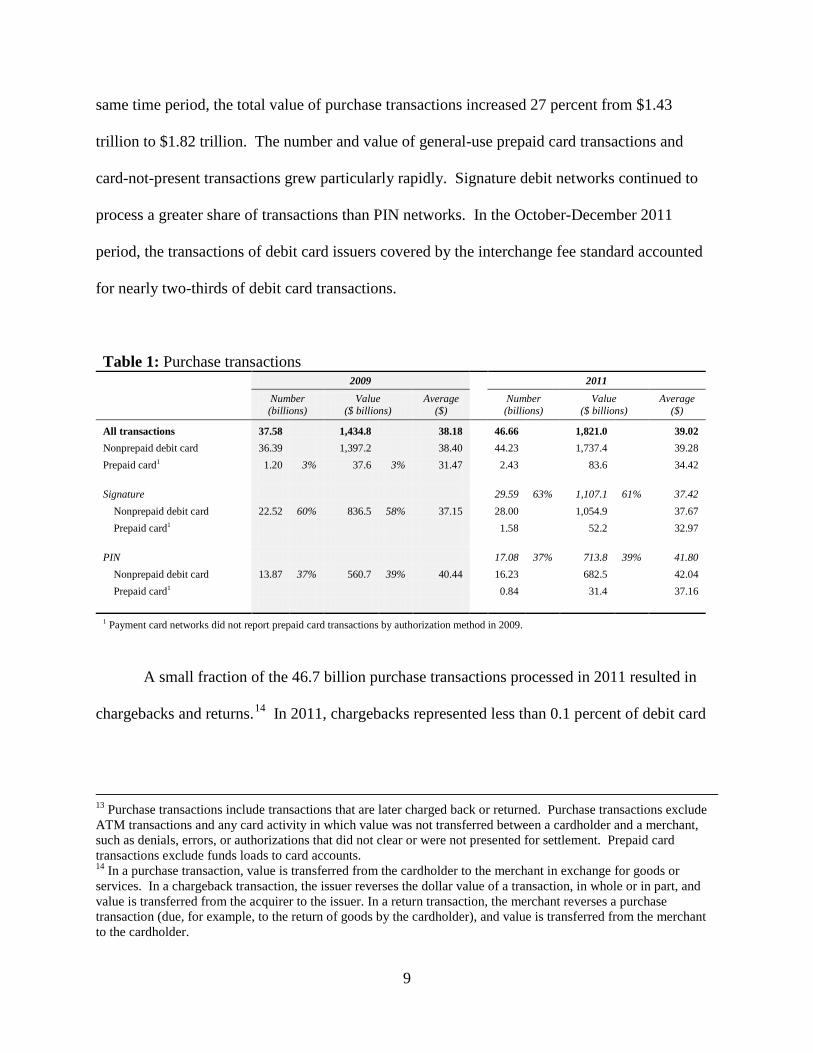
Payment card networks processed 46.7 billion purchase transactions in 2011, a 24 percent
increase from the 37.6 billion purchase transactions processed in 2009 (see Table 1).13 Over the
11 The payment card network survey did distinguish between exempt and non-exempt general-use prepaid cards. 12 Both the payment card network survey and debit card issuer survey asked respondents for data pertaining to the number and value of purchase transactions on debit cards in 2011. Comparison between data from the two surveys suggests a high level of consistency across network and issuer responses: The total number and value of transactions reported in the debit card issuer survey differed from the number and value of transactions reported for covered issuers in the payment card network survey by less than 0.3 percent. Because the debit card issuer survey only includes debit card issuers covered by the interchange fee standard in Regulation II, the figures reported in this section come from payment card network survey data unless otherwise noted.
9
same time period, the total value of purchase transactions increased 27 percent from $1.43
trillion to $1.82 trillion. The number and value of general-use prepaid card transactions and
card-not-present transactions grew particularly rapidly. Signature debit networks continued to
process a greater share of transactions than PIN networks. In the October-December 2011
period, the transactions of debit card issuers covered by the interchange fee standard accounted
37.16 1 Payment card networks did not report prepaid card transactions by authorization method in 2009.
A small fraction of the 46.7 billion purchase transactions processed in 2011 resulted in
chargebacks and returns.14 In 2011, chargebacks represented less than 0.1 percent of debit card
13 Purchase transactions include transactions that are later charged back or returned. Purchase transactions exclude ATM transactions and any card activity in which value was not transferred between a cardholder and a merchant, such as denials, errors, or authorizations that did not clear or were not presented for settlement. Prepaid card transactions exclude funds loads to card accounts. 14 In a purchase transaction, value is transferred from the cardholder to the merchant in exchange for goods or services. In a chargeback transaction, the issuer reverses the dollar value of a transaction, in whole or in part, and value is transferred from the acquirer to the issuer. In a return transaction, the merchant reverses a purchase transaction (due, for example, to the return of goods by the cardholder), and value is transferred from the merchant to the cardholder.
10
transactions and returns represented about 1 percent of transactions.15 Together, chargebacks
and returns totaled 373 million transactions and $22 billion; purchase transactions net of
chargebacks and returns totaled 46.3 billion ($1.8 trillion in value). By volume, signature
networks processed 98 percent of chargebacks and 84 percent of returns; PIN networks
processed the remaining 2 percent of chargebacks and 16 percent of returns. By value, 98
percent of chargebacks and 88 percent of returns were over signature networks.
In 2011, signature debit transactions accounted for 63 percent of debit card transactions
and 61 percent of transaction value; PIN debit transactions accounted for the remaining 37
percent of volume and 39 percent of value. Growth in nonprepaid signature debit use outpaced
growth in nonprepaid PIN debit use from 2009 to 2011. Nonprepaid signature debit transactions
increased 24 percent by volume and 26 percent by value; nonprepaid PIN debit transactions
increased 17 percent by volume and 22 percent by value. The average value of PIN debit
transactions in 2011 ($41.80), however, exceeded that of signature debit transactions ($37.42).
Prepaid card transactions are a small but rapidly growing subset of all debit card
transactions. The 2.43 billion prepaid card transactions processed in 2011 represented 5.2
percent of all debit card transactions and 4.6 percent of total transaction value. The number and
value of prepaid card transactions reported by networks more than doubled from 2009 to 2011.16
The average value of prepaid card transactions increased 9 percent from $31.47 to $34.42,
moving toward the average value of nonprepaid transactions. Around 65 percent of prepaid
transactions were processed over signature networks and 35 percent were processed over PIN
15 In 2011, networks reported 9 million chargebacks totaling $930 million and 364 million returns totaling $21 billion. 16 This may be due in part to improved reporting of prepaid transaction data by payment card networks.
11
networks, similar to the distribution for debit card transactions overall.17 As is the case for debit
card transactions generally, the average value of PIN prepaid transactions exceeded that of
signature prepaid transactions by about $4.19.
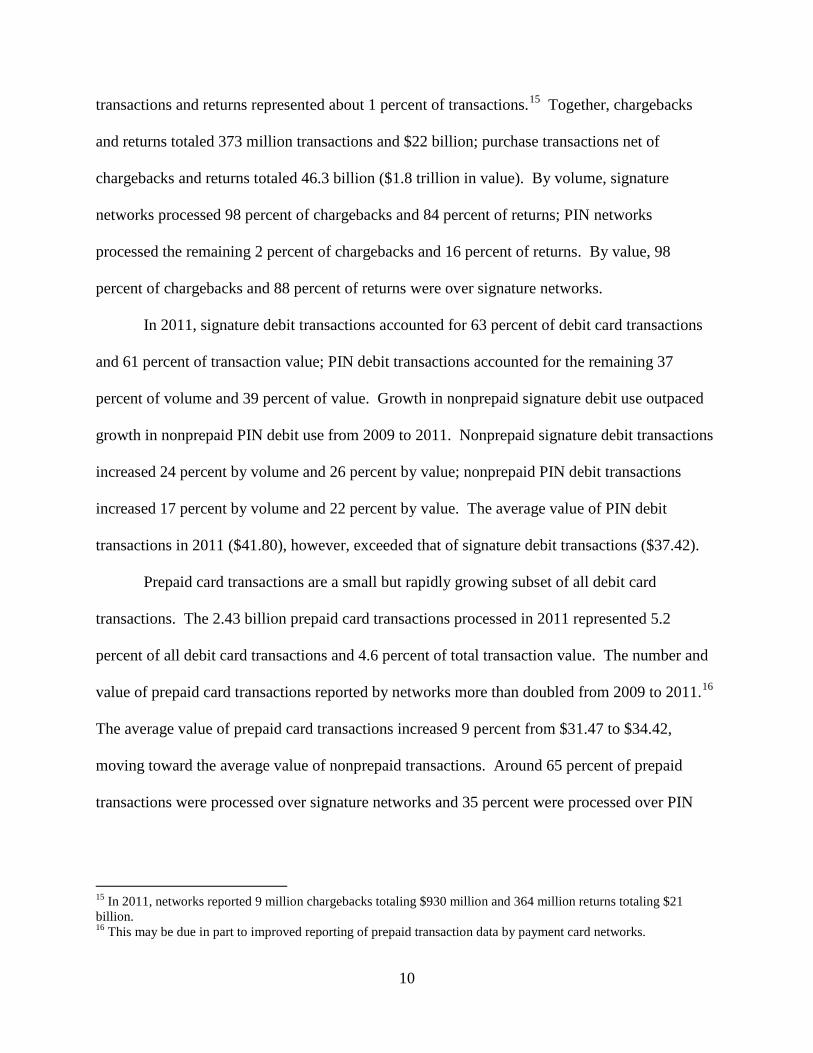
Card-not-present transactions (see Table 2), which include Internet, telephone, and mail
order transactions, accounted for 5.1 billion transactions in 2011 (11 percent of total transaction
volume) and $386 billion (21 percent of total transaction value). The average value of card-not-
present transactions ($75.81) was more than double that of card-present transactions ($34.52).
Card-not-present volume grew about 41 percent from 2009 to 2011, and value grew 36 percent.
Signature card-not-present transactions drove the growth. Signature networks processed
approximately 96 percent of card-not-present transactions in 2011. Card-not-present volume
over PIN networks grew more slowly than did overall debit card transaction volume as PIN
networks continued to have a limited presence online.
Table 2: Card-present and card-not-present transactions
20091 2011
Number (billions)
Value ($ billions)
Average ($)
Number (billions)
Value ($ billions)
Average ($)
All transactions2 37.58 1,434.8 38.18
46.66
1,821.0
39.02 Card-present 33.98 90% 1,152.1 80% 33.90
41.58 89% 1,435.4 79% 34.52
Card-not-present 3.60 10% 282.7 20% 78.55
5.09 11% 385.6 21% 75.81
Signature2 23.45 865.4 36.90
29.59
1,107.1
37.42 Card-present 20.05 85% 605.9 70% 30.22
24.72 84% 747.3 67% 30.23
Card-not-present 3.41 15% 259.5 30% 76.20
4.87 16% 359.9 33% 73.92
PIN2 14.13 569.4 40.30
17.08
713.8
41.80 Card-present 13.94 99% 546.2 96% 39.20
16.86 99% 688.1 96% 40.82
Card-not-present 0.19 1% 23.2 4% 120.18
0.22 1% 25.7 4% 118.09 1 2009 number, value, and average are estimated from the reported proportions of card-present and card-not-present transaction volume and value. 2 Prepaid card transactions are included under signature or PIN debit card transactions based on the type of network over which they were processed. For 2009, the proportion of prepaid card transactions processed over signature and PIN networks is estimated from 2011 data.
17 In the 2009 data collection, prepaid transactions were not separated by authentication method.
12
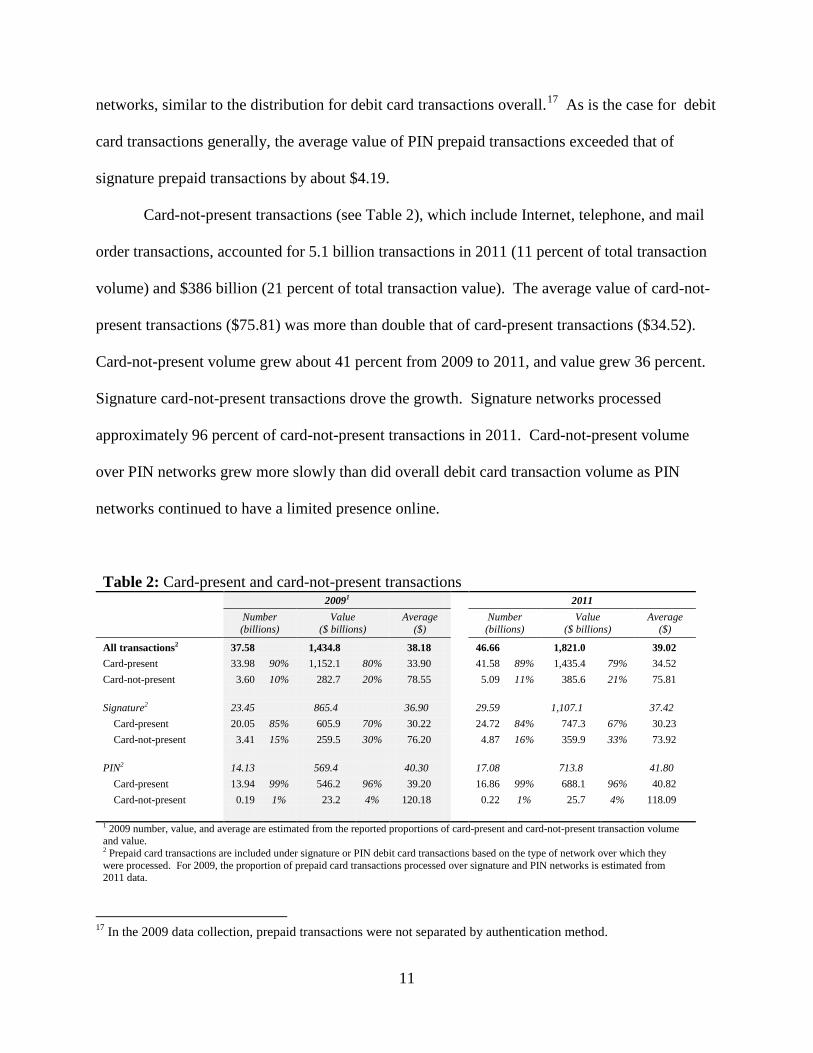
Of the 46.7 billion debit card transactions processed in 2011, 12.1 billion transactions (26
percent) were processed after Regulation II took effect on October 1, 2011 (see Table 3). Nearly
two-thirds of transactions from October 1 to December 31, 2011 (7.8 billion in volume and $308
billion in value) were on cards of issuers covered by the interchange fee standard; the remaining
4.3 billion transactions and $167 billion in value were on cards of exempt issuers. By volume,
covered issuers accounted for 67 percent of signature transactions from October to December but
only 60 percent of PIN transactions. The average value of signature transactions for covered
issuers ($38.03) was $2.45 greater than that for exempt issuers ($35.58). The average value of
PIN transactions was roughly the same for covered issuers ($42.13) and exempt issuers ($42.78).
Table 3: Covered and exempt debit card transactions
0.20 80% 7.1 78% 35.20 1 Prepaid card transactions are included under signature or PIN debit card transactions based on the type of network over which they were processed. The prepaid card transactions reported are a subset of all debit card transactions. 2 Transaction totals for covered issuers may include prepaid card transactions exempt from the interchange fee standard. All nonprepaid debit card transactions are subject to the interchange fee standard for covered issuers. 3 Prepaid card transactions may be counted as exempt either because the issuing institution is exempt or because the prepaid card transaction itself is exempt.
13
Some transactions on cards of covered issuers are exempt from the interchange fee
standard. Specifically, transactions on cards issued pursuant to government-administered
payment programs and certain general-use prepaid cards of covered issuers are exempt.
Although the 2011 data break out transactions into exempt and non-exempt transactions for all
issuers, they do not break out covered issuers’ covered transactions from their exempt
transactions.
Exempt prepaid card transactions across all issuers (covered and exempt) accounted for
549 million (82 percent) of the 671 million prepaid card transactions from October through
December and $18.4 billion (83 percent) of the $22.3 billion of prepaid card transaction value.18
Exempt prepaid card transactions represented 4.5 percent of all debit card transactions in that
period.
Covered prepaid card transactions had a lower average value ($31.35) than exempt
prepaid card transactions ($33.61). Covered prepaid card transactions were more likely than
exempt prepaid card transactions to be processed over PIN networks. Forty-two percent of
covered prepaid card transactions were PIN transactions, compared with 37 percent of exempt
prepaid card transactions.
18 All prepaid card transactions of exempt issuers are exempt from the interchange fee standard because the issuer is exempt.
14
IV. Interchange Fees
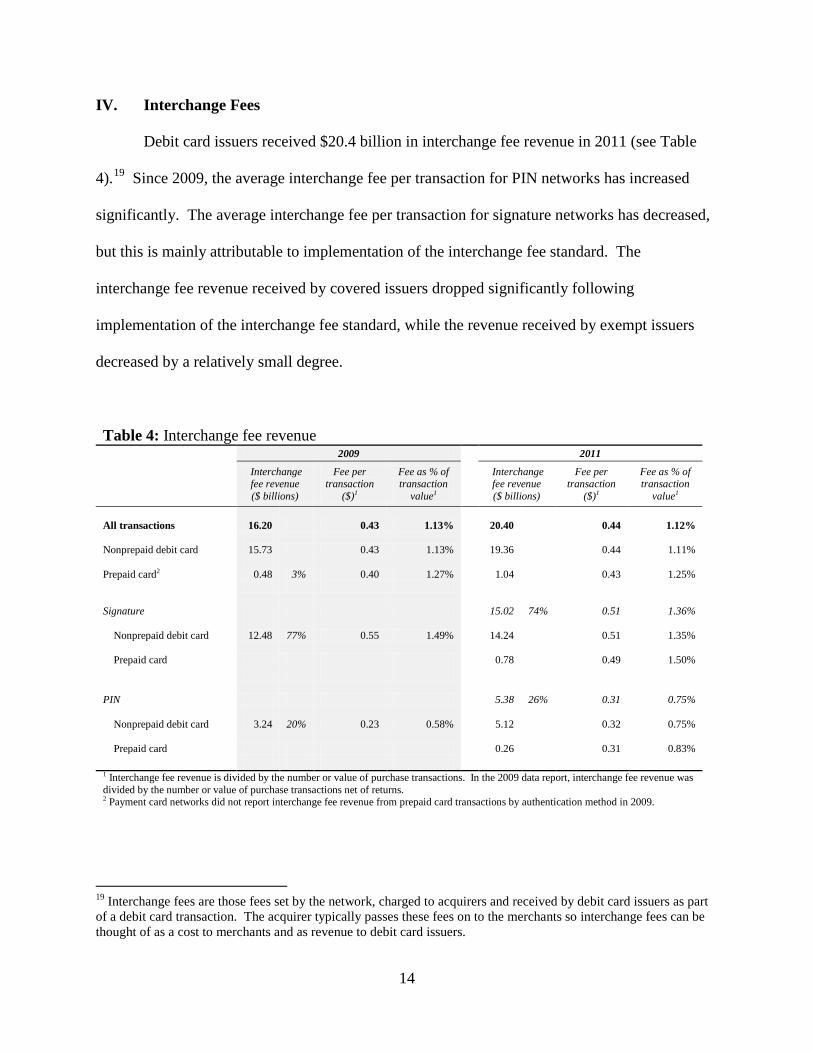
Debit card issuers received $20.4 billion in interchange fee revenue in 2011 (see Table
4).19 Since 2009, the average interchange fee per transaction for PIN networks has increased
significantly. The average interchange fee per transaction for signature networks has decreased,
but this is mainly attributable to implementation of the interchange fee standard. The
interchange fee revenue received by covered issuers dropped significantly following
implementation of the interchange fee standard, while the revenue received by exempt issuers
decreased by a relatively small degree.
Table 4: Interchange fee revenue
2009 2011
Interchange fee revenue ($ billions)
Fee per transaction
($)1
Fee as % of transaction
value1
Interchange fee revenue ($ billions)
Fee per transaction
($)1
Fee as % of transaction
value1
All transactions
16.20 0.43 1.13%
20.40
0.44 1.12%
Nonprepaid debit card
15.73 0.43 1.13%
19.36
0.44 1.11%
Prepaid card2
0.48 3% 0.40 1.27%
1.04
0.43 1.25%
Signature
15.02 74% 0.51 1.36%
Nonprepaid debit card
12.48 77% 0.55 1.49%
14.24
0.51 1.35%
Prepaid card
0.78
0.49 1.50%
PIN
5.38 26% 0.31 0.75%
Nonprepaid debit card
3.24 20% 0.23 0.58%
5.12
0.32 0.75%
Prepaid card
0.26
0.31 0.83%
1 Interchange fee revenue is divided by the number or value of purchase transactions. In the 2009 data report, interchange fee revenue was divided by the number or value of purchase transactions net of returns. 2 Payment card networks did not report interchange fee revenue from prepaid card transactions by authentication method in 2009.
19 Interchange fees are those fees set by the network, charged to acquirers and received by debit card issuers as part of a debit card transaction. The acquirer typically passes these fees on to the merchants so interchange fees can be thought of as a cost to merchants and as revenue to debit card issuers.
15
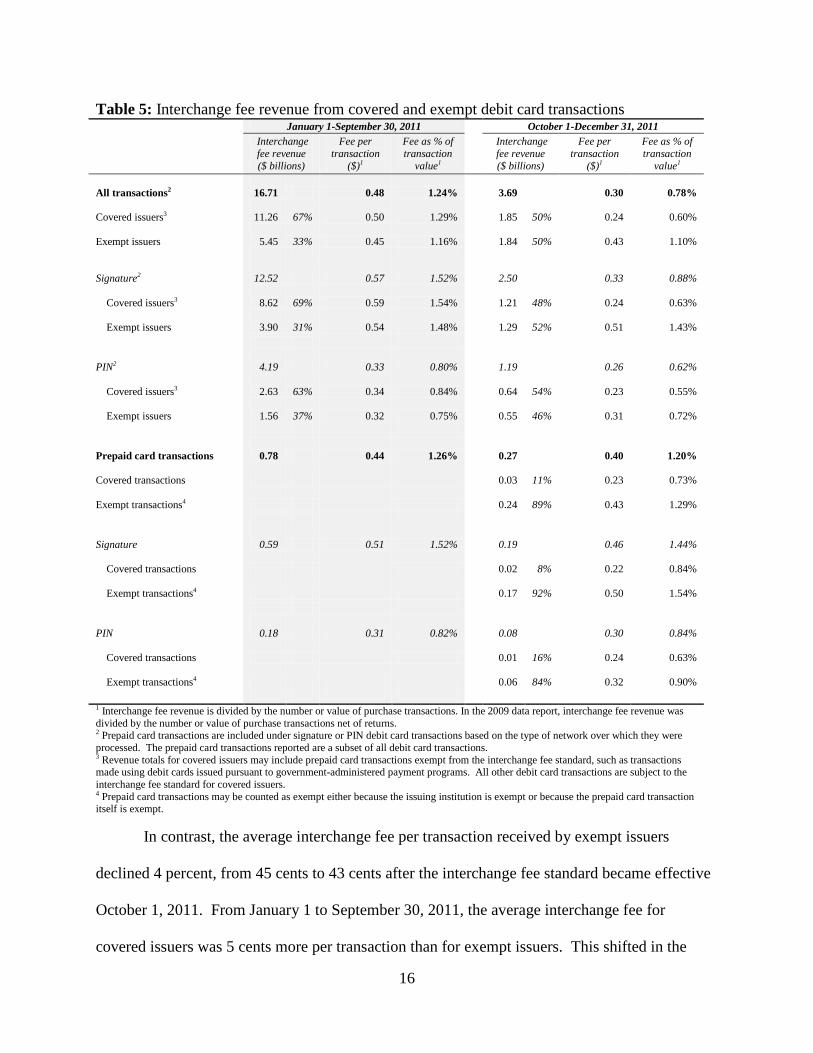
Once the interchange fee standard took effect on October 1, 2011, the interchange fees
received by covered issuers dropped to the level prescribed by the standard (see Table 5).
Interchange fees for exempt issuers decreased slightly but remained close to the levels before
October 1. Overall, the average interchange fee per transaction was 18 cents (38 percent) lower
in the October-December period than in the January-September period. Interchange fees
received by covered issuers dropped by more than half from an average of 50 cents per
transaction (1.29 percent of transaction value) to 24 cents per transaction (0.60 percent of
transaction value). As 24 cents is the maximum interchange fee allowed for a covered issuer
under the interchange fee standard for the average $39 transaction, assuming that the issuer is
eligible for the 1-cent fraud-prevention adjustment, this suggests that most networks set
interchange fees for covered issuers at the cap prescribed by Regulation II once the interchange
fee standard took effect.
16
In contrast, the average interchange fee per transaction received by exempt issuers
declined 4 percent, from 45 cents to 43 cents after the interchange fee standard became effective
October 1, 2011. From January 1 to September 30, 2011, the average interchange fee for
covered issuers was 5 cents more per transaction than for exempt issuers. This shifted in the
Table 5: Interchange fee revenue from covered and exempt debit card transactions
January 1-September 30, 2011 October 1-December 31, 2011 Interchange fee revenue ($ billions)
Fee per transaction
($)1
Fee as % of transaction
value1
Interchange fee revenue ($ billions)
Fee per transaction
($)1
Fee as % of transaction
value1
All transactions2
16.71 0.48 1.24%
3.69
0.30 0.78%
Covered issuers3
11.26 67% 0.50 1.29%
1.85 50% 0.24 0.60%
Exempt issuers
5.45 33% 0.45 1.16%
1.84 50% 0.43 1.10%
Signature2
12.52 0.57 1.52%
2.50
0.33 0.88%
Covered issuers3
8.62 69% 0.59 1.54%
1.21 48% 0.24 0.63%
Exempt issuers
3.90 31% 0.54 1.48%
1.29 52% 0.51 1.43%
PIN2
4.19 0.33 0.80%
1.19
0.26 0.62%
Covered issuers3
2.63 63% 0.34 0.84%
0.64 54% 0.23 0.55%
Exempt issuers
1.56 37% 0.32 0.75%
0.55 46% 0.31 0.72%
Prepaid card transactions
0.78 0.44 1.26%
0.27
0.40 1.20%
Covered transactions
0.03 11% 0.23 0.73%
Exempt transactions4
0.24 89% 0.43 1.29%
Signature
0.59 0.51 1.52%
0.19
0.46 1.44%
Covered transactions
0.02 8% 0.22 0.84%
Exempt transactions4
0.17 92% 0.50 1.54%
PIN
0.18 0.31 0.82%
0.08
0.30 0.84%
Covered transactions
0.01 16% 0.24 0.63%
Exempt transactions4
0.06 84% 0.32 0.90%
1 Interchange fee revenue is divided by the number or value of purchase transactions. In the 2009 data report, interchange fee revenue was divided by the number or value of purchase transactions net of returns. 2 Prepaid card transactions are included under signature or PIN debit card transactions based on the type of network over which they were processed. The prepaid card transactions reported are a subset of all debit card transactions. 3 Revenue totals for covered issuers may include prepaid card transactions exempt from the interchange fee standard, such as transactions made using debit cards issued pursuant to government-administered payment programs. All other debit card transactions are subject to the interchange fee standard for covered issuers. 4 Prepaid card transactions may be counted as exempt either because the issuing institution is exempt or because the prepaid card transaction itself is exempt.
17
October-December period: Exempt issuers received 19 cents more per transaction than covered
issuers. Almost all networks offered higher interchange fees to exempt issuers than covered
issuers.20 Exempt issuers accounted for about the same proportion of debit card transactions
before and after introduction of the interchange fee standard. In the October-December period,
exempt issuers did not appear to experience a substantial change in total interchange fee
revenue.21
The average interchange fee per signature transaction was higher than the average
interchange fee per PIN transaction before October 1, 2011. Because the same interchange fee
standard applies to both signature and PIN transactions, the relative drop in interchange fees for
signature transactions was much larger when the standard took effect. The average interchange
fee per signature transaction for covered issuers dropped 35 cents, from 59 cents to 24 cents. As
a percentage of transaction value, the interchange fee for signature transactions dropped from
1.54 percent to 0.63 percent. In contrast to the almost 60 percent decline in the average
interchange fee per signature transaction for covered issuers, the average interchange fee per PIN
transaction for covered issuers decreased about one-third, from 34 cents to 23 cents. As a
percentage of transaction value, the interchange fee for PIN transactions decreased from 0.84
percent to 0.55 percent. For exempt issuers, the small decrease in interchange fees was fairly
proportional between signature and PIN transactions.
The average interchange fee per prepaid card transaction declined 10 percent, from 44
cents in the January-September 2011 period to 40 cents in the October-December 2011 period.
20 For more detail, the report on average interchange fees published in May 2012 is available at http://www.federalreserve.gov/paymentsystems/regii-average-interchange-fee.htm. 21 Seasonal factors, such as holiday shopping at the end of the year, complicate the comparison of total interchange fee revenue in the January-September and October-December periods. Nonetheless, the total interchange fee revenue received by exempt issuers in the fourth quarter of 2011 was slightly higher than the average interchange fee revenue per quarter received by exempt issuers in the January-September period.
18
The average interchange fee per exempt prepaid card transaction in the October-December
period is comparable to the average interchange fee per transaction for all prepaid card
transactions from January to September.22 From January 1 to September 30, 2011, the average
interchange fee as a percentage of transaction value for prepaid card transactions was about the
same as that for all debit card transactions. From October 1 to December 31, the average
interchange fee per covered prepaid card transaction was 23 cents, essentially at the cap set by
the interchange fee standard. Just as exempt issuers received higher interchange fees than
covered issuers after October 1, 2011, issuers received higher interchange fees for exempt
prepaid card transactions than for covered prepaid card transactions. The average interchange
fee per exempt prepaid transaction was 20 cents higher than the average interchange fee per
covered prepaid transaction from October to December. The average interchange fee per exempt
signature prepaid transaction was 28 cents higher; the average interchange fee per exempt PIN
prepaid transaction was 8 cents higher.
V. Payments and Incentives Paid by Networks
Use of payments and incentives by networks has changed considerably from 2009, even
before the interchange fee standard took effect on October 1, 2011 (see Table 6). The overall
amount of payments and incentives that networks paid to merchants, acquirers, and issuers
declined relative to the number and value of debit card transactions. Payments and incentives
vary widely from network to network; thus, the totals and averages reported in this section serve
only as a general characterization of network practices. Moreover, payments and incentives are
usually bilateral arrangements between a network on one side and a merchant, acquirer, or issuer
22 Networks reported prepaid card transactions in the January 1-September 30, 2011 as a single total.
19
on the other. These figures, calculated from network-reported totals, do not reflect the
heterogeneity of these bilateral arrangements.
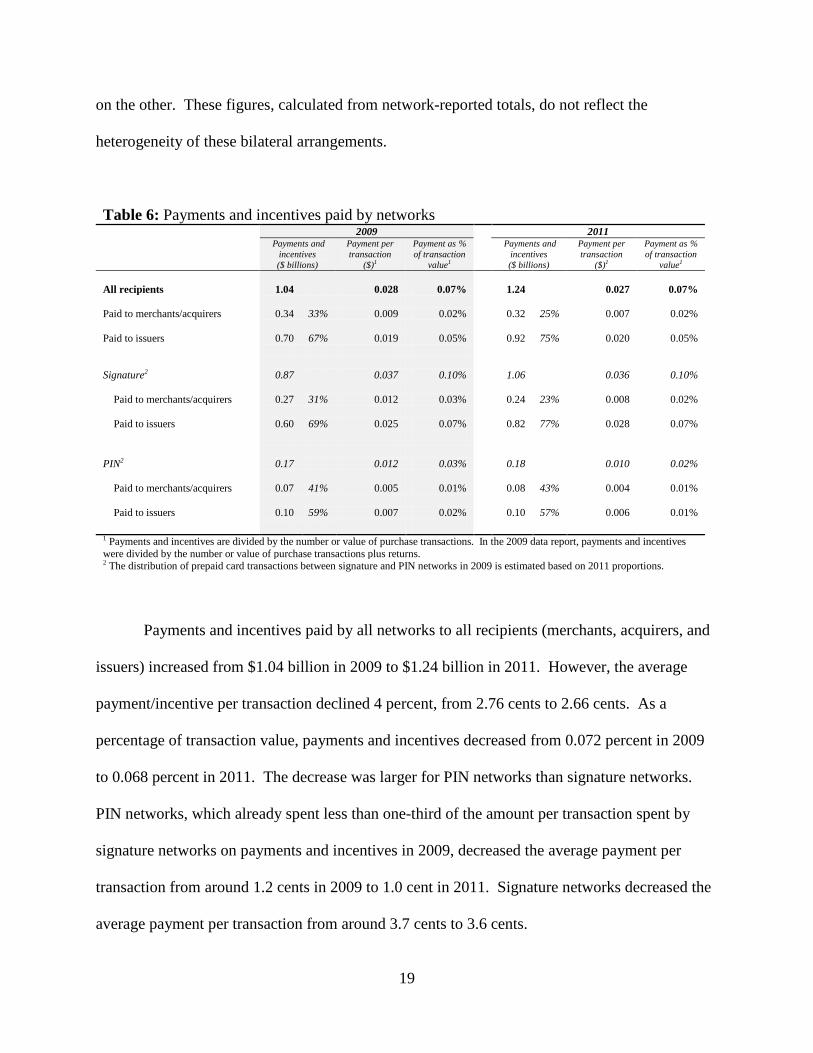
Table 6: Payments and incentives paid by networks
2009 2011
Payments and incentives ($ billions)
Payment per transaction
($)1
Payment as % of transaction
value1
Payments and incentives ($ billions)
Payment per transaction
($)1
Payment as % of transaction
value1
All recipients
1.04 0.028 0.07%
1.24
0.027 0.07%
Paid to merchants/acquirers
0.34 33% 0.009 0.02%
0.32 25% 0.007 0.02%
Paid to issuers
0.70 67% 0.019 0.05%
0.92 75% 0.020 0.05%
Signature2
0.87 0.037 0.10%
1.06
0.036 0.10%
Paid to merchants/acquirers
0.27 31% 0.012 0.03%
0.24 23% 0.008 0.02%
Paid to issuers
0.60 69% 0.025 0.07%
0.82 77% 0.028 0.07%
PIN2
0.17 0.012 0.03%
0.18
0.010 0.02%
Paid to merchants/acquirers
0.07 41% 0.005 0.01%
0.08 43% 0.004 0.01%
Paid to issuers
0.10 59% 0.007 0.02%
0.10 57% 0.006 0.01%
1 Payments and incentives are divided by the number or value of purchase transactions. In the 2009 data report, payments and incentives were divided by the number or value of purchase transactions plus returns. 2 The distribution of prepaid card transactions between signature and PIN networks in 2009 is estimated based on 2011 proportions.
Payments and incentives paid by all networks to all recipients (merchants, acquirers, and
issuers) increased from $1.04 billion in 2009 to $1.24 billion in 2011. However, the average
payment/incentive per transaction declined 4 percent, from 2.76 cents to 2.66 cents. As a
percentage of transaction value, payments and incentives decreased from 0.072 percent in 2009
to 0.068 percent in 2011. The decrease was larger for PIN networks than signature networks.
PIN networks, which already spent less than one-third of the amount per transaction spent by
signature networks on payments and incentives in 2009, decreased the average payment per
transaction from around 1.2 cents in 2009 to 1.0 cent in 2011. Signature networks decreased the
average payment per transaction from around 3.7 cents to 3.6 cents.
20
Networks direct the bulk of their payments and incentives to debit card issuers. Issuers
received $924 million in payments and incentives from networks in 2011, an average of 2.0 cents
per transaction (an increase of 7 percent from 2009) and 0.05 percent of transaction value. In
2011, signature networks paid 77 percent of payments and incentives to issuers; PIN networks
paid 57 percent to issuers. In per-transaction terms, signature networks increased payments and
incentives to issuers from 2009 to 2011 while PIN networks decreased them.
The overall decrease in payments and incentives in per-transaction terms from 2009 to
2011 was driven by a decline in payments and incentives paid to merchants and acquirers as well
as a decrease in payments and incentives paid to covered issuers after the interchange fee
standard took effect. In 2009, networks paid 33 percent of payments and incentives to merchants
and acquirers and 67 percent to issuers. In 2011, merchants’ and acquirers’ share dropped to 25
percent. In per-transaction terms, payments and incentives to merchants and acquirers declined
from 0.91 cents per transaction in 2009 to 0.68 cents per transaction in 2011, a 25 percent
decrease. The average decrease for merchants and acquirers was larger among signature
networks than PIN networks.
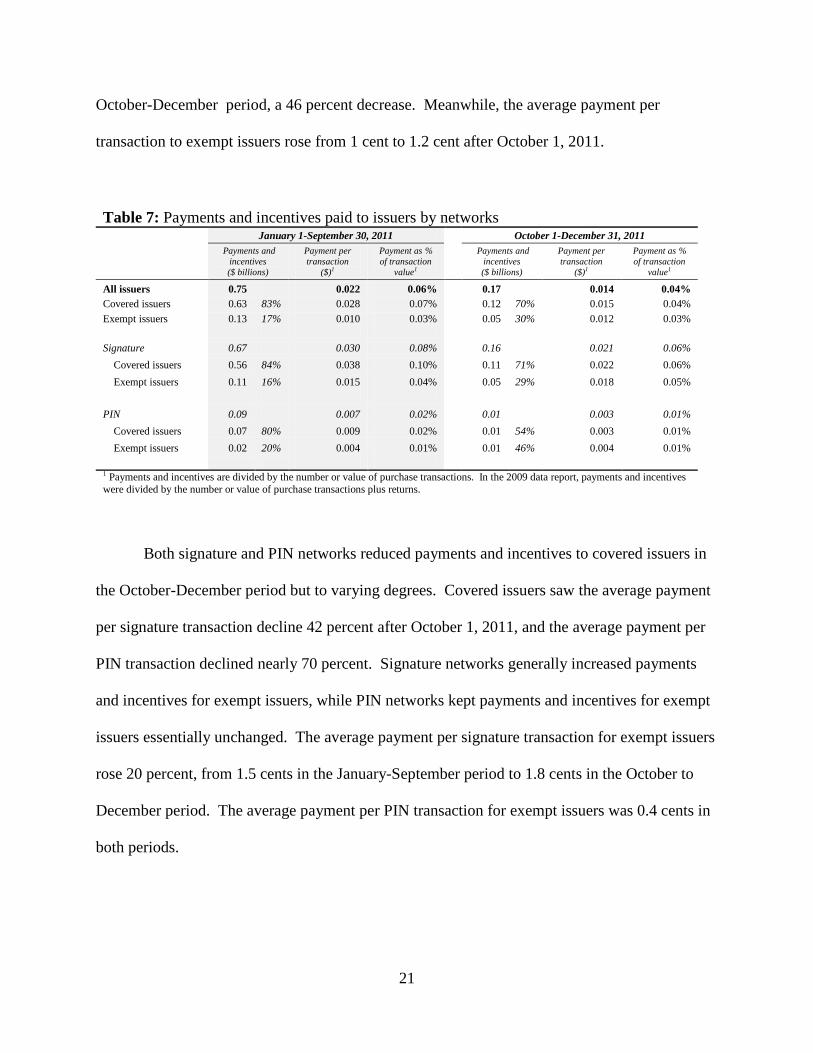
Although networks reduced payments and incentives to covered issuers after October 1,
2011, covered issuers received a disproportionate share of payments and incentives (compared
with exempt issuers) both before and after implementation of the interchange fee standard (see
Table 7). Covered issuers, which accounted for 65 percent of transactions in 2011, received 83
percent of payments and incentives from January to September 2011 and 70 percent of payments
and incentives from October to December 2011. The average payment per transaction to
covered issuers declined from 2.8 cents in the January-September period to 1.5 cents in the
21
October-December period, a 46 percent decrease. Meanwhile, the average payment per
transaction to exempt issuers rose from 1 cent to 1.2 cent after October 1, 2011.
Table 7: Payments and incentives paid to issuers by networks
January 1-September 30, 2011 October 1-December 31, 2011 Payments and
incentives ($ billions)
Payment per transaction
($)1
Payment as % of transaction
value1
Payments and incentives ($ billions)
Payment per transaction
($)1
Payment as % of transaction
value1
All issuers 0.75 0.022 0.06%
0.17
0.014 0.04% Covered issuers 0.63 83% 0.028 0.07%
0.12 70% 0.015 0.04%
Exempt issuers 0.13 17% 0.010 0.03%
0.05 30% 0.012 0.03%
Signature 0.67 0.030 0.08%
0.16
0.021 0.06% Covered issuers 0.56 84% 0.038 0.10%
0.11 71% 0.022 0.06%
Exempt issuers 0.11 16% 0.015 0.04%
0.05 29% 0.018 0.05%
PIN 0.09 0.007 0.02%
0.01
0.003 0.01% Covered issuers 0.07 80% 0.009 0.02%
0.01 54% 0.003 0.01%
Exempt issuers 0.02 20% 0.004 0.01%
0.01 46% 0.004 0.01% 1 Payments and incentives are divided by the number or value of purchase transactions. In the 2009 data report, payments and incentives were divided by the number or value of purchase transactions plus returns.
Both signature and PIN networks reduced payments and incentives to covered issuers in
the October-December period but to varying degrees. Covered issuers saw the average payment
per signature transaction decline 42 percent after October 1, 2011, and the average payment per
and incentives for exempt issuers, while PIN networks kept payments and incentives for exempt
issuers essentially unchanged. The average payment per signature transaction for exempt issuers
rose 20 percent, from 1.5 cents in the January-September period to 1.8 cents in the October to
December period. The average payment per PIN transaction for exempt issuers was 0.4 cents in
both periods.
22
VI. Network Fees
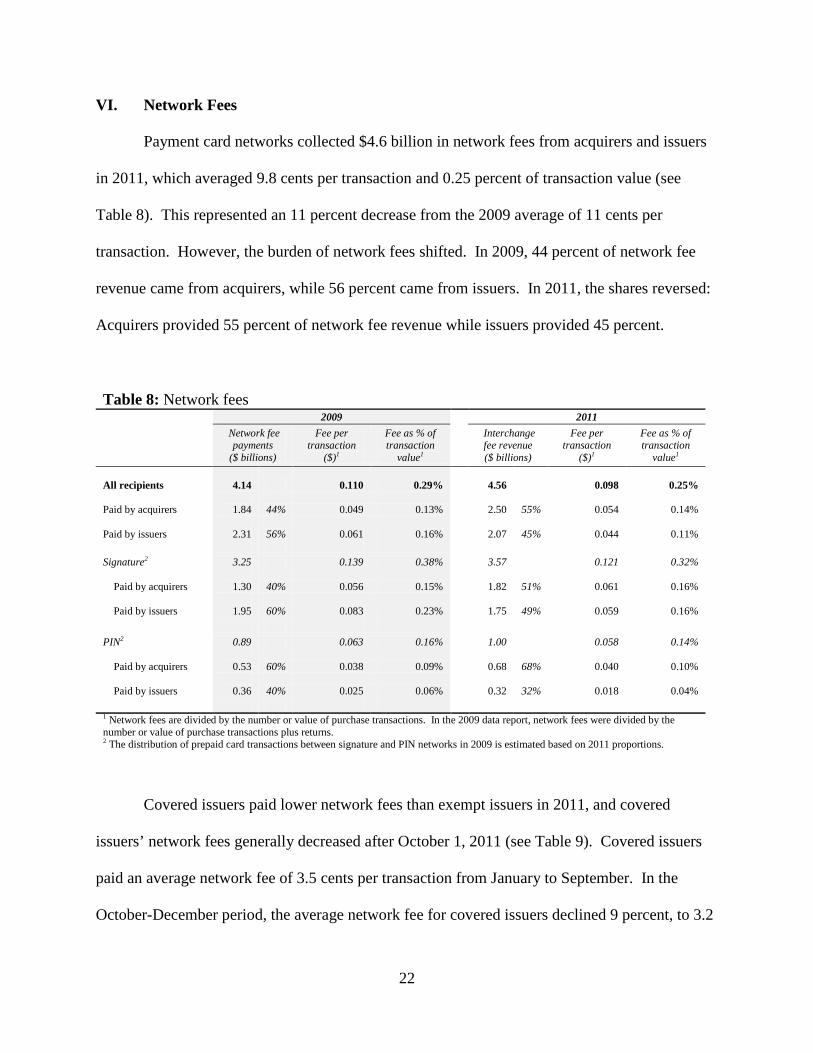
Payment card networks collected $4.6 billion in network fees from acquirers and issuers
in 2011, which averaged 9.8 cents per transaction and 0.25 percent of transaction value (see
Table 8). This represented an 11 percent decrease from the 2009 average of 11 cents per
transaction. However, the burden of network fees shifted. In 2009, 44 percent of network fee
revenue came from acquirers, while 56 percent came from issuers. In 2011, the shares reversed:
Acquirers provided 55 percent of network fee revenue while issuers provided 45 percent.
Table 8: Network fees
2009 2011 Network fee
payments ($ billions)
Fee per transaction
($)1
Fee as % of transaction
value1
Interchange fee revenue ($ billions)
Fee per transaction
($)1
Fee as % of transaction
value1
All recipients
4.14 0.110 0.29%
4.56
0.098 0.25%
Paid by acquirers
1.84 44% 0.049 0.13%
2.50 55% 0.054 0.14%
Paid by issuers
2.31 56% 0.061 0.16%
2.07 45% 0.044 0.11%
Signature2 3.25 0.139 0.38%
3.57
0.121 0.32%
Paid by acquirers
1.30 40% 0.056 0.15%
1.82 51% 0.061 0.16%
Paid by issuers
1.95 60% 0.083 0.23%
1.75 49% 0.059 0.16%
PIN2 0.89 0.063 0.16%
1.00
0.058 0.14%
Paid by acquirers
0.53 60% 0.038 0.09%
0.68 68% 0.040 0.10%
Paid by issuers
0.36 40% 0.025 0.06%
0.32 32% 0.018 0.04%
1 Network fees are divided by the number or value of purchase transactions. In the 2009 data report, network fees were divided by the number or value of purchase transactions plus returns. 2 The distribution of prepaid card transactions between signature and PIN networks in 2009 is estimated based on 2011 proportions.
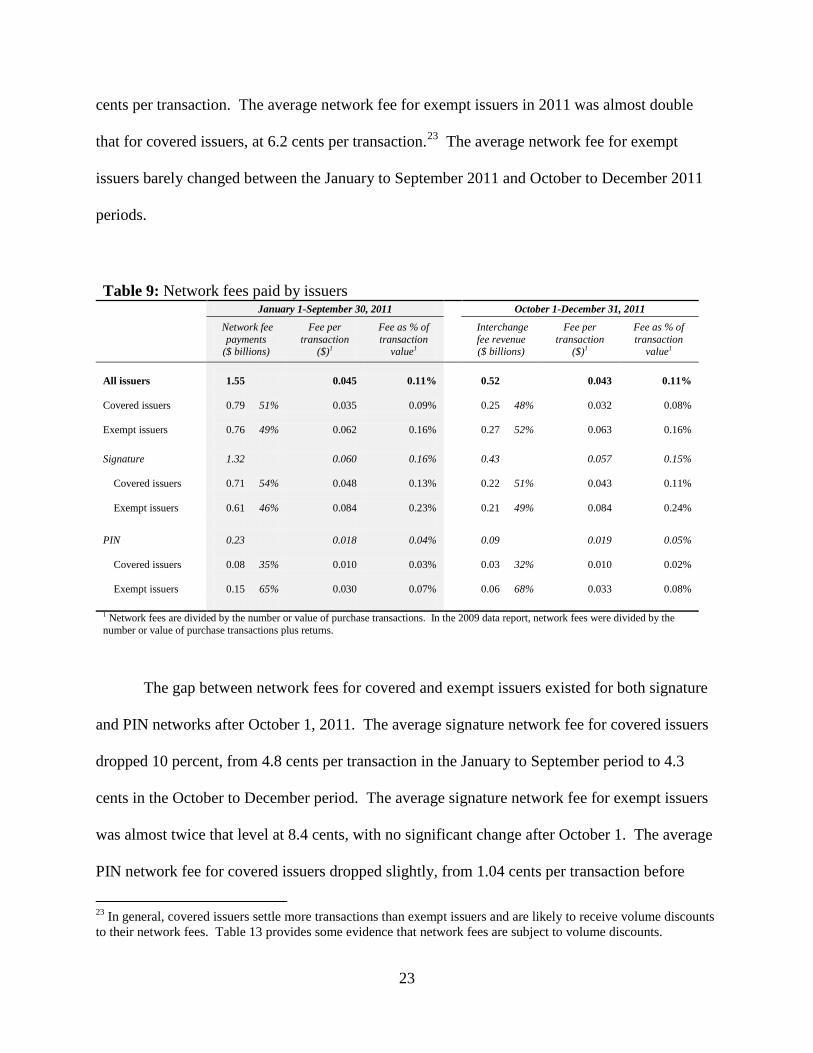
Covered issuers paid lower network fees than exempt issuers in 2011, and covered
issuers’ network fees generally decreased after October 1, 2011 (see Table 9). Covered issuers
paid an average network fee of 3.5 cents per transaction from January to September. In the
October-December period, the average network fee for covered issuers declined 9 percent, to 3.2
23
cents per transaction. The average network fee for exempt issuers in 2011 was almost double
that for covered issuers, at 6.2 cents per transaction.23 The average network fee for exempt
issuers barely changed between the January to September 2011 and October to December 2011
periods.
Table 9: Network fees paid by issuers
January 1-September 30, 2011 October 1-December 31, 2011
Network fee payments
($ billions)
Fee per transaction
($)1
Fee as % of transaction
value1
Interchange fee revenue ($ billions)
Fee per transaction
($)1
Fee as % of transaction
value1
All issuers
1.55 0.045 0.11%
0.52
0.043 0.11%
Covered issuers
0.79 51% 0.035 0.09%
0.25 48% 0.032 0.08%
Exempt issuers
0.76 49% 0.062 0.16%
0.27 52% 0.063 0.16%
Signature 1.32 0.060 0.16%
0.43
0.057 0.15%
Covered issuers
0.71 54% 0.048 0.13%
0.22 51% 0.043 0.11%
Exempt issuers
0.61 46% 0.084 0.23%
0.21 49% 0.084 0.24%
PIN 0.23 0.018 0.04%
0.09
0.019 0.05%
Covered issuers
0.08 35% 0.010 0.03%
0.03 32% 0.010 0.02%
Exempt issuers
0.15 65% 0.030 0.07%
0.06 68% 0.033 0.08%
1 Network fees are divided by the number or value of purchase transactions. In the 2009 data report, network fees were divided by the number or value of purchase transactions plus returns.
The gap between network fees for covered and exempt issuers existed for both signature
and PIN networks after October 1, 2011. The average signature network fee for covered issuers
dropped 10 percent, from 4.8 cents per transaction in the January to September period to 4.3
cents in the October to December period. The average signature network fee for exempt issuers
was almost twice that level at 8.4 cents, with no significant change after October 1. The average
PIN network fee for covered issuers dropped slightly, from 1.04 cents per transaction before
23 In general, covered issuers settle more transactions than exempt issuers and are likely to receive volume discounts to their network fees. Table 13 provides some evidence that network fees are subject to volume discounts.
24
October 1 to 1.0 cent after. The average PIN network fee for exempt issuers increased 10
percent, from 3.0 cents per transaction to 3.3 cents per transaction. Although both payments and
incentives and network fees decreased for covered issuers, the decrease in payments and
incentives exceeded the decrease in network fees.
VII. Covered Issuer Fraud Losses
Fraud losses per transaction declined slightly from 2009 to 2011. Using responses from
covered issuers and networks, the Board estimates that industry wide fraud losses to all parties of
debit card transactions totaled approximately $1.38 billion in 2011.24 About $1.13 billion of
these estimated losses arose from signature debit card transactions, $204 million arose from PIN
debit card transactions, and $51 million arose from prepaid card transactions. The overall
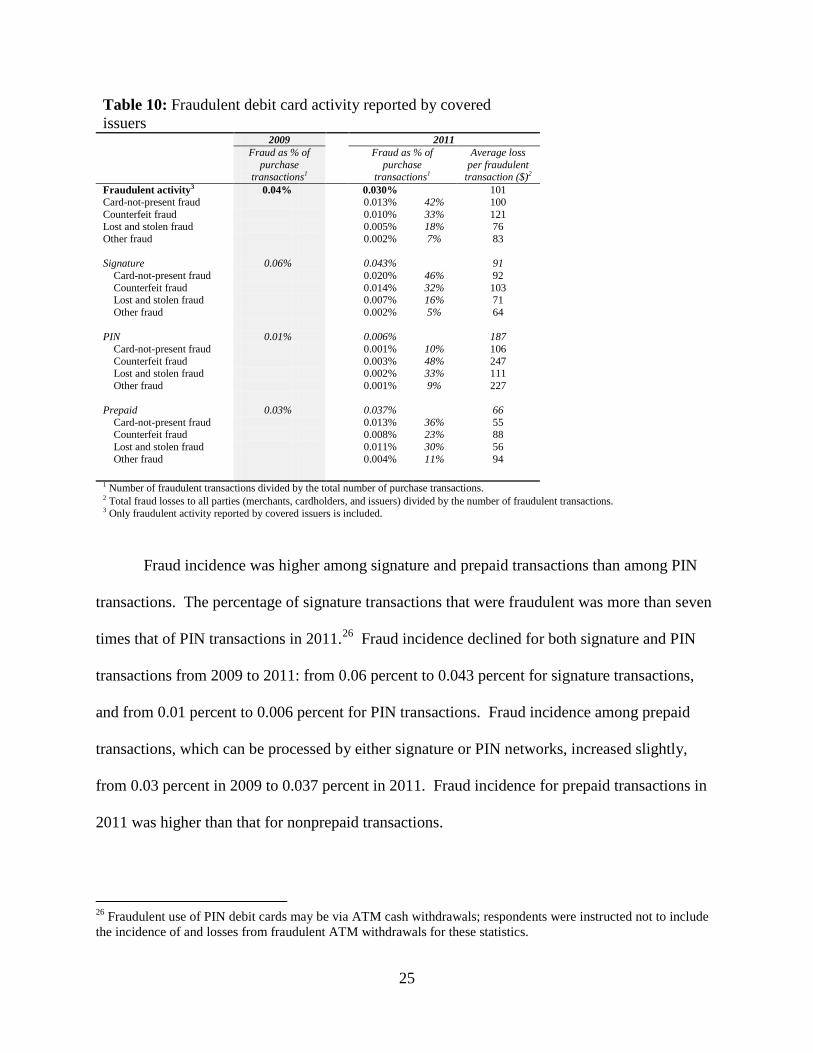
incidence of fraudulent debit card transactions among covered issuers fell from 0.04 percent of
all purchase transactions in 2009 to 0.03 percent in 2011 (see Table 10). Card-not-present fraud
was the most common type of debit card fraud (42 percent of fraudulent transactions), followed
by counterfeit fraud.25 The overall incidence of fraud and the distribution of fraud by type
differed between signature, PIN, and prepaid transactions.
24 Industry-wide fraud losses were extrapolated from data reported in the issuer and network surveys. Of the 131 issuers that responded to the issuer survey, 87 issuers provided data on total fraud losses related to their electronic debit card transactions by authorization method. These issuers reported $827 million in total fraud losses to all parties to card transactions and represented 90 percent of the total transactions reported by covered issuers. 25 From the 2009 debit card issuer survey, the most commonly reported and highest cost fraud types were counterfeit card fraud; lost and stolen card fraud; and card-not-present fraud. (i.e. mail, telephone and Internet order fraud). The 2011 survey asked debit card issuers to report, in addition to the overall incidence and losses to various parties for all fraudulent debit card transactions, the incidence and losses to various parties for each of these types of fraudulent debit card transactions.
25
Table 10: Fraudulent debit card activity reported by covered issuers
2009 2011 Fraud as % of purchase
transactions1
Fraud as % of purchase
transactions1
Average loss per fraudulent
transaction ($)2 Fraudulent activity3 0.04%
0.030%
101
Card-not-present fraud
0.013% 42% 100 Counterfeit fraud
0.010% 33% 121
Lost and stolen fraud
0.005% 18% 76 Other fraud
0.002% 7% 83
Signature 0.06%
0.043%
91 Card-not-present fraud
0.020% 46% 92
Counterfeit fraud
0.014% 32% 103 Lost and stolen fraud
0.007% 16% 71
Other fraud
0.002% 5% 64
PIN 0.01%
0.006%
187 Card-not-present fraud
0.001% 10% 106
Counterfeit fraud
0.003% 48% 247 Lost and stolen fraud
0.002% 33% 111
Other fraud
0.001% 9% 227
Prepaid 0.03%
0.037%
66 Card-not-present fraud
0.013% 36% 55
Counterfeit fraud
0.008% 23% 88 Lost and stolen fraud
0.011% 30% 56
Other fraud
0.004% 11% 94 1 Number of fraudulent transactions divided by the total number of purchase transactions.
2 Total fraud losses to all parties (merchants, cardholders, and issuers) divided by the number of fraudulent transactions. 3 Only fraudulent activity reported by covered issuers is included.
Fraud incidence was higher among signature and prepaid transactions than among PIN
transactions. The percentage of signature transactions that were fraudulent was more than seven
times that of PIN transactions in 2011.26 Fraud incidence declined for both signature and PIN
transactions from 2009 to 2011: from 0.06 percent to 0.043 percent for signature transactions,
and from 0.01 percent to 0.006 percent for PIN transactions. Fraud incidence among prepaid
transactions, which can be processed by either signature or PIN networks, increased slightly,
from 0.03 percent in 2009 to 0.037 percent in 2011. Fraud incidence for prepaid transactions in
2011 was higher than that for nonprepaid transactions.
26 Fraudulent use of PIN debit cards may be via ATM cash withdrawals; respondents were instructed not to include the incidence of and losses from fraudulent ATM withdrawals for these statistics.
26
Covered issuers reported card-not-present fraud as the most common type of fraudulent
signature transaction and counterfeit fraud as the most common type of fraudulent PIN
transaction. Because more than 95 percent of card-not-present transactions are processed over
signature networks, card-not-present fraud was a much more common fraud type among
signature transactions (46 percent of fraudulent signature transactions) than among PIN
of fraudulent PIN debit transactions and 32 percent of fraudulent signature transactions. Lost
and stolen fraud was a more significant type of fraudulent transaction for PIN than for signature,
representing 33 percent of fraudulent PIN transactions but only 16 percent of fraudulent
signature transactions.
Covered issuers reported that 7 percent of fraudulent debit transactions did not fit in the
three categories mentioned above. Respondents were asked to identify what types of fraud were
included in this “other” category. The most common response was account takeover fraud.
Other types of fraudulent transactions that were mentioned were those related to data breaches,
fraudulent merchants, and “friendly” or “family” fraud, which usually involves associates of a
cardholder inappropriately using the card.
The loss to all parties (issuer, merchant, and cardholder) per fraudulent transaction
averaged $101 in 2011.27 The average loss per fraudulent transaction was much higher for PIN
fraud ($187) than for signature fraud ($91), possibly reflecting the fact that fraudulent PIN
27 The average loss to all parties per fraudulent transaction is the gross value of fraudulent transactions divided by the number of fraudulent transactions for a particular transaction type. The vast majority of all fraud losses are absorbed by issuers, merchants and cardholders. The data presented on merchant fraud losses assumes that acquirers pass on to merchants virtually all of the fraud losses that issuers charged back to acquirers. Data were not collected on fraud losses absorbed by networks, which are assumed to be negligible.
27
transactions may involve cash back. The average loss per fraudulent prepaid card transaction
was $66.
For all transaction types, the average loss per purchase transaction was about 3 cents, and
represented about 8 basis points of transaction value in 2011, representing a slight decrease from
what was reported in 2009, 4 cents and 9 basis points, respectively (see Table 11).28 For
signature debit, the average loss per purchase transaction was 4 cents in 2011, down from 5 cents
in 2009, and represented about 11 basis points of transaction value in 2011, down from 13 basis
points in 2009. For PIN debit, the average loss per transaction was 1 cent, or about 3 basis points
of transaction value in 2011. This was essentially unchanged from 2009. For prepaid, the
average loss per transaction was about 2 cents, and represented about 7 basis points of
transaction value in 2011. Both were higher than their 2009 values of 1 cent and 4 basis points,
respectively.
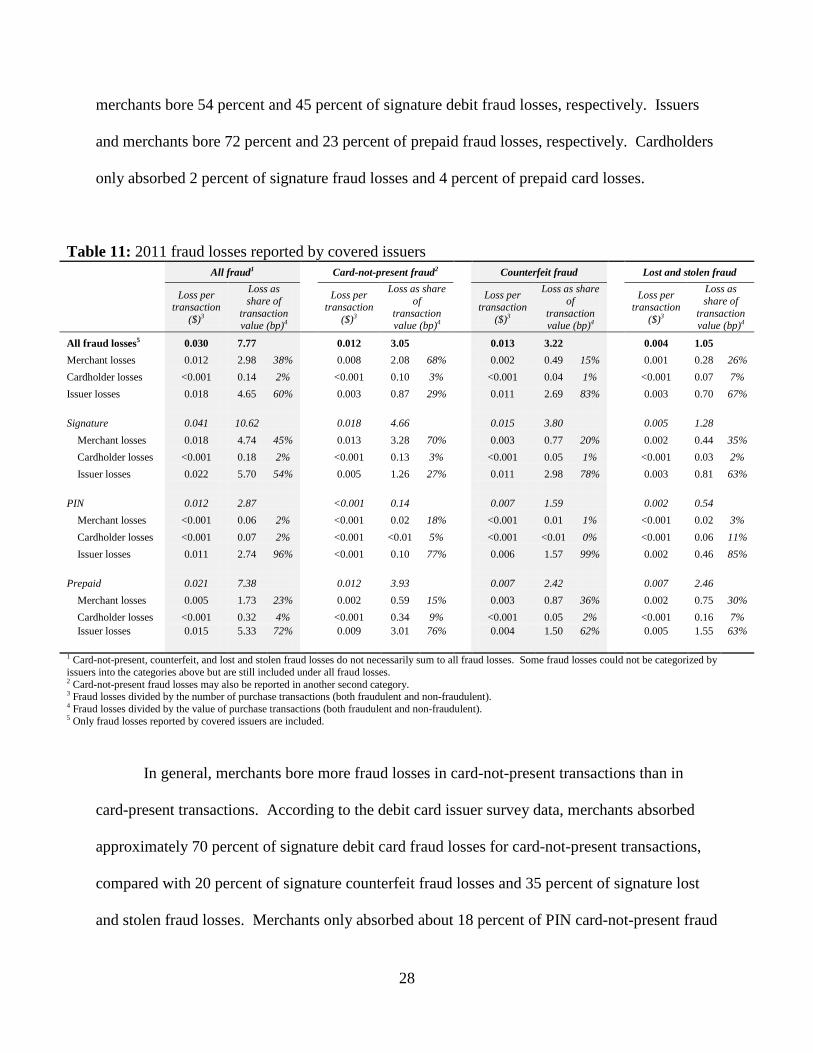
Across all types of transactions, in 2011, 60 percent of reported fraud losses were borne
by issuers, 38 percent were borne by merchants, and 2 percent were borne by cardholders. This
breakout was roughly in line with what was reported in 2009.29 The distribution of fraud losses
among issuers, merchants, and cardholders differed based on the authentication method used in a
debit card transaction. Covered issuers reported that they bore nearly all the fraud losses (96
percent) associated with PIN debit card transactions, with merchants and cardholders absorbing
only 2 percent each. In contrast, reported fraud losses were distributed more evenly between
issuers and merchants for signature debit and prepaid card transactions. Specifically, issuers and
28 Respondents were asked to report the gross value of fraudulent transactions and allocate those losses absorbed by issuers and cardholders, and fraud losses charged back to merchant acquirers. In the 2009 card issuer survey, respondents were only asked to break out fraud losses between acquirers and issuers. 29 The 2009 report did not break out the shares of cardholders and represented only the relative fraction of losses for issuers and merchants. Thus, the 2011 and 2009 numbers are not directly comparable.
28
merchants bore 54 percent and 45 percent of signature debit fraud losses, respectively. Issuers
and merchants bore 72 percent and 23 percent of prepaid fraud losses, respectively. Cardholders
only absorbed 2 percent of signature fraud losses and 4 percent of prepaid card losses.
In general, merchants bore more fraud losses in card-not-present transactions than in
card-present transactions. According to the debit card issuer survey data, merchants absorbed
approximately 70 percent of signature debit card fraud losses for card-not-present transactions,
compared with 20 percent of signature counterfeit fraud losses and 35 percent of signature lost
and stolen fraud losses. Merchants only absorbed about 18 percent of PIN card-not-present fraud
Table 11: 2011 fraud losses reported by covered issuers
All fraud1 Card-not-present fraud2 Counterfeit fraud Lost and stolen fraud
Loss per transaction
($)3
Loss as share of
transaction value (bp)4
Loss per
transaction ($)3
Loss as share of
transaction value (bp)4
Loss per
transaction ($)3
Loss as share of
transaction value (bp)4
Loss per
transaction ($)3
Loss as share of
transaction value (bp)4
All fraud losses5 0.030 7.77
0.012 3.05
0.013 3.22
0.004 1.05 Merchant losses 0.012 2.98 38%
0.008 2.08 68%
0.002 0.49 15%
0.001 0.28 26%
Cardholder losses <0.001 0.14 2%
<0.001 0.10 3%
<0.001 0.04 1%
<0.001 0.07 7% Issuer losses 0.018 4.65 60%
0.003 0.87 29%
0.011 2.69 83%
0.003 0.70 67%
Signature 0.041 10.62
0.018 4.66
0.015 3.80
0.005 1.28 Merchant losses 0.018 4.74 45%
0.013 3.28 70%
0.003 0.77 20%
0.002 0.44 35%
Cardholder losses <0.001 0.18 2%
<0.001 0.13 3%
<0.001 0.05 1%
<0.001 0.03 2% Issuer losses 0.022 5.70 54%
0.005 1.26 27%
0.011 2.98 78%
0.003 0.81 63%
PIN 0.012 2.87
<0.001 0.14
0.007 1.59
0.002 0.54 Merchant losses <0.001 0.06 2%
<0.001 0.02 18%
<0.001 0.01 1%
<0.001 0.02 3%
Cardholder losses <0.001 0.07 2%
<0.001 <0.01 5%
<0.001 <0.01 0%
<0.001 0.06 11% Issuer losses 0.011 2.74 96%
<0.001 0.10 77%
0.006 1.57 99%
0.002 0.46 85%
Prepaid 0.021 7.38
0.012 3.93
0.007 2.42
0.007 2.46 Merchant losses 0.005 1.73 23%
0.002 0.59 15%
0.003 0.87 36%
0.002 0.75 30%
Cardholder losses <0.001 0.32 4%
<0.001 0.34 9%
<0.001 0.05 2%
<0.001 0.16 7% Issuer losses 0.015 5.33 72%
0.009 3.01 76%
0.004 1.50 62%
0.005 1.55 63%
1 Card-not-present, counterfeit, and lost and stolen fraud losses do not necessarily sum to all fraud losses. Some fraud losses could not be categorized by issuers into the categories above but are still included under all fraud losses. 2 Card-not-present fraud losses may also be reported in another second category. 3 Fraud losses divided by the number of purchase transactions (both fraudulent and non-fraudulent). 4 Fraud losses divided by the value of purchase transactions (both fraudulent and non-fraudulent). 5 Only fraud losses reported by covered issuers are included.
29
losses. There are, however, very few card-not-present PIN transactions reported. On the other
hand, issuers absorbed most of the losses associated with card-present transactions. Regardless
of the authentication method used, issuers absorbed approximately 83 percent of counterfeit
fraud losses and 67 percent of lost and stolen fraud losses.
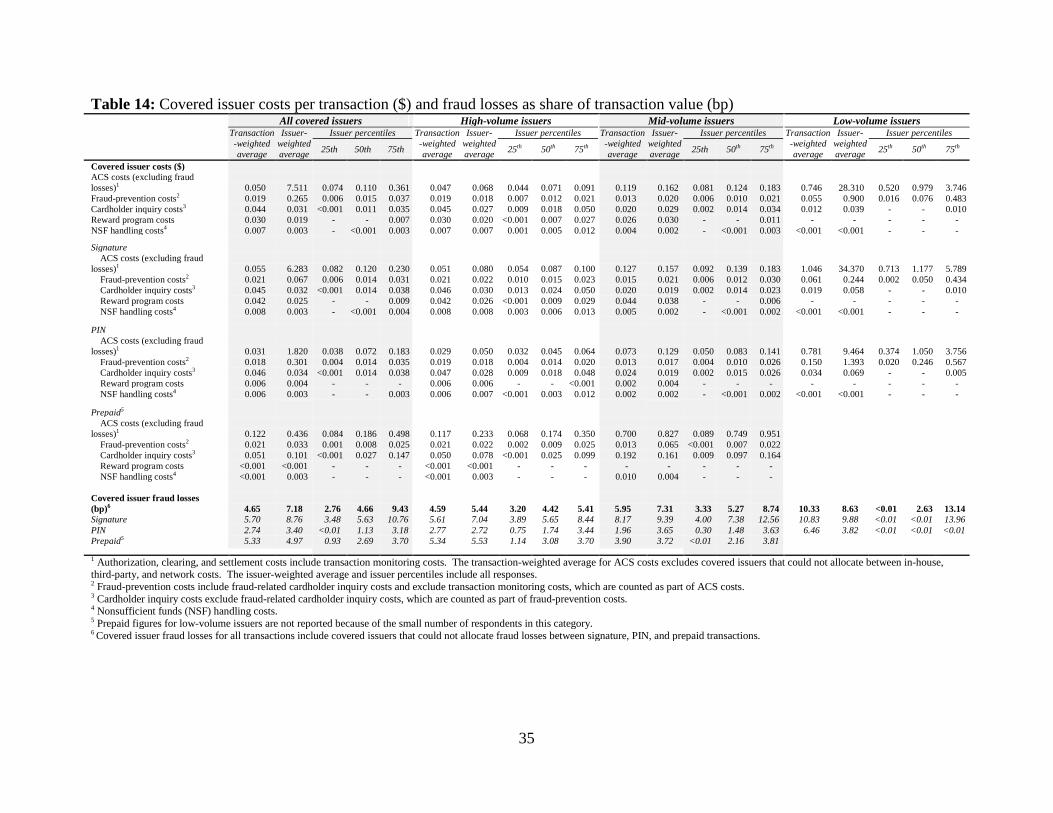
The transaction-weighted average issuer fraud loss in 2011 was 4.65 basis points, and the
median issuer’s average fraud loss was 4.66 basis points (see Table 14). Issuer fraud losses
were greater, on average, for signature transactions than for PIN transactions, averaging 5.7 basis
points and 2.74 basis points, respectively. Average prepaid losses were 5.33 basis points per
transaction.
VIII. Covered Issuer Costs of Authorization, Clearing, and Settlement (Excluding Fraud
Losses)
Authorization, clearing, and settlement (ACS) costs vary widely across covered issuers
(those with consolidated assets of $10 billion or more as of year-end 2011).30 In particular,
covered issuers with the highest debit card transaction volume tend to have much lower costs per
transaction than covered issuers with smaller debit card transaction volume. ACS costs were
generally lower for PIN transactions than for signature and prepaid transactions in 2011.
Meanwhile, the distribution of ACS costs between in-house costs, third-party processing fees,
and network fees differed between signature, PIN, and prepaid transactions.31
30 The costs of authorization, clearing, and settlement include transactions-monitoring costs, in-house costs, third-party processing fees, and network processing fees. Issuers were instructed not to include costs related to corporate overhead, account relationships, rewards programs, non-sufficient funds handling, non-sufficient funds losses, cardholder inquiries, card production and delivery, fraud-prevention costs that are not incurred as part of authorization, fraud losses, costs associated with funds loads (or deposits) or account set-up and maintenance. Issuers were instructed to include costs for purchase transactions, chargebacks, and other non-routine transactions. 31 In-house costs are ACS costs that are not outsourced to third parties and include costs incurred by the card issuer or its affiliated processor (i.e., a processor in the same holding company). Third-party processing fees are fees paid
30
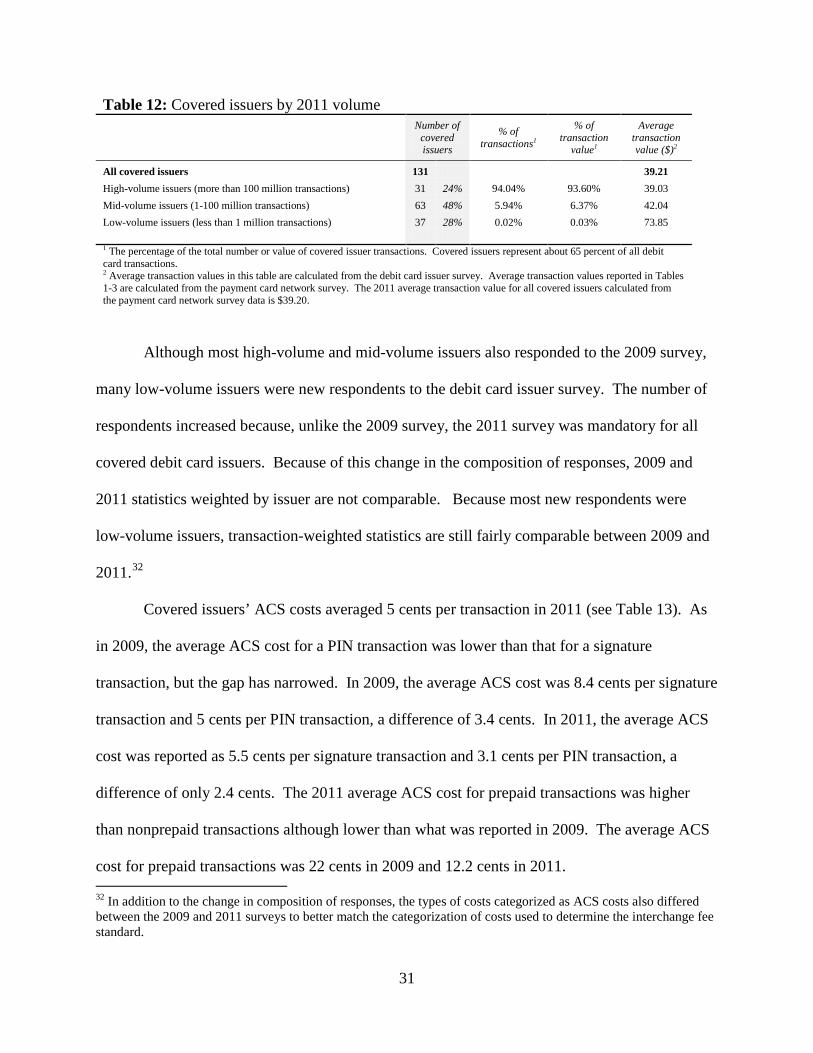
To examine covered issuers’ ACS costs, the Board separated respondents into three tiers
based on transaction volume (see Table 12). Of the 131 issuers that responded to the Board
survey, 31 processed more than 100 million debit card transactions in 2011 (high-volume
issuers). High-volume issuers accounted for about 94 percent of transaction volume and value
reported by covered issuers; they include the largest deposit-taking institutions in the country. In
contrast, 37 of the 131 respondents processed fewer than 1 million debit card transactions in
2011 (low-volume issuers). Low-volume issuers accounted for less than 1 percent of transaction
volume and value reported by covered issuers. Many low-volume issuers are branch operations
of foreign banking organizations. Although affiliated with large institutions, such branches do
not have large U.S. retail banking operations or debit card programs. The remaining 63
respondents each processed between 1 million and 100 million transactions in 2011 (mid-volume
issuers) and represented about 6 percent of the transaction volume and value reported by covered
issuers.
to external service providers for services related to the ACS of debit card transactions that are performed by those service providers on behalf of the debit card issuer. Service providers may include payment card networks or affiliates of payment card networks to the extent that such parties provide optional services related to transaction processing. They do not include other fees charged by a payment card network or an affiliated processor for services that are required for the network processing of transactions. Network processing fees are total fees charged by payment card networks for services that are required for the network processing of transactions and do not include any fees for optional services related to transaction processing that may be provided by a payment card network or an affiliate of a payment card network, or any network fees that are not directly linked to the processing of transactions, such as membership or license fees.
31
Table 12: Covered issuers by 2011 volume
Number of
covered issuers
% of transactions1
% of transaction
value1
Average transaction value ($)2
All covered issuers 131
39.21 High-volume issuers (more than 100 million transactions) 31 24% 94.04% 93.60% 39.03 Mid-volume issuers (1-100 million transactions) 63 48% 5.94% 6.37% 42.04 Low-volume issuers (less than 1 million transactions) 37 28% 0.02% 0.03% 73.85 1 The percentage of the total number or value of covered issuer transactions. Covered issuers represent about 65 percent of all debit card transactions. 2 Average transaction values in this table are calculated from the debit card issuer survey. Average transaction values reported in Tables 1-3 are calculated from the payment card network survey. The 2011 average transaction value for all covered issuers calculated from the payment card network survey data is $39.20.
Although most high-volume and mid-volume issuers also responded to the 2009 survey,
many low-volume issuers were new respondents to the debit card issuer survey. The number of
respondents increased because, unlike the 2009 survey, the 2011 survey was mandatory for all
covered debit card issuers. Because of this change in the composition of responses, 2009 and
2011 statistics weighted by issuer are not comparable. Because most new respondents were
low-volume issuers, transaction-weighted statistics are still fairly comparable between 2009 and
2011.32
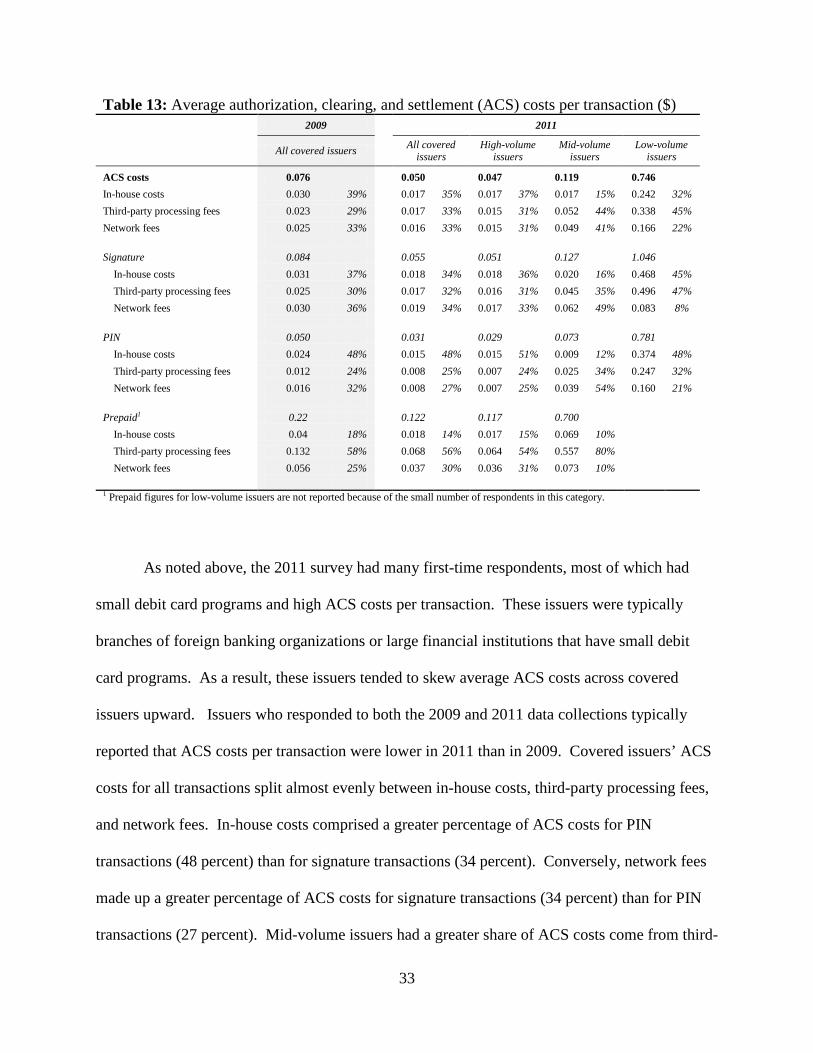
Covered issuers’ ACS costs averaged 5 cents per transaction in 2011 (see Table 13). As
in 2009, the average ACS cost for a PIN transaction was lower than that for a signature
transaction, but the gap has narrowed. In 2009, the average ACS cost was 8.4 cents per signature
transaction and 5 cents per PIN transaction, a difference of 3.4 cents. In 2011, the average ACS
cost was reported as 5.5 cents per signature transaction and 3.1 cents per PIN transaction, a
difference of only 2.4 cents. The 2011 average ACS cost for prepaid transactions was higher
than nonprepaid transactions although lower than what was reported in 2009. The average ACS
cost for prepaid transactions was 22 cents in 2009 and 12.2 cents in 2011. 32 In addition to the change in composition of responses, the types of costs categorized as ACS costs also differed between the 2009 and 2011 surveys to better match the categorization of costs used to determine the interchange fee standard.
32
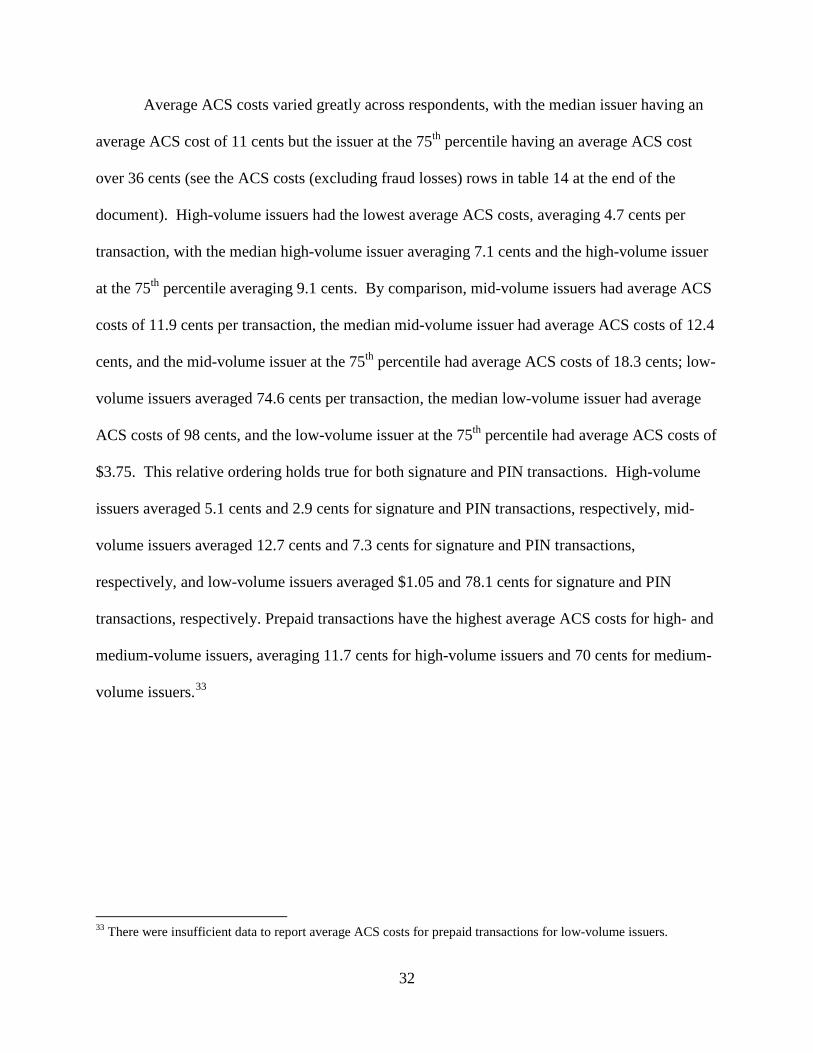
Average ACS costs varied greatly across respondents, with the median issuer having an
average ACS cost of 11 cents but the issuer at the 75th percentile having an average ACS cost
over 36 cents (see the ACS costs (excluding fraud losses) rows in table 14 at the end of the
document). High-volume issuers had the lowest average ACS costs, averaging 4.7 cents per
transaction, with the median high-volume issuer averaging 7.1 cents and the high-volume issuer
at the 75th percentile averaging 9.1 cents. By comparison, mid-volume issuers had average ACS
costs of 11.9 cents per transaction, the median mid-volume issuer had average ACS costs of 12.4
cents, and the mid-volume issuer at the 75th percentile had average ACS costs of 18.3 cents; low-
volume issuers averaged 74.6 cents per transaction, the median low-volume issuer had average
ACS costs of 98 cents, and the low-volume issuer at the 75th percentile had average ACS costs of
$3.75. This relative ordering holds true for both signature and PIN transactions. High-volume
issuers averaged 5.1 cents and 2.9 cents for signature and PIN transactions, respectively, mid-
volume issuers averaged 12.7 cents and 7.3 cents for signature and PIN transactions,
respectively, and low-volume issuers averaged $1.05 and 78.1 cents for signature and PIN
transactions, respectively. Prepaid transactions have the highest average ACS costs for high- and
medium-volume issuers, averaging 11.7 cents for high-volume issuers and 70 cents for medium-
volume issuers.33
33 There were insufficient data to report average ACS costs for prepaid transactions for low-volume issuers.
33
Table 13: Average authorization, clearing, and settlement (ACS) costs per transaction ($)
1 Prepaid figures for low-volume issuers are not reported because of the small number of respondents in this category.
As noted above, the 2011 survey had many first-time respondents, most of which had
small debit card programs and high ACS costs per transaction. These issuers were typically
branches of foreign banking organizations or large financial institutions that have small debit
card programs. As a result, these issuers tended to skew average ACS costs across covered
issuers upward. Issuers who responded to both the 2009 and 2011 data collections typically
reported that ACS costs per transaction were lower in 2011 than in 2009. Covered issuers’ ACS
costs for all transactions split almost evenly between in-house costs, third-party processing fees,
and network fees. In-house costs comprised a greater percentage of ACS costs for PIN
transactions (48 percent) than for signature transactions (34 percent). Conversely, network fees
made up a greater percentage of ACS costs for signature transactions (34 percent) than for PIN
transactions (27 percent). Mid-volume issuers had a greater share of ACS costs come from third-
34
party processing fees and network fees than high-volume issuers. Only 15 percent of mid-volume
issuers’ ACS costs were from in-house costs, compared with 37 percent for high-volume issuers
and 32 percent for low-volume issuers. Low-volume issuers had a lower share of ACS costs
come from network fees than high- and mid-volume issuers. Network fees represented only 22
percent of low-volume issuers’ average ACS costs, compared with 31 percent and 41 percent of
high-volume issuers and mid-volume issuer ACS costs, respectively. For prepaid transactions,
third-party processing fees were a major component of ACS costs, 56 percent overall and almost
80 percent for mid-volume issuers.
IX. Other Covered Issuer Costs
In addition to authorization, clearing, and settlement costs discussed above, debit card
issuers also incur costs for fraud prevention and data security, non-fraud-related cardholder
inquiries, cardholder rewards, and nonsufficient funds handling (see Table 14).34 Fraud-
prevention and data security costs reported in this section include fraud-related cardholder
inquires but do not include transactions monitoring costs tied to authorization. (Transaction
monitoring costs are already included in ACS costs.)35
34 Costs associated with cardholder inquiries include costs associated with cardholder communication with a debit card issuer related to specific debit card transactions, such as inquiries about transactions details, errors, and potential fraudulent activity. These do not include inquiries that are not related to specific debit card transactions, such as account balances, rewards programs, credit card transactions, and ATM transactions. Rewards and other incentives costs are incentive payments given to cardholders as a result of particular debit card transactions. Costs associated with nonsufficient funds handling are the costs of handling of events in which an account does not have enough funds to settle an authorized debit card transaction between the time of authorization of that transaction and the settlement of that transaction. 35 Fraud-prevention and data security costs are costs related to activities aimed at identifying and preventing debit card fraud, costs related to the monitoring of the incidence of, reimbursements received for, and losses incurred from debit card fraud, costs related to responding to suspected and realized debit card fraud in order to prevent or limit losses, costs incurred in securing the data processing and communications infrastructure of debit card operations, and costs incurred in the development or improvement of fraud-prevention technologies.
35
Table 14: Covered issuer costs per transaction ($) and fraud losses as share of transaction value (bp)
All covered issuers High-volume issuers Mid-volume issuers Low-volume issuers Transaction-weighted average
1 Authorization, clearing, and settlement costs include transaction monitoring costs. The transaction-weighted average for ACS costs excludes covered issuers that could not allocate between in-house,
third-party, and network costs. The issuer-weighted average and issuer percentiles include all responses. 2 Fraud-prevention costs include fraud-related cardholder inquiry costs and exclude transaction monitoring costs, which are counted as part of ACS costs. 3 Cardholder inquiry costs exclude fraud-related cardholder inquiry costs, which are counted as part of fraud-prevention costs. 4 Nonsufficient funds (NSF) handling costs. 5 Prepaid figures for low-volume issuers are not reported because of the small number of respondents in this category. 6 Covered issuer fraud losses for all transactions include covered issuers that could not allocate fraud losses between signature, PIN, and prepaid transactions.
36
Fraud-prevention and data security costs averaged 1.9 cents per transaction, with the
median issuer’s average fraud-prevention and data security cost at 1.5 cents. The transaction-
weighted average was highest for low-volume issuers at 5.5 cents per transaction, compared with
1.9 cents for high-volume issuers and 1.3 cents for mid-volume issuers. Fraud-prevention and
data security costs did not vary greatly by whether the transaction was signature, PIN, or prepaid.
Issuers reported a variety of fraud-prevention activities. For example, many cards have
an additional security code, such as a cardholder verification value or code, that is required to be
entered separately at the point of sale from the PIN and the card number. Other fraud-prevention
activities include cardholder education and alert systems to help cardholders be more vigilant at
preventing fraud. Many issuers also noted that they require cardholders to activate their cards
after receiving them to help prevent the use of cards that were stolen from the mail. Finally,
many issuers indicated that they monitor various trends in fraudulent activity and work with
others in the industry to combat new types of fraud.
Costs for non-fraud-related cardholder inquiries averaged 4.4 cents per transaction for all
covered issuers. Cardholder inquiry costs reported in this section only include non-fraud-related
cardholder inquiries that pertain to particular debit card transactions. As noted above, fraud-
related cardholder inquiries are included in the fraud-prevention and data security costs.
Cardholder inquiry costs were highest for high-volume issuers, averaging 4.5 cents per
transaction, and lowest for low-volume issuers at 1.2 cents per transaction. By comparison, mid-
costs did not vary greatly by the type of authentication method used, but were slightly higher for
prepaid transactions (5.1 cents).
37
Cardholder reward costs averaged 3 cents per transaction for all issuers. Reward costs
were significantly higher for signature than PIN, averaging 4.2 cents and 0.6 cents, respectively.
There were virtually no cardholder reward costs for prepaid transactions. Low-volume issuers
typically did not report any cardholder reward costs; there was no noticeable difference between
the average costs for mid- and high-volume issuers.
Nonsufficient funds handling costs averaged 0.7 cents per transaction for all issuers.
Costs for signature debit programs (0.8 cent) were slightly higher than those for PIN debit
programs (0.6 cent) for this category, but were not significant for prepaid transactions or low-
volume issuers.
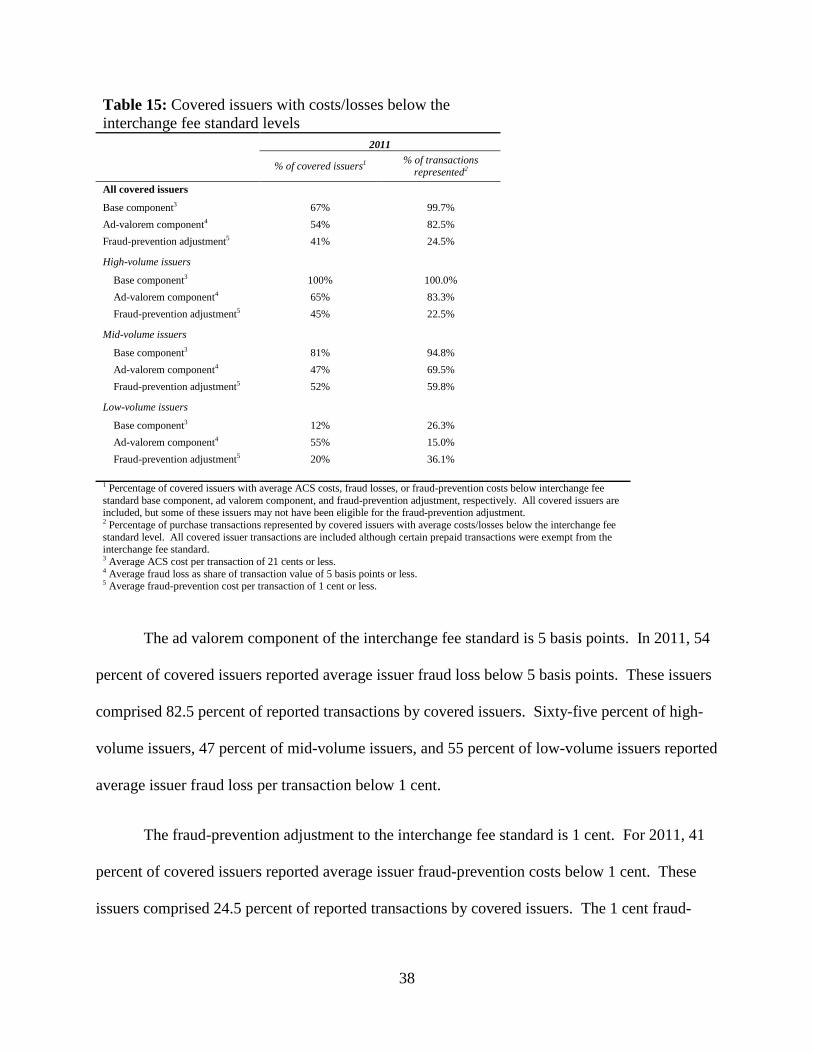
X. Comparison of Covered Issuer ACS Costs with the Interchange Fee Standard
According to covered issuers’ 2011 survey responses, 67 percent of issuers had average
ACS costs below 21 cents, the base component of the interchange fee standard (see Table 15).
These issuers comprised 99.7 percent of all reported covered transactions. All high-volume
issuers reported average ACS costs below 21 cents, while 81 percent of mid-volume issuers and
12 percent of low-volume issuers reported average ACS costs below the 21 cents.
38
Table 15: Covered issuers with costs/losses below the interchange fee standard levels
2011 % of covered issuers1 % of transactions
represented2 All covered issuers Base component3 67% 99.7% Ad-valorem component4 54% 82.5% Fraud-prevention adjustment5 41% 24.5% High-volume issuers Base component3 100% 100.0% Ad-valorem component4 65% 83.3% Fraud-prevention adjustment5 45% 22.5% Mid-volume issuers Base component3 81% 94.8% Ad-valorem component4 47% 69.5% Fraud-prevention adjustment5 52% 59.8% Low-volume issuers Base component3 12% 26.3% Ad-valorem component4 55% 15.0% Fraud-prevention adjustment5 20% 36.1% 1 Percentage of covered issuers with average ACS costs, fraud losses, or fraud-prevention costs below interchange fee
standard base component, ad valorem component, and fraud-prevention adjustment, respectively. All covered issuers are included, but some of these issuers may not have been eligible for the fraud-prevention adjustment. 2 Percentage of purchase transactions represented by covered issuers with average costs/losses below the interchange fee standard level. All covered issuer transactions are included although certain prepaid transactions were exempt from the interchange fee standard. 3 Average ACS cost per transaction of 21 cents or less. 4 Average fraud loss as share of transaction value of 5 basis points or less. 5 Average fraud-prevention cost per transaction of 1 cent or less.
The ad valorem component of the interchange fee standard is 5 basis points. In 2011, 54
percent of covered issuers reported average issuer fraud loss below 5 basis points. These issuers
comprised 82.5 percent of reported transactions by covered issuers. Sixty-five percent of high-
volume issuers, 47 percent of mid-volume issuers, and 55 percent of low-volume issuers reported
average issuer fraud loss per transaction below 1 cent.
The fraud-prevention adjustment to the interchange fee standard is 1 cent. For 2011, 41
percent of covered issuers reported average issuer fraud-prevention costs below 1 cent. These
issuers comprised 24.5 percent of reported transactions by covered issuers. The 1 cent fraud-
39
prevention adjustment was greater than the average fraud-prevention costs of 45 percent of high-
volume issuers, 52 percent of mid-volume issuers, and 20 percent of low-volume issuers.