182

2011 POPULATION AND HOUSING CENSUS
Omusati Regional Profile
Basic Analysis with Highlights
March 2014

Census Indicators, 2011 and
01 Content
Foreword
The first Population and Housing Census in an independent Namibia was conducted in 1991.
Since then, a Census has been undertaken every ten years, and the 2011 Population and Housing
Census marks Namibia’s third census since independence in 1990. The Census is demonstrative
of the Namibia Statistics Agency’s (NSA) commitment to providing relevant and quality statistics
to support decision making, policy formulation and monitoring of development programmes.
This regional profile presents the result of the 2011 Namibia Population and Housing Census for
the Omusati Region. The report provides a wide range of indicators on population
characteristics, household and housing conditions and households enumerated in the region
between 28 August and 15 September 2011. The report further provides detailed information on
age and sex composition, marital status, education, literacy, economic activity, orphan-hood,
fertility and disability. In addition, household size, housing amenities, ownership and the quality
of housing are also presented in this report. All these indicators are provided at regional,
urban/rural and constituency level. It should be noted that internal migration was not possible
to calculate at constituency level. However it was provided at regional level in the 2011 main
census report launched on 27 March 2013, as well as in the Population Atlas released in June
2013.
This regional profile is the fourth in a series of reports to be released based on the 2011 census
data. The first report - released in April 2012 - disseminated provisional results on the
distribution of the population. The second report was the census main report, which presented
more detailed results at national levee; and the third report was the Population Atlas, which
depicts the distribution of the country's population on maps by regions and constituencies.
We thank the Government of the Republic of Namibia for contributing significantly to the
implementation of the 2011 census, as well as our development partners who provided
technical or financial support. We are grateful to everyone who contributed to ensuring that the
2011 census was a success. In particular, we thank UNFPA, the Government of the United States
of America through USAID and Statistics South Africa for their technical support to ensure the
timely completion of census activities. We also thank the census inter-agency technical
committee, line ministries, private institutions, the governor of the region and regional offices,
field staff and the general public for their support, which was pivotal to the success of the 2011
Population & Housing Census.
We are hopeful that the users of this report will find its contents useful for their decision making
and planning purposes, including business investments. Our commitment is to ensure that all
statistics required by our users are readily available.

Census Indicators, 2011 and
01 Content
DR. JOHN STEYTLER STATISTICIAN GENERAL NAMIBIA STATISTICS AGENCY
Census Indicators, 2011 and
01 Content
Contents
List of Acronyms i
Maps ii
Key Indicators by Constituency iii
CHAPTER 1: INTRODUCTION 1
1.1 Background 1
1.2 The 2011 Population and Housing Census 1
1.3 Organization of the Report 2
CHAPTER 2: POPULATION SIZE, STRUCTURE AND COMPOSITION 3
2.1 Population Size and Density 3
2.2 Population Structure and Composition 5
CHAPTER 3: POPULATION CHARACTERISTICS 11
3.1 Marital Status 11
3.2 Citizenship 12
3.3 Namibian Birth Registration 12
CHAPTER 4: POPULATION TRENDS 14
4.1 Population Growth 14
4.2 Fertility 15
4.3 Deaths in the Household 16
CHAPTER 5: SOCIO-ECONOMIC CHARACTERISTICS OF THE POPULATION 19
5.1 Information and Communication Technology 19
5.2 Early Childhood Development 20
5.3 Education and Literacy 21
5.4 Disability 27
5.5 Ophanhood 30
5.6 Economic Activity 31
5.7 Economically Inactive Population 37
Census Indicators, 2011 and
01 Content
CHAPTER 6: HOUSEHOLD CHARACTERISTICS 38
6.1 Household Size 38
6.2 Household Composition 38
6.3 Household Income 40
6.4 Household Assets 41
6.5 Language 42
6.6 Agricultural Activity 43
CHAPTER 7: HOUSING CHARACTERISTICS 44
7.1 Type of Housing 44
7.2 Type of Tenure 46
7.3 Average Number of People Per Room 47
7.4 Type of Materials Used for Construction 47
7.5 Source of Energy 51
7.6 Water Supply and Sanitation 53
7.7 Garbage and Waste Disposal 56
Annex: Glossary of Census Terms 57
Examples of Enumeration Area Map 60
Detailed Census Tables 61


Acronyms
2011 Population and Housing Census Regional Profile, Omusati Region i
LIST OF ACRONYMS
CBS Central Bureau of Statistics
CBR Crude Birth Rate
CDR Crude Death Rate
EA Enumeration Area
ECD Early Childhood Development
ICT Information Communication Technology
MDGs Millennium Development Goals
NDPs National Development Plans
NSA Namibia Statistics Agency
UNFPA United Nations Population Fund
USAID United States Agency for International Development
Maps
2011 Population and Housing Census Regional Profile, Omusati Region ii
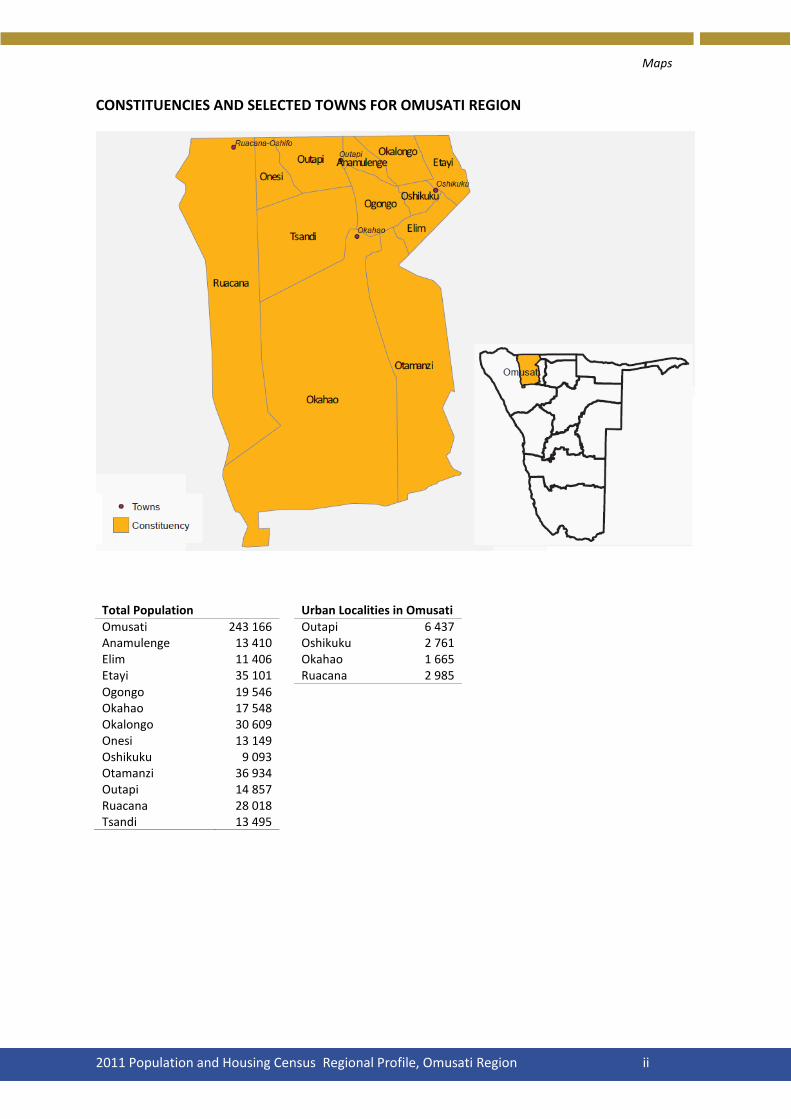
CONSTITUENCIES AND SELECTED TOWNS FOR OMUSATI REGION
Total Population
Urban Localities in Omusati
Omusati 243 166
Outapi 6 437 Anamulenge 13 410
Oshikuku 2 761
Elim 11 406
Okahao 1 665 Etayi 35 101
Ruacana 2 985
Ogongo 19 546 Okahao 17 548 Okalongo 30 609
Onesi 13 149
Oshikuku 9 093
Otamanzi 36 934
Outapi 14 857
Ruacana 28 018
Tsandi 13 495

Census Indicators, 2011 and 2001
tors, 2011 ansus Indicators, 2011 a01
2011 Population and Housing Census Regional Profile, Omusati Region iii
Omusati Region – Census Selected Indicators, 2011 and 2001 2011 2001 2011 2001
Population Size Literacy rate, 15+ years, % 88 84 Total 243 166 228 842 Females 133 621 126 368 Education, 15+ years, %
Males 109 545 102 473 Never attended school 13 17
Currently at school 23 24
Annual growth rate (%) 0.6 1.5 Left school 60 56 Percent in Urban/Rural areas 1 Labour force, 15+ years, % Urban 6 99 In labour force 49 38 Rural 94 Employed 58 65 Unemployed 42 35 Sex ratio: Males per 100 females 82 81 Outside labour force 43 59 Population density Student 50 31 People per sq. km. 9.2 9 Homemaker 13 49 Retired, too old, etc. 37 19 Age composition, % Under 5 years 14 13 Housing conditions, % 5 – 14 years 26 31 Households with 15 – 59 years 49 45 Safe water 52 83 60+ years 11 9 No toilet facility 78 83 Electricity for lighting 10 4 Access to radio 71 75 Marital status: 15+ years, % Wood/charcoal for cooking 88 93 Never married 65 61
Married with certificate 20 19 Main source of income, %
Married traditionally 6 8 Household main income Married consensually 3 4 Farming 22 45 Divorced/Separated 2 3 Wages & Salaries 25 16 Widowed 5 5 Cash remittance 5 6 Business, non-farming 10 7 Citizenship, % Pension 31 22 Namibian 98 98 Non-Namibian 2 2
Disability, % Main language spoken at home, With disability 6.3 6
Percent of households
Oshiwambo languages 96
95
Private households Number 46698 38 202 Average size 5.2 5.9 Head of household, % Females 55 62 Males 45 38
Note: ‘Not stated’ and ‘Don’t know’ were not imputed in 2001 census

Census Indicators, 2011 and 2001
tors, 2011 ansus Indicators, 2011 a01
2011 Population and Housing Census Regional Profile, Omusati Region iv
Anamulenge – Census Selected Indicators, 2011 and 2001 2011 2001 2011 2001
Population Size
Labour force, 15+ years, % 52 38 Total 13 410 12 617 In labour force Females 7 512 6 989 Employed 63 88 Males 5 898 5 628 Unemployed 37 12 Sex ratio: Males per 100 females 79 81 Outside labour force 42 58 Student 53 24 Age composition, % Homemaker 9 57 Under 5 years 14 12 Retired, too old, etc. 38 19 5 – 14 years 27 31 15 – 59 years 49 46 Housing conditions, % 60+ years 10 9 Households with Safe water 48 81 Marital status: 15+ years, % No toilet facility 73 75 Never married 67 64 Electricity for lighting 13 5 Married with certificate 20 21 Access to radio 71 77 Married traditionally 3 5 Wood/charcoal for cooking 88 93 Married consensually 3 3 Divorced/Separated 1 2 Main source of income, % Widowed 6 5 Household main income
Farming 35 41
Wages & Salaries 22 18 Private households
Cash remittance 5 6
Number 2340 1 870 Business, non-farming 9 9 Average size 5.7 6.7 Pension 25 23 Head of household, % Females 56 60 Disability, % Males 44 40 With disability 7 7
Literacy rate, 15+ years, % 90 86
Education, 15+ years, % Never attended school 11 16 Currently at school 25 23 Left school 62 59

Census Indicators, 2011 and 2001
tors, 2011 ansus Indicators, 2011 a01
2011 Population and Housing Census Regional Profile, Omusati Region v
Elim – Census Selected Indicators, 2011 and 2001 2011 2001 2011 2001
Population Size Labour force, 15+ years, % Total 11 406 10 850 In labour force 50 24 Females 6 308 6 109 Employed 67 58 Males 5 098 4 741 Unemployed 33 42 Sex ratio: Males per 100 females 81 78 Outside labour force 47 74 Student 48 31 Age composition, % Homemaker 6 54 Under 5 years 12.6 11 Retired, too old, etc. 47 15 5 – 14 years 25 31 15 – 59 years 49 45 Housing conditions, % 60+ years 13 11 Households with Safe water 74 93 Marital status: 15+ years, % No toilet facility 69 74 Never married 64 59 Electricity for lighting 9 1
Married with certificate 23 24
Acess to radio 80 81
Married traditionally
2 4 Wood/charcoal for cooking
72 85
Married consensually 2 2 Divorced/Separated 1 3 Main source of income, % Widowed 7 7 Household main income
Farming 17 43
Wages & Salaries 27 13 Private households Cash remittance 5 6 Number 2 132 1 781 Business, non-farming 5 8 Average size 5.3 6.1 Pension 46 27 Head of household, % Females 58 62 Disability, % Males 42 38 With disability 5 5
Literacy rate, 15+ years, % 92 90
Education, 15+ years, % Never attended school 8 10 Currently at school 24 25 Left school 66 62
Census Indicators, 2011 and 2001
tors, 2011 ansus Indicators, 2011 a01
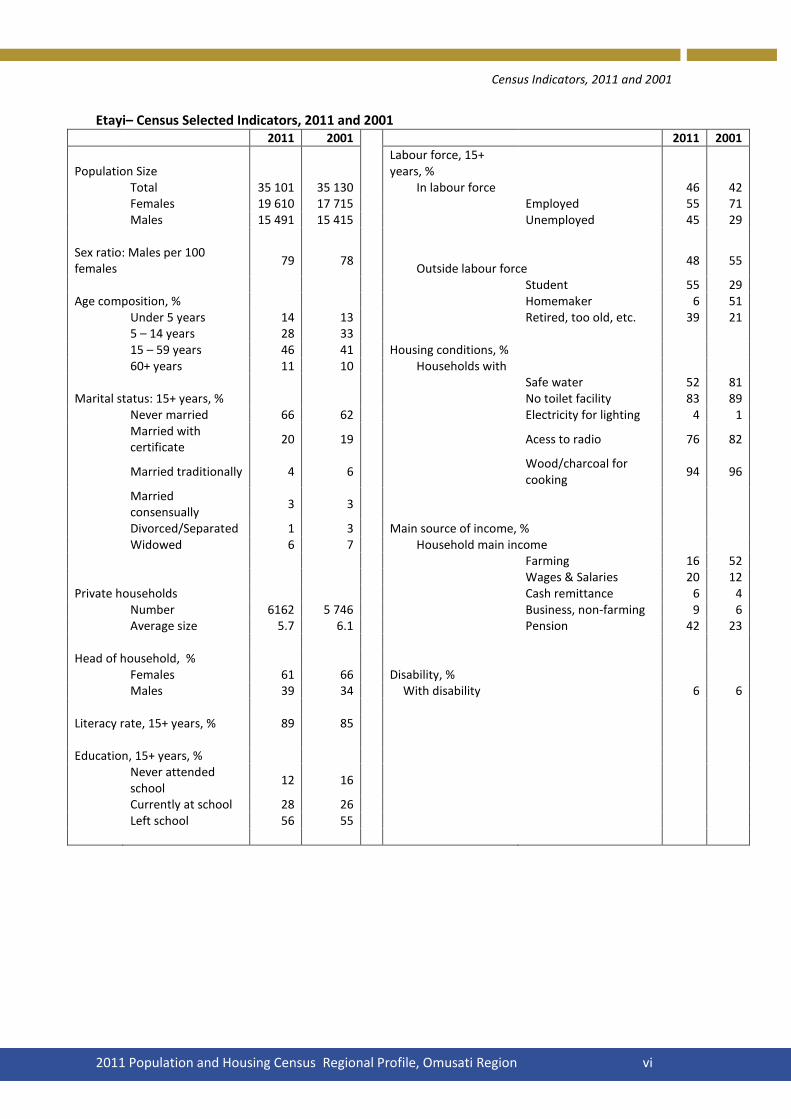
2011 Population and Housing Census Regional Profile, Omusati Region vi
Etayi– Census Selected Indicators, 2011 and 2001 2011 2001 2011 2001
Population Size
Labour force, 15+ years, %
Total 35 101 35 130 In labour force 46 42 Females 19 610 17 715 Employed 55 71 Males 15 491 15 415 Unemployed 45 29 Sex ratio: Males per 100 females
79 78 Outside labour force
48 55
Student 55 29 Age composition, % Homemaker 6 51 Under 5 years 14 13 Retired, too old, etc. 39 21 5 – 14 years 28 33 15 – 59 years 46 41 Housing conditions, % 60+ years 11 10 Households with Safe water 52 81 Marital status: 15+ years, % No toilet facility 83 89 Never married 66 62 Electricity for lighting 4 1
Married with certificate
20 19
Acess to radio 76 82
Married traditionally 4 6
Wood/charcoal for cooking
94 96
Married consensually
3 3
Divorced/Separated 1 3 Main source of income, % Widowed 6 7 Household main income
Farming 16 52
Wages & Salaries 20 12 Private households Cash remittance 6 4 Number 6162 5 746 Business, non-farming 9 6 Average size 5.7 6.1 Pension 42 23 Head of household, % Females 61 66 Disability, % Males 39 34 With disability 6 6 Literacy rate, 15+ years, % 89 85
Education, 15+ years, %
Never attended school
12 16
Currently at school 28 26 Left school 56 55

Census Indicators, 2011 and 2001
tors, 2011 ansus Indicators, 2011 a01
2011 Population and Housing Census Regional Profile, Omusati Region vii
Ogongo– Census Selected Indicators, 2011 and 2001 2011 2001 2011 2001
Population Size Labour force, 15+ years, % Total 19 546 19 611 In labour force 47 45 Females 10 802 10 999 Employed 68 78 Males 8 744 8 612 Unemployed 32 22 Sex ratio: Males per 100 females 81 78 Outside labour force 45 54 Student 46 24 Age composition, % Homemaker 13 58 Under 5 years 14 12 Retired, too old, etc. 41 19 5 – 14 years 26 32 15 – 59 years 48 45 Housing conditions, % 60+ years 12 10 Households with Safe water 49 83 Marital status: 15+ years, % No toilet facility 78 78 Never married 62 60 Electricity for lighting 6 3
Married with certificate
26 22
Acess to radio 78 80
Married traditionally 3 7 Wood/charcoal for cooking 94 94.3 Married consensually 2 3 Divorced/Separated 1 2 Main source of income, % Widowed 6 5 Household main income
Farming 23 32
Wages & Salaries 23 19 Private households Cash remittance 4 11 Number 3 753 3 371 Business, non-farming 9 7 Average size 5.2 5.8 Pension 36 28 Head of household, % Disability, % Females 56 66 With disability 5 5 Males 44 34
Literacy rate, 15+ years, % 90 87
Education, 15+ years, % Never attended school 11 13 Currently at school 23 26 Left school 63 59

Census Indicators, 2011 and 2001
tors, 2011 ansus Indicators, 2011 a01
2011 Population and Housing Census Regional Profile, Omusati Region viii
Okahao – Census Selected Indicators, 2011 and 2001 2011 2001 2011 2001
Population Size Labour force, 15+ years, % Total 17 548 17 751 In labour force 50 38 Females 9 529 9 812 Employed 63 39 Males 8 019 7 939 Unemployed 37 61 Sex ratio: Males per 100 females 84 81 Outside labour force 39 60 Student 43 36 Age composition, % Homemaker 15 36 Under 5 years 13 12 Retired, too old, etc. 42 27 5 – 14 years 24 29 15 – 59 years 51 47 Housing conditions, % 60+ years 12 10 Households with Safe water 52 86 Marital status: 15+ years, % No toilet facility 71 79 Never married 64 61 Electricity for lighting 15 5
Married with certificate
20 19
Acess to radio 67 71
Married traditionally 7 10
Wood/charcoal for cooking
84 91.8
Married consensually 2 3 Divorced/Separated 2 2 Main source of income, % Widowed 5 5 Household main income
Farming 22 43
Wages & Salaries 27 17 Private households Cash remittance 6 7 Number 3 779 3 244 Business, non-farming 9 7 Average size 4.5 5.4 Pension 32 23 Head of household, % Disability, % Females 61 62 With disability 6 7 Males 39 38
Literacy rate, 15+ years, % 84 82
Education, 15+ years, % Never attended school 12 16 Currently at school 19 23 Left school 65 60

Census Indicators, 2011 and 2001
tors, 2011 ansus Indicators, 2011 a01
2011 Population and Housing Census Regional Profile, Omusati Region ix
Okalongo – Census Selected Indicators, 2011 and 2001 2011 2001 2011 2001
Population Size Labour force, 15+ years, % Total 30 609 28 719 In labour force 42 48 Females 17 018 15 992 Employed 53 85 Males 13 591 12 727 Unemployed 47 15 Sex ratio: Males per 100 females 80 80 Outside labour force 47 47 Student 53 32 Age composition, % Homemaker 15 45 Under 5 years 14 14 Retired, too old, etc. 32 23 5 – 14 years 29 34 15 – 59 years 47 41 Housing conditions, % 60+ years 10 9 Households with Safe water 57 90 Marital status: 15+ years, % No toilet facility 82 87 Never married 68 63 Electricity for lighting 57 2
Married with certificate 18 19
Acess to radio 70 76
Married traditionally 6 7 Wood/charcoal for cooking 93 95 Married consensually 1 2 Divorced/Separated 1 3 Main source of income, % Widowed 5 5 Household main income
Farming 20 31
Wages & Salaries 24 18 Private households Cash remittance 5 9 Number 4 889 4 213 Business, non-farming 10 10 Average size 6.2 6.8 Pension 36 29 Head of household, % Disability, % Females 61 64 With disability 6 7 Males 39 36
Literacy rate, 15+ years, % 87 85
Education, 15+ years, % Never attended school 14 21 Currently at school 28 28 Left school 54 47

Census Indicators, 2011 and 2001
tors, 2011 ansus Indicators, 2011 a01
2011 Population and Housing Census Regional Profile, Omusati Region x
Onesi – Census Selected Indicators, 2011 and 2001 2011 2001 2011 2001
Population Size Labour force, 15+ years, % Total 13 149 12 995 In labour force 55 18 Females 7 170 7 040 Employed 41 68 Males 5 979 5 955 Unemployed 59 32 Sex ratio: Males per 100 females 83 85 Outside labour force 40 79 Student 55 27 Age composition, % Homemaker 7 62 Under 5 years 14 14 Retired, too old, etc. 38 11 5 – 14 years 28 30 15 – 59 years 48 46 Housing conditions, % 60+ years 10 8 Households with Safe water 47 73 Marital status: 15+ years, % No toilet facility 80 90 Never married 64 60 Electricity for lighting 8 3
Married with certificate 15 12
Acess to radio 62
69
Married traditionally
11 14 Wood/charcoal for cooking
93 95
Married consensually 5 5 Divorced/Separated 2 3 Main source of income, % Widowed 3 3 Household main income
Farming 44 60
Wages & Salaries 15 10 Private households
Cash remittance 3 4
Number 2 527 2 227 Business, non-farming 13 6 Average size 5.2 5.8 Pension 20 17 Head of household, % Disability, % Females 55 60 With disability 6 6 Males 45 40
Literacy rate, 15+ years, % 83 79
Education, 15+ years, %
Never attended school 18
22
Currently at school 23 22
Left school 55 52

Census Indicators, 2011 and 2001
tors, 2011 ansus Indicators, 2011 a01
2011 Population and Housing Census Regional Profile, Omusati Region xi
Oshikuku – Census Selected Indicators, 2011 and 2001 2011 2001 2011 2001
Population Size Labour force, 15+ years, %
Total 9 093 8 299 In labour force 55 37 Females 5 209 4 747 Employed 58 68 Males 3 884 3 552 Unemployed 42 32 Sex ratio: Males per 100 females 75 75 Outside labour force 38 56 Student 57 36 Age composition, % Homemaker 6 47
Under 5 years
13 11 Retired, too old, etc. 37
17
5 – 14 years 23 29 15 – 59 years 54 47 Housing conditions, % 60+ years 10 8 Households with Safe water 70 91 Marital status: 15+ years, % No toilet facility 80 68
Never married
68 63 Electricity for lighting
28 15
Married with certificate 24 24
Acess to radio 82 85
Married traditionally
1 2 Wood/charcoal for cooking
70 84
Married consensually 2 3 Divorced/Separated 1 1 Main source of income, % Widowed 5 6 Household main income
Farming 11 34
Wages & Salaries 42 25 Private households Cash remittance 4 4
Number
1736 1 357 Business, non-farming
9 14
Average size 5.0 5.9 Pension 30 20 Head of household, % Disability, % Females 58 63 With disability 6 6 Males 42 37
Literacy rate, 15+ years, % 93 86
Education, 15+ years, %
Never attended school
7 8
Currently at school 24 24 Left school 67 63
Census Indicators, 2011 and 2001
tors, 2011 ansus Indicators, 2011 a01
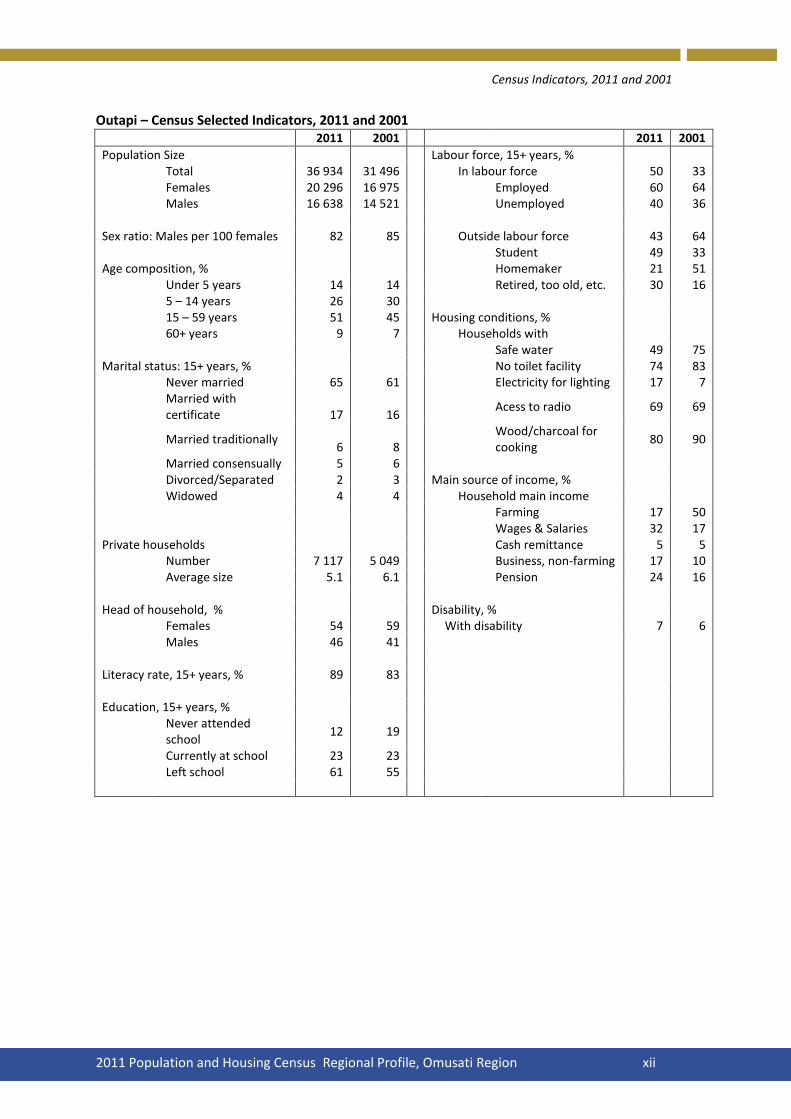
2011 Population and Housing Census Regional Profile, Omusati Region xii
Outapi – Census Selected Indicators, 2011 and 2001 2011 2001 2011 2001
Population Size Labour force, 15+ years, % Total 36 934 31 496 In labour force 50 33 Females 20 296 16 975 Employed 60 64 Males 16 638 14 521 Unemployed 40 36 Sex ratio: Males per 100 females 82 85 Outside labour force 43 64 Student 49 33 Age composition, % Homemaker 21 51 Under 5 years 14 14 Retired, too old, etc. 30 16 5 – 14 years 26 30 15 – 59 years 51 45 Housing conditions, % 60+ years 9 7 Households with Safe water 49 75 Marital status: 15+ years, % No toilet facility 74 83 Never married 65 61 Electricity for lighting 17 7
Married with certificate 17 16
Acess to radio 69 69
Married traditionally
6 8 Wood/charcoal for cooking
80 90
Married consensually 5 6 Divorced/Separated 2 3 Main source of income, % Widowed 4 4 Household main income
Farming 17 50
Wages & Salaries 32 17 Private households Cash remittance 5 5 Number 7 117 5 049 Business, non-farming 17 10 Average size 5.1 6.1 Pension 24 16 Head of household, % Disability, % Females 54 59 With disability 7 6 Males 46 41
Literacy rate, 15+ years, % 89 83
Education, 15+ years, %
Never attended school
12 19
Currently at school 23 23 Left school 61 55
Census Indicators, 2011 and 2001
tors, 2011 ansus Indicators, 2011 a01
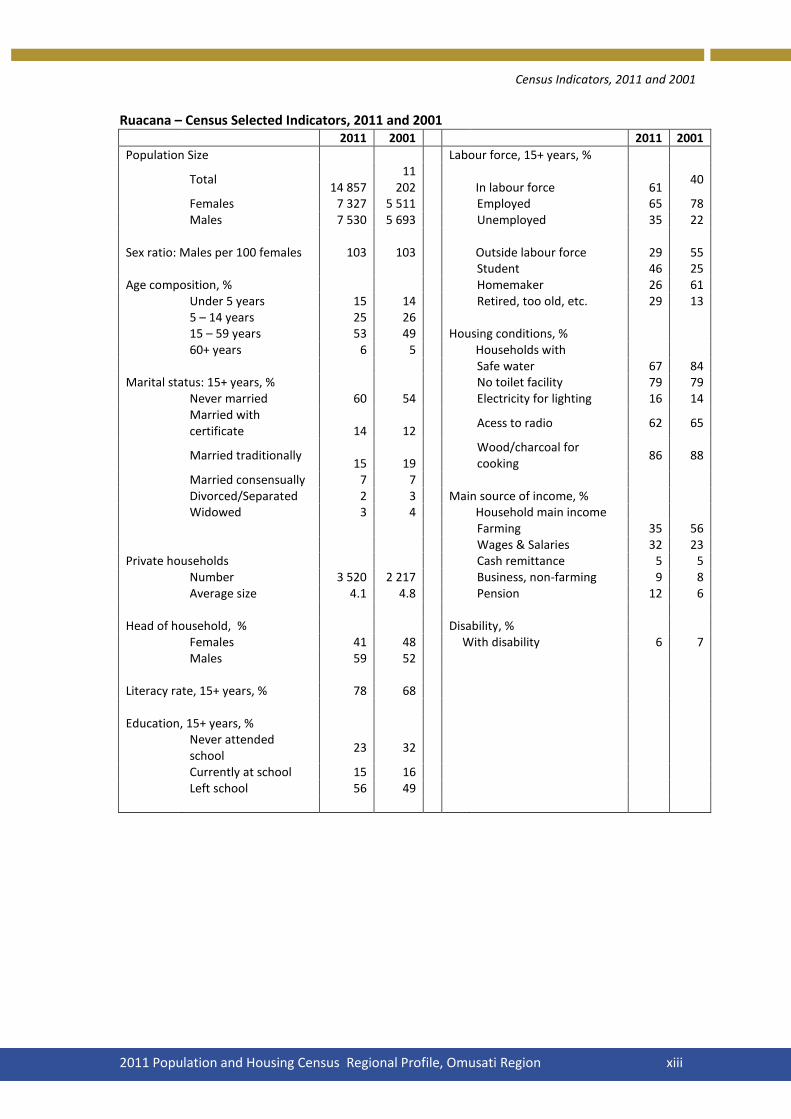
2011 Population and Housing Census Regional Profile, Omusati Region xiii
Ruacana – Census Selected Indicators, 2011 and 2001 2011 2001 2011 2001
Population Size Labour force, 15+ years, %
Total
14 857 11
202 In labour force 61 40
Females 7 327 5 511 Employed 65 78 Males 7 530 5 693 Unemployed 35 22 Sex ratio: Males per 100 females 103 103 Outside labour force 29 55 Student 46 25 Age composition, % Homemaker 26 61 Under 5 years 15 14 Retired, too old, etc. 29 13 5 – 14 years 25 26 15 – 59 years 53 49 Housing conditions, % 60+ years 6 5 Households with Safe water 67 84 Marital status: 15+ years, % No toilet facility 79 79 Never married 60 54 Electricity for lighting 16 14
Married with certificate 14 12
Acess to radio 62 65
Married traditionally
15 19 Wood/charcoal for cooking
86 88
Married consensually 7 7 Divorced/Separated 2 3 Main source of income, % Widowed 3 4 Household main income
Farming 35 56
Wages & Salaries 32 23 Private households Cash remittance 5 5 Number 3 520 2 217 Business, non-farming 9 8 Average size 4.1 4.8 Pension 12 6 Head of household, % Disability, % Females 41 48 With disability 6 7 Males 59 52
Literacy rate, 15+ years, % 78 68
Education, 15+ years, %
Never attended school
23 32
Currently at school 15 16 Left school 56 49

Census Indicators, 2011 and 2001
tors, 2011 ansus Indicators, 2011 a01
2011 Population and Housing Census Regional Profile, Omusati Region xiv
Tsandi – Census Selected Indicators, 2011 and 2001 2011 2001 2011 2001
Population Size Labour force, 15+ years, % Total 28 018 27 049 In labour force 48 45 Females 15 378 15 064 Employed 54 37 Males 12 640 11 984 Unemployed 46 63 Sex ratio: Males per 100 females 82 80 Outside labour force 42 53 Student 45 45 Age composition, % Homemaker 13 30 Under 5 years 14 12 Retired, too old, etc. 41 25 5 – 14 years 25 29 15 – 59 years 49 46 Housing conditions, % 60+ years 13 10 Households with Safe water 47 78 Marital status: 15+ years, % No toilet facility 83 86 Never married 62 61 Electricity for lighting 6 2
Married with certificate 22 20
Acess to radio 67 73
Married traditionally
6 7 Wood/charcoal for cooking
92 96
Married consensually 4 5 Divorced/Separated 2 2 Main source of income, % Widowed 5 5 Household main income
Farming 15 45
Wages & Salaries 26 15 Private households Cash remittance 6 6 Number 5 886 4 808 Business, non-farming 10 5 Average size 4.7 5.6 Pension 38 25 Head of household, % 54 62 Disability, % Females 46 38 With disability 7 7 Males
Literacy rate, 15+ years, % 88 83
Education, 15+ years, %
Never attended school
13 16
Currently at school 21 25 Left school 61 58
Census Indicators, 2011 and 2001
tors, 2011 ansus Indicators, 2011 a01
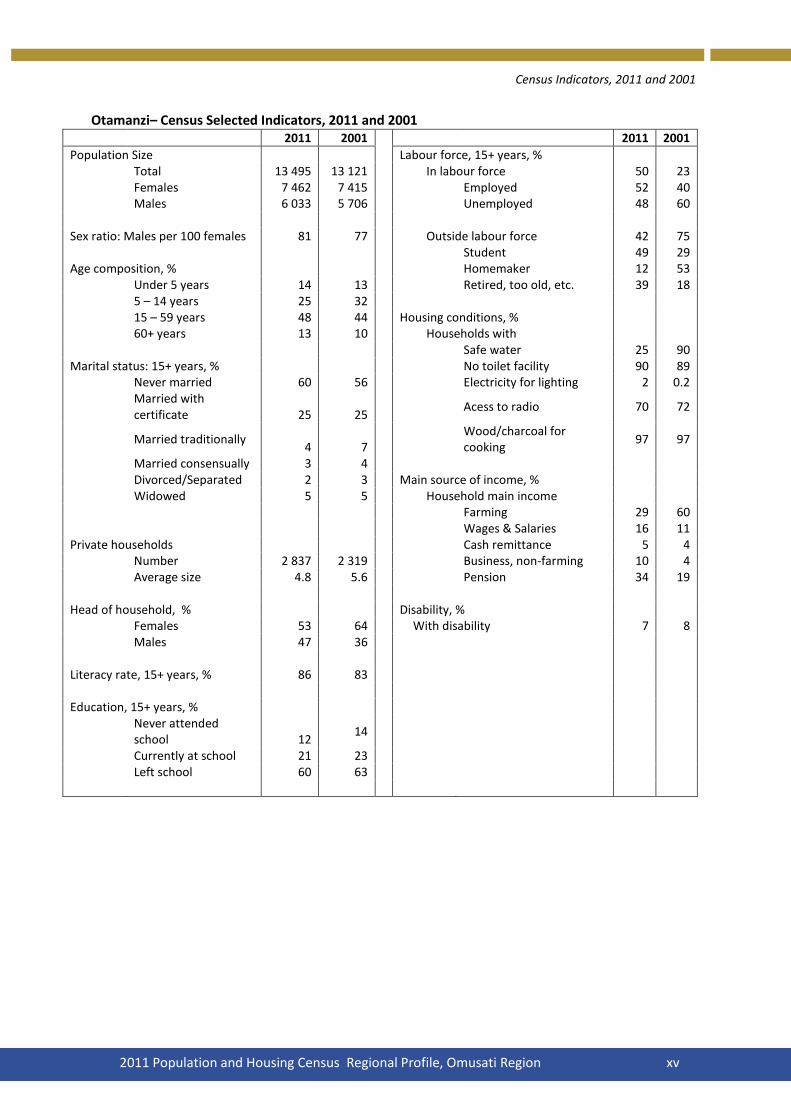
2011 Population and Housing Census Regional Profile, Omusati Region xv
Otamanzi– Census Selected Indicators, 2011 and 2001 2011 2001 2011 2001
Population Size Labour force, 15+ years, % Total 13 495 13 121 In labour force 50 23 Females 7 462 7 415 Employed 52 40 Males 6 033 5 706 Unemployed 48 60 Sex ratio: Males per 100 females 81 77 Outside labour force 42 75 Student 49 29 Age composition, % Homemaker 12 53 Under 5 years 14 13 Retired, too old, etc. 39 18 5 – 14 years 25 32 15 – 59 years 48 44 Housing conditions, % 60+ years 13 10 Households with Safe water 25 90 Marital status: 15+ years, % No toilet facility 90 89 Never married 60 56 Electricity for lighting 2 0.2
Married with certificate 25 25
Acess to radio 70 72
Married traditionally
4 7 Wood/charcoal for cooking
97 97
Married consensually 3 4 Divorced/Separated 2 3 Main source of income, % Widowed 5 5 Household main income
Farming 29 60
Wages & Salaries 16 11 Private households Cash remittance 5 4 Number 2 837 2 319 Business, non-farming 10 4 Average size 4.8 5.6 Pension 34 19 Head of household, % Disability, % Females 53 64 With disability 7 8 Males 47 36
Literacy rate, 15+ years, % 86 83
Education, 15+ years, %
Never attended school 12
14
Currently at school 21 23 Left school 60 63


Chapter 1: Introduction
01
2011 Population and Housing Census Regional Profile, Omusati Region 1
CHAPTER 1: INTRODUCTION
1.1 Background
The Omusati Region is one of the northern regions with a very dominant population of the
Mopani tree species and a few Makalani palm trees, which decrease rapidly in number as one
moves westwards from the border with the Oshana region.
Omusati is predominantly an agricultural region in which mahangu is successfully cultivated as a
staple food. A canal, which carries water from the Ruacana river to Oshakati, passes through the
town of Outapi, the region’s capital. Water from this canal is used for irrigation of the large
government-run farm at Etunda, where crops such as maize, watermelons, tomatoes, potatoes,
and bananas ,amongst other fruits and vegetables, are grown. Omusati Region borders the
Kunene Province of Angola in the north, while domestically it shares borders with Ohangwena
region in the north-east, Oshana region in the east and Kunene region in the south-west.
Omusati Region has 12 constituencies : Anamulenge, Elim, Etayi, Ogongo, Okahao, Okalongo,
Onesi, Oshikuku, Outapi, Ruacana, Tsandi, as well as Otamanzi.
1.2 The 2011 Population and Housing Census
The 2011 Namibia Population and Housing Census results show that Omusati region has a
population of 243 166 people of which 133 621 are women and 109 545 are men. The grew at
an annual rate of 0.6 percent between 2001 and 2011. More than 90 percent of the population
lived in rural areas compared to only 5.7 percent of the population who lived in urban areas.
There were 46 698 households in the region with an average size of 5.2 persons per household.
The aim of this regional report is to provide more detailed findings in terms of the socio-
economic, demographic, households and housing characteristics of the Omusati region as
collected during the 2011 census. Furthermore, comparisons were made with the previous
census years as well as between urban/rural areas and constituencies within the region.
1.3 Organization of the report
The report is comprised of seven main chapters and an Annex. Chapter 1 provides the
background of the region, while Chapter 2 presents information on the population size, structure
and composition as well as sex ratio and population density. Chapter 3 provides information on
marital status, citizenship and registration of births, while information on population trends with
a focus on population growth, fertility and household deaths is given in Chapter 4. Chapter 5
addresses socio-economic characteristics of the population and mainly covers Information
Communication Technology (ICT), literacy, education, disability, orphanhood and economic
activity. Chapter 6 provides information on household characteristics including household size,
household composition, main sources of income for the household, asset ownership, main
language spoken at household level and agricultural activity. Finally, Chapter 7 presents
information on housing characteristics focusing on the types of housing unit, tenure status,
construction materials, water supply and sanitation as well as sources of energy for the
household.
Chapter 1: Introduction
01
2011 Population and Housing Census Regional Profile, Omusati Region 2
Please note that: 1. Chapter two (2) presents information for all persons including those who were night
travellers, or who were in prisons or hotels during the Census period. However, chapters 3 - 7 only present information obtained from all persons who were enumerated in households and institutions.
2. Imputation using the hot-deck method was applied for ‘Not stated’ and ‘Don’t know‘ responses to the age and sex of each person.
3. There are three Annexes: a Glossary of census terms, an Enumeration area map and
detailed tables

Census Indicators, 2011 and
Chapter 2: Population Structure, Composition and Density
01
2011 Population and Housing Census Regional Profile, Omusati Region 3
CHAPTER 2: POPULATION STRUCTURE, COMPOSITION AND DENSITY (Face up)
This chapter provides information on population size, structure, composition and density of the
Omusati region. It also presents analyses of population trends between the 1991, 2001 and 2011
Census years.
2.1 Population Size and Density
Figure 2.1 provides a comparison of the population size by Census year and area. The results
showthat the total population for Omusati region increased from 189,919 in 1991 to 228,842 by
2001 and continued to grow to 243,166 people by 2011.
Population growth was experienced in both the urban and rural areas.
Figure 2.1 Population size by Census year and area
Population density is the average number of persons per square kilometre. Thus, it shows the relationship between a given population and the size of the area in which they reside. Population densities calculated for all constituencies are presented in Table 2.1. At constituency level, Etayi was the most densely populated constituency with 54.6 persons per
square kilometre. On the other hand, Okahao was the least populated constituency with a
density of 1.8 persons per square kilometre.
1991 2001 2011
Omusati 189 919 228 842 243 166
Urban 0 2 640 13 848
Rural 189 919 226 202 229 318
0
50 000
100 000
150 000
200 000
250 000
300 000
Po
pu
lati
on
Total Population was 243,166
The population density for the Omusati Region was 9.2
persons per square kilometre

Census Indicators, 2011 and
Chapter 2: Population Structure, Composition and Density
01
2011 Population and Housing Census Regional Profile, Omusati Region 4
Table 2.1 Population density by area
Area Population Area in
km² Persons per
km2
Omusati 243 166 26604.8 9.1
Anamulenge 13 410 353.6 37.9 Elim 11 406 444.3 25.7 Etayi 35 101 644.2 54.5 Ogongo 19 546 806.8 24.2 Okahao 17 548 9910.5 1.8 Okalongo 30 609 656.9 46.6 Onesi 13 149 601.9 21.8 Oshikuku 9 093 277.2 32.8 Outapi 36 934 985.5 37.5 Ruacana 14 857 5377.0 2.8 Tsandi 28 018 2362.9 11.9 Otamanzi 13 495 4184.1 3.2
Table 2.2 shows the proportion of the population living in rural and urban areas as well as in the
constituencies of Omusati region.
The table shows that the proportion of the population living in rural areas was much higher than
in urban areas (94.3% and 5.7% respectively). At constituency level, Outapi accommodated over
15 percent of the total population while Elim accommodated the least with 4.7 percent.
Table 2.2 Percentage share of the population within the Census year and area
Area Number Percent
2001 2011 2001 2011
Omusati 228 842 243 166
100.0 100.0
Urban 2 640 13 848
1.2 5.7
Rural 226 202 229 318
98.8 94.3
Anamulenge 12 617 13 410
5.5 5.5
Elim 10 850 11 406
4.7 4.7
Etayi 35 130 35 101
15.4 14.4
Ogongo 19 611 19 546
8.6 8.0
Okahao 17 751 17 548
7.8 7.2
Okalongo 28 719 30 609
12.5 12.6
Onesi 12 995 13 149
5.7 5.4
Oshikuku 8 299 9 093
3.6 3.7
Outapi 13 121 36 934
5.7 15.2
Ruacana 31 496 14 857
13.8 6.1
Tsandi 11 204 28 018
4.9 11.5
Otamanzi 27 049 13 495 11.8 5.5
About 94.3% of Omusati Region’s population lived in rural
areas

Census Indicators, 2011 and
Chapter 2: Population Structure, Composition and Density
01
2011 Population and Housing Census Regional Profile, Omusati Region 5
2.2 Population structure and composition
This sub-section provides information on the composition of the population in terms of sex and
age, which are important demographic parameters.
2.2.1 Age structure
The age distribution of the population by broad age groups and area is presented in Table 2.3.
Omusati region had a relatively young population with over 40 percent of the whole population
being less than 15 years of age. The share of young people below the age of 15 years in rural was
41 percent while that of urban areas was 28 percent. The proportion of elderly people aged 60
years and above in rural areas was 11.1 percent, while that in urban areas was 4.1 percent.
Table 2.3 Population distribution by age group and area
Area Population 0-4 5-14 15-59 60+
Omusati 243 166 13.9 26.3 49.0 10.7
Urban 13 848 11.0 17.0 67.9 4.1
Rural 229 318 14.1 26.9 47.9 11.1
Anamulenge 13 410 13.7 26.9 49.3 10.1
Elim 11 406 12.6 25.1 49.0 13.3
Etayi 35 101 14.1 28.2 46.4 11.4
Ogongo 19 546 13.5 26.1 48.1 12.3
Okahao 17 548 12.7 23.9 51.1 12.3
Okalongo 30 609 14.1 29.2 46.7 10.0
Onesi 13 149 14.4 28.0 48.0 9.6
Oshikuku 9 093 12.8 22.8 54.2 10.2
Outapi 36 934 14.4 26.1 50.9 8.7
Ruacana 14 857 15.4 25.1 53.1 6.4
Tsandi 28 018 13.7 25.0 48.6 12.7
Otamanzi 13 495 14.1 24.9 48.3 12.7
2.2.2 Median age
Median age is used as an indicator to determine whether the population is young, intermediate
or old. A region is considered ‘young’ when it has a median age of less than 20 years, while
regions with medians of 30 years and above are considered ‘old’. Populations with median ages
between 20 and 29 are referred to as intermediate.
Omusati region had a median age of 18 years, and was therefore considered young. The median
age of 18 years of age means that half of the population was less than 18 years old, and the
other half older than 18 years old.
Census Indicators, 2011 and
Chapter 2: Population Structure, Composition and Density
01
2011 Population and Housing Census Regional Profile, Omusati Region 6
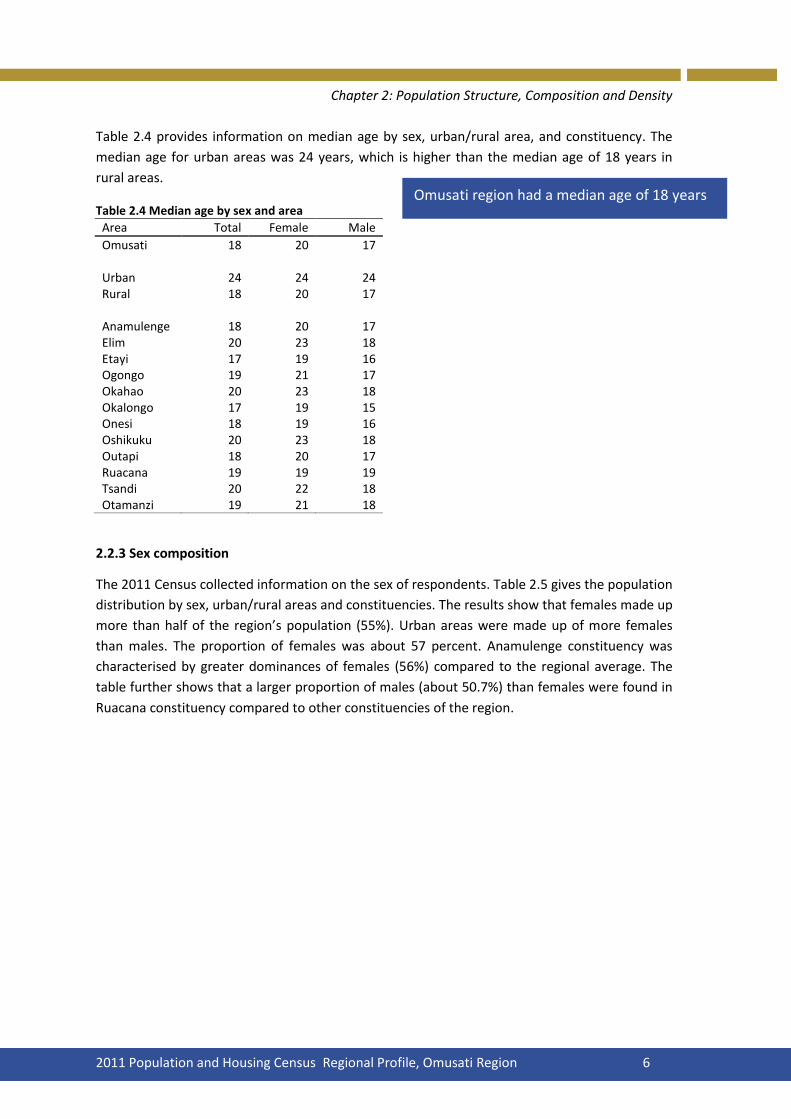
Table 2.4 provides information on median age by sex, urban/rural area, and constituency. The
median age for urban areas was 24 years, which is higher than the median age of 18 years in
rural areas.
Table 2.4 Median age by sex and area
Area Total Female Male
Omusati 18 20 17
Urban 24 24 24 Rural 18 20 17
Anamulenge 18 20 17 Elim 20 23 18 Etayi 17 19 16 Ogongo 19 21 17 Okahao 20 23 18 Okalongo 17 19 15 Onesi 18 19 16 Oshikuku 20 23 18 Outapi 18 20 17 Ruacana 19 19 19 Tsandi 20 22 18 Otamanzi 19 21 18
2.2.3 Sex composition
The 2011 Census collected information on the sex of respondents. Table 2.5 gives the population
distribution by sex, urban/rural areas and constituencies. The results show that females made up
more than half of the region’s population (55%). Urban areas were made up of more females
than males. The proportion of females was about 57 percent. Anamulenge constituency was
characterised by greater dominances of females (56%) compared to the regional average. The
table further shows that a larger proportion of males (about 50.7%) than females were found in
Ruacana constituency compared to other constituencies of the region.
Omusati region had a median age of 18 years

Census Indicators, 2011 and
Chapter 2: Population Structure, Composition and Density
01
2011 Population and Housing Census Regional Profile, Omusati Region 7
Table 2.5 Population distribution by sex and area
Area Total Female Percent Male Percent
Omusati 243 166 133 621 55.0 109 545 45.0 Urban 13 848 7 820 56.5 6 028 43.5 Rural 229 318 125 801 54.9 103 517 45.1 Anamulenge 13 410 7 512 56.0 5 898 44.0 Elim 11 406 6 308 55.3 5 098 44.7 Etayi 35 101 19 610 55.9 15 491 44.1 Ogongo 19 546 10 802 55.3 8 744 44.7 Okahao 17 548 9 529 54.3 8 019 45.7 Okalongo 30 609 17 018 55.6 13 591 44.4 Onesi 13 149 7 170 54.5 5 979 45.5 Oshikuku 9 093 5 209 57.3 3 884 42.7 Outapi 36 934 20 296 55.0 16 638 45.0 Ruacana 14 857 7 327 49.3 7 530 50.7 Tsandi 28 018 15 378 54.9 12 640 45.1 Otamanzi 13 495 7 462 55.3 6 033 44.7
2.2.4 Sex ratio
Sex ratio is another measure of sex composition, and is measured as the proportion of males per
100 females in a given population.
Table 2.6 provides the sex ratio by urban and rural areas as well as constituencies. The sex ratio
for Omusati region was 82 which implies that on average, there were 82 males for every 100
females. In urban areas, the proportion of women was even greater than in rural areas (with sex
ratios of 77 and 82 respectively). Only Ruacana constituency had more males than females, with
a sex ratio of 103 malesper 100 females.

Census Indicators, 2011 and
Chapter 2: Population Structure, Composition and Density
01
2011 Population and Housing Census Regional Profile, Omusati Region 8
Table 2.6 Sex ratio by Census years and area
Area 2001 2011
Omusati 81 82 Urban 102 77 Rural 81 82 Anamulenge 81 79 Elim 78 81 Etayi 78 79 Ogongo 78 81 Okahao 81 84 Okalongo 80 80 Onesi 85 83 Oshikuku 75 75 Outapi 77 82 Ruacana 86 103 Tsandi 103 82 Otamanzi 80 81
2.2.5 Age-sex pyramid
Age-sex pyramids provide important illustrations of the demographic characteristics of the
population.
Figure 2.2 is the population pyramid for Omusati region by five year age groups with a broad
base of more young people and a thin apex with less older people, reflecting the youthfulness of
the population. This shape is a typical reflection of populations having high fertility rates.
Furthermore, the pyramid shows that the share of females is larger than that of males in most of
the age groups.

Census Indicators, 2011 and
Chapter 2: Population Structure, Composition and Density
01
2011 Population and Housing Census Regional Profile, Omusati Region 9
Figure 2.2 Population pyramid, Omusati
Figure 2.3 presents the population pyramid for urban areas in five year age groups. The pyramid
is bulky in the middle and has a relatively narrow apex indicating that urban areas have a large
proportion of working - age people (between 15 - 59 years of age) and a much smaller
proportion of elderly people.
20 000 15 000 10 000 5 000 0 5 000 10 000 15 000 20 000
0 - 4
5 - 9
10 - 14
15 - 19
20 - 24
25 - 29
30 - 34
35 - 39
40 - 44
45 - 49
50 - 54
55 - 59
60 - 64
65 - 69
70 - 74
75 - 79
80 - 84
85 - 89
90 - 94
95+
Male Population Female

Census Indicators, 2011 and
Chapter 2: Population Structure, Composition and Density
01
2011 Population and Housing Census Regional Profile, Omusati Region 10
Figure 2.3 Population pyramid, Omusati Urban
Figure 2.4 presents the pyramid for the rural areas. The pyramid shows a broad base with high
fertility and a narrow apex. However a shrink is observed in both sexes of age groups 15 to
69.This is an indication that migration to urban centres and migration to other regions affected
rural populations.
1 000 800 600 400 200 0 200 400 600 800 1 000 1 200
0 - 4
5 - 9
10 - 14
15 - 19
20 - 24
25 - 29
30 - 34
35 - 39
40 - 44
45 - 49
50 - 54
55 - 59
60 - 64
65 - 69
70 - 74
75 - 79
80 - 84
85 - 89
90 - 94
95+
Male Population Female

Census Indicators, 2011 and
Chapter 2: Population Structure, Composition and Density
01
2011 Population and Housing Census Regional Profile, Omusati Region 11
Figure 2.4 Population pyramid, Omusati Rural
20 000 15 000 10 000 5 000 0 5 000 10 000 15 000 20 000
0 - 45 - 9
10 - 1415 - 1920 - 2425 - 2930 - 3435 - 3940 - 4445 - 4950 - 5455 - 5960 - 6465 - 6970 - 7475 - 7980 - 8485 - 8990 - 94
95+
Male Population Female
Census Indicators, 2011 and
Chapter 3: Population Characteristics
01
2011 Population and Housing Census Regional Profile, Omusati Region 12
CHAPTER 3: POPULATION CHARACTERISTICS
This chapter provides information on demographic characteristics and focuses on marital status, citizenship and status of birth registration.
3.1 Marital status
During the Census, all people were asked to state their marital status in one of the following
categories: never married, married with a certificate, married traditionally, consensual union,
divorced/separated and widowed. For international comparisons, the analysis focuses only on
the population aged 15 years and above, although we acknowledge that there are cases of child
marriages in Namibia.
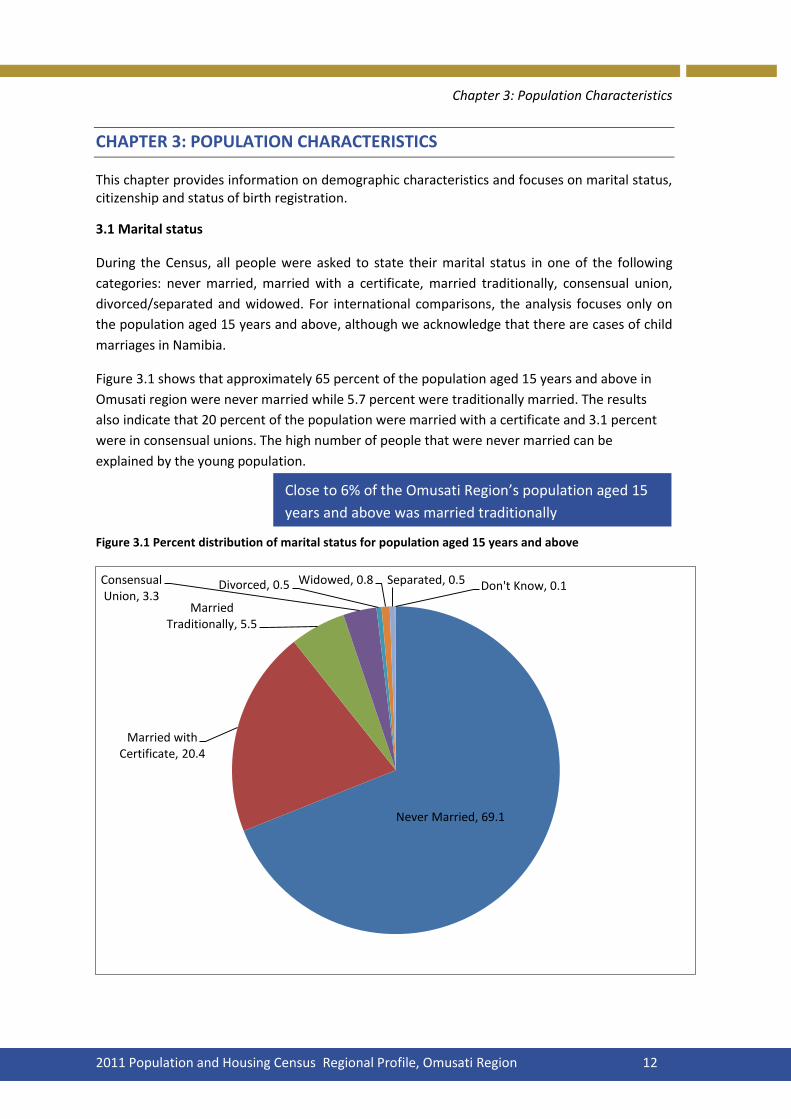
Figure 3.1 shows that approximately 65 percent of the population aged 15 years and above in
Omusati region were never married while 5.7 percent were traditionally married. The results
also indicate that 20 percent of the population were married with a certificate and 3.1 percent
were in consensual unions. The high number of people that were never married can be
explained by the young population.
Figure 3.1 Percent distribution of marital status for population aged 15 years and above
Never Married, 69.1
Married with Certificate, 20.4
Married Traditionally, 5.5
Consensual Union, 3.3
Divorced, 0.5 Widowed, 0.8 Separated, 0.5 Don't Know, 0.1
Close to 6% of the Omusati Region’s population aged 15
years and above was married traditionally
areas
Census Indicators, 2011 and
Chapter 3: Population Characteristics
01
2011 Population and Housing Census Regional Profile, Omusati Region 13
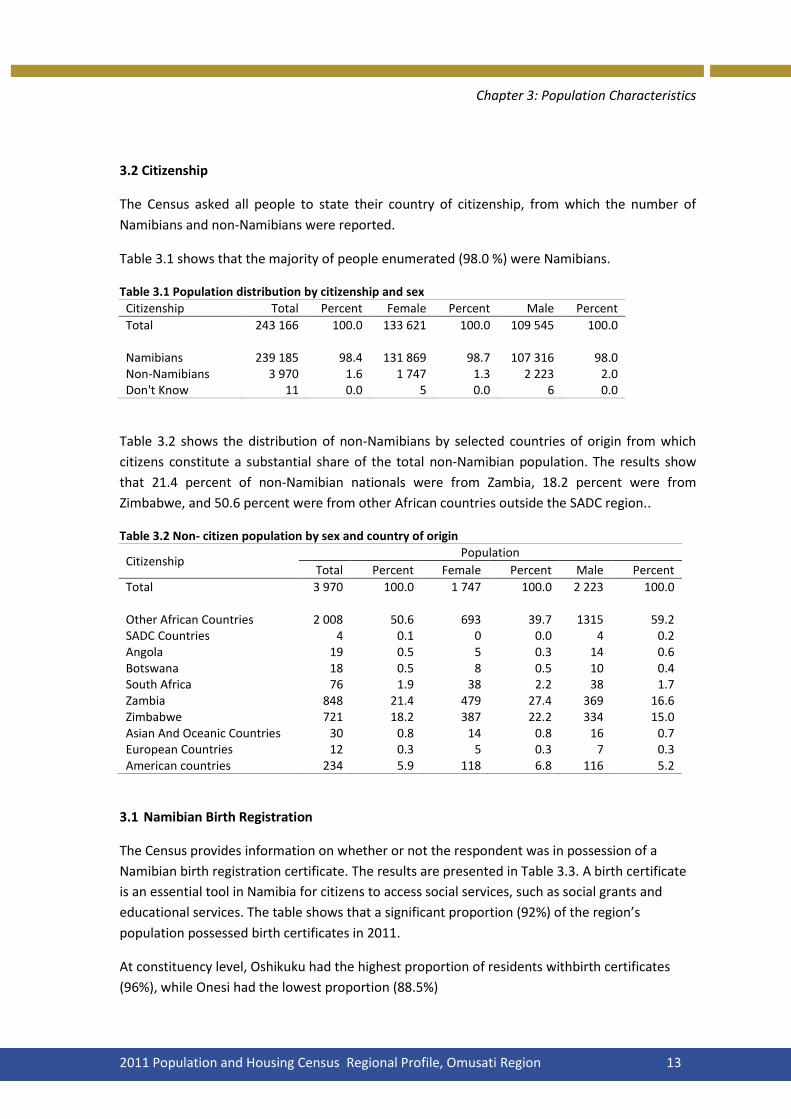
3.2 Citizenship
The Census asked all people to state their country of citizenship, from which the number of
Namibians and non-Namibians were reported.
Table 3.1 shows that the majority of people enumerated (98.0 %) were Namibians.
Table 3.1 Population distribution by citizenship and sex
Citizenship Total Percent Female Percent Male Percent
Total 243 166 100.0 133 621 100.0 109 545 100.0 Namibians 239 185 98.4 131 869 98.7 107 316 98.0 Non-Namibians 3 970 1.6 1 747 1.3 2 223 2.0 Don't Know 11 0.0 5 0.0 6 0.0
Table 3.2 shows the distribution of non-Namibians by selected countries of origin from which
citizens constitute a substantial share of the total non-Namibian population. The results show
that 21.4 percent of non-Namibian nationals were from Zambia, 18.2 percent were from
Zimbabwe, and 50.6 percent were from other African countries outside the SADC region..
Table 3.2 Non- citizen population by sex and country of origin
Citizenship Population
Total Percent Female Percent Male Percent
Total 3 970 100.0 1 747 100.0 2 223 100.0 Other African Countries 2 008 50.6 693 39.7 1315 59.2 SADC Countries 4 0.1 0 0.0 4 0.2 Angola 19 0.5 5 0.3 14 0.6 Botswana 18 0.5 8 0.5 10 0.4 South Africa 76 1.9 38 2.2 38 1.7 Zambia 848 21.4 479 27.4 369 16.6 Zimbabwe 721 18.2 387 22.2 334 15.0 Asian And Oceanic Countries 30 0.8 14 0.8 16 0.7 European Countries 12 0.3 5 0.3 7 0.3 American countries 234 5.9 118 6.8 116 5.2
3.1 Namibian Birth Registration
The Census provides information on whether or not the respondent was in possession of a
Namibian birth registration certificate. The results are presented in Table 3.3. A birth certificate
is an essential tool in Namibia for citizens to access social services, such as social grants and
educational services. The table shows that a significant proportion (92%) of the region’s
population possessed birth certificates in 2011.
At constituency level, Oshikuku had the highest proportion of residents withbirth certificates
(96%), while Onesi had the lowest proportion (88.5%)

Census Indicators, 2011 and
Chapter 3: Population Characteristics
01
2011 Population and Housing Census Regional Profile, Omusati Region 14
Table 3.3 Namibian birth certificate status by area
Area Total
With birth certificate
Without birth
certificate Don’t know
Number Percent Number Percent Number Percent
Omusati 238 474 219 464 92.0 18 206 7.6 804 0.3
Urban 12 889 12 512 97.1 360 2.8 17 0.1 Rural 225 585 206 952 91.7 17846 7.9 787 0.3
Anamulenge 13 150 12 041 91.6 1 076 8.2 33 0.3 Elim 11 316 10 712 94.7 567 5.0 37 0.3 Etayi 34 756 32 037 92.2 2 581 7.4 138 0.4 Ogongo 19 361 18 452 95.3 867 4.5 42 0.2 Okahao 17 296 16 051 92.8 1 153 6.7 92 0.5 Okalongo 30 100 26 735 88.8 3 293 10.9 72 0.2 Onesi 12 836 11 357 88.5 1 451 11.3 28 0.2 Oshikuku 8 765 8 399 95.8 337 3.8 29 0.3 Outapi 35 764 32 952 92.1 2 674 7.5 138 0.4 Ruacana 14 287 13 109 91.8 1 148 8.0 30 0.2 Tsandi 27 536 25 470 92.5 1 970 7.2 96 0.3 Otamanzi 13 307 12 149 91.3 1 089 8.2 69 0.5
About 92% of the Omusati Region’s population had birth
certificates
areas

Census Indicators, 2011 and 2001 Census Indicators, 2011 and
Chapter 4: Population Trends
01
2011 Population and Housing Census Regional Profile, Omusati Region 15
CHAPTER 4: POPULATION TRENDS AND URBANISATION
This chapter analyses population trends, including changes in population growth, fertility and
household deaths.
4.1 Population growth
The population of Omusati region grew steadily since the 2001 Census. Table 4.1 provides
population increase and annual growth rates between 2001 and 2011.
The annual growth rate for Omusati region between 2001 and 2011 was 0.6 percent. The annual
growth rate for urban areas was 16.6 percent - much higher than that of rural areas (0.1%). At
constituency level, Ruacana (2.8%) recorded the highest growth rate, while Okahao constituency
recorded a decrease in the growth rate of 0.1 percent between 2001 and 2011.
Table 4.1 Population change and annual growth rates for 2001-2011 by area
Area Census year Population
change (2001-2011)
Annual growth rate (2001-2011)
2001 2011
Omusati 228 842 243 166 14 324 0.6
Urban 2 640 13 848 11 208 16.6 Rural 226 202 229 318 3 116 0.1
Anamulenge 12 617 13 410 793 0.6 Elim 10 850 11 406 556 0.5 Etayi 35 130 35 101 -29 0.0 Ogongo 19 611 19 546 -65 0.0 Okahao 17 751 17 548 -203 -0.1 Okalongo 28 719 30 609 1 890 0.6 Onesi 12 995 13 149 154 0.1 Oshikuku 8 299 9 093 794 0.9 Outapi 31 496 36 934 5 438 1.6 Ruacana 11 204 14 857 3 653 2.8 Tsandi 27 049 28 018 969 0.4 Otamanzi 13 121 13 495 374 0.3
The annual population growth rate between 2001 and
2011 was 0.6 %

Census Indicators, 2011 and 2001 Census Indicators, 2011 and
Chapter 4: Population Trends
01
2011 Population and Housing Census Regional Profile, Omusati Region 16
4.2 Fertility
The Census collected information on live births from all women aged 15 – 49 years. Generally
this indicator measures the frequency of child bearing in a given population. This section
presents two indicators of fertility, namely: Crude Birth Rate (CBR) and Age at first birth for
women aged 15 – 49 years, irrespective of their marital status.
4.2.1 Crude Birth Rate
The Crude Birth Rate (CBR) is the number of live births per 1,000 people of the total female and
male population per year. In 2011, there were 6,236 children born during the 12-months prior to
the census date, which gives a reported or unadjusted CBR of 25.6 births per 1,000 people (Table
4.2). The results further indicate that the CBR was slightly higher in urban (31.0 births per 1000
people) than in rural areas (25.3 births per 1000 people). At the constituency level, Ruacana had
the highest CBR of 32.2 births per 1,000 people, while Elim had the lowest CBR of 22.0 births per
1,000 people.
Table 4.2 Crude Birth Rates by area
Area Population Births
last 12 months
CBR
Omusati 243 166 6 236 25.6 Urban 13 848 429 31.0 Rural 229 318 5 807 25.3 Anamulenge 13 410 352 26.2 Elim 11 406 251 22.0 Etayi 35 101 907 25.8 Ogongo 19 546 426 21.8 Okahao 17 548 420 23.9 Okalongo 30 609 752 24.6 Onesi 13 149 378 28.7 Oshikuku 9 093 226 24.9 Outapi 36 934 999 27.0 Ruacana 14 857 479 32.2 Tsandi 28 018 705 25.2 Otamanzi 13 495 341 25.3
4.2.2 Age at First Birth
Age at first birth influences the total number of births that a woman might have in her life, which
has an impact on the size, composition and future growth of the population.
Table 4.3 shows that the average age of mothers at first birth in Omusati region was slightly over
23 years. A similar trend was also observed for urban and rural areas. However, there were slight
differences between constituencies. Mothers in Ruacana gave birth for the first time at an
average age of around 22 years, while those in Elim, Ogongo, Okahao, Oshikuku, Tsandi and
Otamanzi on average delayed pregnancy until the age of nearly 24 years.
The unadjusted crude birth rate was
estimated at 25.6 births per 1,000
people

Census Indicators, 2011 and 2001 Census Indicators, 2011 and
Chapter 4: Population Trends
01
2011 Population and Housing Census Regional Profile, Omusati Region 17
Table 4.3 Average age of mother at first birth by area
Area Average age at first
birth
Omusati 23.3 Urban 23.5 Rural 23.3 Anamulenge 23.2 Elim 24.2 Etayi 22.7 Ogongo 24.2 Okahao 23.9 Okalongo 22.9 Onesi 22.6 Oshikuku 24.1 Outapi 23.0 Ruacana 21.8 Tsandi 23.8 Otamanzi 24.0
4.3 Deaths in the household
Information about deaths in the last 12 months prior to the Census (September 2010 to August
2011) was collected from all households during the Census. Usually, mortality indicators are
based on data from civil registration. However, in Namibia this coverage is incomplete. It must
also be acknowledged that information from surveys and censuses may be under-reported,
which can lead to underestimations of the level of mortality.
4.3.1 Reported Deaths
Figure 4.1 presents the distribution of the reported deaths in the last 12 months prior to the
Census by sex and urban and rural areas. A higher proportion of deaths was recorded for males
(58.4%) than females in both urban and rural areas.
2,794 deaths were reported for the 12 months
prior to the census

Census Indicators, 2011 and 2001 Census Indicators, 2011 and
Chapter 4: Population Trends
01
2011 Population and Housing Census Regional Profile, Omusati Region 18
Figure 4.1 Distribution of reported deaths in the last 12 months by sex and area
4.3.2 Crude Death Rate
Crude Death Rate (CDR) is defined as the number of deaths that occurred in a given calendar
year per 1,000 people in the population.
Table 4.4 shows that in Omusati region, a total of 2,794 deaths occurred during the 12 months
prior to the Census, resulting in a CDR of 11.5 per 1,000 people. The results further show that
more deaths were reported in rural (11.8) than urban areas (7.0). At the constituency level, the
highest death rate was in Okalongo (13.7), while the lowest rate was recorded in Outapi (9.6).
Table 4.4 Number of reported deaths in the last 12 months and CDR by area
Area Population Number of
reported deaths
CDR
Omusati 243 166 2 794 11.5 Urban 13 848 97 7.0 Rural 229 318 2 697 11.8 Anamulenge 13 410 162 12.1 Elim 11 406 128 11.2 Etayi 35 101 429 12.2 Ogongo 19 546 220 11.3 Okahao 17 548 205 11.7 Okalongo 30 609 419 13.7 Onesi 13 149 140 10.6 Oshikuku 9 093 93 10.2 Outapi 36 934 354 9.6 Ruacana 14 857 174 11.7 Tsandi 28 018 330 11.8 Otamanzi 13 495 140 10.4
Omusati Urban Rural
Male 58.4 54.6 58.5
Female 41.6 45.4 41.5
0.0
10.0
20.0
30.0
40.0
50.0
60.0
70.0
80.0
90.0
100.0
Pe
rce
nt
The crude death rate was 11.5 deaths per
1,000 people

Chapter 5: Socio-Economic Characteristics of the Population
2011 Population and Housing Census Regional Profile, Omusati Region 19
4.3.3 Death Registration
Table 4.5 shows that 89.3 percent of all reported deaths in the 12 months prior to the Census
were registered. Rates of registration were higher in urban (90.7%) than in rural areas (89.2%).
At constituency level, Okahao had the highest level of registered deaths (98.0%), while the
lowest proportion of registered deaths was in Outapi and Ruacana with around 82 percent of
registered deaths each.
Table 4.5 Death registration status by area
Area Total
reported death
Registered deaths
Percent registered
Omusati 2 794 2 495 89.3
Urban 97 88 90.7 Rural 2 697 2 407 89.2
Anamulenge 162 145 89.5 Elim 128 122 95.3 Etayi 429 390 90.9 Ogongo 220 207 94.1 Okahao 205 201 98.0 Okalongo 419 360 85.9 Onesi 140 123 87.9 Oshikuku 93 91 97.8 Outapi 354 290 81.9 Ruacana 174 142 81.6 Tsandi 330 297 90.0 Otamanzi 140 127 90.7
Chapter 5: Socio-Economic Characteristics of the Population
2011 Population and Housing Census Regional Profile, Omusati Region 20
CHAPTER 5: SOCIO-ECONOMIC CHARACTERISTICS OF THE POPULATION
This chapter deals with socio-economic characteristics of the population and the information
discussed is crucial for decision making, and for the planning and monitoring of development
programmes and policies. The sub-topics discussed include Information Communication
Technology (ICT), Early Childhood Development (ECD), Education and Literacy, Disability and the
Labour Force.
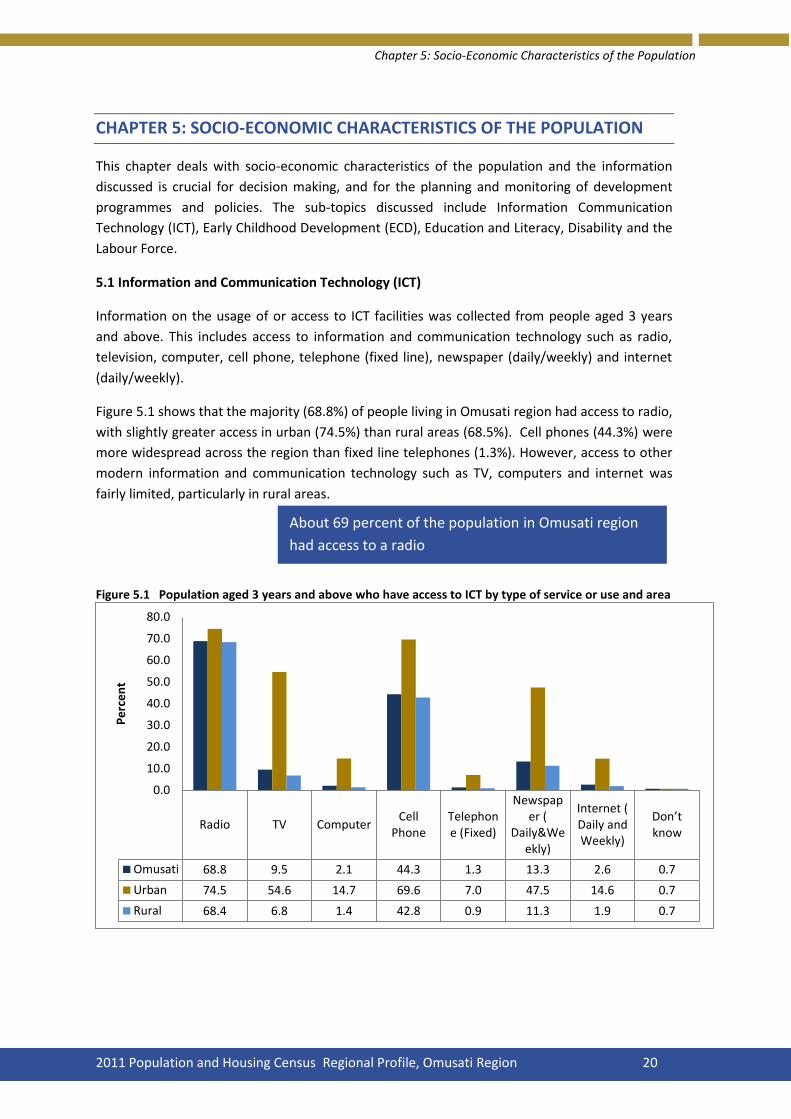
5.1 Information and Communication Technology (ICT)
Information on the usage of or access to ICT facilities was collected from people aged 3 years
and above. This includes access to information and communication technology such as radio,
television, computer, cell phone, telephone (fixed line), newspaper (daily/weekly) and internet
(daily/weekly).
Figure 5.1 shows that the majority (68.8%) of people living in Omusati region had access to radio,
with slightly greater access in urban (74.5%) than rural areas (68.5%). Cell phones (44.3%) were
more widespread across the region than fixed line telephones (1.3%). However, access to other
modern information and communication technology such as TV, computers and internet was
fairly limited, particularly in rural areas.
Figure 5.1 Population aged 3 years and above who have access to ICT by type of service or use and area
Radio TV ComputerCell
PhoneTelephone (Fixed)
Newspaper (
Daily&Weekly)
Internet (Daily andWeekly)
Don’t know
Omusati 68.8 9.5 2.1 44.3 1.3 13.3 2.6 0.7
Urban 74.5 54.6 14.7 69.6 7.0 47.5 14.6 0.7
Rural 68.4 6.8 1.4 42.8 0.9 11.3 1.9 0.7
0.0
10.0
20.0
30.0
40.0
50.0
60.0
70.0
80.0
Pe
rce
nt
About 69 percent of the population in Omusati region
had access to a radio

Chapter 5: Socio-Economic Characteristics of the Population
2011 Population and Housing Census Regional Profile, Omusati Region 21
5.2 Early Childhood Development (ECD)
Respondents were asked to state whether children aged 0-4 years attended any type of Early
Childhood Development (ECD) services, such as Edu-care (day-care, crèche, kindergarten) and
pre-primary school.
Table 5.1 shows that a total number of 33,727 children aged 0-4 years were counted and of this
number, about 9.1 percent were attending ECD programmes. Attendance in urban areas was
much higher than in rural areas, with slightly more than 19 percent of children attending ECD,
while 8.7 percent were attending ECD in rural areas. Slightly more girls than boys were enrolled
in ECD programmes in both rural and urban areas.
At constituency level, the highest proportion of children attending ECD programmes was
recorded in Oshikuku (14.5%), while the lowest was in Anamulenge constituency (6.5%).
Table 5.1 Population aged 0-4 years attending ECD by sex and area
Figure 5.2 presents the population aged 0-4 years attending ECD by type and area. Attendance in
Edu-care programmes was higher (53.7%) than in pre-primary school (46.3%) in Omusati Region,
while at constituency level only children in Anamulenge, Oshikuku and Etayi attended more pre-
primary classes in greater proportions.
Area Population 0 - 4 years Attending ECD Percent attending
Total* Female Male Total Female Male Total Female Male
Omusati 33 727 17 014 16 713
3 070 1 631 1 439
9.1 9.6 8.6
Urban 1 433 763 670
273 162 111
19.1 21.2 16.6
Rural 32 294 16 251 16 043
2 797 1 469 1 328
8.7 9 8.3
Anamulenge 1 841 959 882
104 62 42
5.6 6.5 4.8
Elim 1 436 722 714
145 79 66
10.1 10.9 9.2 Etayi 4 953 2 472 2 481
440 247 193
8.9 10 7.8
Ogongo 2 648 1 312 1 336
202 101 101
7.6 7.7 7.6 Okahao 2 220 1 064 1 156
180 95 85
8.1 8.9 7.4
Okalongo 4 331 2 112 2 219
327 153 174
7.6 7.2 7.8 Onesi 1 888 990 898
110 58 52
5.8 5.9 5.8
Oshikuku 1 115 585 530
162 94 68
14.5 16.1 12.8 Outapi 5 282 2 707 2 575
520 287 233
9.8 10.6 9
Ruacana 2 286 1 156 1 130
193 108 85
8.4 9.3 7.5 Tsandi 3 824 1965 1859
477 246 231
12.5 12.5 12.4
Otamanzi 1 903 970 933 210 101 109 11 10.4 11.7 Note: *This includes only children enumerated in private and institutional households
Less than 10 percent of children aged 0 - 4 years
were attending Early Childhood Development
programmes at the time of the Census

Chapter 5: Socio-Economic Characteristics of the Population
2011 Population and Housing Census Regional Profile, Omusati Region 22
Figure 5.2 Percent distribution of children aged 0-4 years attending ECD by type and area
5.3 Education and Literacy
Information on literacy and education is vital for many purposes, including the need for
Government to articulate and monitor national development programs and goals. During the
Census, specific information on education and literacy was collected from all people aged 5
years and above.
5.3.1 Literacy
Literacy can be defined as the ability to read and write with understanding in any language.
During the Census, all people aged 5 years and above were asked whether they can read and
write in any language with understanding, but no test was administered to determine the level
of literacy.
Table 5.2 provides information on literacy rates for the population aged 15 years and above. The
results show that the regional literacy rate was about 88 percent. The literacy rate in urban areas
stood at 96.2 percent while in rural areas it stood at 87 percent. Furthermore, the table shows
that the literacy rate was highest in Oshikuku (93.3%) and lowest in Ruacana (77.7%).
0.0 10.0 20.0 30.0 40.0 50.0 60.0 70.0
Omusati
Urban
Rural
Anamulenge
Elim
Etayi
Ogongo
Okahao
Okalongo
Onesi
Oshikuku
Outapi
Ruacana
Tsandi
Otamanzi
Percent Attending ECD
Pre-primary
Edu-care
About 87.6% of persons aged 15 years
and above were literate

Chapter 5: Socio-Economic Characteristics of the Population
2011 Population and Housing Census Regional Profile, Omusati Region 23
Table 5.2 Literate population aged 15 years and above by sex and area
Area Population Literate Literacy rate
Total Female Male Total Female Male Total Female Male
Omusati 144 640 84 088 60 552 126 657 72 760 53 897 87.6 86.5 89.0
Urban 9 516 5 534 3 982 9 154 5 328 3 826 96.2 96.3 96.1 Rural 135 124 78 554 56 570 117 503 67 432 50 071 87.0 85.8 88.5
Anamulenge 7 888 4 665 3 223 7 132 4 134 2 998 90.4 88.6 93.0 Elim 7 082 4 165 2 917 6 500 3 817 2 683 91.8 91.6 92.0 Etayi 20 256 12 180 8 076 17 950 10 563 7 387 88.6 86.7 91.5 Ogongo 11 806 6 973 4 833 10 596 6 172 4 424 89.8 88.5 91.5 Okahao 11 074 6 383 4 691 9 347 5 379 3 968 84.4 84.3 84.6 Okalongo 17 335 10 382 6 953 15 057 8 803 6 254 86.9 84.8 89.9 Onesi 7 566 4 361 3 205 6 306 3 544 2 762 83.3 81.3 86.2 Oshikuku 5 709 3 439 2 270 5 327 3 187 2 140 93.3 92.7 94.3 Outapi 21 775 12 610 9 165 19 434 11 120 8 314 89.2 88.2 90.7 Ruacana 8 786 4 270 4 516 6 826 3 282 3 544 77.7 76.9 78.5 Tsandi 17 125 9 883 7 242 15 087 8 624 6 463 88.1 87.3 89.2 Otamanzi 8 238 4 777 3 461 7 095 4 135 2 960 86.1 86.6 85.5
Table 5.3 indicates that the literacy rate for youth aged 15-24 years in Omusati was 95.9 percent,
with a higher proportion of females (96.8%) than males (95.0%) being literate. The literacy rate
was slightly higher in urban areas (97.9%) than rural areas (95.8%). The literacy rate for young
females in rural areas was 1.9 percent higher than males, while in urban areas the literacy rates
were nearly identical.
Table 5.3 Literate youth population aged 15-24 years and above by sex and area
Area Population Literate Literacy rate
Total Female Male Total Female Male Total Female Male
Omusati 53 520 27 346 26 174 51 337 26 481 24 856 95.9 96.8 95.0
Urban 3 320 1 935 1 385 3 251 1 900 1 351 97.9 98.2 97.5 Rural 50 200 25 411 24 789 48 086 24 581 23 505 95.8 96.7 94.8
Anamulenge 2 951 1 584 1 367 2 882 1 551 1 331 97.7 97.9 97.4 Elim 2 387 1 200 1 187 2 334 1 177 1 157 97.8 98.1 97.5 Etayi 8 090 4 185 3 905 7 856 4 086 3 770 97.1 97.6 96.5 Ogongo 4 208 2 119 2 089 4 110 2 084 2 026 97.7 98.3 97 Okahao 3 783 1 926 1 857 3 552 1 850 1 702 93.9 96.1 91.7 Okalongo 7 246 3 706 3 540 6 961 3 578 3 383 96.1 96.5 95.6 Onesi 2 820 1 477 1 343 2 653 1 398 1 255 94.1 94.7 93.4 Oshikuku 2 067 1 085 982 2 036 1 070 966 98.5 98.6 98.4 Outapi 8 328 4 355 3 973 8 066 4 247 3 819 96.9 97.5 96.1 Ruacana 3 096 1 413 1 683 2 667 1 255 1 412 86.1 88.8 83.9 Tsandi 5 726 2 873 2 853 5 537 2 806 2 731 96.7 97.7 95.7 Otamanzi 2 818 1 423 1 395 2 683 1 379 1 304 95.2 96.9 93.5
95.9% of the youth aged 15 to 24 years
were literate
Chapter 5: Socio-Economic Characteristics of the Population
2011 Population and Housing Census Regional Profile, Omusati Region 24
5.3.2 Formal Education
Formal education can be defined as full-time attendance at any regular educational institution -
public or private - for systematic instruction. The categories of formal education used during the
census were: pre-primary; primary schools; secondary or high schools; technical schools;
agricultural institutions; teacher training colleges; polytechnics and universities.
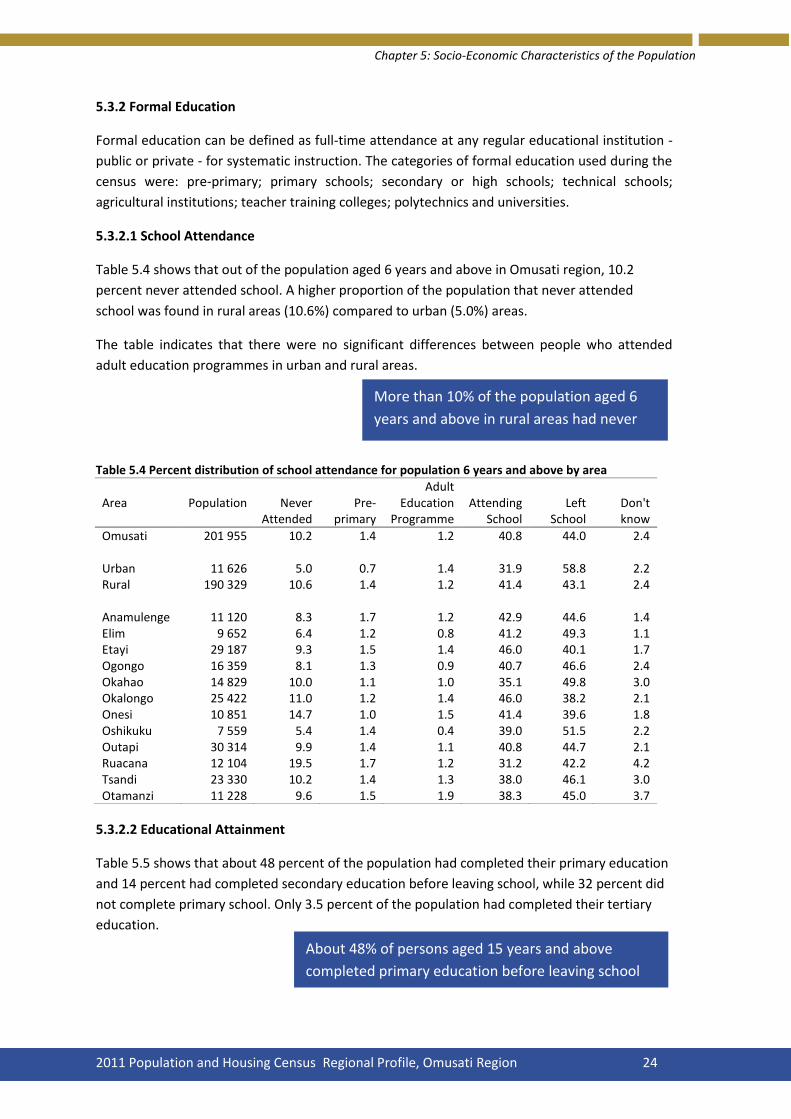
5.3.2.1 School Attendance
Table 5.4 shows that out of the population aged 6 years and above in Omusati region, 10.2
percent never attended school. A higher proportion of the population that never attended
school was found in rural areas (10.6%) compared to urban (5.0%) areas.
The table indicates that there were no significant differences between people who attended
adult education programmes in urban and rural areas.
Table 5.4 Percent distribution of school attendance for population 6 years and above by area
Area Population Never Attended
Pre-primary
Adult Education
Programme Attending
School Left
School Don't know
Omusati 201 955 10.2 1.4 1.2 40.8 44.0 2.4
Urban 11 626 5.0 0.7 1.4 31.9 58.8 2.2 Rural 190 329 10.6 1.4 1.2 41.4 43.1 2.4
Anamulenge 11 120 8.3 1.7 1.2 42.9 44.6 1.4 Elim 9 652 6.4 1.2 0.8 41.2 49.3 1.1 Etayi 29 187 9.3 1.5 1.4 46.0 40.1 1.7 Ogongo 16 359 8.1 1.3 0.9 40.7 46.6 2.4 Okahao 14 829 10.0 1.1 1.0 35.1 49.8 3.0 Okalongo 25 422 11.0 1.2 1.4 46.0 38.2 2.1 Onesi 10 851 14.7 1.0 1.5 41.4 39.6 1.8 Oshikuku 7 559 5.4 1.4 0.4 39.0 51.5 2.2 Outapi 30 314 9.9 1.4 1.1 40.8 44.7 2.1 Ruacana 12 104 19.5 1.7 1.2 31.2 42.2 4.2 Tsandi 23 330 10.2 1.4 1.3 38.0 46.1 3.0 Otamanzi 11 228 9.6 1.5 1.9 38.3 45.0 3.7
5.3.2.2 Educational Attainment
Table 5.5 shows that about 48 percent of the population had completed their primary education
and 14 percent had completed secondary education before leaving school, while 32 percent did
not complete primary school. Only 3.5 percent of the population had completed their tertiary
education.
More than 10% of the population aged 6
years and above in rural areas had never
been to school.
About 48% of persons aged 15 years and above
completed primary education before leaving school

Chapter 5: Socio-Economic Characteristics of the Population
2011 Population and Housing Census Regional Profile, Omusati Region 25
Table 5.5 Distribution of the population aged 15 years and above who left school by highest level of educational attainment and sex
Educational Attainment
Sex Percent
Total Female Male Total Female Male
Total 10 4782 60 290 44 492 100.0 100.0 100.0 No Formal Education 2 523 1 497 1 026 2.4 2.5 2.3 Incomplete Primary 33 575 17 622 15 953 32.0 29.2 35.9 Primary 50 353 30 043 20 310 48.1 49.8 45.6 Secondary education 14 678 8 906 5 772 14.0 14.8 13.0 Tertiary 3 638 2 214 1 424 3.5 3.7 3.2 Others 15 8 7 0.0 0.0 0.0
5.3.2.3 School Enrolment
Figure 5.3 iilustrates school enrolment for the school-going population aged 5 - 24 years.
Enrolment rates were highest for the ages of 7 - 15 years, exceeding 80 percent, but dropped
after the age of 17 years. More females than males were enrolled until the age 18 years.
Figure 5.3 School enrolment of the school going population aged 5-24 years by sex
0.0
10.0
20.0
30.0
40.0
50.0
60.0
70.0
80.0
90.0
100.0
5 6 7 8 9 10 11 12 13 14 15 16 17 18 19 20 21 22 23 24
Pe
rce
nt
en
roll
ed
in
sch
oo
l
Age
Female
Male
Over 80% of children in the Omusati Region aged
7 to 15 years were enrolled in school

Chapter 5: Socio-Economic Characteristics of the Population
2011 Population and Housing Census Regional Profile, Omusati Region 26
Table 5.6 presents school enrolment rates for urban and rural areas. The table shows that the
enrolment rates were slightly higher in rural (73.3%) than urban areas (66.1%).
Table 5.6 School enrolment for the population aged 5-24 years by area
Age Population Enrolled Enrolment rate
Total Urban Rural Total Urban Rural Total Urban Rural
Total 117 547 5 659 111 888 85 738 3 739 81 999 72.9 66.1 73.3 5 6 712 229 6 483 2 943 143 2 800 43.8 62.4 43.2 6 5 986 182 5 804 4 549 148 4 401 76.0 81.3 75.8 7 5 776 215 5 561 5 167 198 4 969 89.5 92.1 89.4 8 6 164 235 5 929 5 746 222 5 524 93.2 94.5 93.2 9 6 095 237 5 858 5 629 223 5 406 92.4 94.1 92.3 10 6 329 233 6 096 5 860 223 5 637 92.6 95.7 92.5 11 7 264 255 7 009 6 691 232 6 459 92.1 91.0 92.2 12 6 621 270 6 351 6 027 245 5 782 91.0 90.7 91.0 13 6 729 237 6 492 6 077 223 5 854 90.3 94.1 90.2 14 6 351 246 6 105 5 669 229 5 440 89.3 93.1 89.1 15 6 787 238 6 549 5 905 199 5 706 87.0 83.6 87.1 16 6 926 268 6 658 5 825 246 5 579 84.1 91.8 83.8 17 6 728 378 6 350 5 463 323 5 140 81.2 85.4 80.9 18 7 000 424 6 576 5 002 319 4 683 71.5 75.2 71.2 19 6 076 333 5 743 3 675 189 3 486 60.5 56.8 60.7 20 5 105 329 4 776 2 302 135 2 167 45.1 41.0 45.4 21 4 873 348 4 525 1 637 99 1 538 33.6 28.4 34 22 3 640 319 3 321 828 65 763 22.7 20.4 23 23 3 458 361 3 097 474 45 429 13.7 12.5 13.9 24 2 927 322 2 605 269 33 236 9.2 10.2 9.1
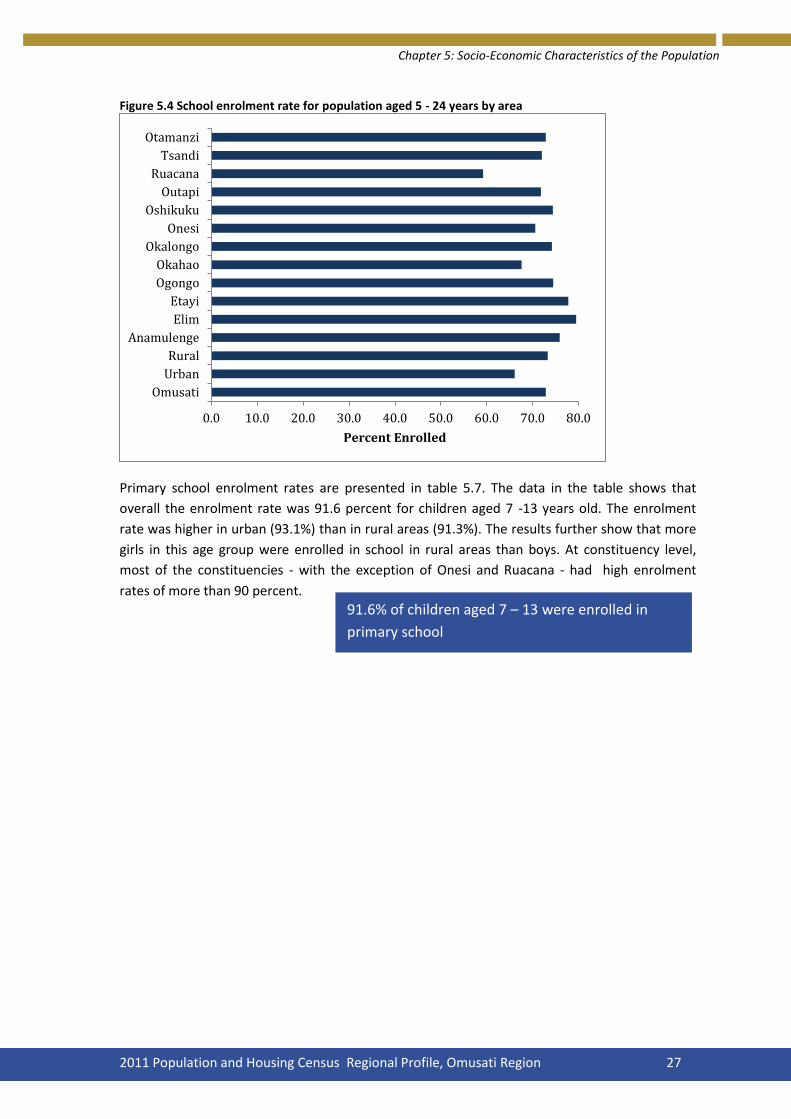
Figure 5.4 presents the school enrolment rate for the population aged 5 - 24 years by area. The
results show that school enrolment was highest in Elim, where it was close to 80 percent. By
contrast, the lowest rate of enrolments were in Ruacana where less than 60 percent of the
population aged 5 –24 years was enrolled at school.
Chapter 5: Socio-Economic Characteristics of the Population
2011 Population and Housing Census Regional Profile, Omusati Region 27
Figure 5.4 School enrolment rate for population aged 5 - 24 years by area
Primary school enrolment rates are presented in table 5.7. The data in the table shows that
overall the enrolment rate was 91.6 percent for children aged 7 -13 years old. The enrolment
rate was higher in urban (93.1%) than in rural areas (91.3%). The results further show that more
girls in this age group were enrolled in school in rural areas than boys. At constituency level,
most of the constituencies - with the exception of Onesi and Ruacana - had high enrolment
rates of more than 90 percent.
0.0 10.0 20.0 30.0 40.0 50.0 60.0 70.0 80.0
Omusati
Urban
Rural
Anamulenge
Elim
Etayi
Ogongo
Okahao
Okalongo
Onesi
Oshikuku
Outapi
Ruacana
Tsandi
Otamanzi
Percent Enrolled
91.6% of children aged 7 – 13 were enrolled in
primary school

Chapter 5: Socio-Economic Characteristics of the Population
2011 Population and Housing Census Regional Profile, Omusati Region 28
Table 5.7 Primary school enrolment for population aged 7-13 years old by area
Area Population Enrolled Enrolment rate
Total Female Male Total Female Male Total Female Male
Omusati 44 978 22 603 22 375 41 197 20 943 20 254 91.6 92.7 90.5 Urban 1 682 940 742 1 566 877 689 93.1 93.3 92.9 Rural 43 296 21 663 21 633 39 631 20 066 19 565 91.5 92.6 90.4 Anamulenge 2 539 1 294 1 245 2 399 1 235 1 164 94.5 95.4 93.5 Elim 1 996 967 1 029 1 890 912 978 94.7 94.3 95.0 Etayi 7 035 3 563 3 472 6 563 3 357 3 206 93.3 94.2 92.3 Ogongo 3 588 1 777 1 811 3 308 1 646 1 662 92.2 92.6 91.8 Okahao 2 916 1 417 1 499 2 634 1 305 1 329 90.3 92.1 88.7 Okalongo 6 378 3 208 3 170 5 773 2 931 2 842 90.5 91.4 89.7 Onesi 2 541 1 237 1 304 2 263 1 111 1 152 89.1 89.8 88.3 Oshikuku 1 436 764 672 1 350 725 625 94.0 94.9 93.0 Outapi 6 747 3 433 3 314 6 212 3 192 3 020 92.1 93.0 91.1 Ruacana 2 574 1 327 1 247 2 123 1 138 985 82.5 85.8 79.0 Tsandi 4 883 2 406 2 477 4 510 2 250 2 260 92.4 93.5 91.2 Otamanzi 2 345 1 210 1 135 2 172 1 141 1 031 92.6 94.3 90.8

Chapter 5: Socio-Economic Characteristics of the Population
2011 Population and Housing Census Regional Profile, Omusati Region 29
5.4 Disability
Disability is defined as a long-term physical, psychological or mental condition that limits a
person from carrying out everyday activities at home, work or school. It may be present from
birth or develop during a person's lifetime. Information on disability assists government in
planning infrastructure, education systems and community awareness programmes amongst
others.
During the Census, all persons in private households and institutions were asked about the types
of long-term permanent disabilities or limitatiosn that they had. Ten types of disabilities were
identified for this purpose: blindness; visual impairment; deafness; hearing difficulties;
muteness/dumbness; speech impairment; physical impairments of lower and upper limbs;
mental disability; albinism and autism.
Table 5.8 indicates that 6.3 percent of the total population in Omusati region had disabilities.
The proportion of people living with disabilities was higher in rural (6.4%) than in urban areas
(4.2%). Constituency figures show that Tsandi and Otamanzi had the highest proportion of
disabled people - each with 7.4 percent. Elim had the lowest proportion of disabled people with
5.3 percent.
Table 5.8 Population with disabilities by sex and area
Area Population Population with disability Percent
Total Female Male Total Female Male Total Female Male
Omusati 242 394 133 303 109 091 15 230 8 175 7 055 6.3 6.1 6.5
Urban 13 288 7 592 5 696 557 281 276 4.2 3.7 4.8 Rural 229 106 125 711 103 395 14 673 7 894 6 779 6.4 6.3 6.6
Anamulenge 13 331 7 481 5 850 887 481 406 6.7 6.4 6.9 Elim 11 377 6 299 5 078 601 334 267 5.3 5.3 5.3 Etayi 35 101 19 610 15 491 2 052 1 121 931 5.8 5.7 6.0 Ogongo 19 546 10 802 8 744 1 049 554 495 5.4 5.1 5.7 Okahao 17 485 9 497 7 988 1 046 550 496 6.0 5.8 6.2 Okalongo 30 597 17 017 13 580 1 948 1 094 854 6.4 6.4 6.3 Onesi 13 140 7 162 5 978 753 381 372 5.7 5.3 6.2 Oshikuku 8 887 5 104 3 783 500 284 216 5.6 5.6 5.7 Outapi 36 674 20 198 16 476 2 458 1 303 1 155 6.7 6.5 7.0 Ruacana 14 808 7 325 7 483 853 373 480 5.8 5.1 6.4 Tsandi 27 953 15 346 12 607 2 080 1 159 921 7.4 7.6 7.3 Otamanzi 13 495 7 462 6 033 1 003 541 462 7.4 7.3 7.7
Table 5.9 shows that visual and physical impairment (of which impairment of lower limbs
accounted for the most common type of physical impairement) affected 23.5 percent of the
population with disabilities. The least common types of disabilities were albinism and autism,
each of which was reported to affect about 1 percent of people with disabilities.
6.3% of the Omusati Region’s
population had disabilities

Chapter 5: Socio-Economic Characteristics of the Population
2011 Population and Housing Census Regional Profile, Omusati Region 30
Table 5.9 Population with disability by type and sex
Type of disability Number Percent
Total* Female Male Total Female Male
Total* 15 230 8 175 7 055 Blindness 2 090 1 194 896 13.7 14.6 12.7 Visual Impairment 2 373 1 439 934 15.6 17.6 13.2 Deafness 912 480 432 6.0 5.9 6.1 Hearing Difficulties 1 462 883 579 9.6 10.8 8.2 Mute/Dumb 864 458 406 5.7 5.6 5.8 Speech Impairment 916 429 487 6.0 5.2 6.9 Physical Impairment - Upper Limbs
1 861 904 957 12.2 11.1 13.6
Physical Impairment - Lower Limbs
3 581 1 862 1 719 23.5 22.8 24.4
Mental Disability 2 318 1 137 1 181 15.2 13.9 16.7 Albinism 172 98 74 1.1 1.2 1.0 Autism 214 105 109 1.4 1.3 1.5 Other 831 440 391 5.5 5.4 5.5 Don't Know 31 18 13 0.2 0.2 0.2
Note: “Total* is the number of persons with a disability. This is not the total in the column as some persons had multiple disabilities
Table 5.10 indicates that in urban areas the highest proportion of people with disabilities were
those with impairment of lower limbs (17.8%). The highest proportion in rural areas was
impairment of lower limbs (17.8%), while the least common types of disabilities were albinism
and autism, of which each was reported to have affected about less than 2 percent of the
population with disabilities.
Table 5.10 Percentage of distribution of disabled population by type and area
Type of disability Omusati Urban Rural
Total 15 230 557 14 673 Blindness 13.3 8.1 13.5 Visual Impairment 14.5 14.9 14.5 Deafness 5.4 3.9 5.4 Hearing Difficulties 7.4 4.5 7.5 Mute/Dumb 4.9 5.9 4.8 Speech Impairment 4.9 5.2 4.9 Physical Impairment - Upper Limbs 10.8 12.9 10.7 Physical Impairment - Lower Limbs 17.8 21.4 17.7 Mental Disability 13.6 13.6 13.6 Albinism 1.1 1.3 1.1 Autism 1.2 1.1 1.2 Other 5.0 7.2 5 Don't Know 0.2 0.0 0.2
Table 5.11 shows that in Omusati Region, about 46 percent of the population with disabilities
also had difficulty engaging in any learning and/or economic activity. There were slight
differences between males and females in this respect. A higher proportion of people with
disabilities and learning difficulties were observed in rural (46.0%) than in urban areas (40.0%).

Chapter 5: Socio-Economic Characteristics of the Population
2011 Population and Housing Census Regional Profile, Omusati Region 31
Table 5.11 Disabled population with difficulties engaging in learning and/or economic activities by sex and area
Area Disabled Inability Percent
Total Female Male Total Female Male Total Female Male
Omusati 15 230 8 175 7 055 6 970 3 788 3 182 45.8 46.3 45.1
Urban 557 281 276 225 123 102 40.4 43.8 37.0 Rural 14 673 7 894 6 779 6 745 3 665 3 080 46.0 46.4 45.4
Anamulenge 887 481 406 453 253 200 51.1 52.6 49.3 Elim 601 334 267 318 172 146 52.9 51.5 54.7 Etayi 2 052 1 121 931 984 558 426 48.0 49.8 45.8 Ogongo 1 049 554 495 520 284 236 49.6 51.3 47.7 Okahao 1 046 550 496 531 278 253 50.8 50.5 51.0 Okalongo 1 948 1 094 854 740 408 332 38.0 37.3 38.9 Onesi 753 381 372 318 184 134 42.2 48.3 36.0 Oshikuku 500 284 216 206 122 84 41.2 43.0 38.9 Outapi 2 458 1 303 1 155 1 140 604 536 46.4 46.4 46.4 Ruacana 853 373 480 328 151 177 38.5 40.5 36.9 Tsandi 2 080 1 159 921 956 518 438 46.0 44.7 47.6 Otamanzi 1 003 541 462 476 256 220 47.5 47.3 47.6
Table 5.12 shows that 87 percent of the population with disabilities was affected by one type of disability, while 13.3 percent were affected by more than one type of disability.
Table 5.12 Population distribution with multiple disabilities by area
Number Percent
Area Total With one
disability
With more
than one disability
With one
disability
With more
than one disability
Omusati 15 230 13 207 2 023 86.7 13.3
Urban 557 518 39 93.0 7.0 Rural 14 673 12 689 1 984 86.5 13.5
Anamulenge 887 746 141 84.1 15.9 Elim 601 522 79 86.9 13.1 Etayi 2 052 1 794 258 87.4 12.6 Ogongo 1 049 906 143 86.4 13.6 Okahao 1 046 889 157 85.0 15.0 Okalongo 1 948 1 684 264 86.4 13.6 Onesi 753 673 80 89.4 10.6 Oshikuku 500 450 50 90.0 10.0 Outapi 2 458 2 127 331 86.5 13.5 Ruacana 853 763 90 89.4 10.6 Tsandi 2 080 1 800 280 86.5 13.5 Otamanzi 1 003 853 150 85.0 15.0
16.7% of children in the Omusati Region
had lost one parent
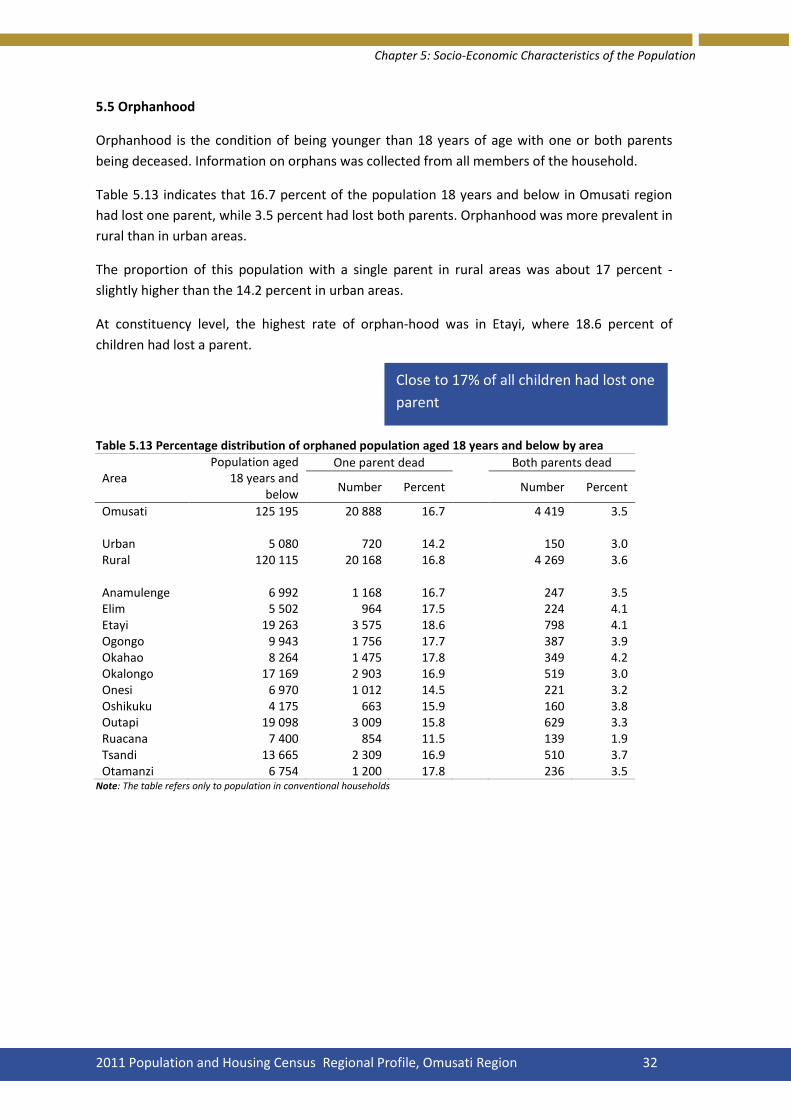
Chapter 5: Socio-Economic Characteristics of the Population
2011 Population and Housing Census Regional Profile, Omusati Region 32
5.5 Orphanhood
Orphanhood is the condition of being younger than 18 years of age with one or both parents
being deceased. Information on orphans was collected from all members of the household.
Table 5.13 indicates that 16.7 percent of the population 18 years and below in Omusati region
had lost one parent, while 3.5 percent had lost both parents. Orphanhood was more prevalent in
rural than in urban areas.
The proportion of this population with a single parent in rural areas was about 17 percent -
slightly higher than the 14.2 percent in urban areas.
At constituency level, the highest rate of orphan-hood was in Etayi, where 18.6 percent of
children had lost a parent.
Table 5.13 Percentage distribution of orphaned population aged 18 years and below by area
Area Population aged
18 years and below
One parent dead Both parents dead
Number Percent Number Percent
Omusati 125 195 20 888 16.7 4 419 3.5 Urban 5 080 720 14.2 150 3.0 Rural 120 115 20 168 16.8 4 269 3.6 Anamulenge 6 992 1 168 16.7 247 3.5 Elim 5 502 964 17.5 224 4.1 Etayi 19 263 3 575 18.6 798 4.1 Ogongo 9 943 1 756 17.7 387 3.9 Okahao 8 264 1 475 17.8 349 4.2 Okalongo 17 169 2 903 16.9 519 3.0 Onesi 6 970 1 012 14.5 221 3.2 Oshikuku 4 175 663 15.9 160 3.8 Outapi 19 098 3 009 15.8 629 3.3 Ruacana 7 400 854 11.5 139 1.9 Tsandi 13 665 2 309 16.9 510 3.7 Otamanzi 6 754 1 200 17.8 236 3.5
Note: The table refers only to population in conventional households
Close to 17% of all children had lost one
parent
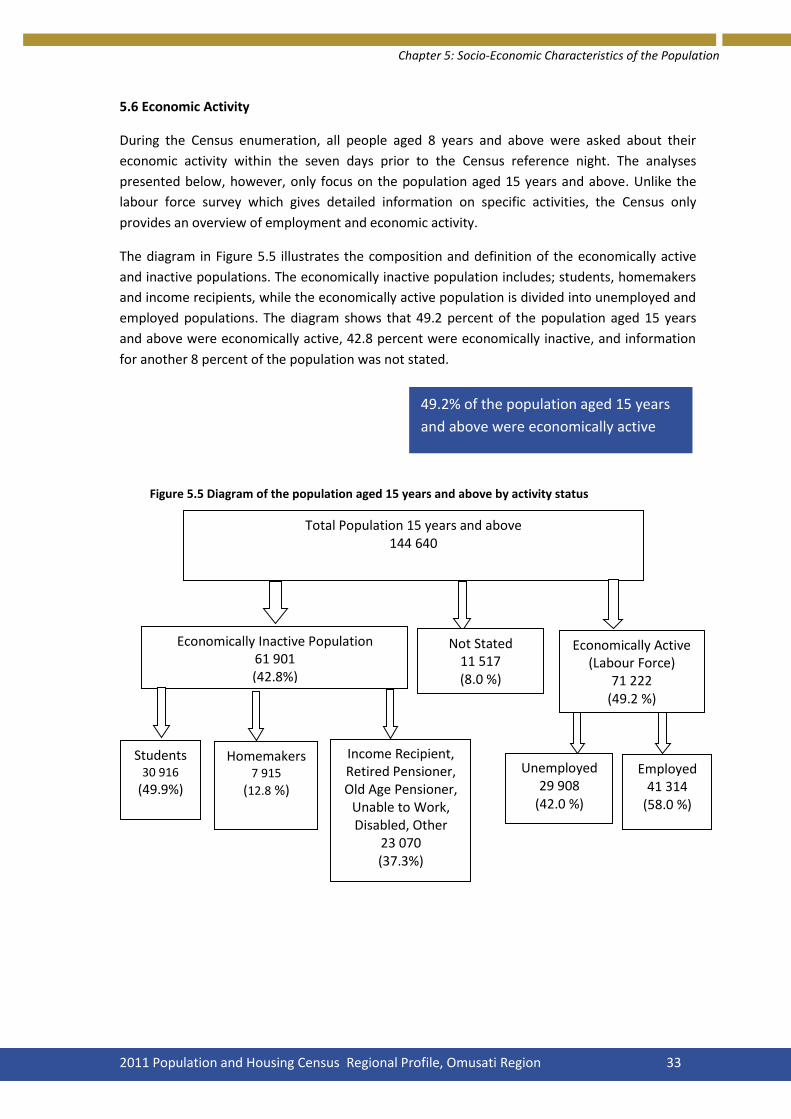
Chapter 5: Socio-Economic Characteristics of the Population
2011 Population and Housing Census Regional Profile, Omusati Region 33
5.6 Economic Activity
During the Census enumeration, all people aged 8 years and above were asked about their
economic activity within the seven days prior to the Census reference night. The analyses
presented below, however, only focus on the population aged 15 years and above. Unlike the
labour force survey which gives detailed information on specific activities, the Census only
provides an overview of employment and economic activity.
The diagram in Figure 5.5 illustrates the composition and definition of the economically active
and inactive populations. The economically inactive population includes; students, homemakers
and income recipients, while the economically active population is divided into unemployed and
employed populations. The diagram shows that 49.2 percent of the population aged 15 years
and above were economically active, 42.8 percent were economically inactive, and information
for another 8 percent of the population was not stated.
Figure 5.5 Diagram of the population aged 15 years and above by activity status
Total Population 15 years and above 144 640
Economically Inactive Population 61 901 (42.8%)
Not Stated 11 517 (8.0 %)
Economically Active (Labour Force)
71 222 (49.2 %)
Students 30 916
(49.9%)
Homemakers 7 915
(12.8 %)
Income Recipient, Retired Pensioner, Old Age Pensioner,
Unable to Work, Disabled, Other
23 070 (37.3%)
Unemployed 29 908
(42.0 %)
Employed 41 314
(58.0 %)
49.2% of the population aged 15 years
and above were economically active
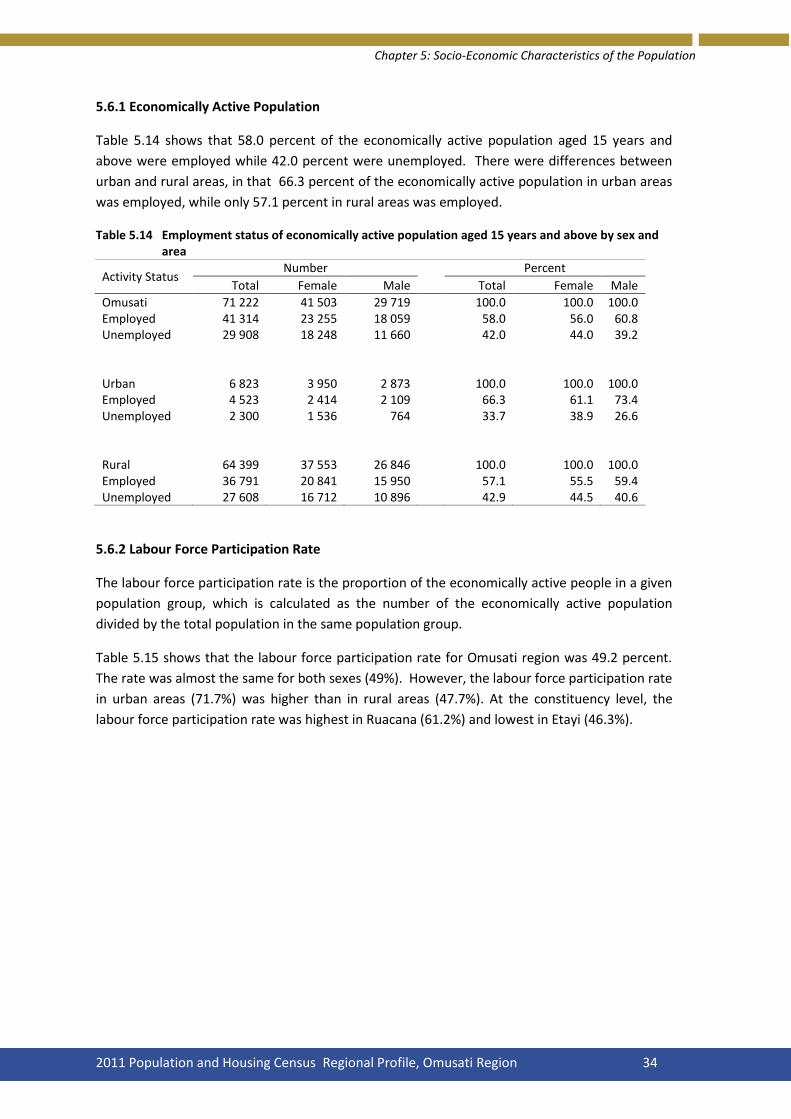
Chapter 5: Socio-Economic Characteristics of the Population
2011 Population and Housing Census Regional Profile, Omusati Region 34
5.6.1 Economically Active Population
Table 5.14 shows that 58.0 percent of the economically active population aged 15 years and
above were employed while 42.0 percent were unemployed. There were differences between
urban and rural areas, in that 66.3 percent of the economically active population in urban areas
was employed, while only 57.1 percent in rural areas was employed.
Table 5.14 Employment status of economically active population aged 15 years and above by sex and area
Activity Status Number Percent
Total Female Male Total Female Male
Omusati 71 222 41 503 29 719 100.0 100.0 100.0 Employed 41 314 23 255 18 059 58.0 56.0 60.8 Unemployed 29 908 18 248 11 660 42.0 44.0 39.2 Urban 6 823 3 950 2 873 100.0 100.0 100.0 Employed 4 523 2 414 2 109 66.3 61.1 73.4 Unemployed 2 300 1 536 764 33.7 38.9 26.6 Rural 64 399 37 553 26 846 100.0 100.0 100.0 Employed 36 791 20 841 15 950 57.1 55.5 59.4 Unemployed 27 608 16 712 10 896 42.9 44.5 40.6
5.6.2 Labour Force Participation Rate
The labour force participation rate is the proportion of the economically active people in a given
population group, which is calculated as the number of the economically active population
divided by the total population in the same population group.
Table 5.15 shows that the labour force participation rate for Omusati region was 49.2 percent.
The rate was almost the same for both sexes (49%). However, the labour force participation rate
in urban areas (71.7%) was higher than in rural areas (47.7%). At the constituency level, the
labour force participation rate was highest in Ruacana (61.2%) and lowest in Etayi (46.3%).

Chapter 5: Socio-Economic Characteristics of the Population
2011 Population and Housing Census Regional Profile, Omusati Region 35
Table 5.15 Labour Force Participation Rate for population aged 15 years and above by sex and area
Area Population aged 15 and above In Labour force Labour Force Participation
Total Female Male Total Female Male Total Female Male
Omusati 144 640 84 088 60 552 71 222 41 503 29 719 49.2 49.4 49.1
Urban 9 516 5 534 3 982 6 823 3 950 2 873 71.7 71.4 72.1 Rural 135 124 78 554 56 570 64 399 37 553 26 846 47.7 47.8 47.5
Anamulenge 7 888 4 665 3 223 4 098 2 453 1 645 52.0 52.6 51.0 Elim 7 082 4 165 2 917 3 540 2 115 1 425 50.0 50.8 48.9 Etayi 20 256 12 180 8 076 9 370 5 847 3 523 46.3 48.0 43.6 Ogongo 11 806 6 973 4 833 5 571 3 249 2 322 47.2 46.6 48.0 Okahao 11 074 6 383 4 691 5 562 3 071 2 491 50.2 48.1 53.1 Okalongo 17 335 10 382 6 953 7 247 4 517 2 730 41.8 43.5 39.3 Onesi 7 566 4 361 3 205 4 125 2 404 1 721 54.5 55.1 53.7 Oshikuku 5 709 3 439 2 270 3 133 1 967 1 166 54.9 57.2 51.4 Outapi 21 775 12 610 9 165 10 808 6 213 4 595 49.6 49.3 50.1 Ruacana 8 786 4 270 4 516 5 379 2 512 2 867 61.2 58.8 63.5 Tsandi 17 125 9 883 7 242 8 242 4 791 3 451 48.1 48.5 47.7 Otamanzi 8 238 4 777 3 461 4 147 2 364 1 783 50.3 49.5 51.5
5.6.3 Employment by main occupation
Table 5.16 shows that skilled agricultural and fishery workers made up the largest occupation
group (48.5%), followed by service workers (11.5%) and professionals (10.6 %). There were
significant differences between females and males in the top three occupational groups. 54.1
percent of the jobs held by women were in the ‘skilled agricultural/fishery’ workers category.
However, more males (12.4%) than females (2.5%) worked in the craft and related trade
occupations. On the other hand, more females worked as professionals and clerks than males.
Table 5.16 Main occupation of employed population aged 15 years and above by sex
Main Occupation Employed population Percent
Total Female Male Total Female Male
Total 41 314 23 255 18 059
100.0 100.0 100.0
Armed force 1 282 316 966
3.1 1.4 5.3 Legislators senior officials and Managers
438 175 263
1.1 0.8 1.5
Professionals 4 376 2 812 1 564
10.6 12.1 8.7 Technician and associate professionals
1 501 861 640
3.6 3.7 3.5
Clerk 919 708 211
2.2 3.0 1.2 Service Workers 4 858 2 755 2 103
11.8 11.8 11.6
Skilled Agricultural and Fishery workers
20 018 12 578 7 440
48.5 54.1 41.2
Craft and Related trades workers 2 833 589 2 244
6.9 2.5 12.4 Plant and Machine operators and assemblers
877 69 808
2.1 0.3 4.5
Elementary occupations 4 189 2 380 1 809
10.1 10.2 10.0 Don't Know 23 12 11 0.1 0.1 0.1
Skilled agricultural/fishery workers made up
the largest occupation group with 48.5%

Chapter 5: Socio-Economic Characteristics of the Population
2011 Population and Housing Census Regional Profile, Omusati Region 36
5.6.4 Employment by Industry
Table 5.17 shows the figures for the employed population by main industries and sex at a
regional level. The result shows that in Omusati region, Agriculture, Forestry and Fishing were
the main industry (50.3%) of the work force, followed by Education (9.4%). Administrative and
Support service activities employed about 6 percent of the workforce.
Education, Wholesale and Retail trade, Accommodation and Food serving activities; Human
Health and Social work activities were clearly the domain of women, while men predominantly
worked in Mining, Construction and the Transportion industry.
Table 5.17 Main industry of employed population aged 15 years and above by sex
Main Industry Employed population Percent
Total Female Male Total Female Male
Total 41 314 23 255 18 059 100.0 100.0 100.0 Agriculture Forestry and Fishing 20 797 12 698 8 099 50.3 54.6 44.8 Mining And Quarrying 428 58 370 1.0 0.2 2.0 Manufacturing 955 413 542 2.3 1.8 3.0 Electricity Gas Steam and Air conditioning supply 30 7 23 0.1 - 0.1 Water Supply Sewerage Waste Management and Remediation activities 70 32 38 0.2 0.1 0.2 Construction 1 807 168 1 639 4.4 0.7 9.1 Wholesale and Retail trade; Repair of motor vehicles and motorcycles 1 482 1 001 481 3.6 4.3 2.7 Transportation and Storage 826 68 758 2.0 0.3 4.2 Accomondation and Food Service activities 892 691 201 2.2 3.0 1.1 Information and Communication 136 83 53 0.3 0.4 0.3 Financial Insurance Activities 210 140 70 0.5 0.6 0.4 Real estate Activities 5 2 3 - - - Professional Scientific and Technical activities 284 118 166 0.7 0.5 0.9 Administrative and Support service activities 2 526 1 381 1 145 6.1 5.9 6.3 Public Administration and Defence; compulsory social security 2 470 870 1 600 6.0 3.7 8.9 Education 3 873 2 637 1 236 9.4 11.3 6.8 Human Health and Social work activities 1 127 830 297 2.7 3.6 1.6 Arts Entertainment and Recreation 92 50 42 0.2 0.2 0.2 Other Services activities 1 249 740 509 3.0 3.2 2.8 Activities of Private Households 1 893 1 198 695 4.6 5.2 3.8 Activities of extraterritorial organisation and bodies 13 11 2 - - - Don't Know 149 59 90 0.4 0.3 0.5

Chapter 5: Socio-Economic Characteristics of the Population
2011 Population and Housing Census Regional Profile, Omusati Region 37
5.6.5 Employment by Educational Attainment
Table 5.18 shows that about 32 percent of the employed population in the region had
completed their primary education. About 14 percent of the employed population had not
completed their primary school education. Women, on average, were better educated than
men. About 34 percent of employed women had completed their primary education and about 9
percent had completed their tertiary education compared to 29 percent and 7 percent of men
respectively.
Table 5.18 Educational attainment of employed population aged 15 years and above by sex
Educational Attainment Employed population Percent
Total Female Male Total Female Male
Total 41 314 23 255 18 059 100.0 100.0 100.0 No Formal Education 5 599 2 910 2 689 13.6 12.5 14.9 Incomplete Primary education
11 242 5 833 5 409
27.2 25.1 30.0
Primary education 13 027 7 887 5 140 31.5 33.9 28.5 Secondary education 7 329 4 230 3 099 17.7 18.2 17.2 Tertiary education 3 314 2 012 1 302 8.0 8.7 7.2 Others 8 4 4 0.0 0.0 0.0 Don't Know 795 379 416 1.9 1.6 2.3
5.6.6 Main Job Undertaken
The results in Table 5.19 show that the subsistence/communal farmer (without paid employees)
provided jobs to the largest proportion of employees (47.9%) in the Omusati Region. The lowest
main jobs were employees of commercial farms, who comprised 0.3 percent of the employed
population. It is observed that more men than women were employed by the private sector,
while subsistence farming (without paid employees) was dominated by women.
Table 5.19 Main job of the employed population aged 15 years and above by sex
Main job Employed population Percent
Total Female Male Total Female Male
Total 41 314 23 255 18 059 100.0 100.0 100.0 Subsistence/Communal Farmer (With Paid Employees) 1 002 371 631 2.4 1.6 3.5 Subsistence/Communal Farmer (Without Paid Employees) 19 801 12 771 7 030 47.9 54.9 38.9 Commercial Farmer (With Paid Employees) 121 69 52 0.3 0.3 0.3 Other Employer 510 270 240 1.2 1.2 1.3 Own Account Worker 796 425 371 1.9 1.8 2.1 Employee (Communal Farms) 661 158 503 1.6 0.7 2.8 Employee (Commercial Farms) 436 189 247 1.1 0.8 1.4 Employee (Government) 8 571 4 755 3 816 20.7 20.4 21.1 Employee (Parastatal) 1 620 588 1 032 3.9 2.5 5.7 Employee (Private) 6 892 3 127 3 765 16.7 13.4 20.8 Unpaid Family Worker (Subsistence/Communal) 521 339 182 1.3 1.5 1.0 Other Unpaid Family Worker 184 108 76 0.4 0.5 0.4 Other 124 59 65 0.3 0.3 0.4 Don't Know 75 26 49 0.2 0.1 0.3

Chapter 5: Socio-Economic Characteristics of the Population
2011 Population and Housing Census Regional Profile, Omusati Region 38
5.6.7 Unemployment
The unemployment rate is the proportion of the unemployed population in the labour force for
a given population group (i.e. the number of the unemployed population divided by the
population in the labour force in the same population group).
Figure 5.7 shows the distribution of the unemployed population in terms of their level of
educational attainment. The results show that about 42 percent of the unemployed population
had completed their primary education, 16.9 percent had completed their secondary education
and 0.8 percent completed their tertiary education. Those with no formal education constituted
around 10 percent of the unemployed population.
Figure 5.6 Percent distribution of unemployed population aged 15 years and above by educational attainment
Table 5.20 shows that 34.5 percent of the unemployed population were actively looking for
work. The proportion of females looking for work was higher than males (35.5% and 33.2%
respectively). The proportion of job seekers in urban areas was higher than in rural areas (36.1%
and 19.1% respectively).
At constituency level, a higher proportion of unemployed females were actively looking for work
than males in all constituencies with the exception of Elim. Onesi had the highest proportion of
job seekers (53.9%), while Ruacana had the lowest proportion of job seekers (25.0%).
Primary, 42.2
Incomplete primary, 28.2
No formal education, 10.2
Don’t know, 1.1
Others, 0.0
Tertiary, 0.8
Secondary education, 16.9
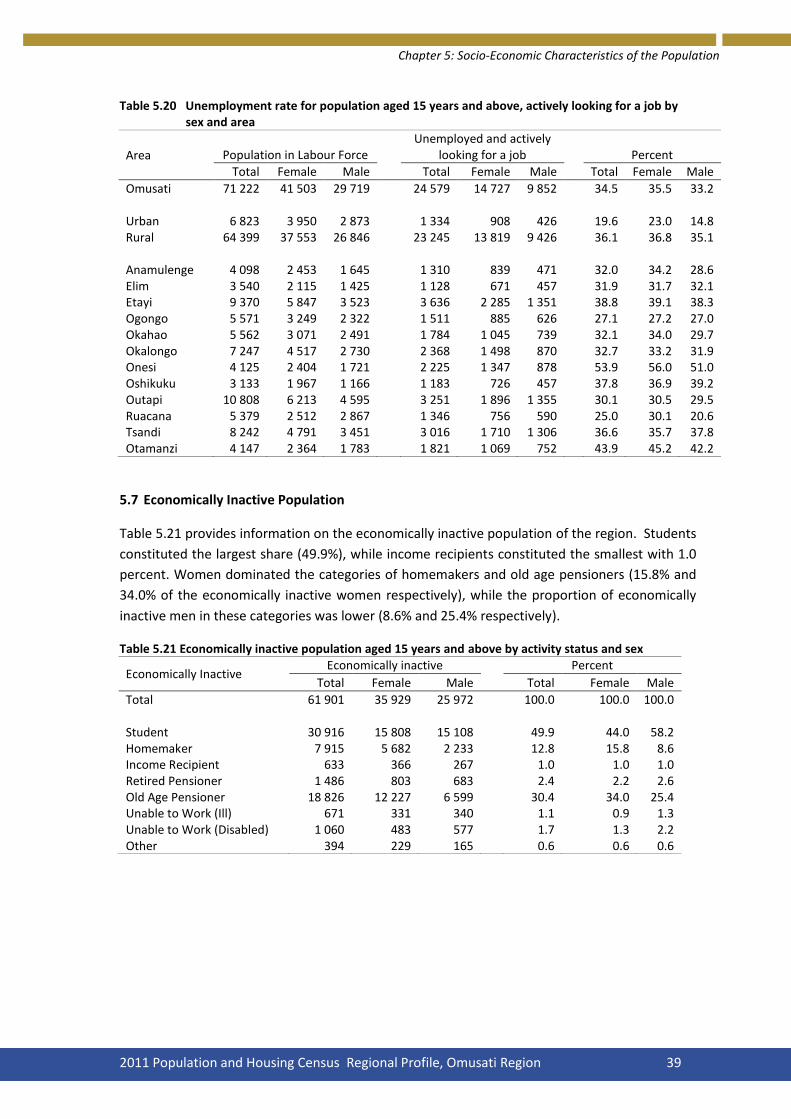
Chapter 5: Socio-Economic Characteristics of the Population
2011 Population and Housing Census Regional Profile, Omusati Region 39
Table 5.20 Unemployment rate for population aged 15 years and above, actively looking for a job by sex and area
Area Population in Labour Force Unemployed and actively
looking for a job Percent
Total Female Male Total Female Male Total Female Male
Omusati 71 222 41 503 29 719 24 579 14 727 9 852 34.5 35.5 33.2
Urban 6 823 3 950 2 873 1 334 908 426 19.6 23.0 14.8 Rural 64 399 37 553 26 846 23 245 13 819 9 426 36.1 36.8 35.1
Anamulenge 4 098 2 453 1 645 1 310 839 471 32.0 34.2 28.6 Elim 3 540 2 115 1 425 1 128 671 457 31.9 31.7 32.1 Etayi 9 370 5 847 3 523 3 636 2 285 1 351 38.8 39.1 38.3 Ogongo 5 571 3 249 2 322 1 511 885 626 27.1 27.2 27.0 Okahao 5 562 3 071 2 491 1 784 1 045 739 32.1 34.0 29.7 Okalongo 7 247 4 517 2 730 2 368 1 498 870 32.7 33.2 31.9 Onesi 4 125 2 404 1 721 2 225 1 347 878 53.9 56.0 51.0 Oshikuku 3 133 1 967 1 166 1 183 726 457 37.8 36.9 39.2 Outapi 10 808 6 213 4 595 3 251 1 896 1 355 30.1 30.5 29.5 Ruacana 5 379 2 512 2 867 1 346 756 590 25.0 30.1 20.6 Tsandi 8 242 4 791 3 451 3 016 1 710 1 306 36.6 35.7 37.8 Otamanzi 4 147 2 364 1 783 1 821 1 069 752 43.9 45.2 42.2
5.7 Economically Inactive Population
Table 5.21 provides information on the economically inactive population of the region. Students
constituted the largest share (49.9%), while income recipients constituted the smallest with 1.0
percent. Women dominated the categories of homemakers and old age pensioners (15.8% and
34.0% of the economically inactive women respectively), while the proportion of economically
inactive men in these categories was lower (8.6% and 25.4% respectively).
Table 5.21 Economically inactive population aged 15 years and above by activity status and sex
Economically Inactive Economically inactive Percent
Total Female Male Total Female Male
Total 61 901 35 929 25 972 100.0 100.0 100.0 Student 30 916 15 808 15 108 49.9 44.0 58.2 Homemaker 7 915 5 682 2 233 12.8 15.8 8.6 Income Recipient 633 366 267 1.0 1.0 1.0 Retired Pensioner 1 486 803 683 2.4 2.2 2.6 Old Age Pensioner 18 826 12 227 6 599 30.4 34.0 25.4 Unable to Work (Ill) 671 331 340 1.1 0.9 1.3 Unable to Work (Disabled) 1 060 483 577 1.7 1.3 2.2 Other 394 229 165 0.6 0.6 0.6
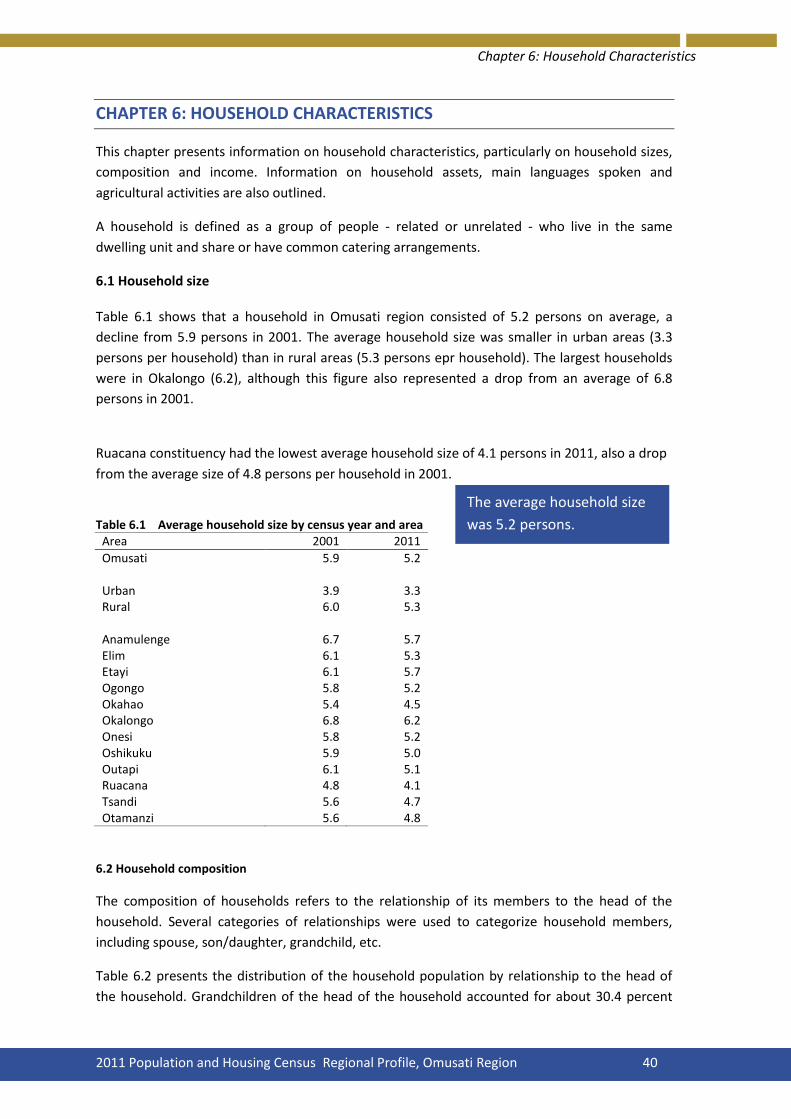
Chapter 6: Household Characteristics
2011 Population and Housing Census Regional Profile, Omusati Region 40
CHAPTER 6: HOUSEHOLD CHARACTERISTICS
This chapter presents information on household characteristics, particularly on household sizes,
composition and income. Information on household assets, main languages spoken and
agricultural activities are also outlined.
A household is defined as a group of people - related or unrelated - who live in the same
dwelling unit and share or have common catering arrangements.
6.1 Household size Table 6.1 shows that a household in Omusati region consisted of 5.2 persons on average, a
decline from 5.9 persons in 2001. The average household size was smaller in urban areas (3.3
persons per household) than in rural areas (5.3 persons epr household). The largest households
were in Okalongo (6.2), although this figure also represented a drop from an average of 6.8
persons in 2001.
Ruacana constituency had the lowest average household size of 4.1 persons in 2011, also a drop
from the average size of 4.8 persons per household in 2001.
Table 6.1 Average household size by census year and area
Area 2001 2011
Omusati 5.9 5.2
Urban 3.9 3.3 Rural 6.0 5.3
Anamulenge 6.7 5.7 Elim 6.1 5.3 Etayi 6.1 5.7 Ogongo 5.8 5.2 Okahao 5.4 4.5 Okalongo 6.8 6.2 Onesi 5.8 5.2 Oshikuku 5.9 5.0 Outapi 6.1 5.1 Ruacana 4.8 4.1 Tsandi 5.6 4.7 Otamanzi 5.6 4.8
6.2 Household composition
The composition of households refers to the relationship of its members to the head of the
household. Several categories of relationships were used to categorize household members,
including spouse, son/daughter, grandchild, etc.
Table 6.2 presents the distribution of the household population by relationship to the head of
the household. Grandchildren of the head of the household accounted for about 30.4 percent
The average household size
was 5.2 persons.

Chapter 6: Household Characteristics
2011 Population and Housing Census Regional Profile, Omusati Region 41
while sons and daughters (26.0%) and other relatives (14.1%) made up other significant
proportions of household membership. Only 5.8 percent of household members were spouses.
Table 6.2 Household population by sex and relationship to the head of household
Relationship to Head Number Percent
Total Female Male Total Female Male
Household population 240 791 132 530 108 261 100.0 100.0 100.0
Head 46 698 25 806 20 892 19.4 19.5 19.3 Spouse 13 932 12 679 1 253 5.8 9.6 1.2 Son/Daughter 61 879 32 886 28 993 25.7 24.8 26.8 Son/Daughter in Law 2 285 1 528 757 0.9 1.2 0.7 Grand Child 73 196 36 803 36 393 30.4 27.8 33.6 Parent 1 016 820 196 0.4 0.6 0.2 Other Relative 34 057 18 074 15 983 14.1 13.6 14.8 Domestic Worker 2 525 1 219 1 306 1.0 0.9 1.2 Other Non-Relative 5 042 2 631 2 411 2.1 2.0 2.2 Don't Know 161 84 77 0.1 0.1 0.1
Note: *This table refers only to conventional/private households
6.2.1 Sex of the Head of Household.
Table 6.3 shows that about 55 percent of households in Omusati region were headed by women.
A similar trend was observed at urban, rural and constituency levels.
Table 6.3 Percent distribution of household head by sex and area
Area Households Sex of head
Female Male
Omusati 46 698 55.3 44.7 Urban 3 774 55.5 44.5 Rural 42 924 55.2 44.8 Anamulenge 2 340 56.2 43.8 Elim 2 132 58.4 41.6 Etayi 6 162 60.8 39.2 Ogongo 3 753 56.2 43.8 Okahao 3 799 52.8 47.2 Okalongo 4 889 61.4 38.6 Onesi 2 527 55.0 45.0 Oshikuku 1 736 58.3 41.7 Outapi 7 117 54.4 45.6 Ruacana 3 520 40.6 59.4 Tsandi 5 886 54.1 45.9 Otamanzi 2 837 52.6 47.4
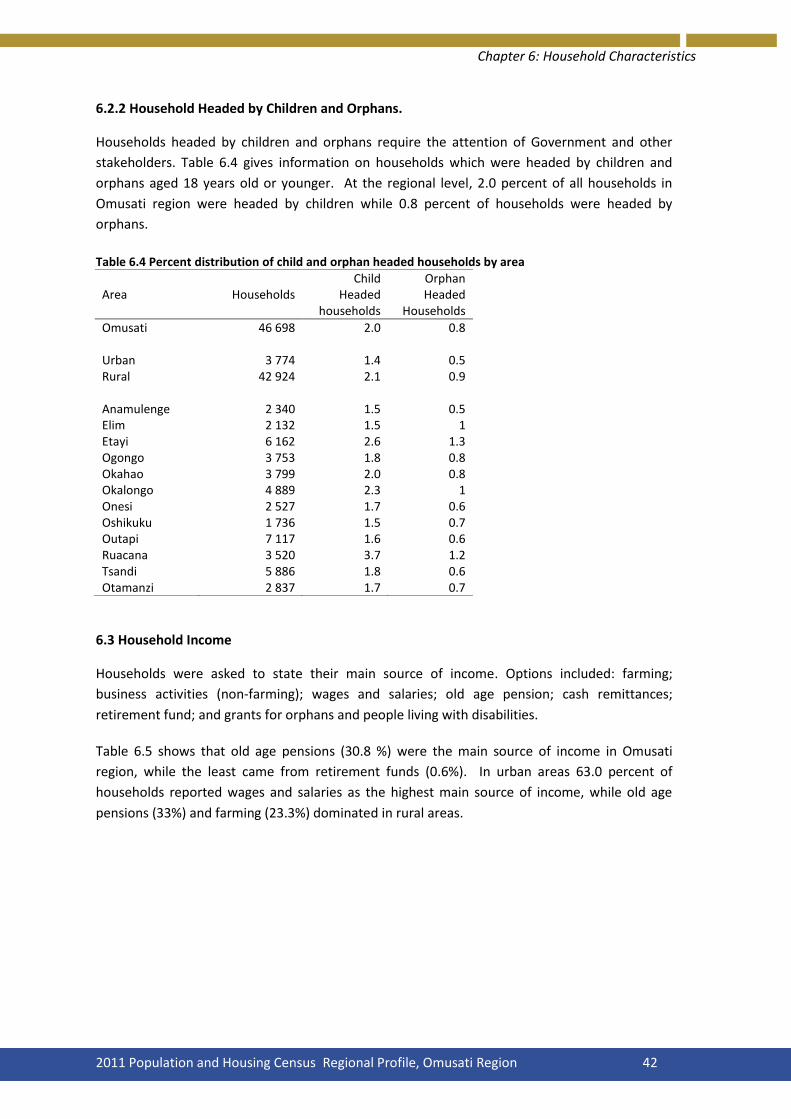
Chapter 6: Household Characteristics
2011 Population and Housing Census Regional Profile, Omusati Region 42
6.2.2 Household Headed by Children and Orphans.
Households headed by children and orphans require the attention of Government and other
stakeholders. Table 6.4 gives information on households which were headed by children and
orphans aged 18 years old or younger. At the regional level, 2.0 percent of all households in
Omusati region were headed by children while 0.8 percent of households were headed by
orphans.
Table 6.4 Percent distribution of child and orphan headed households by area
Area Households Child
Headed households
Orphan Headed
Households
Omusati 46 698 2.0 0.8
Urban 3 774 1.4 0.5 Rural 42 924 2.1 0.9
Anamulenge 2 340 1.5 0.5 Elim 2 132 1.5 1 Etayi 6 162 2.6 1.3 Ogongo 3 753 1.8 0.8 Okahao 3 799 2.0 0.8 Okalongo 4 889 2.3 1 Onesi 2 527 1.7 0.6 Oshikuku 1 736 1.5 0.7 Outapi 7 117 1.6 0.6 Ruacana 3 520 3.7 1.2 Tsandi 5 886 1.8 0.6 Otamanzi 2 837 1.7 0.7
6.3 Household Income
Households were asked to state their main source of income. Options included: farming;
business activities (non-farming); wages and salaries; old age pension; cash remittances;
retirement fund; and grants for orphans and people living with disabilities.
Table 6.5 shows that old age pensions (30.8 %) were the main source of income in Omusati
region, while the least came from retirement funds (0.6%). In urban areas 63.0 percent of
households reported wages and salaries as the highest main source of income, while old age
pensions (33%) and farming (23.3%) dominated in rural areas.

Chapter 6: Household Characteristics
2011 Population and Housing Census Regional Profile, Omusati Region 43
Table 6.5 Percent distribution of households main source of income and area
Area Households
Farming
Business Activity –
non Farming
Wages and
Salaries Old-Age Pension
Cash Remittances
Retirement Fund
Orphan's Grant
Disability Grant Others
Omusati 46 698 22.0 10.4 25.4 30.8 5.0 0.6 2.8 1.0 1.9 Urban 3 774 7.1 15.7 63.0 4.3 4.9 1.9 0.6 0.5 2.0 Rural 42 924 23.3 10.0 22.1 33.2 5.0 0.5 3.0 1.0 1.9 Anamulenge 2 340 35.4 8.9 22.4 24.5 5.4 0.6 1.3 1.2 0.3 Elim 2 132 16.9 5.0 26.8 41.6 4.6 0.2 3.2 0.4 1.2 Etayi 6 162 16.0 9.2 20.0 41.0 6.0 0.6 4.5 1.2 1.6 Ogongo 3 753 22.7 9.1 23.2 35.2 3.5 0.7 3.0 1.1 1.6 Okahao 3 799 22.2 9.3 27.0 31.7 5.5 0.2 2.1 0.8 1.2 Okalongo 4 889 20.0 9.5 23.5 35.1 4.5 0.4 4.2 0.8 1.9 Onesi 2 527 43.5 13.3 15.4 19.4 2.6 0.3 3.4 0.6 1.5 Oshikuku 1 736 10.9 8.8 42.1 29.2 4.1 0.5 1.4 0.7 2.2 Outapi 7 117 17.2 16.5 32.3 23.1 5.1 1.3 2.0 1.3 1.2 Ruacana 3 520 34.9 9.0 31.6 11.5 4.9 0.6 1.4 0.9 5.2 Tsandi 5 886 14.6 9.8 25.8 37.0 6.1 0.7 2.4 1.1 2.6 Otamanzi 2 837 28.5 9.9 16.2 33.8 4.9 0.3 3.4 1.3 1.8
6.4 Household assets
The ownership of assets is an important indicator of social welfare and living standards, and
therefore households that own certain assets have higher standards of living than those without.
The Census collected data on a wide range of assets including televisions, radios and mobile
phones.
Table 6.6 presents information on information and communication assets. The results show that
radio and mobile phones were the most commonly owned assets in Omusati region, owned by
70.6 and 50.0 percent of the households respectively. Only 1.0 percent of all households had
internet connectivity, and most of these were situated in urban areas.

Chapter 6: Household Characteristics
2011 Population and Housing Census Regional Profile, Omusati Region 44
Table 6.6 Percent distribution of households owning selected communication assets by area
Area Households Radio Television
Telephone (Fixed)
Telephone (Mobile)
Computer /Laptop
Home Internet Connectivity
Omusati 46 698 70.6 10.9 1.8 50.0 3.2 1.0 Urban 3 774 72.5 51.7 7.1 67.2 19.7 4.2 Rural 42 924 70.5 7.4 1.4 48.5 1.8 0.8 Anamulenge 2 340 71.4 14.0 2.3 62.5 3.8 1.0 Elim 2 132 80.3 12.3 2.4 44.1 2.5 0.5 Etayi 6 162 76.3 8.7 1.0 55.9 1.6 0.4 Ogongo 3 753 77.5 8.4 0.9 49.2 1.8 0.4 Okahao 3 799 67.4 12.7 1.2 40.7 3.8 1.5 Okalongo 4 889 70.3 8.1 0.8 44.5 2.2 0.4 Onesi 2 527 61.5 6.3 0.9 33.2 1.3 1.1 Oshikuku 1 736 82.3 28.7 7.3 59.2 10.3 1.3 Outapi 7 117 69.2 17.0 2.6 58.7 6.7 2.9 Ruacana 3 520 62.0 11.1 1.9 47.1 2.8 1.2 Tsandi 5 886 66.7 7.2 2.0 50.6 2.3 0.4 Otamanzi 2 837 69.5 3.8 1.7 44.3 0.9 0.6
6.5 Language spoken at home
Information on the main languages spoken in the household was collected from all households. The results in Table 6.7 show that Oshiwambo languages were reported to be spoken in almost
all households in the region (96.1%).
Table 6.7 Distribution of households by main language spoken
Main language Number of
households Percent
Omusati 46 698 100.0 San languages 20 0.0 Caprivi languages 53 0.1 Herero languages 1 295 2.8 Kavango languages 48 0.1 Nama/Damara languages 10 0.0 Oshiwambo languages 44 889 96.1 Setswana 26 0.1 Afrikaans 33 0.1 German 8 0.0 English 213 0.5 Other European languages 63 0.1 Other African languages 25 0.1 Asian languages 10 0.0 Don't know 5 0.0 Note: Main language spoken at home refers to the language usually spoken or most often spoken by the members of the household.

Chapter 6: Household Characteristics
2011 Population and Housing Census Regional Profile, Omusati Region 45
6.1 Agricultural Activity
Agriculture is defined in the population census as any activity directly related to the production
or processing of crops, dairy products, poultry or livestock for commercial sale or as a principal
means of personal subsistence. This is known as ‘own-account’ agriculture. Information was
collected on the type of agricultural activities in which households were engaged during the past
12 months prior to the Census. Where applicable, households could report more than one type
of agricultural activity.
Table 6.8 provides information on households engaged in agricultural activities. The results
indicate that crop farming (69.8%) was the most common agricultural activity in Omusati region,
while agro processing (0.4%) was the least common. In rural areas, close to three quarters of
households (73.8%) were involved in crop farming. Overall, crop farming, livestock and poultry
dominated in all 12 constituencies of the Omusati region.
Table 6.8 Percent distribution of households engaged in own account agricultural activity by area
Area Households Livestock Crop Poultry
Agro processing Horticulture Other
Omusati 46 698 47.2 69.8 33.1 0.4 1.7 0.3 Urban 3 774 14.8 24.0 12.6 0.2 3.5 0.1 Rural 42 924 50.0 73.8 34.9 0.5 1.6 0.3 Anamulenge 2 340 55.0 79.9 37.1 0.8 3.2 0.5 Elim 2 132 67.4 91.4 59.1 0.3 0.1 0.3 Etayi 6 162 36.0 80.5 20.2 0.3 1.1 0.2 Ogongo 3 753 58.6 82.6 51.5 0.5 1.6 0.2 Okahao 3 799 54.0 70.8 38.4 0.5 0.9 0.2 Okalongo 4 889 38.7 59.3 25.0 0.3 0.4 0.2 Onesi 2 527 26.6 63.2 16.9 0.2 1.9 0.2 Oshikuku 1 736 42.7 60.5 36.8 0.7 18.0 0.3 Outapi 7 117 49.0 63.7 33.0 0.7 1.4 0.2 Ruacana 3 520 43.6 55.1 24.4 0.4 0.9 0.2 Tsandi 5 886 46.6 61.5 33.5 0.3 1.1 0.7 Otamanzi 2 837 62.3 84.3 43.8 0.3 0.2 0.2

Chapter 7: Housing Characteristics
2011 Population and Housing Census Regional Profile, Omusati Region 46
CHAPTER 7: HOUSING CHARACTERISTICS
This Chapter presents analyses of the characteristics of housing, which includes all structures
used as dwelling units. Aspects considered were the type of housing, tenure, materials used for
building, housing utilities, sources of energy and water supply, sanitation, garbage and waste
disposal.
7.1 Type of housing
Nine types of housing units were defined in the Census: detached house; semi-
detached/townhouse; apartment/ flat; guest flat; part commercial/industrial; mobile home (e.g.
caravan, tent); single quarters; traditional dwelling and improvised housing unit (e.g. shack).
Table 7.1 indicates that traditional dwellings were the most common type of housing, making up
84.5 percent of the households in Omusati Region. Part commercial/industrial housing units
were the least common housing type with only 0.3 percent. Traditional houses were the most
common in rural areas, comprising about 91 percent of all households. Only 4.3 percent of
households in urban areas lived in improvised housing units/shacks. At constituency level,
traditional dwellings were more common in all constituencies.
84.5% of all households resided in traditional dwellings

Chapter 7: Housing Characteristics
2011 Population and Housing Census Regional Profile, Omusati Region 47
Table 7.1 Percent distribution of households by type of housing unit and area
Area Households Detached
House
Semi-Detached
House Apartment/
Flat Guest
Flat
Part Commercial/
Industrial Mobile Home
Single Quarters
Traditional Dwelling
Improvised Housing
Unit (Shack) Other
Omusati 46 698 7.4 1.9 2.9 0.4 0.3 0.6 0.8 84.5 1.1 0.2 Urban 37 74 44.8 11.9 18.5 2.4 0.3 1.2 3.2 13.3 4.3 0.2 Rural 42 924 4.1 1.0 1.5 0.2 0.3 0.5 0.5 90.8 0.8 0.2 Anamulenge 2 340 9.4 2.3 3.2 0.0 0.1 1.3 0.3 82.1 1.2 0.0 Elim 2 132 8.3 1.0 1.8 0.0 1.1 0.5 0.3 86.4 0.5 0.1 Etayi 6 162 4.5 1.0 1.9 0.3 0.1 0.3 0.3 91.5 0.1 0.1 Ogongo 3 753 3.2 1.0 0.9 0.1 0.0 0.3 0.1 93.7 0.1 0.5 Okahao 3 799 7.4 3.7 4.2 0.4 0.3 0.3 0.2 82.6 0.6 0.2 Okalongo 4 889 4.1 1.1 1.5 0.1 0.0 0.5 0.8 91.3 0.4 0.1 Onesi 2 527 4.6 0.6 2.4 0.5 0.8 0.6 1.0 88.0 1.3 0.2 Oshikuku 1 736 22.8 5.0 6.3 0.3 0.1 0.3 0.7 62.2 2.1 0.0 Outapi 7 117 13.3 2.9 6.2 1.1 0.6 0.4 2.3 70.3 2.7 0.2 Ruacana 3 520 16.1 3.8 1.2 0.2 0.5 1.5 0.7 72.0 3.6 0.5 Tsandi 5 886 2.5 1.3 2.9 0.3 0.3 1.0 0.7 90.7 0.2 0.0 Otamanzi 2 837 0.3 0.3 0.6 0.1 0.5 0.0 0.1 97.8 0.1 0.1
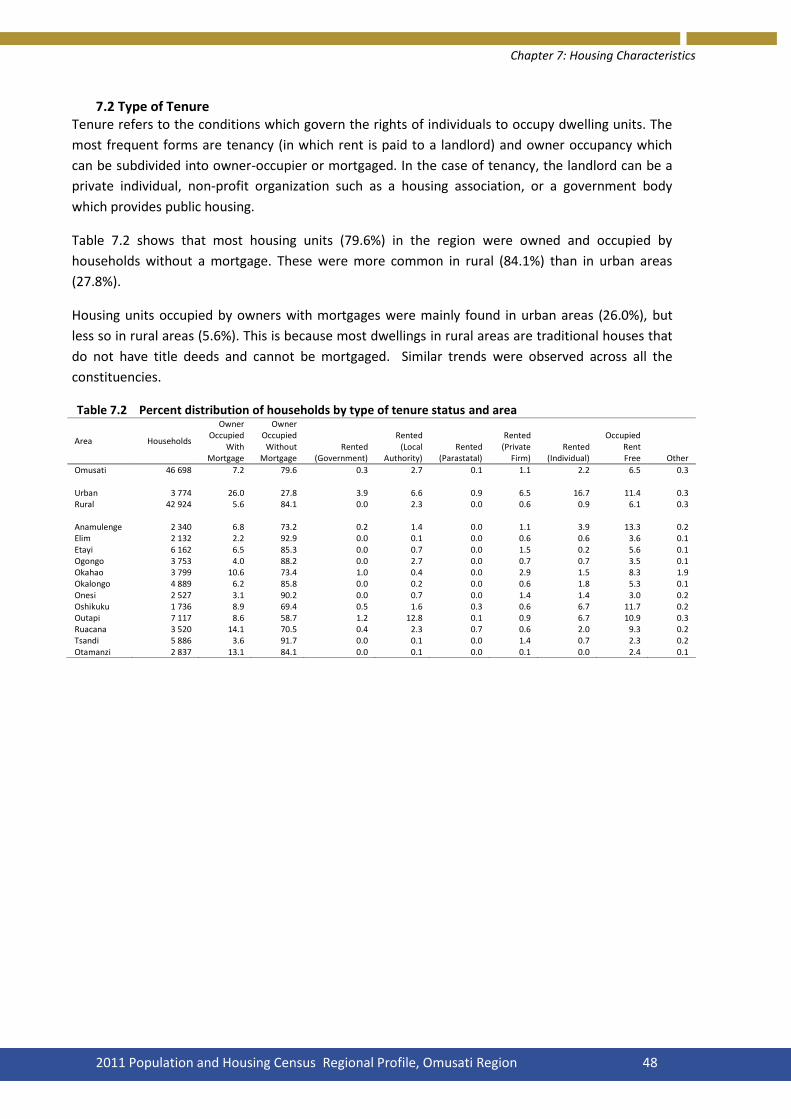
Chapter 7: Housing Characteristics
2011 Population and Housing Census Regional Profile, Omusati Region 48
7.2 Type of Tenure Tenure refers to the conditions which govern the rights of individuals to occupy dwelling units. The
most frequent forms are tenancy (in which rent is paid to a landlord) and owner occupancy which
can be subdivided into owner-occupier or mortgaged. In the case of tenancy, the landlord can be a
private individual, non-profit organization such as a housing association, or a government body
which provides public housing.
Table 7.2 shows that most housing units (79.6%) in the region were owned and occupied by
households without a mortgage. These were more common in rural (84.1%) than in urban areas
(27.8%).
Housing units occupied by owners with mortgages were mainly found in urban areas (26.0%), but
less so in rural areas (5.6%). This is because most dwellings in rural areas are traditional houses that
do not have title deeds and cannot be mortgaged. Similar trends were observed across all the
constituencies.
Table 7.2 Percent distribution of households by type of tenure status and area
Area Households
Owner Occupied
With Mortgage
Owner Occupied Without
Mortgage Rented
(Government)
Rented (Local
Authority) Rented
(Parastatal)
Rented (Private
Firm) Rented
(Individual)
Occupied Rent Free Other
Omusati 46 698 7.2 79.6 0.3 2.7 0.1 1.1 2.2 6.5 0.3
Urban 3 774 26.0 27.8 3.9 6.6 0.9 6.5 16.7 11.4 0.3 Rural 42 924 5.6 84.1 0.0 2.3 0.0 0.6 0.9 6.1 0.3
Anamulenge 2 340 6.8 73.2 0.2 1.4 0.0 1.1 3.9 13.3 0.2 Elim 2 132 2.2 92.9 0.0 0.1 0.0 0.6 0.6 3.6 0.1 Etayi 6 162 6.5 85.3 0.0 0.7 0.0 1.5 0.2 5.6 0.1 Ogongo 3 753 4.0 88.2 0.0 2.7 0.0 0.7 0.7 3.5 0.1 Okahao 3 799 10.6 73.4 1.0 0.4 0.0 2.9 1.5 8.3 1.9 Okalongo 4 889 6.2 85.8 0.0 0.2 0.0 0.6 1.8 5.3 0.1 Onesi 2 527 3.1 90.2 0.0 0.7 0.0 1.4 1.4 3.0 0.2 Oshikuku 1 736 8.9 69.4 0.5 1.6 0.3 0.6 6.7 11.7 0.2 Outapi 7 117 8.6 58.7 1.2 12.8 0.1 0.9 6.7 10.9 0.3 Ruacana 3 520 14.1 70.5 0.4 2.3 0.7 0.6 2.0 9.3 0.2 Tsandi 5 886 3.6 91.7 0.0 0.1 0.0 1.4 0.7 2.3 0.2 Otamanzi 2 837 13.1 84.1 0.0 0.1 0.0 0.1 0.0 2.4 0.1

Chapter 7: Housing Characteristics
2011 Population and Housing Census Regional Profile, Omusati Region 49
7.3 Average number of persons per sleeping room
The Census collected information on the number of sleeping rooms per household. The average
number of persons per sleeping room (or room occupancy) can be used as an indicator of
crowding.
Table 7.3 shows that on average the number of people per sleeping room in Omusati region was
1.3, which suggests that most households are not overcrowded. There were no major
differences between urban and rural areas in this respect. All constituencies had an average
number of people per sleeping room that was less than 2.
Table 7.3 Average number of persons per sleeping room by area
Area Population Number of
sleeping rooms
Average person per
room
Omusati 240 791 186 820 1.3 Urban 12 310 10 459 1.2 Rural 228 481 176 361 1.3 Anamulenge 13 301 9 684 1.4 Elim 11 377 9 639 1.2 Etayi 35 101 25 930 1.4 Ogongo 19 343 17 745 1.1 Okahao 17 266 13 554 1.3 Okalongo 30 463 21 502 1.4 Onesi 13 110 10 257 1.3 Oshikuku 8 650 7 039 1.2 Outapi 36 293 27 808 1.3 Ruacana 14 474 10 071 1.4 Tsandi 27 918 22 242 1.3 Otamanzi 13 495 11 349 1.2
7.4 Materials used for construction
This section presents information on the materials used to construct roofs, walls and floors of
housing units, which are important indicators of the socio-economic conditions and welfare of
households. Most of the materials used can be broadly divided between those that are
harvested with labour from local resources (grass, stick, mud and dung, etc.) and those that are
purchased with cash (for example cement bricks or blocks and corrugated iron).
Table 7.4 shows that 47.4 percent of the households reside in dwellings with walls made from
sticks with mud/ clay and/or cow dung. About 71 percent of urban households used
cement/bricks for outer walls compared to 24.3 percent of rural households. There were a
higher proportion of rural households that used sticks with wooden poles/sticks or grass/reeds
(51.0%) than the 6.3 percent found in urban areas. At constituency level, households with walls
constructed from cement blocks/bricks/stones were predominantly in Oshikuku (63.5%)
47.1% of households resided in
dwellings with walls made from sticks
with mud/clay and cow dung

Chapter 7: Housing Characteristics
2011 Population and Housing Census Regional Profile, Omusati Region 50
Table 7.4 Percent distribution of households by main material used for outer walls and area
Area Households
Cement Blocks/Brick
Burnt Bricks/Face
Bricks Mud/Clay
/Bricks Corrugated
Iron/Zinc Prefabricated
Materials
Wood Poles/Sticks
or Grass/Reeds
Sticks with
Mud/Clay and/or
Cow Dung Tin Other
Omusati 46 698 28.0 0.9 9.3 9.4 0.8 47.4 3.6 0.1 0.4
Urban 3 774 70.9 1.7 1.0 17.6 1.1 6.3 1.4 0.1 0.1 Rural 4 2924 24.3 0.8 10.1 8.7 0.8 51.0 3.8 0.1 0.5
Anamulenge 2 340 56.4 0.8 7.5 15.3 0.2 16.0 2.6 0.0 1.2 Elim 2 132 33.1 0.2 1.5 11.4 0.5 50.5 1.4 1.2 0.2 Etayi 6 162 34.7 0.6 26.5 5.1 1.0 29.1 2.8 0.1 0.2 Ogongo 3 753 26.5 0.7 7.2 3.8 0.7 58.3 2.2 0.0 0.6 Okahao 3 799 26.3 0.7 1.2 6.4 0.9 62.5 1.5 0.1 0.4 Okalongo 4 889 27.0 0.7 27.5 9.3 0.3 32.1 2.4 0.3 0.4 Onesi 2 527 17.8 1.0 6.1 14.3 1.1 53.4 5.9 0.0 0.3 Oshikuku 1 736 63.5 0.9 3.3 12.4 0.2 18.0 1.7 0.0 0.0 Outapi 7 117 32.9 1.8 6.2 14.9 0.8 41.3 1.9 0.1 0.2 Ruacana 3 520 19.8 0.6 2.1 12.5 1.9 42.6 20.1 0.1 0.3 Tsandi 5 886 14.1 1.2 2.1 5.9 1.4 72.5 1.9 0.0 0.8 Otamanzi 2 837 7.0 0.4 0.2 6.9 0.1 84.1 0.8 0.0 0.5
The results in Table 7.5 show that thatch grass was the main material used for roofing - covering
more than half of the households in Omusati (58%). In urban areas, 88.7 percent of households
lived in dwellings where roofs were constructed with corrugated iron sheets, compared to 34.5
percent in rural areas.
Furthermore, across most constituencies, the greater proportion of roofs were made from
thatch grass. In Oshikuku, however, most roofs (71.4%) were made from corrugated iron sheets.

Chapter 7: Housing Characteristics
2011 Population and Housing Census Regional Profile, Omusati Region 51
Table 7.5 Percent distribution of households by main material used for the roof and area
Area Households Corrugated Iron Sheet
Asbestos Sheet
Brick Tiles Concrete
Thatch Grass Slate
Wood Covered
with melthoi
d
Sticks with
Mud/Cow Dung Tin Other
Omusati 46 698 38.9 0.7 0.1 0.1 58.3 0.2 0.5 0.5 0.2 0.6
Urban 3 774 88.7 2.3 0.0 0.1 7.5 0.5 0.0 0.2 0.1 0.6 Rural 42 924 34.5 0.5 0.1 0.1 62.8 0.2 0.5 0.5 0.2 0.6
Anamulenge 2 340 69.7 0.0 0.0 0.0 27.4 0.0 0.7 1.1 0.1 1.0 Elim 2 132 38.6 0.0 0.0 0.2 59.4 0.1 0.1 0.0 1.3 0.1 Etayi 6 162 31.0 0.1 0.2 0.1 68.0 0.2 0.1 0.1 0.2 0.1 Ogongo 3 753 31.3 0.0 0.0 0.3 67.5 0.0 0.2 0.1 0.0 0.6 Okahao 3 799 36.9 1.2 0.0 0.1 58.9 0.3 0.1 0.3 0.1 2.2 Okalongo 4 889 36.0 0.1 0.1 0.3 61.0 0.1 1.3 0.8 0.3 0.1 Onesi 2 527 35.1 0.1 0.5 0.1 63.1 0.1 0.7 0.1 0.0 0.2 Oshikuku 1 736 71.4 0.2 0.1 0.0 26.5 0.2 1.4 0.2 0.1 0.1 Outapi 7 117 51.9 1.2 0.1 0.1 45.6 0.4 0.2 0.2 0.1 0.4 Ruacana 3 520 42.9 0.9 0.1 0.0 49.4 0.1 1.3 3.2 0.1 1.9 Tsandi 5 886 29.3 2.0 0.1 0.2 67.5 0.3 0.3 0.1 0.0 0.2 Otamanzi 2 837 14.2 0.2 0.1 0.1 84.1 0.1 0.5 0.1 0.3 0.4
With regard to material used for the floor, Table 7.6 shows that 58.2 percent of the households
in Omusati had floors made from sand/earth. Similar trends were observed in rural/ urban areas
and constituencies.

Chapter 7: Housing Characteristics
2011 Population and Housing Census Regional Profile, Omusati Region 52
Table 7.6 Percent distribution of households by main material used for the floor and area
Area Households Sand/Earth Cement Mud/Clay Wood Concrete
Tiles (Ceramic/Wood
/Plastic) Oth
er
Omusati 46 698 58.2 27.3 8.9 0.3 2.2 2.7 0.3
Urban 3 774 13.8 52.1 0.8 0.5 7.8 24.7 0.1 Rural 42 924 62.1 25.1 9.6 0.3 1.7 0.8 0.4
Anamulenge 2 340 33.2 53.0 6.7 0.0 4.0 1.9 1.2 Elim 2 132 63.8 30.8 0.7 0.5 2.9 1.3 0.0 Etayi 6 162 48.4 29.7 20.9 0.1 0.5 0.3 0.1 Ogongo 3 753 61.7 22.9 10.0 0.1 4.7 0.5 0.1 Okahao 3 799 67.0 23.5 2.4 0.2 1.7 3.2 1.9 Okalongo 4 889 42.7 30.5 24.7 0.2 0.5 1.3 0.0 Onesi 2 527 66.6 26.4 5.5 0.2 0.8 0.6 0.0 Oshikuku 1 736 25.8 47.1 4.9 0.1 10.4 11.8 0.0 Outapi 7 117 54.3 32.4 2.8 0.3 1.9 8.1 0.2 Ruacana 3 520 60.8 19.1 12.4 0.5 4.1 2.5 0.5 Tsandi 5 886 73.8 19.2 2.9 1.0 1.3 1.6 0.2 Otamanzi 2 837 91.9 6.2 0.4 0.4 0.8 0.2 0.1
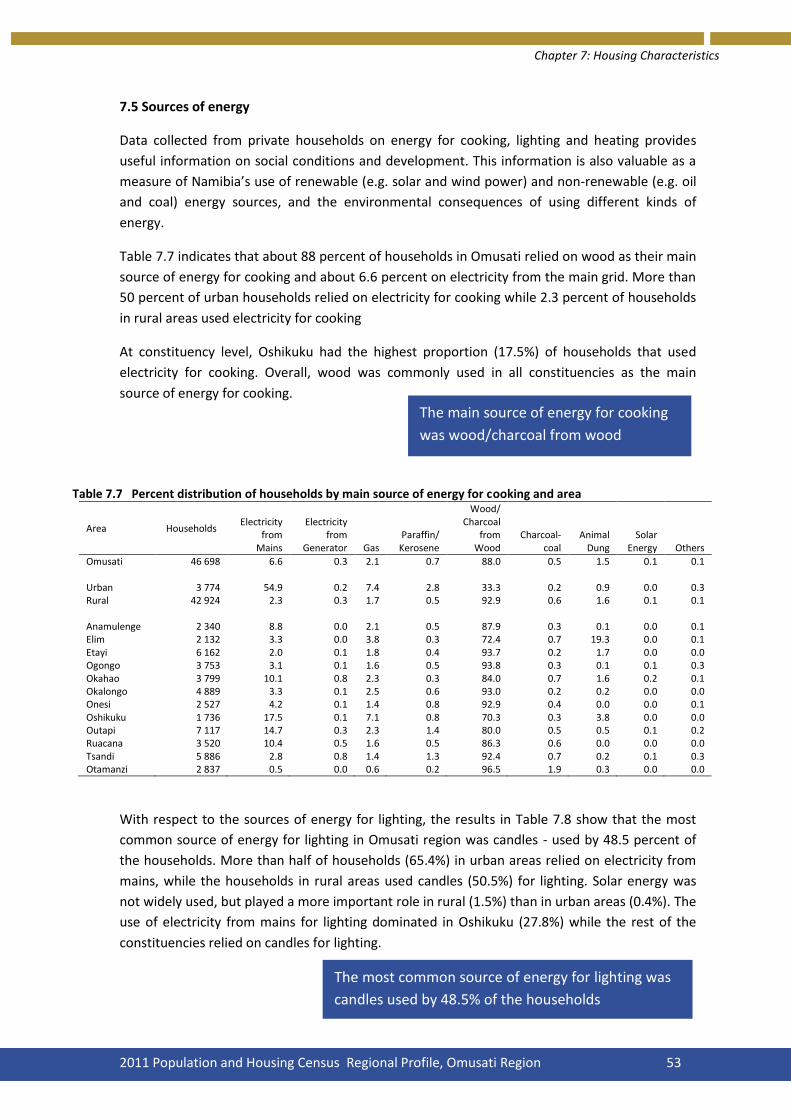
Chapter 7: Housing Characteristics
2011 Population and Housing Census Regional Profile, Omusati Region 53
7.5 Sources of energy
Data collected from private households on energy for cooking, lighting and heating provides
useful information on social conditions and development. This information is also valuable as a
measure of Namibia’s use of renewable (e.g. solar and wind power) and non-renewable (e.g. oil
and coal) energy sources, and the environmental consequences of using different kinds of
energy.
Table 7.7 indicates that about 88 percent of households in Omusati relied on wood as their main
source of energy for cooking and about 6.6 percent on electricity from the main grid. More than
50 percent of urban households relied on electricity for cooking while 2.3 percent of households
in rural areas used electricity for cooking
At constituency level, Oshikuku had the highest proportion (17.5%) of households that used
electricity for cooking. Overall, wood was commonly used in all constituencies as the main
source of energy for cooking.
Table 7.7 Percent distribution of households by main source of energy for cooking and area
Area Households Electricity
from Mains
Electricity from
Generator Gas Paraffin/
Kerosene
Wood/ Charcoal
from Wood
Charcoal-coal
Animal Dung
Solar Energy Others
Omusati 46 698 6.6 0.3 2.1 0.7 88.0 0.5 1.5 0.1 0.1 Urban 3 774 54.9 0.2 7.4 2.8 33.3 0.2 0.9 0.0 0.3 Rural 42 924 2.3 0.3 1.7 0.5 92.9 0.6 1.6 0.1 0.1 Anamulenge 2 340 8.8 0.0 2.1 0.5 87.9 0.3 0.1 0.0 0.1 Elim 2 132 3.3 0.0 3.8 0.3 72.4 0.7 19.3 0.0 0.1 Etayi 6 162 2.0 0.1 1.8 0.4 93.7 0.2 1.7 0.0 0.0 Ogongo 3 753 3.1 0.1 1.6 0.5 93.8 0.3 0.1 0.1 0.3 Okahao 3 799 10.1 0.8 2.3 0.3 84.0 0.7 1.6 0.2 0.1 Okalongo 4 889 3.3 0.1 2.5 0.6 93.0 0.2 0.2 0.0 0.0 Onesi 2 527 4.2 0.1 1.4 0.8 92.9 0.4 0.0 0.0 0.1 Oshikuku 1 736 17.5 0.1 7.1 0.8 70.3 0.3 3.8 0.0 0.0 Outapi 7 117 14.7 0.3 2.3 1.4 80.0 0.5 0.5 0.1 0.2 Ruacana 3 520 10.4 0.5 1.6 0.5 86.3 0.6 0.0 0.0 0.0 Tsandi 5 886 2.8 0.8 1.4 1.3 92.4 0.7 0.2 0.1 0.3 Otamanzi 2 837 0.5 0.0 0.6 0.2 96.5 1.9 0.3 0.0 0.0
With respect to the sources of energy for lighting, the results in Table 7.8 show that the most
common source of energy for lighting in Omusati region was candles - used by 48.5 percent of
the households. More than half of households (65.4%) in urban areas relied on electricity from
mains, while the households in rural areas used candles (50.5%) for lighting. Solar energy was
not widely used, but played a more important role in rural (1.5%) than in urban areas (0.4%). The
use of electricity from mains for lighting dominated in Oshikuku (27.8%) while the rest of the
constituencies relied on candles for lighting.
The most common source of energy for lighting was
candles used by 48.5% of the households
The main source of energy for cooking
was wood/charcoal from wood
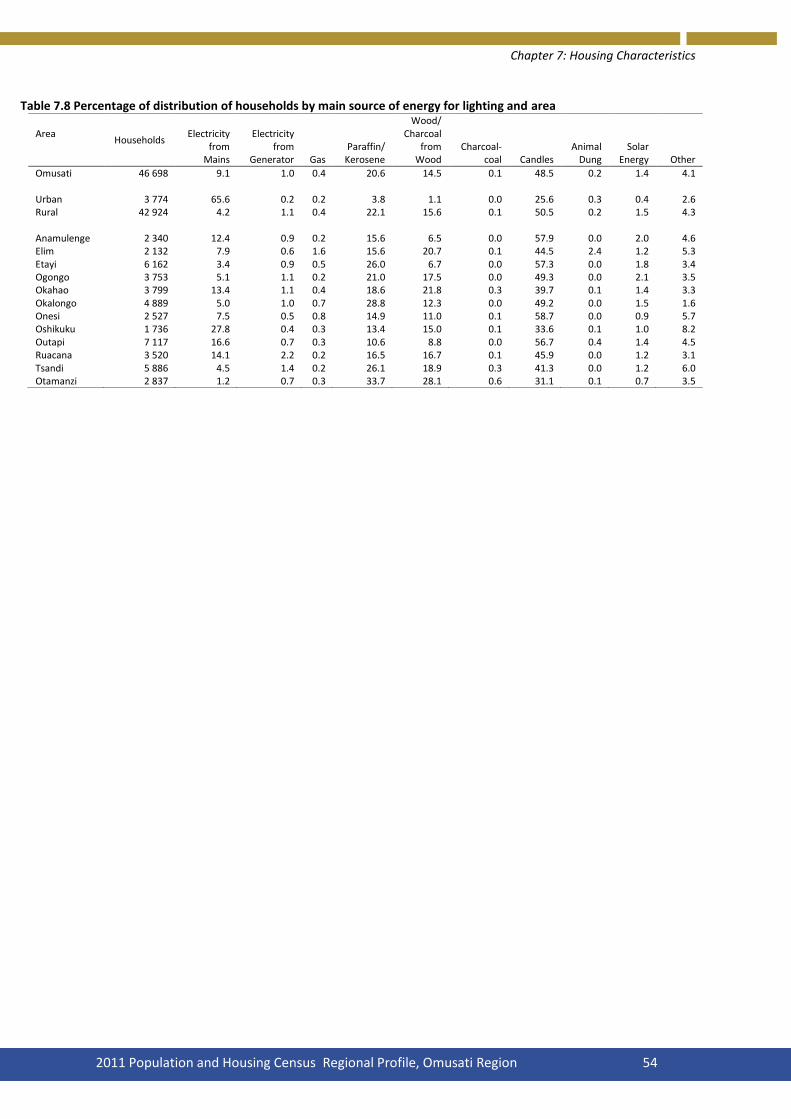
Chapter 7: Housing Characteristics
2011 Population and Housing Census Regional Profile, Omusati Region 54
Table 7.8 Percentage of distribution of households by main source of energy for lighting and area
Area
Households Electricity
from Mains
Electricity from
Generator Gas Paraffin/
Kerosene
Wood/ Charcoal
from Wood
Charcoal-coal Candles
Animal Dung
Solar Energy Other
Omusati 46 698 9.1 1.0 0.4 20.6 14.5 0.1 48.5 0.2 1.4 4.1 Urban 3 774 65.6 0.2 0.2 3.8 1.1 0.0 25.6 0.3 0.4 2.6 Rural 42 924 4.2 1.1 0.4 22.1 15.6 0.1 50.5 0.2 1.5 4.3 Anamulenge 2 340 12.4 0.9 0.2 15.6 6.5 0.0 57.9 0.0 2.0 4.6 Elim 2 132 7.9 0.6 1.6 15.6 20.7 0.1 44.5 2.4 1.2 5.3 Etayi 6 162 3.4 0.9 0.5 26.0 6.7 0.0 57.3 0.0 1.8 3.4 Ogongo 3 753 5.1 1.1 0.2 21.0 17.5 0.0 49.3 0.0 2.1 3.5 Okahao 3 799 13.4 1.1 0.4 18.6 21.8 0.3 39.7 0.1 1.4 3.3 Okalongo 4 889 5.0 1.0 0.7 28.8 12.3 0.0 49.2 0.0 1.5 1.6 Onesi 2 527 7.5 0.5 0.8 14.9 11.0 0.1 58.7 0.0 0.9 5.7 Oshikuku 1 736 27.8 0.4 0.3 13.4 15.0 0.1 33.6 0.1 1.0 8.2 Outapi 7 117 16.6 0.7 0.3 10.6 8.8 0.0 56.7 0.4 1.4 4.5 Ruacana 3 520 14.1 2.2 0.2 16.5 16.7 0.1 45.9 0.0 1.2 3.1 Tsandi 5 886 4.5 1.4 0.2 26.1 18.9 0.3 41.3 0.0 1.2 6.0 Otamanzi 2 837 1.2 0.7 0.3 33.7 28.1 0.6 31.1 0.1 0.7 3.5

Chapter 7: Housing Characteristics
2011 Population and Housing Census Regional Profile, Omusati Region 55
7.6 Water Supply and Sanitation
This section covers the main source of water for drinking and cooking, type of toilet facilities,
and disposal of waste or garbage for households. Poor sanitation and inadequate access to safe
water are public health concerns because they create conditions conducive to the spread of
diseases.
The results in Table 7.9 show that 51.6 percent of the households in Omusati region had access
to safe water. About 92.4 percent of households in urban areas had access to safe water
compared to 48.1 percent in rural areas. With regards to unsafe water, about 51.3 percent of
households in rural areas relied on unprotected wells, boreholes with open tank,
rivers/dams/streams and canals as their main source of water for cooking/drinking.
At constituency level, it was observed that 52.2 and 40.2 percent of households in Otamanzi and
Tsandi constituencies relied on unprotected wells as their main sources of water respectively.
Over 48% of households in rural areas used unsafe water
for cooking and drinking

Chapter 7: Housing Characteristics
2011 Population and Housing Census Regional Profile, Omusati Region 56
Table 7.9 Percent distribution of households by main source of water for cooking/drinking and constituency
Area
Households Piped
Water Inside
Piped Water
Outside Public
Pipe
Borehole with
Tank Covere
d
Well Protecte
d Safe
water
Borehole with Open Tank
River/
Canal
Well Unprotecte
d Other
Dam/
Stream
Omusati 46 698 21.5 9.8 11.7 2.7 5.9 51.6 4.7 10.2 5.1 27.6 0.7
Urban 3 774 45.9 23.1 23.0 0.1 0.2 92.4 0.0 1.0 2.8 2.6 1.2 Rural 42 924 19.4 8.7 10.7 2.9 6.4 48.1 5.1 11.1 5.3 29.8 0.6
Anamulenge
2 340 21.6 14.7 8.7 0.3 2.9 48.2 5.2 5.4 9.0 32.1 0.1
Elim 2 132 32.1 13.0 26.8 0.9 0.8 73.6 0.5 9.3 3.3 13.1 0.3 Etayi 6 162 22.7 10.9 10.9 0.9 6.3 51.7 9.6 9.3 0.7 28.0 0.5 Ogongo 3 753 23.7 7.1 14.6 0.4 2.9 48.7 4.2 8.4 8.8 29.3 0.5 Okahao 3 799 21.1 12.0 7.4 4.1 7.1 51.7 5.0 9.6 2.0 29.8 1.9 Okalongo 4 889 25.7 10.0 7.8 1.3 11.8 56.6 6.2 10.8 0.7 25.6 0.0 Onesi 2 527 12.1 8.7 7.7 5.8 12.2 46.5 5.1 19.6 13.4 15.3 0.0 Oshikuku 1 736 39.9 15.1 13.8 0.0 1.0 69.8 0.6 3.3 9.7 12.3 4.1 Outapi 7 117 20.0 8.8 12.8 0.4 6.6 48.6 0.7 12.2 10.7 26.7 1.1 Ruacana 3 520 14.7 9.2 23.1 17.2 3.0 67.2 10.9 10.1 3.8 7.9 0.1 Tsandi 5 886 22.5 9.0 7.9 1.2 6.6 47.2 3.7 4.9 3.6 40.2 0.3 Otamanzi 2 837 8.7 4.2 6.9 3.5 1.6 24.9 0.9 21.1 0.7 52.2 0.1
With respect to the type of the main toilet facility, the results on Table 7.10 show that 77.9
percent of the households in Omusati region had no toilet facilities and only 6.3 percent had
access to flush toilets. There are notable differences between urban and rural areas. In urban
areas about 49 percent of households used flush toilets while the corresponding rural
percentage was only about 3 percent. Similar trends were observed in all the constituencies with
over 60 percent of households having no toilet facilities, except for Oshikuku constituency where
the proportion was 56 percent.
77.9% households in Omusati had no toilet
facilities

Chapter 7: Housing Characteristics
2011 Population and Housing Census Regional Profile, Omusati Region 57
Table 7.10 Percent distribution of households by type of main toilet facility and constituency
Area
Number of
Households
Private Flush
Connected to Sewer
Shared Flush
Connected to Sewer
Private Flush
Connected to
Septic/Cesspool
Shared Flush
Connected to
Septic/Cesspool
Pit Latrine
with Ventilation Pipe
Covered Pit Latrine
without Ventilation
Pipe
Uncovered Pit Latrine
without Ventilation
Pipe Bucket
Toilet
No Toilet
Facility Other
Omusati 46 698 3.7 1.5 0.7 0.4 6.5 4.7 2.5 1.7 77.9 0.4
Urban 3 774 34.0 12.5 1.6 0.9 11.0 4.9 3.4 0.8 30.7 0.2 Rural 42 924 1.0 0.5 0.7 0.3 6.1 4.7 2.4 1.8 82.0 0.4
Anamulenge 2 340 1.5 1.1 1.2 0.6 12.1 5.3 3.9 1.3 72.7 0.3 Elim 2 132 1.5 0.6 0.8 0.6 11.2 10.4 4.5 1.3 68.5 0.7 Etayi 6 162 0.5 0.2 0.5 0.1 7.3 4.6 2.0 1.7 83.0 0.2 Ogongo 3 753 1.6 0.1 1.7 0.1 6.5 6.3 2.2 3.5 77.7 0.4 Okahao 3 799 5.8 3.0 0.7 0.7 5.1 6.3 4.9 2.2 71.0 0.3 Okalongo 4 889 0.9 0.1 1.5 0.2 6.7 4.2 2.0 1.9 82.4 0.1 Onesi 2 527 2.1 1.2 0.3 0.7 4.3 3.9 4.9 0.7 79.5 2.4 Oshikuku 1 736 16.6 2.2 1.5 0.3 12.0 8.6 2.0 0.6 55.9 0.2 Outapi 7 117 7.6 3.6 0.5 0.6 6.6 3.5 1.8 1.8 73.8 0.2 Ruacana 3 520 8.5 2.9 0.4 0.3 4.2 2.0 0.8 1.3 79.1 0.3 Tsandi 5 886 2.1 1.8 0.2 0.1 5.2 4.1 2.2 1.5 82.6 0.2 Otamanzi 2 837 0.3 0.0 0.1 0.2 2.2 3.6 1.9 1.0 90.3 0.4
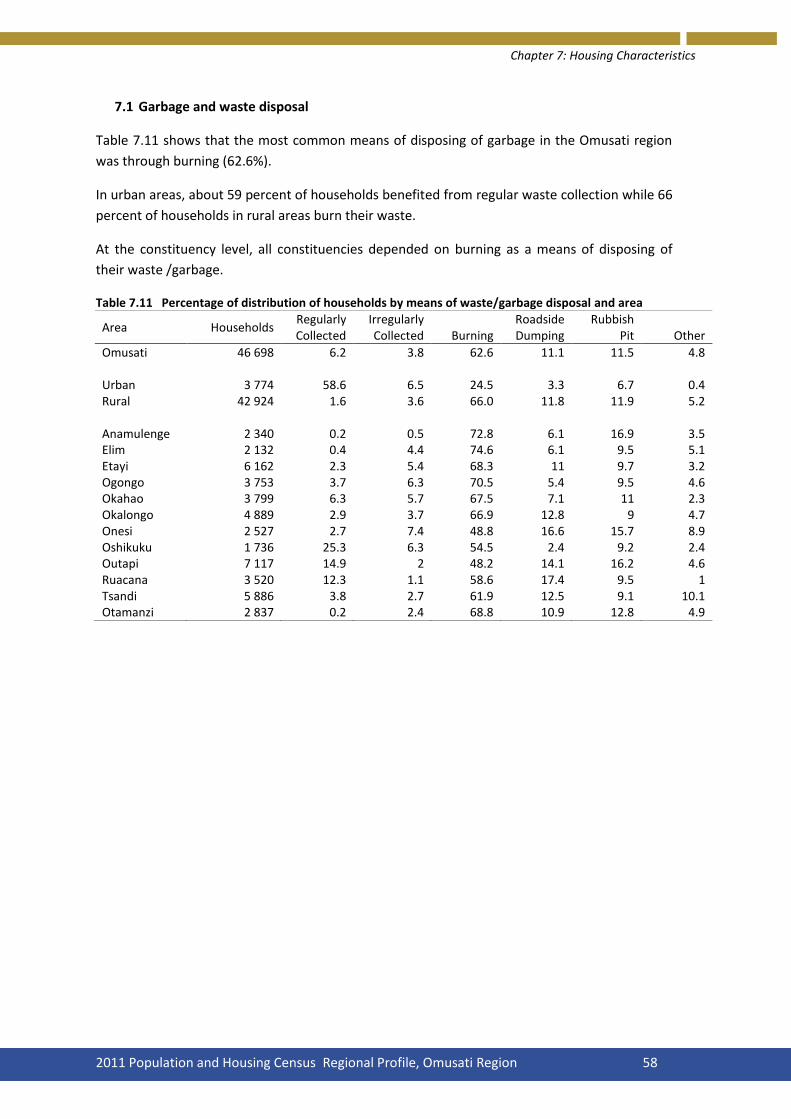
Chapter 7: Housing Characteristics
2011 Population and Housing Census Regional Profile, Omusati Region 58
7.1 Garbage and waste disposal
Table 7.11 shows that the most common means of disposing of garbage in the Omusati region
was through burning (62.6%).
In urban areas, about 59 percent of households benefited from regular waste collection while 66
percent of households in rural areas burn their waste.
At the constituency level, all constituencies depended on burning as a means of disposing of
their waste /garbage.
Table 7.11 Percentage of distribution of households by means of waste/garbage disposal and area
Area Households Regularly Collected
Irregularly Collected Burning
Roadside Dumping
Rubbish Pit Other
Omusati 46 698 6.2 3.8 62.6 11.1 11.5 4.8 Urban 3 774 58.6 6.5 24.5 3.3 6.7 0.4 Rural 42 924 1.6 3.6 66.0 11.8 11.9 5.2 Anamulenge 2 340 0.2 0.5 72.8 6.1 16.9 3.5 Elim 2 132 0.4 4.4 74.6 6.1 9.5 5.1 Etayi 6 162 2.3 5.4 68.3 11 9.7 3.2 Ogongo 3 753 3.7 6.3 70.5 5.4 9.5 4.6 Okahao 3 799 6.3 5.7 67.5 7.1 11 2.3 Okalongo 4 889 2.9 3.7 66.9 12.8 9 4.7 Onesi 2 527 2.7 7.4 48.8 16.6 15.7 8.9 Oshikuku 1 736 25.3 6.3 54.5 2.4 9.2 2.4 Outapi 7 117 14.9 2 48.2 14.1 16.2 4.6 Ruacana 3 520 12.3 1.1 58.6 17.4 9.5 1 Tsandi 5 886 3.8 2.7 61.9 12.5 9.1 10.1 Otamanzi 2 837 0.2 2.4 68.8 10.9 12.8 4.9

Chapter 7: Housing Characteristics
2011 Population and Housing Census Regional Profile, Omusati Region 59
Annexure
Glossary of Census terms
The concepts and classifications used in the 2011 Population and Housing Census are defined
below. These concepts and classifications are based on regional and International
recommendation with adaptations to suit local conditions.
Geographic Concepts
Omusati region consisted of 12 constituencies, namely Anamulenge, Elim, Etayi, Ogongo,
Okahao, Okalongo, Onesi, Oshikuku, Outapi, Ruacana, Tsandi and Otamanzi.
Locality
For the purpose of the Census, a locality is defined as a distinct population cluster, irrespective
of size, in which people live and which has a name or locally recognized status.
Enumeration area
For the purpose of enumeration (census date collection/counting), the whole country was
divided into small geographical areas of manageable sizes known as enumeration areas (EAs).
Dwelling unit
A dwelling unit is a unit of accommodation of a household that may be vacant or shared by more than one household.
Marital status
Is defined as the person’s personal status in relation to the marriage laws or customs of the
country
Live birth
A child born alive is one who cries after being born. Thus, a live birth is a birth which results in a
child that shows any sign of life irrespective of the time or period within which these signs are
manifested.
Early childhood development
This refers to children aged 0 - 4 years who were attending day-care, crèche, kindergarten and pre-primary school. The categories were as follows: Edu-care (day-care, crèche, kindergarten) and
pre-primary school.
Literacy
This refers to the ability to read and write with understanding in any language. Those that could both read and write with understanding were classified as literate; and those who could only read but not write were classified as illiterate.
School attendance
This refers to full time attendance at any regular educational institution, public or private, for systematic instruction at any level of education.

Chapter 7: Housing Characteristics
2011 Population and Housing Census Regional Profile, Omusati Region 60
Educational attainment
The highest standard, grade or years completed at the highest level of school, college or university attended. Disability This refers to a condition of loss of physical or mental function resulting in inability to perform daily activities. Disability is aggravated by physical, personal, and environmental barriers.
Occupation
This refers to the type of work, trade or profession performed by an individual during the Census reference period, irrespective of status in employment of the individual. Industry
This refers to the main goods and/or services produced at the person’s work place (if employed)
or usual place of work (if on vacation, sick leave).
Employment status
This refers to the status of those employed during the reference period or those who were on
sick/vacation leave and had a job to return to, in terms of either working/worked as employees,
employers, own account workers, or unpaid family workers.
Household
A household consists of a person or a group of persons related or unrelated who lived together in the same homestead/compound but not necessarily in the same dwelling unit.
Head of household
The head of household is the person (of either sex) who is looked upon by the other members of the household as their leader or main decision-maker. Children and orphan headed household
This refers to households headed by children/orphans aged 18 years and below. Orphans are
children 18 years and below who during the time of the Census were orphaned by one or both
parents.
Household assets
Ownership of assets is a good measure of the social well-fare and standard of living of
households. Hence, households were also asked whether they owned certain assets, and the
assets had to be in working condition. Assests included: car, motorbike, bicycle, radio, television,
telephone (landline), telephone (mobile), computer/laptop, refrigerator/freezer, stove,
microwave, etc.
Agricultural activities
This refers to activities such as the farming of crop, poultry, or livestock, agro processing and
horticulture.
Housing unit
This refers to separate and independent living premises occupied by the household.

Chapter 7: Housing Characteristics
2011 Population and Housing Census Regional Profile, Omusati Region 61
Tenure
This is the arrangement under which the household occupies all/or part of a housing unit. This
looks at whether the housing unit was owner-occupied, rented or rent-free.
Number of sleeping rooms These are all rooms used for sleeping purposes only, thus it excludes rooms such as study rooms, toilets, kitchens, passages etc. However if a room such as a garage was used for sleeping purposes it was considered a sleeping room.
Material used for outer-walls, floor and roof
This refers to the main material used for the construction of the household’s housing unit. Materials may include cement blocks/bricks/stones, burnt/face bricks for outer-walls, or corrugated iron-sheets, brick tiles, concrete for roof, or sand/earth, cement, mud/clay for floor, etc.
Source of water for cooking and drinking
A measure of the well-being of Namibians is the proportion of households that have access to
clean/potable water. This question referred to the main sources of water used by the
households for cooking and drinking.
Source of energy for cooking, lighting and heating
This refers to the type of energy most often used for cooking, lighting and heating. The sources include electricity, gas, solar, wood, candle, charcoal, paraffin, etc.
Type of toilet facility
This information provides a measure of sanitation level of the household since these facilities are
important for disease control and health improvement. This looked at whether the household
used a private toilet connected to the main sewer, public toilet connected to the sewer, private
toilet connected to septic tank, public toilet connected to septic, etc.
Garbage and refuse disposal
This information can be used in obtaining the hygiene level of the household since these
facilities are important for disease control and health improvements.

Chapter 7: Housing Characteristics
2011 Population and Housing Census Regional Profile, Omusati Region 62
The Enumeration Area Map for Omusati
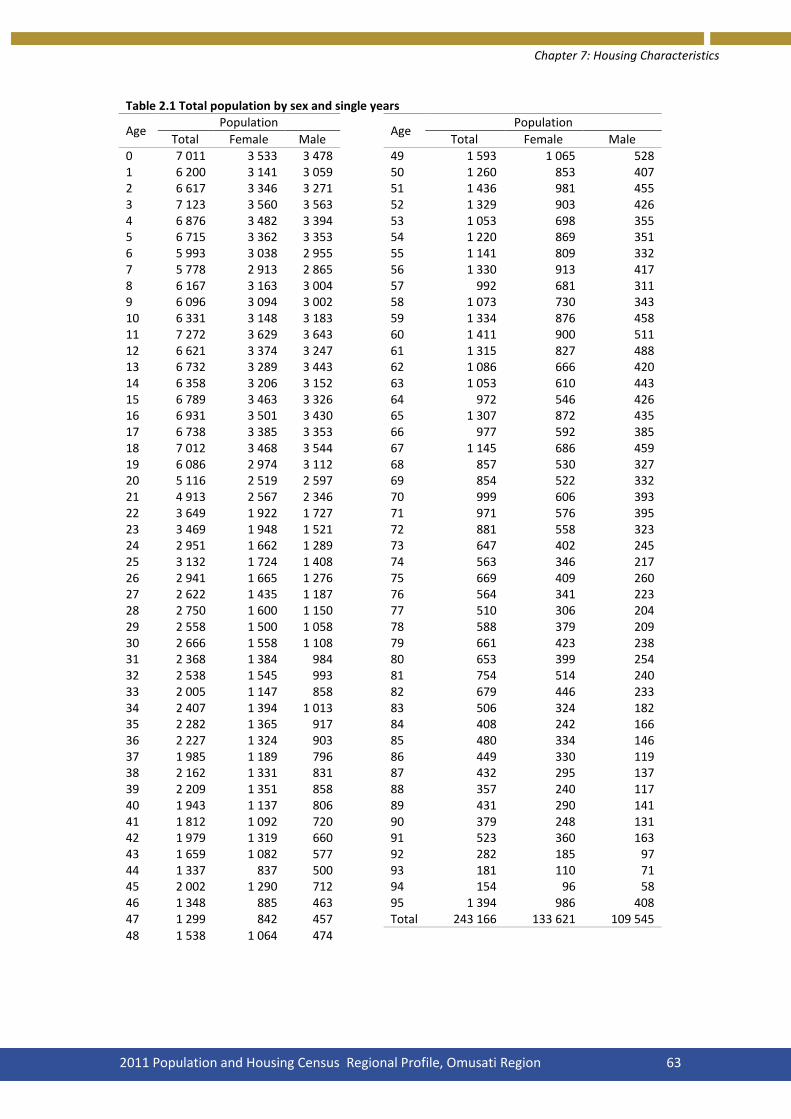
Chapter 7: Housing Characteristics
2011 Population and Housing Census Regional Profile, Omusati Region 63
Table 2.1 Total population by sex and single years
Age Population
Age Population
Total Female Male Total Female Male
0 7 011 3 533 3 478 49 1 593 1 065 528 1 6 200 3 141 3 059 50 1 260 853 407 2 6 617 3 346 3 271 51 1 436 981 455 3 7 123 3 560 3 563 52 1 329 903 426 4 6 876 3 482 3 394 53 1 053 698 355 5 6 715 3 362 3 353 54 1 220 869 351 6 5 993 3 038 2 955 55 1 141 809 332 7 5 778 2 913 2 865 56 1 330 913 417 8 6 167 3 163 3 004 57 992 681 311 9 6 096 3 094 3 002 58 1 073 730 343 10 6 331 3 148 3 183 59 1 334 876 458 11 7 272 3 629 3 643 60 1 411 900 511 12 6 621 3 374 3 247 61 1 315 827 488 13 6 732 3 289 3 443 62 1 086 666 420 14 6 358 3 206 3 152 63 1 053 610 443 15 6 789 3 463 3 326 64 972 546 426 16 6 931 3 501 3 430 65 1 307 872 435 17 6 738 3 385 3 353 66 977 592 385 18 7 012 3 468 3 544 67 1 145 686 459 19 6 086 2 974 3 112 68 857 530 327 20 5 116 2 519 2 597 69 854 522 332 21 4 913 2 567 2 346 70 999 606 393 22 3 649 1 922 1 727 71 971 576 395 23 3 469 1 948 1 521 72 881 558 323 24 2 951 1 662 1 289 73 647 402 245 25 3 132 1 724 1 408 74 563 346 217 26 2 941 1 665 1 276 75 669 409 260 27 2 622 1 435 1 187 76 564 341 223 28 2 750 1 600 1 150 77 510 306 204 29 2 558 1 500 1 058 78 588 379 209 30 2 666 1 558 1 108 79 661 423 238 31 2 368 1 384 984 80 653 399 254 32 2 538 1 545 993 81 754 514 240 33 2 005 1 147 858 82 679 446 233 34 2 407 1 394 1 013 83 506 324 182 35 2 282 1 365 917 84 408 242 166 36 2 227 1 324 903 85 480 334 146 37 1 985 1 189 796 86 449 330 119 38 2 162 1 331 831 87 432 295 137 39 2 209 1 351 858 88 357 240 117 40 1 943 1 137 806 89 431 290 141 41 1 812 1 092 720 90 379 248 131 42 1 979 1 319 660 91 523 360 163 43 1 659 1 082 577 92 282 185 97 44 1 337 837 500 93 181 110 71 45 2 002 1 290 712 94 154 96 58 46 1 348 885 463 95 1 394 986 408 47 1 299 842 457 Total 243 166 133 621 109 545
48 1 538 1 064 474
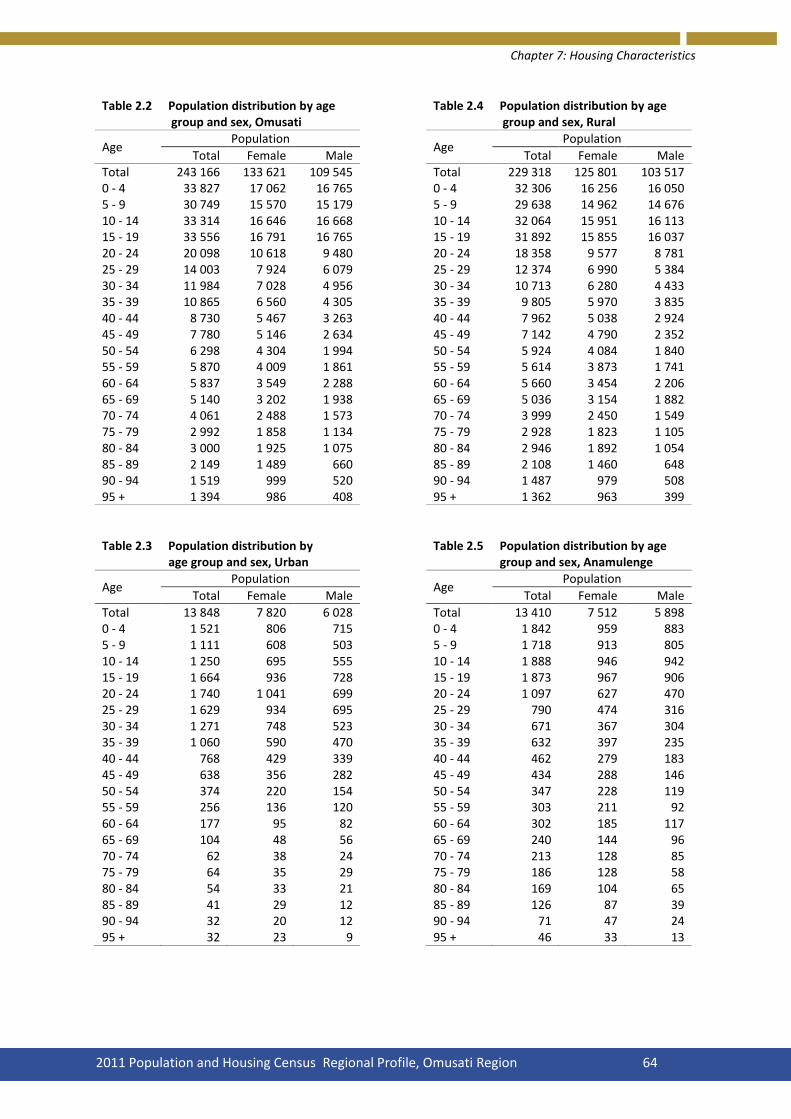
Chapter 7: Housing Characteristics
2011 Population and Housing Census Regional Profile, Omusati Region 64
Table 2.2 Population distribution by age Table 2.4 Population distribution by age group and sex, Omusati group and sex, Rural
Age Population
Age Population
Total Female Male Total Female Male
Total 243 166 133 621 109 545 Total 229 318 125 801 103 517 0 - 4 33 827 17 062 16 765 0 - 4 32 306 16 256 16 050 5 - 9 30 749 15 570 15 179 5 - 9 29 638 14 962 14 676 10 - 14 33 314 16 646 16 668 10 - 14 32 064 15 951 16 113 15 - 19 33 556 16 791 16 765 15 - 19 31 892 15 855 16 037 20 - 24 20 098 10 618 9 480 20 - 24 18 358 9 577 8 781 25 - 29 14 003 7 924 6 079 25 - 29 12 374 6 990 5 384 30 - 34 11 984 7 028 4 956 30 - 34 10 713 6 280 4 433 35 - 39 10 865 6 560 4 305 35 - 39 9 805 5 970 3 835 40 - 44 8 730 5 467 3 263 40 - 44 7 962 5 038 2 924 45 - 49 7 780 5 146 2 634 45 - 49 7 142 4 790 2 352 50 - 54 6 298 4 304 1 994 50 - 54 5 924 4 084 1 840 55 - 59 5 870 4 009 1 861 55 - 59 5 614 3 873 1 741 60 - 64 5 837 3 549 2 288 60 - 64 5 660 3 454 2 206 65 - 69 5 140 3 202 1 938 65 - 69 5 036 3 154 1 882 70 - 74 4 061 2 488 1 573 70 - 74 3 999 2 450 1 549 75 - 79 2 992 1 858 1 134 75 - 79 2 928 1 823 1 105 80 - 84 3 000 1 925 1 075 80 - 84 2 946 1 892 1 054 85 - 89 2 149 1 489 660 85 - 89 2 108 1 460 648 90 - 94 1 519 999 520 90 - 94 1 487 979 508 95 + 1 394 986 408 95 + 1 362 963 399
Table 2.3 Population distribution by Table 2.5 Population distribution by age age group and sex, Urban group and sex, Anamulenge
Age Population
Age Population
Total Female Male Total Female Male
Total 13 848 7 820 6 028 Total 13 410 7 512 5 898 0 - 4 1 521 806 715 0 - 4 1 842 959 883 5 - 9 1 111 608 503 5 - 9 1 718 913 805 10 - 14 1 250 695 555 10 - 14 1 888 946 942 15 - 19 1 664 936 728 15 - 19 1 873 967 906 20 - 24 1 740 1 041 699 20 - 24 1 097 627 470 25 - 29 1 629 934 695 25 - 29 790 474 316 30 - 34 1 271 748 523 30 - 34 671 367 304 35 - 39 1 060 590 470 35 - 39 632 397 235 40 - 44 768 429 339 40 - 44 462 279 183 45 - 49 638 356 282 45 - 49 434 288 146 50 - 54 374 220 154 50 - 54 347 228 119 55 - 59 256 136 120 55 - 59 303 211 92 60 - 64 177 95 82 60 - 64 302 185 117 65 - 69 104 48 56 65 - 69 240 144 96 70 - 74 62 38 24 70 - 74 213 128 85 75 - 79 64 35 29 75 - 79 186 128 58 80 - 84 54 33 21 80 - 84 169 104 65 85 - 89 41 29 12 85 - 89 126 87 39 90 - 94 32 20 12 90 - 94 71 47 24 95 + 32 23 9 95 + 46 33 13

Chapter 7: Housing Characteristics
2011 Population and Housing Census Regional Profile, Omusati Region 65
Table 2.6 Population distribution by age Table 2.8 Population distribution by age group and sex, Elim group and sex, Ogongo
Age Population
Age Population
Total Female Male Total Female Male
Total 11 406 6 308 5 098 Total 19 546 10 802 8 744 0 - 4 1 436 722 714 0 - 4 2 648 1 312 1 336 5 - 9 1 292 654 638 5 - 9 2 429 1 193 1 236 10 - 14 1 569 758 811 10 - 14 2 663 1 324 1 339 15 - 19 1 496 734 762 15 - 19 2 680 1 317 1 363 20 - 24 900 469 431 20 - 24 1 528 802 726 25 - 29 623 351 272 25 - 29 1 042 602 440 30 - 34 573 330 243 30 - 34 886 536 350 35 - 39 515 309 206 35 - 39 864 533 331 40 - 44 427 262 165 40 - 44 689 439 250 45 - 49 399 271 128 45 - 49 609 430 179 50 - 54 350 255 95 50 - 54 553 386 167 55 - 59 307 207 100 55 - 59 556 390 166 60 - 64 306 184 122 60 - 64 509 299 210 65 - 69 289 192 97 65 - 69 496 334 162 70 - 74 237 158 79 70 - 74 355 229 126 75 - 79 179 116 63 75 - 79 288 170 118 80 - 84 179 106 73 80 - 84 308 207 101 85 - 89 140 93 47 85 - 89 202 133 69 90 - 94 104 73 31 90 - 94 122 85 37 95 + 85 64 21 95 + 119 81 38
Table 2.7 Population distribution by age Table 2.9 Population distribution by age group and sex, Etayi group and sex, Okahao
Age Population
Age Population
Total Female Male Total Female Male
Total 35 101 19 610 15 491 Total 17 548 9 529 8 019 0 - 4 4 953 2 472 2 481 0 - 4 2 226 1 068 1 158 5 - 9 4 520 2 247 2 273 5 - 9 2 045 1 024 1 021 10 - 14 5 372 2 711 2 661 10 - 14 2 149 1 026 1 123 15 - 19 5 344 2 718 2 626 15 - 19 2 273 1 131 1 142 20 - 24 2 746 1 467 1 279 20 - 24 1 515 799 716 25 - 29 1 637 981 656 25 - 29 1 102 576 526 30 - 34 1 530 957 573 30 - 34 937 508 429 35 - 39 1 396 881 515 35 - 39 860 510 350 40 - 44 1 156 778 378 40 - 44 654 437 217 45 - 49 959 658 301 45 - 49 622 409 213 50 - 54 753 565 188 50 - 54 518 331 187 55 - 59 750 517 233 55 - 59 483 324 159 60 - 64 773 500 273 60 - 64 494 311 183 65 - 69 771 514 257 65 - 69 459 284 175 70 - 74 628 385 243 70 - 74 292 170 122 75 - 79 493 330 163 75 - 79 218 145 73 80 - 84 468 304 164 80 - 84 255 180 75 85 - 89 380 277 103 85 - 89 180 122 58 90 - 94 285 210 75 90 - 94 122 74 48 95 + 187 138 49 95 + 144 100 44
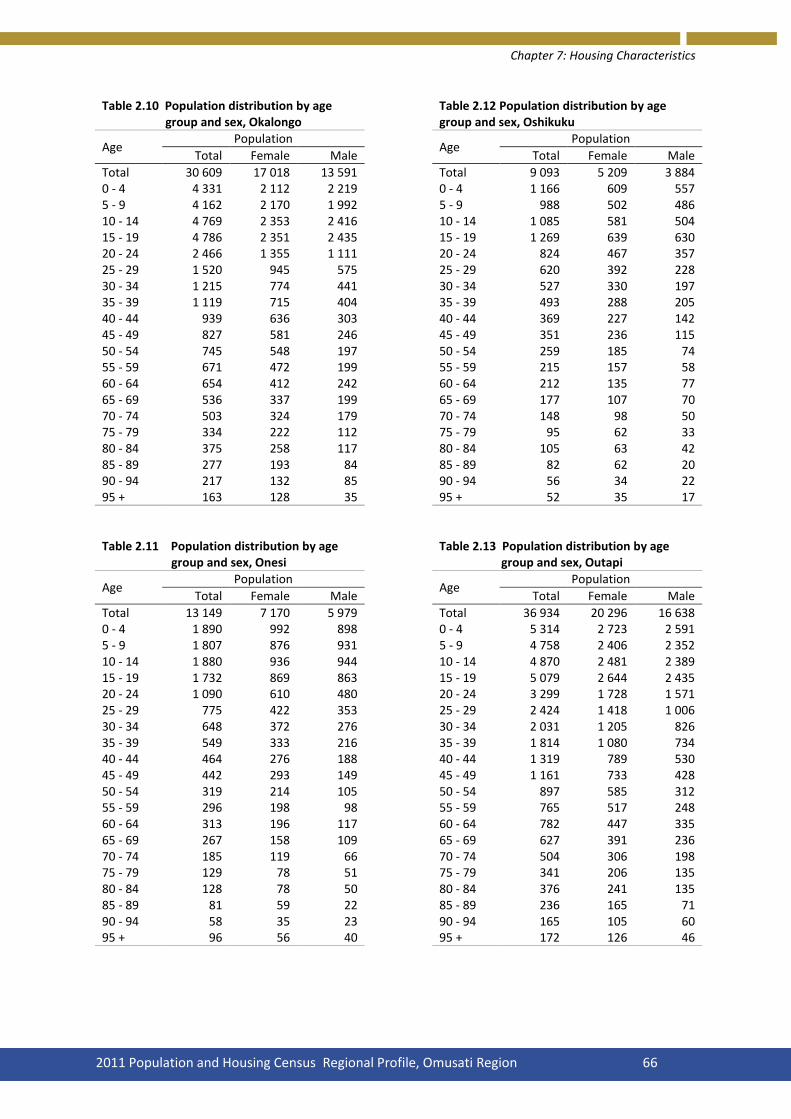
Chapter 7: Housing Characteristics
2011 Population and Housing Census Regional Profile, Omusati Region 66
Table 2.10 Population distribution by age group and sex, Okalongo
Table 2.12 Population distribution by age group and sex, Oshikuku
Age
Population Age
Population
Total Female Male Total Female Male
Total 30 609 17 018 13 591 Total 9 093 5 209 3 884 0 - 4 4 331 2 112 2 219 0 - 4 1 166 609 557 5 - 9 4 162 2 170 1 992 5 - 9 988 502 486 10 - 14 4 769 2 353 2 416 10 - 14 1 085 581 504 15 - 19 4 786 2 351 2 435 15 - 19 1 269 639 630 20 - 24 2 466 1 355 1 111 20 - 24 824 467 357 25 - 29 1 520 945 575 25 - 29 620 392 228 30 - 34 1 215 774 441 30 - 34 527 330 197 35 - 39 1 119 715 404 35 - 39 493 288 205 40 - 44 939 636 303 40 - 44 369 227 142 45 - 49 827 581 246 45 - 49 351 236 115 50 - 54 745 548 197 50 - 54 259 185 74 55 - 59 671 472 199 55 - 59 215 157 58 60 - 64 654 412 242 60 - 64 212 135 77 65 - 69 536 337 199 65 - 69 177 107 70 70 - 74 503 324 179 70 - 74 148 98 50 75 - 79 334 222 112 75 - 79 95 62 33 80 - 84 375 258 117 80 - 84 105 63 42 85 - 89 277 193 84 85 - 89 82 62 20 90 - 94 217 132 85 90 - 94 56 34 22 95 + 163 128 35 95 + 52 35 17
Table 2.11 Population distribution by age
group and sex, Onesi Table 2.13 Population distribution by age
group and sex, Outapi
Age Population
Age Population
Total Female Male Total Female Male
Total 13 149 7 170 5 979 Total 36 934 20 296 16 638 0 - 4 1 890 992 898 0 - 4 5 314 2 723 2 591 5 - 9 1 807 876 931 5 - 9 4 758 2 406 2 352 10 - 14 1 880 936 944 10 - 14 4 870 2 481 2 389 15 - 19 1 732 869 863 15 - 19 5 079 2 644 2 435 20 - 24 1 090 610 480 20 - 24 3 299 1 728 1 571 25 - 29 775 422 353 25 - 29 2 424 1 418 1 006 30 - 34 648 372 276 30 - 34 2 031 1 205 826 35 - 39 549 333 216 35 - 39 1 814 1 080 734 40 - 44 464 276 188 40 - 44 1 319 789 530 45 - 49 442 293 149 45 - 49 1 161 733 428 50 - 54 319 214 105 50 - 54 897 585 312 55 - 59 296 198 98 55 - 59 765 517 248 60 - 64 313 196 117 60 - 64 782 447 335 65 - 69 267 158 109 65 - 69 627 391 236 70 - 74 185 119 66 70 - 74 504 306 198 75 - 79 129 78 51 75 - 79 341 206 135 80 - 84 128 78 50 80 - 84 376 241 135 85 - 89 81 59 22 85 - 89 236 165 71 90 - 94 58 35 23 90 - 94 165 105 60 95 + 96 56 40 95 + 172 126 46

Chapter 7: Housing Characteristics
2011 Population and Housing Census Regional Profile, Omusati Region 67
Table 2.14 Population distribution by age
group and sex, Ruacana
Table 2.16 Population distribution by age
group and sex, Otamanzi
Age Population
Age Population
Total Female Male Total Female Male
Total 14 857 7 327 7 530 Total 13 495 7 462 6 033 0 - 4 2 286 1 156 1130 0 - 4 1 903 970 933 5 - 9 1 887 969 918 5 - 9 1 710 875 835 10 - 14 1 849 930 919 10 - 14 1 644 840 804 15 - 19 1 720 778 942 15 - 19 1 823 906 917 20 - 24 1 382 635 747 20 - 24 995 517 478 25 - 29 1 106 489 617 25 - 29 706 389 317 30 - 34 921 456 465 30 - 34 580 341 239 35 - 39 796 427 369 35 - 39 597 348 249 40 - 44 680 345 335 40 - 44 559 374 185 45 - 49 548 284 264 45 - 49 513 350 163 50 - 54 387 216 171 50 - 54 361 241 120 55 - 59 351 166 185 55 - 59 384 270 114 60 - 64 270 135 135 60 - 64 379 227 152 65 - 69 238 116 122 65 - 69 333 211 122 70 - 74 148 59 89 70 - 74 269 162 107 75 - 79 86 40 46 75 - 79 212 107 105 80 - 84 86 48 38 80 - 84 186 106 80 85 - 89 52 39 13 85 - 89 139 91 48 90 - 94 27 14 13 90 - 94 98 65 33 95 + 37 25 12 95 + 104 72 32
Table 2.15 Population distribution by age group and sex, Tsandi
Age Population
Total Female Male
Total 28 018 15 378 12 640 0 - 4 3 832 1 967 1 865 5 - 9 3 433 1 741 1 692 10 - 14 3 576 1 760 1 816 15 - 19 3 481 1 737 1 744 20 - 24 2 256 1 142 1 114 25 - 29 1 658 885 773 30 - 34 1 465 852 613 35 - 39 1 230 739 491 40 - 44 1 012 625 387 45 - 49 915 613 302 50 - 54 809 550 259 55 - 59 789 580 209 60 - 64 843 518 325 65 - 69 707 414 293 70 - 74 579 350 229 75 - 79 431 254 177 80 - 84 365 230 135 85 - 89 254 168 86 90 - 94 194 125 69 95 + 189 128 61

Chapter 7: Housing Characteristics
2011 Population and Housing Census Regional Profile, Omusati Region 68
Table 3.1 Population aged 15 years and above Table 3.4 Population aged 15 years and above by marital status and sex, Omusati by marital status and sex, Anamulenge
Marital Status Population
Marital Status Population
Total Female Male Total Female Male
Total 144 640 84 088 60 552 Total 7 888 4 665 3 223 Never Married 93 361 51 548 41 813 Never Married 5 287 3 006 2 281 Married with Certificate 28 980 16 626 12 354 Married with Certificate 1 573 889 684 Married Traditionally 8 272 4 966 3 306 Married Traditionally 263 145 118 Consensual Union 4 475 2 478 1 997 Consensual Union 198 107 91 Divorced 1 106 819 287 Divorced 37 28 9 Widowed 7 272 6 799 473 Widowed 470 445 25 Separated 1 037 752 285 Separated 49 38 11 Don’t know 137 100 37 Don't Know 11 7 4
Table 3.2 Population aged 15 years and above Table 3.5 Population aged 15 years and above by marital status and sex, Urban by marital status and sex, Elim
Marital Status Population
Marital Status Population
Total Female Male Total Female Male
Total 9 516 5 534 3 982 Total 7 082 4 165 2 917 Never Married 6 720 3 957 2 763 Never Married 4 566 2 508 2 058 Married with Certificate 1 917 1 021 896 Married with Certificate 1 654 965 689 Married Traditionally 283 152 131 Married Traditionally 127 84 43 Consensual Union 294 147 147 Consensual Union 156 87 69 Divorced 50 33 17 Divorced 43 29 14 Widowed 232 209 23 Widowed 476 450 26 Separated 17 13 4 Separated 58 40 18 Don’t know 3 2 1 Don't Know 2 2 0
Table 3.3 Population aged 15 years and above Table 3.6 Population aged 15 years and above by marital status and sex, Rural by marital status and sex, Etayi
Marital Status Population
Marital Status Population
Total Female Male Total Female Male
Total 135 124 78 554 56 570 Total 20 256 12 180 8 076 Never Married 86 641 47 591 39 050 Never Married 13 378 7 561 5 817 Married with Certificate 27 063 15 605 11 458 Married with Certificate 3 992 2 351 1 641 Married Traditionally 7 989 4 814 3 175 Married Traditionally 899 624 275 Consensual Union 4 181 2 331 1 850 Consensual Union 510 307 203 Divorced 1 056 786 270 Divorced 130 98 32 Widowed 7 040 6 590 450 Widowed 1 221 1 151 70 Separated 1 020 739 281 Separated 111 78 33 Don’t know 134 98 36 Don't Know 15 10 5
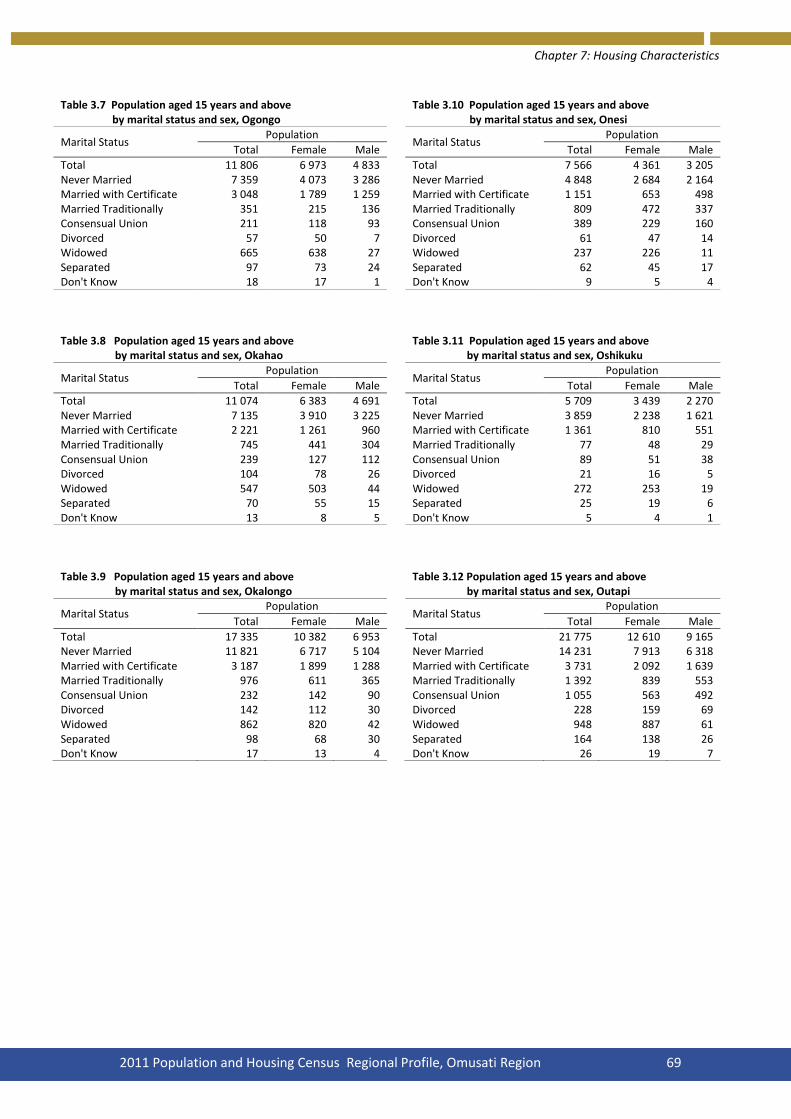
Chapter 7: Housing Characteristics
2011 Population and Housing Census Regional Profile, Omusati Region 69
Table 3.7 Population aged 15 years and above Table 3.10 Population aged 15 years and above by marital status and sex, Ogongo by marital status and sex, Onesi
Marital Status Population
Marital Status Population
Total Female Male Total Female Male
Total 11 806 6 973 4 833 Total 7 566 4 361 3 205 Never Married 7 359 4 073 3 286 Never Married 4 848 2 684 2 164 Married with Certificate 3 048 1 789 1 259 Married with Certificate 1 151 653 498 Married Traditionally 351 215 136 Married Traditionally 809 472 337 Consensual Union 211 118 93 Consensual Union 389 229 160 Divorced 57 50 7 Divorced 61 47 14 Widowed 665 638 27 Widowed 237 226 11 Separated 97 73 24 Separated 62 45 17 Don't Know 18 17 1 Don't Know 9 5 4
Table 3.8 Population aged 15 years and above Table 3.11 Population aged 15 years and above by marital status and sex, Okahao by marital status and sex, Oshikuku
Marital Status Population
Marital Status Population
Total Female Male Total Female Male
Total 11 074 6 383 4 691 Total 5 709 3 439 2 270 Never Married 7 135 3 910 3 225 Never Married 3 859 2 238 1 621 Married with Certificate 2 221 1 261 960 Married with Certificate 1 361 810 551 Married Traditionally 745 441 304 Married Traditionally 77 48 29 Consensual Union 239 127 112 Consensual Union 89 51 38 Divorced 104 78 26 Divorced 21 16 5 Widowed 547 503 44 Widowed 272 253 19 Separated 70 55 15 Separated 25 19 6 Don't Know 13 8 5 Don't Know 5 4 1 Table 3.9 Population aged 15 years and above Table 3.12 Population aged 15 years and above by marital status and sex, Okalongo by marital status and sex, Outapi
Marital Status Population
Marital Status Population
Total Female Male Total Female Male
Total 17 335 10 382 6 953 Total 21 775 12 610 9 165 Never Married 11 821 6 717 5 104 Never Married 14 231 7 913 6 318 Married with Certificate 3 187 1 899 1 288 Married with Certificate 3 731 2 092 1 639 Married Traditionally 976 611 365 Married Traditionally 1 392 839 553 Consensual Union 232 142 90 Consensual Union 1 055 563 492 Divorced 142 112 30 Divorced 228 159 69 Widowed 862 820 42 Widowed 948 887 61 Separated 98 68 30 Separated 164 138 26 Don't Know 17 13 4 Don't Know 26 19 7

Chapter 7: Housing Characteristics
2011 Population and Housing Census Regional Profile, Omusati Region 70
Table 3.13 Population aged 15 years and above Table 3.15 Population aged 15 years and above
by marital status and sex, Ruacana by marital status and sex, Otamanzi
Marital Status Population
Marital Status Population
Total Female Male Total Female Male
Total 8 786 4 270 4 516 Total 8 238 4 777 3 461
Never Married 5 264 2 380 2 884 Never Married 4 971 2 727 2 244
Married with Certificate 1 214 580 634 Married with Certificate 2 074 1 188 886
Married Traditionally 1 297 677 620 Married Traditionally 357 217 140
Consensual Union 572 303 269 Consensual Union 216 116 100
Divorced 73 48 25 Divorced 78 52 26
Widowed 270 213 57 Widowed 447 418 29
Separated 91 67 24 Separated 87 53 34
Don't Know 5 2 3 Don't Know 8 6 2
Table 3.14 Population aged 15 years and above
by marital status and sex, Tsandi
Marital Status Population
Total Female Male
Total 17 125 9 883 7 242
Never Married 10 642 5 831 4 811
Married with Certificate 3 774 2 149 1 625
Married Traditionally 979 593 386
Consensual Union 608 328 280
Divorced 132 102 30
Widowed 857 795 62
Separated 125 78 47
Don't Know 8 7 1

Chapter 7: Housing Characteristics
2011 Population and Housing Census Regional Profile, Omusati Region 71
Table 4.1 Children ever born to females aged 12-64 years by sex, Omusati
Age women Children ever born Surviving Died
Total Female Male Total Female Male Total Female Male
Total 81 045 163 776 82 398 81 378 147 459 74 704 72 755 16 317 7 694 8 623 12 - 14 9 862 282 146 136 258 136 122 24 10 14 15 - 19 16 769 1 842 919 923 1 715 863 852 127 56 71 20 - 24 10 577 8 013 4 010 4 003 7 431 3 745 3 686 582 265 317 25 - 29 7 897 12 667 6 310 6 357 11 742 5 869 5 873 925 441 484 30 - 34 6 983 16 596 8 275 8 321 15 332 7 679 7 653 1 264 596 668 35 - 39 6 536 19 298 9 804 9 494 17 771 9 071 8 700 1 527 733 794 40 - 44 5 449 19 306 9 676 9 630 17 659 8 897 8 762 1 647 779 868 45 - 49 5 138 21 276 10 634 10 642 19 441 9 788 9 653 1 835 846 989 50 - 54 4 291 21 441 10 867 10 574 19 155 9 786 9 369 2 286 1 081 1 205 55 - 59 4 002 22 394 11 248 11 146 19 635 9 972 9 663 2 759 1 276 1 483 60 - 64 3 541 20 661 10 509 10 152 17 320 8 898 8 422 3 341 1 611 1 730
Table 4.2 Children ever born to females aged 12-64 years by sex, Urban
Age women Children ever born Surviving Died
Total Female Male Total Female Male Total Female Male
Total 5 761 8 686 4 360 4 326 7 951 4 045 3 906 735 315 420 12 - 14 415 9 3 6 8 2 6 1 1 0 15 - 19 923 87 39 48 76 34 42 11 5 6 20 - 24 1 012 562 292 270 524 270 254 38 22 16 25 - 29 919 1 102 564 538 1 019 530 489 83 34 49 30 - 34 715 1 281 653 628 1 189 609 580 92 44 48 35 - 39 574 1 379 699 680 1 246 644 602 133 55 78 40 - 44 418 1 185 577 608 1 113 553 560 72 24 48 45 - 49 352 1 191 592 599 1 139 574 565 52 18 34 50 - 54 213 846 416 430 747 375 372 99 41 58 55 - 59 130 537 244 293 485 222 263 52 22 30 60 - 64 90 507 281 226 405 232 173 102 49 53 Table 4.3 Children ever born to females aged 12-64 years by sex, Rural
Age women Children ever born Surviving Died
Total Female Male Total Female Male Total Female Male
Total 75 284 155 090 78 038 77 052 139 508 70 659 68 849 15 582 7 379 8 203 12 - 14 9 447 273 143 130 250 134 116 23 9 14 15 - 19 15 846 1 755 880 875 1 639 829 810 116 51 65 20 - 24 9 565 7 451 3 718 3 733 6 907 3 475 3 432 544 243 301 25 - 29 6 978 11 565 5 746 5 819 10 723 5 339 5 384 842 407 435 30 - 34 6 268 15 315 7 622 7 693 14 143 7 070 7 073 1 172 552 620 35 - 39 5 962 17 919 9 105 8 814 16 525 8 427 8 098 1 394 678 716 40 - 44 5 031 18 121 9 099 9 022 16 546 8 344 8 202 1 575 755 820 45 - 49 4 786 20 085 10 042 10 043 18 302 9 214 9 088 1 783 828 955 50 - 54 4 078 20 595 10 451 10 144 18 408 9 411 8 997 2 187 1 040 1 147 55 - 59 3 872 21 857 11 004 10 853 19 150 9 750 9 400 2 707 1 254 1 453 60 - 64 3 451 20 154 10 228 9 926 16 915 8 666 8 249 3 239 1 562 1 677

Chapter 7: Housing Characteristics
2011 Population and Housing Census Regional Profile, Omusati Region 72
Table 4.4 Children ever born to females aged 12-64 years by sex, Anamulenge
Age women Children ever born Surviving Died
Total Females Male Total Females Male Total Females Male
Total 4 563 8 511 4 311 4 200 7 720 3 948 3 772 791 363 428 12 - 14 569 12 10 2 12 10 2 0 0 0 15 - 19 962 79 33 46 72 30 42 7 3 4 20 - 24 622 427 209 218 395 194 201 32 15 17 25 - 29 469 718 354 364 671 327 344 47 27 20 30 - 34 364 787 392 395 725 360 365 62 32 30 35 - 39 395 1 078 544 534 1 007 513 494 71 31 40 40 - 44 274 891 471 420 812 430 382 79 41 38 45 - 49 286 1 112 590 522 1 047 552 495 65 38 27 50 - 54 226 1 160 595 565 1 028 542 486 132 53 79 55 - 59 211 1 155 562 593 1 007 507 500 148 55 93 60 - 64 185 1 092 551 541 944 483 461 148 68 80
Table 4.5 Children ever born to females aged 12-64 years by sex, Elim
Age women Children ever born Surviving Died
Total Females Male Total Females Male Total Females Male
Total 3 804 6 789 3 447 3 342 6 305 3 208 3 097 484 239 245 12 - 14 440 14 8 6 13 7 6 1 1 0 15 - 19 733 88 47 41 85 45 40 3 2 1 20 - 24 467 274 126 148 258 117 141 16 9 7 25 - 29 350 480 238 242 455 226 229 25 12 13 30 - 34 329 571 282 289 542 264 278 29 18 11 35 - 39 309 653 336 317 620 320 300 33 16 17 40 - 44 262 700 338 362 654 316 338 46 22 24 45 - 49 271 920 488 432 878 465 413 42 23 19 50 - 54 253 1 065 542 523 1003 515 488 62 27 35 55 - 59 206 1 034 518 516 939 484 455 95 34 61 60 - 64 184 990 524 466 858 449 409 132 75 57
Table 4.6 Children ever born to females aged 12-64 years by sex, Etayi
Age women Children ever born Surviving Died
Total Females Male Total Females Male Total Females Male
Total 11 587 23 559 11 803 11 756 21 148 10 714 10 434 2 411 1 089 1 322 12 - 14 1 565 46 22 24 42 21 21 4 1 3 15 - 19 2 718 266 136 130 248 132 116 18 4 14 20 - 24 1 467 1 075 519 556 993 487 506 82 32 50 25 - 29 981 1 536 777 759 1 440 730 710 96 47 49 30 - 34 957 2 311 1 128 1 183 2 147 1 048 1 099 164 80 84 35 - 39 881 2 789 1 477 1 312 2 570 1 366 1 204 219 111 108 40 - 44 778 2 976 1 516 1 460 2 753 1 412 1 341 223 104 119 45 - 49 658 2 929 1 427 1 502 2 653 1 297 1 356 276 130 146 50 - 54 565 3 217 1 612 1 605 2 834 1 439 1 395 383 173 210 55 - 59 517 3 091 1 510 1 581 2 696 1 350 1 346 395 160 235 60 - 64 500 3 323 1 679 1 644 2 772 1 432 1 340 551 247 304

Chapter 7: Housing Characteristics
2011 Population and Housing Census Regional Profile, Omusati Region 73
Table 4.7 Children ever born to females aged 12-64 years by sex, Ogongo
Age women Children ever born Surviving Died
Total Females Male Total Females Male Total Females Male
Total 6 516 12 586 6 281 6 305 11 503 5 739 5 764 1 083 542 541 12 - 14 782 24 12 12 21 11 10 3 1 2 15 - 19 1 317 108 58 50 104 56 48 4 2 2 20 - 24 802 478 247 231 442 230 212 36 17 19 25 - 29 602 870 418 452 824 404 420 46 14 32 30 - 34 536 1 088 510 578 1 017 483 534 71 27 44 35 - 39 533 1 381 663 718 1 275 627 648 106 36 70 40 - 44 439 1 435 721 714 1 314 657 657 121 64 57 45 - 49 430 1 720 852 868 1 614 801 813 106 51 55 50 - 54 386 1 816 938 878 1 676 857 819 140 81 59 55 - 59 390 2 027 1 029 998 1 844 933 911 183 96 87 60 - 64 299 1 639 833 806 1 372 680 692 267 153 114 Table 4.8 Children ever born to females aged 12-64 years by sex, Okahao
Age women Children ever born Surviving Died
Total Females Male Total Females Male Total Females Male
Total 5 935 11 106 5 489 5 617 10 007 4 976 5 031 1 099 513 586 12 - 14 617 17 8 9 17 8 9 0 0 0 15 - 19 1 131 151 73 78 142 73 69 9 0 9 20 - 24 795 569 288 281 544 280 264 25 8 17 25 - 29 574 783 346 437 720 324 396 63 22 41 30 - 34 504 1 049 543 506 974 500 474 75 43 32 35 - 39 508 1 220 613 607 1 150 585 565 70 28 42 40 - 44 435 1 219 592 627 1 129 547 582 90 45 45 45 - 49 408 1 339 665 674 1 231 624 607 108 41 67 50 - 54 329 1 455 735 720 1 290 649 641 165 86 79 55 - 59 323 1 620 808 812 1 421 709 712 199 99 100 60 - 64 311 1 684 818 866 1 389 677 712 295 141 154
Table 4.9 Children ever born to females aged 12-64 years by sex, Okalongo
Age women Children ever born Surviving Died
Total Females Male Total Females Male Total Females Male
Total 10 237 21 241 10 625 10 616 18 932 9 554 9 378 2 309 1 071 1 238 12 - 14 1 449 39 21 18 36 19 17 3 2 1 15 - 19 2 351 219 107 112 198 100 98 21 7 14 20 - 24 1 355 948 478 470 884 443 441 64 35 29 25 - 29 945 1 550 753 797 1 420 686 734 130 67 63 30 - 34 773 1 992 934 1 058 1 848 876 972 144 58 86 35 - 39 715 2 372 1 176 1 196 2 173 1 093 1 080 199 83 116 40 - 44 636 2 681 1 369 1 312 2 402 1 222 1 180 279 147 132 45 - 49 581 2 863 1 413 1 450 2 590 1 310 1 280 273 103 170 50 - 54 548 3 082 1 548 1 534 2 736 1 391 1 345 346 157 189 55 - 59 472 2 876 1 489 1 387 2 471 1 276 1 195 405 213 192 60 - 64 412 2 619 1 337 1 282 2 174 1 138 1 036 445 199 246

Chapter 7: Housing Characteristics
2011 Population and Housing Census Regional Profile, Omusati Region 74
Table 4.10 Children ever born to females aged 12-64 years by sex, Onesi
Age women Children ever born Surviving Died
Total Females Male Total Females Male Total Females Male
Total 4 342 9 621 4 877 4 744 8 594 4 392 4 202 1 027 485 542 12 - 14 564 16 9 7 14 8 6 2 1 1 15 - 19 868 118 64 54 111 61 50 7 3 4 20 - 24 609 558 269 289 525 256 269 33 13 20 25 - 29 421 812 411 401 753 381 372 59 30 29 30 - 34 372 1 032 501 531 958 471 487 74 30 44 35 - 39 333 1 149 598 551 1 057 541 516 92 57 35 40 - 44 276 1 122 552 570 1 033 507 526 89 45 44 45 - 49 292 1 478 755 723 1 313 672 641 165 83 82 50 - 54 213 1 114 592 522 975 520 455 139 72 67 55 - 59 198 1 130 568 562 963 500 463 167 68 99 60 - 64 196 1 092 558 534 892 475 417 200 83 117
Table 4.11 Children ever born to females aged 12-64 years by sex, Oshikuku
Age of mother
women Children ever born Surviving Died
Total Females Male Total Females Male Total Females Male
Total 3 354 6 121 3 147 2 974 5 501 2 840 2 661 620 307 313 12 - 14 361 4 3 1 3 3 0 1 0 1 15 - 19 632 73 35 38 69 33 36 4 2 2 20 - 24 453 296 159 137 276 146 130 20 13 7 25 - 29 390 549 286 263 491 259 232 58 27 31 30 - 34 313 647 342 305 567 300 267 80 42 38 35 - 39 282 688 349 339 641 326 315 47 23 24 40 - 44 222 629 296 333 562 281 281 67 15 52 45 - 49 234 775 397 378 725 368 357 50 29 21 50 - 54 181 767 384 383 701 350 351 66 34 32 55 - 59 154 904 465 439 797 410 387 107 55 52 60 - 64 132 789 431 358 669 364 305 120 67 53
Table 4.12 Children ever born to females aged 12-64 years by sex, Outapi
Age of mother
women Children ever born Surviving Died
Total Females Male Total Females Male Total Females Male
Total 12 525 24 940 12 560 12 380 22 296 11 267 11 029 2 644 1 293 1 351 12 - 14 1 442 54 27 27 50 24 26 4 3 1 15 - 19 2 638 276 144 132 255 128 127 21 16 5 20 - 24 1 717 1 352 663 689 1 232 603 629 120 60 60 25 - 29 1 405 2 297 1 153 1 144 2 131 1 071 1 060 166 82 84 30 - 34 1 192 2 943 1 526 1 417 2 677 1 390 1 287 266 136 130 35 - 39 1 070 3 338 1 642 1 696 3 036 1 491 1 545 302 151 151 40 - 44 785 2 888 1 457 1 431 2 623 1 331 1 292 265 126 139 45 - 49 732 3 178 1 579 1 599 2 855 1 436 1 419 323 143 180 50 - 54 584 3 085 1 574 1 511 2 701 1 393 1 308 384 181 203 55 - 59 515 2 911 1 429 1 482 2 554 1 269 1 285 357 160 197 60 - 64 445 2 618 1 366 1 252 2 182 1 131 1 051 436 235 201

Chapter 7: Housing Characteristics
2011 Population and Housing Census Regional Profile, Omusati Region 75
Table 4.13 Children ever born to females aged 12-64 years by sex, Ruacana
Age of mother
women Children ever born Surviving Died
Total Females Male Total Females Male Total Females Male
Total 4 447 11 018 5 661 5 357 9 888 5 115 4 773 1 130 546 584 12 - 14 518 23 11 12 21 10 11 2 1 1 15 - 19 778 148 86 62 137 79 58 11 7 4 20 - 24 635 712 347 365 661 333 328 51 14 37 25 - 29 489 1 033 553 480 957 514 443 76 39 37 30 - 34 455 1 439 711 728 1 347 677 670 92 34 58 35 - 39 427 1 584 852 732 1 441 777 664 143 75 68 40 - 44 345 1 549 765 784 1 401 697 704 148 68 80 45 - 49 283 1 468 757 711 1 325 689 636 143 68 75 50 - 54 216 1 223 635 588 1 055 546 509 168 89 79 55 - 59 166 1 037 519 518 882 439 443 155 80 75 60 - 64 135 802 425 377 661 354 307 141 71 70
Table 4.14 Children ever born to females aged 12-64 years by sex, Tsandi
Age of mother
women Children ever born Surviving Died
Total Females Male Total Females Male Total Females Male
Total 9 281 18 696 9 362 9 334 16 830 8 521 8 309 1 866 841 1 025 12 - 14 1 064 29 12 17 25 12 13 4 0 4 15 - 19 1 735 204 86 118 188 80 108 16 6 10 20 - 24 1 138 918 505 413 841 465 376 77 40 37 25 - 29 882 1 435 713 722 1 307 649 658 128 64 64 30 - 34 847 1 927 1 000 927 1 777 930 847 150 70 80 35 - 39 735 2 037 1 023 1 014 1 870 944 926 167 79 88 40 - 44 623 1 976 991 985 1 827 936 891 149 55 94 45 - 49 613 2 117 1 041 1 076 1 924 946 978 193 95 98 50 - 54 549 2 288 1 120 1 168 2 089 1 035 1 054 199 85 114 55 - 59 580 3 093 1 555 1 538 2 716 1 388 1 328 377 167 210 60 - 64 515 2 672 1 316 1 356 2 266 1 136 1 130 406 180 226
Table 4.15 Children ever born to females aged 12-64 years by sex, Otamanzi
Age of mother
women Children ever born Surviving Died
Total Females Male Total Females Male Total Females Male
Total 4 454 9 588 4 835 4 753 8 735 4 430 4 305 853 405 448 12 - 14 491 4 3 1 4 3 1 0 0 0 15 - 19 906 112 50 62 106 46 60 6 4 2 20 - 24 517 406 200 206 380 191 189 26 9 17 25 - 29 389 604 308 296 573 298 275 31 10 21 30 - 34 341 810 406 404 753 380 373 57 26 31 35 - 39 348 1 009 531 478 931 488 443 78 43 35 40 - 44 374 1 240 608 632 1 149 561 588 91 47 44 45 - 49 350 1 377 670 707 1 286 628 658 91 42 49 50 - 54 241 1 169 592 577 1 067 549 518 102 43 59 55 - 59 270 1 516 796 720 1 345 707 638 171 89 82 60 - 64 227 1 341 671 670 1 141 579 562 200 92 108
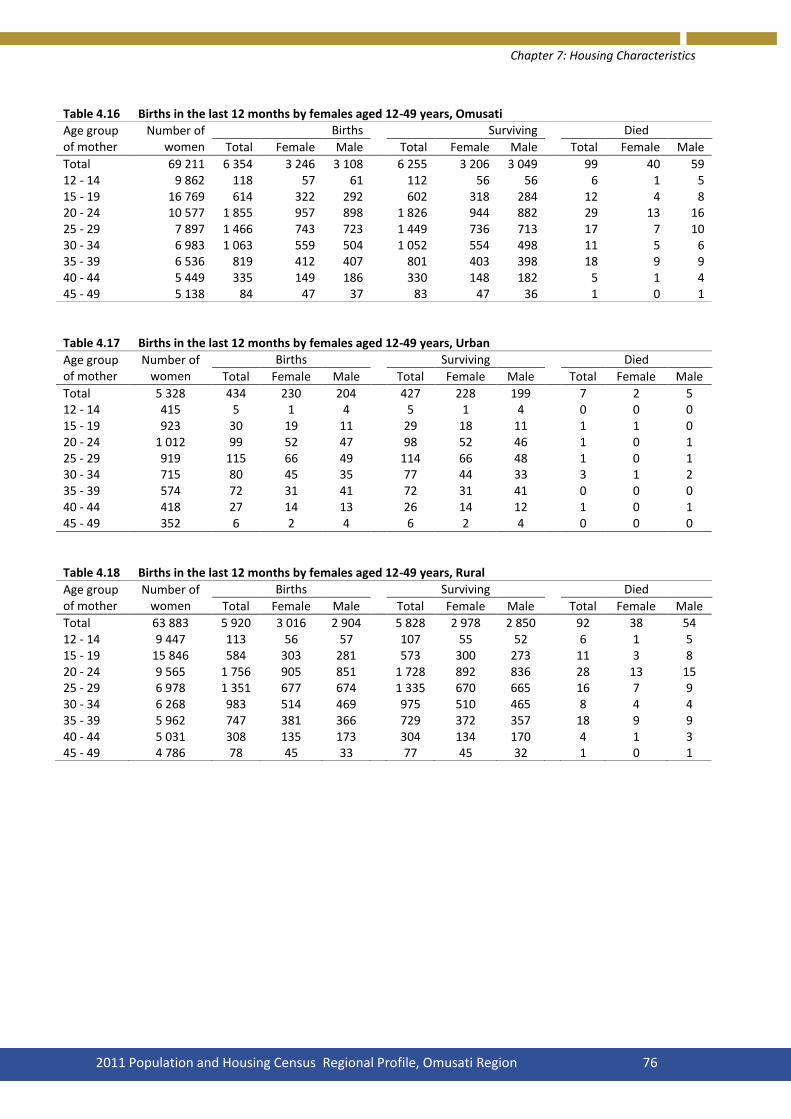
Chapter 7: Housing Characteristics
2011 Population and Housing Census Regional Profile, Omusati Region 76
Table 4.16 Births in the last 12 months by females aged 12-49 years, Omusati
Age group of mother
Number of women
Births Surviving Died
Total Female Male Total Female Male Total Female Male
Total 69 211 6 354 3 246 3 108 6 255 3 206 3 049 99 40 59 12 - 14 9 862 118 57 61 112 56 56 6 1 5 15 - 19 16 769 614 322 292 602 318 284 12 4 8 20 - 24 10 577 1 855 957 898 1 826 944 882 29 13 16 25 - 29 7 897 1 466 743 723 1 449 736 713 17 7 10 30 - 34 6 983 1 063 559 504 1 052 554 498 11 5 6 35 - 39 6 536 819 412 407 801 403 398 18 9 9 40 - 44 5 449 335 149 186 330 148 182 5 1 4 45 - 49 5 138 84 47 37 83 47 36 1 0 1
Table 4.17 Births in the last 12 months by females aged 12-49 years, Urban
Age group of mother
Number of women
Births Surviving Died
Total Female Male Total Female Male Total Female Male
Total 5 328 434 230 204 427 228 199 7 2 5 12 - 14 415 5 1 4 5 1 4 0 0 0 15 - 19 923 30 19 11 29 18 11 1 1 0 20 - 24 1 012 99 52 47 98 52 46 1 0 1 25 - 29 919 115 66 49 114 66 48 1 0 1 30 - 34 715 80 45 35 77 44 33 3 1 2 35 - 39 574 72 31 41 72 31 41 0 0 0 40 - 44 418 27 14 13 26 14 12 1 0 1 45 - 49 352 6 2 4 6 2 4 0 0 0
Table 4.18 Births in the last 12 months by females aged 12-49 years, Rural
Age group of mother
Number of women
Births Surviving Died
Total Female Male Total Female Male Total Female Male
Total 63 883 5 920 3 016 2 904 5 828 2 978 2 850 92 38 54 12 - 14 9 447 113 56 57 107 55 52 6 1 5 15 - 19 15 846 584 303 281 573 300 273 11 3 8 20 - 24 9 565 1 756 905 851 1 728 892 836 28 13 15 25 - 29 6 978 1 351 677 674 1 335 670 665 16 7 9 30 - 34 6 268 983 514 469 975 510 465 8 4 4 35 - 39 5 962 747 381 366 729 372 357 18 9 9 40 - 44 5 031 308 135 173 304 134 170 4 1 3 45 - 49 4 786 78 45 33 77 45 32 1 0 1
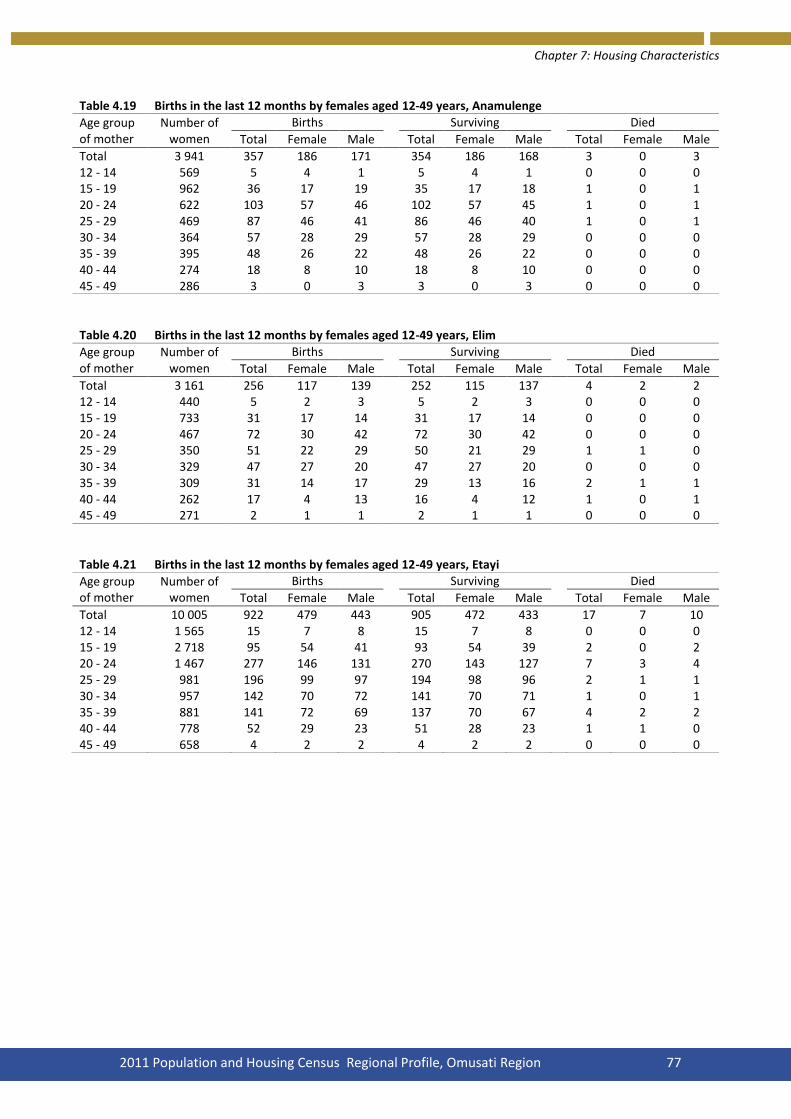
Chapter 7: Housing Characteristics
2011 Population and Housing Census Regional Profile, Omusati Region 77
Table 4.19 Births in the last 12 months by females aged 12-49 years, Anamulenge
Age group of mother
Number of women
Births Surviving Died
Total Female Male Total Female Male Total Female Male
Total 3 941 357 186 171 354 186 168 3 0 3 12 - 14 569 5 4 1 5 4 1 0 0 0 15 - 19 962 36 17 19 35 17 18 1 0 1 20 - 24 622 103 57 46 102 57 45 1 0 1 25 - 29 469 87 46 41 86 46 40 1 0 1 30 - 34 364 57 28 29 57 28 29 0 0 0 35 - 39 395 48 26 22 48 26 22 0 0 0 40 - 44 274 18 8 10 18 8 10 0 0 0 45 - 49 286 3 0 3 3 0 3 0 0 0
Table 4.20 Births in the last 12 months by females aged 12-49 years, Elim
Age group of mother
Number of women
Births Surviving Died
Total Female Male Total Female Male Total Female Male
Total 3 161 256 117 139 252 115 137 4 2 2 12 - 14 440 5 2 3 5 2 3 0 0 0 15 - 19 733 31 17 14 31 17 14 0 0 0 20 - 24 467 72 30 42 72 30 42 0 0 0 25 - 29 350 51 22 29 50 21 29 1 1 0 30 - 34 329 47 27 20 47 27 20 0 0 0 35 - 39 309 31 14 17 29 13 16 2 1 1 40 - 44 262 17 4 13 16 4 12 1 0 1 45 - 49 271 2 1 1 2 1 1 0 0 0
Table 4.21 Births in the last 12 months by females aged 12-49 years, Etayi
Age group of mother
Number of women
Births Surviving Died
Total Female Male Total Female Male Total Female Male
Total 10 005 922 479 443 905 472 433 17 7 10 12 - 14 1 565 15 7 8 15 7 8 0 0 0 15 - 19 2 718 95 54 41 93 54 39 2 0 2 20 - 24 1 467 277 146 131 270 143 127 7 3 4 25 - 29 981 196 99 97 194 98 96 2 1 1 30 - 34 957 142 70 72 141 70 71 1 0 1 35 - 39 881 141 72 69 137 70 67 4 2 2 40 - 44 778 52 29 23 51 28 23 1 1 0 45 - 49 658 4 2 2 4 2 2 0 0 0

Chapter 7: Housing Characteristics
2011 Population and Housing Census Regional Profile, Omusati Region 78
Table 4.22 Births in the last 12 months by females aged 12-49 years, Ogongo
Age group of mother
Number of women
Births Surviving Died
Total Female Male Total Female Male Total Female Male
Total 5 441 436 222 214 431 219 212 5 3 2 12 - 14 782 10 6 4 10 6 4 0 0 0 15 - 19 1 317 43 20 23 42 19 23 1 1 0 20 - 24 802 115 57 58 115 57 58 0 0 0 25 - 29 602 113 60 53 113 60 53 0 0 0 30 - 34 536 68 32 36 66 31 35 2 1 1 35 - 39 533 52 24 28 50 23 27 2 1 1 40 - 44 439 28 18 10 28 18 10 0 0 0 45 - 49 430 7 5 2 7 5 2 0 0 0
Table 4.23 Births in the last 12 months by females aged 12-49 years, Okahao
Age group of mother
Number of women
Births Surviving Died
Total Female Male Total Female Male Total Female Male
Total 4 972 427 222 205 421 220 201 6 2 4 12 - 14 617 7 3 4 7 3 4 0 0 0 15 - 19 1 131 45 22 23 44 22 22 1 0 1 20 - 24 795 140 73 67 140 73 67 0 0 0 25 - 29 574 96 48 48 94 47 47 2 1 1 30 - 34 504 81 40 41 79 40 39 2 0 2 35 - 39 508 38 23 15 37 22 15 1 1 0 40 - 44 435 17 11 6 17 11 6 0 0 0 45 - 49 408 3 2 1 3 2 1 0 0 0
Table 4.24 Births in the last 12 months by females aged 12-49 years, Okalongo
Age group of mother
Number of women
Births Surviving Died
Total Female Male Total Female Male Total Female Male
Total 8 805 773 385 388 763 382 381 10 3 7 12 - 14 1 449 21 9 12 21 9 12 0 0 0 15 - 19 2 351 62 31 31 61 31 30 1 0 1 20 - 24 1 355 224 124 100 221 123 98 3 1 2 25 - 29 945 186 82 104 182 81 101 4 1 3 30 - 34 773 131 68 63 131 68 63 0 0 0 35 - 39 715 93 47 46 92 46 46 1 1 0 40 - 44 636 44 19 25 43 19 24 1 0 1 45 - 49 581 12 5 7 12 5 7 0 0 0

Chapter 7: Housing Characteristics
2011 Population and Housing Census Regional Profile, Omusati Region 79
Table 4.25 Births in the last 12 months by females aged 12-49 years, Onesi
Age group of mother
Number of women
Births Surviving Died
Total Female Male Total Female Male Total Female Male
Total 3 735 385 196 189 381 195 186 4 1 3 12 - 14 564 7 4 3 6 4 2 1 0 1 15 - 19 868 38 23 15 37 23 14 1 0 1 20 - 24 609 119 62 57 118 62 56 1 0 1 25 - 29 421 84 42 42 84 42 42 0 0 0 30 - 34 372 61 35 26 60 34 26 1 1 0 35 - 39 333 46 19 27 46 19 27 0 0 0 40 - 44 276 21 6 15 21 6 15 0 0 0 45 - 49 292 9 5 4 9 5 4 0 0 0
Table 4.26 Births in the last 12 months by females aged 12-49 years, Oshikuku
Age group of mother
Number of women
Births Surviving Died
Total Female Male Total Female Male Total Female Male
Total 2 887 229 129 100 224 126 98 5 3 2 12 - 14 361 3 2 1 2 2 0 1 0 1 15 - 19 632 25 14 11 25 14 11 0 0 0 20 - 24 453 65 33 32 64 32 32 1 1 0 25 - 29 390 56 32 24 56 32 24 0 0 0 30 - 34 313 40 28 12 39 27 12 1 1 0 35 - 39 282 27 15 12 26 14 12 1 1 0 40 - 44 222 7 2 5 7 2 5 0 0 0 45 - 49 234 6 3 3 5 3 2 1 0 1
Table 4.27 Births in the last 12 months by females aged 12-49 years, Outapi
Age group of mother
Number of women
Births Surviving Died
Total Female Male Total Female Male Total Female Male
Total 10 981 1 023 522 501 1 006 516 490 17 6 11 12 - 14 1 442 24 9 15 23 9 14 1 0 1 15 - 19 2 638 87 45 42 86 44 42 1 1 0 20 - 24 1 717 287 150 137 282 147 135 5 3 2 25 - 29 1 405 254 130 124 252 130 122 2 0 2 30 - 34 1 192 175 95 80 173 94 79 2 1 1 35 - 39 1 070 145 69 76 140 68 72 5 1 4 40 - 44 785 37 15 22 36 15 21 1 0 1 45 - 49 732 14 9 5 14 9 5 0 0 0
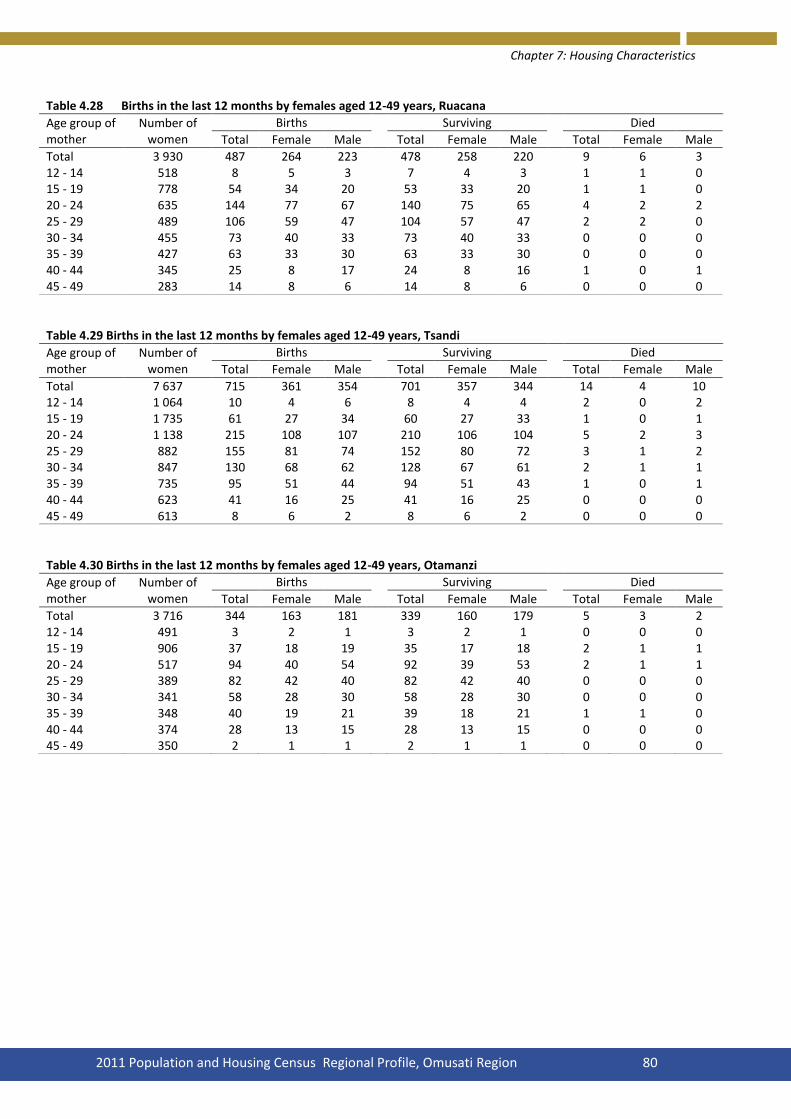
Chapter 7: Housing Characteristics
2011 Population and Housing Census Regional Profile, Omusati Region 80
Table 4.28 Births in the last 12 months by females aged 12-49 years, Ruacana
Age group of mother
Number of women
Births Surviving Died
Total Female Male Total Female Male Total Female Male
Total 3 930 487 264 223 478 258 220 9 6 3 12 - 14 518 8 5 3 7 4 3 1 1 0 15 - 19 778 54 34 20 53 33 20 1 1 0 20 - 24 635 144 77 67 140 75 65 4 2 2 25 - 29 489 106 59 47 104 57 47 2 2 0 30 - 34 455 73 40 33 73 40 33 0 0 0 35 - 39 427 63 33 30 63 33 30 0 0 0 40 - 44 345 25 8 17 24 8 16 1 0 1 45 - 49 283 14 8 6 14 8 6 0 0 0
Table 4.29 Births in the last 12 months by females aged 12-49 years, Tsandi
Age group of mother
Number of women
Births Surviving Died
Total Female Male Total Female Male Total Female Male
Total 7 637 715 361 354 701 357 344 14 4 10 12 - 14 1 064 10 4 6 8 4 4 2 0 2 15 - 19 1 735 61 27 34 60 27 33 1 0 1 20 - 24 1 138 215 108 107 210 106 104 5 2 3 25 - 29 882 155 81 74 152 80 72 3 1 2 30 - 34 847 130 68 62 128 67 61 2 1 1 35 - 39 735 95 51 44 94 51 43 1 0 1 40 - 44 623 41 16 25 41 16 25 0 0 0 45 - 49 613 8 6 2 8 6 2 0 0 0
Table 4.30 Births in the last 12 months by females aged 12-49 years, Otamanzi
Age group of mother
Number of women
Births Surviving Died
Total Female Male Total Female Male Total Female Male
Total 3 716 344 163 181 339 160 179 5 3 2 12 - 14 491 3 2 1 3 2 1 0 0 0 15 - 19 906 37 18 19 35 17 18 2 1 1 20 - 24 517 94 40 54 92 39 53 2 1 1 25 - 29 389 82 42 40 82 42 40 0 0 0 30 - 34 341 58 28 30 58 28 30 0 0 0 35 - 39 348 40 19 21 39 18 21 1 1 0 40 - 44 374 28 13 15 28 13 15 0 0 0 45 - 49 350 2 1 1 2 1 1 0 0 0

Chapter 7: Housing Characteristics
2011 Population and Housing Census Regional Profile, Omusati Region 81
Table 4.31 Deaths in the last 12 months Table 4.33 Deaths in the last 12 months by
by age group and sex, Omusati age group and sex, Rural Age group Total Female Male Age group Total Female Male
Total 2 794 1162 1632 Total 2 697 1 118 1 579 Under 1 259 128 131 Under 1 245 122 123 1 - 4 142 67 75 1 - 4 140 66 74 5 - 9 42 17 25 5 - 9 39 17 22 10 -14 35 15 20 10 -14 31 14 17 15 - 19 50 12 38 15 - 19 48 10 38 20 - 24 93 31 62 20 - 24 88 30 58 25 - 29 149 72 77 25 - 29 147 70 77 30 - 34 199 72 127 30 - 34 193 68 125 35 - 39 202 80 122 35 - 39 187 70 117 40 - 44 172 60 112 40 - 44 165 57 108 45 - 49 134 41 93 45 - 49 129 38 91 50 - 54 121 41 80 50 - 54 115 40 75 55 - 59 108 28 80 55 - 59 106 28 78 60 - 64 107 40 67 60 - 64 106 40 66 65 + 780 383 397 65 + 762 374 388 Don't know 201 75 126 Don't know 196 74 122
Table 4.32 Deaths in the last 12 months
by age group and sex, Urban
Age group Total Female Male
Total 97 44 53 Under 1 14 6 8 1 - 4 2 1 1 5 - 9 3 0 3 10 - 14 4 1 3 15 - 19 2 2 0 20 - 24 5 1 4 25 - 29 2 2 0 30 - 34 6 4 2 35 - 39 15 10 5 40 - 44 7 3 4 45 - 49 5 3 2 50 - 54 6 1 5 55 - 59 2 0 2 60 - 64 1 0 1 65 + 18 9 9 Don't know 5 1 4

Chapter 7: Housing Characteristics
2011 Population and Housing Census Regional Profile, Omusati Region 82
Table 5.1 Population aged 3 years and above who have access to ICT services by type and area
Area Population
Type of ICT
Radio TV Computer Cell
Phone Telephone
(Fixed)
Newspaper ( Daily& Weekly)
Internet ( Daily &
Weekly) Don't know
Omusati 222 661 153 084 21 071 4 751 98 683 2 838 29577 5682 1 589
Urban 12 326 9 182 6 732 1 818 8 573 863 5 864 1 793 88 Rural 210 335 143 902 14 339 2 933 90 110 1 975 23 713 3 889 1 501
Anamulenge 12 272 8 793 1 476 298 5 324 167 2 493 281 83 Elim 10 531 8 474 1 246 189 5 959 191 2 460 260 124 Etayi 32 112 23 612 2 593 348 13 131 197 3 316 503 154 Ogongo 18 012 13 284 1 247 361 8 453 133 1 723 404 41 Okahao 16 187 10 997 1 839 402 7 436 195 2 276 628 96 Okalongo 28 096 19 197 1 533 285 11 880 197 2 526 346 163 Onesi 12 027 7 194 773 105 4 522 100 857 173 82 Oshikuku 8 239 6 709 2 115 453 4 437 280 2 256 469 42 Outapi 33 569 21 678 4 371 1 355 15 225 720 6 308 1 549 293 Ruacana 13 458 7 619 1 634 378 5 856 261 1 374 253 125 Tsandi 25 745 17 100 1 807 454 10 756 291 3 294 580 182 Otamanzi 12 413 8 427 437 123 5 704 106 694 236 204
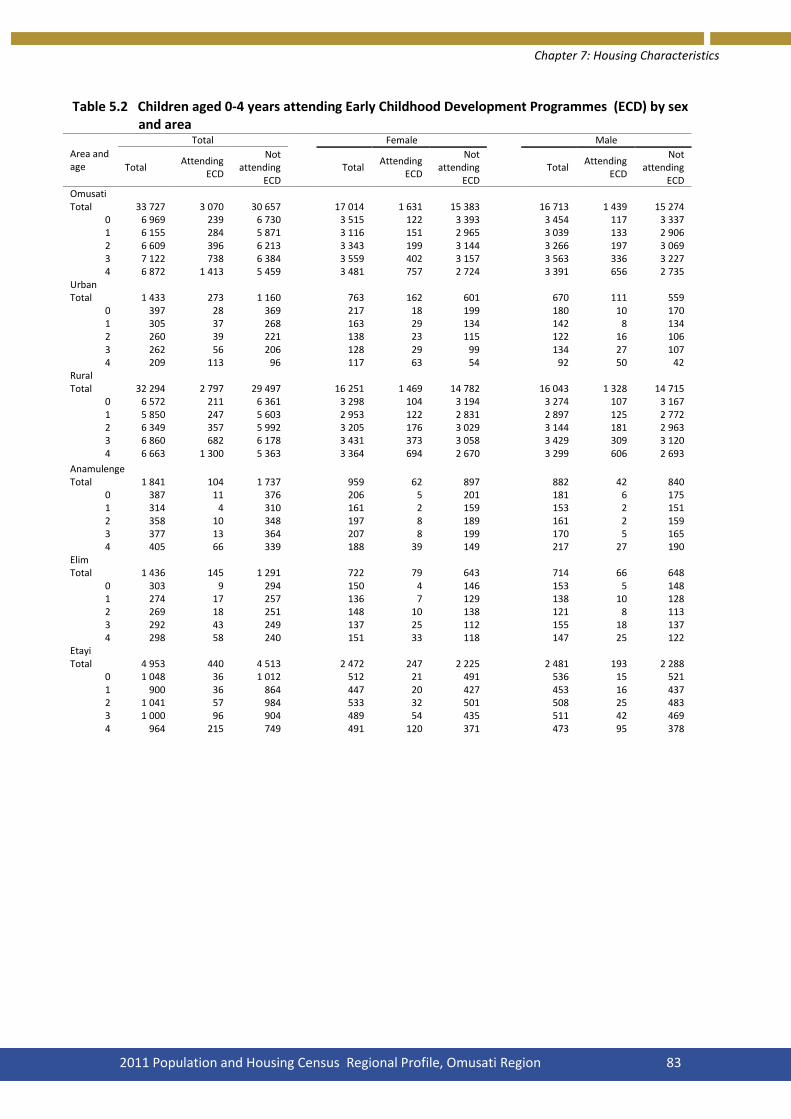
Chapter 7: Housing Characteristics
2011 Population and Housing Census Regional Profile, Omusati Region 83
Table 5.2 Children aged 0-4 years attending Early Childhood Development Programmes (ECD) by sex and area
Area and age
Total Female Male
Total Attending
ECD
Not attending
ECD Total
Attending ECD
Not attending
ECD Total
Attending ECD
Not attending
ECD Omusati
Total 33 727 3 070 30 657
17 014 1 631 15 383
16 713 1 439 15 274 0 6 969 239 6 730
3 515 122 3 393
3 454 117 3 337
1 6 155 284 5 871
3 116 151 2 965
3 039 133 2 906 2 6 609 396 6 213
3 343 199 3 144
3 266 197 3 069
3 7 122 738 6 384
3 559 402 3 157
3 563 336 3 227 4 6 872 1 413 5 459
3 481 757 2 724
3 391 656 2 735
Urban Total 1 433 273 1 160
763 162 601
670 111 559
0 397 28 369
217 18 199
180 10 170 1 305 37 268
163 29 134
142 8 134
2 260 39 221
138 23 115
122 16 106 3 262 56 206
128 29 99
134 27 107
4 209 113 96
117 63 54
92 50 42 Rural
Total 32 294 2 797 29 497
16 251 1 469 14 782
16 043 1 328 14 715 0 6 572 211 6 361
3 298 104 3 194
3 274 107 3 167
1 5 850 247 5 603
2 953 122 2 831
2 897 125 2 772 2 6 349 357 5 992
3 205 176 3 029
3 144 181 2 963
3 6 860 682 6 178
3 431 373 3 058
3 429 309 3 120 4 6 663 1 300 5 363
3 364 694 2 670
3 299 606 2 693
Anamulenge Total 1 841 104 1 737
959 62 897
882 42 840
0 387 11 376
206 5 201
181 6 175 1 314 4 310
161 2 159
153 2 151
2 358 10 348
197 8 189
161 2 159 3 377 13 364
207 8 199
170 5 165
4 405 66 339
188 39 149
217 27 190 Elim
Total 1 436 145 1 291
722 79 643
714 66 648 0 303 9 294
150 4 146
153 5 148
1 274 17 257
136 7 129
138 10 128 2 269 18 251
148 10 138
121 8 113
3 292 43 249
137 25 112
155 18 137 4 298 58 240
151 33 118
147 25 122
Etayi Total 4 953 440 4 513
2 472 247 2 225
2 481 193 2 288
0 1 048 36 1 012
512 21 491
536 15 521 1 900 36 864
447 20 427
453 16 437
2 1 041 57 984
533 32 501
508 25 483 3 1 000 96 904
489 54 435
511 42 469
4 964 215 749
491 120 371
473 95 378

Chapter 7: Housing Characteristics
2011 Population and Housing Census Regional Profile, Omusati Region 84
Table 5.2 Children aged 0-4 years attending Early Childhood Development Programmes (ECD) by sex and area Cont….
Area and age
Total Female Male
Total Attending
ECD
Not attending
ECD Total
Attending ECD
Not attending
ECD Total
Attending ECD
Not attending
ECD Ogongo
Total 2 648 202 2 446
1 312 101 1 211
1 336 101 1 235 0 474 9 465
229 6 223
245 3 242
1 558 6 552
295 3 292
263 3 260 2 502 28 474
246 12 234
256 16 240
3 588 62 526
298 34 264
290 28 262 4 526 97 429
244 46 198
282 51 231
Okahao Total 2 220 180 2 040
1 064 95 969
1 156 85 1 071
0 493 22 471
247 12 235
246 10 236 1 425 11 414
213 7 206
212 4 208
2 380 20 360
184 9 175
196 11 185 3 427 43 384
188 22 166
239 21 218
4 495 84 411
232 45 187
263 39 224 Okalongo
Total 4 331 327 4 004
2 112 153 1 959
2 219 174 2 045 0 895 23 872
445 8 437
450 15 435
1 754 34 720
351 14 337
403 20 383 2 852 47 805
402 15 387
450 32 418
3 961 93 868
465 45 420
496 48 448 4 869 130 739
449 71 378
420 59 361
Onesi
0 Total 1 888 110 1 778
990 58 932
898 52 846
0 417 9 408
204 5 199
213 4 209 1 305 13 292
169 8 161
136 5 131
2 391 10 381
198 4 194
193 6 187 3 397 30 367
203 11 192
194 19 175
4 378 48 330
216 30 186
162 18 144 Oshikuku
Total 1 115 162 953
585 94 491
530 68 462 0 223 10 213
123 7 116
100 3 97
1 213 18 195
107 9 98
106 9 97 2 212 16 196
111 8 103
101 8 93
3 242 31 211
123 21 102
119 10 109 4 225 87 138
121 49 72
104 38 66
Outapi
0
0
0 Total 5 282 520 4 762
2 707 287 2 420
2 575 233 2 342
0 1 095 47 1 048
565 22 543
530 25 505 1 987 56 931
517 39 478
470 17 453
2 1 023 80 943
513 43 470
510 37 473 3 1 102 106 996
558 63 495
544 43 501
4 1 075 231 844
554 120 434
521 111 410

Chapter 7: Housing Characteristics
2011 Population and Housing Census Regional Profile, Omusati Region 85
Table 5.2 Children aged 0-4 years attending Early Childhood Development Programmes (ECD) by sex and area Cont….
Area and age
Total Female Male
Total Attending
ECD
Not attending
ECD Total
Attending ECD
Not attending
ECD Total
Attending ECD
Not attending
ECD
Ruacana Total 2 286 193 2 093
1 156 108 1 048
1 130 85 1 045
0 494 14 480
248 10 238
246 4 242 1 412 23 389
217 11 206
195 12 183
2 444 20 424
211 10 201
233 10 223 3 501 48 453
253 25 228
248 23 225
4 435 88 347
227 52 175
208 36 172 Tsandi
Total 3 824 477 3 347
1 965 246 1 719
1 859 231 1 628 0 802 34 768
418 16 402
384 18 366
1 654 41 613
322 17 305
332 24 308 2 752 73 679
404 37 367
348 36 312
3 835 126 709
435 71 364
400 55 345 4 781 203 578
386 105 281
395 98 297
Otamanzi Total 1 903 210 1 693
970 101 869
933 109 824
0 338 15 323
168 6 162
170 9 161 1 359 25 334
181 14 167
178 11 167
2 385 17 368
196 11 185
189 6 183 3 400 47 353
203 23 180
197 24 173
4 421 106 315 222 47 175 199 59 140
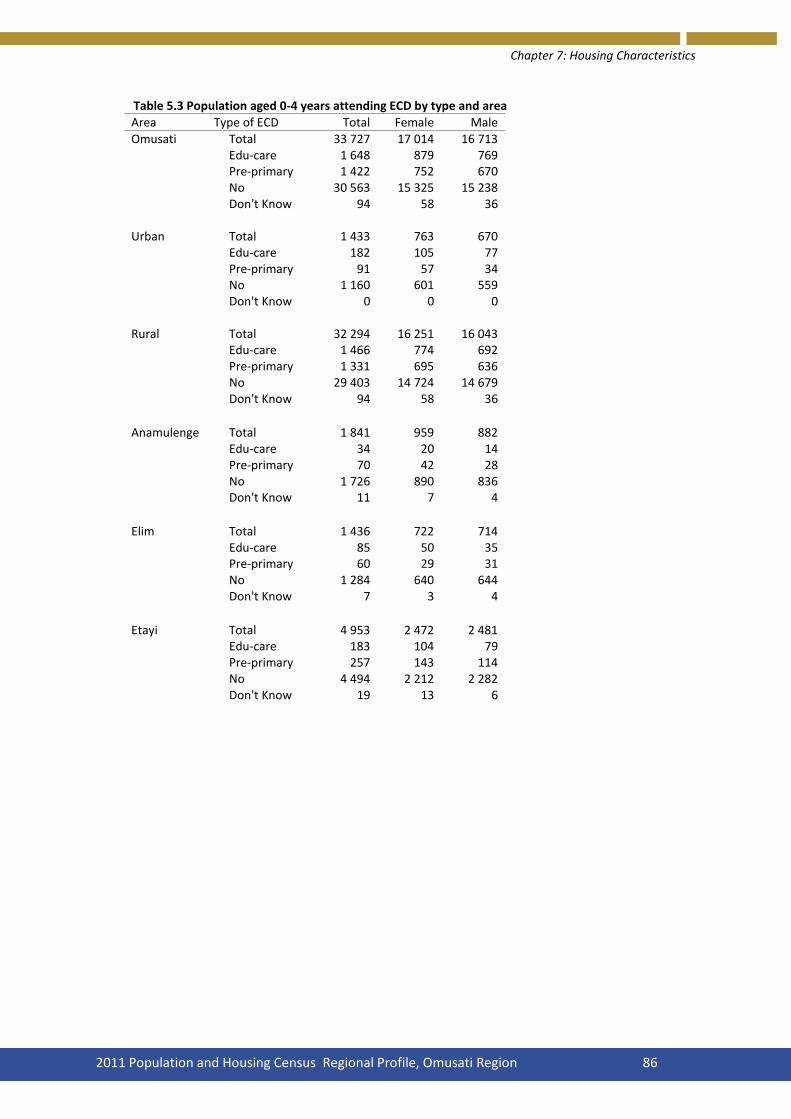
Chapter 7: Housing Characteristics
2011 Population and Housing Census Regional Profile, Omusati Region 86
Table 5.3 Population aged 0-4 years attending ECD by type and area
Area Type of ECD Total Female Male
Omusati Total 33 727 17 014 16 713 Edu-care 1 648 879 769 Pre-primary 1 422 752 670 No 30 563 15 325 15 238
Don't Know 94 58 36
Urban Total 1 433 763 670
Edu-care 182 105 77 Pre-primary 91 57 34 No 1 160 601 559 Don't Know 0 0 0
Rural Total 32 294 16 251 16 043
Edu-care 1 466 774 692
Pre-primary 1 331 695 636
No 29 403 14 724 14 679
Don't Know 94 58 36
Anamulenge
Total 1 841 959 882
Edu-care 34 20 14 Pre-primary 70 42 28
No 1 726 890 836
Don't Know 11 7 4
Elim
Total 1 436 722 714
Edu-care 85 50 35 Pre-primary 60 29 31
No 1 284 640 644
Don't Know 7 3 4
Etayi
Total 4 953 2 472 2 481
Edu-care 183 104 79 Pre-primary 257 143 114
No 4 494 2 212 2 282
Don't Know 19 13 6
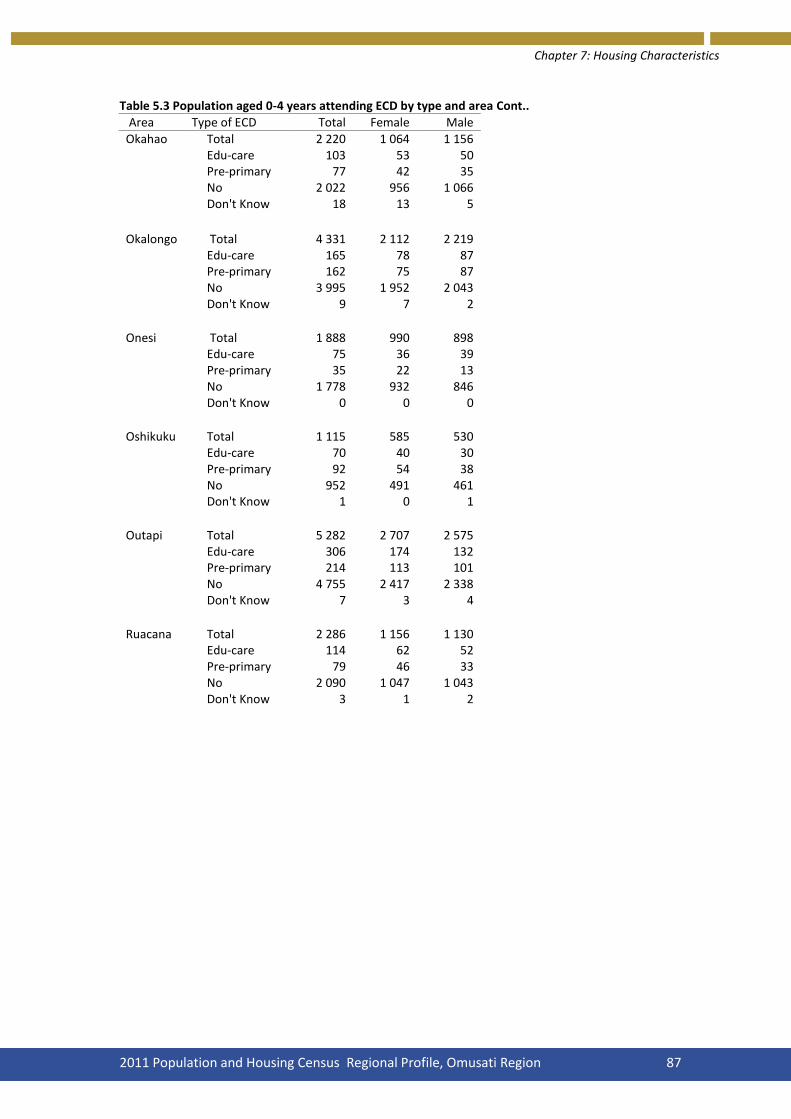
Chapter 7: Housing Characteristics
2011 Population and Housing Census Regional Profile, Omusati Region 87
Table 5.3 Population aged 0-4 years attending ECD by type and area Cont..
Area Type of ECD Total Female Male
Okahao Total 2 220 1 064 1 156 Edu-care 103 53 50 Pre-primary 77 42 35
No 2 022 956 1 066
Don't Know 18 13 5
Okalongo
Total 4 331 2 112 2 219
Edu-care 165 78 87 Pre-primary 162 75 87
No 3 995 1 952 2 043
Don't Know 9 7 2
Onesi
Total 1 888 990 898
Edu-care 75 36 39 Pre-primary 35 22 13
No 1 778 932 846
Don't Know 0 0 0
Oshikuku
Total 1 115 585 530
Edu-care 70 40 30 Pre-primary 92 54 38
No 952 491 461
Don't Know 1 0 1
Outapi
Total 5 282 2 707 2 575
Edu-care 306 174 132 Pre-primary 214 113 101
No 4 755 2 417 2 338
Don't Know 7 3 4
Ruacana
Total 2 286 1 156 1 130
Edu-care 114 62 52 Pre-primary 79 46 33
No 2 090 1 047 1 043
Don't Know 3 1 2
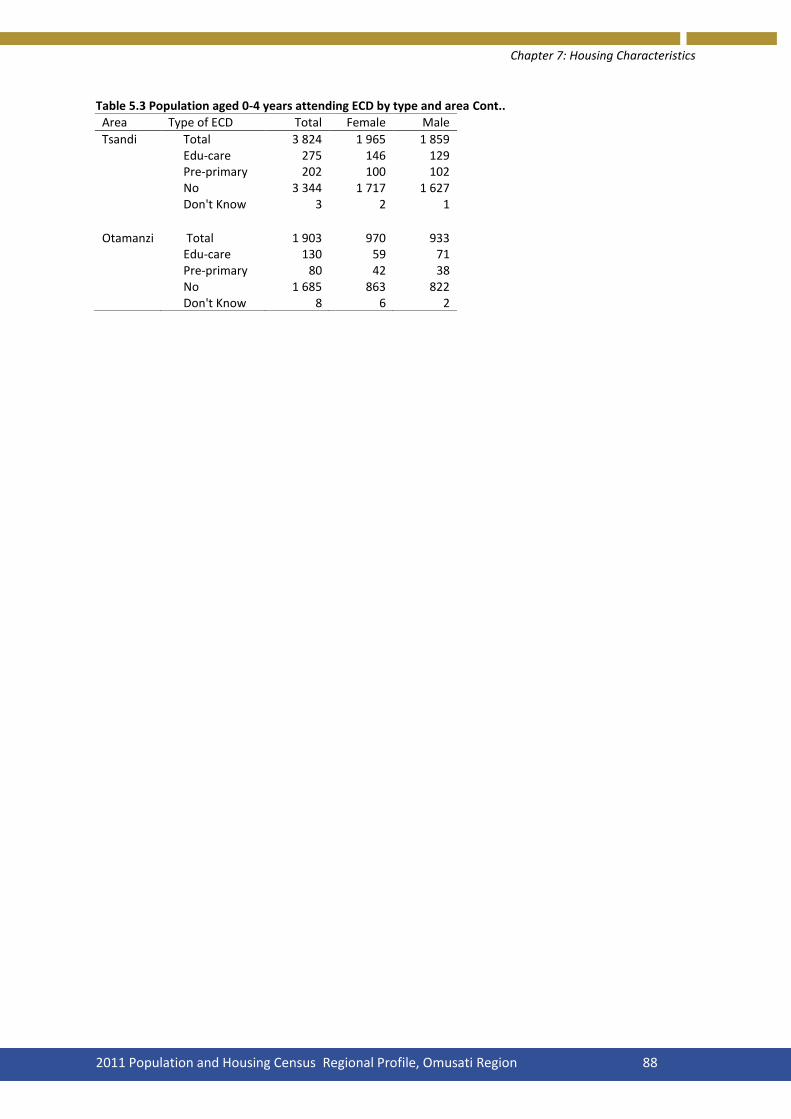
Chapter 7: Housing Characteristics
2011 Population and Housing Census Regional Profile, Omusati Region 88
Table 5.3 Population aged 0-4 years attending ECD by type and area Cont..
Area Type of ECD Total Female Male
Tsandi Total 3 824 1 965 1 859 Edu-care 275 146 129 Pre-primary 202 100 102
No 3 344 1 717 1 627
Don't Know 3 2 1
Otamanzi
Total 1 903 970 933
Edu-care 130 59 71
Pre-primary 80 42 38
No 1 685 863 822
Don't Know 8 6 2

Chapter 7: Housing Characteristics
2011 Population and Housing Census Regional Profile, Omusati Region 89
Table 5.4 Literacy status for population aged 5 years and above by sex and area
Area Population
Literacy status
Illeterate Literate Literacy rate
Total Female Male Total Female Male Total Female Male
Omusati 208 667 116 289 92 378 30 905 17 564 13 341 177 762 98 725 79 037 85.2 84.9 85.6 Urban 11 855 6 829 5 026 719 387 332 11 136 6 442 4 694 93.9 94.3 93.4 Rural 196 812 109 460 87 352 30 186 17 177 13 009 166 626 92 283 74 343 84.7 84.3 85.1 Anamulenge 11 490 6 522 4 968 1 417 872 545 10 073 5 650 4 423 87.7 86.6 89.0 Elim 9 941 5 577 4 364 937 529 408 9 004 5 048 3 956 90.6 90.5 90.7 Etayi 30 148 17 138 13 010 4 116 2 440 1 676 26 032 14 698 11 334 86.3 85.8 87.1 Ogongo 16 898 9 490 7 408 2 042 1 209 833 14 856 8 281 6 575 87.9 87.3 88.8 Okahao 15 265 8 433 6 832 2 571 1 420 1 151 12 694 7 013 5 681 83.2 83.2 83.2 Okalongo 26 266 14 905 11 361 4 213 2 556 1 657 22 053 12 349 9 704 84.0 82.9 85.4 Onesi 11 252 6 172 5 080 2 176 1 263 913 9 076 4 909 4 167 80.7 79.5 82.0 Oshikuku 7 772 4 519 3 253 736 413 323 7 036 4 106 2 930 90.5 90.9 90.1 Outapi 31 392 17 491 13 901 4 278 2 431 1 847 27 114 15 060 12 054 86.4 86.1 86.7 Ruacana 12 522 6 169 6 353 3 327 1 621 1 706 9 195 4 548 4 647 73.4 73.7 73.1 Tsandi 24 129 13 381 10 748 3 334 1 888 1 446 20 795 11 493 9 302 86.2 85.9 86.5 Otamanzi 11 592 6 492 5 100 1 758 922 836 9 834 5 570 4 264 84.8 85.8 83.6

Chapter 7: Housing Characteristics
2011 Population and Housing Census Regional Profile, Omusati Region 90
Table 5.5 Literacy rate for population 15 years and above by age group and sex, Omusati
Age Group
Total Female Male
Total Literate Literacy
rate Total Literate Literacy
rate Total Literate Literacy
rate
Total 144 640 126 657 88
84 088 72 760 87
60 552 53 897 89 15 - 19 33 517 32 387 97
16 769 16 348 97
16 748 16 039 96
20 - 24 20 003 18 950 95
10 577 10 133 96
9 426 8 817 94 25 - 29 13 920 12 990 93
7 897 7 518 95
6 023 5 472 91
30 - 34 11 871 11 045 93
6 983 6 584 94
4 888 4 461 91 35 - 39 10 807 10 061 93
6 536 6 146 94
4 271 3 915 92
40 - 44 8 674 8 018 92
5 449 5 082 93
3 225 2 936 91 45 - 49 7 751 6 994 90
5 138 4 649 90
2 613 2 345 90
50 - 54 6 262 5 365 86
4 291 3 694 86
1 971 1 671 85 55 - 59 5 852 4 868 83
4 002 3 338 83
1 850 1 530 83
60 - 64 5 817 4 398 76
3 541 2 570 73
2 276 1 828 80 65 - 69 5 130 3 659 71
3 198 2 192 69
1 932 1 467 76
70 - 74 4 053 2 599 64
2 486 1 476 59
1 567 1 123 72 75 - 79 2 982 1 838 62
1 857 1 045 56
1 125 793 70
80 - 84 2 985 1 480 50
1 918 791 41
1 067 689 65 85 - 89 2 135 948 44
1 481 576 39
654 372 57
90 - 94 1 504 598 40
991 333 34
513 265 52 95+ 1 377 459 33 974 285 29 403 174 43
Table 5.6 Literacy rate for population 15 years and above by age group and sex, Urban
Age Group
Total Female Male
Total Literate Literacy
rate Total Literate Literacy
rate Total Literate Literacy
rate
Total 9 516 9 154 96 5 534 5 328 96 3 982 3 826 96 15 - 19 1 641 1 607 98
923 907 98
718 700 97
20 - 24 1 679 1 644 98
1 012 993 98
667 651 98 25 - 29 1 573 1 544 98
919 905 98
654 639 98
30 - 34 1 190 1 155 97
715 698 98
475 457 96 35 - 39 1 020 991 97
574 558 97
446 433 97
40 - 44 733 714 97
418 408 98
315 306 97 45 - 49 616 588 95
352 337 96
264 251 95
50 - 54 352 332 94
213 201 94
139 131 94 55 - 59 241 216 90
130 117 90
111 99 89
60 - 64 162 136 84
90 72 80
72 64 89 65 - 69 97 79 81
47 37 79
50 42 84
70 - 74 56 46 82
36 29 81
20 17 85 75 - 79 54 41 76
34 25 74
20 16 80
80 - 84 40 26 65
26 16 62
14 10 71 85 - 89 27 17 63
21 13 62
6 4 67
90 - 94 19 11 58
12 6 50
7 5 71 95+ 16 7 44 12 6 50 4 1 25

Chapter 7: Housing Characteristics
2011 Population and Housing Census Regional Profile, Omusati Region 91
Table 5.7 Literacy rate for population aged 15 years and above by age group and sex, Rural
Age Group
Total Female Male
Total Literate Literacy
rate Total Literate Literacy
rate Total Literate Literacy
rate
Total 135 124 117 503 87 78 554 67 432 86 56 570 50 071 89 15 - 19 31 876 30 780 97 15 846 15 441 97 16 030 15 339 96 20 - 24 18 324 17 306 94 9 565 9 140 96 8 759 8 166 93 25 - 29 12 347 11 446 93 6 978 6 613 95 5 369 4 833 90 30 - 34 10 681 9 890 93 6 268 5 886 94 4 413 4 004 91 35 - 39 9 787 9 070 93 5 962 5 588 94 3 825 3 482 91 40 - 44 7 941 7 304 92 5 031 4 674 93 2 910 2 630 90 45 - 49 7 135 6 406 90 4 786 4 312 90 2 349 2 094 89 50 - 54 5 910 5 033 85 4 078 3 493 86 1 832 1 540 84 55 - 59 5 611 4 652 83 3 872 3 221 83 1 739 1 431 82 60 - 64 5 655 4 262 75 3 451 2 498 72 2 204 1 764 80 65 - 69 5 033 3 580 71 3 151 2 155 68 1 882 1 425 76 70 - 74 3 997 2 553 64 2 450 1 447 59 1 547 1 106 71 75 - 79 2 928 1 797 61 1 823 1 020 56 1 105 777 70 80 - 84 2 945 1 454 49 1 892 775 41 1 053 679 64 85 - 89 2 108 931 44 1 460 563 39 648 368 57 90 - 94 1 485 587 40 979 327 33 506 260 51 95+ 1 361 452 33 962 279 29 399 173 43
Table 5.8 Literacy rate for population aged 15 years and above by age group and sex, Anamulenge
Age Group
Total Female Male
Total Literate Literacy
rate Total Literate Literacy
rate Total Literate Literacy
rate
Total 7 888 7 132 90 4 665 4 134 89 3 223 2 998 93 15 - 19 1 867 1 827 98 962 946 98 905 881 97 20 - 24 1 084 1 055 97 622 605 97 462 450 97 25 - 29 776 742 96 469 453 97 307 289 94 30 - 34 660 633 96 364 353 97 296 280 95 35 - 39 625 597 96 395 379 96 230 218 95 40 - 44 449 436 97 274 267 97 175 169 97 45 - 49 430 405 94 286 267 93 144 138 96 50 - 54 342 304 89 226 197 87 116 107 92 55 - 59 303 256 84 211 178 84 92 78 85 60 - 64 301 253 84 185 149 81 116 104 90 65 - 69 240 175 73 144 97 67 96 78 81 70 - 74 213 139 65 128 77 60 85 62 73 75 - 79 186 120 65 128 76 59 58 44 76 80 - 84 169 89 53 104 39 38 65 50 77 85 - 89 126 52 41 87 26 30 39 26 67 90 - 94 71 31 44 47 14 30 24 17 71 95+ 46 18 39 33 11 33 13 7 54
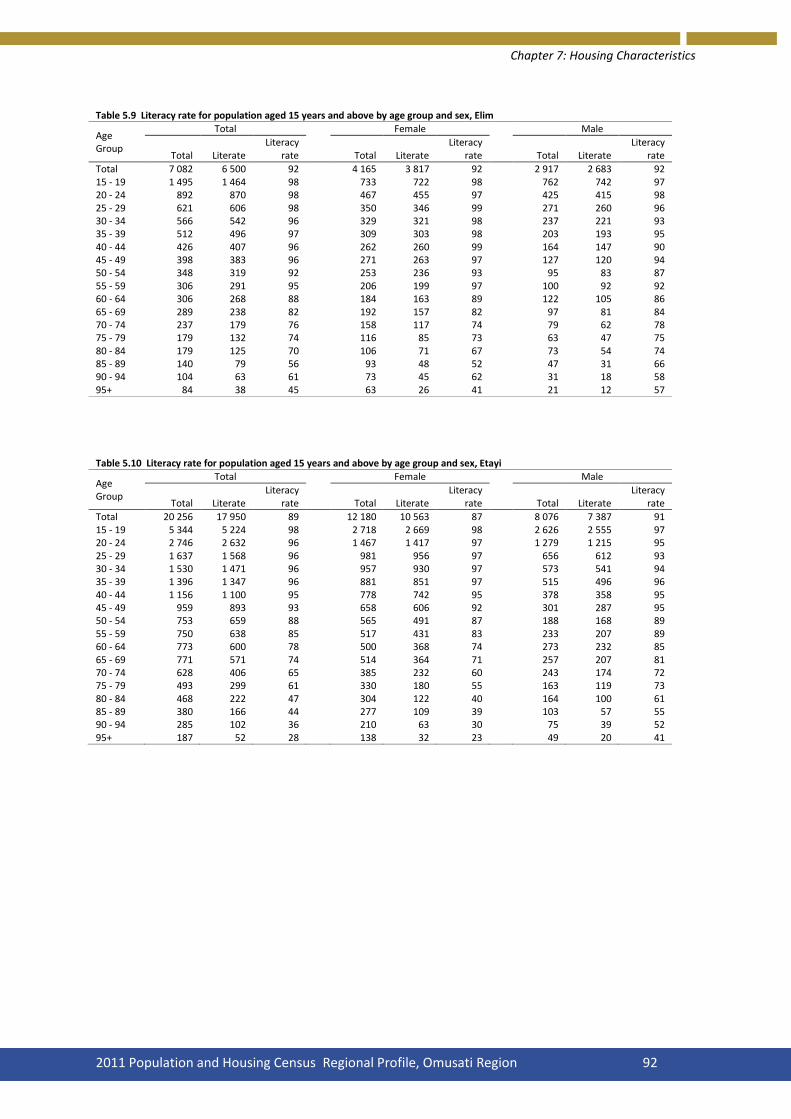
Chapter 7: Housing Characteristics
2011 Population and Housing Census Regional Profile, Omusati Region 92
Table 5.9 Literacy rate for population aged 15 years and above by age group and sex, Elim
Age Group
Total Female Male
Total Literate Literacy
rate Total Literate Literacy
rate Total Literate Literacy
rate
Total 7 082 6 500 92 4 165 3 817 92 2 917 2 683 92 15 - 19 1 495 1 464 98 733 722 98 762 742 97 20 - 24 892 870 98 467 455 97 425 415 98 25 - 29 621 606 98 350 346 99 271 260 96 30 - 34 566 542 96 329 321 98 237 221 93 35 - 39 512 496 97 309 303 98 203 193 95 40 - 44 426 407 96 262 260 99 164 147 90 45 - 49 398 383 96 271 263 97 127 120 94 50 - 54 348 319 92 253 236 93 95 83 87 55 - 59 306 291 95 206 199 97 100 92 92 60 - 64 306 268 88 184 163 89 122 105 86 65 - 69 289 238 82 192 157 82 97 81 84 70 - 74 237 179 76 158 117 74 79 62 78 75 - 79 179 132 74 116 85 73 63 47 75 80 - 84 179 125 70 106 71 67 73 54 74 85 - 89 140 79 56 93 48 52 47 31 66 90 - 94 104 63 61 73 45 62 31 18 58 95+ 84 38 45 63 26 41 21 12 57
Table 5.10 Literacy rate for population aged 15 years and above by age group and sex, Etayi
Age Group
Total Female Male
Total Literate Literacy
rate Total Literate Literacy
rate Total Literate Literacy
rate
Total 20 256 17 950 89 12 180 10 563 87 8 076 7 387 91 15 - 19 5 344 5 224 98 2 718 2 669 98 2 626 2 555 97 20 - 24 2 746 2 632 96 1 467 1 417 97 1 279 1 215 95 25 - 29 1 637 1 568 96 981 956 97 656 612 93 30 - 34 1 530 1 471 96 957 930 97 573 541 94 35 - 39 1 396 1 347 96 881 851 97 515 496 96 40 - 44 1 156 1 100 95 778 742 95 378 358 95 45 - 49 959 893 93 658 606 92 301 287 95 50 - 54 753 659 88 565 491 87 188 168 89 55 - 59 750 638 85 517 431 83 233 207 89 60 - 64 773 600 78 500 368 74 273 232 85 65 - 69 771 571 74 514 364 71 257 207 81 70 - 74 628 406 65 385 232 60 243 174 72 75 - 79 493 299 61 330 180 55 163 119 73 80 - 84 468 222 47 304 122 40 164 100 61 85 - 89 380 166 44 277 109 39 103 57 55 90 - 94 285 102 36 210 63 30 75 39 52 95+ 187 52 28 138 32 23 49 20 41

Chapter 7: Housing Characteristics
2011 Population and Housing Census Regional Profile, Omusati Region 93
Table 5.11 Literacy rate for population aged 15 years and above by age group and sex, Ogongo
Age Group
Total Female Male
Total Literate Literacy
rate Total Literate Literacy
rate Total Literate Literacy
rate Total 11 806 10 596 90 6 973 6 172 89 4 833 4 424 92 15 - 19 2 680 2 626 98 1 317 1 299 99 1 363 1 327 97 20 - 24 1 528 1 484 97 802 785 98 726 699 96 25 - 29 1 042 1 008 97 602 587 98 440 421 96 30 - 34 886 858 97 536 519 97 350 339 97 35 - 39 864 830 96 533 516 97 331 314 95 40 - 44 689 670 97 439 427 97 250 243 97 45 - 49 609 571 94 430 404 94 179 167 93 50 - 54 553 490 89 386 347 90 167 143 86 55 - 59 556 494 89 390 350 90 166 144 87 60 - 64 509 399 78 299 224 75 210 175 83 65 - 69 496 368 74 334 245 73 162 123 76 70 - 74 355 255 72 229 156 68 126 99 79 75 - 79 288 189 66 170 104 61 118 85 72 80 - 84 308 169 55 207 101 49 101 68 67 85 - 89 202 93 46 133 55 41 69 38 55 90 - 94 122 44 36 85 22 26 37 22 59 95+ 119 48 40 81 31 38 38 17 45
Table 5.12 Literacy rate for population aged 15 years and above by age group and sex, Okahao
Age Group
Total Female Male
Total Literate Literacy
rate Total Literate Literacy
rate Total Literate Literacy
rate
Total 11 074 9 347 84 6 383 5 379 84 4 691 3 968 85
15 - 19 2 273 2 147 94 1 131 1 094 97 1 142 1 053 92
20 - 24 1 510 1 405 93 795 756 95 715 649 91
25 - 29 1 099 1 020 93 574 548 95 525 472 90
30 - 34 930 847 91 504 478 95 426 369 87
35 - 39 857 774 90 508 477 94 349 297 85
40 - 44 646 569 88 435 397 91 211 172 82
45 - 49 619 549 89 408 368 90 211 181 86
50 - 54 513 415 81 329 267 81 184 148 80
55 - 59 481 390 81 323 263 81 158 127 80
60 - 64 494 337 68 311 199 64 183 138 75
65 - 69 456 324 71 283 195 69 173 129 75
70 - 74 292 185 63 170 99 58 122 86 70
75 - 79 218 130 60 145 84 58 73 46 63
80 - 84 255 108 42 180 64 36 75 44 59
85 - 89 177 68 38 120 41 34 57 27 47
90 - 94 121 43 36 74 26 35 47 17 36
95+ 133 36 27 93 23 25 40 13 33

Chapter 7: Housing Characteristics
2011 Population and Housing Census Regional Profile, Omusati Region 94
Table 5.13 Literacy rate for population aged 15 years and above by age group and sex, Okalongo
Age Group
Total Female Male
Total Literate Literacy
rate Total Literate Literacy
rate Total Literate Literacy
rate
Total 17 335 15 057 87 10 382 8 803 85 6 953 6 254 90
15 - 19 4 785 4 622 97
2 351 2 284 97
2 434 2 338 96
20 - 24 2 461 2 339 95
1 355 1 294 95
1 106 1 045 94
25 - 29 1 518 1 428 94
945 901 95
573 527 92
30 - 34 1 213 1 130 93
773 726 94
440 404 92
35 - 39 1 119 1 042 93
715 659 92
404 383 95
40 - 44 937 854 91
636 578 91
301 276 92
45 - 49 827 740 89
581 519 89
246 221 90
50 - 54 745 620 83
548 455 83
197 165 84
55 - 59 671 523 78
472 358 76
199 165 83
60 - 64 654 473 72
412 280 68
242 193 80
65 - 69 536 356 66
337 206 61
199 150 75
70 - 74 503 289 57
324 161 50
179 128 72
75 - 79 334 198 59
222 124 56
112 74 66
80 - 84 375 178 47
258 100 39
117 78 67
85 - 89 277 117 42
193 68 35
84 49 58
90 - 94 217 88 41
132 47 36
85 41 48
95+ 163 60 37 128 43 34 35 17 49
Table 5.14 Literacy rate for population aged 15 years and above by age group and sex, Onesi
Age Group
Total Female Male
Total Literate Literacy
rate Total Literate Literacy
rate Total Literate Literacy
rate
Total 7 566 6 306 83 4 361 3 544 81 3 205 2 762 86
15 - 19 1 731 1 649 95
868 832 96
863 817 95
20 - 24 1 089 1 004 92
609 566 93
480 438 91
25 - 29 774 699 90
421 381 90
353 318 90
30 - 34 647 578 89
372 329 88
275 249 91
35 - 39 549 486 89
333 297 89
216 189 88
40 - 44 464 396 85
276 245 89
188 151 80
45 - 49 441 356 81
292 233 80
149 123 83
50 - 54 318 259 81
213 171 80
105 88 84
55 - 59 296 222 75
198 148 75
98 74 76
60 - 64 313 207 66
196 117 60
117 90 77
65 - 69 267 167 63
158 87 55
109 80 73
70 - 74 185 75 41
119 36 30
66 39 59
75 - 79 129 74 57
78 35 45
51 39 76
80 - 84 128 56 44
78 25 32
50 31 62
85 - 89 81 32 40
59 19 32
22 13 59
90 - 94 58 14 24
35 7 20
23 7 30
95+ 96 32 33 56 16 29 40 16 40

Chapter 7: Housing Characteristics
2011 Population and Housing Census Regional Profile, Omusati Region 95
Table 5.15 Literacy rate for population 15 years and above by age group and sex, Oshikuku
Age Group
Total Female Male
Total Literate Literacy
rate Total Literate Literacy
rate Total Literate Literacy
rate
Total 5 709 5 327 93 3 439 3 187 93 2 270 2 140 94 15 - 19 1 260 1 244 99
632 623 99
628 621 99
20 - 24 807 792 98
453 447 99
354 345 97 25 - 29 614 594 97
390 379 97
224 215 96
30 - 34 500 482 96
313 305 97
187 177 95 35 - 39 480 467 97
282 275 98
198 192 97
40 - 44 358 350 98
222 216 97
136 134 99 45 - 49 342 322 94
234 222 95
108 100 93
50 - 54 252 236 94
181 174 96
71 62 87 55 - 59 210 185 88
154 141 92
56 44 79
60 - 64 205 180 88
132 115 87
73 65 89 65 - 69 176 154 88
107 91 85
69 63 91
70 - 74 144 115 80
97 77 79
47 38 81 75 - 79 88 61 69
61 38 62
27 23 85
80 - 84 98 60 61
60 31 52
38 29 76 85 - 89 78 45 58
61 34 56
17 11 65
90 - 94 49 27 55
28 13 46
21 14 67 95+ 48 13 27 32 6 19 16 7 44
Table 5.16 Literacy rate for population aged 15 years and above by age group and sex, Outapi
Age Group
Total Female Male
Total Literate Literacy
rate Total Literate Literacy
rate Total Literate Literacy
rate
Total 21 775 19 434 89 12 610 11 120 88 9 165 8 314 91 15 - 19 5 067 4 933 97
2 638 2 581 98
2 429 2 352 97
20 - 24 3 261 3 133 96
1 717 1 666 97
1 544 1 467 95 25 - 29 2 392 2 253 94
1 405 1 338 95
987 915 93
30 - 34 1 990 1 862 94
1 192 1 120 94
798 742 93 35 - 39 1 791 1 670 93
1 070 1 003 94
721 667 93
40 - 44 1 307 1 217 93
785 729 93
522 488 93 45 - 49 1 155 1 064 92
732 678 93
423 386 91
50 - 54 887 750 85
584 490 84
303 260 86 55 - 59 757 640 85
515 443 86
242 197 81
60 - 64 774 577 75
445 330 74
329 247 75 65 - 69 624 448 72
391 266 68
233 182 78
70 - 74 502 305 61
305 163 53
197 142 72 75 - 79 339 196 58
206 107 52
133 89 67
80 - 84 369 173 47
237 88 37
132 85 64 85 - 89 229 93 41
160 55 34
69 38 55
90 - 94 160 60 38
103 30 29
57 30 53 95+ 171 60 35 125 33 26 46 27 59
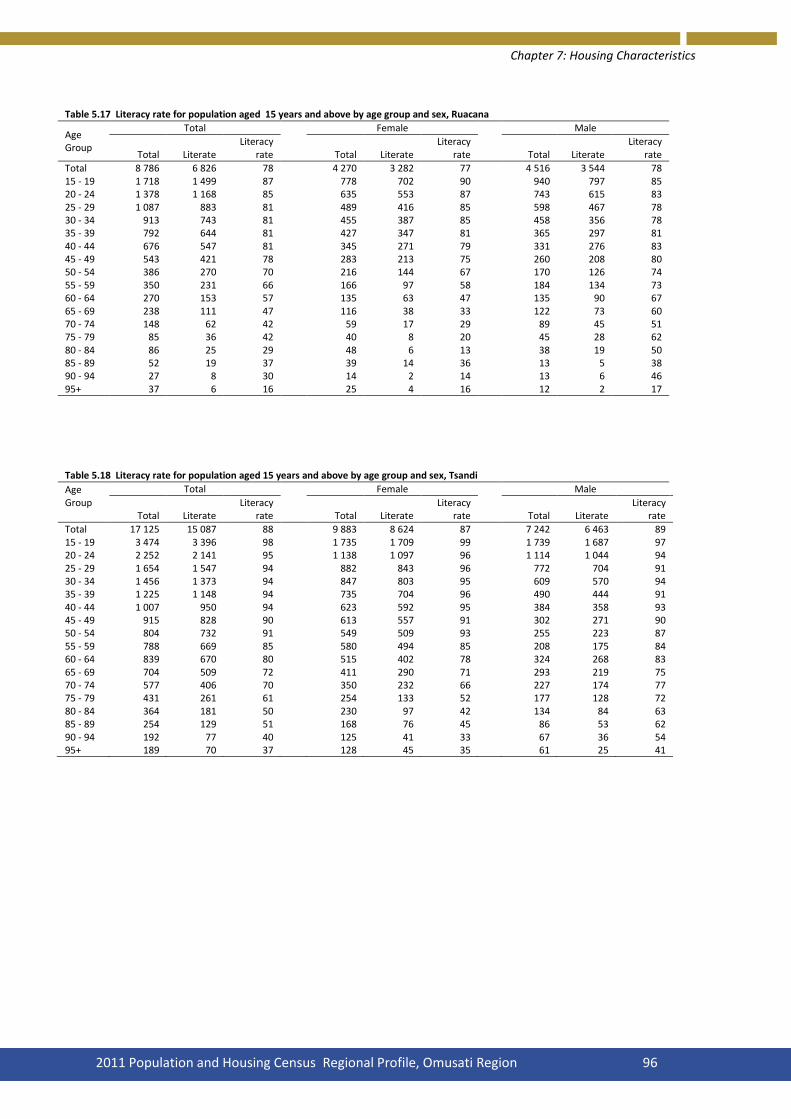
Chapter 7: Housing Characteristics
2011 Population and Housing Census Regional Profile, Omusati Region 96
Table 5.17 Literacy rate for population aged 15 years and above by age group and sex, Ruacana
Age Group
Total Female Male
Total Literate Literacy
rate Total Literate Literacy
rate Total Literate Literacy
rate
Total 8 786 6 826 78 4 270 3 282 77 4 516 3 544 78 15 - 19 1 718 1 499 87
778 702 90
940 797 85
20 - 24 1 378 1 168 85
635 553 87
743 615 83 25 - 29 1 087 883 81
489 416 85
598 467 78
30 - 34 913 743 81
455 387 85
458 356 78 35 - 39 792 644 81
427 347 81
365 297 81
40 - 44 676 547 81
345 271 79
331 276 83 45 - 49 543 421 78
283 213 75
260 208 80
50 - 54 386 270 70
216 144 67
170 126 74 55 - 59 350 231 66
166 97 58
184 134 73
60 - 64 270 153 57
135 63 47
135 90 67 65 - 69 238 111 47
116 38 33
122 73 60
70 - 74 148 62 42
59 17 29
89 45 51 75 - 79 85 36 42
40 8 20
45 28 62
80 - 84 86 25 29
48 6 13
38 19 50 85 - 89 52 19 37
39 14 36
13 5 38
90 - 94 27 8 30
14 2 14
13 6 46 95+ 37 6 16 25 4 16 12 2 17
Table 5.18 Literacy rate for population aged 15 years and above by age group and sex, Tsandi
Age Group
Total Female Male
Total Literate Literacy
rate Total Literate Literacy
rate Total Literate Literacy
rate
Total 17 125 15 087 88 9 883 8 624 87 7 242 6 463 89 15 - 19 3 474 3 396 98
1 735 1 709 99
1 739 1 687 97
20 - 24 2 252 2 141 95
1 138 1 097 96
1 114 1 044 94 25 - 29 1 654 1 547 94
882 843 96
772 704 91
30 - 34 1 456 1 373 94
847 803 95
609 570 94 35 - 39 1 225 1 148 94
735 704 96
490 444 91
40 - 44 1 007 950 94
623 592 95
384 358 93 45 - 49 915 828 90
613 557 91
302 271 90
50 - 54 804 732 91
549 509 93
255 223 87 55 - 59 788 669 85
580 494 85
208 175 84
60 - 64 839 670 80
515 402 78
324 268 83 65 - 69 704 509 72
411 290 71
293 219 75
70 - 74 577 406 70
350 232 66
227 174 77 75 - 79 431 261 61
254 133 52
177 128 72
80 - 84 364 181 50
230 97 42
134 84 63 85 - 89 254 129 51
168 76 45
86 53 62
90 - 94 192 77 40
125 41 33
67 36 54 95+ 189 70 37 128 45 35 61 25 41
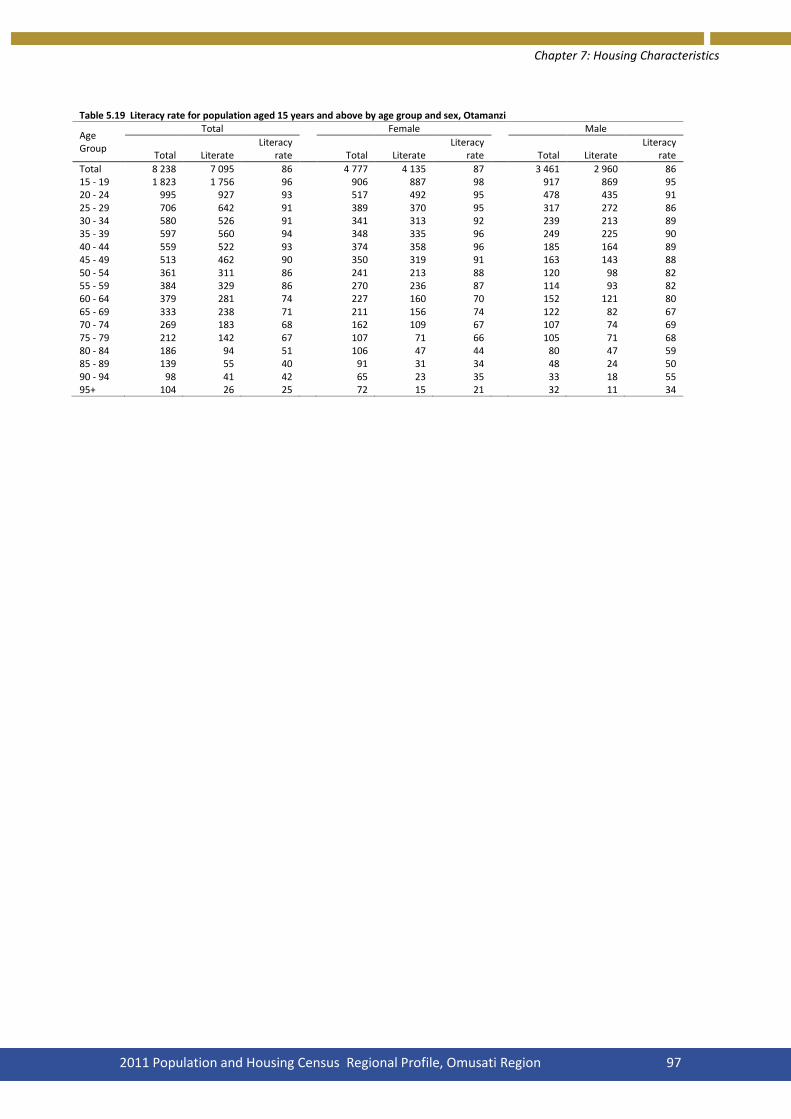
Chapter 7: Housing Characteristics
2011 Population and Housing Census Regional Profile, Omusati Region 97
Table 5.19 Literacy rate for population aged 15 years and above by age group and sex, Otamanzi
Age Group
Total Female Male
Total Literate Literacy
rate Total Literate Literacy
rate Total Literate Literacy
rate
Total 8 238 7 095 86 4 777 4 135 87 3 461 2 960 86 15 - 19 1 823 1 756 96
906 887 98
917 869 95
20 - 24 995 927 93
517 492 95
478 435 91 25 - 29 706 642 91
389 370 95
317 272 86
30 - 34 580 526 91
341 313 92
239 213 89 35 - 39 597 560 94
348 335 96
249 225 90
40 - 44 559 522 93
374 358 96
185 164 89 45 - 49 513 462 90
350 319 91
163 143 88
50 - 54 361 311 86
241 213 88
120 98 82 55 - 59 384 329 86
270 236 87
114 93 82
60 - 64 379 281 74
227 160 70
152 121 80 65 - 69 333 238 71
211 156 74
122 82 67
70 - 74 269 183 68
162 109 67
107 74 69 75 - 79 212 142 67
107 71 66
105 71 68
80 - 84 186 94 51
106 47 44
80 47 59 85 - 89 139 55 40
91 31 34
48 24 50
90 - 94 98 41 42
65 23 35
33 18 55 95+ 104 26 25 72 15 21 32 11 34

Chapter 7: Housing Characteristics
2011 Population and Housing Census Regional Profile, Omusati Region 98
Table 5.20 School enrolment for population aged 5 - 24 years by sex, Omusati
Age Population
Enrolled
Enrolment rate
Total Female Male Total Female Male Total Female Male
Total 117 547 59 547 58 000 85 738 43 827 41 911 72.9 73.6 72.3
5 6 712 3 361 3 351
2 943 1 506 1 437
43.8 44.8 42.9
6 5 986 3 036 2 950
4 549 2 345 2 204
76.0 77.2 74.7
7 5 776 2 913 2 863
5 167 2 653 2 514
89.5 91.1 87.8
8 6 164 3 161 3 003
5 746 2 958 2 788
93.2 93.6 92.8
9 6 095 3 094 3 001
5 629 2 866 2 763
92.4 92.6 92.1
10 6 329 3 147 3 182
5 860 2 934 2 926
92.6 93.2 92.0
11 7 264 3 627 3 637
6 691 3 390 3 301
92.1 93.5 90.8
12 6 621 3 374 3 247
6 027 3 117 2 910
91.0 92.4 89.6
13 6 729 3 287 3 442
6 077 3 025 3 052
90.3 92.0 88.7
14 6 351 3 201 3 150
5 669 2 947 2 722
89.3 92.1 86.4
15 6 787 3 462 3 325
5 905 3 099 2 806
87.0 89.5 84.4
16 6 926 3 498 3 428
5 825 3 049 2 776
84.1 87.2 81.0
17 6 728 3 380 3 348
5 463 2 856 2 607
81.2 84.5 77.9
18 7 000 3 461 3 539
5 002 2 552 2 450
71.5 73.7 69.2
19 6 076 2 968 3 108
3 675 1 803 1 872
60.5 60.7 60.2
20 5 105 2 517 2 588
2 302 1 113 1 189
45.1 44.2 45.9
21 4 873 2 550 2 323
1 637 820 817
33.6 32.2 35.2
22 3 640 1 916 1 724
828 410 418
22.7 21.4 24.2
23 3 458 1 943 1 515
474 235 239
13.7 12.1 15.8
24 2 927 1 651 1 276 269 149 120 9.2 9.0 9.4
Table 5.21 School enrolment for population aged 5 - 24 years by sex, Urban
Age Population
Enrolled
Enrolment rate
Total Female Male Total Female Male Total Female Male
Total 5 659 3 230 2 429 3 739 2 099 1 640 66.1 65.0 67.5
5 229 120 109
143 68 75
62.4 56.7 68.8
6 182 111 71
148 92 56
81.3 82.9 78.9
7 215 112 103
198 102 96
92.1 91.1 93.2
8 235 138 97
222 130 92
94.5 94.2 94.8
9 237 123 114
223 117 106
94.1 95.1 93.0
10 233 129 104
223 120 103
95.7 93.0 99.0
11 255 147 108
232 134 98
91.0 91.2 90.7
12 270 160 110
245 148 97
90.7 92.5 88.2
13 237 131 106
223 126 97
94.1 96.2 91.5
14 246 124 122
229 118 111
93.1 95.2 91.0
15 238 128 110
199 107 92
83.6 83.6 83.6
16 268 162 106
246 149 97
91.8 92.0 91.5
17 378 210 168
323 179 144
85.4 85.2 85.7
18 424 239 185
319 184 135
75.2 77.0 73.0
19 333 184 149
189 100 89
56.8 54.3 59.7
20 329 185 144
135 81 54
41.0 43.8 37.5
21 348 207 141
99 59 40
28.4 28.5 28.4
22 319 197 122
65 40 25
20.4 20.3 20.5
23 361 222 139
45 24 21
12.5 10.8 15.1
24 322 201 121 33 21 12 10.2 10.4 9.9

Chapter 7: Housing Characteristics
2011 Population and Housing Census Regional Profile, Omusati Region 99
Table 5.22 School enrolment for population aged 5 - 24 years by sex, Rural
Age Population
Enrolled
Enrolment rate
Total Female Male Total Female Male Total Female Male
Total 111 888 56 317 55 571 81 999 41 728 40 271 73.3 74.1 72.5
5 6 483 3 241 3 242
2 800 1 438 1 362
43.2 44.4 42.0
6 5 804 2 925 2 879
4 401 2 253 2 148
75.8 77.0 74.6
7 5 561 2 801 2 760
4 969 2 551 2 418
89.4 91.1 87.6
8 5 929 3 023 2 906
5 524 2 828 2 696
93.2 93.5 92.8
9 5 858 2 971 2 887
5 406 2 749 2 657
92.3 92.5 92.0
10 6 096 3 018 3 078
5 637 2 814 2 823
92.5 93.2 91.7
11 7 009 3 480 3 529
6 459 3 256 3 203
92.2 93.6 90.8
12 6 351 3 214 3 137
5 782 2 969 2 813
91.0 92.4 89.7
13 6 492 3 156 3 336
5 854 2 899 2 955
90.2 91.9 88.6
14 6 105 3 077 3 028
5 440 2 829 2 611
89.1 91.9 86.2
15 6 549 3 334 3 215
5 706 2 992 2 714
87.1 89.7 84.4
16 6 658 3 336 3 322
5 579 2 900 2 679
83.8 86.9 80.6
17 6 350 3 170 3 180
5 140 2 677 2 463
80.9 84.4 77.5
18 6 576 3 222 3 354
4 683 2 368 2 315
71.2 73.5 69.0
19 5 743 2 784 2 959
3 486 1 703 1 783
60.7 61.2 60.3
20 4 776 2 332 2 444
2 167 1 032 1 135
45.4 44.3 46.4
21 4 525 2 343 2 182
1 538 761 777
34.0 32.5 35.6
22 3 321 1 719 1 602
763 370 393
23.0 21.5 24.5
23 3 097 1 721 1 376
429 211 218
13.9 12.3 15.8
24 2 605 1 450 1 155 236 128 108 9.1 8.8 9.4
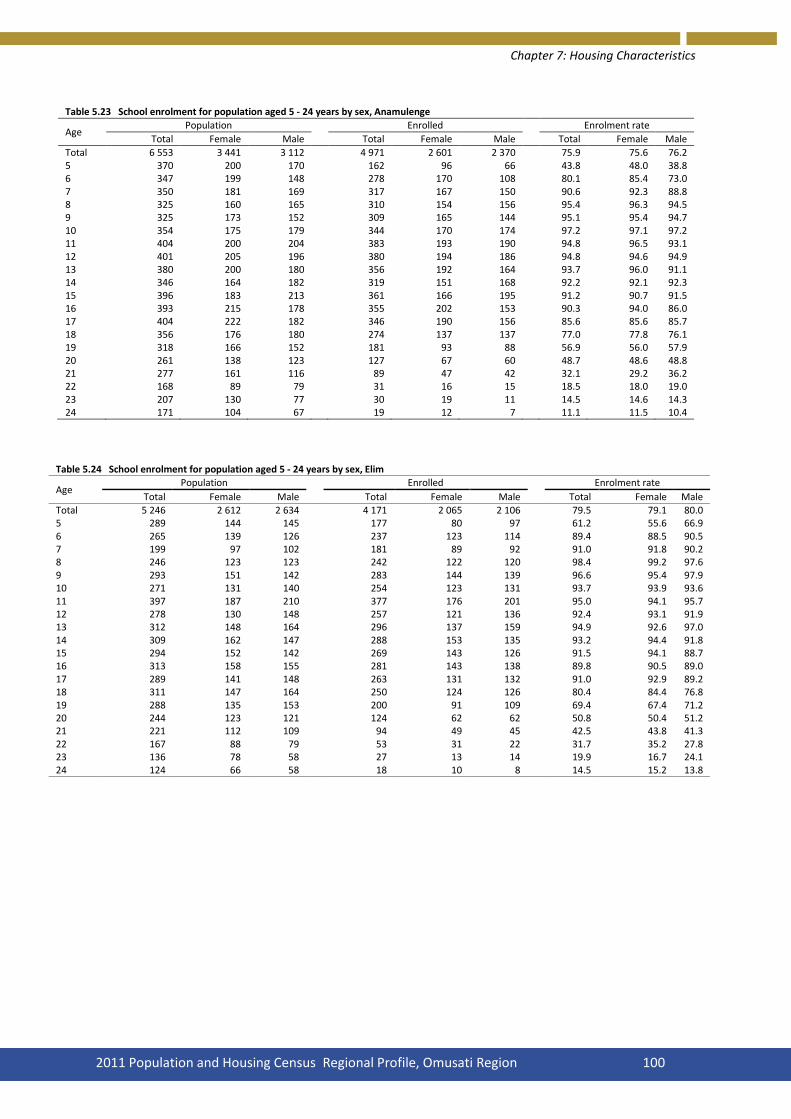
Chapter 7: Housing Characteristics
2011 Population and Housing Census Regional Profile, Omusati Region 100
Table 5.23 School enrolment for population aged 5 - 24 years by sex, Anamulenge
Age Population
Enrolled
Enrolment rate
Total Female Male Total Female Male Total Female Male
Total 6 553 3 441 3 112 4 971 2 601 2 370 75.9 75.6 76.2 5 370 200 170
162 96 66
43.8 48.0 38.8
6 347 199 148
278 170 108
80.1 85.4 73.0 7 350 181 169
317 167 150
90.6 92.3 88.8
8 325 160 165
310 154 156
95.4 96.3 94.5 9 325 173 152
309 165 144
95.1 95.4 94.7
10 354 175 179
344 170 174
97.2 97.1 97.2 11 404 200 204
383 193 190
94.8 96.5 93.1
12 401 205 196
380 194 186
94.8 94.6 94.9 13 380 200 180
356 192 164
93.7 96.0 91.1
14 346 164 182
319 151 168
92.2 92.1 92.3 15 396 183 213
361 166 195
91.2 90.7 91.5
16 393 215 178
355 202 153
90.3 94.0 86.0 17 404 222 182
346 190 156
85.6 85.6 85.7
18 356 176 180
274 137 137
77.0 77.8 76.1 19 318 166 152
181 93 88
56.9 56.0 57.9
20 261 138 123
127 67 60
48.7 48.6 48.8 21 277 161 116
89 47 42
32.1 29.2 36.2
22 168 89 79
31 16 15
18.5 18.0 19.0 23 207 130 77
30 19 11
14.5 14.6 14.3
24 171 104 67 19 12 7 11.1 11.5 10.4
Table 5.24 School enrolment for population aged 5 - 24 years by sex, Elim
Age Population
Enrolled
Enrolment rate
Total Female Male Total Female Male Total Female Male
Total 5 246 2 612 2 634 4 171 2 065 2 106 79.5 79.1 80.0 5 289 144 145
177 80 97
61.2 55.6 66.9
6 265 139 126
237 123 114
89.4 88.5 90.5 7 199 97 102
181 89 92
91.0 91.8 90.2
8 246 123 123
242 122 120
98.4 99.2 97.6 9 293 151 142
283 144 139
96.6 95.4 97.9
10 271 131 140
254 123 131
93.7 93.9 93.6 11 397 187 210
377 176 201
95.0 94.1 95.7
12 278 130 148
257 121 136
92.4 93.1 91.9 13 312 148 164
296 137 159
94.9 92.6 97.0
14 309 162 147
288 153 135
93.2 94.4 91.8 15 294 152 142
269 143 126
91.5 94.1 88.7
16 313 158 155
281 143 138
89.8 90.5 89.0 17 289 141 148
263 131 132
91.0 92.9 89.2
18 311 147 164
250 124 126
80.4 84.4 76.8 19 288 135 153
200 91 109
69.4 67.4 71.2
20 244 123 121
124 62 62
50.8 50.4 51.2 21 221 112 109
94 49 45
42.5 43.8 41.3
22 167 88 79
53 31 22
31.7 35.2 27.8 23 136 78 58
27 13 14
19.9 16.7 24.1
24 124 66 58 18 10 8 14.5 15.2 13.8

Chapter 7: Housing Characteristics
2011 Population and Housing Census Regional Profile, Omusati Region 101
Table 5.25 School enrolment for population aged 5 - 24 years by sex, Etayi
Age Population
Enrolled
Enrolment rate
Total Female Male Total Female Male Total Female Male Total 17 982 9 143 8 839 13 993 7 053 6 940 77.8 77.1 78.5 5 961 470 491
471 228 243
49.0 48.5 49.5
6 884 443 441
713 359 354
80.7 81.0 80.3 7 879 427 452
812 403 409
92.4 94.4 90.5
8 924 468 456
867 440 427
93.8 94.0 93.6 9 872 439 433
827 414 413
94.8 94.3 95.4
10 995 521 474
940 492 448
94.5 94.4 94.5 11 1 213 625 588
1 120 597 523
92.3 95.5 88.9
12 1 036 541 495
968 506 462
93.4 93.5 93.3 13 1 116 542 574
1 029 505 524
92.2 93.2 91.3
14 1 012 482 530
930 454 476
91.9 94.2 89.8 15 1 130 580 550
1 022 541 481
90.4 93.3 87.5
16 1 116 557 559
985 500 485
88.3 89.8 86.8 17 1 043 523 520
898 454 444
86.1 86.8 85.4
18 1 129 586 543
880 456 424
77.9 77.8 78.1 19 926 472 454
647 305 342
69.9 64.6 75.3
20 770 383 387
392 183 209
50.9 47.8 54.0 21 664 331 333
256 117 139
38.6 35.3 41.7
22 524 281 243
133 54 79
25.4 19.2 32.5 23 429 250 179
61 20 41
14.2 8.0 22.9
24 359 222 137 42 25 17 11.7 11.3 12.4
Table 5.26 School enrolment for population aged 5 - 24 years by sex, Ogongo
Age Population
Enrolled
Enrolment rate
Total Female Male Total Female Male Total Female Male
Total 9 300 4 636 4 664 6 932 3 493 3 439 74.5 75.3 73.7 5 539 251 288
234 103 131
43.4 41.0 45.5
6 462 228 234
378 187 191
81.8 82.0 81.6 7 459 224 235
422 206 216
91.9 92.0 91.9
8 469 253 216
440 241 199
93.8 95.3 92.1 9 500 237 263
470 220 250
94.0 92.8 95.1
10 536 265 271
503 250 253
93.8 94.3 93.4 11 561 277 284
522 262 260
93.0 94.6 91.5
12 526 272 254
472 245 227
89.7 90.1 89.4 13 537 249 288
479 222 257
89.2 89.2 89.2
14 503 261 242
452 241 211
89.9 92.3 87.2 15 553 288 265
478 249 229
86.4 86.5 86.4
16 569 276 293
481 248 233
84.5 89.9 79.5 17 524 247 277
427 208 219
81.5 84.2 79.1
18 557 262 295
378 183 195
67.9 69.8 66.1 19 477 244 233
292 152 140
61.2 62.3 60.1
20 403 206 197
213 124 89
52.9 60.2 45.2 21 382 197 185
148 75 73
38.7 38.1 39.5
22 280 151 129
77 46 31
27.5 30.5 24.0 23 227 121 106
42 19 23
18.5 15.7 21.7
24 236 127 109 24 12 12 10.2 9.4 11.0
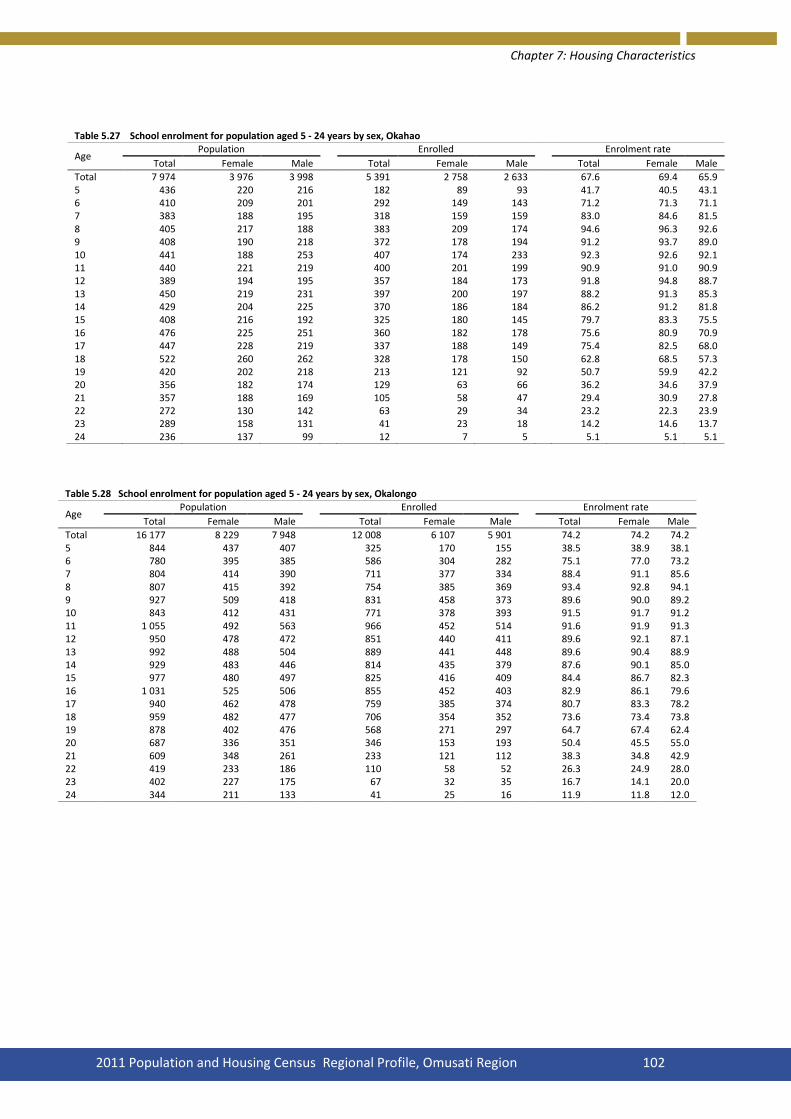
Chapter 7: Housing Characteristics
2011 Population and Housing Census Regional Profile, Omusati Region 102
Table 5.27 School enrolment for population aged 5 - 24 years by sex, Okahao
Age Population
Enrolled
Enrolment rate
Total Female Male Total Female Male Total Female Male
Total 7 974 3 976 3 998 5 391 2 758 2 633 67.6 69.4 65.9 5 436 220 216
182 89 93
41.7 40.5 43.1
6 410 209 201
292 149 143
71.2 71.3 71.1 7 383 188 195
318 159 159
83.0 84.6 81.5
8 405 217 188
383 209 174
94.6 96.3 92.6 9 408 190 218
372 178 194
91.2 93.7 89.0
10 441 188 253
407 174 233
92.3 92.6 92.1 11 440 221 219
400 201 199
90.9 91.0 90.9
12 389 194 195
357 184 173
91.8 94.8 88.7 13 450 219 231
397 200 197
88.2 91.3 85.3
14 429 204 225
370 186 184
86.2 91.2 81.8 15 408 216 192
325 180 145
79.7 83.3 75.5
16 476 225 251
360 182 178
75.6 80.9 70.9 17 447 228 219
337 188 149
75.4 82.5 68.0
18 522 260 262
328 178 150
62.8 68.5 57.3 19 420 202 218
213 121 92
50.7 59.9 42.2
20 356 182 174
129 63 66
36.2 34.6 37.9 21 357 188 169
105 58 47
29.4 30.9 27.8
22 272 130 142
63 29 34
23.2 22.3 23.9 23 289 158 131
41 23 18
14.2 14.6 13.7
24 236 137 99 12 7 5 5.1 5.1 5.1
Table 5.28 School enrolment for population aged 5 - 24 years by sex, Okalongo
Age Population
Enrolled
Enrolment rate
Total Female Male Total Female Male Total Female Male
Total 16 177 8 229 7 948 12 008 6 107 5 901 74.2 74.2 74.2 5 844 437 407
325 170 155
38.5 38.9 38.1
6 780 395 385
586 304 282
75.1 77.0 73.2 7 804 414 390
711 377 334
88.4 91.1 85.6
8 807 415 392
754 385 369
93.4 92.8 94.1 9 927 509 418
831 458 373
89.6 90.0 89.2
10 843 412 431
771 378 393
91.5 91.7 91.2 11 1 055 492 563
966 452 514
91.6 91.9 91.3
12 950 478 472
851 440 411
89.6 92.1 87.1 13 992 488 504
889 441 448
89.6 90.4 88.9
14 929 483 446
814 435 379
87.6 90.1 85.0 15 977 480 497
825 416 409
84.4 86.7 82.3
16 1 031 525 506
855 452 403
82.9 86.1 79.6 17 940 462 478
759 385 374
80.7 83.3 78.2
18 959 482 477
706 354 352
73.6 73.4 73.8 19 878 402 476
568 271 297
64.7 67.4 62.4
20 687 336 351
346 153 193
50.4 45.5 55.0 21 609 348 261
233 121 112
38.3 34.8 42.9
22 419 233 186
110 58 52
26.3 24.9 28.0 23 402 227 175
67 32 35
16.7 14.1 20.0
24 344 211 133 41 25 16 11.9 11.8 12.0
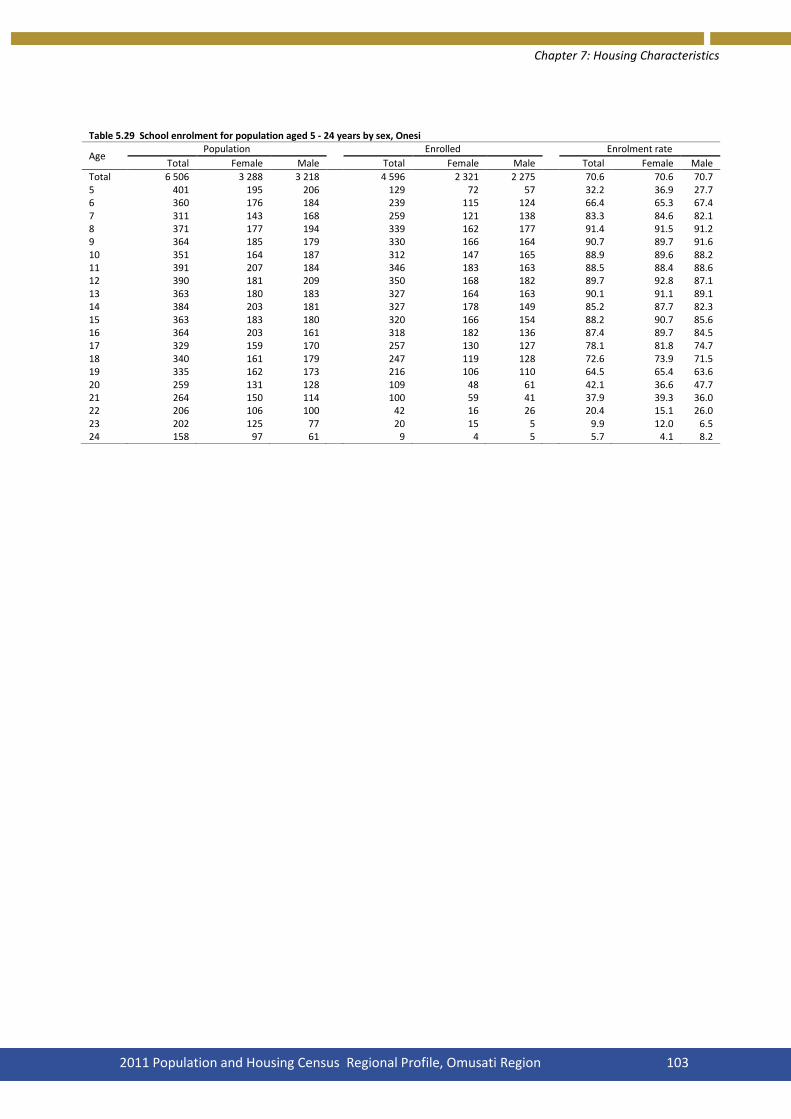
Chapter 7: Housing Characteristics
2011 Population and Housing Census Regional Profile, Omusati Region 103
Table 5.29 School enrolment for population aged 5 - 24 years by sex, Onesi
Age Population
Enrolled
Enrolment rate
Total Female Male Total Female Male Total Female Male
Total 6 506 3 288 3 218 4 596 2 321 2 275 70.6 70.6 70.7 5 401 195 206
129 72 57
32.2 36.9 27.7
6 360 176 184
239 115 124
66.4 65.3 67.4 7 311 143 168
259 121 138
83.3 84.6 82.1
8 371 177 194
339 162 177
91.4 91.5 91.2 9 364 185 179
330 166 164
90.7 89.7 91.6
10 351 164 187
312 147 165
88.9 89.6 88.2 11 391 207 184
346 183 163
88.5 88.4 88.6
12 390 181 209
350 168 182
89.7 92.8 87.1 13 363 180 183
327 164 163
90.1 91.1 89.1
14 384 203 181
327 178 149
85.2 87.7 82.3 15 363 183 180
320 166 154
88.2 90.7 85.6
16 364 203 161
318 182 136
87.4 89.7 84.5 17 329 159 170
257 130 127
78.1 81.8 74.7
18 340 161 179
247 119 128
72.6 73.9 71.5 19 335 162 173
216 106 110
64.5 65.4 63.6
20 259 131 128
109 48 61
42.1 36.6 47.7 21 264 150 114
100 59 41
37.9 39.3 36.0
22 206 106 100
42 16 26
20.4 15.1 26.0 23 202 125 77
20 15 5
9.9 12.0 6.5
24 158 97 61 9 4 5 5.7 4.1 8.2

Chapter 7: Housing Characteristics
2011 Population and Housing Census Regional Profile, Omusati Region 104
Table 5.30 School enrolment for population aged 5 - 24 years by sex, Oshikuku
Age Population
Enrolled
Enrolment rate
Total Female Male Total Female Male Total Female Male
Total 4 130 2 165 1 965 3 073 1 585 1 488 74.4 73.2 75.7 5 213 102 111
113 58 55
53.1 56.9 49.5
6 194 95 99
158 80 78
81.4 84.2 78.8 7 187 91 96
175 84 91
93.6 92.3 94.8
8 197 106 91
191 102 89
97.0 96.2 97.8 9 190 105 85
173 95 78
91.1 90.5 91.8
10 194 105 89
185 102 83
95.4 97.1 93.3 11 220 115 105
206 108 98
93.6 93.9 93.3
12 222 125 97
210 122 88
94.6 97.6 90.7 13 226 117 109
210 112 98
92.9 95.7 89.9
14 220 119 101
205 109 96
93.2 91.6 95.0 15 235 120 115
214 109 105
91.1 90.8 91.3
16 220 106 114
189 93 96
85.9 87.7 84.2 17 254 125 129
232 114 118
91.3 91.2 91.5
18 288 142 146
229 111 118
79.5 78.2 80.8 19 263 139 124
170 84 86
64.6 60.4 69.4
20 216 106 110
103 45 58
47.7 42.5 52.7 21 188 106 82
53 25 28
28.2 23.6 34.1
22 143 85 58
26 14 12
18.2 16.5 20.7 23 144 91 53
18 11 7
12.5 12.1 13.2
24 116 65 51 13 7 6 11.2 10.8 11.8
Table 5.31 School enrolment for population aged 5 - 24 years by sex, Outapi
Age Population
Enrolled
Enrolment rate
Total Female Male Total Female Male Total Female Male
Total 17 945 9 236 8 709 12 893 6 665 6 228 71.8 72.2 71.5 5 1 078 517 561
456 227 229
42.3 43.9 40.8
6 918 472 446
690 359 331
75.2 76.1 74.2 7 856 454 402
773 417 356
90.3 91.9 88.6
8 981 509 472
905 470 435
92.3 92.3 92.2 9 921 452 469
853 420 433
92.6 92.9 92.3
10 980 491 489
905 456 449
92.3 92.9 91.8 11 1 061 544 517
999 518 481
94.2 95.2 93.0
12 1 010 515 495
932 481 451
92.3 93.4 91.1 13 938 468 470
845 430 415
90.1 91.9 88.3
14 874 459 415
791 426 365
90.5 92.8 88.0 15 1 016 541 475
891 486 405
87.7 89.8 85.3
16 1 031 534 497
871 460 411
84.5 86.1 82.7 17 1 103 585 518
901 492 409
81.7 84.1 79.0
18 1 049 541 508
777 411 366
74.1 76.0 72.0 19 868 437 431
495 229 266
57.0 52.4 61.7
20 792 396 396
336 156 180
42.4 39.4 45.5 21 811 420 391
239 109 130
29.5 26.0 33.2
22 594 321 273
120 62 58
20.2 19.3 21.2 23 555 301 254
70 34 36
12.6 11.3 14.2
24 509 279 230 44 22 22 8.6 7.9 9.6

Chapter 7: Housing Characteristics
2011 Population and Housing Census Regional Profile, Omusati Region 105
Table 5.32 School enrolment for population aged 5 - 24 years by sex, Ruacana
Age Population
Enrolled
Enrolment rate
Total Female Male Total Female Male Total Female Male
Total 6 832 3 312 3 520 4 044 2 123 1 921 59.2 64.1 54.6 5 418 216 202
169 96 73
40.4 44.4 36.1
6 394 192 202
255 134 121
64.7 69.8 59.9 7 339 171 168
285 148 137
84.1 86.5 81.5
8 429 229 200
366 198 168
85.3 86.5 84.0 9 307 161 146
255 142 113
83.1 88.2 77.4
10 382 201 181
324 176 148
84.8 87.6 81.8 11 392 211 181
318 179 139
81.1 84.8 76.8
12 369 179 190
290 143 147
78.6 79.9 77.4 13 356 175 181
285 152 133
80.1 86.9 73.5
14 350 164 186
275 137 138
78.6 83.5 74.2 15 324 148 176
235 115 120
72.5 77.7 68.2
16 348 172 176
240 129 111
69.0 75.0 63.1 17 325 143 182
211 102 109
64.9 71.3 59.9
18 381 161 220
187 94 93
49.1 58.4 42.3 19 340 154 186
134 65 69
39.4 42.2 37.1
20 300 126 174
78 40 38
26.0 31.7 21.8 21 307 144 163
58 32 26
18.9 22.2 16.0
22 271 120 151
48 25 23
17.7 20.8 15.2 23 292 147 145
23 11 12
7.9 7.5 8.3
24 208 98 110 8 5 3 3.8 5.1 2.7
Table 5.33 School enrolment for population aged 5 - 24 years by sex, Tsandi
Age Population
Enrolled
Enrolment rate
Total Female Male Total Female Male Total Female Male
Total 12 730 6 371 6 359 9 169 4 654 4 515 72.0 73.0 71.0 5 799 432 367
357 206 151
44.7 47.7 41.1
6 649 334 315
488 255 233
75.2 76.3 74.0 7 649 320 329
586 290 296
90.3 90.6 90.0
8 655 323 332
614 304 310
93.7 94.1 93.4 9 680 332 348
646 316 330
95.0 95.2 94.8
10 642 329 313
603 314 289
93.9 95.4 92.3 11 775 364 411
725 346 379
93.5 95.1 92.2
12 741 389 352
672 357 315
90.7 91.8 89.5 13 741 349 392
664 323 341
89.6 92.6 87.0
14 673 326 347
610 312 298
90.6 95.7 85.9 15 720 365 355
644 338 306
89.4 92.6 86.2
16 697 341 356
584 292 292
83.8 85.6 82.0 17 687 354 333
533 293 240
77.6 82.8 72.1
18 733 380 353
496 261 235
67.7 68.7 66.6 19 637 295 342
372 181 191
58.4 61.4 55.8
20 579 267 312
234 109 125
40.4 40.8 40.1 21 547 270 277
173 80 93
31.6 29.6 33.6
22 402 207 195
92 38 54
22.9 18.4 27.7 23 403 225 178
50 25 25
12.4 11.1 14.0
24 321 169 152 26 14 12 8.1 8.3 7.9

Chapter 7: Housing Characteristics
2011 Population and Housing Census Regional Profile, Omusati Region 106
Table 5.34 School enrolment for population aged 5 - 24 years by sex, Otamanzi
Age Population
Enrolled
Enrolment rate
Total Female Male Total Female Male Total Female Male
Total 6 172 3 138 3 034 4 497 2 402 2 095 72.9 76.5 69.1 5 364 177 187
168 81 87
46.2 45.8 46.5
6 323 154 169
235 110 125
72.8 71.4 74.0 7 360 203 157
328 192 136
91.1 94.6 86.6
8 355 181 174
335 171 164
94.4 94.5 94.3 9 308 160 148
280 148 132
90.9 92.5 89.2
10 340 165 175
312 152 160
91.8 92.1 91.4 11 355 184 171
329 175 154
92.7 95.1 90.1
12 309 165 144
288 156 132
93.2 94.5 91.7 13 318 152 166
300 147 153
94.3 96.7 92.2
14 322 174 148
288 165 123
89.4 94.8 83.1 15 371 206 165
321 190 131
86.5 92.2 79.4
16 368 186 182
306 166 140
83.2 89.2 76.9 17 383 191 192
299 169 130
78.1 88.5 67.7
18 375 163 212
250 124 126
66.7 76.1 59.4 19 326 160 166
187 105 82
57.4 65.6 49.4
20 238 123 115
111 63 48
46.6 51.2 41.7 21 246 123 123
89 48 41
36.2 39.0 33.3
22 194 105 89
33 21 12
17.0 20.0 13.5 23 172 90 82
25 13 12
14.5 14.4 14.6
24 145 76 69 13 6 7 9.0 7.9 10.1

Chapter 7: Housing Characteristics
2011 Population and Housing Census Regional Profile, Omusati Region 107
Table 5.35 Population aged 5 years and above by Table 5.42 Population aged 5 years and above by
school attendance and sex, Omusati region school attendance and sex, Elim
School Attendance Total Female Male School Attendance Total Female Male
Total 208 667 116 289 92 378 Total 9 941 5 577 4 364
Never Attended 23 441 13 373 10 068 Never Attended 706 434 272
Pre-primary 4 727 2 433 2 294 Pre-primary 220 106 114
Adult Education Programme 2 464 1 805 659 Adult Education Programme 81 57 24
School 83 445 42 792 40 653 School 4 048 2 009 2 039
Left School 89 019 52 974 36 045 Left School 4 774 2 910 1 864
Don't Know 5 571 2 912 2 659 Don't Know 112 61 51
Table 5.36 Population aged 5 years and above by Table 5.43 Population aged 5 years and above by
school attendance and sex, Urban school attendance and sex, Etayi
School Attendance Total Female Male School Attendance Total Female Male
Total 11 855 6 829 5 026 Total 30 148 17 138 13 010
Never Attended 636 321 315 Never Attended 3 102 1 961 1 141
Pre-primary 177 94 83 Pre-primary 788 397 391
Adult Education Programme 164 105 59 Adult Education Programme 398 304 94
School 3 754 2 123 1 631 School 13 562 6 867 6 695
Left School 6 842 4 060 2 782 Left School 11 725 7 288 4 437
Don't Know 282 126 156 Don't Know 573 321 252
Table 5.37 Population aged 5 years and above by Table 5.44 Population aged 5 years and above by
school attendance and sex, Rural school attendance and sex, Ogongo
School Attendance Total Female Male School Attendance Total Female Male
Total 196 812 109 460 87 352 Total 16 898 9 490 7 408
Never Attended 22 805 13 052 9 753 Never Attended 1 523 905 618
Pre-primary 4 550 2 339 2 211 Pre-primary 355 180 175
Adult Education Programme 2 300 1 700 600 Adult Education Programme 154 121 33
School 79 691 40 669 39 022 School 6 748 3 407 3 341
Left School 82 177 48 914 33 263 Left School 7 652 4 620 3 032
Don't Know 5 289 2 786 2 503 Don't Know 466 257 209
Table 5.38 Population aged 5 years and above by Table 5.45 Population aged 5 years and above by
school attendance and sex, Anamulenge school attendance and sex, Okahao
School Attendance Total Female Male School Attendance Total Female Male
Total 11 490 6 522 4 968 Total 15 265 8 433 6 832
Never Attended 1 081 642 439 Never Attended 1666 908 758
Pre-primary 305 181 124 Pre-primary 275 132 143
Adult Education Programme 129 93 36 Adult Education Programme 152 111 41
School 4 806 2 496 2 310 School 5 263 2 701 2 562
Left School 4 970 3 005 1 965 Left School 7 407 4 317 3 090
Don't Know 199 105 94 Don't Know 502 264 238

Chapter 7: Housing Characteristics
2011 Population and Housing Census Regional Profile, Omusati Region 108
Table 5.39 Population aged 5 years and above by Table 5.46 Population aged 5 years and above by school attendance and sex, Okalongo school attendance and sex, Ruacana
School Attendance Total Female Male School Attendance Total Female Male
Total 26 266 14 905 11 361 Total 12 522 6 169 6 353 Never Attended 3 196 1 939 1 257 Never Attended 2 538 1 160 1 378 Pre-primary 504 268 236 Pre-primary 338 174 164 Adult Education Programme 355 267 88 Adult Education Programme 141 77 64 School 11 822 6 040 5 782 School 3 817 2 011 1 806 Left School 9 749 6 058 3 691 Left School 5 113 2 472 2 641 Don't Know 640 333 307 Don't Know 575 275 300
Table 5.39 Population aged 5 years and above by Table 5.47 Population aged 5 years and above by school attendance and sex, Onesi school attendance and sex, Tsandi
School Attendance Total Female Male School Attendance Total Female Male
Total 11 252 6 172 5 080 Total 24 129 13 381 10 748 Never Attended 1 817 1 034 0 783 Never Attended 2 687 1 514 1 173 Pre-primary 164 87 77 Pre-primary 576 312 264 Adult Education Programme 162 118 44 Adult Education Programme 306 227 79 School 4 566 2 307 2 259 School 8 964 4 552 4 412 Left School 4 316 2 526 1 790 Left School 10 776 6 348 4 428 Don't Know 227 100 127 Don't Know 820 428 392
Table 5.40 Population aged 5 years and above by Table 5.48 Population aged 5 years and above by school attendance and sex, Oshikuku school attendance and sex, Otamanzi
School Attendance Total Female Male School Attendance Total Female Male
Total 7 772 4 519 3 253 Total 11 592 6 492 5 100 Never Attended 476 292 184 Never Attended 1 199 634 565 Pre-primary 190 93 97 Pre-primary 283 138 145 Adult Education Programme 29 24 5 Adult Education Programme 211 164 47 School 2 979 1 538 1 441 School 4 347 2 347 2 000 Left School 3 897 2 459 1 438 Left School 5 069 2 958 2 111 Don't Know 201 113 88 Don't Know 483 251 232
Table 5.41 Population aged 5 years and above by school attendance and sex, Outapi
School Attendance Total Female Male
Total 31 392 17 491 13 901 Never Attended 3 450 1 950 1 500 Pre-primary 729 365 364 Adult Education Programme 346 242 104 School 12 523 6 517 6 006 Left School 13 571 8 013 5 558 Don't Know 773 404 369
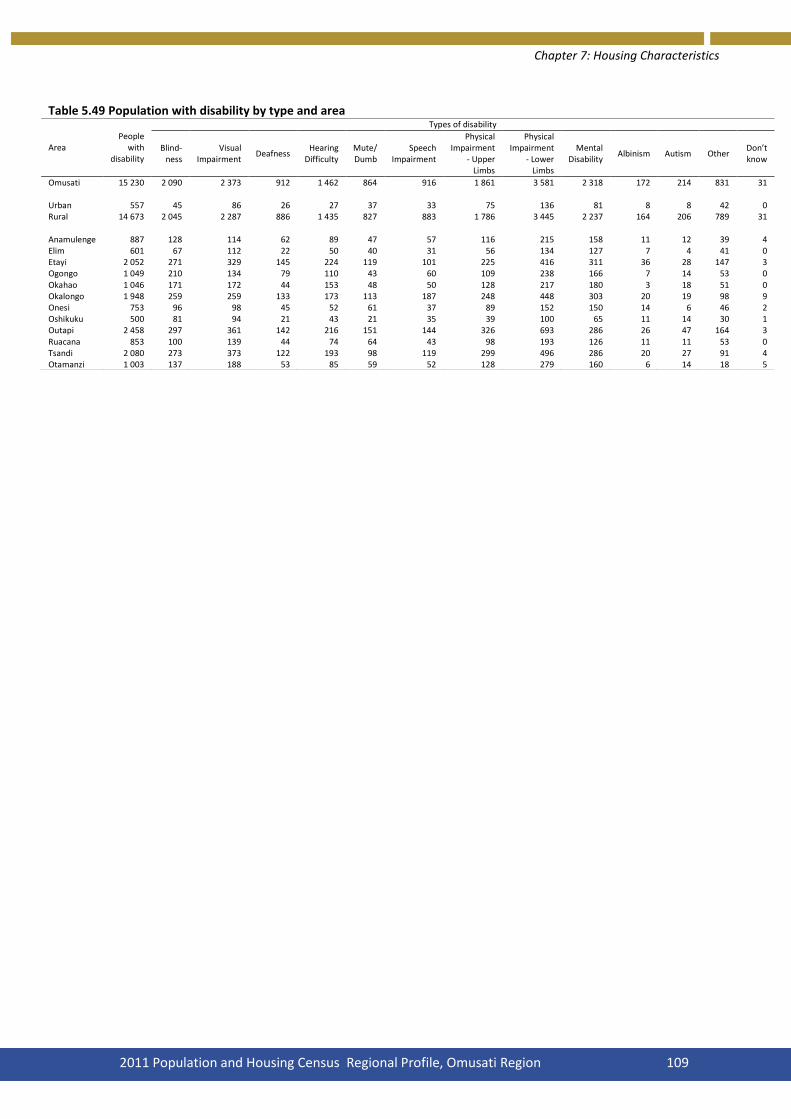
Chapter 7: Housing Characteristics
2011 Population and Housing Census Regional Profile, Omusati Region 109
Table 5.49 Population with disability by type and area
Area People
with disability
Types of disability
Blind-ness
Visual Impairment
Deafness Hearing
Difficulty Mute/ Dumb
Speech Impairment
Physical Impairment
- Upper Limbs
Physical Impairment
- Lower Limbs
Mental Disability
Albinism Autism Other Don’t know
Omusati 15 230 2 090 2 373 912 1 462 864 916 1 861 3 581 2 318 172 214 831 31 Urban 557 45 86 26 27 37 33 75 136 81 8 8 42 0 Rural 14 673 2 045 2 287 886 1 435 827 883 1 786 3 445 2 237 164 206 789 31 Anamulenge 887 128 114 62 89 47 57 116 215 158 11 12 39 4 Elim 601 67 112 22 50 40 31 56 134 127 7 4 41 0 Etayi 2 052 271 329 145 224 119 101 225 416 311 36 28 147 3 Ogongo 1 049 210 134 79 110 43 60 109 238 166 7 14 53 0 Okahao 1 046 171 172 44 153 48 50 128 217 180 3 18 51 0 Okalongo 1 948 259 259 133 173 113 187 248 448 303 20 19 98 9 Onesi 753 96 98 45 52 61 37 89 152 150 14 6 46 2 Oshikuku 500 81 94 21 43 21 35 39 100 65 11 14 30 1 Outapi 2 458 297 361 142 216 151 144 326 693 286 26 47 164 3 Ruacana 853 100 139 44 74 64 43 98 193 126 11 11 53 0 Tsandi 2 080 273 373 122 193 98 119 299 496 286 20 27 91 4 Otamanzi 1 003 137 188 53 85 59 52 128 279 160 6 14 18 5
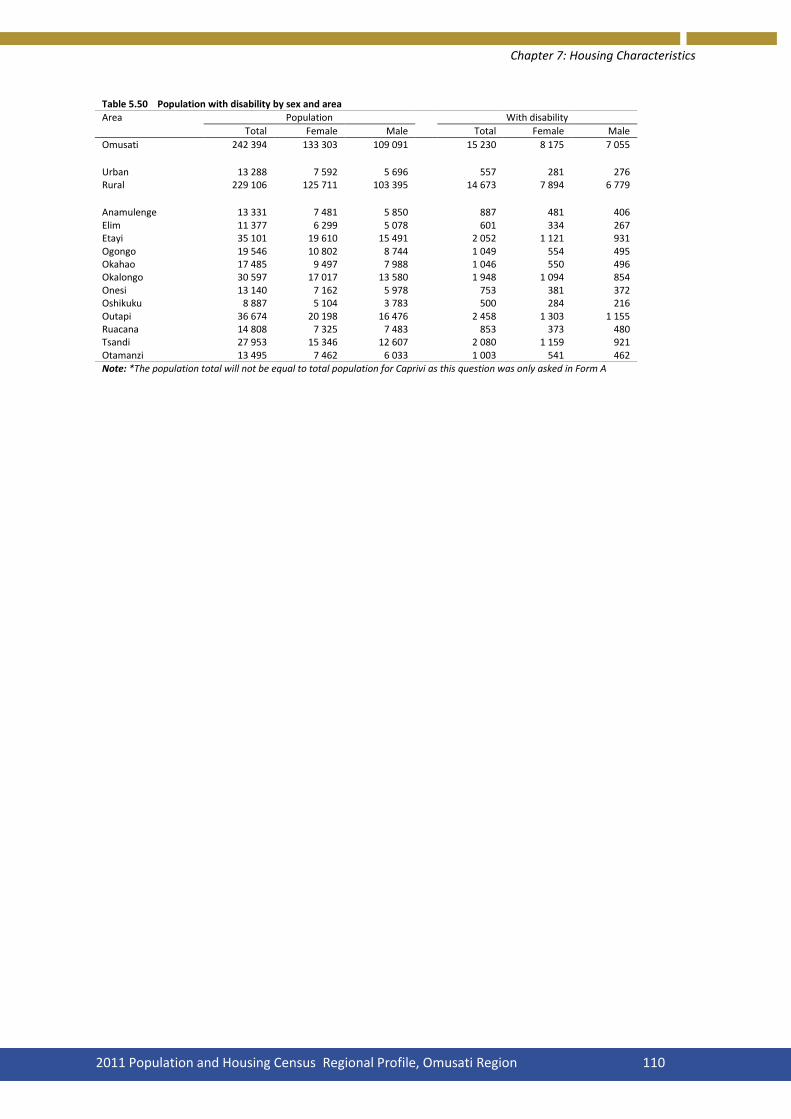
Chapter 7: Housing Characteristics
2011 Population and Housing Census Regional Profile, Omusati Region 110
Table 5.50 Population with disability by sex and area Area Population With disability Total Female Male Total Female Male Omusati 242 394 133 303 109 091
15 230 8 175 7 055
Urban 13 288 7 592 5 696
557 281 276 Rural 229 106 125 711 103 395
14 673 7 894 6 779
Anamulenge 13 331 7 481 5 850
887 481 406 Elim 11 377 6 299 5 078
601 334 267
Etayi 35 101 19 610 15 491
2 052 1 121 931 Ogongo 19 546 10 802 8 744
1 049 554 495
Okahao 17 485 9 497 7 988
1 046 550 496 Okalongo 30 597 17 017 13 580
1 948 1 094 854
Onesi 13 140 7 162 5 978
753 381 372 Oshikuku 8 887 5 104 3 783
500 284 216
Outapi 36 674 20 198 16 476
2 458 1 303 1 155 Ruacana 14 808 7 325 7 483
853 373 480
Tsandi 27 953 15 346 12 607
2 080 1 159 921 Otamanzi 13 495 7 462 6 033 1 003 541 462 Note: *The population total will not be equal to total population for Caprivi as this question was only asked in Form A

Chapter 7: Housing Characteristics
2011 Population and Housing Census Regional Profile, Omusati Region 111
Table 5.51 Population aged 15 years and above by activity status and age group, Omusati
Age group
Total Employed Unemployed Student Homemaker Income
Recipient Retired
Pensioner Old Age
Pensioner
Unable to work (Ill & Disabled) Other
Dont Know
Total 144 640 41 314 29 908 30 916 7 915 633 1 486 18 826 1 731 394 11 517 15 - 19 33 517 2 693 2 389 23 954 722 36 - - 220 82 3 421 20 - 24 20 003 5 338 6 316 5 081 1 013 63 - - 185 69 1 938 25 - 29 13 920 5 602 5 407 691 837 71 - - 151 40 1 121 30 - 34 11 871 5 327 4 374 260 756 68 - - 151 36 899 35 - 39 10 807 4 918 3 871 166 792 67 126 - 150 24 693 40 - 44 8 674 4 307 2 622 143 735 58 130 - 137 24 518 45 - 49 7 751 4 176 1 868 98 704 65 168 - 163 14 495 50 - 54 6 262 3 422 1 246 62 668 49 239 - 162 15 399 55 - 59 5 852 3 083 1 016 66 731 52 342 - 169 26 367 60 - 64 5 817 882 316 58 337 27 181 3 581 65 16 354
65+ 20 166 1 566 483 337 620 77 300 15 245 178 48 1 312
Note: - means not applicable for retired and old age pensioner
Table 5.52 Female population aged 15 years and above by activity status and age group, Omusati
Age group
Total Employed Unemployed Student Homemaker Income
Recipient Retired
Pensioner Old Age
Pensioner
Unable to Work (Ill
and Disabled) Other
Dont Know
Total 84 088 23 255 18 248 15 808 5 682 366 803 12 227 814 229 6 656 15 - 19 16 769 1 150 1 173 12 242 341 14 - - 103 37 1 709 20 - 24 10 577 2 744 3 547 2 485 626 35 - - 92 39 1 009 25 - 29 7 897 2 950 3 246 382 542 48 - - 61 24 644 30 - 34 6 983 2 884 2 790 149 522 35 - - 50 24 529 35 - 39 6 536 2 764 2 463 107 604 34 66 - 62 12 424 40 - 44 5 449 2 539 1 703 82 592 31 72 - 61 14 355 45 - 49 5 138 2 621 1 272 59 590 48 105 - 83 10 350 50 - 54 4 291 2 238 887 40 572 33 145 - 85 11 280 55 - 59 4 002 1 988 716 43 648 35 207 - 87 15 263 60 - 64 3 541 486 180 31 233 14 64 2 275 27 10 221 65+ 12 905 891 271 188 412 39 144 9 952 103 33 872
Note: - means not applicable for retired and old age pensioner

Chapter 7: Housing Characteristics
2011 Population and Housing Census Regional Profile, Omusati Region 112
Table 5.53 Male population aged 15 years and above by activity status and age group, Omusati
Age group
Total Employed Unemployed Student Homemaker Income
Recipient Retired
Pensioner Old Age
Pensioner
Unable to Work (Ill
and Disabled) Other
Dont Know
Total 60 552 18 059 11 660 15 108 2 233 267 683 6 599 917 165 4 861 15 - 19 16 748 1 543 1 216 11 712 381 22 - - 117 45 1 712 20 - 24 9 426 2 594 2 769 2 596 387 28 - - 93 30 929 25 - 29 6 023 2 652 2 161 309 295 23 - - 90 16 477 30 - 34 4 888 2 443 1 584 111 234 33 - - 101 12 370 35 - 39 4 271 2 154 1 408 59 188 33 60 - 88 12 269 40 - 44 3 225 1 768 919 61 143 27 58 - 76 10 163 45 - 49 2 613 1 555 596 39 114 17 63 - 80 4 145 50 - 54 1 971 1 184 359 22 96 16 94 - 77 4 119 55 - 59 1 850 1 095 300 23 83 17 135 - 82 11 104 60 - 64 2 276 396 136 27 104 13 117 1 306 38 6 133 65+ 7 261 675 212 149 208 38 156 5 293 75 15 440
Note: - means not applicable for retired and old age pensioner
Table 5.54 Labour force participation rate and unemployment rate for population aged 15 years and above by age group and sex
Age group
Total Female Male
Total Labour Force Participation
rate Unemployment
rate Total
Labour Force Participation
rate Unemployment
rate Total
Labour Force Participation
rate Unemployment
rate
Total 144 640 49.2 42.0
84 088 49.4 44.0
60 552 49.1 39.2 15 - 19 33 517 15.2 47.0
16 769 13.9 50.5
16 748 16.5 44.1
20 - 24 20 003 58.3 54.2
10 577 59.5 56.4
9 426 56.9 51.6 25 - 29 13 920 79.1 49.1
7 897 78.5 52.4
6 023 79.9 44.9
30 - 34 11 871 81.7 45.1
6 983 81.3 49.2
4 888 82.4 39.3 35 - 39 10 807 81.3 44.0
6 536 80.0 47.1
4 271 83.4 39.5
40 - 44 8 674 79.9 37.8
5 449 77.8 40.1
3 225 83.3 34.2 45 - 49 7 751 78.0 30.9
5 138 75.8 32.7
2 613 82.3 27.7
50 - 54 6 262 74.5 26.7
4 291 72.8 28.4
1 971 78.3 23.3 55 - 59 5 852 70.0 24.8
4 002 67.6 26.5
1 850 75.4 21.5
60 - 64 5 817 20.6 26.4
3 541 18.8 27.0
2 276 23.4 25.6 65+ 20 166 10.2 23.6 12 905 9.0 23.3 7 261 12.2 23.9

Chapter 7: Housing Characteristics
2011 Population and Housing Census Regional Profile, Omusati Region 113
Table 5.55 Population aged 15 years and above by activity status and sex, Omusati
Activity status Total Female Male
Total 144 640 84 088 60 552 Economically Active (In Labour force) 71 222 41 503 29 719 Employed 41 314 23 255 18 059 Unemployed 29 908 18 248 11 660 Economically inactive (outside labour force) 61 901 35 929 Student 30 916 15 808 15 108 Homemaker 7 915 5 682 2 233 Income Recipient 633 366 267 Retired Pensioner 1 486 803 683 Old Age Pensioner 18 826 12 227 6 599 Unable to Work (Ill) 671 331 340 Unable to Work (Disabled) 1 060 483 577 Other 394 229 165 Don't Know 11 517 6 656 4 861
Table 5.56 Population aged 15 years and above by activity status and sex, Urban Activity status Total Female Male
Total 9 516 5 534 3 982 Economically Active (In Labour force) 6 823 3 950 2 873 Employed 4 523 2 414 2 109 Unemployed 2 300 1 536 764
Economically inactive (outside labour force) 2 233 1 317 916 Student 1 561 893 668 Homemaker 227 170 57 Income Recipient 40 20 20 Retired Pensioner 65 28 37 Old Age Pensioner 277 180 97 Unable to Work (Ill) 16 8 8 Unable to Work (Disabled) 25 5 20 Other 22 13 9 Don't Know 460 267 193 Table 5.57 Population aged 15 years and above by activity status and sex, Rural Activity status Total Female Male
Total 135 124 78 554 56 570 Economically Active (In Labour force) 64 399 37 553 26 846 Employed 36 791 20 841 15 950 Unemployed 27 608 16 712 10 896
Economically inactive (outside labour force) 59 668 34 612 25 056 Student 29 355 14 915 14 440 Homemaker 7 688 5 512 2 176 Income Recipient 593 346 247 Retired Pensioner 1 421 775 646 Old Age Pensioner 18 549 12 047 6 502 Unable to Work (Ill) 655 323 332 Unable to Work (Disabled) 1 035 478 557 Other 372 216 156 Don't Know 11 057 6 389 4 668
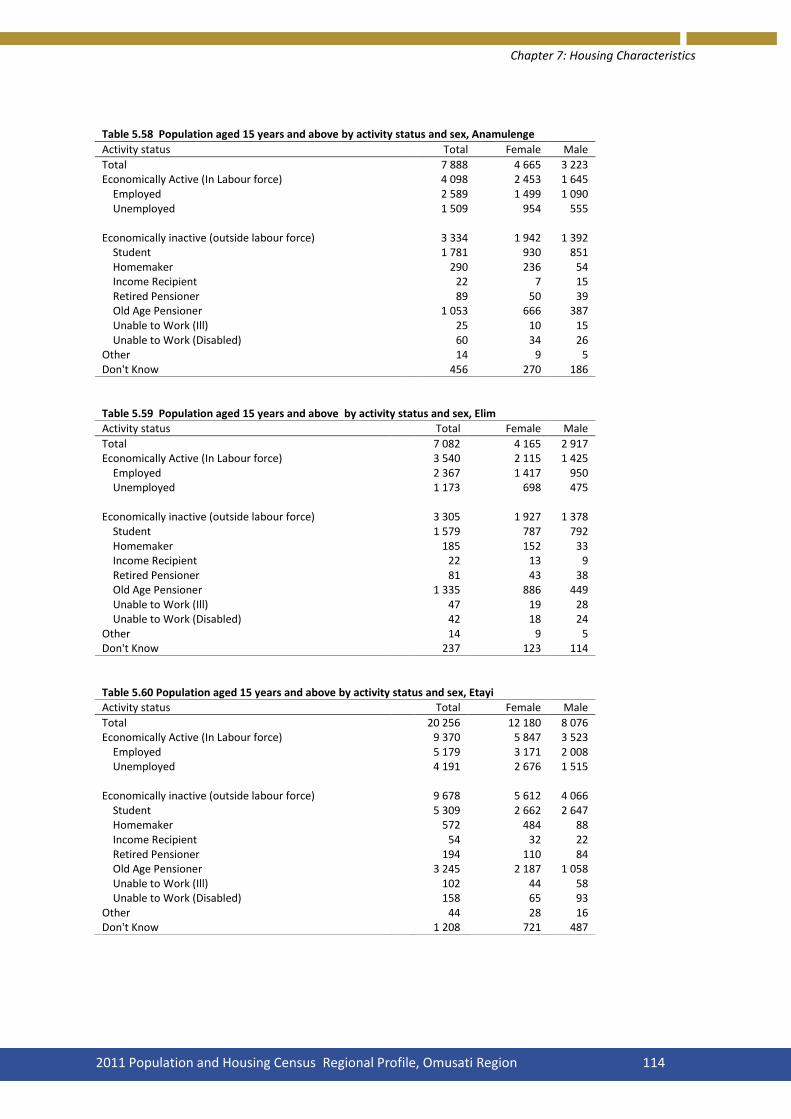
Chapter 7: Housing Characteristics
2011 Population and Housing Census Regional Profile, Omusati Region 114
Table 5.58 Population aged 15 years and above by activity status and sex, Anamulenge
Activity status Total Female Male
Total 7 888 4 665 3 223 Economically Active (In Labour force) 4 098 2 453 1 645 Employed 2 589 1 499 1 090 Unemployed 1 509 954 555
Economically inactive (outside labour force) 3 334 1 942 1 392 Student 1 781 930 851 Homemaker 290 236 54 Income Recipient 22 7 15 Retired Pensioner 89 50 39 Old Age Pensioner 1 053 666 387 Unable to Work (Ill) 25 10 15 Unable to Work (Disabled) 60 34 26 Other 14 9 5 Don't Know 456 270 186 Table 5.59 Population aged 15 years and above by activity status and sex, Elim
Activity status Total Female Male
Total 7 082 4 165 2 917 Economically Active (In Labour force) 3 540 2 115 1 425 Employed 2 367 1 417 950 Unemployed 1 173 698 475
Economically inactive (outside labour force) 3 305 1 927 1 378 Student 1 579 787 792 Homemaker 185 152 33 Income Recipient 22 13 9 Retired Pensioner 81 43 38 Old Age Pensioner 1 335 886 449 Unable to Work (Ill) 47 19 28 Unable to Work (Disabled) 42 18 24 Other 14 9 5 Don't Know 237 123 114
Table 5.60 Population aged 15 years and above by activity status and sex, Etayi
Activity status Total Female Male
Total 20 256 12 180 8 076 Economically Active (In Labour force) 9 370 5 847 3 523 Employed 5 179 3 171 2 008 Unemployed 4 191 2 676 1 515
Economically inactive (outside labour force) 9 678 5 612 4 066 Student 5 309 2 662 2 647 Homemaker 572 484 88 Income Recipient 54 32 22 Retired Pensioner 194 110 84 Old Age Pensioner 3 245 2 187 1 058 Unable to Work (Ill) 102 44 58 Unable to Work (Disabled) 158 65 93 Other 44 28 16 Don't Know 1 208 721 487

Chapter 7: Housing Characteristics
2011 Population and Housing Census Regional Profile, Omusati Region 115
Table 5.61 Population aged 15 years and above by activity status and sex, Ogongo
Activity status Total Female Male
Total 11 806 6 973 4 833 Economically Active (In Labour force) 5 571 3 249 2 322 Employed 3 768 2 178 1 590 Unemployed 1 803 1 071 732
Economically inactive (outside labour force) 5 291 3 183 2 108 Student 2 447 1 246 1 201 Homemaker 687 568 119 Income Recipient 59 34 25 Retired Pensioner 138 71 67 Old Age Pensioner 1 798 1 174 624 Unable to Work (Ill) 78 42 36 Unable to Work (Disabled) 74 41 33 Other 10 7 3 Don't Know 944 541 403
Table 5.62 Population aged 15 years and above by activity status and sex, Okahao
Activity status Total Female Male
Total 11 074 6 383 4 691 Economically Active (In Labour force) 5 562 3 071 2 491 Employed 3 517 1 859 1 658 Unemployed 2 045 1 212 833
Economically inactive (outside labour force) 4 325 2 597 1 728 Student 1 852 995 857 Homemaker 662 462 200 Income Recipient 46 22 24 Retired Pensioner 127 70 57 Old Age Pensioner 1 494 978 516 Unable to Work (Ill) 57 27 30 Unable to Work (Disabled) 74 36 38 Other 13 7 6 Don't Know 1 187 715 472
Table 5.63 Population aged 15 years and above by activity status and sex, Okalongo
Activity status Total Female Male
Total 17 335 10 382 6 953 Economically Active (In Labour force) 7 247 4 517 2 730 Employed 3 830 2 296 1 534 Unemployed 3 417 2 221 1 196
Economically inactive (outside labour force) 8 228 4 779 3 449 Student 4 353 2 197 2 156 Homemaker 1 213 888 325 Income Recipient 130 76 54 Retired Pensioner 188 98 90 Old Age Pensioner 1 980 1 326 654 Unable to Work (Ill) 85 48 37 Unable to Work (Disabled) 147 68 79 Other 132 78 54 Don't Know 1 860 1 086 774
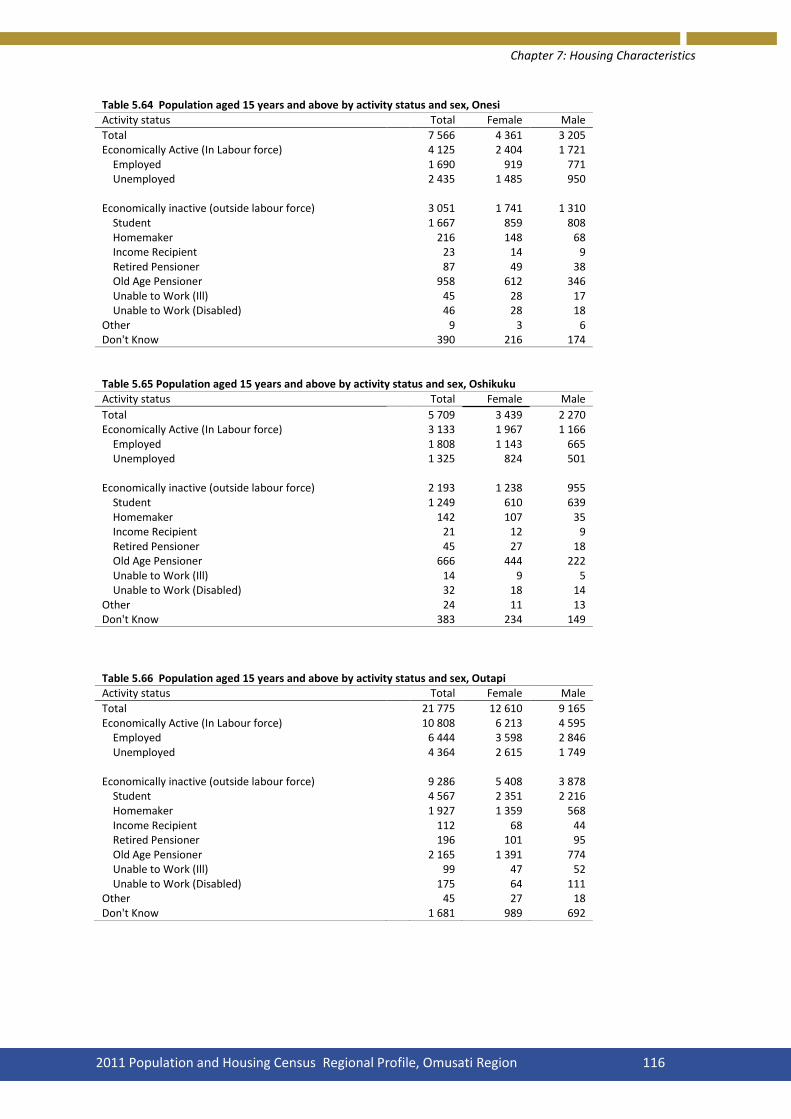
Chapter 7: Housing Characteristics
2011 Population and Housing Census Regional Profile, Omusati Region 116
Table 5.64 Population aged 15 years and above by activity status and sex, Onesi
Activity status Total Female Male
Total 7 566 4 361 3 205 Economically Active (In Labour force) 4 125 2 404 1 721 Employed 1 690 919 771 Unemployed 2 435 1 485 950
Economically inactive (outside labour force) 3 051 1 741 1 310 Student 1 667 859 808 Homemaker 216 148 68 Income Recipient 23 14 9 Retired Pensioner 87 49 38 Old Age Pensioner 958 612 346 Unable to Work (Ill) 45 28 17 Unable to Work (Disabled) 46 28 18 Other 9 3 6 Don't Know 390 216 174
Table 5.65 Population aged 15 years and above by activity status and sex, Oshikuku
Activity status Total Female Male
Total 5 709 3 439 2 270 Economically Active (In Labour force) 3 133 1 967 1 166 Employed 1 808 1 143 665 Unemployed 1 325 824 501 Economically inactive (outside labour force) 2 193 1 238 955 Student 1 249 610 639 Homemaker 142 107 35 Income Recipient 21 12 9 Retired Pensioner 45 27 18 Old Age Pensioner 666 444 222 Unable to Work (Ill) 14 9 5 Unable to Work (Disabled) 32 18 14 Other 24 11 13 Don't Know 383 234 149
Table 5.66 Population aged 15 years and above by activity status and sex, Outapi Activity status Total Female Male
Total 21 775 12 610 9 165 Economically Active (In Labour force) 10 808 6 213 4 595 Employed 6 444 3 598 2 846 Unemployed 4 364 2 615 1 749 Economically inactive (outside labour force) 9 286 5 408 3 878 Student 4 567 2 351 2 216 Homemaker 1 927 1 359 568 Income Recipient 112 68 44 Retired Pensioner 196 101 95 Old Age Pensioner 2 165 1 391 774 Unable to Work (Ill) 99 47 52 Unable to Work (Disabled) 175 64 111 Other 45 27 18 Don't Know 1 681 989 692

Chapter 7: Housing Characteristics
2011 Population and Housing Census Regional Profile, Omusati Region 117
Table 5.67 Population aged 15 years and above by activity status and sex, Ruacana
Activity status Total Female Male
Total 8 786 4 270 4 516 Economically Active (In Labour force) 5 379 2 512 2 867 Employed 3 471 1 386 2 085 Unemployed 1 908 1 126 782 Economically inactive (outside labour force) 2 580 1 332 1 248 Student 1 178 597 581 Homemaker 662 349 313 Income Recipient 30 15 15 Retired Pensioner 53 20 33 Old Age Pensioner 540 296 244 Unable to Work (Ill) 23 12 11 Unable to Work (Disabled) 50 19 31 Other 44 24 20 Don't Know 827 426 401
Table 5.68 Population aged 15 years and above by activity status and sex, Tsandi Activity status Total Female Male
Total 17 125 9 883 7 242 Economically Active (In Labour force) 8 242 4 791 3 451 Employed 4 485 2 593 1 892 Unemployed 3 757 2 198 1 559 Economically inactive (outside labour force) 7 207 4 122 3 085 Student 3 263 1 649 1 614 Homemaker 958 647 311 Income Recipient 72 44 28 Retired Pensioner 220 123 97 Old Age Pensioner 2 449 1 543 906 Unable to Work (Ill) 63 30 33 Unable to Work (Disabled) 143 63 80 Other 39 23 16 Don't Know 1 676 970 706
Table 5.69 Population aged 15 years and above by activity status and sex, Otamanzi Activity status Total Female Male
Total 8 238 4 777 3 461 Economically Active (In Labour force) 4 147 2 364 1 783 Employed 2 166 1 196 970 Unemployed 1 981 1 168 813 Economically inactive (outside labour force) 3 423 2 048 1 375 Student 1 671 925 746 Homemaker 401 282 119 Income Recipient 42 29 13 Retired Pensioner 68 41 27 Old Age Pensioner 1 143 724 419 Unable to Work (Ill) 33 15 18 Unable to Work (Disabled) 59 29 30 Other 6 3 3 Don't Know 668 365 303
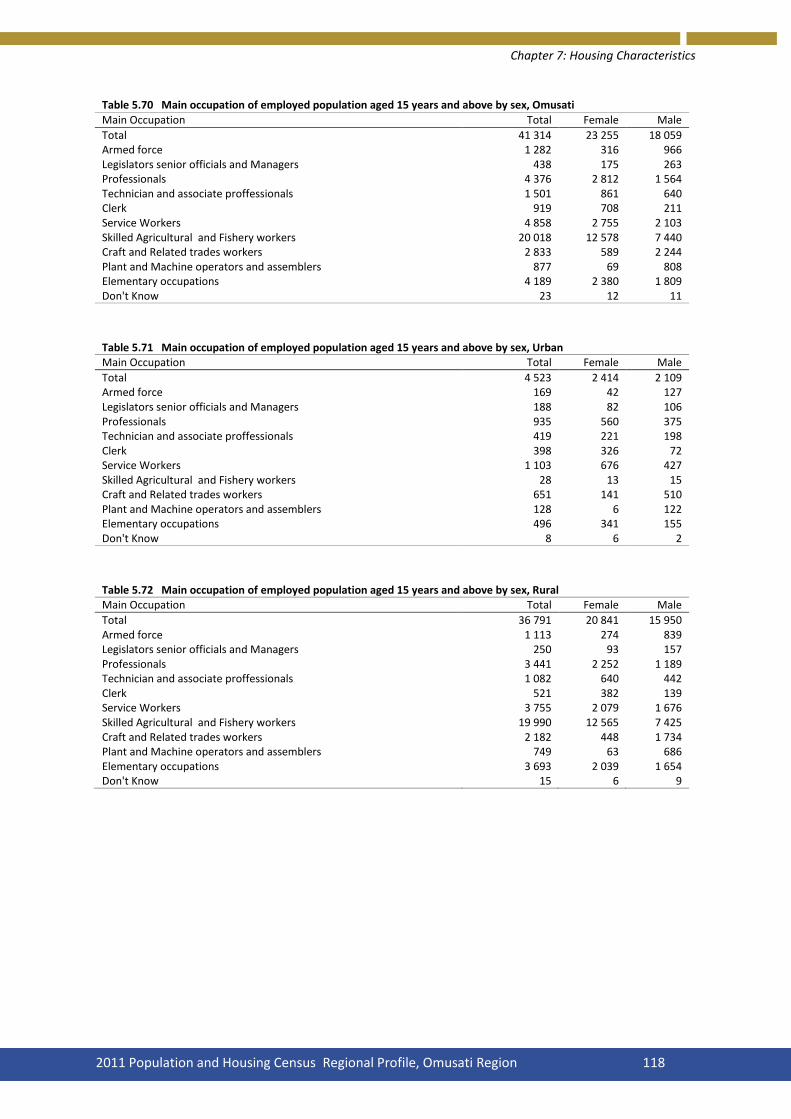
Chapter 7: Housing Characteristics
2011 Population and Housing Census Regional Profile, Omusati Region 118
Table 5.70 Main occupation of employed population aged 15 years and above by sex, Omusati
Main Occupation Total Female Male
Total 41 314 23 255 18 059 Armed force 1 282 316 966 Legislators senior officials and Managers 438 175 263 Professionals 4 376 2 812 1 564 Technician and associate proffessionals 1 501 861 640 Clerk 919 708 211 Service Workers 4 858 2 755 2 103 Skilled Agricultural and Fishery workers 20 018 12 578 7 440 Craft and Related trades workers 2 833 589 2 244 Plant and Machine operators and assemblers 877 69 808 Elementary occupations 4 189 2 380 1 809 Don't Know 23 12 11
Table 5.71 Main occupation of employed population aged 15 years and above by sex, Urban Main Occupation Total Female Male
Total 4 523 2 414 2 109 Armed force 169 42 127 Legislators senior officials and Managers 188 82 106 Professionals 935 560 375 Technician and associate proffessionals 419 221 198 Clerk 398 326 72 Service Workers 1 103 676 427 Skilled Agricultural and Fishery workers 28 13 15 Craft and Related trades workers 651 141 510 Plant and Machine operators and assemblers 128 6 122 Elementary occupations 496 341 155 Don't Know 8 6 2
Table 5.72 Main occupation of employed population aged 15 years and above by sex, Rural Main Occupation Total Female Male
Total 36 791 20 841 15 950 Armed force 1 113 274 839 Legislators senior officials and Managers 250 93 157 Professionals 3 441 2 252 1 189 Technician and associate proffessionals 1 082 640 442 Clerk 521 382 139 Service Workers 3 755 2 079 1 676 Skilled Agricultural and Fishery workers 19 990 12 565 7 425 Craft and Related trades workers 2 182 448 1 734 Plant and Machine operators and assemblers 749 63 686 Elementary occupations 3 693 2 039 1 654 Don't Know 15 6 9
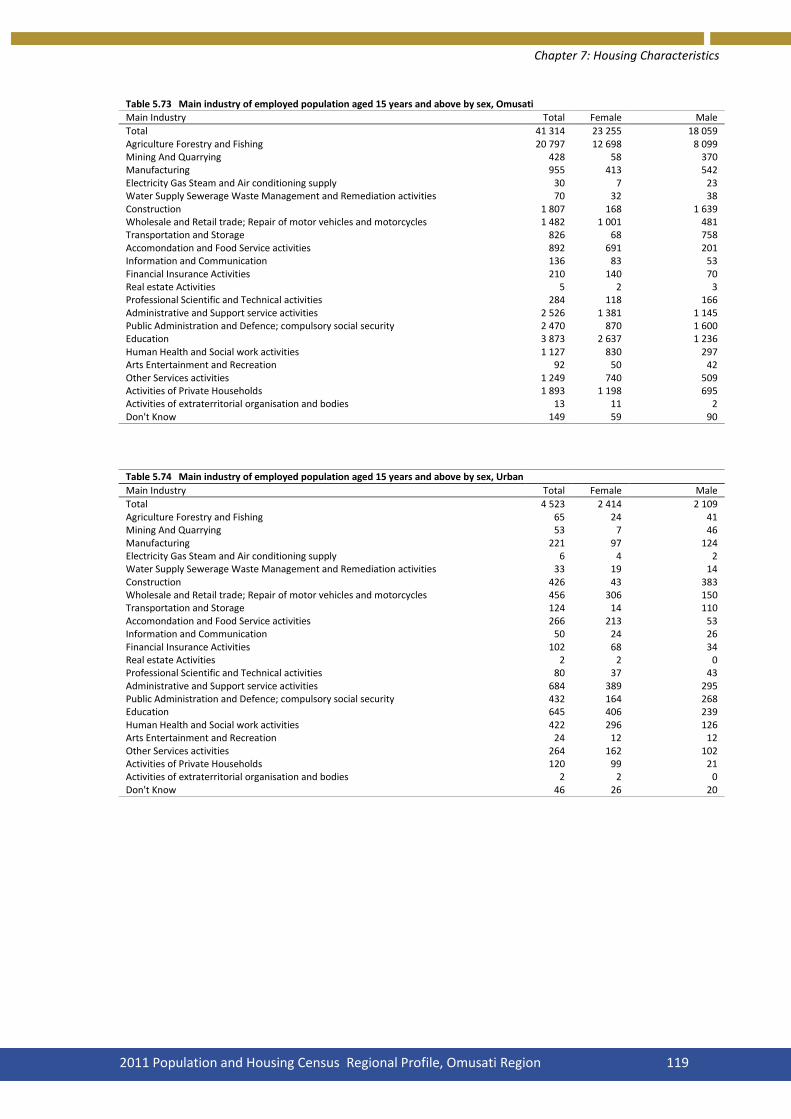
Chapter 7: Housing Characteristics
2011 Population and Housing Census Regional Profile, Omusati Region 119
Table 5.73 Main industry of employed population aged 15 years and above by sex, Omusati
Main Industry Total Female Male
Total 41 314 23 255 18 059 Agriculture Forestry and Fishing 20 797 12 698 8 099 Mining And Quarrying 428 58 370 Manufacturing 955 413 542 Electricity Gas Steam and Air conditioning supply 30 7 23 Water Supply Sewerage Waste Management and Remediation activities 70 32 38 Construction 1 807 168 1 639 Wholesale and Retail trade; Repair of motor vehicles and motorcycles 1 482 1 001 481 Transportation and Storage 826 68 758 Accomondation and Food Service activities 892 691 201 Information and Communication 136 83 53 Financial Insurance Activities 210 140 70 Real estate Activities 5 2 3 Professional Scientific and Technical activities 284 118 166 Administrative and Support service activities 2 526 1 381 1 145 Public Administration and Defence; compulsory social security 2 470 870 1 600 Education 3 873 2 637 1 236 Human Health and Social work activities 1 127 830 297 Arts Entertainment and Recreation 92 50 42 Other Services activities 1 249 740 509 Activities of Private Households 1 893 1 198 695 Activities of extraterritorial organisation and bodies 13 11 2 Don't Know 149 59 90
Table 5.74 Main industry of employed population aged 15 years and above by sex, Urban
Main Industry Total Female Male
Total 4 523 2 414 2 109 Agriculture Forestry and Fishing 65 24 41 Mining And Quarrying 53 7 46 Manufacturing 221 97 124 Electricity Gas Steam and Air conditioning supply 6 4 2 Water Supply Sewerage Waste Management and Remediation activities 33 19 14 Construction 426 43 383 Wholesale and Retail trade; Repair of motor vehicles and motorcycles 456 306 150 Transportation and Storage 124 14 110 Accomondation and Food Service activities 266 213 53 Information and Communication 50 24 26 Financial Insurance Activities 102 68 34 Real estate Activities 2 2 0 Professional Scientific and Technical activities 80 37 43 Administrative and Support service activities 684 389 295 Public Administration and Defence; compulsory social security 432 164 268 Education 645 406 239 Human Health and Social work activities 422 296 126 Arts Entertainment and Recreation 24 12 12 Other Services activities 264 162 102 Activities of Private Households 120 99 21 Activities of extraterritorial organisation and bodies 2 2 0 Don't Know 46 26 20

Chapter 7: Housing Characteristics
2011 Population and Housing Census Regional Profile, Omusati Region 120
Table 5.75 Main industry of employed population aged 15 years and above by sex, Rural
Main Industry Total Female Male
Total 36 791 20 841 15
950
Agriculture Forestry and Fishing 20 732 12 674 8
058 Mining And Quarrying 375 51 324 Manufacturing 734 316 418 Electricity Gas Steam and Air conditioning supply 24 3 21 Water Supply Sewerage Waste Management and Remediation activities 37 13 24
Construction 1 381 125 1
256 Wholesale and Retail trade; Repair of motor vehicles and motorcycles 1 026 695 331 Transportation and Storage 702 54 648 Accomondation and Food Service activities 626 478 148 Information and Communication 86 59 27 Financial Insurance Activities 108 72 36 Real estate Activities 3 0 3 Professional Scientific and Technical activities 204 81 123 Administrative and Support service activities 1 842 992 850
Public Administration and Defence; compulsory social security 2 038 706 1
332 Education 3 228 2 231 997 Human Health and Social work activities 705 534 171 Arts Entertainment and Recreation 68 38 30 Other Services activities 985 578 407 Activities of Private Households 1 773 1 099 674 Activities of extraterritorial organisation and bodies 11 9 2 Don't Know 103 33 70

Chapter 7: Housing Characteristics
2011 Population and Housing Census Regional Profile, Omusati Region 121
Table 5.76 Main job of employed population aged 15 years and above by sex, Omusati
Main job Total Female Male
Total 41 314 23 255 18 059 Subsistence/Communal Farmer (With Paid Employees) 1 002 371 631 Subsistence/Communal Farmer (Without Paid Employees) 19 801 12 771 7 030 Commercial Farmer (With Paid Employees) 121 69 52 Other Employer 510 270 240 Own Account Worker 796 425 371 Employee (Communal Farms) 661 158 503 Employee (Commercial Farms) 436 189 247 Employee (Government) 8 571 4 755 3 816 Employee (Parastatal) 1 620 588 1 032 Employee (Private) 6 892 3 127 3 765 Unpaid Family Worker (Subsistence/Communal) 521 339 182 Other Unpaid Family Worker 184 108 76 Other 124 59 65 Don't Know 75 26 49
Table 5.77 Main job of employed population aged 15 years and above by sex, Urban
Main job Total Female Male
Total 4 523 2 414 2 109 Subsistence/Communal Farmer (With Paid Employees) 40 15 25 Subsistence/Communal Farmer (Without Paid Employees) 21 12 9 Commercial Farmer (With Paid Employees) 3 2 1 Other Employer 160 100 60 Own Account Worker 217 128 89 Employee (Communal Farms) 20 12 8 Employee (Commercial Farms) 78 39 39 Employee (Government) 1 860 1 055 805 Employee (Parastatal) 408 153 255 Employee (Private) 1 642 858 784 Unpaid Family Worker (Subsistence/Communal) 31 25 6 Other Unpaid Family Worker 13 7 6 Other 20 5 15 Don't Know 10 3 7
Table 5.78 Main job of employed population aged 15 years and above by sex, rural Main job Total Female Male
Total 36 791 20 841 15 950 Subsistence/Communal Farmer (With Paid Employees) 962 356 606 Subsistence/Communal Farmer (Without Paid Employees) 19 780 12 759 7 021 Commercial Farmer (With Paid Employees) 118 67 51 Other Employer 350 170 180 Own Account Worker 579 297 282 Employee (Communal Farms) 641 146 495 Employee (Commercial Farms) 358 150 208 Employee (Government) 6 711 3 700 3 011 Employee (Parastatal) 1 212 435 777 Employee (Private) 5 250 2 269 2 981 Unpaid Family Worker (Subsistence/Communal) 490 314 176 Other Unpaid Family Worker 171 101 70 Other 104 54 50 Don't Know 65 23 42
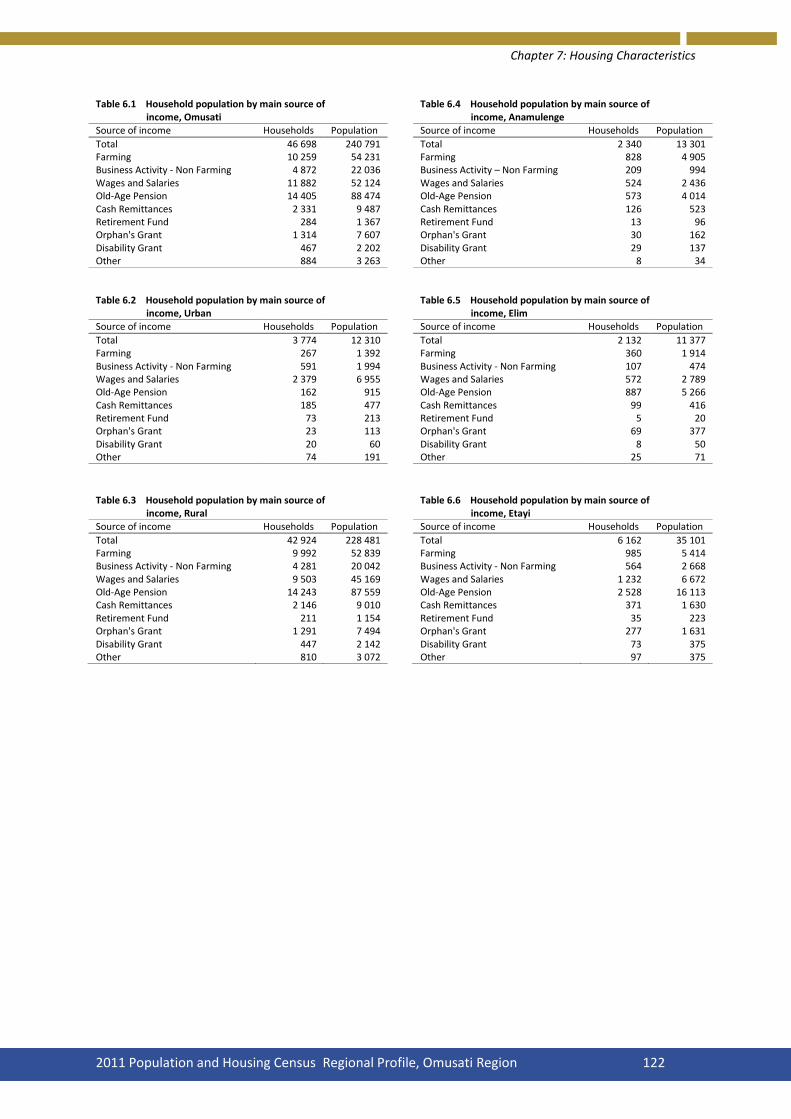
Chapter 7: Housing Characteristics
2011 Population and Housing Census Regional Profile, Omusati Region 122
Table 6.1 Household population by main source of
Table 6.4 Household population by main source of income, Omusati
income, Anamulenge
Source of income Households Population
Source of income Households Population
Total 46 698 240 791
Total 2 340 13 301 Farming 10 259 54 231
Farming 828 4 905
Business Activity - Non Farming 4 872 22 036
Business Activity – Non Farming 209 994 Wages and Salaries 11 882 52 124
Wages and Salaries 524 2 436
Old-Age Pension 14 405 88 474
Old-Age Pension 573 4 014 Cash Remittances 2 331 9 487
Cash Remittances 126 523
Retirement Fund 284 1 367
Retirement Fund 13 96 Orphan's Grant 1 314 7 607
Orphan's Grant 30 162
Disability Grant 467 2 202
Disability Grant 29 137 Other 884 3 263
Other 8 34
Table 6.2 Household population by main source of
Table 6.5 Household population by main source of
income, Urban
income, Elim Source of income Households Population
Source of income Households Population
Total 3 774 12 310
Total 2 132 11 377 Farming 267 1 392
Farming 360 1 914
Business Activity - Non Farming 591 1 994
Business Activity - Non Farming 107 474 Wages and Salaries 2 379 6 955
Wages and Salaries 572 2 789
Old-Age Pension 162 915
Old-Age Pension 887 5 266 Cash Remittances 185 477
Cash Remittances 99 416
Retirement Fund 73 213
Retirement Fund 5 20 Orphan's Grant 23 113
Orphan's Grant 69 377
Disability Grant 20 60
Disability Grant 8 50 Other 74 191
Other 25 71
Table 6.3 Household population by main source of
Table 6.6 Household population by main source of
income, Rural
income, Etayi Source of income Households Population
Source of income Households Population
Total 42 924 228 481
Total 6 162 35 101 Farming 9 992 52 839
Farming 985 5 414
Business Activity - Non Farming 4 281 20 042
Business Activity - Non Farming 564 2 668 Wages and Salaries 9 503 45 169
Wages and Salaries 1 232 6 672
Old-Age Pension 14 243 87 559
Old-Age Pension 2 528 16 113 Cash Remittances 2 146 9 010
Cash Remittances 371 1 630
Retirement Fund 211 1 154
Retirement Fund 35 223 Orphan's Grant 1 291 7 494
Orphan's Grant 277 1 631
Disability Grant 447 2 142
Disability Grant 73 375 Other 810 3 072
Other 97 375

Chapter 7: Housing Characteristics
2011 Population and Housing Census Regional Profile, Omusati Region 123
Table 6.7 Household population by main source of
Table 6.10 Household population by main source of income, Ogongo
income, Onesi
Source of income Households Population
Source of income Households Population
Total 3 753 19 343
Total 2 527 13 110 Farming 851 4 149
Farming 1 100 6 076
Business Activity – Non Farming 342 1 539
Business Activity – Non Farming 335 1 419 Wages and Salaries 870 4 118
Wages and Salaries 390 1 689
Old-Age Pension 1 321 7 808
Old-Age Pension 490 2 863 Cash Remittances 132 572
Cash Remittances 66 304
Retirement Fund 25 145
Retirement Fund 8 41 Orphan's Grant 112 600
Orphan's Grant 86 507
Disability Grant 41 175
Disability Grant 14 65 Other 59 237
Other 38 146
Table 6.8 Household population by main source of
Table 6.11 Household population by main source of
income, Okahao
income, Oshikuku
Source of income Households Population
Source of income Households Population
Total 3 799 17 266
Total 1 736 8 650 Farming 845 4 092
Farming 190 1 062
Business Activity - Non Farming 352 1 419
Business Activity - Non Farming 152 660 Wages and Salaries 1 027 3 504
Wages and Salaries 730 3 173
Old-Age Pension 1 203 6 741
Old-Age Pension 507 3 167 Cash Remittances 209 737
Cash Remittances 72 195
Retirement Fund 9 48
Retirement Fund 8 37 Orphan's Grant 78 401
Orphan's Grant 25 155
Disability Grant 29 155
Disability Grant 13 52 Other 47 169
Other 39 149
Table 6.9 Household population by main source of
Table 6.12 Household population by main source of
income, Okalongo
income, Outapi Source of income Households Population
Source of income Households Population
Total 4 889 30 463
Total 7 117 36 293 Farming 976 5 993
Farming 1 226 7 052
Business Activity - Non Farming 464 2 735
Business Activity – Non Farming 1 175 5 422 Wages and Salaries 1 150 6 252
Wages and Salaries 2 296 9 544
Old-Age Pension 1 718 12 043
Old-Age Pension 1 641 10 986 Cash Remittances 220 1 154
Cash Remittances 365 1 443
Retirement Fund 21 133
Retirement Fund 91 304 Orphan's Grant 205 1 443
Orphan's Grant 145 865
Disability Grant 41 244
Disability Grant 90 390 Other 94 466
Other 88 287

Chapter 7: Housing Characteristics
2011 Population and Housing Census Regional Profile, Omusati Region 124
Table 6.13 Household population by main source of
Table 6.15 Household population by main source of income, Ruacana
income, Otamanzi Source of income Households Population
Source of income Households Population
Total 3 520 14 474
Total 2 837 13 495 Farming 1 230 5 855
Farming 808 3 625 Business Activity - Non Farming 316 1 176
Business Activity - Non Farming 280 1 104 Wages and Salaries 1 111 3 605
Wages and Salaries 459 1 893 Old-Age Pension 404 2 151
Old-Age Pension 958 5 379 Cash Remittances 174 613
Cash Remittances 139 582 Retirement Fund 21 84
Retirement Fund 9 49 Orphan's Grant 50 297
Orphan's Grant 97 498 Disability Grant 30 134
Disability Grant 36 173 Other 184 559
Other 51 192
Table 6.14 Household population by main source of income, Tsandi Source of income Households Population Total 5 886 27 918 Farming 860 4 094 Business Activity – Non Farming 576 2 426 Wages and Salaries 1 521 6 449 Old-Age Pension 2 175 11 943 Cash Remittances 358 1 318 Retirement Fund 39 187 Orphan's Grant 140 671 Disability Grant 63 252 Other 154 578
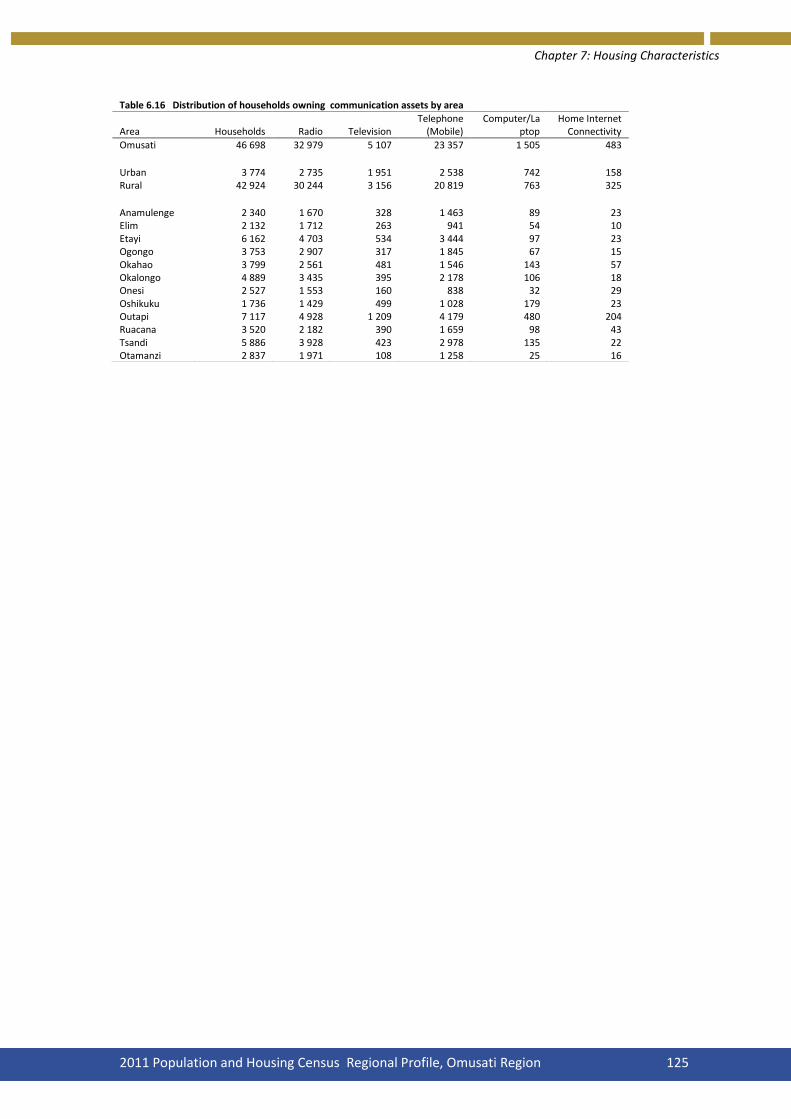
Chapter 7: Housing Characteristics
2011 Population and Housing Census Regional Profile, Omusati Region 125
Table 6.16 Distribution of households owning communication assets by area
Area Households Radio Television Telephone
(Mobile) Computer/La
ptop Home Internet
Connectivity
Omusati 46 698 32 979 5 107 23 357 1 505 483
Urban 3 774 2 735 1 951 2 538 742 158 Rural 42 924 30 244 3 156 20 819 763 325
Anamulenge 2 340 1 670 328 1 463 89 23 Elim 2 132 1 712 263 941 54 10 Etayi 6 162 4 703 534 3 444 97 23 Ogongo 3 753 2 907 317 1 845 67 15 Okahao 3 799 2 561 481 1 546 143 57 Okalongo 4 889 3 435 395 2 178 106 18 Onesi 2 527 1 553 160 838 32 29 Oshikuku 1 736 1 429 499 1 028 179 23 Outapi 7 117 4 928 1 209 4 179 480 204 Ruacana 3 520 2 182 390 1 659 98 43 Tsandi 5 886 3 928 423 2 978 135 22 Otamanzi 2 837 1 971 108 1 258 25 16

Chapter 7: Housing Characteristics
2011 Population and Housing Census Regional Profile, Omusati Region 126
Table 6.17 Households and population by main
Table 6.19 Households and population by main language spoken, Omusati
language spoken, Rural
Main Language Households Population
Main Language Households Population
Total 46 698 240791
Total 42 924 228 481 San languages 20 80
San languages 15 70
Caprivi languages 53 197
Caprivi languages 36 139 Herero languages 1 295 7033
Herero languages 1 143 6331
Kavango languages 48 172
Kavango languages 37 148 Nama/Damara languages 10 40
Nama/Damara languages 6 24
Oshiwambo languages 44 889 232031
Oshiwambo languages 41 463 220 946 Setswana 26 140
Setswana 26 140
Afrikaans 33 109
Afrikaans 13 51 German 8 18
German 3 10
English 213 610
English 113 353 Other European languages 63 243
Other European languages 49 202
Other African languages 25 80
Other African languages 16 50 Asian languages 10 25
Asian languages 3 12
Don't know 5 13
Don't know 1 5
Table 6.18 Households and population by main language spoken, Urban Main Language Households Population Total 3 774 12 310 San languages 5 10 Caprivi languages 17 58 Herero languages 152 702 Kavango languages 11 24 Nama/Damara languages 4 16 Oshiwambo languages 3 426 11 085 Setswana 0 0 Afrikaans 20 58 German 5 8 English 100 257 Other European languages 14 41 Other African languages 9 30 Asian languages 7 13 Don't know 4 8

Chapter 7: Housing Characteristics
2011 Population and Housing Census Regional Profile, Omusati Region 127
Table 7.1 Households and Population by tenure
Table 7.4 Households and Population by tenure status, Omusati
status, Anamulenge
Tenure status Households Population
Tenure status Households Population
Total 46 698 240 791
Total 2 340 13 301 Detached House 3 454 13 765
Detached House 219 824
Semi-Detached House 893 3 255
Semi-Detached House 54 181 Apartment/Flat 1 341 2 588
Apartment/Flat 76 142
Guest Flat 170 446
Guest Flat 1 10 Part Commercial/Industrial 159 590
Part Commercial/Industrial 3 6
Mobile Home 272 902
Mobile Home 30 76 Single Quarters 353 1 006
Single Quarters 7 44
Traditional Dwelling 39 475 216 513
Traditional Dwelling 1 921 11 939 Improvised Housing Unit (Shack) 498 1 368
Improvised Housing Unit (Shack) 29 79
Other 83 358
Other 0 0
Table 7.2 Households and Population by tenure
Table 7.5 Households and Population by tenure status, Urban
status, Elim
Tenure status Households Population
Tenure status Households Population
Total 3 774 12 310
Total 2 132 11 377 Detached House 1 689 5 871
Detached House 177 865
Semi-Detached House 449 1 437
Semi-Detached House 22 111 Apartment/Flat 699 1 237
Apartment/Flat 39 58
Guest Flat 91 188
Guest Flat 1 2 Part Commercial/Industrial 10 15
Part Commercial/Industrial 23 54
Mobile Home 47 138
Mobile Home 10 12 Single Quarters 119 271
Single Quarters 6 36
Traditional Dwelling 503 2 773
Traditional Dwelling 1 842 10 192 Improvised Housing Unit (Shack) 161 368
Improvised Housing Unit (Shack) 10 43
Other 6 12
Other 2 4
Table 7.3 Households and Population by tenure
Table 7.6 Households and Population by tenure status, Urban
status, Etayi
Tenure status Households Population
Tenure status Households Population
Total 42 924 228 481
Total 6 162 35 101 Detached House 1 765 7 894
Detached House 277 1 285
Semi-Detached House 444 1 818
Semi-Detached House 60 287 Apartment/Flat 642 1 351
Apartment/Flat 119 244
Guest Flat 79 258
Guest Flat 17 65 Part Commercial/Industrial 149 575
Part Commercial/Industrial 8 26
Mobile Home 225 764
Mobile Home 17 81 Single Quarters 234 735
Single Quarters 17 56
Traditional Dwelling 38 972 213 740
Traditional Dwelling 5 636 32 994 Improvised Housing Unit (Shack) 337 1 000
Improvised Housing Unit (Shack) 6 31
Other 77 346
Other 5 32

Chapter 7: Housing Characteristics
2011 Population and Housing Census Regional Profile, Omusati Region 128
Table 7.7 Households and Population by tenure
Table 7.10 Households and Population by tenure status, Ogongo
status, Onesi
Tenure status Households Population
Tenure status Households Population
Total 3 753 19 343
Total 2 527 13 110 Detached House 120 451
Detached House 116 338
Semi-Detached House 38 107
Semi-Detached House 15 50 Apartment/Flat 33 58
Apartment/Flat 60 115
Guest Flat 4 6
Guest Flat 13 47 Part Commercial/Industrial 1 8
Part Commercial/Industrial 20 101
Mobile Home 13 31
Mobile Home 16 64 Single Quarters 4 20
Single Quarters 25 72
Traditional Dwelling 3 518 18 567
Traditional Dwelling 2 224 12 244 Improvised Housing Unit (Shack) 3 6
Improvised Housing Unit (Shack) 32 64
Other 19 89
Other 6 15
Table 7.8 Households and Population by tenure
Table 7.11 Households and Population by tenure status, Okahao
status, Oshikuku
Tenure status Households Population
Tenure status Households Population
Total 3 799 17 266
Total 1 736 8 650 Detached House 281 1 087
Detached House 396 1 652
Semi-Detached House 141 448
Semi-Detached House 87 421 Apartment/Flat 160 266
Apartment/Flat 110 185
Guest Flat 16 48
Guest Flat 6 8 Part Commercial/Industrial 11 20
Part Commercial/Industrial 1 1
Mobile Home 12 49
Mobile Home 6 34 Single Quarters 9 24
Single Quarters 13 31
Traditional Dwelling 3 138 15 242
Traditional Dwelling 1 080 6 230 Improvised Housing Unit (Shack) 23 55
Improvised Housing Unit (Shack) 37 88
Other 8 27
Other 0 0
Table 7.9 Households and Population by tenure
Table 7.12 Households and Population by tenure status, Okalongo
status, Outapi
Tenure status Households Population
Tenure status Households Population
Total 4 889 30 463
Total 7 117 36 293 Detached House 200 1 023
Detached House 945 3 641
Semi-Detached House 52 197
Semi-Detached House 205 761 Apartment/Flat 73 140
Apartment/Flat 442 877
Guest Flat 7 16
Guest Flat 76 150 Part Commercial/Industrial 2 14
Part Commercial/Industrial 42 208
Mobile Home 23 47
Mobile Home 31 127 Single Quarters 39 103
Single Quarters 165 415
Traditional Dwelling 4 466 28 813
Traditional Dwelling 5 000 29 480 Improvised Housing Unit (Shack) 21 87
Improvised Housing Unit (Shack) 195 541
Other 6 23
Other 16 93
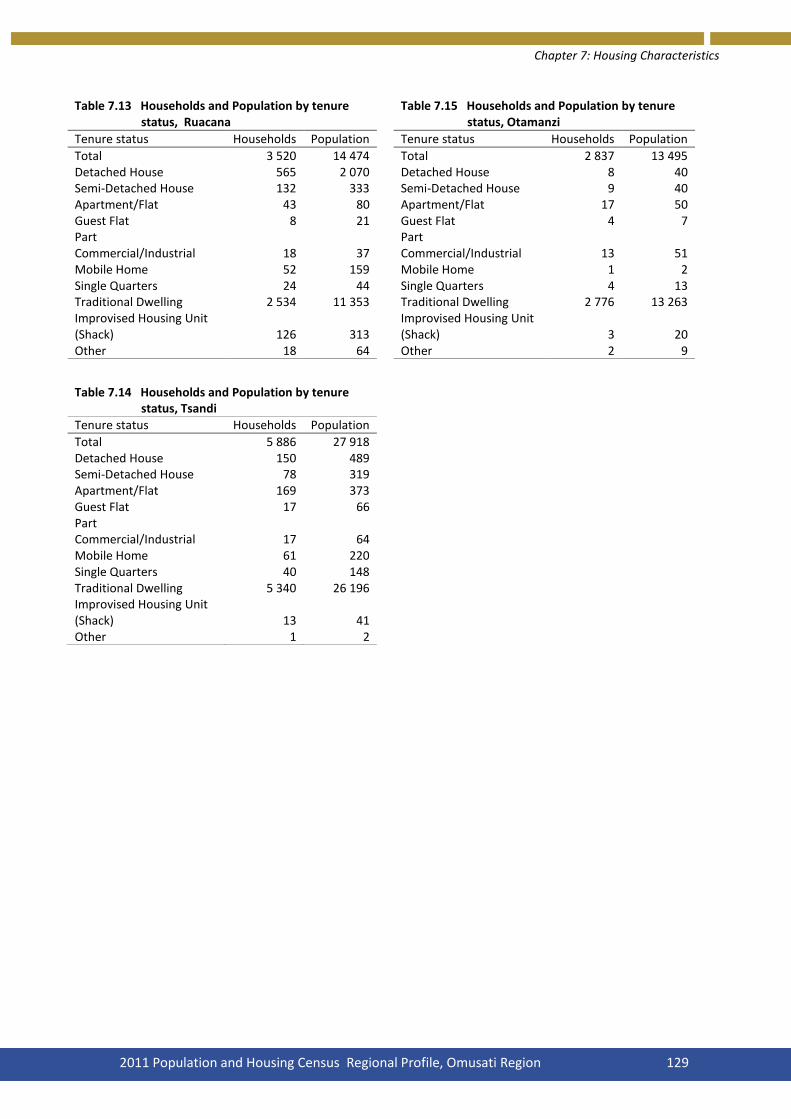
Chapter 7: Housing Characteristics
2011 Population and Housing Census Regional Profile, Omusati Region 129
Table 7.13 Households and Population by tenure
Table 7.15 Households and Population by tenure status, Ruacana
status, Otamanzi
Tenure status Households Population
Tenure status Households Population
Total 3 520 14 474
Total 2 837 13 495 Detached House 565 2 070
Detached House 8 40
Semi-Detached House 132 333
Semi-Detached House 9 40 Apartment/Flat 43 80
Apartment/Flat 17 50
Guest Flat 8 21
Guest Flat 4 7 Part Commercial/Industrial 18 37
Part Commercial/Industrial 13 51
Mobile Home 52 159
Mobile Home 1 2 Single Quarters 24 44
Single Quarters 4 13
Traditional Dwelling 2 534 11 353
Traditional Dwelling 2 776 13 263 Improvised Housing Unit (Shack) 126 313
Improvised Housing Unit (Shack) 3 20
Other 18 64
Other 2 9
Table 7.14 Households and Population by tenure status, Tsandi Tenure status Households Population Total 5 886 27 918 Detached House 150 489 Semi-Detached House 78 319 Apartment/Flat 169 373 Guest Flat 17 66 Part
Commercial/Industrial 17 64 Mobile Home 61 220 Single Quarters 40 148 Traditional Dwelling 5 340 26 196 Improvised Housing Unit
(Shack) 13 41 Other 1 2

Chapter 7: Housing Characteristics
2011 Population and Housing Census Regional Profile, Omusati Region 130
Table 7.19 Households and Population by main
Table 7.22 Households and Population by main
materials used for outer walls, Omusati
materials used for outer walls, Anamulenge
Main material Households Population
Main material Households Population
Total 46 698 240 791
Total 2 340 13 301 Cement Blocks/Brick 13 092 66 507
Cement Blocks/Brick 1 319 7 677
Burnt Bricks/Face Bricks 419 2 171
Burnt Bricks/Face Bricks 19 100 Mud/Day Bricks 4 355 25 804
Mud/Day Bricks 175 1 067
Corrugated Iron/Zinc 4 376 18 497
Corrugated Iron/Zinc 358 1 814 Prefabricated Materials 391 1 511
Prefabricated Materials 4 20
Wood Poles/Sticks or Grass/Reeds 22 128 116 141
Wood Poles/Sticks or Grass/Reeds 375 2 230
Sticks with Mud/Day Cow Dung 1 673 9 154
Sticks with Mud/Day Cow Dung 60 326
Tin 62 272
Tin 1 7 Other 202 734
Other 29 60
Table 7.20 Households and Population by main
Table 7.23 Households and Population by main materials used for outer walls, Urban
materials used for outer walls, Elim
Main material Households Population
Main material Households Population
Total 3 774 12 310
Total 2 132 11 377 Cement Blocks/Brick 2 674 8 472
Cement Blocks/Brick 706 3 883
Burnt Bricks/Face Bricks 65 166
Burnt Bricks/Face Bricks 5 28 Mud/Day Bricks 36 218
Mud/Day Bricks 33 200
Corrugated Iron/Zinc 663 1 768
Corrugated Iron/Zinc 242 1 230 Prefabricated Materials 41 117
Prefabricated Materials 11 52
Wood Poles/Sticks or Grass/Reeds 238 1 249
Wood Poles/Sticks or Grass/Reeds 1 076 5 671
Sticks with Mud/Day Cow Dung 51 305
Sticks with Mud/Day Cow Dung 30 189
Tin 4 11
Tin 25 112 Other 2 4
Other 4 12
Table 7.21 Households and Population by main
Table 7.24 Households and Population by main materials used for outer walls, Rural
materials used for outer walls, Etayi
Main material Households Population
Main material Households Population
Total 42 924 228 481
Total 6 162 35 101 Cement Blocks/Brick 10 418 58 035
Cement Blocks/Brick 2 140 12 471
Burnt Bricks/Face Bricks 354 2 005
Burnt Bricks/Face Bricks 40 238 Mud/Day Bricks 4 319 25 586
Mud/Day Bricks 1 630 9 232
Corrugated Iron/Zinc 3 713 16 729
Corrugated Iron/Zinc 312 1 491 Prefabricated Materials 350 1 394
Prefabricated Materials 61 289
Wood Poles/Sticks or Grass/Reeds 21 890 114 892
Wood Poles/Sticks or Grass/Reeds 1 791 10 341
Sticks with Mud/Day Cow Dung 1 622 8 849
Sticks with Mud/Day Cow Dung 172 970
Tin 58 261
Tin 5 19 Other 200 730
Other 11 50
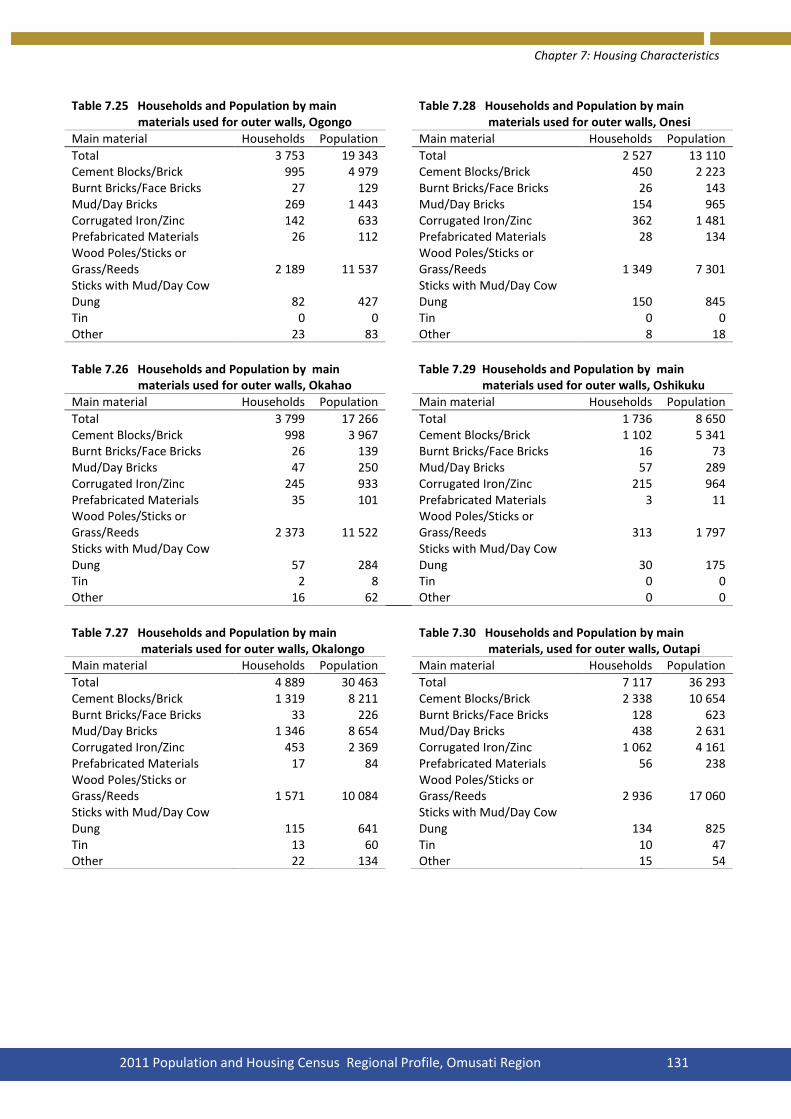
Chapter 7: Housing Characteristics
2011 Population and Housing Census Regional Profile, Omusati Region 131
Table 7.25 Households and Population by main
Table 7.28 Households and Population by main materials used for outer walls, Ogongo
materials used for outer walls, Onesi
Main material Households Population
Main material Households Population
Total 3 753 19 343
Total 2 527 13 110 Cement Blocks/Brick 995 4 979
Cement Blocks/Brick 450 2 223
Burnt Bricks/Face Bricks 27 129
Burnt Bricks/Face Bricks 26 143 Mud/Day Bricks 269 1 443
Mud/Day Bricks 154 965
Corrugated Iron/Zinc 142 633
Corrugated Iron/Zinc 362 1 481 Prefabricated Materials 26 112
Prefabricated Materials 28 134
Wood Poles/Sticks or Grass/Reeds 2 189 11 537
Wood Poles/Sticks or Grass/Reeds 1 349 7 301
Sticks with Mud/Day Cow Dung 82 427
Sticks with Mud/Day Cow Dung 150 845
Tin 0 0
Tin 0 0 Other 23 83
Other 8 18
Table 7.26 Households and Population by main
Table 7.29 Households and Population by main materials used for outer walls, Okahao
materials used for outer walls, Oshikuku
Main material Households Population
Main material Households Population
Total 3 799 17 266
Total 1 736 8 650 Cement Blocks/Brick 998 3 967
Cement Blocks/Brick 1 102 5 341
Burnt Bricks/Face Bricks 26 139
Burnt Bricks/Face Bricks 16 73 Mud/Day Bricks 47 250
Mud/Day Bricks 57 289
Corrugated Iron/Zinc 245 933
Corrugated Iron/Zinc 215 964 Prefabricated Materials 35 101
Prefabricated Materials 3 11
Wood Poles/Sticks or Grass/Reeds 2 373 11 522
Wood Poles/Sticks or Grass/Reeds 313 1 797
Sticks with Mud/Day Cow Dung 57 284
Sticks with Mud/Day Cow Dung 30 175
Tin 2 8
Tin 0 0 Other 16 62 Other 0 0
Table 7.27 Households and Population by main
Table 7.30 Households and Population by main materials used for outer walls, Okalongo
materials, used for outer walls, Outapi
Main material Households Population
Main material Households Population
Total 4 889 30 463
Total 7 117 36 293 Cement Blocks/Brick 1 319 8 211
Cement Blocks/Brick 2 338 10 654
Burnt Bricks/Face Bricks 33 226
Burnt Bricks/Face Bricks 128 623 Mud/Day Bricks 1 346 8 654
Mud/Day Bricks 438 2 631
Corrugated Iron/Zinc 453 2 369
Corrugated Iron/Zinc 1 062 4 161 Prefabricated Materials 17 84
Prefabricated Materials 56 238
Wood Poles/Sticks or Grass/Reeds 1 571 10 084
Wood Poles/Sticks or Grass/Reeds 2 936 17 060
Sticks with Mud/Day Cow Dung 115 641
Sticks with Mud/Day Cow Dung 134 825
Tin 13 60
Tin 10 47 Other 22 134
Other 15 54

Chapter 7: Housing Characteristics
2011 Population and Housing Census Regional Profile, Omusati Region 132
Table 7.31 Households and Population by main
Table 7.33 Households and Population by main materials used for outer walls, Ruacana
materials used for outer walls, Otamanzi
Main material Households Population
Main material Households Population
Total 3 520 14 474
Total 2 837 13 495 Cement Blocks/Brick 696 2 475
Cement Blocks/Brick 198 953 Burnt Bricks/Face Bricks 20 82
Burnt Bricks/Face Bricks 10 43 Mud/Day Bricks 75 361
Mud/Day Bricks 7 33 Corrugated Iron/Zinc 440 1 290
Corrugated Iron/Zinc 196 908 Prefabricated Materials 66 174
Prefabricated Materials 3 16 Wood Poles/Sticks or Grass/Reeds 1 500 6 301
Wood Poles/Sticks or Grass/Reeds 2 385 11 374
Sticks with Mud/Day Cow Dung 709 3 747
Sticks with Mud/Day Cow Dung 24 112
Tin 4 12
Tin 0 0 Other 10 32
Other 14 56
Table 7.32 Households and Population by main materials used for outer walls, Tsandi Main material Households Population Total 5 886 27 918 Cement Blocks/Brick 831 3 673 Burnt Bricks/Face Bricks 69 347 Mud/Day Bricks 124 679 Corrugated Iron/Zinc 349 1 223 Prefabricated Materials 81 280 Wood Poles/Sticks or
Grass/Reeds 4 270 20 923 Sticks with Mud/Day Cow
Dung 110 613 Tin 2 7 Other 50 173
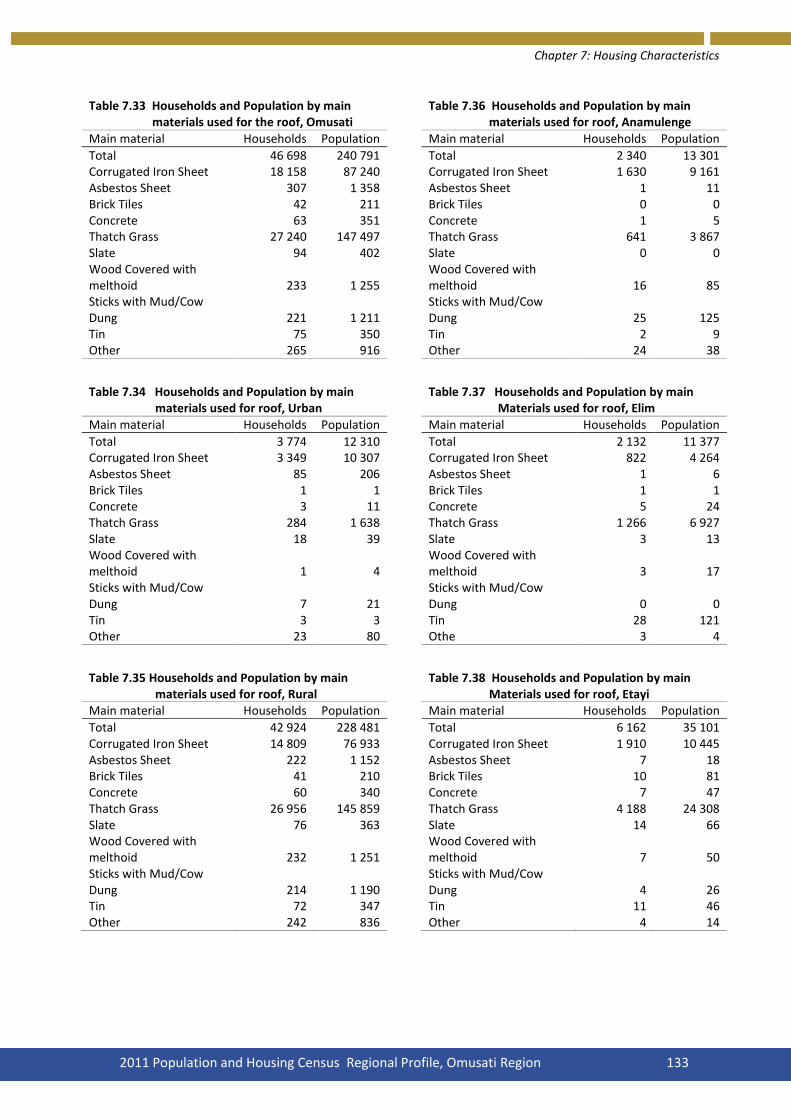
Chapter 7: Housing Characteristics
2011 Population and Housing Census Regional Profile, Omusati Region 133
Table 7.33 Households and Population by main
Table 7.36 Households and Population by main materials used for the roof, Omusati
materials used for roof, Anamulenge
Main material Households Population
Main material Households Population
Total 46 698 240 791
Total 2 340 13 301 Corrugated Iron Sheet 18 158 87 240
Corrugated Iron Sheet 1 630 9 161
Asbestos Sheet 307 1 358
Asbestos Sheet 1 11 Brick Tiles 42 211
Brick Tiles 0 0
Concrete 63 351
Concrete 1 5 Thatch Grass 27 240 147 497
Thatch Grass 641 3 867
Slate 94 402
Slate 0 0 Wood Covered with melthoid 233 1 255
Wood Covered with melthoid 16 85
Sticks with Mud/Cow Dung 221 1 211
Sticks with Mud/Cow Dung 25 125
Tin 75 350
Tin 2 9 Other 265 916
Other 24 38
Table 7.34 Households and Population by main
Table 7.37 Households and Population by main materials used for roof, Urban
Materials used for roof, Elim
Main material Households Population
Main material Households Population
Total 3 774 12 310
Total 2 132 11 377 Corrugated Iron Sheet 3 349 10 307
Corrugated Iron Sheet 822 4 264
Asbestos Sheet 85 206
Asbestos Sheet 1 6 Brick Tiles 1 1
Brick Tiles 1 1
Concrete 3 11
Concrete 5 24 Thatch Grass 284 1 638
Thatch Grass 1 266 6 927
Slate 18 39
Slate 3 13 Wood Covered with melthoid 1 4
Wood Covered with melthoid 3 17
Sticks with Mud/Cow Dung 7 21
Sticks with Mud/Cow Dung 0 0
Tin 3 3
Tin 28 121 Other 23 80
Othe 3 4
Table 7.35 Households and Population by main
Table 7.38 Households and Population by main materials used for roof, Rural
Materials used for roof, Etayi
Main material Households Population
Main material Households Population
Total 42 924 228 481
Total 6 162 35 101 Corrugated Iron Sheet 14 809 76 933
Corrugated Iron Sheet 1 910 10 445
Asbestos Sheet 222 1 152
Asbestos Sheet 7 18 Brick Tiles 41 210
Brick Tiles 10 81
Concrete 60 340
Concrete 7 47 Thatch Grass 26 956 145 859
Thatch Grass 4 188 24 308
Slate 76 363
Slate 14 66 Wood Covered with melthoid 232 1 251
Wood Covered with melthoid 7 50
Sticks with Mud/Cow Dung 214 1 190
Sticks with Mud/Cow Dung 4 26
Tin 72 347
Tin 11 46 Other 242 836
Other 4 14

Chapter 7: Housing Characteristics
2011 Population and Housing Census Regional Profile, Omusati Region 134
Table 7.39 Households and Population by main
Table 7.42 Households and Population by main Materials used for roof, Ogongo
Materials used for roof, Onesi
Main material Households Population
Main material Households Population
Total 3 753 19 343
Total 2 527 13 110 Corrugated Iron Sheet 1 175 5 741
Corrugated Iron Sheet 886 4 056
Asbestos Sheet 1 4
Asbestos Sheet 3 11 Brick Tiles 0 0
Brick Tiles 13 36
Concrete 11 74
Concrete 2 12 Thatch Grass 2 533 13 383
Thatch Grass 1 595 8 856
Slate 1 17
Slate 3 17 Wood Covered with melthoid 8 44
Wood Covered with melthoid 18 101
Sticks with Mud/Cow Dung 2 8
Sticks with Mud/Cow Dung 2 14
Tin 0 0
Tin 1 2 Other 22 72
Other 4 5
Table 7.40 Households and Population by main
Table 7.43 Households and Population by main Materials used for roof, Okahao
Materials used for roof, Oshikuku
Main material Households Population
Main material Households Population
Total 3 799 17 266
Total 1 736 8 650 Corrugated Iron Sheet 1 401 5 758
Corrugated Iron Sheet 1 240 5 810
Asbestos Sheet 47 131
Asbestos Sheet 3 15 Brick Tiles 0 0
Brick Tiles 1 6
Concrete 2 18
Concrete 0 0 Thatch Grass 2 236 10 865
Thatch Grass 460 2 621
Slate 12 55
Slate 3 19 Wood Covered with melthoid 5 21
Wood Covered with melthoid 24 161
Sticks with Mud/Cow Dung 11 53
Sticks with Mud/Cow Dung 3 9
Tin 2 9 Tin 1 1 Other 83 356
Other 1 8
Table 7.41 Households and Population by main
Table 7.44 Households and Population by main materials used for roof, Okalongo
materials used for roof, Outapi
Main material Households Population
Main material Households Population
Total 4 889 30 463
Total 7 117 36 293 Corrugated Iron Sheet 1 761 10 412
Corrugated Iron Sheet 3 693 16 656
Asbestos Sheet 7 41
Asbestos Sheet 83 393 Brick Tiles 3 25
Brick Tiles 5 24
Concrete 14 73
Concrete 8 60 Thatch Grass 2 983 19 111
Thatch Grass 3 242 18 799
Slate 3 18
Slate 28 80 Wood Covered with melthoid 62 446
Wood Covered with melthoid 12 84
Sticks with Mud/Cow Dung 38 223
Sticks with Mud/Cow Dung 14 68
Tin 13 90
Tin 4 23 Other 5 24
Other 28 106

Chapter 7: Housing Characteristics
2011 Population and Housing Census Regional Profile, Omusati Region 135
Table 7.46 Households and Population by main
Table 7.48 Households and Population by main materials used for roof, Ruacana
materials used for roof, Otamanzi
Main material Households
Population
Main material Household
s Populatio
n
Total 3 520 14 474
Total 2 837 13 495 Corrugated Iron Sheet 1 511 5 501
Corrugated Iron Sheet 404 1 862 Asbestos Sheet 32 97
Asbestos Sheet 5 16 Brick Tiles 2 7
Brick Tiles 2 12 Concrete 1 2
Concrete 3 13 Thatch Grass 1 738 7 888
Thatch Grass 2 385 11 399 Slate 5 13
Slate 2 10 Wood Covered with melthoid 46 98
Wood Covered with melthoid 13 79
Sticks with Mud/Cow Dung 114 652
Sticks with Mud/Cow Dung 3 11 Tin 4 6
Tin 8 42 Other 67 210
Other 12 51
Table 7.47 Households and Population by main materials used for roof, Tsandi
Main material Households Population
Total 5 886 27 918 Corrugated Iron Sheet 1 725 7 574 Asbestos Sheet 117 615 Brick Tiles 5 19 Concrete 9 23 Thatch Grass 3 973 19 473 Slate 20 94 Wood Covered with
melthoid 19 69 Sticks with Mud/Cow
Dung 5 22 Tin 1 1 Other 12 28

Chapter 7: Housing Characteristics
2011 Population and Housing Census Regional Profile, Omusati Region 136
Table 7.49 Households and Population by main
Table 7.52 Households and Population by main materials used for the floor, Omusati
materials used for floor, Anamulenge
Main material Households Population
Main material Households Population
Total 46 698 240 791
Total 2 340 13 301 Sand/Earth 27 157 140 707
Sand/Earth 778 4 497
Cement 12 744 65 241
Cement 1 240 7 228 Mud/Clay 4 166 24 498
Mud/Clay 157 938
Wood 159 752
Wood 1 4 Concrete 1 033 4 575
Concrete 93 397
Tiles (Ceramic/Wood/Plastic) 1 281 4 424
Tiles (Ceramic/Wood/Plastic) 44 177
Other 158 594
Other 27 60
Table 7.50 Households and Population by main
Table 7.53 Households and Population by main materials used for floor, Urban
materials used for floor, Elim
Main material Households Population
Main material Households Population
Total 3 774 12 310
Total 2 132 11 377 Sand/Earth 519 2 170
Sand/Earth 1 361 7 316
Cement 1 968 6 028
Cement 657 3 472 Mud/Clay 32 136
Mud/Clay 14 81
Wood 20 52
Wood 10 50 Concrete 296 910
Concrete 61 322
Tiles (Ceramic/Wood/Plastic) 934 3 003
Tiles (Ceramic/Wood/Plastic) 28 135
Other 5 11
Other 1 1
Table 7.51 Households and Population by main
Table 7.54 Households and Population by main materials used for floor, Rural
materials used for floor, Etayi
Main material Households Population
Main material Households Population
Total 42 924 228 481
Total 6 162 35 101 Sand/Earth 26 638 138 537
Sand/Earth 2 980 17 191
Cement 10 776 59 213
Cement 1 833 10 253 Mud/Clay 4 134 24 362
Mud/Clay 1 287 7 350
Wood 139 700
Wood 7 36 Concrete 737 3 665
Concrete 32 173
Tiles (Ceramic/Wood/Plastic) 347 1 421
Tiles (Ceramic/Wood/Plastic) 18 80
Other 153 583
Other 5 18
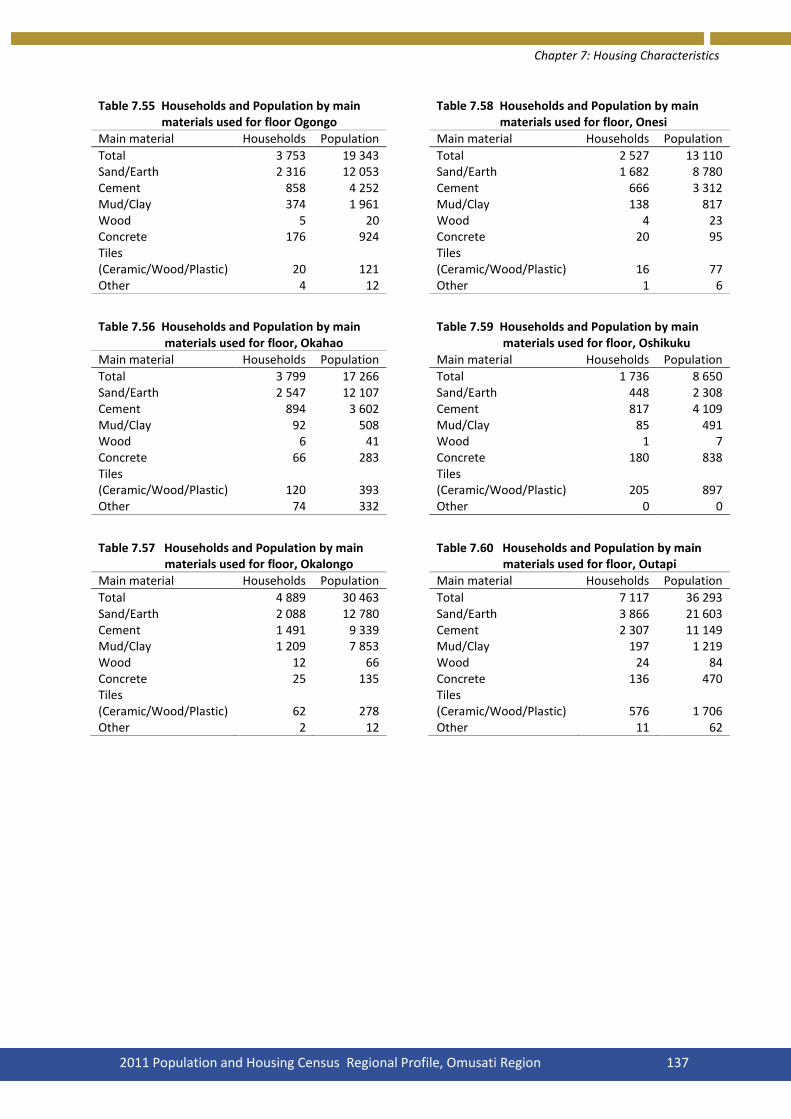
Chapter 7: Housing Characteristics
2011 Population and Housing Census Regional Profile, Omusati Region 137
Table 7.55 Households and Population by main
Table 7.58 Households and Population by main materials used for floor Ogongo
materials used for floor, Onesi
Main material Households Population
Main material Households Population
Total 3 753 19 343
Total 2 527 13 110 Sand/Earth 2 316 12 053
Sand/Earth 1 682 8 780
Cement 858 4 252
Cement 666 3 312 Mud/Clay 374 1 961
Mud/Clay 138 817
Wood 5 20
Wood 4 23 Concrete 176 924
Concrete 20 95
Tiles (Ceramic/Wood/Plastic) 20 121
Tiles (Ceramic/Wood/Plastic) 16 77
Other 4 12
Other 1 6
Table 7.56 Households and Population by main
Table 7.59 Households and Population by main materials used for floor, Okahao
materials used for floor, Oshikuku
Main material Households Population
Main material Households Population
Total 3 799 17 266
Total 1 736 8 650 Sand/Earth 2 547 12 107
Sand/Earth 448 2 308
Cement 894 3 602
Cement 817 4 109 Mud/Clay 92 508
Mud/Clay 85 491
Wood 6 41
Wood 1 7 Concrete 66 283
Concrete 180 838
Tiles (Ceramic/Wood/Plastic) 120 393
Tiles (Ceramic/Wood/Plastic) 205 897
Other 74 332
Other 0 0
Table 7.57 Households and Population by main
Table 7.60 Households and Population by main materials used for floor, Okalongo
materials used for floor, Outapi
Main material Households Population
Main material Households Population
Total 4 889 30 463
Total 7 117 36 293 Sand/Earth 2 088 12 780
Sand/Earth 3 866 21 603
Cement 1 491 9 339
Cement 2 307 11 149 Mud/Clay 1 209 7 853
Mud/Clay 197 1 219
Wood 12 66
Wood 24 84 Concrete 25 135
Concrete 136 470
Tiles (Ceramic/Wood/Plastic) 62 278
Tiles (Ceramic/Wood/Plastic) 576 1 706
Other 2 12
Other 11 62

Chapter 7: Housing Characteristics
2011 Population and Housing Census Regional Profile, Omusati Region 138
Table 7.61 Households and Population by main
Table 7.63 Households and Population by main materials used for floor, Ruacana
materials used for floor, Otamanzi
Main material Households Population
Main material Households Population
Total 3 520 14 474
Total 2 837 13 495 Sand/Earth 2 141 8 781
Sand/Earth 2 606 12 396 Cement 673 2 503
Cement 177 834 Mud/Clay 435 2 400
Mud/Clay 10 43 Wood 19 53
Wood 11 56 Concrete 145 421
Concrete 23 125 Tiles (Ceramic/Wood/Plastic) 89 259
Tiles (Ceramic/Wood/Plastic) 7 38
Other 18 57
Other 3 3
Table 7.62 Households and Population by main materials used for floor, Tsandi Main material Households Population Total 5 886 27 918 Sand/Earth 4 344 20 895 Cement 1 131 5 188 Mud/Clay 168 837 Wood 59 312 Concrete 76 392 Tiles
(Ceramic/Wood/Plastic) 96 263 Other 12 31

Chapter 7: Housing Characteristics
2011 Population and Housing Census Regional Profile, Omusati Region 139
Table 7.64 Households and Population by main
Table 7.67 Households and Population by main source of energy for cooking, Omusati
source of energy for cooking, Anamulenge
Energy for cooking Households Population
Energy for cooking Households Population
Total 46 698 240 791
Total 2 340 13 301 Electricity from Mains 3 068 8 260
Electricity from Mains 207 509
Electricity from Generator 139 465
Electricity from Generator 1 6
Gas 993 4 379
Gas 50 209 Paraffin/Kerosene 339 1 317
Paraffin/Kerosene 11 32
Wood/Charcoal from Wood 41 117 220 581
Wood/Charcoal from Wood 2 058 12 456
Charcoal-coal 248 1 296
Charcoal-coal 6 41 Animal Dung 717 4 179
Animal Dung 3 33
Solar Energy 25 116
Solar Energy 1 8 Other 52 198
Other 3 7
Table 7.65 Households and Population by main
Table 7.68 Households and Population by main source of energy for cooking, Urban
source of energy for cooking, Elim
Energy for cooking Households Population
Energy for cooking Households Population
Total 3 774 12 310
Total 2 132 11 377 Electricity from Mains 2 073 5 689
Electricity from Mains 71 172
Electricity from Generator 6 17
Electricity from Generator 1 2
Gas 279 951
Gas 82 439 Paraffin/Kerosene 105 185
Paraffin/Kerosene 7 35
Wood/Charcoal from Wood 1 255 5 282
Wood/Charcoal from Wood 1 543 8 160
Charcoal-coal 9 37
Charcoal-coal 14 78 Animal Dung 34 128
Animal Dung 412 2 478
Solar Energy 0 0
Solar Energy 0 0 Other 13 21
Other 2 13
Table 7.66 Households and Population by main
Table 7.69 Households and Population by main source of energy for cooking, Rural
source of energy for cooking, Etayi
Energy for cooking Households Population
Energy for cooking Households Population
Total 42 924 228 481
Total 6 162 35 101 Electricity from Mains 995 2 571
Electricity from Mains 122 311
Electricity from Generator 133 448
Electricity from Generator 4 12
Gas 714 3 428
Gas 110 511 Paraffin/Kerosene 234 1 132
Paraffin/Kerosene 25 103
Wood/Charcoal from Wood 39 862 215 299
Wood/Charcoal from Wood 5 776 33 403
Charcoal-coal 239 1 259
Charcoal-coal 14 82 Animal Dung 683 4 051
Animal Dung 107 662
Solar Energy 25 116
Solar Energy 1 1 Other 39 177
Other 3 16
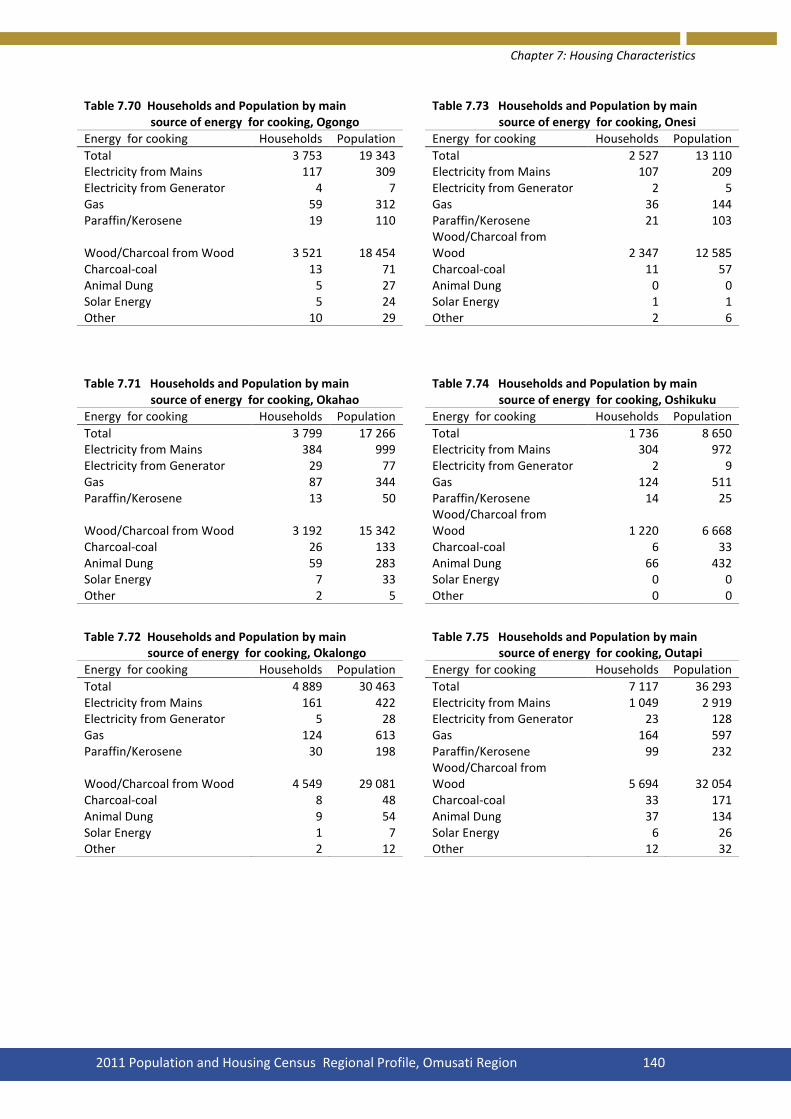
Chapter 7: Housing Characteristics
2011 Population and Housing Census Regional Profile, Omusati Region 140
Table 7.70 Households and Population by main
Table 7.73 Households and Population by main source of energy for cooking, Ogongo
source of energy for cooking, Onesi
Energy for cooking Households Population
Energy for cooking Households Population
Total 3 753 19 343
Total 2 527 13 110 Electricity from Mains 117 309
Electricity from Mains 107 209
Electricity from Generator 4 7
Electricity from Generator 2 5 Gas 59 312
Gas 36 144
Paraffin/Kerosene 19 110
Paraffin/Kerosene 21 103
Wood/Charcoal from Wood 3 521 18 454
Wood/Charcoal from Wood 2 347 12 585
Charcoal-coal 13 71
Charcoal-coal 11 57 Animal Dung 5 27
Animal Dung 0 0
Solar Energy 5 24
Solar Energy 1 1 Other 10 29
Other 2 6
Table 7.71 Households and Population by main
Table 7.74 Households and Population by main source of energy for cooking, Okahao
source of energy for cooking, Oshikuku
Energy for cooking Households Population
Energy for cooking Households Population
Total 3 799 17 266
Total 1 736 8 650 Electricity from Mains 384 999
Electricity from Mains 304 972
Electricity from Generator 29 77
Electricity from Generator 2 9 Gas 87 344
Gas 124 511
Paraffin/Kerosene 13 50
Paraffin/Kerosene 14 25
Wood/Charcoal from Wood 3 192 15 342
Wood/Charcoal from Wood 1 220 6 668
Charcoal-coal 26 133
Charcoal-coal 6 33 Animal Dung 59 283
Animal Dung 66 432
Solar Energy 7 33
Solar Energy 0 0 Other 2 5
Other 0 0
Table 7.72 Households and Population by main
Table 7.75 Households and Population by main source of energy for cooking, Okalongo
source of energy for cooking, Outapi
Energy for cooking Households Population
Energy for cooking Households Population
Total 4 889 30 463
Total 7 117 36 293 Electricity from Mains 161 422
Electricity from Mains 1 049 2 919
Electricity from Generator 5 28
Electricity from Generator 23 128 Gas 124 613
Gas 164 597
Paraffin/Kerosene 30 198
Paraffin/Kerosene 99 232
Wood/Charcoal from Wood 4 549 29 081
Wood/Charcoal from Wood 5 694 32 054
Charcoal-coal 8 48
Charcoal-coal 33 171 Animal Dung 9 54
Animal Dung 37 134
Solar Energy 1 7
Solar Energy 6 26 Other 2 12
Other 12 32

Chapter 7: Housing Characteristics
2011 Population and Housing Census Regional Profile, Omusati Region 141
Table 7.76 Households and Population by main
Table 7.78 Households and Population by main source of energy for cooking, Ruacana
source of energy for cooking, Otamanzi
Energy for cooking Households Population
Energy for cooking Households Population
Total 3 520 14 474
Total 2 837 13 495 Electricity from Mains 367 1 015
Electricity from Mains 14 26 Electricity from Generator 17 63
Electricity from Generator 1 5 Gas 58 252
Gas 16 84 Paraffin/Kerosene 16 54
Paraffin/Kerosene 6 17 Wood/Charcoal from Wood 3 039 12 980
Wood/Charcoal from Wood 2 739 13 099
Charcoal-coal 21 104
Charcoal-coal 53 244 Animal Dung 1 1
Animal Dung 8 20 Solar Energy 0 0
Solar Energy 0 0 Other 1 5
Other 0 0
Table 7.77 Households and Population by main source of energy for cooking, Tsandi Energy for cooking Households Population Total 5 886 27 918 Electricity from Mains 165 397 Electricity from Generator 50 123 Gas 83 363 Paraffin/Kerosene 78 358 Wood/Charcoal from
Wood 5 439 26 299 Charcoal-coal 43 234 Animal Dung 10 55 Solar Energy 3 16 Other 15 73

Chapter 7: Housing Characteristics
2011 Population and Housing Census Regional Profile, Omusati Region 142
Table 7.77 Households and Population by main
Table 7.80 Households and Population by main source of energy for lighting, Omusati
source of energy for lighting, Anamulenge
Energy for lighting Households Population
Energy for lighting Households Population
Total 46 698 240 791
Total 2 340 13 301 Electricity from Mains 4 263 14 206
Electricity from Mains 290 1 026
Electricity from Generator 466 2 257
Electricity from Generator 20 140
Gas 201 1 144
Gas 5 34 Paraffin/Kerosene 9 641 53 303
Paraffin/Kerosene 364 2 280
Wood/Charcoal from Wood 6 754 34 459
Wood/Charcoal from Wood 153 1 015
Charcoal-coal 59 267
Charcoal-coal 1 8 Candles 22 631 121 001
Candles 1 354 7 985
Animal Dung 89 406
Animal Dung 0 0 Solar Energy 658 3 845
Solar Energy 46 265
Other 1 936 9 903
Other 107 548
Table 7.78 Households and Population by main
Table 7.81 Households and Population by main
source of energy for lighting, Urban
source of energy for lighting, Elim
Energy for lighting Households Population
Energy for lighting Households Population
Total 3 774 12 310
Total 2 132 11 377 Electricity from Mains 2 477 7 536
Electricity from Mains 169 667
Electricity from Generator 8 29
Electricity from Generator 12 53
Gas 9 22
Gas 35 225 Paraffin/Kerosene 142 612
Paraffin/Kerosene 333 1 877
Wood/Charcoal from Wood 43 194
Wood/Charcoal from Wood 441 2 188
Charcoal-coal 0 0
Charcoal-coal 3 11 Candles 967 3 525
Candles 948 5 297
Animal Dung 13 27
Animal Dung 52 268 Solar Energy 16 69
Solar Energy 25 155
Other 99 296
Other 114 636
Table 7.79 Households and Population by main
Table 7.82 Households and Population by main
source of energy for lighting, Rural
source of energy for lighting, Etayi
Energy for lighting Households Population
Energy for lighting Households Population
Total 42 924 228 481
Total 6 162 35 101 Electricity from Mains 1 786 6 670
Electricity from Mains 208 748
Electricity from Generator 458 2 228
Electricity from Generator 58 284
Gas 192 1 122
Gas 31 188 Paraffin/Kerosene 9 499 52 691
Paraffin/Kerosene 1 603 9 448
Wood/Charcoal from Wood 6 711 34 265
Wood/Charcoal from Wood 413 2 344
Charcoal-coal 59 267
Charcoal-coal 0 0 Candles 21 664 117 476
Candles 3 531 20 118
Animal Dung 76 379
Animal Dung 1 4 Solar Energy 642 3 776
Solar Energy 109 730
Other 1 837 9 607
Other 208 1 237

Chapter 7: Housing Characteristics
2011 Population and Housing Census Regional Profile, Omusati Region 143
Table 7.83 Households and Population by main
Table 7.86 Households and Population by main source of energy for lighting, Ogongo
source of energy for lighting, Onesi
Energy for lighting Households Population
Energy for lighting Households Population
Total 3 753 19 343
Total 2 527 13 110 Electricity from Mains 190 665
Electricity from Mains 190 612
Electricity from Generator 41 191
Electricity from Generator 12 56 Gas 9 61
Gas 19 110
Paraffin/Kerosene 790 4 202
Paraffin/Kerosene 376 2 070 Wood/Charcoal from Wood 658 3 464
Wood/Charcoal from Wood 278 1 391
Charcoal-coal 1 5
Charcoal-coal 2 14 Candles 1 852 9 568
Candles 1 483 8 026
Animal Dung 1 1
Animal Dung 0 0 Solar Energy 79 467
Solar Energy 24 159
Other 132 719
Other 143 672
Table 7.84 Households and Population by main
Table 7.87 Households and Population by main source of energy for lighting, Okahao
source of energy for lighting, Oshikuku
Energy for lighting Households Population
Energy for lighting Households Population
Total 3 799 17 266
Total 1 736 8 650 Electricity from Mains 509 1 678
Electricity from Mains 482 1 868
Electricity from Generator 41 151
Electricity from Generator 7 53 Gas 14 63
Gas 6 34
Paraffin/Kerosene 706 3 540
Paraffin/Kerosene 233 1 266 Wood/Charcoal from Wood 828 3 730
Wood/Charcoal from Wood 260 1 454
Charcoal-coal 11 45
Charcoal-coal 2 9 Candles 1 510 7 187
Candles 583 3 123
Animal Dung 2 7
Animal Dung 2 15 Solar Energy 52 270
Solar Energy 18 109
Other 126 595
Other 143 719
Table 7.85 Households and Population by main
Table 7.88 Households and Population by main source of energy for lighting, Okalongo
source of energy for lighting, Outapi
Energy for lighting Households Population
Energy for lighting Households Population
Total 4 889 30 463
Total 7 117 36 293 Electricity from Mains 245 926
Electricity from Mains 1 181 3 597
Electricity from Generator 49 329
Electricity from Generator 47 290 Gas 32 191
Gas 23 117
Paraffin/Kerosene 1 409 9 329
Paraffin/Kerosene 754 4 569 Wood/Charcoal from Wood 600 3 724
Wood/Charcoal from Wood 624 3 592
Charcoal-coal 1 5
Charcoal-coal 3 24 Candles 2 403 14 993
Candles 4 037 21 806
Animal Dung 0 0
Animal Dung 28 106 Solar Energy 71 463
Solar Energy 99 574
Other 79 503
Other 321 1 618

Chapter 7: Housing Characteristics
2011 Population and Housing Census Regional Profile, Omusati Region 144
Table 7.89 Households and Population by main
Table 7.91 Households and Population by main source of energy for lighting, Ruacana
source of energy for lighting, Otamanzi
Energy for lighting Households Population
Energy for lighting Households Population
Total 3 520 14 474
Total 2 837 13 495 Electricity from Mains 498 1 479
Electricity from Mains 34 123 Electricity from Generator 77 336
Electricity from Generator 20 101
Gas 7 39
Gas 8 43 Paraffin/Kerosene 582 2 506
Paraffin/Kerosene 955 4 729 Wood/Charcoal from Wood 587 2 513
Wood/Charcoal from Wood 798 3 724
Charcoal-coal 2 3
Charcoal-coal 18 69 Candles 1 615 6 969
Candles 882 4 172 Animal Dung 0 0
Animal Dung 3 5 Solar Energy 43 168
Solar Energy 19 111 Other 109 461
Other 100 418
Table 7.90 Households and Population by main source of energy for lighting, Tsandi Energy for lighting Households Population Total 5 886 27 918 Electricity from Mains 267 817 Electricity from
Generator 82 273 Gas 12 39 Paraffin/Kerosene 1 536 7 487 Wood/Charcoal from
Wood 1 114 5 320 Charcoal-coal 15 74 Candles 2 433 11 757 Animal Dung 0 0 Solar Energy 73 374 Other 354 1 777

Chapter 7: Housing Characteristics
2011 Population and Housing Census Regional Profile, Omusati Region 145
Table 7.92 Households and Population by main
Table 7.95 Households and Population by main
source of energy for heating, Omusati
source of energy for heating, Anamulenge
Energy for heating Households Population
Energy for heating Households Population
Total 46 698 240 791
Total 2 340 13 301 Electricity from Mains 2 874 8 561
Electricity from Mains 188 506
Electricity from Generator 158 607
Electricity from Generator 7 33
Gas 469 2 129
Gas 20 89 Wood/Charcoal from Wood 36 588 196 327
Wood/Charcoal from Wood 1 928 11 647
Charcoal-Coal 407 2 221
Charcoal-Coal 10 72 Animal Dung 574 3 335
Animal Dung 2 23
Solar Energy 68 329
Solar Energy 2 7 None 5 493 26 999
None 177 904
Other 67 283
Other 6 20
Table 7.93 Households and Population by main
Table 7.96 Households and Population by main source of energy for heating, Urban
source of energy for heating, Elim
Energy for heating Households Population
Energy for heating Households Population
Total 3 774 12 310
Total 2 132 11 377 Electricity from Mains 1 873 5 557
Electricity from Mains 65 215
Electricity from Generator 6 24
Electricity from Generator 2 11
Gas 91 250
Gas 70 438 Wood/Charcoal from Wood 1 012 4 151
Wood/Charcoal from Wood 1 382 7 102
Charcoal-Coal 13 69
Charcoal-Coal 46 284 Animal Dung 29 120
Animal Dung 323 1 932
Solar Energy 1 2
Solar Energy 4 30 None 729 2 090
None 235 1 331
Other 20 47
Other 5 34
Table 7.94 Households and Population by main
Table 7.97 Households and Population by main source of energy for heating, Rural
source of energy for heating, Etayi
Energy for heating Households Population
Energy for heating Households Population
Total 42 924 228 481
Total 6 162 35 101 Electricity from Mains 1 001 3 004
Electricity from Mains 63 251
Electricity from Generator 152 583
Electricity from Generator 8 43
Gas 378 1 879
Gas 42 181 Wood/Charcoal from Wood 35 576 192 176
Wood/Charcoal from Wood 4 218 24 545
Charcoal-Coal 394 2 152
Charcoal-Coal 64 388 Animal Dung 545 3 215
Animal Dung 92 564
Solar Energy 67 327
Solar Energy 9 52 None 4 764 24 909
None 1 654 8 998
Other 47 236
Other 12 79
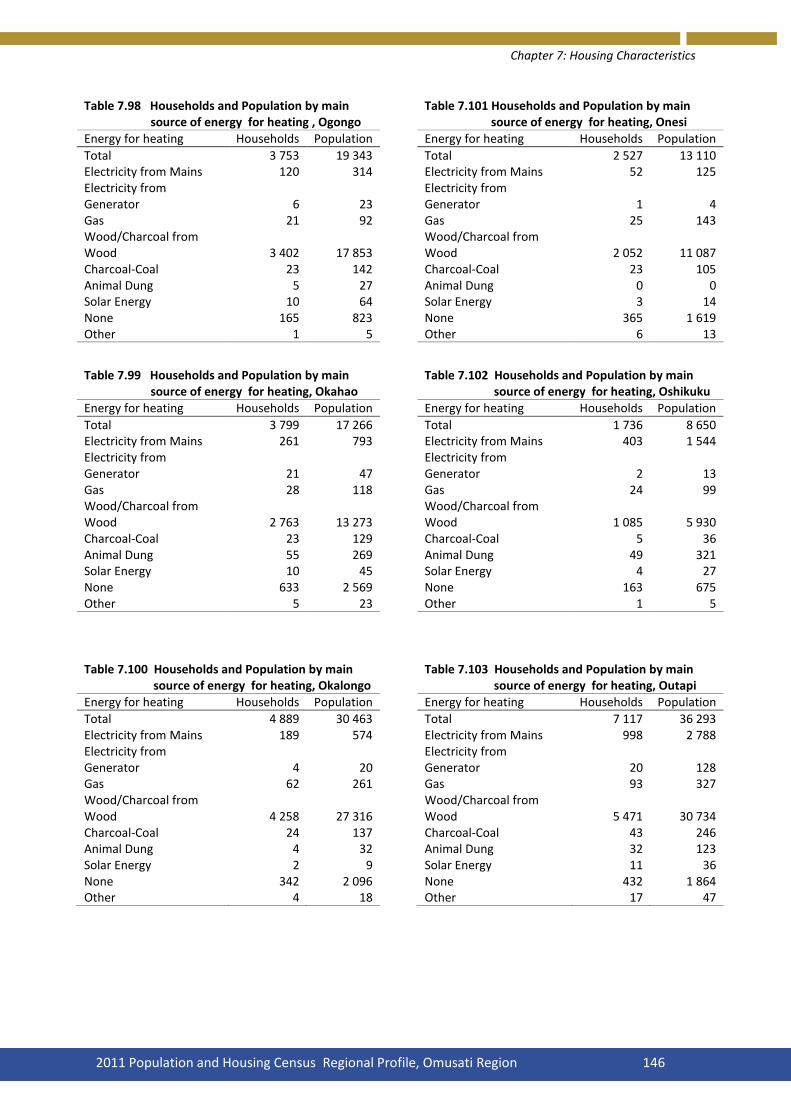
Chapter 7: Housing Characteristics
2011 Population and Housing Census Regional Profile, Omusati Region 146
Table 7.98 Households and Population by main
Table 7.101 Households and Population by main source of energy for heating , Ogongo
source of energy for heating, Onesi
Energy for heating Households Population
Energy for heating Households Population
Total 3 753 19 343
Total 2 527 13 110 Electricity from Mains 120 314
Electricity from Mains 52 125
Electricity from Generator 6 23
Electricity from Generator 1 4
Gas 21 92
Gas 25 143 Wood/Charcoal from Wood 3 402 17 853
Wood/Charcoal from Wood 2 052 11 087
Charcoal-Coal 23 142
Charcoal-Coal 23 105 Animal Dung 5 27
Animal Dung 0 0
Solar Energy 10 64
Solar Energy 3 14 None 165 823
None 365 1 619
Other 1 5
Other 6 13
Table 7.99 Households and Population by main
Table 7.102 Households and Population by main source of energy for heating, Okahao
source of energy for heating, Oshikuku
Energy for heating Households Population
Energy for heating Households Population
Total 3 799 17 266
Total 1 736 8 650 Electricity from Mains 261 793
Electricity from Mains 403 1 544
Electricity from Generator 21 47
Electricity from Generator 2 13
Gas 28 118
Gas 24 99 Wood/Charcoal from Wood 2 763 13 273
Wood/Charcoal from Wood 1 085 5 930
Charcoal-Coal 23 129
Charcoal-Coal 5 36 Animal Dung 55 269
Animal Dung 49 321
Solar Energy 10 45
Solar Energy 4 27 None 633 2 569
None 163 675
Other 5 23
Other 1 5
Table 7.100 Households and Population by main
Table 7.103 Households and Population by main source of energy for heating, Okalongo
source of energy for heating, Outapi
Energy for heating Households Population
Energy for heating Households Population
Total 4 889 30 463
Total 7 117 36 293 Electricity from Mains 189 574
Electricity from Mains 998 2 788
Electricity from Generator 4 20
Electricity from Generator 20 128
Gas 62 261
Gas 93 327 Wood/Charcoal from Wood 4 258 27 316
Wood/Charcoal from Wood 5 471 30 734
Charcoal-Coal 24 137
Charcoal-Coal 43 246 Animal Dung 4 32
Animal Dung 32 123
Solar Energy 2 9
Solar Energy 11 36 None 342 2 096
None 432 1 864
Other 4 18
Other 17 47

Chapter 7: Housing Characteristics
2011 Population and Housing Census Regional Profile, Omusati Region 147
Table 7.104 Households and Population by main
Table 7.106 Households and Population by main source of energy for heating, Ruacana
source of energy for heating, Otamanzi
Energy for heating Households Population
Energy for heating Households Population
Total 3 520 14 474
Total 2 837 13 495 Electricity from Mains 314 889
Electricity from Mains 6 6
Electricity from Generator 38 159
Electricity from Generator 0 0 Gas 22 95
Gas 8 45
Wood/Charcoal from Wood 2 567 10 771
Wood/Charcoal from Wood 2 299 11 012 Charcoal-Coal 40 168
Charcoal-Coal 45 202
Animal Dung 1 1
Animal Dung 5 7 Solar Energy 8 24
Solar Energy 1 4
None 528 2 360
None 470 2 204 Other 2 7
Other 3 15
Table 7.105 Households and Population by main source of energy for heating, Tsandi Energy for heating Households Population Total 5 886 27 918 Electricity from Mains 215 556 Electricity from Generator 49 126 Gas 54 241 Wood/Charcoal from Wood 5 163 25 057 Charcoal-Coal 61 312 Animal Dung 6 36 Solar Energy 4 17 None 329 1 556 Other 5 17
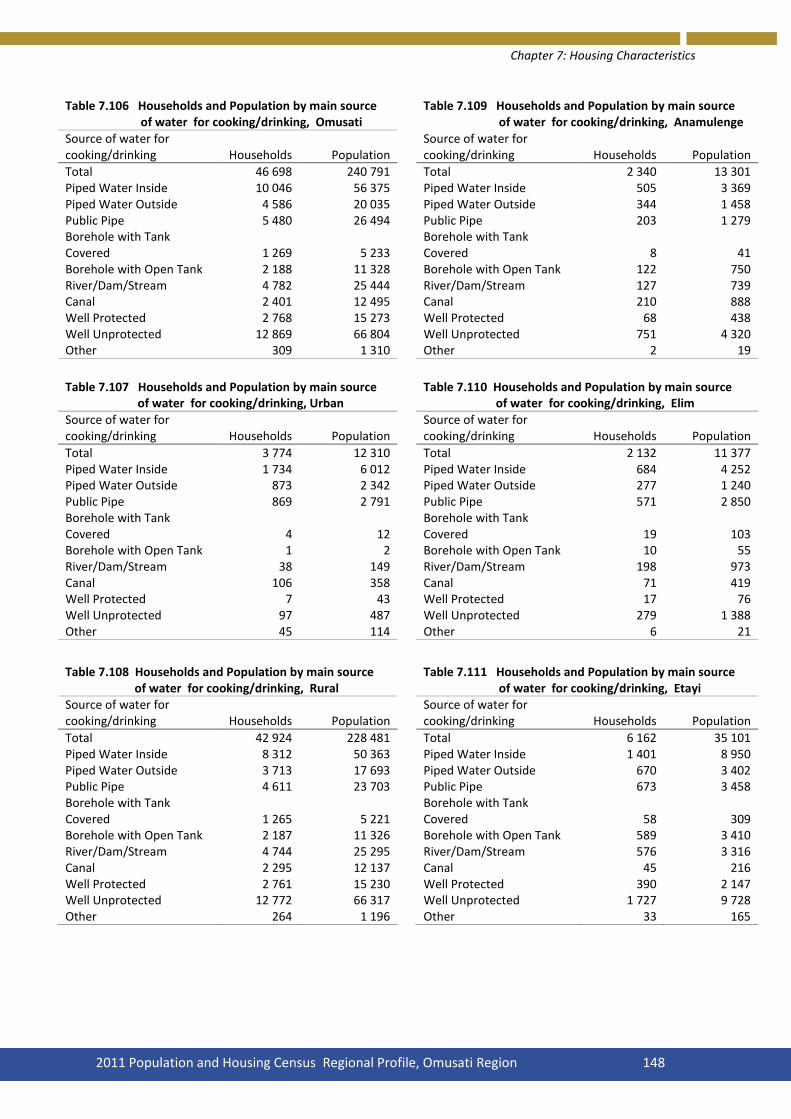
Chapter 7: Housing Characteristics
2011 Population and Housing Census Regional Profile, Omusati Region 148
Table 7.106 Households and Population by main source
Table 7.109 Households and Population by main source of water for cooking/drinking, Omusati
of water for cooking/drinking, Anamulenge
Source of water for cooking/drinking Households Population
Source of water for cooking/drinking Households Population
Total 46 698 240 791
Total 2 340 13 301 Piped Water Inside 10 046 56 375
Piped Water Inside 505 3 369
Piped Water Outside 4 586 20 035
Piped Water Outside 344 1 458 Public Pipe 5 480 26 494
Public Pipe 203 1 279
Borehole with Tank Covered 1 269 5 233
Borehole with Tank Covered 8 41
Borehole with Open Tank 2 188 11 328
Borehole with Open Tank 122 750 River/Dam/Stream 4 782 25 444
River/Dam/Stream 127 739
Canal 2 401 12 495
Canal 210 888 Well Protected 2 768 15 273
Well Protected 68 438
Well Unprotected 12 869 66 804
Well Unprotected 751 4 320 Other 309 1 310
Other 2 19
Table 7.107 Households and Population by main source
Table 7.110 Households and Population by main source
of water for cooking/drinking, Urban
of water for cooking/drinking, Elim
Source of water for cooking/drinking Households Population
Source of water for cooking/drinking Households Population
Total 3 774 12 310
Total 2 132 11 377 Piped Water Inside 1 734 6 012
Piped Water Inside 684 4 252
Piped Water Outside 873 2 342
Piped Water Outside 277 1 240 Public Pipe 869 2 791
Public Pipe 571 2 850
Borehole with Tank Covered 4 12
Borehole with Tank Covered 19 103
Borehole with Open Tank 1 2
Borehole with Open Tank 10 55 River/Dam/Stream 38 149
River/Dam/Stream 198 973
Canal 106 358
Canal 71 419 Well Protected 7 43
Well Protected 17 76
Well Unprotected 97 487
Well Unprotected 279 1 388 Other 45 114
Other 6 21
Table 7.108 Households and Population by main source
Table 7.111 Households and Population by main source
of water for cooking/drinking, Rural
of water for cooking/drinking, Etayi Source of water for cooking/drinking Households Population
Source of water for cooking/drinking Households Population
Total 42 924 228 481
Total 6 162 35 101 Piped Water Inside 8 312 50 363
Piped Water Inside 1 401 8 950
Piped Water Outside 3 713 17 693
Piped Water Outside 670 3 402 Public Pipe 4 611 23 703
Public Pipe 673 3 458
Borehole with Tank Covered 1 265 5 221
Borehole with Tank Covered 58 309
Borehole with Open Tank 2 187 11 326
Borehole with Open Tank 589 3 410 River/Dam/Stream 4 744 25 295
River/Dam/Stream 576 3 316
Canal 2 295 12 137
Canal 45 216 Well Protected 2 761 15 230
Well Protected 390 2 147
Well Unprotected 12 772 66 317
Well Unprotected 1 727 9 728 Other 264 1 196
Other 33 165
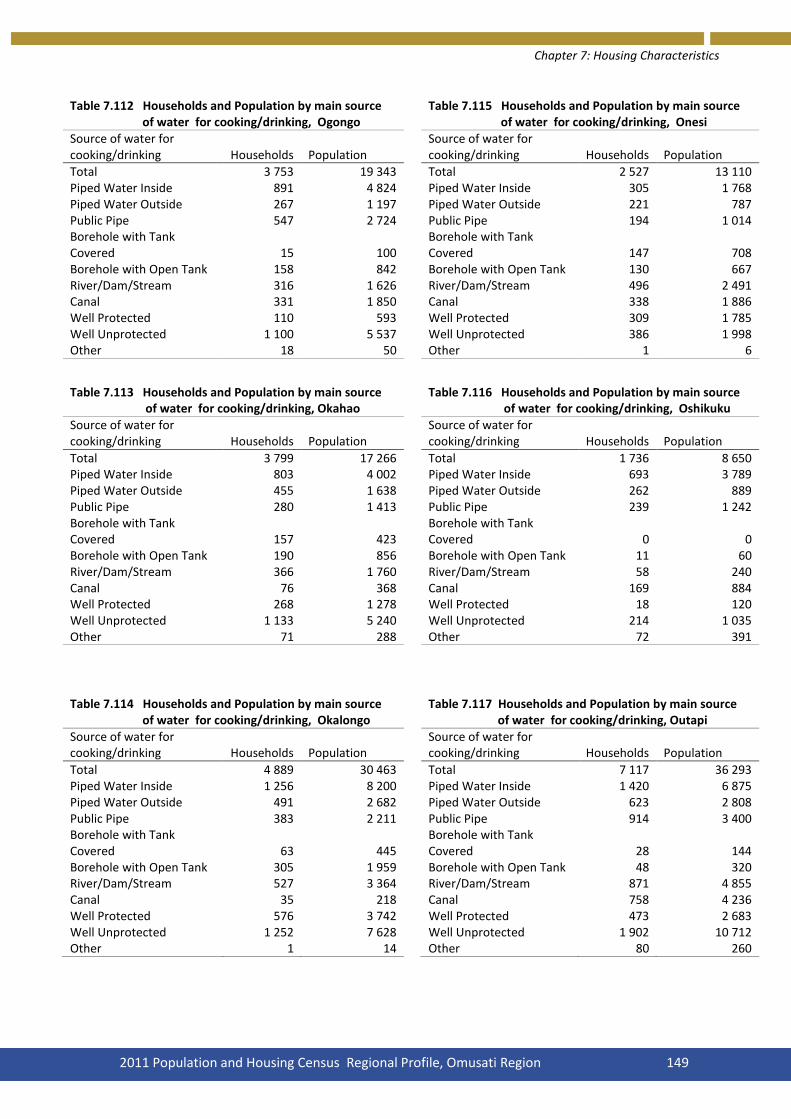
Chapter 7: Housing Characteristics
2011 Population and Housing Census Regional Profile, Omusati Region 149
Table 7.112 Households and Population by main source
Table 7.115 Households and Population by main source of water for cooking/drinking, Ogongo
of water for cooking/drinking, Onesi
Source of water for cooking/drinking Households Population
Source of water for cooking/drinking Households Population
Total 3 753 19 343
Total 2 527 13 110 Piped Water Inside 891 4 824
Piped Water Inside 305 1 768
Piped Water Outside 267 1 197
Piped Water Outside 221 787 Public Pipe 547 2 724
Public Pipe 194 1 014
Borehole with Tank Covered 15 100
Borehole with Tank Covered 147 708
Borehole with Open Tank 158 842
Borehole with Open Tank 130 667 River/Dam/Stream 316 1 626
River/Dam/Stream 496 2 491
Canal 331 1 850
Canal 338 1 886 Well Protected 110 593
Well Protected 309 1 785
Well Unprotected 1 100 5 537
Well Unprotected 386 1 998 Other 18 50
Other 1 6
Table 7.113 Households and Population by main source
Table 7.116 Households and Population by main source of water for cooking/drinking, Okahao
of water for cooking/drinking, Oshikuku
Source of water for cooking/drinking Households Population
Source of water for cooking/drinking Households Population
Total 3 799 17 266
Total 1 736 8 650 Piped Water Inside 803 4 002
Piped Water Inside 693 3 789
Piped Water Outside 455 1 638
Piped Water Outside 262 889 Public Pipe 280 1 413
Public Pipe 239 1 242
Borehole with Tank Covered 157 423
Borehole with Tank Covered 0 0
Borehole with Open Tank 190 856
Borehole with Open Tank 11 60 River/Dam/Stream 366 1 760
River/Dam/Stream 58 240
Canal 76 368
Canal 169 884 Well Protected 268 1 278
Well Protected 18 120
Well Unprotected 1 133 5 240
Well Unprotected 214 1 035 Other 71 288
Other 72 391
Table 7.114 Households and Population by main source
Table 7.117 Households and Population by main source of water for cooking/drinking, Okalongo
of water for cooking/drinking, Outapi
Source of water for cooking/drinking Households Population
Source of water for cooking/drinking Households Population
Total 4 889 30 463
Total 7 117 36 293 Piped Water Inside 1 256 8 200
Piped Water Inside 1 420 6 875
Piped Water Outside 491 2 682
Piped Water Outside 623 2 808 Public Pipe 383 2 211
Public Pipe 914 3 400
Borehole with Tank Covered 63 445
Borehole with Tank Covered 28 144
Borehole with Open Tank 305 1 959
Borehole with Open Tank 48 320 River/Dam/Stream 527 3 364
River/Dam/Stream 871 4 855
Canal 35 218
Canal 758 4 236 Well Protected 576 3 742
Well Protected 473 2 683
Well Unprotected 1 252 7 628
Well Unprotected 1 902 10 712 Other 1 14
Other 80 260
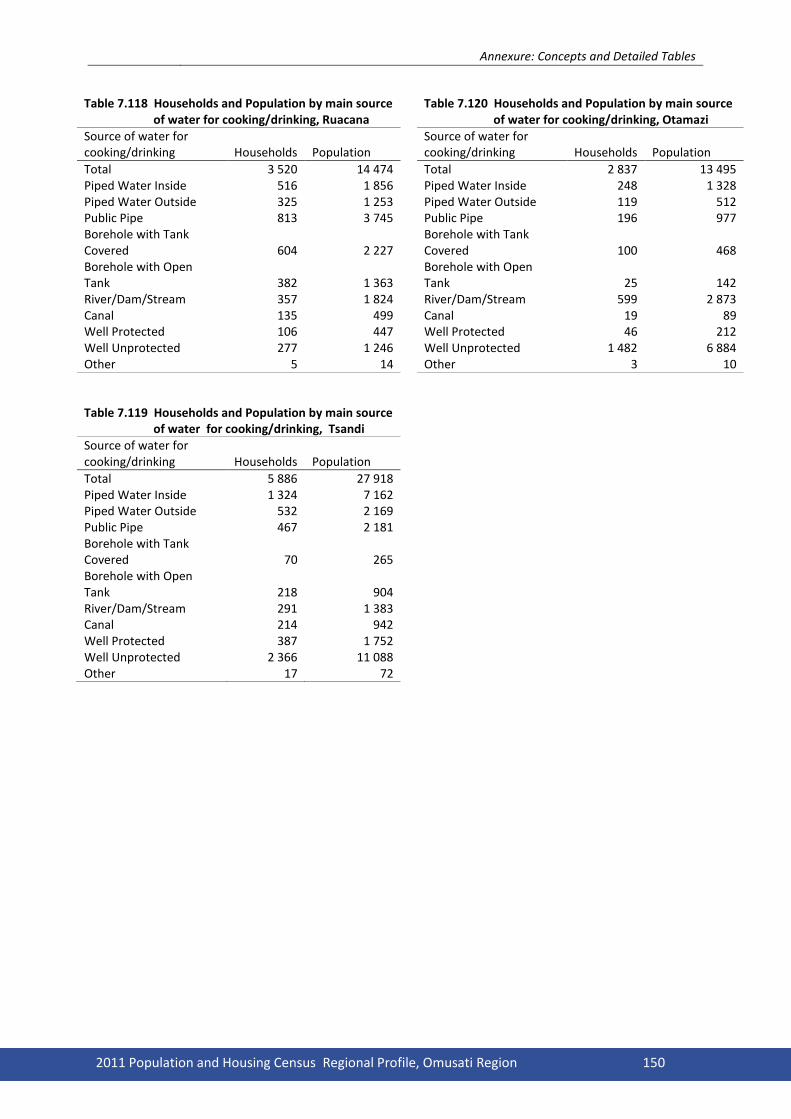
Annexure: Concepts and Detailed Tables
2011 Population and Housing Census Regional Profile, Omusati Region 150
Table 7.118 Households and Population by main source
Table 7.120 Households and Population by main source of water for cooking/drinking, Ruacana
of water for cooking/drinking, Otamazi
Source of water for cooking/drinking Households Population
Source of water for cooking/drinking Households Population
Total 3 520 14 474
Total 2 837 13 495 Piped Water Inside 516 1 856
Piped Water Inside 248 1 328 Piped Water Outside 325 1 253
Piped Water Outside 119 512 Public Pipe 813 3 745
Public Pipe 196 977 Borehole with Tank Covered 604 2 227
Borehole with Tank Covered 100 468
Borehole with Open Tank 382 1 363
Borehole with Open Tank 25 142
River/Dam/Stream 357 1 824
River/Dam/Stream 599 2 873 Canal 135 499
Canal 19 89 Well Protected 106 447
Well Protected 46 212 Well Unprotected 277 1 246
Well Unprotected 1 482 6 884 Other 5 14
Other 3 10
Table 7.119 Households and Population by main source of water for cooking/drinking, Tsandi Source of water for
cooking/drinking Households Population Total 5 886 27 918 Piped Water Inside 1 324 7 162 Piped Water Outside 532 2 169 Public Pipe 467 2 181 Borehole with Tank
Covered 70 265 Borehole with Open
Tank 218 904 River/Dam/Stream 291 1 383 Canal 214 942 Well Protected 387 1 752 Well Unprotected 2 366 11 088 Other 17 72
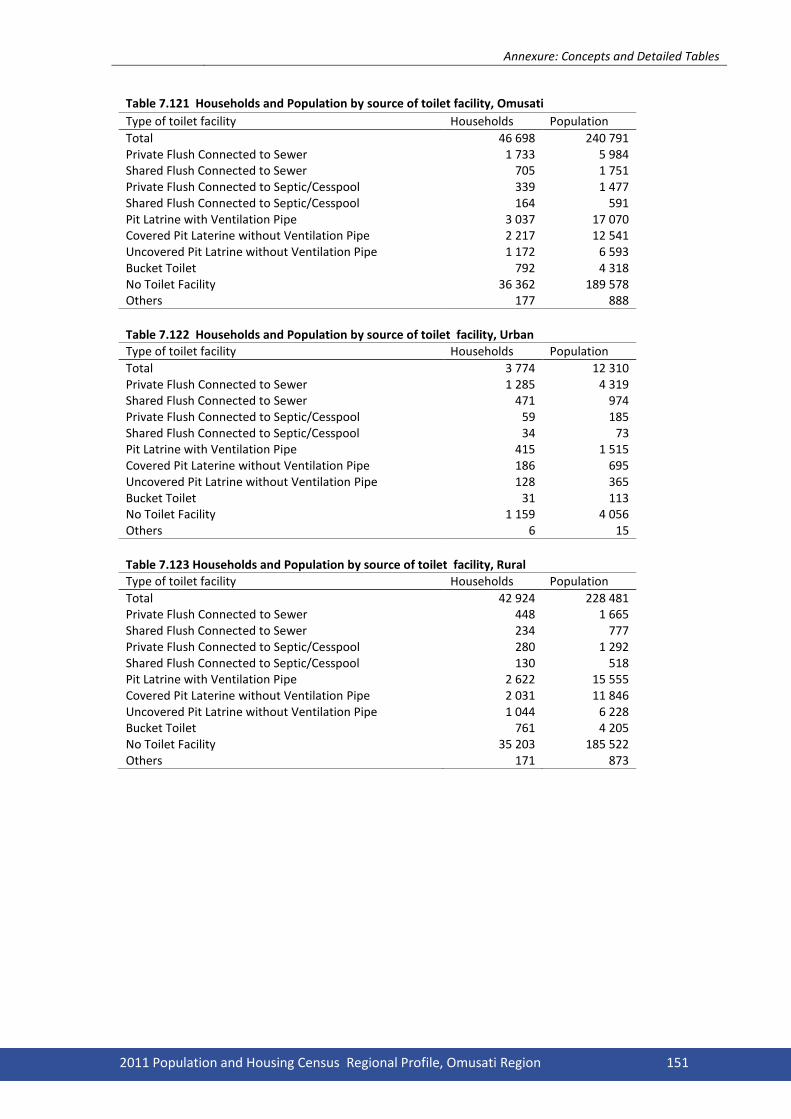
Annexure: Concepts and Detailed Tables
2011 Population and Housing Census Regional Profile, Omusati Region 151
Table 7.121 Households and Population by source of toilet facility, Omusati
Type of toilet facility Households Population
Total 46 698 240 791 Private Flush Connected to Sewer 1 733 5 984 Shared Flush Connected to Sewer 705 1 751 Private Flush Connected to Septic/Cesspool 339 1 477 Shared Flush Connected to Septic/Cesspool 164 591 Pit Latrine with Ventilation Pipe 3 037 17 070 Covered Pit Laterine without Ventilation Pipe 2 217 12 541 Uncovered Pit Latrine without Ventilation Pipe 1 172 6 593 Bucket Toilet 792 4 318 No Toilet Facility 36 362 189 578 Others 177 888
Table 7.122 Households and Population by source of toilet facility, Urban
Type of toilet facility Households Population
Total 3 774 12 310 Private Flush Connected to Sewer 1 285 4 319 Shared Flush Connected to Sewer 471 974 Private Flush Connected to Septic/Cesspool 59 185 Shared Flush Connected to Septic/Cesspool 34 73 Pit Latrine with Ventilation Pipe 415 1 515 Covered Pit Laterine without Ventilation Pipe 186 695 Uncovered Pit Latrine without Ventilation Pipe 128 365 Bucket Toilet 31 113 No Toilet Facility 1 159 4 056 Others 6 15
Table 7.123 Households and Population by source of toilet facility, Rural
Type of toilet facility Households Population
Total 42 924 228 481 Private Flush Connected to Sewer 448 1 665 Shared Flush Connected to Sewer 234 777 Private Flush Connected to Septic/Cesspool 280 1 292 Shared Flush Connected to Septic/Cesspool 130 518 Pit Latrine with Ventilation Pipe 2 622 15 555 Covered Pit Laterine without Ventilation Pipe 2 031 11 846 Uncovered Pit Latrine without Ventilation Pipe 1 044 6 228 Bucket Toilet 761 4 205 No Toilet Facility 35 203 185 522 Others 171 873
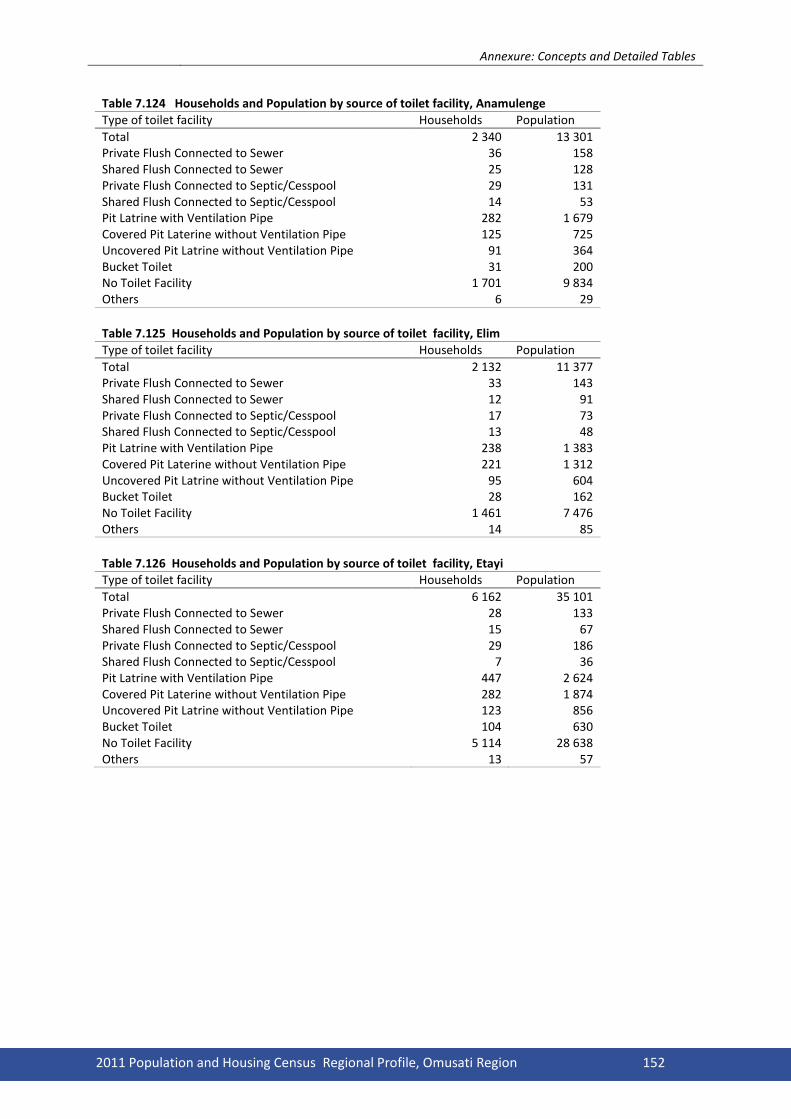
Annexure: Concepts and Detailed Tables
2011 Population and Housing Census Regional Profile, Omusati Region 152
Table 7.124 Households and Population by source of toilet facility, Anamulenge
Type of toilet facility Households Population
Total 2 340 13 301 Private Flush Connected to Sewer 36 158 Shared Flush Connected to Sewer 25 128 Private Flush Connected to Septic/Cesspool 29 131 Shared Flush Connected to Septic/Cesspool 14 53 Pit Latrine with Ventilation Pipe 282 1 679 Covered Pit Laterine without Ventilation Pipe 125 725 Uncovered Pit Latrine without Ventilation Pipe 91 364 Bucket Toilet 31 200 No Toilet Facility 1 701 9 834 Others 6 29
Table 7.125 Households and Population by source of toilet facility, Elim
Type of toilet facility Households Population
Total 2 132 11 377 Private Flush Connected to Sewer 33 143 Shared Flush Connected to Sewer 12 91 Private Flush Connected to Septic/Cesspool 17 73 Shared Flush Connected to Septic/Cesspool 13 48 Pit Latrine with Ventilation Pipe 238 1 383 Covered Pit Laterine without Ventilation Pipe 221 1 312 Uncovered Pit Latrine without Ventilation Pipe 95 604 Bucket Toilet 28 162 No Toilet Facility 1 461 7 476 Others 14 85
Table 7.126 Households and Population by source of toilet facility, Etayi Type of toilet facility Households Population
Total 6 162 35 101 Private Flush Connected to Sewer 28 133 Shared Flush Connected to Sewer 15 67 Private Flush Connected to Septic/Cesspool 29 186 Shared Flush Connected to Septic/Cesspool 7 36 Pit Latrine with Ventilation Pipe 447 2 624 Covered Pit Laterine without Ventilation Pipe 282 1 874 Uncovered Pit Latrine without Ventilation Pipe 123 856 Bucket Toilet 104 630 No Toilet Facility 5 114 28 638 Others 13 57

Annexure: Concepts and Detailed Tables
2011 Population and Housing Census Regional Profile, Omusati Region 153
Table 7.127 Households and Population by source of toilet facility, Ogongo
Type of toilet facility Households Population
Total 3 753 19 343 Private Flush Connected to Sewer 59 158 Shared Flush Connected to Sewer 4 8 Private Flush Connected to Septic/Cesspool 62 253 Shared Flush Connected to Septic/Cesspool 3 10 Pit Latrine with Ventilation Pipe 243 1 328 Covered Pit Laterine without Ventilation Pipe 237 1 330 Uncovered Pit Latrine without Ventilation Pipe 82 517 Bucket Toilet 132 713 No Toilet Facility 2 916 14 977 Others 15 49
Table 7.128 Households and Population by source of toilet facility, Okahao
Type of toilet facility Households Population
Total 3 799 17 266 Private Flush Connected to Sewer 222 691 Shared Flush Connected to Sewer 114 219 Private Flush Connected to Septic/Cesspool 28 165 Shared Flush Connected to Septic/Cesspool 28 108 Pit Latrine with Ventilation Pipe 192 1 038 Covered Pit Laterine without Ventilation Pipe 238 1 184 Uncovered Pit Latrine without Ventilation Pipe 186 1 015 Bucket Toilet 83 440 No Toilet Facility 2 697 12 365 Others 11 41
Table 7.129 Households and Population by source of toilet facility, Okalongo Type of toilet facility Households Population
Total 4 889 30 463 Private Flush Connected to Sewer 42 170 Shared Flush Connected to Sewer 5 37 Private Flush Connected to Septic/Cesspool 73 307 Shared Flush Connected to Septic/Cesspool 9 36 Pit Latrine with Ventilation Pipe 328 2 273 Covered Pit Laterine without Ventilation Pipe 205 1 458 Uncovered Pit Latrine without Ventilation Pipe 97 618 Bucket Toilet 94 546 No Toilet Facility 4 030 24 973 Others 6 45

Annexure: Concepts and Detailed Tables
2011 Population and Housing Census Regional Profile, Omusati Region 154
Table 7.130 Households and Population by source of toilet facility, by source of toilet facility, Onesi
Type of toilet facility Households Population
Total 2 527 13 110 Private Flush Connected to Sewer 54 185 Shared Flush Connected to Sewer 31 77 Private Flush Connected to Septic/Cesspool 7 17 Shared Flush Connected to Septic/Cesspool 18 78 Pit Latrine with Ventilation Pipe 108 507 Covered Pit Laterine without Ventilation Pipe 98 550 Uncovered Pit Latrine without Ventilation Pipe 125 764 Bucket Toilet 18 108 No Toilet Facility 2 008 10 516 Others 60 308
Table 7.131 Households and Population by source of toilet facility, Oshikuku
Type of toilet facility Households Population
Total 1 736 8 650 Private Flush Connected to Sewer 289 1 216 Shared Flush Connected to Sewer 38 76 Private Flush Connected to Septic/Cesspool 26 135 Shared Flush Connected to Septic/Cesspool 6 21 Pit Latrine with Ventilation Pipe 208 1 132 Covered Pit Laterine without Ventilation Pipe 149 809 Uncovered Pit Latrine without Ventilation Pipe 35 201 Bucket Toilet 11 60 No Toilet Facility 971 4 991 Others 3 9
Table 7.132 Households and Population by source of toilet facility, Outapi
Type of toilet facility Households Population
Total 7 117 36 293 Private Flush Connected to Sewer 540 1 756 Shared Flush Connected to Sewer 253 565 Private Flush Connected to Septic/Cesspool 38 103 Shared Flush Connected to Septic/Cesspool 40 121 Pit Latrine with Ventilation Pipe 472 2 409 Covered Pit Laterine without Ventilation Pipe 247 1 222 Uncovered Pit Latrine without Ventilation Pipe 127 580 Bucket Toilet 130 723 No Toilet Facility 5 253 28 695 Others 17 119
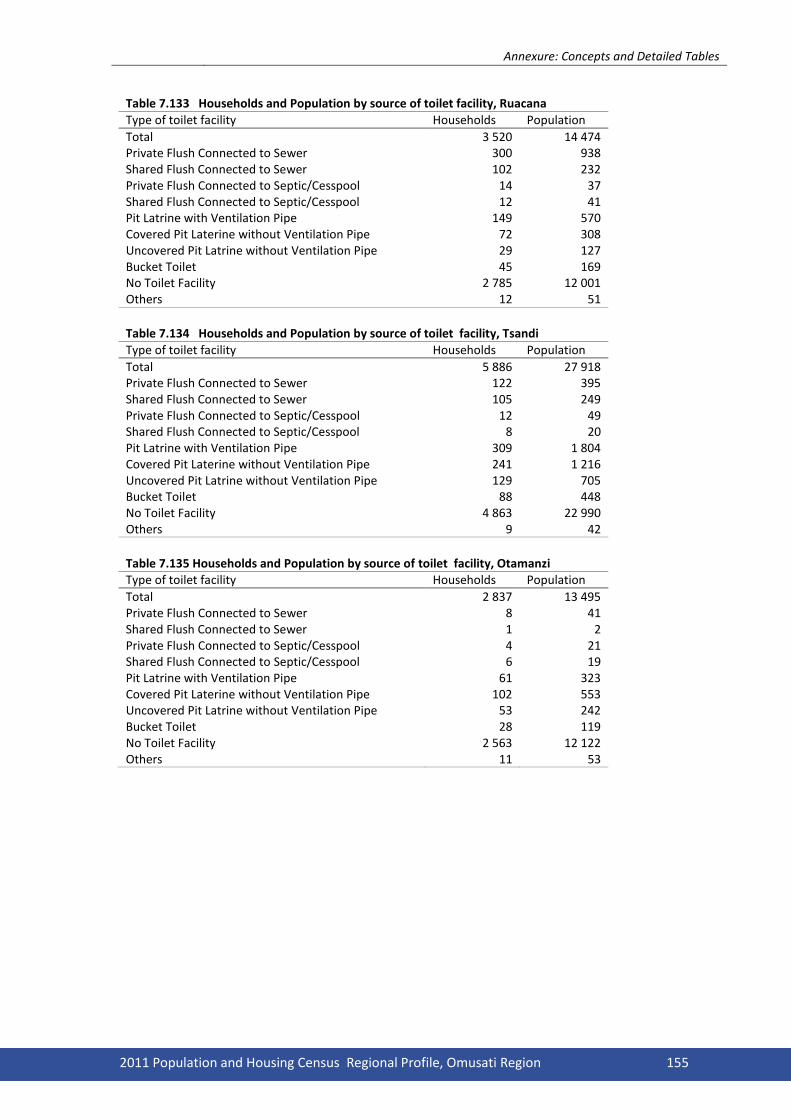
Annexure: Concepts and Detailed Tables
2011 Population and Housing Census Regional Profile, Omusati Region 155
Table 7.133 Households and Population by source of toilet facility, Ruacana
Type of toilet facility Households Population
Total 3 520 14 474 Private Flush Connected to Sewer 300 938 Shared Flush Connected to Sewer 102 232 Private Flush Connected to Septic/Cesspool 14 37 Shared Flush Connected to Septic/Cesspool 12 41 Pit Latrine with Ventilation Pipe 149 570 Covered Pit Laterine without Ventilation Pipe 72 308 Uncovered Pit Latrine without Ventilation Pipe 29 127 Bucket Toilet 45 169 No Toilet Facility 2 785 12 001 Others 12 51
Table 7.134 Households and Population by source of toilet facility, Tsandi
Type of toilet facility Households Population
Total 5 886 27 918 Private Flush Connected to Sewer 122 395 Shared Flush Connected to Sewer 105 249 Private Flush Connected to Septic/Cesspool 12 49 Shared Flush Connected to Septic/Cesspool 8 20 Pit Latrine with Ventilation Pipe 309 1 804 Covered Pit Laterine without Ventilation Pipe 241 1 216 Uncovered Pit Latrine without Ventilation Pipe 129 705 Bucket Toilet 88 448 No Toilet Facility 4 863 22 990 Others 9 42
Table 7.135 Households and Population by source of toilet facility, Otamanzi Type of toilet facility Households Population
Total 2 837 13 495 Private Flush Connected to Sewer 8 41 Shared Flush Connected to Sewer 1 2 Private Flush Connected to Septic/Cesspool 4 21 Shared Flush Connected to Septic/Cesspool 6 19 Pit Latrine with Ventilation Pipe 61 323 Covered Pit Laterine without Ventilation Pipe 102 553 Uncovered Pit Latrine without Ventilation Pipe 53 242 Bucket Toilet 28 119 No Toilet Facility 2 563 12 122 Others 11 53

Annexure: Concepts and Detailed Tables
2011 Population and Housing Census Regional Profile, Omusati Region 156
Table 7.136 Households and Population by means of waste/garbage disposal, Omusati
Table 7.139 Households and Population by means of waste/garbage disposaly, Anamulenge
Means of waste/garbage disposal Households Population
Means of waste/garbage disposal Households Population
Total 46 698 240 791
Total 2 340 13 301 Regularly Collected 2 903 8 704
Regularly Collected 5 13
Irregularly Collected 1 779 9 082
Irregularly Collected 12 78 Burning 29 253 155 694
Burning 1 704 9 687
Roadside Dumping 5 170 26 825
Roadside Dumping 142 854 Rubbish Pit 5 349 28 358
Rubbish Pit 395 2 157
Others 2 244 12 128
Others 82 512
Table 7.137 Households and Population by means of waste/garbage disposal, Urban
Table 7.140 Households and Population by means of waste/garbage disposaly, Elim
Means of waste/garbage disposal Households Population
Means of waste/garbage disposal Households Population
Total 3 774 12 310
Total 2 132 11 377 Regularly Collected 2 211 6 460
Regularly Collected 9 44
Irregularly Collected 245 725
Irregularly Collected 93 555 Burning 925 3 846
Burning 1 590 8 448
Roadside Dumping 124 330
Roadside Dumping 129 708 Rubbish Pit 254 886
Rubbish Pit 202 1 038
Others 15 63
Others 109 584
Table 7.138 Households and Population by means of waste/garbage disposal, Rural
Table 7.141 Households and Population by means of waste/garbage disposal, Etayi
Means of waste/garbage disposal Households Population
Means of waste/garbage disposal Households Population
Total 42 924 228 481
Total 6 162 35 101 Regularly Collected 692 2 244
Regularly Collected 144 386
Irregularly Collected 1 534 8 357
Irregularly Collected 331 1 989 Burning 28 328 151 848
Burning 4 210 24 341
Roadside Dumping 5 046 26 495
Roadside Dumping 680 3 786 Rubbish Pit 5 095 27 472
Rubbish Pit 598 3 504
Others 2 229 12 065
Others 199 1 095

Annexure: Concepts and Detailed Tables
2011 Population and Housing Census Regional Profile, Omusati Region 157
Table 7.142 Households and Population by means of waste/garbage disposal, Ogongo
Table 7.145 Households and Population by means of waste/garbage disposal, Onesi
Means of waste/garbage disposal Households Population
Means of waste/garbage disposal Households Population
Total 3 753 19 343
Total 2 527 13 110 Regularly Collected 137 597
Regularly Collected 68 228
Irregularly Collected 236 1 210
Irregularly Collected 186 974 Burning 2 645 13 722
Burning 1 232 6 512
Roadside Dumping 203 1 049
Roadside Dumping 420 2 116 Rubbish Pit 358 1 822
Rubbish Pit 397 2 052
Others 174 943
Others 224 1 228
Table 7.143 Households and Population by means of waste/garbage disposaly, Okahao
Table 7.146 Households and Population by means of waste/garbage disposal, Oshikuku
Means of waste/garbage disposal Households Population
Means of waste/garbage disposal Households Population
Total 3 799 17 266
Total 1 736 8 650 Regularly Collected 240 626
Regularly Collected 439 1 613
Irregularly Collected 218 679
Irregularly Collected 109 606 Burning 2 566 12 375
Burning 946 5 156
Roadside Dumping 269 1 129
Roadside Dumping 41 216 Rubbish Pit 417 2 037
Rubbish Pit 160 842
Others 89 420
Others 41 217
Table 7.144 Households and Population by means of waste/garbage disposal, Okalongo
Table 7.147 Households and Population by means of waste/garbage disposal, Outapi
Means of waste/garbage disposal Households Population
Means of waste/garbage disposal Households Population
Total 4 889 30 463
Total 7 117 36 293 Regularly Collected 143 400
Regularly Collected 1 058 3 008
Irregularly Collected 182 981
Irregularly Collected 145 752 Burning 3 272 20 498
Burning 3 431 19 428
Roadside Dumping 626 4 185
Roadside Dumping 1 003 5 111 Rubbish Pit 438 2 925
Rubbish Pit 1 150 6 224
Others 228 1 474
Others 330 1 770

Annexure: Concepts and Detailed Tables
2011 Population and Housing Census Regional Profile, Omusati Region 158
Table 7.148 Households and Population by means of waste/garbage disposal, Ruacana
Table 7.150 Households and Population by means of waste/garbage disposal, Otamanzi
Means of waste/garbage disposal Households Population
Means of waste/garbage disposal Households Population
Total 3 520 14 474
Total 2 837 13 495 Regularly Collected 433 1 204
Regularly Collected 5 25
Irregularly Collected 40 140
Irregularly Collected 69 299 Burning 2 062 9 018
Burning 1 952 9 199
Roadside Dumping 614 2 658
Roadside Dumping 309 1 486 Rubbish Pit 335 1 305
Rubbish Pit 364 1 809
Others 36 149
Others 138 677 Table 7.149 Households and Population by means of waste/garbage disposal, Tsandi
Means of waste/garbage disposal Households Population
Total 5 886 27 918
Regularly Collected 222 560
Irregularly Collected 158 819 Burning 3 643 17 310 Roadside Dumping 734 3 527 Rubbish Pit 535 2 643 Others 594 3 059

Annexure: Concepts and Detailed Tables
2011 Population and Housing Census Regional Profile, Omusati Region 159


