61
2011 Smith Travel Research, Inc. 1 Southern Lodging Summit 2011 Jan D. Freitag Senior Vice President
| Date post: | 31-Dec-2015 |
| Category: |
Documents |
| Upload: | abigail-miles |
| View: | 214 times |
| Download: | 0 times |

2011 Smith Travel Research, Inc. 1
Southern Lodging Summit 2011
Jan D. Freitag
Senior Vice President
2011 Smith Travel Research, Inc. 2
Agenda• US Hotel Trends• Chain Scale Trends• Segmentation• US Forecast• Memphis Trends• AH&LA Channel Study – A First Look
Smith Travel Research, Inc. and/or STR Global, Ltd. (collectively for these purposes, “STR”) are the exclusive owners of all rights in these Industry Presentations and their content. Reproduction of all or a portion of these presentations for any purpose without prior approval of STR is strictly prohibited.
2011 Smith Travel Research, Inc. 3
2011 / 2012
Recovery? Or Recovery!
2011 Smith Travel Research, Inc. 4
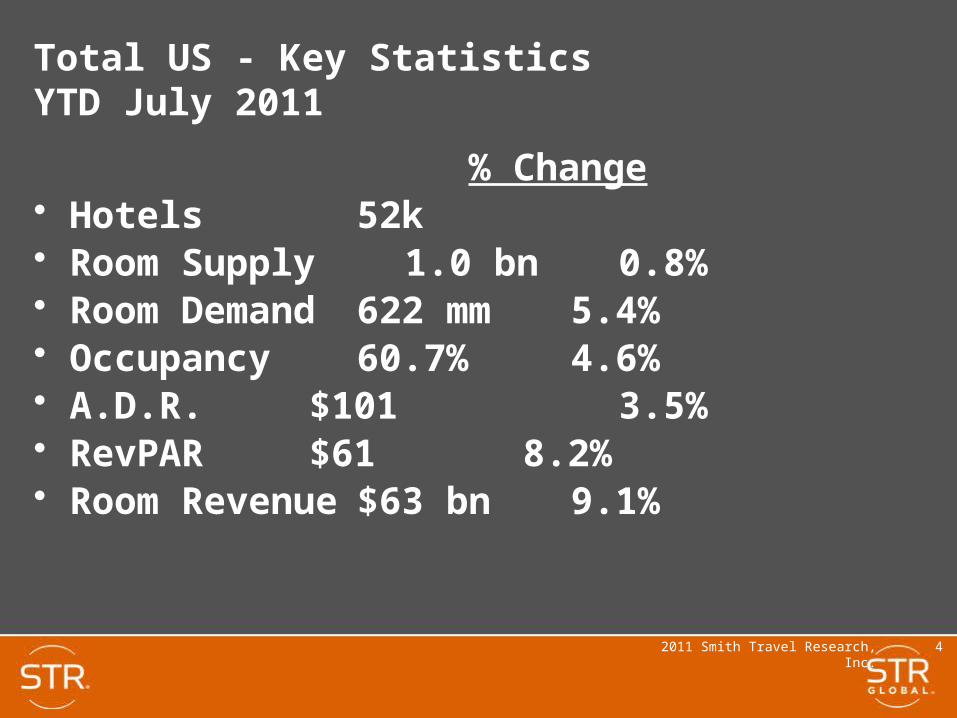
Total US - Key StatisticsYTD July 2011
% Change• Hotels 52k • Room Supply 1.0 bn 0.8%• Room Demand 622 mm 5.4%• Occupancy 60.7% 4.6%• A.D.R. $101 3.5%• RevPAR $61 8.2%• Room Revenue $63 bn 9.1%

2011 Smith Travel Research, Inc. 5
19891990199119921993199419951996199719981999200020012002200320042005200620072008200920102011-9
-6
-3
0
3
6
9
Supply Demand
Strongest Demand Rebound Ever. Supply Line Turning
- 6.9%
-0.9%
- 4.7%
*Total US, Supply & Demand % Change, 12 MMA 1/89 – 7/11
6.5%
2011 Smith Travel Research, Inc. 6
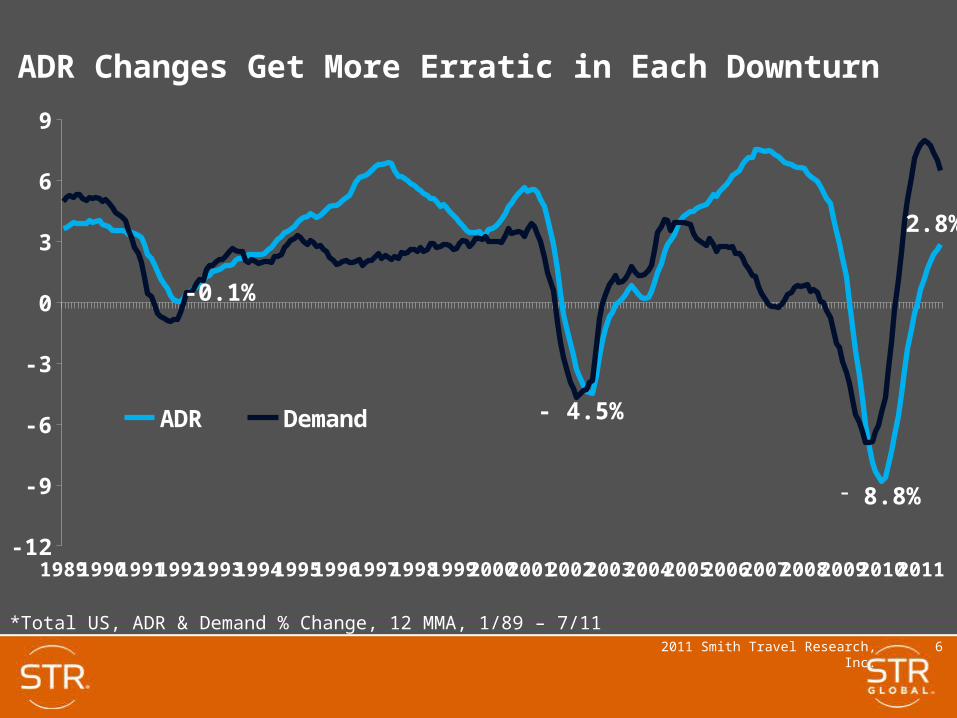
19891990199119921993199419951996199719981999200020012002200320042005200620072008200920102011-12
-9
-6
-3
0
3
6
9
ADR Demand
ADR Changes Get More Erratic in Each Downturn
- 8.8%
-0.1%
- 4.5%
*Total US, ADR & Demand % Change, 12 MMA, 1/89 – 7/11
2.8%

2011 Smith Travel Research, Inc. 7
$85.10 $83.90 $82.68 $82.79 $86.25 $91.06 $97.98 $104.26 $107.30 $98.17 $98.08 $102.21 $109.16
$85.11 $87.52
$88.91 $90.92
$93.36
$96.53
$99.64
$102.48
$106.41 $106.04 $107.63
$109.46 $111.54
Nominal ADR
Yr 2000, Grown by CPI
If year 2000 ADR had increased by CPI each year…
Note: 2011 & 2012 CPI forecast from Blue Chip Economic Indicators
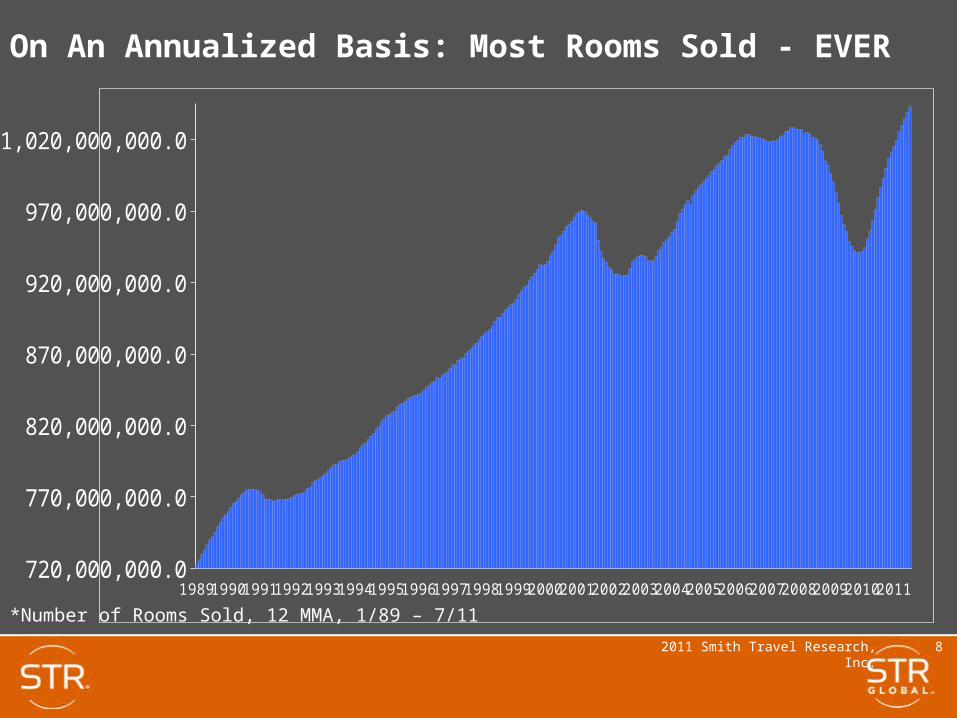
2011 Smith Travel Research, Inc. 8
On An Annualized Basis: Most Rooms Sold - EVER
19891990199119921993199419951996199719981999200020012002200320042005200620072008200920102011720,000,000.0
770,000,000.0
820,000,000.0
870,000,000.0
920,000,000.0
970,000,000.0
1,020,000,000.0
*Number of Rooms Sold, 12 MMA, 1/89 – 7/11
2011 Smith Travel Research, Inc. 9
Chain Scales

2011 Smith Travel Research, Inc. 10
• Luxury – Four Seasons, Ritz Carlton, W Hotels, InterContinental
• Upper Upscale – Hyatt, Embassy Suites, Hilton, Marriott, Sheraton
• Upscale – Hyatt Place, Hilton Garden Inn, Courtyard, Hotel Indigo
• Upper Midscale – Best Western PLUS/Premier, Hampton Inn
• Midscale – Best Western, Country Inn & Suites, La Quinta Inn
• Economy – America’s Best Inn, Econolodge, Red Roof, Days Inn
2011 STR Chain Scales(Selected chains from each segment)
2011 Smith Travel Research, Inc. 11
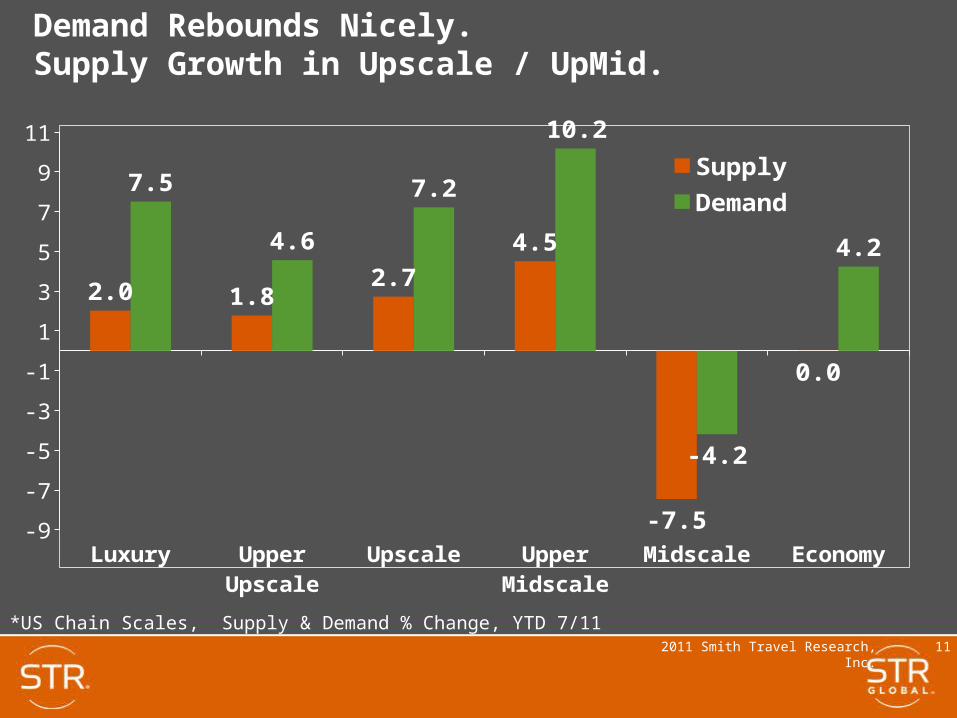
Demand Rebounds Nicely.Supply Growth in Upscale / UpMid.
Luxury Upper Upscale
Upscale Upper Midscale
Midscale Economy-9
-7
-5
-3
-1
1
3
5
7
9
11
2.0 1.82.7
4.5
-7.5
0.0
7.5
4.6
7.2
10.2
-4.2
4.2
Supply
Demand
*US Chain Scales, Supply & Demand % Change, YTD 7/11
2011 Smith Travel Research, Inc. 12
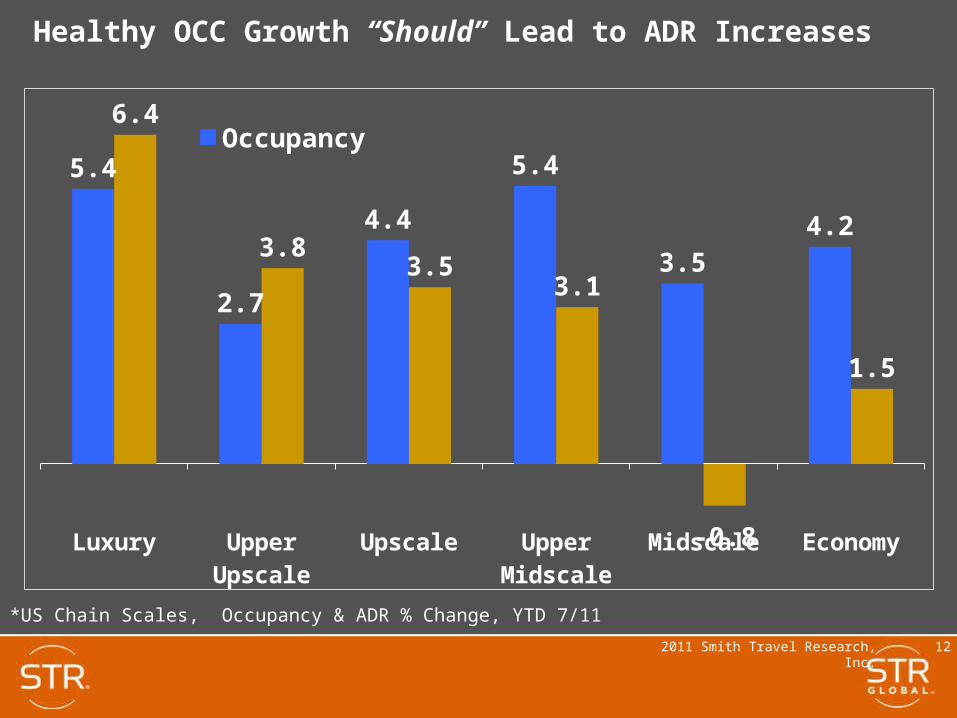
Healthy OCC Growth “Should” Lead to ADR Increases
Luxury Upper Upscale
Upscale Upper Midscale
Midscale Economy
5.4
2.7
4.4
5.4
3.54.2
6.4
3.83.5
3.1
-0.8
1.5
OccupancyADR
*US Chain Scales, Occupancy & ADR % Change, YTD 7/11
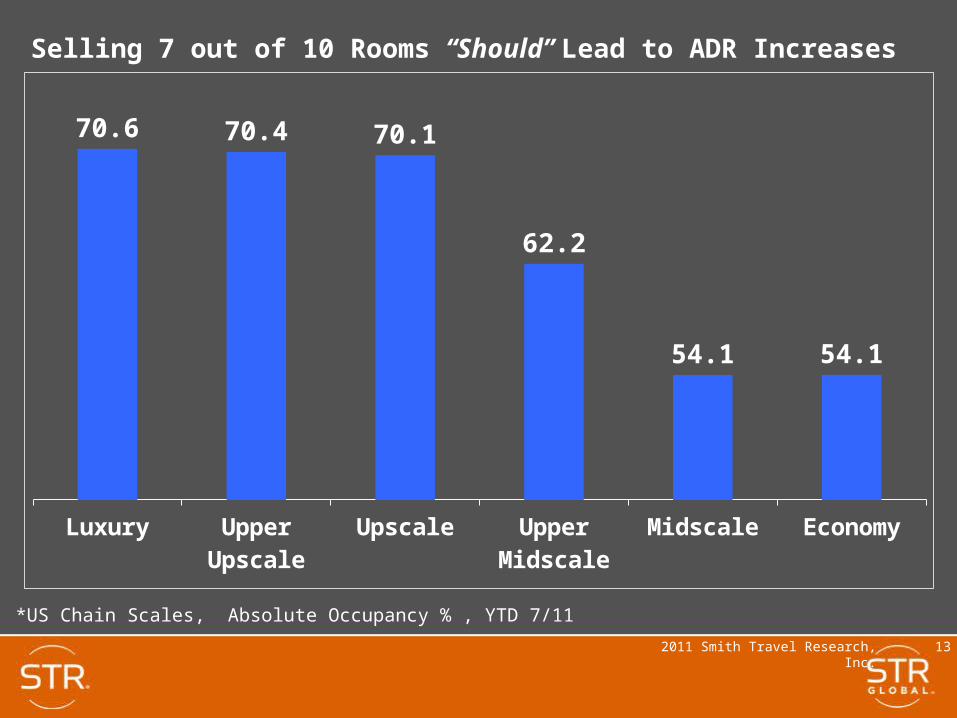
2011 Smith Travel Research, Inc. 13
Selling 7 out of 10 Rooms “Should” Lead to ADR Increases
Luxury Upper Upscale
Upscale Upper Midscale
Midscale Economy
70.6 70.4 70.1
62.2
54.1 54.1
*US Chain Scales, Absolute Occupancy % , YTD 7/11
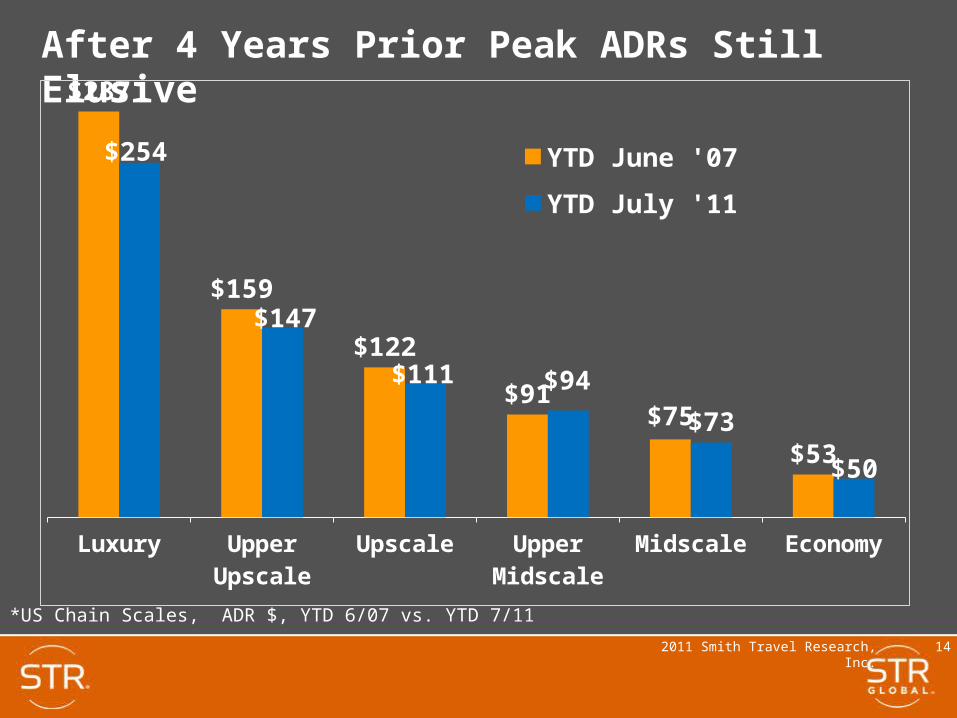
2011 Smith Travel Research, Inc. 14
After 4 Years Prior Peak ADRs Still Elusive
Luxury Upper Upscale
Upscale Upper Midscale
Midscale Economy
$287
$159
$122
$91$75
$53
$254
$147
$111 $94
$73
$50
YTD June '07
YTD July '11
*US Chain Scales, ADR $, YTD 6/07 vs. YTD 7/11
2011 Smith Travel Research, Inc. 15
Segmentation Data

2011 Smith Travel Research, Inc. 16
Transient Demand Rebounds Nicely, But …
Jan Feb Mar Apr May Jun Jul Aug Sep Oct Nov Dec40,000,000
50,000,000
60,000,000
70,000,000
2007
2010
2011
* Total Transient Demand in Millions of Rooms, 1/07 – 7/11.
Mill
ion
s

2011 Smith Travel Research, Inc. 17
… At What Cost?
Jan Feb Mar Apr May Jun Jul Aug Sep Oct Nov Dec$95
$100
$105
$110
$115
$120 2007 2008 2010 2011
* Transient ADR $, 1/07 – 7/11
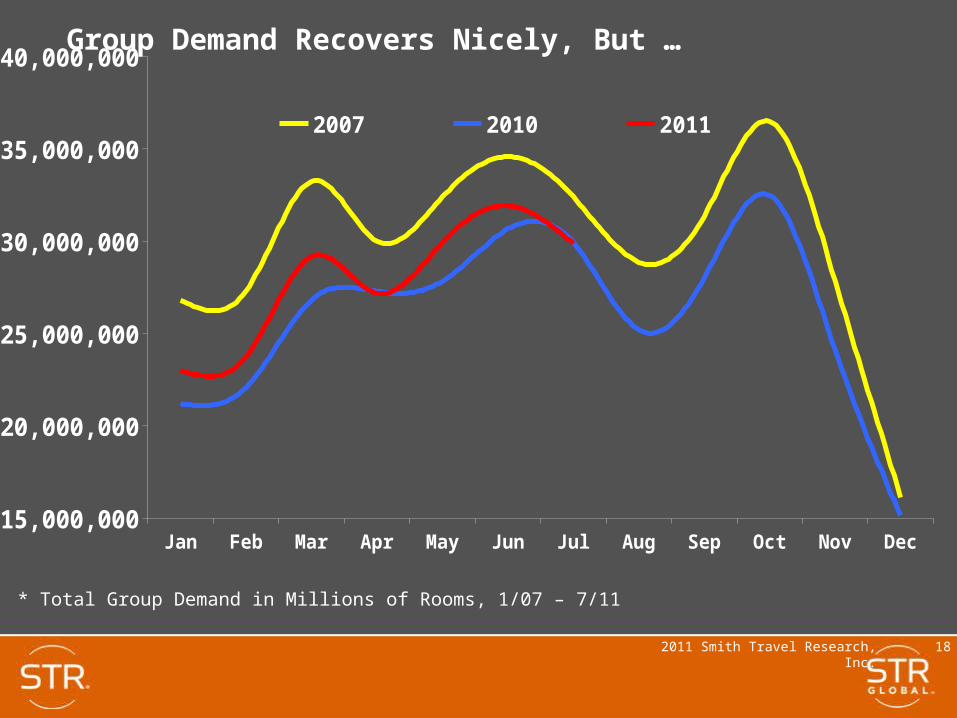
2011 Smith Travel Research, Inc. 18
Group Demand Recovers Nicely, But …
Jan Feb Mar Apr May Jun Jul Aug Sep Oct Nov Dec15,000,000
20,000,000
25,000,000
30,000,000
35,000,000
40,000,000
2007 2010 2011
* Total Group Demand in Millions of Rooms, 1/07 – 7/11

2011 Smith Travel Research, Inc. 19
… Low Group ADR Will Take (At Least) A Year To “Burn Off”
Jan Feb Mar Apr May Jun Jul Aug Sep Oct Nov Dec$90
$100
$110 2007 2008 2010 2011
* Group ADR $, 1/07 – 7/11
2011 Smith Travel Research, Inc. 20
US Forecast

2011 Smith Travel Research, Inc. 21
Total United StatesOutlook Scenarios (% change vs. Prior Year)2011P
Hotel Industry Performance Scenarios
2011
Low RevPARGrowth Forecast
High RevPARGrowth
Supply 0.9 0.7 0.4
Demand 4.0 4.7 5.3
Occupancy 3.2 3.9 4.6
ADR 3.2 3.7 4.5
RevPAR 6.5 7.8 9.1
2011 Smith Travel Research, Inc. 22
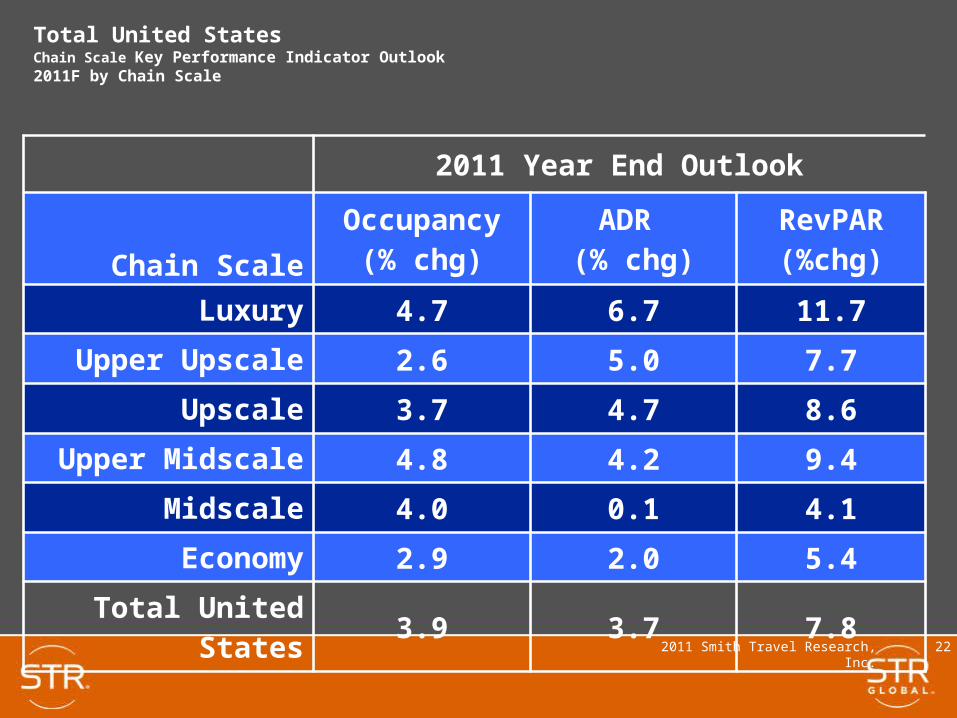
Total United StatesChain Scale Key Performance Indicator Outlook 2011F by Chain Scale
2011 Year End Outlook
Chain Scale
Occupancy(% chg)
ADR (% chg)
RevPAR (%chg)
Luxury 4.7 6.7 11.7
Upper Upscale 2.6 5.0 7.7
Upscale 3.7 4.7 8.6
Upper Midscale 4.8 4.2 9.4
Midscale 4.0 0.1 4.1
Economy 2.9 2.0 5.4
Total United States 3.9 3.7 7.8
2011 Smith Travel Research, Inc. 23
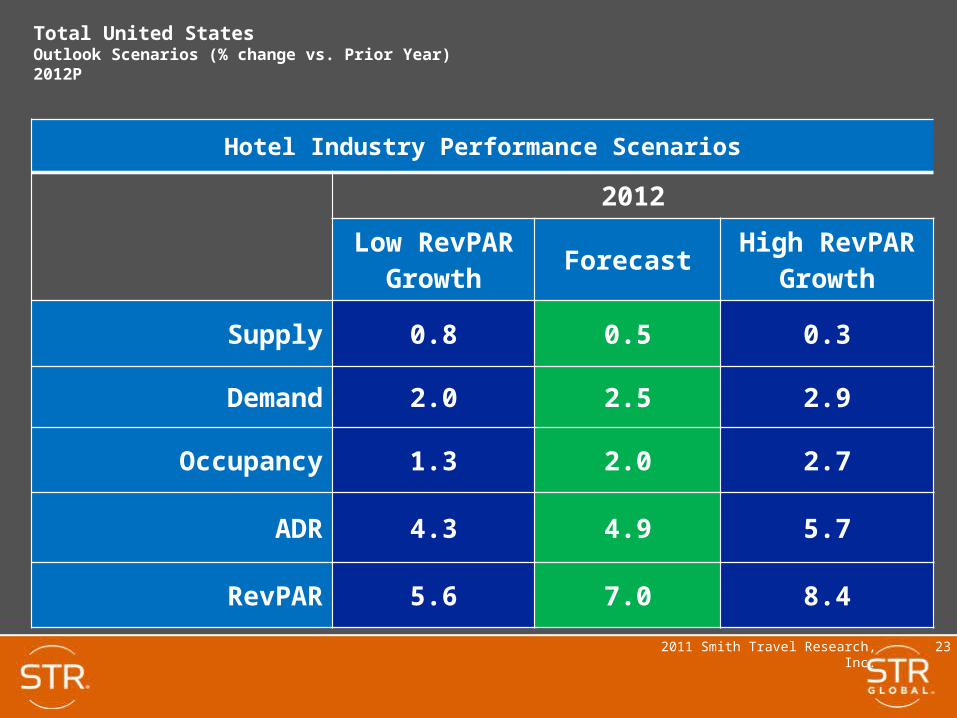
Total United StatesOutlook Scenarios (% change vs. Prior Year)2012P
Hotel Industry Performance Scenarios
2012
Low RevPARGrowth Forecast
High RevPARGrowth
Supply 0.8 0.5 0.3
Demand 2.0 2.5 2.9
Occupancy 1.3 2.0 2.7
ADR 4.3 4.9 5.7
RevPAR 5.6 7.0 8.4
2011 Smith Travel Research, Inc. 24
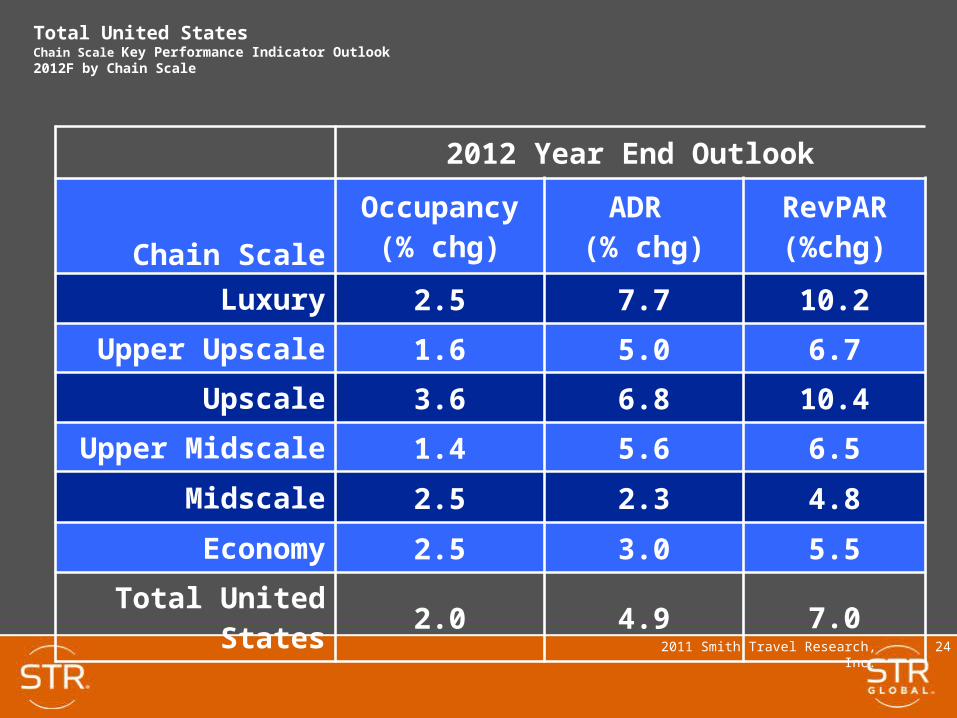
Total United StatesChain Scale Key Performance Indicator Outlook 2012F by Chain Scale
2012 Year End Outlook
Chain Scale
Occupancy(% chg)
ADR (% chg)
RevPAR (%chg)
Luxury 2.5 7.7 10.2
Upper Upscale 1.6 5.0 6.7
Upscale 3.6 6.8 10.4
Upper Midscale 1.4 5.6 6.5
Midscale 2.5 2.3 4.8
Economy 2.5 3.0 5.5
Total United States 2.0 4.9 7.0

2011 Smith Travel Research, Inc. 25
Hotel Industry Forecasts – STR Revisions
2011 2012
Demand ADR Demand ADR
Jan 11 2.5 4.2 2.2 6.8
Jun 11 4.6 4.0 2.5 6.0
Aug 11 4.7 3.7 2.5 4.9
2011 Smith Travel Research, Inc. 26
Takeways
• Demand Is Back• ADR’s “Should” Follow Strong Demand • Trust The Data
2011 Smith Travel Research, Inc. 27
Memphis Trends
2011 Smith Travel Research, Inc. 28
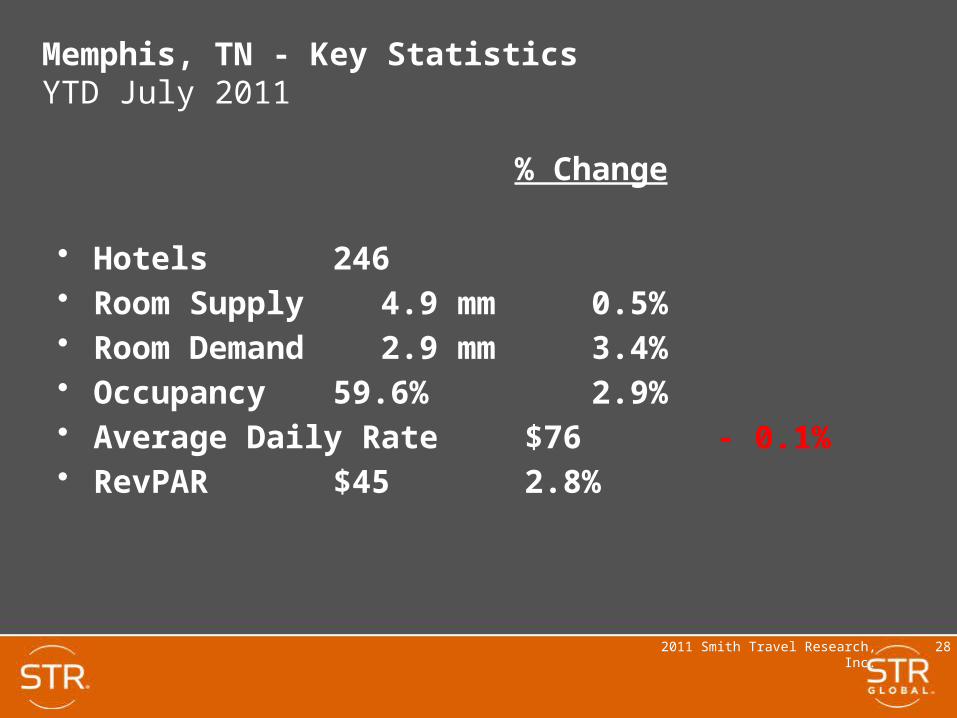
% Change
• Hotels 246• Room Supply 4.9 mm 0.5%• Room Demand 2.9 mm 3.4%• Occupancy 59.6% 2.9%• Average Daily Rate $76 - 0.1%• RevPAR $45 2.8%
Memphis, TN - Key StatisticsYTD July 2011
2011 Smith Travel Research, Inc. 29
2007
2008
2009
2010
2011
-8.0
-4.0
0.0
4.0
8.0 Supply % Change
Demand % Change
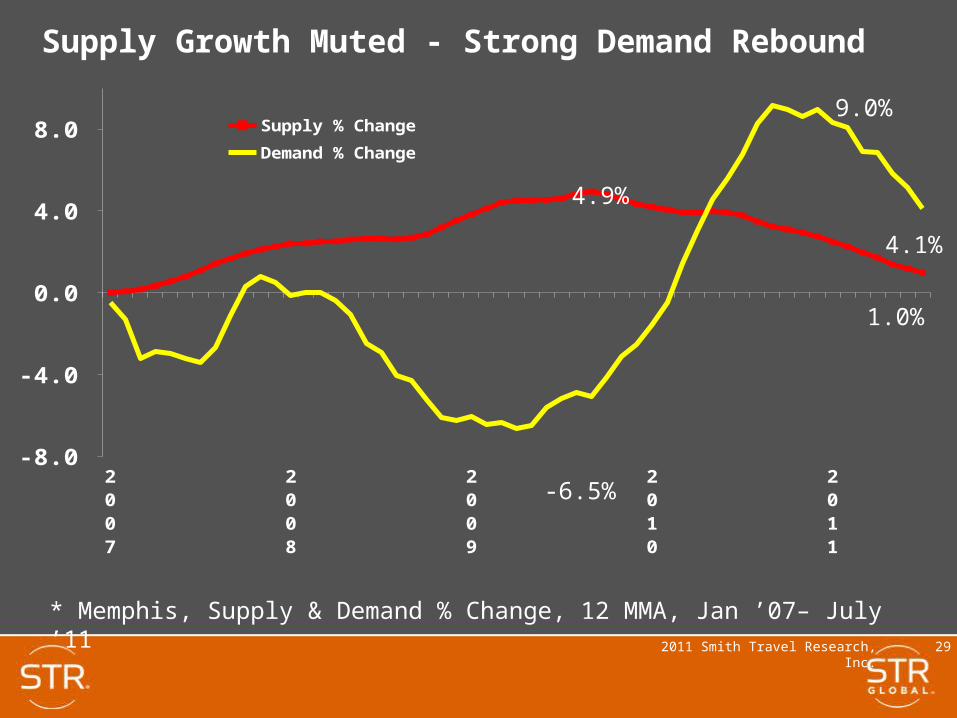
Supply Growth Muted - Strong Demand Rebound
9.0%
4.1%
1.0%
-6.5%
* Memphis, Supply & Demand % Change, 12 MMA, Jan ’07– July ’11
4.9%
2011 Smith Travel Research, Inc. 30
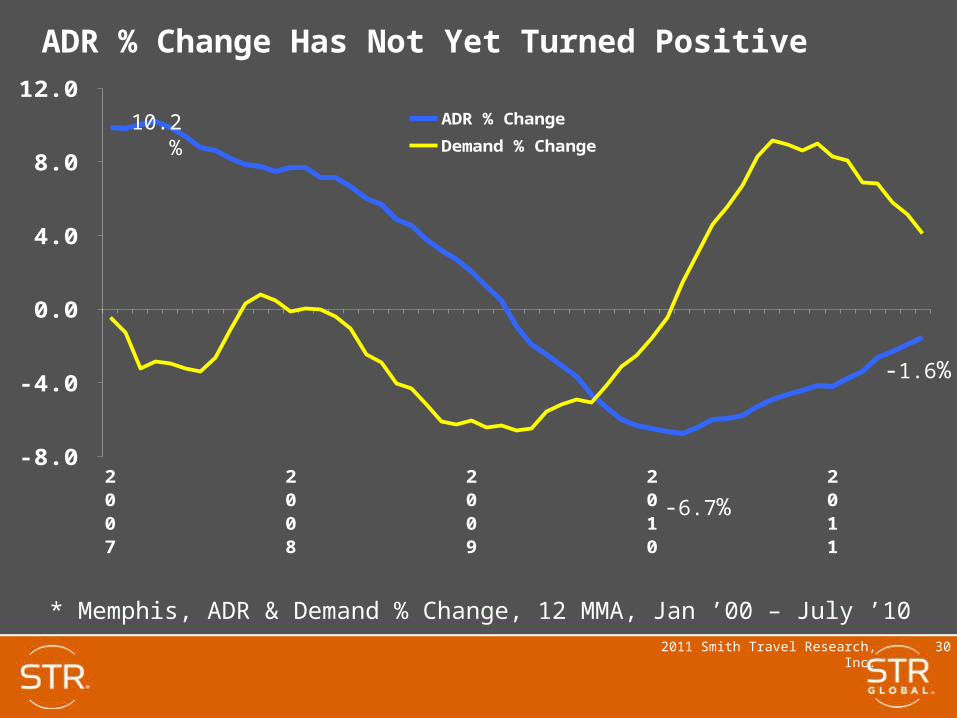
2007
2008
2009
2010
2011
-8.0
-4.0
0.0
4.0
8.0
12.0 ADR % Change
Demand % Change
ADR % Change Has Not Yet Turned Positive
10.2%
-6.7%
* Memphis, ADR & Demand % Change, 12 MMA, Jan ’00 – July ’10
-1.6%
2011 Smith Travel Research, Inc. 31
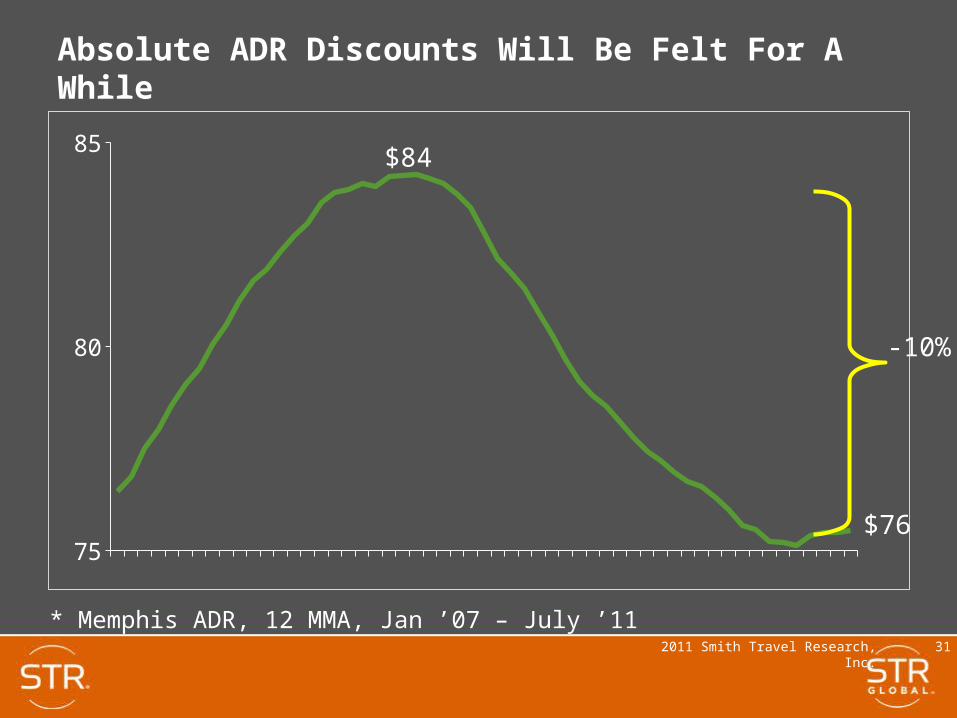
2007 2008 2009 2010 201175
80
85
* Memphis ADR, 12 MMA, Jan ’07 – July ’11
Absolute ADR Discounts Will Be Felt For A While
-10%
$84
$76

2011 Smith Travel Research, Inc. 32
Memphis Downtown Select Set
•Springhill Suites Memphis Downtown
•Madison Hotel
•Sleep Inn @ Court Square Memphis
•Hampton Inn Suites Memphis @ Beale Street
•River Inn Of Harbor Town
•Courtyard Memphis Downtown
•Residence Inn Memphis Downtown
•Westin Memphis Beale Street
•King`s Court Motel
•Holiday Inn Select Memphis Downtown
•Marriott Memphis Downtown
•Preferred The Peabody Memphis
•Comfort Inn Downtown Memphis
•Econo Lodge Memphis
•Doubletree Hotel Memphis Downtown
•Benchmark Hotel
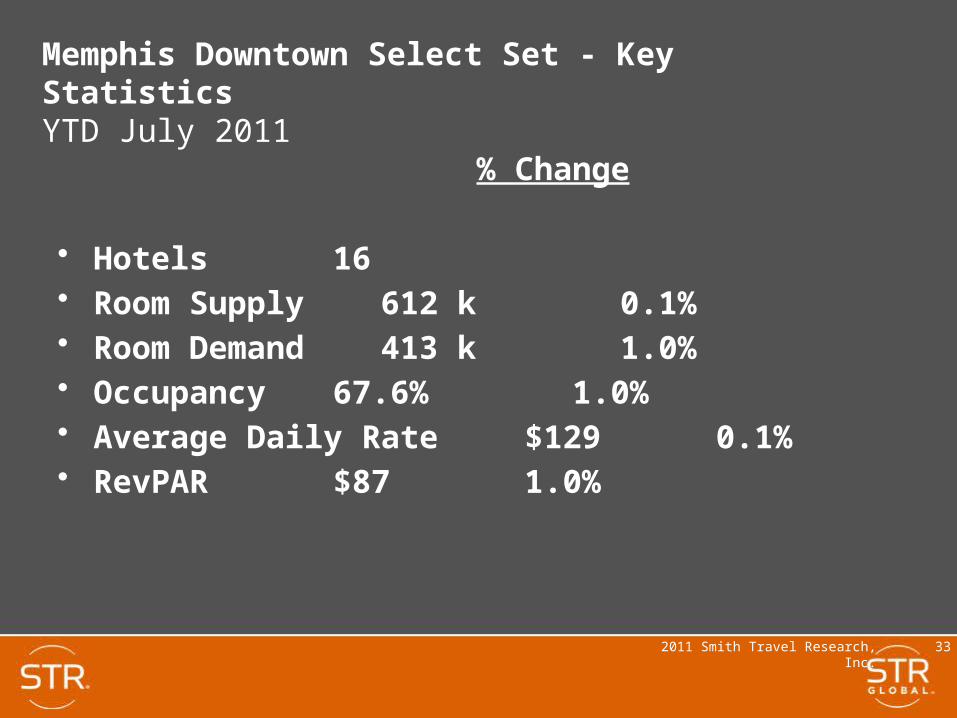
2011 Smith Travel Research, Inc. 33
% Change
• Hotels 16• Room Supply 612 k 0.1%• Room Demand 413 k 1.0%• Occupancy 67.6% 1.0%• Average Daily Rate $129 0.1%• RevPAR $87 1.0%
Memphis Downtown Select Set - Key StatisticsYTD July 2011
2011 Smith Travel Research, Inc. 34
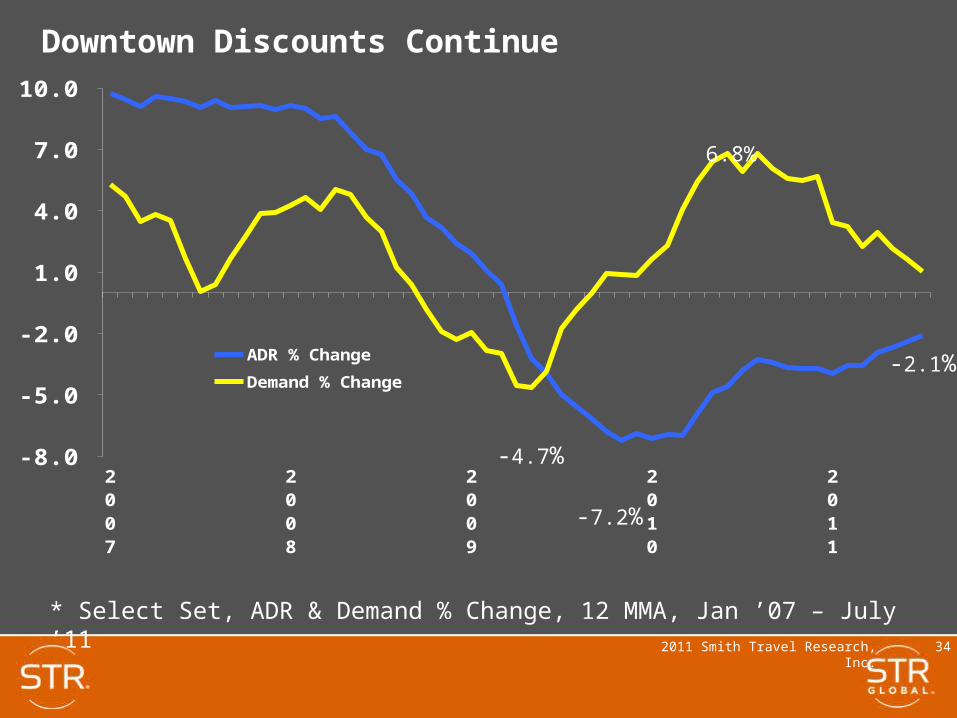
2007
2008
2009
2010
2011
-8.0
-5.0
-2.0
1.0
4.0
7.0
10.0
ADR % Change
Demand % Change
Downtown Discounts Continue
6.8%
-7.2%
* Select Set, ADR & Demand % Change, 12 MMA, Jan ’07 – July ’11
-2.1%
-4.7%
2011 Smith Travel Research, Inc. 35
AH&LA Channel Study- A First Look -
Smith Travel Research, Inc. and/or STR Global, Ltd. (collectively for these purposes, “STR”) are the exclusive owners of all rights in these Industry Presentations and their content. Reproduction of all or a portion of these presentations for any purpose without prior approval of STR is strictly prohibited.
2011 Smith Travel Research, Inc. 36
Agenda
Introduction
US Data
Scale Data
Other Examples
2011 Smith Travel Research, Inc. 37
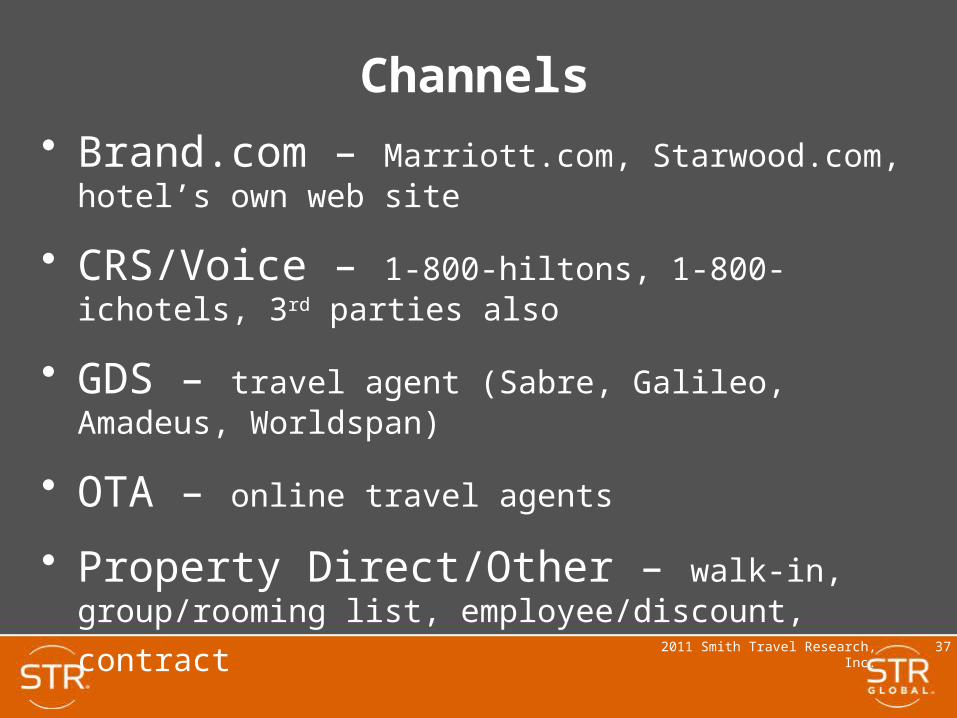
Channels
• Brand.com – Marriott.com, Starwood.com, hotel’s own web site
• CRS/Voice – 1-800-hiltons, 1-800-ichotels, 3rd parties also
• GDS – travel agent (Sabre, Galileo, Amadeus, Worldspan)
• OTA – online travel agents
• Property Direct/Other – walk-in, group/rooming list,
employee/discount, contract
2011 Smith Travel Research, Inc. 38
Participation
• 24,500 properties submitted data
• All of the major players– 95 chains
– 25 additional companies
2011 Smith Travel Research, Inc. 39
US Data
2011 Smith Travel Research, Inc. 40
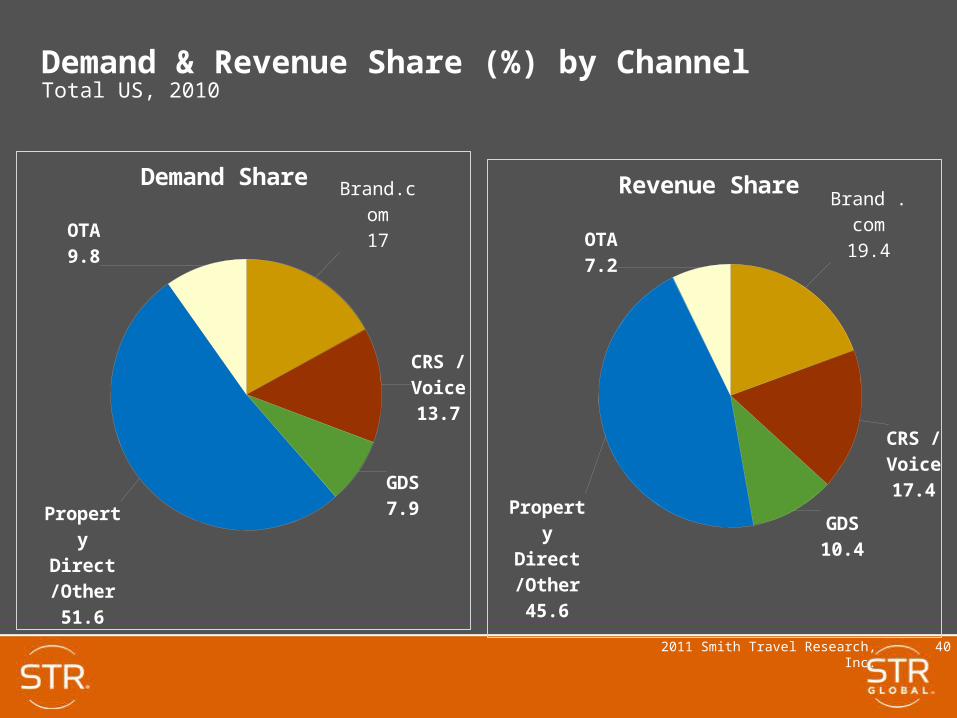
Demand & Revenue Share (%) by Channel
Brand.com17
CRS /Voice13.7
GDS7.9
Prop-erty
Direct /Other51.6
OTA9.8
Demand Share
Total US, 2010
Brand .com
19.4
CRS /Voice17.4
GDS10.4
Property Direct /Other45.6
OTA7.2
Revenue Share
2011 Smith Travel Research, Inc. 41
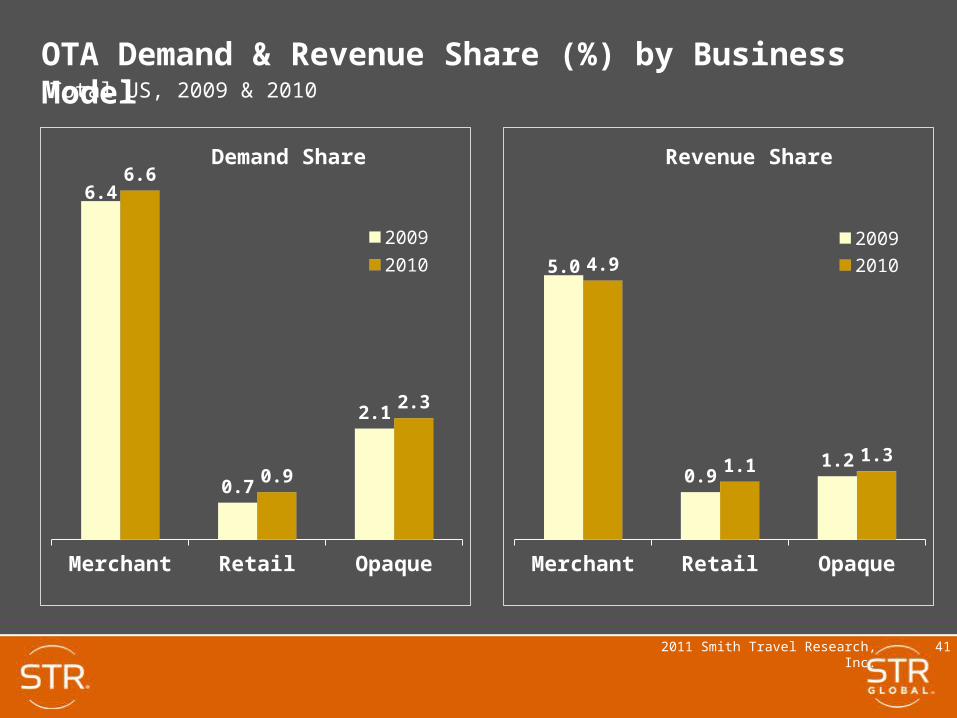
OTA Demand & Revenue Share (%) by Business Model
Merchant Retail Opaque
6.4
0.7
2.1
6.6
0.9
2.3
Demand Share
20092010
Total US, 2009 & 2010
Merchant Retail Opaque
5.0
0.91.2
4.9
1.11.3
Revenue Share
20092010
2011 Smith Travel Research, Inc. 42
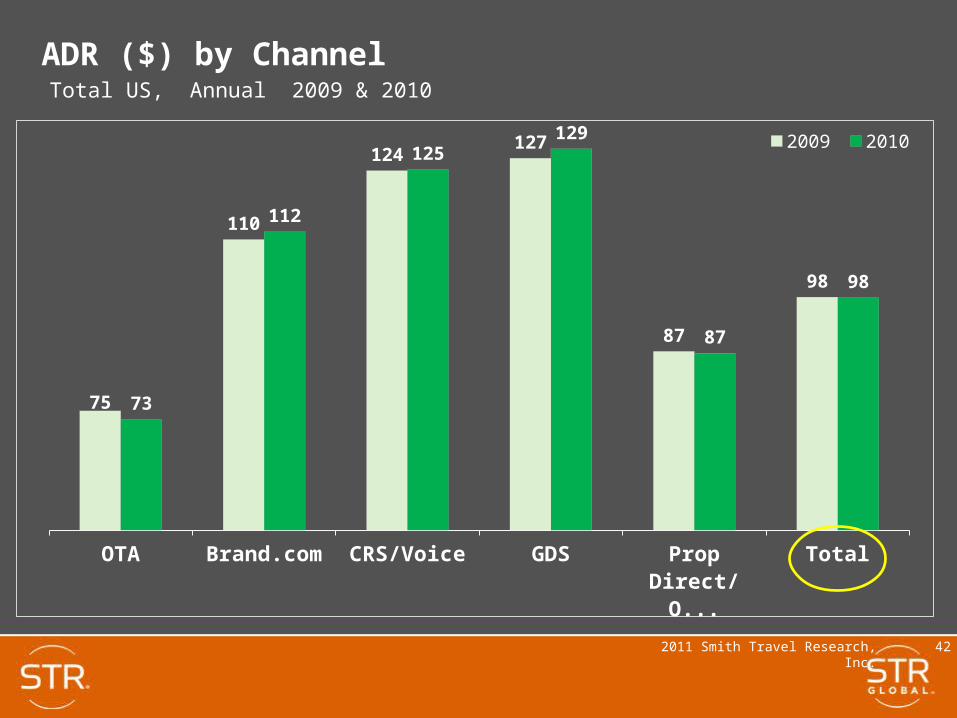
ADR ($) by Channel
OTA Brand.com CRS/Voice GDS Prop Direct/Other
Total
75
110
124127
87
98
73
112
125129
87
98
2009 2010
Total US, Annual 2009 & 2010

2011 Smith Travel Research, Inc. 43
ADR ($) by OTA Business Model
Merchant Retail Opaque
76
119
55
73
119
55
2009 2010
Total US, 2009 & 2010
2011 Smith Travel Research, Inc. 44
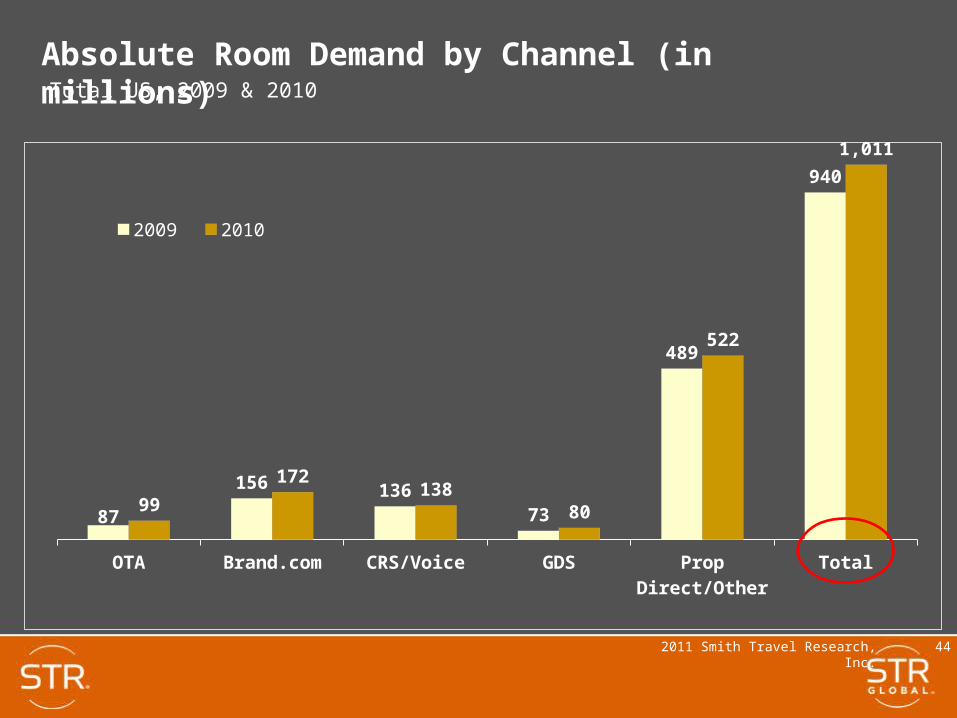
Absolute Room Demand by Channel (in millions)
OTA Brand.com CRS/Voice GDS Prop Direct/Other
Total
87
156 13673
489
940
99
172138
80
522
1,011
2009 2010
Total US, 2009 & 2010

2011 Smith Travel Research, Inc. 45
Absolute Revenue by Channel (in billions $)
OTA Brand.com CRS/Voice GDS Prop Direct/Other
Total
6.5
17.2 16.9
9.3
42.5
92.4
7.2
19.2 17.2
10.4
45.2
99.2
2009 2010
Total US, 2009 & 2010
2011 Smith Travel Research, Inc. 46
Scale Data

2011 Smith Travel Research, Inc. 47
Property Direct/Other Demand Share (%) by Scale
Luxury Upper Upscale
Upscale Upper Midscale
Midscale Economy Inde-pen-dents
33 31
41
52
63
77
52
3431
41
52
62
76
52
2009 2010
Percent of Total Demand, Annual 2009 & 2010
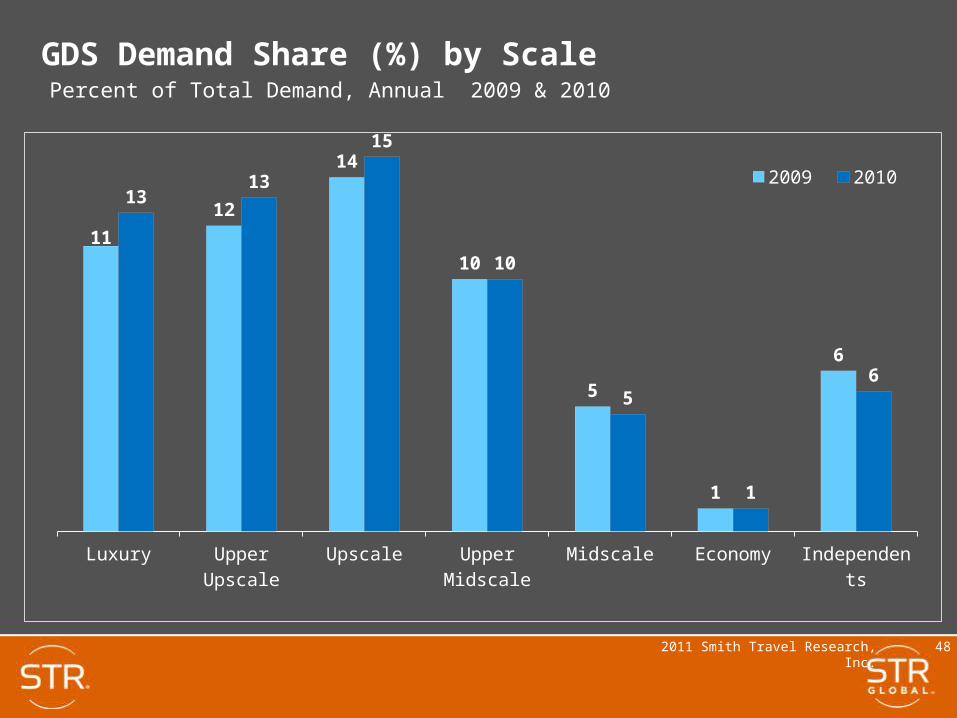
2011 Smith Travel Research, Inc. 48
GDS Demand Share (%) by Scale
Luxury Upper Upscale
Upscale Upper Midscale
Midscale Economy Inde-pen-dents
11
12
14
10
5
1
6
1313
15
10
5
1
6
2009 2010
Percent of Total Demand, Annual 2009 & 2010
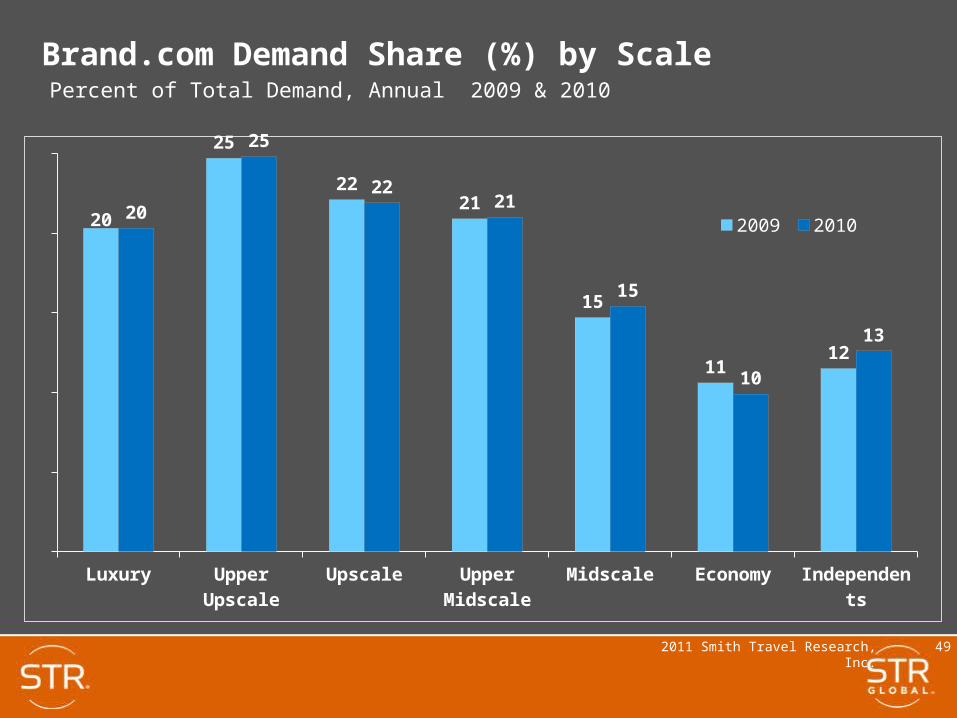
2011 Smith Travel Research, Inc. 49
Brand.com Demand Share (%) by Scale
Luxury Upper Upscale
Upscale Upper Midscale
Midscale Economy Inde-pen-
dents
20
25
2221
15
1112
20
25
2221
15
10
13
2009 2010
Percent of Total Demand, Annual 2009 & 2010
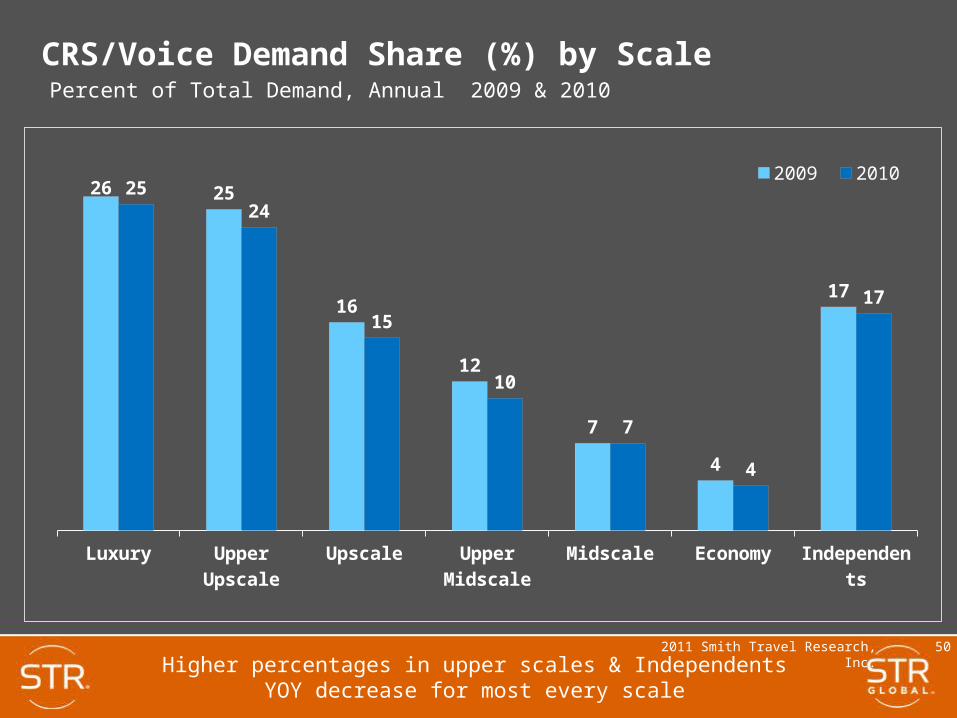
2011 Smith Travel Research, Inc. 50
CRS/Voice Demand Share (%) by Scale
Luxury Upper Upscale
Upscale Upper Midscale
Midscale Economy Inde-pen-
dents
26 25
16
12
7
4
17
2524
15
10
7
4
17
2009 2010
Percent of Total Demand, Annual 2009 & 2010
Higher percentages in upper scales & IndependentsYOY decrease for most every scale
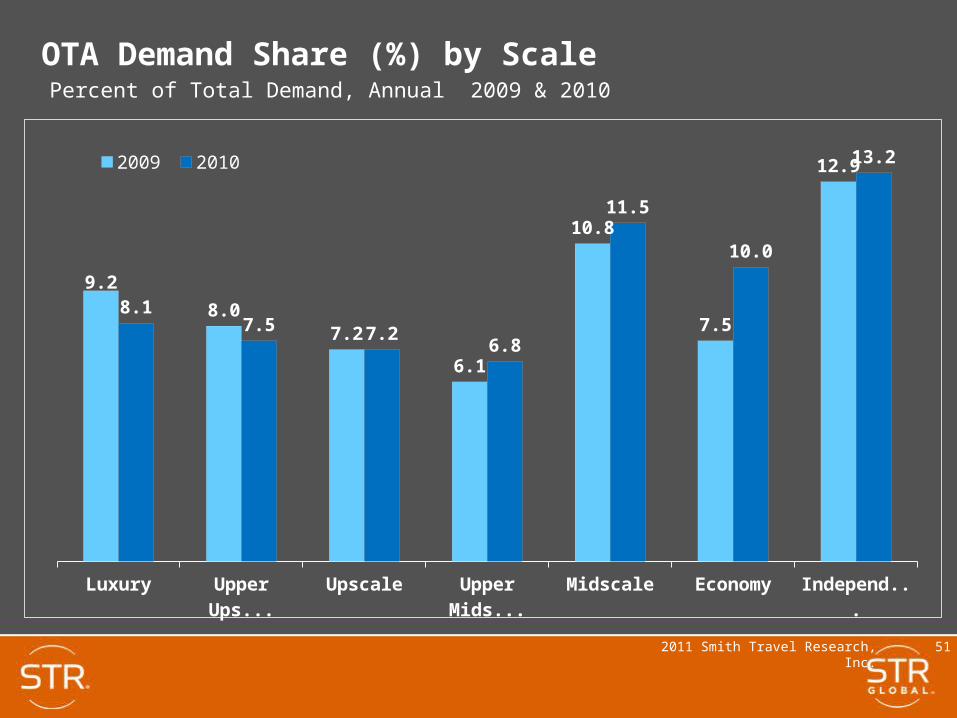
2011 Smith Travel Research, Inc. 51
OTA Demand Share (%) by Scale
Luxury Upper Upscale
Upscale Upper Midscale
Midscale Economy Inde-pen-
dents
9.2
8.07.2
6.1
10.8
7.5
12.9
8.17.5 7.2
6.8
11.5
10.0
13.22009 2010
Percent of Total Demand, Annual 2009 & 2010

2011 Smith Travel Research, Inc. 52
ADR for Luxury Scale by Channel
OTA Merchant
OTA Retail
OTA Opaque
Brand.com CRS/Voice GDS Prop Di-rect/Other
Total
179
244
93
228
257273
243 239
195
257
100
238
258
274
241 244
2009 2010
Annual 2009 & 2010
2011 Smith Travel Research, Inc. 53
Additional Data
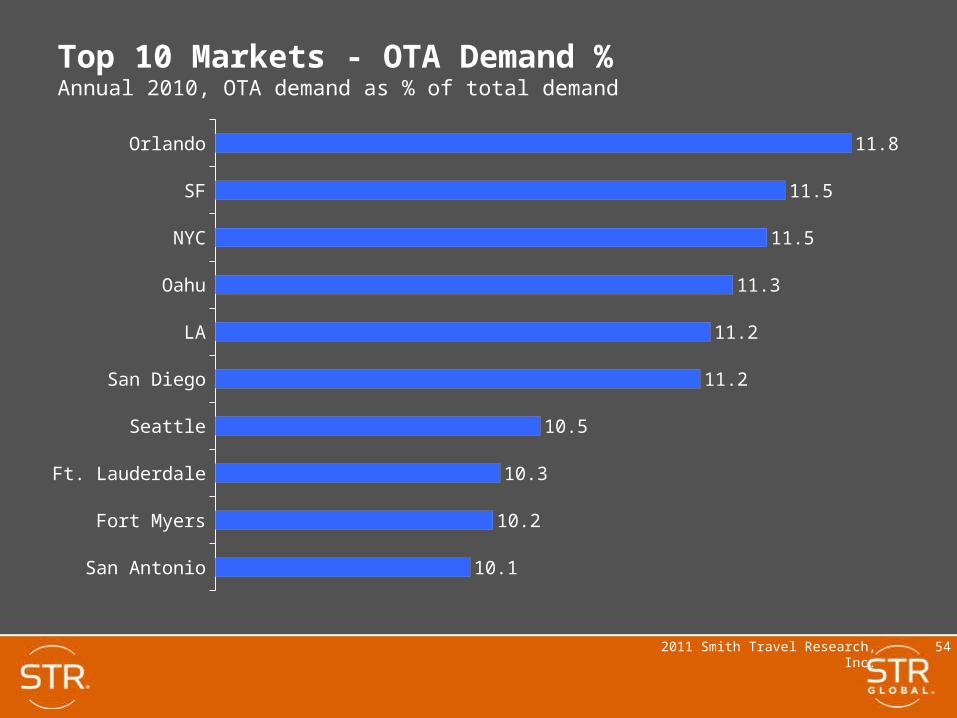
2011 Smith Travel Research, Inc. 54
Top 10 Markets - OTA Demand %Annual 2010, OTA demand as % of total demand
San Antonio
Fort Myers
Ft. Lauderdale
Seattle
San Diego
LA
Oahu
NYC
SF
Orlando
10.1
10.2
10.3
10.5
11.2
11.2
11.3
11.5
11.5
11.8

2011 Smith Travel Research, Inc. 55
Channel ADR ($) for 5 Metro Markets
Boston NYC Miami SF LA
110
178
100 9783
149
242
148139
124
162
246
183
159
138
160
285
176 169
149
126
209
127 120102
OTA Brand.com CRS/Voice GDS Prop Direct/Other
Annual 2010

2011 Smith Travel Research, Inc. 56
Comp Sets
• Generated US comp set data
• 9,000 full comp sets
• 21,000 sufficient (greater than 4 hotels participating)

2011 Smith Travel Research, Inc. 57
Channel Demand Share for Sample Property in NY
OTA Brand.com CRS/Voice GDS Prop Direct/Other
8
26
17
12
38
7
2527
16
24
7
27
24
17
25
7
2625
18
24
Subject Comp Set Tract Scale Market Scale
Demand Share as percent of Total Demand, Annual 2010

2011 Smith Travel Research, Inc. 58
Length of Stay Data
• Most companies submitted “Number of Reservations” along with “Room Nights” and “Revenue”
• Allows us to calculate Length of Stay per Channel
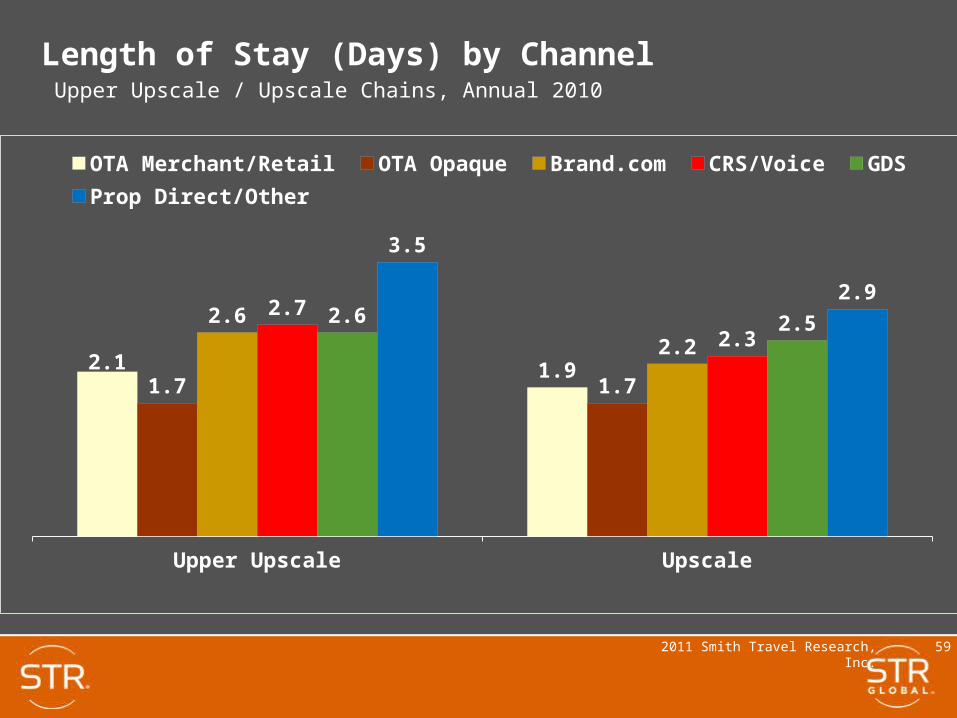
2011 Smith Travel Research, Inc. 59
Length of Stay (Days) by Channel
Upper Upscale Upscale
2.1 1.91.7 1.7
2.6
2.2
2.7
2.32.6 2.5
3.5
2.9
OTA Merchant/Retail OTA Opaque Brand.com CRS/Voice GDS
Prop Direct/Other
Upper Upscale / Upscale Chains, Annual 2010
2011 Smith Travel Research, Inc. 60
Channel Study
• Findings to be published in mid-September
• Corporate monthly product in H1 of 2012
• Property Comp Set product out thereafter
• More research is needed

2011 Smith Travel Research, Inc. 61
www.hotelnewsnow.com
Click on “Industry Presentations”
Smith Travel Research, Inc. and/or STR Global, Ltd. (collectively for these purposes, “STR”) are the exclusive owners of all rights in these Industry Presentations and their content. Reproduction of all or a portion of these presentations for any purpose without prior approval of STR is strictly prohibited.


