Page 1
ASSIGNMENTS MBA – 2nd SEM
Subject Code – MB0044 Book ID – B1133
PRODUCTION & OPERATIONS MANAGEMENT Set – 1
Q.1. Explain in brief the origins of Just in Time. Explain the different types of wastes that can
be eliminated using JIT.
Ans. Just in time were developed to minimize wastage across the organization. If a firm is
optimistic about the demand, then that firm increases their planned inventories. On the other hand if
the demand is weak when compared to the expectations, then that firm’s unplanned inventories are
high. That means companies don’t keep a lot of excess inventory, and then manufacture a product as
an order comes in. It is management philosophy of continuous and forced problem solving.
The seven types of wastes to be eliminated according to JIT are :
1. Over Production
Over production is to manufacture products before it is actually needed. If the demand for that
product decreases, the extra parts or products produced may not be useful or needed. Also over
production results in high storage costs and is also difficult to detect defects. So, over productions is
considered a waste.
2. Inventory
Excess procurement or production builds up stock of materials which are not immediately use,
this locking space and fund carrying heavy cost.
3. Waiting Time
Waste of time happen when goods are not moving or being processed. The operator, the
machine or the part will either be not working or be worked upon. The duration is can be said to be
unproductive and may create more serious consequences.
4. Movement
Any unnecessary movement is a waste of energy; it causes blockages, disrupting movements
and delaying the flow of other items creating delays.
5. Effort
The people, who work, do not make a study as to how the products on which they are making
Page 2
are utilized and do not realize the purpose for which they are made. This lack of education will lead to
waste of resources. Finally, they end up in shortage of resources when needed.
6. Defective products
The defective products lead to a tremendous loss to the company. This is because they use up
the same equipments, workmen and the time that would be used to make good products. Thus
defective products use up resources and result in losses.
7. Over Processing
Some steps like unnecessary processing or production do not add value to the final output. As a
result, it is waste of all the inputs that go into the process.
Q.2. What is value engineering or value analysis ? Elucidate five companies which have
incorporate VE with brief explanation.
Ans. Value of engineering (VE) or Value Analysis is a methodology by which we try to find
substitutes for a product or an operation.
The concept of value engineering originated during the Second World War. It was developed
by the General Electric corporations (GEC). Value Engineering has gained popularity due to its
potential for gaining high Returns on investment (ROI). This methodology is widely used in business
re-engineering, government projects, construction, assembling and machining processes, health care
and environmental engineering, and many others. Value engineering process calls for a deep study of a
product and the purpose for which it is used, such as the raw materials used; the processes of
transformation; the equipment needed, and many others. It is also questions whether what is being
used is the most appropriate and economical. This applies to all aspects of the products.
1. General Electrical Corporation (GEC)
The concepts of value engineering originated in 1947 in General Electricals corporation (GEC)
When a substitute for asbestos for flooring had to be found. Specialized dealers could provide an
equally good material at a lesser price.
Initially, the practioners were the people in charge of purchasing who tried to locate substitute
material which would be equally good, if not better, at a lower price. This is the first and basic
approach to value engineering.
The concept percolated to the manufacturing departments, engineers applied the same
principles and found that, they could use alternate materials, which were cheaper giving the same
Page 3
performance. It was also fund that dimensions and tolerance could be altered without affecting the
performance of the part or the product. The investigations took them on the path of eliminating some
operations. The focus was on the value of each bit materials, each operation. This approach led to the
design stage.
2. Ashok Leyland
In implementation of VA, Ashok Leyland changed gear material from phosphor bronze to a
less expensive cast iron and eliminated frequent field complaint of gear seizure in trucks.
3. TVS
T.V. Sundaram Lyenger (TVS) Limited is one of the largest automobile distribution
companies in India.
During the mid 1940 to 1960s, TVS based in Madurai was ranked as the best bus
transportation system in India. It could manage to run the fleets for about 96% of the time.
TVS used the VE approach to restore the mobility of buses that had broken down. They
stocked their garage with some critical assemblies of a bus. Whenever, a part or an assembly failed of
a bus, they replaced it immediately with a new one, thus restoring mobility within a couple of hours.
When compared to the traditional method, this approach has gained much more benefits to the
company, it helped to save time, reduce cost, efficient, quicker, and competitive.
4. MODI Xerox
Modi Xerox designed the VE-d low cost copier 1025 ST, which uses a single tray. The
advantage of new design is that it is easy to operate and the cost is also very low.
5. TITAN
Titan watches introduced new designs adopting a strategy of innovation.
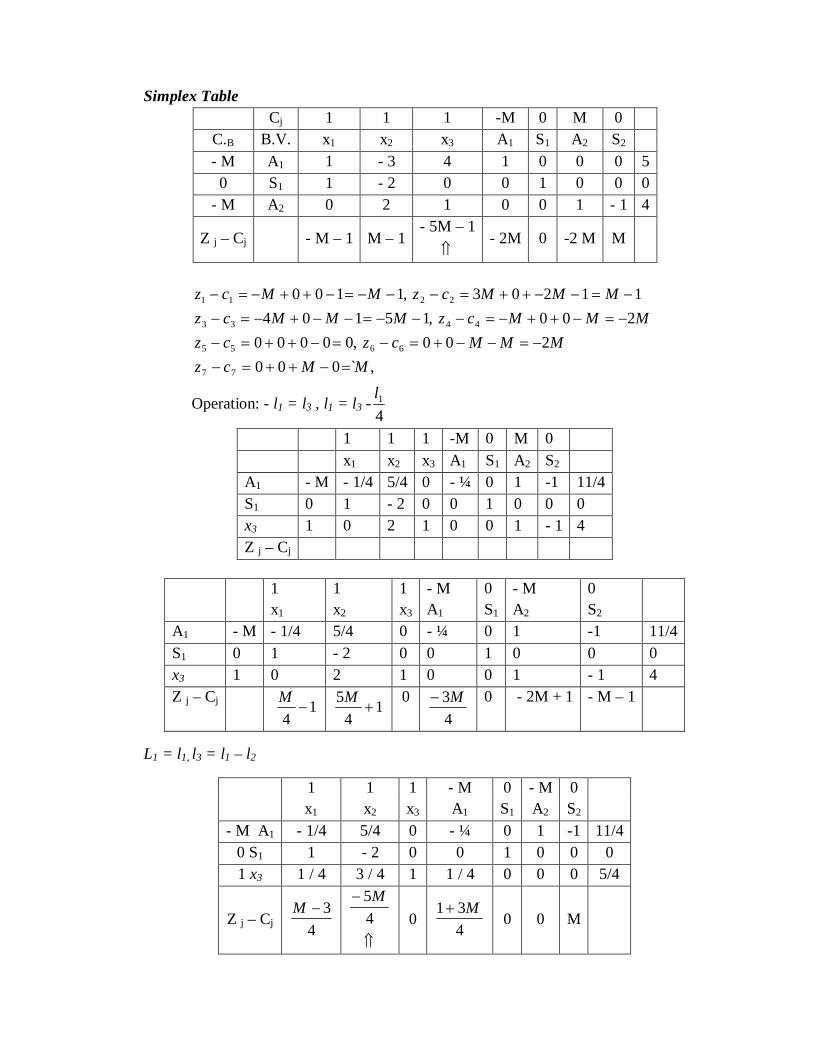
Q.3. Explain different types of quantitative models. Differentiate between work study and motion study.
Ans. There are different quantitative models.
1. Linear Programming:
Linear programming technique is often used for optimizing a given objective like; profit or
revenue maximization, or cost outgo minimization. Distribution of the revenues is the critical issue,
when there are limited resources and they have to meet competing demands.
2. Transportation Model:
Transportation model is concerned with goods from manufacturing center or warehouses
which have to be supplied to depots or retails outlets. The demand and supply position of the places
Page 4
where they are required or produced and the cost of transportation are considered in the model. We use
this model to economize.
3. Assignment Model:
Allocating jobs or persons to machines, awarding different projects to contractors is done so
that maximum returns occur or less expenses are incurred. Hence, calls for the use of this model.
4. Inventory Control Model:
Inventory control model considers the:
a. Frequency of placing orders.
b. Quantities per order considering the cost of placing an order.
c. Number of pieces that are to be kept in reserve.
d. Rate of consumption.
e. Lead time required for the supplier.
f. Cost involved in storage.
We have different models which give solutions to optimization depending upon the
probabilities of consumption and supply.
5. Waiting Line Models:
Queues are formed when the rate of services is at a variance with the rate of arrival. They
are formed when the rate of production is less at particular points compared to the previous one.
Sometimes we see multiple service points and a single queue are formed for feeding them. Number of
items which includes the following is studied with some special techniques.
a. People to be serviced.
b. Rate of service
c. Type of queue discipline that is intended to be followed.
d. Policy of priority
e. Tolerable amounts of waiting
f. Others.
6. Simulation Models:
Simulation models are used when we will not be able to formulate mathematical model. So,
we develop a model which resembles a real life situation. Based on this pattern, we predict and plan
our procurement, production, delivery and other actions.
Page 5
7. PERT (Project Evaluation And Review Technique) And CPM (Critical Path Method)
Models:
When projects are undertaken with a number of activities, some happens in sequence, with
gaps of weeks or months and some happens simultaneously. It is important to estimate the time
required for completion of the project. A lot of coordination is needed while supplying the resources.
It is also equally important to identify the bottlenecks and smoothen resources so that time schedules
are maintained. Delayed completion may entail penalties. In this model, we adopt special methods to
make the system.
Difference between Work Study and Motion Study
Work study Motions study
1. We can say that work study is being conducted when analysis of work methods is conducted during the period when a job is done on a machine or equipment.
1. Method study is on studying the method currently being used and developing a new method of performing the task in a better way.
2. The study helps in designing the
optimum work method and standardization of the work method.
2. Operation flow charts, motion charts, flow process charts, which are the elements of the task are studied to find the purpose of each activity, the sequences in which they are done, and the effect of these on the work.
3. The study enables the methods engineer to search for better methods for higher utilization of man and machine and accomplishment of higher productivity.
3. The study may help in changing some
of them and even eliminate some of them to effect improvements.
4. The study gives an opportunity to the workmen to learn the process of study thus making them able to offer suggestions for improved methods.
4. The new method should result in saving of time, reduced motions and simpler activities.
Page 6
Q.4. What is rapid prototyping ? Explain the difference between Automated flow line and
Automated assembly line with examples.
Ans. Prototyping is a process by which a new product is developed in small numbers.
Prototyping is helpful to:
Determine the suitability of the materials
Study the various methods of manufacture
Determine type of machinery required
Develop techniques to overcome problems that may be encountered when full scale
manufacturing is undertaken.
Prototypes do meet the specification of the components that enter a product and performance
can be measured on those. It helps in confirming the design and any shortcomings can be rectified at
low cost. If serious defects or problems arise during manufacturing, a thorough change in design or
even its replacement may be considered. Toa arrive at decisions and to make use of the advantageous
stated above, it is important that the prototypes are made within the shortest possible time, Rapid
prototyping facilities this.
The advanced Rapid Prototype Modeling Processes are:
1. Computer Aided Design (CAD)
2. Selective Laser Sintering (SLS)
3. Fused Deposition Modeling (FDM)
4. Lamination Object Manufacturing (LOM)
5. Electronic Beam Melting (EBM)
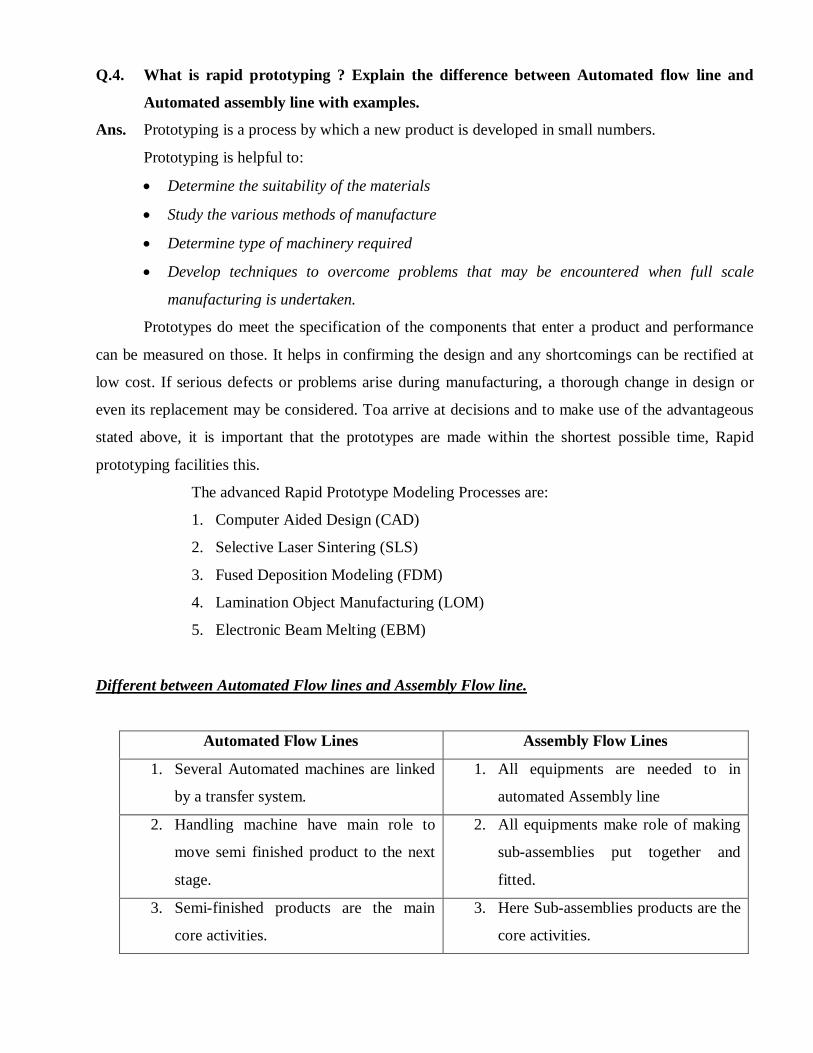
Different between Automated Flow lines and Assembly Flow line.
Automated Flow Lines Assembly Flow Lines
1. Several Automated machines are linked
by a transfer system.
1. All equipments are needed to in
automated Assembly line
2. Handling machine have main role to
move semi finished product to the next
stage.
2. All equipments make role of making
sub-assemblies put together and
fitted.
3. Semi-finished products are the main
core activities.
3. Here Sub-assemblies products are the
core activities.
Page 7
4. Here raw materials are achieving to get
required shapes and acquire special
properties.
4. Here intermediated products are
achieving to get finished product.
5. The materials are needed to be moved,
held, rotated, fitted and positioned for
completing different operations.
5. Here All parts or sub-assemblies are
fitted to enables the product to be in
readiness to perform the function it
was designed to. This process is
called assembly.
6. Human intervention may be needed to
verify that the operations are taking
place according to standards.
6. No human intervention is needed,
methodologies are framed to achieve
the final result, basic principle is to fit
parts together and ensure linkages so
that the functions are integrated and
give out the desired output.
Q.5. Explain Break even Analysis and centre of gravity methods. Explain product layout and process layout with examples.
Ans. Break Even Analysis
Every manufacturing company will have three major contributors to cost;
1. Investments made for land, plant and machinery resulting in interest and depreciation.
2. Recurring expenses, which are not proportional to the quantity of production.
3. Variable costs, which are directly proportional to the quantity produced.
For our calculations, we combine the first two costs together and call them fixed costs. We call
those costs that depend on the quantity of production as variable costs.
We compare the total costs for different locations on estimated amounts per annum and select
whichever locations costs the least. However we will have to consider the possible variations in
production levels during the foreseeable time spans and take decision.
Page 8
Centre Of Gravity Method.
Centre of gravity method is used mainly when;
Transportation costs, either for distribution of products or collection of materials from
different suppliers is the main criterion.
Production rates are high.
The volume and weights of materials that have to be moved are huge.
Time taken either to receive materials from suppliers or delivery to customers is
critical.
It is better to locate the facility at such a place, which caters to the different points most
optimally. The vital factor is the load, that is, number of items, or the weights that need to be moved
from the central location to the existing or demanding point. We use this method when, both distance
and load have to be considered for optimality in terms of costs.
PRODUCT LAYOUT
Product layout is also called as production lines or assembly lines. They are designed and laid
out in such a way that only few products are capable of being manufactured or assembled. Materials
flow through the various facilities. These use special machines to perform specific operations to
produce only one product at one time. So, companies should set different set of machines for different
products. Workers perform a narrow range of activities to complete the operations on the product as it
moves in a flow line. The operation times, the sequence of movements and routing procedures are
highly standardized to meet production requirements which are synchronized with many such products
TO THE COST
CONTRIBUTING
COMPANIES MAJOR
CONTRIBUTORS TO COST
FIXED COSTS
LAND,PLANT AND
MACHINERY
RECURRING EXPENSES
VARIABLE COSTS
PRODUCTION COST
Page 9
to complete finished goods to meets demands. Using special machines and implementing
standardization in operations have many advantages which are listed below:
The skill required of the workers is low
Supervision is minimal
Training needs are small
Precautions to be taken are:
Constant check on the processes needs to be performed so that quality is assured.
Corrective measures have to be implemented to avoid rejections, since, the quantities
that get manufactured will be continuous.
Check for the behavioral of the worker. As jobs are repetitive, workers tend to be bored
and lose concentration. This may affect productivity and quality.
Example: Let us consider an example of a stainless steel manufacturing industry, in which the
operations turning, milling and drilling happen in a sequence. Testing is performed in each
process to assure the quality. The items are then sent to the assembly block. The items that
arrive for assembly are either bought out items or made item components from elsewhere in the
plant. The final product inspections are made and send to the packing dispatch.
TURNING
OPERATION
MILLING
MACHINES
DRILLING
MACHINES
PACKING
DISPATCH
INSPECTION ASSSEMBLY
PROCESS LAYOUT
Design of Process Layout:
The analysis involved in the design of production lines and assembly lines relates primarily to
timing, coordination, and balance among individual stages in the process. For process layouts, the
relative arrangement of departments and machines is the critical factor because of the large amount of
transportation and handling involved.
Procedure For Designing Process Layouts:
Process layout design determines the best relative locations of functional work centers. Work
centers that interact frequently, with movement of material or people, should be located close together,
whereas those that have little interaction can be spatially separated. One approach of designing an
efficient functional layout is described below.
Page 10
1. List and describe each functional work centre.
2. Obtain a drawing and description of the facility being designed.
3. Identify and estimate the amount of material and personnel flow among work centers.
4. Use structured analytical methods to obtain a good general layout.
5. Evaluate and modify the layout, incorporating details such as machine orientation,
storage area location, and equipment access.
The first step in the layout process is to identify and describe each work centre. The description
should include the primary function of the work centre; drilling, new accounts, or cashier; its major
components, including equipment and number of personnel; and the space required. The description
should also include any special access needs (such as access to running water or an elevator) or
restrictions (it must be in a clean area or away from heat). For a new facility, the spatial configuration
of the work centers and the size and shape of the facility are determined simultaneously. Determining
the locations of special structures and fixtures such as elevators, loading docks, and bathrooms
becomes part of the layout process.
However, in many cases the facility and its characteristics are a given. In these situations, it is
necessary to obtain a drawing of the facility being designed, including shape and dimensions, locations
of fixed structures, and restrictions on activities, such as weight limits on certain parts of a floor or
foundation.
Relationship flow diagram
a) To minimize transport times and material-handling costs, we would like to place close together
those work centers that have the greatest flow of materials and people between them.
Page 11
b) To estimate the flows between work centers, it is helpful to begin by drawing relationship
diagram as shown in Fig.
c) For manufacturing systems, material flows and transporting costs can be estimated reasonably
well using historical routings for products or through work sampling techniques applied to
workers or jobs. The flow of people, especially in a service system such as a business office or
a university administration building, may be difficult to estimate precisely, although work
sampling can be used to obtain rough estimates.
The amounts and/or costs of flows among work centers are usually presented using a
flow matrix, a flow-cost matrix, or a proximity chart.
Q.6. Explain Juran’s Quality Trilogy and Crosby’s absolutes of quality. List out the pillars of total productive maintenance.
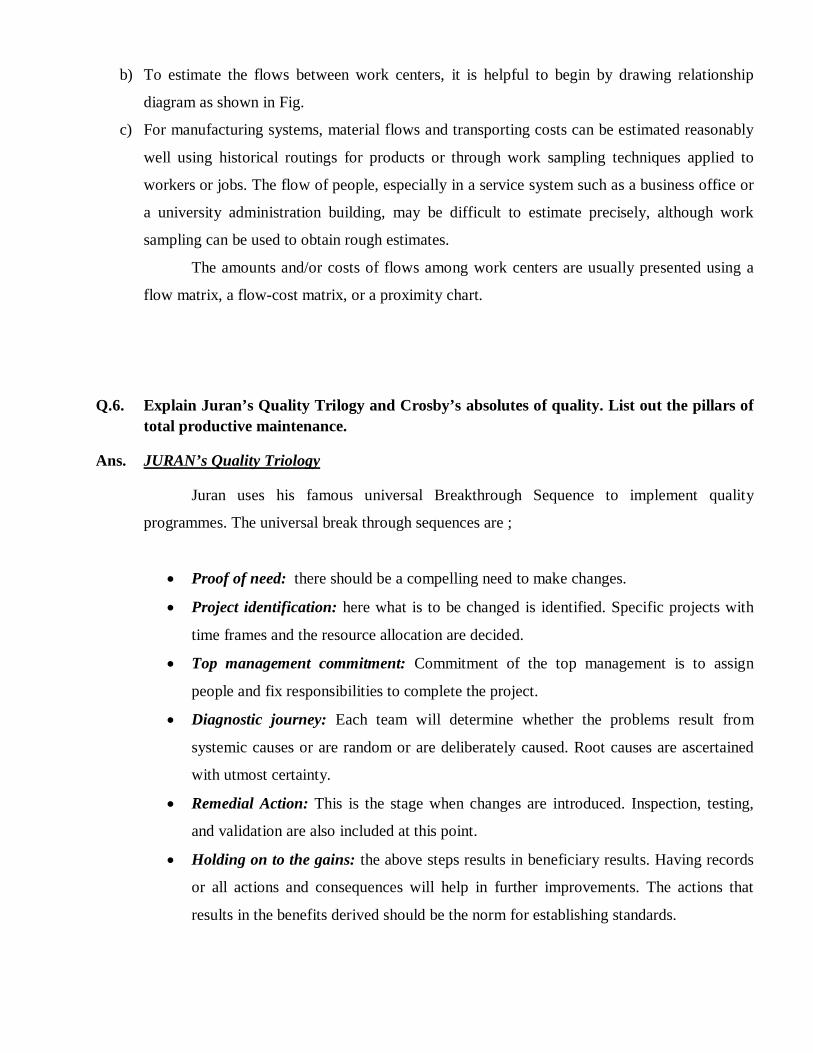
Ans. JURAN’s Quality Triology
Juran uses his famous universal Breakthrough Sequence to implement quality
programmes. The universal break through sequences are ;
Proof of need: there should be a compelling need to make changes.
Project identification: here what is to be changed is identified. Specific projects with
time frames and the resource allocation are decided.
Top management commitment: Commitment of the top management is to assign
people and fix responsibilities to complete the project.
Diagnostic journey: Each team will determine whether the problems result from
systemic causes or are random or are deliberately caused. Root causes are ascertained
with utmost certainty.
Remedial Action: This is the stage when changes are introduced. Inspection, testing,
and validation are also included at this point.
Holding on to the gains: the above steps results in beneficiary results. Having records
or all actions and consequences will help in further improvements. The actions that
results in the benefits derived should be the norm for establishing standards.
Page 12
JURAN has categorised cost of quality in to four categories:
1. Failure Costs–Internal: These are cost of rejections, repairs in terms of materials,
labour, machine time and loss of morale.
2. Failure Costs-External: These are cost of replacement, on-site rework including spare
parts and expenses of the personnel, warranty costs and loss of goodwill.
3. Appraisal Costs: These are cost inspection, including maintenance of records,
certification, segregation costs, and others.
4. Prevention costs: Prevention cost is the sequence of three sets of activities, Quality
planning, Quality control, and Quality improvement, forming the triology to achieve
TOTAL QUALITY MANAGEMENT.
JURAN’s argument says that;
Quality is the result of good planning consideration the needs of both internal and external
customers and develops processes to meet them. The processes are also planned to meet them.
Quality is built into the system of manufacture, inputs and processes that are on stream like raw
material, spare parts, labour, machine maintenance, training, warehousing, inspection
procedures, packaging, and other. All these have to follow standards and control exercises to
make sure that mistake do not occur often and that if mistakes do occur then they are corrected
at the source.
Quality improvement measures are essential to keep the quality culture alive. Newer methods
will be found, some operations can be eliminated, improved technology available. In short, as
experience is gained things can always be done better. IT is for the management to take the
initiative and encourage the employees to be on lookout for opportunities for improvement.
CROSBY’S Absolutes of Quality
Like Deming, Crosby also lays emphasis on top management commitment and responsibility
for designing the system so that defects are not inevitable. He urged that there be no restriction on
spending for achieving quality. In the long run, maintaining quality is more economical than
compromising on its achievement. His absolutes can be listed as under:
Quality is conformance to requirements, not ‘goodness’
Prevention, not appraisal, is the path to quality.
Quality is measured as the price Paid for non-conformance and as indices
Page 13
Quality originates in all factors. There are no quality problems. It is the people designs and
processes that create problems.
Crosby also has given 14 points similar to those of Deming. His approach emphasizes on
measurement of quality, increasing awareness, corrective action, error cause removal and continuously
reinforcing the system, so that advantages derived are not lost over time. He opined that the quality
management regimen should improve that overall health of the organization and prescribed a vaccine.
The ingredients are.
1. Integrity: Honesty and commitment help in producing everything right first time, every
time.
2. Communication: Flow of information between departments, suppliers, customers helps
in indentifying opportunities.
3. Systems and operations: These should bring in a quality environment so that nobody is
comfortable with anything less than the best.
Total Production Maintenance (TPM)
Maintenance is a function in any operations system. Maintenance keeps the equipments in
good condition. Generally equipments deteriorate because usage wear to the parts introducing
inaccuracies on the products made on them. When the deterioration produces a component which
exceeds the permitted deviations rendering them unacceptable, maintenance is undertaken to bring
back the machine to produce acceptable components. Sometimes the failure is sudden and serious and
the equipment stops working. Disruption of production and emergency repairs works are costly and
schedules are missed causing delays in supplies and consequent losses. These breakdowns occur
because the equipment was carrying hidden defects which were not apparent. All theses are attended
to by the maintenances department. Historical records indicate the probability of failures over different
periods thus enabling us to plan to attend to them. With progress in automation, we have costly
equipments. We have flow lines and any one machine breaking down causes a series of machine to be
idle. So, we have to move towards zero breakdowns like we want to move towards zero defects by
implementing TQM Tools.
TPM puts the responsibility of maintenance where it belongs to and the operator who uses the
equipment. It is a companywide activity which involves all the people. The main thrust is eliminating
all break downs. The focus is on the operating personnel because they would know about
malfunctioning earlier and more than anybody else. They work on the machine and are aware of the
slightest variations that occur and thus should be able to plan to remove the cause before it becomes
Page 14
serious. So every planned maintenance activity reduces the probability of a breakdown, Ownership of
the operation and machine increases the commitment of the workmen. Autonomy is the starting point
for learning and excellence. The worker can suggest better ways of improving quality, productivity,
and design. This help in continuous improvement, Team work and participation improves the quality
culture. The principles of 5S- the housekeeping activities which improve efficiency at workplace is
considered a measurable standard to aid the implementation at TPM even in the office rooms.
Page 15
ASSIGNMENTS MBA – 2nd SEM
Subject Code – MB0045 Book ID – B1134
FINANCIAL MANAGEMENT Set – 1
Q1. What are the 4 finance decisions taken by a finance manager.
Ans. A firm performs finance functions simultaneously and continuously in the normal course of the
business. They do not necessarily occur in a sequence. Finance functions call for skilful planning,
control and execution of a firm’s activities. Let us note at the outset hat shareholders are made better
off by a financial decision that increases the value of their shares, Thus while performing the finance
function, the financial manager should strive to maximize the market value of shares. Whatever
decision does a manger takes need to result in wealth maximization of a shareholder.
1. Investment Decision
Investment decision or capital budgeting involves the decision of allocation of capital
or commitment of funds to long-term assets that would yield benefits in the future. Two important
aspects of the investment decision are:
a) The evaluation of the prospective profitability of new investments, and
b) The measurement of a cut-off rate against that the prospective return of new investments could
be compared. Future benefits of investments are difficult to measure and cannot be predicted
with certainty.
Because of the uncertain future, investment decisions involve risk. Investment proposals
should, therefore, be evaluated in terms of both expected return and risk. Besides the decision for
investment managers do see where to commit funds when an asset becomes less productive or non-
profitable.
There is a broad agreement that the correct cut-off rate is the required rate of return or the
opportunity cost of capital. However, there are problems in computing the opportunity cost of capital
in practice from the available data and information. A decision maker should be aware of capital in
practice from the available data and information. A decision maker should be aware of these problems.
2. Financing Decision
Financing decision is the second important function to be performed by the financial
manager. Broadly, her or she must decide when, where and how to acquire funds to meet the firm’s
Page 16
investment needs. The central issue before him or her is to determine the proportion of equity and
debt. The mix of debt and equity is known as the firm’s capital structure. The financial manager must
strive to obtain the best financing mix or the optimum capital structure for his or her firm. The firm’s
capital structure is considered to be optimum when the market value of shares is maximized. The use
of debt affects the return and risk of shareholders; it may increase the return on equity funds but it
always increases risk. A proper balance will have to be struck between return and risk. When the
shareholders’ return is maximized with minimum risk, the market value per share will be maximized
and the firm’s capital structure would be considered optimum. Once the financial manager is able to
determine the best combination of debt and equity, he or she must raise the appropriate amount
through the best available sources. In practice, a firm considers many other factors such as control,
flexibility loan convenience, legal aspects etc. in deciding its capital structure.
3. Dividend Decision
Dividend decision is the third major financial decision. The financial manager must
decide whether the firm should distribute all profits, or retain them, or distribute a portion and retain
the balance. Like the debt policy, the dividend policy should be determined in terms of its impact on
the shareholders’ value. The optimum dividend policy is one that maximizes the market value of the
firm’s shares. Thus if shareholders are not indifferent to the firm’s dividend policy, the financial
manager must determine the optimum dividend – payout ratio. The payout ratio is equal to the
percentage of dividends to earnings available to shareholders. The financial manager should also
consider the questions of dividend stability, bonus shares and cash dividends in practice. Most
profitable companies pay cash dividends regularly. Periodically, additional shares, called bonus share
(or stock dividend), are also issued to the existing shareholders in addition to the cash dividend.
4. Liquidity Decision
Current assets management that affects a firm’s liquidity is yet another important
finances function, in addition to the management of long-term assets. Current assets should be
managed efficiently for safeguarding the firm against the dangers of illiquidity and insolvency.
Investment in current assets affects the firm’s profitability. Liquidity and risk. A conflict exists
between profitability and liquidity while managing current assets. If the firm does not invest sufficient
funds in current assets, it may become illiquid. But it would lose profitability, as idle current assets
would not earn anything. Thus, a proper trade-off must be achieved between profitability and liquidity.
In order to ensure that neither insufficient nor unnecessary funds are invested in current assets, the
Page 17
financial manager should develop sound techniques of managing current assets. He or she should
estimate firm’s needs for current assets and make sure that funds would be made available when
needed. It would thus be clear that financial decisions directly concern the firm’s decision to acquire or
dispose off assets and require commitment or recommitment of funds on a continuous basis. It is in
this context that finance functions are said to influence production, marketing and other functions of
the firm. This, in consequence, finance functions may affect the size, growth, profitability and risk of
the firm, and ultimately, the value of the firm. To quote Ezra Solomon The function of financial
management is to review and control decisions to commit or recommit funds to new or ongoing uses.
Thus, in addition to raising funds, financial management is directly concerned with production,
marketing and other functions, within an enterprise whenever decisions are about the acquisition or
distribution of assets. Various financial functions are intimately connected with each other. For
instance, decision pertaining to the proportion in which fixed assets and current assets are mixed
determines the risk complexion of the firm. Costs of various methods of financing are affected by this
risk. Likewise, dividend decisions influence financing decisions and are themselves influenced by
investment decisions. In view of this, finance manager is expected to call upon the expertise of other
functional managers of the firm particularly in regard to investment of funds. Decisions pertaining to
kinds of fixed assets to be acquired for the firm, level of inventories to be kept in hand, type of
customers to be granted credit facilities, terms of credit should be made after consulting production
and marketing executives.
However, in the management of income finance manager has to act on his own. The
determination of dividend policies is almost exclusively a finance function. A finance manager has a
final say in decisions on dividends than in asset management decisions. Financial management is
looked on as cutting across functional even disciplinary boundaries. It is in such an environment that
finances manager works as a part of total management. In principle, a finance manager is held
responsible to handle all such problem: that involve money matters. But in actual practice, as noted
above, he has to call on the expertise of those in other functional areas to discharge his responsibilities
effectively.
Q.2. What are the factors that affect the financial plan of a company?
Ans. To help your organization succeed, you should develop a plan that needs to be followed. This
applies to starting the company, developing new product, creating a new department or any
undertaking that affects the company’s future. There are several factors that affect planning in an
Page 18
organization. To create an efficient plan, you need to understand the factors involved in the planning
process.
Organizational planning is affected by many factors.
Priorities
In most companies, the priority is generating revenue, and this priority can sometimes interfere
with the planning process of any project. For example, if you are in the process of planning a large
expansion project and your largest customer suddenly threatens to take their business to your
competitor, then you might have to shelve the expansion planning until the customer issue is resolved.
When you start the planning process for any project, you need to assign each of the issues facing the
company a priority rating. That priority rating will determine what issues will sidetrack you from the
planning of your project, and which issues can wait until the process is complete.
Company Resources
Having an idea and developing a plan for your company can help your company to grow and
succeed, but if the company does not have the resources to make the plan come together, it can stall
progress. One of the first steps to any planning process should be an evaluation of the resources
necessary to complete the project, compared to the resources the company has available. Some of the
resources to consider are finances, personnel, space requirements, access to materials and vendor
relationships.
Forecasting
A company constantly should be forecasting to help prepare for changes in the marketplace.
Forecasting sales revenues, materials costs, personnel costs and overhead costs can help a company
plan for upcoming projects. Without accurate forecasting, it can be difficult to tell if the plan has any
chance of success, if the company has the capabilities to pull off the plan and if the plan will help to
strengthen the company’s standing within the industry. For example, if your forecasting for the cost of
goods has changed due to a sudden increase in material costs, then that can affect elements of your
product roll-out plan, including projected profit and the long-term commitment you might need to
make to a supplier to try to get the lowest price possible.
Contingency Planning
To successfully plan, an organization needs to have a contingency plan in place. If the
company has decided to pursue a new product line, there needs to be a part of the plan that addresses
the possibility that the product line will fail. The reallocation of company resources, the acceptable
financial losses and the potential public relations problems that a failed product can cause all need to
be part of the organizational planning process from the beginning.
Page 19
Q.3. Show the relationship between required rate of return and coupon rate on the value of a
bond.
Ans. It is important for prospective bond buyers to know how to determine the price of a bond
because it will indicate the yield received should the bond be purchased. In this section, we will run
through some bond price calculations for various types of bond instruments.
Bonds can be priced at a premium, discount, or at par. If the bond’s price is higher than its par
value, it will sell at a premium because its interest rate is higher than current prevailing rates. If the
bond’s price is lower than its par value, the bond will sell at a discount because its interest rate is lower
than current prevailing interest rates. When you calculate the price of a bond, you are calculating the
maximum price you would want to pay for the bond, given the bond’s coupon rate in comparison to
the average rate most investors are currently receiving in the bond market. Required yield or required
rate of return is the interest rate that a security needs to offer in order to encourage investors to
purchase it. Usually the required yield on a bond is equal to or greater than the current prevailing
interest rates.
Fundamentally, however, the price of a bond is the sum of the present values of all expected
coupon payments plus the present value of the par value at maturity. Calculating bond price is simple:
all we are doing is discounting the known future cash flows. Remember that to calculate present value
(PV) – which is based on the assumption that each payment is re-invested at some interest rate once it
is received–we have to know the interest rate that would earn us a known future value. For bond
pricing, this interest rate is the required yield.
Here is the formula for calculating a bond’s price, which uses the basic present value (PV)
formula:
C = coupon payment
n = number of payments
i = interest rate, or required yield
M = value at maturity, or par value
The succession of coupon payments to be received in the future is referred to as an ordinary
annuity, which is a series of fixed payments at set intervals over a fixed period of time. (Coupons on a
straight bond are paid at ordinary annuity.) The first payment of an ordinary annuity occurs one
interval from the time at which the debt security is acquired. The calculation assumes this time is the
present.
You may have guessed that the bond pricing formula shown above may be tedious to calculate,
as it requires adding the present value of each future coupon payment. Because these payments are
Page 20
paid at an ordinary annuity, however, we can use the shorter PV-of-ordinary-annuity formula that is
mathematically equivalent to the summation of all the PVs of future cash flows. This PV-of-ordinary-
annuity formula replaces the need to add all the present values of the future coupon. The following
diagram illustrates how present value is calculated for an ordinary annuity:
Each full moneybag on the top right represents the fixed coupon payments (future value)
received in periods one, two and three. Notice how the present value decreases for those coupon
payments that are further into the future the present value of the second coupon payment is worth less
than the first coupon and the third coupon is worth the lowest amount today. The farther into the future
a payment is to be received, the less it is worth today – is the fundamental concept for which the PV-
of-ordinary-annuity formula accounts. It calculates the sum of the present values of all future cash
flows, but unlike the bond-pricing formula we saw earlier, it doesn’t require that we add the value of
each coupon payment.
By incorporating the annuity model into the bond pricing formula, which requires us to also
include the present value of the par value received at maturity, we arrive at the following formula:
Let’s go through a basic example to find the price of a plain vanilla bond.
Example 1: Calculate the price of a bond with a par value of $1,000 to be paid in ten years, a coupon
rate of 10%, and a required yield of 12%. In our example we’ll assume that coupon payments are
made semi-annually to bond holders and that the next coupon payment is expected in six months. Here
are the steps we have to take to calculate the price:
1. Determine the Number of Coupon Payments: Because two coupon payments will be made
each year for ten years, we will have a total of 20 coupon payments.
2. Determine the Value of Each Coupon Payment: Because the coupon payments are semi-
annual, divide the coupon rate in half. The coupon rate is the percentage off the bond’s par value. As a
result, each semi-annual coupon payment will be $50 ($1,000 x 0.05).
3. Determine the Semi-Annual Yield: Like the coupon rate, the required yield of 12% must be
divided by two because the number of periods used in the calculation has doubled. If we left the
required yield at 12%, our bond price would be very low and inaccurate. Therefore, the required semi-
annual yield is 6% (0.12/2).
4. Plug the Amounts into the Formula: From the above calculation, we have determined that
the bond is selling at a discount; the bond price is less than its par value because the required yield of
the bond is greater than the coupon rate. The bond must sell at a discount to attract investors, who
could find higher interest elsewhere in the prevailing rates. In other words, because investors can make
a larger return in the market, they need an extra incentive to invest in the bonds.
Page 21
Accounting for Different Payment Frequencies
In the example above coupons were paid semi-annually, so we divided the interest rate and
coupon payments in half to represent the two payments per year. You may be now wondering whether
there is a formula that does not require steps two and three outlined above, which are required if the
coupon payments occur more than once a year. A simple modification of the above formula will allow
you to adjust interest rates and coupon payments to calculate a bond price for any payment frequency:
Notice that the only modification to the original formula is the addition of “F”, which
represents the frequency of coupon payments, or the number of times a year the coupon is paid.
Therefore, for bonds paying annual coupons, F would have a value of one. Should a bond pay
quarterly payments, F would equal four, and if the bond paid semi-annual coupons, F would be two.
Q.4. Discuss the implication of financial leverage for a firm.
Ans. The financial leverage implies the employment of source of funds, involving fixed return so as
to cause more than a proportionate change in earnings per share (EPS) due to change in operating
profits. Like the operating leverage, financial leverage can be positive when operating profits are
increasing and can be negative in the situation of decrease in such profits. In view of these, financial
leverage will affect the financial risk of the firm. An important analytical tool for financial leverage is
the indifference point at which the EPS/market price is the same for different financial plans under
consideration.
The objective of this study was to provide additional evidence on the relationship between
financial leverage and the market value of common stock. Numerous empirical studies have been done
in this area, and, concurrently, many theories have been developed to explain the relationship between
financial leverage and the market value of common stock. Because of the methodological weaknesses
of past studies, however, no conclusions can be drawn as to the validity of the theories. Theories on
financial leverage may be classified into three categories: irrelevance theorem, rising from value
indefinitely with increase in financial leverage, and optimal financial leverage. Empirical implications
of these categories along with the consequences of serious confounding effects are analyzed. The
implications are then compared with evidence from actual events involving financial leverage changes,
and distinguished from each other as finely as possible, using simple and multiple regression analyses,
normal Z-test, and a simulation technique. The evidence shows that changes in the market value of
common stock are positively related to changes in financial leverage for some firms and negatively
Page 22
related for other firms. This evidence is consistent with the existence of an optimal financial leverage
for each firm, assuming that financial leverages of firms with a positive relationship are below the
optimum and those of firms with a negative relationship are above the optimum. The results of the
study do not depend upon the definition of the market portfolio, the definition of the event period, or
the choice of financial leverage measure. Betas estimated from equally weighted market portfolios
were generally higher than those estimated from value weighted market portfolios during 1981-1982.
However, the results of the study were the same for both portfolios. Abnormal returns were
computed for seven and two day event periods, and the results were the same for both periods. Seven
different definitions of financial leverage were tested, and the results were the same for all measures.
Q.5 The cash flows associated with a project are given below: Year Cash flow 0 (100,000) 1 25000 2 40000 3 50000 4 40000 5 30000
Calculate the a) payback period.
b) Benefit cost ratio for 10% cost of capital Ans. a) Payback period:
The cash flows and the cumulative cash flows of the projects is shown under in table
Table Cash flows and cumulative cash flows
Year Project
Cash flows (Rs.) Cumulative Cash flows
1 25,000 25,000 2 40,000 65,000 3 50,000 115,000 4 40,000 155,000 5 30,000 185,000
From the cumulative cash flow column the initial cash outlay of Rs. 1,00,000 lies between 2nd
year and 3rd year in respect of project.
Page 23
Therefore, payback period for project is:
= 000,65
000,65000,1002
= 2.54 years
Hence Pay-back period for project B is 2.54 years.
b) Benefit cost ratio for 10% cost of capital
Table: Present Value (PV) of Cash inflows
Year Cash in flows PV factor at 15% PV of Cash in flows 1 25,000 0.909 22,725 2 40,000 0.826 33,040 3 50,000 0.751 37,550 4 40,000 0.683 27,320 5 30,000 0.621 18,630
PV of Cash inflow 139,265 Initial Cash out lay 1,00,000 NPV 39,265
PV of Cash inflow
Benefit cost ratio = ------------------------ Initial Cash outlay
1,39,265 = --------------
1,00,000
= 1.39 (Ans)
Page 24
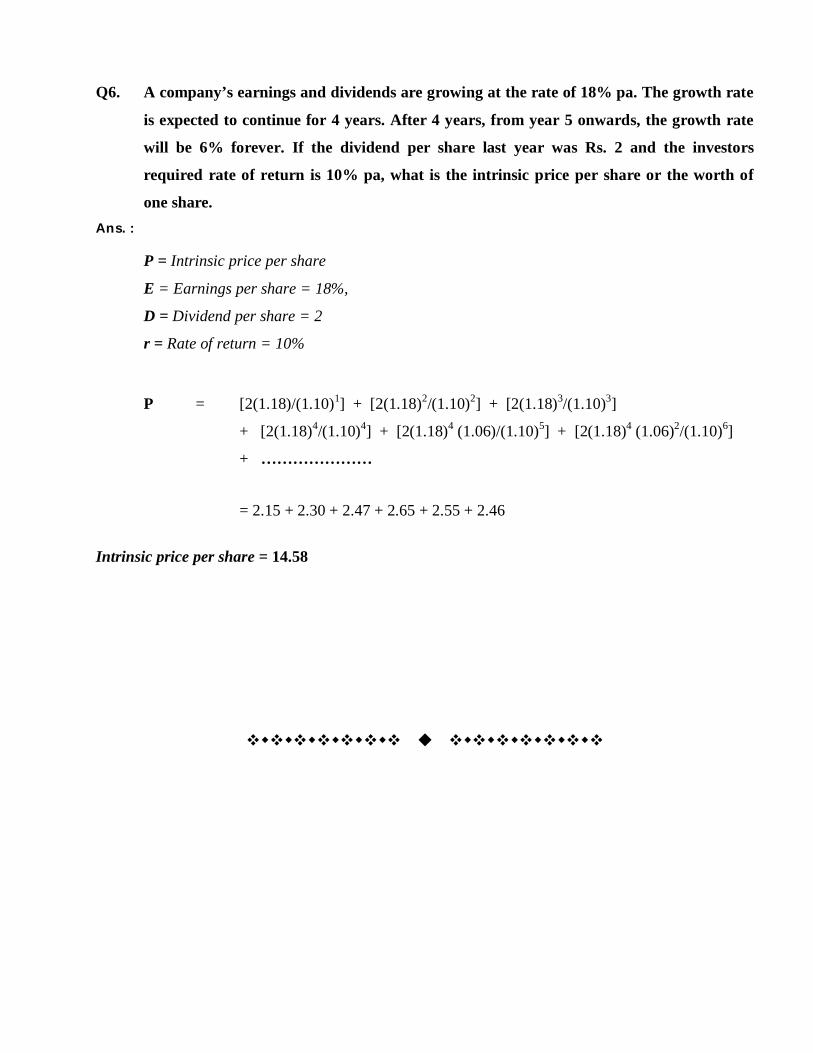
Q6. A company’s earnings and dividends are growing at the rate of 18% pa. The growth rate
is expected to continue for 4 years. After 4 years, from year 5 onwards, the growth rate
will be 6% forever. If the dividend per share last year was Rs. 2 and the investors
required rate of return is 10% pa, what is the intrinsic price per share or the worth of
one share. Ans. :
P = Intrinsic price per share
E = Earnings per share = 18%,
D = Dividend per share = 2
r = Rate of return = 10%
P = [2(1.18)/(1.10)1] + [2(1.18)2/(1.10)2] + [2(1.18)3/(1.10)3]
+ [2(1.18)4/(1.10)4] + [2(1.18)4 (1.06)/(1.10)5] + [2(1.18)4 (1.06)2/(1.10)6]
+ …………………
= 2.15 + 2.30 + 2.47 + 2.65 + 2.55 + 2.46
Intrinsic price per share = 14.58
Page 25
ASSIGNMENTS MBA – 2nd SEM
Subject Code – MB0046 Book ID – B1135
MARKETING MANAGEMENT Set – 1
Q.1 What is Marketing Information System? Explain its characteristics, benefits and
information types.
Ans. A Marketing Information System can be defined as ‘a system in which marketing information is
formally gathered, stored, analysed and distributed to managers in accord with their informational
needs on a regular basis’.
Set of procedures and practices employed in analyzing and assessing marketing information,
gathered continuously from sources inside and outside of a firm. Timely marketing information
provides basis for decisions such as product development or improvement, pricing, packaging,
distribution, media selection, and promotion.
Characteristics of MIS
Philip Kotler defines MIS as “a system that consists of people, equipment and procedures to
gather, sort, analyze, evaluate and distribute needed, timely and accurate information to marketing
decision makers.
Its characteristics are as follows:
1. It is a planned system developed to facilitate smooth and continuous flow of information.
2. It provides pertinent information, collected from sources both internal and external to the
company, for use as the basis of marketing decision making.
3. It provides right information at the right time to the right person.
A well designed MIS serves as a company’s nerve centre, continuously monitoring the market
environment both inside and outside the organization. In the process, it collects lot of data and stores
in the form of a database which is maintained in an organized manner. Marketers classify and analyze
this data from the database as needed.
Benefits of MIS (Marketing Information System)
Various benefits of having a MIS and resultant flow of marketing information are given below:
Page 26
1. It allows marketing managers to carry out their analysis, planning implementation and
control responsibilities more effectively.
2. It ensures effective tapping of marketing opportunities and enables the company to
develop effective safeguard against emerging marketing threats.
3. It provides marketing intelligence to the firm and helps in early spotting of changing
trends.
4. It helps the firm adapt its products and services to the needs and tastes of the customers.
5. By providing quality marketing information to the decision maker, MIS helps in
improving the quality of decision making.
Types of Marketing Informations
A Marketing Information System supplies three types of information.
1. Recurrent Information is the data that MIS supplies periodically at a weekly, monthly,
quarterly, or annual interval. This includes data such as sales, Market Share, sales call reports,
inventory levels, payables, and receivables etc. which are made available regularly. Information on
customer awareness of company’s brands, advertising campaigns and similar data on close
competitors can also be provided.
2. Monitoring Information is the data obtained from regular scanning of certain sources
such as trade journals and other publications. Here relevant data from external environment is captured
to monitor changes and trends related to marketing situation. Data about competitors can also be part
of this category. Some of these data can be purchased at a price from commercial sources such as
Market Research agencies or from Government sources.
3. Problem related or customized information is developed in response to some specific
requirement related to a marketing problem or any particular data requested by a manager. Primary
Data or Secondary Data (or both) are collected through survey Research in response to specific need.
For example, if the company has developed a new product, the marketing manager may want to find
out the opinion of the target customers before launching the product in the market. Such data is
generated by conducting a market research study with adequate sample size, and the findings obtained
are used to help decide whether the product is accepted and can be launched.
Page 27
Q.2 a. Examine how a firm’s macro environment operates.
b. Mention the key points in Psychoanalytic model of consumer behaviour.
Ans. The term micro-environment denotes those elements over which the marketing firm has control
or which it can use in order to gain information that will better help it in its marketing operations. In
other words, these are elements that can be manipulated, or used to glean information, in order to
provide fuller satisfaction to the company’s customers. The objective of marketing philosophy is to
make profits through satisfying customers. This is accomplished through the manipulation of the
variables over which a company has control in such a way as to optimise this objective. The variables
are what Neil Borden has termed ‘the marketing mix’ which is a combination of all the ‘ingredients’ in
a ‘recipe’ that is designed to prove most attractive to customers. In this case the ingredients are
individual elements that marketing can manipulate into the most appropriate mix. E Jerome McCarthy
further dubbed the variables that the company can control in order to reach its target market the ‘four
Ps’. Each of these is discussed in detail in later chapters, but a brief discussion now follows upon each
of these elements of the marketing mix together with an explanation of how they fit into the overall
notion of marketing.
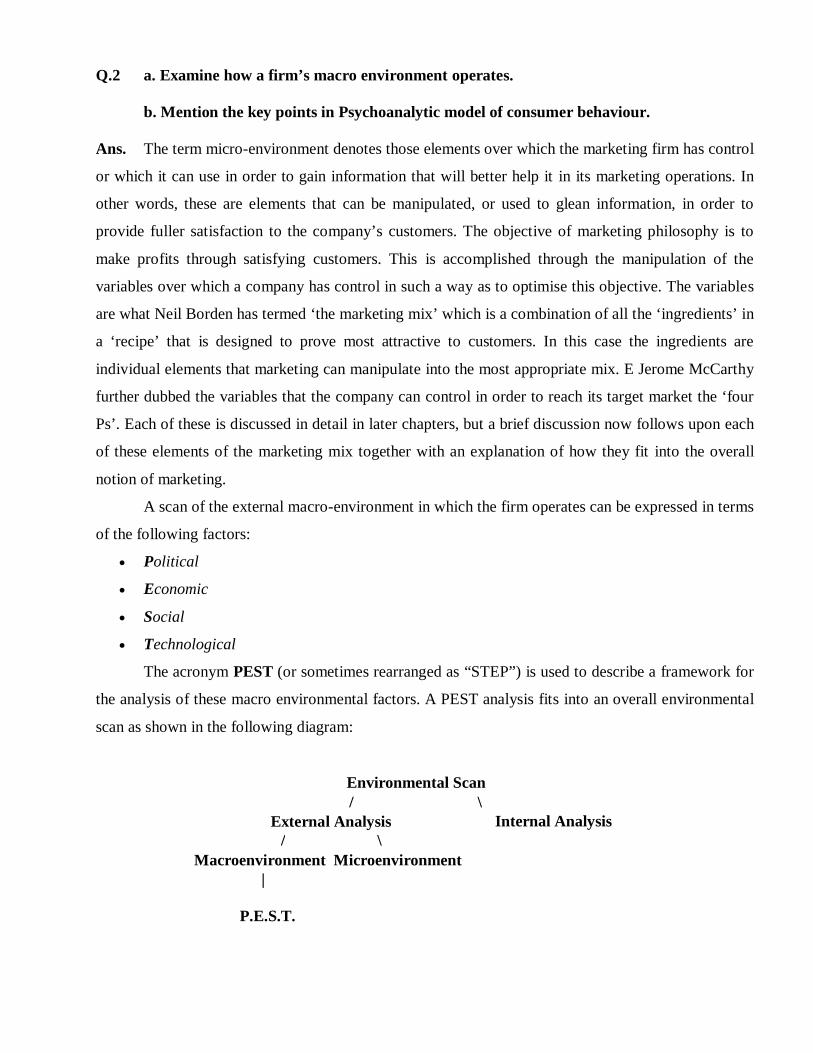
A scan of the external macro-environment in which the firm operates can be expressed in terms
of the following factors:
Political
Economic
Social
Technological
The acronym PEST (or sometimes rearranged as “STEP”) is used to describe a framework for
the analysis of these macro environmental factors. A PEST analysis fits into an overall environmental
scan as shown in the following diagram:
Environmental Scan / \
External Analysis Internal Analysis / \ Macroenvironment Microenvironment |
P.E.S.T.
Page 28
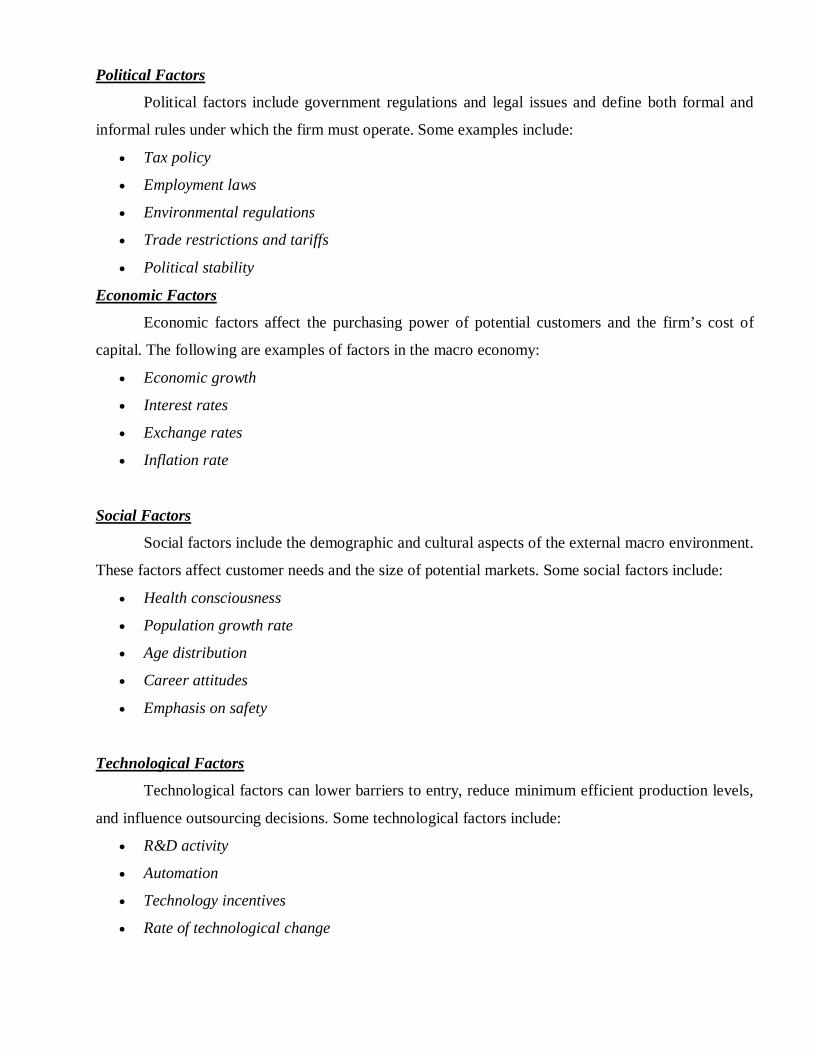
Political Factors
Political factors include government regulations and legal issues and define both formal and
informal rules under which the firm must operate. Some examples include:
Tax policy
Employment laws
Environmental regulations
Trade restrictions and tariffs
Political stability
Economic Factors
Economic factors affect the purchasing power of potential customers and the firm’s cost of
capital. The following are examples of factors in the macro economy:
Economic growth
Interest rates
Exchange rates
Inflation rate
Social Factors
Social factors include the demographic and cultural aspects of the external macro environment.
These factors affect customer needs and the size of potential markets. Some social factors include:
Health consciousness
Population growth rate
Age distribution
Career attitudes
Emphasis on safety
Technological Factors
Technological factors can lower barriers to entry, reduce minimum efficient production levels,
and influence outsourcing decisions. Some technological factors include:
R&D activity
Automation
Technology incentives
Rate of technological change
Page 29
External Opportunities and Threats
The PEST factors combined with external micro environmental factors can be classified as
opportunities and threats in a SWOT analysis.
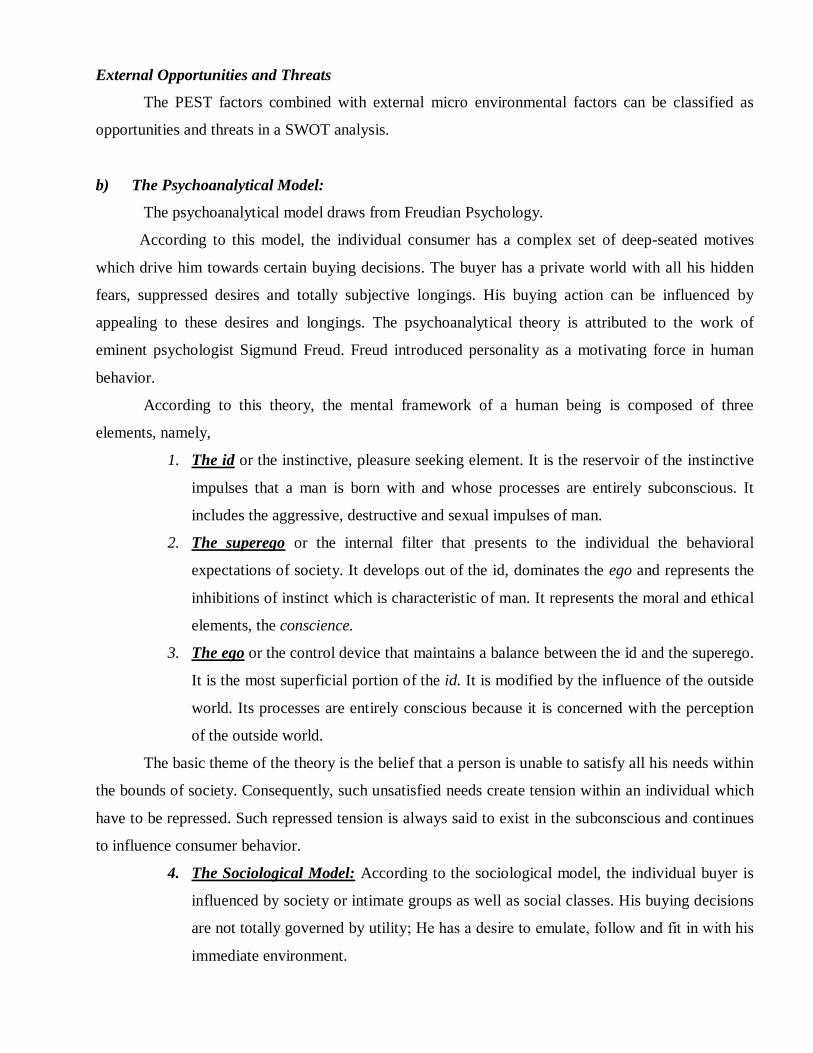
b) The Psychoanalytical Model:
The psychoanalytical model draws from Freudian Psychology.
According to this model, the individual consumer has a complex set of deep-seated motives
which drive him towards certain buying decisions. The buyer has a private world with all his hidden
fears, suppressed desires and totally subjective longings. His buying action can be influenced by
appealing to these desires and longings. The psychoanalytical theory is attributed to the work of
eminent psychologist Sigmund Freud. Freud introduced personality as a motivating force in human
behavior.
According to this theory, the mental framework of a human being is composed of three
elements, namely,
1. The id or the instinctive, pleasure seeking element. It is the reservoir of the instinctive
impulses that a man is born with and whose processes are entirely subconscious. It
includes the aggressive, destructive and sexual impulses of man.
2. The superego or the internal filter that presents to the individual the behavioral
expectations of society. It develops out of the id, dominates the ego and represents the
inhibitions of instinct which is characteristic of man. It represents the moral and ethical
elements, the conscience.
3. The ego or the control device that maintains a balance between the id and the superego.
It is the most superficial portion of the id. It is modified by the influence of the outside
world. Its processes are entirely conscious because it is concerned with the perception
of the outside world.
The basic theme of the theory is the belief that a person is unable to satisfy all his needs within
the bounds of society. Consequently, such unsatisfied needs create tension within an individual which
have to be repressed. Such repressed tension is always said to exist in the subconscious and continues
to influence consumer behavior.
4. The Sociological Model: According to the sociological model, the individual buyer is
influenced by society or intimate groups as well as social classes. His buying decisions
are not totally governed by utility; He has a desire to emulate, follow and fit in with his
immediate environment.
Page 30
5. The Nicosia Model: In recent years, some efforts have been made by marketing
scholars to build buyer behavior models totally from the marketing man’s standpoint.
The Nicosia model and the Howard and Sheth model are two important models in this
category. Both of them belong to the category called the systems model, where the
human being is analyzed as a system with stimuli as the input to the system and
behavior as the output of the system. Francesco Nicosia, an expert in consumer
motivation and behavior put forward his model of buyer behavior in 1966.
The model tries to establish the linkages between a firm and its consumer – how the activities
of the firm influence the consumer and result in his decision to buy. The messages from the firm first
influence the predisposition of the consumer towards the product. Depending on the situation, he
develops a certain attitude towards the product. It may lead to a search for the product or an evaluation
of the product. If these steps have a positive impact on him, it may result in a decision to buy. This is
the sum and substance of the ‘activity explanations’ in the Nicosia Model.
The Nicosia Model groups these activities into four basic fields. Field one has two subfields
the firm’s attributes and the consumer’s attributes. An advertising message from the firm reaches the
consumer’s attributes. Depending on the way the message is received by the consumer, a certain
attribute may develop, and this becomes the input for Field Two. Field Two is the area of search and
evaluation of the advertised product and other alternatives. If this process results in a motivation to
buy, it becomes the input for Field Three. Field Three consists of the act of purchase. And Field Four
consists of the use of the purchased item.
Q.3. Explain the key roles played and various steps involved in organizational buying.
Ans.
Point 1 – Introduction.
The need for an understanding of the organizational buying process has grown in recent years
due to the many competitive challenges presented in business-to-business markets. Since 1980 there
have been a number of key changes in this area, including the growth of outsourcing, the increasing
power enjoyed by purchasing departments and the importance given to developing partnerships with
suppliers.
Point 2 – The organizational buying behaviour process.
The organizational buying behaviour process is well documented with many models depicting
the various phases, the members involved, and the decisions made in each phase. The basic five phase
Page 31
model can be extended to eight; purchase initiation; evaluations criteria formation; information search;
supplier definition for RFQ; evaluation of quotations; negotiations; suppliers choice; and choice
implementation (Matbuy, 1986).
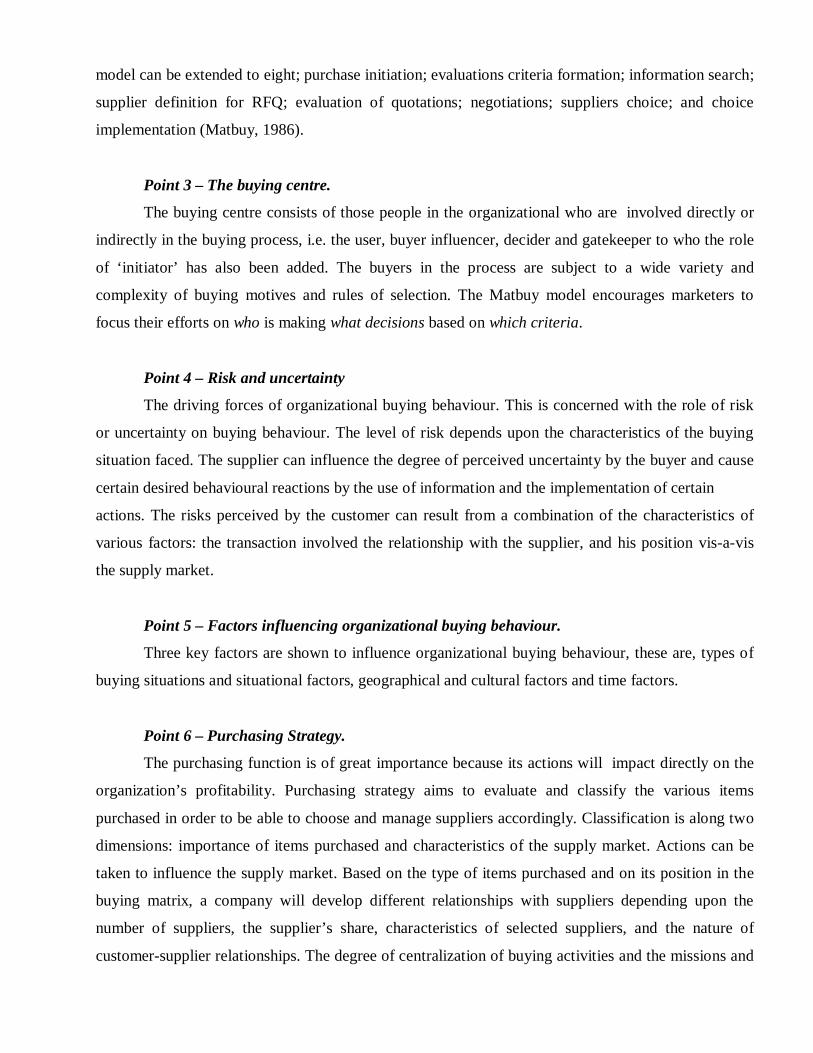
Point 3 – The buying centre.
The buying centre consists of those people in the organizational who are involved directly or
indirectly in the buying process, i.e. the user, buyer influencer, decider and gatekeeper to who the role
of ‘initiator’ has also been added. The buyers in the process are subject to a wide variety and
complexity of buying motives and rules of selection. The Matbuy model encourages marketers to
focus their efforts on who is making what decisions based on which criteria.
Point 4 – Risk and uncertainty
The driving forces of organizational buying behaviour. This is concerned with the role of risk
or uncertainty on buying behaviour. The level of risk depends upon the characteristics of the buying
situation faced. The supplier can influence the degree of perceived uncertainty by the buyer and cause
certain desired behavioural reactions by the use of information and the implementation of certain
actions. The risks perceived by the customer can result from a combination of the characteristics of
various factors: the transaction involved the relationship with the supplier, and his position vis-a-vis
the supply market.
Point 5 – Factors influencing organizational buying behaviour.
Three key factors are shown to influence organizational buying behaviour, these are, types of
buying situations and situational factors, geographical and cultural factors and time factors.
Point 6 – Purchasing Strategy.
The purchasing function is of great importance because its actions will impact directly on the
organization’s profitability. Purchasing strategy aims to evaluate and classify the various items
purchased in order to be able to choose and manage suppliers accordingly. Classification is along two
dimensions: importance of items purchased and characteristics of the supply market. Actions can be
taken to influence the supply market. Based on the type of items purchased and on its position in the
buying matrix, a company will develop different relationships with suppliers depending upon the
number of suppliers, the supplier’s share, characteristics of selected suppliers, and the nature of
customer-supplier relationships. The degree of centralization of buying activities and the missions and
Page 32
status of the buying function can help support purchasing strategy. The company will adapt its
procedures to the type of items purchased which in turn will influence relationships with suppliers.
Point 7 – The future.
Two activities which will be crucial to the future development of organizational buying behaviour will
be information technology and production technologies.
Point 8 – Conclusion.
Organizational buying behaviour is a very complex area, however, an understanding of the key factors
are fundamental to marketing strategy and thus an organization’s ability to compete effectively in the
market place.
Q.4 Explain the different marketing philosophies and its approach.
Ans. Marketing is a societal process by which individuals and groups obtain what they need and want
through creating, offering and freely exchanging products and services of value with others.
According to the American Marketing Association, “Marketing is the process of planning and
executing the conception, pricing, promotion and distribution of ideas, goods and services to create
exchanges that satisfy individual and organizational goods”
There are six competing philosophies under which organizations conduct marketing activities “the
production concept, product concept, selling concept, marketing concept, customer concept; and
societal concept.
1) The Production Concept: The production concept is one of the oldest concepts in business.
The production concept holds that consumers will prefer products that are widely available and
inexpensive. Managers of production-oriented businesses concentrate on achieving high production
efficiency, low costs and mass distribution.
They assume that consumers are primarily interested in products availability and low prices.
This philosophy makes sense in developing countries, where consumers are more interested in
obtaining the product than its features. It is also used when a company wants to expand the market.
2. The product Concept – Product concept holds that consumer will favour these products that
offer the most quality, performance and innovative features. Managers in these organizations focus on
Page 33
making superior products and improving them over time. They assume that buyers admire well-made
products and can evaluate quality and performance product oriented companies often trust that their
engineers can design exceptional products. They get little or no customer input, and very often they
will not even examine competitor’s products.
3. The Selling Concept: The selling concept holds that consumers and businesses, if left alone,
will ordinarily not buy enough of the organization’s products. The organization most, therefore,
undertakes an aggressive selling and promotion effort. This concept assumes that consumers typically
show buying inertia or resistance and must be coaxed into buying. It also assumes that the company
has a whole battery of effective selling and promotion tools to stimulate more buying. The selling
concept is epitomized by the thinking that “The purpose of marketing is to sell more stuff to more
people for more money in order to make more profit
Most firms practice the selling concept when they have over capacity. Their aim is to sell what
they make rather then make what market wants.
4. The Marketing Concept: The marketing concepts hold that the key to achieving its
organizational goals consists of the company being more effective then competitors in creating,
delivering and communicating superior customer value to its chosen target markets.
The marketing concept rests on four pillars: target market, customer needs, integrated
marketing and profitability. There is a contrast between selling and marketing concepts:
“Selling focuses on the needs of the seller; marketing on the needs of the buyer”.
Selling is preoccupied with the seller’s need to convert his product into cash; marketing with
the ideas of satisfying the needs of the customers by means of the product and the whole cluster of
things associated with creating, delivering and finally consuming it.
5. The customer Concept: Under customer concept, companies shape separate offers, services
and messages to individual customers. These companies collect information on each customer’s past
transactions, demographics, psychographics and media and distribution preferences. They hope to
achieve profitable growth through capturing a larger share of each customer’s expenditures by
building high customer loyalty and focusing on customer lifetime value.
The ability of a company to deal with customers are at a time become practical as a result of
advances in factory customization, computers, the internet and database marketing software.
Page 34
6. The Societal Marketing Concept: The societal marketing concept holds that the
organization’s goal is to determine the needs, wants and interests of target markets and to deliver the
desired satisfactions more effectively and efficiently than competitors in a way that preserves or
enhances the consumer’s and the society’s well being.
The societal marketing concept calls upon marketers to build social and ethical considerations
into their marketing practices. They must balance and juggle the often-conflicting criteria of company
profits, consumer want satisfaction and public interest.
Companies see cause-related marketing as an opportunity to enhance their corporate
reputation, raise brand awareness, increase customer loyalty, build sales and increase press coverage.
They believe that consumers will increasingly look for signs of good corporate citizenship that go
beyond supplying rational and emotional benefits.
Q.5. What are the various stages involved in decision process when a consumer is buying new
product? Also, explain the adoption process.
Ans.
Stages of the Consumer Buying Process
Six Stages to the Consumer Buying Decision Process (For complex decisions). Actual
purchasing is only one stage of the process. Not all decision processes lead to a purchase. All
consumer decisions do not always include all 6 stages, determined by the degree of
complexity…discussed next.
The 6 stages are:
1. Problem Recognition (awareness of need)–difference between the desired state and the actual
condition. Deficit in assortment of products. Hunger–Food. Hunger stimulates your need to eat.
Can be stimulated by the marketer through product information–did not know you were deficient? I.E.,
see a commercial for a new pair of shoes, stimulates your recognition that you need a new pair of
shoes.
2. Information search–
o Internal search, memory.
o External search if you need more information. Friends and relatives (word of mouth).
Marketer dominated sources; comparison shopping; public sources etc.
A successful information search leaves a buyer with possible alternatives, the evoked set.
Hungry, want to go out and eat, evoked set is :
Page 35
o Chinese food
o Indian food
o Burger king
o Klondike kates etc
3. Evaluation of Alternatives–need to establish criteria for evaluation features the buyer wants or
does not want. Rank/weight alternatives or resume search. May decide that you want to eat something
spicy, Indian gets highest rank etc.
If not satisfied with your choice then returns to the search phase. Can you think of another
restaurant? Look in the yellow pages etc. Information from different sources may be treated
differently. Marketers try to influence by “framing” alternatives.
4. Purchase decision–Choose buying alternative, includes product, package, store, method of
purchase etc.
5. Purchase–May differ from decision, time lapse between 4 & 5, product availability.
6. Post-Purchase Evaluation–outcome: Satisfaction or Dissatisfaction. Cognitive Dissonance,
have you made the right decision. This can be reduced by warranties, after sales communication etc.
After eating an indian meal, may think that really you wanted a Chinese meal instead.
Adoption Process
Adoption is an individual “™”s decision to become a regular user of a product. How do
potential customers learn about new products, try them, and adopt or reject them? The consumer
adoption process is later followed by the consumer loyalty process, which is the concern of the
established producer. Years ago, new product marketers used a mass market approach to launch
products. This approach had two main drawbacks: It called for heavy marketing expenditures, and it
involved many wasted exposures. These drawbacks led to a second approach, heavy user target
marketing. This approach makes sense, provided that heavy users are identifiable and are early
adopters. However, even within the heavy user group, many heavy users are loyal to existing brands
new product marketers now aim at consumers who are early adopters.
The theory of innovation diffusion and consumer adoption helps marketers identify early
adopters.
An innovation is any good, service, or idea that is perceived by someone as new. The idea may
have a long History, but it is an innovation to the person who sees it as new. Innovations take time to
spread through the social system. The Innovation diffusion process is defined as “the spread of a
new idea from its source of invention or creation to its ultimate users or adopters. The consumer
Page 36
adoption process is the mental process through which an individual passes from first hearing about an
innovation to final adoption.
Adopters of new products have been observed to move through five stages:
1. Awareness : The consumer becomes aware of the innovation but lacks information
about it.
2. Interest : The consumer is stimulated to seek information about the innovation.
3. Evaluation: The consumer considers whether to try the innovation
4. Trial: The consumer tries the innovation to improve his or her estimate of its value.
5. Adoption : The consumer decides to make full and regular use of the innovation.
Q.6. Explain briefly the marketing mix elements for an automobile company giving sufficient
examples.
Ans. Marketing mix is the combination of elements that you will use to market your product. There
are four elements: Product, Place, Price and Promotion. They are called the four Ps of the marketing
mix.
The objectives of this lesson about marketing mix are to give you:
The tools you need for establishing your detailed marketing plan and forecasting your sales.
1. Challenge
2. Product
3. Place
4. Price
5. Promotion
6. Sales strategy
7. Do it yourself
8. Coaching
1. CHALLENGE
You have gotten a rough idea about the market situation and the possible positioning
of your product. Of course, it’s far to be sufficient. Now, you must write your detailed planning. It
means that brainstorming is ended and that you have to go to the specifics in examining and checking
the entire hypothesis you had made in the preceding chapters. You will use the marketing mix.
Page 37
Some people think that the four Ps are old fashionable and propose a new paradigm: The four
Cs! Product becomes customer needs; Place becomes convenience, price is replaced by cost to the
user, promotion becomes communication. It looks like a joke but the Cs is more customer-oriented.
2. PRODUCT
A good product makes its marketing by itself because it gives benefits to the customer.
We can expect that you have right now a clear idea about the benefits your product can offer. Suppose
now that the competitors products offer the same benefits, same quality, same price. You have then to
differentiate your product with design, features, packaging, services, warranties, return and so on. In
general, differentiation is mainly related to:
a) The design: it can be a decisive advantage but it changes with fads. For example, a fun
board must offer a good and fashionable design adapted to young people.
b) The packaging: It must provide a better appearance and a convenient use. In food
business, products often differ only by packaging.
c) The safety: It does not concern fun board but it matters very much for products used
by kids.
d) The “green”: A friendly product to environment gets an advantage among some
segments.
In business to business and for expensive items, the best mean of differentiation are
warranties, return policy, maintenance service, time payments and financial and insurance
services linked to the product.
3. PLACE-DISTRIBUTION
A crucial decision in any marketing mix is to correctly identify the distribution channels.
The question “how to reach the customer” must always be in your mind.
Definition: The place is where you can expect to find your customer and consequently,
where the sale is realized. Knowing this place, you have to look for a distribution channel in order
to reach your customer.
In fact, instead of “place” it would be better to use the word “distribution” but the MBA lingo
uses “place” to memorize the 4 Ps of the marketing mix!
Page 38
4. PRICE
Price means the pricing strategy you will use. You have already fixed, as an hypothesis a
customer price fitted to your customer profile but you will have now to bargain it with the wholesalers
and retailers. Do not be foolish: They know better the market than you and you have to listen their
advices.
5. PROMOTION
Advertising, public relations and so on are included in promotion and consequently in the
4Ps. Sometimes, packaging becomes a fifth P. As promotion is closely linked to the sales, I will
mention here the most common features about the sale strategy.
Definition: The function of promotion is to affect the customer behavior in order to close
a sale.
Of course, it must be consistent with the buying process described in the consumer
analysis.Promotion includes mainly three topics: advertisement, public relations, and sales promotions.
a) Advertisement:
It takes many forms: TV, radio, internet, newspapers, yellow pages, and so on. You have
to take notice about three important notions:
i) Reach is the percentage of the target market which is affected by your advertisement.
For example, if you advertise on radio you must know how many people belonging to your segment
can be affected.
ii) Frequency is the number of time a person is exposed to your message. It is said that a
person must be exposed seven times to the message before to be aware of it. Reach & frequency gives
the gross rating point. You have to evaluate it before any advertisement campaign.
iii) Message: Sometimes, it is called a creative. Anyway, the message must: get attraction,
capture interest, create desire and finally require action that is to say close the sale.
b) Public relations:
Public relations are more subtle and rely mainly on your own personality. For example,
you can deliver public speeches on subjects such as economics, geo-economics, futurology to several
organizations (civic groups, political groups, fraternal organizations, professional associations)
6. SALES STRATEGY
Sales bring in the money. Salesmen are directly exposed to the pressure of finding
prospects, making deals, beating competition and bringing money.
Page 39
ASSIGNMENTS MBA – 2nd SEM
Subject Code – MB0047 Book ID – B1136
MANAGEMENT INFORMATION SYSTEMS Set – 1
Q.1. What is MIS? Define the characteristics of MIS? What are the basic Functions of MIS?
Give some Disadvantage of MIS?
Ans.: MIS systems are extensively used in generating statistical report of any organization which can
be used to study management by behavior. They set objectives to their employees using ratio analysis.
Management also uses MIS for decision making from the low level management to top level
management. In order to perform task using Information systems use of technical support is required.
So it is the combination of 3 components i.e. organization, technology and management.
MIS characteristics
It supports transaction handling and record keeping.
It is also called as integrated database Management System which supports in major functional
areas.
It provides operational, tactical, and strategic level managers with east access to timely
It supports decision –making function which is a vital role of MIS.
It is flexible which is needed to adapt to the changing needs of the organization.
It promotes security system by providing only access to authorized users.
MIS not only provides statistical and data analysis but also works on the basis on MBO
(management by objectives). MIS is successfully used for measuring performance and making
necessary change in the organizational plans and procedures. It helps to build relevant and
measurable objectives, monitor results, and send alerts.
Function of MIS
The main functions of MIS are:
Data Processing: Gathering, storage, transmission, processing and getting output of the data.
Making the data into information is a major task.
Page 40
Prediction: Prediction is based on the historical data by applying the prior knowledge
methodology by using modern mathematics, statistics or simulation. Prior knowledge varies on
the application and with different departments.
Planning: Planning reports are produced based on the enterprise restriction on the companies
and helps in planning each functional department to work reasonably.
Control: MIS helps in monitoring the operations and inspects the plans. It consists of
differences between operation and plan with respect to data belonging to different functional
department. It controls the timely action of the plans and analyzes the reasons for the
differences between the operations and plan. Thereby helps managers to accomplish their
decision making task successfully.
Assistance: It stores the related problems and frequently used information to apply them for
relative economic benefits. Through this it can derive instant answers of the related problem.
Disadvantages of MIS
The following are some of the disadvantages of MIS:
MIS is highly sensitive: MIS is very helpful in maintaining logging information of an
authorized user. This needs to monitor constantly.
Quality of outputs is governed by quality of inputs.
MIS budgeting: There is difficulty in maintaining indirect cost and overheads. Capturing the
actual cost needs to have an accrual system having true costs of outputs which is extremely
difficult. It has been difficult to establish definite findings.
MIS is not flexible to update itself for the changes.
The changes in the decision of top level management decrease its effectiveness.
Information accountability is based on the qualitative factors and the factors like morality,
confidence or attitude will not have any base.
Q.2. Explain Knowledge based system? Explain DSS and OLAP with example?
Ans.:
Knowledge Based System (KBS) :
KBS are the systems based on knowledge base. Knowledge base is the database maintained for
knowledge management which provides the means of data collections, organization and retrieval of
Page 41
knowledge. The knowledge management manages the domain where it creates and enables
organization for adoption of insights and experiences.
There are two types of knowledge bases.
a) Machine Readable Knowledge Bases: The knowledge base helps the computer to process
through. It makes the data in the computer readable code which makes the operator to perform
easier. Such informations are used by semantic web. Semantic web is a web that will make a
description of the system that a system can understand.
b) Human Readable Knowledge Bases: They are designed to help people to retrieve knowledge.
The information need to be processed by the reader. The reader can access the information and
synthesize their own.
Online Analytical Processing (OLAP)
OLAP refers to a system in which there are predefined multiple instances of various modules
used in business applications. Any input to such a system results in verification of the facts with
respect to the available instances. A nearest match is found analytically and the results displayed form
the database. The output is sent only after thorough verification of the input facts fed to the system.
The system goes through a series of multiple checks of the various parameters used in business
decision making. OLAP is also referred to as a multi dimensional analytical model. Many big
companies use OLAP to get good returns in business.
The querying process of the OLAP is very strong. It helps the management take decisions like which
month would be appropriate to launch a product in the market, what should be the production quantity
to maximize the returns, what should be the stocking policy in order to minimize the wastage etc.
A model of OLAP may be well represented in the form of a 3D box. There are six faces of the box.
Each adjoining faces with common vertex may be considered to represent the various parameter of the
business situation under consideration. E.g.: Region, Sales & demand, Product etc.
Decision Support Systems (DSS)
DSS is an interactive computer based system designed to help the decision makers to use all l
the resources available and make use in the decision making. In management many a time problems
arise out of situations for which simple solution may not be possible. To solve such problems you may
have to use complex theories. The models that would be required to solve such problems may have to
be identified. DSS requires a lot of managerial abilities and managers judgment.
Page 42
You may gather and present the following information by using decision support application:
Accessing all of your current information assets, including legacy and relational data sources,
cubes, data warehouses, and data marts
Comparative sales figures between one week and the next
Projected revenue figures based on new product sales assumptions
The consequences of different decision alternatives, given past experience in a context that is
described.
Q.3. What are Value Chain Analysis & describe its significance in MIS? Explain what is
meant by BPR? What is its significance? How Data warehousing & Data Mining is useful
in terms of MIS?
Ans.:
BPR
The existing system in the organization is totally reexamined and radically modified for
incorporating the latest technology. This process of change for the betterment of the organization is
called as Business process re-engineering. This process is mainly used to modernize and make the
organizations efficient. BPR directly affects the performance. It is used to gain an understanding the
process of business and to understand the process to make it better and re-designing and thereby
improving the system.
BPR is mainly used for change in the work process. Latest software is used and accordingly the
business procedures are modified, so that documents are worked upon more easily and efficiently.
This is known as workflow management.
Signification of BPR
Business process are a group of activities performed by various departments, various
organizations or between individuals that is mainly used for transactions in business. There may be
people who do this transaction or tools. We all do them at one point or another either as a supplier or
customer. You will really appreciate the need of process improvement or change in the organizations
conduct with business if you have ever waited in the queue for a longer time to purchase 1 kilo of rice
from a Public Distribution Shop (PDS-ration shop). The process is called the check-out process. It is
called process because uniform standard system has been maintained to undertake such a task. The
Page 43
system starts with forming a queue, receiving the needed item form the shop, getting it billed, payment
which involves billing, paying amount and receiving the receipt of purchase and the process ends up
with the exit from the store. It is the transaction between customer and supplier.
Data Warehousing – Data Warehouse is defined as collection of database which is referred as
relational database for the purpose of querying and analysis rather than just transaction processing.
Data warehouse is usually maintained to store heuristic data for future use. Data warehousing is
usually used to generate reports. Integration and separation of data are the two basic features need to
be kept in mind while creating a data warehousing. The main output from data warehouse systems are;
either tabular listings (queries) with minimal formatting or highly formatted "formal" reports on
business activities. This becomes a convenient way to handle the information being generated by
various processes. Data warehouse is an archive of information collected from wide multiple sources,
stored under a unified scheme, at a single site. This data is stored for a long time permitting the user an
access to archived data for years. The data stored and the subsequent report generated out of a
querying process enables decision making quickly. This concept is useful for big companies having
plenty of data on their business processes. Big companies have bigger problems and complex
problems. Decision makers require access to information from all sources. Setting up queries on
individual processes may be tedious and inefficient.
Data Mining – Data mining is primarily used as a part of information system today, by companies
with a strong consumer focus - retail, financial, communication, and marketing organizations. It
enables these companies to determine relationships among "internal" factors such as price, product
positioning, or staff skills, and "external" factors such as economic indicators, competition, and
customer demographics. And, it enables them to determine the impact on sales, customer satisfaction,
and corporate profits. Finally, it enables them to "drill down" into summary information to view detail
transactional data. With data mining, a retailer could use point-of-sale records of customer purchases
to send targeted promotions based on an individual's purchase history. By mining demographic data
from comment or warranty cards, the retailer could develop products and promotions to appeal to
specific customer segments.
Page 44
Q.4. Explain DFD & Data Dictionary? Explain in detail how the information requirement is
determined for an organization?
Ans.: Data flow diagrams represent the logical flow of data within the system. DFD do not explain
how the processes convert the input data into output. They do not explain how the processing takes
place.
DFD uses few symbols like circles and rectangles connected by arrows to represent data flows.
DFD can easily illustrate relationships among data, flows, external entities an stores. DFD can also be
drawn in increasing levels of detail, starting with a summary high level view and proceeding more
detailed lower level views.
Rounded rectangles represent processes that transform flow of data or work to be done.
Rectangle represents external agents- the boundary of the system. It is source or destination of data.
The open-ended boxes represent data stores, sometimes called files or databases. These data stores
correspond to all instances of a single entity in a data model.
Arrow represents data flows, inputs and outputs to end from the processes.
A number of guideline should be used in DFD
Choose meaningful names for the symbols on the diagram.
Number the processes consistently. The numbers do not imply the sequence.
Avoid over complex DFD.
Make sure the diagrams are balanced
Data Dictionary
The data dictionary is used to create and store definitions of data, location, format for storage
and other characteristics. The data dictionary can be used to retrieve the definition of data that has
already been used in an application. The data dictionary also stores some of the description of data
structures, such as entities, attributes and relationships. It can also have software to update itself and to
produce reports on its contents and to answer some of the queries.
Page 45
Q.5. What is ERP? Explain its existence before and its future after? What are the advantages &
Disadvantages of ERP? What is Artificial Intelligence? How is it different from Neural
Networks?
Ans.: Manufacturing management systems have evolved in stages over the few decades from a simple
means of calculating materials requirements to the automation of an entire enterprise. Around 1980,
over-frequent changes in sales forecasts, entailing continual readjustments in production, as well as the
unsuitability of the parameters fixed by the system, led MRP (Material Requirement Planning) to
evolve into a new concept : Manufacturing Resource Planning (or MRP2) and finally the generic
concept Enterprise Resource Planning (ERP).
Enterprise Resource Planning (ERP) Before and After
Before
Prior to the concept of ERP systems, departments within an organization (for example, the
human resources (HR)) department, the payroll department, and the financial department) would have
their own computer systems. The HR computer system (often called HRMS or HRIS) would typically
contain information on the department, reporting structure, and personal details of employees. The
payroll department would typically calculate and store paycheck information. The financial
department would typically store financial transactions for the organization. Each system would have
to rely on a set of common data to communicate with each other. For the HRIS to send salary
information to the payroll system, an employee number would need to be assigned and remain static
between the two systems to accurately identify an employee. The financial system was not interested
in the employee-level data, but only in the payouts made by the payroll systems, such as the tax
payments to various authorities, payments for employee benefits to providers, and so on. This
provided complications. For instance, a person could not be paid in the payroll system without an
employee number.
After
ERP software, among other things, combined the data of formerly separate applications. This
made the worry of keeping numbers in synchronization across multiple systems disappears. It
standardized and reduced the number of software specialties required within larger organizations.
Page 46
Advantages and Disadvantages
Advantages – In the absence of an ERP system, a large manufacturer may find itself with many
software applications that do not talk to each other and do not effectively interface. Tasks that need to
interface with one another may involve:
A totally integrated system
The ability to streamline different processes and workflows
The ability to easily share data across various departments in an organization
Improved efficiency and productivity levels
Better tracking and forecasting
Lower costs
Improved customer service
Disadvantages – Many problems organizations have with ERP systems are due to inadequate
investment in ongoing training for involved personnel, including those implementing and testing
changes, as well as a lack of corporate policy protecting the integrity of the data in the ERP systems
and how it is used.
While advantages usually outweigh disadvantages for most organizations implementing an ERP
system, here are some of the most common obstacles experienced:
Usually many obstacles can be prevented if adequate investment is made and adequate training is
involved, however, success does depend on skills and the experience of the workforce to quickly adapt
to the new system.
Customization in many situations is limited
The need to reengineer business processes
ERP systems can be cost prohibitive to install and run
Technical support can be shoddy
ERP's may be too rigid for specific organizations that are either new or want to move in a new
direction in the near future.
Page 47
Artificial Intelligence
Artificial Intelligence is the science and technology based on various functions to develop a
system that can think and work like a human being. It can reason, analyze, learn, conclude and solve
problems. The systems which use this type of intelligence are known as artificial intelligent systems
and their intelligence is referred to as artificial intelligence. It was said that the computer don’t have
common sense. Here in AI, the main idea is to make the computer think like human beings, so that it
can be then said that computers also have common sense. More precisely the aim is to obtain a
knowledge based computer system that will help managers to take quick decisions in business.
Artificial Intelligence and Neural Networks
Artificial intelligence is a field of science and technology based on disciplines such as
computer science, biology, psychology, linguistics, mathematics and engineering. The goal of AI is to
develop computers that can simulate the ability to think, see, hear, walk, talk and feel. In other words,
simulation of computer functions normally associated with human intelligence, such as reasoning,
learning and problem solving.
AI can be grouped under three major areas: cognitive science, robotics and natural interfaces.
Cognitive science focuses on researching on how the human brain works and how humans think and
learn. Applications in the cognitive science area of AI include the development of expert systems and
other knowledge-based systems that add a knowledge base and some reasoning capability to
information systems. Also included are adaptive learning systems that can modify their behavior based
on information they acquire as they operate. Chess-playing systems are some examples of such
systems.
Fussy logic systems can process data that are incomplete or ambiguous. Thus, they can solve
semi-structured problems with incomplete knowledge by developing approximate inferences and
answers, as humans do.
Neural network software can learn by processing sample problems and their solutions. As
neural nets start to recognize patterns, they can begin to program themselves to solve such problems
on their own.
Neural networks are computing systems modeled after the human brain’s mesh like network of
interconnected processing elements, called neurons. The human brain is estimated to have over 100
billion neuron brain cells. The neural networks are lot simpler in architecture. Like the brain, the
interconnected processors in a neural network operate in parallel and interact dynamically with each
other.
Page 48
This enables the network to operate and learn from the data it processes, similar to the human
brain. That is, it learns to recognize patterns and relationships in the data. The more data examples it
receives as input, the better it can learn to duplicate the results of the examples it processes. Thus, the
neural networks will change the strengths of the interconnections between the processing elements in
response to changing patterns in the data it receives and results that occur
Q.6. Distinguish between closed decision making system & open decision making system? What
is ‘what – if‘analysis? Why is more time spend in problem analysis & problem definition
as compared to the time spends on decision analysis?
Ans.: If the manager operates in an environment not known to him, then the decision-making system
is termed as an open decision-making system. The conditions of this system in contrast closed
decision-making system are:
a) The manager does not know all the decision alternatives.
b) The outcome of the decision is also not known fully. The knowledge of the outcome may be a
probabilistic one.
c) No method, rule or model is available to study and finalize one decision among the set of
decision alternatives.
What- if analysis
Decisions are made using a model of the problem for developing various solution alternatives
and testing them for best choice. The model is built with some variables and relationship between
variables considered values of variables or relationship in the model may not hold well and therefore
solution needs to be tested for an outcome, if the considered values of variables or relationship change.
This method of analysis is called 'what if analysis.'
Decision Analysis by Analytical Modeling
Based on the methods discussed, a decision is made but such decision needs to be analysed for
conditions and assumptions considered in the decision model. The process is executed through
analytical modelling of problem and solution. The model is analyzed in four ways.
What if analysis
Goal Seeking Analysis
Sensitivity analysis and
Goal Achieving analysis
Page 49
ASSIGNMENTS MBA – 2nd SEM
Subject Code – MB0048 Book ID – B1137
OPERATION RESEARCH Set – 1
Q1. a. Explain how and why Operation Research methods have been valuable in aiding
executive decisions.
b. Discuss the usefulness of Operation Research in decision making process and the role
of computers in this field.
Ans. a)
Churchman, Aackoff and Aruoff defined Operations Research as: “the application of scientific
methods, techniques and tools to operation of a system with optimum solutions to the problems”,
where ‘optimum’ refers to the best possible alternative.
The objective of Operations Research is to provide a scientific basis to the decision-makers for
solving problems involving interaction of various components of the organisation. You can achieve
this by employing a team of scientists from different disciplines, to work together for finding the best
possible solution in the interest of the organisation as a whole. The solution thus obtained is known as
an optimal decision.
You can also define Operations Research as “The use of scientific methods to provide criteria
for decisions regarding man, machine, and systems involving repetitive operations”. OR “Operation
Techniques is a bunch of mathematical techniques.”
“Operation Research is an aid for the executive in making his decisions based on scientific
methods analysis”.
b)
Discussion:-
Any problem, simple or complicated, can use OR techniques to find the best possible solution.
This section will explain the scope of OR by seeing its application in various fields of everyday life.
i) In Defense Operations: In modern warfare, the defense operations are carried out by three
major independent components namely Air Force, Army and Navy. The activities in each of these
components can be further divided in four sub-components namely: administration, intelligence,
operations and training and supply. The applications of modern warfare techniques in each of the
Page 50
components of military organisations require expertise knowledge in respective fields. Furthermore,
each component works to drive maximum gains from its operations and there is always a possibility
that the strategy beneficial to one component may be unfeasible for another component. Thus in
defense operations, there is a requirement to co-ordinate the activities of various components, which
gives maximum benefit to the organisation as a whole, having maximum use of the individual
components. A team of scientists from various disciplines come together to study the strategies of
different components. After appropriate analysis of the various courses of actions, the team selects the
best course of action, known as the ‘optimum strategy’.
ii) In Industry: The system of modern industries is so complex that the optimum point of
operation in its various components cannot be intuitively judged by an individual. The business
environment is always changing and any decision useful at one time may not be so good some time
later. There is always a need to check the validity of decisions continuously against the situations. The
industrial revolution with increased division of labour and introduction of management responsibilities
has made each component an independent unit having their own goals. For example: production
department minimises the cost of production but maximise output. Marketing department maximises
the output, but minimises cost of unit sales. Finance department tries to optimise the capital investment
and personnel department appoints good people at minimum cost. Thus each department plans its own
objectives and all these objectives of various department or components come to conflict with one
another and may not agree to the overall objectives of the organisation. The application of OR
techniques helps in overcoming this difficulty by integrating the diversified activities of various
components to serve the interest of the organisation as a whole efficiently. OR methods in industry can
be applied in the fields of production, inventory controls and marketing, purchasing, transportation and
competitive strategies.
iii) Planning: In modern times, it has become necessary for every government to have careful
planning, for economic development of the country. OR techniques can be fruitfully applied to
maximise the per capita income, with minimum sacrifice and time. A government can thus use OR for
framing future economic and social policies.
iv) Agriculture: With increase in population, there is a need to increase agriculture output. But
this cannot be done arbitrarily. There are several restrictions. Hence the need to determine a course of
Page 51
action serving the best under the given restrictions. You can solve this problem by applying OR
techniques.
v) In Hospitals: OR methods can solve waiting problems in out-patient department of big
hospitals and administrative problems of the hospital organisations.
vi) In Transport: You can apply different OR methods to regulate the arrival of trains and
processing times minimise the passengers waiting time and reduce congestion, formulate suitable
transportation policy, thereby reducing the costs and time of trans-shipment.
vii) Research and Development: You can apply OR methodologies in the field of R&D for
several purposes, such as to control and plan product introductions.
Q2. Explain how the linear programming technique can be helpful in decision-making in the
areas of Marketing and Finance.
Ans.
Linear programming problems are a special class of mathematical programming problems for
which the objective function and all constraints are linear. A classic example of the application of
linear programming is the maximization of profits given various production or cost constraints.
Linear programming can be applied to a variety of business problems, such as marketing mix
determination, financial decision making, production scheduling, workforce assignment, and resource
blending. Such problems are generally solved using the “simplex method.”
Media Selection Problem.
The local Chamber of Commerce periodically sponsors public service seminars and programs.
Promotional plans are under way for this year’s program. Advertising alternatives include television,
radio, and newspaper. Audience estimates, costs, and maximum media usage limitations are shown in
Exhibit 1.
If the promotional budget is limited to $18,200, how many commercial messages should be run
on each medium to maximize total audience contact? Linear programming can find the answer.
Page 52
Q3. a. How do you recognise optimality in the simplex method?
b. Write the role of pivot element in simplex table?
Ans. Simplex method is used for solving linear programming problem especially when more than two
variables are involved.
SIMPLEX METHOD
1. Set up the problem.
That is, write the objective function and the constraints.
2. Convert the inequalities into equations.
This is done by adding one slack variable for each inequality.
3. Construct the initial simplex tableau.
Write the objective function as the bottom row.
4. The most negative entry in the bottom row identifies a column.
5. Calculate the quotients. The smallest quotient identifies a row. The element in the
intersection of the column identified in step 4 and the row identified in this step is identified as the
pivot element. The quotients are computed by dividing the far right column by the identified column in
step 4. A quotient that is a zero, or a negative number, or that has a zero in the denominator, is
ignored.
6. Perform pivoting to make all other entries in this column zero.
This is done the same way as we did with the Gauss-Jordan method.
7. When there are no more negative entries in the bottom row, we are finished; otherwise,
we start again from step 4.
8. Read off your answers.
Get the variables using the columns with 1 and 0s. All other variables are zero. The
maximum value you are looking for appears in the bottom right hand corner.
Example
Niki holds two part-time jobs, Job I and Job II. She never wants to work more than a total of
12 hours a week. She has determined that for every hour she works at Job I, she needs 2 hours of
preparation time, and for every hour she works at Job II, she needs one hour of preparation time, and
she cannot spend more than 16 hours for preparation. If she makes $40 an hour at Job I, and $30 an
hour at Job II, how many hours should she work per week at each job to maximize her income?
Solution: In solving this problem, we will follow the algorithm listed above.
1.Set up the problem. That is, write the objective function and the constraints.
Page 53
Since the simplex method is used for problems that consist of many variables, it is not practical to use
the variables x, y, z etc. We use the symbols x1, x2, x3, and so on.
Let x1 = The number of hours per week Niki will work at Job I.
and x2 = The number of hours per week Niki will work at Job II.
It is customary to choose the variable that is to be maximized as Z.
The problem is formulated the same way as we did in the last chapter.
Maximize Z = 40×1 + 30×2
Subject to: x1 + x2 ≤ 12
2×1 + x2 ≤ 16
x1 ≥ 0; x2 ≥ 0
2. Convert the inequalities into equations. This is done by adding one slack variable for each
inequality.
For example to convert the inequality x1 + x2 ≤ 12 into an equation, we add a non-negative variable
y1, and we get
x1 + x2 + y1 = 12
Here the variable y1 picks up the slack, and it represents the amount by which x1 + x2 falls short of
12. In this problem, if Niki works fewer that 12 hours, say 10, then y1 is 2. Later when we read off
the final solution from the simplex table, the values of the slack variables will identify the unused
amounts.
We can even rewrite the objective function Z = 40×1 + 30×2 as – 40×1 – 30×2 + Z = 0.
After adding the slack variables, our problem reads
Objective function: – 40×1 – 30×2 + Z = 0
Subject to constraints: x1 + x2 + y1 = 12
2×1 + x2 + y2 = 16
x1 ≥ 0; x2 ≥ 0
3. Construct the initial simplex tableau. Write the objective function as the bottom row.
Now that the inequalities are converted into equations, we can represent the problem into an
augmented matrix called the initial simplex tableau as follows.
x1 x2 y1 y2 Z C
1 1 1 0 0 12
2 1 0 1 0 16
–
40
–
30
0 0 1 0
Page 54
Here the vertical line separates the left hand side of the equations from the right side. The horizontal
line separates the constraints from the objective function. The right side of the equation is represented
by the column C.
The reader needs to observe that the last four columns of this matrix look like the final matrix for the
solution of a system of equations. If we arbitrarily choose x1 = 0 and x2 = 0, we get
Which reads
y1 = 12
y2 = 16
Z = 0
The solution obtained by arbitrarily assigning values to some variables and then solving for the
remaining variables is called the basic solution associated with the tableau. So the above solution is
the basic solution associated with the initial simplex tableau. We can label the basic solution variable
in the right of the last column as shown in the table below.
x1 x2 y1 y2 Z
1 1 1 0 0 12 y1
2 1 0 1 0 16 y2
–
40
–
30
0 0 1 0 Z
4. The most negative entry in the bottom row identifies a column.
The most negative entry in the bottom row is –40, therefore the column 1 is
identified.
x1 x2 y1 y2 Z
1 1 1 0 0 12 y1
2 1 0 1 0 16 y2
–
40
–
30
0 0 1 0 Z
Page 55
Q4. What is the significance of duality theory of linear programming? Describe the general rules
for writing the dual of a linear programming problem.
Ans. Linear programming (LP) is a mathematical method for determining a way to achieve the best
outcome (such as maximum profit or lowest cost) in a given mathematical model for some list of
requirements represented as linear relationships. Linear programming is a specific case of
mathematical programming.
More formally, linear programming is a technique for the optimization of a linear objective
function, subject to linear equality and linear inequality constraints. Given a polytope and a real-
valued affine function defined on this polytope, a linear programming method will find a point on the
polytope where this function has the smallest (or largest) value if such point exists, by searching
through the polytope vertices.
Linear programs are problems that can be expressed in canonical form: where x represents the
vector of variables (to be determined), c and b are vectors of (known) coefficients and A is a (known)
matrix of coefficients. The expression to be maximized or minimized is called the objective function
(cTx in this case). The equations Ax ≤ b are the constraints which specify a convex polytope over
which the objective function is to be optimized. (In this context, two vectors are comparable when
every entry in one is less-than or equal-to the corresponding entry in the other. Otherwise, they are
incomparable.)
Linear programming can be applied to various fields of study. It is used most extensively in
business and economics, but can also be utilized for some engineering problems. Industries that use
linear programming models include transportation, energy, telecommunications, and manufacturing. It
has proved useful in modeling diverse types of problems in planning, routing, scheduling, assignment,
and design.
Duality: Every linear programming problem, referred to as a primal problem, can be converted into a
dual problem, which provides an upper bound to the optimal value of the primal problem. In matrix
form, we can express the primal problem as:
Maximize cTx subject to Ax ≤ b, x ≥ 0;
with the corresponding symmetric dual problem,
Minimize bTy subject to ATy ≥ c, y ≥ 0.
An alternative primal formulation is:
Maximize cTx subject to Ax ≤ b;
with the corresponding asymmetric dual problem,
Minimize bTy subject to ATy = c, y ≥ 0.
Page 56
There are two ideas fundamental to duality theory. One is the fact that (for the symmetric dual)
the dual of a dual linear program is the original primal linear program. Additionally, every feasible
solution for a linear program gives a bound on the optimal value of the objective function of its dual.
The weak duality theorem states that the objective function value of the dual at any feasible solution is
always greater than or equal to the objective function value of the primal at any feasible solution. The
strong duality theorem states that if the primal has an optimal solution, x*, then the dual also has an
optimal solution, y*, such that cTx*=bTy*.
A linear program can also be unbounded or infeasible. Duality theory tells us that if the primal
is unbounded then the dual is infeasible by the weak duality theorem. Likewise, if the dual is
unbounded, then the primal must be infeasible. However, it is possible for both the dual and the primal
to be infeasible
Q.5. Use Two-Phase simplex method to solve:
Minimize 321 xxxz
Subject to constraints: x1 - 3 x2 + 4x3 = 5
x1 - 2 x2 ≤ 3
2x2 - 3 x3 ≥ 4
321 0,0 xandxx is unrestricted.
Ans. :- Minimization
Z = x1 + x2 + x3
Subject to constraints x1 - 3 x2 + 4x3 = 5
x1 - 2 x2 ≤ 3
2x2 - 3 x3 ≥ 4
321 0,0 xandxx is integers.
In standard form
Minimization 2211321 OSMAOSMAxxxz
4202
543
2222
121
1321
ASxxSxx
Axxx
Page 57
Simplex Table
Cj 1 1 1 -M 0 M 0 C.B B.V. x1 x2 x3 A1 S1 A2 S2 - M A1 1 - 3 4 1 0 0 0 5
0 S1 1 - 2 0 0 1 0 0 0 - M A2 0 2 1 0 0 1 - 1 4
Z j – Cj - M – 1 M – 1 - 5M – 1
- 2M 0 -2 M M
,`000200,00000
200,1510411203,1100
77
6655
4433
2211
MMczMMMczcz
MMMczMMMczMMMczMMcz
Operation: - l1 = l3 , l1 = l3 - 41l
L1 = l1, l3 = l1 – l2
1 1 1 -M 0 M 0 x1 x2 x3 A1 S1 A2 S2 A1 - M - 1/4 5/4 0 - ¼ 0 1 -1 11/4 S1 0 1 - 2 0 0 1 0 0 0 x3 1 0 2 1 0 0 1 - 1 4 Z j – Cj
1 1 1 - M 0 - M 0 x1 x2 x3 A1 S1 A2 S2 A1 - M - 1/4 5/4 0 - ¼ 0 1 -1 11/4 S1 0 1 - 2 0 0 1 0 0 0 x3 1 0 2 1 0 0 1 - 1 4 Z j – Cj 1
4
M 14
5
M 0 43M 0 - 2M + 1 - M – 1
1 1 1 - M 0 - M 0 x1 x2 x3 A1 S1 A2 S2
- M A1 - 1/4 5/4 0 - ¼ 0 1 -1 11/4 0 S1 1 - 2 0 0 1 0 0 0 1 x3 1 / 4 3 / 4 1 1 / 4 0 0 0 5/4
Z j – Cj 43M 4
5M
0
431 M 0 0 M
Page 58
32312211
4433
2211
43*
38,
58,
54
431
410
4,0
4151
430
45,
431
410
4
llllllll
MMMczcz
MMczMMcz
All true value of zj – cj is positive so z = 9/20 Q.6. Use Branch and Bound method to solve the following L.P.P:
Maximize z = 7x1 + 9x2 Subject to constraints:
7,0357
63
21
21
21
xxxx
xx
x1, x2 ≥ 0 and are integers.
Ans. Maximize z = 7x1 + 9x2 …………………… (i) Subject to constraints
7357
63
2
21
21
xxx
xx
0, 21 xx and all integers
1 1 1 - M 0 - M 0 x1 x2 x3 A1 S1 A2 S2 1 x2 1/5 1 0 1/5 0 4/5 4/5 1/5 0 S1 4/5 0 0 4/5 1 8/5 8/5 22/5 1 x3 11/12 0 1 ¼ 1 0 0 5/4
Z j – Cj + 1/5 0 0 M209 0 M
54 4/5 9/20
Page 59
Mode Situation Additional Types of Solution
x1 x2 Zx
1 9/2 7/2 63 No integer
2 5 0 35 51 x Integer
3 4 10/4 58 41 x . Non-integer. 4 - - - 4,4 21 xx Non-solution
5 4 3 55 3,4 21 xx Integer (optional)
41 x
51 x
Node (i)
Node (iii) Node (ii)
Node (iv)
42 x
32 x
213,
214
27,
29
63
21
21
*
xx
xx
z
310,4
310,4
58
21
21
*
xx
xx
z
0,5
35
21
*
xxz
3,455
21
*
xxz
Optional solution
No solution
Node (v)
Page 60
ASSIGNMENTS MBA – 2nd SEM
Subject Code – MB0049 Book ID – B1138
PROJECT MANAGEMENT Set – 1
Q.1. Describe in detail the various phases of Project management life cycle.
Ans. Projects too have to chore through their life-cycles adhering to a system. Every project
irrespective of its size, scope has to adapt a system. A system in the project management refers to the
existence of interrelationship of activities in a project. The absence of a system makes a project die.
No matter what project it is that you’re preparing for, the project management life cycle can assist you
in narrowing your focus, keeping your objectives in order and finishing said project on time, on budget
and with a minimum of headaches. Every project management life cycle contains five steps: Initiation,
Planning, Execution, Monitoring/Control and Closure. No one step is more important than the other
and each step plays a crucial role in getting your project off the ground, through the race, down the
stretch and across the finish line.
Phases of Project management life cycle
1) Initiation
In this first step you provide an over-view of the project in addition to the strategy you plan on
using in order to achieve the desired results. During the Initiation phase you’ll appoint a project
manager who in turn will -- based on their experience and skills -- select his team members. And lest
you think you need to be a Bill Gates or Donald Trump in order to see your project take on a life of it’s
own, fear not: there are some great technological tools available to get you through the Initiation phase
of the project management life cycle.
2) Planning
The all-important second step of any successful project management life cycle is planning and
should include a detailed breakdown and assignment of each task of your project from beginning to
end. The Planning Phase will also include a risk assessment in addition to defining the criteria needed
for the successful completion of each task. In short, the working process is defined, stake holders are
identified and reporting frequency and channels explained.
3 & 4) Execution and Control
Steps Three and Four take you into deeper water. When it comes to the project management
cycle, execution and control just may be the most important of the five steps in that it ensures project
Page 61
activities are properly executed and controlled. During the Execution and Control phases, the planned
solution is implemented to solve the problem specified in the project's requirements. In product and
system development, a design resulting in a specific set of product requirements is created. This
convergence is measured by prototypes, testing, and reviews. As the Execution and Control phases
progress, groups across the organization become more deeply involved in planning for the final
testing, production, and support.
5) Closure
By the time you reach Step Five -- Closure -- the project manager should be tweaking the little
things to ensure that the project is brought to its proper conclusion. The Closure phase is typically
highlighted by a written formal project review report which contains the following elements: a formal
acceptance of the final product (by the client), Weighted Critical Measurements (a match between the
initial requirements laid out by the client against the final delivered product), lessons learned, project
resources, and a formal project closure notification to higher management.
The Project Management Cycle saves time and keeps everyone on the team focused.
Fortunately, modern technology provides a variety of templates that will take you from A-to-Z (or in
this case from Start-to-Finish) making the Project Management Cycle user friendly no matter what
your level of management experience!
Q.23. List and explain the various aspects of programme management.
Ans.
Project Management
Project management is the planning, organizing, directing, and controlling of company
resources.
It is clear from this definition that project management is concerned with the dynamic
allocation, utilization, and direction of resources (both human and technical), with time -- in relation to
both individual efforts and product delivery schedule -- and with costs, relating to both the acquisition
and consumption of funding. As a corollary, it is safe to say that without the direction project
management provides, work would have to proceed via a series of negotiations, and/or it would not
align with the goals, value proposition, or needs of the enterprise.
Within a program, these same responsibilities (i.e., allocation, utilization, and direction) are
assigned to people at three levels in the management hierarchy; the higher the level, the more general
the responsibilities. For example, at the bottom of the management hierarchy, project managers are
Page 62
assigned to the various projects within the overall program. Each manager carries out the management
responsibilities we described above.
At the middle of the hierarchy is the program manager/director, whose major responsibility is
to ensure that the work effort achieves the outcome specified in the business and IT strategies. This
involves setting and reviewing objectives, coordinating activities across projects, and overseeing the
integration and reuse of interim work products and results. This person spends more time and effort on
integration activities, negotiating changes in plans, and communicating than on the other project
management activities we described (e.g., allocating resources, ensuring adherence to schedule,
budget, etc.).
At the top of the program management hierarchy are the program sponsor(s) and the program
steering committee. Their major responsibility is to own and oversee the implementation of the
program's underlying business and IT strategies, and to define the program's connection to the
enterprise's overall business plan(s) and direction. Their management activities include providing and
interpreting policy, creating an environment that fosters sustainable momentum for the program (i.e.,
removing barriers both inside and outside the enterprise), and periodically reviewing program progress
and interim results to ensure alignment with the overall strategic vision.
These individuals receive periodic summary reports and briefings on funding consumption,
resources and their utilization, and delivery of interim work products and results. Typically, they will
focus on these reports only if there is significant deviation from the plan.
So, let's return to the questions we posed at the start of this section: What is program management? Is
it really management at all?
If you think of management activities strictly as those we defined for project management, then
the answer to the second question is "No," or maybe "Partly." At the project level, managers do still
perform these activities, but the program manager/director addresses a different set of program goals
or needs, which requires a different "bag of tricks" as well as a different view of what is happening and
what needs to get done. And at the top of the hierarchy, the executive leaders who set goals and
oversee the program certainly do not perform the same detailed activities as project managers
Q.3 Write a short note on the following:
a. Project progress control tools and mechanisms
b. Process in bringing about a change in project management.
Page 63
Ans. a) Project progress control tools and mechanism
Project monitoring and control also provides information to support status reporting, progress
measurement, forecasting and updating current cost and schedule information. During this process, it
is also important to ensure that implementation of approved changes are monitored when and as they
occur.
As for tools and techniques used in facilitating project monitoring and control, automated
project management information systems and Earned Value are among the most commonly used. Both
are also used to update information. Earned Value also provides a means for forecasting future
performance based upon past performance.
Status reports are used for communicating project progress and status. Variance Analysis
reports are typically used to identify variances and the information often used as a basis for
determining corrective actions.
The ideal suite of project management tools would provide fully integrated functionality such that:
Tools share the same communication medium to the team (eg Web, Intranet, Exchange server,
EMail, Client/Server)
Information can be automatically transferred to other tools, or, better still, be held only once
(eg team names, task lists, EMail addresses, distribution lists)
Efficiency and effectiveness is supported by automatic messaging and workflow control - the
applications will always prompt those responsible for action.
The tools that are used in project planning are
1. Project organization
Process Skills and activities
Initiation Prepare an outline project justification, plan and project budget
Selection and briefing of the project team, assigning roles and organization
Feasibility study- risk and key success factors
Planning Project definition and project plan
Communicate to the team
Execution Allocating and monitoring the work and cost
Ensuring work and team cohesion
Reporting progress
Control Monitoring progress and managing changes
Helping the team to solve project problems
Page 64
Close Satisfactory delivery
Compiling lessons from project experience
2. Project structure
Development plan, project tracking and oversight.
3. Project Key personnel
Identify those business areas that are within the scope or directly interface with the
scope boundary and list them in the “Business area” column of the project assignment worksheet
Identify the key personnel for each area and list them in the “Person” column of the project
assignment worksheet.
4. Project management team
It is a senior management team, which will be accountable for the project.
Identify project sponsor, client representative and technical representative.
Stage managers- who will plan and manage the project on a day-to-day basis for this stage
Project coordinators- client coordinator and technical coordinator
Clearly define these coordination, control activities and identify the brief suitable personnel to
carry them out
5. Key stakeholders
Identify management level personnel who are critical to the success of the project.
Document the responsibilities of stakeholders
6. Stage teams
Identify appropriate personnel required for the stage, define the team structure and
appoint team leaders. Document the time commitment and responsibilities to be performed by the
team members.
7. Key resources
Individuals assigned to a key resource role may work towards gathering “Business key
resources” and “Technical key resources”. They are project coordinators and team invitees.
8. Work Breakdown Structure (WBS)
The entire process of a project may be considered to be made up on number of sub
process placed in different stage called the Work Breakdown Structure (WBS).
A typical example of a work breakdown structure of a recruitment process is indicated
below :
Page 65
This is the technique to analyze the content of work and cost by breaking it down into
its component parts.
Project key stages form the highest level of the WBS, which is then used to show the
details at the lower levels of the project. Each key stage comprises many tasks
identified at the start of planning and later this list will have to be validated.
WBS is produced by Identifying the key elements, breaking each element down into
component parts and continuing to breakdown until manageable work packages have
been identified. These can then be allocated to the appropriate person. The WBS does
not show dependencies other than a grouping under the key stages. It is not time based-
there is no timescale o the drawing.
9. Task duration
Identifying lead and lag times helps in working out task duration.
Lead time: An amount of time, which a successor task can overlap with its predecessor
task, i.e. the time before the completion of the predecessor at which the successor can start.
Lag time: An amount of time, between a predecessor and a successor task, i.e. the time
after the completion of the predecessor that the start of the successor is delayed
Q.4. Describe in brief the various phases of the quality control process.
Ans. The definition of the ISO 8204 for quality:
“Totality of characteristics of an entity that bears on its ability to satisfy stated and implied needs.”
This means that the Software product conforms to requirements defined.
Description of Phases:
Software Quality Management (SQM) describes the processes that ensure that the Software
Project would reach its goals i.e. meet the client’s expectations.
Any phase of SDLC has its own independent stages of planning, execution, monitoring, control
& reporting. Likewise Software Quality Management has the following three categories or key phases:
1. Quality Planning
2. Quality Assurance
3. Quality Control
Page 66
1. Quality Planning:
Quality Planning is one of the most important parts of Software Quality Management.
It is the start activity of SQM. Through proper planning we can ensure that the processes that make a
product are audited correctly to meet the overall project objective. The staring of Quality Planning
process is followed differently by different Organization. It has been described in different Quality
Policy and Documentation across various Organizations. Other industry standards related to the
Software Project can be referred to Planning phases when needed.
These act as Standard inputs for some specific projects. The Planning stage is having following
inputs:-
1. Quality Policy of a Company
2. Organization Standards
3. Referencing Industry Standards
4. Regulatory compliances
5. Statement Of Work
6. Project specific Requirements
Quality planning process can ensure that standards are as per client’s expectations. The
outcomes of Quality Planning process are as follows:-
a) Standards defined for the project
b) Quality Plan
Various tools and techniques are used to create the quality plan. Few of these tools and
techniques are briefly described in this article. Here are some over views:-
Benchmark: Deciding on the present product standards by comparing with the performances of
similar products which is already exist in the market.
Cost of Quality: The total cost of quality is a summation of prevention, appraisal and failure costs.
Design of Experiments: Statistical data can be used to determine the factors influencing the Quality
of the product.
Page 67
Other tools: There are various tools used in the Planning process such as Cost Benefit Analysis,
Cause and Effect Diagrams, System Flow Charectistics.
All of the above key points aids in the formation of a Quality Management Plan for a particular
project.
2. Quality Assurance:
Quality Plan which is created during planning is the input to Quality Assurance
Process. The Assurance stage is having the following inputs:
1. Quality Audits
2. Various Techniques used to evaluate performance of project
Quality Assurance Process helps us to ensure that the Project is following the Quality
Management Plan. The tools and techniques which are used in Planning Process such as System Flow
Charectistics, Design of Experiments, Cause and Effect Diagrams can be implemented here too, as per
requirements.
3. Quality Control:
The next step to Quality Assurance Process is Quality Control. The Control stage is
having following inputs:
1. Quality Management Plan.
2. Quality Standards for the Project.
3. Actual Observations and Measurements of the work done or work in Progress.
The Quality Control Processes use various tools to Observe and Measure if the work done or
not. If the Work done and it is found that the deliverable is not satisfactory then it can be sent back to
the development team for fixes.
If the work done meets the requirements as defined then it is accepted and released to the
clients.
Page 68
Q.5 Write short note on the following Project Management tools:
a. Quality Certification
b. Strategic inflection point
c. Force field analysis
d. Information risk management
Ans.
Quality Certification
Quality certification has become extremely important in competitive markets and especially in
gaining foothold in exports. To avail the certification of ISO-9000, a unit has to undertake significant
costs; the small scale industries have been found wanting mainly on account of resource crunch to
implement quality systems to obtain this certification. However, as a paradigm shift, SSI must make
'Quality' a way of life.
It has been decided to push the quality upgradation programme in the SSI Sector in a big way.
A scheme has been launched to give financial incentive to those SSI units who acquire ISO-9000
certification, by reimbursing 75% of their costs of obtaining certification, subject to a maximum of Rs.
0.75 lacs per unit.
In order to promote modernisation and technology upgradation in SSI, the units are assisted in
improving the quality of their products.
A new scheme has been launched to assist SSI units in obtaining ISO-9000 or an equivalent
international quality standard. Subject to an upper ceiling of Rs. 075 lacs, each unit is given financial
assistance equal to 75% of the costs incurred in acquiring the quality standard.
The SSI units are also encouraged to participate in quality awareness and learning programmes
organised specially for their benefit.
Strategic inflection point
Point at which a corporation facing a new situation must alter the path it is on and adapt, or fall
into decline. The term was coined by Hungarian-born US computer entrepreneur Andy Grove,
chairman of microprocessor company Intel. Grove believes strategic inflection points occur when a
company's competitive position goes through a transition. The idea concerns how companies
recognize and adapt to paradigm changes. At a strategic inflection point the way a business operates,
and the concept of it as a business, undergoes a change.
Page 69
Force field analysis
Force field analysis is an influential development in the field of social science. It provides a
framework for looking at the factors (forces) that influence a situation, originally social situations. It
looks at forces that are either driving movement toward a goal (helping forces) or blocking movement
toward a goal (hindering forces). The principle, developed by Kurt Lewin, is a significant contribution
to the fields of social science, psychology, social psychology, organizational development, process
management, and change management.
Lewin, a social psychologist, believed the "field" to be a Gestalt psychological environment
existing in an individual's (or in the collective group) mind at a certain point in time that can be
mathematically described in a topological constellation of constructs. The "field" is very dynamic,
changing with time and experience. When fully constructed, an individual's "field" (Lewin used the
term "life space") describes that person's motives, values, needs, moods, goals, anxieties, and ideals.
Lewin believed that changes of an individual's "life space" depend upon that individual's
internalization of external stimuli (from the physical and social world) into the "life space." Although
Lewin did not use the word "experiential," (see experiential learning) he nonetheless believed that
interaction (experience) of the "life space" with "external stimuli" (at what he calls the "boundary
zone") were important for development (or regression). For Lewin, development (or regression) of an
individual occurs when their "life space" has a "boundary zone" experience with external stimuli.
Note, it is not merely the experience that causes change in the "life space," but the acceptance
(internalization) of external stimuli.
Lewin took these same principles and applied them to the analysis of group conflict, learning,
adolescence, hatred, morale, German society, etc. This approach allowed him to break down common
misconceptions of these social phenomena, and to determine their basic elemental constructs. He used
theory, mathematics, and common sense to define a force field, and hence to determine the causes of
human and group behavior.
Information risk management
Information Risk Management follows information as it is created, distributed, stored, copied,
transformed and interacted with throughout its lifecycle.
Three Pillars to an Information Risk Strategy
1) Information-centric approach: Begin by understanding what information is critical to key
business initiatives, such as growth through acquisitions or expanding partnerships. Then diligently
Page 70
‘follow the data’ to gain a more holistic view of all the places where it exists across the organization,
where the points of vulnerability are, and what events could put your business at risk.”
2) Risk/Reward analysis: Security investments should be prioritized, based on the amount of
risk a given activity entails relative to the potential business reward, and in keeping with the
organization’s appetite for risk.
3) Ensuring repeatability: Once enterprise information has been located and a risk assessment
performed, the next step is to implement controls — including policies, technologies, and tools — to
mitigate that risk. Here, organizations often turn to frameworks like ISO 27002 and the PCI Data
Security Standard.
Q.6 List and describe in brief the various types of review used for improving performance of a
project.
Ans. Performance Measurement
Most of us have heard some version of the standard performance measurement cliches: “what
gets measured gets done,” “ if you don’t measure results, you can’t tell success from failure and thus
you can’t claim or reward success or avoid unintentionally rewarding failure,” “ if you can’t recognize
success, you can’t learn from it; if you can’t recognize failure, you can’t correct it,” “if you can’t
measure it, you can neither manage it nor improve it," but what eludes many of us is the easy path to
identifying truly strategic measurements without falling back on things that are easier to measure such
as input, project or operational process measurements.
Performance Measurement is addressed in detail in Step Five of the Nine Steps to Success®
methodology. In this step, Performance Measures are developed for each of the Strategic Objectives.
Leading and lagging measures are identified, expected targets and thresholds are established, and
baseline and benchmarking data is developed. The focus on Strategic Objectives, which should
articulate exactly what the organization is trying to accomplish, is the key to identifying truly strategic
measurements.
Strategic performance measures monitor the implementation and effectiveness of an
organization's strategies, determine the gap between actual and targeted performance and determine
organization effectiveness and operational efficiency.
Page 71
Good Performance Measurement
Focus employees' attention on what matters most to success
Allow measurement of accomplishments, not just of the work that is performed
Provide a common language for communication
Are explicitly defined in terms of owner, unit of measure, collection frequency, data quality,
expected value(targets), and thresholds
Are valid, to ensure measurement of the right things
Are verifiable, to ensure data collection accuracy
Problems in Performance Appraisals:
discourages teamwork
evaluators are inconsistent or use different criteria and standards
only valuable for very good or poor employees
encourages employees to achieve short term goals
managers has complete power over the employees
too subjective
produces emotional anguish
Solutions
Make collaboration a criterion on which employees will be evaluated
Provide training for managers; have the HR department look for patterns on appraisals that
suggest bias or over or under evaluation
Rate selectively (introduce different or various criteria and disclose better performance and
coach for worst performer without disclosing the weakness of the candidate) or increase in
frequency of performance evaluation.
Include long term and short term goals in appraisal process
Introduce M.B.O.(Management By Objectives)
Make criteria specific and test selectivelyEvaluate specific behaviors or results
Focus on behaviors; do not criticize employees; conduct appraisal on time.