27
Office of the Superintendent/Systems Accountability Office • Department of Education • State of Hawaii • RS 13-0654 • December 2012 2011 Superintendent’s 22 nd ANNUAL REPORT

Office of the Superintendent/Systems Accountability Office • Department of Education • State of Hawaii • RS 13-0654 • December 2012
2011 Superintendent’s
22nd ANNUAL REPORT
10/16/12
The Honorable Neil Abercrombie Governor, State of Hawaii
BOARD OF EDUCATIONDonald G. Horner, Chairperson
Brian J. De Lima, Esq., Vice Chairperson Keith Y. Amemiya, Esq. Danicia Honda Nancy J. Budd, Esq. Wesley P. Lo Charlene Cuaresma Cheryl Kauhane Lupenui Kimberly Gennaula Hagi Jim Williams
DEPARTMENT OF EDUCATIONKathryn S. Matayoshi, Superintendent of Education
Ronn K. Nozoe, Deputy Superintendent PatriciaAnnPark,AssistantSuperintendent DavidC.Wu,AssistantSuperintendent&ChiefInformationOfficer OfficeofCurriculum,InstructionandStudentSupport OfficeofInformationTechnologyServices Amy S. Kunz Raymond F. L’Heureux, Assistant Superintendent AssistantSuperintendent&ChiefFinancialOfficer OfficeofSchoolFacilitiesandSupportServices OfficeofFiscalServices Douglas K. Murata, Assistant Superintendent Stephen Schatz, Assistant Superintendent OfficeofHumanResources OfficeofStrategicReform
Calvin Nomiyama Farrington-Kaiser-Kalani Complex Area Superintendent
Ruth Silberstein Kaimuki-McKinley-Roosevelt Complex Area Superintendent
Teri Ushijima, Ed.D. Aiea-Moanalua-Radford Complex Area Superintendent
John Brummel, Ed.D. Leilehua-Mililani-Waialua Complex Area Superintendent
Heidi W. Armstrong Campbell-Kapolei Complex Area Superintendent
Ann A. Mahi Nanakuli-Waianae Complex Area Superintendent
Rodney T.O. Luke Pearl City-Waipahu, Complex Area Superintendent
Lea E. Albert Castle-Kahuku Complex Area Superintendent
Suzanne Mulcahy Kailua-Kalaheo Complex Area Superintendent
Valerie Takata Hilo-Waiakea Complex Area Superintendent
Mary A. Correa Kau-Keaau-Pahoa Complex Area Superintendent
Arthur Souza Honokaa-Kealakehe-Kohala-Konawaena Complex Area Superintendent
Leila Hayashida Baldwin-Kekaulike-Acting Maui Complex Area Superintendent
Lindsay Ball Hana-Lahainaluna-Lanai-Molokai Complex Area Superintendent
William N. Arakaki Kapaa-Kauai-Waimea Complex Area Superintendent
Contents
List of Tables and Charts 4
AtAGlance Official Fall Enrollment for Grades K to 12, Public and Private Schools 5
Hawaii State School Readiness Assessment 5 Percent of Students with Special Needs 5
Educators 6 Funding by Source and Year (in millions) 6
Safety and Well‐Being of Students 6 Hawaii State Assessment 2008‐2011 7 No Child Left Behind Adequate Yearly Progress (AYP) 7 Percent Proficient Annual Yearly Progress (AYP) Mathematics and Reading State Summary 7
Four‐Year Graduation & Dropout Rates 8 High School Diplomas 8 Advanced Placement Programs 8Profiles and Trends
Schools 9 Students 9 Staff 9 State Demographics 10 State School Budget 10
School Finance
Key Finance Indicators 11Percentage of State & Local Expenditures Per Capita Supporting Public Schools 11
Progress & Completion 12 Educational Assessments
National Assessment of Educational Progress (NAEP) 12 Hawaii State Assessment 13 No Child Left Behind (NCLB) 14 Complex Summaries of Students by Percent 15 Complex Summaries of Teachers by Percent 16 Complex Summaries of Wellness Indicators by Percent 17 Complex Summaries of Reading by Percent Proficient and Exceeds by Grade Level 18 Complex Summaries of Mathematics by Percent Proficient and Exceeds by Grade Level 19
Appendices APPENDIX A: Glossary 20 APPENDIX B: References and Resources 24
APPENDIX C: Data Tables 27
4
List of Tables and Charts
Tables
Table 1 Official Fall Enrollment for Grades K to 12, Public and Private Schools
Table 2 Hawaii State School Readiness Assessment
Table 3 Educators
Table 4 Funding by Source and Year (in millions)
Table 5 Safety and Well‐Being of Students
Table 6 Hawaii State Assessment 2008‐2011
Table 7 No Child Left Behind Adequate Yearly Progress (AYP)
Table 8 Four‐Year Graduation & Dropout Rates
Table 9 High School Diplomas
Table 10 Advanced Placement Programs
Table 11 Schools
Table 12 Students
Table 13 Staff
Table 14 State Demographics
Table 15 State School Budget
Table 16 Key Finance Indicators
Table 17 Progress & Completion
Table 18 National Assessment of Educational Progress (NAEP)
Table 19 Hawaii State Assessment
Table 20 No Child Left Behind (NCLB)
Table 21 Complex Summaries of Students by Percent
Table 22 Complex Summaries of Teachers by Percent
Table 23 Complex Summaries of Wellness Indicators by Percent
Table 24 Complex Summaries of Reading by Percent
Table 25 Complex Summaries of Mathematics by Percent
Charts
Chart 1 Percent of Students with Special Needs
Chart 2 Percent Proficient Annual Yearly Progress (AYP) Mathematics and Reading State Summary
Chart 3 Percentage of State & Local Expenditures Per Capita Supporting Public Schools
4
5
AAtt--AA--GGllaannccee
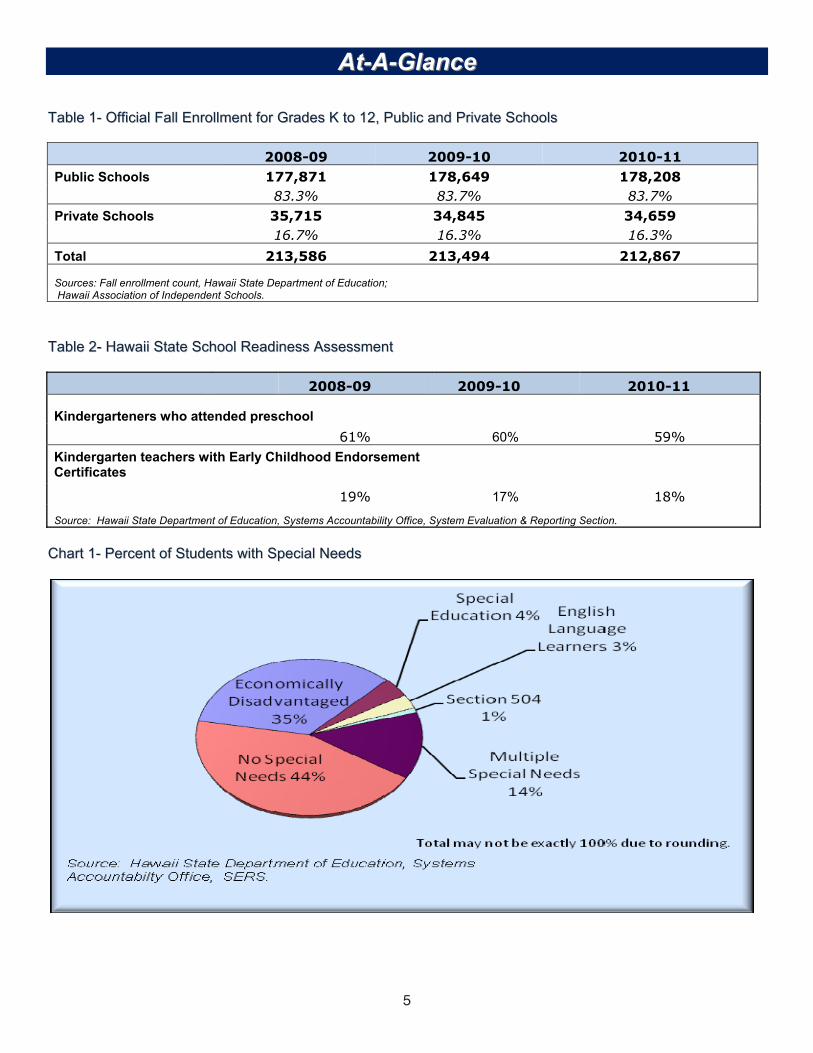
TTaabbllee 11-- OOffffiicciiaall FFaallll EEnnrroollllmmeenntt ffoorr GGrraaddeess KK ttoo 1122,, PPuubblliicc aanndd PPrriivvaattee SScchhoooollss
2008-09 2009-10 2010-11 Public Schools 177,871 178,649 178,208
83.3% 83.7% 83.7% Private Schools 35,715 34,845 34,659
16.7% 16.3% 16.3% Total 213,586 213,494 212,867
Sources: Fall enrollment count, Hawaii State Department of Education; Hawaii Association of Independent Schools.
TTaabbllee 22-- HHaawwaaiiii SSttaattee SScchhooooll RReeaaddiinneessss AAsssseessssmmeenntt
2008-09 2009-10 2010-11
Kindergarteners who attended preschool 61% 60% 59%Kindergarten teachers with Early Childhood Endorsement Certificates
19% 17% 18%
Source: Hawaii State Department of Education, Systems Accountability Office, System Evaluation & Reporting Section.
CChhaarrtt 11-- PPeerrcceenntt ooff SSttuuddeennttss wwiitthh SSppeecciiaall NNeeeeddss
5

6
TTaabbllee 33-- EEdduuccaattoorrss
2009 2010 2011
Fully Licensed 90% 93% 96%
Advanced Degree 31% 32% 34%
5+ Yrs at the Same School 55% 58% 61%
Note. These figures do not include teachers at charter schools.
Source: Hawaii State Department of Education, Office of Human Resources. Based on head counts.
TTaabbllee 44-- FFuunnddiinngg bbyy SSoouurrccee aanndd YYeeaarr ((iinn mmiilllliioonnss))
2009 2010 2011 Appropriated Funds
State General $2,246 $1,978 $1,972 Special 69 75 79 Trust 14 14 68Federal 262 379 309
Source: Hawaii State Department of Education, Office of Fiscal Services.
TTaabbllee 55-- SSaaffeettyy aanndd WWeellll--BBeeiinngg ooff SSttuuddeennttss
2009 2010 2011
Students Not Suspended* 95% 95% 95%
Perceptions of safety & well-being
Students**
Elementary 69% 69% 71%
Middle 50% 50% 53%
High 46% 46% 48%
Teachers** 78% 80% 78%
*Does not include charter schools
**Percent reporting positively on School Quality Survey
Source: Hawaii State Department of Education, Systems Accountability Office.
6
7
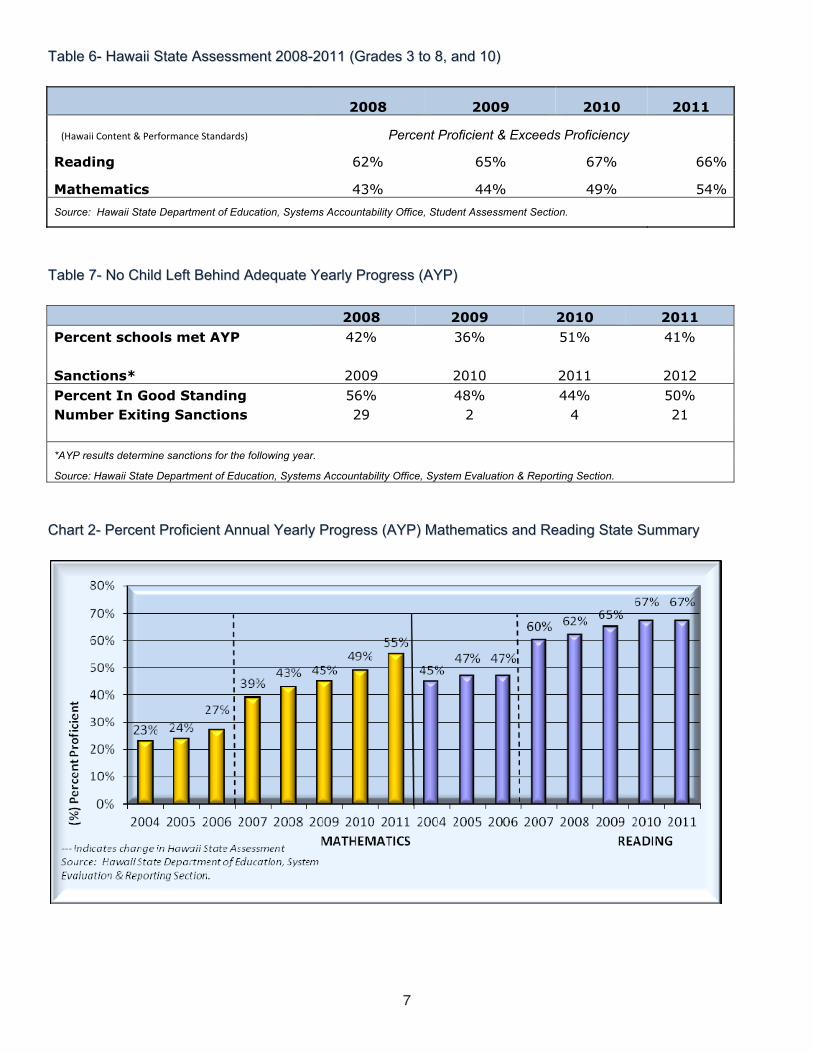
TTaabbllee 66-- HHaawwaaiiii SSttaattee AAsssseessssmmeenntt 22000088--22001111 ((GGrraaddeess 33 ttoo 88,, aanndd 1100))
2008 2009 2010 2011
(Hawaii Content & Performance Standards) Percent Proficient & Exceeds Proficiency
Reading 62% 65% 67% 66%
Mathematics 43% 44% 49% 54%Source: Hawaii State Department of Education, Systems Accountability Office, Student Assessment Section.
TTaabbllee 77-- NNoo CChhiilldd LLeefftt BBeehhiinndd AAddeeqquuaattee YYeeaarrllyy PPrrooggrreessss ((AAYYPP))
2008 2009 2010 2011 Percent schools met AYP 42% 36% 51% 41%
Sanctions* 2009 2010 2011 2012 Percent In Good Standing 56% 48% 44% 50% Number Exiting Sanctions 29 2 4 21
*AYP results determine sanctions for the following year. Source: Hawaii State Department of Education, Systems Accountability Office, System Evaluation & Reporting Section.
CChhaarrtt 22-- PPeerrcceenntt PPrrooffiicciieenntt AAnnnnuuaall YYeeaarrllyy PPrrooggrreessss ((AAYYPP)) MMaatthheemmaattiiccss aanndd RReeaaddiinngg SSttaattee SSuummmmaarryy
7

8
TTaabbllee 88-- FFoouurr--YYeeaarr GGrraadduuaattiioonn && DDrrooppoouutt RRaatteess
2008-09 2009-10 2010-11
Graduation 79.9% 79.3% 80.1%*
Dropouts 15.6% 16.6% 16.4%*
* 2011 percentages based on the new Adjusted Cohort Graduation Rate methodology. (see USDOE website for more information)
Source: Hawaii State Department of Education, Systems Accountability Office, System Evaluation & Reporting Section.
TTaabbllee 99-- HHiigghh SScchhooooll DDiipplloommaass
2008-09 2009-10 2010-11
BOE Diploma 31.7% *17.8% 19.0%
Regular Diploma 62.5% 76.7% 75.7%
Note. Totals do not sum to 100% because non-diploma (certificate) recipients and non-completers make up the remainder of schoolcompletion statistics.
* Effective Fall 2009, BOE Diploma requires 24 credits and the completion of a senior project.
Source: Hawaii State Department of Education, Office of Information Technology Services.
TTaabbllee 1100-- AAddvvaanncceedd PPllaacceemmeenntt PPrrooggrraamm
2009 2010 2011
Number of students enrolled in AP courses1 3,252 3,638 4,245
Number of students who took AP exams2 3,209 3,445 3,996
Number of exams taken2 4,961 4,935 5,813
Number of AP exam results with a score of 3 or higher2 2,072 2,091 2,396
Percent of exams passed2 42% 42% 41%
Sources: Hawaii State Department of Education, Information Resource Management Branch; and the Office of Curriculum Instruction and Student Support.
8
9
Profiles and Trends
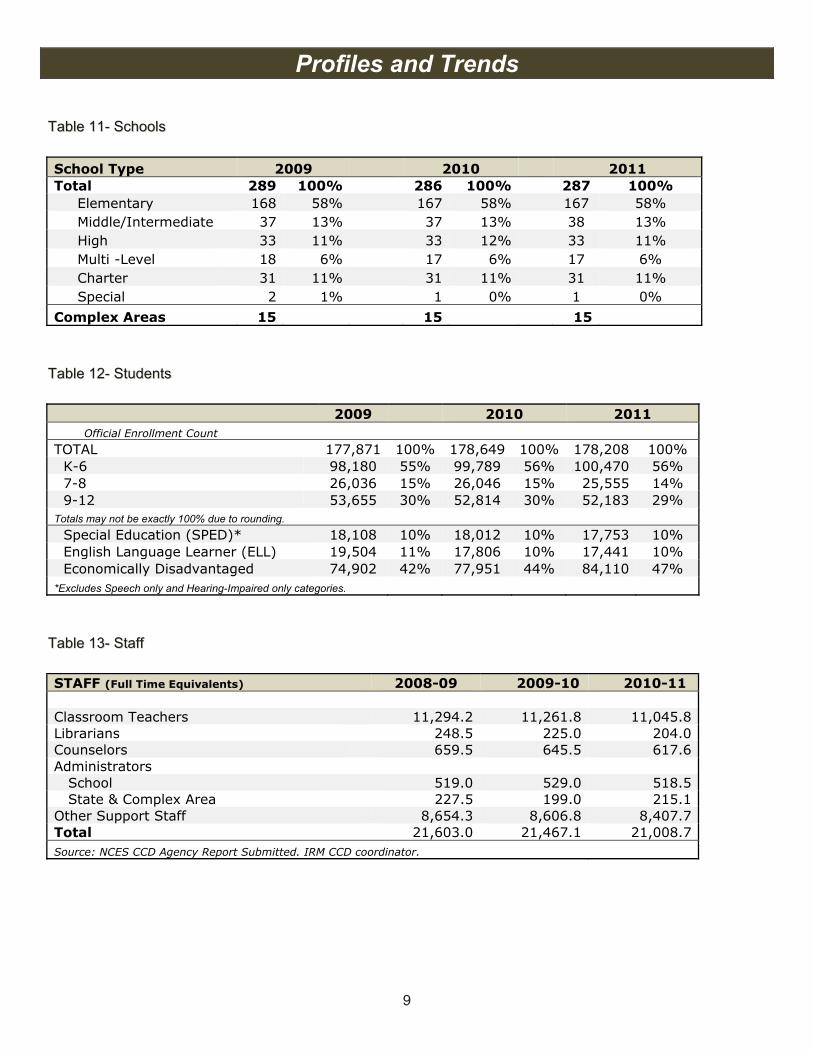
TTaabbllee 1111-- SScchhoooollss
School Type 2009 2010 2011 Total 289 100% 286 100% 287 100% Elementary 168 58% 167 58% 167 58% Middle/Intermediate 37 13% 37 13% 38 13% High 33 11% 33 12% 33 11% Multi -Level 18 6% 17 6% 17 6% Charter 31 11% 31 11% 31 11% Special 2 1% 1 0% 1 0% Complex Areas 15 15 15
TTaabbllee 1122-- SSttuuddeennttss
2009 2010 2011 Official Enrollment Count TOTAL 177,871 100% 178,649 100% 178,208 100% K-6 98,180 55% 99,789 56% 100,470 56% 7-8 26,036 15% 26,046 15% 25,555 14% 9-12 53,655 30% 52,814 30% 52,183 29%Totals may not be exactly 100% due to rounding. Special Education (SPED)* 18,108 10% 18,012 10% 17,753 10% English Language Learner (ELL) 19,504 11% 17,806 10% 17,441 10% Economically Disadvantaged 74,902 42% 77,951 44% 84,110 47%*Excludes Speech only and Hearing-Impaired only categories.
TTaabbllee 1133-- SSttaaffff
STAFF (Full Time Equivalents) 2008-09 2009-10 2010-11
Classroom Teachers 11,294.2 11,261.8 11,045.8Librarians 248.5 225.0 204.0Counselors 659.5 645.5 617.6Administrators School 519.0 529.0 518.5 State & Complex Area 227.5 199.0 215.1Other Support Staff 8,654.3 8,606.8 8,407.7Total 21,603.0 21,467.1 21,008.7Source: NCES CCD Agency Report Submitted. IRM CCD coordinator.
9
10
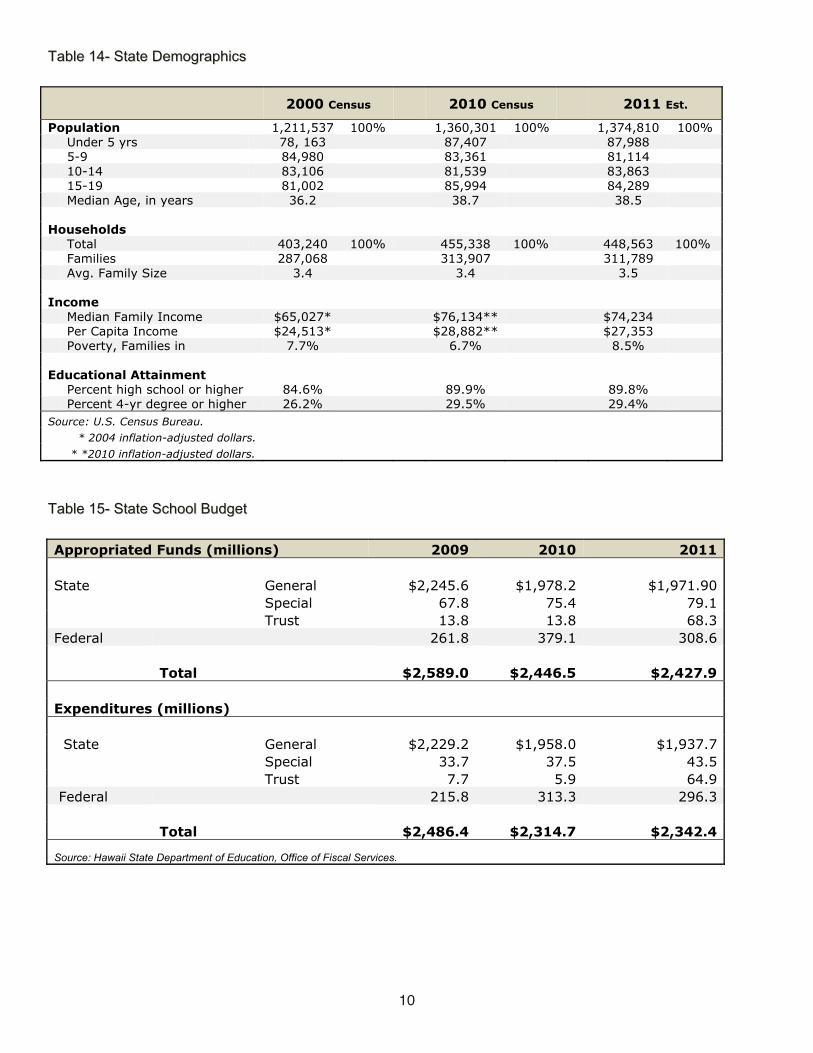
TTaabbllee 1144-- SSttaattee DDeemmooggrraapphhiiccss
2000 Census 2010 Census 2011 Est.
Population 1,211,537 100% 1,360,301 100% 1,374,810 100% Under 5 yrs 78, 163 87,407 87,988
5-9 84,980 83,361 81,114 10-14 83,106 81,539 83,863
15-19 81,002 85,994 84,289 Median Age, in years 36.2 38.7 38.5
Households Total 403,240 100% 455,338 100% 448,563 100%
Families 287,068 313,907 311,789 Avg. Family Size 3.4 3.4 3.5
IncomeMedian Family Income $65,027* $76,134** $74,234
Per Capita Income $24,513* $28,882** $27,353 Poverty, Families in 7.7% 6.7% 8.5%
Educational Attainment Percent high school or higher 84.6% 89.9% 89.8%
Percent 4-yr degree or higher 26.2% 29.5% 29.4% Source: U.S. Census Bureau. * 2004 inflation-adjusted dollars. * *2010 inflation-adjusted dollars.
TTaabbllee 1155-- SSttaattee SScchhooooll BBuuddggeett
Appropriated Funds (millions) 2009 2010 2011
State General $2,245.6 $1,978.2 $1,971.90 Special 67.8 75.4 79.1 Trust 13.8 13.8 68.3Federal 261.8 379.1 308.6
Total $2,589.0 $2,446.5 $2,427.9
Expenditures (millions)
State General $2,229.2 $1,958.0 $1,937.7 Special 33.7 37.5 43.5 Trust 7.7 5.9 64.9 Federal 215.8 313.3 296.3
Total $2,486.4 $2,314.7 $2,342.4
Source: Hawaii State Department of Education, Office of Fiscal Services.
111100
11
School Finance
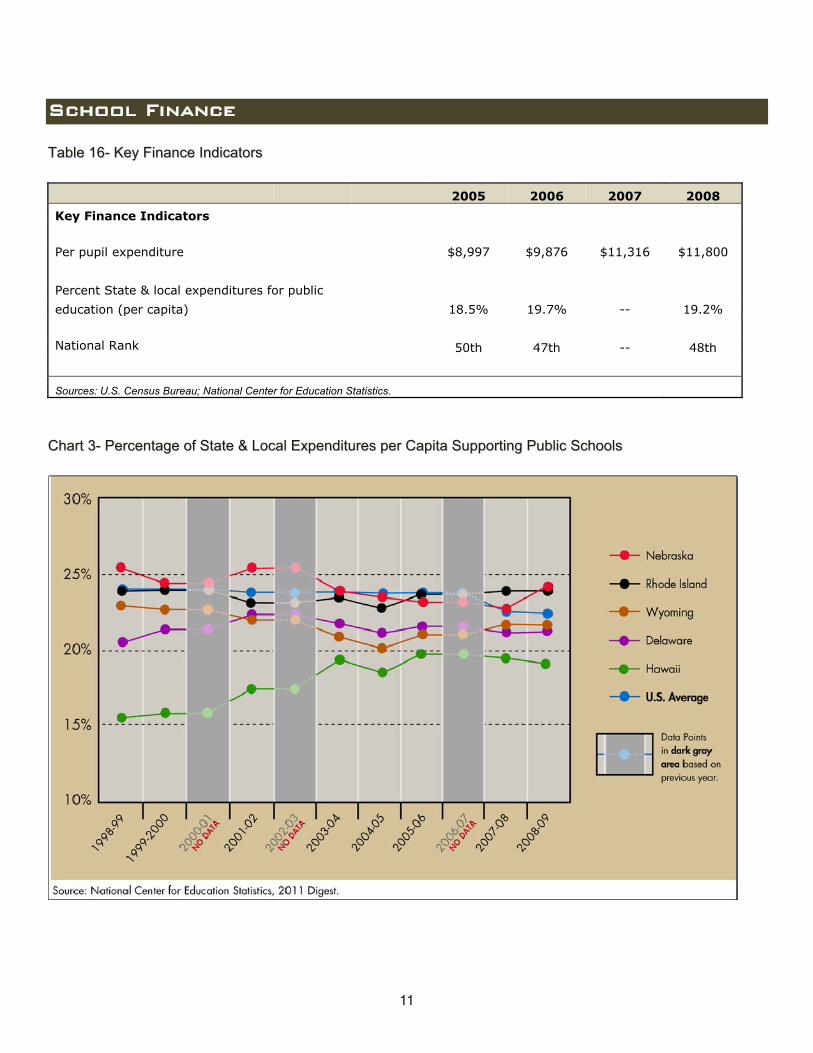
TTaabbllee 1166-- KKeeyy FFiinnaannccee IInnddiiccaattoorrss
2005 2006 2007 2008 Key Finance Indicators
Per pupil expenditure $8,997 $9,876 $11,316 $11,800
Percent State & local expenditures for public education (per capita) 18.5% 19.7% -- 19.2%
National Rank 50th 47th -- 48th
Sources: U.S. Census Bureau; National Center for Education Statistics.
CChhaarrtt 33-- PPeerrcceennttaaggee ooff SSttaattee && LLooccaall EExxppeennddiittuurreess ppeerr CCaappiittaa SSuuppppoorrttiinngg PPuubblliicc SScchhoooollss
11
12
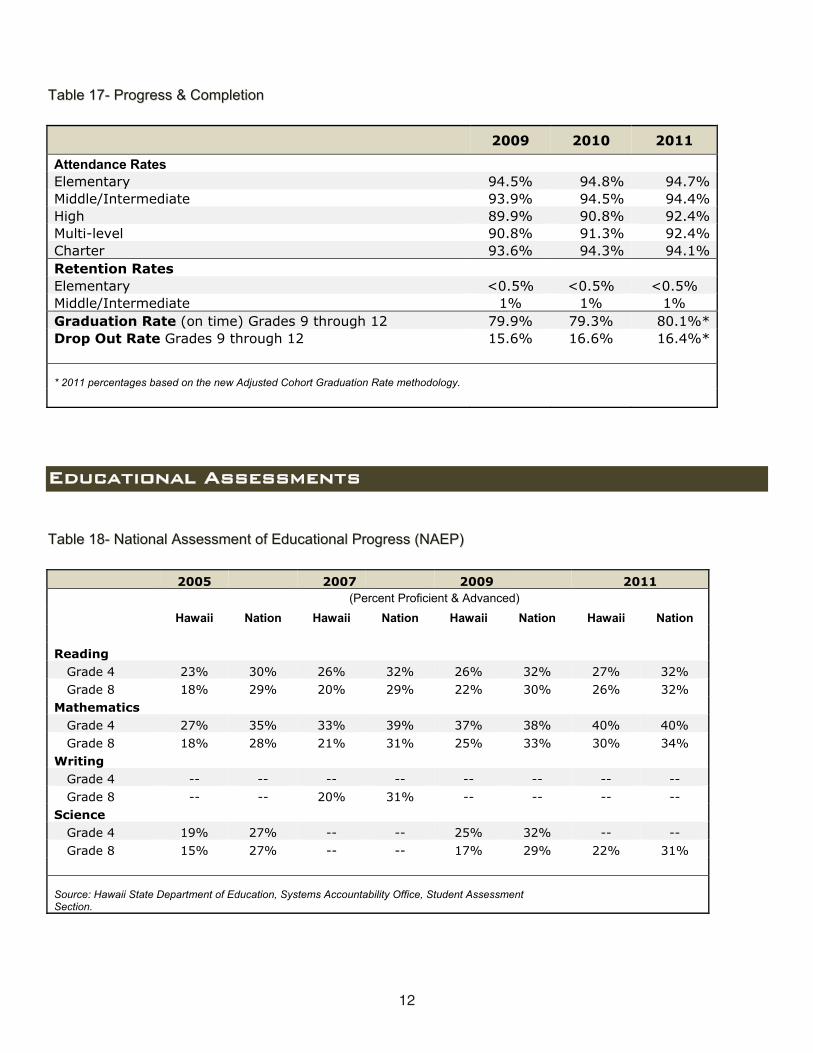
TTaabbllee 1177-- PPrrooggrreessss && CCoommpplleettiioonn
2009 2010 2011
Attendance Rates Elementary 94.5% 94.8% 94.7%Middle/Intermediate 93.9% 94.5% 94.4%High 89.9% 90.8% 92.4%Multi-level 90.8% 91.3% 92.4%Charter 93.6% 94.3% 94.1%Retention Rates Elementary <0.5% <0.5% <0.5% Middle/Intermediate 1% 1% 1% Graduation Rate (on time) Grades 9 through 12 79.9% 79.3% 80.1%*Drop Out Rate Grades 9 through 12 15.6% 16.6% 16.4%*
* 2011 percentages based on the new Adjusted Cohort Graduation Rate methodology.
Educational Assessments
TTaabbllee 1188-- NNaattiioonnaall AAsssseessssmmeenntt ooff EEdduuccaattiioonnaall PPrrooggrreessss ((NNAAEEPP))
2005 2007 2009 2011 (Percent Proficient & Advanced)
Hawaii Nation Hawaii Nation Hawaii Nation Hawaii Nation
Reading Grade 4 23% 30% 26% 32% 26% 32% 27% 32% Grade 8 18% 29% 20% 29% 22% 30% 26% 32% Mathematics Grade 4 27% 35% 33% 39% 37% 38% 40% 40% Grade 8 18% 28% 21% 31% 25% 33% 30% 34% Writing Grade 4 -- -- -- -- -- -- -- -- Grade 8 -- -- 20% 31% -- -- -- -- Science Grade 4 19% 27% -- -- 25% 32% -- -- Grade 8 15% 27% -- -- 17% 29% 22% 31%
Source: Hawaii State Department of Education, Systems Accountability Office, Student Assessment Section.
12
13
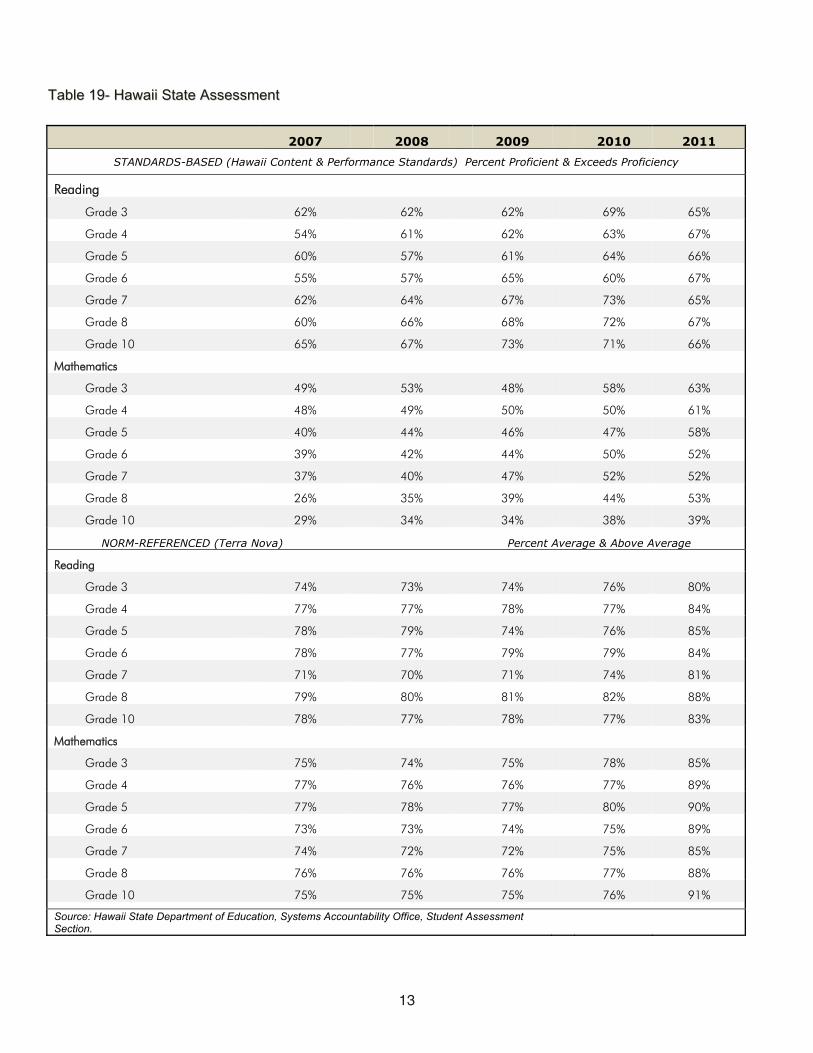
TTaabbllee 1199-- HHaawwaaiiii SSttaattee AAsssseessssmmeenntt
2007 2008 2009 2010 2011 STANDARDS-BASED (Hawaii Content & Performance Standards) Percent Proficient & Exceeds Proficiency
Reading
Grade 3 62% 62% 62% 69% 65%
Grade 4 54% 61% 62% 63% 67%
Grade 5 60% 57% 61% 64% 66%
Grade 6 55% 57% 65% 60% 67%
Grade 7 62% 64% 67% 73% 65%
Grade 8 60% 66% 68% 72% 67%
Grade 10 65% 67% 73% 71% 66%
Mathematics
Grade 3 49% 53% 48% 58% 63%
Grade 4 48% 49% 50% 50% 61%
Grade 5 40% 44% 46% 47% 58%
Grade 6 39% 42% 44% 50% 52%
Grade 7 37% 40% 47% 52% 52%
Grade 8 26% 35% 39% 44% 53%
Grade 10 29% 34% 34% 38% 39%
NORM-REFERENCED (Terra Nova) Percent Average & Above Average
Reading
Grade 3 74% 73% 74% 76% 80%
Grade 4 77% 77% 78% 77% 84%
Grade 5 78% 79% 74% 76% 85%
Grade 6 78% 77% 79% 79% 84%
Grade 7 71% 70% 71% 74% 81%
Grade 8 79% 80% 81% 82% 88%
Grade 10 78% 77% 78% 77% 83%
Mathematics
Grade 3 75% 74% 75% 78% 85%
Grade 4 77% 76% 76% 77% 89%
Grade 5 77% 78% 77% 80% 90%
Grade 6 73% 73% 74% 75% 89%
Grade 7 74% 72% 72% 75% 85%
Grade 8 76% 76% 76% 77% 88%
Grade 10 75% 75% 75% 76% 91%
Source: Hawaii State Department of Education, Systems Accountability Office, Student Assessment Section.
13

14
TTaabbllee 2200-- NNoo CChhiilldd LLeefftt BBeehhiinndd ((NNCCLLBB))
2007 2008 2009 2010 2011 Adequate Yearly Progress
(AYP) All Schools Met 184 65% 119 42% 101 36% 145 51% 117 41% Not Met 98 35% 164 58% 183 64% 141 49% 169 59% Title I Met 118 61% 65 36% 54 30% 90 46% 77 38% Not Met 75 39% 118 64% 126 70% 107 54% 128 62% Charters Met 18 67% 8 29% 8 29% 12 39% 10 32%
Not Met 9 33% 20 71% 20 71% 19 61% 21 68%
14
Sanction Status 2008 2009 2010 2011 2012 All Schools
No Sanctions
In Good Standing, Unconditional 118 42% 113 40% 90 32% 109 38% 97 34%
In Good Standing, Pending 2 1% 45 16% 47 17% 18 6% 45 16%
Totals 120 43% 158 56% 137 48% 127 44% 142 50%
Sanctions
School Improvement Year 1 38 13% 2 1% 24 8% 27 9% 13 5%
School Improvement Year 2 12 4% 20 7% 4 1% 14 5% 20 7%
Corrective Action 19 7% 8 3% 19 7% 12 4% 12 4%
Planning for Restructuring 45 16% 17 6% 10 4% 15 5% 13 5%
Restructuring 48 17% 78 28% 90 32% 91 32% 86 30%
Totals 162 57% 125 44% 147 52% 159 56% 144 51%
Charter Schools
No Sanctions
In Good Standing, Unconditional 13 48% 8 29% 6 21% 7 23% 7 64%
In Good Standing, Pending 2 7% 9 32% 4 14% 5 16% 4 36%
Totals 15 56% 17 61% 10 36% 12 39% 11 35%
Sanctions
School Improvement Year 1 2 7% 2 7% 7 25% 4 13% 4 20%
School Improvement Year 2 2 7% 1 4% 2 7% 5 16% 4 20%
Corrective Action 5 19% 1 4% 1 4% 2 6% 4 20%
Planning for Restructuring 2 7% 5 18% 3 11% 0 0% 1 5%
Restructuring 1 4% 2 7% 5 18% 8 26% 7 35%
Totals 12 44% 11 39% 18 64% 19 61% 20 65%
Totals may not be exactly 100% due to rounding.
Source: Hawaii State Department of Education, Systems Accountability Office, System Evaluation & Reporting Section.
15
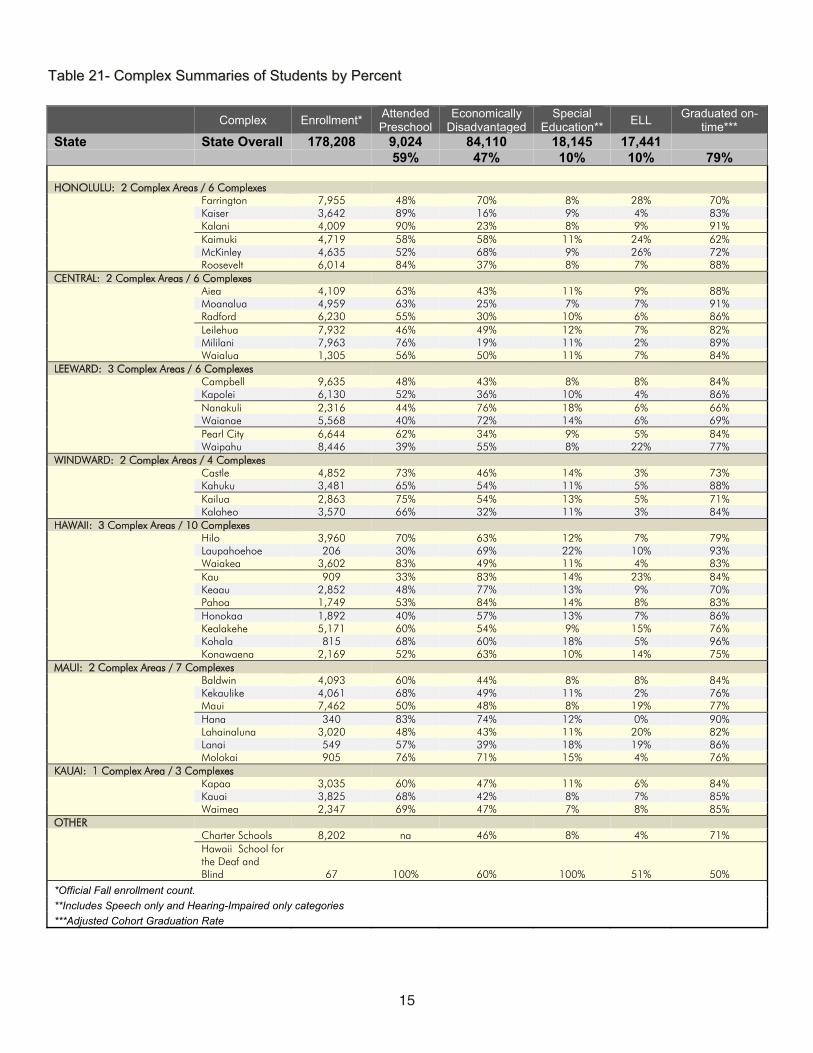
TTaabbllee 2211-- CCoommpplleexx SSuummmmaarriieess ooff SSttuuddeennttss bbyy PPeerrcceenntt
Complex Enrollment* AttendedPreschool
Economically Disadvantaged
Special Education** ELL Graduated on-
time*** State State Overall 178,208 9,024 84,110 18,145 17,441
59% 47% 10% 10% 79%
HONOLULU: 2 Complex Areas / 6 Complexes Farrington 7,955 48% 70% 8% 28% 70% Kaiser 3,642 89% 16% 9% 4% 83% Kalani 4,009 90% 23% 8% 9% 91% Kaimuki 4,719 58% 58% 11% 24% 62% McKinley 4,635 52% 68% 9% 26% 72% Roosevelt 6,014 84% 37% 8% 7% 88% CENTRAL: 2 Complex Areas / 6 Complexes Aiea 4,109 63% 43% 11% 9% 88% Moanalua 4,959 63% 25% 7% 7% 91% Radford 6,230 55% 30% 10% 6% 86% Leilehua 7,932 46% 49% 12% 7% 82% Mililani 7,963 76% 19% 11% 2% 89% Waialua 1,305 56% 50% 11% 7% 84% LEEWARD: 3 Complex Areas / 6 Complexes Campbell 9,635 48% 43% 8% 8% 84% Kapolei 6,130 52% 36% 10% 4% 86% Nanakuli 2,316 44% 76% 18% 6% 66% Waianae 5,568 40% 72% 14% 6% 69% Pearl City 6,644 62% 34% 9% 5% 84% Waipahu 8,446 39% 55% 8% 22% 77% WINDWARD: 2 Complex Areas / 4 Complexes Castle 4,852 73% 46% 14% 3% 73% Kahuku 3,481 65% 54% 11% 5% 88% Kailua 2,863 75% 54% 13% 5% 71% Kalaheo 3,570 66% 32% 11% 3% 84% HAWAII: 3 Complex Areas / 10 Complexes Hilo 3,960 70% 63% 12% 7% 79% Laupahoehoe 206 30% 69% 22% 10% 93% Waiakea 3,602 83% 49% 11% 4% 83% Kau 909 33% 83% 14% 23% 84% Keaau 2,852 48% 77% 13% 9% 70% Pahoa 1,749 53% 84% 14% 8% 83% Honokaa 1,892 40% 57% 13% 7% 86% Kealakehe 5,171 60% 54% 9% 15% 76% Kohala 815 68% 60% 18% 5% 96% Konawaena 2,169 52% 63% 10% 14% 75% MAUI: 2 Complex Areas / 7 Complexes Baldwin 4,093 60% 44% 8% 8% 84% Kekaulike 4,061 68% 49% 11% 2% 76% Maui 7,462 50% 48% 8% 19% 77% Hana 340 83% 74% 12% 0% 90% Lahainaluna 3,020 48% 43% 11% 20% 82% Lanai 549 57% 39% 18% 19% 86% Molokai 905 76% 71% 15% 4% 76% KAUAI: 1 Complex Area / 3 Complexes Kapaa 3,035 60% 47% 11% 6% 84% Kauai 3,825 68% 42% 8% 7% 85% Waimea 2,347 69% 47% 7% 8% 85% OTHER Charter Schools 8,202 na 46% 8% 4% 71%
Hawaii School for the Deaf and Blind 67 100% 60% 100% 51% 50%
*Official Fall enrollment count. **Includes Speech only and Hearing-Impaired only categories ***Adjusted Cohort Graduation Rate
15
16
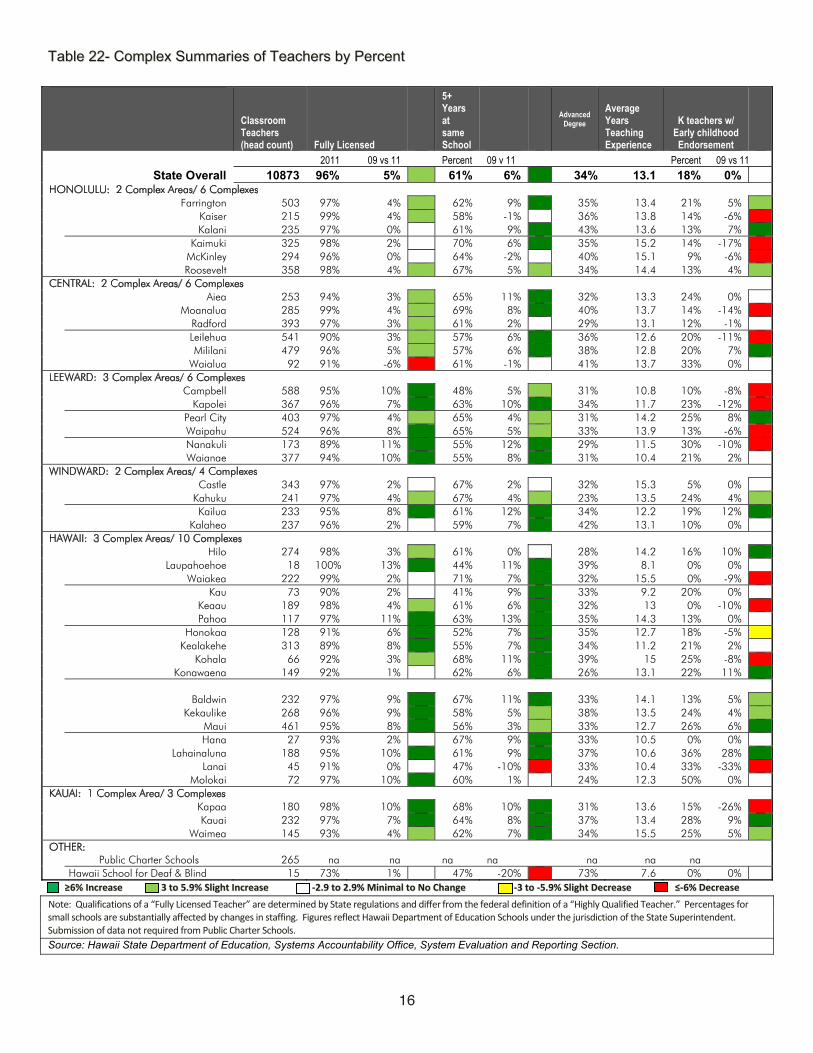
TTaabbllee 2222-- CCoommpplleexx SSuummmmaarriieess ooff TTeeaacchheerrss bbyy PPeerrcceenntt
Classroom Teachers (head count) Fully Licensed
5+Years atsameSchool
Advanced Degree
Average Years Teaching Experience
K teachers w/ Early childhood Endorsement
2011 09 vs 11 Percent 09 v 11 Percent 09 vs 11 State Overall 10873 96% 5% 61% 6% 34% 13.1 18% 0%
HONOLULU: 2 Complex Areas/ 6 Complexes Farrington 503 97% 4% 62% 9% 35% 13.4 21% 5% Kaiser 215 99% 4% 58% -1% 36% 13.8 14% -6% Kalani 235 97% 0% 61% 9% 43% 13.6 13% 7% Kaimuki 325 98% 2% 70% 6% 35% 15.2 14% -17% McKinley 294 96% 0% 64% -2% 40% 15.1 9% -6% Roosevelt 358 98% 4% 67% 5% 34% 14.4 13% 4% CENTRAL: 2 Complex Areas/ 6 Complexes Aiea 253 94% 3% 65% 11% 32% 13.3 24% 0% Moanalua 285 99% 4% 69% 8% 40% 13.7 14% -14% Radford 393 97% 3% 61% 2% 29% 13.1 12% -1% Leilehua 541 90% 3% 57% 6% 36% 12.6 20% -11% Mililani 479 96% 5% 57% 6% 38% 12.8 20% 7% Waialua 92 91% -6% 61% -1% 41% 13.7 33% 0% LEEWARD: 3 Complex Areas/ 6 Complexes Campbell 588 95% 10% 48% 5% 31% 10.8 10% -8% Kapolei 367 96% 7% 63% 10% 34% 11.7 23% -12% Pearl City 403 97% 4% 65% 4% 31% 14.2 25% 8% Waipahu 524 96% 8% 65% 5% 33% 13.9 13% -6% Nanakuli 173 89% 11% 55% 12% 29% 11.5 30% -10% Waianae 377 94% 10% 55% 8% 31% 10.4 21% 2% WINDWARD: 2 Complex Areas/ 4 Complexes Castle 343 97% 2% 67% 2% 32% 15.3 5% 0% Kahuku 241 97% 4% 67% 4% 23% 13.5 24% 4% Kailua 233 95% 8% 61% 12% 34% 12.2 19% 12% Kalaheo 237 96% 2% 59% 7% 42% 13.1 10% 0% HAWAII: 3 Complex Areas/ 10 Complexes Hilo 274 98% 3% 61% 0% 28% 14.2 16% 10% Laupahoehoe 18 100% 13% 44% 11% 39% 8.1 0% 0% Waiakea 222 99% 2% 71% 7% 32% 15.5 0% -9% Kau 73 90% 2% 41% 9% 33% 9.2 20% 0% Keaau 189 98% 4% 61% 6% 32% 13 0% -10% Pahoa 117 97% 11% 63% 13% 35% 14.3 13% 0% Honokaa 128 91% 6% 52% 7% 35% 12.7 18% -5% Kealakehe 313 89% 8% 55% 7% 34% 11.2 21% 2% Kohala 66 92% 3% 68% 11% 39% 15 25% -8% Konawaena 149 92% 1% 62% 6% 26% 13.1 22% 11% Baldwin 232 97% 9% 67% 11% 33% 14.1 13% 5% Kekaulike 268 96% 9% 58% 5% 38% 13.5 24% 4% Maui 461 95% 8% 56% 3% 33% 12.7 26% 6% Hana 27 93% 2% 67% 9% 33% 10.5 0% 0% Lahainaluna 188 95% 10% 61% 9% 37% 10.6 36% 28% Lanai 45 91% 0% 47% -10% 33% 10.4 33% -33% Molokai 72 97% 10% 60% 1% 24% 12.3 50% 0% KAUAI: 1 Complex Area/ 3 Complexes Kapaa 180 98% 10% 68% 10% 31% 13.6 15% -26% Kauai 232 97% 7% 64% 8% 37% 13.4 28% 9% Waimea 145 93% 4% 62% 7% 34% 15.5 25% 5% OTHER: Public Charter Schools 265 na na na na na na na
Hawaii School for Deaf & Blind 15 73% 1% 47% -20% 73% 7.6 0% 0% ≥≥66%% IInnccrreeaassee 33 ttoo 55..99%% SSlliigghhtt IInnccrreeaassee ‐‐22..99 ttoo 22..99%% MMiinniimmaall ttoo NNoo CChhaannggee ‐‐33 ttoo ‐‐55..99%% SSlliigghhtt DDeeccrreeaassee ≤≤‐‐66%% DDeeccrreeaassee
Note: Qualifications of a “Fully Licensed Teacher” are determined by State regulations and differ from the federal definition of a “Highly Qualified Teacher.” Percentages for small schools are substantially affected by changes in staffing. Figures reflect Hawaii Department of Education Schools under the jurisdiction of the State Superintendent. Submission of data not required from Public Charter Schools. Source: Hawaii State Department of Education, Systems Accountability Office, System Evaluation and Reporting Section.
16
17
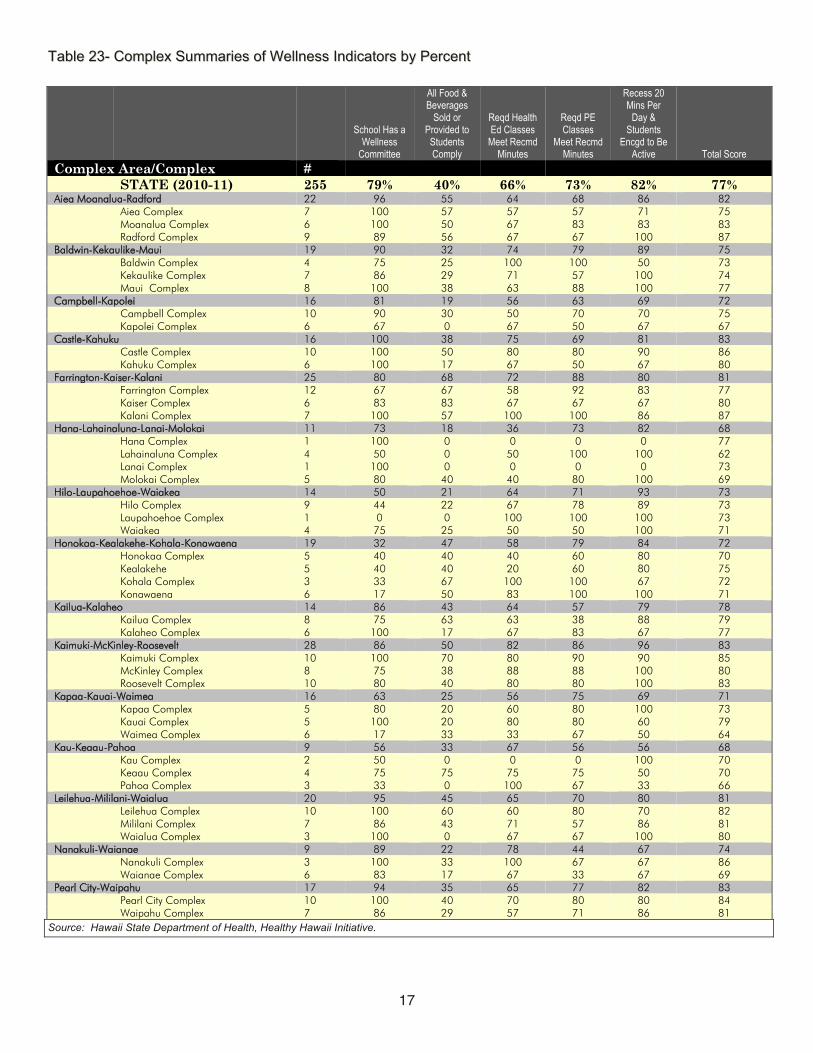
TTaabbllee 2233-- CCoommpplleexx SSuummmmaarriieess ooff WWeellllnneessss IInnddiiccaattoorrss bbyy PPeerrcceenntt
School Has a Wellness
Committee
All Food & Beverages
Sold or Provided to
Students Comply
Reqd Health Ed Classes
Meet Recmd Minutes
Reqd PE Classes
Meet Recmd Minutes
Recess 20 Mins Per
Day & Students
Encgd to Be Active Total Score
Complex Area/Complex # STATE (2010-11) 255 79% 40% 66% 73% 82% 77% Aiea Moanalua-Radford 22 96 55 64 68 86 82 Aiea Complex 7 100 57 57 57 71 75 Moanalua Complex 6 100 50 67 83 83 83 Radford Complex 9 89 56 67 67 100 87 Baldwin-Kekaulike-Maui 19 90 32 74 79 89 75 Baldwin Complex 4 75 25 100 100 50 73 Kekaulike Complex 7 86 29 71 57 100 74 Maui Complex 8 100 38 63 88 100 77 Campbell-Kapolei 16 81 19 56 63 69 72 Campbell Complex 10 90 30 50 70 70 75 Kapolei Complex 6 67 0 67 50 67 67 Castle-Kahuku 16 100 38 75 69 81 83 Castle Complex 10 100 50 80 80 90 86 Kahuku Complex 6 100 17 67 50 67 80 Farrington-Kaiser-Kalani 25 80 68 72 88 80 81 Farrington Complex 12 67 67 58 92 83 77 Kaiser Complex 6 83 83 67 67 67 80 Kalani Complex 7 100 57 100 100 86 87 Hana-Lahainaluna-Lanai-Molokai 11 73 18 36 73 82 68 Hana Complex 1 100 0 0 0 0 77 Lahainaluna Complex 4 50 0 50 100 100 62 Lanai Complex 1 100 0 0 0 0 73 Molokai Complex 5 80 40 40 80 100 69 Hilo-Laupahoehoe-Waiakea 14 50 21 64 71 93 73 Hilo Complex 9 44 22 67 78 89 73 Laupahoehoe Complex 1 0 0 100 100 100 73 Waiakea 4 75 25 50 50 100 71 Honokaa-Kealakehe-Kohala-Konawaena 19 32 47 58 79 84 72 Honokaa Complex 5 40 40 40 60 80 70 Kealakehe 5 40 40 20 60 80 75 Kohala Complex 3 33 67 100 100 67 72 Konawaena 6 17 50 83 100 100 71 Kailua-Kalaheo 14 86 43 64 57 79 78 Kailua Complex 8 75 63 63 38 88 79 Kalaheo Complex 6 100 17 67 83 67 77 Kaimuki-McKinley-Roosevelt 28 86 50 82 86 96 83 Kaimuki Complex 10 100 70 80 90 90 85 McKinley Complex 8 75 38 88 88 100 80 Roosevelt Complex 10 80 40 80 80 100 83 Kapaa-Kauai-Waimea 16 63 25 56 75 69 71 Kapaa Complex 5 80 20 60 80 100 73 Kauai Complex 5 100 20 80 80 60 79 Waimea Complex 6 17 33 33 67 50 64 Kau-Keaau-Pahoa 9 56 33 67 56 56 68 Kau Complex 2 50 0 0 0 100 70 Keaau Complex 4 75 75 75 75 50 70 Pahoa Complex 3 33 0 100 67 33 66 Leilehua-Mililani-Waialua 20 95 45 65 70 80 81 Leilehua Complex 10 100 60 60 80 70 82 Mililani Complex 7 86 43 71 57 86 81 Waialua Complex 3 100 0 67 67 100 80 Nanakuli-Waianae 9 89 22 78 44 67 74 Nanakuli Complex 3 100 33 100 67 67 86 Waianae Complex 6 83 17 67 33 67 69 Pearl City-Waipahu 17 94 35 65 77 82 83 Pearl City Complex 10 100 40 70 80 80 84 Waipahu Complex 7 86 29 57 71 86 81
Source: Hawaii State Department of Health, Healthy Hawaii Initiative.
17
18
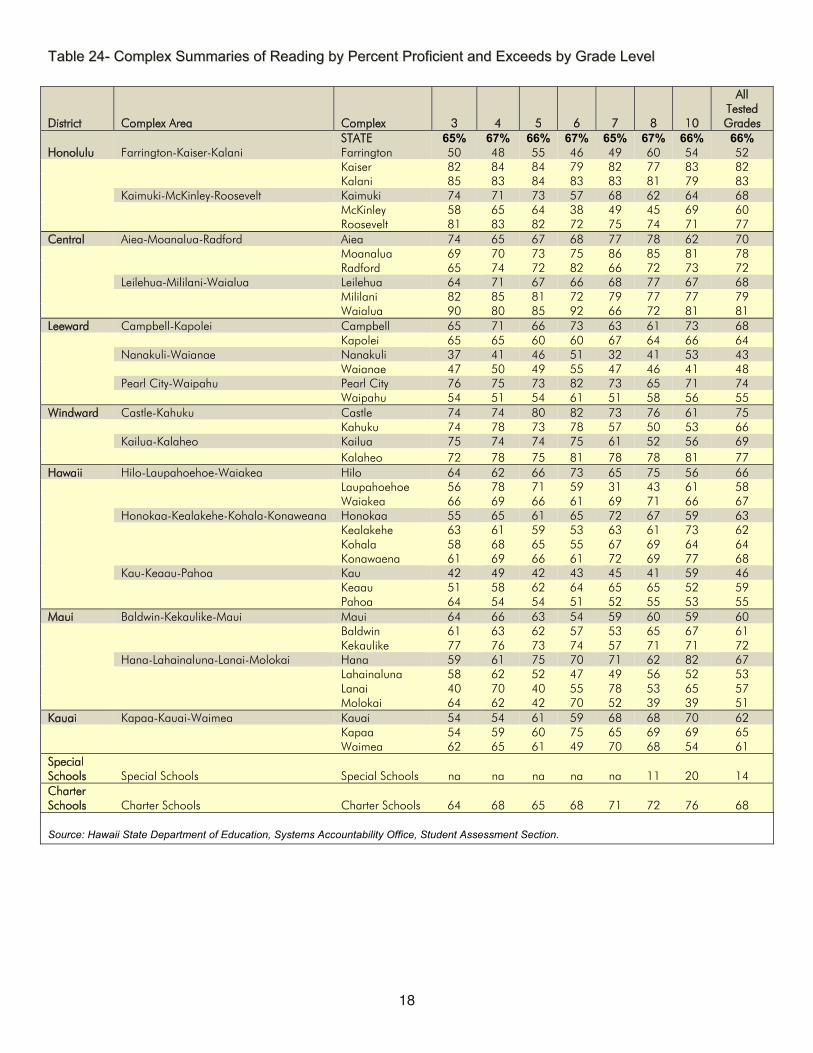
TTaabbllee 2244-- CCoommpplleexx SSuummmmaarriieess ooff RReeaaddiinngg bbyy PPeerrcceenntt PPrrooffiicciieenntt aanndd EExxcceeeeddss bbyy GGrraaddee LLeevveell
District Complex Area Complex 3 4 5 6 7 8 10
All Tested Grades
STATE 65% 67% 66% 67% 65% 67% 66% 66% Honolulu Farrington-Kaiser-Kalani Farrington 50 48 55 46 49 60 54 52 Kaiser 82 84 84 79 82 77 83 82 Kalani 85 83 84 83 83 81 79 83 Kaimuki-McKinley-Roosevelt Kaimuki 74 71 73 57 68 62 64 68 McKinley 58 65 64 38 49 45 69 60 Roosevelt 81 83 82 72 75 74 71 77 Central Aiea-Moanalua-Radford Aiea 74 65 67 68 77 78 62 70 Moanalua 69 70 73 75 86 85 81 78 Radford 65 74 72 82 66 72 73 72 Leilehua-Mililani-Waialua Leilehua 64 71 67 66 68 77 67 68 Mililani 82 85 81 72 79 77 77 79 Waialua 90 80 85 92 66 72 81 81 Leeward Campbell-Kapolei Campbell 65 71 66 73 63 61 73 68 Kapolei 65 65 60 60 67 64 66 64 Nanakuli-Waianae Nanakuli 37 41 46 51 32 41 53 43 Waianae 47 50 49 55 47 46 41 48 Pearl City-Waipahu Pearl City 76 75 73 82 73 65 71 74 Waipahu 54 51 54 61 51 58 56 55 Windward Castle-Kahuku Castle 74 74 80 82 73 76 61 75 Kahuku 74 78 73 78 57 50 53 66 Kailua-Kalaheo Kailua 75 74 74 75 61 52 56 69 Kalaheo 72 78 75 81 78 78 81 77 Hawaii Hilo-Laupahoehoe-Waiakea Hilo 64 62 66 73 65 75 56 66 Laupahoehoe 56 78 71 59 31 43 61 58 Waiakea 66 69 66 61 69 71 66 67 Honokaa-Kealakehe-Kohala-Konaweana Honokaa 55 65 61 65 72 67 59 63 Kealakehe 63 61 59 53 63 61 73 62 Kohala 58 68 65 55 67 69 64 64 Konawaena 61 69 66 61 72 69 77 68 Kau-Keaau-Pahoa Kau 42 49 42 43 45 41 59 46 Keaau 51 58 62 64 65 65 52 59 Pahoa 64 54 54 51 52 55 53 55 Maui Baldwin-Kekaulike-Maui Maui 64 66 63 54 59 60 59 60 Baldwin 61 63 62 57 53 65 67 61 Kekaulike 77 76 73 74 57 71 71 72 Hana-Lahainaluna-Lanai-Molokai Hana 59 61 75 70 71 62 82 67 Lahainaluna 58 62 52 47 49 56 52 53 Lanai 40 70 40 55 78 53 65 57 Molokai 64 62 42 70 52 39 39 51 Kauai Kapaa-Kauai-Waimea Kauai 54 54 61 59 68 68 70 62 Kapaa 54 59 60 75 65 69 69 65 Waimea 62 65 61 49 70 68 54 61 Special Schools Special Schools Special Schools na na na na na 11 20 14 Charter Schools Charter Schools Charter Schools 64 68 65 68 71 72 76 68
Source: Hawaii State Department of Education, Systems Accountability Office, Student Assessment Section.
18
19
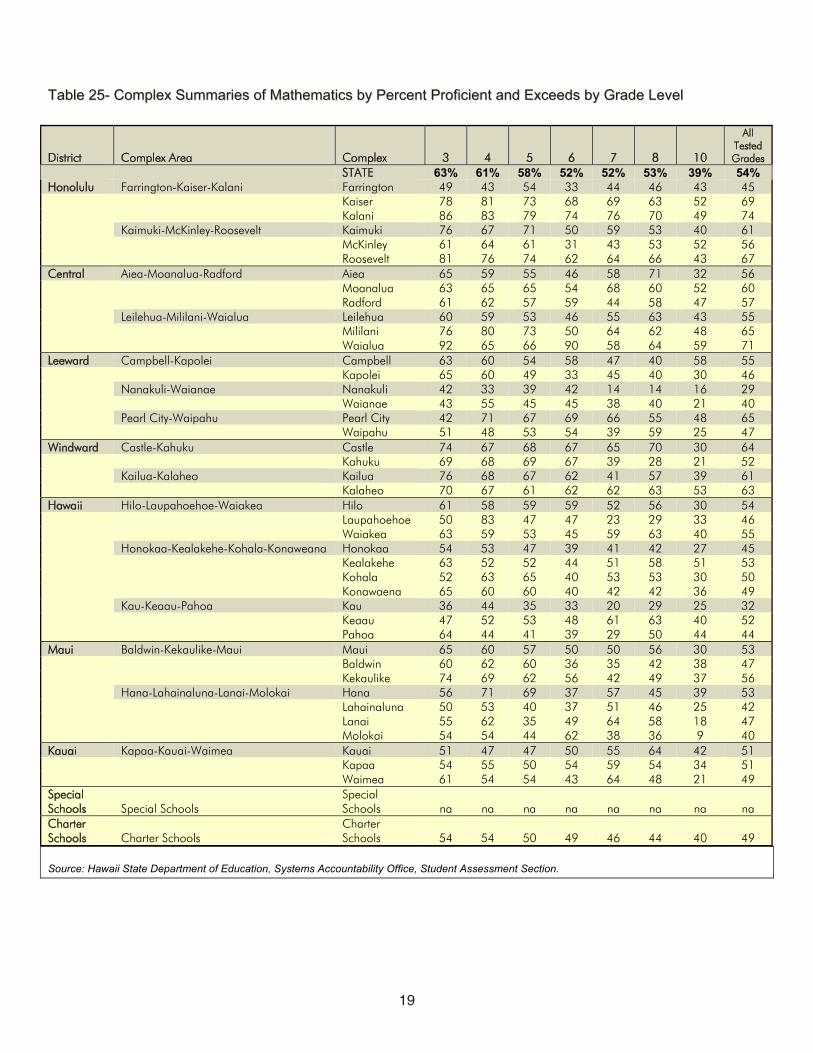
TTaabbllee 2255-- CCoommpplleexx SSuummmmaarriieess ooff MMaatthheemmaattiiccss bbyy PPeerrcceenntt PPrrooffiicciieenntt aanndd EExxcceeeeddss bbyy GGrraaddee LLeevveell
District Complex Area Complex 3 4 5 6 7 8 10
All Tested Grades
STATE 63% 61% 58% 52% 52% 53% 39% 54% Honolulu Farrington-Kaiser-Kalani Farrington 49 43 54 33 44 46 43 45 Kaiser 78 81 73 68 69 63 52 69 Kalani 86 83 79 74 76 70 49 74 Kaimuki-McKinley-Roosevelt Kaimuki 76 67 71 50 59 53 40 61 McKinley 61 64 61 31 43 53 52 56 Roosevelt 81 76 74 62 64 66 43 67 Central Aiea-Moanalua-Radford Aiea 65 59 55 46 58 71 32 56 Moanalua 63 65 65 54 68 60 52 60 Radford 61 62 57 59 44 58 47 57 Leilehua-Mililani-Waialua Leilehua 60 59 53 46 55 63 43 55 Mililani 76 80 73 50 64 62 48 65 Waialua 92 65 66 90 58 64 59 71 Leeward Campbell-Kapolei Campbell 63 60 54 58 47 40 58 55 Kapolei 65 60 49 33 45 40 30 46 Nanakuli-Waianae Nanakuli 42 33 39 42 14 14 16 29 Waianae 43 55 45 45 38 40 21 40 Pearl City-Waipahu Pearl City 42 71 67 69 66 55 48 65 Waipahu 51 48 53 54 39 59 25 47 Windward Castle-Kahuku Castle 74 67 68 67 65 70 30 64 Kahuku 69 68 69 67 39 28 21 52 Kailua-Kalaheo Kailua 76 68 67 62 41 57 39 61 Kalaheo 70 67 61 62 62 63 53 63 Hawaii Hilo-Laupahoehoe-Waiakea Hilo 61 58 59 59 52 56 30 54 Laupahoehoe 50 83 47 47 23 29 33 46 Waiakea 63 59 53 45 59 63 40 55 Honokaa-Kealakehe-Kohala-Konaweana Honokaa 54 53 47 39 41 42 27 45 Kealakehe 63 52 52 44 51 58 51 53 Kohala 52 63 65 40 53 53 30 50 Konawaena 65 60 60 40 42 42 36 49 Kau-Keaau-Pahoa Kau 36 44 35 33 20 29 25 32 Keaau 47 52 53 48 61 63 40 52 Pahoa 64 44 41 39 29 50 44 44 Maui Baldwin-Kekaulike-Maui Maui 65 60 57 50 50 56 30 53 Baldwin 60 62 60 36 35 42 38 47 Kekaulike 74 69 62 56 42 49 37 56 Hana-Lahainaluna-Lanai-Molokai Hana 56 71 69 37 57 45 39 53 Lahainaluna 50 53 40 37 51 46 25 42 Lanai 55 62 35 49 64 58 18 47 Molokai 54 54 44 62 38 36 9 40 Kauai Kapaa-Kauai-Waimea Kauai 51 47 47 50 55 64 42 51 Kapaa 54 55 50 54 59 54 34 51 Waimea 61 54 54 43 64 48 21 49 Special Schools Special Schools
Special Schools na na na na na na na na
Charter Schools Charter Schools
Charter Schools 54 54 50 49 46 44 40 49
Source: Hawaii State Department of Education, Systems Accountability Office, Student Assessment Section.
19
20
Appendix A. Glossary This glossary explains the educational and fiscal terms and measures contained in the 2011 Superintendent’s 22nd
Annual Report. An “na” stands for “not appropriate” or “not reportable,” while a “- - ” stands for missing or unavailable data. Due to rounding of percentages, there may be slight differences between published reports (for example, 9.6% may be reported as 10% for the same measure in different reports).
Adequate Yearly Progress (AYP): This is the minimum standard for improvement that all schools must achieve each year according to the federal No Child Left Behind accountability requirements. To meet AYP, all students and all student subgroups (i.e., Special Education, English Second Language Learner, Economically Disadvantaged, and five ethnic groups) must achieve a certain level of participation and proficiency on the State reading and mathematics tests. In addition, schools must meet either an on-time graduation rate for high schools or must not exceed a retention rate for elementary and middle/intermediate schools. If a school meets the minimum standard for all 37 indicators, it has “Met” AYP. If a school fails to meet one (or more) of the 37 indicators, it has “Not Met” AYP.
Administrators, School: This is a Full-Time Equivalent (FTE) count of all principals and vice-principals.
Administrators, State and Complex Area: The FTE count is the sum of positions that have responsibility for the administrative support of programs, curriculum, and State or federal legal requirements. These FTE position counts include complex areas superintendents, evaluation specialists, facilities planners, personnel specialists, test development specialists, budget specialists, information (data) specialists, state and district curriculum/educational specialists, safety/security program specialists, to list a few.
Appropriated Funds: Funds determined by the state legislature, and enacted by the governor, to provide basic support for the Hawaii Department of Education to operate a statewide school district.
Attendance Rate: The percent of the official student enrollment attending school every day during the school year. For example, 95% means that on any given day during the past school year, 95% of the students are in school on the average.
Average Years Experience: This is a simple average of the number of years of approved teaching experience.
Charter Schools: Charter schools are independent public schools designed and operated by educators, parents, community leaders, educational entrepreneurs, and others. They were established by State legislation and are directly responsible to the Hawaii Board of Education, which monitors their quality and effectiveness, but allows them to operate outside of the traditional system of public schools.
Classroom Teachers, FTE or Headcount: A Full-Time Equivalent (FTE) position count comprises of all teachers who are directly teaching students. Unlike FTE, “Headcount” is a simple count of the number of teachers who are directly teaching students.
Complex: This smaller division within a Complex Area consists of a comprehensive high school and middle/intermediate and elementary schools within its attendance boundary.
Complex Areas: These are administrative units made up of two or more complexes.
Demographics, State: Figures reported by the U.S. Census Bureau for 2007 are estimates and are updated periodically. The 2007 estimates in this report are from the 2007 Community Survey. For an explanation of terms, definitions, and criteria used for classification, please go to the U.S. government website for the census: www.census.gov or www.proximityone.com
Dropout Rate: This four-year dropout rate is the percent of high school students who have not returned to school and have either officially exited as “drop-outs”, whose school enrollment statuses are undetermined, or who have not graduated within four years.
20
21
Early Childhood Endorsement
To earn an Early Childhood Endorsement certificate, a teacher must have had 18 credits in Child & Family Studies; completed all course requirements for Elementary Education and an additional 12 credits in Early Childhood Education; and have successfully completed student teaching in kindergarten, first or second grade.
Economically Disadvantaged: These are students whose families meet the income qualifications for the federal free/reduced-cost lunch program. Note that this is an indicator of school-community poverty.
English Language Learners (ELL): These students are certified as receiving English-as-a-second-language services. Note that in school year 2003-04 a new reporting system for ELL began resulting in figures that are non-comparable to past years’ figures.
Enrollment Count, Official: The official enrollment count of each school is reported to the State upon the yearly opening of school. A school’s enrollment may fluctuate over the course of the school year, so that an enrollment count taken mid-year may be different from its official enrollment count. “Speech only and Hearing-Impaired only” special education students are excluded from the special education student count in the official enrollment report.
Federal Funds: Funds provided by the federal government for use by the State public school system, through grants from various federal agencies, such as the U.S. Department of Education, U.S. Department of Defense, and U.S. Department of Agriculture.
5 or More Years at Same School: Percent of teachers who have taught at one school for five or more years. It is an indicator of school staffing stability. Schools with moderate levels of mobility are considered most successful in implementing and sustaining school improvement efforts.
Fully Licensed: Teachers who meet requirements (e.g., completed at least a bachelor’s degree and an approved teacher training program) to be fully licensed by the Hawaii State Teachers Standards Board.
Full-Time Equivalent (FTE): These are position counts and not “head counts,” and are the sum of full- and part-time positions. Note that partial counts are possible. For example, one full-time (1.0 FTE) and one half-time (0.5FTE) sum to 1.5 FTEs.
General Funds: The primary source of funding for the state public school system, provided by the state through taxpayer revenues.
Graduation, Graduation Rate, Graduate On Time, Four-Year Graduation: Count or percent of all high school students, including public charter school students, who had completed high school within four years of their 9th grade entry date. Special Education students receiving certificates of completion and students taking more than four years to complete high school are not included. For more information on the new Adjusted Cohort Graduation Rate methodology, see USDOE website: http://www2.ed.gov/policy/elsec/guid/hsgrguidance.pdf
Hawaii P-20 Partnerships for Education: is a statewide partnership led by Good Beginnings Alliance, the Hawaii State Department of Education, and the University of Hawaii System to strengthen early childhood through higher education so that all students achieve career and college success.
Hawaii P-3: is the part of Hawaii P-20 that works on increasing children’s social-emotional and cognitive development toward the end goal of reading at grade level by third grade.
National Assessment of Educational Progress (NAEP): These are norm referenced tests in reading, mathematics, writing, and science developed and given by the United States Department of Education (USDOE) to sampled groups of students in grade 4 and 8 in all states. The data from the NAEP include results for demographic groups of students, but not for complex areas, schools, or individual students. The metrics that NAEP uses include average scale scores and the percentages of students achieving NAEP Advanced, NAEP Proficient, NAEP Basic, and NAEP Below Basic. Advanced and Proficient denote mastery of challenging subject matter include success on some items that are above the grade level
21

22
of the students being tested. NAEP defines Basic as denoting partial mastery of prerequisite knowledge and skills that are fundamental for proficient work at each grade assessed. Below Basic means performing below the grade level being tested. These achievement levels overlap with but are not identical to the proficiency levels of the Hawaii State Assessment.
No Child Left Behind (NCLB): This law, enacted in 2001, is a reauthorization of the Elementary and Secondary Education Act, and consists of many Title programs (e.g., Title I, Title IV, etc.) each with its own funding and reporting requirements. The Act specifies school and state accountability mandates and reporting requirements for Title I funds, and requires that all schools in a state must be subject to the same accountability system.
NCLB Sanctions: Mandates imposed on schools “in sanction” status by No Child Left Behind guidelines. The sanctions are increasingly stringent the longer a school stays in sanction status. Initial sanctions include school choice and supplemental educational services.
No Sanctions: Schools whose NCLB status for the coming year is either “In Good Standing, Unconditional” or “In Good Standing, Pending.” If a school meets all 37 AYP indicators for two consecutive years, or if a school In Good Standing has not met AYP for one year, then it is given “no sanctions” by the State.
Norm-Referenced Test, Terra Nova: The Terra Nova Assessment is a norm-referenced test that shows how well students’ test scores compare to those of a nationally selected group of students (called the “norm group”). For the Terra Nova norm group, 77% always score “average and above average.”
Not Suspended, Students: The number of students who are not suspended by the school and therefore an indicator of appropriate student behavior at school.
Perceptions of Safety and Well-Being, Student and Teacher: Positive responses to a set of items on the Department Of Education’s annual School Quality Survey (SQS) regarding school safety and well-being. The percent of positive responses are reported.
Per Pupil Expenditure: The numbers reported from National Center of Education Statistics (NCES) may be used for state to state comparisons. Numbers are based on membership and can be expected to be smaller than per pupil expenditures based on average daily attendance. Current expenditure for public elementary and secondary education in a state is divided by the student membership. Current expenditures are funds spent for operating local public schools and local education agencies, including such operating expenses as salaries for school personnel, student transportation, school books and materials, and energy costs, but excluding capital outlay and interest on school debt.
Preschool, Attended: This is the percent of entering kindergarten students reported as having attended preschool.
Private Schools: Privately operated schools not under the direction of the Hawaii Department of Education.
Relative Wealth, Per Capita Revenue: The per capita revenue is reported by the U.S. Census Bureau as a result of their Annual Survey of Government Finances 2005 a survey completed by all states. Per capita amounts are based on population figures as of July 1, 2009, and are computed on the basis of amounts rounded to the nearest thousand figures obtained also from the U.S. Census Bureau.
Retention Rates for Elementary: Percent of students, excluding kindergartners, who are not promoted to the next grade level. A low retention rate is desired.
Retention Rates for Middle & Intermediate: Percent of 8th grade students who are not promoted to 9th grade the following year. A low retention rate is desired.
Sanctions: If a school fails to meet Adequate Yearly Progress (AYP) for two consecutive years, it receives the sanction associated with NCLB status of School Improvement Year 1. If it continues to not meet AYP, it receives progressively greater sanctions associated with each NCLB status of School Improvement Year 2, Corrective Action, Planning for Restructuring, and Restructuring.
22
23
Schools, Total: The total number is the sum of all public schools. All regular public schools, public charter schools, and special schools are in this count. Adult Community Schools are not counted.
Special Education (SPED): This count and percent contain all special education students listed on the official enrollment report as receiving special education services and includes special education students with a “Speech only and Hearing-Impaired only” condition.
Special Funds: Funds generated through revenue sources other than state taxpayer revenues, such as cafeteria collections from students; adult education tuition/fees; summer school tuition; driver education fees; facility rental fees; and lost textbook penalty fees.
Special Needs, Multiple: Students identified and/or qualified as special needs under more than one of the following categories: economically disadvantaged as determined by receiving free/reduced-cost lunch, Section 504 classification, and certified as receiving special education or English Language Learner services.
Standard-based Assessment, Hawaii Content and Performance Standards: These tests measure student achievement in reading and mathematics based on Hawaii content standards. The percents shown are assessment results, not No Child Left Behind (NCLB) accountability results. “Percent Proficient & Exceeds Proficiency” is derived from test results that meet or exceed proficiency (i.e., proficiency cut-score).
State and Local Expenditures Supporting Public Education, Percent: This percentage is published by the National Center of Education Statistics (NCES), U.S. Department of Education in their Digest of Educational Statistics 2007 publication. The percentage is calculated by dividing the states’ "Total, all general expenditures per capita" by the states’"Elementary and secondary education expenditures" per capita. The Total, all general expenditures per capita includes state and local government expenditures for education services, social services, and income maintenance, transportation, public safety, environment and housing, governmental administration, interest on general debt, and other general expenditures, including intergovernmental expenditure to the federal government, as reported by the State’s NCES Common Core of Data Financial Survey.
Support Staff, Other: This is a Full-Time Equivalent (FTE) count that encompasses a wide range of positions that support schools. These categories may include school assessment liaisons, athletic directors, registrars, State and district resource teachers, school psychologists, custodians, cafeteria workers, school secretaries, school security guards, educational assistants, occupational therapists, mental health assistants, behavioral specialists, student service coordinators, to name a few. Note that the assignment of positions to categories is based on USDOE National Center for Education Statistics, Common Core of Data, Non-Fiscal Survey requirements.
Title I: A school is designated as a “Title I” school and receives supplemental federal funding under NCLB if its student population meets a specified poverty rate. Title I schools are obligated to follow federal requirements regarding Title I funds.
Trust Funds: Funds segregated for specific purposes, such as foundation grants, and athletic gate receipts.
Wellness: Student wellness is affected by nutrition education, the food served in schools, and the amount of physical activity. The DOE also recognizes that when students’ wellness needs are met, they attain higher achievement levels.
23
24
Appendix B. References and Resources Educational and Accountability Reports
Accountability Data CenterThis is a web portal for educational accountability information. It complements the many other federally and state required accountability reports at the school, complex, complex area and the state, that are available as static documents on the Hawaii Department of Education’s ARCH (Accountability Resource Center-Hawaii) website. http://arch.k12.hi.us
EnrollmentThe reports have student enrollment figures by districts, state and grade-level groups. http://doe.k12.hi.us/reports/enrollment.htm
Hawaii State and School Readiness AssessmentThese school and state reports produced in partnership with Good Beginnings Alliance and Kamehameha Schools provide information on the entering skills and characteristics of kindergarten children that contribute to successful early learning experiences and on the readiness of schools to support these young children’s learning. http://arch.k12.hi.us
High School Completer StatisticsThis annual report has state level comparisons by year of high school completer rates.http://doe.k12.hi.us/reports/highschoolcompleter.htm
National Assessment of Educational Progress (NAEP)This extensive web site has three sets of information of special interest to educators and the general public. A visitor to the web site can access them by viewing the key words along the top margin. SAMPLE QUESTIONS provides the visitor with all of the released items since "state NAEP" began in 1990. ANALYZE DATA provides a tool by which an educator or a researcher can retrieve NAEP results by subjects, grades, and demographics. STATE PROFILES provides general results for all states. Anyone seeking help with accessing and using these data tools is welcome to contact NAEP state coordinator, Robert Hillier at [email protected] or (808) 733-4100. The NAEP web site contains a large amount of additional information and links to other assessment-related web sites. http://sas.sao.k12.hi.us/STATE/SAO/SASWebsite.nsfhttp://nces.ed.gov/nationsreportcard
No Child Left Behind (NCLB)These annual school reports include Adequate Yearly Progress (AYP) results; NCLB school status; student performance results on the statewide assessments; graduation or retention rates; and teacher qualification information.http://arch.k12.hi.us
School Quality Survey (SQS)The survey gathers teacher, student and parent perceptions that are useful to schools in developing their school improvement plans for accreditation and standards implementation. The SQS also provides information about parent involvement and parent and student satisfaction with their schools. http://arch.k12.hi.us
24
25
School Status and Improvement Report (SSIR)Each SSIR has a description of the school and its setting, a summary of progress in implementing Hawaii standards, and information on school resources and educational outcomes. http://arch.k12.hi.us
Trend Report: Educational & Fiscal AccountabilityThe annual report contains three years of trend data on schools, school complexes, and system performance at selected benchmark grade levels with performance indicators in areas relating to student achievement, safety and well being, and civic responsibility. These reports are designed to present trend data information to the public in a concise two-page format for each complex and school. http://arch.k12.hi.us
Financial Reports
Allocations by School ProgramThese annual reports contain dollar amounts allocated by Allocation Number, Program, or Organization.http://doe.k12.hi.us/reports/allocations.htm
Annual Financial ReportsThis Annual Financial Report is prepared each year to inform interested persons of the total cost of public education in the State of Hawaii. The reports provide both Operating and Capital Improvement Project fund information that is useful in presenting our educational system financing, expenditures and per pupil information. http://doe.k12.hi.us/reports/financialreports.htm
AuditThe annual report on the financial audit of the Department of Education forms an opinion on the fairness of the presentation of the Department of Education’s financial statements to comply with requirements for state and local governments that receive federal financial assistance. http://doe.k12.hi.us/reports/auditreports.htm
BudgetThese reports have fiscal information on have budget restrictions, operating budget allocations (initial and supplemental), emergency appropriations, and Biennium Budgets. http://doe.k12.hi.us/reports/budget.htm
Expenditures by SchoolAnnual reports of the Hawaii Expenditure Reporting System. http://doe.k12.hi.us/reports/expenditures.htm
Special Education Reports
Due Process Hearings FindingsThe findings of due process hearings are provided for public information. http://doe.k12.hi.us/reports/specialeducation/dueprocess/index.htm
25
26
Annual Performance Report & State Performance PlanThese documents are the State’s plans and reports in accordance with the Individuals with Disabilities Education Improvement Act of 2004. Included are evaluations of the State’s efforts and plans for improving implementation. http://doe.k12.hi.us/reports/specialeducation/stateperformanceplan/
Legislative Reports
Reports to 2010 LegislatureThese are reports on the bills and resolutions passed in the 2008, Regular Session, Hawaii State Legislature. http://doe.k12.hi.us/reports/tolegislature/index.htm
Other Resources
Center on the FamilyThis resource provides access to research reports, informational articles, videos, brochures, and other materials designed to support and strengthen families in Hawaii. The Center on the Family at the University of Hawaii-Manoa also issues an annual report on a core set of indicators reflecting overall well-being of Hawaii families. http://uhfamily.hawaii.edu
Proximity OneThis resource link, provided courtesy of Proximity One, provides access to 2000 Decennial Census information (and 2010 census forthcoming) uniquely available at the high school complex level for 42 complexes throughout the State of Hawaii. Follow the instructions on how to select tables and complexes to produce sample profiles. The DPA software to produce the higher quality Excel reports is an option and is not required to view and print the results. http://proximityone.com/hidmi2.htm
26
27
Appendix C. Data Tables Data tables are available online at: http://arch.k12.hi.us/state/superintendent_report/annual_report.html
DATA TABLES
1. Enrollment in Hawaii Public and Private Schools
2. Enrollment by District
3. Special Needs Affecting Public School Students in Hawaii
4. Average Attendance Rates by School Type
5. Four-year Graduation and Dropout Rates
6. Ethnicity of Students and Teachers
7. Hawaii Content and Performance Standards Assessments
8. Chapter 19 Charges Categorized by Type of Incident
9. Administrative Staff as a Proportion of Total Staff-Hawaii and Comparison States
10. Expenditures per Pupil, Hawaii and Comparison States
11. Hawaii and States with Similar Financial Resources
12. Percent of State and Local Expenditures Supporting Public Education (K-12) by Year & Comparison States
13. Percent of State and Local Expenditures Supporting Public Education (K-12) vs. Per Pupil Expenditures
27


