2011–12 National Postsecondary Student Aid Study (NPSAS:12) Price Estimates for Attending Postsecondary Education Institutions First Look DECEMBER 2013 Sean Simone National Center for Education Statistics David Radwin Jennifer Wine Peter Siegel Michael Bryan RTI International Tracy Hunt-White Project Officer National Center for Education Statistics NCES 2014-166 U.S. DEPARTMENT OF EDUCATION
Transcript
2011–12 National Postsecondary Student Aid Study (NPSAS:12) Price Estimates for Attending Postsecondary Education Institutions
First Look
DECEMBER 2013
Sean Simone National Center for Education Statistics David Radwin Jennifer Wine Peter Siegel Michael Bryan RTI International
Tracy Hunt-White Project Officer National Center for Education Statistics
NCES 2014-166
U.S. DEPARTMENT OF EDUCATION
U.S. Department of Education Arne Duncan Secretary
Institute of Education Sciences John Q. Easton Director
National Center for Education Statistics Jack Buckley Commissioner
The National Center for Education Statistics (NCES) is the primary federal entity for collecting, analyzing, and reporting data related to education in the United States and other nations. It fulfills a congressional mandate to collect, collate, analyze, and report full and complete statistics on the condition of education in the United States; conduct and publish reports and specialized analyses of the meaning and significance of such statistics; assist state and local education agencies in improving their statistical systems; and review and report on education activities in foreign countries.
NCES activities are designed to address high-priority education data needs; provide consistent, reliable, complete, and accurate indicators of education status and trends; and report timely, useful, and high-quality data to the U.S. Department of Education, the Congress, the states, other education policymakers, practitioners, data users, and the general public. Unless specifically noted, all information contained herein is in the public domain.
We strive to make our products available in a variety of formats and in language that is appropriate to a variety of audiences. You, as our customer, are the best judge of our success in communicating information effectively. If you have any comments or suggestions about this or any other NCES product or report, we would like to hear from you. Please direct your comments to
NCES, IES, U.S. Department of Education 1990 K Street NW Washington, DC 20006-5651
December 2013
The NCES Home Page address is http://nces.ed.gov. The NCES Publications and Products address is http://nces.ed.gov/pubsearch.
This publication is only available online. To download, view, and print the report as a PDF file, go to the NCES Publications and Products address shown above.
This report was prepared in part under Contract No. ED-IES-09-C-0039 by the National Center for Education Statistics and RTI International. Mention of trade names, commercial products, or organizations does not imply endorsement by the U.S. Government.
Suggested Citation Simone, S., Radwin, D., Wine, J., Siegel, P., and Bryan, M. (2013). 2011–12 National Postsecondary Student Aid Study (NPSAS:12): Price Estimates for Attending Postsecondary Education Institutions (NCES 2014-166). National Center for Education Statistics, Institute of Education Sciences, U.S. Department of Education. Washington, DC.
Content Contact National Center for Education Statistics
Acknowledgments The authors wish to thank those who contributed to the 2011–12 National Postsecondary
Student Aid Study (NPSAS:12), in particular, students who participated in the survey and the institutional representatives who provided student records. This and past NPSAS studies would not have been possible without their invaluable contributions.
This page intentionally left blank.
iv
v
Contents PAGE
Acknowledgments .............................................................................................................. iii
List of Tables ...................................................................................................................... vi
Appendix B—Technical Notes and Methodology ........................................................ B-1
vi
List of Tables TABLE PAGE
1 Average price of attendance in constant 2011–12 dollars for undergraduate students, by type of institution and selected student characteristics: 2007–08 and 2011–12 ............................................................. 6
2 Average net price (price of attendance minus all grants) in constant 2011–12 dollars among undergraduates, by type of institution and selected student characteristics: 2007–08 and 2011–12 ................................ 8
3 Average out-of-pocket net price (price of attendance minus total aid) in constant 2011–12 dollars of postsecondary education among undergraduates, by type of institution and selected student characteristics: 2007–08 and 2011–12 ............................................................. 10
APPENDIX
B-1 Numbers of sampled, eligible, and participating institutions and enrollment list participation rates, by institution characteristic: 2012 ......... B-5
B-2 Numbers of sampled and eligible students and rates of study membership, by institution characteristic: 2012 ............................................. B-7
B-3 Summary of components of the student analysis weight: 2012 ................... B-10
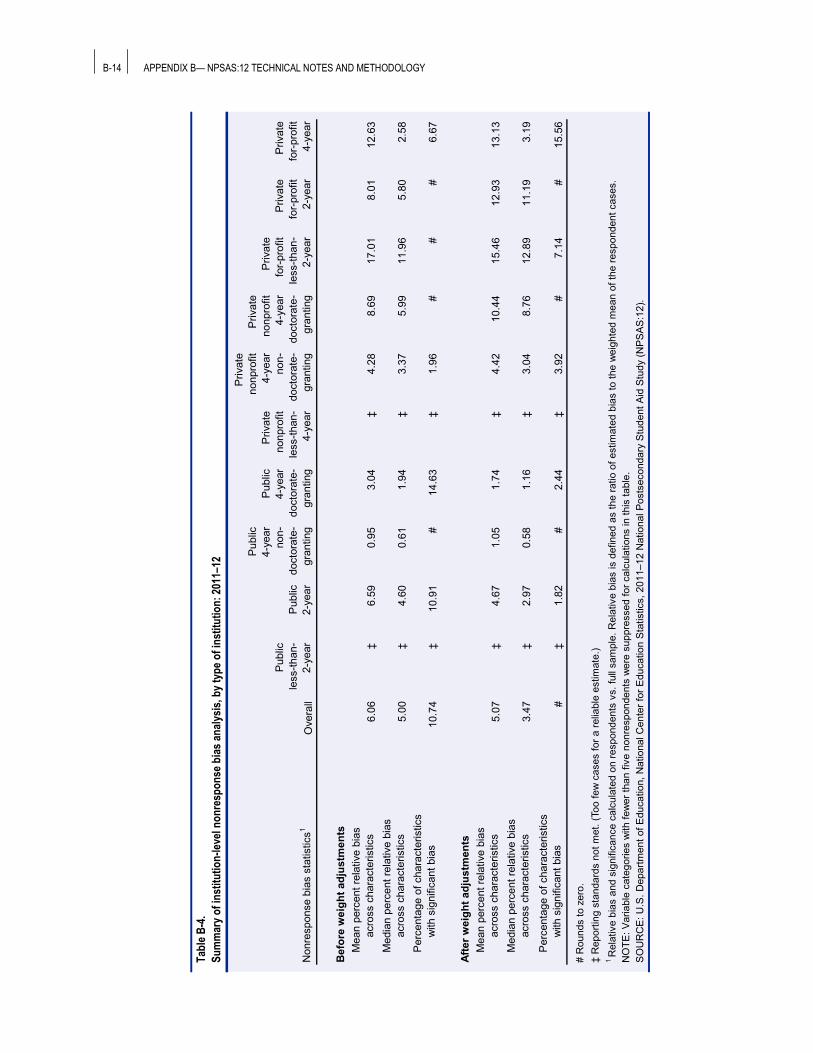
B-4 Summary of institution-level nonresponse bias analysis, by type of institution: 2011–12 ............................................................................................ B-14
B-5 Summary of institution-level differences between means, by type of institution: 2011–12 ............................................................................................ B-15
B-6 Summary of student-level nonresponse bias analysis, by type of institution: 2011–12 ............................................................................................ B-18
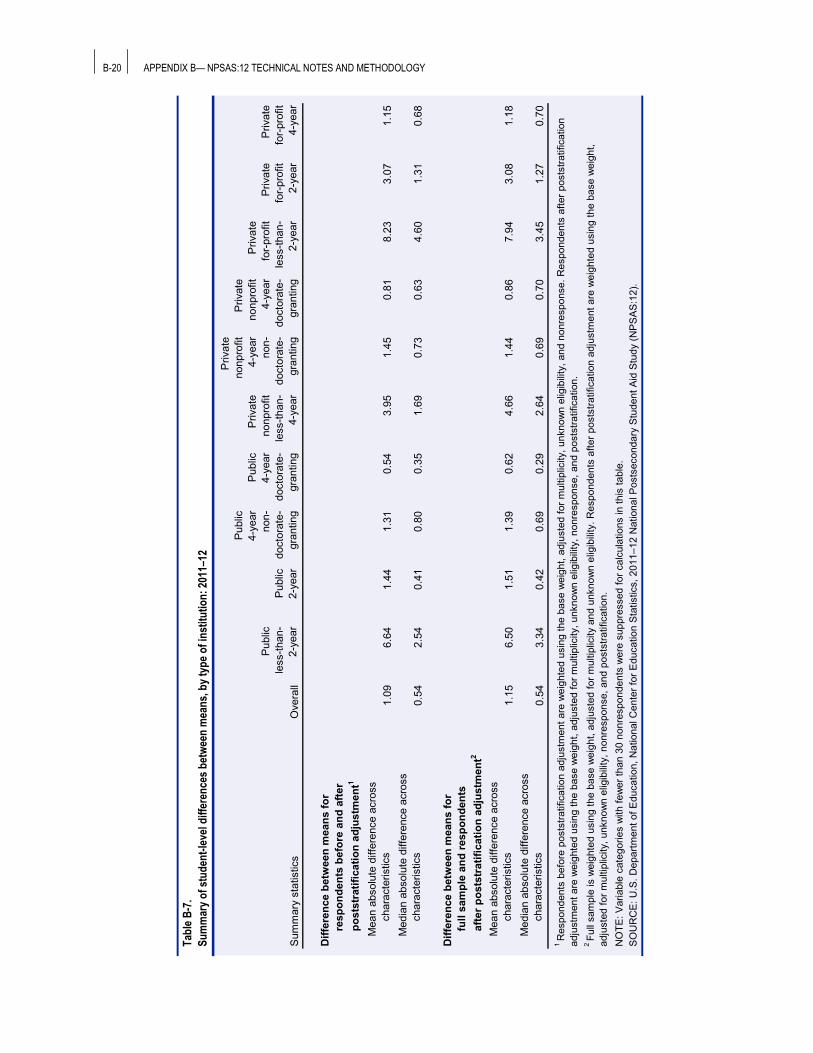
B-7 Summary of student-level differences between means, by type of institution: 2011–12 ............................................................................................ B-20
LIST OF TABLES vii
TABLE PAGE
B-8 Weighted item response rates for all students and by type of institution: 2011–12 ................................................................................................................ B-22
B-9 Standard errors for table 1: Average price of attendance in constant 2011–12 dollars for undergraduate students, by type of institution and selected student characteristics: 2007–08 and 2011–12 ................................ B-27
B-10 Standard errors for table 2: Average net price (price of attendance minus all grants) in constant 2011–12 dollars among undergraduates, by type of institution and selected student characteristics: 2007–08 and 2011–12...... B-28
B-11 Standard errors for table 3: Average out-of-pocket net price (price of attendance minus total aid) in constant 2011–12 dollars of postsecondary education among undergraduates, by type of institution and selected student characteristics: 2007–08 and 2011–12 ......................... B-29
This page intentionally left blank.
viii
1
Introduction This report presents selected findings about the price of attending a college or university for
undergraduate students during the 2011–12 academic year. These findings come from the 2011–12 National Postsecondary Student Aid Study (NPSAS:12), a nationally representative sample survey of undergraduate and graduate students enrolled any time between July 1, 2011, and June 30, 2012, in institutions eligible to participate in federal financial aid programs. The primary purpose of NPSAS:12 is to measure how students and their families pay for postsecondary education, with particular emphasis on federal student aid provided through Title IV of the Higher Education Act of 1965 and subsequent amendments.
The NPSAS:12 sample consists of about 95,000 undergraduate and 16,000 graduate students attending approximately 1,500 Title IV eligible postsecondary institutions in the 50 states and the District of Columbia.1 The sample represents approximately 23 million2 undergraduate and 4 million graduate students enrolled in postsecondary education at any time between July 1, 2011, and June 30, 2012. Additional details about the sample are provided in appendix B.
This report presents estimates of three distinct measures of the price of college. The first measure used in this report is total price of attendance, which is also referred to as “sticker price” or “student budget.” It includes anticipated outlays for tuition and fees, books and materials, housing, food, transportation, and personal expenses, and is used by institutions to develop a student’s financial aid package (financial aid includes grants, loans, and work-study). Because average tuition and fees vary among institutions of different types (Knapp, Kelly-Reid, and Ginder 2011), estimates in this report are disaggregated by selected sectors.
The second measure of cost is net price, which is the cost that the students and their families are responsible for both immediately and long term (through the use of student loans). Net price is the price of attendance minus grant aid (aid that does not need to be paid back).
The final measure is the out-of-pocket net price, which reflects the immediate amount that students and their families need to pay to attend college. It is the difference between the price of attendance and a student’s total financial aid package including grants, loans, and work-study. This measure may not reflect the actual cost to the student over the long-term. However, students who
1 Prior cycles of NPSAS included sampled institutions from Puerto Rico. 2 These numbers reflect unduplicated enrollment counts of students enrolled in postsecondary education. Students may enroll in multiple institutions during the academic year. Hence, NPSAS:12 uses a multiplicity adjustment to estimate the unduplicated counts of undergraduate and graduate students.
2 INTRODUCTION
finance their education using loans must repay not only the principal balance but also any accrued interest. Exhibit 1 summarizes the three price measures used in this report.
Exhibit 1. Summary of price measures
Measure Calculation When does the student need to pay?
Price of attendance or “sticker price”
None The price that students pay during the academic year if they receive no financial aid (includes tuition and fees, books and materials, housing, food, transportation, and personal expenses).
Net price Price of attendance – All grant aid
= Net price
This is the price that students are responsible for either immediately or that needs to be paid back over time.
Net “out-of-pocket” price
Price of attendance – All grant aid – All other aid (e.g., loans, work study, etc.)
= Net “out-of-pocket” price
This is the “out-of-pocket” amount that students are responsible to pay from family income or assets during the academic year. This price does not account for the total cost of debt (i.e., principal plus interest) students incur to pay for college.
For more information about the sources and types of financial aid funding used to develop these measures, see 2011–12 National Postsecondary Student Aid Study (NPSAS:12): Student Financial Aid Estimates for 2011–12.3 This report includes estimates from the 2007–08 National Postsecondary Student Aid Study (NPSAS:08) to evaluate changes in net price since the 2007–08 academic year.4
This report is descriptive in nature and is intended to introduce new National Center for Education Statistics (NCES) NPSAS survey data through the presentation of selected descriptive information. Readers are cautioned not to draw causal inferences based on the presented NPSAS:08 and NPSAS:12 cross-sectional bivariate results. It is important to note that many of the variables examined in this report may be related to one another, and complex interactions and relationships among the variables have not been explored. The variables examined here are also just a small number of those that can be examined in these data; they were selected to demonstrate the range of
3 See Radwin, D., Wine, J., Siegel, P., and Bryan, M. (2013). 2011–12 National Postsecondary Student Aid Study (NPSAS:12): Student Financial Aid Estimates for 2011–12 (NCES 2013-165). Institute of Education Sciences, U.S. Department of Education. Washington, DC: National Center for Education Statistics. Retrieved from http://nces.ed.gov/pubsearch/pubsinfo.asp?pubid=2013165. 4 For more information about NPSAS:08, see Cominole, M., Riccobono, J., Siegel, P., and Caves, L. (2010). 2007–08 National Postsecondary Student Aid Study (NPSAS:08) Full-scale Methodology Report (NCES 2011-188). U.S. Department of Education. Washington, DC: National Center for Education Statistics. Retrieved from http://nces.ed.gov/pubsearch/pubsinfo.asp?pubid=2011188.
information available from the study. These findings are examples of estimates that can be obtained from the data and are not designed to emphasize any particular issue. The release of this report is intended to encourage more in-depth analysis of the data using more sophisticated statistical methods.
Comparisons made in the text were tested for statistical significance to ensure that the differences were larger than might be expected as a result of sampling variation. All differences reported are significant at the p < .05 level. Dollar estimates for NPSAS:08 were adjusted for inflation, but there were no adjustments for multiple comparisons. Given the short format of this release report, information highlighted in the bullets does not report all statistically significant findings from the tables.
Appendix A provides a glossary of variables and their definitions used in this publication. Additional details about Title IV programs are available in the 2011–12 Federal Student Aid Handbook, available at http://ifap.ed.gov/ifap/index.jsp.
Appendix B provides details about the methods and procedures used for NPSAS:12. It contains information on the data sources, sample design, imputation, weighting, and the quality of estimates.
Selected Findings Average price of attendance (includes tuition, fees, books, housing, food, transportation, and personal expenses) in 2011–12 (table 1):
• Among all undergraduates in the 2011–12 academic year, the average price of attending a 4-year institution was $17,900 for public institutions and $34,400 for private nonprofit institutions. At private for-profit 4-year institutions, the average price of attendance was $19,400. The price of attendance was $1,700 higher at public 4-year institutions and $3,900 higher at private nonprofit 4-year institutions compared with 2007–08, after controlling for inflation.5, 6
• The average price of attendance for undergraduate students in 2011–12 was $8,700 for public 2-year institutions and $21,100 for private for-profit 2-year institutions.
• Among full-time, full-year undergraduates, the average price of attending 4-year institutions in the 2011-12 academic year was $23,200 for public institutions and $43,500 for private nonprofit institutions.
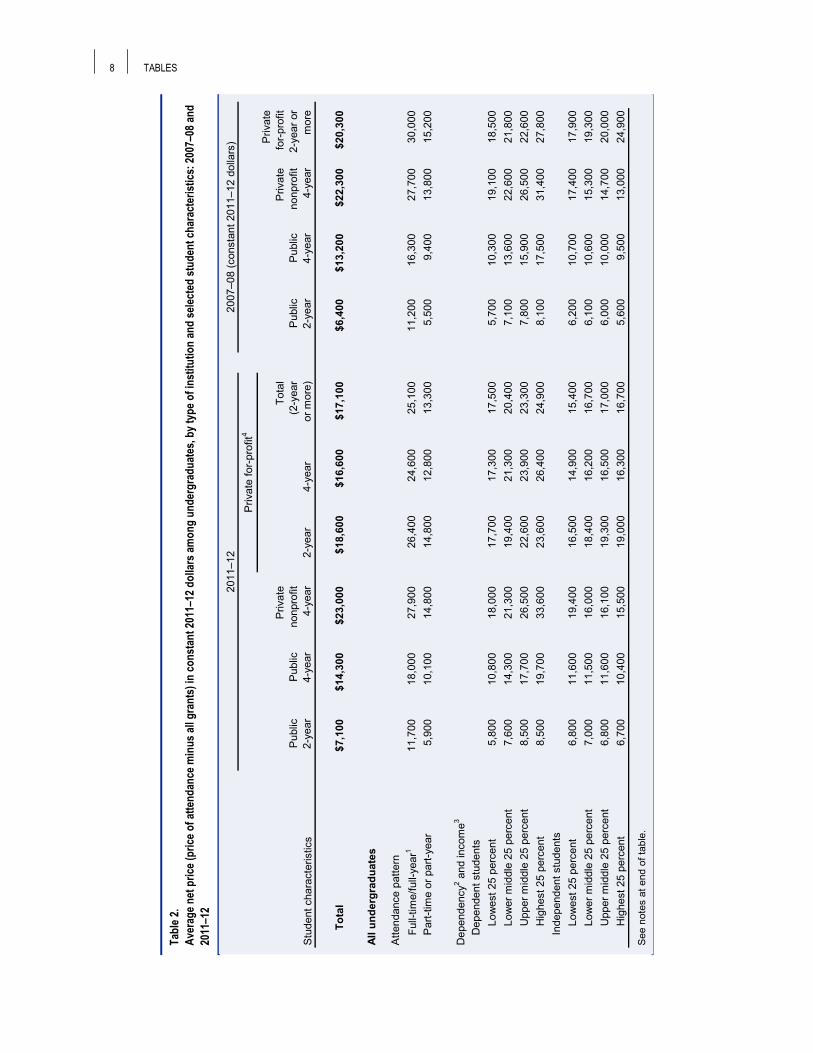
Average net price (price of attendance minus all grant aid) in 2011–12 (table 2):
• The average net price for undergraduates during the 2011–12 academic year to attend a 4-year institution was $14,300 for a public institution and $23,000 for a private nonprofit institution. At private for-profit 4-year institutions, the average net price was $16,600. Public 4-year institutions had a net price that was $1,100 higher in 2011–12 than in 2007–08, after controlling for inflation.
• The average net price for undergraduate students in 2011-12 was $7,100 for public 2-year institutions and $18,600 for for-profit 2-year institutions. The net price at public 2-year institutions was $700 higher in 2011–12 than in the 2007–08 academic year, after controlling for inflation.
• Among full-time, full-year undergraduate students in the 2011–12 academic year, the average net price was $18,000 at public 4-year institutions and $27,900 at private nonprofit 4-year institutions.
Average out-of-pocket net price (price of attendance minus all financial aid) in 2011–12 (table 3):
• The average out-of-pocket net price that undergraduates needed to pay in the 2011–12 academic year (i.e., the amount that students had to pay after all financial aid was applied) to attend a 4-year institution was $9,600 for public institutions and $15,000 for private nonprofit institutions. At private for-profit 4-year institutions, the average price of attendance was $9,000. The price of attendance was $800 higher at both public 4-year and private nonprofit 4-year institutions compared with 2007–08, after controlling for inflation.
• Among all undergraduates in 2011–12, the average out-of-pocket net price was $6,000 for public 2-year institutions and $12,400 for private for-profit 2-year institutions. The out-of-pocket net price at public 2-year institutions was $400 higher than in 2007–08, controlling for inflation.
• For full-time, full-year undergraduate students in the 2011–12 academic year, the average out-of-pocket net price was $11,800 at public 4-year institutions and $18,100 at private nonprofit 4-year institutions.
5 The inflation adjustment uses the percentage increase in the average monthly Consumer Price Index for All Urban Consumers (CPI-U) from July 2007 through June 2008 compared with the average monthly price index from July 2011through June 2012. All differences were calculated using unrounded figures. 6 NPSAS:12 estimates from private for-profit 4-year and private for-profit 2-year institutions could not each be compared with estimates from NPSAS:08 because a different stratification was used in the NPSAS:12 sampling design.
6 TABLES
Tabl
e 1.
Aver
age p
rice o
f atte
ndan
ce in
cons
tant
2011
–12 d
ollar
s for
und
ergr
adua
te st
uden
ts, b
y typ
e of i
nstit
utio
n an
d se
lecte
d st
uden
t cha
ract
erist
ics: 2
007–
08 an
d 20
11–1
2
2011
–12
2007
–08
(con
stan
t 201
1–12
dol
lars
)
Priv
ate
for-p
rofit
4
Priv
ate
Priv
ate
Tota
l P
rivat
e fo
r-pro
fit
Pub
lic
Pub
lic
nonp
rofit
(2
-yea
r
Pub
lic
Pub
lic
nonp
rofit
2-
year
or
Stu
dent
cha
ract
eris
tics
2-ye
ar4-
year
4-ye
ar2-
year
4-ye
aror
mor
e)2-
year
4-ye
ar4-
year
mor
e
T
otal
$8,7
00$1
7,90
0$3
4,40
0$2
1,10
0$1
9,40
0$1
9,90
0$7
,300
$16,
200
$30,
400
$22,
400
All u
nder
grad
uate
s
Atte
ndan
ce p
atte
rn1
Full-
time/
full-
year
15,0
0023
,200
43,5
0029
,700
29,0
0029
,200
13,6
0020
,400
38,8
0032
,900
Par
t-tim
e or
par
t-yea
r7,
100
11,9
0018
,900
16,8
0014
,900
15,4
006,
100
10,9
0017
,400
17,0
00
3D
epen
denc
y2 and
inco
me
Dep
ende
nt s
tude
nts
Lo
wes
t 25
perc
ent
9,20
018
,500
37,0
0021
,200
22,4
0021
,900
7,70
017
,000
34,5
0021
,700
Lo
wer
mid
dle
25 p
erce
nt9,
300
19,4
0038
,600
21,8
0024
,800
23,4
007,
700
17,1
0034
,700
23,2
00
Upp
er m
iddl
e 25
per
cent
9,10
020
,000
39,7
0023
,200
24,6
0023
,900
8,20
018
,000
36,7
0022
,800
H
ighe
st 2
5 pe
rcen
t8,
900
21,8
0044
,700
23,9
0028
,900
26,2
008,
400
19,2
0038
,400
28,0
00In
depe
nden
t stu
dent
s
Low
est 2
5 pe
rcen
t9,
200
16,0
0028
,500
19,5
0018
,100
18,5
007,
800
14,3
0024
,500
20,6
00
Low
er m
iddl
e 25
per
cent
9,10
015
,100
22,4
0021
,200
19,5
0019
,900
7,20
012
,800
19,5
0021
,700
U
pper
mid
dle
25 p
erce
nt8,
200
13,5
0019
,800
21,8
0019
,100
19,6
006,
700
11,5
0017
,900
22,0
00
Hig
hest
25
perc
ent
7,30
011
,400
17,8
0020
,300
17,9
0018
,300
6,00
010
,600
15,5
0026
,600
See
not
es a
t end
of t
able
.
TABLES 7
Tabl
e 1.
Aver
age p
rice o
f atte
ndan
ce in
cons
tant
2011
–12 d
ollar
s for
und
ergr
adua
te st
uden
ts, b
y typ
e of i
nstit
utio
n an
d se
lecte
d st
uden
t cha
ract
erist
ics: 2
007–
08 an
d 20
11–1
2—co
ntin
ued
2011
–12
2007
–08
(con
stan
t 201
1–12
dol
lars
)
Priv
ate
for-p
rofit
4
Priv
ate
Priv
ate
Tota
l P
rivat
e fo
r-pro
fit
Pub
lic
Pub
lic
nonp
rofit
(2
-yea
r P
ublic
P
ublic
no
npro
fit
2-ye
ar o
r S
tude
nt c
hara
cter
istic
s2-
year
4-ye
ar4-
year
2-ye
ar4-
year
or m
ore)
2-ye
ar4-
year
4-ye
arm
ore
1Fu
ll-tim
e/fu
ll-ye
ar u
nder
grad
uate
s
3D
epen
denc
y2 and
inco
me
Dep
ende
nt s
tude
nts
Lo
wes
t 25
perc
ent
13,9
0021
,900
42,7
0029
,800
32,1
0031
,100
12,4
0019
,300
37,7
0032
,200
Lo
wer
mid
dle
25 p
erce
nt14
,300
22,7
0043
,300
30,4
0032
,700
31,9
0012
,600
19,8
0038
,200
33,1
00
Upp
er m
iddl
e 25
per
cent
14,3
0023
,300
44,0
0034
,000
34,5
0034
,200
13,3
0020
,400
39,7
0032
,700
H
ighe
st 2
5 pe
rcen
t14
,800
25,2
0047
,600
33,5
0038
,000
35,7
0013
,300
21,8
0042
,100
37,0
00In
depe
nden
t stu
dent
s
Low
est 2
5 pe
rcen
t16
,100
22,4
0039
,700
28,5
0029
,500
29,2
0014
,900
20,2
0034
,400
32,0
00
Low
er m
iddl
e 25
per
cent
16,5
0022
,200
35,2
0028
,600
28,6
0028
,600
15,4
0020
,100
31,6
0032
,100
U
pper
mid
dle
25 p
erce
nt15
,900
22,2
0033
,100
29,8
0027
,900
28,3
0015
,500
20,1
0031
,200
32,7
00
Hig
hest
25
perc
ent
15,7
0022
,600
33,2
0028
,900
26,8
0027
,100
16,3
0021
,900
32,4
0034
,600
1 Ful
l-tim
e/fu
ll-ye
ar s
tude
nts
wer
e en
rolle
d fu
ll tim
e 9
mon
ths
or m
ore
durin
g th
e ac
adem
ic y
ear (
July
1 to
Jun
e 30
).2 D
epen
dent
stu
dent
s ar
e un
derg
radu
ates
und
er a
ge 2
4 w
ho a
re n
ot m
arrie
d, h
ave
no d
epen
dent
s, a
re n
ot v
eter
ans
or o
n ac
tive
mili
tary
dut
y, a
re n
ot o
rpha
ns o
r war
ds o
f the
cou
rt, w
ere
not h
omel
ess
or a
t ris
k of
bec
omin
g ho
mel
ess,
and
wer
e no
t det
erm
ined
to b
e in
depe
nden
t by
a fin
anci
al a
id o
ffice
r usi
ng p
rofe
ssio
nal j
udgm
ent.
Oth
er u
nder
grad
uate
s ar
e co
nsid
ered
to
be in
depe
nden
t.3 C
onsi
sts
of p
aren
ts’ 2
010
inco
me
in N
PS
AS
:12
or 2
006
inco
me
in N
PS
AS
:08
for d
epen
dent
stu
dent
s. In
depe
nden
t stu
dent
inco
me
incl
udes
the
stud
ent’s
inco
me
(and
the
inco
me
of a
sp
ouse
if th
e st
uden
t is
mar
ried)
in 2
010
for N
PS
AS
:12
or 2
006
for N
PS
AS
:08.
4 The
sam
plin
g de
sign
for N
PS
AS
:08
com
bine
d pr
ivat
e fo
r-pr
ofit
2-ye
ar w
ith p
rivat
e fo
r-pr
ofit
4-ye
ar in
stitu
tions
, whe
reas
NP
SA
S:1
2 ex
plic
itly
sam
pled
priv
ate
for-
prof
it 4-
year
and
priv
ate
for-
prof
it 2-
year
inst
itutio
ns s
epar
atel
y. N
PS
AS
:12
for-
prof
it in
stitu
tion
estim
ates
wer
e ag
greg
ated
und
er th
e to
tal t
o al
low
for c
ompa
rison
s w
ith N
PS
AS
:08.
NO
TE: T
his
tabl
e ex
clud
es s
tude
nts
atte
ndin
g le
ss-th
an-2
-yea
r ins
titut
ions
, priv
ate
nonp
rofit
2-y
ear i
nstit
utio
ns, o
r mor
e th
an o
ne in
stitu
tion.
Est
imat
es in
clud
e st
uden
ts e
nrol
led
in T
itle
IV
elig
ible
pos
tsec
onda
ry in
stitu
tions
in th
e 50
sta
tes
and
the
Dis
trict
of C
olum
bia.
For
com
para
bilit
y w
ith N
PS
AS
:12,
thes
e es
timat
es e
xclu
de s
tude
nts
enro
lled
in P
uerto
Ric
an in
stitu
tions
by
filte
ring
on C
OM
PTO
87. U
nlik
e pr
ior c
ycle
s of
NP
SA
S, N
PS
AS
:12
does
not
incl
ude
inst
itutio
ns s
ampl
ed fr
om P
uerto
Ric
o.
SO
UR
CE
: U.S
. Dep
artm
ent o
f Edu
catio
n, N
atio
nal C
ente
r for
Edu
catio
n S
tatis
tics,
200
7–08
and
201
1–12
Nat
iona
l Pos
tsec
onda
ry S
tude
nt A
id S
tudy
(NP
SA
S:0
8 an
d N
PS
AS
:12)
.
8 TABLES
Tabl
e 2.
Aver
age n
et p
rice (
price
of a
ttend
ance
min
us al
l gra
nts)
in co
nsta
nt 20
11–1
2 dol
lars a
mon
g un
derg
radu
ates
, by t
ype o
f ins
titut
ion
and
selec
ted
stud
ent c
hara
cter
istics
: 200
7–08
and
2011
–12
2011
–12
2007
–08
(con
stan
t 201
1–12
dol
lars
)
Priv
ate
for-p
rofit
4
Priv
ate
Priv
ate
Tota
l
Priv
ate
for-p
rofit
P
ublic
P
ublic
no
npro
fit
(2-y
ear
Pub
lic
Pub
lic
nonp
rofit
2-
year
or
Stu
dent
cha
ract
eris
tics
2-ye
ar4-
year
4-ye
ar2-
year
4-ye
aror
mor
e)2-
year
4-ye
ar4-
year
mor
e
T
otal
$7,1
00$1
4,30
0$2
3,00
0$1
8,60
0$1
6,60
0$1
7,10
0$6
,400
$13,
200
$22,
300
$20,
300
All u
nder
grad
uate
s
Atte
ndan
ce p
atte
rn1
Full-
time/
full-
year
11,7
0018
,000
27,9
0026
,400
24,6
0025
,100
11,2
0016
,300
27,7
0030
,000
Par
t-tim
e or
par
t-yea
r5,
900
10,1
0014
,800
14,8
0012
,800
13,3
005,
500
9,40
013
,800
15,2
00
3D
epen
denc
y2 and
inco
me
Dep
ende
nt s
tude
nts
Lo
wes
t 25
perc
ent
5,80
010
,800
18,0
0017
,700
17,3
0017
,500
5,70
010
,300
19,1
0018
,500
Lo
wer
mid
dle
25 p
erce
nt7,
600
14,3
0021
,300
19,4
0021
,300
20,4
007,
100
13,6
0022
,600
21,8
00
Upp
er m
iddl
e 25
per
cent
8,50
017
,700
26,5
0022
,600
23,9
0023
,300
7,80
015
,900
26,5
0022
,600
H
ighe
st 2
5 pe
rcen
t8,
500
19,7
0033
,600
23,6
0026
,400
24,9
008,
100
17,5
0031
,400
27,8
00In
depe
nden
t stu
dent
s
Low
est 2
5 pe
rcen
t6,
800
11,6
0019
,400
16,5
0014
,900
15,4
006,
200
10,7
0017
,400
17,9
00
Low
er m
iddl
e 25
per
cent
7,00
011
,500
16,0
0018
,400
16,2
0016
,700
6,10
010
,600
15,3
0019
,300
U
pper
mid
dle
25 p
erce
nt6,
800
11,6
0016
,100
19,3
0016
,500
17,0
006,
000
10,0
0014
,700
20,0
00
Hig
hest
25
perc
ent
6,70
010
,400
15,5
0019
,000
16,3
0016
,700
5,60
09,
500
13,0
0024
,900
See
not
es a
t end
of t
able
.
TABLES 9
Tabl
e 2.
Aver
age n
et p
rice (
price
of a
ttend
ance
min
us al
l gra
nts)
in co
nsta
nt 20
11–1
2 dol
lars a
mon
g un
derg
radu
ates
, by t
ype o
f ins
titut
ion
and
selec
ted
stud
ent c
hara
cter
istics
: 200
7–08
and
2011
–12—
cont
inue
d
2011
–12
2007
–08
(con
stan
t 201
1–12
dol
lars
)
Priv
ate
for-p
rofit
4
Priv
ate
Priv
ate
Tota
l P
rivat
e fo
r-pro
fit
Pub
lic
Pub
lic
nonp
rofit
(2
-yea
r P
ublic
P
ublic
no
npro
fit
2-ye
ar o
r S
tude
nt c
hara
cter
istic
s2-
year
4-ye
ar4-
year
2-ye
ar4-
year
or m
ore)
2-ye
ar4-
year
4-ye
arm
ore
1Fu
ll-tim
e/fu
ll-ye
ar u
nder
grad
uate
s
3D
epen
denc
y2 and
inco
me
Dep
ende
nt s
tude
nts
Lo
wes
t 25
perc
ent
8,30
012
,300
19,7
0025
,200
24,3
0024
,700
8,20
011
,200
20,2
0027
,500
Lo
wer
mid
dle
25 p
erce
nt11
,300
16,2
0023
,300
27,3
0028
,200
27,9
0011
,300
15,4
0024
,400
30,8
00
Upp
er m
iddl
e 25
per
cent
13,3
0020
,400
28,8
0033
,400
33,2
0033
,300
12,5
0018
,000
28,4
0031
,900
H
ighe
st 2
5 pe
rcen
t14
,000
22,8
0035
,500
33,1
0034
,800
33,9
0012
,800
19,8
0034
,200
36,9
00In
depe
nden
t stu
dent
s
Low
est 2
5 pe
rcen
t11
,400
15,3
0024
,600
24,1
0024
,000
24,0
0010
,900
14,4
0023
,400
28,4
00
Low
er m
iddl
e 25
per
cent
12,1
0016
,100
23,4
0024
,900
23,6
0023
,900
12,2
0016
,000
23,6
0029
,000
U
pper
mid
dle
25 p
erce
nt12
,400
18,3
0025
,700
26,4
0023
,900
24,4
0013
,100
17,0
0025
,900
30,3
00
Hig
hest
25
perc
ent
14,1
0020
,100
27,6
0027
,600
24,6
0025
,000
15,5
0020
,200
28,3
0032
,400
1 Fu
ll-tim
e/fu
ll-ye
ar s
tude
nts
wer
e en
rolle
d fu
ll tim
e 9
mon
ths
or m
ore
durin
g th
e ac
adem
ic y
ear (
July
1 to
Jun
e 30
).2 D
epen
dent
stu
dent
s ar
e un
derg
radu
ates
und
er a
ge 2
4 w
ho a
re n
ot m
arrie
d, h
ave
no d
epen
dent
s, a
re n
ot v
eter
ans
or o
n ac
tive
mili
tary
dut
y, a
re n
ot o
rpha
ns o
r war
ds o
f the
cou
rt, w
ere
not h
omel
ess
or a
t ris
k of
bec
omin
g ho
mel
ess,
and
wer
e no
t det
erm
ined
to b
e in
depe
nden
t by
a fin
anci
al a
id o
ffice
r usi
ng p
rofe
ssio
nal j
udgm
ent.
Oth
er u
nder
grad
uate
s ar
e co
nsid
ered
to
be in
depe
nden
t.3 C
onsi
sts
of p
aren
ts’ 2
010
inco
me
in N
PS
AS:
12 o
r 200
6 in
com
e in
NP
SA
S:08
for d
epen
dent
stu
dent
s. In
depe
nden
t stu
dent
inco
me
incl
udes
the
stud
ent’s
inco
me
(and
the
inco
me
of a
sp
ouse
if th
e st
uden
t is
mar
ried)
in 2
010
for N
PS
AS
:12
or 2
006
for N
PS
AS
:08.
4 The
sam
plin
g de
sign
for N
PS
AS
:08
com
bine
d pr
ivat
e fo
r-pr
ofit
2-ye
ar w
ith p
rivat
e fo
r-pr
ofit
4-ye
ar in
stitu
tions
, whe
reas
NP
SA
S:1
2 ex
plic
itly
sam
pled
priv
ate
for-
prof
it 4-
year
and
priv
ate
for-
prof
it 2-
year
inst
itutio
ns s
epar
atel
y. N
PS
AS
:12
for-
prof
it in
stitu
tion
estim
ates
wer
e ag
greg
ated
und
er th
e to
tal t
o al
low
for c
ompa
rison
s w
ith N
PS
AS
:08.
NO
TE: T
his
tabl
e ex
clud
es s
tude
nts
atte
ndin
g le
ss-th
an-2
-yea
r ins
titut
ions
, priv
ate
nonp
rofit
2-y
ear i
nstit
utio
ns, o
r mor
e th
an o
ne in
stitu
tion.
Est
imat
es in
clud
e st
uden
ts e
nrol
led
in T
itle
IV
elig
ible
pos
tsec
onda
ry in
stitu
tions
in th
e 50
sta
tes
and
the
Dis
trict
of C
olum
bia.
For
com
para
bilit
y w
ith N
PS
AS
:12,
thes
e es
timat
es e
xclu
de s
tude
nts
enro
lled
in P
uerto
Ric
an in
stitu
tions
by
filte
ring
on C
OM
PTO
87. U
nlik
e pr
ior c
ycle
s of
NP
SA
S, N
PS
AS
:12
does
not
incl
ude
inst
itutio
ns s
ampl
ed fr
om P
uerto
Ric
o.
SO
UR
CE
: U.S
. Dep
artm
ent o
f Edu
catio
n, N
atio
nal C
ente
r for
Edu
catio
n S
tatis
tics,
200
7–08
and
201
1–12
Nat
iona
l Pos
tsec
onda
ry S
tude
nt A
id S
tudy
(NP
SA
S:0
8 an
d N
PS
AS
:12)
.
10 TABLES
Tabl
e 3.
Aver
age o
ut-o
f-poc
ket n
et p
rice (
price
of a
ttend
ance
min
us to
tal a
id) i
n co
nsta
nt 20
11–1
2 dol
lars o
f pos
tsec
onda
ry ed
ucat
ion
amon
g un
derg
radu
ates
, by t
ype o
f ins
titut
ion
and
selec
ted
stud
ent c
hara
cter
istics
: 200
7–08
and
2011
–12
2011
–12
2007
–08
(con
stan
t 201
1–12
dol
lars
)
Priv
ate
for-p
rofit
4
Priv
ate
Priv
ate
Tota
l
Priv
ate
for-p
rofit
P
ublic
P
ublic
no
npro
fit
(2-y
ear
Pub
lic
Pub
lic
nonp
rofit
2-
year
or
Stu
dent
cha
ract
eris
tics
2-ye
ar4-
year
4-ye
ar2-
year
4-ye
aror
mor
e)2-
year
4-ye
ar4-
year
mor
e
T
otal
$6,0
00$9
,600
$15,
000
$12,
400
$9,0
00$9
,900
$5,6
00$8
,800
$14,
200
$11,
500
All u
nder
grad
uate
s
Atte
ndan
ce p
atte
rn1
Full-
time/
full-
year
9,90
011
,800
18,1
0017
,800
13,2
0014
,500
9,60
010
,800
17,6
0019
,800
Par
t-tim
e or
par
t-yea
r5,
000
7,10
09,
700
9,70
07,
000
7,70
04,
800
6,40
08,
900
7,20
0
3D
epen
denc
y2 and
inco
me
Dep
ende
nt s
tude
nts
Lo
wes
t 25
perc
ent
5,20
06,
500
10,2
0012
,200
9,10
010
,600
5,10
05,
900
10,1
009,
100
Lo
wer
mid
dle
25 p
erce
nt6,
800
9,00
012
,000
11,0
009,
900
10,4
006,
300
8,50
011
,900
10,1
00
Upp
er m
iddl
e 25
per
cent
7,70
012
,400
16,9
0013
,700
13,3
0013
,500
7,00
011
,000
16,3
0010
,300
H
ighe
st 2
5 pe
rcen
t8,
000
14,8
0025
,400
17,7
0015
,100
16,5
007,
500
13,6
0023
,500
13,3
00In
depe
nden
t stu
dent
s
Low
est 2
5 pe
rcen
t5,
400
6,80
011
,300
11,6
008,
300
9,20
05,
200
5,90
09,
600
10,4
00
Low
er m
iddl
e 25
per
cent
5,50
06,
500
9,60
012
,800
8,30
09,
500
5,00
06,
100
8,40
011
,000
U
pper
mid
dle
25 p
erce
nt5,
400
7,30
09,
200
11,8
008,
900
9,40
05,
200
6,30
08,
700
12,0
00
Hig
hest
25
perc
ent
5,70
07,
500
10,3
0012
,200
9,50
09,
900
5,10
07,
100
9,00
016
,000
See
not
es a
t end
of t
able
.
TABLES 11
Tabl
e 3.
Aver
age o
ut-o
f-poc
ket n
et p
rice (
price
of a
ttend
ance
min
us to
tal a
id) i
n co
nsta
nt 20
11–1
2 dol
lars o
f pos
tsec
onda
ry ed
ucat
ion
amon
g un
derg
radu
ates
, by t
ype o
f ins
titut
ion
and
selec
ted
stud
ent c
hara
cter
istics
: 200
7–08
and
2011
–12—
cont
inue
d
2011
–12
2007
–08
(con
stan
t 201
1–12
dol
lars
)
Priv
ate
for-p
rofit
4
Priv
ate
Priv
ate
Tota
l P
rivat
e fo
r-pro
fit
Pub
lic
Pub
lic
nonp
rofit
(2
-yea
r P
ublic
P
ublic
no
npro
fit
2-ye
ar o
r S
tude
nt c
hara
cter
istic
s2-
year
4-ye
ar4-
year
2-ye
ar4-
year
or m
ore)
2-ye
ar4-
year
4-ye
arm
ore
1Fu
ll-tim
e/fu
ll-ye
ar u
nder
grad
uate
s3
Dep
ende
ncy2 a
nd in
com
eD
epen
dent
stu
dent
s
Low
est 2
5 pe
rcen
t7,
500
7,10
011
,000
18,0
0012
,400
15,0
007,
100
6,20
010
,400
14,9
00
Low
er m
iddl
e 25
per
cent
10,2
009,
900
12,9
0015
,300
13,5
0014
,200
9,90
09,
500
12,7
0016
,600
U
pper
mid
dle
25 p
erce
nt11
,900
13,9
0018
,200
18,5
0017
,800
18,2
0011
,200
12,3
0017
,400
17,1
00
Hig
hest
25
perc
ent
13,1
0016
,800
26,6
0024
,900
20,5
0022
,700
12,0
0015
,300
25,6
0018
,000
Inde
pend
ent s
tude
nts
Lo
wes
t 25
perc
ent
8,80
08,
600
13,9
0017
,200
13,1
0014
,300
8,70
07,
500
12,3
0019
,600
Lo
wer
mid
dle
25 p
erce
nt9,
000
8,40
013
,900
17,6
0012
,600
13,9
009,
500
8,70
013
,400
19,2
00
Upp
er m
iddl
e 25
per
cent
9,50
010
,300
15,0
0017
,000
12,9
0013
,700
10,3
0010
,000
15,6
0020
,600
H
ighe
st 2
5 pe
rcen
t11
,500
13,6
0017
,300
18,8
0013
,600
14,4
0012
,500
13,8
0019
,200
23,7
001 F
ull-t
ime/
full-
year
stu
dent
s w
ere
enro
lled
full
time
9 m
onth
s or
mor
e du
ring
the
acad
emic
yea
r (Ju
ly 1
to J
une
30).
2 Dep
ende
nt s
tude
nts
are
unde
rgra
duat
es u
nder
age
24
who
are
not
mar
ried,
hav
e no
dep
ende
nts,
are
not
vet
eran
s or
on
activ
e m
ilita
ry d
uty,
are
not
orp
hans
or w
ards
of t
he c
ourt,
wer
e no
t hom
eles
s or
at r
isk
of b
ecom
ing
hom
eles
s, a
nd w
ere
not d
eter
min
ed to
be
inde
pend
ent b
y a
finan
cial
aid
offi
cer u
sing
pro
fess
iona
l jud
gmen
t. O
ther
und
ergr
adua
tes
are
cons
ider
ed to
be
inde
pend
ent.
3 Con
sist
s of
par
ents
’ 201
0 in
com
e in
NP
SA
S:1
2 or
200
6 in
com
e in
NP
SA
S:0
8 fo
r dep
ende
nt s
tude
nts.
Inde
pend
ent s
tude
nt in
com
e in
clud
es th
e st
uden
t’s in
com
e (a
nd th
e in
com
e of
a
spou
se if
the
stud
ent i
s m
arrie
d) in
201
0 fo
r NP
SA
S:1
2 or
200
6 fo
r NP
SA
S:0
8.4 T
he s
ampl
ing
desi
gn fo
r NP
SA
S:0
8 co
mbi
ned
priv
ate
for-
prof
it 2-
year
with
priv
ate
for-
prof
it 4-
year
inst
itutio
ns, w
here
as N
PS
AS
:12
expl
icitl
y sa
mpl
ed p
rivat
e fo
r-pr
ofit
4-ye
ar a
nd p
rivat
e fo
r-pr
ofit
2-ye
ar in
stitu
tions
sep
arat
ely.
NP
SA
S:1
2 fo
r-pr
ofit
inst
itutio
n es
timat
es w
ere
aggr
egat
ed u
nder
the
tota
l to
allo
w fo
r com
paris
ons
with
NP
SA
S:0
8.N
OTE
: Tot
al a
id in
clud
es a
ll ty
pes
of fi
nanc
ial a
id fr
om a
ny s
ourc
e ex
cept
par
ents
, frie
nds,
or r
elat
ives
. Tot
al a
id in
clud
es D
irect
PLU
S lo
ans
to p
aren
ts o
f und
ergr
adua
te s
tude
nts,
kno
wn
in
2007
–08
as P
aren
t Loa
ns to
Und
ergr
adua
te S
tude
nts
(PLU
S). T
his
tabl
e ex
clud
es s
tude
nts
atte
ndin
g le
ss-th
an-2
-yea
r ins
titut
ions
, priv
ate
nonp
rofit
2-y
ear i
nstit
utio
ns, o
r mor
e th
an o
ne
inst
itutio
n. E
stim
ates
incl
ude
stud
ents
enr
olle
d in
Titl
e IV
elig
ible
pos
tsec
onda
ry in
stitu
tions
in th
e 50
sta
tes
and
the
Dis
trict
of C
olum
bia.
For
com
para
bilit
y w
ith N
PS
AS
:12,
thes
e es
timat
es
excl
ude
stud
ents
enr
olle
d in
Pue
rto R
ican
inst
itutio
ns b
y fil
terin
g on
CO
MP
TO87
. Unl
ike
prio
r cyc
les
of N
PS
AS
, NP
SA
S:1
2 do
es n
ot in
clud
e in
stitu
tions
sam
pled
from
Pue
rto R
ico.
S
OU
RC
E: U
.S. D
epar
tmen
t of E
duca
tion,
Nat
iona
l Cen
ter f
or E
duca
tion
Sta
tistic
s, 2
007–
08 a
nd 2
011–
12 N
atio
nal P
osts
econ
dary
Stu
dent
Aid
Stu
dy (N
PS
AS
:08
and
NP
SA
S:1
2).
This page intentionally left blank.
12
13 REFERENCES
References Chromy, J.R. (1979). Sequential Sample Selection Methods. Proceedings of the Section on Survey
Research Methods, American Statistical Association, 401–406.
Cominole, M., Riccobono, J., Siegel, P., and Caves, L. (2010). 2007–08 National Postsecondary Student Aid Study (NPSAS:08) Full-Scale Methodology Report (NCES 2011-188). U.S. Department of Education. Washington, DC: National Center for Education Statistics. Retrieved September 30, 2013, from http://nces.ed.gov/pubsearch/pubsinfo.asp?pubid=2011188.
Cox, B. (1980). The Weighted Sequential Hot Deck Imputation Procedure. Proceedings of the Section on Survey Research Methods, American Statistical Association, 721-726.
Flyer, P.A. (1987). Finite Population Correction for Replication Estimates of Variance. Proceedings of the Section on Survey Research Methods, American Statistical Association, 732-736.
Knapp, L.G., Kelly-Reid, J.E., and Ginder, S.A. (2011). Postsecondary Institutions and Price of Attendance in the United States: 2010–11, Degrees and Other Awards Conferred: 2009–10, and 12-Month Enrollment: 2009–10 (NCES 2011-250). National Center for Education Statistics, Institute of Education Sciences, U.S. Department of Education. Washington, DC. Retrieved September 30, 2013, from http://nces.ed.gov/pubsearch/pubsinfo.asp?pubid=2011250.
Kott, P.S. (1988). Model-Based Finite Population Correction for the Horvitz-Thompson Estimator. Biometrika, 75(4): 797–799.
Marker, D., Judkins, D., and Winglee, M. (2002). Large-Scale Imputation for Complex Surveys. In R. Groves, D. Dillman, J. Eltinge, and R. Little (Eds.), Survey Nonresponse (pp. 329–342). New York: Wiley.
Radwin, D., Wine, J., Siegel, P., and Bryan, M. (2013). 2011–12 National Postsecondary Student Aid Study (NPSAS:12): Student Financial Aid Estimates for 2011–12 (NCES 2013-165). National Center for Education Statistics, Institute of Education Sciences, U.S. Department of Education. Washington, DC. Retrieved September 30, 2013, from http://nces.ed.gov/pubsearch/pubsinfo.asp?pubid=2013165.
U.S. Department of Education. (2003). NCES Statistical Standards (NCES 2003-601). National Center for Education Statistics, Institute of Education Sciences, U.S. Department of Education. Washington, DC. Retrieved September 30, 2013, from http://nces.ed.gov/pubs2003/2003601.pdf.
Appendix A—Glossary This glossary includes descriptions of the variables used in the tables of this report, all of which are found in the 2011–12 and 2007–08 National Postsecondary Student Aid Study (NPSAS:12 and NPSAS:08) databases and are generated by PowerStats, a web-based software application available to the public online at http://nces.ed.gov/datalab. Variables are listed in the glossary index below by general topic area and then in the order in which they appear in the tables. The glossary that follows is organized alphabetically by variable label.
Glossary Index Institution and Student Characteristics Type of institution (includes students attending multiple institutions) ......... SECTOR1 Attendance pattern ............................................................................................ ATTNSTAT Dependent student income .................................................................................... PCTDEP Independent student income ............................................................................ PCTINDEP Number of institutions attended .................................................................... STUDMULT
Institution price Price of attendance (student budget [attendance adjusted]) ....................... BUDGETAJ Net out-of-pocket price of attendance (student budget minus all aid) ......... NETCST1 Net price of attendance (student budget minus all grants) ............................. NETCST3
Survey sample Comparable to 1987 (and 2012) NPSAS ....................................................... COMPTO87
Attendance pattern ATTNSTAT Number of months enrolled full time or part time at all institutions attended during the academic year. Full-year was defined as enrollment for 9 or more months during the NPSAS year. Months did not have to be contiguous or at the same institution, and students did not have to be enrolled for a full month in order to be considered enrolled for that month. Full-time status for the purposes of financial aid eligibility was based on 12 or more credit hours, unless the awarding institution employed a different standard. The categories were as follows:
Full-time/full-year Enrolled full time for 9 or more months.
Full-time/part-year Enrolled full time, but for less than 9 months.
Part-time/full-year Enrolled for 9 or more months, but less than 9 months were full time.
Part-time/part-year Enrolled for less than 9 months, and these months were not all full time.
Comparable to 1987 (and 2012) NPSAS COMPTO87 All cycles of NPSAS, except NPSAS:87 and NPSAS:12, sampled institutions in Puerto Rico. To compare other NPSAS cycles to NPSAS:87 and NPSAS:12, analysts must exclude Puerto Rico. The estimates from NPSAS:08 in this report were filtered using COMPTO87. Dependent student income PCTDEP For dependent undergraduates, this variable represents the total income of the student’s parents in the year prior to the academic year for all dependent undergraduates in the United States. Prior calendar year income is reported in the financial aid application and used in determining the expected family contribution (EFC) in need analysis. For example, 2010 income was used to determine financial aid eligibility for the 2011–12 academic year. Values are based on the financial aid application or the student interview. This variable represents the percentile rank of family income for all dependent students. The “Lowest 25 percent” includes those with incomes in the 0 to 24 percent range; the “Lower middle 25 percent” includes those with incomes in the 25 to 49 percent range; the “Upper middle 25 percent” includes those with incomes in the 50 to 74 percent range; and those in the “Highest 25 percent” have incomes in the 75 percent range or higher.
Independent student income PCTINDEP For independent students, this variable represents the total income of the student (and spouse, if married) in the year prior to the academic year. Prior calendar year income is reported in the financial aid application and used in determining the expected family contribution (EFC) in need analysis. For example, 2010 income was used to determine financial aid eligibility for the 2011–12 academic year. Values are based on the financial aid application or the student interview. This variable represents the percentile rank of income for all independent students. The “Lowest 25 percent” includes those with incomes in the 0 to 24 percent range; the “Lower middle 25 percent” includes those with incomes in the 25 to 49 percent range; the “Upper middle 25 percent” includes those with incomes in the 50 to 74 percent range; and those in the “Highest 25 percent” have incomes in the 75 percent range or higher.
Number of institutions attended STUDMULT The number of institutions attended during the academic year. Students who attended more than one institution were removed using STUDMULT because nontuition expenses at an institution other than the sampled NPSAS institution are not known. As an alternative, analysts can use AIDSECT (which combines STUDMULT and institution type) to accurately generate estimates by removing students who attend multiple institutions.
APPENDIX A—GLOSSARY A-3 VARIABLE
Price of attendance (i.e., sticker price) BUDGETAJ The price of attendance is the attendance-adjusted student budget at the NPSAS sample institution for students who attended only one institution during the academic year. It includes tuition and fees, books and supplies, room and board, transportation, and personal and any other expenses allowed for federal cost of attendance budgets. The price is based on institution-reported student budgets for students who applied for financial aid. Budgets for students who did not apply for financial aid were imputed by calculating the average nontuition budget amounts for aided students at the institution by dependency status and then adding the tuition and fees paid. Nontuition expenses for part-time or part-year students were adjusted to reflect the number of months enrolled and the attendance intensity.
Price of attendance minus all aid (i.e., net out-of-pocket price) NETCST1 The price of attendance minus all aid represents the estimated out-of-pocket expense to students (or net price) remaining after all financial aid, including loans, is received. It is equal to the attendance-adjusted student budget (BUDGETAJ) minus total aid (TOTAID)7. For students who did not receive any financial aid, this amount is the same as the price of attendance. NETCST1 reflects the immediate costs that students and their families need to pay to attend college. It does not reflect the cost the student is responsible for over the long-term. Students may incur debt through student loans which include interest to finance their education. NETCST1 is calculated only for students who attended one institution during the respective academic year.
Price of attendance minus all grants (i.e., net price) NETCST3 NETCST3 is the net total price of attendance after all grants. It is equal to the attendance-adjusted student budget (BUDGETAJ) minus all grants and scholarships from all sources (TOTGRT). Grants include tuition waivers and employer tuition reimbursements. NETCST3 does not include federal Veterans’ benefits, work-study, or education tax benefits. For students who did not receive any grants, this amount is the same as the price of attendance. NETCST3 reflects the immediate and/or long-term costs that students and their families pay to attend college. The principal of the student loans incurred during the academic year is reflected in the price. NETCST3 is only calculated for students who attended one institution during the respective academic year.
Type of institution (includes students attending multiple institutions) SECTOR1 Control and level of the NPSAS sample institution attended by the student during the 2011–12 (or 2007–08) academic year, based on the classification in the Integrated Postsecondary Education Data System (IPEDS) Institutional Characteristics file, respectively. Control concerns the source of revenue and control of operations (public, private nonprofit, private for-profit), and level concerns the highest degree or award offered by the institution in any program. Four-year institutions awarded at least a bachelor’s degree; 2-year institutions awarded an associate’s degree but not a bachelor’s degree or higher; less-than-2-year institutions awarded certificates or other credentials in vocational programs but not an associate’s degree or higher.
7 TOTAID included any grants, student loans, work-study, Direct PLUS Loans to parents of dependent undergraduates (known as Parent Loans for Undergraduate Students in 2007–08), job training funds, Veterans’ benefits and Department of Defense programs, and assistantships. It did not include federal tax benefits or financial assistance from parents, relatives, or friends.
This page intentionally left blank.
A-4
B-1
Appendix B— NPSAS:12 Technical Notes and Methodology
Overview The fundamental purpose of the 2011–12 National Postsecondary Student Aid Study
(NPSAS:12) is to serve as a comprehensive nationwide study to describe how students and their families pay for postsecondary education. NPSAS:12 features a nationally representative sample of both aided and nonaided students in postsecondary education institutions in the United States. The sample is made up of undergraduate and graduate students. These students attended all types and levels of postsecondary institutions that were eligible to distribute student aid authorized under Title IV of the Higher Education Act, including public and private institutions, for-profit and nonprofit institutions, less-than-2-year institutions, 2-year institutions, and 4-year colleges and universities.
The U.S. Department of Education’s (ED’s) National Center for Education Statistics (NCES) first implemented NPSAS during the 1986–87 academic year to meet the need for national-level data about financial aid issues. Since then, NCES has conducted NPSAS every 3 to 4 years, with the most recent implementation during the 2011–12 academic year. NPSAS also serves as the base-year data collection for two longitudinal studies—the Beginning Postsecondary Students Longitudinal Study (BPS) and the Baccalaureate and Beyond Longitudinal Study (B&B)—in alternating cycles. NPSAS:12 is the base year for BPS:12/17, which plans to follow a cohort of 2011–12 first-time beginning postsecondary students (FTBs) in 2014 and then again in 2017. A section of the NPSAS student interview focuses on describing the experiences of these students in their first year of postsecondary education.
Data Sources for NPSAS:12 The data collected for NPSAS:12 were obtained from multiple sources, including, but not
limited to, the following:
• Student records: Institutions were asked to provide information from student financial aid records and other institutional sources;
• Student interviews: Data were collected from students using a multimodal web-based survey either self-administered via the Web or through a computer-assisted telephone interview;
B-2 APPENDIX B— NPSAS:12 TECHNICAL NOTES AND METHODOLOGY
• ED’s Central Processing System (CPS): An ED database containing data from the Free Application for Federal Student Aid (FAFSA) forms;
• ED’s National Student Loan Data System (NSLDS): An ED database of Title IV federal grant and loan funding; and
• ED’s Integrated Postsecondary Education Data System (IPEDS): NCES’s database of descriptive information about individual postsecondary institutions.
Sample Design NPSAS:12 used a two-stage sampling design. The first stage involved the selection of
institutions. In the second stage, students were selected from within sampled institutions.
Selected institutions had to meet the following requirements:
• offered an educational program designed for persons who have completed secondary education;
• offered at least one academic, occupational, or vocational program of study lasting at least 3 months or 300 clock hours;
• offered courses that were open to more than the employees or members of the company or group (e.g., union) that administers the institution;
• were located in the 50 states or the District of Columbia; • were not a U.S. Service academy institution; and • had signed the Title IV participation agreement with ED.8
Institutions that provided only avocational, recreational, or remedial courses, or only in-house courses for their own employees or members, were excluded. All five of the U.S. Service academies were excluded because of their unique funding/tuition base: U.S. Military Academy, U.S. Naval Academy, U.S. Coast Guard Academy, U.S. Merchant Marine Academy, and U.S. Air Force Academy.
8 A Title IV eligible institution has a written program participation agreement with the U.S. Secretary of Education that allows the institution to participate in any of the Title IV federal student financial assistance programs other than the State Student Incentive Grant (SSIG) and the National Early Intervention Scholarship and Partnership (NEISP) programs.
APPENDIX B— NPSAS:12 TECHNICAL NOTES AND METHODOLOGY B-3
The above institution eligibility conditions were consistent with all previous NPSAS administrations with three exceptions: Title IV participation, inclusion of correspondence schools, and exclusion of Puerto Rico. The requirement that an institution be eligible to distribute federal Title IV aid was implemented beginning with NPSAS:2000. Institutions that offered only correspondence courses, provided these same institutions were also eligible to distribute federal Title IV student aid, were first included in NPSAS:04. Institutions in Puerto Rico were not originally included in NPSAS in 1987 but were subsequently added to administrations of NPSAS between 1993 and 2008. Although Puerto Rican institutions enroll only about 1 percent each of undergraduate and graduate students nationally, unique aid, enrollment, and demographic patterns distinguish it from institutions in the 50 states and the District of Columbia. As a result, students enrolled at these institutions tend to skew national estimates for Hispanic students not enrolled in institutions located in Puerto Rico. Because of this concern, and because estimates have never been representative for Puerto Rico, these institutions were not included in the 2012 administration of NPSAS.
The NPSAS:12 target population consisted of all eligible students enrolled at any time between July 1, 2011, and June 30, 2012, in eligible postsecondary institutions in the United States who were
• enrolled in o an academic program; o at least one course for credit that could be applied toward fulfilling the
requirements for an academic degree; o exclusively noncredit remedial coursework but determined by the institution to be
in a program of study eligible for Title IV aid; or o an occupational or vocational program that required at least 3 months or 300 clock
hours of instruction to receive a degree, certificate, or other formal award;
• not currently enrolled in high school; and • not solely enrolled in a General Educational Development (GED) or another high
school completion program.
The above student eligibility criteria were consistent with all previous NPSAS administrations except, in 2012, NCES clarified that students enrolled exclusively in noncredit remedial coursework were eligible to participate in NPSAS so long as the institution had determined they were in a program of study eligible for Title IV aid.
The NPSAS:12 full-scale institution sampling frame was constructed prior to the study’s field test (conducted during the 2010–11 financial aid year) from the IPEDS:2008–09 Institutional Characteristics (IC), 12-Month and Fall Enrollment, and Completions files. For the small number of institutions on the frame that had missing enrollment information, the data were imputed using the latest IPEDS imputation procedures to guarantee complete data for the frame.
B-4 APPENDIX B— NPSAS:12 TECHNICAL NOTES AND METHODOLOGY
Because the original sample of 1,670 institutions was drawn from the IPEDS:2008–09 IC file, the institution sample was freshened in order to add newly eligible institutions to the sample and produce a sample that was representative of institutions eligible in the 2011–12 academic year. To do this, the IPEDS:2009–10 IC, 12-Month and Fall Enrollment, and Completions files were used to create an updated sampling frame of current NPSAS-eligible institutions. This frame was then compared with the original frame, and 387 new or newly eligible institutions were identified. These 387 institutions were included in the freshening sampling frame. Twenty institutions were selected and added to the sample during the freshening process, resulting in a total of 1,690 sampled institutions. Four of these 1,690 institutions had become ineligible and were identified while contacting institutions rather than through the freshening process. Table B-1 shows the number of institutions that were sampled, the number of eligible institutions, the number of eligible institutions providing enrollment lists, the unweighted percentage of eligible institutions providing enrollment lists, and the weighted percentage of eligible institutions providing enrollment lists, by institution characteristic.
APPENDIX B— NPSAS:12 TECHNICAL NOTES AND METHODOLOGY B-5
Table B-1.Numbers of sampled, eligible, and participating institutions and enrollment list participation rates, by institution characteristic: 2012
2 The weight applied in this column is a base weight.NOTE: Detail may not sum to totals because of rounding. IPEDS = Integrated Postsecondary Education Data System.SOURCE: U.S. Department of Education, National Center for Education Statistics, 2011–12 National Postsecondary Student Aid Study (NPSAS:12).
1 Institution characteristics are based on data from the sampling frame formed from IPEDS:2008–09 and freshened from IPEDS:2009–10.
Each sampled institution verified as NPSAS-eligible was asked to provide a list of all students who satisfied all eligibility conditions. The NPSAS:12 student sample of 128,120 (as shown in table B-2) included two subgroups who were intentionally sampled at rates higher than their natural occurrence within the population to improve data quality. One subgroup included undergraduates enrolled in all types of for-profit institutions. In 2009–10, students in for-profit institutions received about 24 percent9
9 U.S. Department of Education, Federal Student Aid, Title IV Program Volume Reports: http://studentaid.ed.gov/about/data-center/student/title-iv.
B-6 APPENDIX B— NPSAS:12 TECHNICAL NOTES AND METHODOLOGY
of disbursed federal aid while constituting about 11 percent10 of the student population. For this subgroup, students in for-profit institutions and in the three undergraduate student strata listed below were oversampled. The other subgroup included FTB undergraduates enrolled in certificate programs at all types of institutions, who have important early labor market experiences that can only be explored in BPS with a sufficiently large starting sample. The first stratum below was added for this second subgroup, but the sampling rates for this stratum accounted for oversampling of these two subgroups.
Eleven student sampling strata were identified for NPSAS:12. Unlike prior NPSAS administrations, NPSAS:12 included additional stratification at the graduate student level to improve the quality of estimates for students in Science, Technology, Engineering, and Mathematics (STEM) programs. The resulting strata were
• FTB undergraduate students enrolled in certificate programs; • other FTB undergraduate students; • other undergraduate students;11 • master’s degree students in STEM programs; • master’s degree students in education and business programs; • master’s degree students in other programs; • doctor’s degree – research/scholarship and doctor’s degree – other students in STEM
programs; • doctor’s degree – research/scholarship and doctor’s degree – other students in
education and business programs; • doctor’s degree – research/scholarship and doctor’s degree – other students in other
programs; • doctor’s degree – professional practice students;12 and • other graduate students.13
As student lists were received from institutions, students were sampled by means of stratified systematic sampling with predetermined sampling rates that varied by student stratum. Table B-2 shows the number of students who were sampled, the number of eligible students, and the unweighted and weighted percentages of study members, by institution characteristics.
10 U.S. Department of Education, National Center for Education Statistics, IPEDS: http://nces.ed.gov/programs/digest/d11/tables/dt11_231.asp. 11 “Other undergraduate students” are defined as any undergraduate student not classified as an FTB student. 12 Previous administrations of NPSAS have included samples of first-professional students. However, IPEDS has replaced the term “first-professional” with “doctor’s degree – professional practice.” 13 “Other graduate students” are those who are not enrolled in a degree program, such as students taking just graduate courses.
1 A study member is defined as an eligible sample member for whom sufficient key data were obtained from one or more sources. 2 Institution characteristics are based on data from the sampling frame formed from IPEDS:2008–09 and freshened from IPEDS:2009–10.3 Sample member eligibility was determined during the student interview or from institutional records in the absence of a student interview.4 The weight applied in this column is a base weight.NOTE: Detail may not sum to totals because of rounding. IPEDS = Integrated Postsecondary Education Data System.SOURCE: U.S. Department of Education, National Center for Education Statistics, 2011–12 National Postsecondary Student Aid Study (NPSAS:12).
B-8 APPENDIX B— NPSAS:12 TECHNICAL NOTES AND METHODOLOGY
Study Members Study members, the unit of analysis in NPSAS:12, includes sample members for whom data
were available for a subset of key variables. The data required for study member designation were collected from student records, student interviews, and administrative federal and private databases including the CPS and NSLDS.
Specifically, a study member was any sampled student who was determined to be study eligible and had, at a minimum, valid data from any source14 for the following:
• student type (undergraduate or graduate); • date of birth or age; • sex; and • at least 8 of the following 15 variables:
o dependency status; o marital status; o any dependents; o income; o expected family contribution (EFC); o degree program; o class level; o FTB status; o months enrolled; o tuition; o received federal aid; o received nonfederal aid; o student budget; o race; and o parent education.
14 Sample members also must have had valid data for at least one key variable from at least one other data source other than CPS.
APPENDIX B— NPSAS:12 TECHNICAL NOTES AND METHODOLOGY B-9
Perturbation To protect the confidentiality of information about specific individuals, NPSAS:12 data were
subject to perturbation procedures to minimize disclosure risk. Perturbation procedures, which have been approved by the NCES Disclosure Review Board, preserve central tendency estimates but may result in slight increases in nonsampling errors.
Imputation All variables with missing data used in this report, as well as those included in the related
PowerStats release, have been imputed. The imputation procedures involved a four-step process. In the first step, missing variables were logically imputed. In the second step, the criteria used to match variables into imputation classes to stratify the dataset were identified so that all imputations could be processed independently within each class. In the third step, an initial weighted sequential hot deck process was implemented (Cox 1980),15 whereby missing data were replaced with valid data from donor records that match the recipients with respect to the matching criteria. In the fourth step, a cyclic n-partition hot deck process (Marker, Judkins, and Winglee 2002) was implemented to iteratively cycle through n-partition hot decks.
Weighting All estimates in this report were weighted to represent the target population described in the
Sample Design section. The weights compensate for the unequal probability of selection of institutions and students in the NPSAS:12 sample. The weights also adjust for multiplicity at the institutional and student levels, unknown student eligibility, nonresponse, and poststratification. A summary of all the weight components, including the probabilities of selection and adjustments, is presented in table B-3. The student analysis weight, WTA000, is the product of the weight components in table B-3.
15 The term hot deck refers to the fact that the set of potential donors changes for each recipient. In contrast, cold deck imputation defines one static set of donors for all recipients. In all such imputation schemes, the selection of the donor from the entire deck is a random process.
B-10 APPENDIX B— NPSAS:12 TECHNICAL NOTES AND METHODOLOGY
Table B-3.Summary of components of the student analysis weight: 2012
Weight component Purpose
Institution sampling and subsampling weights To account for the institution’s probability of selection
Institution multiplicity adjustment To adjust the weights for institutions that had multiple chances of selection
Institution nonresponse adjustment To adjust the institution weights to compensate for nonresponding institutions
Institution poststratification adjustment To adjust the institution weights to match population enrollment totals to ensure population coverage
Student sampling weight To account for the student’s probability of selection
Student multiplicity adjustment To adjust the weights for students who attended more than one institution
Student unknown eligibility adjustment To adjust the weights of nonresponding students with unknown eligibility
Student nonresponse adjustment To adjust the weights to compensate for nonresponding students
Student poststratification adjustment To adjust the student weights to match known population enrollment and aid totals to ensure population coverage
SOURCE: U.S. Department of Education, National Center for Education Statistics, 2011–12 National Postsecondary Student Aid Study (NPSAS:12).
In contrast to NPSAS:08, student poststratification adjustment procedures were revised in NPSAS:12 to use current year (i.e., 2011–12 for NPSAS:12), rather than prior-year, 12-month enrollment totals. In August 2013, NCES revised the weights accompanying NPSAS:08 to use 2007–08, rather than 2006–07, 12-month enrollment totals. These revised weights provide better estimates in sectors where significant enrollment shifts occurred between 2006–07 and 2007–08. This improvement has the greatest effect on estimates for students enrolled in the private for-profit sector, where these enrollment shifts resulted in inflated estimates of the incidence of certain types of financial aid. Information about the changes to NPSAS:08 weighting can be found in appendix C of 2011–12 National Postsecondary Student Aid Study (NPSAS:12): Student Financial Aid Estimates for 2011–12.16
16 See Radwin, D., Wine, J., Siegel, P., and Bryan, M. (2013). 2011–12 National Postsecondary Student Aid Study (NPSAS:12): Student Financial Aid Estimates for 2011–12 (NCES 2013-165). Institute of Education Sciences, U.S. Department of Education. Washington, DC: National Center for Education Statistics. Retrieved from http://nces.ed.gov/pubsearch/pubsinfo.asp?pubid=2013165.
APPENDIX B— NPSAS:12 TECHNICAL NOTES AND METHODOLOGY B-11
Quality of Estimates
Bias Analysis: General Description
NCES Statistical Standard 4-4-1 states that “Any survey stage of data collection with a unit or item response rate less than 85 percent must be evaluated for the potential magnitude of nonresponse bias before the data or any analysis using the data may be released. Estimates of survey characteristics for nonrespondents and respondents are required to assess the potential nonresponse bias” (U.S. Department of Education 2003).
Bias Analysis: Institution Level
An institution respondent is defined as any sampled institution for which a student enrollment list was received that was sufficient for selecting a sample.
As shown in table B-1, about 1,480 of the 1,690 eligible sample institutions were respondents (88 percent unweighted and 87 percent weighted). The institution weighted response rate is below 85 percent for 5 of the 10 types of institutions:
• public less-than-2-year; • public 2-year; • private nonprofit less-than-4-year; • private for-profit less-than-2-year; and • private for-profit 2-year.
The weighted response rates, by type of institution, range from 78 percent for private nonprofit less-than-4-year institutions and private for-profit 2-year institutions to 92 percent for public 4-year non-doctorate-granting institutions.
A nonresponse bias analysis was conducted overall and for each institutional sector, regardless of response rate, because all sectors are included in the nonresponse weight adjustments. The nonresponse bias was estimated for variables known for most respondents and nonrespondents, and some variables were added that were not included in the nonresponse weight adjustment. There are extensive data available for all institutions from IPEDS, and the following variables were used for the nonresponse bias analysis:17
• 2005 Carnegie classification; • degree of urbanization; • Office of Business Economics (OBE) region; • Historically Black College or University (HBCU) indicator;
17 For the continuous variables, categories were formed based on quartiles.
B-12 APPENDIX B— NPSAS:12 TECHNICAL NOTES AND METHODOLOGY
• Hispanic Serving Institution (HSI) indicator; • percentage of students receiving federal grant aid; • percentage of students receiving state/local grant aid; • percentage of students receiving institutional grant aid; • percentage of students receiving student loan aid; • average net price among students receiving grant or scholarship aid; • percentage of students enrolled: Hispanic; • percentage of students enrolled: Asian or Pacific Islander; • percentage of students enrolled: Black, non-Hispanic; • total undergraduate enrollment; • male undergraduate enrollment; • female undergraduate enrollment; • total graduate enrollment; • male graduate enrollment; • female graduate enrollment; • percentage of full-time, first-time degree/certificate-seeking undergraduate students
who received any grant aid; • graduation rate of full-time, first-time degree/certificate-seeking undergraduates within
150 percent of normal time to completion; • public institution tuition and fees as percentage of core revenues; • private institution tuition and fees as percentage of core revenues; • public institution instructional expenses per Full-time equivalent (FTE) enrollment;
and • private institution instructional expenses per FTE enrollment.
First, for the institution-level variables listed above, the nonresponse bias was estimated by comparing base weighted respondents to both nonrespondents and the full sample and tested to determine if it significantly differed from zero at the 5 percent level. The two comparisons yield identical bias estimates but not always the same significance testing results. Second, nonresponse adjustments were computed to significantly reduce or eliminate nonresponse bias for key variables included in the models. Third, using base weights adjusted for nonresponse, bias was re-estimated and statistical tests were performed to check for any remaining significant nonresponse bias. Finally, to better understand the effect of poststratification on efforts to reduce nonresponse bias, two additional sets of estimates were created. The first, the difference in respondent means before and after poststratification, represents the effect of poststratification on nonresponse adjustments. The second, the difference in base weighted full sample means and the poststratified respondent means, represents the cumulative effect of all weighting and adjustment steps.
As shown in table B-4, the institution nonresponse weighting adjustment eliminated some, but not all, significant bias on the observable characteristics (estimates for sectors with fewer than 30 institutions excluded). Before weighting, the percentage of variable categories that were significantly
APPENDIX B— NPSAS:12 TECHNICAL NOTES AND METHODOLOGY B-13
biased ranged from 0 percent for four institutional sectors to 14.6 percent for public 4-year doctorate-granting institutions. After the nonresponse weight adjustment, the percentage of variable categories that remained significantly biased ranged from 0 percent overall and for three institutional sectors to 15.6 percent for private for-profit 4-year institutions. In four of the five sectors with remaining significant bias (ranging from -10.6 to 5.1), the bias remained in one or two categories of the variables’ percentage of students receiving state/local grant aid, percentage of students receiving institutional grant aid, or percentage of Hispanic students enrolled. In the private for-profit 4-year sector, the bias (ranging from -2.5 to 5.1) remained in one or two categories of the variables’ percentage of students receiving student loan aid, total and female undergraduate enrollment, graduation rate, and tuition and fees.
As shown in table B-5, the mean and median absolute differences between means for respondents before and after poststratification adjustment ranged from zero for private for-profit less-than-2-year institutions to 1.9 and 1.8, respectively, for private for-profit 2-year institutions (estimates for sectors with fewer than 30 institutions excluded). The mean and median absolute differences between means for the full sample and respondents after poststratification adjustment ranged from 0.5 and 0.4, respectively, for public 4-year non-doctorate-granting institutions to 6.5 to 4.7, respectively, for private for-profit less-than-2-year institutions.
B-14 APPENDIX B— NPSAS:12 TECHNICAL NOTES AND METHODOLOGY
Tabl
e B-4
.Su
mm
ary o
f ins
titut
ion-
level
nonr
espo
nse b
ias an
alysis
, by t
ype o
f ins
titut
ion:
2011
–12
Priv
ate
Pub
licno
npro
fitP
rivat
e4-
year
Pub
licP
rivat
e4-
year
nonp
rofit
Priv
ate
Pub
licno
n-4-
year
nonp
rofit
non-
4-ye
arfo
r-pro
fitP
rivat
eP
rivat
e
1N
onre
spon
se b
ias
stat
istic
sO
vera
llle
ss-th
an-
2-ye
arP
ublic
2-ye
ardo
ctor
ate-
gran
ting
doct
orat
e-gr
antin
gle
ss-th
an-
4-ye
ardo
ctor
ate-
gran
ting
doct
orat
e-gr
antin
gle
ss-th
an-
2-ye
arfo
r-pro
fit2-
year
for-p
rofit
4-ye
ar
Bef
ore
wei
ght a
djus
tmen
tsM
ean
perc
ent r
elat
ive
bias
a
cros
s ch
arac
teris
tics
6.06
‡6.
590.
953.
04‡
4.28
8.69
17.0
18.
0112
.63
Med
ian
perc
ent r
elat
ive
bias
a
cros
s ch
arac
teris
tics
5.00
‡4.
600.
611.
94‡
3.37
5.99
11.9
65.
802.
58P
erce
ntag
e of
cha
ract
eris
tics
w
ith s
igni
fican
t bia
s10
.74
‡10
.91
#14
.63
‡1.
96#
##
6.67
Afte
r wei
ght a
djus
tmen
tsM
ean
perc
ent r
elat
ive
bias
a
cros
s ch
arac
teris
tics
5.07
‡4.
671.
051.
74‡
4.42
10.4
415
.46
12.9
313
.13
Med
ian
perc
ent r
elat
ive
bias
a
cros
s ch
arac
teris
tics
3.47
‡2.
970.
581.
16‡
3.04
8.76
12.8
911
.19
3.19
Per
cent
age
of c
hara
cter
istic
s
with
sig
nific
ant b
ias
#‡
1.82
#2.
44‡
3.92
#7.
14#
15.5
6
# R
ound
s to
zer
o.‡
Rep
ortin
g st
anda
rds
not m
et. (
Too
few
cas
es fo
r a re
liabl
e es
timat
e.)
1 R
elat
ive
bias
and
sig
nific
ance
cal
cula
ted
on re
spon
dent
s vs
. ful
l sam
ple.
Rel
ativ
e bi
as is
def
ined
as
the
ratio
of e
stim
ated
bia
s to
the
wei
ghte
d m
ean
of th
e re
spon
dent
cas
es.
NO
TE: V
aria
ble
cate
gorie
s w
ith fe
wer
than
five
non
resp
onde
nts
wer
e su
ppre
ssed
for c
alcu
latio
ns in
this
tabl
e.S
OU
RC
E: U
.S. D
epar
tmen
t of E
duca
tion,
Nat
iona
l Cen
ter f
or E
duca
tion
Sta
tistic
s, 2
011–
12 N
atio
nal P
osts
econ
dary
Stu
dent
Aid
Stu
dy (N
PS
AS
:12)
.
APPENDIX B— NPSAS:12 TECHNICAL NOTES AND METHODOLOGY B-15
Tabl
e B-5
.Su
mm
ary o
f ins
titut
ion-
level
diffe
renc
es b
etwe
en m
eans
, by t
ype o
f ins
titut
ion:
2011
–12
Priv
ate
Pub
licno
npro
fitP
rivat
e4-
year
Pub
licP
rivat
e4-
year
nonp
rofit
Priv
ate
Pub
licno
n-4-
year
nonp
rofit
non-
4-ye
arfo
r-pro
fitP
rivat
eP
rivat
ele
ss-th
an-
Pub
licdo
ctor
ate-
doct
orat
e-le
ss-th
an-
doct
orat
e-do
ctor
ate-
less
-than
-fo
r-pro
fitfo
r-pro
fitS
umm
ary
stat
istic
sO
vera
ll2-
year
2-ye
argr
antin
ggr
antin
g4-
year
gran
ting
gran
ting
2-ye
ar2-
year
4-ye
ar
Diff
eren
ce b
etw
een
mea
ns fo
r
res
pond
ents
bef
ore
and
afte
r
pos
tstr
atifi
catio
n ad
just
men
t1
Mea
n ab
solu
te d
iffer
ence
acr
oss
c
hara
cter
istic
s0.
68‡
0.48
0.08
0.79
‡1.
020.
37#
1.91
0.03
Med
ian
abso
lute
diff
eren
ce a
cros
s
cha
ract
eris
tics
0.44
‡0.
380.
080.
43‡
0.68
0.30
#1.
800.
02
Diff
eren
ce b
etw
een
mea
ns fo
r
ful
l sam
ple
and
resp
onde
nts
a
fter p
osts
trat
ifica
tion
adju
stm
ent2
Mea
n ab
solu
te d
iffer
ence
acr
oss
c
hara
cter
istic
s1.
10‡
1.18
0.53
0.95
‡1.
162.
376.
462.
441.
42M
edia
n ab
solu
te d
iffer
ence
acr
oss
c
hara
cter
istic
s0.
74‡
0.93
0.40
0.67
‡0.
881.
714.
711.
801.
23
# R
ound
s to
zer
o.‡
Rep
ortin
g st
anda
rds
not m
et. (
Too
few
cas
es fo
r a re
liabl
e es
timat
e.)
1 R
espo
nden
ts b
efor
e po
stst
ratif
icat
ion
adju
stm
ent a
re w
eigh
ted
usin
g th
e ba
se w
eigh
t, ad
just
ed fo
r mul
tiplic
ity a
nd n
onre
spon
se. R
espo
nden
ts a
fter p
osts
tratif
icat
ion
adju
stm
ent a
re
wei
ghte
d us
ing
the
base
wei
ght,
adju
sted
for m
ultip
licity
, non
resp
onse
, and
pos
tstra
tific
atio
n.2 Fu
ll sa
mpl
e is
wei
ghte
d us
ing
the
base
wei
ght,
adju
sted
for m
ultip
licity
. Res
pond
ents
afte
r pos
tstra
tific
atio
n ad
just
men
t are
wei
ghte
d us
ing
the
base
wei
ght,
adju
sted
for m
ultip
licity
, no
nres
pons
e, a
nd p
osts
tratif
icat
ion.
NO
TE: V
aria
ble
cate
gorie
s w
ith fe
wer
than
five
non
resp
onde
nts
wer
e su
ppre
ssed
for c
alcu
latio
ns in
this
tabl
e.S
OU
RC
E: U
.S. D
epar
tmen
t of E
duca
tion,
Nat
iona
l Cen
ter f
or E
duca
tion
Sta
tistic
s, 2
011–
12 N
atio
nal P
osts
econ
dary
Stu
dent
Aid
Stu
dy (N
PS
AS
:12)
.
B-16 APPENDIX B— NPSAS:12 TECHNICAL NOTES AND METHODOLOGY
Bias Analyses: Study Member Level and Student Interview Level
A study member was defined as any student sample member who was determined to be eligible for the study and had valid data from any source for a selected set of key analytical variables. While these were the minimal data requirements, the vast majority of study members had considerably more complete data.
As shown in table B-2, of the 123,600 eligible students, the weighted and unweighted rates of study membership were 91 and 90 percent, respectively. The rate of study membership was below 85 percent for 1 of the 10 types of institutions: private for-profit less-than-2-year. The weighted study membership rates, by type of institution, ranged from 84 percent for students in private for-profit less-than-2-year institutions to 96 percent for students in private nonprofit 4-year non-doctorate-granting institutions.
Using the procedure described above, a nonresponse bias analysis was conducted overall and within each institutional sector. Again, each sector was included regardless of response rate because all sectors were included in the nonresponse weight adjustments. The nonresponse bias was estimated for variables known for most respondents and nonrespondents, and some variables were added that were not included in the nonresponse weight adjustment. Bias estimates and differences were suppressed for variable categories with fewer than 30 student-level nonrespondents. The following variables were used for the nonresponse bias analysis:18
• institution type; • region; • institution enrollment from IPEDS; • student type (sampled); • student type (after data collection); • FTB status (sampled); • age group; • CPS record indicator (yes/no); • Pell Grant receipt (yes/no); • Pell Grant amount; • Direct Loan receipt (yes/no); • Direct Loan amount; • Direct PLUS Loans to parents amount; • federal aid receipt (yes/no); • institution aid receipt (yes/no);
18 For the continuous variables, categories were formed based on quartiles.
APPENDIX B— NPSAS:12 TECHNICAL NOTES AND METHODOLOGY B-17
• state aid receipt (yes/no); • any aid receipt (yes/no); • major (2-digit CIP); • degree program; • class level of undergraduates; • percentage of full-time, first-time degree/certificate-seeking undergraduate students
who received any grant aid; • graduation rate of full-time, first-time degree/certificate-seeking undergraduates within
150 percent of normal time to completion; • public institution tuition and fees as percentage of core revenues; • private institution tuition and fees as percentage of core revenues; • public institution instructional expenses per FTE enrollment; and • private institution instructional expenses per FTE enrollment.
As shown in table B-6, the student nonresponse weighting adjustment eliminated some, but not all, study member significant bias on the observable characteristics. Before weighting, the percentage of variable categories that were significantly biased ranged from 0 percent for students in private nonprofit less-than-4-year institutions to 68.8 percent for students in private for-profit less-than-2-year institutions. The percentage of variable categories that remained significantly biased after the nonresponse weight adjustment ranged from 5.2 percent for students in private for-profit 2-year institutions to 28.1 percent for students in private for-profit less-than-2-year institutions. Overall, significant bias remained in one category of the variable tuition and fees; two categories of federal aid status, major, and degree program; and three categories of class level. Significant bias was -5.1 and 5.1 for the federal aid status categories and ranged from -0.6 to 0.5 for the other variables. For each sector, all variables had remaining significant bias for at least one category, except for CPS record available and instructional expense. Bias for federal aid status was significant for one or two categories in 9 of the 10 sectors and ranged from -8.6 to 8.7. Major had one to five categories with significant bias in five sectors, and degree program and class level had one or two categories with significant bias in six and five sectors, respectively. The remaining variables had one to four categories with significant bias in one or two sectors. Significant remaining bias for variables other than federal aid status ranged from -3.3 to 1.3, with the majority between -1.0 and 1.0.
B-18 APPENDIX B— NPSAS:12 TECHNICAL NOTES AND METHODOLOGY
Tabl
e B-6
.Su
mm
ary o
f stu
dent
-leve
l non
resp
onse
bias
analy
sis, b
y typ
e of i
nstit
utio
n: 20
11–1
2
Priv
ate
Pub
licno
npro
fitP
rivat
e4-
year
Pub
licP
rivat
e4-
year
nonp
rofit
Priv
ate
Pub
licno
n-4-
year
nonp
rofit
non-
4-ye
arfo
r-pro
fitP
rivat
eP
rivat
e
1N
onre
spon
se b
ias
stat
istic
sO
vera
llle
ss-th
an-
2-ye
arP
ublic
2-ye
ardo
ctor
ate-
gran
ting
doct
orat
e-gr
antin
gle
ss-th
an-
4-ye
ardo
ctor
ate-
gran
ting
doct
orat
e-gr
antin
gle
ss-th
an-
2-ye
arfo
r-pro
fit2-
year
for-p
rofit
4-ye
ar
Bef
ore
wei
ght a
djus
tmen
ts -
stud
y m
embe
r
Mea
n pe
rcen
t rel
ativ
e bi
as
acr
oss
char
acte
ristic
s5.
2946
.21
8.73
8.16
4.43
8.69
5.01
4.07
13.3
58.
306.
86M
edia
n pe
rcen
t rel
ativ
e bi
as
acr
oss
char
acte
ristic
s2.
919.
684.
021.
670.
913.
341.
451.
5910
.68
3.37
3.38
Per
cent
age
of c
hara
cter
istic
s
with
sig
nific
ant b
ias
64.1
040
.00
53.7
536
.21
32.8
4#
43.3
338
.18
68.7
534
.48
57.1
4
Bef
ore
wei
ght a
djus
tmen
ts -
inte
rvie
wM
ean
perc
ent r
elat
ive
bias
a
cros
s ch
arac
teris
tics
8.45
23.7
77.
888.
015.
0816
.95
7.44
4.85
7.68
8.37
9.97
Med
ian
perc
ent r
elat
ive
bias
a
cros
s ch
arac
teris
tics
6.54
12.4
44.
314.
072.
008.
093.
602.
866.
174.
584.
87P
erce
ntag
e of
cha
ract
eris
tics
w
ith s
igni
fican
t bia
s76
.42
30.5
650
.00
50.6
241
.76
14.5
550
.65
34.6
221
.05
33.3
347
.56
Afte
r non
resp
onse
wei
ght a
djus
tmen
tsM
ean
perc
ent r
elat
ive
bias
a
cros
s ch
arac
teris
tics
1.49
10.6
43.
104.
342.
726.
432.
771.
592.
861.
892.
19M
edia
n pe
rcen
t rel
ativ
e bi
as
acr
oss
char
acte
ristic
s0.
203.
671.
061.
060.
422.
680.
920.
821.
661.
350.
99P
erce
ntag
e of
cha
ract
eris
tics
w
ith s
igni
fican
t bia
s8.
5510
.00
13.7
513
.79
10.4
55.
5611
.67
9.09
28.1
35.
1712
.86
# R
ound
s to
zer
o.1 R
elat
ive
bias
and
sig
nific
ance
cal
cula
ted
on re
spon
dent
s vs
. ful
l sam
ple.
Rel
ativ
e bi
as is
def
ined
as
the
ratio
of e
stim
ated
bia
s to
the
wei
ghte
d m
ean
of th
e re
spon
dent
cas
es.
NO
TE: V
aria
ble
cate
gorie
s w
ith fe
wer
than
30
nonr
espo
nden
ts w
ere
supp
ress
ed fo
r cal
cula
tions
in th
is ta
ble.
SOU
RC
E: U
.S. D
epar
tmen
t of E
duca
tion,
Nat
iona
l Cen
ter f
or E
duca
tion
Stat
istic
s, 2
011–
12 N
atio
nal P
osts
econ
dary
Stu
dent
Aid
Stu
dy (N
PSAS
:12)
.
APPENDIX B— NPSAS:12 TECHNICAL NOTES AND METHODOLOGY B-19
As shown in table B-7, the mean and median absolute differences between means for respondents before and after poststratification adjustment ranged from 0.5 and 0.3, respectively, for students in public 4-year doctorate-granting institutions to 8.2 and 4.6, respectively, for students in private for-profit less-than-2-year institutions. The mean and median absolute differences between means for the full sample and respondents after poststratification adjustment ranged from 0.6 and 0.3, respectively, for students in public 4-year doctorate-granting institutions to 7.9 and 3.4, respectively, for students in private for-profit less-than-2-year institutions.
Finally, an additional nonresponse bias analysis was conducted in which interview respondents and interview nonrespondents were compared, following the same procedures outlined above. As shown in table B-6, the nonresponse weighting adjustment eliminated some, but not all, student interview significant bias. Before weighting, the percentage of variable categories that were significantly biased on the basis of t-tests ranged from 14.5 percent for students in private nonprofit less-than-4-year institutions to 76.4 percent overall. Because study members, not interview respondents, are the unit of analysis in NPSAS:12, only a study member weight was created. As a result, nonresponse bias analyses after weight adjustments could not be computed. More information about remaining nonresponse bias after the nonresponse weight adjustment and the poststratification adjustment is available in tables B-6 and B-7, respectively.
B-20 APPENDIX B— NPSAS:12 TECHNICAL NOTES AND METHODOLOGY
Tabl
e B-7
.Su
mm
ary o
f stu
dent
-leve
l diff
eren
ces b
etwe
en m
eans
, by t
ype o
f ins
titut
ion:
2011
–12
Priv
ate
Pub
licno
npro
fitP
rivat
e4-
year
Pub
licP
rivat
e4-
year
nonp
rofit
Priv
ate
Pub
licno
n-4-
year
nonp
rofit
non-
4-ye
arfo
r-pro
fitP
rivat
eP
rivat
ele
ss-th
an-
Pub
licdo
ctor
ate-
doct
orat
e-le
ss-th
an-
doct
orat
e-do
ctor
ate-
less
-than
-fo
r-pro
fitfo
r-pro
fitS
umm
ary
stat
istic
sO
vera
ll2-
year
2-ye
argr
antin
ggr
antin
g4-
year
gran
ting
gran
ting
2-ye
ar2-
year
4-ye
ar
Diff
eren
ce b
etw
een
mea
ns fo
r
res
pond
ents
bef
ore
and
afte
r
pos
tstr
atifi
catio
n ad
just
men
t1
Mea
n ab
solu
te d
iffer
ence
acr
oss
c
hara
cter
istic
s1.
096.
641.
441.
310.
543.
951.
450.
818.
233.
071.
15M
edia
n ab
solu
te d
iffer
ence
acr
oss
c
hara
cter
istic
s0.
542.
540.
410.
800.
351.
690.
730.
634.
601.
310.
68
Diff
eren
ce b
etw
een
mea
ns fo
r
ful
l sam
ple
and
resp
onde
nts
a
fter p
osts
trat
ifica
tion
adju
stm
ent2
Mea
n ab
solu
te d
iffer
ence
acr
oss
c
hara
cter
istic
s1.
156.
501.
511.
390.
624.
661.
440.
867.
943.
081.
18M
edia
n ab
solu
te d
iffer
ence
acr
oss
c
hara
cter
istic
s0.
543.
340.
420.
690.
292.
640.
690.
703.
451.
270.
701 R
espo
nden
ts b
efor
e po
stst
ratif
icat
ion
adju
stm
ent a
re w
eigh
ted
usin
g th
e ba
se w
eigh
t, ad
just
ed fo
r mul
tiplic
ity, u
nkno
wn
elig
ibili
ty, a
nd n
onre
spon
se. R
espo
nden
ts a
fter p
osts
tratif
icat
ion
adju
stm
ent a
re w
eigh
ted
usin
g th
e ba
se w
eigh
t, ad
just
ed fo
r mul
tiplic
ity, u
nkno
wn
elig
ibili
ty, n
onre
spon
se, a
nd p
osts
tratif
icat
ion.
2 Fu
ll sa
mpl
e is
wei
ghte
d us
ing
the
base
wei
ght,
adju
sted
for m
ultip
licity
and
unk
now
n el
igib
ility
. Res
pond
ents
afte
r pos
tstra
tific
atio
n ad
just
men
t are
wei
ghte
d us
ing
the
base
wei
ght,
adju
sted
for m
ultip
licity
, unk
now
n el
igib
ility
, non
resp
onse
, and
pos
tstra
tific
atio
n.N
OTE
: Var
iabl
e ca
tego
ries
with
few
er th
an 3
0 no
nres
pond
ents
wer
e su
ppre
ssed
for c
alcu
latio
ns in
this
tabl
e.S
OU
RC
E: U
.S. D
epar
tmen
t of E
duca
tion,
Nat
iona
l Cen
ter f
or E
duca
tion
Sta
tistic
s, 2
011–
12 N
atio
nal P
osts
econ
dary
Stu
dent
Aid
Stu
dy (N
PS
AS
:12)
.
APPENDIX B— NPSAS:12 TECHNICAL NOTES AND METHODOLOGY B-21
Bias Analysis: Item-Level
NCES Statistical Standard 4-4-3A states: “For an item with a low total response rate, respondents and nonrespondents can be compared on sampling frame and/or questionnaire variables for which data on respondents and nonrespondents are available. Base weights must be used in such analysis. Comparison items should have very high response rates. This approach may be limited to the extent that items available for respondents and nonrespondents may not be related to the low response rate item being analyzed” (U.S. Department of Education 2003).
Moreover, NCES Statistical Standard 1-3-5 states: “Item response rates (RRI) are calculated as the ratio of the number of respondents for whom an in-scope response was obtained (Ix for item x) to the number of respondents who are asked to answer that item. The number asked to answer an item is the number of unit level respondents (I) minus the number of respondents with a valid skip item for item x (Vx). When an abbreviated questionnaire is used to convert refusals, the eliminated questions are treated as item nonresponse. . . . In the case of constructed variables, the numerator includes cases that have available data for the full set of items required to construct the variable, and the denominator includes all respondents eligible to respond to all items in the constructed variable” (U.S. Department of Education 2003). The item response rate is calculated as:
RRIx = Ix / (I – Vx)
A student was defined to be an item respondent for an analytic variable if that student had data for that variable from any source, including logical imputation. Item nonrespondents for analytic variables were study members who did not have data for that variable from any source. As shown in table B-8, the weighted item response rates for items used in this First Look Report for all students ranged from 29 percent to 100 percent. The weighted item response rates by type of institution ranged from 16 percent to 100 percent.
B-22 APPENDIX B— NPSAS:12 TECHNICAL NOTES AND METHODOLOGY
Tabl
e B-8
.W
eight
ed it
em re
spon
se ra
tes f
or al
l stu
dent
s and
by t
ype o
f ins
titut
ion:
2011
–12
P
rivat
eP
rivat
eno
t-for
-no
t-for
-P
rivat
eP
rivat
eP
ublic
Pub
licpr
ofit
prof
itno
t-for
-fo
r-pro
fitle
ss-
4-ye
arP
ublic
less
-4-
year
prof
itle
ss-
Priv
ate
Priv
ate
All
than
-P
ublic
non-
4-ye
arth
an-
non-
4-ye
arth
an-
for-p
rofit
for-p
rofit
Var
iabl
eV
aria
ble
labe
lst
uden
ts2-
year
2-ye
ardo
ctor
ate
doct
orat
e4-
year
doct
orat
edo
ctor
ate
2-ye
ar2-
year
4-ye
ar
ATT
NS
TAT
Atte
ndan
ce p
atte
rn97
.799
.296
.798
.398
.598
.398
.498
.798
.497
.097
.7
BU
DG
ETA
JP
rice
of a
ttend
ance
(stu
dent
bud
get
[atte
ndan
ce a
djus
ted]
)40
.455
.934
.644
.848
.371
.149
.439
.943
.531
.433
.2
NE
TCS
T1N
et o
ut-o
f-poc
ket p
rice
of a
ttend
ance
(s
tude
nt b
udge
t min
us a
ll ai
d)28
.935
.723
.533
.037
.041
.839
.232
.021
.916
.019
.8
NE
TCS
T3N
et p
rice
of a
ttend
ance
(stu
dent
bud
get
min
us a
ll gr
ants
)29
.835
.823
.934
.138
.243
.240
.433
.323
.317
.321
.0
PC
TDE
PIn
com
e pe
rcen
tiles
for d
epen
dent
st
uden
ts68
.467
.660
.868
.570
.375
.678
.472
.481
.981
.389
.6
PC
TIN
DE
PIn
com
e pe
rcen
tiles
for i
ndep
ende
nt
stud
ents
60.3
69.4
56.8
56.3
52.9
65.2
61.8
50.3
84.0
83.3
79.8
SE
CTO
R1
Type
of i
nstit
utio
n10
0.0
100.
010
0.0
100.
010
0.0
100.
010
0.0
100.
010
0.0
100.
010
0.0
STU
DM
ULT
Num
ber o
f ins
titut
ions
atte
nded
100.
010
0.0
100.
010
0.0
100.
010
0.0
100.
010
0.0
100.
010
0.0
100.
0
NO
TE: W
eigh
ted
item
resp
onse
rate
s ar
e ca
lcul
ated
per
NC
ES
Sta
tistic
al S
tand
ard
1-3-
5 as
the
ratio
of t
he n
umbe
r of r
espo
nden
ts fo
r who
m a
n in
-sco
pe re
spon
se w
as o
btai
ned
to th
e nu
mbe
r of r
espo
nden
ts w
ho a
re a
sked
to a
nsw
er th
an it
em.
SO
UR
CE
: U.S
. Dep
artm
ent o
f Edu
catio
n, N
atio
nal C
ente
r for
Edu
catio
n S
tatis
tics,
201
1–12
Nat
iona
l Pos
tsec
onda
ry S
tude
nt A
id S
tudy
(NP
SA
S:1
2).
APPENDIX B— NPSAS:12 TECHNICAL NOTES AND METHODOLOGY B-23
Per NCES Standard 1-3-5, response rates for composite variables must account for missing inputs prior to imputation. Therefore, while most of the components of key constructed variables had response rates greater than 95 percent, many are reported as having low response rates.
Five of the items had a weighted response rate below 85 percent. As shown in table B-8, the response rates for these items (BUDGETAJ, NETCST1, NETCST3, PCTDEP, and PCTINDEP) were below 85 percent for all students and for all of the applicable institution types. (See appendix A for descriptions of these items.) A nonresponse bias analysis was conducted for these five items. The nonresponse bias was estimated for variables known for study members and nonstudy members. The procedures used for the item-level nonresponse bias analysis are the same as those used for the student-level nonresponse bias analysis presented above, and a subset of the variables used for the student-level analysis were used for the item-level analysis.19 Bias estimates were suppressed for variable categories with fewer than 30 item-level nonrespondents.
The percentage of variable categories for which the five items have statistically significant bias prior to imputation ranged from 70 to 75 percent for all students and from 16 to 83 percent by institution sector. The median percent relative absolute bias ranged from 8 to 22 percent for all students and from 2 to 29 percent by institution sector. The survey statisticians measured the differences between means before and after imputation and tested for statistical differences. Statistical tests of these differences were significant for four of the five items for all students and for all five items for at least four institution sectors, indicating that some nonresponse bias may have been reduced through imputation. For more information about the item-level nonresponse bias analysis, see 2011–12 National Postsecondary Student Aid Study (NPSAS:12): Data File Documentation.20
Response rates for BUDGETAJ, NETCST1, and NETCST2, which are below 41 percent, warrant additional discussion regarding the validity of the estimates to the population. These variables are based on data reported by institutions. Not all institutions are able to provide all the necessary data components needed to create the full budget (and therefore a calculated net price), so IPEDS is used (adjusted for attendance status) to impute the data within institution/student classes.
Standard Errors
To facilitate computation of standard errors for both linear and nonlinear statistics, a vector of bootstrap sample weights was added to the analysis file. These weights are zero for units not selected
19 Variables that were added to the student-level nonresponse bias analysis and not included in the nonresponse weight adjustment were not included in the item-level nonresponse bias analysis. 20 See Wine, J., Bryan, M., and Siegel, P. (2013). 2011–12 National Postsecondary Student Aid Study (NPSAS:12): Data File Documentation (NCES 2014-182). Institute of Education Sciences, U.S. Department of Education. Washington, DC: National Center for Education Statistics. Retrieved from http://nces.ed.gov/pubsearch/pubsinfo.asp?pubid=2014182.
B-24 APPENDIX B— NPSAS:12 TECHNICAL NOTES AND METHODOLOGY
in a particular bootstrap sample; weights for other units are inflated for the bootstrap subsampling. The initial analytic weights for the complete sample were also included to compute the desired estimates. The vector of replicate weights allows for computing additional estimates for the sole purpose of estimating a variance. Assuming B sets of replicate weights, the variance of any estimate can be estimated by replicating the estimation procedure for each replicate and computing a simple variance of the replicate estimates; that is,
BVar
B
bb
2
1)ˆˆ(
)ˆ(θθ
θ−
=∑=
•
where •bθ̂ is the estimate based on the bth replicate weight (where b = 1 to the number of replicates)
and B is the total number of sets of replicate weights (B = 200 for NPSAS:12). Once the replicate weights are provided, this estimate can be produced by most survey software packages (e.g., SUDAAN [RTI International 2012]).
The replicate weights were produced using a methodology combining approaches developed by Flyer (1987) and Kott (1988). The NPSAS application of the method incorporated the finite population correction factor at the first stage only, following the methodology proposed by Chromy (1979).
Cautions for Analysts This section outlines key issues for analysts to consider when using NPSAS data, particularly
when comparing different NPSAS administrations over time.
Comparison With Prior NPSAS Administrations
There have been eight NPSAS administrations covering the academic years ending in 1987, 1990, 1993, 1996, 2000, 2004, 2008, and 2012 (NPSAS:87, NPSAS:90, NPSAS:93, NPSAS:96, NPSAS:2000, NPSAS:04, NPSAS:08, and NPSAS:12). For the most part, the results are comparable, but there are several important differences across studies that limit comparisons over time.
Puerto Rico. All administrations except NPSAS:87 and NPSAS:12 sampled institutions in Puerto Rico. There are approximately 80 institutions in Puerto Rico enrolling about 1 percent each of undergraduate and graduate students nationally. In NPSAS:08, students attending institutions in Puerto Rico made up about 10 percent of Hispanic students nationally. Analysts wishing to compare other NPSAS administrations with NPSAS:87 and NPSAS:12 or who are interested in national estimates for Hispanic students may filter on COMPTO87 to exclude Puerto Rico.
APPENDIX B— NPSAS:12 TECHNICAL NOTES AND METHODOLOGY B-25
Graduate programs. NPSAS:12 reflects changes to the classification of graduate degree programs. In NPSAS:08 and earlier surveys, graduate programs were classified as “master’s degree,” “doctor’s degree,” and “first-professional degree.” Some graduate students were also enrolled in a post-baccalaureate or post-master’s certificate program or were not enrolled in any degree program. In NPSAS:12, the “doctor’s degree” category was replaced with “doctor’s degree – research/scholarship,” “doctor’s degree – professional practice,” and “doctor’s degree – other,” and the “first-professional degree” category was eliminated. Most of the graduate degrees formerly classified as “first-professional degree” were reclassified as “doctor’s degree – professional practice,” but graduate degrees in Theology such as M.Div. and M.H.L./Rav were reclassified as “master’s degrees.”
Title IV eligibility. Starting with NPSAS:2000, samples were limited to institutions participating in federal Title IV student aid programs. In the earlier surveys (NPSAS:87, NPSAS:90, NPSAS:93, and NPSAS:96), about 1 percent of undergraduate students, mainly concentrated in private for-profit less-than-2-year institutions, attended institutions that were not eligible for Title IV aid. Analysts wishing to exclude students from institutions that were not eligible for Title IV may filter on T4ELIG in these earlier administrations.
Community colleges. Over the past two decades, community colleges in many states began conferring a limited number of bachelor’s degrees in selected fields. These institutions were reclassified from public 2-year institutions to public 4-year institutions in the IPEDS data used to determine institution types in NPSAS, even if most of the institutions’ programs were below the bachelor’s degree level. Analysts seeking an alternative classification of institutions that takes into consideration the proportion of bachelor’s degrees awarded and is consistent across NPSAS:04, NPSAS:08, and NPSAS:12 should consider using the 2000 Carnegie Classification (CC2000).
Estimates from imputed versus unimputed data. Starting with NPSAS:04, missing values were imputed for all, rather than a selected subset, of variables. Analysts should use caution when comparing estimates based on imputed data with estimates based on unimputed data. Distributions of imputed and unimputed variables are not directly comparable because imputed variables have no missing values, and imputation may appreciably change the distribution of valid values for variables with a substantial proportion of missing data.
For-profit institutions. In NPSAS:12, the sampling design included nationally representative samples from 4-year, 2-year, and less-than-2-year for-profit institutions. Prior to NPSAS:12, the sampling design did not disaggregate for-profit 2-year institutions from for-profit 4-year institutions. Analysts should use caution when comparing estimates that disaggregate for-profit 2-year and 4-year institutions, especially for earlier NPSAS studies with smaller sample sizes in the for-profit sector. Because there are a number of large, multisystem for-profit institutions, one system can have a great
B-26 APPENDIX B— NPSAS:12 TECHNICAL NOTES AND METHODOLOGY
impact on the estimates when sample sizes are small. As a result, this report aggregated for-profit 4-year and 2-year institutions so comparisons can be made to NPSAS:08.
Fall enrollment. Starting with NPSAS:90, all NPSAS samples have been based on 12-month enrollment, which is higher than fall enrollment commonly reported by IPEDS because those who enroll only in spring, summer, or winter terms are included in the 12-month total. This is particularly true at less-than-4-year and private for-profit institutions, where a substantial proportion of students may enroll throughout the year, and not necessarily during the fall. The NPSAS:87 sample was based on fall 1986 enrollment. Analysts wishing to compare NPSAS:87 results with those from subsequent administrations can filter on COMPTO87 in the later NPSAS administrations.
Students Attending Multiple Institutions
About 4 percent of undergraduate students and 4 percent of graduate students attended more than one institution during the 2011–12 academic year, concurrently or sequentially. These students may have attended institutions of differing types (public 4-year non-doctorate-granting, public 4-year doctorate-granting, and so forth) and may have had varying attendance patterns (full-time/full-year or other) at different institutions. These students are excluded from the results in this report.
Sampling Error
Because NPSAS:12 consists of a representative sample of postsecondary students rather than the entire population, the estimates in this report are subject to sampling error. A different sample of the same population, even one using identical methods, would yield different results. Similarly, estimates of aid will vary from population values reported by agency offices.
The sampling error of an estimate is measured by its standard error. The standard errors for the estimates in this report were calculated with bootstrap replication procedures using PowerStats software and are available at http://nces.ed.gov/pubsearch/pubsinfo.asp?pubid=2014663. Standard errors for table 2 in the report are presented in table B-9.
Nonsampling Error
The estimates presented in this report are also subject to various types of nonsampling error. Potential sources of nonsampling error include misreporting by survey respondents, incomplete administrative records, coding and data entry errors, misspecification of derived variables, nonresponse, and other factors. Data swapping and other forms of perturbation used to limit disclosure of information about individual study members may also lead to nonsampling errors.
APPENDIX B— NPSAS:12 TECHNICAL NOTES AND METHODOLOGY B-27
Tabl
e B-9
.
Stan
dard
erro
rs fo
r tab
le 1:
Ave
rage
pric
e of a
ttend
ance
in co
nsta
nt 20
11–1
2 dol
lars f
or u
nder
grad
uate
stud
ents
, by t
ype o
f ins
titut
ion
and
selec
ted
stud
ent c
hara
cter
istics
: 200
7–08
an
d 20
11–1
2
2011
–12
2007
–08
(Con
stan
t 201
1–12
dol
lars
)
Priv
ate
for-p
rofit
Priv
ate
Priv
ate
Tota
l P
rivat
e fo
r-pro
fit
Pub
lic
Pub
lic
nonp
rofit
(2
-yea
r P
ublic
P
ublic
no
npro
fit
2-ye
ar o
r S
tude
nt c
hara
cter
istic
s2-
year
4-ye
ar4-
year
2-ye
ar4-
year
or m
ore)
2-ye
ar4-
year
4-ye
arm
ore
T
otal
$80
$160
$390
$490
$460
$370
$50
$70
$250
$580
All u
nder
grad
uate
s
Atte
ndan
ce p
atte
rnFu
ll-tim
e/fu
ll-ye
ar
1
20
170
3
50
770
3
90
3
40
120
8
0
270
350
Par
t-tim
e or
par
t-yea
r
80
1
40
580
4
40
450
370
4
0
70
56
0
6
40
Dep
ende
ncy
and
inco
me
Dep
ende
nt s
tude
nts
Lo
wes
t 25
perc
ent
150
2
60
880
7
90
740
560
11
0
150
46
0
1,1
80
Low
er m
iddl
e 25
per
cent
140
2
30
680
9
30
820
610
10
0
150
45
0
1,3
90
Upp
er m
iddl
e 25
per
cent
200
2
40
720
1,5
30
7
80
8
60
140
13
0
470
1
,320
H
ighe
st 2
5 pe
rcen
t
2
70
270
6
50
2
,900
1
,570
1,8
00
190
14
0
430
2
,080
Inde
pend
ent s
tude
nts
Lo
wes
t 25
perc
ent
150
2
60
1
,400
670
5
00
4
10
100
16
0
610
930
Lo
wer
mid
dle
25 p
erce
nt
1
40
220
1,2
20
6
70
430
340
10
0
200
49
0
7
90
Upp
er m
iddl
e 25
per
cent
140
2
70
910
6
90
680
580
8
0
210
64
0
6
50
Hig
hest
25
perc
ent
180
2
80
690
9
70
950
840
9
0
260
51
0
8
00
Full-
time/
full-
year
und
ergr
adua
tes
Dep
ende
ncy
and
inco
me
Dep
ende
nt s
tude
nts
Lo
wes
t 25
perc
ent
170
2
30
690
1,1
10
5
10
5
30
130
13
0
310
1
,040
Lo
wer
mid
dle
25 p
erce
nt
1
70
210
4
60
1
,310
650
600
15
0
140
42
0
1,3
50
Upp
er m
iddl
e 25
per
cent
200
2
30
520
1,7
80
1,2
80
1
,070
17
0
120
40
0
1,2
50
Hig
hest
25
perc
ent
280
2
40
650
2,9
20
8
30
1,6
00
220
13
0
320
1
,350
Inde
pend
ent s
tude
nts
Lo
wes
t 25
perc
ent
190
2
50
1
,450
660
4
60
3
60
220
17
0
720
430
Lo
wer
mid
dle
25 p
erce
nt
2
60
290
1,0
90
8
00
320
300
23
0
290
53
0
6
00
Upp
er m
iddl
e 25
per
cent
240
3
80
1
,590
1
,010
390
360
32
0
310
63
0
3
10
Hig
hest
25
perc
ent
330
5
20
1
,250
1
,830
920
830
42
0
410
82
0
3
50
SO
UR
CE
: U.S
. Dep
artm
ent o
f Edu
catio
n, N
atio
nal C
ente
r for
Edu
catio
n S
tatis
tics,
200
7–08
and
201
1–12
Nat
iona
l Pos
tsec
onda
ry S
tude
nt A
id S
tudy
(NP
SA
S:0
8 an
d N
PS
AS:
12).
B-28 APPENDIX B— NPSAS:12 TECHNICAL NOTES AND METHODOLOGY
Tabl
e B-1
0.
Stan
dard
erro
rs fo
r tab
le 2:
Ave
rage
net
pric
e (pr
ice o
f atte
ndan
ce m
inus
all g
rant
s) in
cons
tant
2011
–12 d
ollar
s am
ong
unde
rgra
duat
es, b
y typ
e of i
nstit
utio
n an
d se
lecte
d st
uden
t ch
arac
teris
tics:
2007
–08 a
nd 20
11–1
2
2011
–12
2007
–08
(Con
stan
t 201
1–12
dol
lars
)
Priv
ate
for-p
rofit
Priv
ate
Priv
ate
Tota
l P
rivat
e fo
r-pro
fit
Pub
lic
Pub
lic
nonp
rofit
(2
-yea
r P
ublic
P
ublic
no
npro
fit
2-ye
ar o
r S
tude
nt c
hara
cter
istic
s2-
year
4-ye
ar4-
year
2-ye
ar4-
year
or m
ore)
2-ye
ar4-
year
4-ye
arm
ore
T
otal
$80
$140
$320
$490
$470
$370
$50
$60
$210
$560
All u
nder
grad
uate
s
Atte
ndan
ce p
atte
rnFu
ll-tim
e/fu
ll-ye
ar
140
1
70
350
7
90
390
3
50
120
9
0
280
38
0P
art-t
ime
or p
art-y
ear
70
120
4
30
420
4
50
360
4
0
70
42
0
630
Dep
ende
ncy
and
inco
me
Dep
ende
nt s
tude
nts
Lo
wes
t 25
perc
ent
1
40
170
6
80
740
5
40
480
9
0
130
46
0
1,
100
Lo
wer
mid
dle
25 p
erce
nt
120
1
90
500
9
00
670
5
60
100
13
0
450
1,37
0
Upp
er m
iddl
e 25
per
cent
1
80
220
5
90
1
,550
780
8
70
130
13
0
460
1,30
0
Hig
hest
25
perc
ent
2
60
250
6
60
2
,890
1
,620
1
,760
19
0
150
43
0
2,
080
Inde
pend
ent s
tude
nts
Lo
wes
t 25
perc
ent
1
20
210
1,0
30
6
30
470
3
90
90
13
0
560
90
0
Low
er m
iddl
e 25
per
cent
1
20
190
9
20
650
4
10
330
9
0
180
42
0
810
U
pper
mid
dle
25 p
erce
nt
130
2
60
720
7
50
690
5
90
80
18
0
570
64
0
Hig
hest
25
perc
ent
1
70
270
6
00
1
,010
900
8
00
90
24
0
480
81
0
Full-
time/
full-
year
und
ergr
adua
tes
Dep
ende
ncy
and
inco
me
Dep
ende
nt s
tude
nts
Lo
wes
t 25
perc
ent
2
40
210
8
10
1
,140
480
5
80
140
16
0
480
1,10
0
Low
er m
iddl
e 25
per
cent
2
00
210
4
80
1
,400
630
6
40
180
15
0
550
1,40
0
Upp
er m
iddl
e 25
per
cent
2
00
230
5
60
1
,780
1
,300
1
,080
20
0
130
48
0
1,
240
H
ighe
st 2
5 pe
rcen
t
280
2
40
680
3,0
20
1,2
10
1,6
30
220
15
0
430
1,39
0In
depe
nden
t stu
dent
s
Low
est 2
5 pe
rcen
t
240
3
20
1
,540
760
4
50
370
24
0
180
74
0
570
Lo
wer
mid
dle
25 p
erce
nt
290
3
20
1
,280
860
3
40
330
26
0
320
71
0
690
U
pper
mid
dle
25 p
erce
nt
260
4
40
1
,550
1
,130
440
4
10
330
35
0
680
40
0
Hig
hest
25
perc
ent
3
40
600
1,3
90
1,8
60
9
70
880
46
0
390
86
0
470
SO
UR
CE
: U.S
. Dep
artm
ent o
f Edu
catio
n, N
atio
nal C
ente
r for
Edu
catio
n S
tatis
tics,
200
7–08
and
201
1–12
Nat
iona
l Pos
tsec
onda
ry S
tude
nt A
id S
tudy
(NP
SA
S:0
8 an
d N
PS
AS:
12).
APPENDIX B— NPSAS:12 TECHNICAL NOTES AND METHODOLOGY B-29
Tabl
e B-1
1.
Stan
dard
erro
rs fo
r tab
le 3:
Ave
rage
out
-of-p
ocke
t net
pric
e (pr
ice o
f atte
ndan
ce m
inus
tota
l aid
) in
cons
tant
2011
–12 d
ollar
s of p
osts
econ
dary
educ
atio
n am
ong
unde
rgra
duat
es, b
y ty
pe o
f ins
titut
ion
and
selec
ted
stud
ent c
hara
cter
istics
: 200
7–08
and
2011
–12
2011
–12
2007
–08
(Con
stan
t 201
1–12
dol
lars
)
Priv
ate
for-p
rofit
Priv
ate
Priv
ate
Tota
l P
rivat
e fo
r-pro
fit
Pub
lic
Pub
lic
nonp
rofit
(2
-yea
r P
ublic
P
ublic
no
npro
fit
2-ye
ar o
r S
tude
nt c
hara
cter
istic
s2-
year
4-ye
ar4-
year
2-ye
ar4-
year
or m
ore)
2-ye
ar4-
year
4-ye
arm
ore
T
otal
$70
$110
$310
$440
$380
$290
$50
$60
$200
$560
All u
nder
grad
uate
s
Atte
ndan
ce p
atte
rnFu
ll-tim
e/fu
ll-ye
ar
170
1
60
400
5
90
400
3
30
130
8
0
280
49
0P
art-t
ime
or p
art-y
ear
60
90
3
40
420
3
60
280
4
0
80
34
0
610
Dep
ende
ncy
and
inco
me
Dep
ende
nt s
tude
nts
Lo
wes
t 25
perc
ent
1
30
160
6
80
760
2
90
420
9
0
120
47
0
810
Lo
wer
mid
dle
25 p
erce
nt
120
1
70
480
7
50
420
4
40
100
13
0
390
1,16
0
Upp
er m
iddl
e 25
per
cent
1
60
220
6
30
1
,140
790
6
80
120
13
0
570
1,69
0
Hig
hest
25
perc
ent
2
40
230
7
30
2
,150
1
,130
1
,240
17
0
160
51
0
1,
420
Inde
pend
ent s
tude
nts
Lo
wes
t 25
perc
ent
1
20
210
1,0
50
6
00
410
3
50
80
13
0
520
78
0
Low
er m
iddl
e 25
per
cent
1
20
190
7
60
630
4
00
280
8
0
140
35
0
800
U
pper
mid
dle
25 p
erce
nt
100
2
40
620
6
90
510
4
40
80
15
0
500
61
0
Hig
hest
25
perc
ent
1
30
210
5
80
910
6
30
560
8
0
210
43
0
890
Full-
time/
full-
year
und
ergr
adua
tes
Dep
ende
ncy
and
inco
me
Dep
ende
nt s
tude
nts
Lo
wes
t 25
perc
ent
2
50
220
8
40
1
,230
490
6
90
180
15
0
520
1,10
0
Low
er m
iddl
e 25
per
cent
2
30
230
5
50
1
,360
710
6
90
200
18
0
470
1,67
0
Upp
er m
iddl
e 25
per
cent
2
20
260
7
10
1
,750
1
,430
1
,200
21
0
140
66
0
1,
690
H
ighe
st 2
5 pe
rcen
t
290
2
70
790
2,4
20
1,8
30
1,5
40
230
17
0
560
2,41
0In
depe
nden
t stu
dent
s
Low
est 2
5 pe
rcen
t
290
4
30
1
,650
900
4
70
440
28
0
220
79
0
880
Lo
wer
mid
dle
25 p
erce
nt
320
3
70
1
,400
930
4
80
430
31
0
370
74
0
800
U
pper
mid
dle
25 p
erce
nt
320
5
60
1
,470
970
4
30
370
42
0
450
92
0
640
H
ighe
st 2
5 pe
rcen
t
340
8
10
1
,150
1
,760
750
7
10
580
59
0
780
76
0
SO
UR
CE
: U.S
. Dep
artm
ent o
f Edu
catio
n, N
atio
nal C
ente
r for
Edu
catio
n S
tatis
tics,
200
7–08
and
201
1–12
Nat
iona
l Pos
tsec
onda
ry S
tude
nt A
id S
tudy
(NP
SA
S:0
8 an
d N
PS
AS:
12).
B-30 APPENDIX B— NPSAS:12 TECHNICAL NOTES AND METHODOLOGY
PowerStats The estimates presented in this report were produced using PowerStats, a web-based software
application that enables users to generate tables for most of the postsecondary surveys conducted by NCES. PowerStats produces the design-adjusted standard errors21 necessary for testing the statistical significance of differences in the estimates. PowerStats also contains a detailed description of how each variable was created and includes question wording for items coming directly from an interview.
With PowerStats, users can replicate or expand upon the tables presented in this report. The output from PowerStats includes the table estimates (e.g., percentages or means), the proper standard errors, and weighted sample sizes for the estimates. If the number of valid cases is too small to produce a reliable estimate (fewer than 30 cases), PowerStats prints the double dagger symbol (‡) instead of the estimate.
In addition to generating tables, PowerStats users may conduct linear or logistic regressions. Many options are available for output with the regression results. For a description of all the options available, users should access the PowerStats website at http://nces.ed.gov/datalab/index.aspx. For more information, contact [email protected].
21 NPSAS samples are not simple random samples; therefore, simple random sample techniques for estimating sampling errors cannot be applied to these data. PowerStats takes into account the complexity of the sampling procedures and calculates standard errors appropriate for such samples. The method for computing sampling errors used by PowerStats involves approximating the estimator by replication of the sampled population. The procedure used is a bootstrap technique.