64
2012-13 update on indicators of financial sustainability in the NHS REPORT BY THE COMPTROLLER AND AUDITOR GENERAL HC 590 SESSION 2013-14 18 JULY 2013 Department of Health

2012-13 update on indicators of financial sustainability in the NHS
REPORT BY THE COMPTROLLER AND AUDITOR GENERAL
HC 590 SESSION 2013-14
18 JULY 2013
Department of Health
The National Audit Office scrutinises public spending for Parliament and is independent of government. The Comptroller and Auditor General (C&AG), Amyas Morse, is an Officer of the House of Commons and leads the NAO, which employs some 860 staff. The C&AG certifies the accounts of all government departments and many other public sector bodies. He has statutory authority to examine and report to Parliament on whether departments and the bodies they fund have used their resources efficiently, effectively, and with economy. Our studies evaluate the value for money of public spending, nationally and locally. Our recommendations and reports on good practice help government improve public services, and our work led to audited savings of almost £1.2 billion in 2012.
Our vision is to help the nation spend wisely.
Our public audit perspective helps Parliament hold government to account and improve public services.

Report by the Comptroller and Auditor General
Ordered by the House of Commons to be printed on 18 July 2013
This report has been prepared under Section 6 of the National Audit Act 1983 for presentation to the House of Commons in accordance with Section 9 of the Act
Amyas Morse Comptroller and Auditor General National Audit Office
17 July 2013
Department of Health
HC 590 London: The Stationery Office £16.00
2012-13 update on indicators of financial sustainability in the NHS
This update focuses on the financial sustainability of the NHS trusts and foundation trusts that provide community, secondary and tertiary health services, and on the primary care trusts that commissioned those services up to the end of 2012-13.
© National Audit Office 2013
The text of this document may be reproduced free of charge in any format or medium providing that it is reproduced accurately and not in a misleading context.
The material must be acknowledged as National Audit Office copyright and the document title specified. Where third party material has been identified, permission from the respective copyright holder must be sought.
Links to external websites were valid at the time of publication of this report. The National Audit Office is not responsible for the future validity of the links.
Printed in the UK for The Stationery Office Limited on behalf of the Controller of Her Majesty’s Stationery Office
2576278 07/13 PRCS
The National Audit Office study team consisted of: David Raraty, Philippa Paul, Vanessa Todman and Rachael Lindsay, under the direction of David Moon.
This report can be found on the National Audit Office website at www.nao.org.uk/NHS-sustainability-2013
For further information about the National Audit Office please contact:
National Audit Office Press Office 157–197 Buckingham Palace Road Victoria London SW1W 9SP
Tel: 020 7798 7400
Enquiries: www.nao.org.uk/contact-us
Website: www.nao.org.uk
Twitter: @NAOorguk
Contents
Headlines 4
Part OneNHS funding 10
Part TwoMeasures of financial sustainability 24
Part ThreeOrganisations under financial pressure 36
Part FourLocal health economies 52
4 Headlines 2012-13 update on indicators of financial sustainability in the NHS
Headlines
What this report is about
1 The National Audit Office last reported in July 2012 on Securing the future financial sustainability of the NHS.1 What we found was that the NHS as a whole delivered a surplus of £2.1 billion in 2011-12, but that within that total there was significant variation in financial performance. In particular, some organisations in difficulty had been given additional financial support through both direct financial support and additional non-recurrent funding.
2 This update focuses on the financial sustainability of the NHS trusts and foundation trusts that provide community, secondary and tertiary health services, and on the primary care trusts (PCTs) that commissioned those services up to the end of 2012-13. Our analysis reconfirms what we found last year. Strategic health authorities, PCTs, NHS trusts and foundation trusts had a combined surplus of £2.1 billion in 2012-13. In total, therefore, there was sufficient money in the health service to make ends meet. As last year, however, there was a substantial gap between the trusts with the largest surpluses and those with the largest deficits. There is a similar variation between local health economies. We found that some regions were in overall surplus, while others were not. The differences are most marked in London, where PCT clusters in parts of west London had some of the largest surpluses, whereas outer north-east London had one of the largest deficits.
3 As in 2011-12, trusts in difficulty once again relied on cash support from the Department of Health (the Department) or non-recurrent local revenue support from strategic health authorities and PCTs. We concluded a year ago that it was hard to see that this approach would be a sustainable way of reconciling growing demand with the scale of efficiency gains required within the NHS, and that, without major change affecting some providers, the financial pressure on them would only get more severe. This conclusion remains.
1 Comptroller and Auditor General, Securing the future financial sustainability of the NHS, Session 2012-13, HC 191, National Audit Office, July 2012.
2012-13 update on indicators of financial sustainability in the NHS Headlines 5
4 At the end of the year there were still 100 NHS trusts that had not achieved foundation trust status. We reported on Achievement of foundation trust status by NHS hospital trusts in October 2011, and concluded that there were at least 20 of these trusts that were not financially or clinically viable in their current form.2 The NHS Trust Development Authority no longer expects all NHS trusts to achieve the original target of gaining foundation trust status by March 2014. Nonetheless, the risk that NHS trusts will not maintain their planned trajectory to foundation trust status increased substantially in 2012-13. The risks are greatest among acute trusts.
5 This is a period of major transition for the NHS as NHS England and clinical commissioning groups take over, from strategic health authorities and PCTs, the responsibility for commissioning health services. We plan to repeat our analysis next year, when new commissioning arrangements will have been operating for 12 months.
The impact of additional financial support
6 The number of foundation trusts and NHS trusts reporting a deficit has fallen from 31 at the end of 2011-12 to 25 at the end of 2012-13.3 However, the underlying position is that some NHS trusts may be breaking even only because they are receiving additional local revenue support from strategic health authorities and PCTs. Without extra financial support, the picture is reversed: 43 trusts may have been in deficit in 2011-12, and 44 in 2012-13. The amount of non-recurrent financial support given to trusts has also increased, from £123 million in 2011-12 to £203 million in 2012-13.4 Fifteen of the 23 trusts receiving support in 2012-13 also did so in 2011-12.5
7 In addition to providers, there were also some commissioners that received non-recurrent financial support. In 2012-13, there were 12 PCTs that received a total of £157 million in additional funding for strategic change and financial support. Some of this money was provided directly by the strategic health authority, and some was provided by redistributing available funds between PCTs in the same cluster. It is not yet clear how far, in future, clinical commissioning groups will redistribute local funding in a similar way.
2 Comptroller and Auditor General, Achievement of foundation trust status by NHS hospital trusts, Session 2010–2012, HC 1516, National Audit Office, October 2011.
3 We have included 20 foundation trusts in this total. West Midlands Ambulance Trust reported a deficit of £0.2 million for the three months during which it was a foundation trust (and Monitor therefore includes it in a total of 21 trusts reporting a deficit), but it achieved a surplus for the year as a whole.
4 Under the terms of the franchise risk agreement relating to Hinchingbrooke Healthcare NHS Trust with Circle, additional funding up to a value of £5 million is covered from Circle’s own resources. In 2012-13, no additional NHS funding was required as a consequence of this agreement and Hinchingbrooke Healthcare NHS Trust received £3.5 million franchise funding from Circle. This amount is not included in the £203 million total. For more detail on the franchise, see Comptroller and Auditor General, The franchising of Hinchingbrooke Healthcare NHS Trust, Session 2012-13, HC 628, National Audit Office, November 2012.
5 Barts Health NHS Trust was created on 1 April 2012 following the merger of Barts and The London NHS Trust, Newham University Hospital NHS Trust and Whipps Cross University Hospital NHS Trust.

6 Headlines 2012-13 update on indicators of financial sustainability in the NHS
The performance of NHS trusts and foundation trusts
8 The financial performance of NHS trusts and foundation trusts should be considered in the context of a period of little to zero growth in funding for NHS services over the last two years. Measured by the total surplus or deficit of hospital trusts, financial performance for the NHS appears stronger in 2012-13 than it did in 2011-12. However, there are signs of increasing pressure. A key underlying measure of sustainability, the average EBITDA margin (earnings before interest, tax, depreciation and amortisation as a percentage of income), has been decreasing over the last three years.
9 There are marked differences between trusts that are foundation trusts and those that are not:
• Foundation trusts have a consistently higher average EBITDA margin than NHS trusts.
• Average surpluses in foundation trusts have risen slightly.
• Among NHS trusts, average surpluses rose slightly between 2011-12 and 2012-13 when non-recurrent support is included. When non-recurrent support is taken out of the calculation, NHS trusts might have had an average deficit, which increased from £0.8 million in 2011-12 to £1.0 million in 2012-13.
Foundation trusts in breach of their terms of authorisation
10 Among foundation trusts, the median financial risk rating worsened between 2010-11 and 2011-12, and stayed broadly at the same level in 2012-13. The number of foundation trusts in breach of their terms of authorisation increased steadily throughout 2011-12 and 2012-13. At 31 March 2013, there were 19 foundation trusts (13 per cent) in breach.
2012-13 update on indicators of financial sustainability in the NHS Headlines 7
The performance of primary care trust clusters
11 We have mapped surpluses and deficits by PCT cluster to show the financial health of local health economies as a whole. This highlights a number of clusters facing particular financial pressure, for example in north-east London and the east of England.
How to read the report
12 The update consists of a series of annotated graphics, each of which has a short explanatory note:
• Part One explains how NHS bodies are funded, and details the extent of additional support given to NHS providers and commissioners.
• Part Two assesses, using different measures, the sustainability of individual trusts. These analyses show the effect of including, or possible effect of excluding, additional non-recurrent financial support.
• Part Three focuses on the most challenged NHS organisations, particularly NHS trusts in deficit and foundation trusts in breach of their terms of authorisation.
• Part Four combines data for providers and commissioners to look at the financial sustainability of local health economies. We have grouped NHS bodies into PCT clusters in order to map different indicators of financial health.

8 Headlines 2012-13 update on indicators of financial sustainability in the NHS
Technical notes
13 There are some caveats that need to be recognised when reading the data:
• Two trusts became foundation trusts during 2012-13: one on 1 April 2012 and one on 1 January 2013. We have included these trusts, where appropriate, in totals for foundation trusts. This has the effect of treating them as though they had been a foundation trust all year.
• All figures are quoted in absolute terms as reported, and are not adjusted for inflation.
• As in the National Audit Office’s report last year, surplus or deficit figures for NHS trusts match the way the Department of Health reported them in The Quarter (the Department’s quarterly account of how the NHS is performing at national level against the requirements and indicators set out in the NHS Operating Framework 2012-13). This means that the net surplus or deficit is reported:
• before net impairments;
• before the impact of absorption accounting for bodies which merged with or were acquired by other organisations;
• before additional revenue charges associated with bringing PFI assets on to the balance sheet, due to the introduction of IFRS accounting in 2009-10 (IFRIC 12); and
• before the impact of changes in accounting for donated assets and government grant reserves.
These adjustments mean that the surplus and deficit figures for NHS trusts in this report differ from some of the analyses used in the Department of Health’s annual report and management commentary for 2012-13, where the figures are reported in a number of ways, including after the adjustments shown above and any other related consolidation adjustments.

2012-13 update on indicators of financial sustainability in the NHS Headlines 9
• As in the National Audit Office’s report last year, surplus and deficit figures for foundation trusts match the way Monitor report them in its annual review of NHS foundation trust consolidated accounts. This means that the net surplus or deficit is reported:
• before net impairments;
• before the impact of absorption accounting for bodies which merged with or were acquired by other organisations;
• after the impact of incurring additional revenue charges associated with bringing PFI assets on the balance sheet due to the introduction of IFRS accounting in 2009-10; and
• after the impact of changes in accounting for donated assets and government grant reserves.

10 Part One 2012-13 update on indicators of financial sustainability in the NHS
Part One
NHS funding
1.1 In 2012-13, there were 151 primary care trusts (PCTs), grouped into 50 clusters. During the year, two NHS trusts became foundation trusts (Royal Free London on 1 April 2012, and West Midlands Ambulance Service on 1 January 2013). A further four NHS trusts transferred all services to foundation trusts: (Trafford Healthcare NHS Trust to Central Manchester University Hospitals NHS Foundation Trust; Scarborough and North East Yorkshire Healthcare NHS Trust to York Teaching Hospital NHS Foundation Trust; Oxfordshire Learning Disabilities NHS Trust to Southern Health NHS Foundation Trust and Great Western Ambulance NHS Trust to South Western Ambulance Service NHS Foundation Trust). At the start of the financial year there were 106 NHS trusts, in addition to NHS Direct, which is a national body, and 143 foundation trusts. At 31 March 2013, in addition to NHS Direct, there were 100 NHS trusts and 145 foundation trusts.
Funding for the NHS in 2012-13
1.2 Figure 1 shows, in a simplified way, how PCTs were responsible in 2012-13 for commissioning NHS services with a value of over £90 billion from GPs and other primary care providers, hospital trusts and other bodies.

2012-13 update on indicators of financial sustainability in the NHS Part One 11
Figure 1Funding for the NHS, 2012-13
Department of Health
Ten strategic health authorities in four clusters£6.4 billion
GPs and other primary care providers, public health, social care£33.5 billion1
151 primary care trusts in 50 clusters£91.6 billion
NHS trusts, foundation trusts, purchases from non-NHS bodies£63.8 billion
NOTES1 The £33.5 billion funding for primary care, public health and social care includes PCT income that comes from
other sources, including strategic health authority transfer and external income such as prescription charges.
2 The fi gures shown are initial allocations. The Department of Health and arm’s-length body fi gures include budgets that were transferred to the NHS during the year – such as Drug Pooled Treatment and GP Practice funding.
Source: Department of Health
Central budgets and arm’s-length bodies£7.5 billion

12 Part One 2012-13 update on indicators of financial sustainability in the NHS
Revenue-based public dividend capital
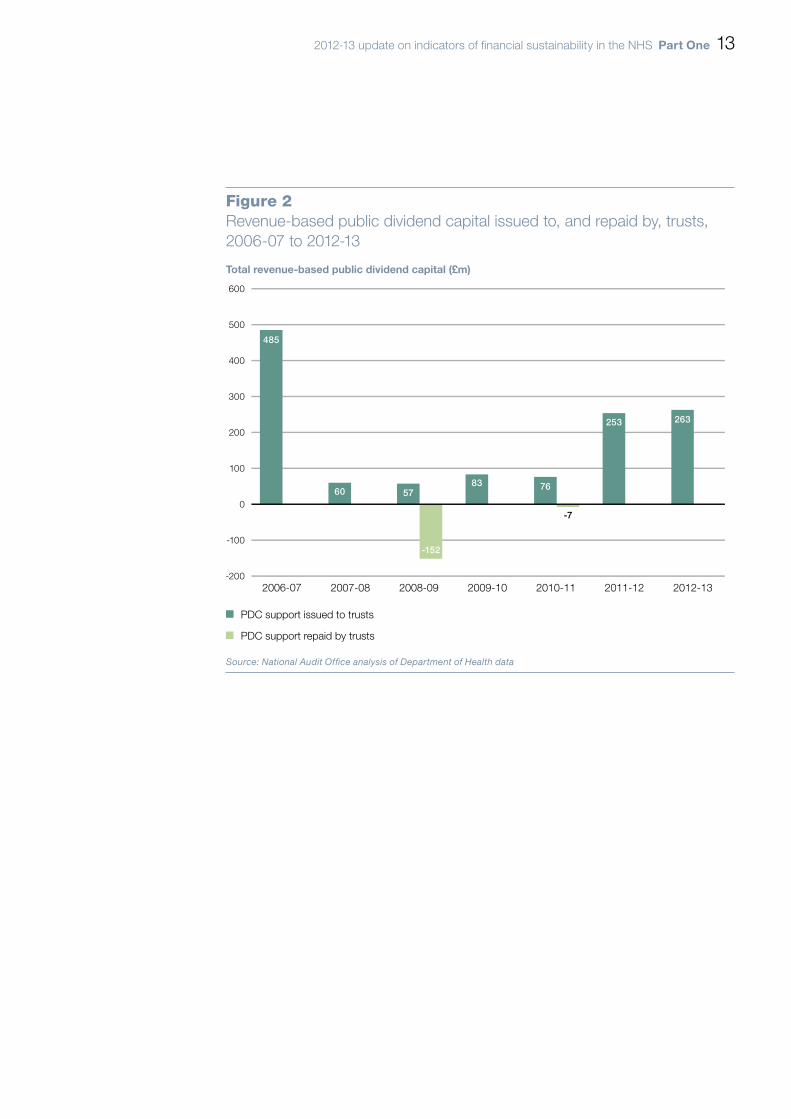
1.3 Figure 2 shows that the Department issued £263 million of public dividend capital (PDC) to trusts in 2012-13. This was an increase of £10 million compared with 2011-12. No trusts repaid any PDC either in 2011-12 or 2012-13. Public dividend capital is the equivalent of share capital for NHS bodies, and is a cash injection that directly strengthens an organisation’s net asset base, as shown in its statement of financial position (balance sheet). Some of the PDC issued (revenue-based PDC) is to support operational cash requirements. Since 2006-07, the Department has issued a total of £1.3 billion revenue-based PDC to 25 organisations (NHS trusts and foundation trusts), of which just under £160 million has been repaid.
2012-13 update on indicators of financial sustainability in the NHS Part One 13
Total revenue-based public dividend capital (£m)
600
500
400
300
200
100
0
-100
-200
Figure 2Revenue-based public dividend capital issued to, and repaid by, trusts, 2006-07 to 2012-13
2006-07 2007-08 2008-09 2009-10 2010-11 2011-12 2012-13
485
60 57
-152
-7
83 76
253 263
PDC support issued to trusts
PDC support repaid by trusts
Source: National Audit Office analysis of Department of Health data
14 Part One 2012-13 update on indicators of financial sustainability in the NHS
The trusts receiving revenue-based public dividend capital
1.4 Figure 3 shows that the Department issued revenue-based public dividend capital to 14 trusts in 2012-13. Six of these were NHS trusts and eight were foundation trusts. There are a small number of trusts that have now received substantial public dividend capital support. South London Healthcare NHS Trust, which received £50 million public dividend capital in 2012-13, and its predecessors have received a total of £405 million since 2006-07.6
1.5 Most of the trusts shown in Figure 3 needed additional public dividend capital because of concerns about their financial viability. In two cases, however, the public dividend capital was to support the cost of acquiring two NHS trusts by two relatively financially strong foundation trusts: Central Manchester NHS Foundation Trust (which acquired Trafford NHS Trust) and York Hospitals NHS Foundation Trust (which acquired Scarborough NHS Trust).
6 South London Healthcare NHS Trust was formed on 1 April 2009 by merging Bromley Hospitals NHS Trust, Queen Mary Sidcup NHS Trust and Queen Elizabeth Hospital NHS Trust.

2012-13 update on indicators of financial sustainability in the NHS Part One 15
South London
Total revenue-based public dividend capital issued (£m)
0 10 20 30 40 50
Figure 3Revenue-based public dividend capital issued to hospital trusts, 2012-13
NHS trust
Foundation trust
NOTE1 Central Manchester (which acquired Trafford) and York (which acquired Scarborough) received public dividend
capital to support the costs of the mergers.
Source: National Audit Office analysis of Department of Health and Monitor data
Peterborough and Stamford
Barking, Havering and Redbridge
Heatherwood and Wexham Park
Mid Staffordshire
North West London
Mid Yorkshire
Epsom and St. Helier
Bolton
Central Manchester
York
United Lincolnshire
Morecambe Bay
Milton Keynes
50
44
40
27
21
20
13
10
9
7
7
6
5
4

16 Part One 2012-13 update on indicators of financial sustainability in the NHS
Public dividend capital dividends payable
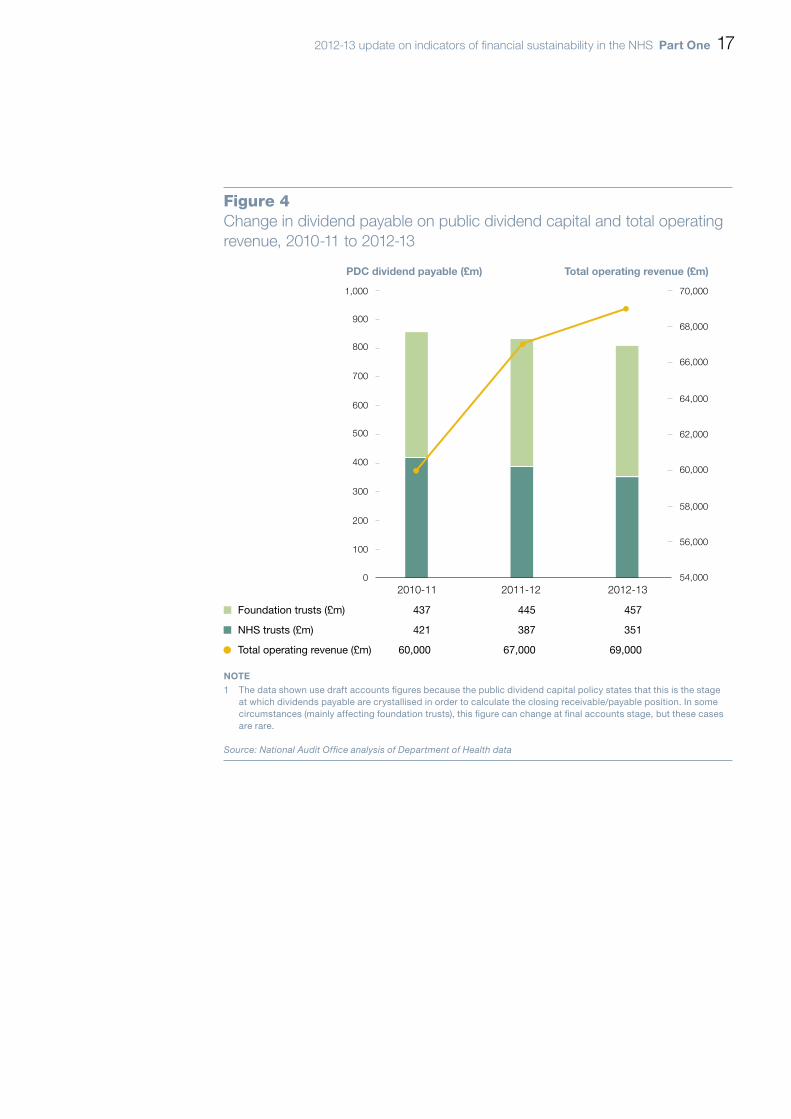
1.6 Figure 4 shows the value of dividends payable by NHS trusts and foundation trusts on public dividend capital (PDC) investments. Public dividend capital investment is similar to the share capital in private companies. NHS trusts and foundation trusts pay dividends based on 3.5 per cent of the value of their average relevant net assets.
1.7 Total operating income for trusts increased by 16 per cent from 2010-11 to 2012-13, while the amount of PDC dividends payable fell by 6 per cent. This can be because of revaluing downwards capitalised assets such as buildings and major equipment. Some trusts with large commitments, for example liabilities for buildings funded under the private finance initiative, may have negative asset balances. This means that they pay no dividends at all on PDC.
1.8 This figure is significant because downward revaluation of assets could allow trusts to reduce their expenditure (increasing their surplus or reducing their deficit) as a result of changes primarily affecting the statement of financial position (the balance sheet).
1.9 The figures shown are the value of dividends payable at the end of the year.
2012-13 update on indicators of financial sustainability in the NHS Part One 17
PDC dividend payable (£m) Total operating revenue (£m)
Figure 4Change in dividend payable on public dividend capital and total operating revenue, 2010-11 to 2012-13
NOTE1 The data shown use draft accounts figures because the public dividend capital policy states that this is the stage
at which dividends payable are crystallised in order to calculate the closing receivable/payable position. In some circumstances (mainly affecting foundation trusts), this figure can change at final accounts stage, but these cases are rare.
Source: National Audit Office analysis of Department of Health data
54,000
56,000
58,000
60,000
62,000
64,000
66,000
68,000
70,000
0
100
200
300
400
500
600
700
800
900
1,000
2010-11 2011-12 2012-13
Foundation trusts (£m) 437 445 457
NHS trusts (£m) 421 387 351
Total operating revenue (£m) 60,000 67,000 69,000

18 Part One 2012-13 update on indicators of financial sustainability in the NHS
Additional funding for strategic change and financial support
1.10 Figure 5 shows that there were 23 trusts that received non-recurrent revenue for strategic change and financial support in 2012-13; this came to a total of £203 million. In comparison, 22 trusts received a total of £123 million funding for strategic change and other revenue support in 2011-12. Of those in receipt of support, 15 received revenue support in both financial years. It is possible, as we reported last year, that there may also have been other non-recurrent funding agreed locally between PCTs and trusts.

2012-13 update on indicators of financial sustainability in the NHS Part One 19
Figure 5Additional funding for strategic change and other fi nancial support to NHS trusts and foundation trusts in 2011-12 and 2012-13
Strategic health authority
NHS trust 2011-12(£000)
2012-13(£000)
North West North Cumbria University Hospitals 28,000 20,000
St. Helens and Knowsley Hospitals 3,000
East Cheshire 2,200
Trafford Healthcare 9,000
East Midlands Northampton General Hospital 6,000
West Midlands University Hospital of North Staffordshire 12,100
Wye Valley 4,000 9,500
George Eliot Hospital 1,700 5,000
Mid Staffordshire NHS Foundation Trust 2,000
Shrewsbury and Telford Hospital 6,500
East of England Mid Essex Hospital Services 6,000 10,000
Bedford Hospital 2,000 6,000
Princess Alexandra Hospital 4,000 6,000
Ipswich Hospital 3,500 2,000
Hinchingbrooke Healthcare1 1,100
Suffolk Mental Health Partnership 2,000
London Barts Health2 10,000 49,400
South London Healthcare 747 10,000
Imperial College Healthcare 15,000 8,000
Barnet and Chase Farm Hospitals 7,800
Barking, Havering and Redbridge University Hospitals
2,531 5,048
North West London Hospitals 9,000 4,300
West Middlesex University 4,200
The Whittington Trust 3,000
Ealing Hospital 2,245
Epsom and St Helier University Hospitals 5,000
South East Coast Surrey and Sussex Healthcare 3,800 13,900
East Sussex Hospitals 8,000
South Central Oxford Learning Disability 1,250 1,400
South West Weston Area Health 3,610 6,600
Total 122,938 203,493
NOTES1 Under the terms of the franchise risk agreement relating to Hinchingbrooke Healthcare NHS Trust with Circle,
additional funding up to a value of £5 million is covered from Circle’s own resources. In 2012-13, no additional NHS funding was required as a consequence of this agreement and Hinchingbrooke Healthcare NHS Trust received £3.5 million franchise funding from Circle.
2 Barts Health NHS Trust was created on 1 April 2012 following the merger of Barts and The London NHS Trust, Newham University Hospital NHS Trust and Whipps Cross University Hospital NHS Trust.
3 In this list, only Mid Staffordshire NHS Foundation Trust is a foundation trust.
Source: National Audit Offi ce analysis of Department of Health data

20 Part One 2012-13 update on indicators of financial sustainability in the NHS
Local support to primary care trusts
1.11 Figure 6 shows that some commissioners also needed financial support; this totalled £157 million in 2012-13. Some of this additional support was managed by agreeing to redistribute available funds within PCT clusters, and some came from strategic health authorities. For 12 of these PCTs, deducting additional support may have turned an underspend at the end of the year into an overspend.

2012-13 update on indicators of financial sustainability in the NHS Part One 21
Figure 6Additional funding for strategic change and other fi nancial support to primary care trusts, 2012-13
Primary care trust (PCT) details Additional funding for strategic change and financial support
Revenue resource limit overspend or underspend
PCT name Cluster Strategic health authority (SHA)
Support received from SHA
(£000)
Support received from PCT
(£000)
Total support
(£000)
Financial position with
additional funding
(£000)
Possible financial position without
additional funding (£000)
Bury Greater Manchester
North West 1,000 – 1,000 757 (243)
South Staffordshire
Staffordshire West Midlands
12,000 – 12,000 15 (11,985)
North Staffordshire
Staffordshire West Midlands
2,000 – 2,000 55 (1,945)
Barnet North Central London
London 13,955 12,824 26,779 2,896 (23,883)
Enfield North Central London
London 17,188 8,434 25,622 2,840 (22,782)
Haringey North Central London
London 17,439 1,725 19,164 2,713 (16,451)
Hillingdon North West London
London – 25,600 25,600 1,979 (23,621)
Harrow North West London
London – 14,600 14,600 3,252 (11,348)
Hounslow North West London
London – 9,083 9,083 1,988 (7,095)
Ealing North West London
London – 4,530 4,530 2,500 (2,030)
Bexley South East London
London – 4,800 4,800 3,518 (1,282)
Croydon South West London
London – 11,633 11,633 63 (11,570)
Total 63,582 93,229 156,811 22,576 (134,235)
NOTES1 PCT support comes from a mixture of within PCT clusters and from strategic health authorities (SHAs).
2 The support PCTs received was all fi nancial support to prevent defi cits, not for strategic change.
Source: National Audit Offi ce analysis of Department of Health data

22 Part One 2012-13 update on indicators of financial sustainability in the NHS
How funding is changing in 2013-14
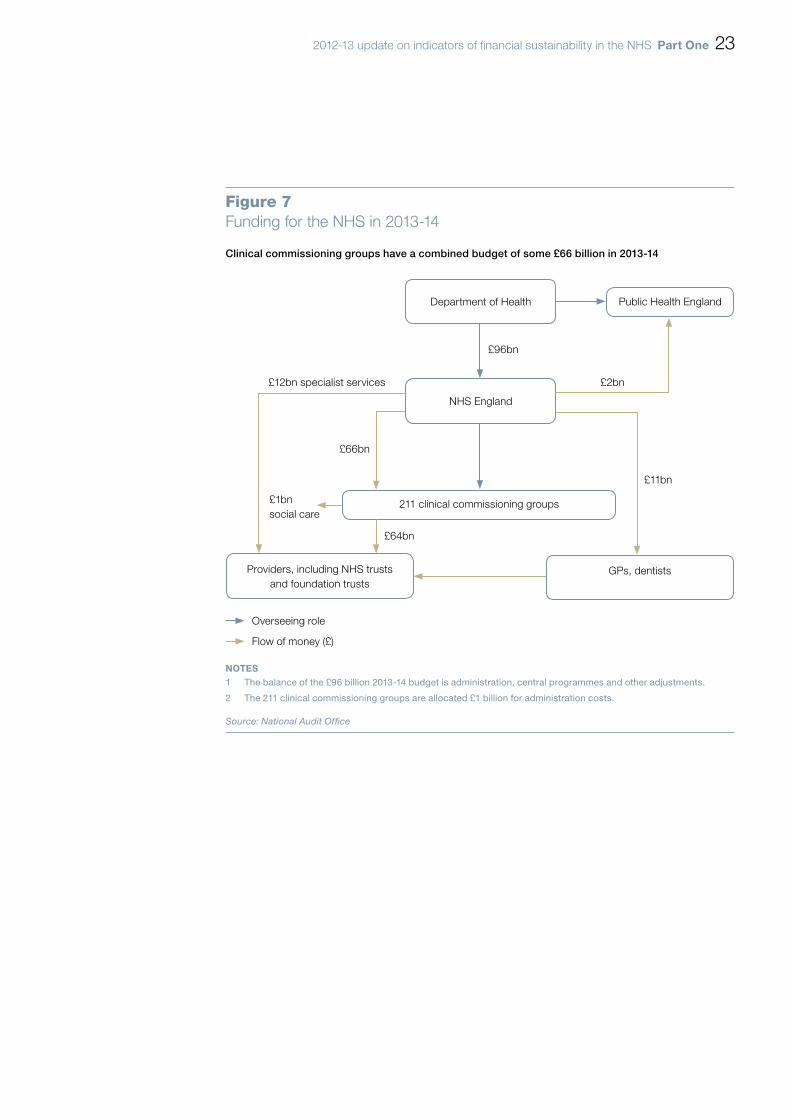
1.12 Figure 7 shows, in a very simplified way, how commissioning has changed in 2013-14. NHS England and local clinical commissioning groups have taken over responsibility from PCTs for commissioning services from NHS trusts and foundation trusts.
1.13 In 2012-13, some PCT clusters managed their resources by agreeing to transfer available funds between PCTs within the cluster. Clinical commissioning groups are not clustered in the same way, which means that there may no longer be scope to do this. However, it is possible that, like PCTs, some clinical commissioning groups will need additional support from NHS England in 2013-14.
2012-13 update on indicators of financial sustainability in the NHS Part One 23
Figure 7Funding for the NHS in 2013-14
Public Health England
211 clinical commissioning groups
Providers, including NHS trusts and foundation trusts
GPs, dentists
£66bn
£11bn
£64bn
Overseeing role
Flow of money (£)
NOTES1 The balance of the £96 billion 2013-14 budget is administration, central programmes and other adjustments.
2 The 211 clinical commissioning groups are allocated £1 billion for administration costs.
Source: National Audit Offi ce
Clinical commissioning groups have a combined budget of some £66 billion in 2013-14
NHS England
Department of Health
£96bn
£2bn£12bn specialist services
£1bn social care
24 Part Two 2012-13 update on indicators of financial sustainability in the NHS
Part Two
Measures of financial sustainability
2.1 This part of the update report considers the financial sustainability of individual trusts. Key measures used are whether trusts achieved a surplus or deficit, and the ratio between their underlying net income, excluding accounting adjustments, and their size. To give an indication of sustainability, we have shown analyses both including and excluding the possible impact of non-recurrent financial support detailed in Part One.
Measures of the sustainability of individual NHS bodies
2.2 Figure 8 shows that most primary care trusts (PCTs), NHS trusts and foundation trusts reported surpluses in 2012-13. There were five NHS trusts in deficit. However, without additional local revenue support from strategic health authorities or PCTs, paid to NHS trusts through PCTs, there may have been 23 NHS trusts in deficit, and NHS trusts taken as a whole may have had a net deficit instead of a net surplus.
2.3 NHS Direct is an NHS trust, but because it is a national body it is not directly comparable to other NHS trusts and foundation trusts. For this reason, it is not included with other trusts in the analyses which follow. In 2012-13, NHS Direct had a deficit of £68 million, largely due to the decommissioning costs of the 0845 telephone service. If these exceptional costs and accounting adjustments for impairments are excluded, NHS Direct had an underlying surplus of £0.4 million in 2012-13.

2012-13 update on indicators of financial sustainability in the NHS Part Two 25
Figure 8Surpluses and defi cits of primary care trusts, NHS trusts and foundation trusts, 2012-13
The figures shown include the position with the additional local support, and possible surpluses and deficits excluding additional support
NOTES1 Totals may not sum due to rounding.
2 NHS trusts that became foundation trusts in year have been treated as though they were foundation trusts for the whole year.
3 Data in the chart excludes fi gures for NHS Direct.
4 Under the terms of the franchise risk agreement relating to Hinchingbrooke Healthcare NHS Trust with Circle, additional funding up to a value of £5 million is covered from Circle’s own resources. In 2012-13, Hinchingbrooke Healthcare NHS Trust received £3.5 million funding from Circle. Because it was part of the franchise agreement, this is not treated as additional funding in the fi gure above.
5 At 31 March 2013, there were 100 NHS trusts. In the course of the year, Oxfordshire Learning Disability NHS Trust transferred all services to Southern Health NHS Foundation Trust (on 1 November 2012), and Great Western Ambulance Service NHS Trust transferred all services to South Western Ambulance Service NHS Foundation Trust (on 1 February 2013). Because these two trusts reported surpluses for the majority of 2012-13, we have included them in the data for this chart.
Source: National Audit Offi ce analysis of Department of Health and Monitor data
Financial position with additional funding Possible financial position without additional funding
PCTs Foundation trusts NHS trusts PCTs NHS trusts
(£m) (Number) (£m) (Number) (£m) (Number) (£m) (Number) (£m) (Number)
Surplus 690 150 651 125 238 97 761 138 217 79
Deficit -12 1 -159 20 -139 5 -146 13 -320 23
Overall reported position
678 151 492 145 100 102 614 151 -104 102
Surplus or deficit (£m)
800
600
400
200
0
-200
-400PCTs Foundation trusts NHS trusts
Financial position with additional funding Possible financial positionwithout additional funding
PCTs NHS trusts
Surplus
Overall reported position
Deficit
If additional funding for strategic change and other non-recurrent support is taken out, instead of an overall surplus NHS trusts may have had a net deficit
26 Part Two 2012-13 update on indicators of financial sustainability in the NHS
The distribution of trusts with a surplus or deficit in 2012-13
2.4 Figure 9 shows that the majority of NHS trusts and foundation trusts reported a surplus in 2012-13. Five NHS trusts and 20 foundation trusts were in deficit. The number of trusts in deficit is relatively small, compared with the total number of trusts, but some of these organisations have very substantial deficits.
2.5 This chart shows financial performance including any additional financial support that trusts may have received. There were three NHS trusts – South London Healthcare, North West London Hospitals Trust, and Barking, Havering and Redbridge University Hospitals Trust – that were in deficit even with financial support.
2.6 The Department’s planning guidance is that NHS trusts should plan to achieve a 1 per cent surplus. The trusts with the largest surpluses are foundation trusts.

2012-13 update on indicators of financial sustainability in the NHS Part Two 27
Surplus or deficit (£m)
40
30
20
10
0
-10
-20
-30
-40
-50
Figure 9Surpluses and deficits of NHS trusts and foundation trusts, 2012-13
Foundation trust
NOTES1 Data in the chart exclude figures for NHS Direct.
2 Figures include any non-recurrent support provided to NHS trusts.
3 NHS trusts that became foundation trusts in year have been treated as though they were foundation trusts for the whole year.
Source: National Audit Office analysis of Department of Health and Monitor data
NHS trust

28 Part Two 2012-13 update on indicators of financial sustainability in the NHS
Net current assets, including cash
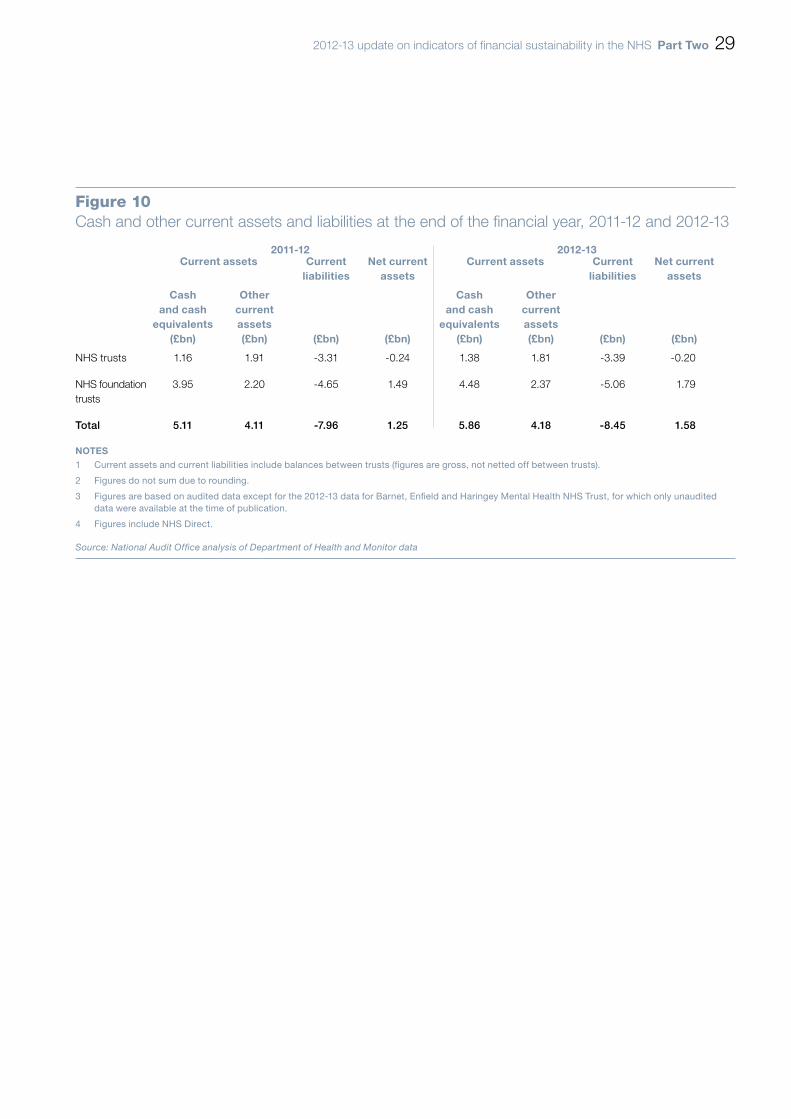
2.7 Figure 10 shows that at the end of March 2013, NHS foundation trusts held net current assets totalling £1.8 billion, an increase from £1.5 billion in 2011-12. NHS trusts were in a much weaker position, with net current liabilities of £0.2 billion.
2.8 At the end of the financial year, foundation trusts held £4.48 billion in cash and cash equivalents, an increase of £0.5 billion from 2011-12. NHS trusts held £1.38 billion in cash and cash equivalents.
2012-13 update on indicators of financial sustainability in the NHS Part Two 29
Figure 10Cash and other current assets and liabilities at the end of the fi nancial year, 2011-12 and 2012-13
2011-12 2012-13Current assets Current
liabilities Net current
assetsCurrent assets Current
liabilitiesNet current
assets
Cash and cash
equivalents(£bn)
Other current assets(£bn) (£bn) (£bn)
Cash and cash
equivalents(£bn)
Other current assets(£bn) (£bn) (£bn)
NHS trusts 1.16 1.91 -3.31 -0.24 1.38 1.81 -3.39 -0.20
NHS foundation trusts
3.95 2.20 -4.65 1.49 4.48 2.37 -5.06 1.79
Total 5.11 4.11 -7.96 1.25 5.86 4.18 -8.45 1.58
NOTES1 Current assets and current liabilities include balances between trusts (fi gures are gross, not netted off between trusts).
2 Figures do not sum due to rounding.
3 Figures are based on audited data except for the 2012-13 data for Barnet, Enfi eld and Haringey Mental Health NHS Trust, for which only unaudited data were available at the time of publication.
4 Figures include NHS Direct.
Source: National Audit Offi ce analysis of Department of Health and Monitor data

30 Part Two 2012-13 update on indicators of financial sustainability in the NHS
The average surplus or deficit of NHS trusts and foundation trusts
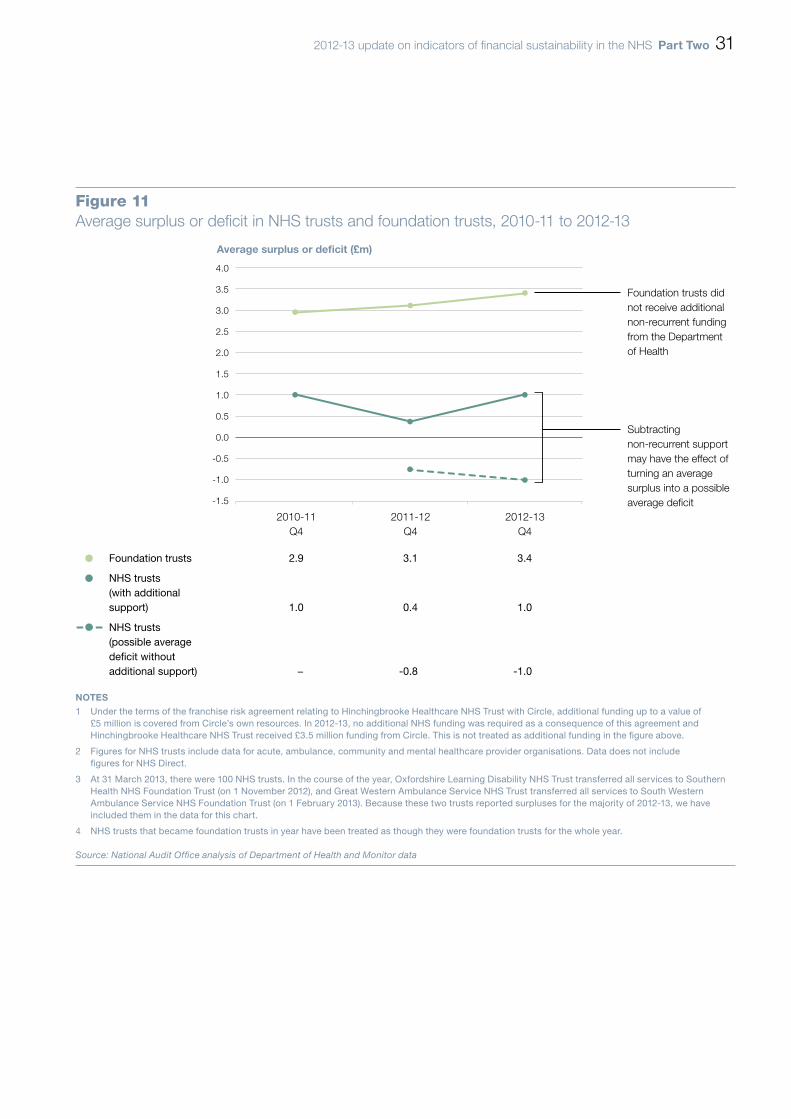
2.9 Figure 11 shows that the average surplus in foundation trusts has consistently been higher than that for NHS trusts, and it has increased over the last three years.
2.10 For NHS trusts, the average surplus was slightly higher in 2012-13 compared with 2011-12. However, this position may be reversed if non-recurrent support is excluded. Without a compensating decrease in expenditure, NHS trusts may have had an average deficit of £1.0 million in 2012-13, compared with a possible deficit of £0.8 million in 2011-12.
2.11 Figures for the total surplus or deficit follow the same pattern:7
• The total net surplus for foundation trusts has increased from £393 million in 2010-11, to £437 million in 2011-12 and £487 million in 2012-13.
• The total net surplus for NHS trusts fell from £112 million in 2010-11 to £44 million in 2011-12,8 and then rose to £106 million in 2012-13.9
• Excluding non-recurrent support, NHS trusts may have had a total net deficit of £82 million in 2011-12, and £98 million in 2012-13.
2.12 It is important to note, however, that there are a few trusts with very large deficits relative to others (including, for example: South London Healthcare NHS Trust; Barking, Havering and Redbridge University Hospitals NHS Trust; and Mid Yorkshire NHS Trust). These bring down the total surplus, and the average, for all NHS trusts.
7 For NHS trusts that became foundation trusts during the year, Monitor and the Department of Health publish surplus or deficit figures based on the period in which they were NHS trusts or foundation trusts. The totals reported here match these figures.
8 The overall trust position for the 2011-12 accounts has been revised from £45 million reported at Quarter four to £44 million, following receipt of the final audited accounts position from East Midlands Ambulance Service NHS Trust (which changed from £2.409 million to £1.402 million).
9 The overall trust position for 2012-13 used draft accounts for Barnet, Enfield and Haringey Mental Health NHS Trust.
2012-13 update on indicators of financial sustainability in the NHS Part Two 31
Figure 11Average surplus or deficit in NHS trusts and foundation trusts, 2010-11 to 2012-13
Average surplus or deficit (£m)
4.0
3.5
3.0
2.5
2.0
1.5
1.0
0.5
0.0
-0.5
-1.0
-1.5
2010-11Q4
2011-12Q4
2012-13Q4
Foundation trusts 2.9 3.1 3.4
NHS trusts (with additional support) 1.0 0.4 1.0
NHS trusts (possible average deficit without additional support) − -0.8 -1.0
NOTES1 Under the terms of the franchise risk agreement relating to Hinchingbrooke Healthcare NHS Trust with Circle, additional funding up to a value of
£5 million is covered from Circle’s own resources. In 2012-13, no additional NHS funding was required as a consequence of this agreement and Hinchingbrooke Healthcare NHS Trust received £3.5 million funding from Circle. This is not treated as additional funding in the figure above.
2 Figures for NHS trusts include data for acute, ambulance, community and mental healthcare provider organisations. Data does not include figures for NHS Direct.
3 At 31 March 2013, there were 100 NHS trusts. In the course of the year, Oxfordshire Learning Disability NHS Trust transferred all services to Southern Health NHS Foundation Trust (on 1 November 2012), and Great Western Ambulance Service NHS Trust transferred all services to South Western Ambulance Service NHS Foundation Trust (on 1 February 2013). Because these two trusts reported surpluses for the majority of 2012-13, we have included them in the data for this chart.
4 NHS trusts that became foundation trusts in year have been treated as though they were foundation trusts for the whole year.
Source: National Audit Office analysis of Department of Health and Monitor data
Foundation trusts did not receive additional non-recurrent funding from the Department of Health
Subtracting non-recurrent support may have the effect of turning an average surplus into a possible average deficit
32 Part Two 2012-13 update on indicators of financial sustainability in the NHS
EBITDA as a measure of underlying sustainability
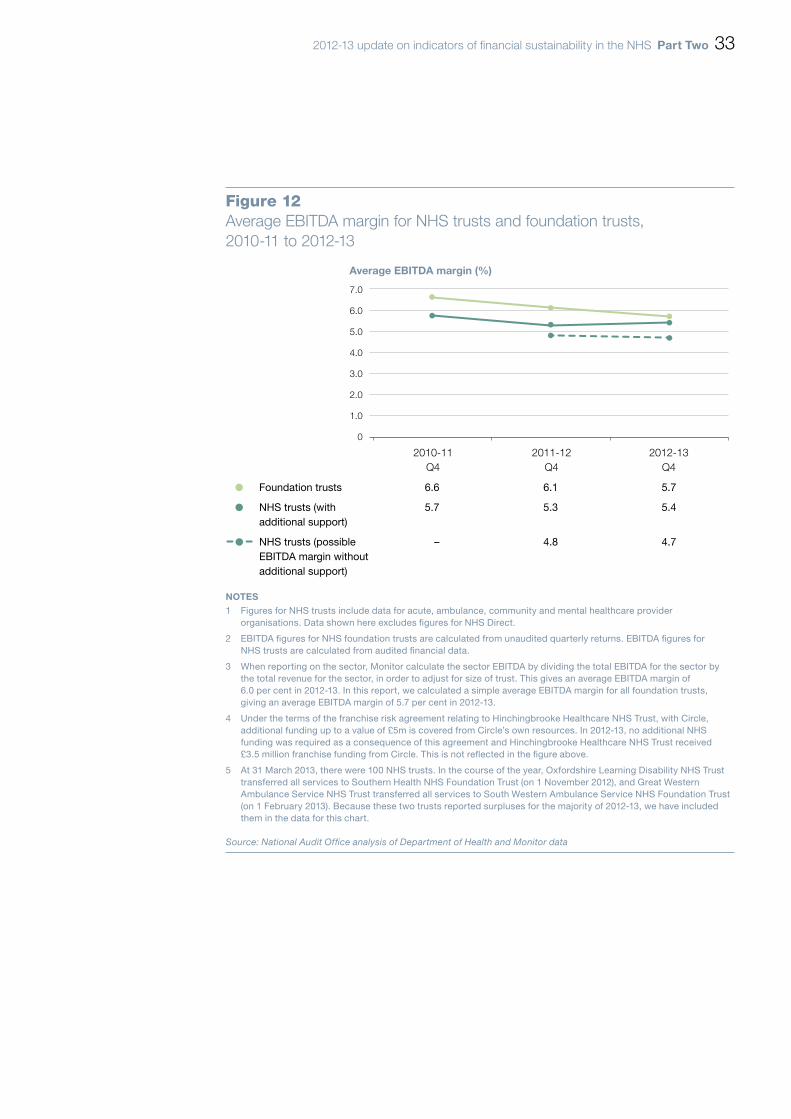
2.13 Monitor reports the financial performance of NHS foundation trusts using a measure called EBITDA (earnings before interest, tax, depreciation and amortisation). Expressed as percentage of income (the EBITDA margin), it is a good measure of underlying financial sustainability, as a proxy for operating efficiency. A high number is better. Monitor uses a threshold of 5 per cent as the EBITDA margin it would normally expect a trust to meet in order to be licensed as a foundation trust.
2.14 Figure 12 shows that the average EBITDA margin has been in decline for foundation trusts over the last three years. It has, however, been consistently higher for foundation trusts than it has been for NHS trusts.
2.15 In NHS trusts, the average EBITDA margin fell from 5.7 per cent in 2010-11 to 5.3 per cent in 2011-12. It then rose slightly, to 5.4 per cent, in 2012-13.
2.16 However, the average EBITDA margin may be distorted by the potential effect of non-recurrent financial support. Removing non-recurrent support from the calculation means that the average EBITDA margin for NHS trusts may be lower, and potentially falls from 4.8 per cent in 2011-12 to 4.7 per cent in 2012-13.
2012-13 update on indicators of financial sustainability in the NHS Part Two 33
Figure 12Average EBITDA margin for NHS trusts and foundation trusts, 2010-11 to 2012-13
Average EBITDA margin (%)
7.0
6.0
5.0
4.0
3.0
2.0
1.0
0
2010-11Q4
2011-12Q4
2012-13Q4
Foundation trusts 6.6 6.1 5.7
NHS trusts (with 5.7 5.3 5.4additional support)
NHS trusts (possible – 4.8 4.7EBITDA margin withoutadditional support)
NOTES1 Figures for NHS trusts include data for acute, ambulance, community and mental healthcare provider
organisations. Data shown here excludes figures for NHS Direct.
2 EBITDA figures for NHS foundation trusts are calculated from unaudited quarterly returns. EBITDA figures for NHS trusts are calculated from audited financial data.
3 When reporting on the sector, Monitor calculate the sector EBITDA by dividing the total EBITDA for the sector by the total revenue for the sector, in order to adjust for size of trust. This gives an average EBITDA margin of 6.0 per cent in 2012-13. In this report, we calculated a simple average EBITDA margin for all foundation trusts, giving an average EBITDA margin of 5.7 per cent in 2012-13.
4 Under the terms of the franchise risk agreement relating to Hinchingbrooke Healthcare NHS Trust, with Circle, additional funding up to a value of £5m is covered from Circle’s own resources. In 2012-13, no additional NHS funding was required as a consequence of this agreement and Hinchingbrooke Healthcare NHS Trust received £3.5 million franchise funding from Circle. This is not reflected in the figure above.
5 At 31 March 2013, there were 100 NHS trusts. In the course of the year, Oxfordshire Learning Disability NHS Trust transferred all services to Southern Health NHS Foundation Trust (on 1 November 2012), and Great Western Ambulance Service NHS Trust transferred all services to South Western Ambulance Service NHS Foundation Trust (on 1 February 2013). Because these two trusts reported surpluses for the majority of 2012-13, we have included them in the data for this chart.
Source: National Audit Office analysis of Department of Health and Monitor data

34 Part Two 2012-13 update on indicators of financial sustainability in the NHS
The distribution of EBITDA margins
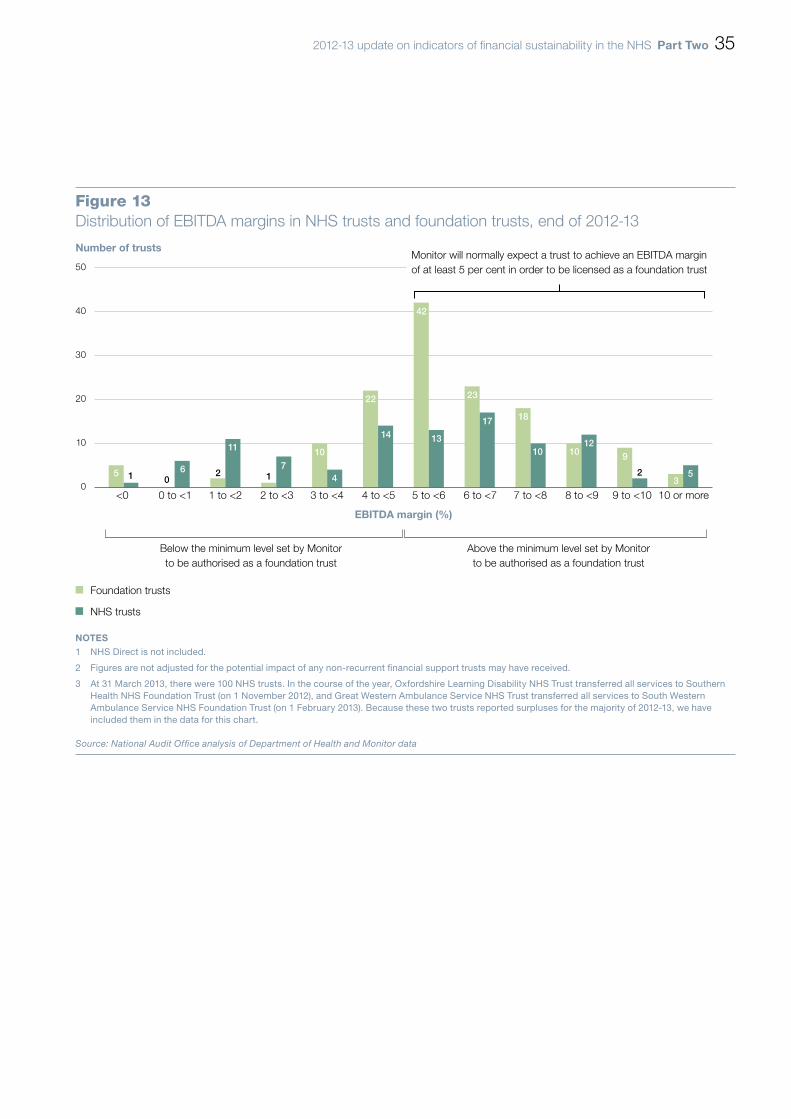
2.17 Figure 13 shows that there is a substantial number of trusts with an EBITDA margin below 5 per cent, placing them below the level Monitor would normally view as a sustainable level in order to license a trust as a foundation trust.
2.18 Taken as a whole, foundation trusts are in a stronger position than NHS trusts. Nonetheless, there were 40 foundation trusts (28 per cent of all foundation trusts) that would not meet Monitor’s requirement if applying for foundation trust status now.
2.19 At the end of 2012-13, there were 43 NHS trusts (42 per cent of all NHS trusts) that did not meet the 5 per cent minimum requirement to be licensed as foundation trusts. The figure also includes non-recurrent local revenue support. Were this to be excluded, as Figure 12 shows, scores for NHS trusts may have been lower.
2012-13 update on indicators of financial sustainability in the NHS Part Two 35
Figure 13Distribution of EBITDA margins in NHS trusts and foundation trusts, end of 2012-13
NOTES1 NHS Direct is not included.
2 Figures are not adjusted for the potential impact of any non-recurrent financial support trusts may have received.
3 At 31 March 2013, there were 100 NHS trusts. In the course of the year, Oxfordshire Learning Disability NHS Trust transferred all services to Southern Health NHS Foundation Trust (on 1 November 2012), and Great Western Ambulance Service NHS Trust transferred all services to South Western Ambulance Service NHS Foundation Trust (on 1 February 2013). Because these two trusts reported surpluses for the majority of 2012-13, we have included them in the data for this chart.
Source: National Audit Office analysis of Department of Health and Monitor data
Number of trusts
50
40
30
20
10
0<0 0 to <1 1 to <2 2 to <3 3 to <4 4 to <5 5 to <6 6 to <7 7 to <8 8 to <9 9 to <10 10 or more
Below the minimum level set by Monitorto be authorised as a foundation trust
Above the minimum level set by Monitorto be authorised as a foundation trust
Foundation trusts
NHS trusts
5 1 06
11
2 17
10
4
22
14
42
13
23
17 18
10 1012
9
23
5
Monitor will normally expect a trust to achieve an EBITDA margin of at least 5 per cent in order to be licensed as a foundation trust
EBITDA margin (%)
36 Part Three 2012-13 update on indicators of financial sustainability in the NHS
Part Three
Organisations under financial pressure
3.1 There is a small number of trusts that are under particular pressure. For some trusts, a deficit in one year is not necessarily an indicator of poor performance if the trust is able to break even over the longer term. A deficit, for example, may be due to exceptional reconfiguration costs. However, there are other trusts that have persistent deficits and are unlikely to be sustainable in their current form. We previously reported that in at least six cases, this was because trusts had unaffordable long-term commitments under private finance agreements.10
3.2 Figure 14 shows that the number of organisations in deficit fell from 34 in 2011-12 to 26 in 2012-13.11 There were four times as many foundation trusts in deficit as there were NHS trusts. The average deficit was much higher among NHS trusts than it was in foundation trusts because there was a small number of NHS trusts with large deficits. However, when additional financial support is excluded, both the number of trusts in deficit and the size of the underlying deficit may have increased from 2011-12 to 2012-13.
10 Comptroller and Auditor General, Securing the future financial sustainability of the NHS, Session 2012-13, HC 191, National Audit Office, July 2012.
11 We have included 20 foundation trusts in this total. West Midlands Ambulance NHS Trust reported a deficit of £0.2 million for the three months during which it was a foundation trust (and Monitor therefore includes it in a total of 21 trusts reporting a deficit), but it achieved a surplus for the year as a whole.

2012-13 update on indicators of financial sustainability in the NHS Part Three 37
Figure 14NHS organisations in defi cit, 2011-12 and 2012-13
Figures are shown both with and without additional local funding for strategic change and financial support
2012-13 2011-12
NHS organisation
Deficit(with support)
Possible deficit (without support)
Deficit(with support)
Possible deficit (without support)
(Number) (£m) (Number) (£m) (Number) (£m) (Number) (£m)
PCTs 1 -12 13 -146 3 -49 3 -49
NHS foundation trusts
20 -159 20 -159 21 -130 21 -132
NHS trusts 5 -139 23 -320 10 -177 22 -287
Total 26 -310 56 -625 34 -356 46 -468
NOTES1 NHS trusts that became foundation trusts during the fi nancial year have been treated as though they were
foundation trusts for the whole year.
2 Under the terms of the franchise risk agreement relating to Hinchingbrooke Healthcare NHS Trust, with Circle, additional funding up to a value of £5 million is covered from Circle’s own resources. In 2012-13, no additional NHS funding was required as a consequence of this agreement and Hinchingbrooke Healthcare NHS Trust received £3.5 million franchise funding from Circle. This is not refl ected in the fi gure above.
3 NHS Direct is not included.
Source: National Audit Offi ce analysis of Department of Health and Monitor data

38 Part Three 2012-13 update on indicators of financial sustainability in the NHS
NHS trusts in deficit despite additional support
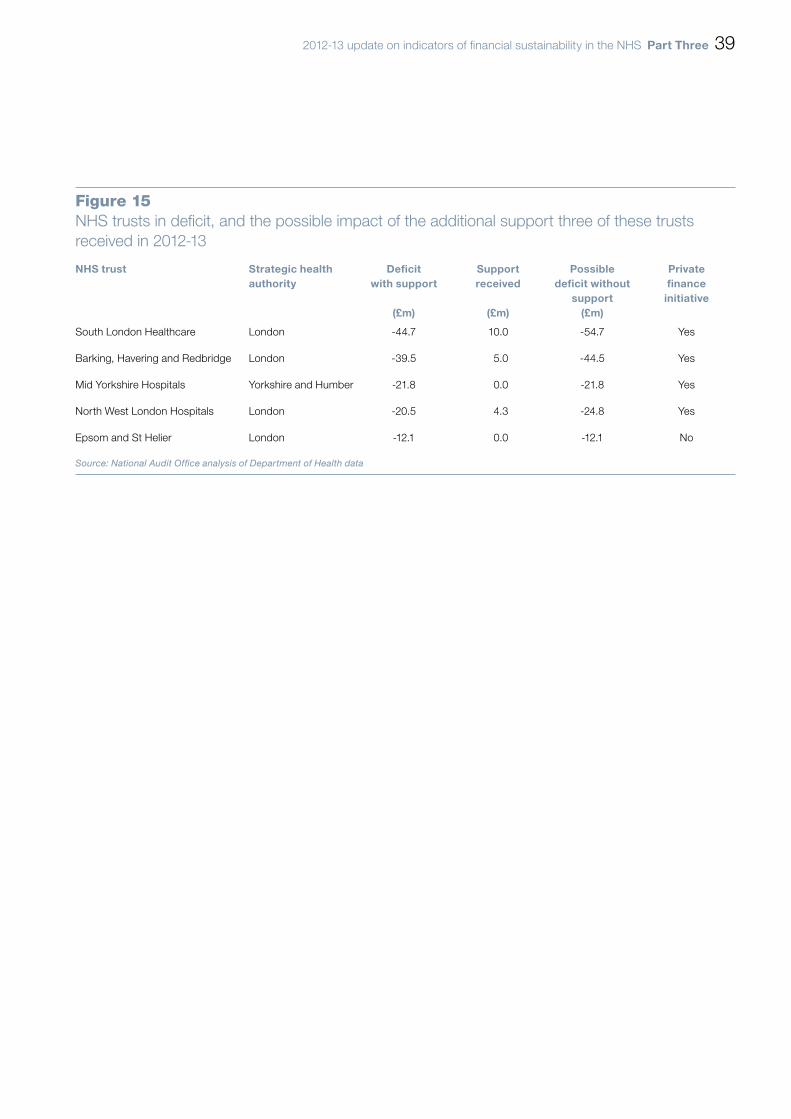
3.3 Figure 15 lists the five NHS trusts that were in deficit in 2012-13. Four of these trusts also have private finance initiative commitments. Among these, the largest deficits were in South London Healthcare NHS Trust and Barking, Havering and Redbridge University Hospitals NHS Trust, which have had persistent deficits for some years.
3.4 Three of these trusts – South London Healthcare NHS Trust; Barking, Havering and Redbridge University Hospitals NHS Trust; and North West London Hospitals NHS Trust – received non-recurrent revenue support, without which they may have had a larger deficit than they reported.
2012-13 update on indicators of financial sustainability in the NHS Part Three 39
Figure 15NHS trusts in defi cit, and the possible impact of the additional support three of these trusts received in 2012-13
NHS trust Strategic health authority
Deficit with support
(£m)
Supportreceived
(£m)
Possible deficit without
support(£m)
Private finance
initiative
South London Healthcare London -44.7 10.0 -54.7 Yes
Barking, Havering and Redbridge London -39.5 5.0 -44.5 Yes
Mid Yorkshire Hospitals Yorkshire and Humber -21.8 0.0 -21.8 Yes
North West London Hospitals London -20.5 4.3 -24.8 Yes
Epsom and St Helier London -12.1 0.0 -12.1 No
Source: National Audit Offi ce analysis of Department of Health data

40 Part Three 2012-13 update on indicators of financial sustainability in the NHS
Foundation trusts in deficit
3.5 Figure 16 shows that in 2012-13, there were five foundation trusts with deficits greater than £10 million. Three of these foundation trusts (Bolton, Morecambe Bay and Mid Staffordshire) do not have private finance initiative commitments.

2012-13 update on indicators of financial sustainability in the NHS Part Three 41
Figure 16Foundation trusts with defi cits greater than £10 million, 2012-13
Foundation trust Strategic health authority
Deficit(£m)
Private finance initiative
Governance risk rating
Peterborough and Stamford East of England -39.0 Yes
Bolton North West -23.7 No
Morecambe Bay North West -23.2 No
Sherwood Forest Hospitals East Midlands -15.1 Yes
Mid Staffordshire West Midlands -14.7 No
Source: National Audit Offi ce analysis of Monitor data
42 Part Three 2012-13 update on indicators of financial sustainability in the NHS
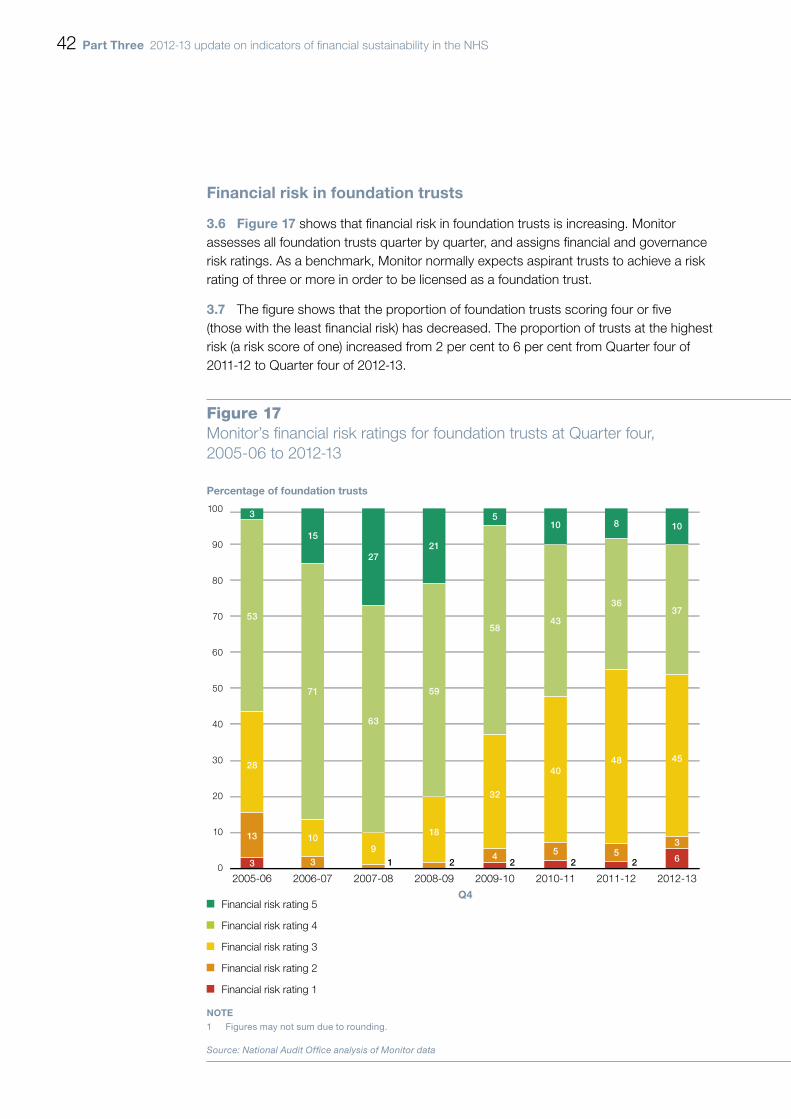
Financial risk in foundation trusts
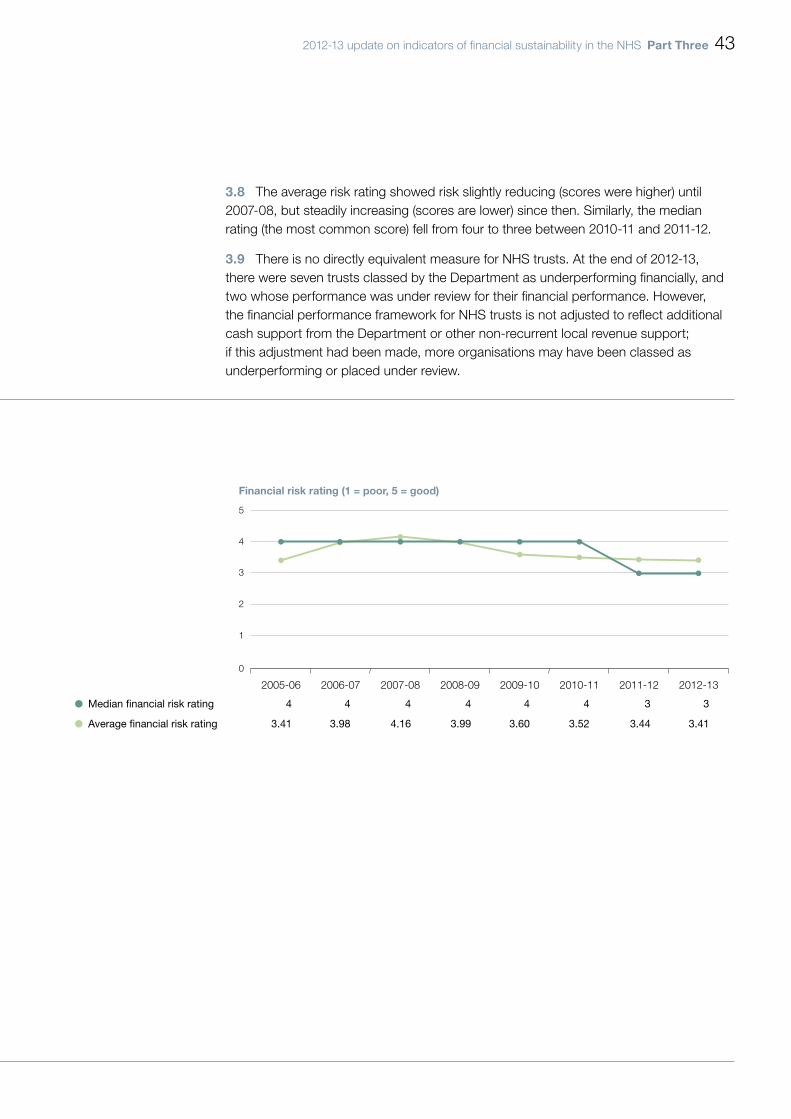
3.6 Figure 17 shows that financial risk in foundation trusts is increasing. Monitor assesses all foundation trusts quarter by quarter, and assigns financial and governance risk ratings. As a benchmark, Monitor normally expects aspirant trusts to achieve a risk rating of three or more in order to be licensed as a foundation trust.
3.7 The figure shows that the proportion of foundation trusts scoring four or five (those with the least financial risk) has decreased. The proportion of trusts at the highest risk (a risk score of one) increased from 2 per cent to 6 per cent from Quarter four of 2011-12 to Quarter four of 2012-13.
Figure 17Monitor’s fi nancial risk ratings for foundation trusts at Quarter four,2005-06 to 2012-13
NOTE1 Figures may not sum due to rounding.
Source: National Audit Offi ce analysis of Monitor data
Percentage of foundation trusts
Q4
100
90
80
70
60
50
40
30
20
10
02005-06 2006-07 2007-08 2008-09 2009-10 2010-11 2011-12 2012-13
Financial risk rating 5
Financial risk rating 3
Financial risk rating 4
Financial risk rating 1
Financial risk rating 2
3 510
43
40
5
10
37
45
3
6
8
36
48
5
58
32
4
15
2721
59
18
63
91 2 2 2 2
71
10
3
53
28
13
3
Financial risk rating (1 = poor, 5 = good)
5
4
3
2
1
0
2005-06 2006-07 2007-08 2008-09 2009-10 2010-11 2011-12 2012-13
Median financial risk rating 4 4 4 4 4 4 3 3
Average financial risk rating 3.41 3.98 4.16 3.99 3.60 3.52 3.44 3.41
2012-13 update on indicators of financial sustainability in the NHS Part Three 43
3.8 The average risk rating showed risk slightly reducing (scores were higher) until 2007-08, but steadily increasing (scores are lower) since then. Similarly, the median rating (the most common score) fell from four to three between 2010-11 and 2011-12.
3.9 There is no directly equivalent measure for NHS trusts. At the end of 2012-13, there were seven trusts classed by the Department as underperforming financially, and two whose performance was under review for their financial performance. However, the financial performance framework for NHS trusts is not adjusted to reflect additional cash support from the Department or other non-recurrent local revenue support; if this adjustment had been made, more organisations may have been classed as underperforming or placed under review.
Figure 17Monitor’s fi nancial risk ratings for foundation trusts at Quarter four,2005-06 to 2012-13
NOTE1 Figures may not sum due to rounding.
Source: National Audit Offi ce analysis of Monitor data
Percentage of foundation trusts
Q4
100
90
80
70
60
50
40
30
20
10
02005-06 2006-07 2007-08 2008-09 2009-10 2010-11 2011-12 2012-13
Financial risk rating 5
Financial risk rating 3
Financial risk rating 4
Financial risk rating 1
Financial risk rating 2
3 510
43
40
5
10
37
45
3
6
8
36
48
5
58
32
4
15
2721
59
18
63
91 2 2 2 2
71
10
3
53
28
13
3
Financial risk rating (1 = poor, 5 = good)
5
4
3
2
1
0
2005-06 2006-07 2007-08 2008-09 2009-10 2010-11 2011-12 2012-13
Median financial risk rating 4 4 4 4 4 4 3 3
Average financial risk rating 3.41 3.98 4.16 3.99 3.60 3.52 3.44 3.41

44 Part Three 2012-13 update on indicators of financial sustainability in the NHS
Governance risk for foundation trusts
3.10 Figure 18 shows that the proportion of foundation trusts assigned a red rating for governance risk is increasing. The proportion of red ratings increased from 3 per cent in 2005-06 to 18 per cent (26 of 145 foundation trusts) in 2012-13.
3.11 It is difficult to identify clear trends in the governance risk ratings, however, because Monitor has changed the assessment criteria it uses:
• In 2010-11, Monitor moved from a three-point scale to a four-point scale, splitting the amber rating into amber–green and amber–red ratings.
• The criteria for ratings (such as the clinical targets that form part of Monitor’s assessment) have changed over time.
3.12 The governance risk ratings for 2012-13 are not directly comparable with the previous year, because Monitor changed the way it considers information from the Care Quality Commission. Monitor’s governance rating in 2012-13 takes into account only those trusts for which the Care Quality Commission has flagged major concerns or has taken enforcement action. In principle, we would expect to have seen a small improvement in reported risk ratings, but this is not apparent in the data. Irrespective of the changes to the way risk is reported, Monitor remains aware of minor and moderate concerns, and uses this information to inform how it regulates individual trusts on a day-to-day basis.
3.13 There is no directly equivalent measure for NHS trusts. At the end of 2011-12, there were four trusts classed by the Department as challenged because of their quality of services, and 14 underperforming.12 In 2012-13, tripartite formal agreement (TFA) monitoring and the NHS Performance Framework were brought together. The Department has said that it will publish TFA monitoring ratings for all the remaining acute and ambulance NHS trusts alongside the monthly NHS Performance Framework results for 2012-13. The TFA process is informed by the NHS Performance Framework ratings.
12 Based on indicators underpinning the NHS Performance Framework, organisations were categorised as ‘performing’, ‘performance under review’, ‘underperforming’, or ‘challenged’. Performance under review described an organisation with minor concerns; underperforming referred to an organisation with more serious performance issues; and challenged was used to signify organisations that had serious ongoing performance concerns for an extended period of time. Organisations were not allowed to remain in a poor performance category indefinitely, so that being in one category for three consecutive quarters would relegate a trust to the category below.

2012-13 update on indicators of financial sustainability in the NHS Part Three 45
Q4
100
90
80
70
60
50
40
30
20
10
0
Figure 18Monitor’s governance risk ratings for foundation trusts at Quarter four,2005-06 to 2012-13
2005-06 2006-07 2007-08 2008-09 2009-10 2010-11 2011-12 2012-13
Red
Amber
Amber–red
NOTES1 In 2010-11, Monitor moved from a three-point scale to a four-point scale, splitting the amber rating into
amber–green and amber–red ratings.
2 Figures may not sum due to rounding.
Source: National Audit Office analysis of Monitor data
Percentage of foundation trusts
Green
Amber–green
16
81
3
36
58
7
15.6
54
40
6
69
24
8
62
22
16
61
13
9
18
51
20
13
15
46
19
18
17

46 Part Three 2012-13 update on indicators of financial sustainability in the NHS
Foundation trusts in breach of the terms of their licence
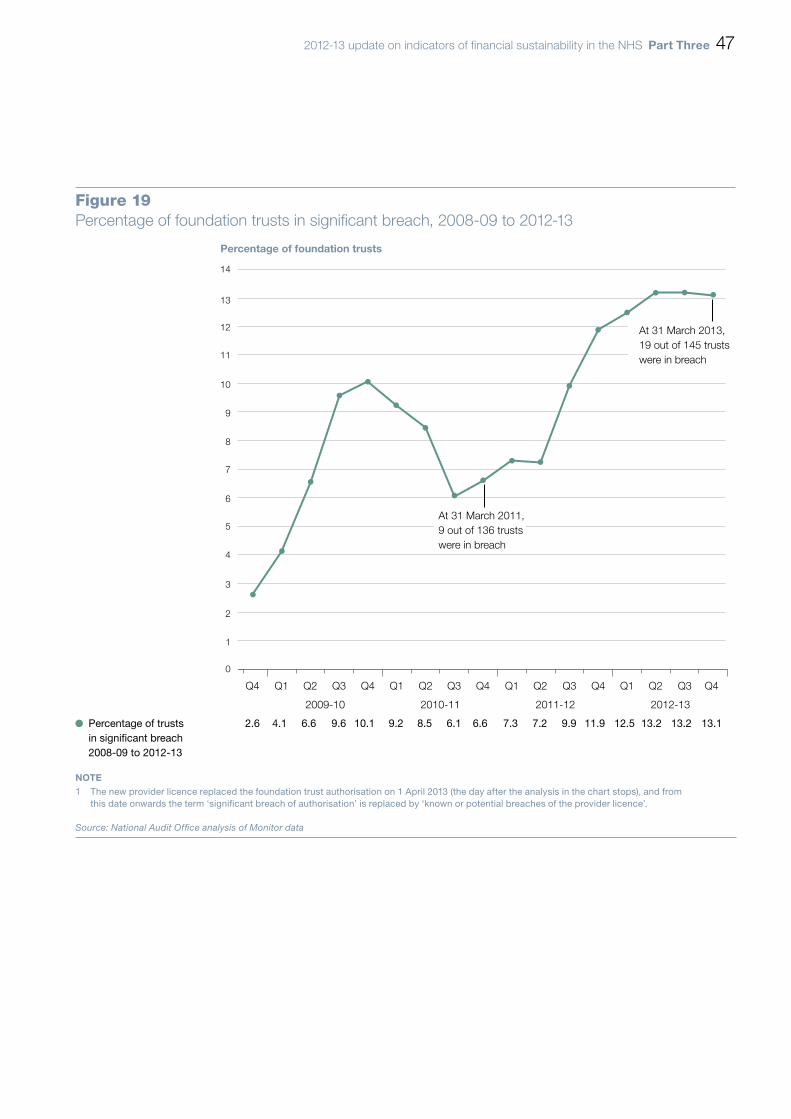
3.14 Figure 19 shows that an increasing number of trusts are unable to meet the standards Monitor requires all foundation trusts to achieve. Monitor reports quarterly on the number of trusts that are not meeting its standards. In the last quarter of 2012-13, there were 19 trusts (13 per cent of all foundation trusts) in significant breach of their terms of authorisation. There were more trusts in breach of their terms of authorisation in 2012-13, both in absolute and percentage terms, than there have been at any point in the past.
2012-13 update on indicators of financial sustainability in the NHS Part Three 47
Figure 19Percentage of foundation trusts in significant breach, 2008-09 to 2012-13
Percentage of foundation trusts
Percentage of trusts 2.6 4.1 6.6 9.6 10.1 9.2 8.5 6.1 6.6 7.3 7.2 9.9 11.9 12.5 13.2 13.2 13.1 in significant breach 2008-09 to 2012-13
NOTE1 The new provider licence replaced the foundation trust authorisation on 1 April 2013 (the day after the analysis in the chart stops), and from
this date onwards the term ‘significant breach of authorisation’ is replaced by ‘known or potential breaches of the provider licence’.
Source: National Audit Office analysis of Monitor data
0
2
3
1
4
5
7
9
11
13
6
8
10
12
14
Q4 Q1 Q2 Q3 Q4 Q1 Q2 Q3 Q4 Q1 Q2 Q3 Q4 Q1 Q2 Q3 Q4
2009-10 2010-11 2011-12 2012-13
At 31 March 2013, 19 out of 145 trusts were in breach
At 31 March 2011, 9 out of 136 trusts were in breach

48 Part Three 2012-13 update on indicators of financial sustainability in the NHS
Foundation trusts persistently in breach
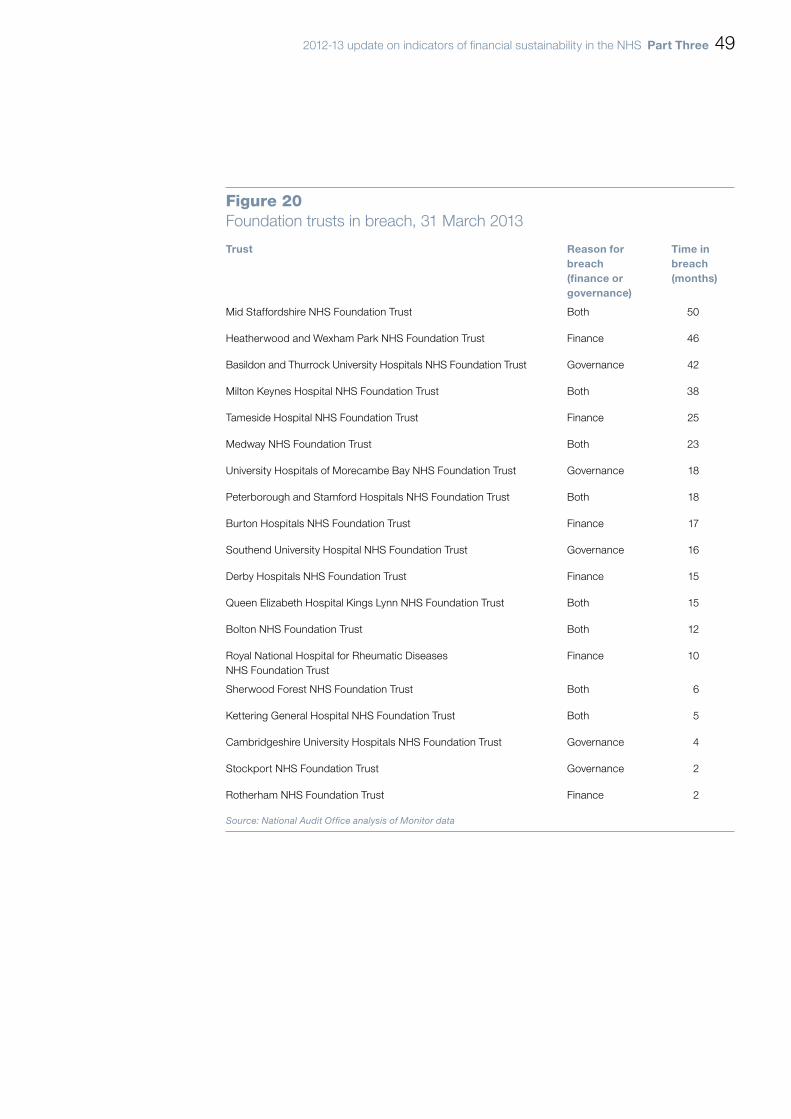
3.15 Figure 20 shows that there are a number of foundation trusts that have persistently been unable to meet the standards of finance or governance that Monitor expects foundation trusts to achieve. At 31 March 2013, there were 19 foundation trusts in breach of their terms of authorisation, of which four had been in breach for over three years. Of the 19 trusts in breach, 14 were in breach wholly or partly because of financial problems.
2012-13 update on indicators of financial sustainability in the NHS Part Three 49
Figure 20Foundation trusts in breach, 31 March 2013
Trust Reason forbreach (finance or governance)
Time in breach (months)
Mid Staffordshire NHS Foundation Trust Both 50
Heatherwood and Wexham Park NHS Foundation Trust Finance 46
Basildon and Thurrock University Hospitals NHS Foundation Trust Governance 42
Milton Keynes Hospital NHS Foundation Trust Both 38
Tameside Hospital NHS Foundation Trust Finance 25
Medway NHS Foundation Trust Both 23
University Hospitals of Morecambe Bay NHS Foundation Trust Governance 18
Peterborough and Stamford Hospitals NHS Foundation Trust Both 18
Burton Hospitals NHS Foundation Trust Finance 17
Southend University Hospital NHS Foundation Trust Governance 16
Derby Hospitals NHS Foundation Trust Finance 15
Queen Elizabeth Hospital Kings Lynn NHS Foundation Trust Both 15
Bolton NHS Foundation Trust Both 12
Royal National Hospital for Rheumatic Diseases NHS Foundation Trust
Finance 10
Sherwood Forest NHS Foundation Trust Both 6
Kettering General Hospital NHS Foundation Trust Both 5
Cambridgeshire University Hospitals NHS Foundation Trust Governance 4
Stockport NHS Foundation Trust Governance 2
Rotherham NHS Foundation Trust Finance 2
Source: National Audit Offi ce analysis of Monitor data

50 Part Three 2012-13 update on indicators of financial sustainability in the NHS
The foundation trust pipeline
3.16 Figure 21 shows how strategic health authorities assessed the risk of NHS trusts meeting, or failing to meet, the schedule they had set for achieving foundation trust status. The number with red ratings doubled between the end of March 2012 and the end of March 2013, and the numbers with green or amber–green ratings fell markedly. The NHS Trust Development Authority no longer expects all NHS trusts to achieve the original target of gaining foundation trust status by March 2014. Nonetheless, in 2012-13, the risk increased substantially that NHS trusts will not maintain the trajectory to foundation trust status they have planned. The risks are greatest among acute trusts.
3.17 The National Audit Office reported in October 2011 on Achievement of foundation trust status by NHS hospital trusts, and concluded then that there were at least 20 trusts facing such substantial problems that they have recognised they are not financially or clinically viable in their current form.13 There are 32 acute trusts rated red and 18 rated amber–red. Among these are a number that will be unable to achieve foundation trust status in their current form.
13 Comptroller and Auditor General, Achievement of foundation trust status by NHS hospital trusts, Session 2010–2012, HC 1516, National Audit Office, October 2011.

2012-13 update on indicators of financial sustainability in the NHS Part Three 51
Number of trusts
120
100
80
60
40
20
030 Sept
201131 Dec2011
31 Mar2012
31 Mar2013
Acute sector31 Mar 2013
Red
Amber-red
Green
Amber-green
18
5
6
32
28
19
23
12
43
22
30
38
20
17
26
41
11
20
40
41
Figure 21Strategic health authority risk ratings of NHS trusts’ progress towards foundation trust status, 2011 to 2013
Source: Department of Health
The number of trusts with a red risk rating for achievement of foundation status on time has doubled in the last 12 months
Acute trusts exclude mental health, community and ambulance trusts, and include many of those at highest risk of not meeting the timetable they set themselves for achievement of foundation trust status
52 Part Four 2012-13 update on indicators of financial sustainability in the NHS
Part Four
Local health economies
4.1 This part of the update report combines data for commissioners and providers, and presents this graphically to show the variation between local health economies. Viewed this way, there are some areas of the country that face particular challenges. In some places, for example the Cambridgeshire and Peterborough cluster, or the North East London cluster, difficulties appearing in the cluster maps are linked to financial challenges facing one or two hospital trusts.
4.2 The data should be viewed as indicative rather than definitive but, taken together, the maps suggest that the financial position for a number of clusters was slightly stronger at the end of 2012-13 than it was at the end of 2011-12. However, the maps also show that without local non-recurrent support, the financial environment in these clusters may have been much more difficult.
Regional variations between local health economies
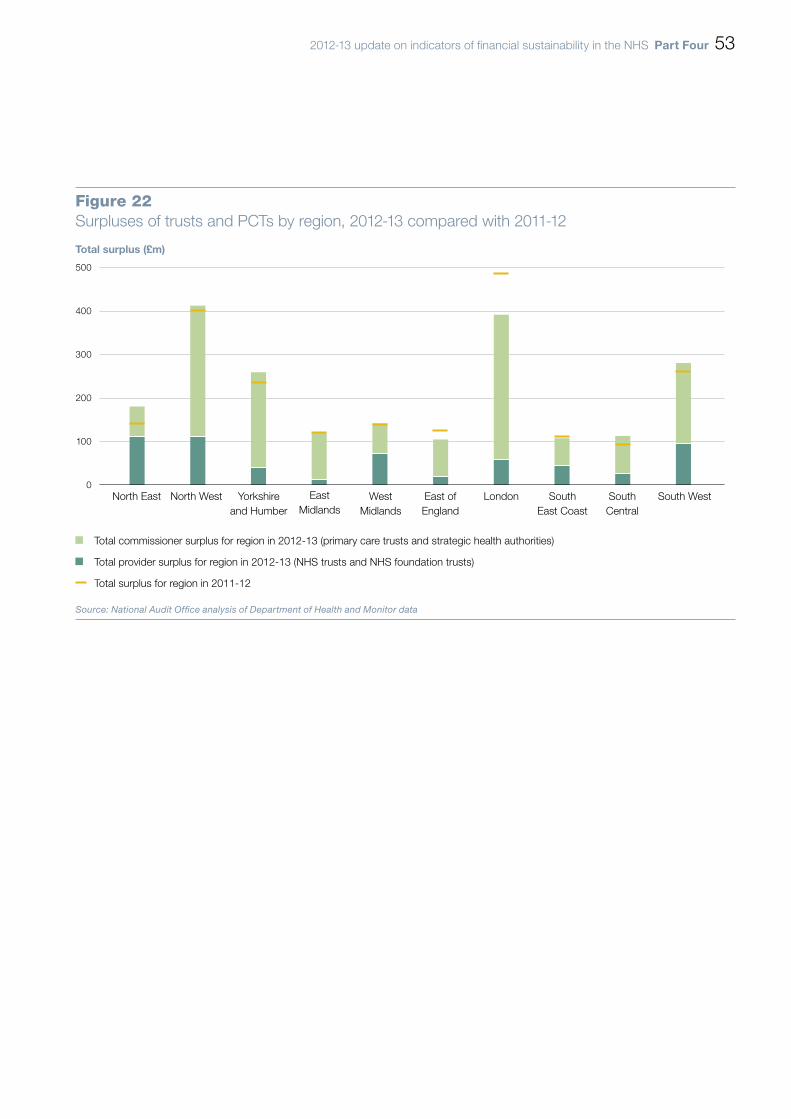
4.3 Figure 22 compares the financial strength of commissioners (strategic health authorities and PCTs) and providers (NHS trusts and NHS foundation trusts), analysed by PCT cluster, in 2012-13 and 2011-12.
4.4 There are very different patterns in different parts of the country, both when comparing the two years, and when looking at the balance of funds held by commissioners and providers. This is likely to be affected by the proportion of trusts with foundation status, and the way in which strategic health authorities and PCTs managed funds.
4.5 Changes are most marked in London, where provider surpluses have fallen substantially, but PCT surpluses rose in each of the last three years. The total surplus in London for 2012-13 was £333 million in PCTs and strategic health authorities, and £58 million in NHS trusts and NHS foundation trusts.
2012-13 update on indicators of financial sustainability in the NHS Part Four 53
Total surplus (£m)
500
400
300
200
100
0
Figure 22Surpluses of trusts and PCTs by region, 2012-13 compared with 2011-12
North East North West Yorkshireand Humber
EastMidlands
WestMidlands
East ofEngland
London South West
Total provider surplus for region in 2012-13 (NHS trusts and NHS foundation trusts)
Total commissioner surplus for region in 2012-13 (primary care trusts and strategic health authorities)
Source: National Audit Office analysis of Department of Health and Monitor data
SouthEast Coast
SouthCentral
Total surplus for region in 2011-12

54 Part Four 2012-13 update on indicators of financial sustainability in the NHS
Financial performance within clusters
4.6 Figure 23 shows the combined financial performance of PCTs, NHS trusts and NHS foundation trusts, analysed by cluster. This map includes any non-recurrent additional funding for strategic change and financial support. The maps are labelled with the highest and lowest performing clusters in London and nationally. The maps highlight some clear contrasts. For example, the West London cluster has been consistently in surplus, and Outer North East London persistently one of the clusters with the highest deficit. The Cambridgeshire and Peterborough cluster had the second highest deficit in 2011-12 and the highest deficit in 2012-13, mainly because of difficulties in Peterborough and Stamford NHS Foundation Trust.14
14 Comptroller and Auditor General, Peterborough and Stamford Hospitals NHS Foundation Trust, Session 2012-13, HC 658, National Audit Office, November 2012.
Figure 23Financial performance of trusts and commissioners by PCT cluster, including support
Q4 2010-11 Q4 2011-12
NOTE1 The data in these maps exclude ambulance trusts and NHS Direct.
Source: National Audit Office analysis of Department of Health and Monitor data
more than £30 million surplus
£20 million to £30 million surplus
£10 million to £20 million surplus
£0 million to £10 million surplus
£10 million to £0 million deficit
£20 million to £10 million deficit
more than £20 million deficit
> £30 million
£20 million to £30 million
£10 million to £20 million
£0 million to £10 million
-£10 million to £0 million
-£20 million to -£10 million
< -£20 million
more than £30 million surplus
£20 million to £30 million surplus
£10 million to £20 million surplus
£0 million to £10 million surplus
£10 million to £0 million deficit
£20 million to £10 million deficit
more than £20 million deficit
Outer North East London
£18.4 million deficit
Outer North East London
£37.4 million deficit
Merseyside
£54.9 million surplus
Merseyside
£58.3 million surplus
North West London
£75.8 million surplus
North West London
£84.4 million surplus
Berkshire
£8.7 million deficit
Cambridgeshire and Peterborough
£35.9 million deficit

2012-13 update on indicators of financial sustainability in the NHS Part Four 55
Figure 23Financial performance of trusts and commissioners by PCT cluster, including support
Q4 2012-13
NOTE1 The data in these maps exclude ambulance trusts and NHS Direct.
Source: National Audit Office analysis of Department of Health and Monitor data
> £30 million
£20 million to £30 million
£10 million to £20 million
£0 million to £10 million
-£10 million to £0 million
-£20 million to -£10 million
< -£20 million
Outer North East London
£15.5 million deficit
Black Country
£65.0 million surplus
North Central London
£108.2 million surplus
Cambridgeshire and Peterborough
£22.3 million deficit

56 Part Four 2012-13 update on indicators of financial sustainability in the NHS
4.7 Figure 24 shows the possible financial performance of NHS bodies by cluster, excluding income from non-recurrent support. This has the effect of moving some clusters, such as Cumbria, Northampton and Milton Keynes, and Inner North East London, from a net surplus position to a possible net deficit.

2012-13 update on indicators of financial sustainability in the NHS Part Four 57
Figure 24 Financial performance of trusts and commissioners by PCT cluster, excluding support
Q4 2011-12 Q4 2012-13
NOTES1 The data in these maps exclude ambulance trusts and NHS Direct.
2 We did not analyse the fi nancial performance of PCT clusters excluding additional support in 2010-11.
3 These maps exclude non-recurrent support that strategic health authorities gave to PCTs. No adjustment is necessary for non-recurrent support that was given from one PCT to another within the same cluster.
Source: National Audit Offi ce analysis of Department of Health and Monitor data
> £30 million
£20 million to £30 million
£10 million to £20 million
£0 million to £10 million
-£10 million to £0 million
-£20 million to -£10 million
< -£20 million
> £30 million
£20 million to £30 million
£10 million to £20 million
£0 million to £10 million
-£10 million to £0 million
-£20 million to -£10 million
< -£20 million
more than £30 million surplus
£20 million to £30 million surplus
£10 million to £20 million surplus
£0 million to £10 million surplus
£10 million to £0 million deficit
£20 million to £10 million deficit
more than £20 million deficit
Outer North East London
£39.9 million deficit
Outer North East London
£20.6 million deficit
Merseyside
£58.3 million surplus
Black Country
£65.0 million surplus
North Central London
£62.4 million surplus
North West London
£81.9 million surplus
Staffordshire
£39.6 million deficitCambridgeshire and Peterborough
£37 million deficit
Inner North East London
£6.1 million deficit


Design and Production by NAO Communications DP Ref: 10220-001
This report has been printed on Evolution Digital Satin and contains material sourced from responsibly managed and sustainable forests certified in accordance with the FSC (Forest Stewardship Council).
The wood pulp is totally recyclable and acid-free. Our printers also have full ISO 14001 environmental accreditation, which ensures that they have effective procedures in place to manage waste and practices that may affect the environment.

Published by TSO (The Stationery Office) and available from:
Online www.tsoshop.co.uk
Mail, telephone, fax and email TSO PO Box 29, Norwich NR3 1GN Telephone orders/general enquiries: 0870 600 5522 Order through the Parliamentary Hotline Lo-Call 0845 7 023474 Fax orders: 0870 600 5533 Email: [email protected] Textphone: 0870 240 3701
The Houses of Parliament Shop 12 Bridge Street, Parliament Square, London SW1A 2JX Telephone orders/general enquiries: 020 7219 3890 Fax orders: 020 7219 3866 Email: [email protected] Internet: http://www.shop.parliament.uk
TSO@Blackwell and other accredited agents
£16.00
9 780102 986112
ISBN 978-0-10-298611-2


