Northeast Power Coordinating Council Reliability Assessment For Winter 2012‐13 Conducted by the NPCC CO‐12 & CP‐8 Working Groups FINAL REPORT Approved by the Reliability Coordinating Committee November 2012
Transcript
Northeast Power Coordinating Council
Reliability Assessment
For
Winter 2012‐13
Conducted by the
NPCC CO‐12 amp CP‐8 Working Groups
FINAL REPORT
Approved by the Reliability Coordinating Committee November 2012
TABLE OF CONTENTS
1 EXECUTIVE SUMMARY 1
SUMMARY OF FINDINGS 1
2 INTRODUCTION 5
3 DEMAND FORECASTS FOR WINTER 2011‐12 7
SUMMARY OF RELIABILITY COORDINATOR AREA FORECASTS 8
4 RESOURCE ADEQUACY 15
NPCC SUMMARY FOR WINTER 2011‐12 15 PROJECTED CAPACITY ANALYSIS BY RELIABILITY COORDINATOR AREA 17 RECENT AND ANTICIPATED GENERATION RESOURCE ADDITIONS 22 FUEL INFRASTRUCTURE BY RELIABILITY COORDINATOR AREA 24 WIND CAPACITY ANALYSIS BY RELIABILITY COORDINATOR AREA 28
The information in this report is provided by the CO‐12 Operations Planning Working Group of the NPCC Task Force on Coordination of Operation Additional information provided by Reliability Councils adjacent to NPCC
The CO‐12 Working Group members are
Rod Hicks New Brunswick System Operator Yan Bechamp Independent Electricity System Operator Paul Metsa TransEacutenergie Dragan Pecurica Nova Scotia Power Inc Paul Roman Northeast Power Coordinating Council Michael Courchesne ISO New England Kyle Ardolino New York ISO
Information from neighboring Reliability Councils provided by
Paul Kure Reliability First (RFC)
The Multi‐Area Probabilistic Reliability Assessment provided in this report is provided by the CP‐8 Working Group of the NPCC Task Force on Coordination of Planning
The CP‐8 Working Group members are
Phil Fedora (Chair) Northeast Power Coordinating Council Alan Adamson New York State Reliability Council Rob Vance New Brunswick System Operator Frank Ciani New York Independent System Operator Kevan Jefferies Ontario Power Generation J W (Jack) Martin National Grid USA Abdelhakim Sennoun Hydro‐Queacutebec Distribution Kamala Rangaswamy Nova Scotia Power Inc Vithy Vithyananthan Independent Electricity System Operator Fei Zeng ISO New England The CP‐8 Working Group acknowledges the efforts of Messrs Glenn Haringa GE Energy and Andrew Ford the PJM Interconnection for their assistance in this analysis
Page 1
1 Executive Summary
This report is based on the work of the NPCC CO‐12 Operations Planning Working Group and focuses on the assessment of reliability within NPCC for the 2012‐13 Winter Operating Period Portions of this report are based on work previously completed for the NPCC Reliability Assessment for the Winter 2011‐121
Moreover the NPCC CP‐8 Working Group provides a seasonal multi‐area probabilistic reliability assessment Results of this assessment are included as a chapter in this report and supporting documentation is provided in Appendix VIII
Those aspects that the CO‐12 Working Group has examined to determine the reliability and adequacy of NPCC for the winter of 2011‐12 are discussed in detail in the specific report sections The following Summary of Findings addresses the significant points of the report discussion These findings are based on projections of electric demand requirements available resources and transmission configurations This report evaluates NPCCrsquos and the associated Balancing Authority areasrsquo ability to deal with the differing resource and transmission configurations within NPCC and the associated Balancing Authority areasrsquo preparations to deal with the possible uncertainties identified in this report
Summary of Findings
The forecasted coincident peak demand for NPCC during the peak week (week beginning January 13 2013)2 is 111860 MW as compared to 111821 MW forecasted during 2011‐12 Winter peak week The capacity outlook indicates a forecasted Net Margin for that week of 19881 MW This equates to a net margin of 178 percent in terms of the 111860 MW forecasted peak demand This week also has the minimum percentage of forecasted Net Margin available to NPCC
The largest forecasted NPCC Net Margin of 353 percent occurs during the week beginning March 24 2013 The minimum NPCC net margin from last winter was 150 percent and this winter it is 175 percent
During the NPCC forecasted peak week the forecasted net margin in terms of forecasted demand ranges from approximately 19 percent in Queacutebec to 405 percent in Ontario
When comparing the peak week from last winter (Jan 15 2012) to this winterrsquos expected peak week (Jan 13 2013) the NPCC installed capacity has increased by
1 The NPCC Assessments can be downloaded from the NPCC website httpswwwnpccorgLibrarySeasonal20AssessmentFormsPublic20Listaspx
2 Load and Capacity Forecast Summaries for NPCC IESO ISO‐NE NYISO HQ and the Maritimes are included in Appendix I
Page 2
2515 MW Individual area changes are the following Maritimes ‐263 MW New England ‐421 MW New York +875 MW Ontario +1857 MW Queacutebec +467 MW
No delays are forecasted for the commissioning of new resources However any delay should not materially impact the overall net margin projections for NPCC
The Point Lepreau Nuclear station (approximately 660 MW) which has been out for refurbishment since April 2008 is expected to be back in service during Fall 2012 Since last winter a 299 MW oil‐fired plant has retired and a 30 MW wind farm has come on line The Maritimes Area is projecting positive net margin If load is higher than normal or if resource outages are higher than projected net margin for some weeks may become negative That should not be a problem as the Feasible Transfer Capability from Queacutebec and New England to the Maritimes Area totals around 1300 MW
ISO New England does expect the potential for various amounts of single fuel gas‐only power plants to be temporarily unavailable during extreme winter weather conditions or during force majeure conditions on the regional gas grid and plans to mitigate these scenarios with supplemental commitment
Phase angle regulators (PARs) are now installed on all four of the Michigan ndash Ontario interconnections
Since winter 2011‐2012 seven new wind plants (total of 760 MW) and two units at La Sarcelle hydro GS (total of 100 MW) will have been placed in service Two fossil fuel generating stations (Tracy 450 MW and La Citiegravere 280 MW) have been retired Synchronous Condenser CS23 at Duvernay will be back in service for this operating period This will enhance transfer capability on the Southern Interface near the load area of the system No particular operating issues are expected
The Gentilly‐2 nuclear generating station (675 MW) will be retired and decommissioned beginning December 28 2012 This does not affect the Queacutebec margin since the station was originally scheduled to be out of service for refurbishment
Wind generation has grown considerably in the NPCC region since 2007 Wind generation totals in the winter 2007‐08 1525 MW 2008‐09 2337 MW 2009‐10 3862 MW 2010‐11 3952 MW 2011‐12 5261 MW and 2012‐13 6519 MW This translates to a growth of approximately 427 percent since winter 2007‐08
There is 6519 MW of nameplate wind capacity in the NPCC region After applying wind derate factors in the respective Balancing Authority areas 1409 MW counts toward capacity Since the previous winter there has been an increase of 1258 MW of nameplate wind capacity
Page 3
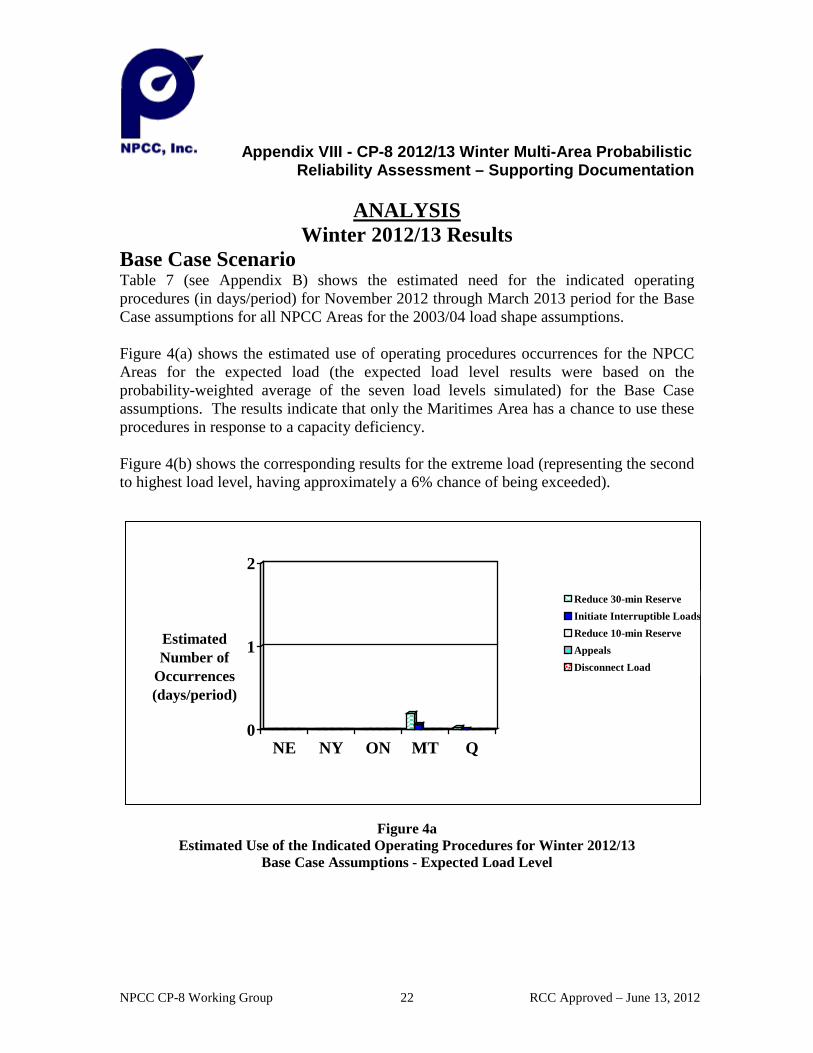
Based on the CP‐8 Probabilistic Reliability assessment study the use of operating procedures designed to mitigate resource shortages is not expected for Queacutebec Ontario New England and New York under both the assumed Base Case conditions for the expected load level The Maritimes Area shows a possibility of reducing 30‐minute reserves and to call on interruptible loads in response to a capacity deficiency this winter for Base and expected or extreme conditions Queacutebec shows a possibility of reducing 30‐minute reserves for Base and Extreme conditions
Based on the CP‐8 Probabilistic Reliability assessment study the Maritimes Area shows a possibility of reducing 30‐minute reserves and to call on interruptible loads in response to a capacity deficiency this winter for the severe set of resource unavailability assumptions used in this analysis occurs Quebec also shows a possibility of reducing 30‐minute reserves and 10‐minute reserves for the severe set of resource unavailability assumptions
Environmental constraints specifically state provincial and local regulations may have some minor impact on operations at various times during the 2012‐13 Winter Operating Period
With the exception of New England which has received additional information since the data was gathered for this report no particular fuel availability problem is foreseen by any of the Balancing Authority Areas Since the initial coordinated data gathering reflected in this report and as a result of additional information since Hurricane Sandy New England projects that an additional 955 MW of capacity will most likely be unavailable for this winter period In addition New England also expects that reduced LNG supplies into the Northeast may also cause further reductions on New England generators during extreme cold weather conditions
Communication protocols in place are sufficient to ensure the timely and efficient communications in all Balancing Authority Areas to maximize the availability of emergency support
The winter assessment indicates that each NPCC Area is reasonably prepared and is reviewing the necessary strategies and procedures to deal with operational problems and emergencies if they develop The CO‐12 Working Group believes that these preparations are valid for dealing with the various operating scenarios expected during the Winter Operating Period
The results of the CO‐12 and CP‐8 Working Groupsrsquo studies indicate that NPCC and the associated Balancing Authority Areas have adequate generation and transmission for the Winter Operating Period and have developed the necessary strategies and procedures to deal with operational problems and emergencies as they may develop However the resource and transmission assessments in this report are mere snapshots
Page 4
in time and base case studies Continued vigilance is required to monitor changes to any of the assumptions that can alter this reportrsquos findings
Page 5
2 Introduction
The NPCC Task Force on Coordination of Operation (TFCO) established the CO‐12 Working Group to conduct overall assessments of the reliability of the generation and transmission system in the NPCC Region for the Summer Operating Period (defined as the months of May through September) and the Winter Operating Period (defined as the months of December through March) The Working Group may occasionally study other conditions as requested by the TFCO
For the 2012‐13 Winter Operating Period3 the CO‐12 Working Group
Examined historical winter operating experiences and assessed their applicability for this period
Examined the existing emergency operating procedures available within NPCC and reviewed recent operating procedure additions and revisions The NPCC CP‐8 Working Group has done a probabilistic assessment of the implementation of operating procedures for the 2012‐13 Winter Operating Period The results and conclusions of the CP‐8 assessment are included as chapter 9 in this report and the full report is included as Appendix VIII
Reported potential sensitivities that may impact resource adequacy on a Reliability Coordinator Area basis These sensitivities included temperature variations new wind generation delays to in‐service of new generation load forecast uncertainties evolving load response measures solar magnetic activity system voltage and generator reactive capability limits
Reviewed the communications protocols with participants to ensure that timely and efficient communications will be in place in all Reliability Coordinator Areas to maximize the availability of emergency support
Reviewed the capacity margins accounting for bottled capacity within the NPCC
Reviewed inter‐Area and intra‐Area transmission adequacy including new transmission projects upgrades or derates and potential transmission problems
Reviewed the operational readiness of the NPCC region and actions to mitigate potential problems
Assessed the implications of strategies adopted for the Winter Operating Period on the adequacy of supply in the shoulder months
Coordinated data and modeling assumptions with NPCC CP‐8 Working Group and documented the methodology of each Reliability Coordinator area in its projection of load forecasts
3 For the purposes of this report the Winter Operating Period includes the week beginning November 25 2012 to the week beginning March 24 2013 inclusive
Page 6
Coordinated with other parallel seasonal operational assessments including the Eastern Interconnection Reliability Assessment Group (ERAG) SERC East ‐ ReliabilityFirst ndash NPCC and the NERC Reliability Assessment Subcommittee (RAS) Assessments
Page 7
3 Demand Forecasts for Winter 2012‐13
The non‐coincident forecasted peak demand for NPCC over the 2012‐13 Winter Operating Period is 112217 MW This peak demand translates to a coincident peak demand of 111860 MW which is expected during the week beginning January 13 2013 Demand and Capacity forecast summaries for NPCC Maritimes New England New York Ontario and Queacutebec are included in Appendix I
Ambient weather conditions are an important variable impacting the demand forecasts However unlike the summer demand forecasts the non‐coincident peak demand varies only slightly from the coincident peak forecast in the winter This is mainly due to the fact that the drivers that impact the peak demand are concentrated into a specific period in time In winter the peak demands are determined mainly by low temperatures along with the reduced hours of daylight that occurs over the first few weeks of January
While the peak demands appear to be confined to a few weeks in January each Area is aware that reduced margins could occur during any week of the operating period as a result of weather variables and or higher than normal outage rates
The impact of ambient weather conditions on load forecasts can be demonstrated by various means The IESO and Maritimes represent the resulting load forecast uncertainty in their respective Areas as a mathematical function of the base load The NYISO use a weather index that relates air temperature and wind speed to the load response and increases the load by a MW factor for each degree below the base value TransEacutenergie the Queacutebec system operator updates forecasts on an hourly basis within a 12 day horizon based on information on local weather wind speed cloud cover sunlight incidence and type and intensity of precipitation over nine regions of the Queacutebec Balancing Authority Area ISO‐NE relates air temperature to the load response and increases the load by a MW factor for each degree below the base value
The method each Reliability Coordinator area uses to determine the peak forecast demand and the associated load forecast uncertainty relating to weather variables is described in Appendix IV Below is a summary of all Reliability Coordinator Area forecasts
Page 8
Summary of Reliability Coordinator Area Forecasts
Maritimes
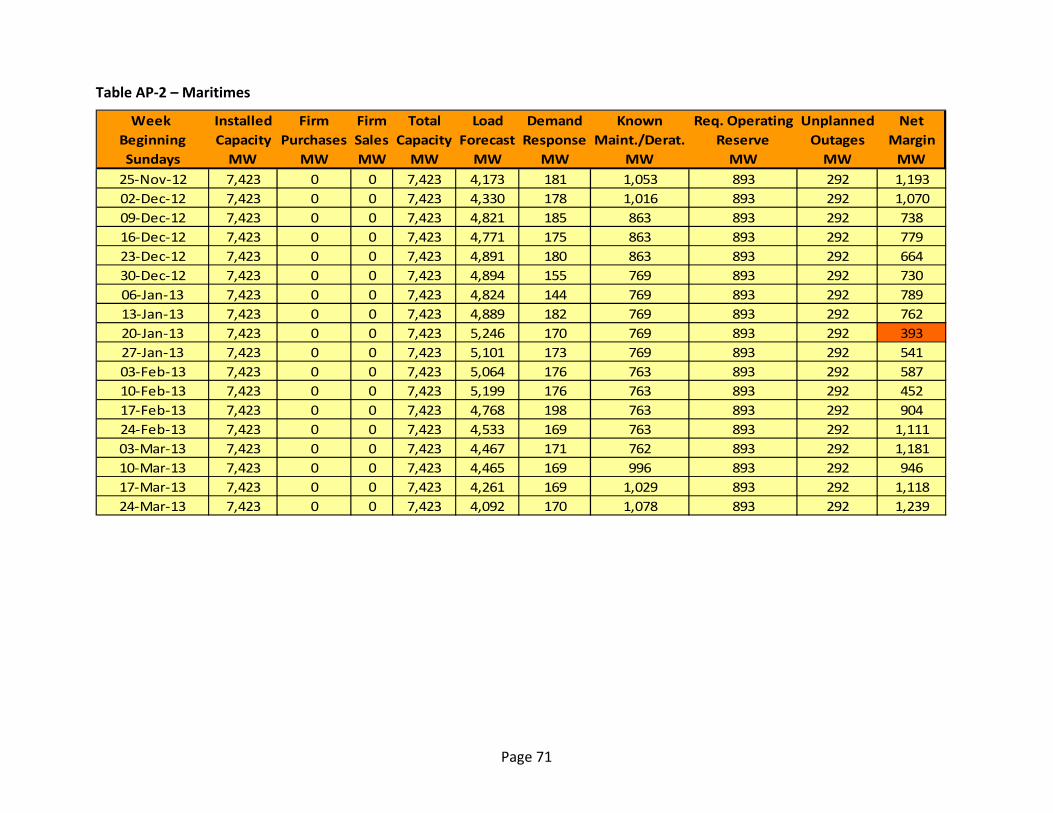
Based on the Maritimes Area winter 2012‐13 demand forecast a peak of 5246 MW is predicted to occur this Winter Operating Period December through February The peak demand is forecasted to occur the week beginning January 20 2013 The forecasted peak is approximately 6 percent higher than last yearrsquos actual winter peak of 4963 MW which occurred February 13 2012 This can be explained as last winter was milder than expected and there has been some loss of industrial load During the NPCC forecasted peak week beginning January 13 2013 the Maritimes Area is forecasting a load of 4889 MW
It should be noted that the Maritimes Area load is simply the mathematical sum of the forecasted weekly peak loads of the sub‐areas (New Brunswick Nova Scotia Prince Edward Island and the area served by the Northern Maine Independent System Operator) As such it does not take the effect of load coincidence within the week into account If the total Maritimes load included a coincidence factor the forecast load would be approximately 1‐3 percent lower The following graph illustrates the weekly Maritimes forecast
The New England Balancing Authority Area reference forecast (50 percent chance of being exceeded) for winter 2012‐13 projects a peak demand of 21392 MW4 This projected peak is 103 MW (05 percent) lower than the 2011‐12 winter projected peak of 21495 MW5 and 1466 MW (74 percent) higher than the 2011‐12 actual metered winter peak of 19926 MW The key factors driving this fairly level forecast are the continued penetration of energy efficiency and the lingering effects of the economic recession New Englandrsquos all‐time winter peak demand of 22818 MW occurred on January 15 2004 If extremely cold weather occurs for a prolonged period during the upcoming Winter Operating Period the winter peak demand could reach 22132 MW (10 percent chance of being exceeded)
The following graph illustrates the range of potential peak demands that ISO‐NE may experience this winter and compares them to historical peaks (1980‐2011)
Figure 2 New England Winter 2012‐13 Weekly
Load Profile
4 This forecast takes into account a reduction of 963 MW for passive demand resources (energy efficiency) with capacity supply obligations in ISO‐NErsquos Forward Capacity Market Without that reduction the forecast is the reference load forecast of 22355 MW published in the ISO New England 2012 CELT Report and shown in Table AP‐3 Appendix I of this report
5 The 2011‐12 forecasted winter peak demand without the effects of energy efficiency was 22255 MW
Page 10
Page 11
New York
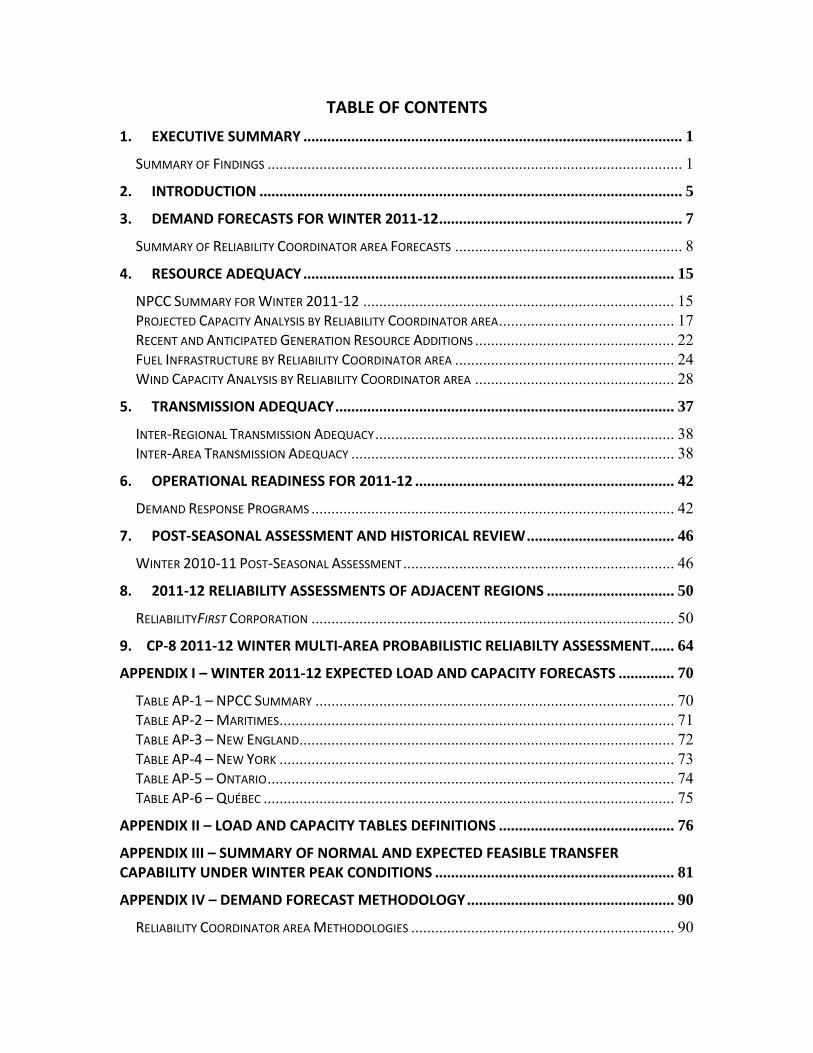
The New York Balancing Authority 2012‐13 winter peak load forecast is 24832 MW which is 299 MW higher than the forecast of 24533 MW peak for the 2011‐12 winter and 931 MW more than the actual winter peak in 2011‐12 of 23901 MW This forecast load is 278 percent lower than the all‐time winter peak load of 25541 MW that occurred on December 20 2004 The daily peak demand observed by New York during the Winter Operating Period occurs in the late afternoon or early evening hours
The following illustration provides the range of potential peak demands that New York may experience this winter
Figure 3 New York Winter 2012‐13 Weekly Load Profile
19000
20000
21000
22000
23000
24000
25000
26000
27000
MW
Week Beginning
Extreme Load Normal Load Historical Max Load
Page 12
Ontario
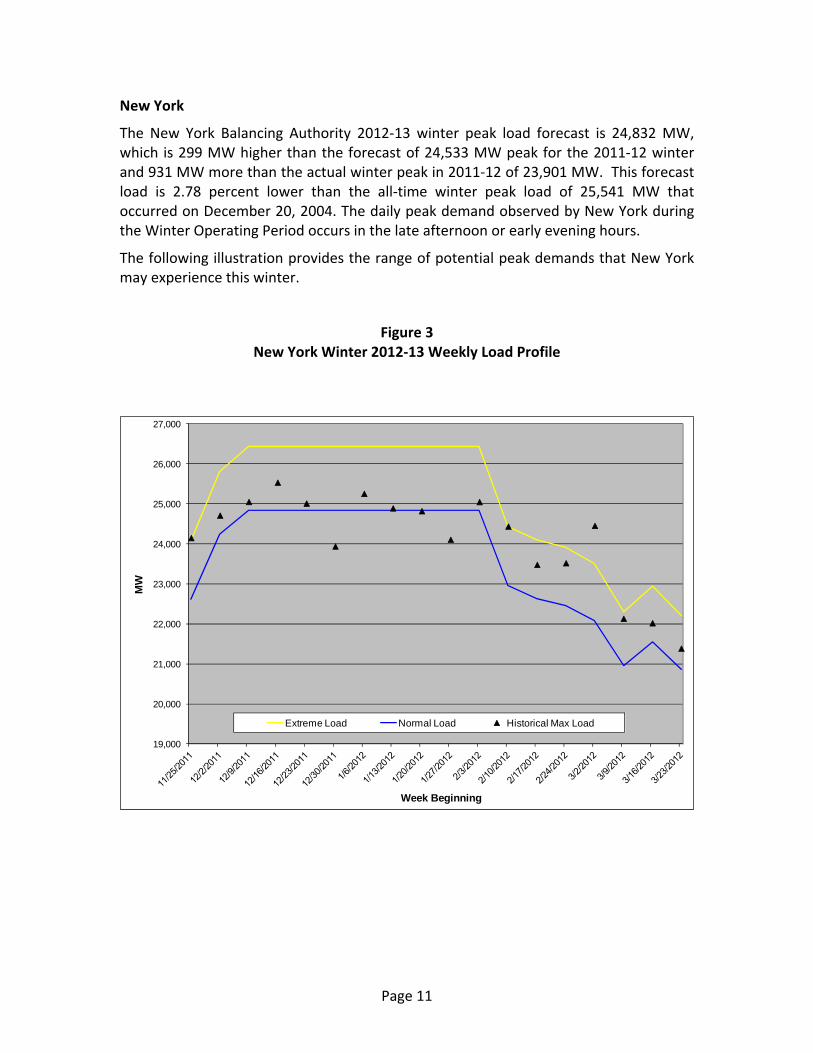
The forecasted weather normal hourly peak demand for this Winter Operating Period is 22087 MW This is 224 MW lower than the 22311 MW forecasted last winter and 438 MW higher than last winterrsquos actual peak of 21649 MW The actual peak demand for the 2011‐12 Winter Operating Period occurred on January 3 2012 The forecasted peak demands are expected to decline in comparison to last winter because of the continued growth in embedded (distributed) generation and conservation programs
The following graph illustrates the range of possible demands that the IESO may experience over this Winter Operating Period The peak demand is forecast for the week beginning January 13 2013 however the peak can occur at any time during the season from the week beginning December 09 2012 to the week beginning February 24 2013
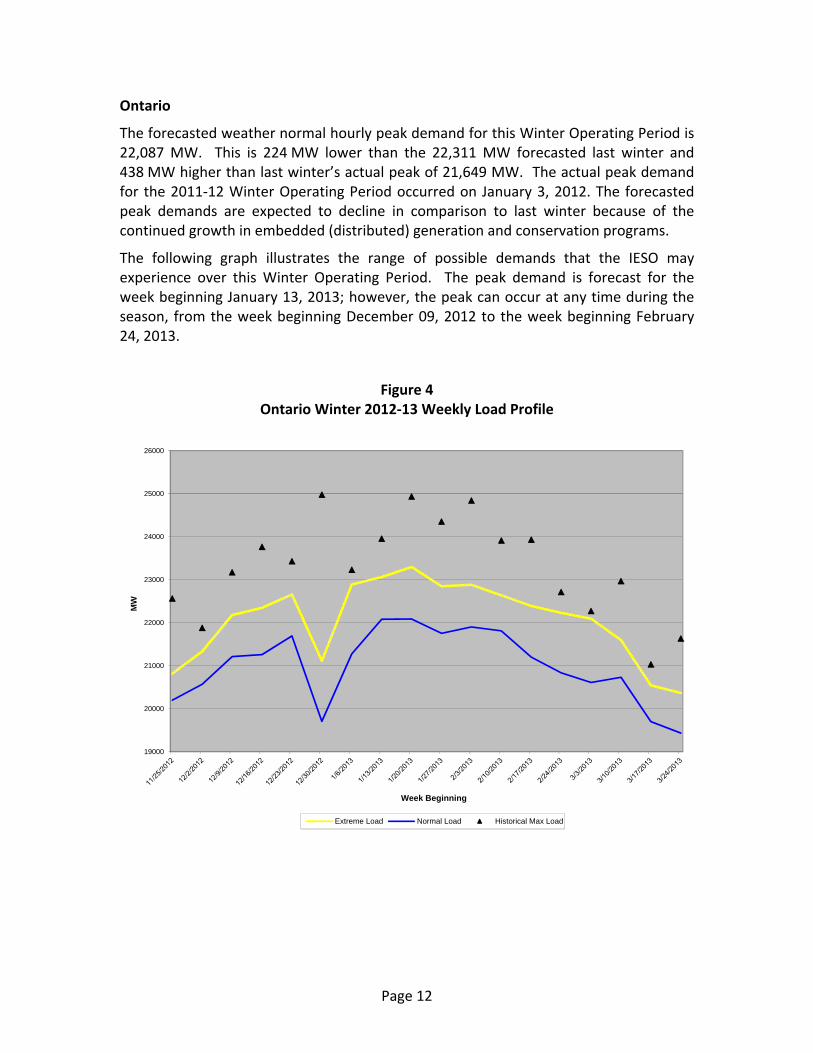
The Queacutebec Balancing Authority Area is winter peaking Hydro‐Queacutebecrsquos reference peak internal demand forecast for the 2012‐13 Winter Operating Period is 37543 MW assumed to occur during the week beginning January 13 2013 This is 390 MW higher than the 2011‐12 forecast of 37153 MW (105 percent) A slight increase in all demand sectors and particularly in the industrial sector has caused this rise in the forecast The actual internal peak demand for the 2011‐12 Winter Operating Period was 35481 MW which occurred on January 16 2012 at 8h00 EST (See ldquoPost‐Seasonal Assessment and Historical Reviewrdquo section below)
These values do not include the supply of 145 MW of load to Cornwall over the Cedars Rapids Transmission (CRT) system (154 MW with losses) This load in the Cornwall area of Ontario is tapped‐off CD11 and CD22 120 kV lines which are in a radial configuration (not connected to TransEacutenergiersquos main grid) from Les Cegravedres Generating Station in Queacutebec to Dennison in New York This load is served by Queacutebec For this reason the Cornwall load is included in Table AP‐6 Appendix I The demand forecast in Table AP‐6 for the week beginning January 13 is therefore 37697 MW
Throughout the Winter Operating Period as seen in Table AP‐6 weekly peak demand varies from 30700 MW for the week beginning November 25 to 37697 MW for the week beginning January 13 and back to 29741 MW for the week beginning March 24
The following graph demonstrates the range of potential weekly peak demands on the Queacutebec system for the 2012‐13 Winter Operating Period
Extreme Load 90 Normal Load 50 Historical Max Load
Page 15
4 Resource Adequacy
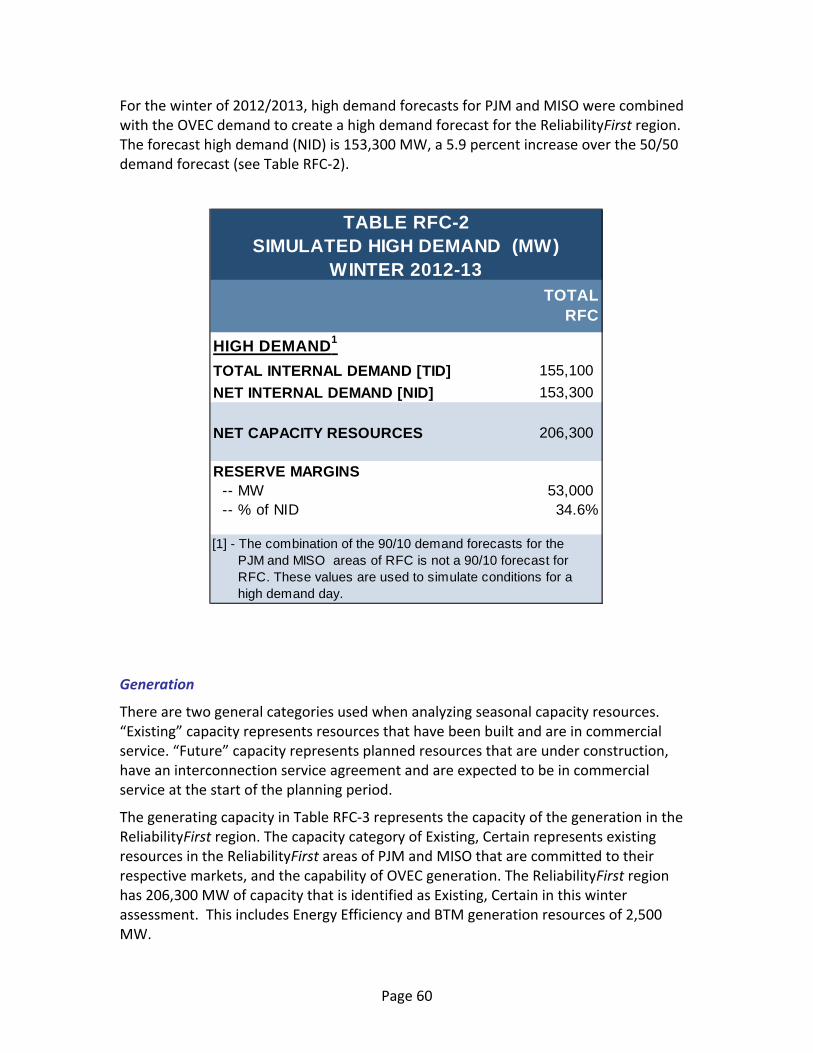
NPCC Summary for Winter 2012‐13
The following assessment of resource adequacy indicates the week with the highest coincident NPCC demand is the week beginning January 13 2013 Detailed Projected Load and Capacity Forecast Summaries specific to NPCC and each Area are included in Appendix I
Table AP‐1 Appendix I is the NPCC load and capacity summary for the 2012‐13 Winter Operating Period Appendix I Tables AP‐2 to AP‐6 contain the load and capacity summary for each NPCC Balancing Authority area Each entry in Table 1 is simply the aggregate of the corresponding entry for the five NPCC Balancing Authority Areas
Table 1 (below) summarizes the load and capacity situation for the peak week beginning January 13 2013 compared to the winter 2011‐12 forecasted peak week (week beginning January 15 2012)
Page 16
TABLE 1
Comparison of Resource Adequacy for NPCC
2012‐13 Forecast and 2011‐12 Forecast
All values in MW Forecasted week of Jan 13 2013
2012‐13 Forecast
Forecasted week of Jan 15 2012
2011‐12 Forecast
Difference
Installed Capacity 159446 156931 2515
Purchases 0 0 0
Sales 0 0 0
Total Capacity 159446 156931 2515
Coincident Demand 111860 111821 39
Demand Response 6048 6914 ‐866
MaintenanceDe‐rate 15415 16099 ‐684
Required Reserve 7558 7548 10
Unplanned Outages 10779 9736 1043
Net Margin 19881 18641 1240
This years 1240‐MW increase in Net Margin is mainly due to an increase in Installed Capacity balanced by an increase in unplanned outages The following sections detail the winter 2012‐13 capacity analysis for each Reliability Coordinator area
Page 17
The following are the assessments for each Balancing Authority Area supporting this overall resource adequacy assessment
Projected Capacity Analysis by Reliability Coordinator area
Maritimes
The Installed Capacity for the assessment period is 7423 MW This is a decrease of 263 MW when compared to last winter Since the last winter assessment the Dalhousie thermal plant (299 MW) retired in May 2012 and the Amherst wind farm (30 MW) came on line April 2012 The remaining 6 MW decrease can be attributed to minor de‐rates spread throughout the fleet It should be noted that The Point Lepreau Nuclear station (approximately 660 MW) which has been out for refurbishment since April 2008 is expected to be back in service Fall 2012
During the NPCC forecasted peak week of January 13 2013 the Maritimes Area Installed Capacity is 7423 MW When allowances for firm sales purchases known maintenance and de‐ratings required operating reserve and unplanned outages are considered the Maritimes Area is projecting a net margin of 762 MW for the NPCC peak week The net margins will range from 393 MW to 1239 MW (7 to 30 percent) over the Winter Operating Period The corresponding 2011‐12 winter Maritimes net margin range was 8 percent to 30 percent
The Maritimes Area assesses its seasonal resource adequacy in accordance with NPCC Directory 1 Appendix F Procedure for Operational Planning Coordination As such the assessment considers the regional operating reserve criteria 100 percent of the largest single contingency and 50 percent of the second largest contingency
The Maritimes area is forecasting normal hydro conditions for the 2012‐13 winter assessment period The Arearsquos hydro resources are run of the river facilities with limited reservoir storage facilities These facilities are primarily utilized as peaking units and providing operating reserve
The Maritimes Area is not relying on outside assistanceexternal resources during the Winter Operating Period
New England
With the expected weather and planned resource outages capacity within New England is forecasted to be sufficient to meet load plus operating reserve requirements during this Winter Operating Period The lowest projected net margin of 2227 MW (102 percent) is expected to occur during the week beginning February 9 2013 while the highest projected net margin of 8288 MW is expected to occur during the week beginning March 23 2013 if all assumed system conditions materialize under the reference load forecast (50 percent chance of being exceeded)
Page 18
The net margin is based on known outages an allowance for unplanned outages6 anticipated generation additions and retirements projected firm purchases and sales and the impact of expected Demand Response Programs
In addition to the allowance for unplanned outages an allowance for higher unplanned outages due to possible natural gas shortages of New England generators is included in the seven highest load weeks of January and February This allowance which has historically been assumed to be 2000 MW under the reference load forecast significantly decreases the forecasted net margins during the weeks of January 8 through February 19 With the growing concern of gas supply at risk it is anticipated this value will increase over the next few months This may require the supplemental commitment of additional resources and repositioning of existing planned generator outages
Natural gas‐fired generation represents the largest component of ISO‐NErsquos total installed capacity at 453 percent (15599 MW) followed by oil‐fired generation at 214 percent (7358 MW) nuclear generation at 136 percent (4674 MW) and coal at 69 percent (2367 MW) Hydroelectric capacity and pumped‐storage capacity make up 47 and 49 percent of the total respectively The remaining 32 percent of capacity consists of renewable resources such as wind or biomass facilities
During times of capacity deficiencies ISO New England invokes ISO‐NE Operating Procedure No 4 ndash Actions during a Capacity Deficiency (OP‐4) which includes public appeals for conservation purchasing emergency energy from the neighboring Areas interrupting real time demand response providers and implementing voltage reductions
While ISO New England expects to have adequate margins for this winter under expected weather and normal resource outages if operable capacity shortages occur due to higher than expected resource unavailability or higher than expected load conditions ISO New England may have to implement ISO‐NE OP 4 or ISO‐NE Operating Procedure No 21 ndash Action during an Energy Emergency (OP 21) OP 21 is an emergency operating procedure designed to provide additional commitment and dispatch flexibility to manage and conserve fuel‐limited supply‐side resources Since the initial coordinated data gathering reflected in this report and as a result of additional information since Hurricane Sandy New England projects that an additional 955 MW of capacity will most likely be unavailable for this winter period In addition New England also expects that reduced LNG supplies into the Northeast may also cause further reductions on New England generators during extreme cold weather conditions
6 The allowance for unplanned outages is based on historical trends and is estimated to be between 2200 MW and 3200 MW during the winter
Page 19
New York
The NYISO forecasts available installed capacity of 32050 MW for the peak week (week beginning February 3 2013 indicates the lowest net margin) demand forecast of 24832 MW Available installed capacity is the total installed capacity less known planned and predicted forced outages Accounting for purchases sales required operating reserve demand response planned and unplanned outages results in a Net Margin of 6038 MW
These resources represent all generation capability located physically within the New York Balancing Authority Area that is able to participate in the NYISO ICAP market In addition to these generation resources within the New York Balancing Authority Area generation resources external to the New York Balancing Authority Area can also participate in the NYISO ICAP market Resources within the New York Balancing Authority Area that provide firm capacity to an entity external to the New York Balancing Authority Area are not qualified to participate in the ICAP market An external ICAP supplier must declare that the amount of generation that is accepted as ICAP in NY will not be sold elsewhere The external Area in which the supplier is located has to agree that the supplier will not be recalled or curtailed to support its own loads or will treat the supplier using the same pro rata curtailment priority for resources within its Balancing Authority Area The energy that has been accepted as ICAP in NY must be demonstrated to be deliverable to the NY border The NYISO sets a limit on the amount of ICAP that can be provided by suppliers external to NY
NYISO conducts semi‐annual and monthly Installed Capacity (ICAP) auctions Based on the forecast load for 2012‐13 the ICAP requirement is 28805 MW based on a 160 percent installed reserve margin (IRM) requirement Last year the IRM requirement was 155 percent When allowances are taken for scheduled and unplanned outages (based on historical performance of 80 percent unavailable capacity) the net available resources will be 32050 MW This will be sufficient to meet the New York Balancing Authority Area load and operating reserve requirement during the peak load hours with an additional reserve margin of approximately 6038 MW expected at peak conditions
Generation retirements since the winter 2011‐12 period total 397 MW This includes Glenwood ST 04 and 05 (228 MW) Far Rockaway ST 04 (100 MW) Binghamton Cogen (48 MW) Beebee CT 13 (18 MW) and Kensico Hydro (3 MW) In addition 1099 MW of generation have been placed into protective layup This included Dunkirk units 3 and 4 (435 MW) Astoria 4 (380 MW) Astoria 2 (180 MW) and Astoria GTs 10 and 11 (32 MW each)
NYISO expects approximately 549 MW of load relief from emergency operating procedures that include internal load curtailment by the transmission owners public appeals and 5 percent system wide voltage reductions during forecast peak demand conditions Participation in the Emergency Demand Response Program (EDRP) and Special Case Resources (SCR) programs represents an additional 800 MW available through the market EDRP participants voluntarily curtail load when requested by the
Page 20
NYISO SCR participants must as part of their agreement curtail power usage usually by shutting down when asked by the NYISO
Ontario
The IESO begins the Winter Operating Period with an installed generating capacity of 36231 MW By the end of the assessment period the installed capacity will decrease by 201 MW to 36060 MW This decrease is due to the shutdown of the Atikokan coal plant in order to convert it to a biomass facility The change in capacity from last year includes the addition of four wind projects with a total capacity of 409 MW which are scheduled to be in service for and the return of two refurbished nuclear units (750 MW) during fourth quarter of 2012
The IESO expects to have adequate margins for this winter under expected weather and normal resource outages These net margins range from 7347 MW to 11416 MW The lowest projected net margin of 357 percent is expected to occur during the week beginning November 25 2012 while the highest projected net margin of 579 percent is expected to occur during the week beginning December 23 2012 if all planned outages are allowed to proceed as requested
This analysis is based on a review of known outages a projection of unplanned outages and a forecast of price responsive loads Known outages include those resources that are scheduled to be on planned outages transmission constrained resources as well as the difference between the installed capacity and the dependable capacity associated with certain resources Unplanned outages represent an estimate of the forced outages that may be experienced in this study period
The IESO forecasts the future price responsive load based on Market Participant registered data and consideration of actual market experience The net margin shown in Table AP‐5 of Appendix I does not consider that the IESO has several demand management programs which are implemented as part the IESOs Emergency Operating State Control Actions For example the IESO can institute a 3 percent or a 5 percent voltage reduction which has the effect of reducing the demand by 15 percent and 26 percent for a short period of time
The risks associated with this analysis are that demands may be heavier than expected due to extreme weather generators on outage may not return to service as scheduled or generators forced from service may be higher than projected The projected margins and control actions available to the IESO are continuously assessed Should the IESO determine that the Ontario Area is deficient the appropriate course of action will be taken Actions can include the adjustment of outage programs securing assistance via market mechanisms or the acquisition of emergency energy from other Areas as a final step
Queacutebec
Installed Capacity
Page 21
For the 2012‐13 Winter Operating Period Installed Capacity in the Queacutebec Balancing Authority Area will total 43605 MW Installed capacity for the 2011‐2012 period (February 2012) was 43394 MW Seven new wind projects totaling 760 MW will be on‐line for the winter period (see Wind Power section below) Two units at the new La Sarcelle hydro GS (100 MW) will be commissioned for the winter period A certain amount of biomass stations and small hydro is also coming online for this period The 43605 MW Installed Capacity includes Gentilly‐2s 675‐MW capacity which will be decommissioned beginning December 28 2012 Subsequent assessments will show this retirement For this assessment the retirement is accounted for through derates since the station was originally scheduled out of service for refurbishment The Net Margins are not affected
The Tracy fossil fuel GS (450 MW) which was mothballed in the last winter assessment has been permanently retired since March 2012 Moreover the La Citiegravere jet turbine GS (280 MW) has also been retired Minor capacity adjustments due to generator characteristic changes water level and temperature adjustments have been made as usual
Purchases Sales and Interruptible Load
The Queacutebec area will need to purchase about 600 MW on short term markets to ensure resource adequacy for the 2012‐2013 Winter Operating Period All capacity purchases needed to ensure resource adequacy will be backed by firm contracts for both generation and transmission
Firm sales of 253 MW to ISO‐NE are expected for the entire period
Table AP‐6 Appendix I presents 1830 MW of interruptible load and Direct Control Load management for the Queacutebec Area This is discussed further in the Demand Response Programs section below
Known MaintenanceDerates
In the Queacutebec Area in winter the Known MaintenanceDerates column of the Load and Capacity table mainly reflects hydraulic restrictions on Hydro‐Queacutebec Productionrsquos (HQP) various generating stations with a few other particular constraints on other generating stations In early December numbers show the effect of some late generator maintenance still ongoing at this time Numbers in January February and March reflect hydraulic restrictions and outages
In this assessment the 547 MW natural gas unit operated by TransCanada Energy at Beacutecancour is mothballed for 2013 Moreover as mentioned above the Gentilly‐2 Nuclear GS (675 MW) will be retired beginning December 28 2012
Page 22
When hydraulic and mechanical restrictions wind derates and the above‐mentioned outages are accounted for this brings inoperable resources for the forecasted peak week (week beginning January 13) to 4334 MW They are included in the Known MaintenanceDerates column from Table AP‐6 Appendix I
Numbers vary from 7274 MW in early December to 4213 MW in late January and 6810 MW in March Restrictions and outages are generally higher than what was posted for the last Winter Operating Period
Required Operating Reserve
Historically the required operating reserve for the Queacutebec Balancing Authority Area has been set at 1500 MW This is based on the largest single contingency on the system the loss of a Churchill Falls 230735 kV transformer typically carrying 1000 MW For this Winter Operating Period this is again the basis for the reserve calculation
The required operating reserve shown in Table AP‐6 Appendix I for the 2012‐13 Winter Operating Period is therefore set at 1500 MW
Net Margin
As mentioned in the Summary of Area Forecasts section above the winter peak is expected to materialize during the week of January 13 2013 Forecast internal peak demand is 37543 MW 154 MW is added to this amount for the Cornwall load Total peak load in Table AP‐6 of Appendix I is therefore set at 37697 MW Firm sales to neighboring systems excluding Cornwall amount to 269 MW Capacity purchases from neighboring areas amount to 581 MW When required operating reserve interruptible load and allowances for unplanned outages and load uncertainty are taken into account the Net Margin at peak load is 716 MW (19 percent based on the load forecast) In order to maintain appropriate reserve margins the Queacutebec Area has access to additional capacity or energy purchases from New York and Ontario markets through existing interconnections
The Net Margin varies from 4192 MW during December to 716 MW at peak load and back to 5615 MW during late March as can be observed in Table AP‐6 Appendix I
Recent and Anticipated Generation Resource Additions
The following Table lists the recent and anticipated generation resource additions and retirements
TABLE 2
Recent and Anticipated Generation Resource Additions and Retirements
Page 23
2011‐12 Winter through 2012‐13 Winter
Area Generation Facility Nameplate Capacity (MW)
Fuel Type In Service
Date
Maritimes Dalhousie (New Brunswick)
(Retirement) ‐299 Oil May 2012
Amherst (Nova Scotia) 30 Wind April 2012
New England
Salem Harbor Units 1 and 2 (Retirement)
‐158 Coal December 2011
Spruce Mountain Wind 20 Wind Dec 2011
Record Hill Wind 50 Wind Jan 2012
Granite Reliable Power LLC 99 Wind Feb 2012
New Haven Harbor Unit 2 ‐ 4 145 Nat
GasOil May 2012
New York Bayonne Energy Center 500 Nat
GasOil June 2012
Nine Mile Point 2 (Uprate) 168 Uranium June 2012
Marble River Wind Farm I amp II 215 Wind October 2012
Binghamton Cogen ‐48 Nat
GasOil February 2012
Beebee CT 13 ‐18 Oil March 2012
Astoria 2 ‐180 Nat Gas April 2012
Astoria 4 ‐380 OilNat Gas
April 2012
Astoria GT10 ‐32 Oil May 2012
Astoria GT11 ‐32 Oil July 2012
Glenwood ST 04 amp 05 ‐228 Nat Gas July 2012
Far Rockaway ST 04 ‐100 Nat
GasOil July 2012
Dunkirk 3 amp 4 ‐435 Bituminous
Coal September
2012
Kensico Hydro ‐3 Water October 2012
Ontario Bruce Unit 1 750 Uranium Q3 2012
Comber Wind Limited Partnership 166 Wind Q3 2012
Page 24
Pointe Aux Roches Wind 49 Wind Q3 2012
Bruce Unit 2 750 Uranium Q4 2012
Atikokan (fuel replacement) ‐211 Coal Q1 2012
Thunder Bay Condensing Turbine 40 Biomass Q1 2012
Queacutebec La Sarcelle (2 units) 100 Hydro Spring 2012
Tracy Retirement ‐450 Oil Summer 2012
La Citiegravere Retirement ‐280 Oil
Seven Wind Projects 760 Wind Fall 2012
Gentilly‐2 retirement and decommissioning
‐675 Nuclear Dec 2012
Maritimes
There is no new capacity scheduled to be put in service or any existing capacity scheduled to be retired during this winter assessment period
New England
Five wind projects and a biomass plant with nameplates totaling 253 MW are expected to go commercial in New England during the Winter Operating Period A delay in the commercial operation of these projects will not have an adverse impact on New Englandrsquos reliability
New York
New generating projects with nameplates totaling 500 MW have come into service since the 2011‐12 Winter Operating Period A new wind project Marble River Wind Farm with a nameplate of 2152 MW came into service in October 2012
Ontario
From the Winter 2011‐12 assessment to the Winter 2012‐13 assessment inclusive Ontario will have added 215 MW of wind 1500 MW of nuclear and removed 211 MW of coal generation
Queacutebec
No delays are expected for wind plant and hydro commissioning
Fuel Infrastructure by Reliability Coordinator area
The following is a self‐assessment by each Reliability Coordinator area of the expected fuel supply infrastructure
Maritimes
Page 25
The Maritimes Area does not consider potential fuel‐supply interruptions in the regional assessment The fuel supply in the Maritimes Area is very diverse and includes nuclear natural gas diesel coal oilpet coke oil (both light and residual) hydro tidal municipal waste wind and wood Fuel supplies are expected to be adequate during the projected winter period Extreme weather conditions should have no impact on the fuel supply to the Maritimes Area Responsibility for fuel switching plans lies with the generation owner All applicable units have the required procedures The only generator units with fuel‐switching capability are at Tuftrsquos Cove Nova Scotia (natural gas or oil) and Coleson Cove unit 3 New Brunswick (oil or oilpetcoke) and totaling 645 MW Each facility maintains an adequate supply of its primary fuel
New England
The majority of power generators within New England are fueled by natural gas followed by oil nuclear coal hydro and renewable resources In 2011 gas‐fired generation produced over 51 percent of the regionrsquos electric energy production New Englandrsquos heavy reliance on natural gas to produce electricity has produced some winter reliability concerns in the past primarily due to the direct competition with the core natural gas markets for both gas supply and regional transportation during extreme winter weather conditions In addition to discussing the winter outlook with regional stakeholders During extremely cold winter days there may be fuel supply restrictions on natural gas‐fired generating units due to regional gas pipelines invoking delivery prioritization amongst their entitlement holders Such conditions routinely occur resulting in temporary reductions in gas‐fired capacity These temporary reductions to operable capacity are reflected within ISO‐NErsquos forced outage assumptions Concerns have increased for the 2012 ndash 2013 winter capacity period as most of gas turbine generators do not have firm gas supply or transportation contracts On days of extreme winter temperatures single‐fuel natural gas‐fired capacity is at risk of being unavailable due to fuel constraints ISO‐NE monitors these potential situations and mitigates their effects by dispatching non‐gas‐fired resources to replenish these temporary forced outages ISO‐NE gauges the impacts that fuel supply disruptions could have upon system or subregional reliability ISO‐NE continuously monitors the regional natural gas pipeline systems via their Electronic Bulletin Board (EBB) postings This ensures that emerging gas supply or delivery issues can be incorporated into and mitigated within the daily or day‐ahead operating plans Should natural gas issues arise ISO‐NE has predefined communication protocols in place with the Gas Control Centers of both regional pipelines and local gas distribution companies (LDCs) in order to quickly understand the emerging situation and subsequently implement mitigation measures ISO‐NE has two procedures that can also be invoked to mitigate regional fuel supply emergencies impacting the power generation sector
Page 26
1) ISO‐NErsquos Operating Procedure No 21 ‐ Action During an Energy Emergency (OP 21) is designed to help mitigate the impacts on bulk power system reliability resulting from the loss of operable capacity due to regional fuel supply deficiencies that can occur anytime during the year7 Fuel supply deficiencies are the temporary or prolonged disruption to regional fuel supply chains for coal natural gas LNG and heavy and light fuel oil
2) ISO‐NErsquos Market Rule No 1 ndash Appendix H ndash Operations during Cold Weather
Conditions is a procedure that is designed to help mitigate the impacts on bulk power system reliability resulting from the loss of operable capacity due to the combined effects from extreme cold winter weather or constraints with regional natural gas supplies or deliveries8
The ongoing reliability concern for this winter involves the reliability implications to the electric power system resulting from very extreme winter weather or a ldquoforce majeurerdquo type event on the regional natural gas system As noted by the events that occurred in the southwest during February 2011 extreme winter weather has the capability to impact the availability of generation by inducing cold weather‐related outages Although the majority of New Englandrsquos generation fleet took various remedial actions to prepare their stations after the Cold Snap of January 2004 portions of the fleet may still be susceptible to outages induced by extreme winter weather In addition an extreme contingency located upstream or on the regional natural gas grid although temporary in nature could create considerable regional gas supply shortages which would primarily affect the regional gas‐fired generation fleet Either type of event could quickly diminish the capacity margins projected for the winter which would require ISO‐NE to implement Emergency Operating Procedures (EOPs) to mitigate the impacts from these events Since the initial coordinated data gathering reflected in this report and as a result of additional information since Hurricane Sandy New England projects that an additional 1200 MW of capacity will most likely be unavailable for this winter period In addition New England also expects that reduced LNG supplies into the Northeast may also cause further reductions on New England generators during extreme cold weather conditions
New York
Traditionally New York generation mix has been dependent on fossil fuels for the largest portion of the installed capacity Recent capacity additions or enhancements
7 Operating Procedure No 21 is located on the ISOrsquos web site at httpwwwiso-necomrules_procedsoperatingisoneop21indexhtml 8 Appendix H of Market Rule No 1 is located at httpwwwiso-necomregulatorytariffsect_3mr1_append-hpdf
Page 27
now available use natural gas as the primary fuel While some existing generators in southeastern New York have ldquodual‐fuelrdquo capability use of residual or distillate oil as an alternate may be limited by environmental regulations Adequate supplies of all fuel types are expected to be available for the winter period
Ontario
The majority of generation facilities operating on the IESO‐controlled grid are represented by three basic types of fuel ‐ Fossil Nuclear and Hydroelectric At the time of this assessment OilGas generation exceeded coal‐fired fossil generation by more than double This trend is expected to continue as the retirement of four coal‐fired units on October 1 2010 began the move towards eliminating coal‐fired generation in Ontario by 2014 The portion of oil fired fossil generation remains relatively unchanged Generation from biomass technologies is a very small percentage of Ontariorsquos generation mix Lennox generating station with a capacity of 2000 MW is the only significant dual‐fuel facility which can be fueled by oil or gas
During the winter months shipping capability is limited by ice and weather conditions on the Great Lakes This is important because fuel for a portion of the coal‐fired resources is delivered by boat via the Great Lakes While these conditions may prevent delivery for extended periods of time all sites relying on this delivery mechanism stockpile the fuel
As in other Areas natural gas supplies for electricity generation in Ontario also compete with space heating requirements Natural gas supplies and delivery infrastructures are expected to be adequate for the Winter Operating Period The IESO and the gas distribution companies in Ontario have an established protocol whereby the gas distribution companies inform the IESO of situations that could affect gas supplies into Ontario
At the time of this report the IESO has not been made aware of any fuel supply concerns It is therefore expected that adequate supplies of all fuels will be available for the Winter Operating Period
Queacutebec
About 93 percent of the Queacutebec Balancing Authority Arearsquos generating capacity is made up of hydro stations located on geographically dispersed river systems
Hydro generating plants are classified into three categories run‐of‐river plants annual reservoir and multi‐annual reservoir plants Low water inflows are coped with in different ways for each category
Run‐of‐river hydro plants relatively constant hydraulic restrictions from year to year
Annual reservoir hydro plants during a year with normal water inflows these reservoirs are almost full at the beginning of winter If annual water inflow is low hydraulic restrictions increase
Page 28
Multi‐annual reservoir hydro plants the target level for multi‐annual reservoirs is approximately 50 percent to 60 percent full in order to compensate or store inflows during periods of below or above normal water inflows Hydraulic restrictions increase during a period of low inflows
After a severe drought having a 2 percent probability of occurrence hydro generation on the system would suffer additional hydraulic restrictions of about 500 MW above the ldquonormal conditionsrdquo restrictions Stream flows storage levels and snow cover are constantly being monitored allowing Hydro‐Queacutebec to plan margins to cope with drought periods
To assess its energy reliability Hydro‐Queacutebec has developed an energy criterion stating that sufficient resources should be available to run through sequences of two or four years of low inflows having a 2 percent probability of occurrence Hydro‐Queacutebec must demonstrate its ability to meet this criterion three times a year to the Queacutebec Energy Board The last assessment can be found on the Queacutebec Energy Board web site9
To smooth out the effects of low inflow cycles different means have been identified
Reduction of the energy stock in reservoirs to a minimum of 10 TWh beginning in May
External non‐firm energy sales reductions
Off‐peak purchases from neighboring areas
Wind Capacity Analysis by Reliability Coordinator area
As seen in the wind generation analyses below there is relatively little wind generation on the system For the 2012‐13 Winter Operating Period installed wind capacity accounts for approximately 37 percent of the total NPCC installed capacity After applying the derate factor the amount of wind generation counted towards capacity is only approximately 06 percent Reliability Coordinator areas have different ways of accounting for this generation The Reliability Coordinator areas are still developing their knowledge regarding operation of wind generation in terms of capacity forecasting and utilization factor
The following table illustrates the nameplate wind capacity in NPCC for the Winter Operating Period and indicates the capacity derate method used Some Reliability Coordinator areas include the entire nameplate capacity in the Installed Capacity
section of the Load and Capacity Tables and use a derate value in the Known MaintenanceDerates section to account for the fact that some of the capacity will not be online at the time of peak Others simply reduce the nameplate capacity by a factor and include this reduced capacity directly in the Installed Capacity section of the Load and Capacity Tables
Page 30
Table 3 NPCC Wind Capacity and Derating Methodology
Reliability Coordinator
area
Nameplate Capacity
2012 (MW)
Capacity After Applied
Derating Factor (MW)
Derating Methodology Used
Maritimes 816 168 Derate factors done by sub‐areas Nova Scotia 100 percent Based on median historical hourly production values from the previous three years for each individual wind facility the following areas use New Brunswick averages winter 71 percent summer 75 percent PEI averages 57 percent winter summer 70 percent and Northern Maine winter and summer 70 percent
New England 581 131 Based on the average of the median net output during the summer or winter reliability hours during the previous year The winter reliability hours are the hours ending 1800 through 1900 each day of the winter period (January through May and October through December) and all winter period hours in which the ISO has declared a shortage event
New York 1578 473 Uses 70 percent derate factor for the winter season
Ontario 1727 124 Uses seasonal contribution factors based on median historical hourly production values from September 2006 to the present 928 percent derate for June‐August 814 percent derate for March‐May and Sept‐November 722 percent derate for Dec‐Feb
Queacutebec 1817 513 Weather data covering the period between 1971 and 2006 were used to re‐simulate coincident hourly load and
Page 31
wind generation in order to estimate the derate factor for winter peak periods which is evaluated at 70 percent
Total 6519 1409
Maritimes
The Maritimes Area currently has approximately 816 MW of nameplate installed wind capacity After applying derates the current wind capacity is 168 MW Since the winter 2011‐12 period there has been 30 MW of new wind generation added There has also been some wind projects that were either postponed or cancelled that were scheduled to come on line this summer This would account for the difference of what was reported for nameplate wind capacity of 846 MW during the summer 2012 assessment period as compared to the 816 MW reported for this winter assessment period
Wind projected capacity is derated to its demonstrated average output for each summer or winter capability period In New Brunswick Prince Edward Island and NMISA each individually wind facility that has been in production for an extended period of time (three years or more) a derated monthly average is calculated using metering data from previous years over each seasonal assessment period Nova Scotia does not include any wind facilities towards their installed capacity (100 percent derated)
The Maritimes Area capacity is the mathematical sum of the sub‐areas (New Brunswick Nova Scotia Prince Edward Island and the area served by the Northern Maine Independent System Operator) Each sub‐arearsquos wind generator totals are shown below with their nameplate and derate values
Table 4 Maritimes Wind Nameplate Capacity
Maritimes Sub‐Areas Nameplate
Capacity 2013 (MW)
New Brunswick (Winter Derate) 294
Prince Edward Island (Winter Derate) 164
Nova Scotia (On‐Peak Capacity Factor) 316
NMISA (Average yearly Derate) 42
TOTALS 816
New England
The total nameplate capability of wind generators in New England is 581 MW of which 802 MW is in the 2012 ndash 2013 Forward Capacity Market (FCM) 2012‐13 commitment
Page 32
period This equates to approximately 14 percent having a capacity supply obligation and is counted toward installed capacity in New Englandrsquos load and capacity calculations (Table 3 Appendix I)
Table 5 New England Wind Nameplate Capacity
Name Nameplate Capacity (MW)
Berkshire Wind Power Project 15
Granite Reliable Power LLC 99
Kibby Wind Power 132
Lempster Wind 24
Record Hill Wind 50
Rollins Wind Plant 60
Sheffield Wind Plant 40
Spruce Mountain Wind 20
Stetson II Wind Farm 26
Stetson Wind Farm 57
Total Wind Projects lt10 MW 58
Total 581
In addition five new wind projects are expected to go commercial by the end of the year Bull Hill Georgia Mountain Community Wind Groton Wind Hoosac Wind and Kingdom Community Wind with a combined nameplate capacity of 185 MW
New York
New York currently has 1578 nameplate MW of wind capacity Wind is applied at 100 of nameplate capability to installed capacity However New York applies a 70 percent
Page 33
derate factor for wind generation in the winter operating period resulting in 4734 MW derated capacity
A new 215 MW nameplate wind project Marble River Wind Farm I amp II came into service in October 2012 It is interconnected at a new substation Patnode on the NYSEG 230 kV system between Willis and Plattsburgh in northern NY
Table 6 New York Wind Nameplate Capacity
Name Nameplate
Capacity (MW)
Altona Wind Power 98
Bliss Wind Power 101
Canandaigua Wind Power 125
Chateaugay Wind Power 107
Clinton Wind Power 101
Ellenburg Wind Power 81
Hardscrabble Wind 74
High Sheldon Wind Farm 112
Howard Wind 51
Madison Wind Power 12
Maple Ridge Wind 1 231
Maple Ridge Wind 2 91
Marble River Wind Farm I 83
Marble River Wind Farm II 132
Munnsville Wind Power 35
Steel Winds 20
Wethersfield Wind Power 126
Total 1578
Ontario
Wind generator output varies significantly hour‐to‐hour or day‐to‐day However over longer periods wind generation shows more consistent production The IESO forecasts wind capacity by using seasonal contribution factors based on median historical hourly production values from September 2006 to the present These factors are updated twice a year and eventually will be calculated using a rolling 10 year data set
Page 34
The seasonal wind contribution factors currently in use by the IESO are 278 percent for winter (December January and February) 72 percent for summer (June July August) and 186 percent for shoulder (remaining months)
The IESO presently has 1727 MW of wind capacity Below are the currently connected wind generators
Table 7 Ontario Wind Nameplate Capacity
Wind Farm Nameplate
Capacity 2012 (MW)
Wind Farm Nameplate
Capacity 2012 (MW)
Amaranth 200 Port Alma 202
Comber 166 Port Burwell 99
Dillon 78 Prince Farm 189
Gosfield 50 Ripley South 76
Greenwhich 99 Spence 99
Kingsbridge 40 Underwood 182
Pointe Aux Roche
49 Wolfe Island 198
Total 1727
Only 32 percent of nameplate rating is used for wind capacity forecasts for the winter period this equates to 553 MW The geographic distribution of Ontario wind resources mitigates some of the risk associated with wind capacity variability
Queacutebec
New wind capacity totaling 760 MW distributed between seven projects will be commissioned for this Winter Operating Period Wind capacity will total 1817 MW
The following table shows wind plants in‐service for the 2012‐13 Winter Operating Period
Table 8 Queacutebec Wind Nameplate Capacity
Page 35
Wind Farm Nameplate Capacity
2012 (MW)
Le Nordais Cap‐Chat 57
Le Nordais Matane 43
Mont‐Copper 54
Mont‐Miller 54
TechnoCentre 4
Baie‐des‐Sables 110
Anse‐agrave‐Valleau 101
Carleton 110
St‐UlricSt‐Leacuteandre 128
Mont‐Louis 101
Montagne‐Segraveche 59
Gros‐Morne Phase 1 101
Le Plateau 139
Total 1057
New for Winter 2012‐2013
Lac Alfred Phase 1 150
New Richmond 68
St‐Robert‐Bellarmin 80
Monteacutereacutegie 101
De lEacuterable 100
Gros‐Morne Phase 2 111
Massif‐du‐Sud 150
Total New 760
Grand Total 1817
For resource adequacy studies pertaining to Winter Operating Periods wind capacity is derated by 70 percent This is based on detailed wind capacity credit evaluations which have been presented to the Reacutegie de leacutenergie du Queacutebec (Queacutebec Energy Board)
In this report 1304 MW is included in the Known MaintenanceDerates column in Table AP‐6 of Appendix I to account for wind derates
Page 36
In addition to the present 1817 MW wind generation capacity another 1500 MW are planned to come into service gradually until 2015
Page 37
5 Transmission Adequacy
Regional Transmission studies specifically indentifying interface transfer capabilities in NPCC are not normally conducted However NPCC uses the results developed in each of the NPCC Reliability Coordinator areas and compiles them for all major interfaces and for significant load areas (Appendix III) Recognizing this the CO‐12 working group reviewed the Normal Transfer Capabilities (NTC) and the Feasible Transfer Capabilities (FTC) between the Balancing Authority Areas of NPCC under peak demand configurations
The following is a transmission adequacy assessment from the perspective of the ability to support energy transfers for the differing levels Inter‐Region Inter‐Area and Intra‐Area
Table 9 NPCC ndash Transmission Additions for 2012‐13 Winter
NPCC Sub‐Area
Transmission Project Voltage (kV) In Service
Maritimes None
New England
345115 kV autotransformer at Deerfield Substation New Hampshire
New York Gowanus Straight to Ring Bus 345 Summer 2012
Astoria Annex‐Astoria East w 345138 kV
Transformer and PAR 345138 Summer 2012
Oakdale 3236 Tower Separation 345 Summer 2012
Various Switched Shunt Capacitor Bank Additions
(626 MVAr) Various Summer 2013
Ontario BP76
Return to service 230 December 2012
Two new Bruce‐Milton circuits 500 Spring 2012
Queacutebec Wind generation integration (seven projects) 315‐230‐120 Fall 2012
Limoilou satellite substation 23025 Fall 2012
Anse‐Pleureuse satellite substation 23025 Fall 2012
Neubois satellite substation 12025 Fall 2012
Beacutecancour subsystem reinforcement 230120 Fall 2012
Page 38
Inter‐Regional Transmission Adequacy
Phase angle regulators (PARs) are installed on the Ontario‐Michigan interconnection at Lambton TS (L4D and L51D) and Keith (J5D) on the Ontario side and at Bunce Creek TS (B3N) in Michigan representing the four interconnections with Michigan Final regulatory approvals have been received permitting operation of these facilities Three PARs were placed in service prior to summer 2012 and are being used to manage circulation power flows around Lake Erie as well as contingencies
The MISO and IESO have indicated that operation of the Phase Angle Regulators will assist in the management of system congestion and control of circulating flows
Inter‐Area Transmission Adequacy
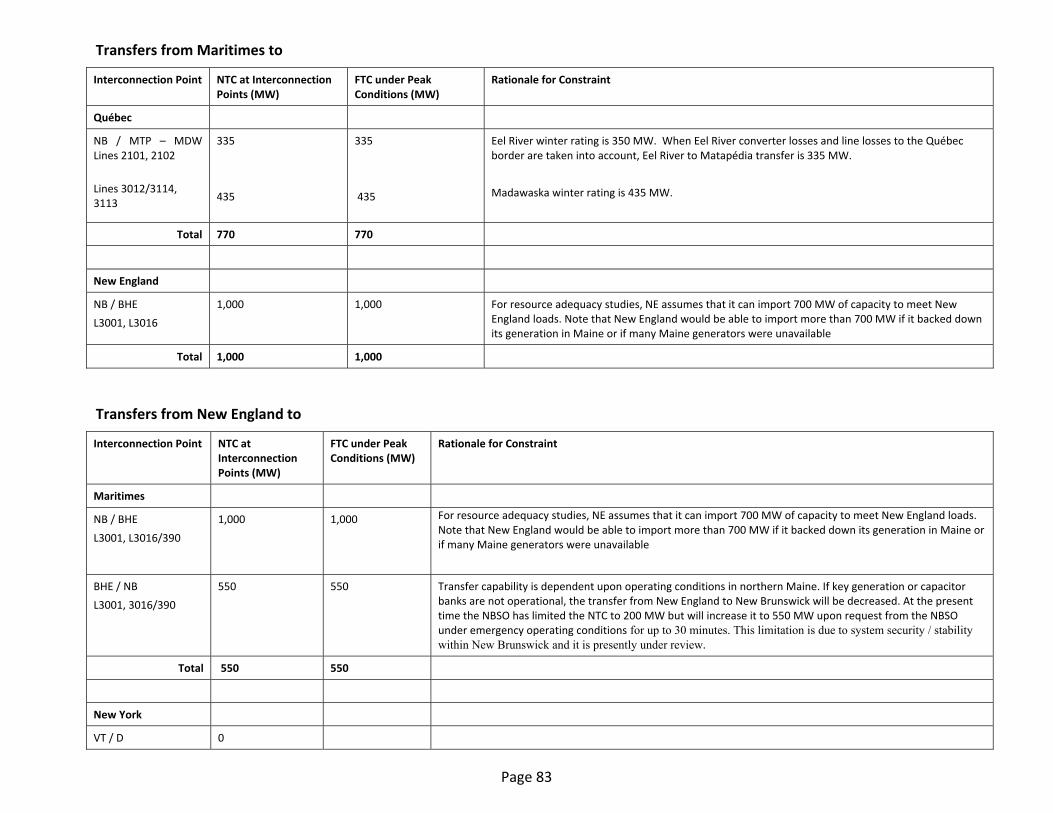
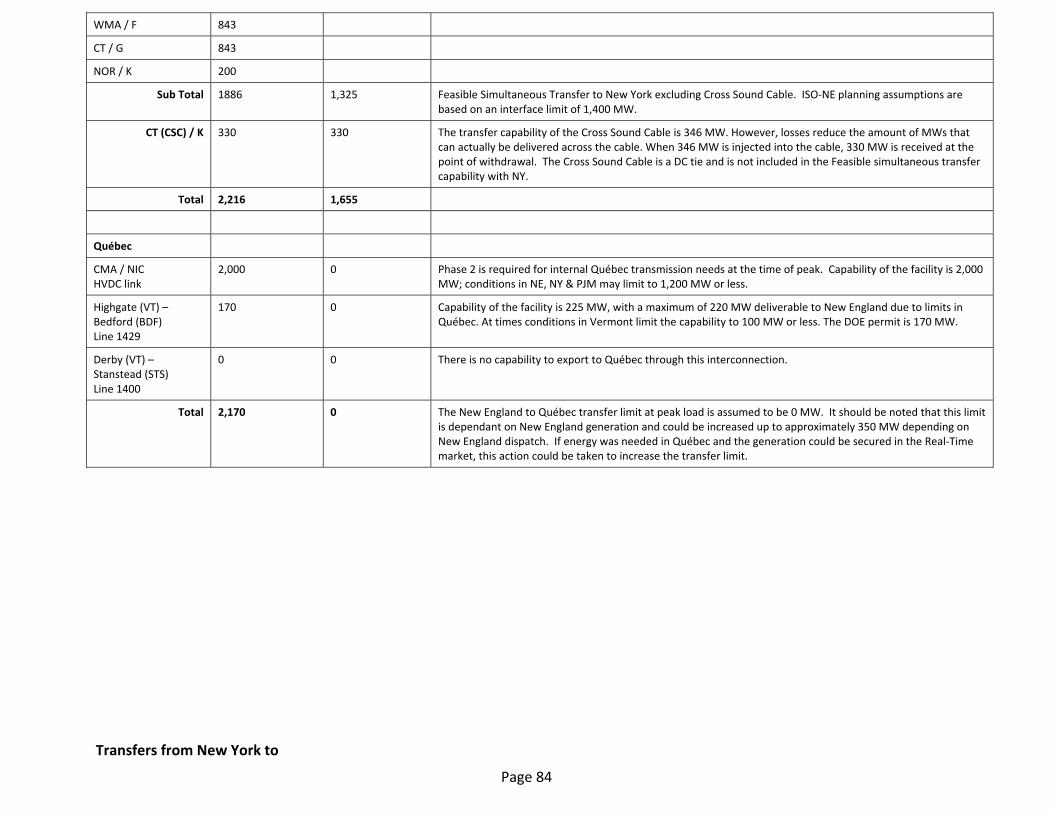
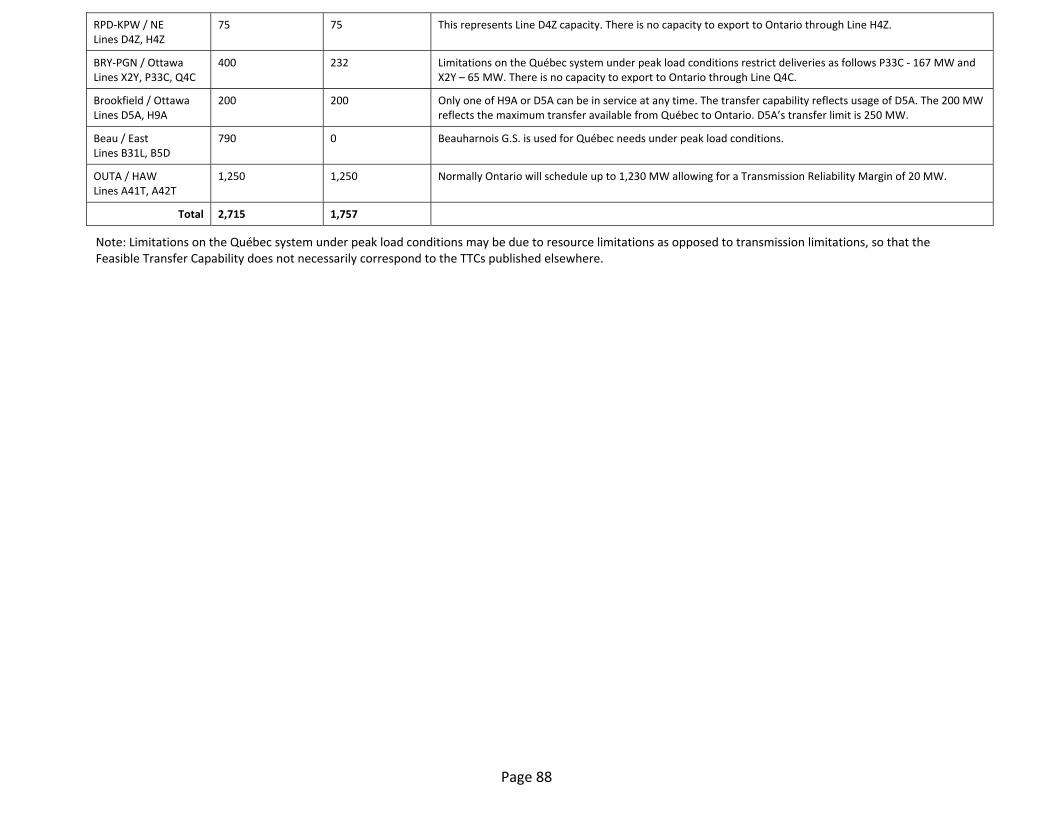
The tables in Appendix III provide a summary of the normal transfer capabilities (NTC) on the interfaces between NPCC Balancing Authority Areas and for some specific load zone areas They also indicate the corresponding feasible transfer capabilities (FTC) under peak conditions based on internal limitations or other factors and indicate the rationale behind reductions from the normal transfer capability
New York ndash Ontario intertie BP76 which has been out of service since January 2008 will remain out‐of‐service until the failed voltage regulator has been replaced at the end of 2012
Page 39
Intra‐Area Transmission Adequacy Assessment
Maritimes
The Maritimes bulk transmission system is projected to be adequate to supply the demand requirements for the Winter Operating Period Part of the TTC calculation with HQ is based on the ability to transfer radial loads onto the HQ system The radial load number will be calculated monthly and HQ will be notified of the changes (See Appendix III)
New England
The 2012 Regional System Plan (RSP12) outlines a number of the ongoing transmission planning studies and projects that are taking place The report continues to describe the various areas of the region where transmission projects are needed for reliability ISO‐NE continually monitors transmission facility additions and coordinates outages in order to mitigate any possible reliability risks that may be associated with changes in the transmission system
New bulk power transmission facilities have been placed in service in New England since the 2011‐12 winter period Some of the more significant improvements include a new 345115 kV transformer in the Deerfield substation located in Southern New Hampshire This is a transmission system improvement which will increase interface limits and reduce the severity of a double circuit contingency
In addition two 345 kV reactors at the Coolidge substation in Southern Vermont have been energized These improvements provide additional voltage support to the area to address various thermal and voltage issues as well as support transfers to and from New York Final improvements were also applied to the Berry Street substation which reinforce and improve import limits into the Rhode Island area
Facilities that are expected to be in service for the upcoming winter include a new 345 kV transmission line from Orrington to a new substation named Albion Road and a new 345 kV transmission line from Surowiec to a new substation named Larrabee Road both of which are part of the Maine Power Reliability Program (MPRP) a new 345 kV transmission line from Ludlow to Agawam which is part of the Greater Springfield Reliability Project (GSRP) and new and existing substations with multiple 115 kV line improvements throughout the region
New York
Several transmission modifications worth noting have occurred since the 2011‐12 winter operating period or will be completed by summer 2013 In summer 2012 the Gowanus 345 kV bus was converted to a full ring bus to accommodate the interconnection of the Bayonne Energy Center Previously it was a straight bus configuration There was also the addition of a 345138 kV transformer PAR and cable between the Astoria Annex 345 kV bus and the Astoria East 138 kV bus
Page 40
A new substation Patnode on the NYSEG 230 kV system between Willis and Plattsburgh in northern NY was added to accommodate the interconnection of the Marble River Wind Farm
Two circuits from Oakdale formed a double circuit tower contingency In summer 2012 the Oakdale‐Fraser 32 and Oakdale‐Clarks Corners 36 lines were separated to eliminate this contingency
The Beck‐Packard BP76 line is expected to return to service in December 2012
By summer 2013 approximately 626 MVAr of switched shunt capacitors will be added to the system funded by DOE smart grid grants
The New Bridge 345138 kV transformer bank 2 will be out‐of‐service for the winter 2012‐13 operating period
Ontario
The system enhancements planned for this winter include the return to service of the Beck‐Packard BP76 line between Ontario and New York expected in December 2012 Phase angle regulators (PARs) are now installed on all four of the Michigan ndash Ontario interconnections
Two new 500 kV circuits from Bruce NGS to Milton SS were placed in service in May 2012 This work at the Bruce switchyards was done to extend a 500 kV bus and complete the addition of terminal breakers for the two new Bruce minus Milton circuits
Queacutebec
No major 735‐kV transmission project is being commissioned for the 2012‐13 Winter Operating Period As shown in Table 9 above wind generation integration at several voltage levels is ongoing a few satellite (distribution) substations are being commissioned and the Beacutecancour 230120‐kV subsystem is being upgraded All these projects are presently on schedule
As usual no transmission line outages are expected and no major maintenance is scheduled during the 2012‐13 Winter Operating Period
Synchronous Condenser CS23 at Duvernay substation in the Montreacuteal area which has been out of service since June 2008 due to a major transformer fault will be back in service for the 2012‐13 Winter Operating Period This will enhance transmission capability on the Southern Interface in the load area of the system
Transmission capability for the peak period is adequate to carry the net internal demand plus the firm capacity sales and operating reserve Moreover enough transmission capability remains on the system to carry additional resources that would be called upon if load was greater than the forecast
Page 41
TransEacutenergie continually performs load flow and stability studies to assess system reliability and transfer capabilities on all its internal interfaces A peak load study is performed annually integrating new generation new transmission and the latest demand forecasts as well as any unusual operating conditions such as generation and transmission outages
Extreme cold weather conditions result in a large load pickup over the normal weather forecast and are included in TransEacutenergiersquos Transmission Design Criteria When designing the system both steady state and stability assessments are made with winter scenarios involving demands 4000 MW higher than the normal weather peak demand forecast This is equivalent to 111 percent of peak winter demand Hydro‐Queacutebec Distribution (the load serving entity) is responsible for the procurement of resources to feed this exceptional demand
Voltage support in the southern part of the system (load area) is a concern during Winter Operating Periods especially during episodes of heavy load TransEacutenergie has an agreement with Hydro‐Queacutebec Production (the largest Generator Owner on the system) that maintenance on generating units will be terminated by December 1 and that all possible generation will be available This along with yearly testing of reactive capability of the generators ensures maximum availability of both active and reactive power The end of maintenance on the high voltage transmission system is also targeted for December 1 Also TransEacutenergie has a target for the availability of both high voltage and low voltage capacitor banks No more than 400 Mvar of high voltage banks should be unavailable during the Winter Operating Period The target for the low voltage banks is 90 percent availability This ensures adequate voltage support in the load area of the system
Page 42
6 Operational Readiness for 2012‐13
Demand Response Programs
Each Reliability Coordinator area utilizes various methods of demand management The following is a summary of each arearsquos current demand response programs available for the Winter Operating Period
Maritimes
Interruptible and dispatchable loads are forecast on a weekly basis and range between 144 MW and 198 MW They values can be found in Appendix I Table AP‐2 and are available for use when corrective action is required within the Area
New England
During times of capacity deficiencies ISO New England declares ISO New England Operating Procedure No 4 (OP 4) ndash Actions during a Capacity Deficiency That includes public appeals for conservation purchasing emergency energy from the neighboring Balancing Authority Areas activating demand response resources and implementing voltage reductions
In the Load and Capacity Table for New England (Table AP‐3 Appendix I) 957 MW out of a total of 1920 MW of demand response resources are assumed available during OP 4 conditions for the 2012‐13 Winter Operating Period In addition to the active demand response resources there is a total of 963 MW of energy efficiency with FCM obligations
New York
Participation in the Emergency Demand Response Program (EDRP) and Special Case Resources (SCR) programs represents an additional 800 MW available through the market for reliability The NYISO Emergency Demand Response Program (EDRP) and Special Case Resources (SCR) program may be deployed without time or call frequency limitations in any Operating Period in which the resources are enrolled EDRP participants voluntarily curtail load when requested by the NYISO when an operating reserves deficiency or major emergency exists SCR participants are required to respond when deployed by the NYISO for reliability
The New York Independent System Operator Inc (NYISO) offers two demand response programs that support reliability the Emergency Demand Response Program10 (EDRP) and the Installed Capacity‐Special Case Resource Program (ICAPSCR)
EDRP provides demand resources with the opportunity to earn the greater of $500MWh or the prevailing locational‐based marginal price (LBMP) for energy consumption curtailments provided when the NYISO calls on the resource There are no
10 Terms in upper case not defined herein have the meaning ascribed to them in the NYISOrsquos Market Administration and Control Area Services Tariff
Page 43
consequences for enrolled EDRP resources that fail to curtail Resources participate in EDRP through Curtailment Service Providers (CSPs) which serve as the interface between the NYISO and resources
The ICAPSCR program allows demand resources that meet certification requirements to offer Unforced Capacity (UCAP) to Load Serving Entities (LSEs) Special Case Resources can participate in the Installed Capacity (ICAP) Market just like any other ICAP Resource however Special Case Resources participate through Responsible Interface Parties which serve as the interface between the NYISO and resources Resources are obligated to curtail when called upon to do so with two or more hours notice provided the NYISO notify the Responsible Interface Party a day ahead of the possibility of such a call In addition ICAPSCR resources are subject to testing each Capability Period to verify that they can fulfill their curtailment requirement Failure to curtail could result in penalties administered under the ICAP program Curtailments are called by the NYISO when reserve shortages are anticipated Resources may register for either EDRP or ICAPSCR but not both Special Case Resources are eligible for an energy payment during an event using the same performance calculation as EDRP resources
The Targeted Demand Response Program (TDRP) introduced in July 2007 is a NYISO reliability program that deploys existing EDRP and SCR resources on a voluntary basis at the request of a Transmission Owner in targeted subzones to solve local reliability problems The TDRP program is currently available in Zone J New York City
The Day Ahead Demand Response Program (DADRP) program provides demand resources with an opportunity to offer their load curtailment capability into the Day‐Ahead Market (ldquoDAMrdquo) as an energy resource Resources submit offers by 500 am specifying the hours and amount of load curtailment they are offering for the next day and the price at which they are willing to curtail Prior to November 1 2004 the minimum offer price was $50MWh The offer floor price currently is $75MWh Offers are structured like those of generation resources DADRP program resources may specify minimum and maximum run times and the hours that they are available They are eligible for Bid Production Cost guarantee payments to make up for any difference between the market price received and their block offer price across the day Load scheduled in the DAM is obligated to curtail the next day Failure to curtail results in the imposition of a penalty for each such hour equal to the product of the MW curtailment shortfall and the greater of the corresponding DAM or Real‐Time Market price of energy
The Demand Side Ancillary Services Program (DSASP) introduced in June 2008 provides demand resources that meet telemetry and other qualification requirements an opportunity to offer their load curtailment capability into the DAM andor Real‐Time Market to provide Operating Reserves and Regulation Service DSASP resources must qualify to provide Operating Reserves or Regulation Service through standard resource testing requirements Offers are submitted through the same process as generation resources Resources submit offers by 500 am specifying the ancillary service they are offering (Spinning or Non‐Synchronous Reserves andor Regulation if qualified) along
Page 44
with the hours and amount of load curtailment for the next day and the price at which they are willing to curtail Real‐time offers may be made up to 75 minutes before the hour of the offer Although DSASP resources are not scheduled for energy in the DAM they are required to submit energy offers which are used in the co‐optimization algorithm for dispatching operating reserve resources Similar to the DADRP the energy offer floor price is currently $75MWh DSASP resources are not paid for energy They are eligible for a Day‐Ahead Margin Assurance Payment to make up for any balancing difference between their Day‐Ahead Reserve or Regulation schedule and Real‐Time dispatch subject to their performance for the scheduled service Performance indices are calculated on an interval basis for both Reserves and Regulation Payment is adjusted by the performance index for the service provided
Ontario
A sizeable number of loads within the province bid their load into the market and are responsive to price and to dispatch instructions Other loads have been contracted by the Ontario Power Authority to provide demand response under tight supply conditions The forecast amount of these demand measures has been steadily increasing and now amounts to approximately 1200 MW in total of which 773 MW is categorized as interruptible
Queacutebec
There are two interruptible load programs and a voltage reduction program implemented in the Queacutebec Control Area
For winter 2012‐13 the load subscribing to the Interruptible programs totals about 2100 MW These programs have operating constraints which are accounted for through a diversity factor for resource assessment purposes The total interruptible load posted is therefore 1580 MW Follow‐up of the interruptible load programs is done by compiling differences between the customersrsquo real consumption and the customers anticipated hourly load profile at the time the program is scheduled to be in effect These programs have been in operation for a number of years and according to the records customer response is highly reliable
Hydro‐Queacutebec Distribution and TransEacutenergie have developed a voltage reduction program at a large number of distribution substations This is included in the ldquoDemand Responserdquo column in Table AP‐6 Appendix I Table AP‐6 therefore presents 1830 MW of load which consists of interruptible load (1580 MW) plus the voltage reduction program (250 MW)
On an operations horizon if peak demands are higher than expected a number of measures are available to the System Control personnel Operating Instruction I‐001 lists such measures These vary from limitations on non guaranteed wheel through and export transactions operation of hydro generating units at their near‐maximum output (away from optimal efficiency but still allowing for reserves) use of import contracts
Page 45
with neighbouring systems starting up of thermal peaking units use of interruptible load programs and eventually reducing 30‐minute reserve and stability reserve applying voltage reduction making public appeals and ultimately using cyclic load shedding to re‐establish reserves
Page 46
7 Post‐Seasonal Assessment and Historical Review
Winter 2011‐12 Post‐Seasonal Assessment
NPCC
The sections below describe briefly each Balancing Authority Arearsquos 2011‐12 winter operational experience Total NPCC non‐coincident demand was 108249 MW for the period
Maritimes
The forecasted peak for winter 2011‐12 was 5552 MW
The actual peak demand of 4963 MW occurred February 13 2012
Control actions were not required
New England
The forecasted peak for winter 2011‐12 was 21495 MW
The actual peak demand of 19926 MW occurred January 4th 2012
Implementation of Operating Procedure 4 (OP 4) was not required during the winter operating period
New York
The forecasted peak for winter 2011‐12 was 24533 MW
The actual peak demand of 23901 MW occurred on January 3rd 2012
No particular issues to report
Ontario
The forecasted peak for winter 2011‐12 was 22311 MW
The actual peak demand of 21649 MW occurred on January 3rd 2012 There were no issues with meeting this level of demand
Queacutebec
The internal demand forecast was 37153 MW for the 2011‐12 Winter Operating Period
Page 47
Actual peak demand occurred on January 16 2012 at 8h00 EST Internal demand was 35481 MW At that time exports of 3856 MW were sustained by the Queacutebec Balancing Authority and imports amounted to 1827 MW Moreover 1388 MW of interruptible industrial load was called for the peak hour
Global system needs accounting for interruptible load and exports were then evaluated at 37508 MW
Temperature in Montreacuteal at peak was ‐18 degC (‐04 degF) and wind velocity was 9 kmh (56 mph) Winter 2011‐12 was remarkably warmer than average Mean temperatures were 34 degC (61 degF) warmer than normal temperatures for that period
Generation and Reserves
At the time of peak maximum generation capacity was about 43140 MW
Generation outages totaled 1978 MW The TransCanada Energy GS (547 MW in winter) was under a temporary shutdown agreement and is included in the outages Tracy oil‐fueled GS had three units (450 MW) mothballed (now retired) Hydraulic wind and mechanical restrictions totaled 1818 MW Thus total available capacity was about 39344 MW
Thirty‐minute operating reserve at peak time was 3000 MW 1500 MW over the requirement
State of the System
735 kV Lines
On peak day all 735 kV transmission was available
Other Equipment
Synchronous Condenser CS23 at Duvernay substation was unavailable for the Winter Operating Period
During spring 2011 a 735‐kV current transformer (CT) at Chissibi 735‐kV substation exploded due to gas accumulation This event triggered an extensive oil verification program for this type of CT Out of 281 sampled CTs it was found that 70 had to be changed Thus a replacement program was planned and initiated In January 2012 about 50 CTs had been changed and the rest was scheduled for 2012
The reactive power output of generating stations in the southern part of the system at peak load and capacitor bank availability were adequate considering load and system conditions during the Winter Operating Period
Wind generation
Approximately 425 MW of wind generation was present on the system during the peak hour on January 16 out of a total of 919 MW
Interconnections
Page 48
On January 16 2012 (peak day) all interconnection equipment was available and operating During the Winter Operating Period seven events occurred which made interconnections unavailable The most significant events were the following
bull Sandy Pond Pole 1 trip on February 9 2012 with loss of 780 MW export
bull Madawaska GC1 trip on February 1 2012 with TTC reduction to New Brunswick
bull Leacutevis Transformer T13 (735315 kV) trip on February 16 with TTC reduction to New Brunswick
Page 49
Historical Winter Demand Review (Pre‐2012)
The table below summarizes historical non‐coincident winter peaks for each NPCC Balancing Authority Area since 2000‐01
Table 10 Historical Peak Demands by Reliability Coordinator Area Occurring December to March And Total Non‐Coincident NPCC Demand (MW)
Year Ontario Maritimes New
England New York
Queacutebec Total NPCC Non‐
Coincident Demand
2000‐01 23126 4822 20088 23764 30277 102077
2001‐02 22623 4783 19872 22798 30080 100156
2002‐03 24158 5376 21535 24454 34989 110512
2003‐04 24937 5716 22818 25262 36268 115001
2004‐05 24979 5419 22631 25541 34956 113526
2005‐06 23766 4987 21733 25060 33636 109182
2006‐07 23935 5593 21640 25057 36251 112376
2007‐08 23054 5385 21782 25021 35352 110594
2008‐09 22983 5504 21026 24673 37230 111416
2009‐10 22045 5205 20791 24074 34659 106774
2010‐11 22733 5252 21060 24654 37717 111416
2011‐12 21649 4963 22255 23901 35481 108249
2012‐13 Forecast
22087 5246 22355 24832 37543 112063
Page 50
8 2012‐13 Reliability Assessments of Adjacent Regions
ReliabilityFirst Corporation
Executive Summary (highlights)
This assessment provides information on the projected resource adequacy for the upcoming winter season across the ReliabilityFirst Corporation (RFC) region The RFC Resource Adequacy Assessment Standard BAL‐502‐RFC‐02 is a Federal Energy Regulatory Commission (FERC) approved regional standard which requires Planning Coordinators to identify the minimum planning reserves to satisfy a resource adequacy criterion that is used to assess their respective areas of RFC PJM Interconnection (PJM) and Midwest Independent Transmission System Operator (MISO) are the Planning Coordinators for their market areas The reserve requirements in this assessment are based upon the explicit probability analyses conducted by these two Planning Coordinators in RFC
All RFC members are affiliated with either the MISO or the PJM Regional Transmission Organization (RTO) for market operations and reliability coordination Ohio Valley Electric Corporation (OVEC) a generation and transmission company located in Indiana Kentucky and Ohio is not a member of either RTO Also RFC does not officially designate subregions MISO and PJM each operate as a single Balancing Authority area Since all RFC demand is in either MISO or PJM except for the small load (less than 100 MW) within the OVEC Balancing Authority area the reliability of the PJM RTO and MISO are assessed and the results used to indicate the reliability of the ReliabilityFirst Region
In this report Demand Response (DR) is defined as the demand that can be interrupted for system emergencies It may consist of Interruptible Load (IL) Direct Control Load Management (DCLM) or load used as a capacity resource The approved RFC Resource Adequacy Assessment Standard requires the reserve margins be calculated with DR used as a load reduction The reserve margin used in this assessment is therefore based on Net Internal Demand (NID)
The report for the RFC region includes the resources and demand only in the RFC area operated by PJM MISO and OVEC The remaining area of PJM operates within the SERC Reliability Corporation (SERC) region and the remaining area of MISO operates in the Midwest Reliability Organization (MRO) or SERC regions
In this assessment forecast demand capacity and interchange values for RFC PJM MISO and OVEC are rounded to the nearest 100 MW Also note that it is possible that reports or other data released by PJM or MISO for this assessment period may differ from the data reported in this assessment owing to when various data were reported ReliabilityFirst does not expect any differences to alter the conclusions of this assessment
Page 51
Executive Summary
Demand Capacity and Reserve Margins
The projected reserve margin for the ReliabilityFirst region is 61900 MW which is 428 percent based on NID and Net Capacity Resources without DR Both MISO and PJM are expected to have sufficient resources to satisfy their planning reserve requirements Therefore the resulting reserve margin for this winter in the ReliabilityFirst region is adequate This compares to a 589 percent reserve margin in last winterrsquos assessment
The forecast winter 20122013 coincident peak demand for the ReliabilityFirst region is 144700 MW NID This is 10200 MW higher than the NID peak of 134500 MW forecast for the winter of 20112012 The main reason for the increase in NID is the reduction in the amount of contractual DR available this winter in PJM Weather and economic conditions have a significant influence on electrical peak demands Any deviation from the original forecast assumptions could cause the actual peak to be significantly different from the forecast
The amount of OVEC PJM and MISO net capacity and interchange in ReliabilityFirst is 206300 MW This is 7400 MW less resources than the 213700 MW that was reported within the 20112012 winter assessment Much of the reduced resources are due to generation retirements many occurring after the summer season Capacity changes that have occurred after the start of the planning year (June) have been included within the calculation of the winter reserve margins for both PJM and MISO Capacity resources committed to the markets at the beginning of the winter period are assumed constant throughout the winter
PJM net capacity and interchange for the 2012 planning year are 182500 MW The projected reserves for PJM during the 20122013 winter peak are 52300 MW which is 402 percent of the Net Internal Demand of 130200 MW The PJM Reserve Margin (NID) has decreased by 127 percentage points over last years forecast reserve margin due to recent generation retirements and the reduction in DSM available during this winter The PJM reserve requirement for the 2012 planning year is 156 percent PJM has adequate reserves to serve the 20122013 winter peak demand
The MISO net capacity and interchange for the 2012 planning year are 109500 MW The current projected reserves for MISO for the 2012 winter peak are 37300 MW which is 517 percent of the Net Internal Demand of 72200 MW The MISO Reserve Margin (NID) has increased by 63 percentage points over last years forecast reserve margin due to a slight increase in Demand Response resources and the net impact of the DEOK transfer of generation and resources into PJM The MISO reserve requirement is 167 percent for the 2012 planning year The MISO winter reserve margin is adequate
Page 52
PJM RTO
Demand
The demand forecast represents the median forecast (5050)11 of a Monte Carlo simulation employing actual weather observations from over thirty years of history Economic assumptions are based on projected growth in Gross Metropolitan Product for 36 metropolitan areas across PJM produced by Moodys Analytics as of December 2011 The PJM winter peak for 20112012 was 118664 MW on January 3 2012 at hour ending 1900 The Total Internal Demand (TID) projection for the 20112012 PJM winter peak was 130711 MW while the Total Internal Demand projection for the 20122013 PJM winter peak is 130200 MW The decrease reflects the impacts of a weak economy PJM forecasts both the non‐coincident and coincident loads of all members PJMrsquos resource evaluations are conducted on the coincident peak loads PJM is a summer peaking region with the typical winter peak about 84 percent of the summer peak
PJM has no contractually interruptible demand side management secured for use by the PJM operators during the winter season Energy Efficiency programs included in the 2012 PJM Load Forecast Report are impacts approved for use in the PJM Reliability Pricing Model At time of the 2012 load forecast publication 600 MW of Energy Efficiency programs have been approved as Reliability Pricing Model resources in 2012 Measurement and verification of energy efficiency programs are governed by rules specified in PJM Manual 18B12 To demonstrate the value of an energy efficiency resource resource providers must comply with the measurement and verification standards defined in this manual by establishing plans providing post‐installation reports and undergoing a Measurement and Verification audit
Quantitative analysis was done to assess the weather uncertainty of the projected demand Using a Monte Carlo simulation employing actual weather observations from over thirty years of history it is estimated that the 90101 load for Winter 20122013 is 138200 MW which is 7900 MW (or 6 percent) above the expected Total Internal Demand No changes were made to the load forecast method used for the 2012 PJM Load Forecast Report Extreme weather conditions are explicitly addressed as part of emergency import analysis for PJMs Locational Deliverability Areas
Generation
The total PJM resources expected to be in service for the 20122013 winter peak period are approximately 182300 MW including 600 MW of Energy Efficiency resources in RPM This is less than the expected capacity from the 2012 summer assessment due to retirement of nearly 4000 MW of generation after the summer
Variable generation amounts to 5600 MW nameplate and 800 MW expected on peak
11 For an explanation of 5050 and 9010 demand forecasts please see Appendix B 12 httpwwwpjmcom~mediadocumentsmanualsm18bashx
Page 53
Variable resources are only counted partially for PJM resource adequacy studies Both wind and solar initially utilize class average capacity factors which are 13 percent for wind and 38 percent for solar Performance over the peak period is tracked and the class average capacity factor is supplanted with historic information After three years of operation only historic performance over the peak period is used to determine the individual units capacity factor PJM has 900 MW of Biomass Biomass is counted fully in capacity calculations
Anticipated hydro conditions for the winter are normal Hydro conditions are expected to be sufficient to meet both peak demand and the daily energy demand throughout the winter peak period PJM is not experiencing or expecting conditions that would reduce capacity
Imports and Exports on Peak
PJM has firm capacity imports of 1400 MW No non‐firm imports are considered in this reliability analysis There are no Expected or Provisional transactions counted towards meeting the reserve margin requirements All included transactions are firm for both generation and transmission No imports are based on partial path reservations There are no transactions with Liquidated Damages clauses or ldquomake‐wholerdquo contracts included in the reserve margins
PJM has firm capacity exports of 1200 MW No non‐firm exports are considered in this reliability analysis There are no Expected or Provisional transactions in place All included transactions are firm for both generation and transmission No imports are based on partial path reservations There are no transactions with Liquidated Damages clauses or ldquomake‐wholerdquo contracts included in the reserve margins
External emergency assistance does not contribute to satisfying the reserve margin requirement PJM only relies on existing certain generation and firm capacity purchases for meeting its reserve margin requirement
Reliability Assessment Analysis
PJM evaluates its resources (generation interchange) and demand (including demand‐side management) to determine if the Reserve Margin requirements are met Contingency analysis performed as part of the PJM Operations Assessment Task Force internal studies and the interregional studies with our neighbors ensures operations within secure transfer limits PJM has adopted a Loss of Load Expectation (LOLE) standard of one occurrence in ten years PJM performs an annual LOLE study to determine the reserve margin required to satisfy this criterion The study recognizes among other factors load forecast uncertainty due to economics and weather generator availability deliverability of resources to load and the benefit of interconnection with neighboring systems The methods and modeling assumptions used in this study are available in PJM Manual 2013
13 httpwwwpjmcom~mediadocumentsmanualsm20ashx
Page 54
This assessment uses the resource adequacy study that was completed in October 20114 This study examined the period 2011 to 2022 The required reserve margins to satisfy an LOLE of one occurrence in ten years are summarized in Table I‐2 on page 5 The PJM projected reserve margin for winter 20122013 based on NID with DSM as a load reduction and energy efficiency as a resource is 401 percent This reserve margin is well in excess of the 2012 planning year reserve margin of 156 percent14 The PJM Reserve Margin (NID) has decreased by 127 percentage points over last years forecast reserve margin due to recent generation retirements and the reduction in DSM available during this winter
PJM has established rulesprocedures to ensure fuel is conserved to maintain an adequate level of on‐site fuel supplies under forecasted peak load conditions PJM coordinates with neighboring entities and gas pipelines to quickly address fuel issues
Generation scheduled to be out of service for scheduled maintenance over the winter peak period is expected to be at normal levels
The demands as reported by the Load Serving Entities are weather normalized (5050)15 forecasts Historically reported load forecasts have been highly accurate as each member has expert knowledge of their individual loads with respect to weather and economic assumptions During last yearrsquos winter season MISO experienced an instantaneous peak of 74011 MW on December 6 2011 hour ending 1900 EST The instantaneous load is the highest value metered during the peak hour
Last yearrsquos unrestricted non‐coincident demand forecast of 83700 MW is 60 percent higher than this yearrsquos unrestricted non‐coincident demand forecast of 78700 MW for December 2012 This difference is due to the transfer of Duke Energy OhioKentucky to PJM on January 1 2012
An unrestricted non‐coincident peak demand is created on a regional basis by summing the coincident monthly forecasts for the individual Load Serving Entities (LSE) in the larger regional area of interest Using historic market data a load diversity factor was calculated by observing the individual peaks of each Local Balancing Authority and comparing them against the system peak This produced an estimated diversity of 3600 MW therefore MISO forecasts a total internal demand of 75100 MW
MISO bases its resource evaluation on the actual market peak MISO currently separates Demand Resources into two separate categories Interruptible Load and DCLM Interruptible load of 2600 MW (35 percent of Total Internal Demand) for this assessment is the magnitude of customer demand (usually industrial) that in accordance with contractual arrangements can be interrupted at the time of peak by direct control of the system operator (remote tripping) or by action of the customer at the direct request of the system operator DCLM of 300 MW (04 percent of Total Internal Demand) for this assessment is the magnitude of customer service (usually residential) that can be interrupted at the time of peak by direct control of the applicable system operator DCLM is typically used for ldquopeak shavingrdquo This results in a net internal demand of 72200 MW The Resource Adequacy processes as set forth in Module E of MISOrsquos tariff acts as the measurement and verification tool for demand response
MISO does not currently track Energy Efficiency programs however they may be reflected in individual LSE load forecasts To account for uncertainties in load forecasts MISO applies a probability distribution Load Forecast Uncertainty to consider a larger range of forecasted demand levels Load Forecast Uncertainty is derived from variance analyses to determine how likely forecasts will deviate from actual load There have not been any changes made due to the economic recession in both the load forecast methodassumptions and the impact to the actual forecast
15 For an explanation of 5050 and 9010 demand forecasts please see Appendix B
Page 56
Generation
MISO projects 103800 MW of Existing‐Certain capacity during the assessment timeframe Of the Existing‐Certain capacity it is difficult to predict the wind capacity available on peak due to the intermittent nature of wind However MISO has determined maximum wind capacity credits using an Equivalent Load Carrying Capacity a metric commonly utilized by the National Renewable Energy Laboratory MISO used the Equivalent Load Carrying Capacity for wind generation and Loss of Load Expectation analyses16 Wind shows an Existing‐Certain capacity of 600 MW on peak over the assessment timeframe utilizing a 149 percent capacity credit for those resources committed as Planning Resource capacity to MISO within the Module E Capacity Tracking tool It is important to note that not all Existing wind capacity was committed in the Module E Capacity Tracking tool Existing‐Other capacity for wind is 1000 MW expected on peak and 9200 MW derates on peak over the assessment timeframe Hydro shows an Existing‐Certain capacity of 800 MW expected on peak over the assessment timeframe The Existing‐Other capacity for hydro is 300 MW expected on peak and 100 MW derates on peak over the assessment timeframe Of the Existing‐Certain capacity biomass shows 500 MW on peak throughout the assessment timeframe MISO anticipates 3000 MW of Behind‐the‐meter Generation (BTMG) to be available for the winter season Hydro conditions for the winter appear normal and there are no reports of reservoir levels showing insufficiencies to meet both peak demand the daily energy demand throughout the winter MISO is not expecting conditions (ie weather fuel supply fuel transportation) that would reduce capacity
Imports and Exports on Peak
MISO only reports power imports (not exports) to the MISO market or reported interchange transactions into the MISO market The forecast includes 2700 MW of power imports17 All these imports are firm and fully backed by firm transmission and firm generation No import assumptions are based on partial path reservations There are no transactions with Liquidated Damages Contract clauses or ldquomake‐wholerdquo contracts that are included as firm capacity External emergency assistance does not contribute to satisfying the reserve margin requirement MISO only relies on committed generation and firm capacity purchases for meeting its reserve margin requirement
16httpswwwmidwestisoorgLibraryRepositoryStudyLOLE201220LOLE20Study20Reportpdf 17 2012-2013 winter peak power imports obtained from the Module E Capacity Tracking tool
Page 57
Reliability Assessment Analysis
The LOLE study is used to determine the level of planning reserves which ensures that the probability for loss of load on the integrated peak hour for each day of the annual planning period sums to 01 dayyear or 1 day in 10 years within the MISO system18 Refer to Table 2‐10 of the 2012 LOLE Study Report for a comparison of Planning Year 2012 Planning Reserve Margin (PRM) to last yearrsquos PRM
According to the 2011 LOLE study the reserve margin requirement calculated for MISO is 167 percent of the MISO Net Internal Demand of its market area for the 20122013 winter season In addition to the 103800 MW of Existing‐certain capacity resources in December MISO expects 2700 MW of external resources and 3000 MW of BTMG resources which are available to serve load19 Behind‐the‐meter generation is considered a capacity resource when calculating the MISO reserve margin This additional capacity arrives at a total designated capacity of 109500 MW
This brings the projected reserve margin for MISO to 37300 MW which is 517 percent of MISO Net Internal Demand The MISO Reserve Margin (NID) has increased by 63 percentage points over last years forecast reserve margin due to a slight increase in Demand Response resources and the net impact of the DEOK transfer of generation and resources into PJM This projected reserve margin is higher than the 167 percent MISO system PRM requirement Firm load curtailment is a very low probability event for the 20122013 winter period
For inclusion in seasonal assessments MISO utilizes Energy Information Administration fuel forecasts to identify any system wide fuel shortages and none are projected for the winter period In addition to the seasonal assessments MISOrsquos Independent Market Monitor submits a monthly report to MISOrsquos Board of Directors which covers fuel availability and security issues During the operating horizon MISO relies on market participants to anticipate reliability concerns related to the fuel supply or fuel delivery Since there are no requirements to verify the operability of backup fuel systems or inventories supply adequacy and potential problems must be communicated appropriately by the market participants to enable adequate response time
18httpswwwmidwestisoorgLibraryRepositoryStudyLOLE201220LOLE20Study20Reportpdf 19 External BTMG and DRR values are based on forecasted 2012-2013 winter values from Module E
Page 58
RELIABILITYFIRST
Demand
In this assessment the data related to the ReliabilityFirst areas of PJM and MISO is combined with the data from OVEC to develop the ReliabilityFirst regional data The demand forecasts used in this assessment are all based on the coincident peak demand of MISOrsquos Local Balancing Authorities and the coincident peak of PJMrsquos load zones Both PJM and MISO demand forecasts are based on an expected or 5050 demand forecast While there is some diversity between the PJM and MISO coincident peak demands and the ReliabilityFirst coincident peak demands most of the demand diversity is already reflected in the PJM and MISO coincident demand forecasts For this assessment no additional diversity is included for the ReliabilityFirst region therefore the ReliabilityFirst coincident peak demand is simply the sum of the PJM MISO and OVEC peak demands (rounded to nearest 100 MW) The composite ReliabilityFirst region forecast is considered a 5050 demand forecast (see Appendix B for explanation of 5050 demand forecast)
PJM and MISO use the categories of Direct Control Load Management and Interruptible Load to account for the expected combined potential DR reduction within the ReliabilityFirst region PJM and MISO also include demand reductions for load in their respective markets Load as a capacity resource is included as a load reduction in the PJM market In MISO the load served behind‐the‐meter from BTMG is included with the demand forecast so BTMG is included as a capacity resource The combined Direct Control Load Management during the winter is 300 MW and the Interruptible Demand is 1600 MW This is a total demand reduction of 1900 MW and is the maximum controlled demand mitigation that is expected to be available during peak demand conditions
Since demand reduction programs are a contractual management of system demand utilization reduces the reserve margin requirement for PJM and MISO Net Internal Demand is TID less the demand reduction Reserve margin requirements are based on Net Internal Demand
The Net Internal Demand peak of the ReliabilityFirst region for the 2012 winter season is 144700 MW and is projected to occur during January 2013 This value is based on a TID forecast of 146600 MW with the full reduction of 1900 MW (13 percent of TID) from the demand response programs within the region (see Table RFC‐1)
Page 59
Compared to the actual winter 20112012 peak demand of 132683 MW the 20122013 winter forecast NID is 12017 MW (91 percent) higher than the actual 20112012 winter peak demand In addition the 2011 forecast of 20122013 winter NID peak demand was 136700 MW making this yearrsquos winter NID peak demand forecast 8000 MW (59 percent) higher than last yearrsquos 2012 winter peak demand forecast The NID forecast for this winter is higher due to the reduction in available DSM reported by PJM for this winter
Weather and economic conditions have significant influence on electrical peak demands Any deviation from the original forecast assumptions for those parameters could cause the aggregate 20122013 winter peak to be significantly different from the forecast
DECEMBER JANUARY FEBRUARY
RFC Totals [2]
TOTAL INTERNAL DEMAND 144500 146600 141200
Direct Control Load Management (300) (300) (300)Interruptible Demand (1600) (1600) (1600)
Load as a Capacity Resource 0 0 0
NET INTERNAL DEMAND 142600 144700 139300
[2] - The RFC regional demand includes OVEC with the PJM and MISO areas of RFC[1] - All demand totals are rounded to the nearest 100 MW
TABLE RFC-1
RFC PROJECTED PEAK DEMANDS (MW)1
WINTER 2012-13
Page 60
For the winter of 20122013 high demand forecasts for PJM and MISO were combined with the OVEC demand to create a high demand forecast for the ReliabilityFirst region The forecast high demand (NID) is 153300 MW a 59 percent increase over the 5050 demand forecast (see Table RFC‐2)
Generation
There are two general categories used when analyzing seasonal capacity resources ldquoExistingrdquo capacity represents resources that have been built and are in commercial service ldquoFuturerdquo capacity represents planned resources that are under construction have an interconnection service agreement and are expected to be in commercial service at the start of the planning period
The generating capacity in Table RFC‐3 represents the capacity of the generation in the ReliabilityFirst region The capacity category of Existing Certain represents existing resources in the ReliabilityFirst areas of PJM and MISO that are committed to their respective markets and the capability of OVEC generation The ReliabilityFirst region has 206300 MW of capacity that is identified as Existing Certain in this winter assessment This includes Energy Efficiency and BTM generation resources of 2500 MW
TOTALRFC
HIGH DEMAND1
TOTAL INTERNAL DEMAND [TID] 155100
NET INTERNAL DEMAND [NID] 153300
NET CAPACITY RESOURCES 206300
RESERVE MARGINS -- MW 53000 -- of NID 346
TABLE RFC-2SIMULATED HIGH DEMAND (MW)
WINTER 2012-13
[1] - The combination of the 9010 demand forecasts for the PJM and MISO areas of RFC is not a 9010 forecast for RFC These values are used to simulate conditions for a high demand day
Page 61
The Existing Other category includes the existing resources that represent expected on‐peak windvariable resource derating and other existing capacity resources within the ReliabilityFirst region not included as Existing Certain resources There is up to 7500 MW of these types of capacity resources None of this capacity is used to satisfy the reserve margin requirement in PJM and MISO
Capacity changes (new and retired generation) that occurred prior to the winter season are included in these winter reserve margins No Future Planned capacity additions are included during the winter in this ReliabilityFirst assessment
The total nameplate amount of variable generation in ReliabilityFirst is about 5800 MW This is nearly all wind power (with about 32 MW solar) with the amount of available on‐peak variable generation capability included in the reserve calculations at about 700 MW The difference between the nameplate rating and the on‐peak expected wind capability rating is accounted for in the Existing Other category
RFC2012
EXISTING CAPACITY 214500
EXISTING INOPERABLE (700)
EXISTING OTHER CAPACITY (7500)
EXISTING CERTAIN CAPACITY 206300
CAPACITY TRANSACTIONS - IMPORTS 1 700
CAPACITY TRANSACTIONS - EXPORTS 1 (700)
NET INTERCHANGE 0
CAPACITY and NET INTERCHANGE 206300
NET CAPACITY RESOURCES 206300
1 - Intra-regional transfers reported by the RTOs (between RTOs and with OVEC) have been removed
TABLE RFC-3RFC PROJECTED CAPACITY RESOURCES (MW)
WINTER 2012-13
Page 62
There is also 700 MW of biomass (renewable) resources included in the ReliabilityFirst reserve margins
Each generator operator is expected to coordinate with the fuel industry regarding fuel supplies and deliveries Although PJM and MISO do not explicitly communicate with the fuel industry regarding fuel supply issues their respective market rules encourage generator owners and operators to have adequate fuel supplies ReliabilityFirst does not communicate directly with the fuel industry on supply adequacy or potential problems ReliabilityFirst does periodically survey its generator owners and operators about relevant fuel issues that may occur The last survey was in 2008 to determine if severe flooding in the Midwest was expected to significantly delay or curtail fuel shipments
There are no known or expected conditions or situations regarding fuel supply or delivery hydroelectric reservoirs adverse weather generator availability environmental regulatory or capacity retirement that are anticipated to adversely impact the forecasts used in this 20122013 winter assessment
Imports and Exports on Peak
Expected and firm power imports into the ReliabilityFirst regional area are forecast to be 700 MW Firm power exports are forecast to be 700 MW There is no net interchange forecast for the ReliabilityFirst regional area There are no transactions using Liquidated Damage Contracts or make‐whole contracts
Reliability Assessment Analysis
The PJM projected reserve margin for winter 20122013 based on Net Internal Demand is 402 percent This 402 percent reserve margin is a 126 percentage point decrease over the 20112012 forecast reserve margin due to the reduction in available DSM reported by PJM for this winter The reserve margin requirement in PJM is 156 percent of the summer peak which requires minimum capacity resources of 164400 MW This is an equivalent requirement of 263 percent reserve margin based on the winter NID forecast PJM is projected to have adequate reserves for the 20122013 winter peak demand
The reserve margin requirement calculated for MISO is 167 percent of the Net Internal Demand of its market area The current projected reserve margin for MISO is 37300 MW which is 517 percent of the Net Internal Demand Therefore MISO is projected to have adequate reserves for the 20122013 winter peak demand
Since PJM and MISO are projected to have sufficient resources to satisfy their respective reserve margin requirements the ReliabilityFirst region is projected to have adequate resources for the 20122013 winter period In Table RFC‐4 the calculated reserve margin for ReliabilityFirst is 61600 MW which is 426 percent based on Net Internal Demand and Net Capacity Resources This compares to a 589 percent reserve margin in last winterrsquos assessment The reduction in available DSM reported by PJM for this winter and the retirement of generation resources after the summer is the reason for the decrease in winter reserve margins
Page 63
DECEMBER JANUARY FEBRUARY
TOTAL INTERNAL DEMAND (MW) 144500 146600 141200
DEMAND RESPONSE (MW) (1900) (1900) (1900)
NET INTERNAL DEMAND (MW) 142600 144700 139300
NET CAPACITY RESOURCES (MW) 206300 206300 206300
RESERVE MARGINS -- MW 63700 61600 67000 -- of NID 447 426 481
Introduction This study estimated the use of NPCC Area Operating Procedures designed to mitigate resource shortages for the winter of 201213 (November 2012 through March 2013) The CP‐8 Working Grouprsquos effort is consistent with the CO‐12 Working Grouprsquos study NPCC Reliability Assessment for Winter 2012‐13 November 2012 20 General Electricrsquos (GE) Multi‐Area Reliability Simulation (MARS) program was selected for the analysis GE Energy was retained by NPCC to conduct the simulations Results For the November 2012 ‐ March 2013 period Figure EX‐1a shows the estimated use of the indicated operating procedures under the Base Case assumptions for the expected load level (the expected load level results were based on the probability‐weighted average of the seven load levels simulated)
20 See httpwwwnpccorgdocumentsreportsSeasonalaspx
Page 65
Figure EX-1a
Expected Use of Indicated Operating Procedures for Winter 201213
Base Case Assumptions ndash Expected Load Level
For the November 2012 ‐ March 2013 period Figure EX‐1b shows the estimated use of the indicated operating procedures under the Base Case assumptions for the extreme load level (representing the second to highest load level having approximately a 6 chance of being exceeded)
0
1
2
NE NY ON MT Q
Estimated Number of
Occurrences (daysperiod)
Reduce 30-min Reserve
Initiate Interruptible Loads
Reduce 10-min Reserve
Appeals
Disconnect Load
Page 66
Figure EX-1b
Expected Use of the Indicated Operating Procedures for Winter 201213
Base Case Assumptions - Extreme Load Level
For the November 2012 ‐ March 2013 period Figure EX‐2a shows the estimated use of the indicated operating procedures under the Severe Case assumptions for the expected load level (the expected load level results were based on the probability‐weighted average of the seven load levels simulated)
0
1
2
Estimated Number of
Occurrences (daysperiod)
Reduce 30-min Reserve
Initiate Interruptible Loads
Reduce 10-min Reserve
Appeals
Disconnect Load
Page 67
0
1
2
NE NY ON MT Q
Estimated Number of
Occurrences (daysperiod)
Reduce 30-min Reserve
Initiate Interruptible Loads
Reduce 10-min Reserve
Appeals
Disconnect Load
Page 68
Figure Figure EX-2a
EX-2a
Expected Use of the Indicated Operating Procedures for Winter 201213
Severe Case Assumptions - Expected Load Level
For the November 2012 ‐ March 2013 period Figure EX‐2b shows the estimated use of the indicated operating procedures under the Severe Case assumptions for the extreme load level (representing the second to highest load level having approximately a 6 chance of being exceeded)
Figure EX-2b
Expected Use of the Indicated Operating Procedures for Winter 201213
Severe Case Assumptions - Extreme Load Level
0
2
4
6
NE NY ON MT Q
Estimated Number of
Occurrences (daysperiod)
Reduce 30-min Reserve
Initiate Interruptible Loads
Reduce 10-min Reserve
Appeals
Disconnect Load
Page 69
Conclusions
As shown in Figures EX‐1a the use of operating procedures designed to mitigate resource shortages is not expected for Queacutebec Ontario the Maritimes New York and New England under the assumed Base Case conditions for the expected load level The expected load level results were based on the probability‐weighted average of the seven load levels simulated Figure EX‐1b indicates only the Maritimes show a need to implement their operating procedures under Base Case extreme load level conditions
Figure EX‐2b shows the estimated use of operating procedures for the extreme load level if the severe set of resource unavailability assumptions used in this analysis occurs The extreme load level represents the second to highest load level having approximately a 6 chance of being exceeded Only the Maritimes and Quebec Areas show a need for use of operating procedures in response to a capacity deficiency this winter for these conditions The results for the Maritimes Area are driven by the assumption of continuation of the Pt Lepreau refurbishment outage The results for the Queacutebec Area are driven by the assumed generation reductions from Churchill Falls and La Sarcelle
Page 70
Appendix I ndash Winter 2012‐13 Expected Load and Capacity Forecasts
Table AP‐1 ndash NPCC Summary
Week Installed Total Load Demand Known Req Operating Unplanned Net Bottled Revised
‐ Includes known scheduled maintenance as of September 12 2012
‐ Assumed unplanned outages based on historical observation of outages with an additional 2000 MW of outages for generation at risk due to gas supply during seven weeks in January and
February
‐ Installed Capacity Firm Purchases and Sales and Interruptible Load are based on ISO‐NE Forward Capacity Market (FCM) resource obligations for the 2012‐2013 capacity commitment
period
‐ Purchases and sales consist of imports of 253 MW from Quebec and 322 MW from New York and an export of 100 MW to New York
‐ Load Forecast assumes Peak Load Exposure reported in the 2012 CELT Report
‐ Interruptible Loads consist of both active and passive (energy efficiency) FCM Demand Resource obligations
‐ 2375 MW of operating reserve assumes 125 of the first largest contingency at 1400 MW and 50 of the second largest contingency of 1250 MW
Page 73
Table AP‐4 ndash New York
Week Installed Firm Firm Total Load Demand Known Req Operating Unplanned Net
and available capacity from Churchill Falls at the Newfoundland minus Queacutebec border
2) Purchases 400 MW in December 581 MW in January and 481 MW in February
3) Sales of 253 MW + losses to ISO‐NE
Does not include firm sale of 145 MW to Cornwall (154 MW with losses)
4) Expected weekly internal peak load plus 154 MW for Cornwall including losses
5) Includes 250 MW of load management through voltage reduction (Direct Control Load Management)
Page 76
Appendix II ndash Load and Capacity Tables definitions
This appendix defines the terms used in the Load and Capacity tables of Appendix I Individual Balancing Authority Area particularities are presented when necessary
Installed Capacity
This is the generation capacity installed within a Reliability Coordinator area This should correspond to nameplate andor test data and may include temperature derating according to the Operating Period It may also include wind generation derating
Individual Reliability Coordinator area particularities
New England
Installed capacity is based on generator Forward Capacity Market supply obligations
Queacutebec
Most of the Installed Capacity in the Queacutebec Area is owned and operated by Hydro‐Queacutebec Production The remaining capacity is provided by Churchill Falls and by private producers (hydro wind biomass and natural gas cogeneration)
Maritimes
This number is the maximum net rating for each generation facility (net of unit station service) and does not account for reductions associated with ambient temperature derating and intermittent output (eg hydro andor wind)
Ontario
This number includes all generation registered with the IESO
New York
This number includes all generation resources that participate in the NYISO Installed Capacity (ICAP) market
NPCC A‐07
Capacity The rated continuous load‐carrying ability expressed in MW or MVA of generation transmission or other electrical equipment
Purchases
These are purchases between Reliability Coordinator areas or from outside NPCC that have firm transmission reservations to back them up
Individual Reliability Coordinator area particularities
New England
Imports with obligations in the Forward Capacity Market are included
Page 77
New York
NY does not use the firm transmission concept
Queacutebec
Both long term firm purchases and short term calls for tenders are included as needed
Maritimes
Short or long‐term capacity‐backed purchases would be included
Ontario
Ontario only allows hourly transactions
Sales
These are sales between Reliability Coordinator areas or to outside NPCC that have firm transmission reservations to back them up
Individual Reliability Coordinator area particularities
New England
Exports with Forward Capacity Market obligations are included
New York
NY does not use the firm transmission concept
Queacutebec
Firm sales and wheel throughs are included However in this assessment the 145 MW contract to Cedars Rapids Transmission is not included in the sales It is included in the Queacutebec Balancing Area demand This is different than what is done in the NERC seasonal assessments where this load is considered a firm export
Maritimes
Short or long‐term capacity‐backed sales would be included
Ontario
Ontario only allows hourly transactions
Total Capacity
Total Capacity = Installed Capacity + Purchases ndash Sales
Demand Forecast
This is the total internal demand forecast for each Reliability Coordinator area as per its Demand Forecast Methodology (Appendix IV)
Page 78
Demand Response
Loads that are interruptible under the terms specified in a contract These may include supply and economic interruptible loads Demand Response Programs or market‐based programs
Known MaintenanceConstraints
This is the reduction in Capacity caused by forecasted generator maintenance outages and by any additional forecasted transmission or by other constraints causing internal bottling within the Reliability Coordinator area Some Reliability Coordinator areas may include wind generation derating
Individual Reliability Coordinator area particularities
New England
Known maintenance includes all planned outages as reported on the ISO‐NE Annual Maintenance Schedule
Queacutebec
This includes scheduled generator maintenance and hydraulic as well as mechanical restrictions It also includes wind generation derating It may include ndash usually in summer ndash transmission constraints on the TransEacutenergie system
Maritimes
This includes scheduled generator maintenance and ambient temperature derates It also includes wind and hydro generation derating
Ontario
This includes generator maintenance derating plus generation bottling
Required Operating Reserve
This is the minimum operating reserve on the system for each Reliability Coordinator area
NPCC A‐07
Operating reserve This is the sum of ten‐minute and thirty‐minute reserve (fully available in 10 minutes and in 30 minutes)
Individual Reliability Coordinator area particularities
New England
The required operating reserve consists of 100 percent of the first largest contingency plus 50 percent of the second largest contingency
Page 79
New York
The required operating reserve consists of 150 percent of the first largest contingency
Queacutebec
The required operating reserve consists of 100 percent of the largest first contingency + 50 percent of the largest second contingency including 1000 MW of hydro synchronous reserve distributed all over the system to be used as stability and frequency support reserve
Maritimes
The required operating reserve consists of 100 percent of the first largest contingency plus 50 percent of the second largest contingency
Ontario
The required operating reserve consists of 100 percent of the first largest contingency plus 50 percent of the second largest contingency
Unplanned Outages
This is the forecasted reduction in Installed Capacity by each Reliability Coordinator area based on historical conditions used to take into account a certain probability that some capacity may be on forced outage
Individual Reliability Coordinator area particularities
New England
Monthly unplanned outage values have been calculated based on five years of historical unplanned outage data
Queacutebec
This value includes a provision for frequency regulation in the Queacutebec Balancing Authority Area for unplanned outages and for heavy loads as determined by the system controller
Maritimes
Monthly unplanned outage values have been calculated based on historical unplanned outage data
Ontario
This value is a historical observation of the capacity that is on forced outage at any given time
Net Margin
Page 80
Net margin = Total capacity ndash Load forecast + Interruptible load ndash Known maintenanceConstraints ndash Required operating reserve ndash Unplanned outages
Individual Reliability Coordinator area particularities
New York
NY plans for an Installed Reserve Margin requirement as a percentage above peak load forecast and approved by the New York State Reliability Council (NYSRC)
Bottled Resources
Bottled resources = Queacutebec Net margin + Maritimes Net margin ndash available transfer capacity between QueacutebecMaritimes and Rest of NPCC
This is used primarily in summer It takes into account the fact that the margin available in Maritimes and Queacutebec exceeds the transfer capability to the rest of NPCC since Queacutebec and Maritimes are winter peaking
Revised net margin (NPCC Summary only)
Revised net margin = Net margin ndash Bottled resources
This is used only in the Summer Assessment and follows from the Bottled Resources calculation
Page 81
Appendix III ndash Summary of Normal and Expected Feasible Transfer Capability under Winter Peak Conditions
The following table shows Normal Transfer Capability (NTC) between Reliability Coordinator areas representing transfer capabilities under normal system conditions It is recognized that the actual transfer conditions may differ depending on system conditions or configurations such as actual voltage profiles operating conditions etc Also the Feasible Transfer Capability (FTC) values represent an expected transfer capability under the peak demand scenario with the assumed transmission configuration identified in this report This Feasible Transfer Capability is based on historical operating experience and known operating constraints in each Reliability Coordinator area The total for each Reliability Coordinator area represents the simultaneous transfer between Reliability Coordinator areas that may be achievable It should be noted that real‐time transfer limits may change depending on the operation of the system at the time and readers are encouraged to review information on the Available Transfer Capability (ATC) and Total Transfer Capabilities (TTC) between Reliability Coordinator areas via httpwwwnerroorg
Diagram 1
Out
Page 82
Reliability Coordinator area Acronym Description
Maritimes Ontario
NB ‐ New Brunswick NW ‐ North West Sub‐Area
West ‐ Western Sub‐Area
New England Niagara ‐ Niagara
BHE ‐ Bangor‐Hydro Electric NE ‐ North‐East Sub‐Area
CMA ‐ Central Massachusetts CHAT ‐ Ottawa
VT ‐ Vermont East ‐ East
WMA ‐ Western Massachusetts RFC ‐ ReliabilityFirst Corporation
CT ‐ Connecticut MAN ‐ Manitoba
NOR ‐ Norwalk MRO ‐ Midwest Reliability Organization
MIN ‐ Minnesota
HAW ‐ Hawthorne
New York
The New York Balancing Authority area is divided into 11 zones (A ndash K) that are defined based on the transmission system topology
A West Queacutebec
B Genessee Brookfield ‐ Brookfield
C Central RPD‐KPW ‐ Rapide‐des‐Iles Kipawa
D North BRY‐PGN ‐ Bryson ‐ Paugan
E Mohawk Valley CHAT ‐ Chateauguay
F Capital CRT ‐ Cedar Rapids Transmission
G Hudson Valley BDF‐STS ‐ Bedford Stanstead
H Millwood BEAU ‐ Beauharnois
I Dunwoodie NIC ‐ Nicolet
J New York City MTP‐MDW ‐ Matapedia‐Madawaska
K Long Island OUTA ‐ Outaouais
Page 83
Transfers from Maritimes to
Interconnection Point NTC at Interconnection Points (MW)
FTC under Peak Conditions (MW)
Rationale for Constraint
Queacutebec
NB MTP ndash MDW Lines 2101 2102
Lines 30123114 3113
335
435
335
435
Eel River winter rating is 350 MW When Eel River converter losses and line losses to the Queacutebec border are taken into account Eel River to Matapeacutedia transfer is 335 MW
Madawaska winter rating is 435 MW
Total 770 770
New England
NB BHE
L3001 L3016
1000 1000 For resource adequacy studies NE assumes that it can import 700 MW of capacity to meet New England loads Note that New England would be able to import more than 700 MW if it backed down its generation in Maine or if many Maine generators were unavailable
Total 1000 1000
Transfers from New England to
Interconnection Point NTC at Interconnection Points (MW)
FTC under Peak Conditions (MW)
Rationale for Constraint
Maritimes
NB BHE
L3001 L3016390
1000 1000 For resource adequacy studies NE assumes that it can import 700 MW of capacity to meet New England loads Note that New England would be able to import more than 700 MW if it backed down its generation in Maine or if many Maine generators were unavailable
BHE NB
L3001 3016390
550 550 Transfer capability is dependent upon operating conditions in northern Maine If key generation or capacitor banks are not operational the transfer from New England to New Brunswick will be decreased At the present time the NBSO has limited the NTC to 200 MW but will increase it to 550 MW upon request from the NBSO under emergency operating conditions for up to 30 minutes This limitation is due to system security stability within New Brunswick and it is presently under review
Total 550 550
New York
VT D 0
Page 84
WMA F 843
CT G 843
NOR K 200
Sub Total 1886 1325 Feasible Simultaneous Transfer to New York excluding Cross Sound Cable ISO‐NE planning assumptions are based on an interface limit of 1400 MW
CT (CSC) K 330 330 The transfer capability of the Cross Sound Cable is 346 MW However losses reduce the amount of MWs that can actually be delivered across the cable When 346 MW is injected into the cable 330 MW is received at the point of withdrawal The Cross Sound Cable is a DC tie and is not included in the Feasible simultaneous transfer capability with NY
Total 2216 1655
Queacutebec
CMA NIC HVDC link
2000 0 Phase 2 is required for internal Queacutebec transmission needs at the time of peak Capability of the facility is 2000 MW conditions in NE NY amp PJM may limit to 1200 MW or less
Highgate (VT) ndash Bedford (BDF) Line 1429
170 0 Capability of the facility is 225 MW with a maximum of 220 MW deliverable to New England due to limits in Queacutebec At times conditions in Vermont limit the capability to 100 MW or less The DOE permit is 170 MW
Derby (VT) ndash Stanstead (STS) Line 1400
0 0 There is no capability to export to Queacutebec through this interconnection
Total 2170 0 The New England to Queacutebec transfer limit at peak load is assumed to be 0 MW It should be noted that this limit is dependant on New England generation and could be increased up to approximately 350 MW depending on New England dispatch If energy was needed in Queacutebec and the generation could be secured in the Real‐Time market this action could be taken to increase the transfer limit
Transfers from New York to
Page 85
Interconnection Point NTC at Interconnection Points (MW)
FTC under Peak Conditions (MW)
Rationale for Constraint
New England
D VT
F WMA
K CT
K NOR
Sub Total 1450 1450 Feasible Simultaneous Transfer to New England excluding Cross Sound Cable
K CT (CSC) 340 340 Cross Sound Cable power injection is up to 346 MW losses reduce power at the point of withdrawal to 340 MW The Cross Sound Cable is a DC tie and is not included in the Feasible Simultaneous Transfer capability with NY
Total 1790 1790
Ontario
D East Lines L33P L34P
A Niagara Lines PA301 PA302 BP76 PA27
Simultaneous Transfers between Ontario and NY may be impacted by loop flows and assumes phase shifting capability of Michigan ‐ Ontario interface is not available Additionally thermal limits on the QFW interface may restrict imports to lesser values when the generation in the Niagara area is taken into account BP76 OS
Total 1700 1700
PJM
A PJM
C PJM
G PJM
J PJM
Total 2350 2350 Feasible Simultaneous Transfer to PJM on peak
Queacutebec
D Chat L7040 1000 1000
D CRT Lines CD11 CD22
100 100
Total 1100 1100
Page 86
Transfers from Ontario to
Interconnection Point NTC at Interconnection Points (MW)
FTC under Peak Conditions (MW)
Rationale for Constraint
New York
East D Lines L33P L34P
300 300
Niagara A Lines PA301 PA302 BP76 PA27
1390 1390
Total 1690 1690 Simultaneous Transfers between Ontario and NY may be impacted by loop flows and assumes phase shifting capability of Michigan ‐ Ontario interface is not available BP76 is OS
MISO Michigan
Lines L4D L51D J5D B3N
2160 2160
Total 2160 2160 Simultaneous Transfers between Michigan and Ontario may be impacted by loop flows and assumes phase shifting capability of Ontario‐Michigan interface is not available
Queacutebec
NE RPD ndash KPW Lines D4Z H4Z
85 85 The 85 MW reflects an agreement through the TE‐IESO Interconnection Committee pending further study of available options resulting from the Outaouais Interconnection H4Z thermal capability in winter is 110 MW
Ottawa BRY ndash PGN Lines X2Y Q4C
140 52 Circuit Q4C is capable of transferring 140 MW less frac12 of Chat Falls generation that is considered in the Queacutebec Installed Capacity (140‐88=52) There is no capacity to export to Queacutebec through Lines P33C and X2Y
Ottawa Brookfield Lines D5A H9A
110 110 Only one of H9A or D5A can be in service at any time The 110 MW reflects the maximum load that can be transferred to Ontario from Queacutebec (Papier Masson Inc) D5A`s transfer capability is 200 MW
East Beau Lines B5D B31L
470 470 Capacity from Saunders that can be synchronized to the Hydro‐Queacutebec system
HAW OUTA
Lines A41T A42T
1250 1250 Normally Ontario will schedule up to 1230 MW allowing for a Transmission Reliability Margin of 20 MW
Total 2055 1967
MISO Manitoba Minnesota
NW MAN Lines K21W K22W
275 275
Page 87
NW MIN Line F3M
140 140
Total 415 415 Feasible Simultaneous Transfer to MAPP
Transfers from Queacutebec to
Interconnection Point NTC at Interconnection Points (MW)
FTC under Peak Conditions (MW)
Rationale for Constraint
Maritimes
MTP‐MDWNB Lines 2101 2102
Lines 30123114 3113
350 + radial loads
423 + radial loads
350 + radial loads
423 + radial loads
Eel River HVDC winter rating is 350 MW plus available radial load transfers (Radial load transfer amount is dependent on local loading and will be updated monthly Dec ‐ 78 MW Jan ndash 85 MW Feb ndash 74 MW March ndash 72 MW These values will be updated as required
Madawaska winter rating is 435 MW When Madawaska converter losses and line losses to the New Brunswick border are taken into account Madawaska to St‐Andreacute transfer is 423 MW
(Radial load transfer amount is dependent on local loading and will be updated monthly Dec ndash 157 MW Jan ndash 159 MW Feb ‐ 138 MW Marchndash 137 MW These values will be updated as required
Total 773 + radial loads 773 + radial loads
New England
NIC CMA HVDC link
2000 1400 Capability of the facility is 2000 MW actual conditions in NE NY PJM may lower this value The value estimated at peak load is 1400 MW However Phase 2 may be required for internal Queacutebec transmission needs at the time of peak in which case FTC would be ldquozerordquo
Bedford (BDF) ndash Highgate (VT) Line 1429
220 200 Limitations on the Queacutebec system under peak load conditions
Stanstead (STS) ndash Derby (VT) Line 1400
35 35
Total 2255 1635
New York
Chateauguay ndash D Line 7040
1500 1000 Beauharnois GS is used for Queacutebec needs under peak load conditions in which case transfer is limited to Chacircteauguay capacity
CRT ndash D Lines CD11 CD22
325 180 Transfer limit is 325 MW less projected peak Cornwall load of 145 MW tapped off the circuit
Total 1825 1180 Queacutebec to New York transfer capability may reach 2000 MW on an hour‐ahead basis and depending on operating conditions in New York and in Queacutebec
Ontario
Page 88
RPD‐KPW NE Lines D4Z H4Z
75 75 This represents Line D4Z capacity There is no capacity to export to Ontario through Line H4Z
BRY‐PGN Ottawa Lines X2Y P33C Q4C
400 232 Limitations on the Queacutebec system under peak load conditions restrict deliveries as follows P33C ‐ 167 MW and X2Y ndash 65 MW There is no capacity to export to Ontario through Line Q4C
Brookfield Ottawa Lines D5A H9A
200 200 Only one of H9A or D5A can be in service at any time The transfer capability reflects usage of D5A The 200 MW reflects the maximum transfer available from Queacutebec to Ontario D5Arsquos transfer limit is 250 MW
Beau East Lines B31L B5D
790 0 Beauharnois GS is used for Queacutebec needs under peak load conditions
OUTA HAW Lines A41T A42T
1250 1250 Normally Ontario will schedule up to 1230 MW allowing for a Transmission Reliability Margin of 20 MW
Total 2715 1757
Note Limitations on the Queacutebec system under peak load conditions may be due to resource limitations as opposed to transmission limitations so that the Feasible Transfer Capability does not necessarily correspond to the TTCs published elsewhere
Page 89
Transfers from Regions External to NPCC
Interconnection Point Normal Transfer Capability at Interconnection Points (MW)
Feasible Transfer Capability under Peak Conditions (MW)
Rationale for Constraint
MISO (Michigan) ONT Lines L4D L51D J5D B3N
1860 1860 Represents a worst case scenario for the implementation of Policy on operation
Total 1860 1860 Simultaneous Transfers between Michigan and Ontario may be impacted by loop flows and assumes phase shifting capability of Ontario‐Michigan interface is not available
MISO (Manitoba‐Minnesota) ONT
NW MAN Lines K21W K22W
275 275
NW MIN Line F3M
90 90
Total 365 365 Feasible Simultaneous Transfer to Ontario
PJM New York
A
C
G
J
Total 2650 2650 Feasible Simultaneous Transfer to New York
Page 90
Appendix IV ndash Demand Forecast Methodology
Reliability Coordinator area Methodologies
Maritimes
The Maritimes Area demand is the mathematical sum of the forecasted weekly peak demands of the sub‐areas (New Brunswick Nova Scotia Prince Edward Island and the area served by the Northern Maine Independent System Operator) As such it does not take the effect of load coincidence within the week into account If the total Maritimes Area demand included a coincidence factor the forecast demand would be approximately 1 to 3 percent lower
For the NBSO the demand forecast is based on an End‐use Model (sum of forecasted loads by use eg water heating space heating lighting etc) for residential loads and an Econometric Model for general service and industrial loads correlating forecasted economic growth and historical loads Each of these models is weather adjusted using a 30‐year historical average
For Nova Scotia the load forecast is based on a 10‐year weather average measured at the major load center along with analyses of sales history economic indicators customer surveys technological and demographic changes in the market and the price and availability of other energy sources
For Prince Edward Island the demand forecast uses average long‐term weather for the peak period (typically December) and a time‐based regression model to determine the forecasted annual peak The remaining months are prorated on the previous year
The Northern Maine Independent System Administrator performs a trend analysis on historic data in order to develop an estimate of future loads
New England
ISO New Englandrsquos energy model is an annual model of ISO‐NE Area total energy using real income the real price of electricity and weather variables as drivers Income is a proxy for all economic activity
The peak load model is a monthly model of the typical daily peak for each month and produces forecasts of weekly monthly and seasonal peak loads over a 10 year time period Daily peak loads are modeled as a function of energy weather and a time trend on weather for the summer months to capture the increasing sensitivity of peak load to weather due to the increasing cooling load
The reference demand forecast which has a 50 percent chance of being exceeded is based on weekly weather distributions and the monthly model of typical daily peak The weekly weather distributions were built using 40 years of temperature data at the time of daily electrical peaks (for non‐holiday weekdays) A reasonable approximation for ldquonormal weatherrdquo associated with the winter peak is 70 degF and for the summer peak is 902 degF
Page 91
ISO New Englandrsquos forecasting details may be found at httpwwwiso‐necomtransceltfsct_detailindexhtml
New York
The 2012‐13 winter forecast assumes normal weather conditions for both energy usage and peak demand The economic outlook is derived from the New York forecast provided to the NYISO by Moodys Economycom Econometric models are used to obtain energy forecasts for each of the eleven zones in New York A winter load factor is used to derive the winter peak from the annual energy forecast
The NYISO uses a weather index that relates dry bulb air temperature and wind speed to the load response in the determination of the forecast At the forecast load levels a one‐degree decrease in this index will result in approximately 100 MW of additional load The expected temperature at which the New York load could reach the forecast peak is 129 degF (‐11 degC)
Ontario
The Ontario Demand is the sum of coincident loads plus the losses on the IESO‐controlled grid Ontario Demand is calculated by taking the sum of injections by registered generators plus the imports into Ontario minus the exports from Ontario Ontario Demand does not include loads that are supplied by non‐registered generation The IESO forecasting system uses multivariate econometric equations to estimate the relationships between electricity demand and a number of drivers These drivers include weather effects economic data and calendar variables Using regression techniques the model estimates the relationship between these factors and energy and peak demand Calibration routines within the system ensure the integrity of the forecast with respect to energy and peak demand including zone and system wide projections IESO produces a forecast of hourly demand by zone From this forecast the following information is available
hourly peak demand
hourly minimum demand
hourly coincident and non‐coincident peak demand by zone
energy demand by zone
These forecasts are generated based on a set of weather and economic assumptions IESO uses a number of different weather scenarios to forecast demand The appropriate weather scenarios are determined by the purpose and underlying assumptions of the analysis The base case demand forecast uses a median economic forecast and monthly normalized weather Multiple economic scenarios are only used in longer term assessments A quantity of price‐responsive demand is also forecast based on market participant information and actual market experience
Page 92
Queacutebec
Hydro‐Queacutebecrsquos demand and energy‐sales forecasting is Hydro‐Queacutebec Distributionrsquos responsibility First the energy‐sales forecast is built on the forecast from four different consumption sectors ndash domestic commercial small and medium‐size industrial and large industrial The model types used in the forecasting process are different for each sector and are based on end‐use andor econometric models They consider weather variables economic‐driver forecasts demographics energy efficiency and different information about large industrial customers This forecast is normalized for weather conditions based on an historical trend weather analysis
The requirements are obtained by adding transmission and distribution losses to the sales forecasts The monthly peak demand is then calculated by applying load factors to each end‐use andor sector sale The sum of these monthly end‐usesector peak demands is the total monthly peak demand
Load Forecast Uncertainty (LFU) includes weather and load uncertainties Weather uncertainty is due to variations in weather conditions It is based on a 36‐year database of temperatures (1971‐2006) adjusted by 030 degC (054 degF) per decade starting in 1971 to account for climate change Moreover each year of historical climatic data is shifted up to plusmn3 days to gain information on conditions that occurred during either a weekend or a weekday Such an exercise generates a set of 252 different demand scenarios The base case scenario is the arithmetical average of the peak hour in each of these 252 scenarios Load uncertainty is due to the uncertainty in economic and demographic variables affecting demand forecast and to residual errors from the models
Overall uncertainty is defined as the independent combination of climatic uncertainty and load uncertainty This Overall Uncertainty expressed as a percentage of standard deviation over total load is similar to the previous reliability assessment For the 2012‐13 winter peak period the overall uncertainty is evaluated at 1560 MW
TransEacutenergie ndash the Queacutebec system operator ndash then determines the Queacutebec Balancing Authority Area forecasts using Hydro‐Queacutebec Distributionrsquos forecasts (HQ internal demand) and accounting for agreements with different private systems within the Balancing Authority Area The forecasts are updated on an hourly basis within a 12‐day horizon according to information on local weather wind speed cloud cover sunlight incidence and type and intensity of precipitation over nine regions of the Queacutebec Balancing Authority Area Forecasts on a minute basis are also produced within a two day horizon TransEacutenergie has a team of meteorologists who feed the demand forecasting model with accurate climatic observations and precise weather forecasts Short term changes in industrial loads and agreements with different private systems within the Balancing Authority Area are also taken into account on a short term basis
Page 93
Appendix V ‐ NPCC Operational Criteria and Procedures
NPCC Directories Pertinent to Operations
NPCC Regional Reliability Reference Directory 1 ndash Design and Operation of the Bulk Power System
Description This directory provides a ldquodesign‐based approachrdquo to ensure the bulk power system is designed and operated to a level of reliability such that the loss of a major portion of the system or unintentional separation of a major portion of the
system will not result from any design contingencies Includes Appendices F and G ldquoProcedure for Operational Planning Coordinationrdquo and rdquoProcedure for Inter Reliability Coordinator area Voltage Controlrdquo respectively Note‐Directory 1 is presently being revised by the NPCC Task Forces on Coordination of Operation and Coordination of Planning
Description Objectives principles and requirements are presented to assist the NPCC Reliability Coordinator areas in formulating plans and procedures to be followed in an emergency or during conditions which could lead to an emergency
Description This directory provides objectives principles and requirements to enable each NPCC Reliability Coordinator Area to provide reserve and simultaneous activation of reserve
Note‐The Directory 5 revisions was completed during 2012 was approved by NPCC membership and went into place on October 11 2012
NPCC Regional Reliability Reference Directory 6 ndash ldquoReserve Sharing Groupsrdquo Description This directory provides the framework for Regional Reserve Sharing Groups within NPCC It establishes the requirements for any Reserve Sharing Groups involving NPCC Balancing Authorities
NPCC Regional Reliability Reference Directory 8 ‐ System Restoration
Description This directory provides objectives principles and requirements to enable each NPCC Reliability Coordinator Area to perform power system restoration following a major event or total blackout
NPCC Regional Reliability Reference Directory 9‐ Verification of Generator Gross and Net Real Power Capability
Description This document establishes the minimum criteria to verify the Gross Real Power Capability and Net Real Power Capability of generators used to ensure accuracy of information used in the steady‐state and dynamic simulation models to assess the reliability of the NPCC bulk power system
Page 94
NPCC Regional Reliability Reference Directory 10‐ Verification of Generator Gross and Net Reactive Power Capability
Description This document establishes the minimum criteria to verify the Gross Reactive Power Capability and Net Reactive Power Capability of generators used to ensure accuracy of information used in the steady‐state and dynamic simulation models to assess the reliability of the NPCC bulk power system These criteria have been developed to ensure that the requirements specified in NERC Standard MOD‐025‐1 ldquoVerification of Generator Gross and Net Reactive Power Capabilityrdquo are met by NPCC and its applicable members responsible for meeting the NERC standards
NPCC Regional Reliability Reference Directory 12‐Underfrequency Load Shedding Requirements Description This document presents the basic criteria for the design and implementation of under frequency load shedding programs to ensure that declining frequency is arrested and recovered in accordance with established NPCC performance requirements to prevent system collapse due to load‐generation imbalance
A‐10 Classification of Bulk Power System Elements
Description This Classification of Bulk Power System Elements (Document A‐10) provides the methodology for the identification of those elements of the interconnected NPCC Region to which NPCC bulk power system criteria are applicable Each Reliability Coordinator area has an existing list of bulk power system elements The methodology in this document is used to classify elements of the bulk power system and has been applied in classifying elements in each Reliability Coordinator area as bulk power system or non‐bulk power system
C‐05 Monitoring Procedures for Emergency Operation Criteria
Description This procedural document establishes TFCOs monitoring and reporting requirements for conformance with NPCC Regional Reliability Reference Directory 2 ‐ Emergency Operations
C‐07 Monitoring Procedures for Guide for Rating Generating Capability
Description This procedural document establishes the TFCOs monitoring and reporting requirements for conformance with the NPCC Guide for Rating Generating Capability (Document B‐9)
C‐15 Procedures for Solar Magnetic Disturbances on Electrical Power Systems
Page 95
Description This procedural document clarifies the reporting channels and information available to the operator during solar alerts and suggests measures that may be taken to mitigate the impact of a solar magnetic disturbance
C‐17 Procedures for Monitoring and Reporting Critical Operating Tool Failures
The purpose of this document is to outline the reporting requirements responsibilities and obligations of the NPCC Reliability Coordinators (RCrsquos) in response to unforeseen critical operating tool failures
C‐35 NPCC Inter‐Area Power System Restoration Reference Document
Description This procedure provides guidance and training material to the system operator to manage system restoration events that affect the NPCC Reliability Coordinator areas and adjoining Reliability Coordinator areas
C‐36 Procedures for Communications during Emergencies
Description This procedure establishes the types of communications that should take place between Reliability Coordinator area system operators and with external agencies during an emergency It also indicates the data that should be collected during and after a major system event
C‐42 Procedure for Reporting and Reviewing System Disturbances
This document establishes the procedures of the Task Force on Coordination of Operation (TFCO) for reporting and reviewing system disturbances
C‐43 NPCC Operational Review for the Integration of New Facilities
The document provides the procedure to be followed in conducting operations reviews of new facilities being added to the power system This procedure is intended to apply to new facilities that if removed from service may have a significant direct or indirect impact on another Reliability Coordinator arearsquos inter‐Area or intra‐Area transfer capabilities The cause of such impact might include stability voltage andor thermal considerations
C‐44 NPCC Inc Regional Methodology and Procedures for Forecasting TTC and ATC
Description This document establishes a common methodology for calculating Total Transfer Capability (TTC) and Available Transfer Capability (ATC) within the NPCC Region
Page 96
Appendix VI ‐ Web Sites
Independent Electricity System Operator
httpwwwiesoca
ISO‐ New England
httpwwwiso‐necom
MAPP
httpwwwmappcororg
Maritimes
Maritimes Electric Company Ltd
httpwwwmaritimeelectriccom
New Brunswick Power Corporation
httpwwwnbpowercom
New Brunswick System Operator
httpwwwnbsoca
Nova Scotia Power Inc
httpwwwnspowerca
Northern Maine Independent System Administrator
httpwwwnmisacom
Midwest Reliability Organization
wwwmidwestreliabilityorg
National Oceanic and Atmospheric Administration Solar Cycle Sunspots
NPCC CP-8 Working Group 1 RCC Approved - June 13 2012
CP-8 WORKING GROUP
Northeast Power Coordinating Council Inc Phil Fedora Chairman Hydro-Queacutebec Distribution Abdelhakim Sennoun Independent Electricity System Operator Vithy
Vithyananthan ISO - New England Inc Fei Zeng National Grid Jack Martin New Brunswick System Operator Rob Vance New York Independent System Operator Frank Ciani New York State Reliability Council Al Adamson Nova Scotia Power Inc Kamala Rangaswamy Ontario Power Generation Inc Kevan Jefferies
The CP-8 Working Group acknowledges the efforts of Messrs Glenn Haringa and Mark Walling GE Energy and Patricio Rocha PJM and thanks them for their assistance in this analysis
NPCC CP-8 Working Group 2 RCC Approved - June 13 2012
TABLE OF CONTENTS
PAGE EXECUTIVE SUMMARY 4 Introduction 4 Results 4 Conclusions 7 INTRODUCTION 8 MODEL ASSUMPTIONS 9 Load Representation 9 Load Shape 9 Load Forecast Uncertainty 10 Generation 11 Unit Availability 12 Transfer Limits 14 Operating Procedures to Mitigate Resource Shortages 15
Assistance Priority 16 Modeling of Neighboring Regions 16 WINTER 201112 SUMMARY 19 ANALYSIS 22 Winter 201213 Results 22 Base Case Scenario 22
Base Case Assumptions helliphelliphelliphelliphelliphelliphelliphelliphelliphelliphelliphelliphelliphelliphelliphelliphelliphelliphelliphelliphellip 23 Severe Case Scenario 27 Severe Case Assumptionshelliphelliphelliphelliphelliphelliphelliphelliphelliphelliphelliphelliphelliphelliphelliphelliphelliphelliphelliphelliphellip 29 Conclusions 30
NPCC CP-8 Working Group 3 RCC Approved - June 13 2012
APPENDICES PAGE A) OBJECTIVE AND SCOPE OF WORK 31
B) EXPECTED NEED FOR OPERATING PROCEDURES 32 Table 7 - Base Case Assumptions (200304 Load Shape) 32 Table 8 - Severe Case Scenario (200304 Load Shape) 33 C) MULTI-AREA RELIABILITY SIMULATION PROGRAM DESCRIPTION 34
NPCC CP-8 Working Group 4 RCC Approved ndash June 13 2012
EXECUTIVE SUMMARY Introduction
This study estimated the use of NPCC Area Operating Procedures designed to mitigate resource shortages for the winter of 201213 (November 2012 through March 2013) The CP-8 Working Grouprsquos effort is consistent with the CO-12 Working Grouprsquos study NPCC Reliability Assessment for Winter 2012-13 November 2012 1 General Electricrsquos (GE) Multi-Area Reliability Simulation (MARS) program was selected for the analysis GE Energy was retained by NPCC to conduct the simulations
Results For the November 2012 - March 2013 period Figure EX-1a shows the estimated use of the indicated operating procedures under the Base Case assumptions for the expected load level (the expected load level results were based on the probability-weighted average of the seven load levels simulated)
Figure EX-1a Expected Use of Indicated Operating Procedures for Winter 201213
Base Case Assumptions ndash Expected Load Level For the November 2012 - March 2013 period Figure EX-1b shows the estimated use of the indicated operating procedures under the Base Case assumptions for the extreme load level (representing the second to highest load level having approximately a 6 chance of being exceeded) 1 See httpwwwnpccorgdocumentsreportsSeasonalaspx
NPCC CP-8 Working Group 5 RCC Approved ndash June 13 2012
Figure EX-1b Expected Use of the Indicated Operating Procedures for Winter 201213
Base Case Assumptions - Extreme Load Level For the November 2012 - March 2013 period Figure EX-2a shows the estimated use of the indicated operating procedures under the Severe Case assumptions for the expected load level (the expected load level results were based on the probability-weighted average of the seven load levels simulated)
Figure EX-2a Expected Use of the Indicated Operating Procedures for Winter 201213
NPCC CP-8 Working Group 6 RCC Approved ndash June 13 2012
For the November 2012 - March 2013 period Figure EX-2b shows the estimated use of the indicated operating procedures under the Severe Case assumptions for the extreme load level (representing the second to highest load level having approximately a 6 chance of being exceeded)
Figure EX-2b Expected Use of the Indicated Operating Procedures for Winter 201213
NPCC CP-8 Working Group 7 RCC Approved ndash June 13 2012
Conclusions As shown in Figures EX-1a the use of operating procedures designed to mitigate resource shortages is not expected for Queacutebec Ontario the Maritimes New York and New England under the assumed Base Case conditions for the expected load level The expected load level results were based on the probability-weighted average of the seven load levels simulated Figure EX-1b indicates only the Maritimes show a need to implement their operating procedures under Base Case extreme load level conditions Figure EX-2b shows the estimated use of operating procedures for the extreme load level if the severe set of resource unavailability assumptions used in this analysis occurs The extreme load level represents the second to highest load level having approximately a 6 chance of being exceeded Only the Maritimes and Quebec Areas show a need for use of operating procedures in response to a capacity deficiency this winter for these conditions The results for the Maritimes Area are driven by the assumption of continuation of the Pt Lepreau refurbishment outage The results for the Queacutebec Area are driven by the assumed generation reductions from Churchill Falls and La Sarcelle
NPCC CP-8 Working Group 8 RCC Approved ndash June 13 2012
INTRODUCTION
This study estimated the use of NPCC Area operating procedures to mitigate resource shortages for November 2012 through March 2013 The Working Grouprsquos efforts are consistent with the NPCC CO-12 Working Grouprsquos study NPCC Reliability Assessment for Winter 2012-13 November 2012 1 The development of this Working Grouprsquos assessment was in response to the following recommendation from the NPCC Reliability Assessment for Winter 200405 1
ldquoThe CO-12 assessment of the Summer Operating Period is accompanied by a corresponding multi area probabilistic assessment of Loss of Load Expectations and of the projected use of Operating Procedures designed to mitigate resource shortages This assessment was not performed for this Winter Operating Period For completeness in the assessment of the Winter Operating Period the CO-12 Working Group recommends that TFCO and TFCP review the merits of having this assessment performed for future Winter Operating Periodsrdquo
The database developed by the CP-8 Working Group for the NPCC Reliability Assessment for Summer 2012 April 2012 2 was used as the starting point for this analysis Working Group members reviewed the existing data and made revisions to reflect the conditions expected for the winter 201213 assessment period This report is organized in the following manner after a brief introduction specific model assumptions are presented followed by an analysis of the results based on the scenarios simulated The Working Groups Objective and Scope of Work is shown in Appendix A Tables presenting the corresponding results for the Base Case and Severe Case simulations are listed in Appendix B Appendix C provides an overview of General Electrics Multi-Area Reliability Simulation (MARS) Program version 314 was used for this assessment
2 See httpswwwnpccorgLibrarySeasonal20AssessmentNPCC_2012_Summer_Reliability_Assessment_Final_Reportpdf - Appendix VIII
NPCC CP-8 Working Group 9 RCC Approved ndash June 13 2012
MODEL ASSUMPTIONS
Load Representation The loads for each Area were modeled on an hourly chronological basis The MARS program modified the input hourly loads through time to meet each Areas specified annual or monthly peaks and energies Table 1 summarizes each NPCC Areas winter peak load assumptions for the winter 201213
Table 1 Assumed NPCC 201213 Peak Loads ndash MW
(200304 Load Shapes)
200304 Load Shape
Area Expected
Peak Extreme Peak
Month
Queacutebec (Q) 37262 40616 January
Maritimes Area (MT) 5209 5730 February
New England (NE) 22355 23211 January
New York (NY) 26794 27625 January
Ontario (ON) 22194 22995 January
Extreme Peak based on load forecast uncertainty for peak month Maritimes Area represents New Brunswick Nova Scotia Prince Edward Island and the
system administrated by the Northern Maine Independent System Administrator (NMISA)
Load Shape In 2006 the Working Group considered two load shape assumptions for the winter multi-area assessment
bull a 200203 load shape representative of a winter weather pattern with a typical expectation of cold days and
bull a 200304 load shape representative of a winter weather pattern that includes a consecutive period of cold days
Review of the results for both load shape assumptions indicated only slight differences in the results The Working Group agreed that the weather patterns associated with the 200304 load shape are representative of weather conditions that stress the system appropriate for use in future winter assessments Upon review of subsequent winter weather experience the Working Group agreed that the 200304 load shape assumption be again used for this analysis
NPCC CP-8 Working Group 10 RCC Approved ndash June 13 2012
The growth rate in each monthrsquos peak was used to escalate Area loads to match the Areas winter demand and energy forecasts The impacts of Demand-Side Management programs were included in each Areas load forecast Figure 1 shows the diversity in the NPCC area load shapes used in this analysis for the 200304 load shape assumptions
Figure 1 ndash 201112 Projected Monthly Peak Loads for NPCC Areas
(200304 Load Shape)
Load Forecast Uncertainty Peak load forecast uncertainty was also modeled The effects on reliability of uncertainties in the peak load forecast due to weather andor economic conditions were captured through the load forecast uncertainty model in MARS The program computes the reliability indices at each of the specified load levels (for this study seven load levels were modeled) and calculates weighted-average values based on input probabilities of occurrence While the per unit variations in the load can vary on a monthly basis Table 2 shows the values assumed for January 2013 Table 2 also shows the probability of occurrence assumed for each of the seven load levels modeled
NPCC CP-8 Working Group 11 RCC Approved ndash June 13 2012
In computing the reliability indices all of the Areas were evaluated simultaneously at the corresponding load level the assumption being that the factors giving rise to the uncertainty affect all of the Areas at the same time The amount of the effect can vary according to the variations in the load levels
For this study reliability measures are reported for two load conditions expected and extreme The values for the expected load conditions are derived from computing the reliability at each of the seven load levels and computing a weighted-average expected value based on the specified probabilities of occurrence The indices for the extreme load conditions provide a measure of the reliability in the event of higher than expected loads and were computed for the second-to-highest load level These values are highlighted in Table 2
Table 2 Per Unit Variation in Load Assumed for the Month of January 2013
Area Per-Unit Variation in Load
Q 10914 10900 10406 09989 09594 09192 09086
MT 11000 11000 10500 10000 09500 09000 09000
NE 10934 10383 09971 09635 09402 08500 08000
NY 10430 10310 10160 09980 09750 09440 09050
ON 10541 10361 10180 10000 09820 09639 09459
Prob 00062 00606 02417 03830 02417 00606 00062 Generation Tables 3(a) and 3(b) summarize the winter 201213 capacity assumptions for the NPCC Areas used in the analysis for the Base Case and the Severe Case Scenario respectively Base Case conditions are consistent with the assumptions used in the NPCC CO-12 Working Group NPCC Reliability Assessment for Winter 2012-13 November 2012
Reserve () 9 39 55 50 43 Annual Weighted Average Unit Availability ()
9859 9046 8768 8487 8576
Scheduled Maintenance 5
20 623 2140 25
Table 3 (b) NPCC Capacity and Load Assumptions for January 2013 - MW
Severe Assumptions Scenario - Extreme Load Q MT NE NY ON
Assumed Capacity 36405 6841 30712 3 39272 29800 3
PurchaseSale 1995 0 429 -456 0
Peak Load 4 40616 5655 23211 27625 22995
Demand Response (MW) 1302 0 863 1081 1166
Reserve () -2 21 38 44 35 Scheduled Maintenance 5
680 621 3169 1117
Unit Availability Details regarding the NPCC Arearsquos assumptions for generator unit availability are described in the respective Arearsquos most recent NPCC Comprehensive Review of Resource Adequacy 6 In addition the following Areas provided the following
3 Does not include demand-side resources 4 Based on the 200304 Load Shape assumption internal Queacutebec load shown 5 Maintenance shown is for the week of the monthly peak load Capacity shown for Queacutebec adjusted for
scheduled maintenance and other restrictions 6 See httpwwwnpccorgdocumentsreviewsResourceaspx
NPCC CP-8 Working Group 13 RCC Approved ndash June 13 2012
Queacutebec The planned outages for the winter period are reflected in this assessment The volume of planned outages is consistent with historical volumes Ontario Ontariorsquos generating unit availability was based on IESO ldquo18-Month Outlook An Assessment of the Reliability and Operability of the Ontario Electricity System from June 2012 ndash November 2013rdquo 7 Ontario market participants provided the majority of generation data Forced Outage Rates (FOR) and Planned Outage Rates (POR) were based on forecast values for generating units which reflect past experience and future expectations based on recent maintenance activities However for some of the generating units FOR and POR values were based on North American Reliability Council (NERC) Generator Availability Data System 8 (GADs) data for similar type units New England This probabilistic assessment reflects New England generating unit availability assumptions based upon historical performance over the prior five-year period Unit availability modeled reflects the projected scheduled maintenance and forced outages Individual generating unit maintenance assumptions are based upon each unitrsquos historical five-year average of scheduled maintenance Individual generating unit forced outage assumptions were based on the unitrsquos historical data and North American Reliability Council (NERC) average data for the same class of unit A more detailed description of the modeling assumptions can be found by referring to the corresponding FERC filings concerning the ISO-New England Installed Capacity Requirement and related values for the 3rd Reconfiguration Auction for the 20122013 Capability Year 9 New York Detailed availability assumptions used for the New York units can be found in the New York ISO Technical Study Report 10 Locational Minimum Installed Capacity Requirements Study covering the New York Control Area for the 2012 ndash 2013 Capability Year and the ldquoNew York Control Area Installed Capacity Requirement for the Period May 2012-April 2013rdquo New York State Reliability Council December 2 2011 report 11 7 See httpiesocaimowebpubsmarketReports18MonthOutlook_2012febpdf 8 See httpwwwnerccompagephpcid=4|43 9 See httpwwwiso-necomregulatoryfercfilings2011nover12-496-000_11-30-11_icr_2012-2013pdf 10 See httpwwwnyisocompublicmarkets_operationsservicesplanningplanning_studiesindexjsp 11 See httpwwwnysrcorgpdfReports201220IRM20Final20Reportpdf
NPCC CP-8 Working Group 14 RCC Approved ndash June 13 2012
Transfer Limits Figure 2 depicts the system that was represented in this Assessment showing Area and assumed Base Case transfer limits for the winter 201213 period New York Area internal transmission representation was consistent with the assumptions used in the New York ISO report 10 - Locational Minimum Installed Capacity Requirements Study covering the New York Control Area for the 2012 ndash 2013 Capability Year and the ldquoNew York Control Area Installed Capacity Requirements for the Period May 2012 ndash April 2013rdquo New York State Reliability Council December 2 2011 report 11
The New England internal transmission representation is consistent with assumptions currently being developed for the 2012 New England Regional System Plan 12
Figure 2 - Assumed Transfer Limits Between Areas
12 The New England Regional System plans can be found at httpwwwiso-necomtransrsp2009indexhtml
The transfer capability is 1000 MW However it was modeled as 700 MW to reflect limitations imposed by internal New England constraints
The transfer capability in this direction reflects limitations imposed by internal New England constraints
NPCC CP-8 Working Group 15 RCC Approved ndash June 13 2012
Tie transfer limits between Areas are indicated in Figure 2 with seasonal ratings (S- summer W- winter) where appropriate The acronyms and notes used in Figure 2 are defined as follows Chur - Churchill Falls NOR - Norwalk ndash Stamford RFC - ReliabilityFirst Corp MANIT - Manitoba BHE - Bangor Hydro Electric NB - New Brunswick ND - Nicolet-Des Cantons Mtl - Montreacuteal PEI - Prince Edward Island JB - James Bay C MA - Central MA CT - Connecticut MAN - Manicouagan W MA - Western MA NS - Nova Scotia NE - Northeast (Ontario) NBM - Millbank NW - Northwest (Ontario) MRO - Midwest Reliability VT - Vermont CSC - Cross Sound Cable
Organization Que - Queacutebec Centre Cdrs - Cedars NM - Northern Maine Centre Phase angle regulators (PARs) are installed on the Ontario ndash Michigan interconnection at Lambton Transformer Station (L4D and L51D) and Keith (J5D) on the Ontario side and at Bunce Creek Transformer Station (B3N) in Michigan representing the four interconnections with Michigan Final regulatory approvals have been received permitting operation of these facilities Operating Procedures to Mitigate Resource Shortages Each Area takes defined steps as their reserve levels approach critical levels These steps consist of those load control and generation supplements that can be implemented before firm load has to be actually disconnected Load control measures could include disconnecting interruptible loads public appeals to reduce demand and voltage reductions Other measures could include calling on generation available under emergency conditions andor reduced operating reserves The need for an Area to begin these operating procedures is modeled in MARS by evaluating the daily Loss of Load Expectation (LOLE) at specified margin states The user specifies these margin states for each area in terms of the benefits realized from each emergency measure which can be expressed in MW as a per unit of the original or modified load and as a per unit of the available capacity for the hour
Table 4 summarizes the load relief assumptions modeled for each NPCC Area The Working Group recognizes that Areas may invoke these actions in any order depending on the situation faced at the time however it was agreed that modeling the actions as in the order indicated in Table 4 was a reasonable approximation for this analysis
NPCC CP-8 Working Group 16 RCC Approved ndash June 13 2012
Table 4 - NPCC Operating Procedures to Mitigate Resource Shortages
201213 Winter Load Relief Assumptions - MW Actions Q MT NE 13 NY ON
1 Curtail Load Utility Surplus Appeals RT-DR SCR EDRP SCR Load Man Volt Red
1302 0 0 0
0 0 0 0
0 0
495 0
0 0
1384 021
148 100
0 0
2 No 30-min Reserves 500 234 600 600 473
3 Voltage Reduction Interruptible Load 14
250 0
0 285
322 0
124 0
0 0
4 No 10-min Reserves RT-EG 15
Appeals Curtailments
750 0 0
660 0 0
0 268
0
0 0
231
1081 0 0
5 5 Voltage Reduction No 10-min Reserves
0 0
0 0
0 1200
0 1200
260 0
Real-Time Demand Response
Assistance Priority All Areas received assistance on a shared basis in proportion to their deficiency In this analysis each step was initiated simultaneously in all Areas and sub-Areas Modeling of Neighboring Regions For the scenarios studied a detailed representation of RFC (ReliabilityFirst Corp) and the MRO-US (Midwest Reliability Organization ndash US portion) was modeled The assumptions are summarized in Table 5
Figure 3 shows the 201213 Projected Monthly Expected Peak Loads for NPCC PJM RFC-OTH (Other) and the MRO for the 200304 Load Shape assumption 13 Values for New Englandrsquos Real-Time Demand Resources and Real-Time Emergency Generation have
been derated to account for historical availability performance 14 Interruptible Loads for Maritimes Area (implemented only for the Area) Voltage Reduction for all
NPCC CP-8 Working Group 18 RCC Approved ndash June 13 2012
Figure 3 ndash 201213 Projected Monthly Expected Peak Loads (200304 Load Shape) ReliabilityFirst is the successor organization to the Mid-Atlantic Area Council (MAAC) the East Central Area Coordination (ECAR) Agreement and the Mid-American Interconnected Network (MAIN) organizations The RFC-OTH (Other) area modeled in this analysis was intended to represent the non-PJM RTO region data within RFC The modeling of the RFC region is in transition due to changes in the regional boundaries between RFC MRO and SERC This model was based on publicly available data from the NERC Electricity Supply amp Demand (ESampD) provided by PJM The modeling of RFC-OTH is expected to evolve for future studies as data reflecting the new regional boundaries becomes available For now the RFC-OTH area is the non-PJM RTO region that was formerly in either MAIN or ECAR The MAIN and ECAR boundaries do not correctly define the new RFC boundaries but this definition insures consistency within the use of the NERC ESampD data
NPCC CP-8 Working Group 19 RCC Approved ndash June 13 2012
WINTER 201112 SUMMARY Major Weather Highlights On average the 2011-2012 winter was a mild one for the contiguous United States NOAArsquos National Climatic Data Center 17 reported that December January and February (the meteorologicalrdquo winter for 2011-2012) was the fourth warmest of the past 117 winters The seasonal average temperature was 368 degrees Fahrenheit which is 39 degrees above the 20th century average The most unusually warm temperatures were found in the northern states especially in the northern Great Plains NOAArsquos National Climatic Data Center explained the reason for the pattern the jet stream stayed farther north than usual this winter The high-altitude winds of the jet stream generally mark the boundary between Arctic air to the north and warmer air to the south That position allowed warm southern air to prevail over the entire US and prevented cold fronts from descending from the north and clashing with warm fronts creating large snow- and rainstorms The jet stream was locked in that position for most of the winter 18 According to the National Oceanic and Atmospheric Administration more than 95 percent of the US had below-average snow cover the greatest such percentage ever recorded Load Comparison Table 6 compares NPCC Arearsquos actual 2011-12 winter peak demands against the forecast assumptions Except for the Maritimes the moderate winter temperatures coupled with the on-going economic recession and implementation of conservation programs resulted in less demand than forecast for all NPCC sub regions for the winter of 2011-12
17 See httpwwwclimatewatchnoaagovarticle2012u-s-has-fourth-warmest-winter-on-record-west-southeast-drier-than-average 18 See httpwwwscientificamericancomarticlecfmid=whats-causing-dry-winter
NPCC CP-8 Working Group 20 RCC Approved ndash June 13 2012
Table 6 Comparison of NPCC 201112 Actual and Forecast Peak Loads ndash MW
Date Actual
(MW)
Forecast
(Based on 200304 Load Shape)
Area Expected
Peak Extreme
Peak Month
Queacutebec Jan 16 2012 35481 37232 39782 January Maritimes Area
Feb 13 2012 5552 5464 6010 February
New England Jan 4 2012
19908
22225 23107 January
New York Jan 3 2012 23901 26174 26985 January
Ontario Jan 3 2012 21649 22270 23510 January
Queacutebec Winter 2011‐2012 was much warmer than normal In Montreacuteal average temperatures for winter were 34 degC (61 degF) higher than mean temperatures This was the warmest winter since 2001‐2002 and the second warmest since 1942 Internal demand was correspondingly low Only ten peak days showed demand values above 33000 MW Internal peak hourly demand for winter 2011‐2012 was established to be 35481 MW on Monday January 16 2012 at 8h00 EST This value includes 1388 MW of interruptible demand that was used at the time Therefore actual metered demand (Served Internal Demand) was 34093 MW at peak The annual forecast was 37209 MW Transfers to neighboring areas at the time of peak were 3512 MW Montreacuteal temperature at peak time was ‐18 degC (‐04 degF) and wind speed was 9 kmhour (6 mph) Temperatures in most other areas of the province were somewhat colder than in Montreacuteal but nowhere near usual peak period temperatures Thirty‐minute operating reserve at peak time was 2711 MW 1211 MW over the reserve requirement No particular transmission condition that affected internal demand or firm transactions occurred during the 2011 - 2012 winter period Maritimes The Maritimes Area load is the mathematical sum of the forecasted or actual peak loads of the sub-areas (New Brunswick Nova Scotia Prince Edward Island and the area served by the Northern Maine Independent System Operator)
NPCC CP-8 Working Group 21 RCC Approved ndash June 13 2012
It was a milder than usual winter and no reliability issues occurred in the Maritime Provinces The actual winter peak was 5375 MW and occurred on February 13 2012 The Maritime Provinces did not experience any unexpected extreme or adverse weather conditions and did not require use of its Demand Response measures New England Within New England during the 20112012 winter period there were no major operational issues that impacted system reliability The 20112012 actual New England winter peak of 19908 MW (21333 MW with passive demand resources added back in) occurred on January 4 2012 19 Implementation of Operating Procedure 4 (OP 4) was not required at the time of the peak However OP 4 was implemented on the morning of December 19 2011 due to forced generator reductionsoutages and loads running over the forecast New York The actual system coincident peak for the 20102011 winter was 23901 MW which occurred on January 3 2012 New York did not experience any significant operating issues during the winter 20112012 season Ontario The actual winter peak demand of 21649 MW occurred on January 3 2012 Ontario did not experience any significant operating issues during the 20112012 winter period
19 See httpwwwiso-necomtransceltfsct_detail2012winter_pknormal_2011-2012pdf
NPCC CP-8 Working Group 22 RCC Approved ndash June 13 2012
ANALYSIS
Winter 201213 Results Base Case Scenario Table 7 (see Appendix B) shows the estimated need for the indicated operating procedures (in daysperiod) for November 2012 through March 2013 period for the Base Case assumptions for all NPCC Areas for the 200304 load shape assumptions Figure 4(a) shows the estimated use of operating procedures occurrences for the NPCC Areas for the expected load (the expected load level results were based on the probability-weighted average of the seven load levels simulated) for the Base Case assumptions The results indicate that only the Maritimes Area has a chance to use these procedures in response to a capacity deficiency Figure 4(b) shows the corresponding results for the extreme load (representing the second to highest load level having approximately a 6 chance of being exceeded)
Figure 4a Estimated Use of the Indicated Operating Procedures for Winter 201213
Base Case Assumptions - Expected Load Level
Maritimes Area initiates interruptible loads instead of voltage reduction
NPCC CP-8 Working Group 23 RCC Approved ndash June 13 2012
Figure 4b Estimated Use of the Indicated Operating Procedures for Winter 201213
Base Case Assumptions Extreme Load Level
Base Case Assumptions The following summary of Base Case assumptions represents system conditions consistent with those assumed in the NPCC CO-12 Working Groups Reliability Assessment for Winter 2012-13 November 2012 The Base Case assumptions are summarized below System - As-Is System for the 2012-2013 period - Transfers allowed between Areas - 200304 Load Shape adjusted to Arearsquos year 2012 forecast (expected amp extreme
assumptions) 20
Ontario - Forecast consistent with the IESOrsquos 18-Month Outlook ndash (June 2012) 7
- 1511 MW of installed Wind Generation (seasonal wind capacity contribution of 336 at peak)
NPCC CP-8 Working Group 24 RCC Approved ndash June 13 2012
- Michigan ndash Ontario Phase Angle Regulators PARs on J5D L51D B3N and L4D are in-service
- BP76 (Ontario to New York 230 kV tie line) returns to service end of 2012 New England
- ~ 34515 MW of existing and planned generation resources modeled - ~ 1920 MW of demand supply resources modeled - ~ 575 MW of capacity import - ~2000 MW of gas-fired generation unavailable
New York - All cables in service - Assumptions consistent with the NYCA Installed Capacity Requirements for the Period
May 2012 through April 2013 - ~ 2165 MW of registered SCR resources discounted to historic availability (~1400
MW)
Maritimes - Point Lepreau Nuclear Generating Station returns to service October 1 2012 - 816 MW installed wind capacity in service prior to winter season - New hourly wind profile for each sub-area Queacutebec - Resources and load forecast consistent with Queacutebec 2011 Comprehensive Review -
including about 1500 MW of scheduled maintenance and restrictions - Trans-Canada Energy (TCE) Gas GS (547 MW) mothballed - Tracy thermal GS (450 MW) and La Citiegravere thermal GS are retired (280 MW) - 1835 MW of installed wind generation (520 MW modeled representing 30 value at
peak) and 104 MW derated by 100 - 150 MW of additional interruptible load expected for the winter period - 398 MW of firm capacity exports - 1100 MW of available capacity imports
PJM-RTO - As-Is System for the 201213 winter period ndash consistent with the PJM 2011 Reserve
Requirement Study 21 - 200304 Load Shapes adjusted to the 2012 forecast provided by PJM - Load forecast uncertainty of 9413 +- 505 1010 and 1515 - Operating Reserve 3400 MW (30-min 2765 MW 10-min 635 MW)
21 2011 PJM Reserve Requirement Study (RRS) dated October 13 2011 - available at this link on PJM
Web site httppjmcomplanningresource-adequacy-planning~mediaplanningres-adeq2011-rrs-studyashx
NPCC CP-8 Working Group 25 RCC Approved ndash June 13 2012
- 0 MW of Demand Response (DR) RFC lsquoOtherrsquo 22 - As-Is System for the 201213 winter period ndash based on NERC ESampD database updated
by the respective ISOs compiled by PJM staff - 200304 Load Shapes adjusted to the most recent monthly forecast provided by PJM - Load forecast uncertainty of 9401 +- 515 1030 and 1544 - Operating Reserve 2206 MW (30-min 1470 MW 10-min 736 MW)
MRO-US - As-Is System for the 201213 winter period - based on NERC ESampD database updated
by the respective ISOs compiled by PJM staff - 200304 Load Shapes adjusted to the most recent monthly forecast provided by PJM - Load forecast uncertainty of 9430 +- 490 981 and 1471 - Operating Reserve 1700 MW (30-min 1200 MW 10-min 500 MW)
New York Details The Base Case assumes that the New York City and Long Island localities will meet their locational installed capacity requirements as described in the New York ISO report - Locational Installed Capacity Requirements Study covering the New York Control Area for the 2012 ndash 2013 Capability Year and New York State will meet the capacity requirements described in the ldquoNew York Control Area Installed Capacity Requirements for the Period May 2012 ndash April 2013rdquo New York State Reliability Council December 2 2011 Technical Study Report The New York unit ratings were obtained from the ldquo2012 Load amp Capacity Data of the NYISOrdquo (Gold Book 23) Existing Resources All in-service New York generation resources were modeled Wind resources exhibit daily output variation that correlates to wind speed and density One approach would be to model wind resources with 90 summer and 70 winter derate factors The NYISONYSERDA Wind Study Phase 2 prepared by GE Energy Consulting 24 have shown these availability factors may be appropriate However the MARS model only captures monthly rating changes and not the daily changes necessary to accurately model this variation
22 ldquoRFC Otherrdquo refers to previous (before RFC ndash circa 2006) NERC regional boundaries of ECAR and MAIN excluding PJMrsquos territory 23 See httpwwwnyisocompublicwebdocsservicesplanningplanning_data_reference_documents2011_GoldBook_Public_Finalpdf 24 See httpwwwnyisocompublicservicesplanningspecial_studiesjsp
NPCC CP-8 Working Group 26 RCC Approved ndash June 13 2012
The NYISOrsquos approach is to model wind resources as load modifiers with a 90 summer derate factor Hourly wind readings taken at or near each wind resource are converted to hourly unit MW output Wind density turbine height and other factors are taken into account These hourly MW output values are then netted against the hourly zonal load New York uses historic hourly wind readings taken in 2002 This wind study year also corresponds to the base hourly load shape year used in this assessment Special Case Resources and Emergency Demand Response Programs Special Case Resources (SCRs) are loads capable of being interrupted and distributed generators rated at 100 kW or higher that are not directly telemetered SCRs offer load curtailment as ICAP resources and provide energyload curtailment when activated in accordance with the NYISO Emergency Operating Manual SCRs are required to respond to a deployment request for a minimum of four hours however there is no limit to the number of calls or the time of day in which the Special Case Resources may be deployed SCRs receive a capacity payment for load curtailment capability sold in the ICAP market and an energy payment for energy performance during a demand response event The Emergency Demand Response Program (EDRP) is a voluntary reliability program that allows registered interruptible loads and standby generators when activated in accordance with the NYISO Emergency Operating Manual EDRP resources are only paid for their energy performance during a demand response event There is no limit to the number of calls or the time of day in which EDRP resources may be deployed SCRs and EDRPs are modeled as an operating procedure step activated to minimize the probability of customer load disconnection The GE-MARS models the NYISO operations practice of only activating operating procedures in zones from which are capable of being delivered 2165 MW of registered SCR were discounted to historic availability (1316 MW January) 148 MW of load reduction from EDRP was discounted to historic availability (68 MW January) New England Details The New England generating unit ratings are consistent with their seasonal capability for the 2012 CELT report
Demand Supply Resources The passive non-dispatchable demand resources On-Peak and Seasonal-Peak are expected to provide ~962 MW of load relief during the peak hours About 958 MW of active demand resources including Real-Time Demand Resources and Real-Time Emergency Generation Resources provide additional real time peak load relief at a request by ISO New England during or in anticipation of expected operable capacity
NPCC CP-8 Working Group 27 RCC Approved ndash June 13 2012
shortage conditions to implement ISO-NE Operating Procedure No 4 Actions During a Capacity Deficiency These demand resources are discounted in the assessment to account for performance based on the observed availability factors of demand response programs in the past Ontario Details For the purposes of this study the Base Case assumptions for Ontario are consistent with the IESO ldquo18-Month Outlook An Assessment of the Reliability and Operability of the Ontario Electricity Systemrdquo (June 2012)7 but with the resource additions as shown below Existing Resources All in-service Ontario generation resources were modeled 2012 Resource Additions
Project Name Zone Fuel Type Estimated Effective
Date
Planned (MW)
Comber Wind Limited Partnership West Wind 2012-Q2 166 Pointe Aux Roches Wind West Wind 2012-Q2 49 Bruce Unit Bruce Uranium 2012-Q3 750
For the purposes of this assessment the IESO assumed that wind generation has a dependable contribution of 336 of the installed generation capacity All of the dispatchable demand response resources in Ontario total 1315 MW for the winter period In addition the study assumed 188 MW is available from Utility Surplus (aka ldquoStretchrdquo Capability) called as a part of operating procedures
Severe Case Scenario Table 8 (see Appendix B) shows the estimated need for the indicated operating procedures (in daysperiod) during November 2012 through March 2013 period for the Severe Case Scenario for all NPCC Areas for the 200304 load shape assumptions respectively Only the Maritimes Area is expected to need to use these procedures in response to a capacity deficiency for this Scenario Figure 5(a) shows the estimated use of operating procedures occurrences for the NPCC Areas for the expected load (the expected load level results were based on the probability-weighted average of the seven load levels simulated) for the Severe Case assumptions
NPCC CP-8 Working Group 28 RCC Approved ndash June 13 2012
Figure 5a Estimated Use of the Indicated Operating Procedures for Winter 201213
Severe Case Assumptions - Expected Load Level
Figure 5(b) shows the estimated use of the indicated operating procedures under the Severe Case assumptions for the extreme load level (representing the second to highest load level having approximately a 6 chance of being exceeded)
Figure 5b Estimated Use of the Indicated Operating Procedures for Winter 201213
NPCC CP-8 Working Group 29 RCC Approved ndash June 13 2012
Severe Case Assumptions The Severe Case Scenario assumptions are summarized below
System - As-Is System for the 201213 period - Transfers allowed between Areas - Transfer capability between NPCC and MRORFC- lsquoOtherrsquo reduced by 50 - 200304 Load Shape adjusted to Arearsquos year 2012 forecast (expected amp extreme
assumptions) 25 Ontario - ~1000 MW of maintenance extended into the winter period - Only existing Demand Response of 1141 MW modeled - Hydro electric capacity and energy 10 lower than the Base Case - Niagara ndash New York interconnection Limits reduced for the winter period (BP76
(Ontario to New York 230 kV tie line) outage continues) New England - Assume 50 reduction in Demand Resources - Maintenance overrun by 4 weeks - ~ 3800 MW of gas-fired generation unavailable
New York - Extended maintenance of 1000 MW in southeastern New York - 25 reduction in effectiveness of SCR and EDRP programs - 330 MW of assumed cable transmission transfer reduction resulting from component
failures within the Neptune and Cross Sound HVDC facilities
Maritimes - Point Lepreau Nuclear Generating Station returns to service April 1 2013 - 816 MW installed wind capacity in service prior to winter season - New hourly wind profile for each sub-area with the output from wind generation
reduced by half for the three winter months of December January and February Queacutebec - ~1000 MW reduction from Churchill Falls and 100 MW from La Sarcelle assumed PJM-RTO - Gas-fired only capacity not having firm pipeline transportation assumed ~4200 MW
unavailable - One percent increase in load forecast uncertainty - Ice Storm ice blocking fuel delivery to all units Unit outage event ~8400 MW 25 The 200304 load shape represents a weather pattern that includes a consecutive period of cold days
NPCC CP-8 Working Group 30 RCC Approved ndash June 13 2012
Conclusions The use of operating procedures designed to mitigate resource shortages is not expected for Queacutebec Ontario the Maritimes New York and New England under both the assumed Base Case conditions for the expected load level The expected load level results were based on the probability-weighted average of the seven load levels simulated Only the Maritimes show a need to implement their operating procedures under Base Case extreme load level conditions The Maritimes and Queacutebec Areas show a need for use of operating procedures in response to a capacity deficiency this winter for the extreme load level if the severe set of resource unavailability assumptions used in this analysis occurs The extreme load level represents the second to highest load level having approximately a 6 chance of being exceeded The results for the Maritimes Area are driven by the assumption of continuation of the Pt Lepreau refurbishment outage The results for the Queacutebec Area are driven by the assumed generation reductions from Churchill Falls and La Sarcelle
NPCC CP-8 Working Group 31 RCC Approved ndash June 13 2012
APPENDIX A
Objective and Scope of Work 1 Objective Using the GE Multi-Area Reliability Simulation (MARS) program review NPCC Area reliability resulting from the anticipated resource and transmission capacity reported for the 2012 ndash 2013 winter period under Base Case and Severe Case assumptions and summarize the range of results for the winter and shoulder season months (the period from November 2012 to March 2013) 2 Scope In meeting this objective the CP-8 Working Group will review the short-term resource adequacy of NPCC and neighboring regions for the 2012 and 2013 winter period recognizing uncertainty in forecasted demand scheduled outages of transmission forced and scheduled outages of generation facilities including fuel supply disruptions and the impact of proposed load response programs Reliability will be measured by calculating the estimated use of Area operating procedures used to mitigate resource shortages The results of the assessment will be approved no later than June 2012 The assessment will
bull Review last winterrsquos CP-8 Working Group Winter assessment with respect to actual NPCC Arearsquos experience
bull Consider the impacts of Sub-Area transmission constraints bull Incorporate to the extent possible a detailed GE MARS reliability representation
for the regions bordering NPCC bull Coordinate assessment assumptions with the NPCC Task Force on Coordination
of Operations (CO-12 Working Group) and bull Examine any impact of evolving market rules on overall NPCC interconnection
NPCC CP-8 Working Group 32 RCC Approved ndash June 13 2012
APPENDIX B
Table 7 - Base Case Assumptions (200304 Load Shape Assumption) Expected Need for Indicated Operating Procedures (daysperiod)
(Occurrences 05 or greater are highlighted)
Base Case Queacutebec Maritimes Area New England New York Ontario 30-min VR 10-min Appeal 30-min IL 10-min Appeal 30-min VR 10-min Appeal Disc 30-min VR Appeal 10-min Disc 30-min VR 10-min Appeal Disc Disc Disc 0304 Load Shape-Expected Load
NPCC CP-8 Working Group 34 RCC Approved ndash June 13 2012
APPENDIX C
Multi-Area Reliability Simulation Program Description General Electricrsquos Multi-Area Reliability Simulation (MARS) program 26 allows assessment of the reliability of a generation system comprised of any number of interconnected areas Modeling Technique A sequential Monte Carlo simulation forms the basis for MARS The Monte Carlo method allows for many different types of generation and demand-side options In the sequential Monte Carlo simulation chronological system histories are developed by combining randomly generated operating histories of the generating units with the inter-area transfer limits and the hourly chronological loads Consequently the system can be modeled in great detail with accurate recognition of random events such as equipment failures as well as deterministic rules and policies that govern system operation Reliability Indices The following reliability indices are available on both an isolated (zero ties between areas) and interconnected (using the input tie ratings between areas) basis
Daily Loss of Load Expectation (LOLE - daysyear)
Hourly LOLE (hoursyear)
Loss of Energy Expectation (LOEE -MWhyear)
Frequency of outage (outagesyear)
Duration of outage (hoursoutage)
Need for initiating Operating Procedures (daysyear or daysperiod)
The Working Group used both the daily LOLE and Operating Procedure indices for this analysis
The use of Monte Carlo simulation allows for the calculation of probability distributions in addition to expected values for all of the reliability indices These values can be calculated both with and without load forecast uncertainty The MARS program probabilistically models uncertainty in forecast load and generator unit availability The program calculates expected values of Loss of Load Expectation (LOLE) and can estimate each Areas expected exposure to their Emergency Operating Procedures Scenario analysis is used to study the impacts of extreme weather conditions variations in expected unit in-service dates overruns in planned scheduled maintenance or transmission limitations 26 See httpwwwgepowercomprod_servproductsutility_softwareenge_marshtm
NPCC CP-8 Working Group 35 RCC Approved ndash June 13 2012
APPENDIX C Resource Allocation Among Areas The first step in calculating the reliability indices is to compute the area margins on an isolated basis for each hour This is done by subtracting from the total available capacity in the area for the hour the load demand for the hour If an area has a positive or zero margin then it has sufficient capacity to meet its load If the area margin is negative the load exceeds the capacity available to serve it and the area is in a loss-of-load situation If there are any areas that have a negative margin after the isolated area margins have been adjusted for curtailable contracts the program will attempt to satisfy those deficiencies with capacity from areas that have positive margins Two methods are available for determining how the reserves from areas with excess capacity are allocated among the areas that are deficient In the first approach the user specifies the order in which an area with excess resources provides assistance to areas that are deficient The second method shares the available excess reserves among the deficient areas in proportion to the size of their shortfalls The user can also specify that areas within a pool will have priority over outside areas In this case an area must assist all deficient areas within the same pool regardless of the order of areas in the priority list before assisting areas outside of the pool Pool-sharing agreements can also be modeled in which pools provide assistance to other pools according to a specified order Generation MARS has the capability to model the following different types of resources
Thermal
Energy-limited
Cogeneration
Energy-storage
Demand-side management
An energy-limited unit can be modeled stochastically as a thermal unit with an energy probability distribution (Type 1 energy-limited unit) or deterministically as a load modifier (Type 2 energy-limited unit) Cogeneration units are modeled as thermal units with an associated hourly load demand Energy-storage and demand-side management impacts are modeled as load modifiers For each unit modeled the installation and retirement dates and planned maintenance requirements are specified Other data such as maximum rating available capacity states state transition rates and net modification of the hourly loads are input depending on the unit type The planned outages for all types of units in MARS can be specified by the user or automatically scheduled by the program on a weekly basis The program schedules planned maintenance to levelize reserves on either an area pool or system basis MARS also has the option of reading a maintenance schedule developed by a previous run and modifying it as specified by the user through any of the maintenance input data This schedule can then be saved for use by subsequent runs
NPCC CP-8 Working Group 36 RCC Approved ndash June 13 2012
APPENDIX C Thermal Unit In addition to the data described previously thermal units (including Type 1 energy-limited units and cogeneration) require data describing the available capacity states in which the unit can operate This is input by specifying the maximum rating of each unit and the rating of each capacity state as a per unit of the units maximum rating A maximum of eleven capacity states are allowed for each unit representing decreasing amounts of available capacity as governed by the outages of various unit components Because MARS is based on a sequential Monte Carlo simulation it uses state transition rates rather than state probabilities to describe the random forced outages of the thermal units State probabilities give the probability of a unit being in a given capacity state at any particular time and can be used if you assume that the units capacity state for a given hour is independent of its state at any other hour Sequential Monte Carlo simulation recognizes the fact that a units capacity state in a given hour is dependent on its state in previous hours and influences its state in future hours It thus requires the additional information that is contained in the transition rate data For each unit a transition rate matrix is input that shows the transition rates to go from each capacity state to each other capacity state The transition rate from state A to state B is defined as the number of transitions from A to B per unit of time in state A Number of Transitions from A to B TR (A to B) = _____________________________
Total Time in State A If detailed transition rate data for the units is not available MARS can approximate the transition rates from the partial forced outage rates and an assumed number of transitions between pairs of capacity states Transition rates calculated in this manner will give accurate results for LOLE and LOEE but it is important to remember that the assumed number of transitions between states will have an impact on the time-correlated indices such as frequency and duration Energy-Limited Units Type 1 energy-limited units are modeled as thermal units whose capacity is limited on a random basis for reasons other than the forced outages on the unit This unit type can be used to model a thermal unit whose operation may be restricted due to the unavailability of fuel or a hydro unit with limited water availability It can also be used to model technologies such as wind or solar the capacity may be available but the energy output is limited by weather conditions Type 2 energy-limited units are modeled as deterministic load modifiers They are typically used to model conventional hydro units for which the available water is assumed to be known with little or no uncertainty This type can also be used to model certain types of contracts A
NPCC CP-8 Working Group 37 RCC Approved ndash June 13 2012
APPENDIX C Type 2 energy-limited unit is described by specifying a maximum rating a minimum rating and a monthly available energy This data can be changed on a monthly basis The unit is scheduled on a monthly basis with the units minimum rating dispatched for all of the hours in the month The remaining capacity and energy can be scheduled in one of two ways In the first method it is scheduled deterministically so as to reduce the peak loads as much as possible In the second approach the peak-shaving portion of the unit is scheduled only in those hours in which the available thermal capacity is not sufficient to meet the load if there is sufficient thermal capacity the energy of the Type 2 energy-limited units will be saved for use in some future hour when it is needed Cogeneration MARS models cogeneration as a thermal unit with an associated load demand The difference between the units available capacity and its load requirements represents the amount of capacity that the unit can contribute to the system The load demand is input by specifying the hourly loads for a typical week (168 hourly loads for Monday through Sunday) This load profile can be changed on a monthly basis Two types of cogeneration are modeled in the program the difference being whether or not the system provides back-up generation when the unit is unable to meet its native load demand Energy-Storage and DSM Energy-storage units and demand-side management impacts are both modeled as deterministic load modifiers For each such unit the user specifies a net hourly load modification for a typical week which is subtracted from the hourly loads for the units area Transmission System The transmission system between interconnected areas is modeled through transfer limits on the interfaces between pairs of areas The transfer limits are specified for each direction of the interface and can be changed on a monthly basis Random forced outages on the interfaces are modeled in the same manner as the outages on thermal units through the use of state transition rates Contracts Contracts are used to model scheduled interchanges of capacity between areas in the system These interchanges are separate from those that are scheduled by the program as one area with excess capacity in a given hour provides emergency assistance to a deficient area Each contract can be identified as either firm or curtailable Firm contracts will be scheduled regardless of whether or not the sending area has sufficient resources on an isolated basis but they will be curtailed because of interface transfer limits Curtailable contracts will be scheduled only to the extent that the sending Area has the necessary resources on its own or can obtain them as emergency assistance from other areas
CP-8_Winter_2012_13_Multi-Area_Probabilistic_Assessment_Executive Summary to Place in CO-12_2012-2013Wpdf
EXECUTIVE SUMMARY 4
INTRODUCTION 8
MODEL ASSUMPTIONS 9
WINTER 201112 SUMMARY 19
ANALYSIS 22
A) OBJECTIVE AND SCOPE OF WORK 31
B) EXPECTED NEED FOR OPERATING PROCEDURES 32
C) MULTI-AREA RELIABILITY SIMULATION PROGRAM DESCRIPTION 34
C) MULTI-AREA RELIABILITY SIMULATION PROGRAM DESCRIPTION 34
Load Representation
Load Shape
Load Forecast Uncertainty
New England
Assistance Priority
Major Weather Highlights
Load Comparison
New England Details
Demand Supply Resources
Ontario Details
TABLE OF CONTENTS
1 EXECUTIVE SUMMARY 1
SUMMARY OF FINDINGS 1
2 INTRODUCTION 5
3 DEMAND FORECASTS FOR WINTER 2011‐12 7
SUMMARY OF RELIABILITY COORDINATOR AREA FORECASTS 8
4 RESOURCE ADEQUACY 15
NPCC SUMMARY FOR WINTER 2011‐12 15 PROJECTED CAPACITY ANALYSIS BY RELIABILITY COORDINATOR AREA 17 RECENT AND ANTICIPATED GENERATION RESOURCE ADDITIONS 22 FUEL INFRASTRUCTURE BY RELIABILITY COORDINATOR AREA 24 WIND CAPACITY ANALYSIS BY RELIABILITY COORDINATOR AREA 28
The information in this report is provided by the CO‐12 Operations Planning Working Group of the NPCC Task Force on Coordination of Operation Additional information provided by Reliability Councils adjacent to NPCC
The CO‐12 Working Group members are
Rod Hicks New Brunswick System Operator Yan Bechamp Independent Electricity System Operator Paul Metsa TransEacutenergie Dragan Pecurica Nova Scotia Power Inc Paul Roman Northeast Power Coordinating Council Michael Courchesne ISO New England Kyle Ardolino New York ISO
Information from neighboring Reliability Councils provided by
Paul Kure Reliability First (RFC)
The Multi‐Area Probabilistic Reliability Assessment provided in this report is provided by the CP‐8 Working Group of the NPCC Task Force on Coordination of Planning
The CP‐8 Working Group members are
Phil Fedora (Chair) Northeast Power Coordinating Council Alan Adamson New York State Reliability Council Rob Vance New Brunswick System Operator Frank Ciani New York Independent System Operator Kevan Jefferies Ontario Power Generation J W (Jack) Martin National Grid USA Abdelhakim Sennoun Hydro‐Queacutebec Distribution Kamala Rangaswamy Nova Scotia Power Inc Vithy Vithyananthan Independent Electricity System Operator Fei Zeng ISO New England The CP‐8 Working Group acknowledges the efforts of Messrs Glenn Haringa GE Energy and Andrew Ford the PJM Interconnection for their assistance in this analysis
Page 1
1 Executive Summary
This report is based on the work of the NPCC CO‐12 Operations Planning Working Group and focuses on the assessment of reliability within NPCC for the 2012‐13 Winter Operating Period Portions of this report are based on work previously completed for the NPCC Reliability Assessment for the Winter 2011‐121
Moreover the NPCC CP‐8 Working Group provides a seasonal multi‐area probabilistic reliability assessment Results of this assessment are included as a chapter in this report and supporting documentation is provided in Appendix VIII
Those aspects that the CO‐12 Working Group has examined to determine the reliability and adequacy of NPCC for the winter of 2011‐12 are discussed in detail in the specific report sections The following Summary of Findings addresses the significant points of the report discussion These findings are based on projections of electric demand requirements available resources and transmission configurations This report evaluates NPCCrsquos and the associated Balancing Authority areasrsquo ability to deal with the differing resource and transmission configurations within NPCC and the associated Balancing Authority areasrsquo preparations to deal with the possible uncertainties identified in this report
Summary of Findings
The forecasted coincident peak demand for NPCC during the peak week (week beginning January 13 2013)2 is 111860 MW as compared to 111821 MW forecasted during 2011‐12 Winter peak week The capacity outlook indicates a forecasted Net Margin for that week of 19881 MW This equates to a net margin of 178 percent in terms of the 111860 MW forecasted peak demand This week also has the minimum percentage of forecasted Net Margin available to NPCC
The largest forecasted NPCC Net Margin of 353 percent occurs during the week beginning March 24 2013 The minimum NPCC net margin from last winter was 150 percent and this winter it is 175 percent
During the NPCC forecasted peak week the forecasted net margin in terms of forecasted demand ranges from approximately 19 percent in Queacutebec to 405 percent in Ontario
When comparing the peak week from last winter (Jan 15 2012) to this winterrsquos expected peak week (Jan 13 2013) the NPCC installed capacity has increased by
1 The NPCC Assessments can be downloaded from the NPCC website httpswwwnpccorgLibrarySeasonal20AssessmentFormsPublic20Listaspx
2 Load and Capacity Forecast Summaries for NPCC IESO ISO‐NE NYISO HQ and the Maritimes are included in Appendix I
Page 2
2515 MW Individual area changes are the following Maritimes ‐263 MW New England ‐421 MW New York +875 MW Ontario +1857 MW Queacutebec +467 MW
No delays are forecasted for the commissioning of new resources However any delay should not materially impact the overall net margin projections for NPCC
The Point Lepreau Nuclear station (approximately 660 MW) which has been out for refurbishment since April 2008 is expected to be back in service during Fall 2012 Since last winter a 299 MW oil‐fired plant has retired and a 30 MW wind farm has come on line The Maritimes Area is projecting positive net margin If load is higher than normal or if resource outages are higher than projected net margin for some weeks may become negative That should not be a problem as the Feasible Transfer Capability from Queacutebec and New England to the Maritimes Area totals around 1300 MW
ISO New England does expect the potential for various amounts of single fuel gas‐only power plants to be temporarily unavailable during extreme winter weather conditions or during force majeure conditions on the regional gas grid and plans to mitigate these scenarios with supplemental commitment
Phase angle regulators (PARs) are now installed on all four of the Michigan ndash Ontario interconnections
Since winter 2011‐2012 seven new wind plants (total of 760 MW) and two units at La Sarcelle hydro GS (total of 100 MW) will have been placed in service Two fossil fuel generating stations (Tracy 450 MW and La Citiegravere 280 MW) have been retired Synchronous Condenser CS23 at Duvernay will be back in service for this operating period This will enhance transfer capability on the Southern Interface near the load area of the system No particular operating issues are expected
The Gentilly‐2 nuclear generating station (675 MW) will be retired and decommissioned beginning December 28 2012 This does not affect the Queacutebec margin since the station was originally scheduled to be out of service for refurbishment
Wind generation has grown considerably in the NPCC region since 2007 Wind generation totals in the winter 2007‐08 1525 MW 2008‐09 2337 MW 2009‐10 3862 MW 2010‐11 3952 MW 2011‐12 5261 MW and 2012‐13 6519 MW This translates to a growth of approximately 427 percent since winter 2007‐08
There is 6519 MW of nameplate wind capacity in the NPCC region After applying wind derate factors in the respective Balancing Authority areas 1409 MW counts toward capacity Since the previous winter there has been an increase of 1258 MW of nameplate wind capacity
Page 3
Based on the CP‐8 Probabilistic Reliability assessment study the use of operating procedures designed to mitigate resource shortages is not expected for Queacutebec Ontario New England and New York under both the assumed Base Case conditions for the expected load level The Maritimes Area shows a possibility of reducing 30‐minute reserves and to call on interruptible loads in response to a capacity deficiency this winter for Base and expected or extreme conditions Queacutebec shows a possibility of reducing 30‐minute reserves for Base and Extreme conditions
Based on the CP‐8 Probabilistic Reliability assessment study the Maritimes Area shows a possibility of reducing 30‐minute reserves and to call on interruptible loads in response to a capacity deficiency this winter for the severe set of resource unavailability assumptions used in this analysis occurs Quebec also shows a possibility of reducing 30‐minute reserves and 10‐minute reserves for the severe set of resource unavailability assumptions
Environmental constraints specifically state provincial and local regulations may have some minor impact on operations at various times during the 2012‐13 Winter Operating Period
With the exception of New England which has received additional information since the data was gathered for this report no particular fuel availability problem is foreseen by any of the Balancing Authority Areas Since the initial coordinated data gathering reflected in this report and as a result of additional information since Hurricane Sandy New England projects that an additional 955 MW of capacity will most likely be unavailable for this winter period In addition New England also expects that reduced LNG supplies into the Northeast may also cause further reductions on New England generators during extreme cold weather conditions
Communication protocols in place are sufficient to ensure the timely and efficient communications in all Balancing Authority Areas to maximize the availability of emergency support
The winter assessment indicates that each NPCC Area is reasonably prepared and is reviewing the necessary strategies and procedures to deal with operational problems and emergencies if they develop The CO‐12 Working Group believes that these preparations are valid for dealing with the various operating scenarios expected during the Winter Operating Period
The results of the CO‐12 and CP‐8 Working Groupsrsquo studies indicate that NPCC and the associated Balancing Authority Areas have adequate generation and transmission for the Winter Operating Period and have developed the necessary strategies and procedures to deal with operational problems and emergencies as they may develop However the resource and transmission assessments in this report are mere snapshots
Page 4
in time and base case studies Continued vigilance is required to monitor changes to any of the assumptions that can alter this reportrsquos findings
Page 5
2 Introduction
The NPCC Task Force on Coordination of Operation (TFCO) established the CO‐12 Working Group to conduct overall assessments of the reliability of the generation and transmission system in the NPCC Region for the Summer Operating Period (defined as the months of May through September) and the Winter Operating Period (defined as the months of December through March) The Working Group may occasionally study other conditions as requested by the TFCO
For the 2012‐13 Winter Operating Period3 the CO‐12 Working Group
Examined historical winter operating experiences and assessed their applicability for this period
Examined the existing emergency operating procedures available within NPCC and reviewed recent operating procedure additions and revisions The NPCC CP‐8 Working Group has done a probabilistic assessment of the implementation of operating procedures for the 2012‐13 Winter Operating Period The results and conclusions of the CP‐8 assessment are included as chapter 9 in this report and the full report is included as Appendix VIII
Reported potential sensitivities that may impact resource adequacy on a Reliability Coordinator Area basis These sensitivities included temperature variations new wind generation delays to in‐service of new generation load forecast uncertainties evolving load response measures solar magnetic activity system voltage and generator reactive capability limits
Reviewed the communications protocols with participants to ensure that timely and efficient communications will be in place in all Reliability Coordinator Areas to maximize the availability of emergency support
Reviewed the capacity margins accounting for bottled capacity within the NPCC
Reviewed inter‐Area and intra‐Area transmission adequacy including new transmission projects upgrades or derates and potential transmission problems
Reviewed the operational readiness of the NPCC region and actions to mitigate potential problems
Assessed the implications of strategies adopted for the Winter Operating Period on the adequacy of supply in the shoulder months
Coordinated data and modeling assumptions with NPCC CP‐8 Working Group and documented the methodology of each Reliability Coordinator area in its projection of load forecasts
3 For the purposes of this report the Winter Operating Period includes the week beginning November 25 2012 to the week beginning March 24 2013 inclusive
Page 6
Coordinated with other parallel seasonal operational assessments including the Eastern Interconnection Reliability Assessment Group (ERAG) SERC East ‐ ReliabilityFirst ndash NPCC and the NERC Reliability Assessment Subcommittee (RAS) Assessments
Page 7
3 Demand Forecasts for Winter 2012‐13
The non‐coincident forecasted peak demand for NPCC over the 2012‐13 Winter Operating Period is 112217 MW This peak demand translates to a coincident peak demand of 111860 MW which is expected during the week beginning January 13 2013 Demand and Capacity forecast summaries for NPCC Maritimes New England New York Ontario and Queacutebec are included in Appendix I
Ambient weather conditions are an important variable impacting the demand forecasts However unlike the summer demand forecasts the non‐coincident peak demand varies only slightly from the coincident peak forecast in the winter This is mainly due to the fact that the drivers that impact the peak demand are concentrated into a specific period in time In winter the peak demands are determined mainly by low temperatures along with the reduced hours of daylight that occurs over the first few weeks of January
While the peak demands appear to be confined to a few weeks in January each Area is aware that reduced margins could occur during any week of the operating period as a result of weather variables and or higher than normal outage rates
The impact of ambient weather conditions on load forecasts can be demonstrated by various means The IESO and Maritimes represent the resulting load forecast uncertainty in their respective Areas as a mathematical function of the base load The NYISO use a weather index that relates air temperature and wind speed to the load response and increases the load by a MW factor for each degree below the base value TransEacutenergie the Queacutebec system operator updates forecasts on an hourly basis within a 12 day horizon based on information on local weather wind speed cloud cover sunlight incidence and type and intensity of precipitation over nine regions of the Queacutebec Balancing Authority Area ISO‐NE relates air temperature to the load response and increases the load by a MW factor for each degree below the base value
The method each Reliability Coordinator area uses to determine the peak forecast demand and the associated load forecast uncertainty relating to weather variables is described in Appendix IV Below is a summary of all Reliability Coordinator Area forecasts
Page 8
Summary of Reliability Coordinator Area Forecasts
Maritimes
Based on the Maritimes Area winter 2012‐13 demand forecast a peak of 5246 MW is predicted to occur this Winter Operating Period December through February The peak demand is forecasted to occur the week beginning January 20 2013 The forecasted peak is approximately 6 percent higher than last yearrsquos actual winter peak of 4963 MW which occurred February 13 2012 This can be explained as last winter was milder than expected and there has been some loss of industrial load During the NPCC forecasted peak week beginning January 13 2013 the Maritimes Area is forecasting a load of 4889 MW
It should be noted that the Maritimes Area load is simply the mathematical sum of the forecasted weekly peak loads of the sub‐areas (New Brunswick Nova Scotia Prince Edward Island and the area served by the Northern Maine Independent System Operator) As such it does not take the effect of load coincidence within the week into account If the total Maritimes load included a coincidence factor the forecast load would be approximately 1‐3 percent lower The following graph illustrates the weekly Maritimes forecast
The New England Balancing Authority Area reference forecast (50 percent chance of being exceeded) for winter 2012‐13 projects a peak demand of 21392 MW4 This projected peak is 103 MW (05 percent) lower than the 2011‐12 winter projected peak of 21495 MW5 and 1466 MW (74 percent) higher than the 2011‐12 actual metered winter peak of 19926 MW The key factors driving this fairly level forecast are the continued penetration of energy efficiency and the lingering effects of the economic recession New Englandrsquos all‐time winter peak demand of 22818 MW occurred on January 15 2004 If extremely cold weather occurs for a prolonged period during the upcoming Winter Operating Period the winter peak demand could reach 22132 MW (10 percent chance of being exceeded)
The following graph illustrates the range of potential peak demands that ISO‐NE may experience this winter and compares them to historical peaks (1980‐2011)
Figure 2 New England Winter 2012‐13 Weekly
Load Profile
4 This forecast takes into account a reduction of 963 MW for passive demand resources (energy efficiency) with capacity supply obligations in ISO‐NErsquos Forward Capacity Market Without that reduction the forecast is the reference load forecast of 22355 MW published in the ISO New England 2012 CELT Report and shown in Table AP‐3 Appendix I of this report
5 The 2011‐12 forecasted winter peak demand without the effects of energy efficiency was 22255 MW
Page 10
Page 11
New York
The New York Balancing Authority 2012‐13 winter peak load forecast is 24832 MW which is 299 MW higher than the forecast of 24533 MW peak for the 2011‐12 winter and 931 MW more than the actual winter peak in 2011‐12 of 23901 MW This forecast load is 278 percent lower than the all‐time winter peak load of 25541 MW that occurred on December 20 2004 The daily peak demand observed by New York during the Winter Operating Period occurs in the late afternoon or early evening hours
The following illustration provides the range of potential peak demands that New York may experience this winter
Figure 3 New York Winter 2012‐13 Weekly Load Profile
19000
20000
21000
22000
23000
24000
25000
26000
27000
MW
Week Beginning
Extreme Load Normal Load Historical Max Load
Page 12
Ontario
The forecasted weather normal hourly peak demand for this Winter Operating Period is 22087 MW This is 224 MW lower than the 22311 MW forecasted last winter and 438 MW higher than last winterrsquos actual peak of 21649 MW The actual peak demand for the 2011‐12 Winter Operating Period occurred on January 3 2012 The forecasted peak demands are expected to decline in comparison to last winter because of the continued growth in embedded (distributed) generation and conservation programs
The following graph illustrates the range of possible demands that the IESO may experience over this Winter Operating Period The peak demand is forecast for the week beginning January 13 2013 however the peak can occur at any time during the season from the week beginning December 09 2012 to the week beginning February 24 2013
The Queacutebec Balancing Authority Area is winter peaking Hydro‐Queacutebecrsquos reference peak internal demand forecast for the 2012‐13 Winter Operating Period is 37543 MW assumed to occur during the week beginning January 13 2013 This is 390 MW higher than the 2011‐12 forecast of 37153 MW (105 percent) A slight increase in all demand sectors and particularly in the industrial sector has caused this rise in the forecast The actual internal peak demand for the 2011‐12 Winter Operating Period was 35481 MW which occurred on January 16 2012 at 8h00 EST (See ldquoPost‐Seasonal Assessment and Historical Reviewrdquo section below)
These values do not include the supply of 145 MW of load to Cornwall over the Cedars Rapids Transmission (CRT) system (154 MW with losses) This load in the Cornwall area of Ontario is tapped‐off CD11 and CD22 120 kV lines which are in a radial configuration (not connected to TransEacutenergiersquos main grid) from Les Cegravedres Generating Station in Queacutebec to Dennison in New York This load is served by Queacutebec For this reason the Cornwall load is included in Table AP‐6 Appendix I The demand forecast in Table AP‐6 for the week beginning January 13 is therefore 37697 MW
Throughout the Winter Operating Period as seen in Table AP‐6 weekly peak demand varies from 30700 MW for the week beginning November 25 to 37697 MW for the week beginning January 13 and back to 29741 MW for the week beginning March 24
The following graph demonstrates the range of potential weekly peak demands on the Queacutebec system for the 2012‐13 Winter Operating Period
Extreme Load 90 Normal Load 50 Historical Max Load
Page 15
4 Resource Adequacy
NPCC Summary for Winter 2012‐13
The following assessment of resource adequacy indicates the week with the highest coincident NPCC demand is the week beginning January 13 2013 Detailed Projected Load and Capacity Forecast Summaries specific to NPCC and each Area are included in Appendix I
Table AP‐1 Appendix I is the NPCC load and capacity summary for the 2012‐13 Winter Operating Period Appendix I Tables AP‐2 to AP‐6 contain the load and capacity summary for each NPCC Balancing Authority area Each entry in Table 1 is simply the aggregate of the corresponding entry for the five NPCC Balancing Authority Areas
Table 1 (below) summarizes the load and capacity situation for the peak week beginning January 13 2013 compared to the winter 2011‐12 forecasted peak week (week beginning January 15 2012)
Page 16
TABLE 1
Comparison of Resource Adequacy for NPCC
2012‐13 Forecast and 2011‐12 Forecast
All values in MW Forecasted week of Jan 13 2013
2012‐13 Forecast
Forecasted week of Jan 15 2012
2011‐12 Forecast
Difference
Installed Capacity 159446 156931 2515
Purchases 0 0 0
Sales 0 0 0
Total Capacity 159446 156931 2515
Coincident Demand 111860 111821 39
Demand Response 6048 6914 ‐866
MaintenanceDe‐rate 15415 16099 ‐684
Required Reserve 7558 7548 10
Unplanned Outages 10779 9736 1043
Net Margin 19881 18641 1240
This years 1240‐MW increase in Net Margin is mainly due to an increase in Installed Capacity balanced by an increase in unplanned outages The following sections detail the winter 2012‐13 capacity analysis for each Reliability Coordinator area
Page 17
The following are the assessments for each Balancing Authority Area supporting this overall resource adequacy assessment
Projected Capacity Analysis by Reliability Coordinator area
Maritimes
The Installed Capacity for the assessment period is 7423 MW This is a decrease of 263 MW when compared to last winter Since the last winter assessment the Dalhousie thermal plant (299 MW) retired in May 2012 and the Amherst wind farm (30 MW) came on line April 2012 The remaining 6 MW decrease can be attributed to minor de‐rates spread throughout the fleet It should be noted that The Point Lepreau Nuclear station (approximately 660 MW) which has been out for refurbishment since April 2008 is expected to be back in service Fall 2012
During the NPCC forecasted peak week of January 13 2013 the Maritimes Area Installed Capacity is 7423 MW When allowances for firm sales purchases known maintenance and de‐ratings required operating reserve and unplanned outages are considered the Maritimes Area is projecting a net margin of 762 MW for the NPCC peak week The net margins will range from 393 MW to 1239 MW (7 to 30 percent) over the Winter Operating Period The corresponding 2011‐12 winter Maritimes net margin range was 8 percent to 30 percent
The Maritimes Area assesses its seasonal resource adequacy in accordance with NPCC Directory 1 Appendix F Procedure for Operational Planning Coordination As such the assessment considers the regional operating reserve criteria 100 percent of the largest single contingency and 50 percent of the second largest contingency
The Maritimes area is forecasting normal hydro conditions for the 2012‐13 winter assessment period The Arearsquos hydro resources are run of the river facilities with limited reservoir storage facilities These facilities are primarily utilized as peaking units and providing operating reserve
The Maritimes Area is not relying on outside assistanceexternal resources during the Winter Operating Period
New England
With the expected weather and planned resource outages capacity within New England is forecasted to be sufficient to meet load plus operating reserve requirements during this Winter Operating Period The lowest projected net margin of 2227 MW (102 percent) is expected to occur during the week beginning February 9 2013 while the highest projected net margin of 8288 MW is expected to occur during the week beginning March 23 2013 if all assumed system conditions materialize under the reference load forecast (50 percent chance of being exceeded)
Page 18
The net margin is based on known outages an allowance for unplanned outages6 anticipated generation additions and retirements projected firm purchases and sales and the impact of expected Demand Response Programs
In addition to the allowance for unplanned outages an allowance for higher unplanned outages due to possible natural gas shortages of New England generators is included in the seven highest load weeks of January and February This allowance which has historically been assumed to be 2000 MW under the reference load forecast significantly decreases the forecasted net margins during the weeks of January 8 through February 19 With the growing concern of gas supply at risk it is anticipated this value will increase over the next few months This may require the supplemental commitment of additional resources and repositioning of existing planned generator outages
Natural gas‐fired generation represents the largest component of ISO‐NErsquos total installed capacity at 453 percent (15599 MW) followed by oil‐fired generation at 214 percent (7358 MW) nuclear generation at 136 percent (4674 MW) and coal at 69 percent (2367 MW) Hydroelectric capacity and pumped‐storage capacity make up 47 and 49 percent of the total respectively The remaining 32 percent of capacity consists of renewable resources such as wind or biomass facilities
During times of capacity deficiencies ISO New England invokes ISO‐NE Operating Procedure No 4 ndash Actions during a Capacity Deficiency (OP‐4) which includes public appeals for conservation purchasing emergency energy from the neighboring Areas interrupting real time demand response providers and implementing voltage reductions
While ISO New England expects to have adequate margins for this winter under expected weather and normal resource outages if operable capacity shortages occur due to higher than expected resource unavailability or higher than expected load conditions ISO New England may have to implement ISO‐NE OP 4 or ISO‐NE Operating Procedure No 21 ndash Action during an Energy Emergency (OP 21) OP 21 is an emergency operating procedure designed to provide additional commitment and dispatch flexibility to manage and conserve fuel‐limited supply‐side resources Since the initial coordinated data gathering reflected in this report and as a result of additional information since Hurricane Sandy New England projects that an additional 955 MW of capacity will most likely be unavailable for this winter period In addition New England also expects that reduced LNG supplies into the Northeast may also cause further reductions on New England generators during extreme cold weather conditions
6 The allowance for unplanned outages is based on historical trends and is estimated to be between 2200 MW and 3200 MW during the winter
Page 19
New York
The NYISO forecasts available installed capacity of 32050 MW for the peak week (week beginning February 3 2013 indicates the lowest net margin) demand forecast of 24832 MW Available installed capacity is the total installed capacity less known planned and predicted forced outages Accounting for purchases sales required operating reserve demand response planned and unplanned outages results in a Net Margin of 6038 MW
These resources represent all generation capability located physically within the New York Balancing Authority Area that is able to participate in the NYISO ICAP market In addition to these generation resources within the New York Balancing Authority Area generation resources external to the New York Balancing Authority Area can also participate in the NYISO ICAP market Resources within the New York Balancing Authority Area that provide firm capacity to an entity external to the New York Balancing Authority Area are not qualified to participate in the ICAP market An external ICAP supplier must declare that the amount of generation that is accepted as ICAP in NY will not be sold elsewhere The external Area in which the supplier is located has to agree that the supplier will not be recalled or curtailed to support its own loads or will treat the supplier using the same pro rata curtailment priority for resources within its Balancing Authority Area The energy that has been accepted as ICAP in NY must be demonstrated to be deliverable to the NY border The NYISO sets a limit on the amount of ICAP that can be provided by suppliers external to NY
NYISO conducts semi‐annual and monthly Installed Capacity (ICAP) auctions Based on the forecast load for 2012‐13 the ICAP requirement is 28805 MW based on a 160 percent installed reserve margin (IRM) requirement Last year the IRM requirement was 155 percent When allowances are taken for scheduled and unplanned outages (based on historical performance of 80 percent unavailable capacity) the net available resources will be 32050 MW This will be sufficient to meet the New York Balancing Authority Area load and operating reserve requirement during the peak load hours with an additional reserve margin of approximately 6038 MW expected at peak conditions
Generation retirements since the winter 2011‐12 period total 397 MW This includes Glenwood ST 04 and 05 (228 MW) Far Rockaway ST 04 (100 MW) Binghamton Cogen (48 MW) Beebee CT 13 (18 MW) and Kensico Hydro (3 MW) In addition 1099 MW of generation have been placed into protective layup This included Dunkirk units 3 and 4 (435 MW) Astoria 4 (380 MW) Astoria 2 (180 MW) and Astoria GTs 10 and 11 (32 MW each)
NYISO expects approximately 549 MW of load relief from emergency operating procedures that include internal load curtailment by the transmission owners public appeals and 5 percent system wide voltage reductions during forecast peak demand conditions Participation in the Emergency Demand Response Program (EDRP) and Special Case Resources (SCR) programs represents an additional 800 MW available through the market EDRP participants voluntarily curtail load when requested by the
Page 20
NYISO SCR participants must as part of their agreement curtail power usage usually by shutting down when asked by the NYISO
Ontario
The IESO begins the Winter Operating Period with an installed generating capacity of 36231 MW By the end of the assessment period the installed capacity will decrease by 201 MW to 36060 MW This decrease is due to the shutdown of the Atikokan coal plant in order to convert it to a biomass facility The change in capacity from last year includes the addition of four wind projects with a total capacity of 409 MW which are scheduled to be in service for and the return of two refurbished nuclear units (750 MW) during fourth quarter of 2012
The IESO expects to have adequate margins for this winter under expected weather and normal resource outages These net margins range from 7347 MW to 11416 MW The lowest projected net margin of 357 percent is expected to occur during the week beginning November 25 2012 while the highest projected net margin of 579 percent is expected to occur during the week beginning December 23 2012 if all planned outages are allowed to proceed as requested
This analysis is based on a review of known outages a projection of unplanned outages and a forecast of price responsive loads Known outages include those resources that are scheduled to be on planned outages transmission constrained resources as well as the difference between the installed capacity and the dependable capacity associated with certain resources Unplanned outages represent an estimate of the forced outages that may be experienced in this study period
The IESO forecasts the future price responsive load based on Market Participant registered data and consideration of actual market experience The net margin shown in Table AP‐5 of Appendix I does not consider that the IESO has several demand management programs which are implemented as part the IESOs Emergency Operating State Control Actions For example the IESO can institute a 3 percent or a 5 percent voltage reduction which has the effect of reducing the demand by 15 percent and 26 percent for a short period of time
The risks associated with this analysis are that demands may be heavier than expected due to extreme weather generators on outage may not return to service as scheduled or generators forced from service may be higher than projected The projected margins and control actions available to the IESO are continuously assessed Should the IESO determine that the Ontario Area is deficient the appropriate course of action will be taken Actions can include the adjustment of outage programs securing assistance via market mechanisms or the acquisition of emergency energy from other Areas as a final step
Queacutebec
Installed Capacity
Page 21
For the 2012‐13 Winter Operating Period Installed Capacity in the Queacutebec Balancing Authority Area will total 43605 MW Installed capacity for the 2011‐2012 period (February 2012) was 43394 MW Seven new wind projects totaling 760 MW will be on‐line for the winter period (see Wind Power section below) Two units at the new La Sarcelle hydro GS (100 MW) will be commissioned for the winter period A certain amount of biomass stations and small hydro is also coming online for this period The 43605 MW Installed Capacity includes Gentilly‐2s 675‐MW capacity which will be decommissioned beginning December 28 2012 Subsequent assessments will show this retirement For this assessment the retirement is accounted for through derates since the station was originally scheduled out of service for refurbishment The Net Margins are not affected
The Tracy fossil fuel GS (450 MW) which was mothballed in the last winter assessment has been permanently retired since March 2012 Moreover the La Citiegravere jet turbine GS (280 MW) has also been retired Minor capacity adjustments due to generator characteristic changes water level and temperature adjustments have been made as usual
Purchases Sales and Interruptible Load
The Queacutebec area will need to purchase about 600 MW on short term markets to ensure resource adequacy for the 2012‐2013 Winter Operating Period All capacity purchases needed to ensure resource adequacy will be backed by firm contracts for both generation and transmission
Firm sales of 253 MW to ISO‐NE are expected for the entire period
Table AP‐6 Appendix I presents 1830 MW of interruptible load and Direct Control Load management for the Queacutebec Area This is discussed further in the Demand Response Programs section below
Known MaintenanceDerates
In the Queacutebec Area in winter the Known MaintenanceDerates column of the Load and Capacity table mainly reflects hydraulic restrictions on Hydro‐Queacutebec Productionrsquos (HQP) various generating stations with a few other particular constraints on other generating stations In early December numbers show the effect of some late generator maintenance still ongoing at this time Numbers in January February and March reflect hydraulic restrictions and outages
In this assessment the 547 MW natural gas unit operated by TransCanada Energy at Beacutecancour is mothballed for 2013 Moreover as mentioned above the Gentilly‐2 Nuclear GS (675 MW) will be retired beginning December 28 2012
Page 22
When hydraulic and mechanical restrictions wind derates and the above‐mentioned outages are accounted for this brings inoperable resources for the forecasted peak week (week beginning January 13) to 4334 MW They are included in the Known MaintenanceDerates column from Table AP‐6 Appendix I
Numbers vary from 7274 MW in early December to 4213 MW in late January and 6810 MW in March Restrictions and outages are generally higher than what was posted for the last Winter Operating Period
Required Operating Reserve
Historically the required operating reserve for the Queacutebec Balancing Authority Area has been set at 1500 MW This is based on the largest single contingency on the system the loss of a Churchill Falls 230735 kV transformer typically carrying 1000 MW For this Winter Operating Period this is again the basis for the reserve calculation
The required operating reserve shown in Table AP‐6 Appendix I for the 2012‐13 Winter Operating Period is therefore set at 1500 MW
Net Margin
As mentioned in the Summary of Area Forecasts section above the winter peak is expected to materialize during the week of January 13 2013 Forecast internal peak demand is 37543 MW 154 MW is added to this amount for the Cornwall load Total peak load in Table AP‐6 of Appendix I is therefore set at 37697 MW Firm sales to neighboring systems excluding Cornwall amount to 269 MW Capacity purchases from neighboring areas amount to 581 MW When required operating reserve interruptible load and allowances for unplanned outages and load uncertainty are taken into account the Net Margin at peak load is 716 MW (19 percent based on the load forecast) In order to maintain appropriate reserve margins the Queacutebec Area has access to additional capacity or energy purchases from New York and Ontario markets through existing interconnections
The Net Margin varies from 4192 MW during December to 716 MW at peak load and back to 5615 MW during late March as can be observed in Table AP‐6 Appendix I
Recent and Anticipated Generation Resource Additions
The following Table lists the recent and anticipated generation resource additions and retirements
TABLE 2
Recent and Anticipated Generation Resource Additions and Retirements
Page 23
2011‐12 Winter through 2012‐13 Winter
Area Generation Facility Nameplate Capacity (MW)
Fuel Type In Service
Date
Maritimes Dalhousie (New Brunswick)
(Retirement) ‐299 Oil May 2012
Amherst (Nova Scotia) 30 Wind April 2012
New England
Salem Harbor Units 1 and 2 (Retirement)
‐158 Coal December 2011
Spruce Mountain Wind 20 Wind Dec 2011
Record Hill Wind 50 Wind Jan 2012
Granite Reliable Power LLC 99 Wind Feb 2012
New Haven Harbor Unit 2 ‐ 4 145 Nat
GasOil May 2012
New York Bayonne Energy Center 500 Nat
GasOil June 2012
Nine Mile Point 2 (Uprate) 168 Uranium June 2012
Marble River Wind Farm I amp II 215 Wind October 2012
Binghamton Cogen ‐48 Nat
GasOil February 2012
Beebee CT 13 ‐18 Oil March 2012
Astoria 2 ‐180 Nat Gas April 2012
Astoria 4 ‐380 OilNat Gas
April 2012
Astoria GT10 ‐32 Oil May 2012
Astoria GT11 ‐32 Oil July 2012
Glenwood ST 04 amp 05 ‐228 Nat Gas July 2012
Far Rockaway ST 04 ‐100 Nat
GasOil July 2012
Dunkirk 3 amp 4 ‐435 Bituminous
Coal September
2012
Kensico Hydro ‐3 Water October 2012
Ontario Bruce Unit 1 750 Uranium Q3 2012
Comber Wind Limited Partnership 166 Wind Q3 2012
Page 24
Pointe Aux Roches Wind 49 Wind Q3 2012
Bruce Unit 2 750 Uranium Q4 2012
Atikokan (fuel replacement) ‐211 Coal Q1 2012
Thunder Bay Condensing Turbine 40 Biomass Q1 2012
Queacutebec La Sarcelle (2 units) 100 Hydro Spring 2012
Tracy Retirement ‐450 Oil Summer 2012
La Citiegravere Retirement ‐280 Oil
Seven Wind Projects 760 Wind Fall 2012
Gentilly‐2 retirement and decommissioning
‐675 Nuclear Dec 2012
Maritimes
There is no new capacity scheduled to be put in service or any existing capacity scheduled to be retired during this winter assessment period
New England
Five wind projects and a biomass plant with nameplates totaling 253 MW are expected to go commercial in New England during the Winter Operating Period A delay in the commercial operation of these projects will not have an adverse impact on New Englandrsquos reliability
New York
New generating projects with nameplates totaling 500 MW have come into service since the 2011‐12 Winter Operating Period A new wind project Marble River Wind Farm with a nameplate of 2152 MW came into service in October 2012
Ontario
From the Winter 2011‐12 assessment to the Winter 2012‐13 assessment inclusive Ontario will have added 215 MW of wind 1500 MW of nuclear and removed 211 MW of coal generation
Queacutebec
No delays are expected for wind plant and hydro commissioning
Fuel Infrastructure by Reliability Coordinator area
The following is a self‐assessment by each Reliability Coordinator area of the expected fuel supply infrastructure
Maritimes
Page 25
The Maritimes Area does not consider potential fuel‐supply interruptions in the regional assessment The fuel supply in the Maritimes Area is very diverse and includes nuclear natural gas diesel coal oilpet coke oil (both light and residual) hydro tidal municipal waste wind and wood Fuel supplies are expected to be adequate during the projected winter period Extreme weather conditions should have no impact on the fuel supply to the Maritimes Area Responsibility for fuel switching plans lies with the generation owner All applicable units have the required procedures The only generator units with fuel‐switching capability are at Tuftrsquos Cove Nova Scotia (natural gas or oil) and Coleson Cove unit 3 New Brunswick (oil or oilpetcoke) and totaling 645 MW Each facility maintains an adequate supply of its primary fuel
New England
The majority of power generators within New England are fueled by natural gas followed by oil nuclear coal hydro and renewable resources In 2011 gas‐fired generation produced over 51 percent of the regionrsquos electric energy production New Englandrsquos heavy reliance on natural gas to produce electricity has produced some winter reliability concerns in the past primarily due to the direct competition with the core natural gas markets for both gas supply and regional transportation during extreme winter weather conditions In addition to discussing the winter outlook with regional stakeholders During extremely cold winter days there may be fuel supply restrictions on natural gas‐fired generating units due to regional gas pipelines invoking delivery prioritization amongst their entitlement holders Such conditions routinely occur resulting in temporary reductions in gas‐fired capacity These temporary reductions to operable capacity are reflected within ISO‐NErsquos forced outage assumptions Concerns have increased for the 2012 ndash 2013 winter capacity period as most of gas turbine generators do not have firm gas supply or transportation contracts On days of extreme winter temperatures single‐fuel natural gas‐fired capacity is at risk of being unavailable due to fuel constraints ISO‐NE monitors these potential situations and mitigates their effects by dispatching non‐gas‐fired resources to replenish these temporary forced outages ISO‐NE gauges the impacts that fuel supply disruptions could have upon system or subregional reliability ISO‐NE continuously monitors the regional natural gas pipeline systems via their Electronic Bulletin Board (EBB) postings This ensures that emerging gas supply or delivery issues can be incorporated into and mitigated within the daily or day‐ahead operating plans Should natural gas issues arise ISO‐NE has predefined communication protocols in place with the Gas Control Centers of both regional pipelines and local gas distribution companies (LDCs) in order to quickly understand the emerging situation and subsequently implement mitigation measures ISO‐NE has two procedures that can also be invoked to mitigate regional fuel supply emergencies impacting the power generation sector
Page 26
1) ISO‐NErsquos Operating Procedure No 21 ‐ Action During an Energy Emergency (OP 21) is designed to help mitigate the impacts on bulk power system reliability resulting from the loss of operable capacity due to regional fuel supply deficiencies that can occur anytime during the year7 Fuel supply deficiencies are the temporary or prolonged disruption to regional fuel supply chains for coal natural gas LNG and heavy and light fuel oil
2) ISO‐NErsquos Market Rule No 1 ndash Appendix H ndash Operations during Cold Weather
Conditions is a procedure that is designed to help mitigate the impacts on bulk power system reliability resulting from the loss of operable capacity due to the combined effects from extreme cold winter weather or constraints with regional natural gas supplies or deliveries8
The ongoing reliability concern for this winter involves the reliability implications to the electric power system resulting from very extreme winter weather or a ldquoforce majeurerdquo type event on the regional natural gas system As noted by the events that occurred in the southwest during February 2011 extreme winter weather has the capability to impact the availability of generation by inducing cold weather‐related outages Although the majority of New Englandrsquos generation fleet took various remedial actions to prepare their stations after the Cold Snap of January 2004 portions of the fleet may still be susceptible to outages induced by extreme winter weather In addition an extreme contingency located upstream or on the regional natural gas grid although temporary in nature could create considerable regional gas supply shortages which would primarily affect the regional gas‐fired generation fleet Either type of event could quickly diminish the capacity margins projected for the winter which would require ISO‐NE to implement Emergency Operating Procedures (EOPs) to mitigate the impacts from these events Since the initial coordinated data gathering reflected in this report and as a result of additional information since Hurricane Sandy New England projects that an additional 1200 MW of capacity will most likely be unavailable for this winter period In addition New England also expects that reduced LNG supplies into the Northeast may also cause further reductions on New England generators during extreme cold weather conditions
New York
Traditionally New York generation mix has been dependent on fossil fuels for the largest portion of the installed capacity Recent capacity additions or enhancements
7 Operating Procedure No 21 is located on the ISOrsquos web site at httpwwwiso-necomrules_procedsoperatingisoneop21indexhtml 8 Appendix H of Market Rule No 1 is located at httpwwwiso-necomregulatorytariffsect_3mr1_append-hpdf
Page 27
now available use natural gas as the primary fuel While some existing generators in southeastern New York have ldquodual‐fuelrdquo capability use of residual or distillate oil as an alternate may be limited by environmental regulations Adequate supplies of all fuel types are expected to be available for the winter period
Ontario
The majority of generation facilities operating on the IESO‐controlled grid are represented by three basic types of fuel ‐ Fossil Nuclear and Hydroelectric At the time of this assessment OilGas generation exceeded coal‐fired fossil generation by more than double This trend is expected to continue as the retirement of four coal‐fired units on October 1 2010 began the move towards eliminating coal‐fired generation in Ontario by 2014 The portion of oil fired fossil generation remains relatively unchanged Generation from biomass technologies is a very small percentage of Ontariorsquos generation mix Lennox generating station with a capacity of 2000 MW is the only significant dual‐fuel facility which can be fueled by oil or gas
During the winter months shipping capability is limited by ice and weather conditions on the Great Lakes This is important because fuel for a portion of the coal‐fired resources is delivered by boat via the Great Lakes While these conditions may prevent delivery for extended periods of time all sites relying on this delivery mechanism stockpile the fuel
As in other Areas natural gas supplies for electricity generation in Ontario also compete with space heating requirements Natural gas supplies and delivery infrastructures are expected to be adequate for the Winter Operating Period The IESO and the gas distribution companies in Ontario have an established protocol whereby the gas distribution companies inform the IESO of situations that could affect gas supplies into Ontario
At the time of this report the IESO has not been made aware of any fuel supply concerns It is therefore expected that adequate supplies of all fuels will be available for the Winter Operating Period
Queacutebec
About 93 percent of the Queacutebec Balancing Authority Arearsquos generating capacity is made up of hydro stations located on geographically dispersed river systems
Hydro generating plants are classified into three categories run‐of‐river plants annual reservoir and multi‐annual reservoir plants Low water inflows are coped with in different ways for each category
Run‐of‐river hydro plants relatively constant hydraulic restrictions from year to year
Annual reservoir hydro plants during a year with normal water inflows these reservoirs are almost full at the beginning of winter If annual water inflow is low hydraulic restrictions increase
Page 28
Multi‐annual reservoir hydro plants the target level for multi‐annual reservoirs is approximately 50 percent to 60 percent full in order to compensate or store inflows during periods of below or above normal water inflows Hydraulic restrictions increase during a period of low inflows
After a severe drought having a 2 percent probability of occurrence hydro generation on the system would suffer additional hydraulic restrictions of about 500 MW above the ldquonormal conditionsrdquo restrictions Stream flows storage levels and snow cover are constantly being monitored allowing Hydro‐Queacutebec to plan margins to cope with drought periods
To assess its energy reliability Hydro‐Queacutebec has developed an energy criterion stating that sufficient resources should be available to run through sequences of two or four years of low inflows having a 2 percent probability of occurrence Hydro‐Queacutebec must demonstrate its ability to meet this criterion three times a year to the Queacutebec Energy Board The last assessment can be found on the Queacutebec Energy Board web site9
To smooth out the effects of low inflow cycles different means have been identified
Reduction of the energy stock in reservoirs to a minimum of 10 TWh beginning in May
External non‐firm energy sales reductions
Off‐peak purchases from neighboring areas
Wind Capacity Analysis by Reliability Coordinator area
As seen in the wind generation analyses below there is relatively little wind generation on the system For the 2012‐13 Winter Operating Period installed wind capacity accounts for approximately 37 percent of the total NPCC installed capacity After applying the derate factor the amount of wind generation counted towards capacity is only approximately 06 percent Reliability Coordinator areas have different ways of accounting for this generation The Reliability Coordinator areas are still developing their knowledge regarding operation of wind generation in terms of capacity forecasting and utilization factor
The following table illustrates the nameplate wind capacity in NPCC for the Winter Operating Period and indicates the capacity derate method used Some Reliability Coordinator areas include the entire nameplate capacity in the Installed Capacity
section of the Load and Capacity Tables and use a derate value in the Known MaintenanceDerates section to account for the fact that some of the capacity will not be online at the time of peak Others simply reduce the nameplate capacity by a factor and include this reduced capacity directly in the Installed Capacity section of the Load and Capacity Tables
Page 30
Table 3 NPCC Wind Capacity and Derating Methodology
Reliability Coordinator
area
Nameplate Capacity
2012 (MW)
Capacity After Applied
Derating Factor (MW)
Derating Methodology Used
Maritimes 816 168 Derate factors done by sub‐areas Nova Scotia 100 percent Based on median historical hourly production values from the previous three years for each individual wind facility the following areas use New Brunswick averages winter 71 percent summer 75 percent PEI averages 57 percent winter summer 70 percent and Northern Maine winter and summer 70 percent
New England 581 131 Based on the average of the median net output during the summer or winter reliability hours during the previous year The winter reliability hours are the hours ending 1800 through 1900 each day of the winter period (January through May and October through December) and all winter period hours in which the ISO has declared a shortage event
New York 1578 473 Uses 70 percent derate factor for the winter season
Ontario 1727 124 Uses seasonal contribution factors based on median historical hourly production values from September 2006 to the present 928 percent derate for June‐August 814 percent derate for March‐May and Sept‐November 722 percent derate for Dec‐Feb
Queacutebec 1817 513 Weather data covering the period between 1971 and 2006 were used to re‐simulate coincident hourly load and
Page 31
wind generation in order to estimate the derate factor for winter peak periods which is evaluated at 70 percent
Total 6519 1409
Maritimes
The Maritimes Area currently has approximately 816 MW of nameplate installed wind capacity After applying derates the current wind capacity is 168 MW Since the winter 2011‐12 period there has been 30 MW of new wind generation added There has also been some wind projects that were either postponed or cancelled that were scheduled to come on line this summer This would account for the difference of what was reported for nameplate wind capacity of 846 MW during the summer 2012 assessment period as compared to the 816 MW reported for this winter assessment period
Wind projected capacity is derated to its demonstrated average output for each summer or winter capability period In New Brunswick Prince Edward Island and NMISA each individually wind facility that has been in production for an extended period of time (three years or more) a derated monthly average is calculated using metering data from previous years over each seasonal assessment period Nova Scotia does not include any wind facilities towards their installed capacity (100 percent derated)
The Maritimes Area capacity is the mathematical sum of the sub‐areas (New Brunswick Nova Scotia Prince Edward Island and the area served by the Northern Maine Independent System Operator) Each sub‐arearsquos wind generator totals are shown below with their nameplate and derate values
Table 4 Maritimes Wind Nameplate Capacity
Maritimes Sub‐Areas Nameplate
Capacity 2013 (MW)
New Brunswick (Winter Derate) 294
Prince Edward Island (Winter Derate) 164
Nova Scotia (On‐Peak Capacity Factor) 316
NMISA (Average yearly Derate) 42
TOTALS 816
New England
The total nameplate capability of wind generators in New England is 581 MW of which 802 MW is in the 2012 ndash 2013 Forward Capacity Market (FCM) 2012‐13 commitment
Page 32
period This equates to approximately 14 percent having a capacity supply obligation and is counted toward installed capacity in New Englandrsquos load and capacity calculations (Table 3 Appendix I)
Table 5 New England Wind Nameplate Capacity
Name Nameplate Capacity (MW)
Berkshire Wind Power Project 15
Granite Reliable Power LLC 99
Kibby Wind Power 132
Lempster Wind 24
Record Hill Wind 50
Rollins Wind Plant 60
Sheffield Wind Plant 40
Spruce Mountain Wind 20
Stetson II Wind Farm 26
Stetson Wind Farm 57
Total Wind Projects lt10 MW 58
Total 581
In addition five new wind projects are expected to go commercial by the end of the year Bull Hill Georgia Mountain Community Wind Groton Wind Hoosac Wind and Kingdom Community Wind with a combined nameplate capacity of 185 MW
New York
New York currently has 1578 nameplate MW of wind capacity Wind is applied at 100 of nameplate capability to installed capacity However New York applies a 70 percent
Page 33
derate factor for wind generation in the winter operating period resulting in 4734 MW derated capacity
A new 215 MW nameplate wind project Marble River Wind Farm I amp II came into service in October 2012 It is interconnected at a new substation Patnode on the NYSEG 230 kV system between Willis and Plattsburgh in northern NY
Table 6 New York Wind Nameplate Capacity
Name Nameplate
Capacity (MW)
Altona Wind Power 98
Bliss Wind Power 101
Canandaigua Wind Power 125
Chateaugay Wind Power 107
Clinton Wind Power 101
Ellenburg Wind Power 81
Hardscrabble Wind 74
High Sheldon Wind Farm 112
Howard Wind 51
Madison Wind Power 12
Maple Ridge Wind 1 231
Maple Ridge Wind 2 91
Marble River Wind Farm I 83
Marble River Wind Farm II 132
Munnsville Wind Power 35
Steel Winds 20
Wethersfield Wind Power 126
Total 1578
Ontario
Wind generator output varies significantly hour‐to‐hour or day‐to‐day However over longer periods wind generation shows more consistent production The IESO forecasts wind capacity by using seasonal contribution factors based on median historical hourly production values from September 2006 to the present These factors are updated twice a year and eventually will be calculated using a rolling 10 year data set
Page 34
The seasonal wind contribution factors currently in use by the IESO are 278 percent for winter (December January and February) 72 percent for summer (June July August) and 186 percent for shoulder (remaining months)
The IESO presently has 1727 MW of wind capacity Below are the currently connected wind generators
Table 7 Ontario Wind Nameplate Capacity
Wind Farm Nameplate
Capacity 2012 (MW)
Wind Farm Nameplate
Capacity 2012 (MW)
Amaranth 200 Port Alma 202
Comber 166 Port Burwell 99
Dillon 78 Prince Farm 189
Gosfield 50 Ripley South 76
Greenwhich 99 Spence 99
Kingsbridge 40 Underwood 182
Pointe Aux Roche
49 Wolfe Island 198
Total 1727
Only 32 percent of nameplate rating is used for wind capacity forecasts for the winter period this equates to 553 MW The geographic distribution of Ontario wind resources mitigates some of the risk associated with wind capacity variability
Queacutebec
New wind capacity totaling 760 MW distributed between seven projects will be commissioned for this Winter Operating Period Wind capacity will total 1817 MW
The following table shows wind plants in‐service for the 2012‐13 Winter Operating Period
Table 8 Queacutebec Wind Nameplate Capacity
Page 35
Wind Farm Nameplate Capacity
2012 (MW)
Le Nordais Cap‐Chat 57
Le Nordais Matane 43
Mont‐Copper 54
Mont‐Miller 54
TechnoCentre 4
Baie‐des‐Sables 110
Anse‐agrave‐Valleau 101
Carleton 110
St‐UlricSt‐Leacuteandre 128
Mont‐Louis 101
Montagne‐Segraveche 59
Gros‐Morne Phase 1 101
Le Plateau 139
Total 1057
New for Winter 2012‐2013
Lac Alfred Phase 1 150
New Richmond 68
St‐Robert‐Bellarmin 80
Monteacutereacutegie 101
De lEacuterable 100
Gros‐Morne Phase 2 111
Massif‐du‐Sud 150
Total New 760
Grand Total 1817
For resource adequacy studies pertaining to Winter Operating Periods wind capacity is derated by 70 percent This is based on detailed wind capacity credit evaluations which have been presented to the Reacutegie de leacutenergie du Queacutebec (Queacutebec Energy Board)
In this report 1304 MW is included in the Known MaintenanceDerates column in Table AP‐6 of Appendix I to account for wind derates
Page 36
In addition to the present 1817 MW wind generation capacity another 1500 MW are planned to come into service gradually until 2015
Page 37
5 Transmission Adequacy
Regional Transmission studies specifically indentifying interface transfer capabilities in NPCC are not normally conducted However NPCC uses the results developed in each of the NPCC Reliability Coordinator areas and compiles them for all major interfaces and for significant load areas (Appendix III) Recognizing this the CO‐12 working group reviewed the Normal Transfer Capabilities (NTC) and the Feasible Transfer Capabilities (FTC) between the Balancing Authority Areas of NPCC under peak demand configurations
The following is a transmission adequacy assessment from the perspective of the ability to support energy transfers for the differing levels Inter‐Region Inter‐Area and Intra‐Area
Table 9 NPCC ndash Transmission Additions for 2012‐13 Winter
NPCC Sub‐Area
Transmission Project Voltage (kV) In Service
Maritimes None
New England
345115 kV autotransformer at Deerfield Substation New Hampshire
New York Gowanus Straight to Ring Bus 345 Summer 2012
Astoria Annex‐Astoria East w 345138 kV
Transformer and PAR 345138 Summer 2012
Oakdale 3236 Tower Separation 345 Summer 2012
Various Switched Shunt Capacitor Bank Additions
(626 MVAr) Various Summer 2013
Ontario BP76
Return to service 230 December 2012
Two new Bruce‐Milton circuits 500 Spring 2012
Queacutebec Wind generation integration (seven projects) 315‐230‐120 Fall 2012
Limoilou satellite substation 23025 Fall 2012
Anse‐Pleureuse satellite substation 23025 Fall 2012
Neubois satellite substation 12025 Fall 2012
Beacutecancour subsystem reinforcement 230120 Fall 2012
Page 38
Inter‐Regional Transmission Adequacy
Phase angle regulators (PARs) are installed on the Ontario‐Michigan interconnection at Lambton TS (L4D and L51D) and Keith (J5D) on the Ontario side and at Bunce Creek TS (B3N) in Michigan representing the four interconnections with Michigan Final regulatory approvals have been received permitting operation of these facilities Three PARs were placed in service prior to summer 2012 and are being used to manage circulation power flows around Lake Erie as well as contingencies
The MISO and IESO have indicated that operation of the Phase Angle Regulators will assist in the management of system congestion and control of circulating flows
Inter‐Area Transmission Adequacy
The tables in Appendix III provide a summary of the normal transfer capabilities (NTC) on the interfaces between NPCC Balancing Authority Areas and for some specific load zone areas They also indicate the corresponding feasible transfer capabilities (FTC) under peak conditions based on internal limitations or other factors and indicate the rationale behind reductions from the normal transfer capability
New York ndash Ontario intertie BP76 which has been out of service since January 2008 will remain out‐of‐service until the failed voltage regulator has been replaced at the end of 2012
Page 39
Intra‐Area Transmission Adequacy Assessment
Maritimes
The Maritimes bulk transmission system is projected to be adequate to supply the demand requirements for the Winter Operating Period Part of the TTC calculation with HQ is based on the ability to transfer radial loads onto the HQ system The radial load number will be calculated monthly and HQ will be notified of the changes (See Appendix III)
New England
The 2012 Regional System Plan (RSP12) outlines a number of the ongoing transmission planning studies and projects that are taking place The report continues to describe the various areas of the region where transmission projects are needed for reliability ISO‐NE continually monitors transmission facility additions and coordinates outages in order to mitigate any possible reliability risks that may be associated with changes in the transmission system
New bulk power transmission facilities have been placed in service in New England since the 2011‐12 winter period Some of the more significant improvements include a new 345115 kV transformer in the Deerfield substation located in Southern New Hampshire This is a transmission system improvement which will increase interface limits and reduce the severity of a double circuit contingency
In addition two 345 kV reactors at the Coolidge substation in Southern Vermont have been energized These improvements provide additional voltage support to the area to address various thermal and voltage issues as well as support transfers to and from New York Final improvements were also applied to the Berry Street substation which reinforce and improve import limits into the Rhode Island area
Facilities that are expected to be in service for the upcoming winter include a new 345 kV transmission line from Orrington to a new substation named Albion Road and a new 345 kV transmission line from Surowiec to a new substation named Larrabee Road both of which are part of the Maine Power Reliability Program (MPRP) a new 345 kV transmission line from Ludlow to Agawam which is part of the Greater Springfield Reliability Project (GSRP) and new and existing substations with multiple 115 kV line improvements throughout the region
New York
Several transmission modifications worth noting have occurred since the 2011‐12 winter operating period or will be completed by summer 2013 In summer 2012 the Gowanus 345 kV bus was converted to a full ring bus to accommodate the interconnection of the Bayonne Energy Center Previously it was a straight bus configuration There was also the addition of a 345138 kV transformer PAR and cable between the Astoria Annex 345 kV bus and the Astoria East 138 kV bus
Page 40
A new substation Patnode on the NYSEG 230 kV system between Willis and Plattsburgh in northern NY was added to accommodate the interconnection of the Marble River Wind Farm
Two circuits from Oakdale formed a double circuit tower contingency In summer 2012 the Oakdale‐Fraser 32 and Oakdale‐Clarks Corners 36 lines were separated to eliminate this contingency
The Beck‐Packard BP76 line is expected to return to service in December 2012
By summer 2013 approximately 626 MVAr of switched shunt capacitors will be added to the system funded by DOE smart grid grants
The New Bridge 345138 kV transformer bank 2 will be out‐of‐service for the winter 2012‐13 operating period
Ontario
The system enhancements planned for this winter include the return to service of the Beck‐Packard BP76 line between Ontario and New York expected in December 2012 Phase angle regulators (PARs) are now installed on all four of the Michigan ndash Ontario interconnections
Two new 500 kV circuits from Bruce NGS to Milton SS were placed in service in May 2012 This work at the Bruce switchyards was done to extend a 500 kV bus and complete the addition of terminal breakers for the two new Bruce minus Milton circuits
Queacutebec
No major 735‐kV transmission project is being commissioned for the 2012‐13 Winter Operating Period As shown in Table 9 above wind generation integration at several voltage levels is ongoing a few satellite (distribution) substations are being commissioned and the Beacutecancour 230120‐kV subsystem is being upgraded All these projects are presently on schedule
As usual no transmission line outages are expected and no major maintenance is scheduled during the 2012‐13 Winter Operating Period
Synchronous Condenser CS23 at Duvernay substation in the Montreacuteal area which has been out of service since June 2008 due to a major transformer fault will be back in service for the 2012‐13 Winter Operating Period This will enhance transmission capability on the Southern Interface in the load area of the system
Transmission capability for the peak period is adequate to carry the net internal demand plus the firm capacity sales and operating reserve Moreover enough transmission capability remains on the system to carry additional resources that would be called upon if load was greater than the forecast
Page 41
TransEacutenergie continually performs load flow and stability studies to assess system reliability and transfer capabilities on all its internal interfaces A peak load study is performed annually integrating new generation new transmission and the latest demand forecasts as well as any unusual operating conditions such as generation and transmission outages
Extreme cold weather conditions result in a large load pickup over the normal weather forecast and are included in TransEacutenergiersquos Transmission Design Criteria When designing the system both steady state and stability assessments are made with winter scenarios involving demands 4000 MW higher than the normal weather peak demand forecast This is equivalent to 111 percent of peak winter demand Hydro‐Queacutebec Distribution (the load serving entity) is responsible for the procurement of resources to feed this exceptional demand
Voltage support in the southern part of the system (load area) is a concern during Winter Operating Periods especially during episodes of heavy load TransEacutenergie has an agreement with Hydro‐Queacutebec Production (the largest Generator Owner on the system) that maintenance on generating units will be terminated by December 1 and that all possible generation will be available This along with yearly testing of reactive capability of the generators ensures maximum availability of both active and reactive power The end of maintenance on the high voltage transmission system is also targeted for December 1 Also TransEacutenergie has a target for the availability of both high voltage and low voltage capacitor banks No more than 400 Mvar of high voltage banks should be unavailable during the Winter Operating Period The target for the low voltage banks is 90 percent availability This ensures adequate voltage support in the load area of the system
Page 42
6 Operational Readiness for 2012‐13
Demand Response Programs
Each Reliability Coordinator area utilizes various methods of demand management The following is a summary of each arearsquos current demand response programs available for the Winter Operating Period
Maritimes
Interruptible and dispatchable loads are forecast on a weekly basis and range between 144 MW and 198 MW They values can be found in Appendix I Table AP‐2 and are available for use when corrective action is required within the Area
New England
During times of capacity deficiencies ISO New England declares ISO New England Operating Procedure No 4 (OP 4) ndash Actions during a Capacity Deficiency That includes public appeals for conservation purchasing emergency energy from the neighboring Balancing Authority Areas activating demand response resources and implementing voltage reductions
In the Load and Capacity Table for New England (Table AP‐3 Appendix I) 957 MW out of a total of 1920 MW of demand response resources are assumed available during OP 4 conditions for the 2012‐13 Winter Operating Period In addition to the active demand response resources there is a total of 963 MW of energy efficiency with FCM obligations
New York
Participation in the Emergency Demand Response Program (EDRP) and Special Case Resources (SCR) programs represents an additional 800 MW available through the market for reliability The NYISO Emergency Demand Response Program (EDRP) and Special Case Resources (SCR) program may be deployed without time or call frequency limitations in any Operating Period in which the resources are enrolled EDRP participants voluntarily curtail load when requested by the NYISO when an operating reserves deficiency or major emergency exists SCR participants are required to respond when deployed by the NYISO for reliability
The New York Independent System Operator Inc (NYISO) offers two demand response programs that support reliability the Emergency Demand Response Program10 (EDRP) and the Installed Capacity‐Special Case Resource Program (ICAPSCR)
EDRP provides demand resources with the opportunity to earn the greater of $500MWh or the prevailing locational‐based marginal price (LBMP) for energy consumption curtailments provided when the NYISO calls on the resource There are no
10 Terms in upper case not defined herein have the meaning ascribed to them in the NYISOrsquos Market Administration and Control Area Services Tariff
Page 43
consequences for enrolled EDRP resources that fail to curtail Resources participate in EDRP through Curtailment Service Providers (CSPs) which serve as the interface between the NYISO and resources
The ICAPSCR program allows demand resources that meet certification requirements to offer Unforced Capacity (UCAP) to Load Serving Entities (LSEs) Special Case Resources can participate in the Installed Capacity (ICAP) Market just like any other ICAP Resource however Special Case Resources participate through Responsible Interface Parties which serve as the interface between the NYISO and resources Resources are obligated to curtail when called upon to do so with two or more hours notice provided the NYISO notify the Responsible Interface Party a day ahead of the possibility of such a call In addition ICAPSCR resources are subject to testing each Capability Period to verify that they can fulfill their curtailment requirement Failure to curtail could result in penalties administered under the ICAP program Curtailments are called by the NYISO when reserve shortages are anticipated Resources may register for either EDRP or ICAPSCR but not both Special Case Resources are eligible for an energy payment during an event using the same performance calculation as EDRP resources
The Targeted Demand Response Program (TDRP) introduced in July 2007 is a NYISO reliability program that deploys existing EDRP and SCR resources on a voluntary basis at the request of a Transmission Owner in targeted subzones to solve local reliability problems The TDRP program is currently available in Zone J New York City
The Day Ahead Demand Response Program (DADRP) program provides demand resources with an opportunity to offer their load curtailment capability into the Day‐Ahead Market (ldquoDAMrdquo) as an energy resource Resources submit offers by 500 am specifying the hours and amount of load curtailment they are offering for the next day and the price at which they are willing to curtail Prior to November 1 2004 the minimum offer price was $50MWh The offer floor price currently is $75MWh Offers are structured like those of generation resources DADRP program resources may specify minimum and maximum run times and the hours that they are available They are eligible for Bid Production Cost guarantee payments to make up for any difference between the market price received and their block offer price across the day Load scheduled in the DAM is obligated to curtail the next day Failure to curtail results in the imposition of a penalty for each such hour equal to the product of the MW curtailment shortfall and the greater of the corresponding DAM or Real‐Time Market price of energy
The Demand Side Ancillary Services Program (DSASP) introduced in June 2008 provides demand resources that meet telemetry and other qualification requirements an opportunity to offer their load curtailment capability into the DAM andor Real‐Time Market to provide Operating Reserves and Regulation Service DSASP resources must qualify to provide Operating Reserves or Regulation Service through standard resource testing requirements Offers are submitted through the same process as generation resources Resources submit offers by 500 am specifying the ancillary service they are offering (Spinning or Non‐Synchronous Reserves andor Regulation if qualified) along
Page 44
with the hours and amount of load curtailment for the next day and the price at which they are willing to curtail Real‐time offers may be made up to 75 minutes before the hour of the offer Although DSASP resources are not scheduled for energy in the DAM they are required to submit energy offers which are used in the co‐optimization algorithm for dispatching operating reserve resources Similar to the DADRP the energy offer floor price is currently $75MWh DSASP resources are not paid for energy They are eligible for a Day‐Ahead Margin Assurance Payment to make up for any balancing difference between their Day‐Ahead Reserve or Regulation schedule and Real‐Time dispatch subject to their performance for the scheduled service Performance indices are calculated on an interval basis for both Reserves and Regulation Payment is adjusted by the performance index for the service provided
Ontario
A sizeable number of loads within the province bid their load into the market and are responsive to price and to dispatch instructions Other loads have been contracted by the Ontario Power Authority to provide demand response under tight supply conditions The forecast amount of these demand measures has been steadily increasing and now amounts to approximately 1200 MW in total of which 773 MW is categorized as interruptible
Queacutebec
There are two interruptible load programs and a voltage reduction program implemented in the Queacutebec Control Area
For winter 2012‐13 the load subscribing to the Interruptible programs totals about 2100 MW These programs have operating constraints which are accounted for through a diversity factor for resource assessment purposes The total interruptible load posted is therefore 1580 MW Follow‐up of the interruptible load programs is done by compiling differences between the customersrsquo real consumption and the customers anticipated hourly load profile at the time the program is scheduled to be in effect These programs have been in operation for a number of years and according to the records customer response is highly reliable
Hydro‐Queacutebec Distribution and TransEacutenergie have developed a voltage reduction program at a large number of distribution substations This is included in the ldquoDemand Responserdquo column in Table AP‐6 Appendix I Table AP‐6 therefore presents 1830 MW of load which consists of interruptible load (1580 MW) plus the voltage reduction program (250 MW)
On an operations horizon if peak demands are higher than expected a number of measures are available to the System Control personnel Operating Instruction I‐001 lists such measures These vary from limitations on non guaranteed wheel through and export transactions operation of hydro generating units at their near‐maximum output (away from optimal efficiency but still allowing for reserves) use of import contracts
Page 45
with neighbouring systems starting up of thermal peaking units use of interruptible load programs and eventually reducing 30‐minute reserve and stability reserve applying voltage reduction making public appeals and ultimately using cyclic load shedding to re‐establish reserves
Page 46
7 Post‐Seasonal Assessment and Historical Review
Winter 2011‐12 Post‐Seasonal Assessment
NPCC
The sections below describe briefly each Balancing Authority Arearsquos 2011‐12 winter operational experience Total NPCC non‐coincident demand was 108249 MW for the period
Maritimes
The forecasted peak for winter 2011‐12 was 5552 MW
The actual peak demand of 4963 MW occurred February 13 2012
Control actions were not required
New England
The forecasted peak for winter 2011‐12 was 21495 MW
The actual peak demand of 19926 MW occurred January 4th 2012
Implementation of Operating Procedure 4 (OP 4) was not required during the winter operating period
New York
The forecasted peak for winter 2011‐12 was 24533 MW
The actual peak demand of 23901 MW occurred on January 3rd 2012
No particular issues to report
Ontario
The forecasted peak for winter 2011‐12 was 22311 MW
The actual peak demand of 21649 MW occurred on January 3rd 2012 There were no issues with meeting this level of demand
Queacutebec
The internal demand forecast was 37153 MW for the 2011‐12 Winter Operating Period
Page 47
Actual peak demand occurred on January 16 2012 at 8h00 EST Internal demand was 35481 MW At that time exports of 3856 MW were sustained by the Queacutebec Balancing Authority and imports amounted to 1827 MW Moreover 1388 MW of interruptible industrial load was called for the peak hour
Global system needs accounting for interruptible load and exports were then evaluated at 37508 MW
Temperature in Montreacuteal at peak was ‐18 degC (‐04 degF) and wind velocity was 9 kmh (56 mph) Winter 2011‐12 was remarkably warmer than average Mean temperatures were 34 degC (61 degF) warmer than normal temperatures for that period
Generation and Reserves
At the time of peak maximum generation capacity was about 43140 MW
Generation outages totaled 1978 MW The TransCanada Energy GS (547 MW in winter) was under a temporary shutdown agreement and is included in the outages Tracy oil‐fueled GS had three units (450 MW) mothballed (now retired) Hydraulic wind and mechanical restrictions totaled 1818 MW Thus total available capacity was about 39344 MW
Thirty‐minute operating reserve at peak time was 3000 MW 1500 MW over the requirement
State of the System
735 kV Lines
On peak day all 735 kV transmission was available
Other Equipment
Synchronous Condenser CS23 at Duvernay substation was unavailable for the Winter Operating Period
During spring 2011 a 735‐kV current transformer (CT) at Chissibi 735‐kV substation exploded due to gas accumulation This event triggered an extensive oil verification program for this type of CT Out of 281 sampled CTs it was found that 70 had to be changed Thus a replacement program was planned and initiated In January 2012 about 50 CTs had been changed and the rest was scheduled for 2012
The reactive power output of generating stations in the southern part of the system at peak load and capacitor bank availability were adequate considering load and system conditions during the Winter Operating Period
Wind generation
Approximately 425 MW of wind generation was present on the system during the peak hour on January 16 out of a total of 919 MW
Interconnections
Page 48
On January 16 2012 (peak day) all interconnection equipment was available and operating During the Winter Operating Period seven events occurred which made interconnections unavailable The most significant events were the following
bull Sandy Pond Pole 1 trip on February 9 2012 with loss of 780 MW export
bull Madawaska GC1 trip on February 1 2012 with TTC reduction to New Brunswick
bull Leacutevis Transformer T13 (735315 kV) trip on February 16 with TTC reduction to New Brunswick
Page 49
Historical Winter Demand Review (Pre‐2012)
The table below summarizes historical non‐coincident winter peaks for each NPCC Balancing Authority Area since 2000‐01
Table 10 Historical Peak Demands by Reliability Coordinator Area Occurring December to March And Total Non‐Coincident NPCC Demand (MW)
Year Ontario Maritimes New
England New York
Queacutebec Total NPCC Non‐
Coincident Demand
2000‐01 23126 4822 20088 23764 30277 102077
2001‐02 22623 4783 19872 22798 30080 100156
2002‐03 24158 5376 21535 24454 34989 110512
2003‐04 24937 5716 22818 25262 36268 115001
2004‐05 24979 5419 22631 25541 34956 113526
2005‐06 23766 4987 21733 25060 33636 109182
2006‐07 23935 5593 21640 25057 36251 112376
2007‐08 23054 5385 21782 25021 35352 110594
2008‐09 22983 5504 21026 24673 37230 111416
2009‐10 22045 5205 20791 24074 34659 106774
2010‐11 22733 5252 21060 24654 37717 111416
2011‐12 21649 4963 22255 23901 35481 108249
2012‐13 Forecast
22087 5246 22355 24832 37543 112063
Page 50
8 2012‐13 Reliability Assessments of Adjacent Regions
ReliabilityFirst Corporation
Executive Summary (highlights)
This assessment provides information on the projected resource adequacy for the upcoming winter season across the ReliabilityFirst Corporation (RFC) region The RFC Resource Adequacy Assessment Standard BAL‐502‐RFC‐02 is a Federal Energy Regulatory Commission (FERC) approved regional standard which requires Planning Coordinators to identify the minimum planning reserves to satisfy a resource adequacy criterion that is used to assess their respective areas of RFC PJM Interconnection (PJM) and Midwest Independent Transmission System Operator (MISO) are the Planning Coordinators for their market areas The reserve requirements in this assessment are based upon the explicit probability analyses conducted by these two Planning Coordinators in RFC
All RFC members are affiliated with either the MISO or the PJM Regional Transmission Organization (RTO) for market operations and reliability coordination Ohio Valley Electric Corporation (OVEC) a generation and transmission company located in Indiana Kentucky and Ohio is not a member of either RTO Also RFC does not officially designate subregions MISO and PJM each operate as a single Balancing Authority area Since all RFC demand is in either MISO or PJM except for the small load (less than 100 MW) within the OVEC Balancing Authority area the reliability of the PJM RTO and MISO are assessed and the results used to indicate the reliability of the ReliabilityFirst Region
In this report Demand Response (DR) is defined as the demand that can be interrupted for system emergencies It may consist of Interruptible Load (IL) Direct Control Load Management (DCLM) or load used as a capacity resource The approved RFC Resource Adequacy Assessment Standard requires the reserve margins be calculated with DR used as a load reduction The reserve margin used in this assessment is therefore based on Net Internal Demand (NID)
The report for the RFC region includes the resources and demand only in the RFC area operated by PJM MISO and OVEC The remaining area of PJM operates within the SERC Reliability Corporation (SERC) region and the remaining area of MISO operates in the Midwest Reliability Organization (MRO) or SERC regions
In this assessment forecast demand capacity and interchange values for RFC PJM MISO and OVEC are rounded to the nearest 100 MW Also note that it is possible that reports or other data released by PJM or MISO for this assessment period may differ from the data reported in this assessment owing to when various data were reported ReliabilityFirst does not expect any differences to alter the conclusions of this assessment
Page 51
Executive Summary
Demand Capacity and Reserve Margins
The projected reserve margin for the ReliabilityFirst region is 61900 MW which is 428 percent based on NID and Net Capacity Resources without DR Both MISO and PJM are expected to have sufficient resources to satisfy their planning reserve requirements Therefore the resulting reserve margin for this winter in the ReliabilityFirst region is adequate This compares to a 589 percent reserve margin in last winterrsquos assessment
The forecast winter 20122013 coincident peak demand for the ReliabilityFirst region is 144700 MW NID This is 10200 MW higher than the NID peak of 134500 MW forecast for the winter of 20112012 The main reason for the increase in NID is the reduction in the amount of contractual DR available this winter in PJM Weather and economic conditions have a significant influence on electrical peak demands Any deviation from the original forecast assumptions could cause the actual peak to be significantly different from the forecast
The amount of OVEC PJM and MISO net capacity and interchange in ReliabilityFirst is 206300 MW This is 7400 MW less resources than the 213700 MW that was reported within the 20112012 winter assessment Much of the reduced resources are due to generation retirements many occurring after the summer season Capacity changes that have occurred after the start of the planning year (June) have been included within the calculation of the winter reserve margins for both PJM and MISO Capacity resources committed to the markets at the beginning of the winter period are assumed constant throughout the winter
PJM net capacity and interchange for the 2012 planning year are 182500 MW The projected reserves for PJM during the 20122013 winter peak are 52300 MW which is 402 percent of the Net Internal Demand of 130200 MW The PJM Reserve Margin (NID) has decreased by 127 percentage points over last years forecast reserve margin due to recent generation retirements and the reduction in DSM available during this winter The PJM reserve requirement for the 2012 planning year is 156 percent PJM has adequate reserves to serve the 20122013 winter peak demand
The MISO net capacity and interchange for the 2012 planning year are 109500 MW The current projected reserves for MISO for the 2012 winter peak are 37300 MW which is 517 percent of the Net Internal Demand of 72200 MW The MISO Reserve Margin (NID) has increased by 63 percentage points over last years forecast reserve margin due to a slight increase in Demand Response resources and the net impact of the DEOK transfer of generation and resources into PJM The MISO reserve requirement is 167 percent for the 2012 planning year The MISO winter reserve margin is adequate
Page 52
PJM RTO
Demand
The demand forecast represents the median forecast (5050)11 of a Monte Carlo simulation employing actual weather observations from over thirty years of history Economic assumptions are based on projected growth in Gross Metropolitan Product for 36 metropolitan areas across PJM produced by Moodys Analytics as of December 2011 The PJM winter peak for 20112012 was 118664 MW on January 3 2012 at hour ending 1900 The Total Internal Demand (TID) projection for the 20112012 PJM winter peak was 130711 MW while the Total Internal Demand projection for the 20122013 PJM winter peak is 130200 MW The decrease reflects the impacts of a weak economy PJM forecasts both the non‐coincident and coincident loads of all members PJMrsquos resource evaluations are conducted on the coincident peak loads PJM is a summer peaking region with the typical winter peak about 84 percent of the summer peak
PJM has no contractually interruptible demand side management secured for use by the PJM operators during the winter season Energy Efficiency programs included in the 2012 PJM Load Forecast Report are impacts approved for use in the PJM Reliability Pricing Model At time of the 2012 load forecast publication 600 MW of Energy Efficiency programs have been approved as Reliability Pricing Model resources in 2012 Measurement and verification of energy efficiency programs are governed by rules specified in PJM Manual 18B12 To demonstrate the value of an energy efficiency resource resource providers must comply with the measurement and verification standards defined in this manual by establishing plans providing post‐installation reports and undergoing a Measurement and Verification audit
Quantitative analysis was done to assess the weather uncertainty of the projected demand Using a Monte Carlo simulation employing actual weather observations from over thirty years of history it is estimated that the 90101 load for Winter 20122013 is 138200 MW which is 7900 MW (or 6 percent) above the expected Total Internal Demand No changes were made to the load forecast method used for the 2012 PJM Load Forecast Report Extreme weather conditions are explicitly addressed as part of emergency import analysis for PJMs Locational Deliverability Areas
Generation
The total PJM resources expected to be in service for the 20122013 winter peak period are approximately 182300 MW including 600 MW of Energy Efficiency resources in RPM This is less than the expected capacity from the 2012 summer assessment due to retirement of nearly 4000 MW of generation after the summer
Variable generation amounts to 5600 MW nameplate and 800 MW expected on peak
11 For an explanation of 5050 and 9010 demand forecasts please see Appendix B 12 httpwwwpjmcom~mediadocumentsmanualsm18bashx
Page 53
Variable resources are only counted partially for PJM resource adequacy studies Both wind and solar initially utilize class average capacity factors which are 13 percent for wind and 38 percent for solar Performance over the peak period is tracked and the class average capacity factor is supplanted with historic information After three years of operation only historic performance over the peak period is used to determine the individual units capacity factor PJM has 900 MW of Biomass Biomass is counted fully in capacity calculations
Anticipated hydro conditions for the winter are normal Hydro conditions are expected to be sufficient to meet both peak demand and the daily energy demand throughout the winter peak period PJM is not experiencing or expecting conditions that would reduce capacity
Imports and Exports on Peak
PJM has firm capacity imports of 1400 MW No non‐firm imports are considered in this reliability analysis There are no Expected or Provisional transactions counted towards meeting the reserve margin requirements All included transactions are firm for both generation and transmission No imports are based on partial path reservations There are no transactions with Liquidated Damages clauses or ldquomake‐wholerdquo contracts included in the reserve margins
PJM has firm capacity exports of 1200 MW No non‐firm exports are considered in this reliability analysis There are no Expected or Provisional transactions in place All included transactions are firm for both generation and transmission No imports are based on partial path reservations There are no transactions with Liquidated Damages clauses or ldquomake‐wholerdquo contracts included in the reserve margins
External emergency assistance does not contribute to satisfying the reserve margin requirement PJM only relies on existing certain generation and firm capacity purchases for meeting its reserve margin requirement
Reliability Assessment Analysis
PJM evaluates its resources (generation interchange) and demand (including demand‐side management) to determine if the Reserve Margin requirements are met Contingency analysis performed as part of the PJM Operations Assessment Task Force internal studies and the interregional studies with our neighbors ensures operations within secure transfer limits PJM has adopted a Loss of Load Expectation (LOLE) standard of one occurrence in ten years PJM performs an annual LOLE study to determine the reserve margin required to satisfy this criterion The study recognizes among other factors load forecast uncertainty due to economics and weather generator availability deliverability of resources to load and the benefit of interconnection with neighboring systems The methods and modeling assumptions used in this study are available in PJM Manual 2013
13 httpwwwpjmcom~mediadocumentsmanualsm20ashx
Page 54
This assessment uses the resource adequacy study that was completed in October 20114 This study examined the period 2011 to 2022 The required reserve margins to satisfy an LOLE of one occurrence in ten years are summarized in Table I‐2 on page 5 The PJM projected reserve margin for winter 20122013 based on NID with DSM as a load reduction and energy efficiency as a resource is 401 percent This reserve margin is well in excess of the 2012 planning year reserve margin of 156 percent14 The PJM Reserve Margin (NID) has decreased by 127 percentage points over last years forecast reserve margin due to recent generation retirements and the reduction in DSM available during this winter
PJM has established rulesprocedures to ensure fuel is conserved to maintain an adequate level of on‐site fuel supplies under forecasted peak load conditions PJM coordinates with neighboring entities and gas pipelines to quickly address fuel issues
Generation scheduled to be out of service for scheduled maintenance over the winter peak period is expected to be at normal levels
The demands as reported by the Load Serving Entities are weather normalized (5050)15 forecasts Historically reported load forecasts have been highly accurate as each member has expert knowledge of their individual loads with respect to weather and economic assumptions During last yearrsquos winter season MISO experienced an instantaneous peak of 74011 MW on December 6 2011 hour ending 1900 EST The instantaneous load is the highest value metered during the peak hour
Last yearrsquos unrestricted non‐coincident demand forecast of 83700 MW is 60 percent higher than this yearrsquos unrestricted non‐coincident demand forecast of 78700 MW for December 2012 This difference is due to the transfer of Duke Energy OhioKentucky to PJM on January 1 2012
An unrestricted non‐coincident peak demand is created on a regional basis by summing the coincident monthly forecasts for the individual Load Serving Entities (LSE) in the larger regional area of interest Using historic market data a load diversity factor was calculated by observing the individual peaks of each Local Balancing Authority and comparing them against the system peak This produced an estimated diversity of 3600 MW therefore MISO forecasts a total internal demand of 75100 MW
MISO bases its resource evaluation on the actual market peak MISO currently separates Demand Resources into two separate categories Interruptible Load and DCLM Interruptible load of 2600 MW (35 percent of Total Internal Demand) for this assessment is the magnitude of customer demand (usually industrial) that in accordance with contractual arrangements can be interrupted at the time of peak by direct control of the system operator (remote tripping) or by action of the customer at the direct request of the system operator DCLM of 300 MW (04 percent of Total Internal Demand) for this assessment is the magnitude of customer service (usually residential) that can be interrupted at the time of peak by direct control of the applicable system operator DCLM is typically used for ldquopeak shavingrdquo This results in a net internal demand of 72200 MW The Resource Adequacy processes as set forth in Module E of MISOrsquos tariff acts as the measurement and verification tool for demand response
MISO does not currently track Energy Efficiency programs however they may be reflected in individual LSE load forecasts To account for uncertainties in load forecasts MISO applies a probability distribution Load Forecast Uncertainty to consider a larger range of forecasted demand levels Load Forecast Uncertainty is derived from variance analyses to determine how likely forecasts will deviate from actual load There have not been any changes made due to the economic recession in both the load forecast methodassumptions and the impact to the actual forecast
15 For an explanation of 5050 and 9010 demand forecasts please see Appendix B
Page 56
Generation
MISO projects 103800 MW of Existing‐Certain capacity during the assessment timeframe Of the Existing‐Certain capacity it is difficult to predict the wind capacity available on peak due to the intermittent nature of wind However MISO has determined maximum wind capacity credits using an Equivalent Load Carrying Capacity a metric commonly utilized by the National Renewable Energy Laboratory MISO used the Equivalent Load Carrying Capacity for wind generation and Loss of Load Expectation analyses16 Wind shows an Existing‐Certain capacity of 600 MW on peak over the assessment timeframe utilizing a 149 percent capacity credit for those resources committed as Planning Resource capacity to MISO within the Module E Capacity Tracking tool It is important to note that not all Existing wind capacity was committed in the Module E Capacity Tracking tool Existing‐Other capacity for wind is 1000 MW expected on peak and 9200 MW derates on peak over the assessment timeframe Hydro shows an Existing‐Certain capacity of 800 MW expected on peak over the assessment timeframe The Existing‐Other capacity for hydro is 300 MW expected on peak and 100 MW derates on peak over the assessment timeframe Of the Existing‐Certain capacity biomass shows 500 MW on peak throughout the assessment timeframe MISO anticipates 3000 MW of Behind‐the‐meter Generation (BTMG) to be available for the winter season Hydro conditions for the winter appear normal and there are no reports of reservoir levels showing insufficiencies to meet both peak demand the daily energy demand throughout the winter MISO is not expecting conditions (ie weather fuel supply fuel transportation) that would reduce capacity
Imports and Exports on Peak
MISO only reports power imports (not exports) to the MISO market or reported interchange transactions into the MISO market The forecast includes 2700 MW of power imports17 All these imports are firm and fully backed by firm transmission and firm generation No import assumptions are based on partial path reservations There are no transactions with Liquidated Damages Contract clauses or ldquomake‐wholerdquo contracts that are included as firm capacity External emergency assistance does not contribute to satisfying the reserve margin requirement MISO only relies on committed generation and firm capacity purchases for meeting its reserve margin requirement
16httpswwwmidwestisoorgLibraryRepositoryStudyLOLE201220LOLE20Study20Reportpdf 17 2012-2013 winter peak power imports obtained from the Module E Capacity Tracking tool
Page 57
Reliability Assessment Analysis
The LOLE study is used to determine the level of planning reserves which ensures that the probability for loss of load on the integrated peak hour for each day of the annual planning period sums to 01 dayyear or 1 day in 10 years within the MISO system18 Refer to Table 2‐10 of the 2012 LOLE Study Report for a comparison of Planning Year 2012 Planning Reserve Margin (PRM) to last yearrsquos PRM
According to the 2011 LOLE study the reserve margin requirement calculated for MISO is 167 percent of the MISO Net Internal Demand of its market area for the 20122013 winter season In addition to the 103800 MW of Existing‐certain capacity resources in December MISO expects 2700 MW of external resources and 3000 MW of BTMG resources which are available to serve load19 Behind‐the‐meter generation is considered a capacity resource when calculating the MISO reserve margin This additional capacity arrives at a total designated capacity of 109500 MW
This brings the projected reserve margin for MISO to 37300 MW which is 517 percent of MISO Net Internal Demand The MISO Reserve Margin (NID) has increased by 63 percentage points over last years forecast reserve margin due to a slight increase in Demand Response resources and the net impact of the DEOK transfer of generation and resources into PJM This projected reserve margin is higher than the 167 percent MISO system PRM requirement Firm load curtailment is a very low probability event for the 20122013 winter period
For inclusion in seasonal assessments MISO utilizes Energy Information Administration fuel forecasts to identify any system wide fuel shortages and none are projected for the winter period In addition to the seasonal assessments MISOrsquos Independent Market Monitor submits a monthly report to MISOrsquos Board of Directors which covers fuel availability and security issues During the operating horizon MISO relies on market participants to anticipate reliability concerns related to the fuel supply or fuel delivery Since there are no requirements to verify the operability of backup fuel systems or inventories supply adequacy and potential problems must be communicated appropriately by the market participants to enable adequate response time
18httpswwwmidwestisoorgLibraryRepositoryStudyLOLE201220LOLE20Study20Reportpdf 19 External BTMG and DRR values are based on forecasted 2012-2013 winter values from Module E
Page 58
RELIABILITYFIRST
Demand
In this assessment the data related to the ReliabilityFirst areas of PJM and MISO is combined with the data from OVEC to develop the ReliabilityFirst regional data The demand forecasts used in this assessment are all based on the coincident peak demand of MISOrsquos Local Balancing Authorities and the coincident peak of PJMrsquos load zones Both PJM and MISO demand forecasts are based on an expected or 5050 demand forecast While there is some diversity between the PJM and MISO coincident peak demands and the ReliabilityFirst coincident peak demands most of the demand diversity is already reflected in the PJM and MISO coincident demand forecasts For this assessment no additional diversity is included for the ReliabilityFirst region therefore the ReliabilityFirst coincident peak demand is simply the sum of the PJM MISO and OVEC peak demands (rounded to nearest 100 MW) The composite ReliabilityFirst region forecast is considered a 5050 demand forecast (see Appendix B for explanation of 5050 demand forecast)
PJM and MISO use the categories of Direct Control Load Management and Interruptible Load to account for the expected combined potential DR reduction within the ReliabilityFirst region PJM and MISO also include demand reductions for load in their respective markets Load as a capacity resource is included as a load reduction in the PJM market In MISO the load served behind‐the‐meter from BTMG is included with the demand forecast so BTMG is included as a capacity resource The combined Direct Control Load Management during the winter is 300 MW and the Interruptible Demand is 1600 MW This is a total demand reduction of 1900 MW and is the maximum controlled demand mitigation that is expected to be available during peak demand conditions
Since demand reduction programs are a contractual management of system demand utilization reduces the reserve margin requirement for PJM and MISO Net Internal Demand is TID less the demand reduction Reserve margin requirements are based on Net Internal Demand
The Net Internal Demand peak of the ReliabilityFirst region for the 2012 winter season is 144700 MW and is projected to occur during January 2013 This value is based on a TID forecast of 146600 MW with the full reduction of 1900 MW (13 percent of TID) from the demand response programs within the region (see Table RFC‐1)
Page 59
Compared to the actual winter 20112012 peak demand of 132683 MW the 20122013 winter forecast NID is 12017 MW (91 percent) higher than the actual 20112012 winter peak demand In addition the 2011 forecast of 20122013 winter NID peak demand was 136700 MW making this yearrsquos winter NID peak demand forecast 8000 MW (59 percent) higher than last yearrsquos 2012 winter peak demand forecast The NID forecast for this winter is higher due to the reduction in available DSM reported by PJM for this winter
Weather and economic conditions have significant influence on electrical peak demands Any deviation from the original forecast assumptions for those parameters could cause the aggregate 20122013 winter peak to be significantly different from the forecast
DECEMBER JANUARY FEBRUARY
RFC Totals [2]
TOTAL INTERNAL DEMAND 144500 146600 141200
Direct Control Load Management (300) (300) (300)Interruptible Demand (1600) (1600) (1600)
Load as a Capacity Resource 0 0 0
NET INTERNAL DEMAND 142600 144700 139300
[2] - The RFC regional demand includes OVEC with the PJM and MISO areas of RFC[1] - All demand totals are rounded to the nearest 100 MW
TABLE RFC-1
RFC PROJECTED PEAK DEMANDS (MW)1
WINTER 2012-13
Page 60
For the winter of 20122013 high demand forecasts for PJM and MISO were combined with the OVEC demand to create a high demand forecast for the ReliabilityFirst region The forecast high demand (NID) is 153300 MW a 59 percent increase over the 5050 demand forecast (see Table RFC‐2)
Generation
There are two general categories used when analyzing seasonal capacity resources ldquoExistingrdquo capacity represents resources that have been built and are in commercial service ldquoFuturerdquo capacity represents planned resources that are under construction have an interconnection service agreement and are expected to be in commercial service at the start of the planning period
The generating capacity in Table RFC‐3 represents the capacity of the generation in the ReliabilityFirst region The capacity category of Existing Certain represents existing resources in the ReliabilityFirst areas of PJM and MISO that are committed to their respective markets and the capability of OVEC generation The ReliabilityFirst region has 206300 MW of capacity that is identified as Existing Certain in this winter assessment This includes Energy Efficiency and BTM generation resources of 2500 MW
TOTALRFC
HIGH DEMAND1
TOTAL INTERNAL DEMAND [TID] 155100
NET INTERNAL DEMAND [NID] 153300
NET CAPACITY RESOURCES 206300
RESERVE MARGINS -- MW 53000 -- of NID 346
TABLE RFC-2SIMULATED HIGH DEMAND (MW)
WINTER 2012-13
[1] - The combination of the 9010 demand forecasts for the PJM and MISO areas of RFC is not a 9010 forecast for RFC These values are used to simulate conditions for a high demand day
Page 61
The Existing Other category includes the existing resources that represent expected on‐peak windvariable resource derating and other existing capacity resources within the ReliabilityFirst region not included as Existing Certain resources There is up to 7500 MW of these types of capacity resources None of this capacity is used to satisfy the reserve margin requirement in PJM and MISO
Capacity changes (new and retired generation) that occurred prior to the winter season are included in these winter reserve margins No Future Planned capacity additions are included during the winter in this ReliabilityFirst assessment
The total nameplate amount of variable generation in ReliabilityFirst is about 5800 MW This is nearly all wind power (with about 32 MW solar) with the amount of available on‐peak variable generation capability included in the reserve calculations at about 700 MW The difference between the nameplate rating and the on‐peak expected wind capability rating is accounted for in the Existing Other category
RFC2012
EXISTING CAPACITY 214500
EXISTING INOPERABLE (700)
EXISTING OTHER CAPACITY (7500)
EXISTING CERTAIN CAPACITY 206300
CAPACITY TRANSACTIONS - IMPORTS 1 700
CAPACITY TRANSACTIONS - EXPORTS 1 (700)
NET INTERCHANGE 0
CAPACITY and NET INTERCHANGE 206300
NET CAPACITY RESOURCES 206300
1 - Intra-regional transfers reported by the RTOs (between RTOs and with OVEC) have been removed
TABLE RFC-3RFC PROJECTED CAPACITY RESOURCES (MW)
WINTER 2012-13
Page 62
There is also 700 MW of biomass (renewable) resources included in the ReliabilityFirst reserve margins
Each generator operator is expected to coordinate with the fuel industry regarding fuel supplies and deliveries Although PJM and MISO do not explicitly communicate with the fuel industry regarding fuel supply issues their respective market rules encourage generator owners and operators to have adequate fuel supplies ReliabilityFirst does not communicate directly with the fuel industry on supply adequacy or potential problems ReliabilityFirst does periodically survey its generator owners and operators about relevant fuel issues that may occur The last survey was in 2008 to determine if severe flooding in the Midwest was expected to significantly delay or curtail fuel shipments
There are no known or expected conditions or situations regarding fuel supply or delivery hydroelectric reservoirs adverse weather generator availability environmental regulatory or capacity retirement that are anticipated to adversely impact the forecasts used in this 20122013 winter assessment
Imports and Exports on Peak
Expected and firm power imports into the ReliabilityFirst regional area are forecast to be 700 MW Firm power exports are forecast to be 700 MW There is no net interchange forecast for the ReliabilityFirst regional area There are no transactions using Liquidated Damage Contracts or make‐whole contracts
Reliability Assessment Analysis
The PJM projected reserve margin for winter 20122013 based on Net Internal Demand is 402 percent This 402 percent reserve margin is a 126 percentage point decrease over the 20112012 forecast reserve margin due to the reduction in available DSM reported by PJM for this winter The reserve margin requirement in PJM is 156 percent of the summer peak which requires minimum capacity resources of 164400 MW This is an equivalent requirement of 263 percent reserve margin based on the winter NID forecast PJM is projected to have adequate reserves for the 20122013 winter peak demand
The reserve margin requirement calculated for MISO is 167 percent of the Net Internal Demand of its market area The current projected reserve margin for MISO is 37300 MW which is 517 percent of the Net Internal Demand Therefore MISO is projected to have adequate reserves for the 20122013 winter peak demand
Since PJM and MISO are projected to have sufficient resources to satisfy their respective reserve margin requirements the ReliabilityFirst region is projected to have adequate resources for the 20122013 winter period In Table RFC‐4 the calculated reserve margin for ReliabilityFirst is 61600 MW which is 426 percent based on Net Internal Demand and Net Capacity Resources This compares to a 589 percent reserve margin in last winterrsquos assessment The reduction in available DSM reported by PJM for this winter and the retirement of generation resources after the summer is the reason for the decrease in winter reserve margins
Page 63
DECEMBER JANUARY FEBRUARY
TOTAL INTERNAL DEMAND (MW) 144500 146600 141200
DEMAND RESPONSE (MW) (1900) (1900) (1900)
NET INTERNAL DEMAND (MW) 142600 144700 139300
NET CAPACITY RESOURCES (MW) 206300 206300 206300
RESERVE MARGINS -- MW 63700 61600 67000 -- of NID 447 426 481
Introduction This study estimated the use of NPCC Area Operating Procedures designed to mitigate resource shortages for the winter of 201213 (November 2012 through March 2013) The CP‐8 Working Grouprsquos effort is consistent with the CO‐12 Working Grouprsquos study NPCC Reliability Assessment for Winter 2012‐13 November 2012 20 General Electricrsquos (GE) Multi‐Area Reliability Simulation (MARS) program was selected for the analysis GE Energy was retained by NPCC to conduct the simulations Results For the November 2012 ‐ March 2013 period Figure EX‐1a shows the estimated use of the indicated operating procedures under the Base Case assumptions for the expected load level (the expected load level results were based on the probability‐weighted average of the seven load levels simulated)
20 See httpwwwnpccorgdocumentsreportsSeasonalaspx
Page 65
Figure EX-1a
Expected Use of Indicated Operating Procedures for Winter 201213
Base Case Assumptions ndash Expected Load Level
For the November 2012 ‐ March 2013 period Figure EX‐1b shows the estimated use of the indicated operating procedures under the Base Case assumptions for the extreme load level (representing the second to highest load level having approximately a 6 chance of being exceeded)
0
1
2
NE NY ON MT Q
Estimated Number of
Occurrences (daysperiod)
Reduce 30-min Reserve
Initiate Interruptible Loads
Reduce 10-min Reserve
Appeals
Disconnect Load
Page 66
Figure EX-1b
Expected Use of the Indicated Operating Procedures for Winter 201213
Base Case Assumptions - Extreme Load Level
For the November 2012 ‐ March 2013 period Figure EX‐2a shows the estimated use of the indicated operating procedures under the Severe Case assumptions for the expected load level (the expected load level results were based on the probability‐weighted average of the seven load levels simulated)
0
1
2
Estimated Number of
Occurrences (daysperiod)
Reduce 30-min Reserve
Initiate Interruptible Loads
Reduce 10-min Reserve
Appeals
Disconnect Load
Page 67
0
1
2
NE NY ON MT Q
Estimated Number of
Occurrences (daysperiod)
Reduce 30-min Reserve
Initiate Interruptible Loads
Reduce 10-min Reserve
Appeals
Disconnect Load
Page 68
Figure Figure EX-2a
EX-2a
Expected Use of the Indicated Operating Procedures for Winter 201213
Severe Case Assumptions - Expected Load Level
For the November 2012 ‐ March 2013 period Figure EX‐2b shows the estimated use of the indicated operating procedures under the Severe Case assumptions for the extreme load level (representing the second to highest load level having approximately a 6 chance of being exceeded)
Figure EX-2b
Expected Use of the Indicated Operating Procedures for Winter 201213
Severe Case Assumptions - Extreme Load Level
0
2
4
6
NE NY ON MT Q
Estimated Number of
Occurrences (daysperiod)
Reduce 30-min Reserve
Initiate Interruptible Loads
Reduce 10-min Reserve
Appeals
Disconnect Load
Page 69
Conclusions
As shown in Figures EX‐1a the use of operating procedures designed to mitigate resource shortages is not expected for Queacutebec Ontario the Maritimes New York and New England under the assumed Base Case conditions for the expected load level The expected load level results were based on the probability‐weighted average of the seven load levels simulated Figure EX‐1b indicates only the Maritimes show a need to implement their operating procedures under Base Case extreme load level conditions
Figure EX‐2b shows the estimated use of operating procedures for the extreme load level if the severe set of resource unavailability assumptions used in this analysis occurs The extreme load level represents the second to highest load level having approximately a 6 chance of being exceeded Only the Maritimes and Quebec Areas show a need for use of operating procedures in response to a capacity deficiency this winter for these conditions The results for the Maritimes Area are driven by the assumption of continuation of the Pt Lepreau refurbishment outage The results for the Queacutebec Area are driven by the assumed generation reductions from Churchill Falls and La Sarcelle
Page 70
Appendix I ndash Winter 2012‐13 Expected Load and Capacity Forecasts
Table AP‐1 ndash NPCC Summary
Week Installed Total Load Demand Known Req Operating Unplanned Net Bottled Revised
‐ Includes known scheduled maintenance as of September 12 2012
‐ Assumed unplanned outages based on historical observation of outages with an additional 2000 MW of outages for generation at risk due to gas supply during seven weeks in January and
February
‐ Installed Capacity Firm Purchases and Sales and Interruptible Load are based on ISO‐NE Forward Capacity Market (FCM) resource obligations for the 2012‐2013 capacity commitment
period
‐ Purchases and sales consist of imports of 253 MW from Quebec and 322 MW from New York and an export of 100 MW to New York
‐ Load Forecast assumes Peak Load Exposure reported in the 2012 CELT Report
‐ Interruptible Loads consist of both active and passive (energy efficiency) FCM Demand Resource obligations
‐ 2375 MW of operating reserve assumes 125 of the first largest contingency at 1400 MW and 50 of the second largest contingency of 1250 MW
Page 73
Table AP‐4 ndash New York
Week Installed Firm Firm Total Load Demand Known Req Operating Unplanned Net
and available capacity from Churchill Falls at the Newfoundland minus Queacutebec border
2) Purchases 400 MW in December 581 MW in January and 481 MW in February
3) Sales of 253 MW + losses to ISO‐NE
Does not include firm sale of 145 MW to Cornwall (154 MW with losses)
4) Expected weekly internal peak load plus 154 MW for Cornwall including losses
5) Includes 250 MW of load management through voltage reduction (Direct Control Load Management)
Page 76
Appendix II ndash Load and Capacity Tables definitions
This appendix defines the terms used in the Load and Capacity tables of Appendix I Individual Balancing Authority Area particularities are presented when necessary
Installed Capacity
This is the generation capacity installed within a Reliability Coordinator area This should correspond to nameplate andor test data and may include temperature derating according to the Operating Period It may also include wind generation derating
Individual Reliability Coordinator area particularities
New England
Installed capacity is based on generator Forward Capacity Market supply obligations
Queacutebec
Most of the Installed Capacity in the Queacutebec Area is owned and operated by Hydro‐Queacutebec Production The remaining capacity is provided by Churchill Falls and by private producers (hydro wind biomass and natural gas cogeneration)
Maritimes
This number is the maximum net rating for each generation facility (net of unit station service) and does not account for reductions associated with ambient temperature derating and intermittent output (eg hydro andor wind)
Ontario
This number includes all generation registered with the IESO
New York
This number includes all generation resources that participate in the NYISO Installed Capacity (ICAP) market
NPCC A‐07
Capacity The rated continuous load‐carrying ability expressed in MW or MVA of generation transmission or other electrical equipment
Purchases
These are purchases between Reliability Coordinator areas or from outside NPCC that have firm transmission reservations to back them up
Individual Reliability Coordinator area particularities
New England
Imports with obligations in the Forward Capacity Market are included
Page 77
New York
NY does not use the firm transmission concept
Queacutebec
Both long term firm purchases and short term calls for tenders are included as needed
Maritimes
Short or long‐term capacity‐backed purchases would be included
Ontario
Ontario only allows hourly transactions
Sales
These are sales between Reliability Coordinator areas or to outside NPCC that have firm transmission reservations to back them up
Individual Reliability Coordinator area particularities
New England
Exports with Forward Capacity Market obligations are included
New York
NY does not use the firm transmission concept
Queacutebec
Firm sales and wheel throughs are included However in this assessment the 145 MW contract to Cedars Rapids Transmission is not included in the sales It is included in the Queacutebec Balancing Area demand This is different than what is done in the NERC seasonal assessments where this load is considered a firm export
Maritimes
Short or long‐term capacity‐backed sales would be included
Ontario
Ontario only allows hourly transactions
Total Capacity
Total Capacity = Installed Capacity + Purchases ndash Sales
Demand Forecast
This is the total internal demand forecast for each Reliability Coordinator area as per its Demand Forecast Methodology (Appendix IV)
Page 78
Demand Response
Loads that are interruptible under the terms specified in a contract These may include supply and economic interruptible loads Demand Response Programs or market‐based programs
Known MaintenanceConstraints
This is the reduction in Capacity caused by forecasted generator maintenance outages and by any additional forecasted transmission or by other constraints causing internal bottling within the Reliability Coordinator area Some Reliability Coordinator areas may include wind generation derating
Individual Reliability Coordinator area particularities
New England
Known maintenance includes all planned outages as reported on the ISO‐NE Annual Maintenance Schedule
Queacutebec
This includes scheduled generator maintenance and hydraulic as well as mechanical restrictions It also includes wind generation derating It may include ndash usually in summer ndash transmission constraints on the TransEacutenergie system
Maritimes
This includes scheduled generator maintenance and ambient temperature derates It also includes wind and hydro generation derating
Ontario
This includes generator maintenance derating plus generation bottling
Required Operating Reserve
This is the minimum operating reserve on the system for each Reliability Coordinator area
NPCC A‐07
Operating reserve This is the sum of ten‐minute and thirty‐minute reserve (fully available in 10 minutes and in 30 minutes)
Individual Reliability Coordinator area particularities
New England
The required operating reserve consists of 100 percent of the first largest contingency plus 50 percent of the second largest contingency
Page 79
New York
The required operating reserve consists of 150 percent of the first largest contingency
Queacutebec
The required operating reserve consists of 100 percent of the largest first contingency + 50 percent of the largest second contingency including 1000 MW of hydro synchronous reserve distributed all over the system to be used as stability and frequency support reserve
Maritimes
The required operating reserve consists of 100 percent of the first largest contingency plus 50 percent of the second largest contingency
Ontario
The required operating reserve consists of 100 percent of the first largest contingency plus 50 percent of the second largest contingency
Unplanned Outages
This is the forecasted reduction in Installed Capacity by each Reliability Coordinator area based on historical conditions used to take into account a certain probability that some capacity may be on forced outage
Individual Reliability Coordinator area particularities
New England
Monthly unplanned outage values have been calculated based on five years of historical unplanned outage data
Queacutebec
This value includes a provision for frequency regulation in the Queacutebec Balancing Authority Area for unplanned outages and for heavy loads as determined by the system controller
Maritimes
Monthly unplanned outage values have been calculated based on historical unplanned outage data
Ontario
This value is a historical observation of the capacity that is on forced outage at any given time
Net Margin
Page 80
Net margin = Total capacity ndash Load forecast + Interruptible load ndash Known maintenanceConstraints ndash Required operating reserve ndash Unplanned outages
Individual Reliability Coordinator area particularities
New York
NY plans for an Installed Reserve Margin requirement as a percentage above peak load forecast and approved by the New York State Reliability Council (NYSRC)
Bottled Resources
Bottled resources = Queacutebec Net margin + Maritimes Net margin ndash available transfer capacity between QueacutebecMaritimes and Rest of NPCC
This is used primarily in summer It takes into account the fact that the margin available in Maritimes and Queacutebec exceeds the transfer capability to the rest of NPCC since Queacutebec and Maritimes are winter peaking
Revised net margin (NPCC Summary only)
Revised net margin = Net margin ndash Bottled resources
This is used only in the Summer Assessment and follows from the Bottled Resources calculation
Page 81
Appendix III ndash Summary of Normal and Expected Feasible Transfer Capability under Winter Peak Conditions
The following table shows Normal Transfer Capability (NTC) between Reliability Coordinator areas representing transfer capabilities under normal system conditions It is recognized that the actual transfer conditions may differ depending on system conditions or configurations such as actual voltage profiles operating conditions etc Also the Feasible Transfer Capability (FTC) values represent an expected transfer capability under the peak demand scenario with the assumed transmission configuration identified in this report This Feasible Transfer Capability is based on historical operating experience and known operating constraints in each Reliability Coordinator area The total for each Reliability Coordinator area represents the simultaneous transfer between Reliability Coordinator areas that may be achievable It should be noted that real‐time transfer limits may change depending on the operation of the system at the time and readers are encouraged to review information on the Available Transfer Capability (ATC) and Total Transfer Capabilities (TTC) between Reliability Coordinator areas via httpwwwnerroorg
Diagram 1
Out
Page 82
Reliability Coordinator area Acronym Description
Maritimes Ontario
NB ‐ New Brunswick NW ‐ North West Sub‐Area
West ‐ Western Sub‐Area
New England Niagara ‐ Niagara
BHE ‐ Bangor‐Hydro Electric NE ‐ North‐East Sub‐Area
CMA ‐ Central Massachusetts CHAT ‐ Ottawa
VT ‐ Vermont East ‐ East
WMA ‐ Western Massachusetts RFC ‐ ReliabilityFirst Corporation
CT ‐ Connecticut MAN ‐ Manitoba
NOR ‐ Norwalk MRO ‐ Midwest Reliability Organization
MIN ‐ Minnesota
HAW ‐ Hawthorne
New York
The New York Balancing Authority area is divided into 11 zones (A ndash K) that are defined based on the transmission system topology
A West Queacutebec
B Genessee Brookfield ‐ Brookfield
C Central RPD‐KPW ‐ Rapide‐des‐Iles Kipawa
D North BRY‐PGN ‐ Bryson ‐ Paugan
E Mohawk Valley CHAT ‐ Chateauguay
F Capital CRT ‐ Cedar Rapids Transmission
G Hudson Valley BDF‐STS ‐ Bedford Stanstead
H Millwood BEAU ‐ Beauharnois
I Dunwoodie NIC ‐ Nicolet
J New York City MTP‐MDW ‐ Matapedia‐Madawaska
K Long Island OUTA ‐ Outaouais
Page 83
Transfers from Maritimes to
Interconnection Point NTC at Interconnection Points (MW)
FTC under Peak Conditions (MW)
Rationale for Constraint
Queacutebec
NB MTP ndash MDW Lines 2101 2102
Lines 30123114 3113
335
435
335
435
Eel River winter rating is 350 MW When Eel River converter losses and line losses to the Queacutebec border are taken into account Eel River to Matapeacutedia transfer is 335 MW
Madawaska winter rating is 435 MW
Total 770 770
New England
NB BHE
L3001 L3016
1000 1000 For resource adequacy studies NE assumes that it can import 700 MW of capacity to meet New England loads Note that New England would be able to import more than 700 MW if it backed down its generation in Maine or if many Maine generators were unavailable
Total 1000 1000
Transfers from New England to
Interconnection Point NTC at Interconnection Points (MW)
FTC under Peak Conditions (MW)
Rationale for Constraint
Maritimes
NB BHE
L3001 L3016390
1000 1000 For resource adequacy studies NE assumes that it can import 700 MW of capacity to meet New England loads Note that New England would be able to import more than 700 MW if it backed down its generation in Maine or if many Maine generators were unavailable
BHE NB
L3001 3016390
550 550 Transfer capability is dependent upon operating conditions in northern Maine If key generation or capacitor banks are not operational the transfer from New England to New Brunswick will be decreased At the present time the NBSO has limited the NTC to 200 MW but will increase it to 550 MW upon request from the NBSO under emergency operating conditions for up to 30 minutes This limitation is due to system security stability within New Brunswick and it is presently under review
Total 550 550
New York
VT D 0
Page 84
WMA F 843
CT G 843
NOR K 200
Sub Total 1886 1325 Feasible Simultaneous Transfer to New York excluding Cross Sound Cable ISO‐NE planning assumptions are based on an interface limit of 1400 MW
CT (CSC) K 330 330 The transfer capability of the Cross Sound Cable is 346 MW However losses reduce the amount of MWs that can actually be delivered across the cable When 346 MW is injected into the cable 330 MW is received at the point of withdrawal The Cross Sound Cable is a DC tie and is not included in the Feasible simultaneous transfer capability with NY
Total 2216 1655
Queacutebec
CMA NIC HVDC link
2000 0 Phase 2 is required for internal Queacutebec transmission needs at the time of peak Capability of the facility is 2000 MW conditions in NE NY amp PJM may limit to 1200 MW or less
Highgate (VT) ndash Bedford (BDF) Line 1429
170 0 Capability of the facility is 225 MW with a maximum of 220 MW deliverable to New England due to limits in Queacutebec At times conditions in Vermont limit the capability to 100 MW or less The DOE permit is 170 MW
Derby (VT) ndash Stanstead (STS) Line 1400
0 0 There is no capability to export to Queacutebec through this interconnection
Total 2170 0 The New England to Queacutebec transfer limit at peak load is assumed to be 0 MW It should be noted that this limit is dependant on New England generation and could be increased up to approximately 350 MW depending on New England dispatch If energy was needed in Queacutebec and the generation could be secured in the Real‐Time market this action could be taken to increase the transfer limit
Transfers from New York to
Page 85
Interconnection Point NTC at Interconnection Points (MW)
FTC under Peak Conditions (MW)
Rationale for Constraint
New England
D VT
F WMA
K CT
K NOR
Sub Total 1450 1450 Feasible Simultaneous Transfer to New England excluding Cross Sound Cable
K CT (CSC) 340 340 Cross Sound Cable power injection is up to 346 MW losses reduce power at the point of withdrawal to 340 MW The Cross Sound Cable is a DC tie and is not included in the Feasible Simultaneous Transfer capability with NY
Total 1790 1790
Ontario
D East Lines L33P L34P
A Niagara Lines PA301 PA302 BP76 PA27
Simultaneous Transfers between Ontario and NY may be impacted by loop flows and assumes phase shifting capability of Michigan ‐ Ontario interface is not available Additionally thermal limits on the QFW interface may restrict imports to lesser values when the generation in the Niagara area is taken into account BP76 OS
Total 1700 1700
PJM
A PJM
C PJM
G PJM
J PJM
Total 2350 2350 Feasible Simultaneous Transfer to PJM on peak
Queacutebec
D Chat L7040 1000 1000
D CRT Lines CD11 CD22
100 100
Total 1100 1100
Page 86
Transfers from Ontario to
Interconnection Point NTC at Interconnection Points (MW)
FTC under Peak Conditions (MW)
Rationale for Constraint
New York
East D Lines L33P L34P
300 300
Niagara A Lines PA301 PA302 BP76 PA27
1390 1390
Total 1690 1690 Simultaneous Transfers between Ontario and NY may be impacted by loop flows and assumes phase shifting capability of Michigan ‐ Ontario interface is not available BP76 is OS
MISO Michigan
Lines L4D L51D J5D B3N
2160 2160
Total 2160 2160 Simultaneous Transfers between Michigan and Ontario may be impacted by loop flows and assumes phase shifting capability of Ontario‐Michigan interface is not available
Queacutebec
NE RPD ndash KPW Lines D4Z H4Z
85 85 The 85 MW reflects an agreement through the TE‐IESO Interconnection Committee pending further study of available options resulting from the Outaouais Interconnection H4Z thermal capability in winter is 110 MW
Ottawa BRY ndash PGN Lines X2Y Q4C
140 52 Circuit Q4C is capable of transferring 140 MW less frac12 of Chat Falls generation that is considered in the Queacutebec Installed Capacity (140‐88=52) There is no capacity to export to Queacutebec through Lines P33C and X2Y
Ottawa Brookfield Lines D5A H9A
110 110 Only one of H9A or D5A can be in service at any time The 110 MW reflects the maximum load that can be transferred to Ontario from Queacutebec (Papier Masson Inc) D5A`s transfer capability is 200 MW
East Beau Lines B5D B31L
470 470 Capacity from Saunders that can be synchronized to the Hydro‐Queacutebec system
HAW OUTA
Lines A41T A42T
1250 1250 Normally Ontario will schedule up to 1230 MW allowing for a Transmission Reliability Margin of 20 MW
Total 2055 1967
MISO Manitoba Minnesota
NW MAN Lines K21W K22W
275 275
Page 87
NW MIN Line F3M
140 140
Total 415 415 Feasible Simultaneous Transfer to MAPP
Transfers from Queacutebec to
Interconnection Point NTC at Interconnection Points (MW)
FTC under Peak Conditions (MW)
Rationale for Constraint
Maritimes
MTP‐MDWNB Lines 2101 2102
Lines 30123114 3113
350 + radial loads
423 + radial loads
350 + radial loads
423 + radial loads
Eel River HVDC winter rating is 350 MW plus available radial load transfers (Radial load transfer amount is dependent on local loading and will be updated monthly Dec ‐ 78 MW Jan ndash 85 MW Feb ndash 74 MW March ndash 72 MW These values will be updated as required
Madawaska winter rating is 435 MW When Madawaska converter losses and line losses to the New Brunswick border are taken into account Madawaska to St‐Andreacute transfer is 423 MW
(Radial load transfer amount is dependent on local loading and will be updated monthly Dec ndash 157 MW Jan ndash 159 MW Feb ‐ 138 MW Marchndash 137 MW These values will be updated as required
Total 773 + radial loads 773 + radial loads
New England
NIC CMA HVDC link
2000 1400 Capability of the facility is 2000 MW actual conditions in NE NY PJM may lower this value The value estimated at peak load is 1400 MW However Phase 2 may be required for internal Queacutebec transmission needs at the time of peak in which case FTC would be ldquozerordquo
Bedford (BDF) ndash Highgate (VT) Line 1429
220 200 Limitations on the Queacutebec system under peak load conditions
Stanstead (STS) ndash Derby (VT) Line 1400
35 35
Total 2255 1635
New York
Chateauguay ndash D Line 7040
1500 1000 Beauharnois GS is used for Queacutebec needs under peak load conditions in which case transfer is limited to Chacircteauguay capacity
CRT ndash D Lines CD11 CD22
325 180 Transfer limit is 325 MW less projected peak Cornwall load of 145 MW tapped off the circuit
Total 1825 1180 Queacutebec to New York transfer capability may reach 2000 MW on an hour‐ahead basis and depending on operating conditions in New York and in Queacutebec
Ontario
Page 88
RPD‐KPW NE Lines D4Z H4Z
75 75 This represents Line D4Z capacity There is no capacity to export to Ontario through Line H4Z
BRY‐PGN Ottawa Lines X2Y P33C Q4C
400 232 Limitations on the Queacutebec system under peak load conditions restrict deliveries as follows P33C ‐ 167 MW and X2Y ndash 65 MW There is no capacity to export to Ontario through Line Q4C
Brookfield Ottawa Lines D5A H9A
200 200 Only one of H9A or D5A can be in service at any time The transfer capability reflects usage of D5A The 200 MW reflects the maximum transfer available from Queacutebec to Ontario D5Arsquos transfer limit is 250 MW
Beau East Lines B31L B5D
790 0 Beauharnois GS is used for Queacutebec needs under peak load conditions
OUTA HAW Lines A41T A42T
1250 1250 Normally Ontario will schedule up to 1230 MW allowing for a Transmission Reliability Margin of 20 MW
Total 2715 1757
Note Limitations on the Queacutebec system under peak load conditions may be due to resource limitations as opposed to transmission limitations so that the Feasible Transfer Capability does not necessarily correspond to the TTCs published elsewhere
Page 89
Transfers from Regions External to NPCC
Interconnection Point Normal Transfer Capability at Interconnection Points (MW)
Feasible Transfer Capability under Peak Conditions (MW)
Rationale for Constraint
MISO (Michigan) ONT Lines L4D L51D J5D B3N
1860 1860 Represents a worst case scenario for the implementation of Policy on operation
Total 1860 1860 Simultaneous Transfers between Michigan and Ontario may be impacted by loop flows and assumes phase shifting capability of Ontario‐Michigan interface is not available
MISO (Manitoba‐Minnesota) ONT
NW MAN Lines K21W K22W
275 275
NW MIN Line F3M
90 90
Total 365 365 Feasible Simultaneous Transfer to Ontario
PJM New York
A
C
G
J
Total 2650 2650 Feasible Simultaneous Transfer to New York
Page 90
Appendix IV ndash Demand Forecast Methodology
Reliability Coordinator area Methodologies
Maritimes
The Maritimes Area demand is the mathematical sum of the forecasted weekly peak demands of the sub‐areas (New Brunswick Nova Scotia Prince Edward Island and the area served by the Northern Maine Independent System Operator) As such it does not take the effect of load coincidence within the week into account If the total Maritimes Area demand included a coincidence factor the forecast demand would be approximately 1 to 3 percent lower
For the NBSO the demand forecast is based on an End‐use Model (sum of forecasted loads by use eg water heating space heating lighting etc) for residential loads and an Econometric Model for general service and industrial loads correlating forecasted economic growth and historical loads Each of these models is weather adjusted using a 30‐year historical average
For Nova Scotia the load forecast is based on a 10‐year weather average measured at the major load center along with analyses of sales history economic indicators customer surveys technological and demographic changes in the market and the price and availability of other energy sources
For Prince Edward Island the demand forecast uses average long‐term weather for the peak period (typically December) and a time‐based regression model to determine the forecasted annual peak The remaining months are prorated on the previous year
The Northern Maine Independent System Administrator performs a trend analysis on historic data in order to develop an estimate of future loads
New England
ISO New Englandrsquos energy model is an annual model of ISO‐NE Area total energy using real income the real price of electricity and weather variables as drivers Income is a proxy for all economic activity
The peak load model is a monthly model of the typical daily peak for each month and produces forecasts of weekly monthly and seasonal peak loads over a 10 year time period Daily peak loads are modeled as a function of energy weather and a time trend on weather for the summer months to capture the increasing sensitivity of peak load to weather due to the increasing cooling load
The reference demand forecast which has a 50 percent chance of being exceeded is based on weekly weather distributions and the monthly model of typical daily peak The weekly weather distributions were built using 40 years of temperature data at the time of daily electrical peaks (for non‐holiday weekdays) A reasonable approximation for ldquonormal weatherrdquo associated with the winter peak is 70 degF and for the summer peak is 902 degF
Page 91
ISO New Englandrsquos forecasting details may be found at httpwwwiso‐necomtransceltfsct_detailindexhtml
New York
The 2012‐13 winter forecast assumes normal weather conditions for both energy usage and peak demand The economic outlook is derived from the New York forecast provided to the NYISO by Moodys Economycom Econometric models are used to obtain energy forecasts for each of the eleven zones in New York A winter load factor is used to derive the winter peak from the annual energy forecast
The NYISO uses a weather index that relates dry bulb air temperature and wind speed to the load response in the determination of the forecast At the forecast load levels a one‐degree decrease in this index will result in approximately 100 MW of additional load The expected temperature at which the New York load could reach the forecast peak is 129 degF (‐11 degC)
Ontario
The Ontario Demand is the sum of coincident loads plus the losses on the IESO‐controlled grid Ontario Demand is calculated by taking the sum of injections by registered generators plus the imports into Ontario minus the exports from Ontario Ontario Demand does not include loads that are supplied by non‐registered generation The IESO forecasting system uses multivariate econometric equations to estimate the relationships between electricity demand and a number of drivers These drivers include weather effects economic data and calendar variables Using regression techniques the model estimates the relationship between these factors and energy and peak demand Calibration routines within the system ensure the integrity of the forecast with respect to energy and peak demand including zone and system wide projections IESO produces a forecast of hourly demand by zone From this forecast the following information is available
hourly peak demand
hourly minimum demand
hourly coincident and non‐coincident peak demand by zone
energy demand by zone
These forecasts are generated based on a set of weather and economic assumptions IESO uses a number of different weather scenarios to forecast demand The appropriate weather scenarios are determined by the purpose and underlying assumptions of the analysis The base case demand forecast uses a median economic forecast and monthly normalized weather Multiple economic scenarios are only used in longer term assessments A quantity of price‐responsive demand is also forecast based on market participant information and actual market experience
Page 92
Queacutebec
Hydro‐Queacutebecrsquos demand and energy‐sales forecasting is Hydro‐Queacutebec Distributionrsquos responsibility First the energy‐sales forecast is built on the forecast from four different consumption sectors ndash domestic commercial small and medium‐size industrial and large industrial The model types used in the forecasting process are different for each sector and are based on end‐use andor econometric models They consider weather variables economic‐driver forecasts demographics energy efficiency and different information about large industrial customers This forecast is normalized for weather conditions based on an historical trend weather analysis
The requirements are obtained by adding transmission and distribution losses to the sales forecasts The monthly peak demand is then calculated by applying load factors to each end‐use andor sector sale The sum of these monthly end‐usesector peak demands is the total monthly peak demand
Load Forecast Uncertainty (LFU) includes weather and load uncertainties Weather uncertainty is due to variations in weather conditions It is based on a 36‐year database of temperatures (1971‐2006) adjusted by 030 degC (054 degF) per decade starting in 1971 to account for climate change Moreover each year of historical climatic data is shifted up to plusmn3 days to gain information on conditions that occurred during either a weekend or a weekday Such an exercise generates a set of 252 different demand scenarios The base case scenario is the arithmetical average of the peak hour in each of these 252 scenarios Load uncertainty is due to the uncertainty in economic and demographic variables affecting demand forecast and to residual errors from the models
Overall uncertainty is defined as the independent combination of climatic uncertainty and load uncertainty This Overall Uncertainty expressed as a percentage of standard deviation over total load is similar to the previous reliability assessment For the 2012‐13 winter peak period the overall uncertainty is evaluated at 1560 MW
TransEacutenergie ndash the Queacutebec system operator ndash then determines the Queacutebec Balancing Authority Area forecasts using Hydro‐Queacutebec Distributionrsquos forecasts (HQ internal demand) and accounting for agreements with different private systems within the Balancing Authority Area The forecasts are updated on an hourly basis within a 12‐day horizon according to information on local weather wind speed cloud cover sunlight incidence and type and intensity of precipitation over nine regions of the Queacutebec Balancing Authority Area Forecasts on a minute basis are also produced within a two day horizon TransEacutenergie has a team of meteorologists who feed the demand forecasting model with accurate climatic observations and precise weather forecasts Short term changes in industrial loads and agreements with different private systems within the Balancing Authority Area are also taken into account on a short term basis
Page 93
Appendix V ‐ NPCC Operational Criteria and Procedures
NPCC Directories Pertinent to Operations
NPCC Regional Reliability Reference Directory 1 ndash Design and Operation of the Bulk Power System
Description This directory provides a ldquodesign‐based approachrdquo to ensure the bulk power system is designed and operated to a level of reliability such that the loss of a major portion of the system or unintentional separation of a major portion of the
system will not result from any design contingencies Includes Appendices F and G ldquoProcedure for Operational Planning Coordinationrdquo and rdquoProcedure for Inter Reliability Coordinator area Voltage Controlrdquo respectively Note‐Directory 1 is presently being revised by the NPCC Task Forces on Coordination of Operation and Coordination of Planning
Description Objectives principles and requirements are presented to assist the NPCC Reliability Coordinator areas in formulating plans and procedures to be followed in an emergency or during conditions which could lead to an emergency
Description This directory provides objectives principles and requirements to enable each NPCC Reliability Coordinator Area to provide reserve and simultaneous activation of reserve
Note‐The Directory 5 revisions was completed during 2012 was approved by NPCC membership and went into place on October 11 2012
NPCC Regional Reliability Reference Directory 6 ndash ldquoReserve Sharing Groupsrdquo Description This directory provides the framework for Regional Reserve Sharing Groups within NPCC It establishes the requirements for any Reserve Sharing Groups involving NPCC Balancing Authorities
NPCC Regional Reliability Reference Directory 8 ‐ System Restoration
Description This directory provides objectives principles and requirements to enable each NPCC Reliability Coordinator Area to perform power system restoration following a major event or total blackout
NPCC Regional Reliability Reference Directory 9‐ Verification of Generator Gross and Net Real Power Capability
Description This document establishes the minimum criteria to verify the Gross Real Power Capability and Net Real Power Capability of generators used to ensure accuracy of information used in the steady‐state and dynamic simulation models to assess the reliability of the NPCC bulk power system
Page 94
NPCC Regional Reliability Reference Directory 10‐ Verification of Generator Gross and Net Reactive Power Capability
Description This document establishes the minimum criteria to verify the Gross Reactive Power Capability and Net Reactive Power Capability of generators used to ensure accuracy of information used in the steady‐state and dynamic simulation models to assess the reliability of the NPCC bulk power system These criteria have been developed to ensure that the requirements specified in NERC Standard MOD‐025‐1 ldquoVerification of Generator Gross and Net Reactive Power Capabilityrdquo are met by NPCC and its applicable members responsible for meeting the NERC standards
NPCC Regional Reliability Reference Directory 12‐Underfrequency Load Shedding Requirements Description This document presents the basic criteria for the design and implementation of under frequency load shedding programs to ensure that declining frequency is arrested and recovered in accordance with established NPCC performance requirements to prevent system collapse due to load‐generation imbalance
A‐10 Classification of Bulk Power System Elements
Description This Classification of Bulk Power System Elements (Document A‐10) provides the methodology for the identification of those elements of the interconnected NPCC Region to which NPCC bulk power system criteria are applicable Each Reliability Coordinator area has an existing list of bulk power system elements The methodology in this document is used to classify elements of the bulk power system and has been applied in classifying elements in each Reliability Coordinator area as bulk power system or non‐bulk power system
C‐05 Monitoring Procedures for Emergency Operation Criteria
Description This procedural document establishes TFCOs monitoring and reporting requirements for conformance with NPCC Regional Reliability Reference Directory 2 ‐ Emergency Operations
C‐07 Monitoring Procedures for Guide for Rating Generating Capability
Description This procedural document establishes the TFCOs monitoring and reporting requirements for conformance with the NPCC Guide for Rating Generating Capability (Document B‐9)
C‐15 Procedures for Solar Magnetic Disturbances on Electrical Power Systems
Page 95
Description This procedural document clarifies the reporting channels and information available to the operator during solar alerts and suggests measures that may be taken to mitigate the impact of a solar magnetic disturbance
C‐17 Procedures for Monitoring and Reporting Critical Operating Tool Failures
The purpose of this document is to outline the reporting requirements responsibilities and obligations of the NPCC Reliability Coordinators (RCrsquos) in response to unforeseen critical operating tool failures
C‐35 NPCC Inter‐Area Power System Restoration Reference Document
Description This procedure provides guidance and training material to the system operator to manage system restoration events that affect the NPCC Reliability Coordinator areas and adjoining Reliability Coordinator areas
C‐36 Procedures for Communications during Emergencies
Description This procedure establishes the types of communications that should take place between Reliability Coordinator area system operators and with external agencies during an emergency It also indicates the data that should be collected during and after a major system event
C‐42 Procedure for Reporting and Reviewing System Disturbances
This document establishes the procedures of the Task Force on Coordination of Operation (TFCO) for reporting and reviewing system disturbances
C‐43 NPCC Operational Review for the Integration of New Facilities
The document provides the procedure to be followed in conducting operations reviews of new facilities being added to the power system This procedure is intended to apply to new facilities that if removed from service may have a significant direct or indirect impact on another Reliability Coordinator arearsquos inter‐Area or intra‐Area transfer capabilities The cause of such impact might include stability voltage andor thermal considerations
C‐44 NPCC Inc Regional Methodology and Procedures for Forecasting TTC and ATC
Description This document establishes a common methodology for calculating Total Transfer Capability (TTC) and Available Transfer Capability (ATC) within the NPCC Region
Page 96
Appendix VI ‐ Web Sites
Independent Electricity System Operator
httpwwwiesoca
ISO‐ New England
httpwwwiso‐necom
MAPP
httpwwwmappcororg
Maritimes
Maritimes Electric Company Ltd
httpwwwmaritimeelectriccom
New Brunswick Power Corporation
httpwwwnbpowercom
New Brunswick System Operator
httpwwwnbsoca
Nova Scotia Power Inc
httpwwwnspowerca
Northern Maine Independent System Administrator
httpwwwnmisacom
Midwest Reliability Organization
wwwmidwestreliabilityorg
National Oceanic and Atmospheric Administration Solar Cycle Sunspots
NPCC CP-8 Working Group 1 RCC Approved - June 13 2012
CP-8 WORKING GROUP
Northeast Power Coordinating Council Inc Phil Fedora Chairman Hydro-Queacutebec Distribution Abdelhakim Sennoun Independent Electricity System Operator Vithy
Vithyananthan ISO - New England Inc Fei Zeng National Grid Jack Martin New Brunswick System Operator Rob Vance New York Independent System Operator Frank Ciani New York State Reliability Council Al Adamson Nova Scotia Power Inc Kamala Rangaswamy Ontario Power Generation Inc Kevan Jefferies
The CP-8 Working Group acknowledges the efforts of Messrs Glenn Haringa and Mark Walling GE Energy and Patricio Rocha PJM and thanks them for their assistance in this analysis
NPCC CP-8 Working Group 2 RCC Approved - June 13 2012
TABLE OF CONTENTS
PAGE EXECUTIVE SUMMARY 4 Introduction 4 Results 4 Conclusions 7 INTRODUCTION 8 MODEL ASSUMPTIONS 9 Load Representation 9 Load Shape 9 Load Forecast Uncertainty 10 Generation 11 Unit Availability 12 Transfer Limits 14 Operating Procedures to Mitigate Resource Shortages 15
Assistance Priority 16 Modeling of Neighboring Regions 16 WINTER 201112 SUMMARY 19 ANALYSIS 22 Winter 201213 Results 22 Base Case Scenario 22
Base Case Assumptions helliphelliphelliphelliphelliphelliphelliphelliphelliphelliphelliphelliphelliphelliphelliphelliphelliphelliphelliphelliphellip 23 Severe Case Scenario 27 Severe Case Assumptionshelliphelliphelliphelliphelliphelliphelliphelliphelliphelliphelliphelliphelliphelliphelliphelliphelliphelliphelliphelliphellip 29 Conclusions 30
NPCC CP-8 Working Group 3 RCC Approved - June 13 2012
APPENDICES PAGE A) OBJECTIVE AND SCOPE OF WORK 31
B) EXPECTED NEED FOR OPERATING PROCEDURES 32 Table 7 - Base Case Assumptions (200304 Load Shape) 32 Table 8 - Severe Case Scenario (200304 Load Shape) 33 C) MULTI-AREA RELIABILITY SIMULATION PROGRAM DESCRIPTION 34
NPCC CP-8 Working Group 4 RCC Approved ndash June 13 2012
EXECUTIVE SUMMARY Introduction
This study estimated the use of NPCC Area Operating Procedures designed to mitigate resource shortages for the winter of 201213 (November 2012 through March 2013) The CP-8 Working Grouprsquos effort is consistent with the CO-12 Working Grouprsquos study NPCC Reliability Assessment for Winter 2012-13 November 2012 1 General Electricrsquos (GE) Multi-Area Reliability Simulation (MARS) program was selected for the analysis GE Energy was retained by NPCC to conduct the simulations
Results For the November 2012 - March 2013 period Figure EX-1a shows the estimated use of the indicated operating procedures under the Base Case assumptions for the expected load level (the expected load level results were based on the probability-weighted average of the seven load levels simulated)
Figure EX-1a Expected Use of Indicated Operating Procedures for Winter 201213
Base Case Assumptions ndash Expected Load Level For the November 2012 - March 2013 period Figure EX-1b shows the estimated use of the indicated operating procedures under the Base Case assumptions for the extreme load level (representing the second to highest load level having approximately a 6 chance of being exceeded) 1 See httpwwwnpccorgdocumentsreportsSeasonalaspx
NPCC CP-8 Working Group 5 RCC Approved ndash June 13 2012
Figure EX-1b Expected Use of the Indicated Operating Procedures for Winter 201213
Base Case Assumptions - Extreme Load Level For the November 2012 - March 2013 period Figure EX-2a shows the estimated use of the indicated operating procedures under the Severe Case assumptions for the expected load level (the expected load level results were based on the probability-weighted average of the seven load levels simulated)
Figure EX-2a Expected Use of the Indicated Operating Procedures for Winter 201213
NPCC CP-8 Working Group 6 RCC Approved ndash June 13 2012
For the November 2012 - March 2013 period Figure EX-2b shows the estimated use of the indicated operating procedures under the Severe Case assumptions for the extreme load level (representing the second to highest load level having approximately a 6 chance of being exceeded)
Figure EX-2b Expected Use of the Indicated Operating Procedures for Winter 201213
NPCC CP-8 Working Group 7 RCC Approved ndash June 13 2012
Conclusions As shown in Figures EX-1a the use of operating procedures designed to mitigate resource shortages is not expected for Queacutebec Ontario the Maritimes New York and New England under the assumed Base Case conditions for the expected load level The expected load level results were based on the probability-weighted average of the seven load levels simulated Figure EX-1b indicates only the Maritimes show a need to implement their operating procedures under Base Case extreme load level conditions Figure EX-2b shows the estimated use of operating procedures for the extreme load level if the severe set of resource unavailability assumptions used in this analysis occurs The extreme load level represents the second to highest load level having approximately a 6 chance of being exceeded Only the Maritimes and Quebec Areas show a need for use of operating procedures in response to a capacity deficiency this winter for these conditions The results for the Maritimes Area are driven by the assumption of continuation of the Pt Lepreau refurbishment outage The results for the Queacutebec Area are driven by the assumed generation reductions from Churchill Falls and La Sarcelle
NPCC CP-8 Working Group 8 RCC Approved ndash June 13 2012
INTRODUCTION
This study estimated the use of NPCC Area operating procedures to mitigate resource shortages for November 2012 through March 2013 The Working Grouprsquos efforts are consistent with the NPCC CO-12 Working Grouprsquos study NPCC Reliability Assessment for Winter 2012-13 November 2012 1 The development of this Working Grouprsquos assessment was in response to the following recommendation from the NPCC Reliability Assessment for Winter 200405 1
ldquoThe CO-12 assessment of the Summer Operating Period is accompanied by a corresponding multi area probabilistic assessment of Loss of Load Expectations and of the projected use of Operating Procedures designed to mitigate resource shortages This assessment was not performed for this Winter Operating Period For completeness in the assessment of the Winter Operating Period the CO-12 Working Group recommends that TFCO and TFCP review the merits of having this assessment performed for future Winter Operating Periodsrdquo
The database developed by the CP-8 Working Group for the NPCC Reliability Assessment for Summer 2012 April 2012 2 was used as the starting point for this analysis Working Group members reviewed the existing data and made revisions to reflect the conditions expected for the winter 201213 assessment period This report is organized in the following manner after a brief introduction specific model assumptions are presented followed by an analysis of the results based on the scenarios simulated The Working Groups Objective and Scope of Work is shown in Appendix A Tables presenting the corresponding results for the Base Case and Severe Case simulations are listed in Appendix B Appendix C provides an overview of General Electrics Multi-Area Reliability Simulation (MARS) Program version 314 was used for this assessment
2 See httpswwwnpccorgLibrarySeasonal20AssessmentNPCC_2012_Summer_Reliability_Assessment_Final_Reportpdf - Appendix VIII
NPCC CP-8 Working Group 9 RCC Approved ndash June 13 2012
MODEL ASSUMPTIONS
Load Representation The loads for each Area were modeled on an hourly chronological basis The MARS program modified the input hourly loads through time to meet each Areas specified annual or monthly peaks and energies Table 1 summarizes each NPCC Areas winter peak load assumptions for the winter 201213
Table 1 Assumed NPCC 201213 Peak Loads ndash MW
(200304 Load Shapes)
200304 Load Shape
Area Expected
Peak Extreme Peak
Month
Queacutebec (Q) 37262 40616 January
Maritimes Area (MT) 5209 5730 February
New England (NE) 22355 23211 January
New York (NY) 26794 27625 January
Ontario (ON) 22194 22995 January
Extreme Peak based on load forecast uncertainty for peak month Maritimes Area represents New Brunswick Nova Scotia Prince Edward Island and the
system administrated by the Northern Maine Independent System Administrator (NMISA)
Load Shape In 2006 the Working Group considered two load shape assumptions for the winter multi-area assessment
bull a 200203 load shape representative of a winter weather pattern with a typical expectation of cold days and
bull a 200304 load shape representative of a winter weather pattern that includes a consecutive period of cold days
Review of the results for both load shape assumptions indicated only slight differences in the results The Working Group agreed that the weather patterns associated with the 200304 load shape are representative of weather conditions that stress the system appropriate for use in future winter assessments Upon review of subsequent winter weather experience the Working Group agreed that the 200304 load shape assumption be again used for this analysis
NPCC CP-8 Working Group 10 RCC Approved ndash June 13 2012
The growth rate in each monthrsquos peak was used to escalate Area loads to match the Areas winter demand and energy forecasts The impacts of Demand-Side Management programs were included in each Areas load forecast Figure 1 shows the diversity in the NPCC area load shapes used in this analysis for the 200304 load shape assumptions
Figure 1 ndash 201112 Projected Monthly Peak Loads for NPCC Areas
(200304 Load Shape)
Load Forecast Uncertainty Peak load forecast uncertainty was also modeled The effects on reliability of uncertainties in the peak load forecast due to weather andor economic conditions were captured through the load forecast uncertainty model in MARS The program computes the reliability indices at each of the specified load levels (for this study seven load levels were modeled) and calculates weighted-average values based on input probabilities of occurrence While the per unit variations in the load can vary on a monthly basis Table 2 shows the values assumed for January 2013 Table 2 also shows the probability of occurrence assumed for each of the seven load levels modeled
NPCC CP-8 Working Group 11 RCC Approved ndash June 13 2012
In computing the reliability indices all of the Areas were evaluated simultaneously at the corresponding load level the assumption being that the factors giving rise to the uncertainty affect all of the Areas at the same time The amount of the effect can vary according to the variations in the load levels
For this study reliability measures are reported for two load conditions expected and extreme The values for the expected load conditions are derived from computing the reliability at each of the seven load levels and computing a weighted-average expected value based on the specified probabilities of occurrence The indices for the extreme load conditions provide a measure of the reliability in the event of higher than expected loads and were computed for the second-to-highest load level These values are highlighted in Table 2
Table 2 Per Unit Variation in Load Assumed for the Month of January 2013
Area Per-Unit Variation in Load
Q 10914 10900 10406 09989 09594 09192 09086
MT 11000 11000 10500 10000 09500 09000 09000
NE 10934 10383 09971 09635 09402 08500 08000
NY 10430 10310 10160 09980 09750 09440 09050
ON 10541 10361 10180 10000 09820 09639 09459
Prob 00062 00606 02417 03830 02417 00606 00062 Generation Tables 3(a) and 3(b) summarize the winter 201213 capacity assumptions for the NPCC Areas used in the analysis for the Base Case and the Severe Case Scenario respectively Base Case conditions are consistent with the assumptions used in the NPCC CO-12 Working Group NPCC Reliability Assessment for Winter 2012-13 November 2012
Reserve () 9 39 55 50 43 Annual Weighted Average Unit Availability ()
9859 9046 8768 8487 8576
Scheduled Maintenance 5
20 623 2140 25
Table 3 (b) NPCC Capacity and Load Assumptions for January 2013 - MW
Severe Assumptions Scenario - Extreme Load Q MT NE NY ON
Assumed Capacity 36405 6841 30712 3 39272 29800 3
PurchaseSale 1995 0 429 -456 0
Peak Load 4 40616 5655 23211 27625 22995
Demand Response (MW) 1302 0 863 1081 1166
Reserve () -2 21 38 44 35 Scheduled Maintenance 5
680 621 3169 1117
Unit Availability Details regarding the NPCC Arearsquos assumptions for generator unit availability are described in the respective Arearsquos most recent NPCC Comprehensive Review of Resource Adequacy 6 In addition the following Areas provided the following
3 Does not include demand-side resources 4 Based on the 200304 Load Shape assumption internal Queacutebec load shown 5 Maintenance shown is for the week of the monthly peak load Capacity shown for Queacutebec adjusted for
scheduled maintenance and other restrictions 6 See httpwwwnpccorgdocumentsreviewsResourceaspx
NPCC CP-8 Working Group 13 RCC Approved ndash June 13 2012
Queacutebec The planned outages for the winter period are reflected in this assessment The volume of planned outages is consistent with historical volumes Ontario Ontariorsquos generating unit availability was based on IESO ldquo18-Month Outlook An Assessment of the Reliability and Operability of the Ontario Electricity System from June 2012 ndash November 2013rdquo 7 Ontario market participants provided the majority of generation data Forced Outage Rates (FOR) and Planned Outage Rates (POR) were based on forecast values for generating units which reflect past experience and future expectations based on recent maintenance activities However for some of the generating units FOR and POR values were based on North American Reliability Council (NERC) Generator Availability Data System 8 (GADs) data for similar type units New England This probabilistic assessment reflects New England generating unit availability assumptions based upon historical performance over the prior five-year period Unit availability modeled reflects the projected scheduled maintenance and forced outages Individual generating unit maintenance assumptions are based upon each unitrsquos historical five-year average of scheduled maintenance Individual generating unit forced outage assumptions were based on the unitrsquos historical data and North American Reliability Council (NERC) average data for the same class of unit A more detailed description of the modeling assumptions can be found by referring to the corresponding FERC filings concerning the ISO-New England Installed Capacity Requirement and related values for the 3rd Reconfiguration Auction for the 20122013 Capability Year 9 New York Detailed availability assumptions used for the New York units can be found in the New York ISO Technical Study Report 10 Locational Minimum Installed Capacity Requirements Study covering the New York Control Area for the 2012 ndash 2013 Capability Year and the ldquoNew York Control Area Installed Capacity Requirement for the Period May 2012-April 2013rdquo New York State Reliability Council December 2 2011 report 11 7 See httpiesocaimowebpubsmarketReports18MonthOutlook_2012febpdf 8 See httpwwwnerccompagephpcid=4|43 9 See httpwwwiso-necomregulatoryfercfilings2011nover12-496-000_11-30-11_icr_2012-2013pdf 10 See httpwwwnyisocompublicmarkets_operationsservicesplanningplanning_studiesindexjsp 11 See httpwwwnysrcorgpdfReports201220IRM20Final20Reportpdf
NPCC CP-8 Working Group 14 RCC Approved ndash June 13 2012
Transfer Limits Figure 2 depicts the system that was represented in this Assessment showing Area and assumed Base Case transfer limits for the winter 201213 period New York Area internal transmission representation was consistent with the assumptions used in the New York ISO report 10 - Locational Minimum Installed Capacity Requirements Study covering the New York Control Area for the 2012 ndash 2013 Capability Year and the ldquoNew York Control Area Installed Capacity Requirements for the Period May 2012 ndash April 2013rdquo New York State Reliability Council December 2 2011 report 11
The New England internal transmission representation is consistent with assumptions currently being developed for the 2012 New England Regional System Plan 12
Figure 2 - Assumed Transfer Limits Between Areas
12 The New England Regional System plans can be found at httpwwwiso-necomtransrsp2009indexhtml
The transfer capability is 1000 MW However it was modeled as 700 MW to reflect limitations imposed by internal New England constraints
The transfer capability in this direction reflects limitations imposed by internal New England constraints
NPCC CP-8 Working Group 15 RCC Approved ndash June 13 2012
Tie transfer limits between Areas are indicated in Figure 2 with seasonal ratings (S- summer W- winter) where appropriate The acronyms and notes used in Figure 2 are defined as follows Chur - Churchill Falls NOR - Norwalk ndash Stamford RFC - ReliabilityFirst Corp MANIT - Manitoba BHE - Bangor Hydro Electric NB - New Brunswick ND - Nicolet-Des Cantons Mtl - Montreacuteal PEI - Prince Edward Island JB - James Bay C MA - Central MA CT - Connecticut MAN - Manicouagan W MA - Western MA NS - Nova Scotia NE - Northeast (Ontario) NBM - Millbank NW - Northwest (Ontario) MRO - Midwest Reliability VT - Vermont CSC - Cross Sound Cable
Organization Que - Queacutebec Centre Cdrs - Cedars NM - Northern Maine Centre Phase angle regulators (PARs) are installed on the Ontario ndash Michigan interconnection at Lambton Transformer Station (L4D and L51D) and Keith (J5D) on the Ontario side and at Bunce Creek Transformer Station (B3N) in Michigan representing the four interconnections with Michigan Final regulatory approvals have been received permitting operation of these facilities Operating Procedures to Mitigate Resource Shortages Each Area takes defined steps as their reserve levels approach critical levels These steps consist of those load control and generation supplements that can be implemented before firm load has to be actually disconnected Load control measures could include disconnecting interruptible loads public appeals to reduce demand and voltage reductions Other measures could include calling on generation available under emergency conditions andor reduced operating reserves The need for an Area to begin these operating procedures is modeled in MARS by evaluating the daily Loss of Load Expectation (LOLE) at specified margin states The user specifies these margin states for each area in terms of the benefits realized from each emergency measure which can be expressed in MW as a per unit of the original or modified load and as a per unit of the available capacity for the hour
Table 4 summarizes the load relief assumptions modeled for each NPCC Area The Working Group recognizes that Areas may invoke these actions in any order depending on the situation faced at the time however it was agreed that modeling the actions as in the order indicated in Table 4 was a reasonable approximation for this analysis
NPCC CP-8 Working Group 16 RCC Approved ndash June 13 2012
Table 4 - NPCC Operating Procedures to Mitigate Resource Shortages
201213 Winter Load Relief Assumptions - MW Actions Q MT NE 13 NY ON
1 Curtail Load Utility Surplus Appeals RT-DR SCR EDRP SCR Load Man Volt Red
1302 0 0 0
0 0 0 0
0 0
495 0
0 0
1384 021
148 100
0 0
2 No 30-min Reserves 500 234 600 600 473
3 Voltage Reduction Interruptible Load 14
250 0
0 285
322 0
124 0
0 0
4 No 10-min Reserves RT-EG 15
Appeals Curtailments
750 0 0
660 0 0
0 268
0
0 0
231
1081 0 0
5 5 Voltage Reduction No 10-min Reserves
0 0
0 0
0 1200
0 1200
260 0
Real-Time Demand Response
Assistance Priority All Areas received assistance on a shared basis in proportion to their deficiency In this analysis each step was initiated simultaneously in all Areas and sub-Areas Modeling of Neighboring Regions For the scenarios studied a detailed representation of RFC (ReliabilityFirst Corp) and the MRO-US (Midwest Reliability Organization ndash US portion) was modeled The assumptions are summarized in Table 5
Figure 3 shows the 201213 Projected Monthly Expected Peak Loads for NPCC PJM RFC-OTH (Other) and the MRO for the 200304 Load Shape assumption 13 Values for New Englandrsquos Real-Time Demand Resources and Real-Time Emergency Generation have
been derated to account for historical availability performance 14 Interruptible Loads for Maritimes Area (implemented only for the Area) Voltage Reduction for all
NPCC CP-8 Working Group 18 RCC Approved ndash June 13 2012
Figure 3 ndash 201213 Projected Monthly Expected Peak Loads (200304 Load Shape) ReliabilityFirst is the successor organization to the Mid-Atlantic Area Council (MAAC) the East Central Area Coordination (ECAR) Agreement and the Mid-American Interconnected Network (MAIN) organizations The RFC-OTH (Other) area modeled in this analysis was intended to represent the non-PJM RTO region data within RFC The modeling of the RFC region is in transition due to changes in the regional boundaries between RFC MRO and SERC This model was based on publicly available data from the NERC Electricity Supply amp Demand (ESampD) provided by PJM The modeling of RFC-OTH is expected to evolve for future studies as data reflecting the new regional boundaries becomes available For now the RFC-OTH area is the non-PJM RTO region that was formerly in either MAIN or ECAR The MAIN and ECAR boundaries do not correctly define the new RFC boundaries but this definition insures consistency within the use of the NERC ESampD data
NPCC CP-8 Working Group 19 RCC Approved ndash June 13 2012
WINTER 201112 SUMMARY Major Weather Highlights On average the 2011-2012 winter was a mild one for the contiguous United States NOAArsquos National Climatic Data Center 17 reported that December January and February (the meteorologicalrdquo winter for 2011-2012) was the fourth warmest of the past 117 winters The seasonal average temperature was 368 degrees Fahrenheit which is 39 degrees above the 20th century average The most unusually warm temperatures were found in the northern states especially in the northern Great Plains NOAArsquos National Climatic Data Center explained the reason for the pattern the jet stream stayed farther north than usual this winter The high-altitude winds of the jet stream generally mark the boundary between Arctic air to the north and warmer air to the south That position allowed warm southern air to prevail over the entire US and prevented cold fronts from descending from the north and clashing with warm fronts creating large snow- and rainstorms The jet stream was locked in that position for most of the winter 18 According to the National Oceanic and Atmospheric Administration more than 95 percent of the US had below-average snow cover the greatest such percentage ever recorded Load Comparison Table 6 compares NPCC Arearsquos actual 2011-12 winter peak demands against the forecast assumptions Except for the Maritimes the moderate winter temperatures coupled with the on-going economic recession and implementation of conservation programs resulted in less demand than forecast for all NPCC sub regions for the winter of 2011-12
17 See httpwwwclimatewatchnoaagovarticle2012u-s-has-fourth-warmest-winter-on-record-west-southeast-drier-than-average 18 See httpwwwscientificamericancomarticlecfmid=whats-causing-dry-winter
NPCC CP-8 Working Group 20 RCC Approved ndash June 13 2012
Table 6 Comparison of NPCC 201112 Actual and Forecast Peak Loads ndash MW
Date Actual
(MW)
Forecast
(Based on 200304 Load Shape)
Area Expected
Peak Extreme
Peak Month
Queacutebec Jan 16 2012 35481 37232 39782 January Maritimes Area
Feb 13 2012 5552 5464 6010 February
New England Jan 4 2012
19908
22225 23107 January
New York Jan 3 2012 23901 26174 26985 January
Ontario Jan 3 2012 21649 22270 23510 January
Queacutebec Winter 2011‐2012 was much warmer than normal In Montreacuteal average temperatures for winter were 34 degC (61 degF) higher than mean temperatures This was the warmest winter since 2001‐2002 and the second warmest since 1942 Internal demand was correspondingly low Only ten peak days showed demand values above 33000 MW Internal peak hourly demand for winter 2011‐2012 was established to be 35481 MW on Monday January 16 2012 at 8h00 EST This value includes 1388 MW of interruptible demand that was used at the time Therefore actual metered demand (Served Internal Demand) was 34093 MW at peak The annual forecast was 37209 MW Transfers to neighboring areas at the time of peak were 3512 MW Montreacuteal temperature at peak time was ‐18 degC (‐04 degF) and wind speed was 9 kmhour (6 mph) Temperatures in most other areas of the province were somewhat colder than in Montreacuteal but nowhere near usual peak period temperatures Thirty‐minute operating reserve at peak time was 2711 MW 1211 MW over the reserve requirement No particular transmission condition that affected internal demand or firm transactions occurred during the 2011 - 2012 winter period Maritimes The Maritimes Area load is the mathematical sum of the forecasted or actual peak loads of the sub-areas (New Brunswick Nova Scotia Prince Edward Island and the area served by the Northern Maine Independent System Operator)
NPCC CP-8 Working Group 21 RCC Approved ndash June 13 2012
It was a milder than usual winter and no reliability issues occurred in the Maritime Provinces The actual winter peak was 5375 MW and occurred on February 13 2012 The Maritime Provinces did not experience any unexpected extreme or adverse weather conditions and did not require use of its Demand Response measures New England Within New England during the 20112012 winter period there were no major operational issues that impacted system reliability The 20112012 actual New England winter peak of 19908 MW (21333 MW with passive demand resources added back in) occurred on January 4 2012 19 Implementation of Operating Procedure 4 (OP 4) was not required at the time of the peak However OP 4 was implemented on the morning of December 19 2011 due to forced generator reductionsoutages and loads running over the forecast New York The actual system coincident peak for the 20102011 winter was 23901 MW which occurred on January 3 2012 New York did not experience any significant operating issues during the winter 20112012 season Ontario The actual winter peak demand of 21649 MW occurred on January 3 2012 Ontario did not experience any significant operating issues during the 20112012 winter period
19 See httpwwwiso-necomtransceltfsct_detail2012winter_pknormal_2011-2012pdf
NPCC CP-8 Working Group 22 RCC Approved ndash June 13 2012
ANALYSIS
Winter 201213 Results Base Case Scenario Table 7 (see Appendix B) shows the estimated need for the indicated operating procedures (in daysperiod) for November 2012 through March 2013 period for the Base Case assumptions for all NPCC Areas for the 200304 load shape assumptions Figure 4(a) shows the estimated use of operating procedures occurrences for the NPCC Areas for the expected load (the expected load level results were based on the probability-weighted average of the seven load levels simulated) for the Base Case assumptions The results indicate that only the Maritimes Area has a chance to use these procedures in response to a capacity deficiency Figure 4(b) shows the corresponding results for the extreme load (representing the second to highest load level having approximately a 6 chance of being exceeded)
Figure 4a Estimated Use of the Indicated Operating Procedures for Winter 201213
Base Case Assumptions - Expected Load Level
Maritimes Area initiates interruptible loads instead of voltage reduction
NPCC CP-8 Working Group 23 RCC Approved ndash June 13 2012
Figure 4b Estimated Use of the Indicated Operating Procedures for Winter 201213
Base Case Assumptions Extreme Load Level
Base Case Assumptions The following summary of Base Case assumptions represents system conditions consistent with those assumed in the NPCC CO-12 Working Groups Reliability Assessment for Winter 2012-13 November 2012 The Base Case assumptions are summarized below System - As-Is System for the 2012-2013 period - Transfers allowed between Areas - 200304 Load Shape adjusted to Arearsquos year 2012 forecast (expected amp extreme
assumptions) 20
Ontario - Forecast consistent with the IESOrsquos 18-Month Outlook ndash (June 2012) 7
- 1511 MW of installed Wind Generation (seasonal wind capacity contribution of 336 at peak)
NPCC CP-8 Working Group 24 RCC Approved ndash June 13 2012
- Michigan ndash Ontario Phase Angle Regulators PARs on J5D L51D B3N and L4D are in-service
- BP76 (Ontario to New York 230 kV tie line) returns to service end of 2012 New England
- ~ 34515 MW of existing and planned generation resources modeled - ~ 1920 MW of demand supply resources modeled - ~ 575 MW of capacity import - ~2000 MW of gas-fired generation unavailable
New York - All cables in service - Assumptions consistent with the NYCA Installed Capacity Requirements for the Period
May 2012 through April 2013 - ~ 2165 MW of registered SCR resources discounted to historic availability (~1400
MW)
Maritimes - Point Lepreau Nuclear Generating Station returns to service October 1 2012 - 816 MW installed wind capacity in service prior to winter season - New hourly wind profile for each sub-area Queacutebec - Resources and load forecast consistent with Queacutebec 2011 Comprehensive Review -
including about 1500 MW of scheduled maintenance and restrictions - Trans-Canada Energy (TCE) Gas GS (547 MW) mothballed - Tracy thermal GS (450 MW) and La Citiegravere thermal GS are retired (280 MW) - 1835 MW of installed wind generation (520 MW modeled representing 30 value at
peak) and 104 MW derated by 100 - 150 MW of additional interruptible load expected for the winter period - 398 MW of firm capacity exports - 1100 MW of available capacity imports
PJM-RTO - As-Is System for the 201213 winter period ndash consistent with the PJM 2011 Reserve
Requirement Study 21 - 200304 Load Shapes adjusted to the 2012 forecast provided by PJM - Load forecast uncertainty of 9413 +- 505 1010 and 1515 - Operating Reserve 3400 MW (30-min 2765 MW 10-min 635 MW)
21 2011 PJM Reserve Requirement Study (RRS) dated October 13 2011 - available at this link on PJM
Web site httppjmcomplanningresource-adequacy-planning~mediaplanningres-adeq2011-rrs-studyashx
NPCC CP-8 Working Group 25 RCC Approved ndash June 13 2012
- 0 MW of Demand Response (DR) RFC lsquoOtherrsquo 22 - As-Is System for the 201213 winter period ndash based on NERC ESampD database updated
by the respective ISOs compiled by PJM staff - 200304 Load Shapes adjusted to the most recent monthly forecast provided by PJM - Load forecast uncertainty of 9401 +- 515 1030 and 1544 - Operating Reserve 2206 MW (30-min 1470 MW 10-min 736 MW)
MRO-US - As-Is System for the 201213 winter period - based on NERC ESampD database updated
by the respective ISOs compiled by PJM staff - 200304 Load Shapes adjusted to the most recent monthly forecast provided by PJM - Load forecast uncertainty of 9430 +- 490 981 and 1471 - Operating Reserve 1700 MW (30-min 1200 MW 10-min 500 MW)
New York Details The Base Case assumes that the New York City and Long Island localities will meet their locational installed capacity requirements as described in the New York ISO report - Locational Installed Capacity Requirements Study covering the New York Control Area for the 2012 ndash 2013 Capability Year and New York State will meet the capacity requirements described in the ldquoNew York Control Area Installed Capacity Requirements for the Period May 2012 ndash April 2013rdquo New York State Reliability Council December 2 2011 Technical Study Report The New York unit ratings were obtained from the ldquo2012 Load amp Capacity Data of the NYISOrdquo (Gold Book 23) Existing Resources All in-service New York generation resources were modeled Wind resources exhibit daily output variation that correlates to wind speed and density One approach would be to model wind resources with 90 summer and 70 winter derate factors The NYISONYSERDA Wind Study Phase 2 prepared by GE Energy Consulting 24 have shown these availability factors may be appropriate However the MARS model only captures monthly rating changes and not the daily changes necessary to accurately model this variation
22 ldquoRFC Otherrdquo refers to previous (before RFC ndash circa 2006) NERC regional boundaries of ECAR and MAIN excluding PJMrsquos territory 23 See httpwwwnyisocompublicwebdocsservicesplanningplanning_data_reference_documents2011_GoldBook_Public_Finalpdf 24 See httpwwwnyisocompublicservicesplanningspecial_studiesjsp
NPCC CP-8 Working Group 26 RCC Approved ndash June 13 2012
The NYISOrsquos approach is to model wind resources as load modifiers with a 90 summer derate factor Hourly wind readings taken at or near each wind resource are converted to hourly unit MW output Wind density turbine height and other factors are taken into account These hourly MW output values are then netted against the hourly zonal load New York uses historic hourly wind readings taken in 2002 This wind study year also corresponds to the base hourly load shape year used in this assessment Special Case Resources and Emergency Demand Response Programs Special Case Resources (SCRs) are loads capable of being interrupted and distributed generators rated at 100 kW or higher that are not directly telemetered SCRs offer load curtailment as ICAP resources and provide energyload curtailment when activated in accordance with the NYISO Emergency Operating Manual SCRs are required to respond to a deployment request for a minimum of four hours however there is no limit to the number of calls or the time of day in which the Special Case Resources may be deployed SCRs receive a capacity payment for load curtailment capability sold in the ICAP market and an energy payment for energy performance during a demand response event The Emergency Demand Response Program (EDRP) is a voluntary reliability program that allows registered interruptible loads and standby generators when activated in accordance with the NYISO Emergency Operating Manual EDRP resources are only paid for their energy performance during a demand response event There is no limit to the number of calls or the time of day in which EDRP resources may be deployed SCRs and EDRPs are modeled as an operating procedure step activated to minimize the probability of customer load disconnection The GE-MARS models the NYISO operations practice of only activating operating procedures in zones from which are capable of being delivered 2165 MW of registered SCR were discounted to historic availability (1316 MW January) 148 MW of load reduction from EDRP was discounted to historic availability (68 MW January) New England Details The New England generating unit ratings are consistent with their seasonal capability for the 2012 CELT report
Demand Supply Resources The passive non-dispatchable demand resources On-Peak and Seasonal-Peak are expected to provide ~962 MW of load relief during the peak hours About 958 MW of active demand resources including Real-Time Demand Resources and Real-Time Emergency Generation Resources provide additional real time peak load relief at a request by ISO New England during or in anticipation of expected operable capacity
NPCC CP-8 Working Group 27 RCC Approved ndash June 13 2012
shortage conditions to implement ISO-NE Operating Procedure No 4 Actions During a Capacity Deficiency These demand resources are discounted in the assessment to account for performance based on the observed availability factors of demand response programs in the past Ontario Details For the purposes of this study the Base Case assumptions for Ontario are consistent with the IESO ldquo18-Month Outlook An Assessment of the Reliability and Operability of the Ontario Electricity Systemrdquo (June 2012)7 but with the resource additions as shown below Existing Resources All in-service Ontario generation resources were modeled 2012 Resource Additions
Project Name Zone Fuel Type Estimated Effective
Date
Planned (MW)
Comber Wind Limited Partnership West Wind 2012-Q2 166 Pointe Aux Roches Wind West Wind 2012-Q2 49 Bruce Unit Bruce Uranium 2012-Q3 750
For the purposes of this assessment the IESO assumed that wind generation has a dependable contribution of 336 of the installed generation capacity All of the dispatchable demand response resources in Ontario total 1315 MW for the winter period In addition the study assumed 188 MW is available from Utility Surplus (aka ldquoStretchrdquo Capability) called as a part of operating procedures
Severe Case Scenario Table 8 (see Appendix B) shows the estimated need for the indicated operating procedures (in daysperiod) during November 2012 through March 2013 period for the Severe Case Scenario for all NPCC Areas for the 200304 load shape assumptions respectively Only the Maritimes Area is expected to need to use these procedures in response to a capacity deficiency for this Scenario Figure 5(a) shows the estimated use of operating procedures occurrences for the NPCC Areas for the expected load (the expected load level results were based on the probability-weighted average of the seven load levels simulated) for the Severe Case assumptions
NPCC CP-8 Working Group 28 RCC Approved ndash June 13 2012
Figure 5a Estimated Use of the Indicated Operating Procedures for Winter 201213
Severe Case Assumptions - Expected Load Level
Figure 5(b) shows the estimated use of the indicated operating procedures under the Severe Case assumptions for the extreme load level (representing the second to highest load level having approximately a 6 chance of being exceeded)
Figure 5b Estimated Use of the Indicated Operating Procedures for Winter 201213
NPCC CP-8 Working Group 29 RCC Approved ndash June 13 2012
Severe Case Assumptions The Severe Case Scenario assumptions are summarized below
System - As-Is System for the 201213 period - Transfers allowed between Areas - Transfer capability between NPCC and MRORFC- lsquoOtherrsquo reduced by 50 - 200304 Load Shape adjusted to Arearsquos year 2012 forecast (expected amp extreme
assumptions) 25 Ontario - ~1000 MW of maintenance extended into the winter period - Only existing Demand Response of 1141 MW modeled - Hydro electric capacity and energy 10 lower than the Base Case - Niagara ndash New York interconnection Limits reduced for the winter period (BP76
(Ontario to New York 230 kV tie line) outage continues) New England - Assume 50 reduction in Demand Resources - Maintenance overrun by 4 weeks - ~ 3800 MW of gas-fired generation unavailable
New York - Extended maintenance of 1000 MW in southeastern New York - 25 reduction in effectiveness of SCR and EDRP programs - 330 MW of assumed cable transmission transfer reduction resulting from component
failures within the Neptune and Cross Sound HVDC facilities
Maritimes - Point Lepreau Nuclear Generating Station returns to service April 1 2013 - 816 MW installed wind capacity in service prior to winter season - New hourly wind profile for each sub-area with the output from wind generation
reduced by half for the three winter months of December January and February Queacutebec - ~1000 MW reduction from Churchill Falls and 100 MW from La Sarcelle assumed PJM-RTO - Gas-fired only capacity not having firm pipeline transportation assumed ~4200 MW
unavailable - One percent increase in load forecast uncertainty - Ice Storm ice blocking fuel delivery to all units Unit outage event ~8400 MW 25 The 200304 load shape represents a weather pattern that includes a consecutive period of cold days
NPCC CP-8 Working Group 30 RCC Approved ndash June 13 2012
Conclusions The use of operating procedures designed to mitigate resource shortages is not expected for Queacutebec Ontario the Maritimes New York and New England under both the assumed Base Case conditions for the expected load level The expected load level results were based on the probability-weighted average of the seven load levels simulated Only the Maritimes show a need to implement their operating procedures under Base Case extreme load level conditions The Maritimes and Queacutebec Areas show a need for use of operating procedures in response to a capacity deficiency this winter for the extreme load level if the severe set of resource unavailability assumptions used in this analysis occurs The extreme load level represents the second to highest load level having approximately a 6 chance of being exceeded The results for the Maritimes Area are driven by the assumption of continuation of the Pt Lepreau refurbishment outage The results for the Queacutebec Area are driven by the assumed generation reductions from Churchill Falls and La Sarcelle
NPCC CP-8 Working Group 31 RCC Approved ndash June 13 2012
APPENDIX A
Objective and Scope of Work 1 Objective Using the GE Multi-Area Reliability Simulation (MARS) program review NPCC Area reliability resulting from the anticipated resource and transmission capacity reported for the 2012 ndash 2013 winter period under Base Case and Severe Case assumptions and summarize the range of results for the winter and shoulder season months (the period from November 2012 to March 2013) 2 Scope In meeting this objective the CP-8 Working Group will review the short-term resource adequacy of NPCC and neighboring regions for the 2012 and 2013 winter period recognizing uncertainty in forecasted demand scheduled outages of transmission forced and scheduled outages of generation facilities including fuel supply disruptions and the impact of proposed load response programs Reliability will be measured by calculating the estimated use of Area operating procedures used to mitigate resource shortages The results of the assessment will be approved no later than June 2012 The assessment will
bull Review last winterrsquos CP-8 Working Group Winter assessment with respect to actual NPCC Arearsquos experience
bull Consider the impacts of Sub-Area transmission constraints bull Incorporate to the extent possible a detailed GE MARS reliability representation
for the regions bordering NPCC bull Coordinate assessment assumptions with the NPCC Task Force on Coordination
of Operations (CO-12 Working Group) and bull Examine any impact of evolving market rules on overall NPCC interconnection
NPCC CP-8 Working Group 32 RCC Approved ndash June 13 2012
APPENDIX B
Table 7 - Base Case Assumptions (200304 Load Shape Assumption) Expected Need for Indicated Operating Procedures (daysperiod)
(Occurrences 05 or greater are highlighted)
Base Case Queacutebec Maritimes Area New England New York Ontario 30-min VR 10-min Appeal 30-min IL 10-min Appeal 30-min VR 10-min Appeal Disc 30-min VR Appeal 10-min Disc 30-min VR 10-min Appeal Disc Disc Disc 0304 Load Shape-Expected Load
NPCC CP-8 Working Group 34 RCC Approved ndash June 13 2012
APPENDIX C
Multi-Area Reliability Simulation Program Description General Electricrsquos Multi-Area Reliability Simulation (MARS) program 26 allows assessment of the reliability of a generation system comprised of any number of interconnected areas Modeling Technique A sequential Monte Carlo simulation forms the basis for MARS The Monte Carlo method allows for many different types of generation and demand-side options In the sequential Monte Carlo simulation chronological system histories are developed by combining randomly generated operating histories of the generating units with the inter-area transfer limits and the hourly chronological loads Consequently the system can be modeled in great detail with accurate recognition of random events such as equipment failures as well as deterministic rules and policies that govern system operation Reliability Indices The following reliability indices are available on both an isolated (zero ties between areas) and interconnected (using the input tie ratings between areas) basis
Daily Loss of Load Expectation (LOLE - daysyear)
Hourly LOLE (hoursyear)
Loss of Energy Expectation (LOEE -MWhyear)
Frequency of outage (outagesyear)
Duration of outage (hoursoutage)
Need for initiating Operating Procedures (daysyear or daysperiod)
The Working Group used both the daily LOLE and Operating Procedure indices for this analysis
The use of Monte Carlo simulation allows for the calculation of probability distributions in addition to expected values for all of the reliability indices These values can be calculated both with and without load forecast uncertainty The MARS program probabilistically models uncertainty in forecast load and generator unit availability The program calculates expected values of Loss of Load Expectation (LOLE) and can estimate each Areas expected exposure to their Emergency Operating Procedures Scenario analysis is used to study the impacts of extreme weather conditions variations in expected unit in-service dates overruns in planned scheduled maintenance or transmission limitations 26 See httpwwwgepowercomprod_servproductsutility_softwareenge_marshtm
NPCC CP-8 Working Group 35 RCC Approved ndash June 13 2012
APPENDIX C Resource Allocation Among Areas The first step in calculating the reliability indices is to compute the area margins on an isolated basis for each hour This is done by subtracting from the total available capacity in the area for the hour the load demand for the hour If an area has a positive or zero margin then it has sufficient capacity to meet its load If the area margin is negative the load exceeds the capacity available to serve it and the area is in a loss-of-load situation If there are any areas that have a negative margin after the isolated area margins have been adjusted for curtailable contracts the program will attempt to satisfy those deficiencies with capacity from areas that have positive margins Two methods are available for determining how the reserves from areas with excess capacity are allocated among the areas that are deficient In the first approach the user specifies the order in which an area with excess resources provides assistance to areas that are deficient The second method shares the available excess reserves among the deficient areas in proportion to the size of their shortfalls The user can also specify that areas within a pool will have priority over outside areas In this case an area must assist all deficient areas within the same pool regardless of the order of areas in the priority list before assisting areas outside of the pool Pool-sharing agreements can also be modeled in which pools provide assistance to other pools according to a specified order Generation MARS has the capability to model the following different types of resources
Thermal
Energy-limited
Cogeneration
Energy-storage
Demand-side management
An energy-limited unit can be modeled stochastically as a thermal unit with an energy probability distribution (Type 1 energy-limited unit) or deterministically as a load modifier (Type 2 energy-limited unit) Cogeneration units are modeled as thermal units with an associated hourly load demand Energy-storage and demand-side management impacts are modeled as load modifiers For each unit modeled the installation and retirement dates and planned maintenance requirements are specified Other data such as maximum rating available capacity states state transition rates and net modification of the hourly loads are input depending on the unit type The planned outages for all types of units in MARS can be specified by the user or automatically scheduled by the program on a weekly basis The program schedules planned maintenance to levelize reserves on either an area pool or system basis MARS also has the option of reading a maintenance schedule developed by a previous run and modifying it as specified by the user through any of the maintenance input data This schedule can then be saved for use by subsequent runs
NPCC CP-8 Working Group 36 RCC Approved ndash June 13 2012
APPENDIX C Thermal Unit In addition to the data described previously thermal units (including Type 1 energy-limited units and cogeneration) require data describing the available capacity states in which the unit can operate This is input by specifying the maximum rating of each unit and the rating of each capacity state as a per unit of the units maximum rating A maximum of eleven capacity states are allowed for each unit representing decreasing amounts of available capacity as governed by the outages of various unit components Because MARS is based on a sequential Monte Carlo simulation it uses state transition rates rather than state probabilities to describe the random forced outages of the thermal units State probabilities give the probability of a unit being in a given capacity state at any particular time and can be used if you assume that the units capacity state for a given hour is independent of its state at any other hour Sequential Monte Carlo simulation recognizes the fact that a units capacity state in a given hour is dependent on its state in previous hours and influences its state in future hours It thus requires the additional information that is contained in the transition rate data For each unit a transition rate matrix is input that shows the transition rates to go from each capacity state to each other capacity state The transition rate from state A to state B is defined as the number of transitions from A to B per unit of time in state A Number of Transitions from A to B TR (A to B) = _____________________________
Total Time in State A If detailed transition rate data for the units is not available MARS can approximate the transition rates from the partial forced outage rates and an assumed number of transitions between pairs of capacity states Transition rates calculated in this manner will give accurate results for LOLE and LOEE but it is important to remember that the assumed number of transitions between states will have an impact on the time-correlated indices such as frequency and duration Energy-Limited Units Type 1 energy-limited units are modeled as thermal units whose capacity is limited on a random basis for reasons other than the forced outages on the unit This unit type can be used to model a thermal unit whose operation may be restricted due to the unavailability of fuel or a hydro unit with limited water availability It can also be used to model technologies such as wind or solar the capacity may be available but the energy output is limited by weather conditions Type 2 energy-limited units are modeled as deterministic load modifiers They are typically used to model conventional hydro units for which the available water is assumed to be known with little or no uncertainty This type can also be used to model certain types of contracts A
NPCC CP-8 Working Group 37 RCC Approved ndash June 13 2012
APPENDIX C Type 2 energy-limited unit is described by specifying a maximum rating a minimum rating and a monthly available energy This data can be changed on a monthly basis The unit is scheduled on a monthly basis with the units minimum rating dispatched for all of the hours in the month The remaining capacity and energy can be scheduled in one of two ways In the first method it is scheduled deterministically so as to reduce the peak loads as much as possible In the second approach the peak-shaving portion of the unit is scheduled only in those hours in which the available thermal capacity is not sufficient to meet the load if there is sufficient thermal capacity the energy of the Type 2 energy-limited units will be saved for use in some future hour when it is needed Cogeneration MARS models cogeneration as a thermal unit with an associated load demand The difference between the units available capacity and its load requirements represents the amount of capacity that the unit can contribute to the system The load demand is input by specifying the hourly loads for a typical week (168 hourly loads for Monday through Sunday) This load profile can be changed on a monthly basis Two types of cogeneration are modeled in the program the difference being whether or not the system provides back-up generation when the unit is unable to meet its native load demand Energy-Storage and DSM Energy-storage units and demand-side management impacts are both modeled as deterministic load modifiers For each such unit the user specifies a net hourly load modification for a typical week which is subtracted from the hourly loads for the units area Transmission System The transmission system between interconnected areas is modeled through transfer limits on the interfaces between pairs of areas The transfer limits are specified for each direction of the interface and can be changed on a monthly basis Random forced outages on the interfaces are modeled in the same manner as the outages on thermal units through the use of state transition rates Contracts Contracts are used to model scheduled interchanges of capacity between areas in the system These interchanges are separate from those that are scheduled by the program as one area with excess capacity in a given hour provides emergency assistance to a deficient area Each contract can be identified as either firm or curtailable Firm contracts will be scheduled regardless of whether or not the sending area has sufficient resources on an isolated basis but they will be curtailed because of interface transfer limits Curtailable contracts will be scheduled only to the extent that the sending Area has the necessary resources on its own or can obtain them as emergency assistance from other areas
CP-8_Winter_2012_13_Multi-Area_Probabilistic_Assessment_Executive Summary to Place in CO-12_2012-2013Wpdf
EXECUTIVE SUMMARY 4
INTRODUCTION 8
MODEL ASSUMPTIONS 9
WINTER 201112 SUMMARY 19
ANALYSIS 22
A) OBJECTIVE AND SCOPE OF WORK 31
B) EXPECTED NEED FOR OPERATING PROCEDURES 32
C) MULTI-AREA RELIABILITY SIMULATION PROGRAM DESCRIPTION 34
C) MULTI-AREA RELIABILITY SIMULATION PROGRAM DESCRIPTION 34
Load Representation
Load Shape
Load Forecast Uncertainty
New England
Assistance Priority
Major Weather Highlights
Load Comparison
New England Details
Demand Supply Resources
Ontario Details
Page 5
2 Introduction
The NPCC Task Force on Coordination of Operation (TFCO) established the CO‐12 Working Group to conduct overall assessments of the reliability of the generation and transmission system in the NPCC Region for the Summer Operating Period (defined as the months of May through September) and the Winter Operating Period (defined as the months of December through March) The Working Group may occasionally study other conditions as requested by the TFCO
For the 2012‐13 Winter Operating Period3 the CO‐12 Working Group
Examined historical winter operating experiences and assessed their applicability for this period
Examined the existing emergency operating procedures available within NPCC and reviewed recent operating procedure additions and revisions The NPCC CP‐8 Working Group has done a probabilistic assessment of the implementation of operating procedures for the 2012‐13 Winter Operating Period The results and conclusions of the CP‐8 assessment are included as chapter 9 in this report and the full report is included as Appendix VIII
Reported potential sensitivities that may impact resource adequacy on a Reliability Coordinator Area basis These sensitivities included temperature variations new wind generation delays to in‐service of new generation load forecast uncertainties evolving load response measures solar magnetic activity system voltage and generator reactive capability limits
Reviewed the communications protocols with participants to ensure that timely and efficient communications will be in place in all Reliability Coordinator Areas to maximize the availability of emergency support
Reviewed the capacity margins accounting for bottled capacity within the NPCC
Reviewed inter‐Area and intra‐Area transmission adequacy including new transmission projects upgrades or derates and potential transmission problems
Reviewed the operational readiness of the NPCC region and actions to mitigate potential problems
Assessed the implications of strategies adopted for the Winter Operating Period on the adequacy of supply in the shoulder months
Coordinated data and modeling assumptions with NPCC CP‐8 Working Group and documented the methodology of each Reliability Coordinator area in its projection of load forecasts
3 For the purposes of this report the Winter Operating Period includes the week beginning November 25 2012 to the week beginning March 24 2013 inclusive
Page 6
Coordinated with other parallel seasonal operational assessments including the Eastern Interconnection Reliability Assessment Group (ERAG) SERC East ‐ ReliabilityFirst ndash NPCC and the NERC Reliability Assessment Subcommittee (RAS) Assessments
Page 7
3 Demand Forecasts for Winter 2012‐13
The non‐coincident forecasted peak demand for NPCC over the 2012‐13 Winter Operating Period is 112217 MW This peak demand translates to a coincident peak demand of 111860 MW which is expected during the week beginning January 13 2013 Demand and Capacity forecast summaries for NPCC Maritimes New England New York Ontario and Queacutebec are included in Appendix I
Ambient weather conditions are an important variable impacting the demand forecasts However unlike the summer demand forecasts the non‐coincident peak demand varies only slightly from the coincident peak forecast in the winter This is mainly due to the fact that the drivers that impact the peak demand are concentrated into a specific period in time In winter the peak demands are determined mainly by low temperatures along with the reduced hours of daylight that occurs over the first few weeks of January
While the peak demands appear to be confined to a few weeks in January each Area is aware that reduced margins could occur during any week of the operating period as a result of weather variables and or higher than normal outage rates
The impact of ambient weather conditions on load forecasts can be demonstrated by various means The IESO and Maritimes represent the resulting load forecast uncertainty in their respective Areas as a mathematical function of the base load The NYISO use a weather index that relates air temperature and wind speed to the load response and increases the load by a MW factor for each degree below the base value TransEacutenergie the Queacutebec system operator updates forecasts on an hourly basis within a 12 day horizon based on information on local weather wind speed cloud cover sunlight incidence and type and intensity of precipitation over nine regions of the Queacutebec Balancing Authority Area ISO‐NE relates air temperature to the load response and increases the load by a MW factor for each degree below the base value
The method each Reliability Coordinator area uses to determine the peak forecast demand and the associated load forecast uncertainty relating to weather variables is described in Appendix IV Below is a summary of all Reliability Coordinator Area forecasts
Page 8
Summary of Reliability Coordinator Area Forecasts
Maritimes
Based on the Maritimes Area winter 2012‐13 demand forecast a peak of 5246 MW is predicted to occur this Winter Operating Period December through February The peak demand is forecasted to occur the week beginning January 20 2013 The forecasted peak is approximately 6 percent higher than last yearrsquos actual winter peak of 4963 MW which occurred February 13 2012 This can be explained as last winter was milder than expected and there has been some loss of industrial load During the NPCC forecasted peak week beginning January 13 2013 the Maritimes Area is forecasting a load of 4889 MW
It should be noted that the Maritimes Area load is simply the mathematical sum of the forecasted weekly peak loads of the sub‐areas (New Brunswick Nova Scotia Prince Edward Island and the area served by the Northern Maine Independent System Operator) As such it does not take the effect of load coincidence within the week into account If the total Maritimes load included a coincidence factor the forecast load would be approximately 1‐3 percent lower The following graph illustrates the weekly Maritimes forecast
The New England Balancing Authority Area reference forecast (50 percent chance of being exceeded) for winter 2012‐13 projects a peak demand of 21392 MW4 This projected peak is 103 MW (05 percent) lower than the 2011‐12 winter projected peak of 21495 MW5 and 1466 MW (74 percent) higher than the 2011‐12 actual metered winter peak of 19926 MW The key factors driving this fairly level forecast are the continued penetration of energy efficiency and the lingering effects of the economic recession New Englandrsquos all‐time winter peak demand of 22818 MW occurred on January 15 2004 If extremely cold weather occurs for a prolonged period during the upcoming Winter Operating Period the winter peak demand could reach 22132 MW (10 percent chance of being exceeded)
The following graph illustrates the range of potential peak demands that ISO‐NE may experience this winter and compares them to historical peaks (1980‐2011)
Figure 2 New England Winter 2012‐13 Weekly
Load Profile
4 This forecast takes into account a reduction of 963 MW for passive demand resources (energy efficiency) with capacity supply obligations in ISO‐NErsquos Forward Capacity Market Without that reduction the forecast is the reference load forecast of 22355 MW published in the ISO New England 2012 CELT Report and shown in Table AP‐3 Appendix I of this report
5 The 2011‐12 forecasted winter peak demand without the effects of energy efficiency was 22255 MW
Page 10
Page 11
New York
The New York Balancing Authority 2012‐13 winter peak load forecast is 24832 MW which is 299 MW higher than the forecast of 24533 MW peak for the 2011‐12 winter and 931 MW more than the actual winter peak in 2011‐12 of 23901 MW This forecast load is 278 percent lower than the all‐time winter peak load of 25541 MW that occurred on December 20 2004 The daily peak demand observed by New York during the Winter Operating Period occurs in the late afternoon or early evening hours
The following illustration provides the range of potential peak demands that New York may experience this winter
Figure 3 New York Winter 2012‐13 Weekly Load Profile
19000
20000
21000
22000
23000
24000
25000
26000
27000
MW
Week Beginning
Extreme Load Normal Load Historical Max Load
Page 12
Ontario
The forecasted weather normal hourly peak demand for this Winter Operating Period is 22087 MW This is 224 MW lower than the 22311 MW forecasted last winter and 438 MW higher than last winterrsquos actual peak of 21649 MW The actual peak demand for the 2011‐12 Winter Operating Period occurred on January 3 2012 The forecasted peak demands are expected to decline in comparison to last winter because of the continued growth in embedded (distributed) generation and conservation programs
The following graph illustrates the range of possible demands that the IESO may experience over this Winter Operating Period The peak demand is forecast for the week beginning January 13 2013 however the peak can occur at any time during the season from the week beginning December 09 2012 to the week beginning February 24 2013
The Queacutebec Balancing Authority Area is winter peaking Hydro‐Queacutebecrsquos reference peak internal demand forecast for the 2012‐13 Winter Operating Period is 37543 MW assumed to occur during the week beginning January 13 2013 This is 390 MW higher than the 2011‐12 forecast of 37153 MW (105 percent) A slight increase in all demand sectors and particularly in the industrial sector has caused this rise in the forecast The actual internal peak demand for the 2011‐12 Winter Operating Period was 35481 MW which occurred on January 16 2012 at 8h00 EST (See ldquoPost‐Seasonal Assessment and Historical Reviewrdquo section below)
These values do not include the supply of 145 MW of load to Cornwall over the Cedars Rapids Transmission (CRT) system (154 MW with losses) This load in the Cornwall area of Ontario is tapped‐off CD11 and CD22 120 kV lines which are in a radial configuration (not connected to TransEacutenergiersquos main grid) from Les Cegravedres Generating Station in Queacutebec to Dennison in New York This load is served by Queacutebec For this reason the Cornwall load is included in Table AP‐6 Appendix I The demand forecast in Table AP‐6 for the week beginning January 13 is therefore 37697 MW
Throughout the Winter Operating Period as seen in Table AP‐6 weekly peak demand varies from 30700 MW for the week beginning November 25 to 37697 MW for the week beginning January 13 and back to 29741 MW for the week beginning March 24
The following graph demonstrates the range of potential weekly peak demands on the Queacutebec system for the 2012‐13 Winter Operating Period
Extreme Load 90 Normal Load 50 Historical Max Load
Page 15
4 Resource Adequacy
NPCC Summary for Winter 2012‐13
The following assessment of resource adequacy indicates the week with the highest coincident NPCC demand is the week beginning January 13 2013 Detailed Projected Load and Capacity Forecast Summaries specific to NPCC and each Area are included in Appendix I
Table AP‐1 Appendix I is the NPCC load and capacity summary for the 2012‐13 Winter Operating Period Appendix I Tables AP‐2 to AP‐6 contain the load and capacity summary for each NPCC Balancing Authority area Each entry in Table 1 is simply the aggregate of the corresponding entry for the five NPCC Balancing Authority Areas
Table 1 (below) summarizes the load and capacity situation for the peak week beginning January 13 2013 compared to the winter 2011‐12 forecasted peak week (week beginning January 15 2012)
Page 16
TABLE 1
Comparison of Resource Adequacy for NPCC
2012‐13 Forecast and 2011‐12 Forecast
All values in MW Forecasted week of Jan 13 2013
2012‐13 Forecast
Forecasted week of Jan 15 2012
2011‐12 Forecast
Difference
Installed Capacity 159446 156931 2515
Purchases 0 0 0
Sales 0 0 0
Total Capacity 159446 156931 2515
Coincident Demand 111860 111821 39
Demand Response 6048 6914 ‐866
MaintenanceDe‐rate 15415 16099 ‐684
Required Reserve 7558 7548 10
Unplanned Outages 10779 9736 1043
Net Margin 19881 18641 1240
This years 1240‐MW increase in Net Margin is mainly due to an increase in Installed Capacity balanced by an increase in unplanned outages The following sections detail the winter 2012‐13 capacity analysis for each Reliability Coordinator area
Page 17
The following are the assessments for each Balancing Authority Area supporting this overall resource adequacy assessment
Projected Capacity Analysis by Reliability Coordinator area
Maritimes
The Installed Capacity for the assessment period is 7423 MW This is a decrease of 263 MW when compared to last winter Since the last winter assessment the Dalhousie thermal plant (299 MW) retired in May 2012 and the Amherst wind farm (30 MW) came on line April 2012 The remaining 6 MW decrease can be attributed to minor de‐rates spread throughout the fleet It should be noted that The Point Lepreau Nuclear station (approximately 660 MW) which has been out for refurbishment since April 2008 is expected to be back in service Fall 2012
During the NPCC forecasted peak week of January 13 2013 the Maritimes Area Installed Capacity is 7423 MW When allowances for firm sales purchases known maintenance and de‐ratings required operating reserve and unplanned outages are considered the Maritimes Area is projecting a net margin of 762 MW for the NPCC peak week The net margins will range from 393 MW to 1239 MW (7 to 30 percent) over the Winter Operating Period The corresponding 2011‐12 winter Maritimes net margin range was 8 percent to 30 percent
The Maritimes Area assesses its seasonal resource adequacy in accordance with NPCC Directory 1 Appendix F Procedure for Operational Planning Coordination As such the assessment considers the regional operating reserve criteria 100 percent of the largest single contingency and 50 percent of the second largest contingency
The Maritimes area is forecasting normal hydro conditions for the 2012‐13 winter assessment period The Arearsquos hydro resources are run of the river facilities with limited reservoir storage facilities These facilities are primarily utilized as peaking units and providing operating reserve
The Maritimes Area is not relying on outside assistanceexternal resources during the Winter Operating Period
New England
With the expected weather and planned resource outages capacity within New England is forecasted to be sufficient to meet load plus operating reserve requirements during this Winter Operating Period The lowest projected net margin of 2227 MW (102 percent) is expected to occur during the week beginning February 9 2013 while the highest projected net margin of 8288 MW is expected to occur during the week beginning March 23 2013 if all assumed system conditions materialize under the reference load forecast (50 percent chance of being exceeded)
Page 18
The net margin is based on known outages an allowance for unplanned outages6 anticipated generation additions and retirements projected firm purchases and sales and the impact of expected Demand Response Programs
In addition to the allowance for unplanned outages an allowance for higher unplanned outages due to possible natural gas shortages of New England generators is included in the seven highest load weeks of January and February This allowance which has historically been assumed to be 2000 MW under the reference load forecast significantly decreases the forecasted net margins during the weeks of January 8 through February 19 With the growing concern of gas supply at risk it is anticipated this value will increase over the next few months This may require the supplemental commitment of additional resources and repositioning of existing planned generator outages
Natural gas‐fired generation represents the largest component of ISO‐NErsquos total installed capacity at 453 percent (15599 MW) followed by oil‐fired generation at 214 percent (7358 MW) nuclear generation at 136 percent (4674 MW) and coal at 69 percent (2367 MW) Hydroelectric capacity and pumped‐storage capacity make up 47 and 49 percent of the total respectively The remaining 32 percent of capacity consists of renewable resources such as wind or biomass facilities
During times of capacity deficiencies ISO New England invokes ISO‐NE Operating Procedure No 4 ndash Actions during a Capacity Deficiency (OP‐4) which includes public appeals for conservation purchasing emergency energy from the neighboring Areas interrupting real time demand response providers and implementing voltage reductions
While ISO New England expects to have adequate margins for this winter under expected weather and normal resource outages if operable capacity shortages occur due to higher than expected resource unavailability or higher than expected load conditions ISO New England may have to implement ISO‐NE OP 4 or ISO‐NE Operating Procedure No 21 ndash Action during an Energy Emergency (OP 21) OP 21 is an emergency operating procedure designed to provide additional commitment and dispatch flexibility to manage and conserve fuel‐limited supply‐side resources Since the initial coordinated data gathering reflected in this report and as a result of additional information since Hurricane Sandy New England projects that an additional 955 MW of capacity will most likely be unavailable for this winter period In addition New England also expects that reduced LNG supplies into the Northeast may also cause further reductions on New England generators during extreme cold weather conditions
6 The allowance for unplanned outages is based on historical trends and is estimated to be between 2200 MW and 3200 MW during the winter
Page 19
New York
The NYISO forecasts available installed capacity of 32050 MW for the peak week (week beginning February 3 2013 indicates the lowest net margin) demand forecast of 24832 MW Available installed capacity is the total installed capacity less known planned and predicted forced outages Accounting for purchases sales required operating reserve demand response planned and unplanned outages results in a Net Margin of 6038 MW
These resources represent all generation capability located physically within the New York Balancing Authority Area that is able to participate in the NYISO ICAP market In addition to these generation resources within the New York Balancing Authority Area generation resources external to the New York Balancing Authority Area can also participate in the NYISO ICAP market Resources within the New York Balancing Authority Area that provide firm capacity to an entity external to the New York Balancing Authority Area are not qualified to participate in the ICAP market An external ICAP supplier must declare that the amount of generation that is accepted as ICAP in NY will not be sold elsewhere The external Area in which the supplier is located has to agree that the supplier will not be recalled or curtailed to support its own loads or will treat the supplier using the same pro rata curtailment priority for resources within its Balancing Authority Area The energy that has been accepted as ICAP in NY must be demonstrated to be deliverable to the NY border The NYISO sets a limit on the amount of ICAP that can be provided by suppliers external to NY
NYISO conducts semi‐annual and monthly Installed Capacity (ICAP) auctions Based on the forecast load for 2012‐13 the ICAP requirement is 28805 MW based on a 160 percent installed reserve margin (IRM) requirement Last year the IRM requirement was 155 percent When allowances are taken for scheduled and unplanned outages (based on historical performance of 80 percent unavailable capacity) the net available resources will be 32050 MW This will be sufficient to meet the New York Balancing Authority Area load and operating reserve requirement during the peak load hours with an additional reserve margin of approximately 6038 MW expected at peak conditions
Generation retirements since the winter 2011‐12 period total 397 MW This includes Glenwood ST 04 and 05 (228 MW) Far Rockaway ST 04 (100 MW) Binghamton Cogen (48 MW) Beebee CT 13 (18 MW) and Kensico Hydro (3 MW) In addition 1099 MW of generation have been placed into protective layup This included Dunkirk units 3 and 4 (435 MW) Astoria 4 (380 MW) Astoria 2 (180 MW) and Astoria GTs 10 and 11 (32 MW each)
NYISO expects approximately 549 MW of load relief from emergency operating procedures that include internal load curtailment by the transmission owners public appeals and 5 percent system wide voltage reductions during forecast peak demand conditions Participation in the Emergency Demand Response Program (EDRP) and Special Case Resources (SCR) programs represents an additional 800 MW available through the market EDRP participants voluntarily curtail load when requested by the
Page 20
NYISO SCR participants must as part of their agreement curtail power usage usually by shutting down when asked by the NYISO
Ontario
The IESO begins the Winter Operating Period with an installed generating capacity of 36231 MW By the end of the assessment period the installed capacity will decrease by 201 MW to 36060 MW This decrease is due to the shutdown of the Atikokan coal plant in order to convert it to a biomass facility The change in capacity from last year includes the addition of four wind projects with a total capacity of 409 MW which are scheduled to be in service for and the return of two refurbished nuclear units (750 MW) during fourth quarter of 2012
The IESO expects to have adequate margins for this winter under expected weather and normal resource outages These net margins range from 7347 MW to 11416 MW The lowest projected net margin of 357 percent is expected to occur during the week beginning November 25 2012 while the highest projected net margin of 579 percent is expected to occur during the week beginning December 23 2012 if all planned outages are allowed to proceed as requested
This analysis is based on a review of known outages a projection of unplanned outages and a forecast of price responsive loads Known outages include those resources that are scheduled to be on planned outages transmission constrained resources as well as the difference between the installed capacity and the dependable capacity associated with certain resources Unplanned outages represent an estimate of the forced outages that may be experienced in this study period
The IESO forecasts the future price responsive load based on Market Participant registered data and consideration of actual market experience The net margin shown in Table AP‐5 of Appendix I does not consider that the IESO has several demand management programs which are implemented as part the IESOs Emergency Operating State Control Actions For example the IESO can institute a 3 percent or a 5 percent voltage reduction which has the effect of reducing the demand by 15 percent and 26 percent for a short period of time
The risks associated with this analysis are that demands may be heavier than expected due to extreme weather generators on outage may not return to service as scheduled or generators forced from service may be higher than projected The projected margins and control actions available to the IESO are continuously assessed Should the IESO determine that the Ontario Area is deficient the appropriate course of action will be taken Actions can include the adjustment of outage programs securing assistance via market mechanisms or the acquisition of emergency energy from other Areas as a final step
Queacutebec
Installed Capacity
Page 21
For the 2012‐13 Winter Operating Period Installed Capacity in the Queacutebec Balancing Authority Area will total 43605 MW Installed capacity for the 2011‐2012 period (February 2012) was 43394 MW Seven new wind projects totaling 760 MW will be on‐line for the winter period (see Wind Power section below) Two units at the new La Sarcelle hydro GS (100 MW) will be commissioned for the winter period A certain amount of biomass stations and small hydro is also coming online for this period The 43605 MW Installed Capacity includes Gentilly‐2s 675‐MW capacity which will be decommissioned beginning December 28 2012 Subsequent assessments will show this retirement For this assessment the retirement is accounted for through derates since the station was originally scheduled out of service for refurbishment The Net Margins are not affected
The Tracy fossil fuel GS (450 MW) which was mothballed in the last winter assessment has been permanently retired since March 2012 Moreover the La Citiegravere jet turbine GS (280 MW) has also been retired Minor capacity adjustments due to generator characteristic changes water level and temperature adjustments have been made as usual
Purchases Sales and Interruptible Load
The Queacutebec area will need to purchase about 600 MW on short term markets to ensure resource adequacy for the 2012‐2013 Winter Operating Period All capacity purchases needed to ensure resource adequacy will be backed by firm contracts for both generation and transmission
Firm sales of 253 MW to ISO‐NE are expected for the entire period
Table AP‐6 Appendix I presents 1830 MW of interruptible load and Direct Control Load management for the Queacutebec Area This is discussed further in the Demand Response Programs section below
Known MaintenanceDerates
In the Queacutebec Area in winter the Known MaintenanceDerates column of the Load and Capacity table mainly reflects hydraulic restrictions on Hydro‐Queacutebec Productionrsquos (HQP) various generating stations with a few other particular constraints on other generating stations In early December numbers show the effect of some late generator maintenance still ongoing at this time Numbers in January February and March reflect hydraulic restrictions and outages
In this assessment the 547 MW natural gas unit operated by TransCanada Energy at Beacutecancour is mothballed for 2013 Moreover as mentioned above the Gentilly‐2 Nuclear GS (675 MW) will be retired beginning December 28 2012
Page 22
When hydraulic and mechanical restrictions wind derates and the above‐mentioned outages are accounted for this brings inoperable resources for the forecasted peak week (week beginning January 13) to 4334 MW They are included in the Known MaintenanceDerates column from Table AP‐6 Appendix I
Numbers vary from 7274 MW in early December to 4213 MW in late January and 6810 MW in March Restrictions and outages are generally higher than what was posted for the last Winter Operating Period
Required Operating Reserve
Historically the required operating reserve for the Queacutebec Balancing Authority Area has been set at 1500 MW This is based on the largest single contingency on the system the loss of a Churchill Falls 230735 kV transformer typically carrying 1000 MW For this Winter Operating Period this is again the basis for the reserve calculation
The required operating reserve shown in Table AP‐6 Appendix I for the 2012‐13 Winter Operating Period is therefore set at 1500 MW
Net Margin
As mentioned in the Summary of Area Forecasts section above the winter peak is expected to materialize during the week of January 13 2013 Forecast internal peak demand is 37543 MW 154 MW is added to this amount for the Cornwall load Total peak load in Table AP‐6 of Appendix I is therefore set at 37697 MW Firm sales to neighboring systems excluding Cornwall amount to 269 MW Capacity purchases from neighboring areas amount to 581 MW When required operating reserve interruptible load and allowances for unplanned outages and load uncertainty are taken into account the Net Margin at peak load is 716 MW (19 percent based on the load forecast) In order to maintain appropriate reserve margins the Queacutebec Area has access to additional capacity or energy purchases from New York and Ontario markets through existing interconnections
The Net Margin varies from 4192 MW during December to 716 MW at peak load and back to 5615 MW during late March as can be observed in Table AP‐6 Appendix I
Recent and Anticipated Generation Resource Additions
The following Table lists the recent and anticipated generation resource additions and retirements
TABLE 2
Recent and Anticipated Generation Resource Additions and Retirements
Page 23
2011‐12 Winter through 2012‐13 Winter
Area Generation Facility Nameplate Capacity (MW)
Fuel Type In Service
Date
Maritimes Dalhousie (New Brunswick)
(Retirement) ‐299 Oil May 2012
Amherst (Nova Scotia) 30 Wind April 2012
New England
Salem Harbor Units 1 and 2 (Retirement)
‐158 Coal December 2011
Spruce Mountain Wind 20 Wind Dec 2011
Record Hill Wind 50 Wind Jan 2012
Granite Reliable Power LLC 99 Wind Feb 2012
New Haven Harbor Unit 2 ‐ 4 145 Nat
GasOil May 2012
New York Bayonne Energy Center 500 Nat
GasOil June 2012
Nine Mile Point 2 (Uprate) 168 Uranium June 2012
Marble River Wind Farm I amp II 215 Wind October 2012
Binghamton Cogen ‐48 Nat
GasOil February 2012
Beebee CT 13 ‐18 Oil March 2012
Astoria 2 ‐180 Nat Gas April 2012
Astoria 4 ‐380 OilNat Gas
April 2012
Astoria GT10 ‐32 Oil May 2012
Astoria GT11 ‐32 Oil July 2012
Glenwood ST 04 amp 05 ‐228 Nat Gas July 2012
Far Rockaway ST 04 ‐100 Nat
GasOil July 2012
Dunkirk 3 amp 4 ‐435 Bituminous
Coal September
2012
Kensico Hydro ‐3 Water October 2012
Ontario Bruce Unit 1 750 Uranium Q3 2012
Comber Wind Limited Partnership 166 Wind Q3 2012
Page 24
Pointe Aux Roches Wind 49 Wind Q3 2012
Bruce Unit 2 750 Uranium Q4 2012
Atikokan (fuel replacement) ‐211 Coal Q1 2012
Thunder Bay Condensing Turbine 40 Biomass Q1 2012
Queacutebec La Sarcelle (2 units) 100 Hydro Spring 2012
Tracy Retirement ‐450 Oil Summer 2012
La Citiegravere Retirement ‐280 Oil
Seven Wind Projects 760 Wind Fall 2012
Gentilly‐2 retirement and decommissioning
‐675 Nuclear Dec 2012
Maritimes
There is no new capacity scheduled to be put in service or any existing capacity scheduled to be retired during this winter assessment period
New England
Five wind projects and a biomass plant with nameplates totaling 253 MW are expected to go commercial in New England during the Winter Operating Period A delay in the commercial operation of these projects will not have an adverse impact on New Englandrsquos reliability
New York
New generating projects with nameplates totaling 500 MW have come into service since the 2011‐12 Winter Operating Period A new wind project Marble River Wind Farm with a nameplate of 2152 MW came into service in October 2012
Ontario
From the Winter 2011‐12 assessment to the Winter 2012‐13 assessment inclusive Ontario will have added 215 MW of wind 1500 MW of nuclear and removed 211 MW of coal generation
Queacutebec
No delays are expected for wind plant and hydro commissioning
Fuel Infrastructure by Reliability Coordinator area
The following is a self‐assessment by each Reliability Coordinator area of the expected fuel supply infrastructure
Maritimes
Page 25
The Maritimes Area does not consider potential fuel‐supply interruptions in the regional assessment The fuel supply in the Maritimes Area is very diverse and includes nuclear natural gas diesel coal oilpet coke oil (both light and residual) hydro tidal municipal waste wind and wood Fuel supplies are expected to be adequate during the projected winter period Extreme weather conditions should have no impact on the fuel supply to the Maritimes Area Responsibility for fuel switching plans lies with the generation owner All applicable units have the required procedures The only generator units with fuel‐switching capability are at Tuftrsquos Cove Nova Scotia (natural gas or oil) and Coleson Cove unit 3 New Brunswick (oil or oilpetcoke) and totaling 645 MW Each facility maintains an adequate supply of its primary fuel
New England
The majority of power generators within New England are fueled by natural gas followed by oil nuclear coal hydro and renewable resources In 2011 gas‐fired generation produced over 51 percent of the regionrsquos electric energy production New Englandrsquos heavy reliance on natural gas to produce electricity has produced some winter reliability concerns in the past primarily due to the direct competition with the core natural gas markets for both gas supply and regional transportation during extreme winter weather conditions In addition to discussing the winter outlook with regional stakeholders During extremely cold winter days there may be fuel supply restrictions on natural gas‐fired generating units due to regional gas pipelines invoking delivery prioritization amongst their entitlement holders Such conditions routinely occur resulting in temporary reductions in gas‐fired capacity These temporary reductions to operable capacity are reflected within ISO‐NErsquos forced outage assumptions Concerns have increased for the 2012 ndash 2013 winter capacity period as most of gas turbine generators do not have firm gas supply or transportation contracts On days of extreme winter temperatures single‐fuel natural gas‐fired capacity is at risk of being unavailable due to fuel constraints ISO‐NE monitors these potential situations and mitigates their effects by dispatching non‐gas‐fired resources to replenish these temporary forced outages ISO‐NE gauges the impacts that fuel supply disruptions could have upon system or subregional reliability ISO‐NE continuously monitors the regional natural gas pipeline systems via their Electronic Bulletin Board (EBB) postings This ensures that emerging gas supply or delivery issues can be incorporated into and mitigated within the daily or day‐ahead operating plans Should natural gas issues arise ISO‐NE has predefined communication protocols in place with the Gas Control Centers of both regional pipelines and local gas distribution companies (LDCs) in order to quickly understand the emerging situation and subsequently implement mitigation measures ISO‐NE has two procedures that can also be invoked to mitigate regional fuel supply emergencies impacting the power generation sector
Page 26
1) ISO‐NErsquos Operating Procedure No 21 ‐ Action During an Energy Emergency (OP 21) is designed to help mitigate the impacts on bulk power system reliability resulting from the loss of operable capacity due to regional fuel supply deficiencies that can occur anytime during the year7 Fuel supply deficiencies are the temporary or prolonged disruption to regional fuel supply chains for coal natural gas LNG and heavy and light fuel oil
2) ISO‐NErsquos Market Rule No 1 ndash Appendix H ndash Operations during Cold Weather
Conditions is a procedure that is designed to help mitigate the impacts on bulk power system reliability resulting from the loss of operable capacity due to the combined effects from extreme cold winter weather or constraints with regional natural gas supplies or deliveries8
The ongoing reliability concern for this winter involves the reliability implications to the electric power system resulting from very extreme winter weather or a ldquoforce majeurerdquo type event on the regional natural gas system As noted by the events that occurred in the southwest during February 2011 extreme winter weather has the capability to impact the availability of generation by inducing cold weather‐related outages Although the majority of New Englandrsquos generation fleet took various remedial actions to prepare their stations after the Cold Snap of January 2004 portions of the fleet may still be susceptible to outages induced by extreme winter weather In addition an extreme contingency located upstream or on the regional natural gas grid although temporary in nature could create considerable regional gas supply shortages which would primarily affect the regional gas‐fired generation fleet Either type of event could quickly diminish the capacity margins projected for the winter which would require ISO‐NE to implement Emergency Operating Procedures (EOPs) to mitigate the impacts from these events Since the initial coordinated data gathering reflected in this report and as a result of additional information since Hurricane Sandy New England projects that an additional 1200 MW of capacity will most likely be unavailable for this winter period In addition New England also expects that reduced LNG supplies into the Northeast may also cause further reductions on New England generators during extreme cold weather conditions
New York
Traditionally New York generation mix has been dependent on fossil fuels for the largest portion of the installed capacity Recent capacity additions or enhancements
7 Operating Procedure No 21 is located on the ISOrsquos web site at httpwwwiso-necomrules_procedsoperatingisoneop21indexhtml 8 Appendix H of Market Rule No 1 is located at httpwwwiso-necomregulatorytariffsect_3mr1_append-hpdf
Page 27
now available use natural gas as the primary fuel While some existing generators in southeastern New York have ldquodual‐fuelrdquo capability use of residual or distillate oil as an alternate may be limited by environmental regulations Adequate supplies of all fuel types are expected to be available for the winter period
Ontario
The majority of generation facilities operating on the IESO‐controlled grid are represented by three basic types of fuel ‐ Fossil Nuclear and Hydroelectric At the time of this assessment OilGas generation exceeded coal‐fired fossil generation by more than double This trend is expected to continue as the retirement of four coal‐fired units on October 1 2010 began the move towards eliminating coal‐fired generation in Ontario by 2014 The portion of oil fired fossil generation remains relatively unchanged Generation from biomass technologies is a very small percentage of Ontariorsquos generation mix Lennox generating station with a capacity of 2000 MW is the only significant dual‐fuel facility which can be fueled by oil or gas
During the winter months shipping capability is limited by ice and weather conditions on the Great Lakes This is important because fuel for a portion of the coal‐fired resources is delivered by boat via the Great Lakes While these conditions may prevent delivery for extended periods of time all sites relying on this delivery mechanism stockpile the fuel
As in other Areas natural gas supplies for electricity generation in Ontario also compete with space heating requirements Natural gas supplies and delivery infrastructures are expected to be adequate for the Winter Operating Period The IESO and the gas distribution companies in Ontario have an established protocol whereby the gas distribution companies inform the IESO of situations that could affect gas supplies into Ontario
At the time of this report the IESO has not been made aware of any fuel supply concerns It is therefore expected that adequate supplies of all fuels will be available for the Winter Operating Period
Queacutebec
About 93 percent of the Queacutebec Balancing Authority Arearsquos generating capacity is made up of hydro stations located on geographically dispersed river systems
Hydro generating plants are classified into three categories run‐of‐river plants annual reservoir and multi‐annual reservoir plants Low water inflows are coped with in different ways for each category
Run‐of‐river hydro plants relatively constant hydraulic restrictions from year to year
Annual reservoir hydro plants during a year with normal water inflows these reservoirs are almost full at the beginning of winter If annual water inflow is low hydraulic restrictions increase
Page 28
Multi‐annual reservoir hydro plants the target level for multi‐annual reservoirs is approximately 50 percent to 60 percent full in order to compensate or store inflows during periods of below or above normal water inflows Hydraulic restrictions increase during a period of low inflows
After a severe drought having a 2 percent probability of occurrence hydro generation on the system would suffer additional hydraulic restrictions of about 500 MW above the ldquonormal conditionsrdquo restrictions Stream flows storage levels and snow cover are constantly being monitored allowing Hydro‐Queacutebec to plan margins to cope with drought periods
To assess its energy reliability Hydro‐Queacutebec has developed an energy criterion stating that sufficient resources should be available to run through sequences of two or four years of low inflows having a 2 percent probability of occurrence Hydro‐Queacutebec must demonstrate its ability to meet this criterion three times a year to the Queacutebec Energy Board The last assessment can be found on the Queacutebec Energy Board web site9
To smooth out the effects of low inflow cycles different means have been identified
Reduction of the energy stock in reservoirs to a minimum of 10 TWh beginning in May
External non‐firm energy sales reductions
Off‐peak purchases from neighboring areas
Wind Capacity Analysis by Reliability Coordinator area
As seen in the wind generation analyses below there is relatively little wind generation on the system For the 2012‐13 Winter Operating Period installed wind capacity accounts for approximately 37 percent of the total NPCC installed capacity After applying the derate factor the amount of wind generation counted towards capacity is only approximately 06 percent Reliability Coordinator areas have different ways of accounting for this generation The Reliability Coordinator areas are still developing their knowledge regarding operation of wind generation in terms of capacity forecasting and utilization factor
The following table illustrates the nameplate wind capacity in NPCC for the Winter Operating Period and indicates the capacity derate method used Some Reliability Coordinator areas include the entire nameplate capacity in the Installed Capacity
section of the Load and Capacity Tables and use a derate value in the Known MaintenanceDerates section to account for the fact that some of the capacity will not be online at the time of peak Others simply reduce the nameplate capacity by a factor and include this reduced capacity directly in the Installed Capacity section of the Load and Capacity Tables
Page 30
Table 3 NPCC Wind Capacity and Derating Methodology
Reliability Coordinator
area
Nameplate Capacity
2012 (MW)
Capacity After Applied
Derating Factor (MW)
Derating Methodology Used
Maritimes 816 168 Derate factors done by sub‐areas Nova Scotia 100 percent Based on median historical hourly production values from the previous three years for each individual wind facility the following areas use New Brunswick averages winter 71 percent summer 75 percent PEI averages 57 percent winter summer 70 percent and Northern Maine winter and summer 70 percent
New England 581 131 Based on the average of the median net output during the summer or winter reliability hours during the previous year The winter reliability hours are the hours ending 1800 through 1900 each day of the winter period (January through May and October through December) and all winter period hours in which the ISO has declared a shortage event
New York 1578 473 Uses 70 percent derate factor for the winter season
Ontario 1727 124 Uses seasonal contribution factors based on median historical hourly production values from September 2006 to the present 928 percent derate for June‐August 814 percent derate for March‐May and Sept‐November 722 percent derate for Dec‐Feb
Queacutebec 1817 513 Weather data covering the period between 1971 and 2006 were used to re‐simulate coincident hourly load and
Page 31
wind generation in order to estimate the derate factor for winter peak periods which is evaluated at 70 percent
Total 6519 1409
Maritimes
The Maritimes Area currently has approximately 816 MW of nameplate installed wind capacity After applying derates the current wind capacity is 168 MW Since the winter 2011‐12 period there has been 30 MW of new wind generation added There has also been some wind projects that were either postponed or cancelled that were scheduled to come on line this summer This would account for the difference of what was reported for nameplate wind capacity of 846 MW during the summer 2012 assessment period as compared to the 816 MW reported for this winter assessment period
Wind projected capacity is derated to its demonstrated average output for each summer or winter capability period In New Brunswick Prince Edward Island and NMISA each individually wind facility that has been in production for an extended period of time (three years or more) a derated monthly average is calculated using metering data from previous years over each seasonal assessment period Nova Scotia does not include any wind facilities towards their installed capacity (100 percent derated)
The Maritimes Area capacity is the mathematical sum of the sub‐areas (New Brunswick Nova Scotia Prince Edward Island and the area served by the Northern Maine Independent System Operator) Each sub‐arearsquos wind generator totals are shown below with their nameplate and derate values
Table 4 Maritimes Wind Nameplate Capacity
Maritimes Sub‐Areas Nameplate
Capacity 2013 (MW)
New Brunswick (Winter Derate) 294
Prince Edward Island (Winter Derate) 164
Nova Scotia (On‐Peak Capacity Factor) 316
NMISA (Average yearly Derate) 42
TOTALS 816
New England
The total nameplate capability of wind generators in New England is 581 MW of which 802 MW is in the 2012 ndash 2013 Forward Capacity Market (FCM) 2012‐13 commitment
Page 32
period This equates to approximately 14 percent having a capacity supply obligation and is counted toward installed capacity in New Englandrsquos load and capacity calculations (Table 3 Appendix I)
Table 5 New England Wind Nameplate Capacity
Name Nameplate Capacity (MW)
Berkshire Wind Power Project 15
Granite Reliable Power LLC 99
Kibby Wind Power 132
Lempster Wind 24
Record Hill Wind 50
Rollins Wind Plant 60
Sheffield Wind Plant 40
Spruce Mountain Wind 20
Stetson II Wind Farm 26
Stetson Wind Farm 57
Total Wind Projects lt10 MW 58
Total 581
In addition five new wind projects are expected to go commercial by the end of the year Bull Hill Georgia Mountain Community Wind Groton Wind Hoosac Wind and Kingdom Community Wind with a combined nameplate capacity of 185 MW
New York
New York currently has 1578 nameplate MW of wind capacity Wind is applied at 100 of nameplate capability to installed capacity However New York applies a 70 percent
Page 33
derate factor for wind generation in the winter operating period resulting in 4734 MW derated capacity
A new 215 MW nameplate wind project Marble River Wind Farm I amp II came into service in October 2012 It is interconnected at a new substation Patnode on the NYSEG 230 kV system between Willis and Plattsburgh in northern NY
Table 6 New York Wind Nameplate Capacity
Name Nameplate
Capacity (MW)
Altona Wind Power 98
Bliss Wind Power 101
Canandaigua Wind Power 125
Chateaugay Wind Power 107
Clinton Wind Power 101
Ellenburg Wind Power 81
Hardscrabble Wind 74
High Sheldon Wind Farm 112
Howard Wind 51
Madison Wind Power 12
Maple Ridge Wind 1 231
Maple Ridge Wind 2 91
Marble River Wind Farm I 83
Marble River Wind Farm II 132
Munnsville Wind Power 35
Steel Winds 20
Wethersfield Wind Power 126
Total 1578
Ontario
Wind generator output varies significantly hour‐to‐hour or day‐to‐day However over longer periods wind generation shows more consistent production The IESO forecasts wind capacity by using seasonal contribution factors based on median historical hourly production values from September 2006 to the present These factors are updated twice a year and eventually will be calculated using a rolling 10 year data set
Page 34
The seasonal wind contribution factors currently in use by the IESO are 278 percent for winter (December January and February) 72 percent for summer (June July August) and 186 percent for shoulder (remaining months)
The IESO presently has 1727 MW of wind capacity Below are the currently connected wind generators
Table 7 Ontario Wind Nameplate Capacity
Wind Farm Nameplate
Capacity 2012 (MW)
Wind Farm Nameplate
Capacity 2012 (MW)
Amaranth 200 Port Alma 202
Comber 166 Port Burwell 99
Dillon 78 Prince Farm 189
Gosfield 50 Ripley South 76
Greenwhich 99 Spence 99
Kingsbridge 40 Underwood 182
Pointe Aux Roche
49 Wolfe Island 198
Total 1727
Only 32 percent of nameplate rating is used for wind capacity forecasts for the winter period this equates to 553 MW The geographic distribution of Ontario wind resources mitigates some of the risk associated with wind capacity variability
Queacutebec
New wind capacity totaling 760 MW distributed between seven projects will be commissioned for this Winter Operating Period Wind capacity will total 1817 MW
The following table shows wind plants in‐service for the 2012‐13 Winter Operating Period
Table 8 Queacutebec Wind Nameplate Capacity
Page 35
Wind Farm Nameplate Capacity
2012 (MW)
Le Nordais Cap‐Chat 57
Le Nordais Matane 43
Mont‐Copper 54
Mont‐Miller 54
TechnoCentre 4
Baie‐des‐Sables 110
Anse‐agrave‐Valleau 101
Carleton 110
St‐UlricSt‐Leacuteandre 128
Mont‐Louis 101
Montagne‐Segraveche 59
Gros‐Morne Phase 1 101
Le Plateau 139
Total 1057
New for Winter 2012‐2013
Lac Alfred Phase 1 150
New Richmond 68
St‐Robert‐Bellarmin 80
Monteacutereacutegie 101
De lEacuterable 100
Gros‐Morne Phase 2 111
Massif‐du‐Sud 150
Total New 760
Grand Total 1817
For resource adequacy studies pertaining to Winter Operating Periods wind capacity is derated by 70 percent This is based on detailed wind capacity credit evaluations which have been presented to the Reacutegie de leacutenergie du Queacutebec (Queacutebec Energy Board)
In this report 1304 MW is included in the Known MaintenanceDerates column in Table AP‐6 of Appendix I to account for wind derates
Page 36
In addition to the present 1817 MW wind generation capacity another 1500 MW are planned to come into service gradually until 2015
Page 37
5 Transmission Adequacy
Regional Transmission studies specifically indentifying interface transfer capabilities in NPCC are not normally conducted However NPCC uses the results developed in each of the NPCC Reliability Coordinator areas and compiles them for all major interfaces and for significant load areas (Appendix III) Recognizing this the CO‐12 working group reviewed the Normal Transfer Capabilities (NTC) and the Feasible Transfer Capabilities (FTC) between the Balancing Authority Areas of NPCC under peak demand configurations
The following is a transmission adequacy assessment from the perspective of the ability to support energy transfers for the differing levels Inter‐Region Inter‐Area and Intra‐Area
Table 9 NPCC ndash Transmission Additions for 2012‐13 Winter
NPCC Sub‐Area
Transmission Project Voltage (kV) In Service
Maritimes None
New England
345115 kV autotransformer at Deerfield Substation New Hampshire
New York Gowanus Straight to Ring Bus 345 Summer 2012
Astoria Annex‐Astoria East w 345138 kV
Transformer and PAR 345138 Summer 2012
Oakdale 3236 Tower Separation 345 Summer 2012
Various Switched Shunt Capacitor Bank Additions
(626 MVAr) Various Summer 2013
Ontario BP76
Return to service 230 December 2012
Two new Bruce‐Milton circuits 500 Spring 2012
Queacutebec Wind generation integration (seven projects) 315‐230‐120 Fall 2012
Limoilou satellite substation 23025 Fall 2012
Anse‐Pleureuse satellite substation 23025 Fall 2012
Neubois satellite substation 12025 Fall 2012
Beacutecancour subsystem reinforcement 230120 Fall 2012
Page 38
Inter‐Regional Transmission Adequacy
Phase angle regulators (PARs) are installed on the Ontario‐Michigan interconnection at Lambton TS (L4D and L51D) and Keith (J5D) on the Ontario side and at Bunce Creek TS (B3N) in Michigan representing the four interconnections with Michigan Final regulatory approvals have been received permitting operation of these facilities Three PARs were placed in service prior to summer 2012 and are being used to manage circulation power flows around Lake Erie as well as contingencies
The MISO and IESO have indicated that operation of the Phase Angle Regulators will assist in the management of system congestion and control of circulating flows
Inter‐Area Transmission Adequacy
The tables in Appendix III provide a summary of the normal transfer capabilities (NTC) on the interfaces between NPCC Balancing Authority Areas and for some specific load zone areas They also indicate the corresponding feasible transfer capabilities (FTC) under peak conditions based on internal limitations or other factors and indicate the rationale behind reductions from the normal transfer capability
New York ndash Ontario intertie BP76 which has been out of service since January 2008 will remain out‐of‐service until the failed voltage regulator has been replaced at the end of 2012
Page 39
Intra‐Area Transmission Adequacy Assessment
Maritimes
The Maritimes bulk transmission system is projected to be adequate to supply the demand requirements for the Winter Operating Period Part of the TTC calculation with HQ is based on the ability to transfer radial loads onto the HQ system The radial load number will be calculated monthly and HQ will be notified of the changes (See Appendix III)
New England
The 2012 Regional System Plan (RSP12) outlines a number of the ongoing transmission planning studies and projects that are taking place The report continues to describe the various areas of the region where transmission projects are needed for reliability ISO‐NE continually monitors transmission facility additions and coordinates outages in order to mitigate any possible reliability risks that may be associated with changes in the transmission system
New bulk power transmission facilities have been placed in service in New England since the 2011‐12 winter period Some of the more significant improvements include a new 345115 kV transformer in the Deerfield substation located in Southern New Hampshire This is a transmission system improvement which will increase interface limits and reduce the severity of a double circuit contingency
In addition two 345 kV reactors at the Coolidge substation in Southern Vermont have been energized These improvements provide additional voltage support to the area to address various thermal and voltage issues as well as support transfers to and from New York Final improvements were also applied to the Berry Street substation which reinforce and improve import limits into the Rhode Island area
Facilities that are expected to be in service for the upcoming winter include a new 345 kV transmission line from Orrington to a new substation named Albion Road and a new 345 kV transmission line from Surowiec to a new substation named Larrabee Road both of which are part of the Maine Power Reliability Program (MPRP) a new 345 kV transmission line from Ludlow to Agawam which is part of the Greater Springfield Reliability Project (GSRP) and new and existing substations with multiple 115 kV line improvements throughout the region
New York
Several transmission modifications worth noting have occurred since the 2011‐12 winter operating period or will be completed by summer 2013 In summer 2012 the Gowanus 345 kV bus was converted to a full ring bus to accommodate the interconnection of the Bayonne Energy Center Previously it was a straight bus configuration There was also the addition of a 345138 kV transformer PAR and cable between the Astoria Annex 345 kV bus and the Astoria East 138 kV bus
Page 40
A new substation Patnode on the NYSEG 230 kV system between Willis and Plattsburgh in northern NY was added to accommodate the interconnection of the Marble River Wind Farm
Two circuits from Oakdale formed a double circuit tower contingency In summer 2012 the Oakdale‐Fraser 32 and Oakdale‐Clarks Corners 36 lines were separated to eliminate this contingency
The Beck‐Packard BP76 line is expected to return to service in December 2012
By summer 2013 approximately 626 MVAr of switched shunt capacitors will be added to the system funded by DOE smart grid grants
The New Bridge 345138 kV transformer bank 2 will be out‐of‐service for the winter 2012‐13 operating period
Ontario
The system enhancements planned for this winter include the return to service of the Beck‐Packard BP76 line between Ontario and New York expected in December 2012 Phase angle regulators (PARs) are now installed on all four of the Michigan ndash Ontario interconnections
Two new 500 kV circuits from Bruce NGS to Milton SS were placed in service in May 2012 This work at the Bruce switchyards was done to extend a 500 kV bus and complete the addition of terminal breakers for the two new Bruce minus Milton circuits
Queacutebec
No major 735‐kV transmission project is being commissioned for the 2012‐13 Winter Operating Period As shown in Table 9 above wind generation integration at several voltage levels is ongoing a few satellite (distribution) substations are being commissioned and the Beacutecancour 230120‐kV subsystem is being upgraded All these projects are presently on schedule
As usual no transmission line outages are expected and no major maintenance is scheduled during the 2012‐13 Winter Operating Period
Synchronous Condenser CS23 at Duvernay substation in the Montreacuteal area which has been out of service since June 2008 due to a major transformer fault will be back in service for the 2012‐13 Winter Operating Period This will enhance transmission capability on the Southern Interface in the load area of the system
Transmission capability for the peak period is adequate to carry the net internal demand plus the firm capacity sales and operating reserve Moreover enough transmission capability remains on the system to carry additional resources that would be called upon if load was greater than the forecast
Page 41
TransEacutenergie continually performs load flow and stability studies to assess system reliability and transfer capabilities on all its internal interfaces A peak load study is performed annually integrating new generation new transmission and the latest demand forecasts as well as any unusual operating conditions such as generation and transmission outages
Extreme cold weather conditions result in a large load pickup over the normal weather forecast and are included in TransEacutenergiersquos Transmission Design Criteria When designing the system both steady state and stability assessments are made with winter scenarios involving demands 4000 MW higher than the normal weather peak demand forecast This is equivalent to 111 percent of peak winter demand Hydro‐Queacutebec Distribution (the load serving entity) is responsible for the procurement of resources to feed this exceptional demand
Voltage support in the southern part of the system (load area) is a concern during Winter Operating Periods especially during episodes of heavy load TransEacutenergie has an agreement with Hydro‐Queacutebec Production (the largest Generator Owner on the system) that maintenance on generating units will be terminated by December 1 and that all possible generation will be available This along with yearly testing of reactive capability of the generators ensures maximum availability of both active and reactive power The end of maintenance on the high voltage transmission system is also targeted for December 1 Also TransEacutenergie has a target for the availability of both high voltage and low voltage capacitor banks No more than 400 Mvar of high voltage banks should be unavailable during the Winter Operating Period The target for the low voltage banks is 90 percent availability This ensures adequate voltage support in the load area of the system
Page 42
6 Operational Readiness for 2012‐13
Demand Response Programs
Each Reliability Coordinator area utilizes various methods of demand management The following is a summary of each arearsquos current demand response programs available for the Winter Operating Period
Maritimes
Interruptible and dispatchable loads are forecast on a weekly basis and range between 144 MW and 198 MW They values can be found in Appendix I Table AP‐2 and are available for use when corrective action is required within the Area
New England
During times of capacity deficiencies ISO New England declares ISO New England Operating Procedure No 4 (OP 4) ndash Actions during a Capacity Deficiency That includes public appeals for conservation purchasing emergency energy from the neighboring Balancing Authority Areas activating demand response resources and implementing voltage reductions
In the Load and Capacity Table for New England (Table AP‐3 Appendix I) 957 MW out of a total of 1920 MW of demand response resources are assumed available during OP 4 conditions for the 2012‐13 Winter Operating Period In addition to the active demand response resources there is a total of 963 MW of energy efficiency with FCM obligations
New York
Participation in the Emergency Demand Response Program (EDRP) and Special Case Resources (SCR) programs represents an additional 800 MW available through the market for reliability The NYISO Emergency Demand Response Program (EDRP) and Special Case Resources (SCR) program may be deployed without time or call frequency limitations in any Operating Period in which the resources are enrolled EDRP participants voluntarily curtail load when requested by the NYISO when an operating reserves deficiency or major emergency exists SCR participants are required to respond when deployed by the NYISO for reliability
The New York Independent System Operator Inc (NYISO) offers two demand response programs that support reliability the Emergency Demand Response Program10 (EDRP) and the Installed Capacity‐Special Case Resource Program (ICAPSCR)
EDRP provides demand resources with the opportunity to earn the greater of $500MWh or the prevailing locational‐based marginal price (LBMP) for energy consumption curtailments provided when the NYISO calls on the resource There are no
10 Terms in upper case not defined herein have the meaning ascribed to them in the NYISOrsquos Market Administration and Control Area Services Tariff
Page 43
consequences for enrolled EDRP resources that fail to curtail Resources participate in EDRP through Curtailment Service Providers (CSPs) which serve as the interface between the NYISO and resources
The ICAPSCR program allows demand resources that meet certification requirements to offer Unforced Capacity (UCAP) to Load Serving Entities (LSEs) Special Case Resources can participate in the Installed Capacity (ICAP) Market just like any other ICAP Resource however Special Case Resources participate through Responsible Interface Parties which serve as the interface between the NYISO and resources Resources are obligated to curtail when called upon to do so with two or more hours notice provided the NYISO notify the Responsible Interface Party a day ahead of the possibility of such a call In addition ICAPSCR resources are subject to testing each Capability Period to verify that they can fulfill their curtailment requirement Failure to curtail could result in penalties administered under the ICAP program Curtailments are called by the NYISO when reserve shortages are anticipated Resources may register for either EDRP or ICAPSCR but not both Special Case Resources are eligible for an energy payment during an event using the same performance calculation as EDRP resources
The Targeted Demand Response Program (TDRP) introduced in July 2007 is a NYISO reliability program that deploys existing EDRP and SCR resources on a voluntary basis at the request of a Transmission Owner in targeted subzones to solve local reliability problems The TDRP program is currently available in Zone J New York City
The Day Ahead Demand Response Program (DADRP) program provides demand resources with an opportunity to offer their load curtailment capability into the Day‐Ahead Market (ldquoDAMrdquo) as an energy resource Resources submit offers by 500 am specifying the hours and amount of load curtailment they are offering for the next day and the price at which they are willing to curtail Prior to November 1 2004 the minimum offer price was $50MWh The offer floor price currently is $75MWh Offers are structured like those of generation resources DADRP program resources may specify minimum and maximum run times and the hours that they are available They are eligible for Bid Production Cost guarantee payments to make up for any difference between the market price received and their block offer price across the day Load scheduled in the DAM is obligated to curtail the next day Failure to curtail results in the imposition of a penalty for each such hour equal to the product of the MW curtailment shortfall and the greater of the corresponding DAM or Real‐Time Market price of energy
The Demand Side Ancillary Services Program (DSASP) introduced in June 2008 provides demand resources that meet telemetry and other qualification requirements an opportunity to offer their load curtailment capability into the DAM andor Real‐Time Market to provide Operating Reserves and Regulation Service DSASP resources must qualify to provide Operating Reserves or Regulation Service through standard resource testing requirements Offers are submitted through the same process as generation resources Resources submit offers by 500 am specifying the ancillary service they are offering (Spinning or Non‐Synchronous Reserves andor Regulation if qualified) along
Page 44
with the hours and amount of load curtailment for the next day and the price at which they are willing to curtail Real‐time offers may be made up to 75 minutes before the hour of the offer Although DSASP resources are not scheduled for energy in the DAM they are required to submit energy offers which are used in the co‐optimization algorithm for dispatching operating reserve resources Similar to the DADRP the energy offer floor price is currently $75MWh DSASP resources are not paid for energy They are eligible for a Day‐Ahead Margin Assurance Payment to make up for any balancing difference between their Day‐Ahead Reserve or Regulation schedule and Real‐Time dispatch subject to their performance for the scheduled service Performance indices are calculated on an interval basis for both Reserves and Regulation Payment is adjusted by the performance index for the service provided
Ontario
A sizeable number of loads within the province bid their load into the market and are responsive to price and to dispatch instructions Other loads have been contracted by the Ontario Power Authority to provide demand response under tight supply conditions The forecast amount of these demand measures has been steadily increasing and now amounts to approximately 1200 MW in total of which 773 MW is categorized as interruptible
Queacutebec
There are two interruptible load programs and a voltage reduction program implemented in the Queacutebec Control Area
For winter 2012‐13 the load subscribing to the Interruptible programs totals about 2100 MW These programs have operating constraints which are accounted for through a diversity factor for resource assessment purposes The total interruptible load posted is therefore 1580 MW Follow‐up of the interruptible load programs is done by compiling differences between the customersrsquo real consumption and the customers anticipated hourly load profile at the time the program is scheduled to be in effect These programs have been in operation for a number of years and according to the records customer response is highly reliable
Hydro‐Queacutebec Distribution and TransEacutenergie have developed a voltage reduction program at a large number of distribution substations This is included in the ldquoDemand Responserdquo column in Table AP‐6 Appendix I Table AP‐6 therefore presents 1830 MW of load which consists of interruptible load (1580 MW) plus the voltage reduction program (250 MW)
On an operations horizon if peak demands are higher than expected a number of measures are available to the System Control personnel Operating Instruction I‐001 lists such measures These vary from limitations on non guaranteed wheel through and export transactions operation of hydro generating units at their near‐maximum output (away from optimal efficiency but still allowing for reserves) use of import contracts
Page 45
with neighbouring systems starting up of thermal peaking units use of interruptible load programs and eventually reducing 30‐minute reserve and stability reserve applying voltage reduction making public appeals and ultimately using cyclic load shedding to re‐establish reserves
Page 46
7 Post‐Seasonal Assessment and Historical Review
Winter 2011‐12 Post‐Seasonal Assessment
NPCC
The sections below describe briefly each Balancing Authority Arearsquos 2011‐12 winter operational experience Total NPCC non‐coincident demand was 108249 MW for the period
Maritimes
The forecasted peak for winter 2011‐12 was 5552 MW
The actual peak demand of 4963 MW occurred February 13 2012
Control actions were not required
New England
The forecasted peak for winter 2011‐12 was 21495 MW
The actual peak demand of 19926 MW occurred January 4th 2012
Implementation of Operating Procedure 4 (OP 4) was not required during the winter operating period
New York
The forecasted peak for winter 2011‐12 was 24533 MW
The actual peak demand of 23901 MW occurred on January 3rd 2012
No particular issues to report
Ontario
The forecasted peak for winter 2011‐12 was 22311 MW
The actual peak demand of 21649 MW occurred on January 3rd 2012 There were no issues with meeting this level of demand
Queacutebec
The internal demand forecast was 37153 MW for the 2011‐12 Winter Operating Period
Page 47
Actual peak demand occurred on January 16 2012 at 8h00 EST Internal demand was 35481 MW At that time exports of 3856 MW were sustained by the Queacutebec Balancing Authority and imports amounted to 1827 MW Moreover 1388 MW of interruptible industrial load was called for the peak hour
Global system needs accounting for interruptible load and exports were then evaluated at 37508 MW
Temperature in Montreacuteal at peak was ‐18 degC (‐04 degF) and wind velocity was 9 kmh (56 mph) Winter 2011‐12 was remarkably warmer than average Mean temperatures were 34 degC (61 degF) warmer than normal temperatures for that period
Generation and Reserves
At the time of peak maximum generation capacity was about 43140 MW
Generation outages totaled 1978 MW The TransCanada Energy GS (547 MW in winter) was under a temporary shutdown agreement and is included in the outages Tracy oil‐fueled GS had three units (450 MW) mothballed (now retired) Hydraulic wind and mechanical restrictions totaled 1818 MW Thus total available capacity was about 39344 MW
Thirty‐minute operating reserve at peak time was 3000 MW 1500 MW over the requirement
State of the System
735 kV Lines
On peak day all 735 kV transmission was available
Other Equipment
Synchronous Condenser CS23 at Duvernay substation was unavailable for the Winter Operating Period
During spring 2011 a 735‐kV current transformer (CT) at Chissibi 735‐kV substation exploded due to gas accumulation This event triggered an extensive oil verification program for this type of CT Out of 281 sampled CTs it was found that 70 had to be changed Thus a replacement program was planned and initiated In January 2012 about 50 CTs had been changed and the rest was scheduled for 2012
The reactive power output of generating stations in the southern part of the system at peak load and capacitor bank availability were adequate considering load and system conditions during the Winter Operating Period
Wind generation
Approximately 425 MW of wind generation was present on the system during the peak hour on January 16 out of a total of 919 MW
Interconnections
Page 48
On January 16 2012 (peak day) all interconnection equipment was available and operating During the Winter Operating Period seven events occurred which made interconnections unavailable The most significant events were the following
bull Sandy Pond Pole 1 trip on February 9 2012 with loss of 780 MW export
bull Madawaska GC1 trip on February 1 2012 with TTC reduction to New Brunswick
bull Leacutevis Transformer T13 (735315 kV) trip on February 16 with TTC reduction to New Brunswick
Page 49
Historical Winter Demand Review (Pre‐2012)
The table below summarizes historical non‐coincident winter peaks for each NPCC Balancing Authority Area since 2000‐01
Table 10 Historical Peak Demands by Reliability Coordinator Area Occurring December to March And Total Non‐Coincident NPCC Demand (MW)
Year Ontario Maritimes New
England New York
Queacutebec Total NPCC Non‐
Coincident Demand
2000‐01 23126 4822 20088 23764 30277 102077
2001‐02 22623 4783 19872 22798 30080 100156
2002‐03 24158 5376 21535 24454 34989 110512
2003‐04 24937 5716 22818 25262 36268 115001
2004‐05 24979 5419 22631 25541 34956 113526
2005‐06 23766 4987 21733 25060 33636 109182
2006‐07 23935 5593 21640 25057 36251 112376
2007‐08 23054 5385 21782 25021 35352 110594
2008‐09 22983 5504 21026 24673 37230 111416
2009‐10 22045 5205 20791 24074 34659 106774
2010‐11 22733 5252 21060 24654 37717 111416
2011‐12 21649 4963 22255 23901 35481 108249
2012‐13 Forecast
22087 5246 22355 24832 37543 112063
Page 50
8 2012‐13 Reliability Assessments of Adjacent Regions
ReliabilityFirst Corporation
Executive Summary (highlights)
This assessment provides information on the projected resource adequacy for the upcoming winter season across the ReliabilityFirst Corporation (RFC) region The RFC Resource Adequacy Assessment Standard BAL‐502‐RFC‐02 is a Federal Energy Regulatory Commission (FERC) approved regional standard which requires Planning Coordinators to identify the minimum planning reserves to satisfy a resource adequacy criterion that is used to assess their respective areas of RFC PJM Interconnection (PJM) and Midwest Independent Transmission System Operator (MISO) are the Planning Coordinators for their market areas The reserve requirements in this assessment are based upon the explicit probability analyses conducted by these two Planning Coordinators in RFC
All RFC members are affiliated with either the MISO or the PJM Regional Transmission Organization (RTO) for market operations and reliability coordination Ohio Valley Electric Corporation (OVEC) a generation and transmission company located in Indiana Kentucky and Ohio is not a member of either RTO Also RFC does not officially designate subregions MISO and PJM each operate as a single Balancing Authority area Since all RFC demand is in either MISO or PJM except for the small load (less than 100 MW) within the OVEC Balancing Authority area the reliability of the PJM RTO and MISO are assessed and the results used to indicate the reliability of the ReliabilityFirst Region
In this report Demand Response (DR) is defined as the demand that can be interrupted for system emergencies It may consist of Interruptible Load (IL) Direct Control Load Management (DCLM) or load used as a capacity resource The approved RFC Resource Adequacy Assessment Standard requires the reserve margins be calculated with DR used as a load reduction The reserve margin used in this assessment is therefore based on Net Internal Demand (NID)
The report for the RFC region includes the resources and demand only in the RFC area operated by PJM MISO and OVEC The remaining area of PJM operates within the SERC Reliability Corporation (SERC) region and the remaining area of MISO operates in the Midwest Reliability Organization (MRO) or SERC regions
In this assessment forecast demand capacity and interchange values for RFC PJM MISO and OVEC are rounded to the nearest 100 MW Also note that it is possible that reports or other data released by PJM or MISO for this assessment period may differ from the data reported in this assessment owing to when various data were reported ReliabilityFirst does not expect any differences to alter the conclusions of this assessment
Page 51
Executive Summary
Demand Capacity and Reserve Margins
The projected reserve margin for the ReliabilityFirst region is 61900 MW which is 428 percent based on NID and Net Capacity Resources without DR Both MISO and PJM are expected to have sufficient resources to satisfy their planning reserve requirements Therefore the resulting reserve margin for this winter in the ReliabilityFirst region is adequate This compares to a 589 percent reserve margin in last winterrsquos assessment
The forecast winter 20122013 coincident peak demand for the ReliabilityFirst region is 144700 MW NID This is 10200 MW higher than the NID peak of 134500 MW forecast for the winter of 20112012 The main reason for the increase in NID is the reduction in the amount of contractual DR available this winter in PJM Weather and economic conditions have a significant influence on electrical peak demands Any deviation from the original forecast assumptions could cause the actual peak to be significantly different from the forecast
The amount of OVEC PJM and MISO net capacity and interchange in ReliabilityFirst is 206300 MW This is 7400 MW less resources than the 213700 MW that was reported within the 20112012 winter assessment Much of the reduced resources are due to generation retirements many occurring after the summer season Capacity changes that have occurred after the start of the planning year (June) have been included within the calculation of the winter reserve margins for both PJM and MISO Capacity resources committed to the markets at the beginning of the winter period are assumed constant throughout the winter
PJM net capacity and interchange for the 2012 planning year are 182500 MW The projected reserves for PJM during the 20122013 winter peak are 52300 MW which is 402 percent of the Net Internal Demand of 130200 MW The PJM Reserve Margin (NID) has decreased by 127 percentage points over last years forecast reserve margin due to recent generation retirements and the reduction in DSM available during this winter The PJM reserve requirement for the 2012 planning year is 156 percent PJM has adequate reserves to serve the 20122013 winter peak demand
The MISO net capacity and interchange for the 2012 planning year are 109500 MW The current projected reserves for MISO for the 2012 winter peak are 37300 MW which is 517 percent of the Net Internal Demand of 72200 MW The MISO Reserve Margin (NID) has increased by 63 percentage points over last years forecast reserve margin due to a slight increase in Demand Response resources and the net impact of the DEOK transfer of generation and resources into PJM The MISO reserve requirement is 167 percent for the 2012 planning year The MISO winter reserve margin is adequate
Page 52
PJM RTO
Demand
The demand forecast represents the median forecast (5050)11 of a Monte Carlo simulation employing actual weather observations from over thirty years of history Economic assumptions are based on projected growth in Gross Metropolitan Product for 36 metropolitan areas across PJM produced by Moodys Analytics as of December 2011 The PJM winter peak for 20112012 was 118664 MW on January 3 2012 at hour ending 1900 The Total Internal Demand (TID) projection for the 20112012 PJM winter peak was 130711 MW while the Total Internal Demand projection for the 20122013 PJM winter peak is 130200 MW The decrease reflects the impacts of a weak economy PJM forecasts both the non‐coincident and coincident loads of all members PJMrsquos resource evaluations are conducted on the coincident peak loads PJM is a summer peaking region with the typical winter peak about 84 percent of the summer peak
PJM has no contractually interruptible demand side management secured for use by the PJM operators during the winter season Energy Efficiency programs included in the 2012 PJM Load Forecast Report are impacts approved for use in the PJM Reliability Pricing Model At time of the 2012 load forecast publication 600 MW of Energy Efficiency programs have been approved as Reliability Pricing Model resources in 2012 Measurement and verification of energy efficiency programs are governed by rules specified in PJM Manual 18B12 To demonstrate the value of an energy efficiency resource resource providers must comply with the measurement and verification standards defined in this manual by establishing plans providing post‐installation reports and undergoing a Measurement and Verification audit
Quantitative analysis was done to assess the weather uncertainty of the projected demand Using a Monte Carlo simulation employing actual weather observations from over thirty years of history it is estimated that the 90101 load for Winter 20122013 is 138200 MW which is 7900 MW (or 6 percent) above the expected Total Internal Demand No changes were made to the load forecast method used for the 2012 PJM Load Forecast Report Extreme weather conditions are explicitly addressed as part of emergency import analysis for PJMs Locational Deliverability Areas
Generation
The total PJM resources expected to be in service for the 20122013 winter peak period are approximately 182300 MW including 600 MW of Energy Efficiency resources in RPM This is less than the expected capacity from the 2012 summer assessment due to retirement of nearly 4000 MW of generation after the summer
Variable generation amounts to 5600 MW nameplate and 800 MW expected on peak
11 For an explanation of 5050 and 9010 demand forecasts please see Appendix B 12 httpwwwpjmcom~mediadocumentsmanualsm18bashx
Page 53
Variable resources are only counted partially for PJM resource adequacy studies Both wind and solar initially utilize class average capacity factors which are 13 percent for wind and 38 percent for solar Performance over the peak period is tracked and the class average capacity factor is supplanted with historic information After three years of operation only historic performance over the peak period is used to determine the individual units capacity factor PJM has 900 MW of Biomass Biomass is counted fully in capacity calculations
Anticipated hydro conditions for the winter are normal Hydro conditions are expected to be sufficient to meet both peak demand and the daily energy demand throughout the winter peak period PJM is not experiencing or expecting conditions that would reduce capacity
Imports and Exports on Peak
PJM has firm capacity imports of 1400 MW No non‐firm imports are considered in this reliability analysis There are no Expected or Provisional transactions counted towards meeting the reserve margin requirements All included transactions are firm for both generation and transmission No imports are based on partial path reservations There are no transactions with Liquidated Damages clauses or ldquomake‐wholerdquo contracts included in the reserve margins
PJM has firm capacity exports of 1200 MW No non‐firm exports are considered in this reliability analysis There are no Expected or Provisional transactions in place All included transactions are firm for both generation and transmission No imports are based on partial path reservations There are no transactions with Liquidated Damages clauses or ldquomake‐wholerdquo contracts included in the reserve margins
External emergency assistance does not contribute to satisfying the reserve margin requirement PJM only relies on existing certain generation and firm capacity purchases for meeting its reserve margin requirement
Reliability Assessment Analysis
PJM evaluates its resources (generation interchange) and demand (including demand‐side management) to determine if the Reserve Margin requirements are met Contingency analysis performed as part of the PJM Operations Assessment Task Force internal studies and the interregional studies with our neighbors ensures operations within secure transfer limits PJM has adopted a Loss of Load Expectation (LOLE) standard of one occurrence in ten years PJM performs an annual LOLE study to determine the reserve margin required to satisfy this criterion The study recognizes among other factors load forecast uncertainty due to economics and weather generator availability deliverability of resources to load and the benefit of interconnection with neighboring systems The methods and modeling assumptions used in this study are available in PJM Manual 2013
13 httpwwwpjmcom~mediadocumentsmanualsm20ashx
Page 54
This assessment uses the resource adequacy study that was completed in October 20114 This study examined the period 2011 to 2022 The required reserve margins to satisfy an LOLE of one occurrence in ten years are summarized in Table I‐2 on page 5 The PJM projected reserve margin for winter 20122013 based on NID with DSM as a load reduction and energy efficiency as a resource is 401 percent This reserve margin is well in excess of the 2012 planning year reserve margin of 156 percent14 The PJM Reserve Margin (NID) has decreased by 127 percentage points over last years forecast reserve margin due to recent generation retirements and the reduction in DSM available during this winter
PJM has established rulesprocedures to ensure fuel is conserved to maintain an adequate level of on‐site fuel supplies under forecasted peak load conditions PJM coordinates with neighboring entities and gas pipelines to quickly address fuel issues
Generation scheduled to be out of service for scheduled maintenance over the winter peak period is expected to be at normal levels
The demands as reported by the Load Serving Entities are weather normalized (5050)15 forecasts Historically reported load forecasts have been highly accurate as each member has expert knowledge of their individual loads with respect to weather and economic assumptions During last yearrsquos winter season MISO experienced an instantaneous peak of 74011 MW on December 6 2011 hour ending 1900 EST The instantaneous load is the highest value metered during the peak hour
Last yearrsquos unrestricted non‐coincident demand forecast of 83700 MW is 60 percent higher than this yearrsquos unrestricted non‐coincident demand forecast of 78700 MW for December 2012 This difference is due to the transfer of Duke Energy OhioKentucky to PJM on January 1 2012
An unrestricted non‐coincident peak demand is created on a regional basis by summing the coincident monthly forecasts for the individual Load Serving Entities (LSE) in the larger regional area of interest Using historic market data a load diversity factor was calculated by observing the individual peaks of each Local Balancing Authority and comparing them against the system peak This produced an estimated diversity of 3600 MW therefore MISO forecasts a total internal demand of 75100 MW
MISO bases its resource evaluation on the actual market peak MISO currently separates Demand Resources into two separate categories Interruptible Load and DCLM Interruptible load of 2600 MW (35 percent of Total Internal Demand) for this assessment is the magnitude of customer demand (usually industrial) that in accordance with contractual arrangements can be interrupted at the time of peak by direct control of the system operator (remote tripping) or by action of the customer at the direct request of the system operator DCLM of 300 MW (04 percent of Total Internal Demand) for this assessment is the magnitude of customer service (usually residential) that can be interrupted at the time of peak by direct control of the applicable system operator DCLM is typically used for ldquopeak shavingrdquo This results in a net internal demand of 72200 MW The Resource Adequacy processes as set forth in Module E of MISOrsquos tariff acts as the measurement and verification tool for demand response
MISO does not currently track Energy Efficiency programs however they may be reflected in individual LSE load forecasts To account for uncertainties in load forecasts MISO applies a probability distribution Load Forecast Uncertainty to consider a larger range of forecasted demand levels Load Forecast Uncertainty is derived from variance analyses to determine how likely forecasts will deviate from actual load There have not been any changes made due to the economic recession in both the load forecast methodassumptions and the impact to the actual forecast
15 For an explanation of 5050 and 9010 demand forecasts please see Appendix B
Page 56
Generation
MISO projects 103800 MW of Existing‐Certain capacity during the assessment timeframe Of the Existing‐Certain capacity it is difficult to predict the wind capacity available on peak due to the intermittent nature of wind However MISO has determined maximum wind capacity credits using an Equivalent Load Carrying Capacity a metric commonly utilized by the National Renewable Energy Laboratory MISO used the Equivalent Load Carrying Capacity for wind generation and Loss of Load Expectation analyses16 Wind shows an Existing‐Certain capacity of 600 MW on peak over the assessment timeframe utilizing a 149 percent capacity credit for those resources committed as Planning Resource capacity to MISO within the Module E Capacity Tracking tool It is important to note that not all Existing wind capacity was committed in the Module E Capacity Tracking tool Existing‐Other capacity for wind is 1000 MW expected on peak and 9200 MW derates on peak over the assessment timeframe Hydro shows an Existing‐Certain capacity of 800 MW expected on peak over the assessment timeframe The Existing‐Other capacity for hydro is 300 MW expected on peak and 100 MW derates on peak over the assessment timeframe Of the Existing‐Certain capacity biomass shows 500 MW on peak throughout the assessment timeframe MISO anticipates 3000 MW of Behind‐the‐meter Generation (BTMG) to be available for the winter season Hydro conditions for the winter appear normal and there are no reports of reservoir levels showing insufficiencies to meet both peak demand the daily energy demand throughout the winter MISO is not expecting conditions (ie weather fuel supply fuel transportation) that would reduce capacity
Imports and Exports on Peak
MISO only reports power imports (not exports) to the MISO market or reported interchange transactions into the MISO market The forecast includes 2700 MW of power imports17 All these imports are firm and fully backed by firm transmission and firm generation No import assumptions are based on partial path reservations There are no transactions with Liquidated Damages Contract clauses or ldquomake‐wholerdquo contracts that are included as firm capacity External emergency assistance does not contribute to satisfying the reserve margin requirement MISO only relies on committed generation and firm capacity purchases for meeting its reserve margin requirement
16httpswwwmidwestisoorgLibraryRepositoryStudyLOLE201220LOLE20Study20Reportpdf 17 2012-2013 winter peak power imports obtained from the Module E Capacity Tracking tool
Page 57
Reliability Assessment Analysis
The LOLE study is used to determine the level of planning reserves which ensures that the probability for loss of load on the integrated peak hour for each day of the annual planning period sums to 01 dayyear or 1 day in 10 years within the MISO system18 Refer to Table 2‐10 of the 2012 LOLE Study Report for a comparison of Planning Year 2012 Planning Reserve Margin (PRM) to last yearrsquos PRM
According to the 2011 LOLE study the reserve margin requirement calculated for MISO is 167 percent of the MISO Net Internal Demand of its market area for the 20122013 winter season In addition to the 103800 MW of Existing‐certain capacity resources in December MISO expects 2700 MW of external resources and 3000 MW of BTMG resources which are available to serve load19 Behind‐the‐meter generation is considered a capacity resource when calculating the MISO reserve margin This additional capacity arrives at a total designated capacity of 109500 MW
This brings the projected reserve margin for MISO to 37300 MW which is 517 percent of MISO Net Internal Demand The MISO Reserve Margin (NID) has increased by 63 percentage points over last years forecast reserve margin due to a slight increase in Demand Response resources and the net impact of the DEOK transfer of generation and resources into PJM This projected reserve margin is higher than the 167 percent MISO system PRM requirement Firm load curtailment is a very low probability event for the 20122013 winter period
For inclusion in seasonal assessments MISO utilizes Energy Information Administration fuel forecasts to identify any system wide fuel shortages and none are projected for the winter period In addition to the seasonal assessments MISOrsquos Independent Market Monitor submits a monthly report to MISOrsquos Board of Directors which covers fuel availability and security issues During the operating horizon MISO relies on market participants to anticipate reliability concerns related to the fuel supply or fuel delivery Since there are no requirements to verify the operability of backup fuel systems or inventories supply adequacy and potential problems must be communicated appropriately by the market participants to enable adequate response time
18httpswwwmidwestisoorgLibraryRepositoryStudyLOLE201220LOLE20Study20Reportpdf 19 External BTMG and DRR values are based on forecasted 2012-2013 winter values from Module E
Page 58
RELIABILITYFIRST
Demand
In this assessment the data related to the ReliabilityFirst areas of PJM and MISO is combined with the data from OVEC to develop the ReliabilityFirst regional data The demand forecasts used in this assessment are all based on the coincident peak demand of MISOrsquos Local Balancing Authorities and the coincident peak of PJMrsquos load zones Both PJM and MISO demand forecasts are based on an expected or 5050 demand forecast While there is some diversity between the PJM and MISO coincident peak demands and the ReliabilityFirst coincident peak demands most of the demand diversity is already reflected in the PJM and MISO coincident demand forecasts For this assessment no additional diversity is included for the ReliabilityFirst region therefore the ReliabilityFirst coincident peak demand is simply the sum of the PJM MISO and OVEC peak demands (rounded to nearest 100 MW) The composite ReliabilityFirst region forecast is considered a 5050 demand forecast (see Appendix B for explanation of 5050 demand forecast)
PJM and MISO use the categories of Direct Control Load Management and Interruptible Load to account for the expected combined potential DR reduction within the ReliabilityFirst region PJM and MISO also include demand reductions for load in their respective markets Load as a capacity resource is included as a load reduction in the PJM market In MISO the load served behind‐the‐meter from BTMG is included with the demand forecast so BTMG is included as a capacity resource The combined Direct Control Load Management during the winter is 300 MW and the Interruptible Demand is 1600 MW This is a total demand reduction of 1900 MW and is the maximum controlled demand mitigation that is expected to be available during peak demand conditions
Since demand reduction programs are a contractual management of system demand utilization reduces the reserve margin requirement for PJM and MISO Net Internal Demand is TID less the demand reduction Reserve margin requirements are based on Net Internal Demand
The Net Internal Demand peak of the ReliabilityFirst region for the 2012 winter season is 144700 MW and is projected to occur during January 2013 This value is based on a TID forecast of 146600 MW with the full reduction of 1900 MW (13 percent of TID) from the demand response programs within the region (see Table RFC‐1)
Page 59
Compared to the actual winter 20112012 peak demand of 132683 MW the 20122013 winter forecast NID is 12017 MW (91 percent) higher than the actual 20112012 winter peak demand In addition the 2011 forecast of 20122013 winter NID peak demand was 136700 MW making this yearrsquos winter NID peak demand forecast 8000 MW (59 percent) higher than last yearrsquos 2012 winter peak demand forecast The NID forecast for this winter is higher due to the reduction in available DSM reported by PJM for this winter
Weather and economic conditions have significant influence on electrical peak demands Any deviation from the original forecast assumptions for those parameters could cause the aggregate 20122013 winter peak to be significantly different from the forecast
DECEMBER JANUARY FEBRUARY
RFC Totals [2]
TOTAL INTERNAL DEMAND 144500 146600 141200
Direct Control Load Management (300) (300) (300)Interruptible Demand (1600) (1600) (1600)
Load as a Capacity Resource 0 0 0
NET INTERNAL DEMAND 142600 144700 139300
[2] - The RFC regional demand includes OVEC with the PJM and MISO areas of RFC[1] - All demand totals are rounded to the nearest 100 MW
TABLE RFC-1
RFC PROJECTED PEAK DEMANDS (MW)1
WINTER 2012-13
Page 60
For the winter of 20122013 high demand forecasts for PJM and MISO were combined with the OVEC demand to create a high demand forecast for the ReliabilityFirst region The forecast high demand (NID) is 153300 MW a 59 percent increase over the 5050 demand forecast (see Table RFC‐2)
Generation
There are two general categories used when analyzing seasonal capacity resources ldquoExistingrdquo capacity represents resources that have been built and are in commercial service ldquoFuturerdquo capacity represents planned resources that are under construction have an interconnection service agreement and are expected to be in commercial service at the start of the planning period
The generating capacity in Table RFC‐3 represents the capacity of the generation in the ReliabilityFirst region The capacity category of Existing Certain represents existing resources in the ReliabilityFirst areas of PJM and MISO that are committed to their respective markets and the capability of OVEC generation The ReliabilityFirst region has 206300 MW of capacity that is identified as Existing Certain in this winter assessment This includes Energy Efficiency and BTM generation resources of 2500 MW
TOTALRFC
HIGH DEMAND1
TOTAL INTERNAL DEMAND [TID] 155100
NET INTERNAL DEMAND [NID] 153300
NET CAPACITY RESOURCES 206300
RESERVE MARGINS -- MW 53000 -- of NID 346
TABLE RFC-2SIMULATED HIGH DEMAND (MW)
WINTER 2012-13
[1] - The combination of the 9010 demand forecasts for the PJM and MISO areas of RFC is not a 9010 forecast for RFC These values are used to simulate conditions for a high demand day
Page 61
The Existing Other category includes the existing resources that represent expected on‐peak windvariable resource derating and other existing capacity resources within the ReliabilityFirst region not included as Existing Certain resources There is up to 7500 MW of these types of capacity resources None of this capacity is used to satisfy the reserve margin requirement in PJM and MISO
Capacity changes (new and retired generation) that occurred prior to the winter season are included in these winter reserve margins No Future Planned capacity additions are included during the winter in this ReliabilityFirst assessment
The total nameplate amount of variable generation in ReliabilityFirst is about 5800 MW This is nearly all wind power (with about 32 MW solar) with the amount of available on‐peak variable generation capability included in the reserve calculations at about 700 MW The difference between the nameplate rating and the on‐peak expected wind capability rating is accounted for in the Existing Other category
RFC2012
EXISTING CAPACITY 214500
EXISTING INOPERABLE (700)
EXISTING OTHER CAPACITY (7500)
EXISTING CERTAIN CAPACITY 206300
CAPACITY TRANSACTIONS - IMPORTS 1 700
CAPACITY TRANSACTIONS - EXPORTS 1 (700)
NET INTERCHANGE 0
CAPACITY and NET INTERCHANGE 206300
NET CAPACITY RESOURCES 206300
1 - Intra-regional transfers reported by the RTOs (between RTOs and with OVEC) have been removed
TABLE RFC-3RFC PROJECTED CAPACITY RESOURCES (MW)
WINTER 2012-13
Page 62
There is also 700 MW of biomass (renewable) resources included in the ReliabilityFirst reserve margins
Each generator operator is expected to coordinate with the fuel industry regarding fuel supplies and deliveries Although PJM and MISO do not explicitly communicate with the fuel industry regarding fuel supply issues their respective market rules encourage generator owners and operators to have adequate fuel supplies ReliabilityFirst does not communicate directly with the fuel industry on supply adequacy or potential problems ReliabilityFirst does periodically survey its generator owners and operators about relevant fuel issues that may occur The last survey was in 2008 to determine if severe flooding in the Midwest was expected to significantly delay or curtail fuel shipments
There are no known or expected conditions or situations regarding fuel supply or delivery hydroelectric reservoirs adverse weather generator availability environmental regulatory or capacity retirement that are anticipated to adversely impact the forecasts used in this 20122013 winter assessment
Imports and Exports on Peak
Expected and firm power imports into the ReliabilityFirst regional area are forecast to be 700 MW Firm power exports are forecast to be 700 MW There is no net interchange forecast for the ReliabilityFirst regional area There are no transactions using Liquidated Damage Contracts or make‐whole contracts
Reliability Assessment Analysis
The PJM projected reserve margin for winter 20122013 based on Net Internal Demand is 402 percent This 402 percent reserve margin is a 126 percentage point decrease over the 20112012 forecast reserve margin due to the reduction in available DSM reported by PJM for this winter The reserve margin requirement in PJM is 156 percent of the summer peak which requires minimum capacity resources of 164400 MW This is an equivalent requirement of 263 percent reserve margin based on the winter NID forecast PJM is projected to have adequate reserves for the 20122013 winter peak demand
The reserve margin requirement calculated for MISO is 167 percent of the Net Internal Demand of its market area The current projected reserve margin for MISO is 37300 MW which is 517 percent of the Net Internal Demand Therefore MISO is projected to have adequate reserves for the 20122013 winter peak demand
Since PJM and MISO are projected to have sufficient resources to satisfy their respective reserve margin requirements the ReliabilityFirst region is projected to have adequate resources for the 20122013 winter period In Table RFC‐4 the calculated reserve margin for ReliabilityFirst is 61600 MW which is 426 percent based on Net Internal Demand and Net Capacity Resources This compares to a 589 percent reserve margin in last winterrsquos assessment The reduction in available DSM reported by PJM for this winter and the retirement of generation resources after the summer is the reason for the decrease in winter reserve margins
Page 63
DECEMBER JANUARY FEBRUARY
TOTAL INTERNAL DEMAND (MW) 144500 146600 141200
DEMAND RESPONSE (MW) (1900) (1900) (1900)
NET INTERNAL DEMAND (MW) 142600 144700 139300
NET CAPACITY RESOURCES (MW) 206300 206300 206300
RESERVE MARGINS -- MW 63700 61600 67000 -- of NID 447 426 481
Introduction This study estimated the use of NPCC Area Operating Procedures designed to mitigate resource shortages for the winter of 201213 (November 2012 through March 2013) The CP‐8 Working Grouprsquos effort is consistent with the CO‐12 Working Grouprsquos study NPCC Reliability Assessment for Winter 2012‐13 November 2012 20 General Electricrsquos (GE) Multi‐Area Reliability Simulation (MARS) program was selected for the analysis GE Energy was retained by NPCC to conduct the simulations Results For the November 2012 ‐ March 2013 period Figure EX‐1a shows the estimated use of the indicated operating procedures under the Base Case assumptions for the expected load level (the expected load level results were based on the probability‐weighted average of the seven load levels simulated)
20 See httpwwwnpccorgdocumentsreportsSeasonalaspx
Page 65
Figure EX-1a
Expected Use of Indicated Operating Procedures for Winter 201213
Base Case Assumptions ndash Expected Load Level
For the November 2012 ‐ March 2013 period Figure EX‐1b shows the estimated use of the indicated operating procedures under the Base Case assumptions for the extreme load level (representing the second to highest load level having approximately a 6 chance of being exceeded)
0
1
2
NE NY ON MT Q
Estimated Number of
Occurrences (daysperiod)
Reduce 30-min Reserve
Initiate Interruptible Loads
Reduce 10-min Reserve
Appeals
Disconnect Load
Page 66
Figure EX-1b
Expected Use of the Indicated Operating Procedures for Winter 201213
Base Case Assumptions - Extreme Load Level
For the November 2012 ‐ March 2013 period Figure EX‐2a shows the estimated use of the indicated operating procedures under the Severe Case assumptions for the expected load level (the expected load level results were based on the probability‐weighted average of the seven load levels simulated)
0
1
2
Estimated Number of
Occurrences (daysperiod)
Reduce 30-min Reserve
Initiate Interruptible Loads
Reduce 10-min Reserve
Appeals
Disconnect Load
Page 67
0
1
2
NE NY ON MT Q
Estimated Number of
Occurrences (daysperiod)
Reduce 30-min Reserve
Initiate Interruptible Loads
Reduce 10-min Reserve
Appeals
Disconnect Load
Page 68
Figure Figure EX-2a
EX-2a
Expected Use of the Indicated Operating Procedures for Winter 201213
Severe Case Assumptions - Expected Load Level
For the November 2012 ‐ March 2013 period Figure EX‐2b shows the estimated use of the indicated operating procedures under the Severe Case assumptions for the extreme load level (representing the second to highest load level having approximately a 6 chance of being exceeded)
Figure EX-2b
Expected Use of the Indicated Operating Procedures for Winter 201213
Severe Case Assumptions - Extreme Load Level
0
2
4
6
NE NY ON MT Q
Estimated Number of
Occurrences (daysperiod)
Reduce 30-min Reserve
Initiate Interruptible Loads
Reduce 10-min Reserve
Appeals
Disconnect Load
Page 69
Conclusions
As shown in Figures EX‐1a the use of operating procedures designed to mitigate resource shortages is not expected for Queacutebec Ontario the Maritimes New York and New England under the assumed Base Case conditions for the expected load level The expected load level results were based on the probability‐weighted average of the seven load levels simulated Figure EX‐1b indicates only the Maritimes show a need to implement their operating procedures under Base Case extreme load level conditions
Figure EX‐2b shows the estimated use of operating procedures for the extreme load level if the severe set of resource unavailability assumptions used in this analysis occurs The extreme load level represents the second to highest load level having approximately a 6 chance of being exceeded Only the Maritimes and Quebec Areas show a need for use of operating procedures in response to a capacity deficiency this winter for these conditions The results for the Maritimes Area are driven by the assumption of continuation of the Pt Lepreau refurbishment outage The results for the Queacutebec Area are driven by the assumed generation reductions from Churchill Falls and La Sarcelle
Page 70
Appendix I ndash Winter 2012‐13 Expected Load and Capacity Forecasts
Table AP‐1 ndash NPCC Summary
Week Installed Total Load Demand Known Req Operating Unplanned Net Bottled Revised
‐ Includes known scheduled maintenance as of September 12 2012
‐ Assumed unplanned outages based on historical observation of outages with an additional 2000 MW of outages for generation at risk due to gas supply during seven weeks in January and
February
‐ Installed Capacity Firm Purchases and Sales and Interruptible Load are based on ISO‐NE Forward Capacity Market (FCM) resource obligations for the 2012‐2013 capacity commitment
period
‐ Purchases and sales consist of imports of 253 MW from Quebec and 322 MW from New York and an export of 100 MW to New York
‐ Load Forecast assumes Peak Load Exposure reported in the 2012 CELT Report
‐ Interruptible Loads consist of both active and passive (energy efficiency) FCM Demand Resource obligations
‐ 2375 MW of operating reserve assumes 125 of the first largest contingency at 1400 MW and 50 of the second largest contingency of 1250 MW
Page 73
Table AP‐4 ndash New York
Week Installed Firm Firm Total Load Demand Known Req Operating Unplanned Net
and available capacity from Churchill Falls at the Newfoundland minus Queacutebec border
2) Purchases 400 MW in December 581 MW in January and 481 MW in February
3) Sales of 253 MW + losses to ISO‐NE
Does not include firm sale of 145 MW to Cornwall (154 MW with losses)
4) Expected weekly internal peak load plus 154 MW for Cornwall including losses
5) Includes 250 MW of load management through voltage reduction (Direct Control Load Management)
Page 76
Appendix II ndash Load and Capacity Tables definitions
This appendix defines the terms used in the Load and Capacity tables of Appendix I Individual Balancing Authority Area particularities are presented when necessary
Installed Capacity
This is the generation capacity installed within a Reliability Coordinator area This should correspond to nameplate andor test data and may include temperature derating according to the Operating Period It may also include wind generation derating
Individual Reliability Coordinator area particularities
New England
Installed capacity is based on generator Forward Capacity Market supply obligations
Queacutebec
Most of the Installed Capacity in the Queacutebec Area is owned and operated by Hydro‐Queacutebec Production The remaining capacity is provided by Churchill Falls and by private producers (hydro wind biomass and natural gas cogeneration)
Maritimes
This number is the maximum net rating for each generation facility (net of unit station service) and does not account for reductions associated with ambient temperature derating and intermittent output (eg hydro andor wind)
Ontario
This number includes all generation registered with the IESO
New York
This number includes all generation resources that participate in the NYISO Installed Capacity (ICAP) market
NPCC A‐07
Capacity The rated continuous load‐carrying ability expressed in MW or MVA of generation transmission or other electrical equipment
Purchases
These are purchases between Reliability Coordinator areas or from outside NPCC that have firm transmission reservations to back them up
Individual Reliability Coordinator area particularities
New England
Imports with obligations in the Forward Capacity Market are included
Page 77
New York
NY does not use the firm transmission concept
Queacutebec
Both long term firm purchases and short term calls for tenders are included as needed
Maritimes
Short or long‐term capacity‐backed purchases would be included
Ontario
Ontario only allows hourly transactions
Sales
These are sales between Reliability Coordinator areas or to outside NPCC that have firm transmission reservations to back them up
Individual Reliability Coordinator area particularities
New England
Exports with Forward Capacity Market obligations are included
New York
NY does not use the firm transmission concept
Queacutebec
Firm sales and wheel throughs are included However in this assessment the 145 MW contract to Cedars Rapids Transmission is not included in the sales It is included in the Queacutebec Balancing Area demand This is different than what is done in the NERC seasonal assessments where this load is considered a firm export
Maritimes
Short or long‐term capacity‐backed sales would be included
Ontario
Ontario only allows hourly transactions
Total Capacity
Total Capacity = Installed Capacity + Purchases ndash Sales
Demand Forecast
This is the total internal demand forecast for each Reliability Coordinator area as per its Demand Forecast Methodology (Appendix IV)
Page 78
Demand Response
Loads that are interruptible under the terms specified in a contract These may include supply and economic interruptible loads Demand Response Programs or market‐based programs
Known MaintenanceConstraints
This is the reduction in Capacity caused by forecasted generator maintenance outages and by any additional forecasted transmission or by other constraints causing internal bottling within the Reliability Coordinator area Some Reliability Coordinator areas may include wind generation derating
Individual Reliability Coordinator area particularities
New England
Known maintenance includes all planned outages as reported on the ISO‐NE Annual Maintenance Schedule
Queacutebec
This includes scheduled generator maintenance and hydraulic as well as mechanical restrictions It also includes wind generation derating It may include ndash usually in summer ndash transmission constraints on the TransEacutenergie system
Maritimes
This includes scheduled generator maintenance and ambient temperature derates It also includes wind and hydro generation derating
Ontario
This includes generator maintenance derating plus generation bottling
Required Operating Reserve
This is the minimum operating reserve on the system for each Reliability Coordinator area
NPCC A‐07
Operating reserve This is the sum of ten‐minute and thirty‐minute reserve (fully available in 10 minutes and in 30 minutes)
Individual Reliability Coordinator area particularities
New England
The required operating reserve consists of 100 percent of the first largest contingency plus 50 percent of the second largest contingency
Page 79
New York
The required operating reserve consists of 150 percent of the first largest contingency
Queacutebec
The required operating reserve consists of 100 percent of the largest first contingency + 50 percent of the largest second contingency including 1000 MW of hydro synchronous reserve distributed all over the system to be used as stability and frequency support reserve
Maritimes
The required operating reserve consists of 100 percent of the first largest contingency plus 50 percent of the second largest contingency
Ontario
The required operating reserve consists of 100 percent of the first largest contingency plus 50 percent of the second largest contingency
Unplanned Outages
This is the forecasted reduction in Installed Capacity by each Reliability Coordinator area based on historical conditions used to take into account a certain probability that some capacity may be on forced outage
Individual Reliability Coordinator area particularities
New England
Monthly unplanned outage values have been calculated based on five years of historical unplanned outage data
Queacutebec
This value includes a provision for frequency regulation in the Queacutebec Balancing Authority Area for unplanned outages and for heavy loads as determined by the system controller
Maritimes
Monthly unplanned outage values have been calculated based on historical unplanned outage data
Ontario
This value is a historical observation of the capacity that is on forced outage at any given time
Net Margin
Page 80
Net margin = Total capacity ndash Load forecast + Interruptible load ndash Known maintenanceConstraints ndash Required operating reserve ndash Unplanned outages
Individual Reliability Coordinator area particularities
New York
NY plans for an Installed Reserve Margin requirement as a percentage above peak load forecast and approved by the New York State Reliability Council (NYSRC)
Bottled Resources
Bottled resources = Queacutebec Net margin + Maritimes Net margin ndash available transfer capacity between QueacutebecMaritimes and Rest of NPCC
This is used primarily in summer It takes into account the fact that the margin available in Maritimes and Queacutebec exceeds the transfer capability to the rest of NPCC since Queacutebec and Maritimes are winter peaking
Revised net margin (NPCC Summary only)
Revised net margin = Net margin ndash Bottled resources
This is used only in the Summer Assessment and follows from the Bottled Resources calculation
Page 81
Appendix III ndash Summary of Normal and Expected Feasible Transfer Capability under Winter Peak Conditions
The following table shows Normal Transfer Capability (NTC) between Reliability Coordinator areas representing transfer capabilities under normal system conditions It is recognized that the actual transfer conditions may differ depending on system conditions or configurations such as actual voltage profiles operating conditions etc Also the Feasible Transfer Capability (FTC) values represent an expected transfer capability under the peak demand scenario with the assumed transmission configuration identified in this report This Feasible Transfer Capability is based on historical operating experience and known operating constraints in each Reliability Coordinator area The total for each Reliability Coordinator area represents the simultaneous transfer between Reliability Coordinator areas that may be achievable It should be noted that real‐time transfer limits may change depending on the operation of the system at the time and readers are encouraged to review information on the Available Transfer Capability (ATC) and Total Transfer Capabilities (TTC) between Reliability Coordinator areas via httpwwwnerroorg
Diagram 1
Out
Page 82
Reliability Coordinator area Acronym Description
Maritimes Ontario
NB ‐ New Brunswick NW ‐ North West Sub‐Area
West ‐ Western Sub‐Area
New England Niagara ‐ Niagara
BHE ‐ Bangor‐Hydro Electric NE ‐ North‐East Sub‐Area
CMA ‐ Central Massachusetts CHAT ‐ Ottawa
VT ‐ Vermont East ‐ East
WMA ‐ Western Massachusetts RFC ‐ ReliabilityFirst Corporation
CT ‐ Connecticut MAN ‐ Manitoba
NOR ‐ Norwalk MRO ‐ Midwest Reliability Organization
MIN ‐ Minnesota
HAW ‐ Hawthorne
New York
The New York Balancing Authority area is divided into 11 zones (A ndash K) that are defined based on the transmission system topology
A West Queacutebec
B Genessee Brookfield ‐ Brookfield
C Central RPD‐KPW ‐ Rapide‐des‐Iles Kipawa
D North BRY‐PGN ‐ Bryson ‐ Paugan
E Mohawk Valley CHAT ‐ Chateauguay
F Capital CRT ‐ Cedar Rapids Transmission
G Hudson Valley BDF‐STS ‐ Bedford Stanstead
H Millwood BEAU ‐ Beauharnois
I Dunwoodie NIC ‐ Nicolet
J New York City MTP‐MDW ‐ Matapedia‐Madawaska
K Long Island OUTA ‐ Outaouais
Page 83
Transfers from Maritimes to
Interconnection Point NTC at Interconnection Points (MW)
FTC under Peak Conditions (MW)
Rationale for Constraint
Queacutebec
NB MTP ndash MDW Lines 2101 2102
Lines 30123114 3113
335
435
335
435
Eel River winter rating is 350 MW When Eel River converter losses and line losses to the Queacutebec border are taken into account Eel River to Matapeacutedia transfer is 335 MW
Madawaska winter rating is 435 MW
Total 770 770
New England
NB BHE
L3001 L3016
1000 1000 For resource adequacy studies NE assumes that it can import 700 MW of capacity to meet New England loads Note that New England would be able to import more than 700 MW if it backed down its generation in Maine or if many Maine generators were unavailable
Total 1000 1000
Transfers from New England to
Interconnection Point NTC at Interconnection Points (MW)
FTC under Peak Conditions (MW)
Rationale for Constraint
Maritimes
NB BHE
L3001 L3016390
1000 1000 For resource adequacy studies NE assumes that it can import 700 MW of capacity to meet New England loads Note that New England would be able to import more than 700 MW if it backed down its generation in Maine or if many Maine generators were unavailable
BHE NB
L3001 3016390
550 550 Transfer capability is dependent upon operating conditions in northern Maine If key generation or capacitor banks are not operational the transfer from New England to New Brunswick will be decreased At the present time the NBSO has limited the NTC to 200 MW but will increase it to 550 MW upon request from the NBSO under emergency operating conditions for up to 30 minutes This limitation is due to system security stability within New Brunswick and it is presently under review
Total 550 550
New York
VT D 0
Page 84
WMA F 843
CT G 843
NOR K 200
Sub Total 1886 1325 Feasible Simultaneous Transfer to New York excluding Cross Sound Cable ISO‐NE planning assumptions are based on an interface limit of 1400 MW
CT (CSC) K 330 330 The transfer capability of the Cross Sound Cable is 346 MW However losses reduce the amount of MWs that can actually be delivered across the cable When 346 MW is injected into the cable 330 MW is received at the point of withdrawal The Cross Sound Cable is a DC tie and is not included in the Feasible simultaneous transfer capability with NY
Total 2216 1655
Queacutebec
CMA NIC HVDC link
2000 0 Phase 2 is required for internal Queacutebec transmission needs at the time of peak Capability of the facility is 2000 MW conditions in NE NY amp PJM may limit to 1200 MW or less
Highgate (VT) ndash Bedford (BDF) Line 1429
170 0 Capability of the facility is 225 MW with a maximum of 220 MW deliverable to New England due to limits in Queacutebec At times conditions in Vermont limit the capability to 100 MW or less The DOE permit is 170 MW
Derby (VT) ndash Stanstead (STS) Line 1400
0 0 There is no capability to export to Queacutebec through this interconnection
Total 2170 0 The New England to Queacutebec transfer limit at peak load is assumed to be 0 MW It should be noted that this limit is dependant on New England generation and could be increased up to approximately 350 MW depending on New England dispatch If energy was needed in Queacutebec and the generation could be secured in the Real‐Time market this action could be taken to increase the transfer limit
Transfers from New York to
Page 85
Interconnection Point NTC at Interconnection Points (MW)
FTC under Peak Conditions (MW)
Rationale for Constraint
New England
D VT
F WMA
K CT
K NOR
Sub Total 1450 1450 Feasible Simultaneous Transfer to New England excluding Cross Sound Cable
K CT (CSC) 340 340 Cross Sound Cable power injection is up to 346 MW losses reduce power at the point of withdrawal to 340 MW The Cross Sound Cable is a DC tie and is not included in the Feasible Simultaneous Transfer capability with NY
Total 1790 1790
Ontario
D East Lines L33P L34P
A Niagara Lines PA301 PA302 BP76 PA27
Simultaneous Transfers between Ontario and NY may be impacted by loop flows and assumes phase shifting capability of Michigan ‐ Ontario interface is not available Additionally thermal limits on the QFW interface may restrict imports to lesser values when the generation in the Niagara area is taken into account BP76 OS
Total 1700 1700
PJM
A PJM
C PJM
G PJM
J PJM
Total 2350 2350 Feasible Simultaneous Transfer to PJM on peak
Queacutebec
D Chat L7040 1000 1000
D CRT Lines CD11 CD22
100 100
Total 1100 1100
Page 86
Transfers from Ontario to
Interconnection Point NTC at Interconnection Points (MW)
FTC under Peak Conditions (MW)
Rationale for Constraint
New York
East D Lines L33P L34P
300 300
Niagara A Lines PA301 PA302 BP76 PA27
1390 1390
Total 1690 1690 Simultaneous Transfers between Ontario and NY may be impacted by loop flows and assumes phase shifting capability of Michigan ‐ Ontario interface is not available BP76 is OS
MISO Michigan
Lines L4D L51D J5D B3N
2160 2160
Total 2160 2160 Simultaneous Transfers between Michigan and Ontario may be impacted by loop flows and assumes phase shifting capability of Ontario‐Michigan interface is not available
Queacutebec
NE RPD ndash KPW Lines D4Z H4Z
85 85 The 85 MW reflects an agreement through the TE‐IESO Interconnection Committee pending further study of available options resulting from the Outaouais Interconnection H4Z thermal capability in winter is 110 MW
Ottawa BRY ndash PGN Lines X2Y Q4C
140 52 Circuit Q4C is capable of transferring 140 MW less frac12 of Chat Falls generation that is considered in the Queacutebec Installed Capacity (140‐88=52) There is no capacity to export to Queacutebec through Lines P33C and X2Y
Ottawa Brookfield Lines D5A H9A
110 110 Only one of H9A or D5A can be in service at any time The 110 MW reflects the maximum load that can be transferred to Ontario from Queacutebec (Papier Masson Inc) D5A`s transfer capability is 200 MW
East Beau Lines B5D B31L
470 470 Capacity from Saunders that can be synchronized to the Hydro‐Queacutebec system
HAW OUTA
Lines A41T A42T
1250 1250 Normally Ontario will schedule up to 1230 MW allowing for a Transmission Reliability Margin of 20 MW
Total 2055 1967
MISO Manitoba Minnesota
NW MAN Lines K21W K22W
275 275
Page 87
NW MIN Line F3M
140 140
Total 415 415 Feasible Simultaneous Transfer to MAPP
Transfers from Queacutebec to
Interconnection Point NTC at Interconnection Points (MW)
FTC under Peak Conditions (MW)
Rationale for Constraint
Maritimes
MTP‐MDWNB Lines 2101 2102
Lines 30123114 3113
350 + radial loads
423 + radial loads
350 + radial loads
423 + radial loads
Eel River HVDC winter rating is 350 MW plus available radial load transfers (Radial load transfer amount is dependent on local loading and will be updated monthly Dec ‐ 78 MW Jan ndash 85 MW Feb ndash 74 MW March ndash 72 MW These values will be updated as required
Madawaska winter rating is 435 MW When Madawaska converter losses and line losses to the New Brunswick border are taken into account Madawaska to St‐Andreacute transfer is 423 MW
(Radial load transfer amount is dependent on local loading and will be updated monthly Dec ndash 157 MW Jan ndash 159 MW Feb ‐ 138 MW Marchndash 137 MW These values will be updated as required
Total 773 + radial loads 773 + radial loads
New England
NIC CMA HVDC link
2000 1400 Capability of the facility is 2000 MW actual conditions in NE NY PJM may lower this value The value estimated at peak load is 1400 MW However Phase 2 may be required for internal Queacutebec transmission needs at the time of peak in which case FTC would be ldquozerordquo
Bedford (BDF) ndash Highgate (VT) Line 1429
220 200 Limitations on the Queacutebec system under peak load conditions
Stanstead (STS) ndash Derby (VT) Line 1400
35 35
Total 2255 1635
New York
Chateauguay ndash D Line 7040
1500 1000 Beauharnois GS is used for Queacutebec needs under peak load conditions in which case transfer is limited to Chacircteauguay capacity
CRT ndash D Lines CD11 CD22
325 180 Transfer limit is 325 MW less projected peak Cornwall load of 145 MW tapped off the circuit
Total 1825 1180 Queacutebec to New York transfer capability may reach 2000 MW on an hour‐ahead basis and depending on operating conditions in New York and in Queacutebec
Ontario
Page 88
RPD‐KPW NE Lines D4Z H4Z
75 75 This represents Line D4Z capacity There is no capacity to export to Ontario through Line H4Z
BRY‐PGN Ottawa Lines X2Y P33C Q4C
400 232 Limitations on the Queacutebec system under peak load conditions restrict deliveries as follows P33C ‐ 167 MW and X2Y ndash 65 MW There is no capacity to export to Ontario through Line Q4C
Brookfield Ottawa Lines D5A H9A
200 200 Only one of H9A or D5A can be in service at any time The transfer capability reflects usage of D5A The 200 MW reflects the maximum transfer available from Queacutebec to Ontario D5Arsquos transfer limit is 250 MW
Beau East Lines B31L B5D
790 0 Beauharnois GS is used for Queacutebec needs under peak load conditions
OUTA HAW Lines A41T A42T
1250 1250 Normally Ontario will schedule up to 1230 MW allowing for a Transmission Reliability Margin of 20 MW
Total 2715 1757
Note Limitations on the Queacutebec system under peak load conditions may be due to resource limitations as opposed to transmission limitations so that the Feasible Transfer Capability does not necessarily correspond to the TTCs published elsewhere
Page 89
Transfers from Regions External to NPCC
Interconnection Point Normal Transfer Capability at Interconnection Points (MW)
Feasible Transfer Capability under Peak Conditions (MW)
Rationale for Constraint
MISO (Michigan) ONT Lines L4D L51D J5D B3N
1860 1860 Represents a worst case scenario for the implementation of Policy on operation
Total 1860 1860 Simultaneous Transfers between Michigan and Ontario may be impacted by loop flows and assumes phase shifting capability of Ontario‐Michigan interface is not available
MISO (Manitoba‐Minnesota) ONT
NW MAN Lines K21W K22W
275 275
NW MIN Line F3M
90 90
Total 365 365 Feasible Simultaneous Transfer to Ontario
PJM New York
A
C
G
J
Total 2650 2650 Feasible Simultaneous Transfer to New York
Page 90
Appendix IV ndash Demand Forecast Methodology
Reliability Coordinator area Methodologies
Maritimes
The Maritimes Area demand is the mathematical sum of the forecasted weekly peak demands of the sub‐areas (New Brunswick Nova Scotia Prince Edward Island and the area served by the Northern Maine Independent System Operator) As such it does not take the effect of load coincidence within the week into account If the total Maritimes Area demand included a coincidence factor the forecast demand would be approximately 1 to 3 percent lower
For the NBSO the demand forecast is based on an End‐use Model (sum of forecasted loads by use eg water heating space heating lighting etc) for residential loads and an Econometric Model for general service and industrial loads correlating forecasted economic growth and historical loads Each of these models is weather adjusted using a 30‐year historical average
For Nova Scotia the load forecast is based on a 10‐year weather average measured at the major load center along with analyses of sales history economic indicators customer surveys technological and demographic changes in the market and the price and availability of other energy sources
For Prince Edward Island the demand forecast uses average long‐term weather for the peak period (typically December) and a time‐based regression model to determine the forecasted annual peak The remaining months are prorated on the previous year
The Northern Maine Independent System Administrator performs a trend analysis on historic data in order to develop an estimate of future loads
New England
ISO New Englandrsquos energy model is an annual model of ISO‐NE Area total energy using real income the real price of electricity and weather variables as drivers Income is a proxy for all economic activity
The peak load model is a monthly model of the typical daily peak for each month and produces forecasts of weekly monthly and seasonal peak loads over a 10 year time period Daily peak loads are modeled as a function of energy weather and a time trend on weather for the summer months to capture the increasing sensitivity of peak load to weather due to the increasing cooling load
The reference demand forecast which has a 50 percent chance of being exceeded is based on weekly weather distributions and the monthly model of typical daily peak The weekly weather distributions were built using 40 years of temperature data at the time of daily electrical peaks (for non‐holiday weekdays) A reasonable approximation for ldquonormal weatherrdquo associated with the winter peak is 70 degF and for the summer peak is 902 degF
Page 91
ISO New Englandrsquos forecasting details may be found at httpwwwiso‐necomtransceltfsct_detailindexhtml
New York
The 2012‐13 winter forecast assumes normal weather conditions for both energy usage and peak demand The economic outlook is derived from the New York forecast provided to the NYISO by Moodys Economycom Econometric models are used to obtain energy forecasts for each of the eleven zones in New York A winter load factor is used to derive the winter peak from the annual energy forecast
The NYISO uses a weather index that relates dry bulb air temperature and wind speed to the load response in the determination of the forecast At the forecast load levels a one‐degree decrease in this index will result in approximately 100 MW of additional load The expected temperature at which the New York load could reach the forecast peak is 129 degF (‐11 degC)
Ontario
The Ontario Demand is the sum of coincident loads plus the losses on the IESO‐controlled grid Ontario Demand is calculated by taking the sum of injections by registered generators plus the imports into Ontario minus the exports from Ontario Ontario Demand does not include loads that are supplied by non‐registered generation The IESO forecasting system uses multivariate econometric equations to estimate the relationships between electricity demand and a number of drivers These drivers include weather effects economic data and calendar variables Using regression techniques the model estimates the relationship between these factors and energy and peak demand Calibration routines within the system ensure the integrity of the forecast with respect to energy and peak demand including zone and system wide projections IESO produces a forecast of hourly demand by zone From this forecast the following information is available
hourly peak demand
hourly minimum demand
hourly coincident and non‐coincident peak demand by zone
energy demand by zone
These forecasts are generated based on a set of weather and economic assumptions IESO uses a number of different weather scenarios to forecast demand The appropriate weather scenarios are determined by the purpose and underlying assumptions of the analysis The base case demand forecast uses a median economic forecast and monthly normalized weather Multiple economic scenarios are only used in longer term assessments A quantity of price‐responsive demand is also forecast based on market participant information and actual market experience
Page 92
Queacutebec
Hydro‐Queacutebecrsquos demand and energy‐sales forecasting is Hydro‐Queacutebec Distributionrsquos responsibility First the energy‐sales forecast is built on the forecast from four different consumption sectors ndash domestic commercial small and medium‐size industrial and large industrial The model types used in the forecasting process are different for each sector and are based on end‐use andor econometric models They consider weather variables economic‐driver forecasts demographics energy efficiency and different information about large industrial customers This forecast is normalized for weather conditions based on an historical trend weather analysis
The requirements are obtained by adding transmission and distribution losses to the sales forecasts The monthly peak demand is then calculated by applying load factors to each end‐use andor sector sale The sum of these monthly end‐usesector peak demands is the total monthly peak demand
Load Forecast Uncertainty (LFU) includes weather and load uncertainties Weather uncertainty is due to variations in weather conditions It is based on a 36‐year database of temperatures (1971‐2006) adjusted by 030 degC (054 degF) per decade starting in 1971 to account for climate change Moreover each year of historical climatic data is shifted up to plusmn3 days to gain information on conditions that occurred during either a weekend or a weekday Such an exercise generates a set of 252 different demand scenarios The base case scenario is the arithmetical average of the peak hour in each of these 252 scenarios Load uncertainty is due to the uncertainty in economic and demographic variables affecting demand forecast and to residual errors from the models
Overall uncertainty is defined as the independent combination of climatic uncertainty and load uncertainty This Overall Uncertainty expressed as a percentage of standard deviation over total load is similar to the previous reliability assessment For the 2012‐13 winter peak period the overall uncertainty is evaluated at 1560 MW
TransEacutenergie ndash the Queacutebec system operator ndash then determines the Queacutebec Balancing Authority Area forecasts using Hydro‐Queacutebec Distributionrsquos forecasts (HQ internal demand) and accounting for agreements with different private systems within the Balancing Authority Area The forecasts are updated on an hourly basis within a 12‐day horizon according to information on local weather wind speed cloud cover sunlight incidence and type and intensity of precipitation over nine regions of the Queacutebec Balancing Authority Area Forecasts on a minute basis are also produced within a two day horizon TransEacutenergie has a team of meteorologists who feed the demand forecasting model with accurate climatic observations and precise weather forecasts Short term changes in industrial loads and agreements with different private systems within the Balancing Authority Area are also taken into account on a short term basis
Page 93
Appendix V ‐ NPCC Operational Criteria and Procedures
NPCC Directories Pertinent to Operations
NPCC Regional Reliability Reference Directory 1 ndash Design and Operation of the Bulk Power System
Description This directory provides a ldquodesign‐based approachrdquo to ensure the bulk power system is designed and operated to a level of reliability such that the loss of a major portion of the system or unintentional separation of a major portion of the
system will not result from any design contingencies Includes Appendices F and G ldquoProcedure for Operational Planning Coordinationrdquo and rdquoProcedure for Inter Reliability Coordinator area Voltage Controlrdquo respectively Note‐Directory 1 is presently being revised by the NPCC Task Forces on Coordination of Operation and Coordination of Planning
Description Objectives principles and requirements are presented to assist the NPCC Reliability Coordinator areas in formulating plans and procedures to be followed in an emergency or during conditions which could lead to an emergency
Description This directory provides objectives principles and requirements to enable each NPCC Reliability Coordinator Area to provide reserve and simultaneous activation of reserve
Note‐The Directory 5 revisions was completed during 2012 was approved by NPCC membership and went into place on October 11 2012
NPCC Regional Reliability Reference Directory 6 ndash ldquoReserve Sharing Groupsrdquo Description This directory provides the framework for Regional Reserve Sharing Groups within NPCC It establishes the requirements for any Reserve Sharing Groups involving NPCC Balancing Authorities
NPCC Regional Reliability Reference Directory 8 ‐ System Restoration
Description This directory provides objectives principles and requirements to enable each NPCC Reliability Coordinator Area to perform power system restoration following a major event or total blackout
NPCC Regional Reliability Reference Directory 9‐ Verification of Generator Gross and Net Real Power Capability
Description This document establishes the minimum criteria to verify the Gross Real Power Capability and Net Real Power Capability of generators used to ensure accuracy of information used in the steady‐state and dynamic simulation models to assess the reliability of the NPCC bulk power system
Page 94
NPCC Regional Reliability Reference Directory 10‐ Verification of Generator Gross and Net Reactive Power Capability
Description This document establishes the minimum criteria to verify the Gross Reactive Power Capability and Net Reactive Power Capability of generators used to ensure accuracy of information used in the steady‐state and dynamic simulation models to assess the reliability of the NPCC bulk power system These criteria have been developed to ensure that the requirements specified in NERC Standard MOD‐025‐1 ldquoVerification of Generator Gross and Net Reactive Power Capabilityrdquo are met by NPCC and its applicable members responsible for meeting the NERC standards
NPCC Regional Reliability Reference Directory 12‐Underfrequency Load Shedding Requirements Description This document presents the basic criteria for the design and implementation of under frequency load shedding programs to ensure that declining frequency is arrested and recovered in accordance with established NPCC performance requirements to prevent system collapse due to load‐generation imbalance
A‐10 Classification of Bulk Power System Elements
Description This Classification of Bulk Power System Elements (Document A‐10) provides the methodology for the identification of those elements of the interconnected NPCC Region to which NPCC bulk power system criteria are applicable Each Reliability Coordinator area has an existing list of bulk power system elements The methodology in this document is used to classify elements of the bulk power system and has been applied in classifying elements in each Reliability Coordinator area as bulk power system or non‐bulk power system
C‐05 Monitoring Procedures for Emergency Operation Criteria
Description This procedural document establishes TFCOs monitoring and reporting requirements for conformance with NPCC Regional Reliability Reference Directory 2 ‐ Emergency Operations
C‐07 Monitoring Procedures for Guide for Rating Generating Capability
Description This procedural document establishes the TFCOs monitoring and reporting requirements for conformance with the NPCC Guide for Rating Generating Capability (Document B‐9)
C‐15 Procedures for Solar Magnetic Disturbances on Electrical Power Systems
Page 95
Description This procedural document clarifies the reporting channels and information available to the operator during solar alerts and suggests measures that may be taken to mitigate the impact of a solar magnetic disturbance
C‐17 Procedures for Monitoring and Reporting Critical Operating Tool Failures
The purpose of this document is to outline the reporting requirements responsibilities and obligations of the NPCC Reliability Coordinators (RCrsquos) in response to unforeseen critical operating tool failures
C‐35 NPCC Inter‐Area Power System Restoration Reference Document
Description This procedure provides guidance and training material to the system operator to manage system restoration events that affect the NPCC Reliability Coordinator areas and adjoining Reliability Coordinator areas
C‐36 Procedures for Communications during Emergencies
Description This procedure establishes the types of communications that should take place between Reliability Coordinator area system operators and with external agencies during an emergency It also indicates the data that should be collected during and after a major system event
C‐42 Procedure for Reporting and Reviewing System Disturbances
This document establishes the procedures of the Task Force on Coordination of Operation (TFCO) for reporting and reviewing system disturbances
C‐43 NPCC Operational Review for the Integration of New Facilities
The document provides the procedure to be followed in conducting operations reviews of new facilities being added to the power system This procedure is intended to apply to new facilities that if removed from service may have a significant direct or indirect impact on another Reliability Coordinator arearsquos inter‐Area or intra‐Area transfer capabilities The cause of such impact might include stability voltage andor thermal considerations
C‐44 NPCC Inc Regional Methodology and Procedures for Forecasting TTC and ATC
Description This document establishes a common methodology for calculating Total Transfer Capability (TTC) and Available Transfer Capability (ATC) within the NPCC Region
Page 96
Appendix VI ‐ Web Sites
Independent Electricity System Operator
httpwwwiesoca
ISO‐ New England
httpwwwiso‐necom
MAPP
httpwwwmappcororg
Maritimes
Maritimes Electric Company Ltd
httpwwwmaritimeelectriccom
New Brunswick Power Corporation
httpwwwnbpowercom
New Brunswick System Operator
httpwwwnbsoca
Nova Scotia Power Inc
httpwwwnspowerca
Northern Maine Independent System Administrator
httpwwwnmisacom
Midwest Reliability Organization
wwwmidwestreliabilityorg
National Oceanic and Atmospheric Administration Solar Cycle Sunspots
NPCC CP-8 Working Group 1 RCC Approved - June 13 2012
CP-8 WORKING GROUP
Northeast Power Coordinating Council Inc Phil Fedora Chairman Hydro-Queacutebec Distribution Abdelhakim Sennoun Independent Electricity System Operator Vithy
Vithyananthan ISO - New England Inc Fei Zeng National Grid Jack Martin New Brunswick System Operator Rob Vance New York Independent System Operator Frank Ciani New York State Reliability Council Al Adamson Nova Scotia Power Inc Kamala Rangaswamy Ontario Power Generation Inc Kevan Jefferies
The CP-8 Working Group acknowledges the efforts of Messrs Glenn Haringa and Mark Walling GE Energy and Patricio Rocha PJM and thanks them for their assistance in this analysis
NPCC CP-8 Working Group 2 RCC Approved - June 13 2012
TABLE OF CONTENTS
PAGE EXECUTIVE SUMMARY 4 Introduction 4 Results 4 Conclusions 7 INTRODUCTION 8 MODEL ASSUMPTIONS 9 Load Representation 9 Load Shape 9 Load Forecast Uncertainty 10 Generation 11 Unit Availability 12 Transfer Limits 14 Operating Procedures to Mitigate Resource Shortages 15
Assistance Priority 16 Modeling of Neighboring Regions 16 WINTER 201112 SUMMARY 19 ANALYSIS 22 Winter 201213 Results 22 Base Case Scenario 22
Base Case Assumptions helliphelliphelliphelliphelliphelliphelliphelliphelliphelliphelliphelliphelliphelliphelliphelliphelliphelliphelliphelliphellip 23 Severe Case Scenario 27 Severe Case Assumptionshelliphelliphelliphelliphelliphelliphelliphelliphelliphelliphelliphelliphelliphelliphelliphelliphelliphelliphelliphelliphellip 29 Conclusions 30
NPCC CP-8 Working Group 3 RCC Approved - June 13 2012
APPENDICES PAGE A) OBJECTIVE AND SCOPE OF WORK 31
B) EXPECTED NEED FOR OPERATING PROCEDURES 32 Table 7 - Base Case Assumptions (200304 Load Shape) 32 Table 8 - Severe Case Scenario (200304 Load Shape) 33 C) MULTI-AREA RELIABILITY SIMULATION PROGRAM DESCRIPTION 34
NPCC CP-8 Working Group 4 RCC Approved ndash June 13 2012
EXECUTIVE SUMMARY Introduction
This study estimated the use of NPCC Area Operating Procedures designed to mitigate resource shortages for the winter of 201213 (November 2012 through March 2013) The CP-8 Working Grouprsquos effort is consistent with the CO-12 Working Grouprsquos study NPCC Reliability Assessment for Winter 2012-13 November 2012 1 General Electricrsquos (GE) Multi-Area Reliability Simulation (MARS) program was selected for the analysis GE Energy was retained by NPCC to conduct the simulations
Results For the November 2012 - March 2013 period Figure EX-1a shows the estimated use of the indicated operating procedures under the Base Case assumptions for the expected load level (the expected load level results were based on the probability-weighted average of the seven load levels simulated)
Figure EX-1a Expected Use of Indicated Operating Procedures for Winter 201213
Base Case Assumptions ndash Expected Load Level For the November 2012 - March 2013 period Figure EX-1b shows the estimated use of the indicated operating procedures under the Base Case assumptions for the extreme load level (representing the second to highest load level having approximately a 6 chance of being exceeded) 1 See httpwwwnpccorgdocumentsreportsSeasonalaspx
NPCC CP-8 Working Group 5 RCC Approved ndash June 13 2012
Figure EX-1b Expected Use of the Indicated Operating Procedures for Winter 201213
Base Case Assumptions - Extreme Load Level For the November 2012 - March 2013 period Figure EX-2a shows the estimated use of the indicated operating procedures under the Severe Case assumptions for the expected load level (the expected load level results were based on the probability-weighted average of the seven load levels simulated)
Figure EX-2a Expected Use of the Indicated Operating Procedures for Winter 201213
NPCC CP-8 Working Group 6 RCC Approved ndash June 13 2012
For the November 2012 - March 2013 period Figure EX-2b shows the estimated use of the indicated operating procedures under the Severe Case assumptions for the extreme load level (representing the second to highest load level having approximately a 6 chance of being exceeded)
Figure EX-2b Expected Use of the Indicated Operating Procedures for Winter 201213
NPCC CP-8 Working Group 7 RCC Approved ndash June 13 2012
Conclusions As shown in Figures EX-1a the use of operating procedures designed to mitigate resource shortages is not expected for Queacutebec Ontario the Maritimes New York and New England under the assumed Base Case conditions for the expected load level The expected load level results were based on the probability-weighted average of the seven load levels simulated Figure EX-1b indicates only the Maritimes show a need to implement their operating procedures under Base Case extreme load level conditions Figure EX-2b shows the estimated use of operating procedures for the extreme load level if the severe set of resource unavailability assumptions used in this analysis occurs The extreme load level represents the second to highest load level having approximately a 6 chance of being exceeded Only the Maritimes and Quebec Areas show a need for use of operating procedures in response to a capacity deficiency this winter for these conditions The results for the Maritimes Area are driven by the assumption of continuation of the Pt Lepreau refurbishment outage The results for the Queacutebec Area are driven by the assumed generation reductions from Churchill Falls and La Sarcelle
NPCC CP-8 Working Group 8 RCC Approved ndash June 13 2012
INTRODUCTION
This study estimated the use of NPCC Area operating procedures to mitigate resource shortages for November 2012 through March 2013 The Working Grouprsquos efforts are consistent with the NPCC CO-12 Working Grouprsquos study NPCC Reliability Assessment for Winter 2012-13 November 2012 1 The development of this Working Grouprsquos assessment was in response to the following recommendation from the NPCC Reliability Assessment for Winter 200405 1
ldquoThe CO-12 assessment of the Summer Operating Period is accompanied by a corresponding multi area probabilistic assessment of Loss of Load Expectations and of the projected use of Operating Procedures designed to mitigate resource shortages This assessment was not performed for this Winter Operating Period For completeness in the assessment of the Winter Operating Period the CO-12 Working Group recommends that TFCO and TFCP review the merits of having this assessment performed for future Winter Operating Periodsrdquo
The database developed by the CP-8 Working Group for the NPCC Reliability Assessment for Summer 2012 April 2012 2 was used as the starting point for this analysis Working Group members reviewed the existing data and made revisions to reflect the conditions expected for the winter 201213 assessment period This report is organized in the following manner after a brief introduction specific model assumptions are presented followed by an analysis of the results based on the scenarios simulated The Working Groups Objective and Scope of Work is shown in Appendix A Tables presenting the corresponding results for the Base Case and Severe Case simulations are listed in Appendix B Appendix C provides an overview of General Electrics Multi-Area Reliability Simulation (MARS) Program version 314 was used for this assessment
2 See httpswwwnpccorgLibrarySeasonal20AssessmentNPCC_2012_Summer_Reliability_Assessment_Final_Reportpdf - Appendix VIII
NPCC CP-8 Working Group 9 RCC Approved ndash June 13 2012
MODEL ASSUMPTIONS
Load Representation The loads for each Area were modeled on an hourly chronological basis The MARS program modified the input hourly loads through time to meet each Areas specified annual or monthly peaks and energies Table 1 summarizes each NPCC Areas winter peak load assumptions for the winter 201213
Table 1 Assumed NPCC 201213 Peak Loads ndash MW
(200304 Load Shapes)
200304 Load Shape
Area Expected
Peak Extreme Peak
Month
Queacutebec (Q) 37262 40616 January
Maritimes Area (MT) 5209 5730 February
New England (NE) 22355 23211 January
New York (NY) 26794 27625 January
Ontario (ON) 22194 22995 January
Extreme Peak based on load forecast uncertainty for peak month Maritimes Area represents New Brunswick Nova Scotia Prince Edward Island and the
system administrated by the Northern Maine Independent System Administrator (NMISA)
Load Shape In 2006 the Working Group considered two load shape assumptions for the winter multi-area assessment
bull a 200203 load shape representative of a winter weather pattern with a typical expectation of cold days and
bull a 200304 load shape representative of a winter weather pattern that includes a consecutive period of cold days
Review of the results for both load shape assumptions indicated only slight differences in the results The Working Group agreed that the weather patterns associated with the 200304 load shape are representative of weather conditions that stress the system appropriate for use in future winter assessments Upon review of subsequent winter weather experience the Working Group agreed that the 200304 load shape assumption be again used for this analysis
NPCC CP-8 Working Group 10 RCC Approved ndash June 13 2012
The growth rate in each monthrsquos peak was used to escalate Area loads to match the Areas winter demand and energy forecasts The impacts of Demand-Side Management programs were included in each Areas load forecast Figure 1 shows the diversity in the NPCC area load shapes used in this analysis for the 200304 load shape assumptions
Figure 1 ndash 201112 Projected Monthly Peak Loads for NPCC Areas
(200304 Load Shape)
Load Forecast Uncertainty Peak load forecast uncertainty was also modeled The effects on reliability of uncertainties in the peak load forecast due to weather andor economic conditions were captured through the load forecast uncertainty model in MARS The program computes the reliability indices at each of the specified load levels (for this study seven load levels were modeled) and calculates weighted-average values based on input probabilities of occurrence While the per unit variations in the load can vary on a monthly basis Table 2 shows the values assumed for January 2013 Table 2 also shows the probability of occurrence assumed for each of the seven load levels modeled
NPCC CP-8 Working Group 11 RCC Approved ndash June 13 2012
In computing the reliability indices all of the Areas were evaluated simultaneously at the corresponding load level the assumption being that the factors giving rise to the uncertainty affect all of the Areas at the same time The amount of the effect can vary according to the variations in the load levels
For this study reliability measures are reported for two load conditions expected and extreme The values for the expected load conditions are derived from computing the reliability at each of the seven load levels and computing a weighted-average expected value based on the specified probabilities of occurrence The indices for the extreme load conditions provide a measure of the reliability in the event of higher than expected loads and were computed for the second-to-highest load level These values are highlighted in Table 2
Table 2 Per Unit Variation in Load Assumed for the Month of January 2013
Area Per-Unit Variation in Load
Q 10914 10900 10406 09989 09594 09192 09086
MT 11000 11000 10500 10000 09500 09000 09000
NE 10934 10383 09971 09635 09402 08500 08000
NY 10430 10310 10160 09980 09750 09440 09050
ON 10541 10361 10180 10000 09820 09639 09459
Prob 00062 00606 02417 03830 02417 00606 00062 Generation Tables 3(a) and 3(b) summarize the winter 201213 capacity assumptions for the NPCC Areas used in the analysis for the Base Case and the Severe Case Scenario respectively Base Case conditions are consistent with the assumptions used in the NPCC CO-12 Working Group NPCC Reliability Assessment for Winter 2012-13 November 2012
Reserve () 9 39 55 50 43 Annual Weighted Average Unit Availability ()
9859 9046 8768 8487 8576
Scheduled Maintenance 5
20 623 2140 25
Table 3 (b) NPCC Capacity and Load Assumptions for January 2013 - MW
Severe Assumptions Scenario - Extreme Load Q MT NE NY ON
Assumed Capacity 36405 6841 30712 3 39272 29800 3
PurchaseSale 1995 0 429 -456 0
Peak Load 4 40616 5655 23211 27625 22995
Demand Response (MW) 1302 0 863 1081 1166
Reserve () -2 21 38 44 35 Scheduled Maintenance 5
680 621 3169 1117
Unit Availability Details regarding the NPCC Arearsquos assumptions for generator unit availability are described in the respective Arearsquos most recent NPCC Comprehensive Review of Resource Adequacy 6 In addition the following Areas provided the following
3 Does not include demand-side resources 4 Based on the 200304 Load Shape assumption internal Queacutebec load shown 5 Maintenance shown is for the week of the monthly peak load Capacity shown for Queacutebec adjusted for
scheduled maintenance and other restrictions 6 See httpwwwnpccorgdocumentsreviewsResourceaspx
NPCC CP-8 Working Group 13 RCC Approved ndash June 13 2012
Queacutebec The planned outages for the winter period are reflected in this assessment The volume of planned outages is consistent with historical volumes Ontario Ontariorsquos generating unit availability was based on IESO ldquo18-Month Outlook An Assessment of the Reliability and Operability of the Ontario Electricity System from June 2012 ndash November 2013rdquo 7 Ontario market participants provided the majority of generation data Forced Outage Rates (FOR) and Planned Outage Rates (POR) were based on forecast values for generating units which reflect past experience and future expectations based on recent maintenance activities However for some of the generating units FOR and POR values were based on North American Reliability Council (NERC) Generator Availability Data System 8 (GADs) data for similar type units New England This probabilistic assessment reflects New England generating unit availability assumptions based upon historical performance over the prior five-year period Unit availability modeled reflects the projected scheduled maintenance and forced outages Individual generating unit maintenance assumptions are based upon each unitrsquos historical five-year average of scheduled maintenance Individual generating unit forced outage assumptions were based on the unitrsquos historical data and North American Reliability Council (NERC) average data for the same class of unit A more detailed description of the modeling assumptions can be found by referring to the corresponding FERC filings concerning the ISO-New England Installed Capacity Requirement and related values for the 3rd Reconfiguration Auction for the 20122013 Capability Year 9 New York Detailed availability assumptions used for the New York units can be found in the New York ISO Technical Study Report 10 Locational Minimum Installed Capacity Requirements Study covering the New York Control Area for the 2012 ndash 2013 Capability Year and the ldquoNew York Control Area Installed Capacity Requirement for the Period May 2012-April 2013rdquo New York State Reliability Council December 2 2011 report 11 7 See httpiesocaimowebpubsmarketReports18MonthOutlook_2012febpdf 8 See httpwwwnerccompagephpcid=4|43 9 See httpwwwiso-necomregulatoryfercfilings2011nover12-496-000_11-30-11_icr_2012-2013pdf 10 See httpwwwnyisocompublicmarkets_operationsservicesplanningplanning_studiesindexjsp 11 See httpwwwnysrcorgpdfReports201220IRM20Final20Reportpdf
NPCC CP-8 Working Group 14 RCC Approved ndash June 13 2012
Transfer Limits Figure 2 depicts the system that was represented in this Assessment showing Area and assumed Base Case transfer limits for the winter 201213 period New York Area internal transmission representation was consistent with the assumptions used in the New York ISO report 10 - Locational Minimum Installed Capacity Requirements Study covering the New York Control Area for the 2012 ndash 2013 Capability Year and the ldquoNew York Control Area Installed Capacity Requirements for the Period May 2012 ndash April 2013rdquo New York State Reliability Council December 2 2011 report 11
The New England internal transmission representation is consistent with assumptions currently being developed for the 2012 New England Regional System Plan 12
Figure 2 - Assumed Transfer Limits Between Areas
12 The New England Regional System plans can be found at httpwwwiso-necomtransrsp2009indexhtml
The transfer capability is 1000 MW However it was modeled as 700 MW to reflect limitations imposed by internal New England constraints
The transfer capability in this direction reflects limitations imposed by internal New England constraints
NPCC CP-8 Working Group 15 RCC Approved ndash June 13 2012
Tie transfer limits between Areas are indicated in Figure 2 with seasonal ratings (S- summer W- winter) where appropriate The acronyms and notes used in Figure 2 are defined as follows Chur - Churchill Falls NOR - Norwalk ndash Stamford RFC - ReliabilityFirst Corp MANIT - Manitoba BHE - Bangor Hydro Electric NB - New Brunswick ND - Nicolet-Des Cantons Mtl - Montreacuteal PEI - Prince Edward Island JB - James Bay C MA - Central MA CT - Connecticut MAN - Manicouagan W MA - Western MA NS - Nova Scotia NE - Northeast (Ontario) NBM - Millbank NW - Northwest (Ontario) MRO - Midwest Reliability VT - Vermont CSC - Cross Sound Cable
Organization Que - Queacutebec Centre Cdrs - Cedars NM - Northern Maine Centre Phase angle regulators (PARs) are installed on the Ontario ndash Michigan interconnection at Lambton Transformer Station (L4D and L51D) and Keith (J5D) on the Ontario side and at Bunce Creek Transformer Station (B3N) in Michigan representing the four interconnections with Michigan Final regulatory approvals have been received permitting operation of these facilities Operating Procedures to Mitigate Resource Shortages Each Area takes defined steps as their reserve levels approach critical levels These steps consist of those load control and generation supplements that can be implemented before firm load has to be actually disconnected Load control measures could include disconnecting interruptible loads public appeals to reduce demand and voltage reductions Other measures could include calling on generation available under emergency conditions andor reduced operating reserves The need for an Area to begin these operating procedures is modeled in MARS by evaluating the daily Loss of Load Expectation (LOLE) at specified margin states The user specifies these margin states for each area in terms of the benefits realized from each emergency measure which can be expressed in MW as a per unit of the original or modified load and as a per unit of the available capacity for the hour
Table 4 summarizes the load relief assumptions modeled for each NPCC Area The Working Group recognizes that Areas may invoke these actions in any order depending on the situation faced at the time however it was agreed that modeling the actions as in the order indicated in Table 4 was a reasonable approximation for this analysis
NPCC CP-8 Working Group 16 RCC Approved ndash June 13 2012
Table 4 - NPCC Operating Procedures to Mitigate Resource Shortages
201213 Winter Load Relief Assumptions - MW Actions Q MT NE 13 NY ON
1 Curtail Load Utility Surplus Appeals RT-DR SCR EDRP SCR Load Man Volt Red
1302 0 0 0
0 0 0 0
0 0
495 0
0 0
1384 021
148 100
0 0
2 No 30-min Reserves 500 234 600 600 473
3 Voltage Reduction Interruptible Load 14
250 0
0 285
322 0
124 0
0 0
4 No 10-min Reserves RT-EG 15
Appeals Curtailments
750 0 0
660 0 0
0 268
0
0 0
231
1081 0 0
5 5 Voltage Reduction No 10-min Reserves
0 0
0 0
0 1200
0 1200
260 0
Real-Time Demand Response
Assistance Priority All Areas received assistance on a shared basis in proportion to their deficiency In this analysis each step was initiated simultaneously in all Areas and sub-Areas Modeling of Neighboring Regions For the scenarios studied a detailed representation of RFC (ReliabilityFirst Corp) and the MRO-US (Midwest Reliability Organization ndash US portion) was modeled The assumptions are summarized in Table 5
Figure 3 shows the 201213 Projected Monthly Expected Peak Loads for NPCC PJM RFC-OTH (Other) and the MRO for the 200304 Load Shape assumption 13 Values for New Englandrsquos Real-Time Demand Resources and Real-Time Emergency Generation have
been derated to account for historical availability performance 14 Interruptible Loads for Maritimes Area (implemented only for the Area) Voltage Reduction for all
NPCC CP-8 Working Group 18 RCC Approved ndash June 13 2012
Figure 3 ndash 201213 Projected Monthly Expected Peak Loads (200304 Load Shape) ReliabilityFirst is the successor organization to the Mid-Atlantic Area Council (MAAC) the East Central Area Coordination (ECAR) Agreement and the Mid-American Interconnected Network (MAIN) organizations The RFC-OTH (Other) area modeled in this analysis was intended to represent the non-PJM RTO region data within RFC The modeling of the RFC region is in transition due to changes in the regional boundaries between RFC MRO and SERC This model was based on publicly available data from the NERC Electricity Supply amp Demand (ESampD) provided by PJM The modeling of RFC-OTH is expected to evolve for future studies as data reflecting the new regional boundaries becomes available For now the RFC-OTH area is the non-PJM RTO region that was formerly in either MAIN or ECAR The MAIN and ECAR boundaries do not correctly define the new RFC boundaries but this definition insures consistency within the use of the NERC ESampD data
NPCC CP-8 Working Group 19 RCC Approved ndash June 13 2012
WINTER 201112 SUMMARY Major Weather Highlights On average the 2011-2012 winter was a mild one for the contiguous United States NOAArsquos National Climatic Data Center 17 reported that December January and February (the meteorologicalrdquo winter for 2011-2012) was the fourth warmest of the past 117 winters The seasonal average temperature was 368 degrees Fahrenheit which is 39 degrees above the 20th century average The most unusually warm temperatures were found in the northern states especially in the northern Great Plains NOAArsquos National Climatic Data Center explained the reason for the pattern the jet stream stayed farther north than usual this winter The high-altitude winds of the jet stream generally mark the boundary between Arctic air to the north and warmer air to the south That position allowed warm southern air to prevail over the entire US and prevented cold fronts from descending from the north and clashing with warm fronts creating large snow- and rainstorms The jet stream was locked in that position for most of the winter 18 According to the National Oceanic and Atmospheric Administration more than 95 percent of the US had below-average snow cover the greatest such percentage ever recorded Load Comparison Table 6 compares NPCC Arearsquos actual 2011-12 winter peak demands against the forecast assumptions Except for the Maritimes the moderate winter temperatures coupled with the on-going economic recession and implementation of conservation programs resulted in less demand than forecast for all NPCC sub regions for the winter of 2011-12
17 See httpwwwclimatewatchnoaagovarticle2012u-s-has-fourth-warmest-winter-on-record-west-southeast-drier-than-average 18 See httpwwwscientificamericancomarticlecfmid=whats-causing-dry-winter
NPCC CP-8 Working Group 20 RCC Approved ndash June 13 2012
Table 6 Comparison of NPCC 201112 Actual and Forecast Peak Loads ndash MW
Date Actual
(MW)
Forecast
(Based on 200304 Load Shape)
Area Expected
Peak Extreme
Peak Month
Queacutebec Jan 16 2012 35481 37232 39782 January Maritimes Area
Feb 13 2012 5552 5464 6010 February
New England Jan 4 2012
19908
22225 23107 January
New York Jan 3 2012 23901 26174 26985 January
Ontario Jan 3 2012 21649 22270 23510 January
Queacutebec Winter 2011‐2012 was much warmer than normal In Montreacuteal average temperatures for winter were 34 degC (61 degF) higher than mean temperatures This was the warmest winter since 2001‐2002 and the second warmest since 1942 Internal demand was correspondingly low Only ten peak days showed demand values above 33000 MW Internal peak hourly demand for winter 2011‐2012 was established to be 35481 MW on Monday January 16 2012 at 8h00 EST This value includes 1388 MW of interruptible demand that was used at the time Therefore actual metered demand (Served Internal Demand) was 34093 MW at peak The annual forecast was 37209 MW Transfers to neighboring areas at the time of peak were 3512 MW Montreacuteal temperature at peak time was ‐18 degC (‐04 degF) and wind speed was 9 kmhour (6 mph) Temperatures in most other areas of the province were somewhat colder than in Montreacuteal but nowhere near usual peak period temperatures Thirty‐minute operating reserve at peak time was 2711 MW 1211 MW over the reserve requirement No particular transmission condition that affected internal demand or firm transactions occurred during the 2011 - 2012 winter period Maritimes The Maritimes Area load is the mathematical sum of the forecasted or actual peak loads of the sub-areas (New Brunswick Nova Scotia Prince Edward Island and the area served by the Northern Maine Independent System Operator)
NPCC CP-8 Working Group 21 RCC Approved ndash June 13 2012
It was a milder than usual winter and no reliability issues occurred in the Maritime Provinces The actual winter peak was 5375 MW and occurred on February 13 2012 The Maritime Provinces did not experience any unexpected extreme or adverse weather conditions and did not require use of its Demand Response measures New England Within New England during the 20112012 winter period there were no major operational issues that impacted system reliability The 20112012 actual New England winter peak of 19908 MW (21333 MW with passive demand resources added back in) occurred on January 4 2012 19 Implementation of Operating Procedure 4 (OP 4) was not required at the time of the peak However OP 4 was implemented on the morning of December 19 2011 due to forced generator reductionsoutages and loads running over the forecast New York The actual system coincident peak for the 20102011 winter was 23901 MW which occurred on January 3 2012 New York did not experience any significant operating issues during the winter 20112012 season Ontario The actual winter peak demand of 21649 MW occurred on January 3 2012 Ontario did not experience any significant operating issues during the 20112012 winter period
19 See httpwwwiso-necomtransceltfsct_detail2012winter_pknormal_2011-2012pdf
NPCC CP-8 Working Group 22 RCC Approved ndash June 13 2012
ANALYSIS
Winter 201213 Results Base Case Scenario Table 7 (see Appendix B) shows the estimated need for the indicated operating procedures (in daysperiod) for November 2012 through March 2013 period for the Base Case assumptions for all NPCC Areas for the 200304 load shape assumptions Figure 4(a) shows the estimated use of operating procedures occurrences for the NPCC Areas for the expected load (the expected load level results were based on the probability-weighted average of the seven load levels simulated) for the Base Case assumptions The results indicate that only the Maritimes Area has a chance to use these procedures in response to a capacity deficiency Figure 4(b) shows the corresponding results for the extreme load (representing the second to highest load level having approximately a 6 chance of being exceeded)
Figure 4a Estimated Use of the Indicated Operating Procedures for Winter 201213
Base Case Assumptions - Expected Load Level
Maritimes Area initiates interruptible loads instead of voltage reduction
NPCC CP-8 Working Group 23 RCC Approved ndash June 13 2012
Figure 4b Estimated Use of the Indicated Operating Procedures for Winter 201213
Base Case Assumptions Extreme Load Level
Base Case Assumptions The following summary of Base Case assumptions represents system conditions consistent with those assumed in the NPCC CO-12 Working Groups Reliability Assessment for Winter 2012-13 November 2012 The Base Case assumptions are summarized below System - As-Is System for the 2012-2013 period - Transfers allowed between Areas - 200304 Load Shape adjusted to Arearsquos year 2012 forecast (expected amp extreme
assumptions) 20
Ontario - Forecast consistent with the IESOrsquos 18-Month Outlook ndash (June 2012) 7
- 1511 MW of installed Wind Generation (seasonal wind capacity contribution of 336 at peak)
NPCC CP-8 Working Group 24 RCC Approved ndash June 13 2012
- Michigan ndash Ontario Phase Angle Regulators PARs on J5D L51D B3N and L4D are in-service
- BP76 (Ontario to New York 230 kV tie line) returns to service end of 2012 New England
- ~ 34515 MW of existing and planned generation resources modeled - ~ 1920 MW of demand supply resources modeled - ~ 575 MW of capacity import - ~2000 MW of gas-fired generation unavailable
New York - All cables in service - Assumptions consistent with the NYCA Installed Capacity Requirements for the Period
May 2012 through April 2013 - ~ 2165 MW of registered SCR resources discounted to historic availability (~1400
MW)
Maritimes - Point Lepreau Nuclear Generating Station returns to service October 1 2012 - 816 MW installed wind capacity in service prior to winter season - New hourly wind profile for each sub-area Queacutebec - Resources and load forecast consistent with Queacutebec 2011 Comprehensive Review -
including about 1500 MW of scheduled maintenance and restrictions - Trans-Canada Energy (TCE) Gas GS (547 MW) mothballed - Tracy thermal GS (450 MW) and La Citiegravere thermal GS are retired (280 MW) - 1835 MW of installed wind generation (520 MW modeled representing 30 value at
peak) and 104 MW derated by 100 - 150 MW of additional interruptible load expected for the winter period - 398 MW of firm capacity exports - 1100 MW of available capacity imports
PJM-RTO - As-Is System for the 201213 winter period ndash consistent with the PJM 2011 Reserve
Requirement Study 21 - 200304 Load Shapes adjusted to the 2012 forecast provided by PJM - Load forecast uncertainty of 9413 +- 505 1010 and 1515 - Operating Reserve 3400 MW (30-min 2765 MW 10-min 635 MW)
21 2011 PJM Reserve Requirement Study (RRS) dated October 13 2011 - available at this link on PJM
Web site httppjmcomplanningresource-adequacy-planning~mediaplanningres-adeq2011-rrs-studyashx
NPCC CP-8 Working Group 25 RCC Approved ndash June 13 2012
- 0 MW of Demand Response (DR) RFC lsquoOtherrsquo 22 - As-Is System for the 201213 winter period ndash based on NERC ESampD database updated
by the respective ISOs compiled by PJM staff - 200304 Load Shapes adjusted to the most recent monthly forecast provided by PJM - Load forecast uncertainty of 9401 +- 515 1030 and 1544 - Operating Reserve 2206 MW (30-min 1470 MW 10-min 736 MW)
MRO-US - As-Is System for the 201213 winter period - based on NERC ESampD database updated
by the respective ISOs compiled by PJM staff - 200304 Load Shapes adjusted to the most recent monthly forecast provided by PJM - Load forecast uncertainty of 9430 +- 490 981 and 1471 - Operating Reserve 1700 MW (30-min 1200 MW 10-min 500 MW)
New York Details The Base Case assumes that the New York City and Long Island localities will meet their locational installed capacity requirements as described in the New York ISO report - Locational Installed Capacity Requirements Study covering the New York Control Area for the 2012 ndash 2013 Capability Year and New York State will meet the capacity requirements described in the ldquoNew York Control Area Installed Capacity Requirements for the Period May 2012 ndash April 2013rdquo New York State Reliability Council December 2 2011 Technical Study Report The New York unit ratings were obtained from the ldquo2012 Load amp Capacity Data of the NYISOrdquo (Gold Book 23) Existing Resources All in-service New York generation resources were modeled Wind resources exhibit daily output variation that correlates to wind speed and density One approach would be to model wind resources with 90 summer and 70 winter derate factors The NYISONYSERDA Wind Study Phase 2 prepared by GE Energy Consulting 24 have shown these availability factors may be appropriate However the MARS model only captures monthly rating changes and not the daily changes necessary to accurately model this variation
22 ldquoRFC Otherrdquo refers to previous (before RFC ndash circa 2006) NERC regional boundaries of ECAR and MAIN excluding PJMrsquos territory 23 See httpwwwnyisocompublicwebdocsservicesplanningplanning_data_reference_documents2011_GoldBook_Public_Finalpdf 24 See httpwwwnyisocompublicservicesplanningspecial_studiesjsp
NPCC CP-8 Working Group 26 RCC Approved ndash June 13 2012
The NYISOrsquos approach is to model wind resources as load modifiers with a 90 summer derate factor Hourly wind readings taken at or near each wind resource are converted to hourly unit MW output Wind density turbine height and other factors are taken into account These hourly MW output values are then netted against the hourly zonal load New York uses historic hourly wind readings taken in 2002 This wind study year also corresponds to the base hourly load shape year used in this assessment Special Case Resources and Emergency Demand Response Programs Special Case Resources (SCRs) are loads capable of being interrupted and distributed generators rated at 100 kW or higher that are not directly telemetered SCRs offer load curtailment as ICAP resources and provide energyload curtailment when activated in accordance with the NYISO Emergency Operating Manual SCRs are required to respond to a deployment request for a minimum of four hours however there is no limit to the number of calls or the time of day in which the Special Case Resources may be deployed SCRs receive a capacity payment for load curtailment capability sold in the ICAP market and an energy payment for energy performance during a demand response event The Emergency Demand Response Program (EDRP) is a voluntary reliability program that allows registered interruptible loads and standby generators when activated in accordance with the NYISO Emergency Operating Manual EDRP resources are only paid for their energy performance during a demand response event There is no limit to the number of calls or the time of day in which EDRP resources may be deployed SCRs and EDRPs are modeled as an operating procedure step activated to minimize the probability of customer load disconnection The GE-MARS models the NYISO operations practice of only activating operating procedures in zones from which are capable of being delivered 2165 MW of registered SCR were discounted to historic availability (1316 MW January) 148 MW of load reduction from EDRP was discounted to historic availability (68 MW January) New England Details The New England generating unit ratings are consistent with their seasonal capability for the 2012 CELT report
Demand Supply Resources The passive non-dispatchable demand resources On-Peak and Seasonal-Peak are expected to provide ~962 MW of load relief during the peak hours About 958 MW of active demand resources including Real-Time Demand Resources and Real-Time Emergency Generation Resources provide additional real time peak load relief at a request by ISO New England during or in anticipation of expected operable capacity
NPCC CP-8 Working Group 27 RCC Approved ndash June 13 2012
shortage conditions to implement ISO-NE Operating Procedure No 4 Actions During a Capacity Deficiency These demand resources are discounted in the assessment to account for performance based on the observed availability factors of demand response programs in the past Ontario Details For the purposes of this study the Base Case assumptions for Ontario are consistent with the IESO ldquo18-Month Outlook An Assessment of the Reliability and Operability of the Ontario Electricity Systemrdquo (June 2012)7 but with the resource additions as shown below Existing Resources All in-service Ontario generation resources were modeled 2012 Resource Additions
Project Name Zone Fuel Type Estimated Effective
Date
Planned (MW)
Comber Wind Limited Partnership West Wind 2012-Q2 166 Pointe Aux Roches Wind West Wind 2012-Q2 49 Bruce Unit Bruce Uranium 2012-Q3 750
For the purposes of this assessment the IESO assumed that wind generation has a dependable contribution of 336 of the installed generation capacity All of the dispatchable demand response resources in Ontario total 1315 MW for the winter period In addition the study assumed 188 MW is available from Utility Surplus (aka ldquoStretchrdquo Capability) called as a part of operating procedures
Severe Case Scenario Table 8 (see Appendix B) shows the estimated need for the indicated operating procedures (in daysperiod) during November 2012 through March 2013 period for the Severe Case Scenario for all NPCC Areas for the 200304 load shape assumptions respectively Only the Maritimes Area is expected to need to use these procedures in response to a capacity deficiency for this Scenario Figure 5(a) shows the estimated use of operating procedures occurrences for the NPCC Areas for the expected load (the expected load level results were based on the probability-weighted average of the seven load levels simulated) for the Severe Case assumptions
NPCC CP-8 Working Group 28 RCC Approved ndash June 13 2012
Figure 5a Estimated Use of the Indicated Operating Procedures for Winter 201213
Severe Case Assumptions - Expected Load Level
Figure 5(b) shows the estimated use of the indicated operating procedures under the Severe Case assumptions for the extreme load level (representing the second to highest load level having approximately a 6 chance of being exceeded)
Figure 5b Estimated Use of the Indicated Operating Procedures for Winter 201213
NPCC CP-8 Working Group 29 RCC Approved ndash June 13 2012
Severe Case Assumptions The Severe Case Scenario assumptions are summarized below
System - As-Is System for the 201213 period - Transfers allowed between Areas - Transfer capability between NPCC and MRORFC- lsquoOtherrsquo reduced by 50 - 200304 Load Shape adjusted to Arearsquos year 2012 forecast (expected amp extreme
assumptions) 25 Ontario - ~1000 MW of maintenance extended into the winter period - Only existing Demand Response of 1141 MW modeled - Hydro electric capacity and energy 10 lower than the Base Case - Niagara ndash New York interconnection Limits reduced for the winter period (BP76
(Ontario to New York 230 kV tie line) outage continues) New England - Assume 50 reduction in Demand Resources - Maintenance overrun by 4 weeks - ~ 3800 MW of gas-fired generation unavailable
New York - Extended maintenance of 1000 MW in southeastern New York - 25 reduction in effectiveness of SCR and EDRP programs - 330 MW of assumed cable transmission transfer reduction resulting from component
failures within the Neptune and Cross Sound HVDC facilities
Maritimes - Point Lepreau Nuclear Generating Station returns to service April 1 2013 - 816 MW installed wind capacity in service prior to winter season - New hourly wind profile for each sub-area with the output from wind generation
reduced by half for the three winter months of December January and February Queacutebec - ~1000 MW reduction from Churchill Falls and 100 MW from La Sarcelle assumed PJM-RTO - Gas-fired only capacity not having firm pipeline transportation assumed ~4200 MW
unavailable - One percent increase in load forecast uncertainty - Ice Storm ice blocking fuel delivery to all units Unit outage event ~8400 MW 25 The 200304 load shape represents a weather pattern that includes a consecutive period of cold days
NPCC CP-8 Working Group 30 RCC Approved ndash June 13 2012
Conclusions The use of operating procedures designed to mitigate resource shortages is not expected for Queacutebec Ontario the Maritimes New York and New England under both the assumed Base Case conditions for the expected load level The expected load level results were based on the probability-weighted average of the seven load levels simulated Only the Maritimes show a need to implement their operating procedures under Base Case extreme load level conditions The Maritimes and Queacutebec Areas show a need for use of operating procedures in response to a capacity deficiency this winter for the extreme load level if the severe set of resource unavailability assumptions used in this analysis occurs The extreme load level represents the second to highest load level having approximately a 6 chance of being exceeded The results for the Maritimes Area are driven by the assumption of continuation of the Pt Lepreau refurbishment outage The results for the Queacutebec Area are driven by the assumed generation reductions from Churchill Falls and La Sarcelle
NPCC CP-8 Working Group 31 RCC Approved ndash June 13 2012
APPENDIX A
Objective and Scope of Work 1 Objective Using the GE Multi-Area Reliability Simulation (MARS) program review NPCC Area reliability resulting from the anticipated resource and transmission capacity reported for the 2012 ndash 2013 winter period under Base Case and Severe Case assumptions and summarize the range of results for the winter and shoulder season months (the period from November 2012 to March 2013) 2 Scope In meeting this objective the CP-8 Working Group will review the short-term resource adequacy of NPCC and neighboring regions for the 2012 and 2013 winter period recognizing uncertainty in forecasted demand scheduled outages of transmission forced and scheduled outages of generation facilities including fuel supply disruptions and the impact of proposed load response programs Reliability will be measured by calculating the estimated use of Area operating procedures used to mitigate resource shortages The results of the assessment will be approved no later than June 2012 The assessment will
bull Review last winterrsquos CP-8 Working Group Winter assessment with respect to actual NPCC Arearsquos experience
bull Consider the impacts of Sub-Area transmission constraints bull Incorporate to the extent possible a detailed GE MARS reliability representation
for the regions bordering NPCC bull Coordinate assessment assumptions with the NPCC Task Force on Coordination
of Operations (CO-12 Working Group) and bull Examine any impact of evolving market rules on overall NPCC interconnection
NPCC CP-8 Working Group 32 RCC Approved ndash June 13 2012
APPENDIX B
Table 7 - Base Case Assumptions (200304 Load Shape Assumption) Expected Need for Indicated Operating Procedures (daysperiod)
(Occurrences 05 or greater are highlighted)
Base Case Queacutebec Maritimes Area New England New York Ontario 30-min VR 10-min Appeal 30-min IL 10-min Appeal 30-min VR 10-min Appeal Disc 30-min VR Appeal 10-min Disc 30-min VR 10-min Appeal Disc Disc Disc 0304 Load Shape-Expected Load
NPCC CP-8 Working Group 34 RCC Approved ndash June 13 2012
APPENDIX C
Multi-Area Reliability Simulation Program Description General Electricrsquos Multi-Area Reliability Simulation (MARS) program 26 allows assessment of the reliability of a generation system comprised of any number of interconnected areas Modeling Technique A sequential Monte Carlo simulation forms the basis for MARS The Monte Carlo method allows for many different types of generation and demand-side options In the sequential Monte Carlo simulation chronological system histories are developed by combining randomly generated operating histories of the generating units with the inter-area transfer limits and the hourly chronological loads Consequently the system can be modeled in great detail with accurate recognition of random events such as equipment failures as well as deterministic rules and policies that govern system operation Reliability Indices The following reliability indices are available on both an isolated (zero ties between areas) and interconnected (using the input tie ratings between areas) basis
Daily Loss of Load Expectation (LOLE - daysyear)
Hourly LOLE (hoursyear)
Loss of Energy Expectation (LOEE -MWhyear)
Frequency of outage (outagesyear)
Duration of outage (hoursoutage)
Need for initiating Operating Procedures (daysyear or daysperiod)
The Working Group used both the daily LOLE and Operating Procedure indices for this analysis
The use of Monte Carlo simulation allows for the calculation of probability distributions in addition to expected values for all of the reliability indices These values can be calculated both with and without load forecast uncertainty The MARS program probabilistically models uncertainty in forecast load and generator unit availability The program calculates expected values of Loss of Load Expectation (LOLE) and can estimate each Areas expected exposure to their Emergency Operating Procedures Scenario analysis is used to study the impacts of extreme weather conditions variations in expected unit in-service dates overruns in planned scheduled maintenance or transmission limitations 26 See httpwwwgepowercomprod_servproductsutility_softwareenge_marshtm
NPCC CP-8 Working Group 35 RCC Approved ndash June 13 2012
APPENDIX C Resource Allocation Among Areas The first step in calculating the reliability indices is to compute the area margins on an isolated basis for each hour This is done by subtracting from the total available capacity in the area for the hour the load demand for the hour If an area has a positive or zero margin then it has sufficient capacity to meet its load If the area margin is negative the load exceeds the capacity available to serve it and the area is in a loss-of-load situation If there are any areas that have a negative margin after the isolated area margins have been adjusted for curtailable contracts the program will attempt to satisfy those deficiencies with capacity from areas that have positive margins Two methods are available for determining how the reserves from areas with excess capacity are allocated among the areas that are deficient In the first approach the user specifies the order in which an area with excess resources provides assistance to areas that are deficient The second method shares the available excess reserves among the deficient areas in proportion to the size of their shortfalls The user can also specify that areas within a pool will have priority over outside areas In this case an area must assist all deficient areas within the same pool regardless of the order of areas in the priority list before assisting areas outside of the pool Pool-sharing agreements can also be modeled in which pools provide assistance to other pools according to a specified order Generation MARS has the capability to model the following different types of resources
Thermal
Energy-limited
Cogeneration
Energy-storage
Demand-side management
An energy-limited unit can be modeled stochastically as a thermal unit with an energy probability distribution (Type 1 energy-limited unit) or deterministically as a load modifier (Type 2 energy-limited unit) Cogeneration units are modeled as thermal units with an associated hourly load demand Energy-storage and demand-side management impacts are modeled as load modifiers For each unit modeled the installation and retirement dates and planned maintenance requirements are specified Other data such as maximum rating available capacity states state transition rates and net modification of the hourly loads are input depending on the unit type The planned outages for all types of units in MARS can be specified by the user or automatically scheduled by the program on a weekly basis The program schedules planned maintenance to levelize reserves on either an area pool or system basis MARS also has the option of reading a maintenance schedule developed by a previous run and modifying it as specified by the user through any of the maintenance input data This schedule can then be saved for use by subsequent runs
NPCC CP-8 Working Group 36 RCC Approved ndash June 13 2012
APPENDIX C Thermal Unit In addition to the data described previously thermal units (including Type 1 energy-limited units and cogeneration) require data describing the available capacity states in which the unit can operate This is input by specifying the maximum rating of each unit and the rating of each capacity state as a per unit of the units maximum rating A maximum of eleven capacity states are allowed for each unit representing decreasing amounts of available capacity as governed by the outages of various unit components Because MARS is based on a sequential Monte Carlo simulation it uses state transition rates rather than state probabilities to describe the random forced outages of the thermal units State probabilities give the probability of a unit being in a given capacity state at any particular time and can be used if you assume that the units capacity state for a given hour is independent of its state at any other hour Sequential Monte Carlo simulation recognizes the fact that a units capacity state in a given hour is dependent on its state in previous hours and influences its state in future hours It thus requires the additional information that is contained in the transition rate data For each unit a transition rate matrix is input that shows the transition rates to go from each capacity state to each other capacity state The transition rate from state A to state B is defined as the number of transitions from A to B per unit of time in state A Number of Transitions from A to B TR (A to B) = _____________________________
Total Time in State A If detailed transition rate data for the units is not available MARS can approximate the transition rates from the partial forced outage rates and an assumed number of transitions between pairs of capacity states Transition rates calculated in this manner will give accurate results for LOLE and LOEE but it is important to remember that the assumed number of transitions between states will have an impact on the time-correlated indices such as frequency and duration Energy-Limited Units Type 1 energy-limited units are modeled as thermal units whose capacity is limited on a random basis for reasons other than the forced outages on the unit This unit type can be used to model a thermal unit whose operation may be restricted due to the unavailability of fuel or a hydro unit with limited water availability It can also be used to model technologies such as wind or solar the capacity may be available but the energy output is limited by weather conditions Type 2 energy-limited units are modeled as deterministic load modifiers They are typically used to model conventional hydro units for which the available water is assumed to be known with little or no uncertainty This type can also be used to model certain types of contracts A
NPCC CP-8 Working Group 37 RCC Approved ndash June 13 2012
APPENDIX C Type 2 energy-limited unit is described by specifying a maximum rating a minimum rating and a monthly available energy This data can be changed on a monthly basis The unit is scheduled on a monthly basis with the units minimum rating dispatched for all of the hours in the month The remaining capacity and energy can be scheduled in one of two ways In the first method it is scheduled deterministically so as to reduce the peak loads as much as possible In the second approach the peak-shaving portion of the unit is scheduled only in those hours in which the available thermal capacity is not sufficient to meet the load if there is sufficient thermal capacity the energy of the Type 2 energy-limited units will be saved for use in some future hour when it is needed Cogeneration MARS models cogeneration as a thermal unit with an associated load demand The difference between the units available capacity and its load requirements represents the amount of capacity that the unit can contribute to the system The load demand is input by specifying the hourly loads for a typical week (168 hourly loads for Monday through Sunday) This load profile can be changed on a monthly basis Two types of cogeneration are modeled in the program the difference being whether or not the system provides back-up generation when the unit is unable to meet its native load demand Energy-Storage and DSM Energy-storage units and demand-side management impacts are both modeled as deterministic load modifiers For each such unit the user specifies a net hourly load modification for a typical week which is subtracted from the hourly loads for the units area Transmission System The transmission system between interconnected areas is modeled through transfer limits on the interfaces between pairs of areas The transfer limits are specified for each direction of the interface and can be changed on a monthly basis Random forced outages on the interfaces are modeled in the same manner as the outages on thermal units through the use of state transition rates Contracts Contracts are used to model scheduled interchanges of capacity between areas in the system These interchanges are separate from those that are scheduled by the program as one area with excess capacity in a given hour provides emergency assistance to a deficient area Each contract can be identified as either firm or curtailable Firm contracts will be scheduled regardless of whether or not the sending area has sufficient resources on an isolated basis but they will be curtailed because of interface transfer limits Curtailable contracts will be scheduled only to the extent that the sending Area has the necessary resources on its own or can obtain them as emergency assistance from other areas
CP-8_Winter_2012_13_Multi-Area_Probabilistic_Assessment_Executive Summary to Place in CO-12_2012-2013Wpdf
EXECUTIVE SUMMARY 4
INTRODUCTION 8
MODEL ASSUMPTIONS 9
WINTER 201112 SUMMARY 19
ANALYSIS 22
A) OBJECTIVE AND SCOPE OF WORK 31
B) EXPECTED NEED FOR OPERATING PROCEDURES 32
C) MULTI-AREA RELIABILITY SIMULATION PROGRAM DESCRIPTION 34