84
a resource mobilisation strategy for unrwa 2012-2015
a resource mobilisationstrategy for unrwa
2012-2015

a resource mobilisation strategy forunrwa2012-2015

contentsExecutive summary
IntroductionOrigins of this resource mobilisation strategyAbout this document
1. Situation analysis1.1 Global context1.2 Drivers of the funding requirements for unrwa1.3 The reforming context of unrwa1.4 Organisational change within resource mobilisation1.5 Trends in the donor dependency of UNRWA1.6 Successes in fundraising
2. A review of trends in sources of funding2.1 Trends in ODA and humanitarian assistance2.2 Summary of the key findings from Annexes E, F and G2.3 Private sources
3. Funding needs3.1 Consolidation of needs and budgets3.2 Conclusion
4. Opportunities, risks and contingency analysis4.1 Importance of evaluating opportunities and risks4.2 High-level opportunities and risks
5. Resource mobilisation strategy5.1 Resource mobilisation priorities5.2 Funding targets by donor category5.3 Base-case funding projections for 2012-155.4 Strategic framework
6. Implementing the resource mobilisation strategy6.1 Where does “resource mobilisation’” take place within UNRWA?6.2 High-level work plan requirements6.3 Resourcing the strategy6.4 Monitoring the strategy
Annexes
1
222
3335556
7778
899
101010
1212121214
1818191920
22
A RESOURCE MOBILISATION STRATEGY FOR UNRWA (2012-2015), NOVEMBER 20121
Executive summaryThis resource mobilisation strategy sets out how UNRWA can raise the resources needed for delivering on its obligations to Palestine refugees.
The strategy is based on strengthening capabilities toward external partners, delivered through improved internal capacity. Three high-level strategic objectives have been set: to deepen the partnership with traditional donors; to diversify the donor base; and to develop improved cross-Agency capacity to mobilise resources.
Resource mobilisation is an activity that implicates all of UNRWA, and the successful implementation of this strategy will require improvements to capacity throughout the organisation, and continued and strengthened partnerships beyond.
A unique UN agencyUNRWA is the largest United Nations programme in the Middle East, providing assistance and protection to a population of nearly five million registered Palestine refugees in Jordan, Lebanon, Syria, and the occupied Palestinian territory (oPt). Unlike other United Nations organisations that work through local authorities or executing agencies, UNRWA provides its services directly to Palestine refugees, plans and carries out its own activities and projects, and builds and administers facilities such as schools and clinics in collaboration with governmental authorities in the areas of operation.
The partnership between UNRWA, donors and host authorities has successfully ensured basic health and literacy that compares favourably with other countries in the region, despite very challenging operating conditions.
Meeting international obligationsResolution 302 (IV) of December 1949, most recently renewed in resolution 65/100 of 10 December 2010, defines UNRWA’s mandate and sets the obligation of the international community. The costs of delivering on the mandate have increased at a rate higher than the financial contributions received; a rising refugee population and needs exacerbated by crises has left UNRWA chronically under-funded.
The Agency is and will remain highly dependent on a core group of donors contributing funding consistent with the obligations of the international community.
Efforts to broaden the donor base have been successful but have been addressed in earnest only in recent years.
The establishment in 2006 of a specialised unit has resulted in an increased share of the regular budget being borne by Arab donors and the Agency has made some initial progress in building relationships with donors in non-traditional and emerging markets.
OutlookThe funding outlook is at best uncertain. Many traditional donor economies are implementing austerity plans to reduce public spending, including international aid.
In order to sustain its operations over time, UNRWA needs to increase revenue by at least three per cent annually over the next four years; and is very likely to need continued funding for reconstruction and other projects to address consequences of the crises.
2A RESOURCE MOBILISATION STRATEGY FOR UNRWA (2012-2015), NOVEMBER 2012
INTRODUCTION WHY MOBILISE RESOURCES?UNRWA has provided essential services to Palestine refugees in Jordan, Lebanon, Syria, and the oPt since starting operations in 1950 under the mandate of UN General Assembly resolution 302 (IV). The stated mission of the Agency is to “help Palestine refugees achieve their full potential in human development under the difficult circumstances in which they live”. UNRWA implements its mandate through direct delivery of education, health, relief, and microfinance services to refugees registered with UNRWA. At the heart of UNRWA’s resource mobilisation strategy lies the deep-seated realisation that to achieve our historic responsibilities to the Palestine refugees and to the international community, the Agency must and will forge a new and creative paradigm to address its long-term funding aspirations.
Despite generous support from the international community and host countries, a number of external factors continue to present a challenge for UNRWA in meeting funding requirements for UNRWA’s core budget, the General Fund. For historical reasons, this “temporary” agency is almost entirely dependent on voluntary contributions. Changes in global economic dynamics can therefore have a direct impact on funding toward UNRWA, both in terms of the
General Fund as well as emergency appeals and project financing. More than 95 per cent of contributions come from a small group of traditional donors. The present economic crisis has had a direct impact on funding in general as a result of many donors facing financial restraints and some traditional donors have reduced their contributions to UNRWA. Apart from economic uncertainty, volatility in the region has in the past few years affected UNRWA operations in four out of five fields. The implication of the “Arab Spring’” on operations remains to be known. Demand for UNRWA services has also grown, corresponding to the steady increase of UNRWA beneficiaries, with 5.1 million refugees registered in January 2012.
The challenge ahead is sobering. In order to sustain its operations over the next four years, UNRWA must increase revenue by three per cent annually. This strategic document addresses that urgent imperative through a rigorous dissection of the markets, detailed analysis of the opportunities and forward-looking identification of resource mobilisation priorities.
Origins of this resource mobilisation strategyIn recognition of the challenges faced by the Agency, and with continued resolve to fulfil its mandate to the Palestine refugees, UNRWA embarked on an organisational development process in 2006 that was to last three years and resulted in, among other things, the Agency’s Medium Term Strategy. This process has since been renewed in the Sustaining Change initiative in which focus shifted from management to ensuring quality in programme activities. Both the Medium Term Strategy and Sustaining Change recognise the need for UNRWA to develop a resource mobilisation strategy in order to support its services.
The development of the vision contained in this document has been long and inclusive. The external relations and communications department (ERCD) held preliminary consultations with donors
and hosts in March and April 2011 in order to set the scope for the next four years, and worked to build a strategy outline, which was discussed at the Sub-Committee and later endorsed in June by the Advisory Commission (Ad Com). In order to benefit from the experience of sister UN agencies and to learn from best practices in resource mobilisation, ERCD visited various agencies in Geneva in July 2011. External support was sought for the analytical research and background to the strategy, and a consultant was selected to support the internal and external reviews, and to draft this document. Extensive internal consultations took place in September and early October 2011, including a resource mobilisation workshop, followed by a fresh round of consultations with external stakeholders.
ABOUT THIS DOCUMENTThis resource mobilisation strategy document is relatively brief, but it is both conceptual and practical. Extensive supporting analysis and facts may be found in the accompanying annexes. The strategy makes a vital link between external funding challenges and the continued internal improvements necessary to achieve the objectives, many of which build on work already underway. The required activities to deliver these objectives have been structured into a series of logical frameworks. These will form the bases of the annual work-plans for each division in ERCD, providing coherence and vision over the next four years.
A RESOURCE MOBILISATION STRATEGY FOR UNRWA (2012-2015), NOVEMBER 20123
1.1 Global contextThe resource mobilisation strategy, outlined in the spring and finalised in the autumn of 2011, was formulated at a time of significant uncertainty within the global economy: the sovereign debt crisis in Europe and political turmoil in the US in relation to the national debt ceiling indicate the poor state of public finances in many of UNRWA’s traditional donor countries and has resulted in unforeseen cuts in funding. The “Arab Spring” of political change in several Arab countries also changes the outlook for UNRWA in an as yet uncertain way; in the short term it has reduced available funding (as a result of cancelled pledges) and put increased pressure on services within some of the fields, but may yet attract additional funding into the region.
1.1.1 A mixed outlook for the Global economyAccording to the latest analysis published by the Organisation for Economic Cooperation and Development (OECD) in September 2011, economic recovery appears to have come close to a halt in major industrialised economies, with decreasing household and business confidence affecting both world trade and employment. Growth remains strong in most emerging economies, albeit at a more moderate pace.
Economic growth in the G7 economies (excluding Japan) will remain at an annual rate of less than 1 per cent in the second half of 2011. The United States is set to grow in the range of 0.5 percent to 1 per cent: a sharp fall from the previous decade of growth.
The impact of the sovereign debt woes in Europe and the United States and the associated turbulence in stock markets over the summer of 2011 have not yet been fully incorporated into projections, but certainly add to the uncertainty.
The risk of more negative growth going forward has become higher in some major OECD economies, but a downturn of the magnitude of 2008/09 is not foreseen.
Emerging markets continue to achieve higher levels of growth, but are not immune to the slowdown in the rest of the world. Concerns are also being raised about the sustainability of growth within the BRICS countries (Brazil, Russia India, China and South Africa) and the risk is that an asset price bubble may yet provoke an emerging market crisis.
Nevertheless, economic observers continue to project an increased role of emerging markets in driving growth: according to the Conference Board, advanced economies as a group will account for less than 1 per cent of global growth from 2010-2020; 3.4 per centpoints will come from emerging economies. China and India together will account for half of global growth from 2010 to 2020.
1.1.2 Consequences for ODA among OECD DAC countriesThe OECD Development Assistance Committee (DAC) published the latest of its surveys on donor spending plans in September 2011, covering forward planning of contributions to 2013. The outlook is not positive, even if overall contributions are expected to increase. In the last three years,global country programmable aid (CPA – a subset of ODA which excludes non-programmable items such as humanitarian aid, debt relief, and in-donor costs such as administration) increased by an average of 8 per cent a year in real terms: this growth is expected to fall to 2 per cent a year. For bilateral aid from DAC countries alone, the projected increase is set to slow to a slightly lower figure of 1.3 per cent per year.
1.2 Drivers of the funding requirements for UNRWAThe fulfillment of UNRWA’s mandate implies an obligation to meet the costs of providing for the wellbeing and protection of Palestine refugees. Irrespective of the economic crisis, the international community has an obligation to ensure its continued commitment.
In 2010, the total level of contributions for all funding portals reached USD 840 million: an increase of 150 per cent over the figure of 2000 (or an equivalent compound annual growth of 9.6 per cent). The regular budget doubled over the ten-year period, increasing by USD 275 million.
This growth has been driven by a number of factors, mostly beyond the control of the Agency: increases in the overall refugee population (average annual increase of 3.4 per cent compound in the last 10 years); inflation (which has averaged in excess of 5 per cent annually); statutory wage increases (UNRWA’s wage bill is indexed to wage rates applied by host governments); and increased numbers of refugees having recourse to UNRWA services as a result of the hardship caused by the blockade of Gaza and Israeli practices in the West Bank, including house demolitions and farmers being removed from their lands in addition to the substantially increased costs to the Agency of Israeli security procedures in relation to goods being shipped into Gaza from Israel. In the Gaza Strip alone, the Agency has been forced to palletise goods for import to Gaza through the Kerem Shalom, the only crossing in regular operation. The additional costs associated with the storage, demurrage, transportation and palletisation of goods exceeded USD 2.3 million in the first six months of 2011 alone (not including staff days lost due to closures and other restrictions). In addition, the Agency has been compelled to seek an additional USD 1.3 million per year from donors in order to comply with the requirements for Israeli approval of UNRWA/UN construction projects and the associated import of construction materials. This diverts much needed funding from the Agency’s core operations.
1. SITUATION ANALYSIS
4A RESOURCE MOBILISATION STRATEGY FOR UNRWA (2012-2015), NOVEMBER 2012
The Emergency Appeal and the Project budget also grew, but were subject to higher variability in spending as a function of the funds available. Major emergencies, such as the 2008-9 Gaza war and the
subsequent and ongoing blockade and the destruction of Nahr el-Bared camp in Lebanon in 2007 caused exceptional increases to UNRWA requirements.
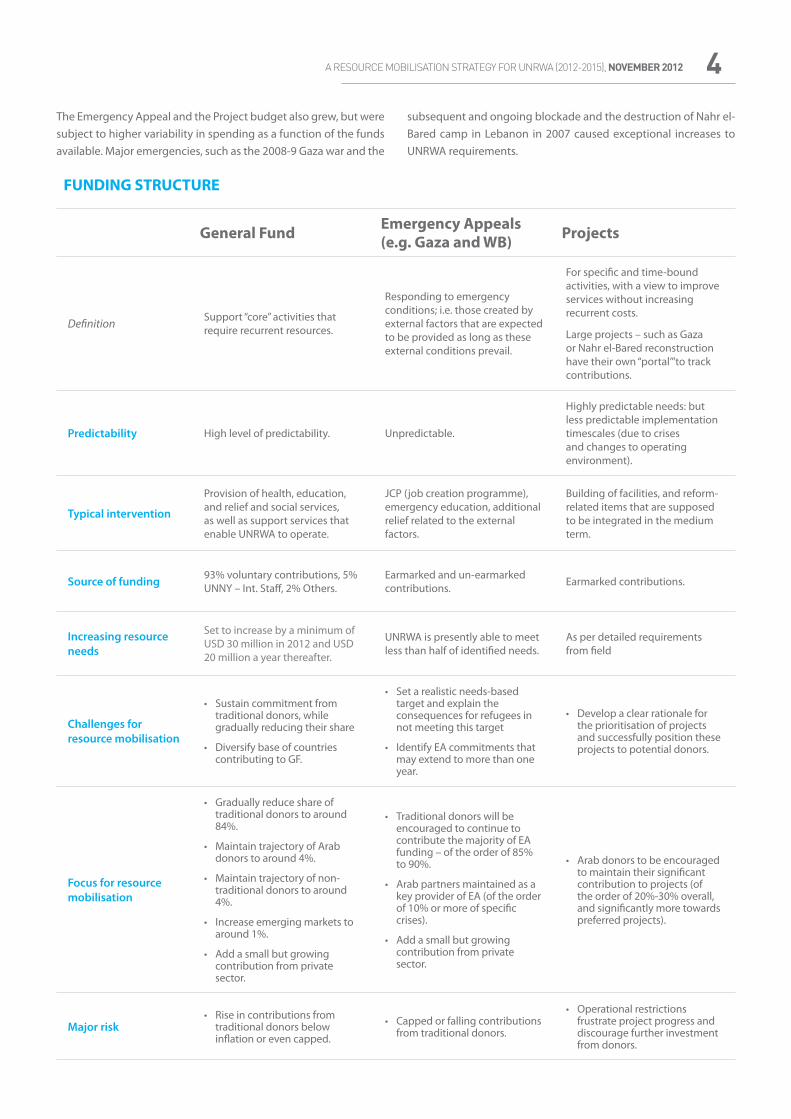
FUNDING STRUCTURE
General Fund Emergency Appeals (e.g. Gaza and WB) Projects
Definition Support “core” activities that require recurrent resources.
Responding to emergency conditions; i.e. those created by external factors that are expected to be provided as long as these external conditions prevail.
For specific and time-bound activities, with a view to improve services without increasing recurrent costs.
Large projects – such as Gaza or Nahr el-Bared reconstruction have their own “portal’”to track contributions.
Predictability High level of predictability. Unpredictable.
Highly predictable needs: but less predictable implementation timescales (due to crises and changes to operating environment).
Typical intervention
Provision of health, education, and relief and social services, as well as support services that enable UNRWA to operate.
JCP (job creation programme), emergency education, additional relief related to the external factors.
Building of facilities, and reform-related items that are supposed to be integrated in the medium term.
Source of funding 93% voluntary contributions, 5% UNNY – Int. Staff, 2% Others.
Earmarked and un-earmarked contributions. Earmarked contributions.
Increasing resource needs
Set to increase by a minimum of USD 30 million in 2012 and USD 20 million a year thereafter.
UNRWA is presently able to meet less than half of identified needs.
As per detailed requirements from field
Challenges for resource mobilisation
• Sustain commitment from traditional donors, while gradually reducing their share
• Diversify base of countries contributing to GF.
• Set a realistic needs-based target and explain the consequences for refugees in not meeting this target
• Identify EA commitments that may extend to more than one year.
• Develop a clear rationale for the prioritisation of projects and successfully position these projects to potential donors.
Focus for resource mobilisation
• Gradually reduce share of traditional donors to around 84%.
• Maintain trajectory of Arab donors to around 4%.
• Maintain trajectory of non-traditional donors to around 4%.
• Increase emerging markets to around 1%.
• Add a small but growing contribution from private sector.
• Traditional donors will be encouraged to continue to contribute the majority of EA funding – of the order of 85% to 90%.
• Arab partners maintained as a key provider of EA (of the order of 10% or more of specific crises).
• Add a small but growing contribution from private sector.
• Arab donors to be encouraged to maintain their significant contribution to projects (of the order of 20%-30% overall, and significantly more towards preferred projects).
Major risk• Rise in contributions from
traditional donors below inflation or even capped.
• Capped or falling contributions from traditional donors.
• Operational restrictions frustrate project progress and discourage further investment from donors.
A RESOURCE MOBILISATION STRATEGY FOR UNRWA (2012-2015), NOVEMBER 20125
1.3 The reforming context of UNRWAThis resource mobilisation strategy is consistent with a continued focus on organisational improvement within UNRWA that can trace its origins to the Geneva Conference of 2004 and the consequent production of the first Medium Term Plan (MTP) for 2005-2009, which constituted a major step forward in how UNRWA plans and tracks its progress against objectives.
The organisational development initiative built on this momentum through:• the decentralisation of functions and processes;
• the introduction of strategic-planning processes and programme-cycle management;
• the re-engineering of key processes to increase efficiency in program delivery.
• In terms of reporting and financial management UNRWA has made considerable progress over the last couple of years:
• Since 2010 UNRWA has been one of the very few UN entities to conduct a monthly hard close of the General Ledger. The General Fund (GF) is fully accrued. UNRWA is now able to provide a monthly reporting of expenditures, and current and projected funding needs.
• Work on closing expired projects and rationalising the list of projects has helped to improve transparency and to ease management accounting for projects, even if major challenges remain.
• UNRWA is also ahead of many UN Agencies in its switch to international public sector accounting standards (IPSAS), which should be implemented from 1 January 2012.
1.4 Organisational change within resource mobilisationUNRWA’s central objective for its resource mobilisation, announced in the Medium Term Strategy (MTS), is to bridge the funding gaps in the GF, emergency and projects budgets, through more predictable and sustainable funding flows. Special attention is to be given to the GF given its importance to UNRWA’s core operations. The MTS also emphasises that stronger internal capacity to lead resource mobilisation will be needed.
With the Sustaining Change initiative in 2009, UNRWA renewed its commitment to develop its resource mobilisation capacity in a number of key areas including:
• Merging the department of external relations with the HQ public information office to create the department of external relations and communications (ERCD);
• Developing a partnership strategy and establishing a partnerships division within ERCD;
• Establishing a new representative office in Washington; and
• Strengthening the existing representative office in Brussels.
1.5 Trends in the donor dependency of UNRWA 1.5.1 Total contributionsTraditional donors, defined as OECD/DAC members that were also members of the AdCom in 2009, dominate total contributions to UNRWA. In 2010, 88 per cent of all funding came from this grouping of countries – in particular the US, the European Commission and some European Union Member States (such as Sweden, UK and the Netherlands). The two largest donors accounted for over 49 per cent of contributions - a share which has slightly risen over the last ten years. Nevertheless, the trend is gently and consistently on the decline toward lower dependency on traditional donors (in the year 2000, traditional donors accounted for 92 per cent of all contributions)1.
This fall is due to an increased share in contributions from two groups: Arab donors who have given generously toward projects and the “non-traditional’” donor group (which includes established Western donors such as Luxembourg and Austria who were not members of the AdCom in 2009) which have consistently increased their share from 1.6 per cent of the total in 2000 to around 3 per cent today.
Arab donors have preferred to allocate their contributions in response to emergencies, and therefore their share has varied between 2 per cent and 12 per cent of total contributions. However, the trend of giving from Arab donors, whether in relation to their relatively modest contribution to the General Fund (GF), or toward emergency appeals (EA) and projects is on the increase. Arab donors have shown their most consistent and sustained level of contributions toward projects (including the Lebanon crisis) and in 2010 contributed 20 per cent of project funding (34 per cent in 2009).
In assessing overall Arab contributions to UNRWA, it is also important to acknowledge the central role of host authorities, including the PLO/PA. The responsibility to assist refugees lies with the international community through UNRWA. Host countries have, in parallel, played a key role in supporting refugees by hosting them amidst their own communities. That has also meant allocating substantial resources in complementing and supporting UNRWA services.
1.5.2 General FundThe GF is the lifeblood of UNRWA. It pays for the ongoing commitment of UNRWA in conducting its mandate within the five field operations and in providing management and administrative support. Ensuring sustained and predictable funding to the GF is the priority for resource mobilisation within UNRWA.
In nominal terms, GF income doubled in the period 2000-20102, reflecting demographic trends and inflationary pressures in UNRWA’s areas of operation. The average growth rate over the ten-year period was equivalent to an annual rate of 7.2 per cent compound.
6A RESOURCE MOBILISATION STRATEGY FOR UNRWA (2012-2015), NOVEMBER 2012
The GF is more dependent on traditional donors: 90 per cent of the GF came from this group in 2010, a share which has fallen only marginally over the last ten years (in 2000 it was 92 per cent). Most of the reduced dependency on traditional donors is due to the rise in the ‘non traditional’ group. Arab partners have maintained a relatively consistent share (2-3 per cent). Meanwhile, the emerging markets group, notwithstanding its recent increase in contributions toward the GF, still represents a very small proportion of funding.
1.5.3 Traditional donor perceptions of UNRWA3
Following interviews with a sample of representatives from donor countries in September 2011, a number of concerns were raised in relation to UNRWA’s ability to successfully reach its resource mobilisation targets.
• Public sector funding pressure: Increasing contributions from traditional donors will require an equivalent obligation on the part of UNRWA to show efficiency as well as progress in diversifying its donor base.
• Budgeting transparency: Traditional donors would like to a clearer view and predictability in terms of total funding needs. It is also of concern that emergency appeals funding covers issues which are multi-year in nature, and may be a source of risk if this form of funding was not to be renewed.
• Capacity for resource mobilisation: Traditional donors would like to see progress made in how UNRWA structures its RM efforts, and how it approaches partnerships.
By formalising UNRWA’s resource mobilisation objectives and providing greater clarity on how the Agency intends to achieve them, this strategy should provide an answer to these concerns.
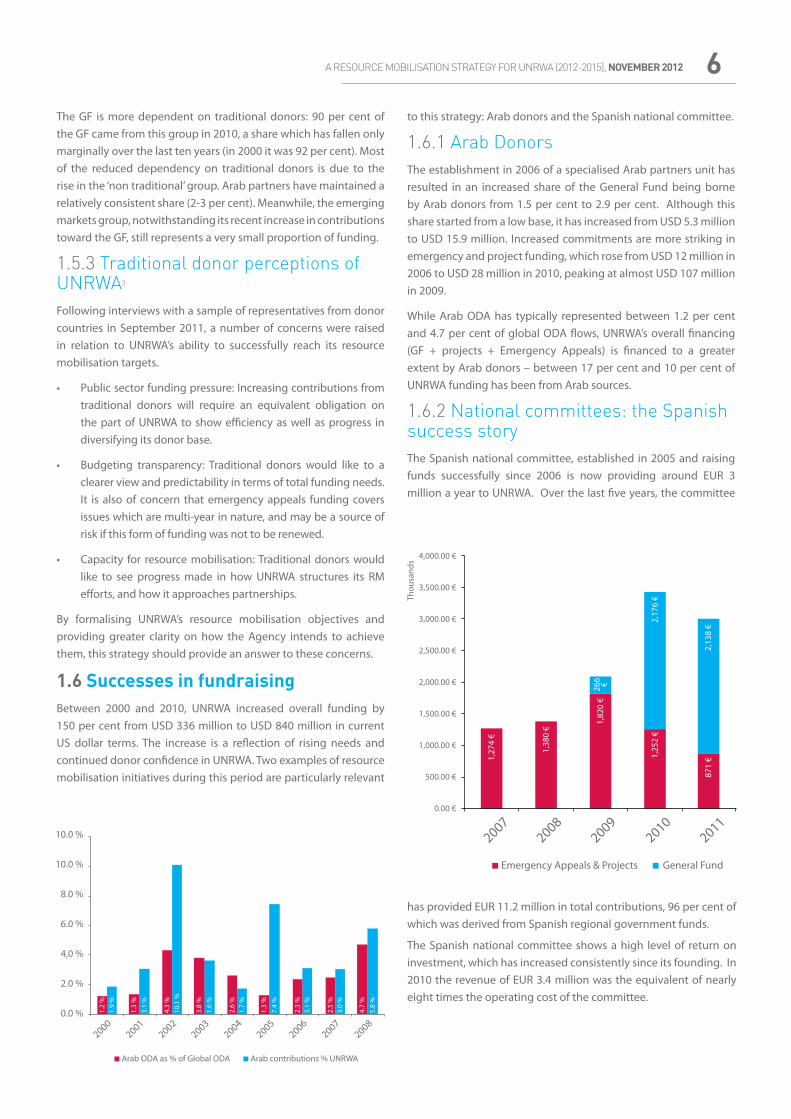
1.6 Successes in fundraisingBetween 2000 and 2010, UNRWA increased overall funding by 150 per cent from USD 336 million to USD 840 million in current US dollar terms. The increase is a reflection of rising needs and continued donor confidence in UNRWA. Two examples of resource mobilisation initiatives during this period are particularly relevant
to this strategy: Arab donors and the Spanish national committee.
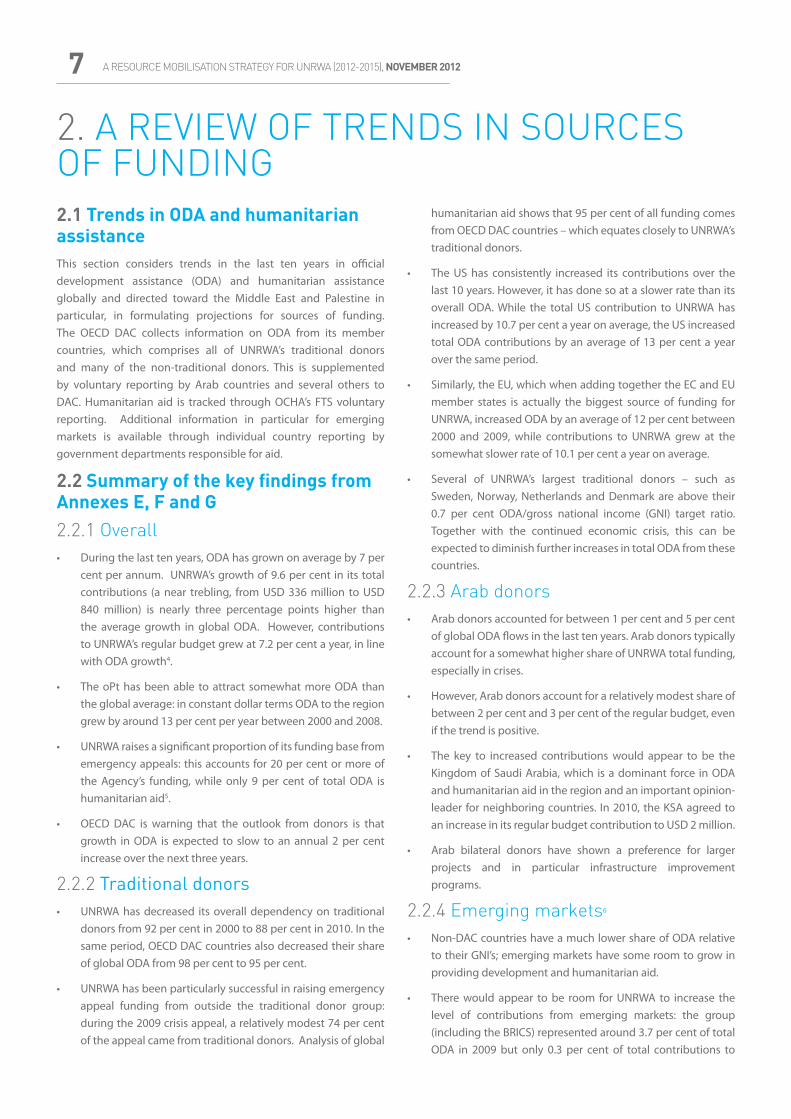
1.6.1 Arab DonorsThe establishment in 2006 of a specialised Arab partners unit has resulted in an increased share of the General Fund being borne by Arab donors from 1.5 per cent to 2.9 per cent. Although this share started from a low base, it has increased from USD 5.3 million to USD 15.9 million. Increased commitments are more striking in emergency and project funding, which rose from USD 12 million in 2006 to USD 28 million in 2010, peaking at almost USD 107 million in 2009.
While Arab ODA has typically represented between 1.2 per cent and 4.7 per cent of global ODA flows, UNRWA’s overall financing (GF + projects + Emergency Appeals) is financed to a greater extent by Arab donors – between 17 per cent and 10 per cent of UNRWA funding has been from Arab sources.
1.6.2 National committees: the Spanish success storyThe Spanish national committee, established in 2005 and raising funds successfully since 2006 is now providing around EUR 3 million a year to UNRWA. Over the last five years, the committee
has provided EUR 11.2 million in total contributions, 96 per cent of which was derived from Spanish regional government funds.
The Spanish national committee shows a high level of return on investment, which has increased consistently since its founding. In 2010 the revenue of EUR 3.4 million was the equivalent of nearly eight times the operating cost of the committee.
A RESOURCE MOBILISATION STRATEGY FOR UNRWA (2012-2015), NOVEMBER 20127
2.1 Trends in ODA and humanitarian assistanceThis section considers trends in the last ten years in official development assistance (ODA) and humanitarian assistance globally and directed toward the Middle East and Palestine in particular, in formulating projections for sources of funding. The OECD DAC collects information on ODA from its member countries, which comprises all of UNRWA’s traditional donors and many of the non-traditional donors. This is supplemented by voluntary reporting by Arab countries and several others to DAC. Humanitarian aid is tracked through OCHA’s FTS voluntary reporting. Additional information in particular for emerging markets is available through individual country reporting by government departments responsible for aid.
2.2 Summary of the key findings from Annexes E, F and G2.2.1 Overall• During the last ten years, ODA has grown on average by 7 per
cent per annum. UNRWA’s growth of 9.6 per cent in its total contributions (a near trebling, from USD 336 million to USD 840 million) is nearly three percentage points higher than the average growth in global ODA. However, contributions to UNRWA’s regular budget grew at 7.2 per cent a year, in line with ODA growth4.
• The oPt has been able to attract somewhat more ODA than the global average: in constant dollar terms ODA to the region grew by around 13 per cent per year between 2000 and 2008.
• UNRWA raises a significant proportion of its funding base from emergency appeals: this accounts for 20 per cent or more of the Agency’s funding, while only 9 per cent of total ODA is humanitarian aid5.
• OECD DAC is warning that the outlook from donors is that growth in ODA is expected to slow to an annual 2 per cent increase over the next three years.
2.2.2 Traditional donors• UNRWA has decreased its overall dependency on traditional
donors from 92 per cent in 2000 to 88 per cent in 2010. In the same period, OECD DAC countries also decreased their share of global ODA from 98 per cent to 95 per cent.
• UNRWA has been particularly successful in raising emergency appeal funding from outside the traditional donor group: during the 2009 crisis appeal, a relatively modest 74 per cent of the appeal came from traditional donors. Analysis of global
humanitarian aid shows that 95 per cent of all funding comes from OECD DAC countries – which equates closely to UNRWA’s traditional donors.
• The US has consistently increased its contributions over the last 10 years. However, it has done so at a slower rate than its overall ODA. While the total US contribution to UNRWA has increased by 10.7 per cent a year on average, the US increased total ODA contributions by an average of 13 per cent a year over the same period.
• Similarly, the EU, which when adding together the EC and EU member states is actually the biggest source of funding for UNRWA, increased ODA by an average of 12 per cent between 2000 and 2009, while contributions to UNRWA grew at the somewhat slower rate of 10.1 per cent a year on average.
• Several of UNRWA’s largest traditional donors – such as Sweden, Norway, Netherlands and Denmark are above their 0.7 per cent ODA/gross national income (GNI) target ratio. Together with the continued economic crisis, this can be expected to diminish further increases in total ODA from these countries.
2.2.3 Arab donors• Arab donors accounted for between 1 per cent and 5 per cent
of global ODA flows in the last ten years. Arab donors typically account for a somewhat higher share of UNRWA total funding, especially in crises.
• However, Arab donors account for a relatively modest share of between 2 per cent and 3 per cent of the regular budget, even if the trend is positive.
• The key to increased contributions would appear to be the Kingdom of Saudi Arabia, which is a dominant force in ODA and humanitarian aid in the region and an important opinion-leader for neighboring countries. In 2010, the KSA agreed to an increase in its regular budget contribution to USD 2 million.
• Arab bilateral donors have shown a preference for larger projects and in particular infrastructure improvement programs.
2.2.4 Emerging markets6
• Non-DAC countries have a much lower share of ODA relative to their GNI’s; emerging markets have some room to grow in providing development and humanitarian aid.
• There would appear to be room for UNRWA to increase the level of contributions from emerging markets: the group (including the BRICS) represented around 3.7 per cent of total ODA in 2009 but only 0.3 per cent of total contributions to
2. A REVIEW OF TRENDS IN SOURCES OF FUNDING
8A RESOURCE MOBILISATION STRATEGY FOR UNRWA (2012-2015), NOVEMBER 2012
UNRWA (see Annex G).
• While data on the recipients of emerging market ODA remains challenging to obtain, it is known that these countries do have a propensity to give to the UN system: typically between 30 per cent and 50 percent of humanitarian aid from non-DAC countries goes to the UN system. There is no particular reason why UNRWA could not be a bigger beneficiary of emerging market ODA.
• In terms of humanitarian aid, the emerging markets represented 1.2 per cent of global humanitarian aid in 2010, whereas UNRWA received no funding for its emergency programme from these countries.
2.2.5 Non-traditional donors• Western countries, such as New Zealand, Austria and
Luxembourg, have consistently grown their share of total contributions through donations to the GF. They have not contributed significantly to the the Agency.
• Luxembourg, one of the major contributors in this group and a donor that qualifies for membership in the AdCom, is already above its target ODA/GNI ratio and could be subject to limitations in ODA growth as a whole.This group also includes countries that have recently become EU Member States and several others that have not yet been consistently researched by UNRWA.
2.3 Private sourcesUNRWA is a reflection of the commitment of the international community to support Palestine refugees until a just and durable solution to their plight has been found. The Agency has
overwhelmingly relied on official donors to sustain its operations.
UNRWA has done very little to effectively target private sources of income, and most of what has been achieved has been opportunistic. The Agency aims to improve this situation by investing in private fundraising, and anticipates that income from this sector will represent a modest but significant supplement to its overall resources, while it will continue to rely on government funding from new and traditional donors.
A study of other UN Agencies7 shows that private sector sources of funding are increasingly important to the work of multilateral agencies. However, developing a significant presence among private donors requires substantial investments in relevant skills and resources.
Following are some of the findings of the review:
• Pledge giving, both online and off-line, whereby private individuals agree to make regular contributions, is the priority for several UN agencies, who have found this to be a successful and low-cost way of fundraising from the public.
• Corporations and foundations would need to be targeted on a very selective basis – a particular challenge will be to direct donations toward complementing and enhancing core services rather than create specific projects.
• High net-worth individuals (HNWIs) are a significant source of potential income and therefore any investment in private sector fundraising should consider how to identify and target individuals.
3. FUNDING NEEDSCommitments and positive results
UNRWA mobilises resources to deliver on its mandate for Palestine refugees: advocating and providing for their human development and humanitarian needs. Historically, UNRWA has had to address the deficit between the cost of covering those needs and what has been feasible to finance. Although the Agency has had to prioritise, it can nevertheless show some successful outcomes, irrespective of the on-going deficit. Some examples include:
• According to the World Bank8, the oPt has been a “stellar performer” with respect to achievements in human development. UNRWA is responsible for a significant part of achieving this accolade.
• Several indicators show how the oPt has accomplished and maintained standards above comparable benchmark countries and regions: within UNRWA’s two key human development goals (in education and health care), the region has a significantly higher adult literacy rate and lower infant
mortality rate than comparable regions (in income terms) and even in relation to the global average.
• The analysis of the 2003 and 2007 TIMSS9 student achievement results shows better academic results of UNRWA students as compared to host government schools in the oPt.
• A study commissioned by DFID in the West Bank in September 2011 underlines the relative success in education achieved by UNRWA primary schools. In standardised tests, UNRWA schools scored better than their PA counterparts, while also managing to reduce unit staffing costs.
Outside oPt:• UNRWA’s students in Syria regularly score better on the
preparatory school national exam than their host government school counterparts.
• In the 2009 PISA10 results UNRWA students in Jordan fared better than their government school counterparts .
A RESOURCE MOBILISATION STRATEGY FOR UNRWA (2012-2015), NOVEMBER 20129
3.1 Consolidation of needs and budgets3.1.1 GF funding needsThe GF is subject to detailed and rigorous budgeting: within the priorities established under the MTS each field assesses its needs and projections are made based on an established set of cost drivers (principally the population covered by UNRWA’s education and primary medical services) and expected unit costs (staff costs and materials).
The ‘Blue Book’ publishes this needs-based assessment for each biennium, setting the expected level of fundraising. Consistent with the MTS, UNRWA projects general funding needs according to four human development goals, governance and other costs11 (for more details, see graphs and analysis in Appendix B).
• Consistent with UNRWA’s mandate and priorities, educational related objectives under the human development goal ‘Acquired Knowledge and Skills’ account for at least 50 per cent of GF funding needs.
• This needs-based projection of GF estimates a 5 per cent increase in 2012 (an additional USD 30 million) and 3 per cent in 2013 (an additional USD 20 million). Structurally, costs increase at least USD20 million per annum.
3.1.2 Other funding needsIn addition to the GF, UNRWA raises humanitarian funding through the Emergency Appeal and project financing.
• The Emergency Appeal is a bottom-up exercise in which the fields calculate the required funding to address critical and immediate needs. For 2011 it is projected that less than 50 per cent of these requirements will be met which will once again leave critical shortages unaddressed12.
• Projects budgets are estimated by the field and funded according to donor acceptance of a proposal.
3.1.3 Consolidation of needs: two scenariosThe consolidated needs to 2015 are subject to two key uncertainties:
1. The resolution of existing crises within the region, or the outbreak of new emergencies resulting in a direct worsening of conditions for refugees or increased pressure on UNRWA’s services within the fields of operation.
2. Restrictions on the operational conduct of existing projects affecting the timing of work and expenditures - for instance, access to Gaza and operating conditions for Nahr al-Bared camp reconstruction.
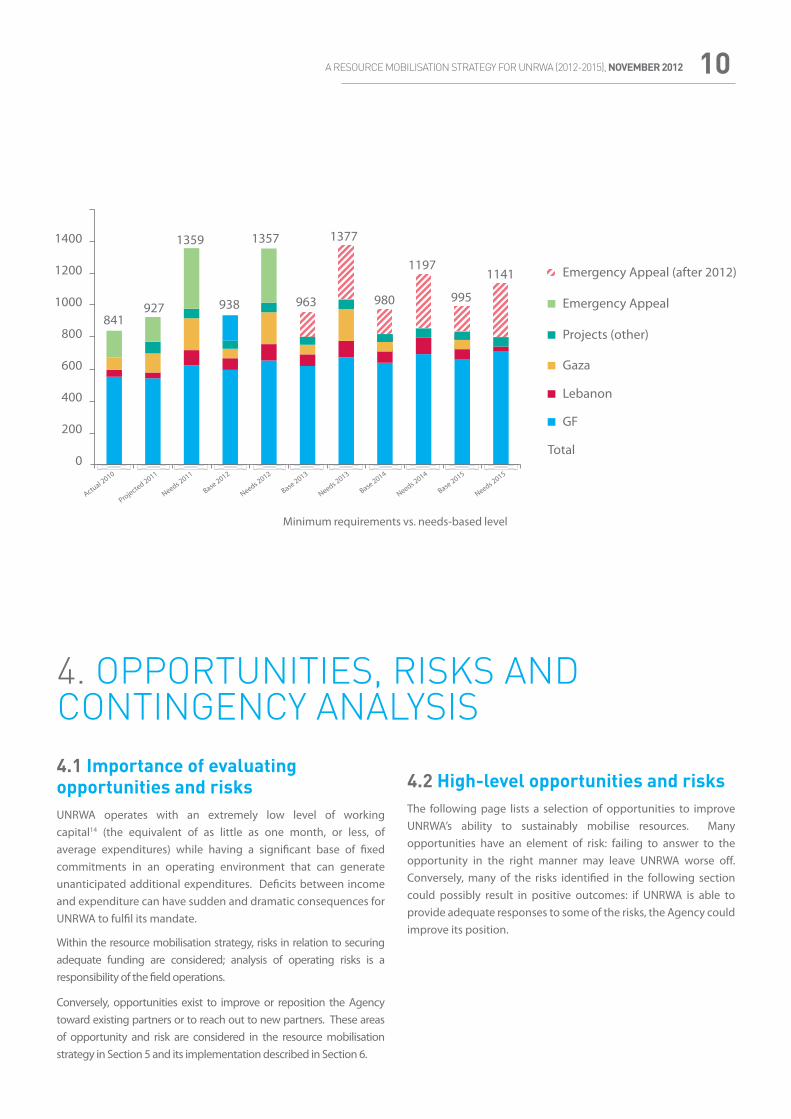
Furthermore, projections are considered on two fundraising scenarios: one which is based on the Agency’s needs; and one based on the requirements to sustain present levels of operations only.
Needs-based level: The GF is increased to the 2011 needs-based
level, then increased for projected operating cost increases in 2012 to 2015. Humanitarian needs will depend on a range of contextual factors and are impossible to predict several years in advance. So for 2013 and beyond, the 2012 Emergency Appeal level has been taken as a constant. The needs-based level further presupposes that the two large reconstruction programs, Gaza and NBC, can be finalised within the next two and three years respectively. In such a scenario the Agency’s resource requirement would peak in 2013 at some USD 1.37 billion. In 2015, requirements have declined to USD 1.14 billion reflecting the completion of large reconstruction projects.
• It should be noted that not even this needs-based level captures all implementation costs of the MTS. UNRWA estimates that the full implementation of the MTS would require close to USD 1.2 billion in recurrent costs and an additional one-time investments in excess of USD 800 million13.
Minimum requirement level: Only the very basic needs of the refugees are covered. The GF is considered at the 2011 level and is augmented for structural cost increases only. Under this base scenario, the amount of emergency assistance is projected at the 2011 likely outcome level which meets less than half of the needs identified in the appeal. For the larger reconstruction programmes, a more realistic figure of the last three-year average has been chosen, which substantially increases the implementation period.
• Taken together, this will lead to a steady increase in funding requirements to USD 995 million in 2015 just in order to maintain services at the present level.
• The two scenarios are illustrated in the graph on the opposite page.
3.2 Conclusion In order to meet the needs in refugee communities, UNRWA would have to significantly increase its fundraising as illustrated by the needs columns. Based on the trends in UNRWA’s sources of funding as set out in Section 2 such a dramatic change of trajectory is not deemed feasible. For the purposes of this strategy, minimum requirements are taken as the base level during the next two biennia leading to an increase in donor income from USD 841m in 2010 to USD 995m in 2015.
10A RESOURCE MOBILISATION STRATEGY FOR UNRWA (2012-2015), NOVEMBER 2012
4.1 Importance of evaluating opportunities and risksUNRWA operates with an extremely low level of working capital14 (the equivalent of as little as one month, or less, of average expenditures) while having a significant base of fixed commitments in an operating environment that can generate unanticipated additional expenditures. Deficits between income and expenditure can have sudden and dramatic consequences for UNRWA to fulfil its mandate.
Within the resource mobilisation strategy, risks in relation to securing adequate funding are considered; analysis of operating risks is a responsibility of the field operations.
Conversely, opportunities exist to improve or reposition the Agency toward existing partners or to reach out to new partners. These areas of opportunity and risk are considered in the resource mobilisation strategy in Section 5 and its implementation described in Section 6.
4.2 High-level opportunities and risks The following page lists a selection of opportunities to improve UNRWA’s ability to sustainably mobilise resources. Many opportunities have an element of risk: failing to answer to the opportunity in the right manner may leave UNRWA worse off. Conversely, many of the risks identified in the following section could possibly result in positive outcomes: if UNRWA is able to provide adequate responses to some of the risks, the Agency could improve its position.
4. OPPORTUNITIES, RISKS AND CONTINGENCY ANALYSIS
Minimum requirements vs. needs-based level
A RESOURCE MOBILISATION STRATEGY FOR UNRWA (2012-2015), NOVEMBER 201211
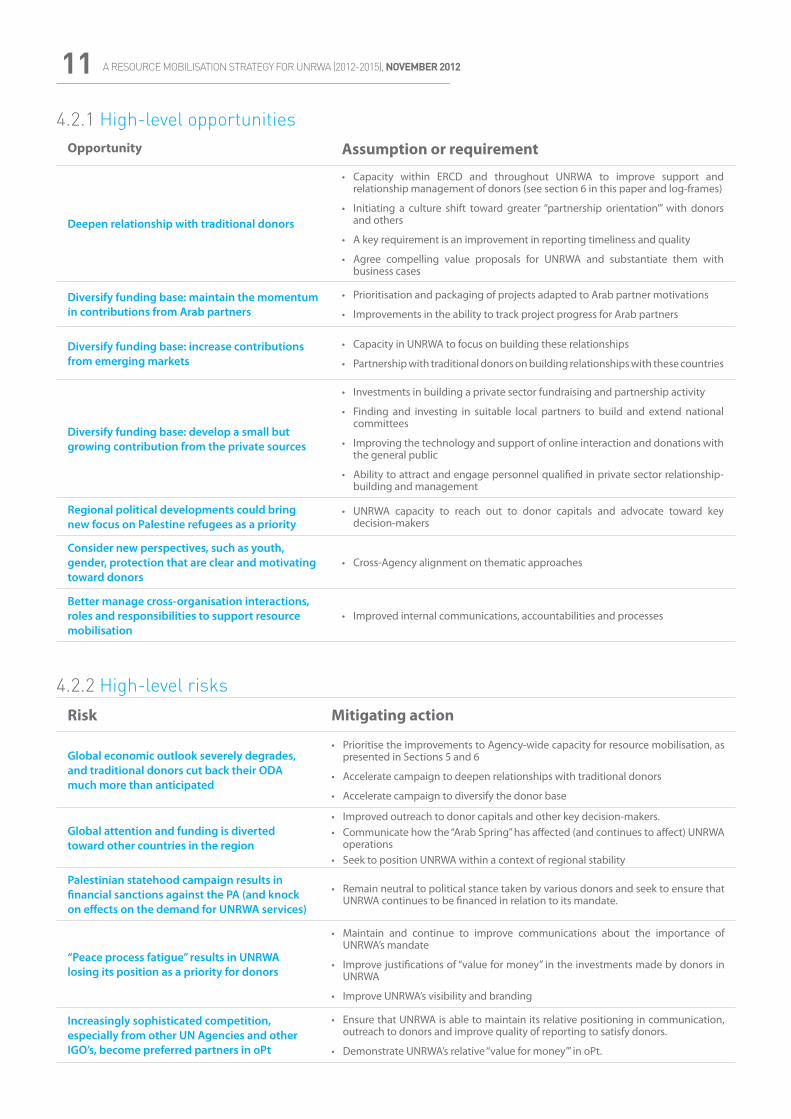
4.2.1 High-level opportunitiesOpportunity Assumption or requirement
Deepen relationship with traditional donors
• Capacity within ERCD and throughout UNRWA to improve support and relationship management of donors (see section 6 in this paper and log-frames)
• Initiating a culture shift toward greater “partnership orientation’” with donors and others
• A key requirement is an improvement in reporting timeliness and quality
• Agree compelling value proposals for UNRWA and substantiate them with business cases
Diversify funding base: maintain the momentum in contributions from Arab partners
• Prioritisation and packaging of projects adapted to Arab partner motivations
• Improvements in the ability to track project progress for Arab partners
Diversify funding base: increase contributions from emerging markets
• Capacity in UNRWA to focus on building these relationships
• Partnership with traditional donors on building relationships with these countries
Diversify funding base: develop a small but growing contribution from the private sources
• Investments in building a private sector fundraising and partnership activity
• Finding and investing in suitable local partners to build and extend national committees
• Improving the technology and support of online interaction and donations with the general public
• Ability to attract and engage personnel qualified in private sector relationship-building and management
Regional political developments could bring new focus on Palestine refugees as a priority
• UNRWA capacity to reach out to donor capitals and advocate toward key decision-makers
Consider new perspectives, such as youth, gender, protection that are clear and motivating toward donors
• Cross-Agency alignment on thematic approaches
Better manage cross-organisation interactions, roles and responsibilities to support resource mobilisation
• Improved internal communications, accountabilities and processes
4.2.2 High-level risksRisk Mitigating action
Global economic outlook severely degrades, and traditional donors cut back their ODA much more than anticipated
• Prioritise the improvements to Agency-wide capacity for resource mobilisation, as presented in Sections 5 and 6
• Accelerate campaign to deepen relationships with traditional donors
• Accelerate campaign to diversify the donor base
Global attention and funding is diverted toward other countries in the region
• Improved outreach to donor capitals and other key decision-makers.• Communicate how the “Arab Spring” has affected (and continues to affect) UNRWA
operations• Seek to position UNRWA within a context of regional stability
Palestinian statehood campaign results in financial sanctions against the PA (and knock on effects on the demand for UNRWA services)
• Remain neutral to political stance taken by various donors and seek to ensure that UNRWA continues to be financed in relation to its mandate.
“Peace process fatigue” results in UNRWA losing its position as a priority for donors
• Maintain and continue to improve communications about the importance of UNRWA’s mandate
• Improve justifications of “value for money” in the investments made by donors in UNRWA
• Improve UNRWA’s visibility and branding
Increasingly sophisticated competition, especially from other UN Agencies and other IGO’s, become preferred partners in oPt
• Ensure that UNRWA is able to maintain its relative positioning in communication, outreach to donors and improve quality of reporting to satisfy donors.
• Demonstrate UNRWA’s relative “value for money’” in oPt.
12A RESOURCE MOBILISATION STRATEGY FOR UNRWA (2012-2015), NOVEMBER 2012
5.1 Resource mobilisation prioritiesIn order to promote aid effectiveness and avoid a proliferation of projects, UNRWA encourages donors to give un-earmarked funds. To the extent that donor funds are fully un-earmarked, priority is always given to the GF.
Responding to a range of donor priorities and requirements , UNRWA seeks to maximise the resources available to the Agency by fully utilising the opportunities arising from a variety of donor instruments and bilateral budget lines in all fields of operations.
UNRWA directs its resource mobilisation efforts first and foremost towards meeting the requirements of the GF. Donors are encouraged to enter into multi-year performance-based agreements in order to increase income predictability and reduce recurrent fundraising costs.
When mobilising humanitarian funding, UNRWA seeks to ensure that minimum needs are met across fields with emergency programmes.
Large reconstruction programmes require a targeted (and somewhat opportunistic) RM approach and are generally financed by agreements with specific donors. Efforts are made to secure funding to meet minimum annual operational requirements.
Discrete projects outside of larger reconstruction programmes are funded as opportunities arise, provided they meet quality standards set by the Agency. The Agency does not actively promote the funding of small donor-specific projects which can be disproportionably costly to set up, track and review.
5.2 Funding targets by donor categoryTaken together, the following are the major assumptions built into the four-year funding outlook:
• The traditional donors will continue to increase funding, but at a significantly lower rate than in the past. Given the outlook for ODA from DAC countries, it would be consistent to expect overall GF contributions to grow annually by no more than 2-4 per cent and overall contributions at around 3 per cent a year.
• It should be reasonable to justify an increase in the relative contribution of Arab donors toward the GF, while targeting at least a maintenance of their share of Emergency Appeal and projects.
• Non-traditional partners should be managed to increase their growth through diversifying contributions to more donors – while maintaining and growing the current key contributors in this group.
• Emerging markets are rapidly increasing aid levels. Provided that UNRWA specifically targets these countries, substantial increases in their contributions are feasible. The Agency aims
for a ten-fold increase in overall income from these countries. However, recognising that solid institutional relationships will take time to develop, the full potential of emerging markets will only be reflected in the following strategy period.
• Provided that a significant investment is made in terms of both human resources and operating budget, there is a potential for substantial increases in income raised from private sources: online, individual giving, corporations, foundations and high net-worth individuals (HNWIs). However, UNRWA’s overwhelming reliance on government funding from new and traditional donors will remain.
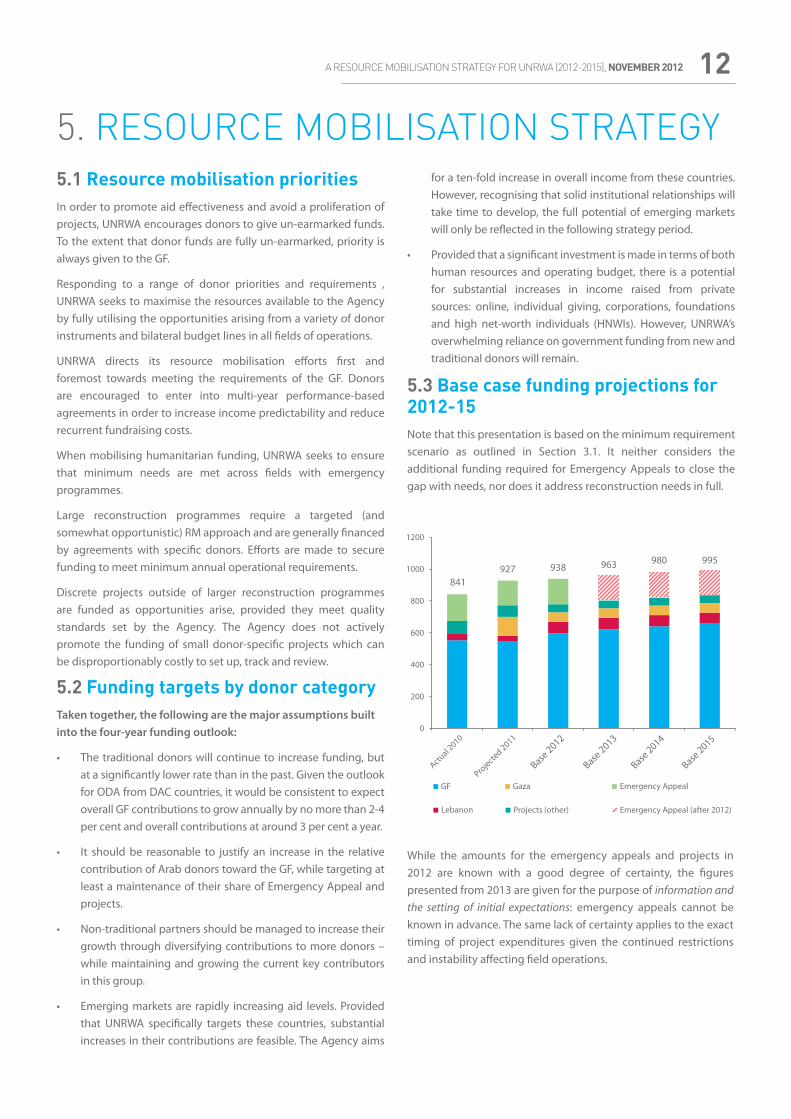
5.3 Base case funding projections for 2012-15Note that this presentation is based on the minimum requirement scenario as outlined in Section 3.1. It neither considers the additional funding required for Emergency Appeals to close the gap with needs, nor does it address reconstruction needs in full.
5. RESOURCE MOBILISATION STRATEGY
While the amounts for the emergency appeals and projects in 2012 are known with a good degree of certainty, the figures presented from 2013 are given for the purpose of information and the setting of initial expectations: emergency appeals cannot be known in advance. The same lack of certainty applies to the exact timing of project expenditures given the continued restrictions and instability affecting field operations.
A RESOURCE MOBILISATION STRATEGY FOR UNRWA (2012-2015), NOVEMBER 201213
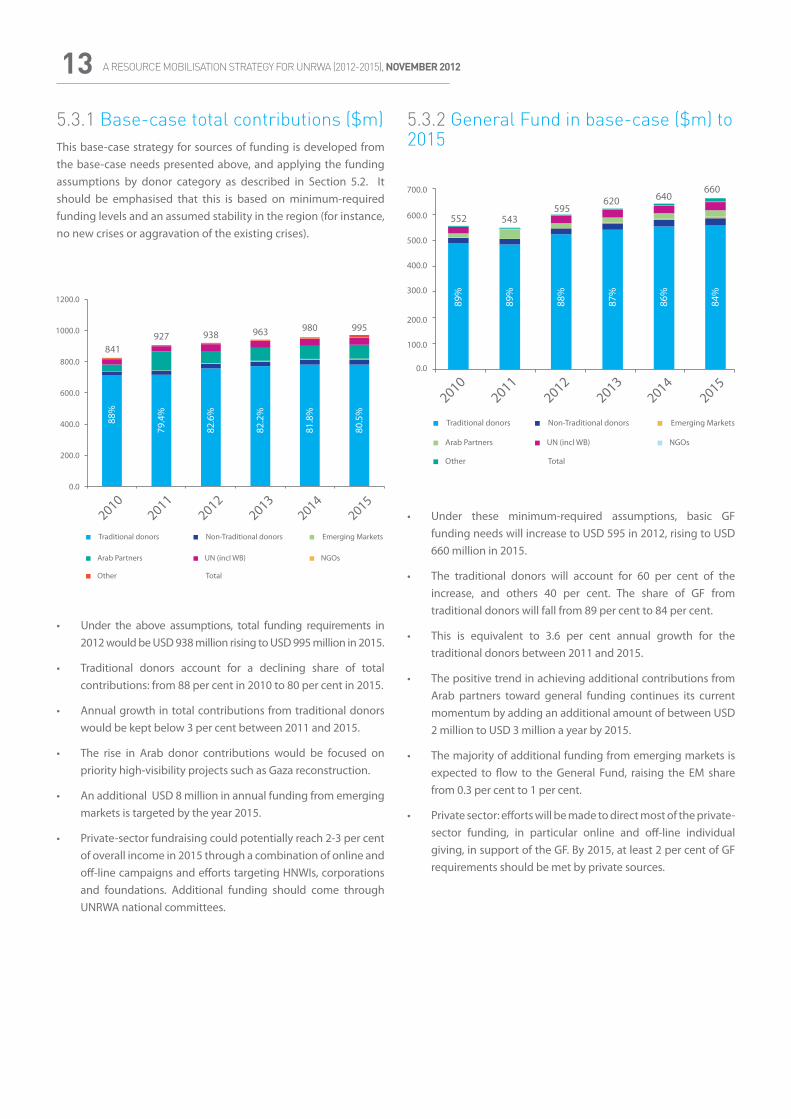
5.3.1 Base-case total contributions ($m) This base-case strategy for sources of funding is developed from the base-case needs presented above, and applying the funding assumptions by donor category as described in Section 5.2. It should be emphasised that this is based on minimum-required funding levels and an assumed stability in the region (for instance, no new crises or aggravation of the existing crises).
• Under these minimum-required assumptions, basic GF funding needs will increase to USD 595 in 2012, rising to USD 660 million in 2015.
• The traditional donors will account for 60 per cent of the increase, and others 40 per cent. The share of GF from traditional donors will fall from 89 per cent to 84 per cent.
• This is equivalent to 3.6 per cent annual growth for the traditional donors between 2011 and 2015.
• The positive trend in achieving additional contributions from Arab partners toward general funding continues its current momentum by adding an additional amount of between USD 2 million to USD 3 million a year by 2015.
• The majority of additional funding from emerging markets is expected to flow to the General Fund, raising the EM share from 0.3 per cent to 1 per cent.
• Private sector: efforts will be made to direct most of the private-sector funding, in particular online and off-line individual giving, in support of the GF. By 2015, at least 2 per cent of GF requirements should be met by private sources.
• Under the above assumptions, total funding requirements in 2012 would be USD 938 million rising to USD 995 million in 2015.
• Traditional donors account for a declining share of total contributions: from 88 per cent in 2010 to 80 per cent in 2015.
• Annual growth in total contributions from traditional donors would be kept below 3 per cent between 2011 and 2015.
• The rise in Arab donor contributions would be focused on priority high-visibility projects such as Gaza reconstruction.
• An additional USD 8 million in annual funding from emerging markets is targeted by the year 2015.
• Private-sector fundraising could potentially reach 2-3 per cent of overall income in 2015 through a combination of online and off-line campaigns and efforts targeting HNWIs, corporations and foundations. Additional funding should come through UNRWA national committees.
5.3.2 General Fund in base-case ($m) to 2015
14A RESOURCE MOBILISATION STRATEGY FOR UNRWA (2012-2015), NOVEMBER 2012
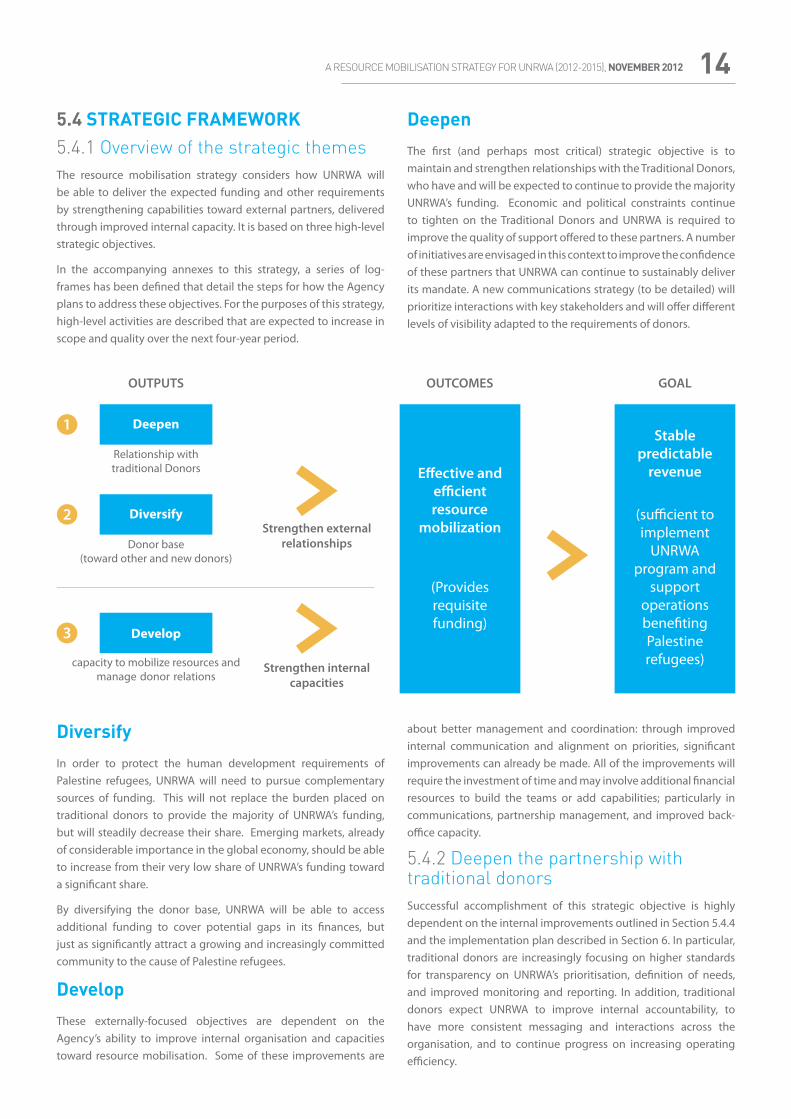
5.4 STRATEGIC FRAMEWORK5.4.1 Overview of the strategic themesThe resource mobilisation strategy considers how UNRWA will be able to deliver the expected funding and other requirements by strengthening capabilities toward external partners, delivered through improved internal capacity. It is based on three high-level strategic objectives.
In the accompanying annexes to this strategy, a series of log-frames has been defined that detail the steps for how the Agency plans to address these objectives. For the purposes of this strategy, high-level activities are described that are expected to increase in scope and quality over the next four-year period.
DiversifyIn order to protect the human development requirements of Palestine refugees, UNRWA will need to pursue complementary sources of funding. This will not replace the burden placed on traditional donors to provide the majority of UNRWA’s funding, but will steadily decrease their share. Emerging markets, already of considerable importance in the global economy, should be able to increase from their very low share of UNRWA’s funding toward a significant share.
By diversifying the donor base, UNRWA will be able to access additional funding to cover potential gaps in its finances, but just as significantly attract a growing and increasingly committed community to the cause of Palestine refugees.
DevelopThese externally-focused objectives are dependent on the Agency’s ability to improve internal organisation and capacities toward resource mobilisation. Some of these improvements are
DeepenThe first (and perhaps most critical) strategic objective is to maintain and strengthen relationships with the Traditional Donors, who have and will be expected to continue to provide the majority UNRWA’s funding. Economic and political constraints continue to tighten on the Traditional Donors and UNRWA is required to improve the quality of support offered to these partners. A number of initiatives are envisaged in this context to improve the confidence of these partners that UNRWA can continue to sustainably deliver its mandate. A new communications strategy (to be detailed) will prioritize interactions with key stakeholders and will offer different levels of visibility adapted to the requirements of donors.
about better management and coordination: through improved internal communication and alignment on priorities, significant improvements can already be made. All of the improvements will require the investment of time and may involve additional financial resources to build the teams or add capabilities; particularly in communications, partnership management, and improved back-office capacity.
5.4.2 Deepen the partnership with traditional donorsSuccessful accomplishment of this strategic objective is highly dependent on the internal improvements outlined in Section 5.4.4 and the implementation plan described in Section 6. In particular, traditional donors are increasingly focusing on higher standards for transparency on UNRWA’s prioritisation, definition of needs, and improved monitoring and reporting. In addition, traditional donors expect UNRWA to improve internal accountability, to have more consistent messaging and interactions across the organisation, and to continue progress on increasing operating efficiency.
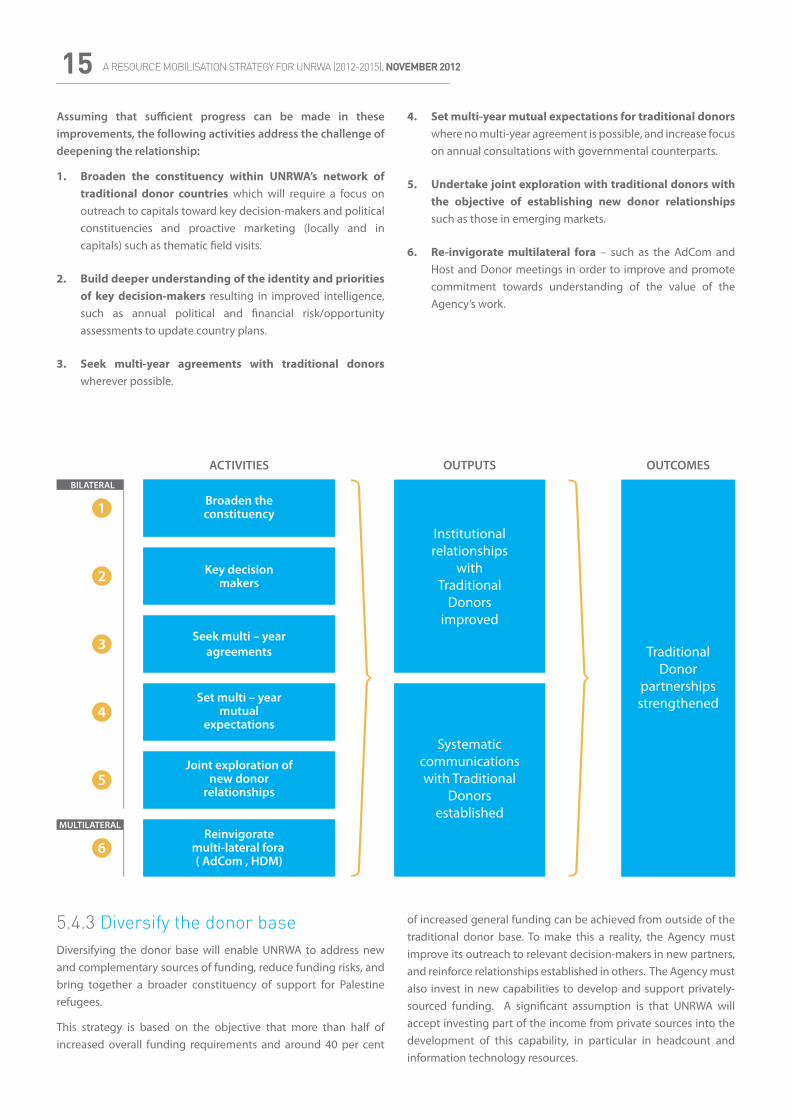
A RESOURCE MOBILISATION STRATEGY FOR UNRWA (2012-2015), NOVEMBER 201215Assuming that sufficient progress can be made in these improvements, the following activities address the challenge of deepening the relationship:
1. Broaden the constituency within UNRWA’s network of traditional donor countries which will require a focus on outreach to capitals toward key decision-makers and political constituencies and proactive marketing (locally and in capitals) such as thematic field visits.
2. Build deeper understanding of the identity and priorities of key decision-makers resulting in improved intelligence, such as annual political and financial risk/opportunity assessments to update country plans.
3. Seek multi-year agreements with traditional donors wherever possible.
4. Set multi-year mutual expectations for traditional donors where no multi-year agreement is possible, and increase focus on annual consultations with governmental counterparts.
5. Undertake joint exploration with traditional donors with the objective of establishing new donor relationships such as those in emerging markets.
6. Re-invigorate multilateral fora – such as the AdCom and Host and Donor meetings in order to improve and promote commitment towards understanding of the value of the Agency’s work.
5.4.3 Diversify the donor baseDiversifying the donor base will enable UNRWA to address new and complementary sources of funding, reduce funding risks, and bring together a broader constituency of support for Palestine refugees.
This strategy is based on the objective that more than half of increased overall funding requirements and around 40 per cent
of increased general funding can be achieved from outside of the traditional donor base. To make this a reality, the Agency must improve its outreach to relevant decision-makers in new partners, and reinforce relationships established in others. The Agency must also invest in new capabilities to develop and support privately-sourced funding. A significant assumption is that UNRWA will accept investing part of the income from private sources into the development of this capability, in particular in headcount and information technology resources.
16A RESOURCE MOBILISATION STRATEGY FOR UNRWA (2012-2015), NOVEMBER 2012
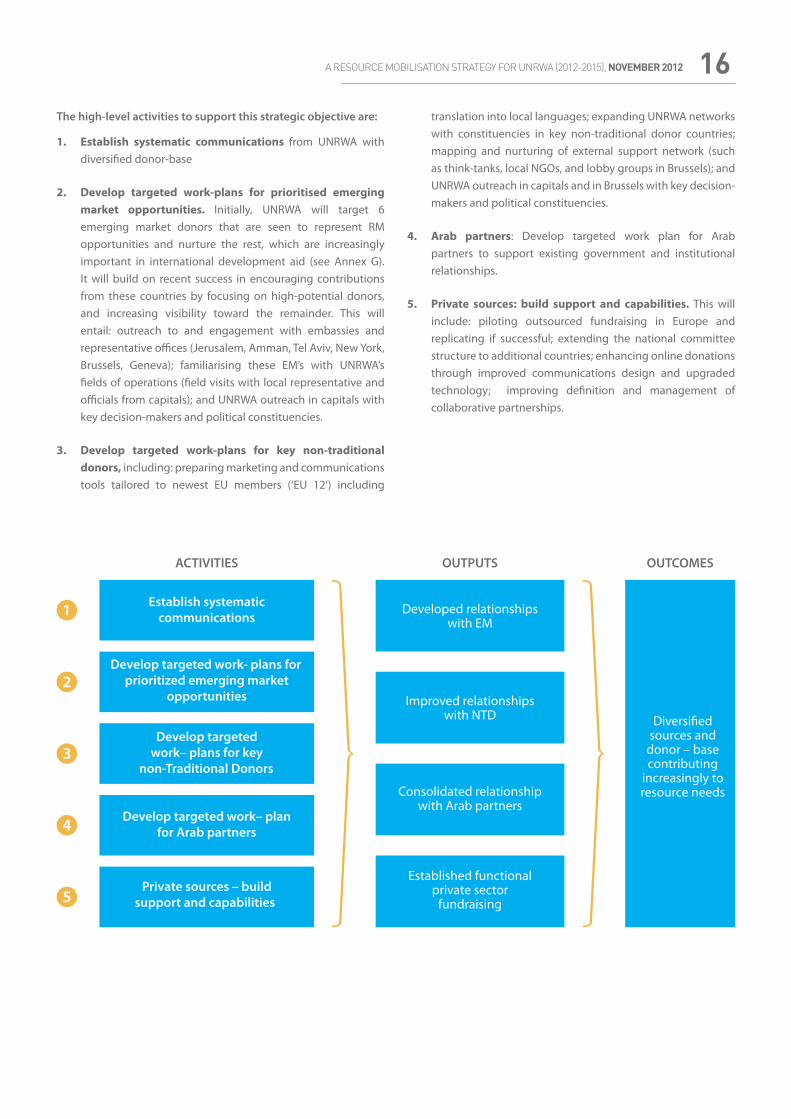
The high-level activities to support this strategic objective are:
1. Establish systematic communications from UNRWA with diversified donor-base
2. Develop targeted work-plans for prioritised emerging market opportunities. Initially, UNRWA will target 6 emerging market donors that are seen to represent RM opportunities and nurture the rest, which are increasingly important in international development aid (see Annex G). It will build on recent success in encouraging contributions from these countries by focusing on high-potential donors, and increasing visibility toward the remainder. This will entail: outreach to and engagement with embassies and representative offices (Jerusalem, Amman, Tel Aviv, New York, Brussels, Geneva); familiarising these EM’s with UNRWA’s fields of operations (field visits with local representative and officials from capitals); and UNRWA outreach in capitals with key decision-makers and political constituencies.
3. Develop targeted work-plans for key non-traditional donors, including: preparing marketing and communications tools tailored to newest EU members (‘EU 12’) including
translation into local languages; expanding UNRWA networks with constituencies in key non-traditional donor countries; mapping and nurturing of external support network (such as think-tanks, local NGOs, and lobby groups in Brussels); and UNRWA outreach in capitals and in Brussels with key decision-makers and political constituencies.
4. Arab partners: Develop targeted work plan for Arab partners to support existing government and institutional relationships.
5. Private sources: build support and capabilities. This will include: piloting outsourced fundraising in Europe and replicating if successful; extending the national committee structure to additional countries; enhancing online donations through improved communications design and upgraded technology; improving definition and management of collaborative partnerships.
A RESOURCE MOBILISATION STRATEGY FOR UNRWA (2012-2015), NOVEMBER 201217
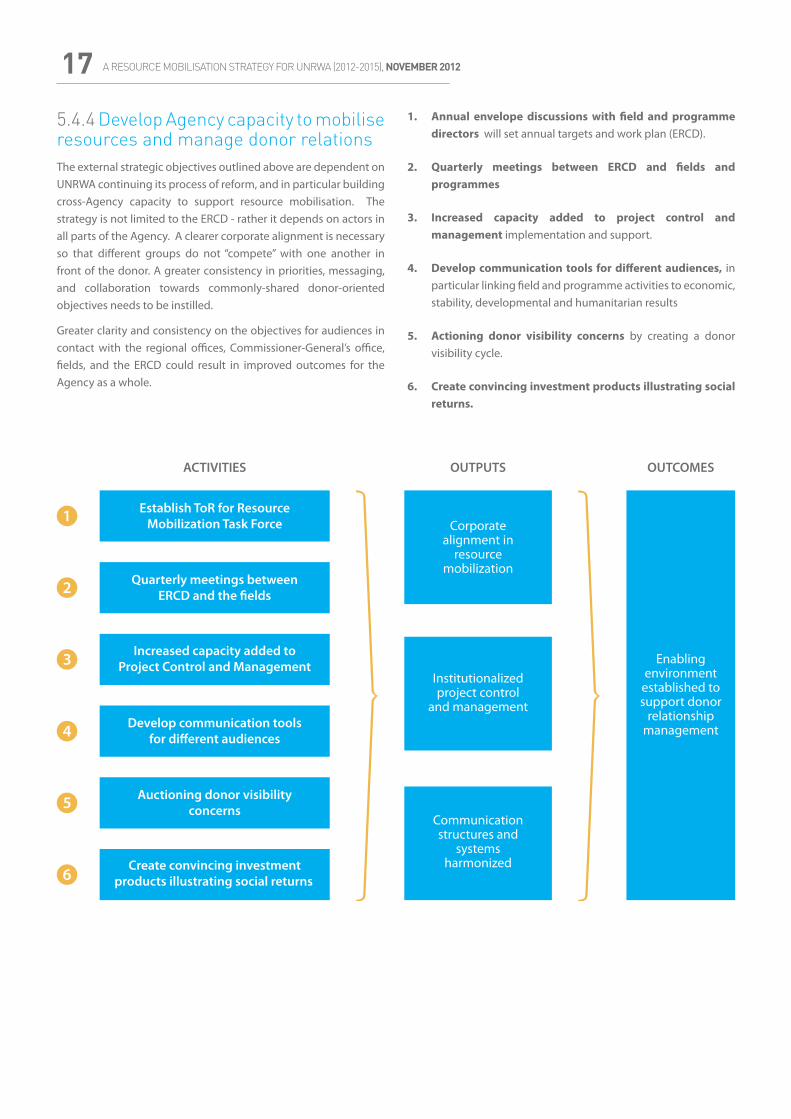
5.4.4 Develop Agency capacity to mobilise resources and manage donor relationsThe external strategic objectives outlined above are dependent on UNRWA continuing its process of reform, and in particular building cross-Agency capacity to support resource mobilisation. The strategy is not limited to the ERCD - rather it depends on actors in all parts of the Agency. A clearer corporate alignment is necessary so that different groups do not “compete” with one another in front of the donor. A greater consistency in priorities, messaging, and collaboration towards commonly-shared donor-oriented objectives needs to be instilled.
Greater clarity and consistency on the objectives for audiences in contact with the regional offices, Commissioner-General’s office, fields, and the ERCD could result in improved outcomes for the Agency as a whole.
1. Annual envelope discussions with field and programme directors will set annual targets and work plan (ERCD).
2. Quarterly meetings between ERCD and fields and programmes
3. Increased capacity added to project control and management implementation and support.
4. Develop communication tools for different audiences, in particular linking field and programme activities to economic, stability, developmental and humanitarian results
5. Actioning donor visibility concerns by creating a donor visibility cycle.
6. Create convincing investment products illustrating social returns.
18A RESOURCE MOBILISATION STRATEGY FOR UNRWA (2012-2015), NOVEMBER 2012
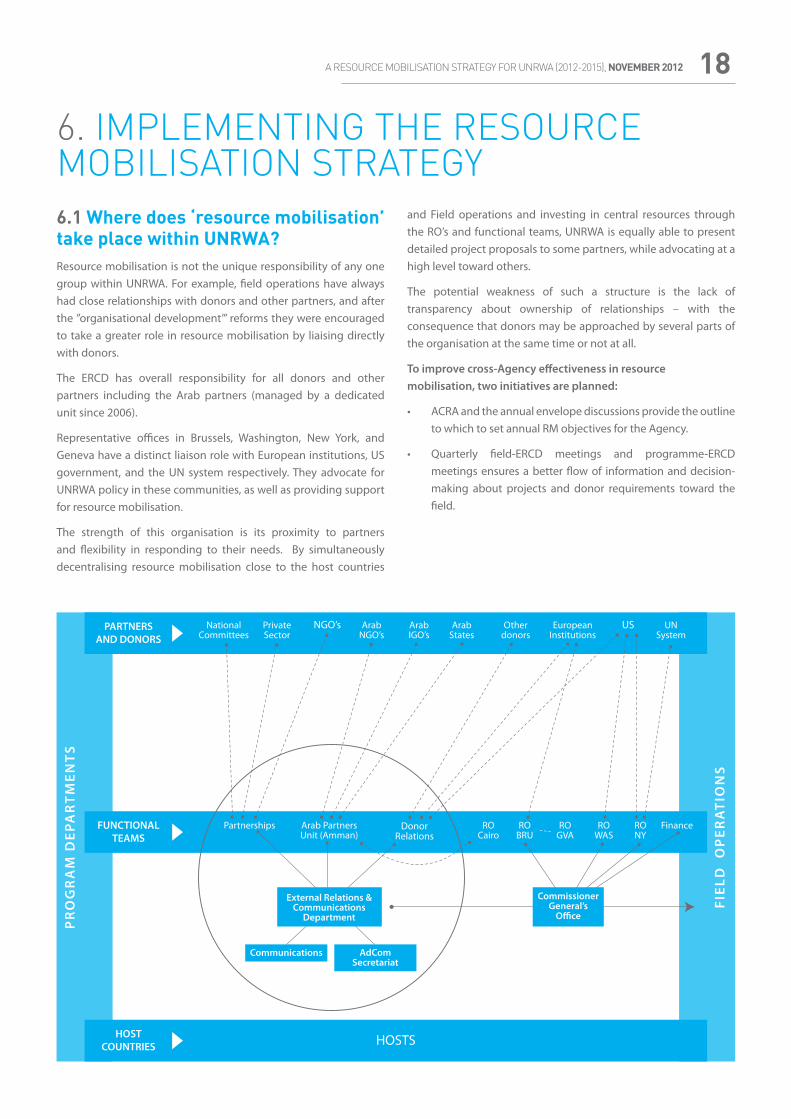
6.1 Where does ‘resource mobilisation’ take place within UNRWA?Resource mobilisation is not the unique responsibility of any one group within UNRWA. For example, field operations have always had close relationships with donors and other partners, and after the ”organisational development’” reforms they were encouraged to take a greater role in resource mobilisation by liaising directly with donors.
The ERCD has overall responsibility for all donors and other partners including the Arab partners (managed by a dedicated unit since 2006).
Representative offices in Brussels, Washington, New York, and Geneva have a distinct liaison role with European institutions, US government, and the UN system respectively. They advocate for UNRWA policy in these communities, as well as providing support for resource mobilisation.
The strength of this organisation is its proximity to partners and flexibility in responding to their needs. By simultaneously decentralising resource mobilisation close to the host countries
and Field operations and investing in central resources through the RO’s and functional teams, UNRWA is equally able to present detailed project proposals to some partners, while advocating at a high level toward others.
The potential weakness of such a structure is the lack of transparency about ownership of relationships – with the consequence that donors may be approached by several parts of the organisation at the same time or not at all.
To improve cross-Agency effectiveness in resource mobilisation, two initiatives are planned:
• ACRA and the annual envelope discussions provide the outline to which to set annual RM objectives for the Agency.
• Quarterly field-ERCD meetings and programme-ERCD meetings ensures a better flow of information and decision-making about projects and donor requirements toward the field.
6. IMPLEMENTING THE RESOURCE MOBILISATION STRATEGY
A RESOURCE MOBILISATION STRATEGY FOR UNRWA (2012-2015), NOVEMBER 201219
6.2 High-level work-plan requirementsThe “log-frame’”described in Section 5 (and shown in detail in Annex A) will be broken down into annual work-plans, reflecting milestones in the progress toward delivering the overall strategy. Each of the work plans includes targets and specifies roles and responsibilities across the various functional groups and departments (as described in Section 6.1, above). Each activity will also be broken down into more specific actions to be carried out depending on donor/target audience.
Within ERCD, the log-frames are used as the basis to establish annual objectives for each of the managers and project officers.
The effective implementation of this plan will require the attention of groups outside of the ERCD, and in particular:
• The Commissioner-General’s office: support of the RM strategy including outreach to donor capitals and explicit agreement on the terms of reference for the RM task force.
• Representative offices: support in building a broader constituency in UNRWA’s donor network and joint exploration of new donor relationships.
• Programme departments and fields: collaboration with ERCD in developing convincing “investment products” illustrating social returns.
• Fields: commitment to implementing and adequately supporting project management and control processes.
• Finance department: improved clarity toward donors of actual and expected cost changes and project expenditure.
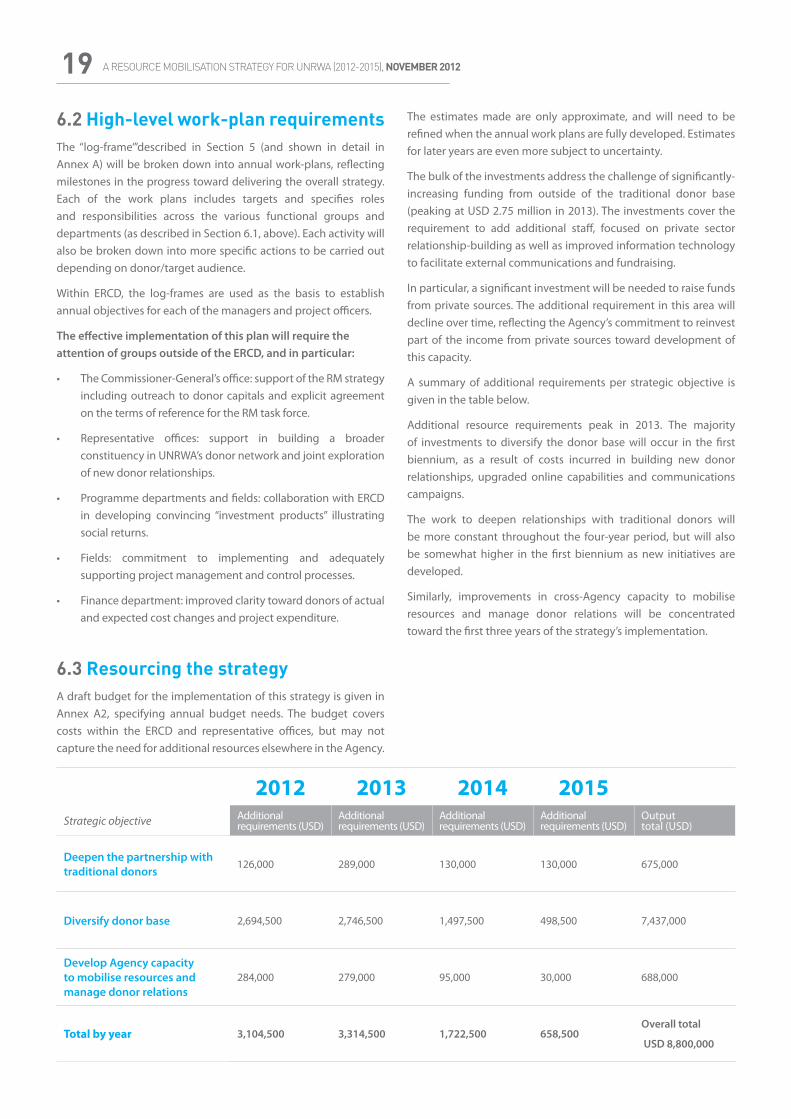
6.3 Resourcing the strategyA draft budget for the implementation of this strategy is given in Annex A2, specifying annual budget needs. The budget covers costs within the ERCD and representative offices, but may not capture the need for additional resources elsewhere in the Agency.
The estimates made are only approximate, and will need to be refined when the annual work plans are fully developed. Estimates for later years are even more subject to uncertainty.
The bulk of the investments address the challenge of significantly-increasing funding from outside of the traditional donor base (peaking at USD 2.75 million in 2013). The investments cover the requirement to add additional staff, focused on private sector relationship-building as well as improved information technology to facilitate external communications and fundraising.
In particular, a significant investment will be needed to raise funds from private sources. The additional requirement in this area will decline over time, reflecting the Agency’s commitment to reinvest part of the income from private sources toward development of this capacity.
A summary of additional requirements per strategic objective is given in the table below.
Additional resource requirements peak in 2013. The majority of investments to diversify the donor base will occur in the first biennium, as a result of costs incurred in building new donor relationships, upgraded online capabilities and communications campaigns.
The work to deepen relationships with traditional donors will be more constant throughout the four-year period, but will also be somewhat higher in the first biennium as new initiatives are developed.
Similarly, improvements in cross-Agency capacity to mobilise resources and manage donor relations will be concentrated toward the first three years of the strategy’s implementation.
2012 2013 2014 2015Strategic objective Additional
requirements (USD)Additionalrequirements (USD)
Additionalrequirements (USD)
Additionalrequirements (USD)
Outputtotal (USD)
Deepen the partnership with traditional donors
126,000 289,000 130,000 130,000 675,000
Diversify donor base 2,694,500 2,746,500 1,497,500 498,500 7,437,000
Develop Agency capacity to mobilise resources and manage donor relations
284,000 279,000 95,000 30,000 688,000
Total by year 3,104,500 3,314,500 1,722,500 658,500Overall total
USD 8,800,000
20A RESOURCE MOBILISATION STRATEGY FOR UNRWA (2012-2015), NOVEMBER 2012
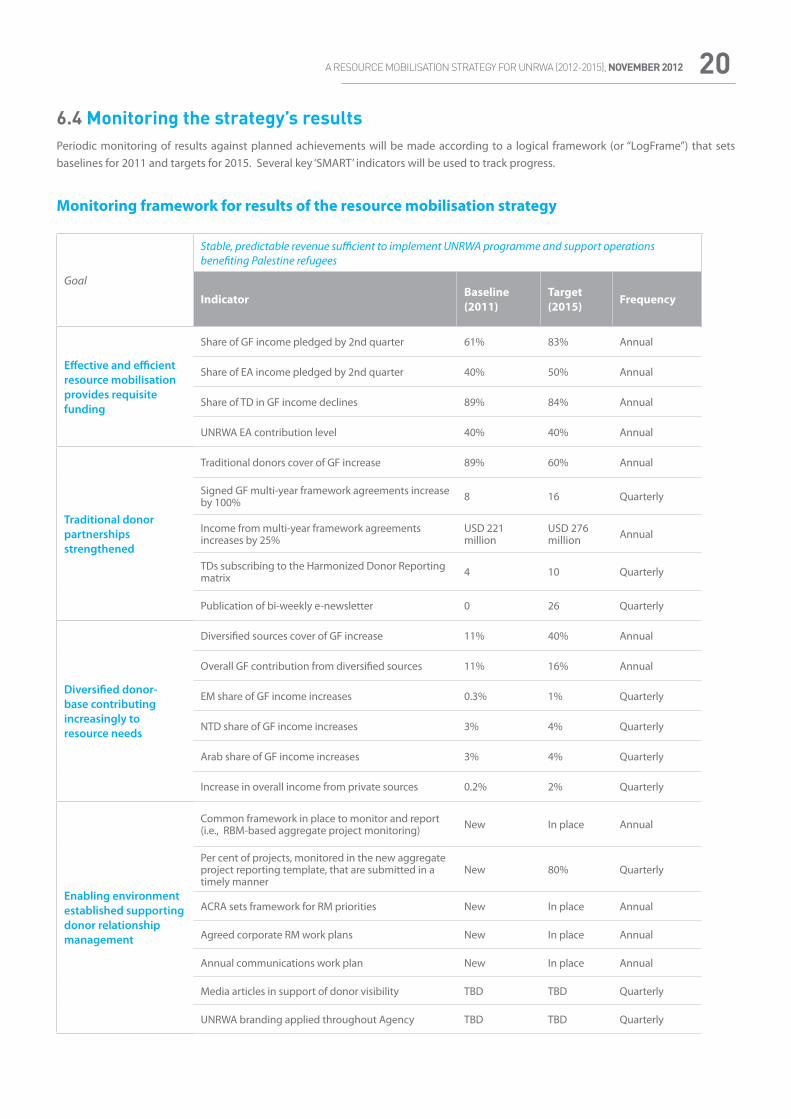
6.4 Monitoring the strategy’s resultsPeriodic monitoring of results against planned achievements will be made according to a logical framework (or “LogFrame”) that sets baselines for 2011 and targets for 2015. Several key ‘SMART’ indicators will be used to track progress.
Monitoring framework for results of the resource mobilisation strategy
Goal
Stable, predictable revenue sufficient to implement UNRWA programme and support operations benefiting Palestine refugees
Indicator Baseline (2011)
Target (2015) Frequency
Effective and efficient resource mobilisation provides requisite funding
Share of GF income pledged by 2nd quarter 61% 83% Annual
Share of EA income pledged by 2nd quarter 40% 50% Annual
Share of TD in GF income declines 89% 84% Annual
UNRWA EA contribution level 40% 40% Annual
Traditional donor partnerships strengthened
Traditional donors cover of GF increase 89% 60% Annual
Signed GF multi-year framework agreements increase by 100% 8 16 Quarterly
Income from multi-year framework agreements increases by 25%
USD 221 million
USD 276 million Annual
TDs subscribing to the Harmonized Donor Reporting matrix 4 10 Quarterly
Publication of bi-weekly e-newsletter 0 26 Quarterly
Diversified donor-base contributing increasingly to resource needs
Diversified sources cover of GF increase 11% 40% Annual
Overall GF contribution from diversified sources 11% 16% Annual
EM share of GF income increases 0.3% 1% Quarterly
NTD share of GF income increases 3% 4% Quarterly
Arab share of GF income increases 3% 4% Quarterly
Increase in overall income from private sources 0.2% 2% Quarterly
Enabling environment established supporting donor relationship management
Common framework in place to monitor and report (i.e., RBM-based aggregate project monitoring) New In place Annual
Per cent of projects, monitored in the new aggregate project reporting template, that are submitted in a timely manner
New 80% Quarterly
ACRA sets framework for RM priorities New In place Annual
Agreed corporate RM work plans New In place Annual
Annual communications work plan New In place Annual
Media articles in support of donor visibility TBD TBD Quarterly
UNRWA branding applied throughout Agency TBD TBD Quarterly
A RESOURCE MOBILISATION STRATEGY FOR UNRWA (2012-2015), NOVEMBER 201221Additional structures to support the monitoring of this strategy include:
• An annual ERCD Resource Mobilisation Report will summarise results against targets for an internal and external audience.
• Quarterly meetings with field and programme directors to monitor and manage implementation of the strategy.
• The results-based monitoring system tool will be used to provide systematic tracking of results and reports for the resource mobilisation strategy.
Evaluation of the strategyIn addition to periodic monitoring supporting management, there will be an external, third-party evaluation of the resource mobilisation strategy at the mid-term and at the end of the four-year period.
An evaluation of the strategy will facilitate an objective assessment of the overall results against the planned achievement, including the design of the logical framework and its implementation and execution.
The terms of reference for the mid-term evaluation should review the progress of the implementation of the strategy using the framework shown in Annex A.
ANNEXES: A RESOURCE MOBILIZATION STRATEGY FOR UNRWA (2012-2015), OCTOBER 2011 22
annexes a resource mobilisation strategy forUNRWA2012-2015
Explanation and notesDonor categories
A) Implementation planA 1 - LogFramesA 2 - Draft budget for implementation of the resource mobilisation strategy
B) Introduction to UNRWAOverview of Annex B: Introduction to UNRWAB 1 - OverviewB 2 - HistoryB 3 - MandateB 4 - Current contextB 5 - ProgrammesB 6 - FieldsB 7 - Role of host countriesB 8 - Reforms
C) Funding structureOverview of Annex C: Funding structureC 1 - Consolidation of needs and budgetsC 2 - Effect of the shortfall in funding of the Emergency AppealC 3 - Toward a consolidated budgetC 4 - Projected consolidated funding requirementsC 5 - Prioritisation of projects and expenditure-reduction measures
D) Contributions to UNRWA (2000-2010)Overview of Annex D: Contributions to UNRWAD 1 - Total contributions (all funding portals)D 2 - Regular budgetD 3 - Emergency appealsD 4 - ProjectsD 5 - Lebanon crisisD 6 - Traditional donor perceptions of UNRWA
E) Global ODA and humanitarian aid trendsOverview of Annex E: Global ODA and humanitarian aid trendsE 1 - Global ODA donor trendsE 2 - Middle Eastern ODA recipient trends
F) Analysis of Arab aid donorsOverview of Annex F: Analysis of Arab aid donorsF 1 - Overview of Arab aidF 2 - Types of projects supported by Arab aid
G) Emerging marketsOverview of Annex G: Emerging marketsG 1 - Note on definitions of emerging marketsG 2 - Development aid from emerging countriesG 3 - Humanitarian aid from emerging economies
H) PhilanthropyOverview of Annex H: PhilanthropyH 1 - Global trends in high-net-worth ndividualsH 2 - USA philanthropy and corporate givingH 3 - Arab region
2525262630
32323232323334353637
38383839404141
42424245474849
50
51515156
58585859
6060606061
6363646567
annexes
I) Learning from other UN organisationsOverview of Annex I: Learning from other UN organisationsI 1 - Summary of other UN agency benchmarkingI 2 - UNICEFI 3 - UNHCRI 4 - WFPI 5 - Fundraising by other UN agencies in the Gulf region
J) PartnershipsOverview of Annex J: PartnershipsJ 1 - Value of partnershipsJ 2 - Examples of partnershipsJ 3 - Value proposition of UNRWA for its partnersJ 4 - Reviewing and setting expectations for partnershipsJ 5 - Partnership mapping within UNRWAJ 6 - ECRD role in managing partnershipsJ 7 - Partnerships management in other UN organisationsAbbreviations
67676869707072
72727273737474757576
ANNEXES: A RESOURCE MOBILIZATION STRATEGY FOR UNRWA (2012-2015), OCTOBER 201125
EXPLANATION AND NOTESDonor categories
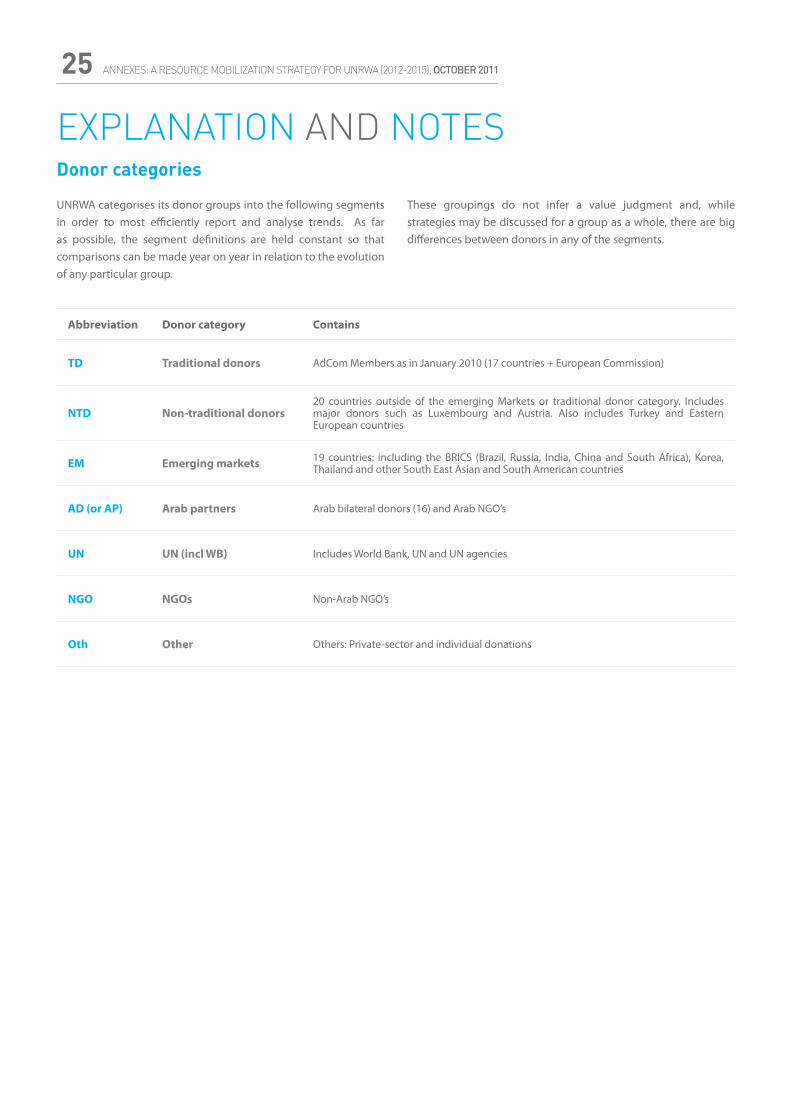
UNRWA categorises its donor groups into the following segments in order to most efficiently report and analyse trends. As far as possible, the segment definitions are held constant so that comparisons can be made year on year in relation to the evolution of any particular group.
These groupings do not infer a value judgment and, while strategies may be discussed for a group as a whole, there are big differences between donors in any of the segments.
Abbreviation Donor category Contains
TD Traditional donors AdCom Members as in January 2010 (17 countries + European Commission)
NTD Non-traditional donors20 countries outside of the emerging Markets or traditional donor category. Includes major donors such as Luxembourg and Austria. Also includes Turkey and Eastern European countries
EM Emerging markets 19 countries: including the BRICS (Brazil, Russia, India, China and South Africa), Korea, Thailand and other South East Asian and South American countries
AD (or AP) Arab partners Arab bilateral donors (16) and Arab NGO’s
UN UN (incl WB) Includes World Bank, UN and UN agencies
NGO NGOs Non-Arab NGO’s
Oth Other Others: Private-sector and individual donations
ANNEXES: A RESOURCE MOBILIZATION STRATEGY FOR UNRWA (2012-2015), OCTOBER 2011 26
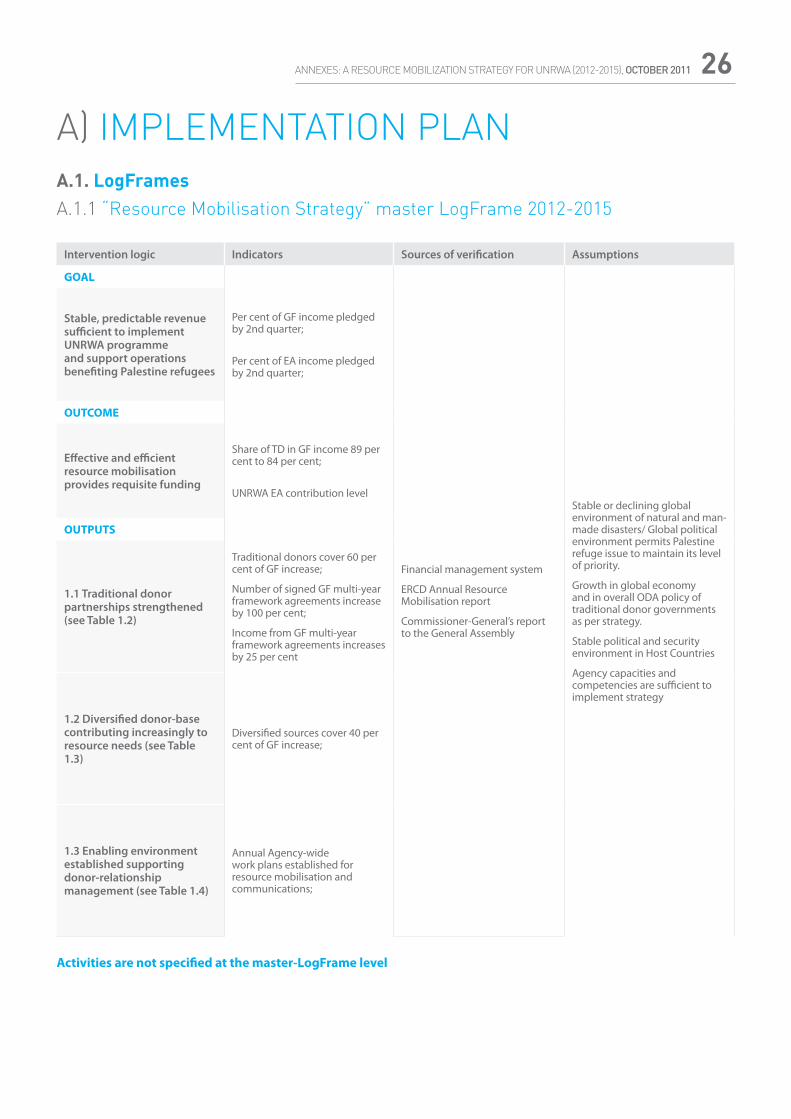
A) IMPLEMENTATION PLANA.1. LogFramesA.1.1 “Resource Mobilisation Strategy” master LogFrame 2012-2015
Intervention logic Indicators Sources of verification Assumptions
GOAL
Financial management system
ERCD Annual Resource Mobilisation report
Commissioner-General’s report to the General Assembly
Stable or declining global environment of natural and man-made disasters/ Global political environment permits Palestine refuge issue to maintain its level of priority.
Growth in global economy and in overall ODA policy of traditional donor governments as per strategy.
Stable political and security environment in Host Countries
Agency capacities and competencies are sufficient to implement strategy
Stable, predictable revenue sufficient to implement UNRWA programme and support operations benefiting Palestine refugees
Per cent of GF income pledged by 2nd quarter;
Per cent of EA income pledged by 2nd quarter;
OUTCOME
Effective and efficient resource mobilisation provides requisite funding
Share of TD in GF income 89 per cent to 84 per cent;
UNRWA EA contribution level
OUTPUTS
1.1 Traditional donor partnerships strengthened (see Table 1.2)
Traditional donors cover 60 per cent of GF increase;
Number of signed GF multi-year framework agreements increase by 100 per cent;
Income from GF multi-year framework agreements increases by 25 per cent
1.2 Diversified donor-base contributing increasingly to resource needs (see Table 1.3)
Diversified sources cover 40 per cent of GF increase;
1.3 Enabling environment established supporting donor-relationship management (see Table 1.4)
Annual Agency-wide work plans established for resource mobilisation and communications;
Activities are not specified at the master-LogFrame level
ANNEXES: A RESOURCE MOBILIZATION STRATEGY FOR UNRWA (2012-2015), OCTOBER 201127
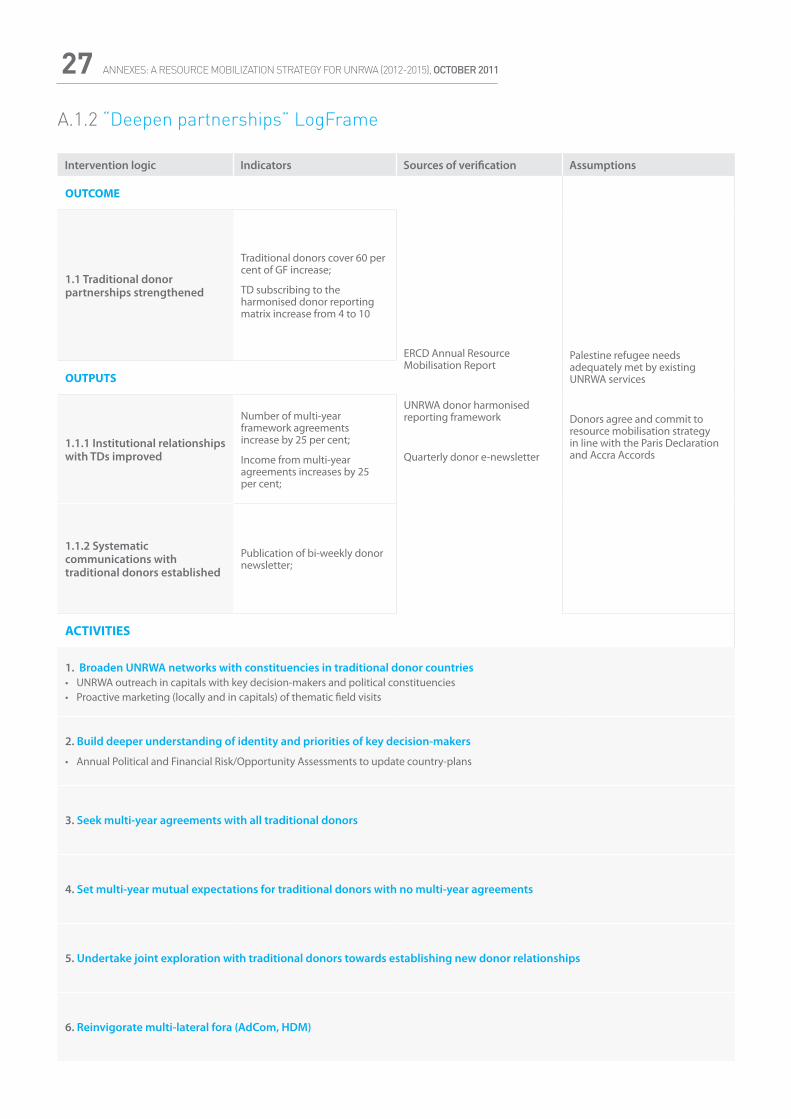
A.1.2 “Deepen partnerships” LogFrame
Intervention logic Indicators Sources of verification Assumptions
OUTCOME
ERCD Annual Resource Mobilisation Report
UNRWA donor harmonised reporting framework
Quarterly donor e-newsletter
Palestine refugee needs adequately met by existing UNRWA services
Donors agree and commit to resource mobilisation strategy in line with the Paris Declaration and Accra Accords
1.1 Traditional donor partnerships strengthened
Traditional donors cover 60 per cent of GF increase;
TD subscribing to the harmonised donor reporting matrix increase from 4 to 10
OUTPUTS
1.1.1 Institutional relationships with TDs improved
Number of multi-year framework agreements increase by 25 per cent;
Income from multi-year agreements increases by 25 per cent;
1.1.2 Systematic communications with traditional donors established
Publication of bi-weekly donor newsletter;
ACTIVITIES
1. Broaden UNRWA networks with constituencies in traditional donor countries• UNRWA outreach in capitals with key decision-makers and political constituencies • Proactive marketing (locally and in capitals) of thematic field visits
2. Build deeper understanding of identity and priorities of key decision-makers
• Annual Political and Financial Risk/Opportunity Assessments to update country-plans
3. Seek multi-year agreements with all traditional donors
4. Set multi-year mutual expectations for traditional donors with no multi-year agreements
5. Undertake joint exploration with traditional donors towards establishing new donor relationships
6. Reinvigorate multi-lateral fora (AdCom, HDM)
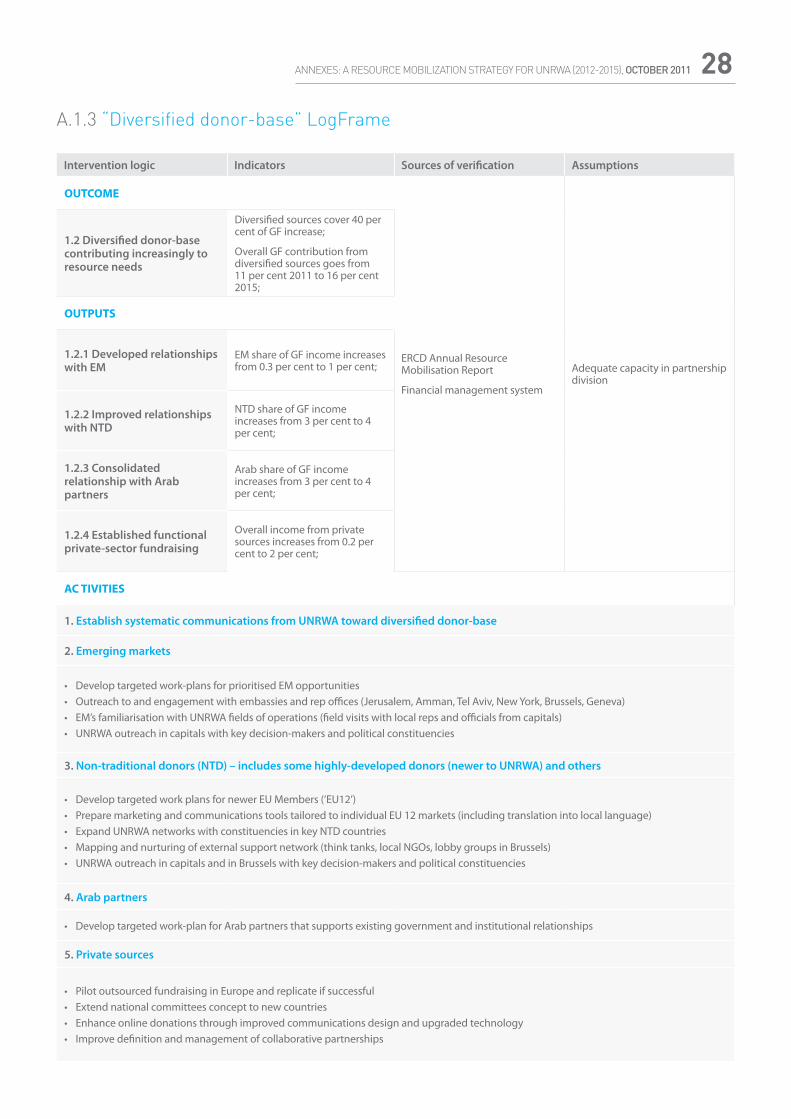
ANNEXES: A RESOURCE MOBILIZATION STRATEGY FOR UNRWA (2012-2015), OCTOBER 2011 28
A.1.3 “Diversified donor-base” LogFrame
Intervention logic Indicators Sources of verification Assumptions
OUTCOME
ERCD Annual Resource Mobilisation Report
Financial management system
Adequate capacity in partnership division
1.2 Diversified donor-base contributing increasingly to resource needs
Diversified sources cover 40 per cent of GF increase;
Overall GF contribution from diversified sources goes from 11 per cent 2011 to 16 per cent 2015;
OUTPUTS
1.2.1 Developed relationships with EM
EM share of GF income increases from 0.3 per cent to 1 per cent;
1.2.2 Improved relationships with NTD
NTD share of GF income increases from 3 per cent to 4 per cent;
1.2.3 Consolidated relationship with Arab partners
Arab share of GF income increases from 3 per cent to 4 per cent;
1.2.4 Established functional private-sector fundraising
Overall income from private sources increases from 0.2 per cent to 2 per cent;
AC TIVITIES
1. Establish systematic communications from UNRWA toward diversified donor-base
2. Emerging markets
• Develop targeted work-plans for prioritised EM opportunities• Outreach to and engagement with embassies and rep offices (Jerusalem, Amman, Tel Aviv, New York, Brussels, Geneva)• EM’s familiarisation with UNRWA fields of operations (field visits with local reps and officials from capitals)• UNRWA outreach in capitals with key decision-makers and political constituencies
3. Non-traditional donors (NTD) – includes some highly-developed donors (newer to UNRWA) and others
• Develop targeted work plans for newer EU Members (‘EU12’)• Prepare marketing and communications tools tailored to individual EU 12 markets (including translation into local language)• Expand UNRWA networks with constituencies in key NTD countries• Mapping and nurturing of external support network (think tanks, local NGOs, lobby groups in Brussels)• UNRWA outreach in capitals and in Brussels with key decision-makers and political constituencies
4. Arab partners
• Develop targeted work-plan for Arab partners that supports existing government and institutional relationships
5. Private sources
• Pilot outsourced fundraising in Europe and replicate if successful• Extend national committees concept to new countries• Enhance online donations through improved communications design and upgraded technology• Improve definition and management of collaborative partnerships
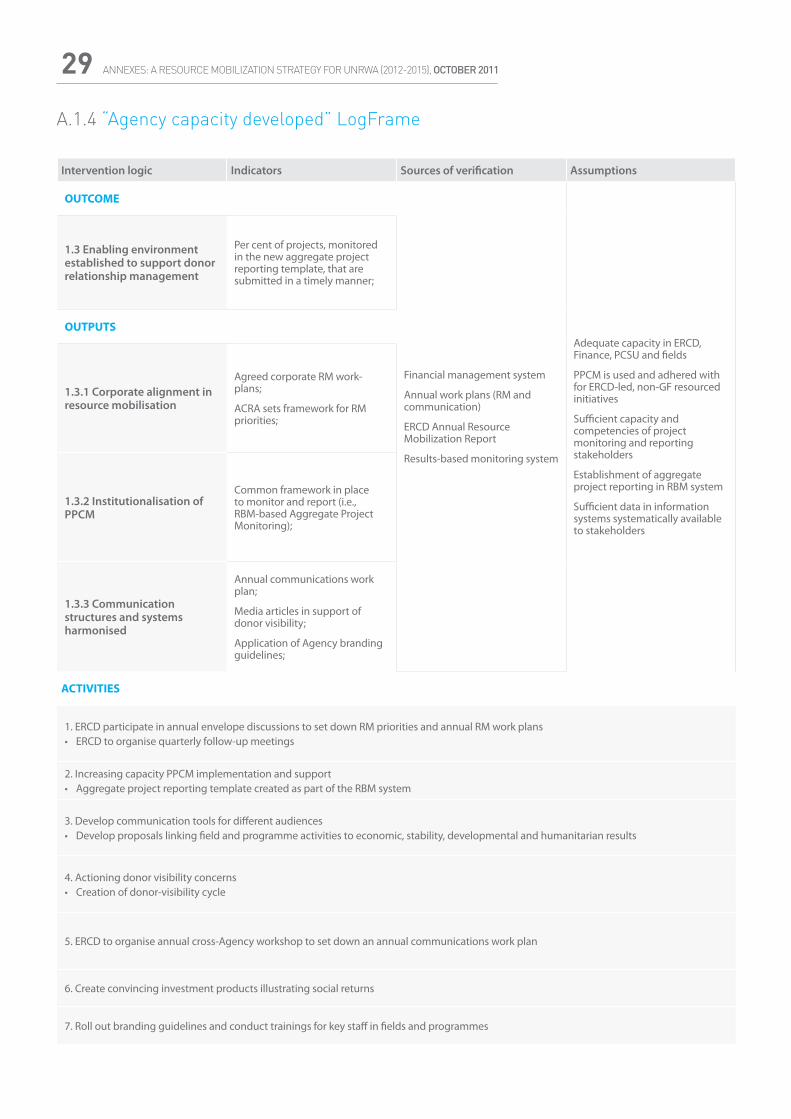
ANNEXES: A RESOURCE MOBILIZATION STRATEGY FOR UNRWA (2012-2015), OCTOBER 201129
A.1.4 “Agency capacity developed” LogFrame
Intervention logic Indicators Sources of verification Assumptions
OUTCOME
Financial management system
Annual work plans (RM and communication)
ERCD Annual Resource Mobilization Report
Results-based monitoring system
Adequate capacity in ERCD, Finance, PCSU and fields
PPCM is used and adhered with for ERCD-led, non-GF resourced initiatives
Sufficient capacity and competencies of project monitoring and reporting stakeholders
Establishment of aggregate project reporting in RBM system
Sufficient data in information systems systematically available to stakeholders
1.3 Enabling environment established to support donor relationship management
Per cent of projects, monitored in the new aggregate project reporting template, that are submitted in a timely manner;
OUTPUTS
1.3.1 Corporate alignment in resource mobilisation
Agreed corporate RM work-plans;
ACRA sets framework for RM priorities;
1.3.2 Institutionalisation of PPCM
Common framework in place to monitor and report (i.e., RBM-based Aggregate Project Monitoring);
1.3.3 Communication structures and systems harmonised
Annual communications work plan;
Media articles in support of donor visibility;
Application of Agency branding guidelines;
ACTIVITIES
1. ERCD participate in annual envelope discussions to set down RM priorities and annual RM work plans • ERCD to organise quarterly follow-up meetings
2. Increasing capacity PPCM implementation and support• Aggregate project reporting template created as part of the RBM system
3. Develop communication tools for different audiences• Develop proposals linking field and programme activities to economic, stability, developmental and humanitarian results
4. Actioning donor visibility concerns• Creation of donor-visibility cycle
5. ERCD to organise annual cross-Agency workshop to set down an annual communications work plan
6. Create convincing investment products illustrating social returns
7. Roll out branding guidelines and conduct trainings for key staff in fields and programmes
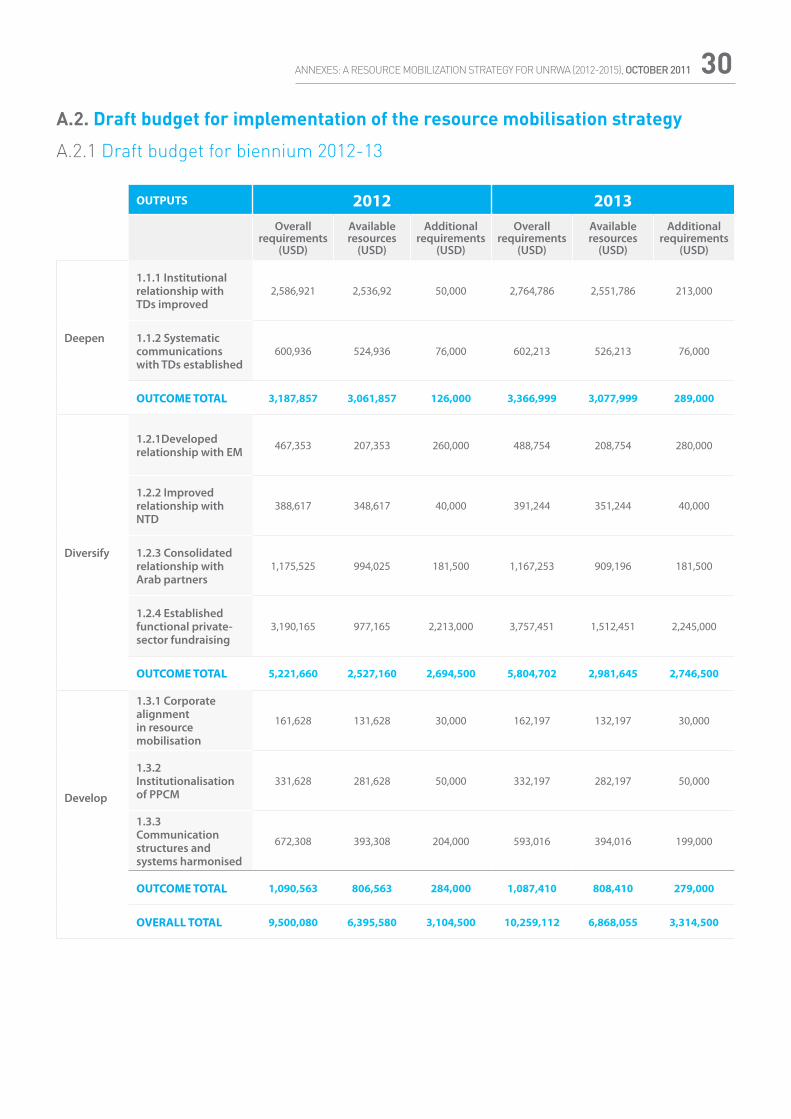
ANNEXES: A RESOURCE MOBILIZATION STRATEGY FOR UNRWA (2012-2015), OCTOBER 2011 30
A.2. Draft budget for implementation of the resource mobilisation strategy
A.2.1 Draft budget for biennium 2012-13
OUTPUTS 2012 2013Overall
requirements (USD)
Available resources
(USD)
Additional requirements
(USD)
Overall requirements
(USD)
Available resources
(USD)
Additional requirements
(USD)
Deepen
1.1.1 Institutional relationship with TDs improved
2,586,921 2,536,92 50,000 2,764,786 2,551,786 213,000
1.1.2 Systematic communications with TDs established
600,936 524,936 76,000 602,213 526,213 76,000
OUTCOME TOTAL 3,187,857 3,061,857 126,000 3,366,999 3,077,999 289,000
Diversify
1.2.1Developed relationship with EM 467,353 207,353 260,000 488,754 208,754 280,000
1.2.2 Improved relationship with NTD
388,617 348,617 40,000 391,244 351,244 40,000
1.2.3 Consolidated relationship with Arab partners
1,175,525 994,025 181,500 1,167,253 909,196 181,500
1.2.4 Established functional private-sector fundraising
3,190,165 977,165 2,213,000 3,757,451 1,512,451 2,245,000
OUTCOME TOTAL 5,221,660 2,527,160 2,694,500 5,804,702 2,981,645 2,746,500
Develop
1.3.1 Corporate alignment in resource mobilisation
161,628 131,628 30,000 162,197 132,197 30,000
1.3.2 Institutionalisation of PPCM
331,628 281,628 50,000 332,197 282,197 50,000
1.3.3 Communication structures and systems harmonised
672,308 393,308 204,000 593,016 394,016 199,000
OUTCOME TOTAL 1,090,563 806,563 284,000 1,087,410 808,410 279,000
OVERALL TOTAL 9,500,080 6,395,580 3,104,500 10,259,112 6,868,055 3,314,500
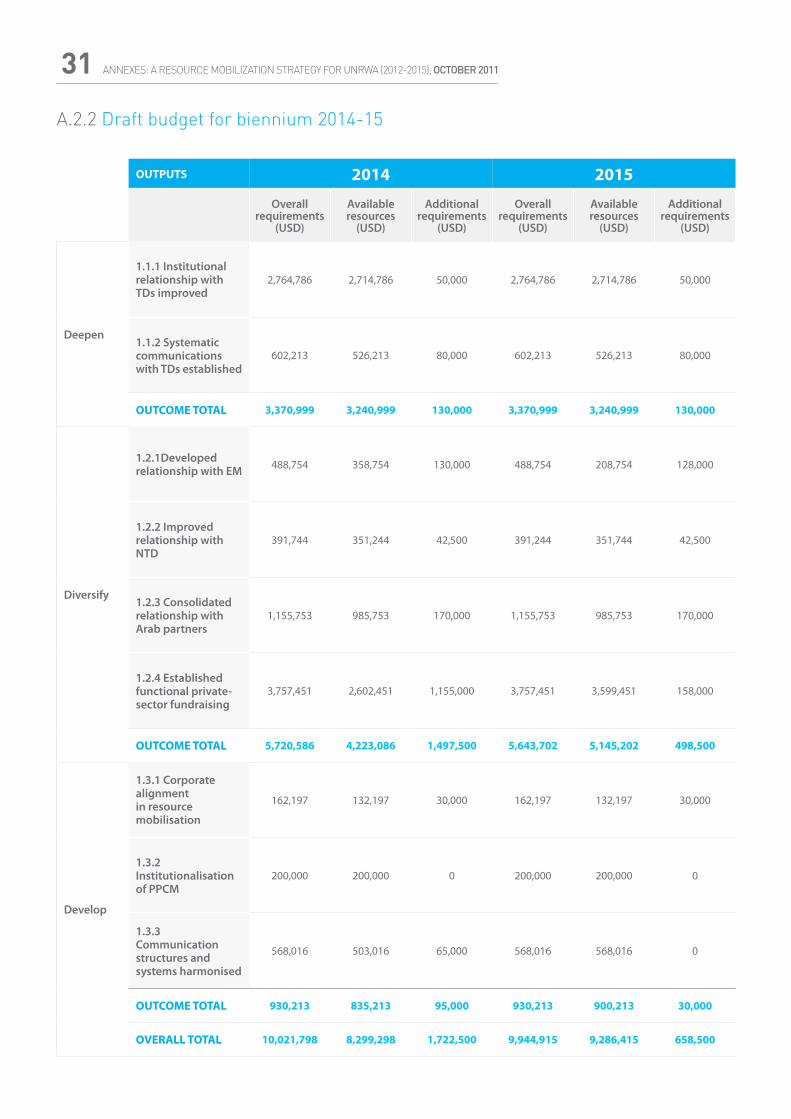
ANNEXES: A RESOURCE MOBILIZATION STRATEGY FOR UNRWA (2012-2015), OCTOBER 201131
A.2.2 Draft budget for biennium 2014-15
OUTPUTS 2014 2015
Overall requirements
(USD)
Available resources
(USD)
Additional requirements
(USD)
Overall requirements
(USD)
Available resources
(USD)
Additional requirements
(USD)
Deepen
1.1.1 Institutional relationship with TDs improved
2,764,786 2,714,786 50,000 2,764,786 2,714,786 50,000
1.1.2 Systematic communications with TDs established
602,213 526,213 80,000 602,213 526,213 80,000
OUTCOME TOTAL 3,370,999 3,240,999 130,000 3,370,999 3,240,999 130,000
Diversify
1.2.1Developed relationship with EM 488,754 358,754 130,000 488,754 208,754 128,000
1.2.2 Improved relationship with NTD
391,744 351,244 42,500 391,244 351,744 42,500
1.2.3 Consolidated relationship with Arab partners
1,155,753 985,753 170,000 1,155,753 985,753 170,000
1.2.4 Established functional private-sector fundraising
3,757,451 2,602,451 1,155,000 3,757,451 3,599,451 158,000
OUTCOME TOTAL 5,720,586 4,223,086 1,497,500 5,643,702 5,145,202 498,500
Develop
1.3.1 Corporate alignment in resource mobilisation
162,197 132,197 30,000 162,197 132,197 30,000
1.3.2 Institutionalisation of PPCM
200,000 200,000 0 200,000 200,000 0
1.3.3 Communication structures and systems harmonised
568,016 503,016 65,000 568,016 568,016 0
OUTCOME TOTAL 930,213 835,213 95,000 930,213 900,213 30,000
OVERALL TOTAL 10,021,798 8,299,298 1,722,500 9,944,915 9,286,415 658,500
ANNEXES: A RESOURCE MOBILIZATION STRATEGY FOR UNRWA (2012-2015), OCTOBER 2011 32
B) INTRODUCTION TO UNRWAOverview of Annex B: Introduction to UNRWA
• Created in 1949, UNRWA has served the needs of three generations of Palestine refugees in advocating and providing for their human development and humanitarian needs.
• Today UNRWA is one of the largest United Nations programs, with a population of 5.1 million Palestine refugees covered by its mandate in 2012. Among United Nations agencies, UNRWA is unique in delivering services directly to beneficiaries.
• The General Assembly renewed the Agency’s mandate most recently in resolution 65/98 of 10 December 2010 when it affirmed the necessity for the continuation of the Agency’s work pending the just resolution of the question of the Palestine refugees.
• UNRWA has set four human development goals for its work with Palestine refugees: a long and healthy life, acquired knowledge and skills, a decent standard of living, and human rights enjoyed to the fullest extent possible; as well as plans and budgets for a related set of 15 projects, each which is measured by a relevant set of indicators.
• UNRWA supports refugees within five fields of operation: Jordan, Lebanon, Syria, Gaza and The West Bank.
• Following extensive consultation with stakeholders in 2008-9 an organisation development programme was conducted in order to review the effectiveness of management systems and progress, with the goal of improving productivity and transparency on funding requirements and the results achieved by projects.
• The key conclusions of this review (many of which are already implemented and some undergoing implementation) include: improving the capability and processes for resource mobilisation, improvements to the strategic planning framework and cycle, a switch to results-based budgeting in which funding needs are precisely tied to programme objectives, implementation of various knowledge management systems including a new ERP system, focused improvements to HR planning including training, and the introduction of new risk management and accountability frameworks.
B.1. OverviewCreated in 1949, UNRWA has served the needs of three generations of Palestine refugees in advocating and providing for their human development and humanitarian needs. UNRWA exerts a stabilising influence among refugees, and through them on the communities, the host countries and the region in which they live.
B.2. HistoryThe United Nations Relief and Works Agency for Palestine Refugees in the Near East (UNRWA) was established within the United Nations (UN) system as a subsidiary organ of the General Assembly by the General Assembly in its resolution 302 (IV) of 08 December 1949, and became operational on 1 May 1950.
The absence since 1948 of a peaceful resolution of the Israeli-Palestinian conflict has contributed to a strong sense of dispossession and injustice among Palestine refugees. This has fueled tensions that are exacerbated by the occupation since 1967 of Palestinian territory and by recurrent armed conflict. Intra-Palestinian divisions further aggravate this volatile political climate, creating a challenging operating environment for UNRWA.
Today UNRWA is one of the largest United Nations programs, with a population of 5.1 million Palestine refugees covered by its mandate in 2012.
The core services UNRWA provides are comparable in nature and scope to those provided by a local or national government. With around 29,000 staff, most of whom are Palestine refugees themselves, UNRWA is one of the largest employers in the Middle East. Over 480,000 children go to UNRWA schools, run by around 22,000 education staff. UNRWA’s 137 health centres across the region received over 10 million patient visits last year. The Agency also assists close to 280,000 of the poorest and most vulnerable refugees with additional assistance provided by a reformed society safety net (SSN) programme targeting the poorest of the poor. Persons with other special needs, such as people with disability, also benefit from specialised services in the Agency’s health centers. Gender is being mainstreamed into UNRWA’s core programmes, with the empowerment of women in their community a key area of focus for the Agency.
As the General Assembly expressed in its resolution 65/100 of 10 December 2010, the Agency has played an essential role for over 60 years since its establishment in providing vital services for the well-being, human development and protection of the Palestine refugees and the amelioration of their plight. The General Assembly renews the Agency’s mandate every three years, most recently in resolution 65/98 of 10 December 2010 when it affirmed the necessity for the continuation of the Agency’s work pending the just resolution of the question of the Palestine refugees.
B.3. MandateUNRWA’s mission is to help Palestine refugees achieve their full potential in human development under the difficult circumstances in which they live, consistent with internationally agreed goals and standards. The Agency fulfils this mission by providing a variety of
ANNEXES: A RESOURCE MOBILIZATION STRATEGY FOR UNRWA (2012-2015), OCTOBER 201133essential services within the framework of international standards to Palestine refugees in the Gaza Strip, the West Bank, Jordan, Lebanon and Syria. Among United Nations agencies, UNRWA is unique in delivering services directly to beneficiaries. UNRWA’s mandate, which derives from the General Assembly and has evolved over time in response to developments in the operational context, extends at present to providing education, health, relief and social services, microfinance and emergency assistance to refugees; infrastructure and camp improvement within refugee camps; and protection.
B.4. Current contextIn 1950, there were approximately 750,000 Palestine refugees. Their number has increased to 5.11 million in 2012, with an average annual growth rate of three per cent (though this is abating). In the past 20 years, the refugee population has nearly doubled. Use of key UNRWA services has increased as a result. Population density (and overcrowding in refugee camps) is amongst the highest in the world and has increased by 18.5 per cent in the last decade. Critical demographic shifts are also apparent. The refugee population is predominantly made up of young people: more than 56 per cent of refugees were under 25 years of age in 2000. In addition, numbers of refugees within camps are slowly declining; only 30 per cent of refugees now live in refugee camps.
In Gaza, a regime of border closures that was intensified during 2007 brought public services, the private sector, and the socio-economic situation to a state of near collapse. From 27 December 2008 to 18 January 2009, intensive armed conflict led to hundreds of civilian deaths and injuries alongside the wide-spread destruction of refugee homes, and civilian and public infrastructure. Almost the entire refugee population was rendered aid-dependent. In the West Bank, the effects of the Israeli occupation, such as the tight regime of access restrictions, settlement expansion along with continuous low-level violence, imposes burdens on daily life that are becoming more permanent, more challenging and demeaning, and more costly to UNRWA and refugees. Intra-Palestinian tension and fighting has had further adverse consequences on the prospects for the occupied Palestinian territory (oPt). In Lebanon, the government has been supportive of efforts to improve the situation of refugees through action on identity documentation, employment and camp conditions. However, the lack of rights afforded to refugees continues to constrain their human development potential. Moreover, refugees in Lebanon are often directly affected by political crises or armed conflict, as demonstrated by the destruction of Nahr al-Bared in 2007, which led to the displacement of 31,000 refugees.
UNRWA’s long period of operation has seen its services stretched and adapted continually to respond to new needs, while the Agency’s core resources have declined in real terms. Data show that with the exception of two periods (1989- 91 and 1993-95), income to UNRWA’s General Fund has declined steadily from a high of USD 100 per refugee in 1991 to USD 60.6 in 2006, picking up again slightly in 2007. The regular budget, including the General Fund and in-kind contributions is the Agency’s primary means of
sustaining core services. A decline in the value of these resources thus places strain on the Agency’s main operations. The effects of the decline are further magnified by the long-term costs arising from under-investment, as in deteriorating infrastructure or acute health conditions caused by poor living conditions.
Checkpoints, access restrictions, and permit requirements in the Gaza Strip and West Bank, including East Jerusalem, are currently a source of increased operational costs and impact the Agency’s budget. In the Gaza Strip alone, the Agency has been forced to palletise goods for import to Gaza through the Kerem Shalom, the only crossing in regular operation. The additional costs associated with storage, demurrage, transportation and palletisation of goods has amounted to over USD 2.3 million in the first six months of 2011 alone. The Agency remains extremely concerned that these additional costs are incurred at a time when UNRWA faces a severe financial crisis not to mention the staff days lost due to closures and other restrictions. Additionally, the Agency has been compelled to seek an additional USD 1.3 million per year from donors in order to comply with the requirements for Israeli approval of UNRWA/UN construction projects and the import of construction materials for those projects.
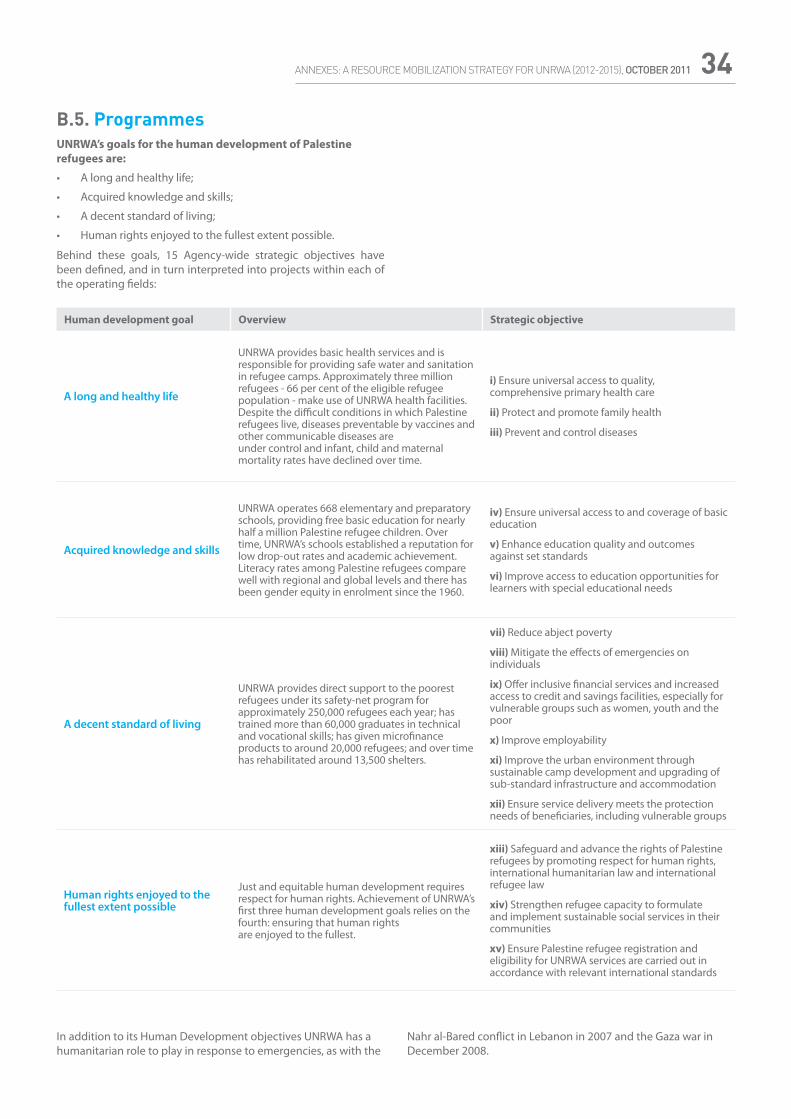
ANNEXES: A RESOURCE MOBILIZATION STRATEGY FOR UNRWA (2012-2015), OCTOBER 2011 34
B.5. ProgrammesUNRWA’s goals for the human development of Palestine refugees are:
• A long and healthy life;
• Acquired knowledge and skills;
• A decent standard of living;
• Human rights enjoyed to the fullest extent possible.
Behind these goals, 15 Agency-wide strategic objectives have been defined, and in turn interpreted into projects within each of the operating fields:
In addition to its Human Development objectives UNRWA has a humanitarian role to play in response to emergencies, as with the
Nahr al-Bared conflict in Lebanon in 2007 and the Gaza war in December 2008.
Human development goal Overview Strategic objective
A long and healthy life
UNRWA provides basic health services and is responsible for providing safe water and sanitation in refugee camps. Approximately three million refugees - 66 per cent of the eligible refugee population - make use of UNRWA health facilities. Despite the difficult conditions in which Palestine refugees live, diseases preventable by vaccines and other communicable diseases areunder control and infant, child and maternal mortality rates have declined over time.
i) Ensure universal access to quality, comprehensive primary health care
ii) Protect and promote family health
iii) Prevent and control diseases
Acquired knowledge and skills
UNRWA operates 668 elementary and preparatory schools, providing free basic education for nearly half a million Palestine refugee children. Overtime, UNRWA’s schools established a reputation for low drop-out rates and academic achievement.Literacy rates among Palestine refugees compare well with regional and global levels and there has been gender equity in enrolment since the 1960.
iv) Ensure universal access to and coverage of basic education
v) Enhance education quality and outcomes against set standards
vi) Improve access to education opportunities for learners with special educational needs
A decent standard of living
UNRWA provides direct support to the poorest refugees under its safety-net program for approximately 250,000 refugees each year; has trained more than 60,000 graduates in technicaland vocational skills; has given microfinance products to around 20,000 refugees; and over time has rehabilitated around 13,500 shelters.
vii) Reduce abject poverty
viii) Mitigate the effects of emergencies on individuals
ix) Offer inclusive financial services and increased access to credit and savings facilities, especially for vulnerable groups such as women, youth and the poor
x) Improve employability
xi) Improve the urban environment through sustainable camp development and upgrading of sub-standard infrastructure and accommodation
xii) Ensure service delivery meets the protection needs of beneficiaries, including vulnerable groups
Human rights enjoyed to the fullest extent possible
Just and equitable human development requires respect for human rights. Achievement of UNRWA’s first three human development goals relies on the fourth: ensuring that human rightsare enjoyed to the fullest.
xiii) Safeguard and advance the rights of Palestine refugees by promoting respect for human rights, international humanitarian law and international refugee law
xiv) Strengthen refugee capacity to formulate and implement sustainable social services in their communities
xv) Ensure Palestine refugee registration and eligibility for UNRWA services are carried out in accordance with relevant international standards
ANNEXES: A RESOURCE MOBILIZATION STRATEGY FOR UNRWA (2012-2015), OCTOBER 201135
B.6. FieldsB.6.1 JordanJordan hosts the most refugees of all the five fields in which UNRWA operates. The more than two million Palestine refugees registered with the Agency constitute 40 per cent of all registered Palestine refugees in the Near East. Only 18 per cent live in the ten official camps. Others live in three unofficial camps, and elsewhere in urban and rural areas, though all share similar socio-economic conditions. The age profile shows a high number of youth, with 49 per cent of refugees aged 24 years or less.
Although UNRWA resources have not kept pace with the scale of the challenge and rising costs in Jordan, it is relatively harder than in other fields where UNRWA operates to generate donor support such as project financing given the relative stability that most refugees enjoy.
UNRWA has three main priorities for the medium term in Jordan:
1. Jordan field office will focus on maintaining core services at acceptable quality compared with government provision.
a. Health: Retaining high-quality staff, strengthening partnership and collaboration, and where possible integration with Jordanian health authorities
b. Education performance and quality: maintain high-quality teachers, as well as upgrading education infrastructure and tackling violence in schools. Action to verify and ensure that refugee children are accessing education either from UNRWA or government schools is also needed.
2. Intensify efforts to help refugees take advantage of the opportunities for employment and human development afforded them by the rights they enjoy in Jordan, to reduce their dependency on assistance.
c. Microfinance programme opening new branch offices in areas hosting a significant urban population of Palestine refugees.
d. Make vocational training more widely available in future and to make courses more relevant to the region’s job market, to equip more refugees to gain relevant, marketable skills. These opportunities will be focused on vulnerable groups, especially youth in response to Jordan’s demographic profile, but also women.
3. Intensify help for the most vulnerable, especially the abject poor and ex-Gazans.
And in line with the Agency’s commitment to protection, UNRWA in Jordan will focus on advocacy and support for ex-Gazans, but will also mainstream human rights concerns throughout its operations, and support vulnerable other groups, in particular refugees with disabilities with targeted programs.
B.6.2 LebanonAround 460,000 Palestine refugees are registered with UNRWA in Lebanon, about 50 per cent of whom live in 12 official refugee camps, while others live in 27 ‘gatherings’ along with Lebanese and other communities.
UNRWA will continue to be a lifeline for refugees in Lebanon, their primary source of education, health and social assistance and a critical advocate for their rights. There is little scope in this context for cutting back services that go beyond what UNRWA provides in other contexts such as secondary education and tertiary health care. The focus for the medium term will be:
1. Better health and education quality2. A better standard of living for the poorest refugees 3. Protection4. To continue with the reconstruction of Nahr el-Bared camp.
In addition, UNRWA in Lebanon will continue to play a significant role in meeting the needs of large numbers of refugees still displaced and living in appalling conditions following the destruction of the Nahr al-Bared camp in 2007.
B.6.3 SyriaThere are nearly 510,000 registered Palestine refugees in Syria. There are 13 refugee camps in Syria and 75 per cent of refugees live in or around Damascus, within and outside camps.
The development context of Syria had been politically stable up until early 2011, permitting a concentration on human development in its broadest sense: the Spring uprising brings into doubt the security of refugees and staff and will obviously require continuous appraisal of the local priorities
In the medium term key priorities will be: (i) sustaining quality core services, and (ii) combating youth unemployment and rising poverty levels.
B.6.4 GazaThere are approximately 1.22 million registered Palestine refugees in Gaza, approximately 43 per cent of whom live in eight camps. The refugee population comprises 74 per cent of the Gazan population.
Conflict has erupted on a number of occasions with devastating consequences for the population. In 2010, around 650,000 refugees received emergency food from UNRWA. All of the more than 200,000 pupils in UNRWA’s Gaza schools received a meal under the school feeding program. The Agency also provided temporary job opportunities to 42,685 beneficiaries, and emergency cash assistance to thousands of refugees who were unable to meet their basic needs. The package of targeted emergency programmes also included the provision of health-care services and the rehabilitation of shelters and water and sanitation infrastructures. Against the backdrop of the blockade, the overarching protection concern in the Gaza Strip continued to be the lack of access for goods and people and its impact on the basic living conditions and enjoyment of human rights of the population.
ANNEXES: A RESOURCE MOBILIZATION STRATEGY FOR UNRWA (2012-2015), OCTOBER 2011 36The task of rebuilding the 4,000 homes destroyed (including more than 2,000 refugees’ homes) and peoples’ lives in the aftermath of the conflict between 27 December 2008 and 18 January 2009 will require coordinated, well-funded recovery and reconstruction efforts on a very large scale.
Gaza field office has four main priorities within the overall framework of Agency goals and objectives:
1. Strengthening of the basic education system through continuing reform ;
2. Meeting the needs of the abject (food-insecure) refugees through the provision of food/cash transfer, as well as through poverty alleviation strategies such as vocational training and job creation opportunities ;
3. Strengthening environmental health services (access to water, sewage networks, and solid waste management) in the camps, as well as where possible to the wider community ;
4. Support to the private construction sector of Gaza through a large-scale reconstruction programme, designed to provide essential infrastructure for UNRWA beneficiaries (schools, shelters, and clinics) as well as the provision of jobs.
B.6.5 West BankThere are approximately 874,000 registered refugees in the West Bank, of whom 25.4 per cent live in 19 refugee camps. Refugees represent 32 per cent of the total population of the West Bank. Thirty-nine per cent of refugees are aged 18 years and below. Since the Al-Aqsa Intifada in late-2000, the protracted socio-economic crisis in the oPt has lead to deteriorating human and economic development and mounting hardships for this Palestinian community. Due to Israeli access and movement restrictions, economic stagnation and forced displacements, Palestinian communities in the West Bank are plagued by high levels of poverty, unemployment, food insecurity and tension.
The complexity of the Palestinian crisis and the depth of Palestine refugees’ needs require a balanced approach; combining humanitarian tools aimed to meet the immediate needs of refugees, with long-term development interventions laying the basis for individual, social and economic development of the refugee community living in the West Bank. To this end, the main priorities of the West Bank can be broadly identified as the following:
1. Ensuring that the poorest and most vulnerable refugees are served through a social protection framework, with emphasis upon protecting the basic consumption of the abject poor, protection of refugees from economic shocks, and reducing abject poverty through increased employability and access to credit.
2. Ensuring that refugees have access to preventive, primary and tertiary health-care facilities, including psycho-social support and community-based crisis-intervention services. This continues to be a significant challenge due to the increased
demand for UNRWA health services as refugees have lost economic access to health care and/or increased poverty has resulted in a general deterioration of the health of refugees.
3. Ensuring school-age children are provided opportunities to learn in safe and supportive UNRWA schools, promoted through the WBFO Education Recovery Plan. This is essential to improving the quality of education received by Palestinian refugee children, thereby ensuring they have the knowledge and skills to succeed in life.
4. Ensuring that the basic human rights of Palestine refugees are protected and strengthened through a consistent and coherent protection strategy implemented in and through UNRWA’s programmes.
B.7. Role of Host CountriesHistorically UNRWA has enjoyed over the decades a solid and productive working relationship with the three Host authorities – Jordan, Syria and Lebanon.
The fact that in Syria and Jordan, Palestine refugees were accorded key rights and free access to the local economy helped both in complementing UNRWA key services and in mitigating the impact of the difficult economic conditions refugees in these two countries lived and continue to live under.
In Lebanon, the situation has been and remains more difficult. Lebanon’s sectarian structure and the controversial history of the PLO in Lebanon combined to create unfavorable living conditions for Palestine refugees complete including the absence of human rights such as the right to work and the right to own property.
Although the PLO does not enjoy any sustained working relationship with UNRWA, the PLO Refugee Department in these countries (and some of the PLO institutions such as the Red Crescent Society) works with UNRWA in an ad-hoc manner to complement some of the services.
Following the establishment of the Palestinian Authority in 1996 it too entered into working arrangements with UNRWA, declaring itself a Host authority vis-à-vis the Agency (for obvious political reasons). At the service level, the PA’s line ministries enjoy a clear working relationship with UNRWA’s health, relief and education departments. Politically, the PLO Refugee Department functions as the official body that liaises and coordinates with UNRWA when it comes to the Agency’s operations in the oPt. That is not the case in the other three Host Countries, where each has separate departments to deal with the Palestinian refugees and coordinate UNRWA activities.
The four host authorities can claim to be de-facto donor countries to UNRWA since they render services to Palestine refugees in complementary areas to UNRWA.
ANNEXES: A RESOURCE MOBILIZATION STRATEGY FOR UNRWA (2012-2015), OCTOBER 201137
B.8. ReformsFollowing the Geneva Conference in 2004, UNRWA’s Medium Term Plan (MTP) for 2005-2009 established a new planning framework with the objective of restoring the living conditions of Palestine refugees to acceptable international standards. The MTP acted as a springboard for discussions on how to strengthen the Agency’s capacity to deliver better-resourced programmes and services to refugees.
In 2005, the Agency launched a comprehensive management reform process (entitled “Organisational Development”) designed to strengthen and sustain the Agency’s capacity for programme management and delivery. Following internal consultations as well as consultations with Hosts and donors, in 2006 the OD plan was adopted. For the following three years, from 2007 to 2009, the Agency proceeded to implement a far-reaching organisational reform process to strengthen its capacity to serve Palestine refugees effectively.
Through OD, the Agency was able to achieve the following key results and achievements:
• Change in UNRWA’s organisational design to facilitate improved delineation of roles and responsibilities and decision-making authority across the Agency;
• Establishment of a results-focused strategic planning process, accompanied by programme cycle-management tools;
• Improvement of Agency procedures, processes, and systems in human resources, procurement, and information technology
• Improvement in the Agency’s public information and communication capacity;
• Greater scope for innovation in programming across the Agency, as demonstrated by the Schools of Excellence Programme in Gaza and the Engaging Youth initiative in Syria.
During 2010, the Agency continued pursuing its reform agenda to modernize management systems and improve the quality of services provided to the refugees. Building on the achievements of the three-year organisational development (OD) process, which concluded in 2009, UNRWA prepared a “Sustaining Change” plan during 2010 with a focus on enhancing programme-effectiveness over the period 2010 to 2012.
The Sustaining Change (SC) initiative was endorsed and launched in 2010 to sustain the gains generated by the organisational development (OD) programme (2007-2009). The initiative offers a comprehensive framework for UNRWA and its stakeholders in seeking to enhance the quality of services for refugees. By focusing on the three core result areas of programme reform, effective resource mobilisation and strong management systems, SC seeks to ensure that all individual reform plans and strategies developed within the Agency are results-oriented and guided by the same coherent goals.
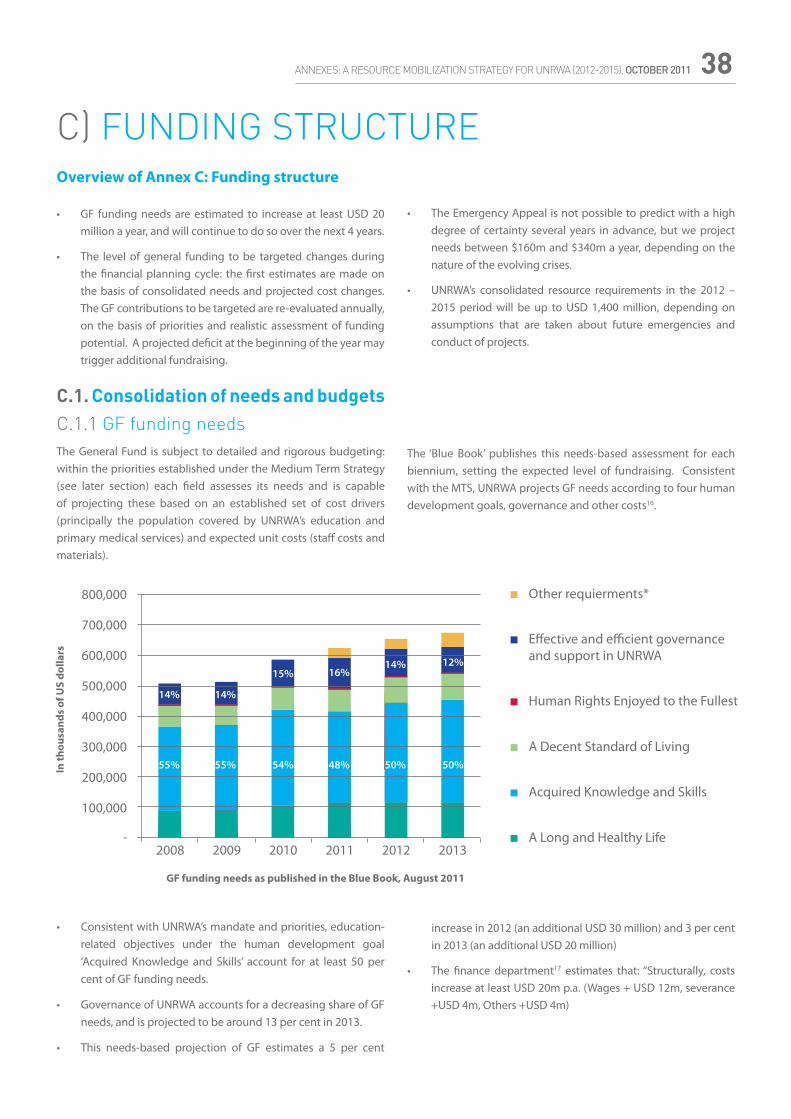
ANNEXES: A RESOURCE MOBILIZATION STRATEGY FOR UNRWA (2012-2015), OCTOBER 2011 38
C) FUNDING STRUCTUREOverview of Annex C: Funding structure
• Consistent with UNRWA’s mandate and priorities, education-related objectives under the human development goal ‘Acquired Knowledge and Skills’ account for at least 50 per cent of GF funding needs.
• Governance of UNRWA accounts for a decreasing share of GF needs, and is projected to be around 13 per cent in 2013.
• This needs-based projection of GF estimates a 5 per cent
• GF funding needs are estimated to increase at least USD 20 million a year, and will continue to do so over the next 4 years.
• The level of general funding to be targeted changes during the financial planning cycle: the first estimates are made on the basis of consolidated needs and projected cost changes. The GF contributions to be targeted are re-evaluated annually, on the basis of priorities and realistic assessment of funding potential. A projected deficit at the beginning of the year may trigger additional fundraising.
• The Emergency Appeal is not possible to predict with a high degree of certainty several years in advance, but we project needs between $160m and $340m a year, depending on the nature of the evolving crises.
• UNRWA’s consolidated resource requirements in the 2012 – 2015 period will be up to USD 1,400 million, depending on assumptions that are taken about future emergencies and conduct of projects.
C.1. Consolidation of needs and budgetsC.1.1 GF funding needsThe General Fund is subject to detailed and rigorous budgeting: within the priorities established under the Medium Term Strategy (see later section) each field assesses its needs and is capable of projecting these based on an established set of cost drivers (principally the population covered by UNRWA’s education and primary medical services) and expected unit costs (staff costs and materials).
The ‘Blue Book’ publishes this needs-based assessment for each biennium, setting the expected level of fundraising. Consistent with the MTS, UNRWA projects GF needs according to four human development goals, governance and other costs16.
increase in 2012 (an additional USD 30 million) and 3 per cent in 2013 (an additional USD 20 million)
• The finance department17 estimates that: “Structurally, costs increase at least USD 20m p.a. (Wages + USD 12m, severance +USD 4m, Others +USD 4m)
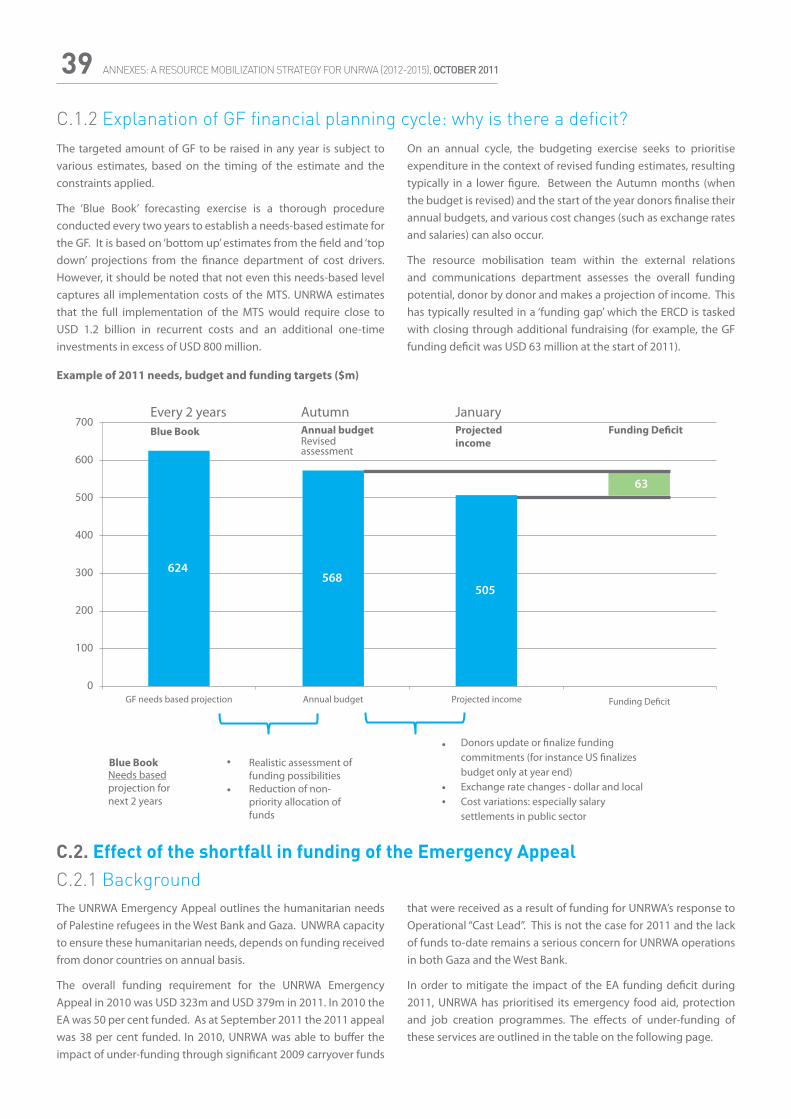
ANNEXES: A RESOURCE MOBILIZATION STRATEGY FOR UNRWA (2012-2015), OCTOBER 201139
C.1.2 Explanation of GF financial planning cycle: why is there a deficit?
C.2. Effect of the shortfall in funding of the Emergency AppealC.2.1 Background
The targeted amount of GF to be raised in any year is subject to various estimates, based on the timing of the estimate and the constraints applied.
The ‘Blue Book’ forecasting exercise is a thorough procedure conducted every two years to establish a needs-based estimate for the GF. It is based on ‘bottom up’ estimates from the field and ‘top down’ projections from the finance department of cost drivers. However, it should be noted that not even this needs-based level captures all implementation costs of the MTS. UNRWA estimates that the full implementation of the MTS would require close to USD 1.2 billion in recurrent costs and an additional one-time investments in excess of USD 800 million.
On an annual cycle, the budgeting exercise seeks to prioritise expenditure in the context of revised funding estimates, resulting typically in a lower figure. Between the Autumn months (when the budget is revised) and the start of the year donors finalise their annual budgets, and various cost changes (such as exchange rates and salaries) can also occur.
The resource mobilisation team within the external relations and communications department assesses the overall funding potential, donor by donor and makes a projection of income. This has typically resulted in a ‘funding gap’ which the ERCD is tasked with closing through additional fundraising (for example, the GF funding deficit was USD 63 million at the start of 2011).
Example of 2011 needs, budget and funding targets ($m)
The UNRWA Emergency Appeal outlines the humanitarian needs of Palestine refugees in the West Bank and Gaza. UNWRA capacity to ensure these humanitarian needs, depends on funding received from donor countries on annual basis.
The overall funding requirement for the UNRWA Emergency Appeal in 2010 was USD 323m and USD 379m in 2011. In 2010 the EA was 50 per cent funded. As at September 2011 the 2011 appeal was 38 per cent funded. In 2010, UNRWA was able to buffer the impact of under-funding through significant 2009 carryover funds
that were received as a result of funding for UNRWA’s response to Operational “Cast Lead”. This is not the case for 2011 and the lack of funds to-date remains a serious concern for UNRWA operations in both Gaza and the West Bank.
In order to mitigate the impact of the EA funding deficit during 2011, UNRWA has prioritised its emergency food aid, protection and job creation programmes. The effects of under-funding of these services are outlined in the table on the following page.
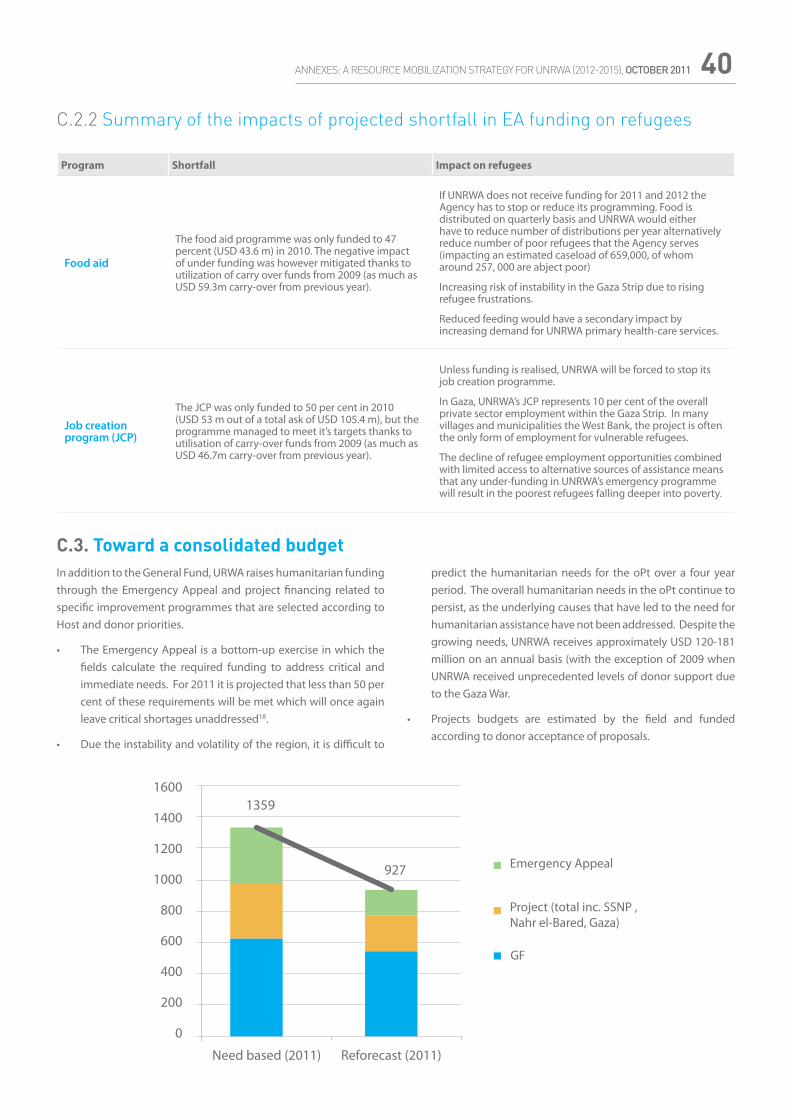
ANNEXES: A RESOURCE MOBILIZATION STRATEGY FOR UNRWA (2012-2015), OCTOBER 2011 40
C.2.2 Summary of the impacts of projected shortfall in EA funding on refugees
Program Shortfall Impact on refugees
Food aid
The food aid programme was only funded to 47 percent (USD 43.6 m) in 2010. The negative impact of under funding was however mitigated thanks to utilization of carry over funds from 2009 (as much as USD 59.3m carry-over from previous year).
If UNRWA does not receive funding for 2011 and 2012 the Agency has to stop or reduce its programming. Food is distributed on quarterly basis and UNRWA would either have to reduce number of distributions per year alternatively reduce number of poor refugees that the Agency serves (impacting an estimated caseload of 659,000, of whom around 257, 000 are abject poor)
Increasing risk of instability in the Gaza Strip due to rising refugee frustrations.
Reduced feeding would have a secondary impact by increasing demand for UNRWA primary health-care services.
Job creation program (JCP)
The JCP was only funded to 50 per cent in 2010 (USD 53 m out of a total ask of USD 105.4 m), but the programme managed to meet it’s targets thanks to utilisation of carry-over funds from 2009 (as much as USD 46.7m carry-over from previous year).
Unless funding is realised, UNRWA will be forced to stop its job creation programme.
In Gaza, UNRWA’s JCP represents 10 per cent of the overall private sector employment within the Gaza Strip. In many villages and municipalities the West Bank, the project is often the only form of employment for vulnerable refugees.
The decline of refugee employment opportunities combined with limited access to alternative sources of assistance means that any under-funding in UNRWA’s emergency programme will result in the poorest refugees falling deeper into poverty.
C.3. Toward a consolidated budgetIn addition to the General Fund, URWA raises humanitarian funding through the Emergency Appeal and project financing related to specific improvement programmes that are selected according to Host and donor priorities.
• The Emergency Appeal is a bottom-up exercise in which the fields calculate the required funding to address critical and immediate needs. For 2011 it is projected that less than 50 per cent of these requirements will be met which will once again leave critical shortages unaddressed18.
• Due the instability and volatility of the region, it is difficult to
predict the humanitarian needs for the oPt over a four year period. The overall humanitarian needs in the oPt continue to persist, as the underlying causes that have led to the need for humanitarian assistance have not been addressed. Despite the growing needs, UNRWA receives approximately USD 120-181 million on an annual basis (with the exception of 2009 when UNRWA received unprecedented levels of donor support due to the Gaza War.
• Projects budgets are estimated by the field and funded according to donor acceptance of proposals.
ANNEXES: A RESOURCE MOBILIZATION STRATEGY FOR UNRWA (2012-2015), OCTOBER 201141
C.4. Projected consolidated funding requirementsBased on the increases to costs estimated by the finance Department, we can project forward GF needs over the four-year period of this resource mobilisation strategy – either from the base of actuals in 2011 or the need-based value.
Project funding requirements are given either in relation to the total estimated, or separated by major programme. Costs are USD millions in constant 2011 terms.
Figures after 2012 are given for information only. Emergency Appeals in particular cannot be predicted accurately, and so we make the assumption that needs will be similar to those in 2011 and the base will be the amount that has been historically feasible to raise.
Actual2010
Projected2011
Needs2011
Base2012
Needs2012
Base2013
Needs2013
Base2014
Needs2014
Base2015
Needs2015
GF 552 543 624 595 654 620 674 640 694 660 714
Lebanon 44 36 95 73 103 73 103 70 103 65 27
Gaza 120 200 60 200 60 200 60 0 60 0
Projects(other) 77 73 60 50 60 50 60 50 60 50 60
Emergency Appeal 168 155 380 160 340 160 340 160 340 160 340
TOTAL 841 927 1359 938 1357 963 1377 980 1197 995 1141
Growth Y/Y ($m) 11 -2 25 20 17 -180 15 -56
Growth Y/Y (%) 1% 0% 3% 1% 2% -13% 2% -5%
C.5. Prioritisation of projects and expenditure reduction measures
Priority services
Highest priority: common to all fields
Core services which UNRWA must ensure: to enable refugees to enjoy their basic rights and to respond to the human development needs and priorities of refugees.
• Basic education
• Comprehensive primary health care
• Relief and direct support (cash, food and shelter) to the abject poor (through safety-net and emergency programmes)
• Environmental health; and improvement of critically substandard shelter, facilities and infrastructure
Priority level two: weighting will vary from field to field
a) Services that meet the needs of the highly vulnerable
and
b) Services that provide a clear and measurable contribution to the human development of Palestine refugees
• Shelter improvement for the most vulnerable
• Social services for the most vulnerable
• Support for hospital services for selected conditions for the most vulnerable
• Advocacy on protection issues
• Technical and vocational education
• Credit and microfinance from MD
• Employment promotion
• Environmental protection activities
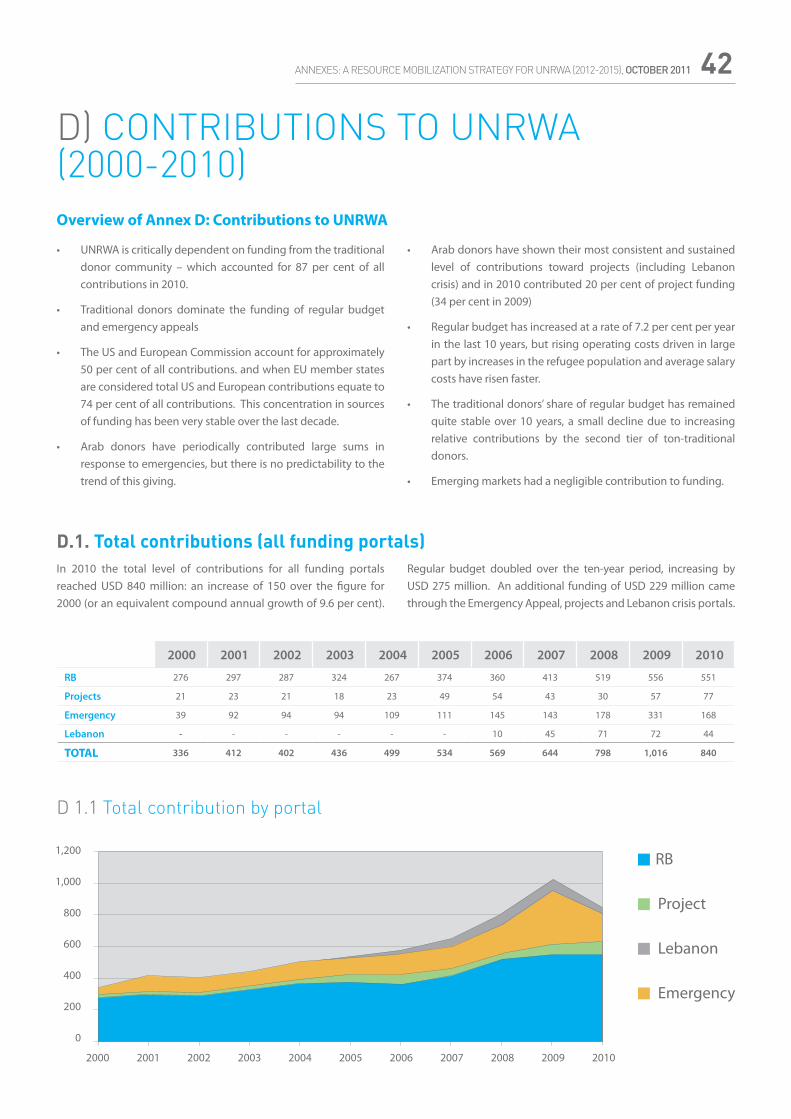
ANNEXES: A RESOURCE MOBILIZATION STRATEGY FOR UNRWA (2012-2015), OCTOBER 2011 42
D) CONTRIBUTIONS TO UNRWA(2000-2010)Overview of Annex D: Contributions to UNRWA
D 1.1 Total contribution by portal
D.1. Total contributions (all funding portals)
• UNRWA is critically dependent on funding from the traditional donor community – which accounted for 87 per cent of all contributions in 2010.
• Traditional donors dominate the funding of regular budget and emergency appeals
• The US and European Commission account for approximately 50 per cent of all contributions. and when EU member states are considered total US and European contributions equate to 74 per cent of all contributions. This concentration in sources of funding has been very stable over the last decade.
• Arab donors have periodically contributed large sums in response to emergencies, but there is no predictability to the trend of this giving.
• Arab donors have shown their most consistent and sustained level of contributions toward projects (including Lebanon crisis) and in 2010 contributed 20 per cent of project funding (34 per cent in 2009)
• Regular budget has increased at a rate of 7.2 per cent per year in the last 10 years, but rising operating costs driven in large part by increases in the refugee population and average salary costs have risen faster.
• The traditional donors’ share of regular budget has remained quite stable over 10 years, a small decline due to increasing relative contributions by the second tier of ton-traditional donors.
• Emerging markets had a negligible contribution to funding.
In 2010 the total level of contributions for all funding portals reached USD 840 million: an increase of 150 over the figure for 2000 (or an equivalent compound annual growth of 9.6 per cent).
Regular budget doubled over the ten-year period, increasing by USD 275 million. An additional funding of USD 229 million came through the Emergency Appeal, projects and Lebanon crisis portals.
2000 2001 2002 2003 2004 2005 2006 2007 2008 2009 2010
RB 276 297 287 324 267 374 360 413 519 556 551
Projects 21 23 21 18 23 49 54 43 30 57 77
Emergency 39 92 94 94 109 111 145 143 178 331 168
Lebanon - - - - - - 10 45 71 72 44
TOTAL 336 412 402 436 499 534 569 644 798 1,016 840
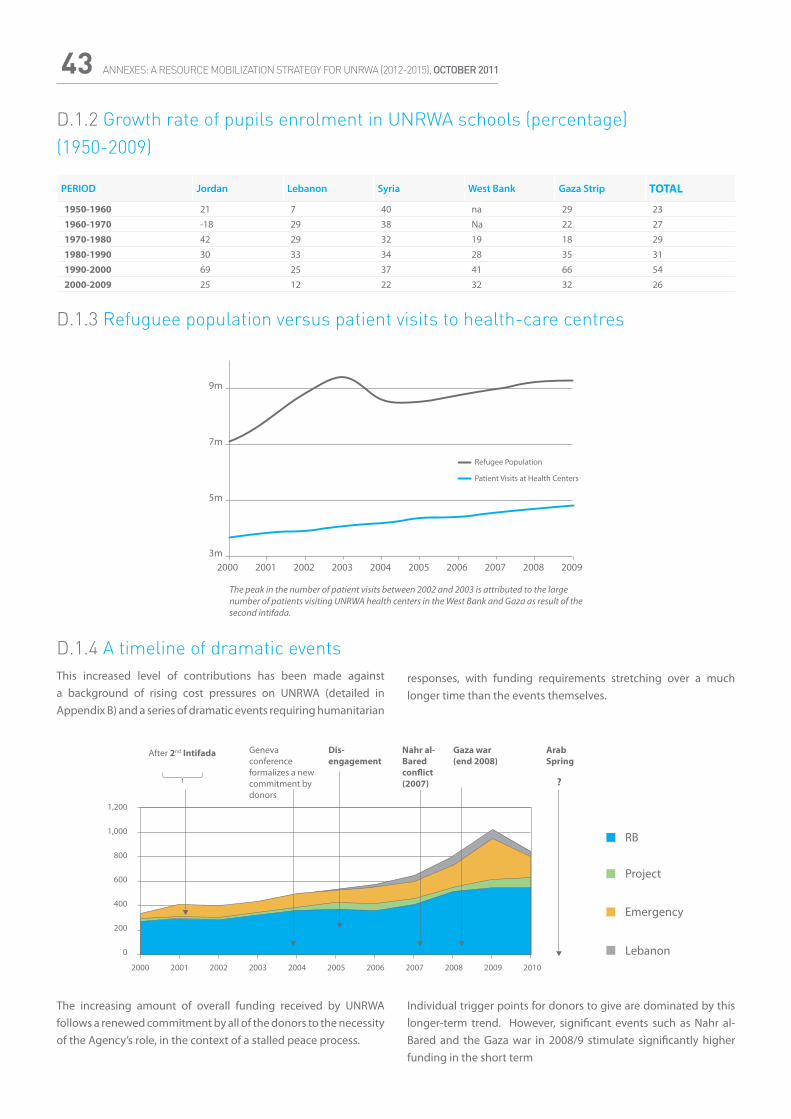
ANNEXES: A RESOURCE MOBILIZATION STRATEGY FOR UNRWA (2012-2015), OCTOBER 201143
D.1.2 Growth rate of pupils enrolment in UNRWA schools (percentage)(1950-2009)
PERIOD Jordan Lebanon Syria West Bank Gaza Strip TOTAL
1950-1960 21 7 40 na 29 23
1960-1970 -18 29 38 Na 22 27
1970-1980 42 29 32 19 18 29
1980-1990 30 33 34 28 35 31
1990-2000 69 25 37 41 66 54
2000-2009 25 12 22 32 32 26
D.1.3 Refuguee population versus patient visits to health-care centres
D.1.4 A timeline of dramatic events This increased level of contributions has been made against a background of rising cost pressures on UNRWA (detailed in Appendix B) and a series of dramatic events requiring humanitarian
responses, with funding requirements stretching over a much longer time than the events themselves.
The increasing amount of overall funding received by UNRWA follows a renewed commitment by all of the donors to the necessity of the Agency’s role, in the context of a stalled peace process.
Individual trigger points for donors to give are dominated by this longer-term trend. However, significant events such as Nahr al-Bared and the Gaza war in 2008/9 stimulate significantly higher funding in the short term
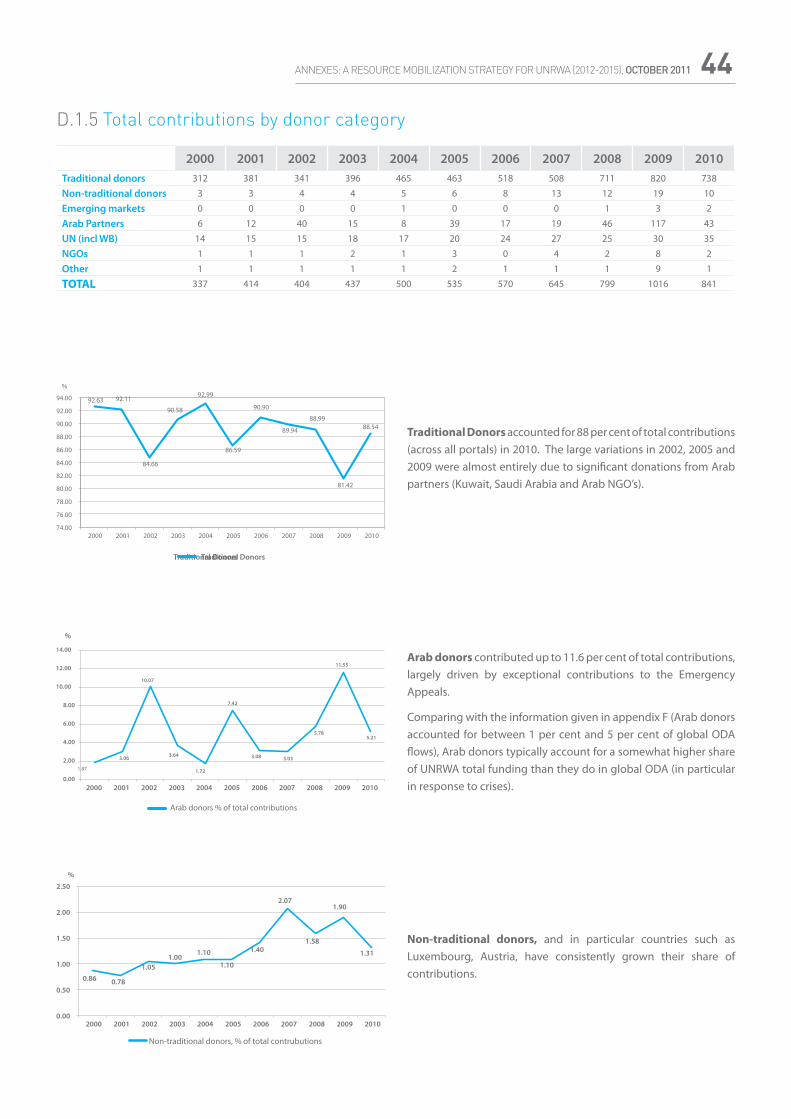
ANNEXES: A RESOURCE MOBILIZATION STRATEGY FOR UNRWA (2012-2015), OCTOBER 2011 44
D.1.5 Total contributions by donor category
2000 2001 2002 2003 2004 2005 2006 2007 2008 2009 2010Traditional donors 312 381 341 396 465 463 518 508 711 820 738
Non-traditional donors 3 3 4 4 5 6 8 13 12 19 10
Emerging markets 0 0 0 0 1 0 0 0 1 3 2
Arab Partners 6 12 40 15 8 39 17 19 46 117 43
UN (incl WB) 14 15 15 18 17 20 24 27 25 30 35
NGOs 1 1 1 2 1 3 0 4 2 8 2
Other 1 1 1 1 1 2 1 1 1 9 1
TOTAL 337 414 404 437 500 535 570 645 799 1016 841
Traditional Donors accounted for 88 per cent of total contributions (across all portals) in 2010. The large variations in 2002, 2005 and 2009 were almost entirely due to significant donations from Arab partners (Kuwait, Saudi Arabia and Arab NGO’s).
Arab donors contributed up to 11.6 per cent of total contributions, largely driven by exceptional contributions to the Emergency Appeals.
Comparing with the information given in appendix F (Arab donors accounted for between 1 per cent and 5 per cent of global ODA flows), Arab donors typically account for a somewhat higher share of UNRWA total funding than they do in global ODA (in particular in response to crises).
Non-traditional donors, and in particular countries such as Luxembourg, Austria, have consistently grown their share of contributions.
Traditional Donors
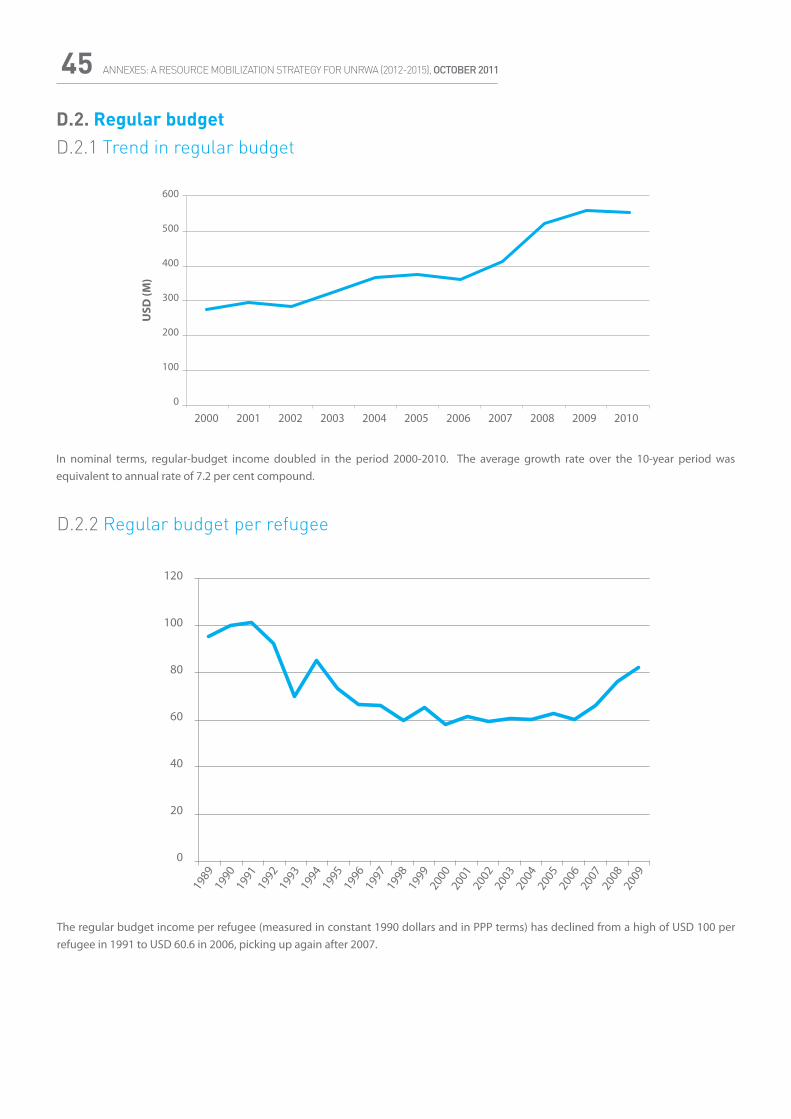
ANNEXES: A RESOURCE MOBILIZATION STRATEGY FOR UNRWA (2012-2015), OCTOBER 201145
D.2. Regular budgetD.2.1 Trend in regular budget
In nominal terms, regular-budget income doubled in the period 2000-2010. The average growth rate over the 10-year period was equivalent to annual rate of 7.2 per cent compound.
D.2.2 Regular budget per refugee
The regular budget income per refugee (measured in constant 1990 dollars and in PPP terms) has declined from a high of USD 100 per refugee in 1991 to USD 60.6 in 2006, picking up again after 2007.
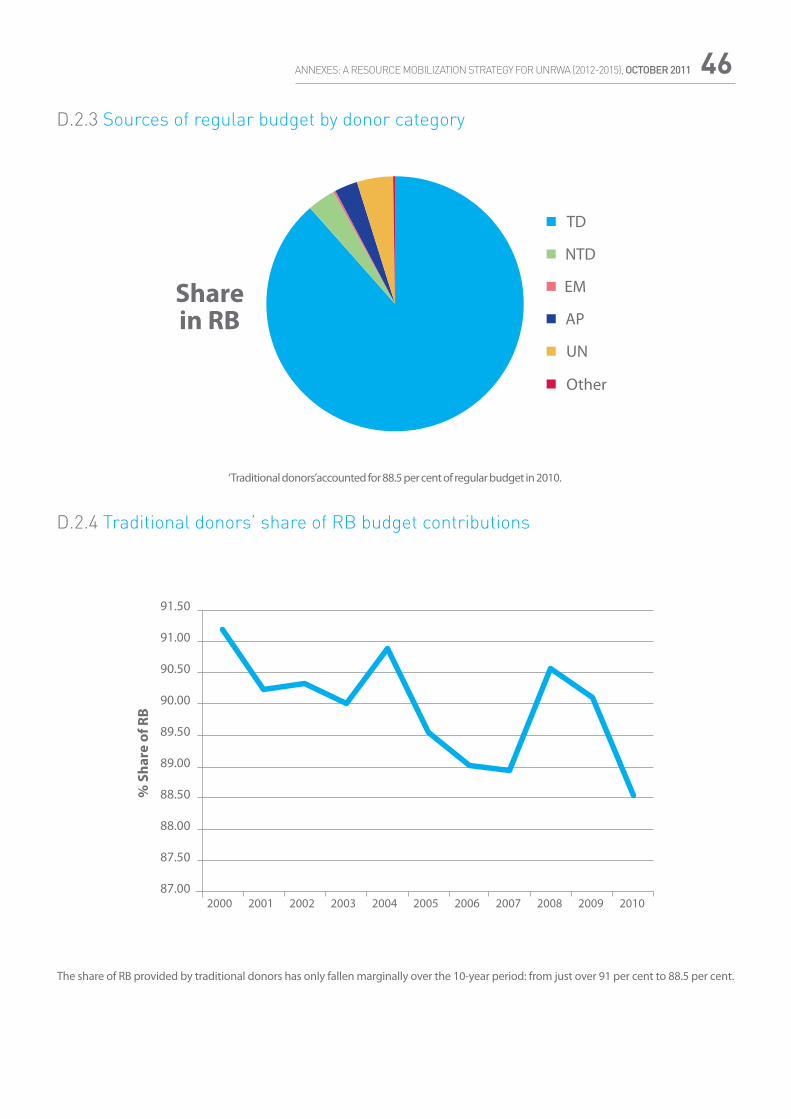
ANNEXES: A RESOURCE MOBILIZATION STRATEGY FOR UNRWA (2012-2015), OCTOBER 2011 46
D.2.3 Sources of regular budget by donor category
‘Traditional donors’accounted for 88.5 per cent of regular budget in 2010.
D.2.4 Traditional donors’ share of RB budget contributions
The share of RB provided by traditional donors has only fallen marginally over the 10-year period: from just over 91 per cent to 88.5 per cent.
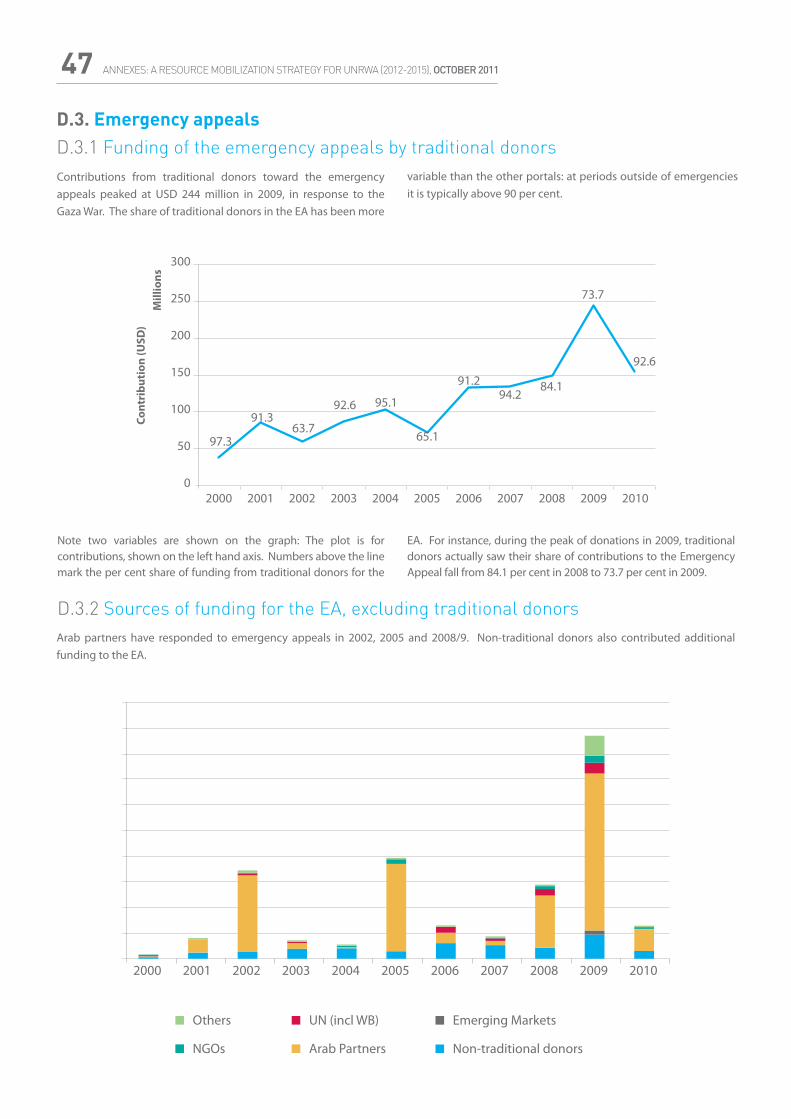
ANNEXES: A RESOURCE MOBILIZATION STRATEGY FOR UNRWA (2012-2015), OCTOBER 201147
D.3.2 Sources of funding for the EA, excluding traditional donors
Note two variables are shown on the graph: The plot is for contributions, shown on the left hand axis. Numbers above the line mark the per cent share of funding from traditional donors for the
D.3. Emergency appealsD.3.1 Funding of the emergency appeals by traditional donorsContributions from traditional donors toward the emergency appeals peaked at USD 244 million in 2009, in response to the Gaza War. The share of traditional donors in the EA has been more
variable than the other portals: at periods outside of emergencies it is typically above 90 per cent.
EA. For instance, during the peak of donations in 2009, traditional donors actually saw their share of contributions to the Emergency Appeal fall from 84.1 per cent in 2008 to 73.7 per cent in 2009.
Arab partners have responded to emergency appeals in 2002, 2005 and 2008/9. Non-traditional donors also contributed additional funding to the EA.
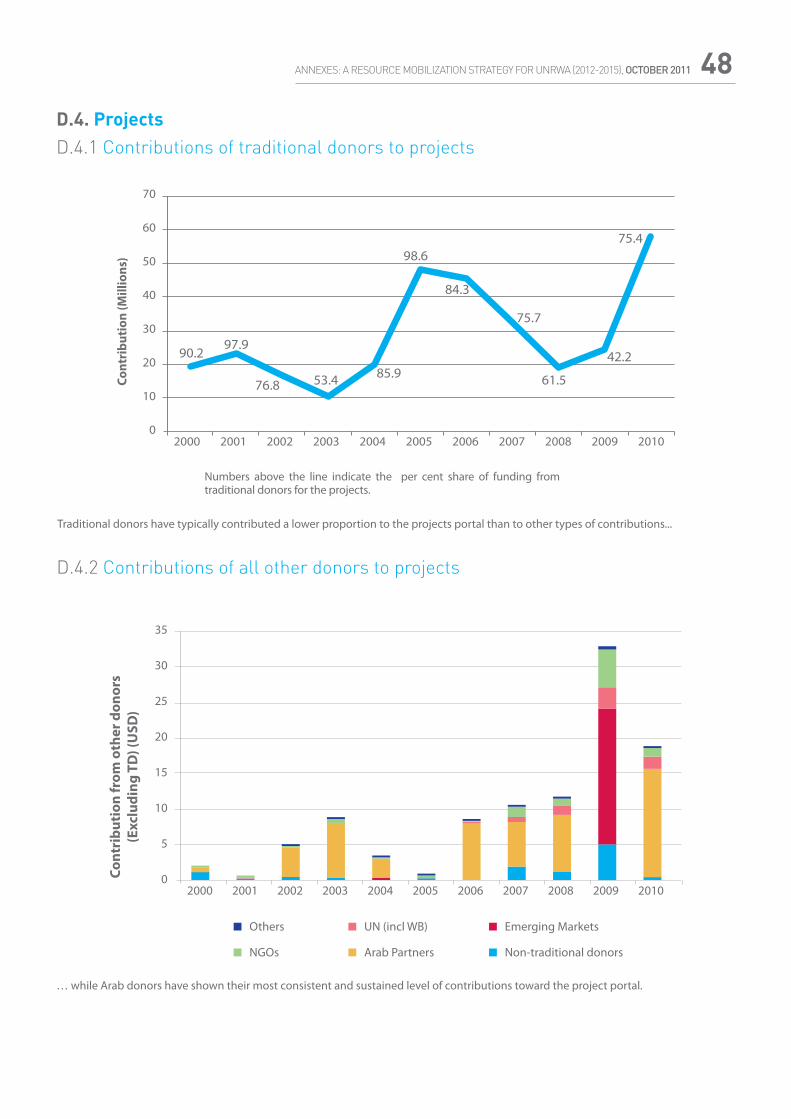
ANNEXES: A RESOURCE MOBILIZATION STRATEGY FOR UNRWA (2012-2015), OCTOBER 2011 48
Traditional donors have typically contributed a lower proportion to the projects portal than to other types of contributions...
D.4.2 Contributions of all other donors to projects
D.4. ProjectsD.4.1 Contributions of traditional donors to projects
Numbers above the line indicate the per cent share of funding from traditional donors for the projects.
… while Arab donors have shown their most consistent and sustained level of contributions toward the project portal.
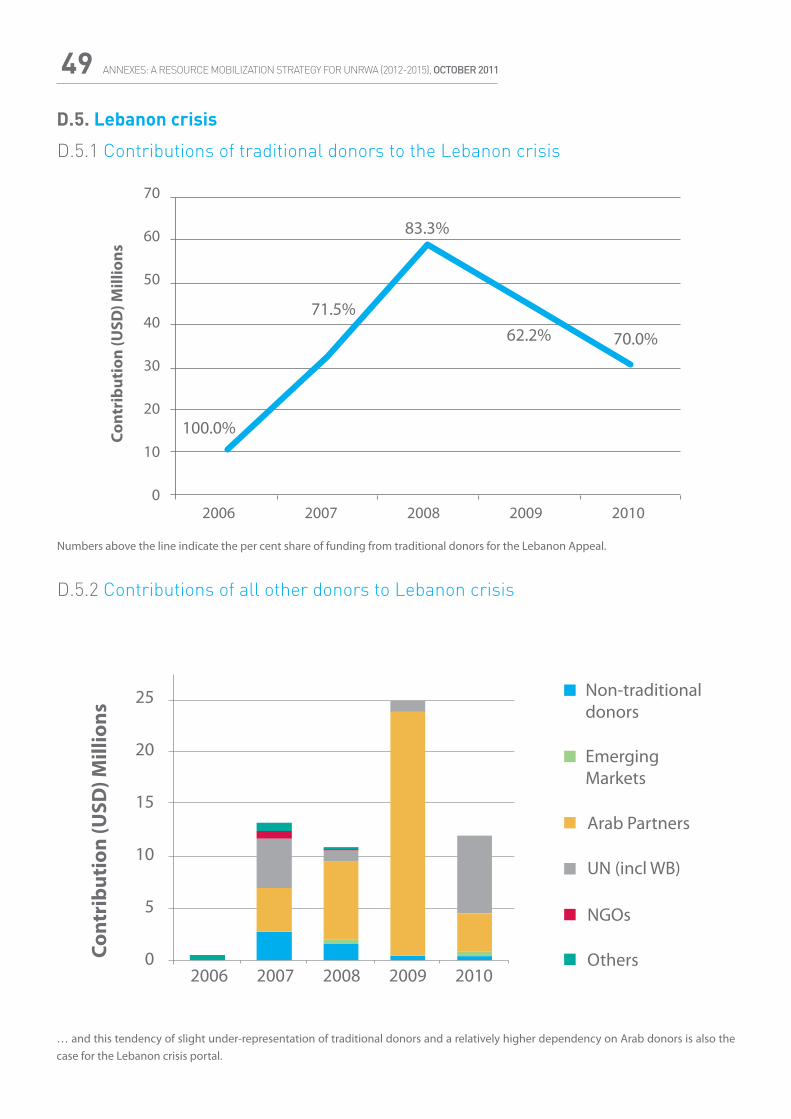
ANNEXES: A RESOURCE MOBILIZATION STRATEGY FOR UNRWA (2012-2015), OCTOBER 201149
D.5. Lebanon crisis
D.5.1 Contributions of traditional donors to the Lebanon crisis
Numbers above the line indicate the per cent share of funding from traditional donors for the Lebanon Appeal.
D.5.2 Contributions of all other donors to Lebanon crisis
… and this tendency of slight under-representation of traditional donors and a relatively higher dependency on Arab donors is also the case for the Lebanon crisis portal.
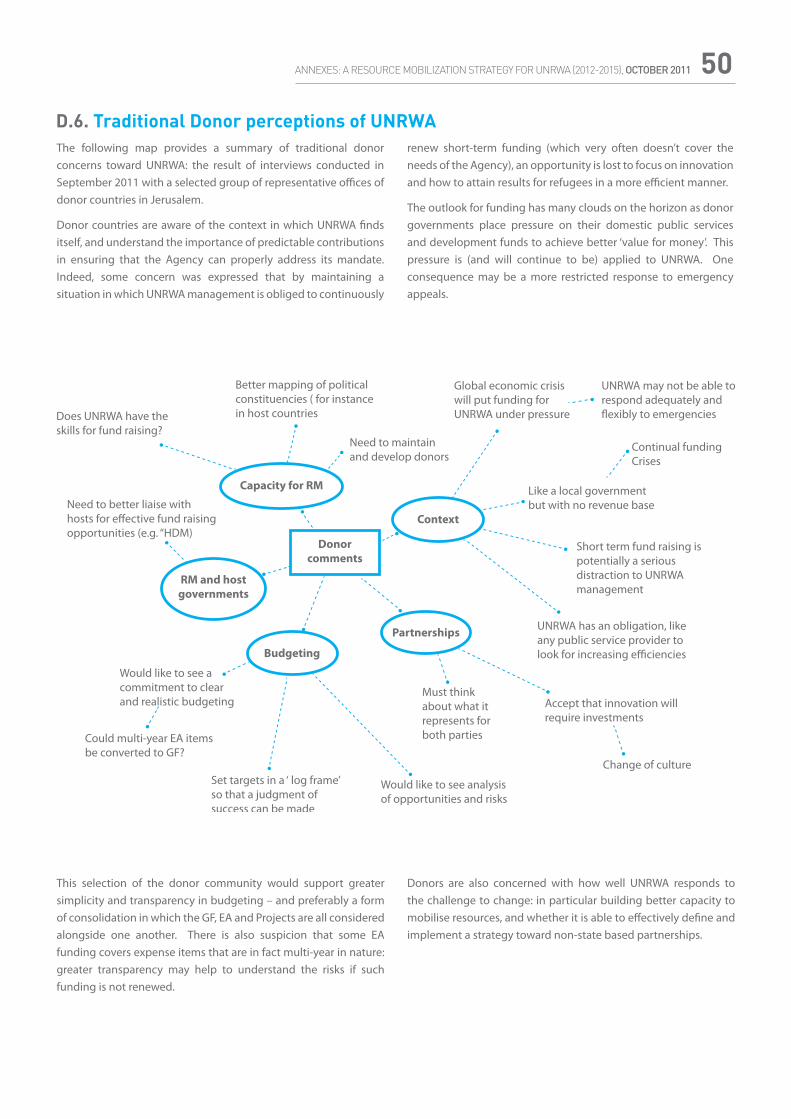
ANNEXES: A RESOURCE MOBILIZATION STRATEGY FOR UNRWA (2012-2015), OCTOBER 2011 50
D.6. Traditional Donor perceptions of UNRWA
This selection of the donor community would support greater simplicity and transparency in budgeting – and preferably a form of consolidation in which the GF, EA and Projects are all considered alongside one another. There is also suspicion that some EA funding covers expense items that are in fact multi-year in nature: greater transparency may help to understand the risks if such funding is not renewed.
Donors are also concerned with how well UNRWA responds to the challenge to change: in particular building better capacity to mobilise resources, and whether it is able to effectively define and implement a strategy toward non-state based partnerships.
The following map provides a summary of traditional donor concerns toward UNRWA: the result of interviews conducted in September 2011 with a selected group of representative offices of donor countries in Jerusalem.
Donor countries are aware of the context in which UNRWA finds itself, and understand the importance of predictable contributions in ensuring that the Agency can properly address its mandate. Indeed, some concern was expressed that by maintaining a situation in which UNRWA management is obliged to continuously
renew short-term funding (which very often doesn’t cover the needs of the Agency), an opportunity is lost to focus on innovation and how to attain results for refugees in a more efficient manner.
The outlook for funding has many clouds on the horizon as donor governments place pressure on their domestic public services and development funds to achieve better ‘value for money’. This pressure is (and will continue to be) applied to UNRWA. One consequence may be a more restricted response to emergency appeals.
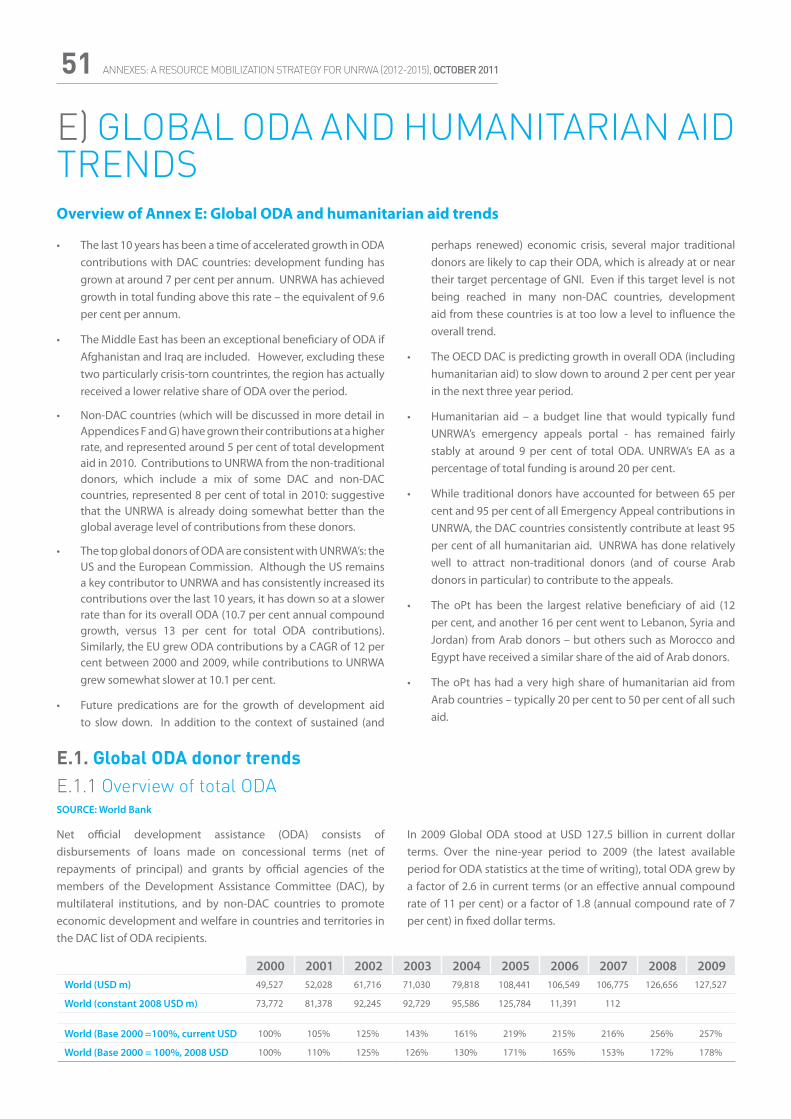
ANNEXES: A RESOURCE MOBILIZATION STRATEGY FOR UNRWA (2012-2015), OCTOBER 201151
E) GLOBAL ODA AND HUMANITARIAN AIDTRENDSOverview of Annex E: Global ODA and humanitarian aid trends
E.1. Global ODA donor trendsE.1.1 Overview of total ODASOURCE: World Bank
Net official development assistance (ODA) consists of disbursements of loans made on concessional terms (net of repayments of principal) and grants by official agencies of the members of the Development Assistance Committee (DAC), by multilateral institutions, and by non-DAC countries to promote economic development and welfare in countries and territories in the DAC list of ODA recipients.
• The last 10 years has been a time of accelerated growth in ODA contributions with DAC countries: development funding has grown at around 7 per cent per annum. UNRWA has achieved growth in total funding above this rate – the equivalent of 9.6 per cent per annum.
• The Middle East has been an exceptional beneficiary of ODA if Afghanistan and Iraq are included. However, excluding these two particularly crisis-torn countrintes, the region has actually received a lower relative share of ODA over the period.
• Non-DAC countries (which will be discussed in more detail in Appendices F and G) have grown their contributions at a higher rate, and represented around 5 per cent of total development aid in 2010. Contributions to UNRWA from the non-traditional donors, which include a mix of some DAC and non-DAC countries, represented 8 per cent of total in 2010: suggestive that the UNRWA is already doing somewhat better than the global average level of contributions from these donors.
• The top global donors of ODA are consistent with UNRWA’s: the US and the European Commission. Although the US remains a key contributor to UNRWA and has consistently increased its contributions over the last 10 years, it has down so at a slower rate than for its overall ODA (10.7 per cent annual compound growth, versus 13 per cent for total ODA contributions). Similarly, the EU grew ODA contributions by a CAGR of 12 per cent between 2000 and 2009, while contributions to UNRWA grew somewhat slower at 10.1 per cent.
• Future predications are for the growth of development aid to slow down. In addition to the context of sustained (and
perhaps renewed) economic crisis, several major traditional donors are likely to cap their ODA, which is already at or near their target percentage of GNI. Even if this target level is not being reached in many non-DAC countries, development aid from these countries is at too low a level to influence the overall trend.
• The OECD DAC is predicting growth in overall ODA (including humanitarian aid) to slow down to around 2 per cent per year in the next three year period.
• Humanitarian aid – a budget line that would typically fund UNRWA’s emergency appeals portal - has remained fairly stably at around 9 per cent of total ODA. UNRWA’s EA as a percentage of total funding is around 20 per cent.
• While traditional donors have accounted for between 65 per cent and 95 per cent of all Emergency Appeal contributions in UNRWA, the DAC countries consistently contribute at least 95 per cent of all humanitarian aid. UNRWA has done relatively well to attract non-traditional donors (and of course Arab donors in particular) to contribute to the appeals.
• The oPt has been the largest relative beneficiary of aid (12 per cent, and another 16 per cent went to Lebanon, Syria and Jordan) from Arab donors – but others such as Morocco and Egypt have received a similar share of the aid of Arab donors.
• The oPt has had a very high share of humanitarian aid from Arab countries – typically 20 per cent to 50 per cent of all such aid.
In 2009 Global ODA stood at USD 127.5 billion in current dollar terms. Over the nine-year period to 2009 (the latest available period for ODA statistics at the time of writing), total ODA grew by a factor of 2.6 in current terms (or an effective annual compound rate of 11 per cent) or a factor of 1.8 (annual compound rate of 7 per cent) in fixed dollar terms.
2000 2001 2002 2003 2004 2005 2006 2007 2008 2009World (USD m) 49,527 52,028 61,716 71,030 79,818 108,441 106,549 106,775 126,656 127,527
World (constant 2008 USD m) 73,772 81,378 92,245 92,729 95,586 125,784 11,391 112
World (Base 2000 =100%, current USD 100% 105% 125% 143% 161% 219% 215% 216% 256% 257%
World (Base 2000 = 100%, 2008 USD 100% 110% 125% 126% 130% 171% 165% 153% 172% 178%
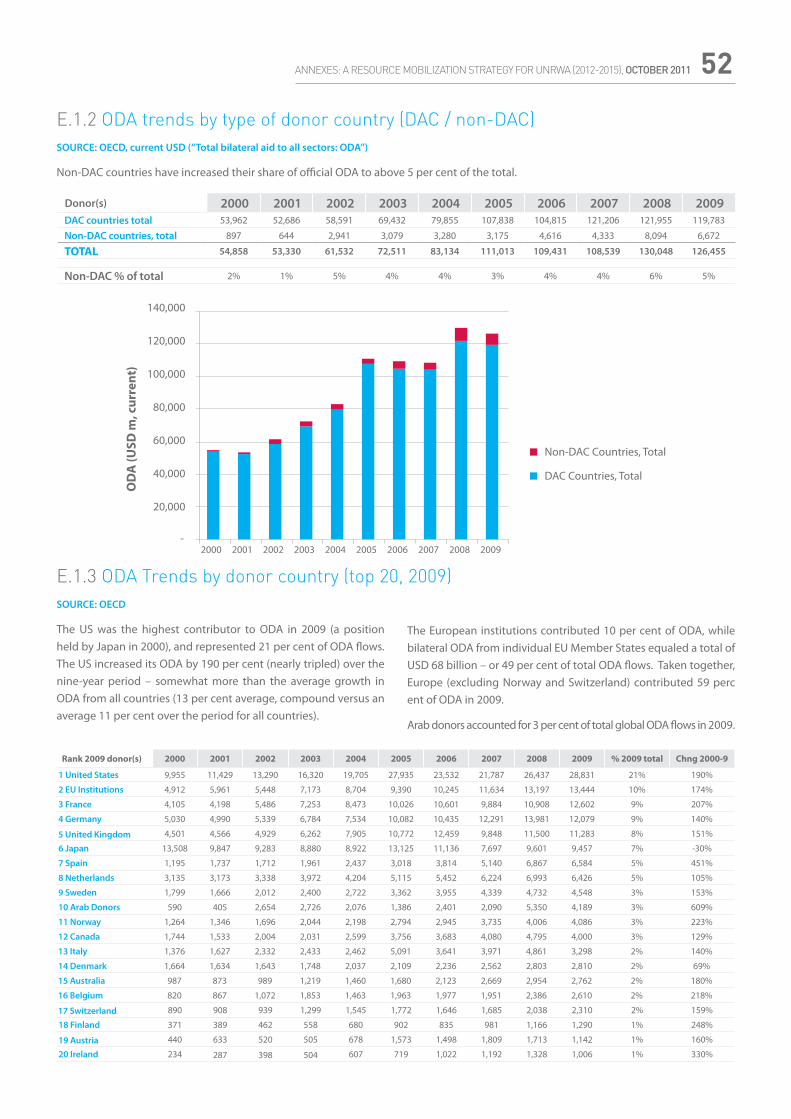
ANNEXES: A RESOURCE MOBILIZATION STRATEGY FOR UNRWA (2012-2015), OCTOBER 2011 52
E.1.2 ODA trends by type of donor country (DAC / non-DAC)SOURCE: OECD, current USD (“Total bilateral aid to all sectors: ODA”)
Non-DAC countries have increased their share of official ODA to above 5 per cent of the total.
Donor(s) 2000 2001 2002 2003 2004 2005 2006 2007 2008 2009DAC countries total 53,962 52,686 58,591 69,432 79,855 107,838 104,815 121,206 121,955 119,783
Non-DAC countries, total 897 644 2,941 3,079 3,280 3,175 4,616 4,333 8,094 6,672
TOTAL 54,858 53,330 61,532 72,511 83,134 111,013 109,431 108,539 130,048 126,455
Non-DAC % of total 2% 1% 5% 4% 4% 3% 4% 4% 6% 5%
SOURCE: OECD
The US was the highest contributor to ODA in 2009 (a position held by Japan in 2000), and represented 21 per cent of ODA flows. The US increased its ODA by 190 per cent (nearly tripled) over the nine-year period – somewhat more than the average growth in ODA from all countries (13 per cent average, compound versus an average 11 per cent over the period for all countries).
The European institutions contributed 10 per cent of ODA, while bilateral ODA from individual EU Member States equaled a total of USD 68 billion – or 49 per cent of total ODA flows. Taken together, Europe (excluding Norway and Switzerland) contributed 59 perc ent of ODA in 2009.
Arab donors accounted for 3 per cent of total global ODA flows in 2009.
Rank 2009 donor(s) 2000 2001 2002 2003 2004 2005 2006 2007 2008 2009 % 2009 total Chng 2000-9
1 United States 9,955 11,429 13,290 16,320 19,705 27,935 23,532 21,787 26,437 28,831 21% 190%
2 EU Institutions 4,912 5,961 5,448 7,173 8,704 9,390 10,245 11,634 13,197 13,444 10% 174%
3 France 4,105 4,198 5,486 7,253 8,473 10,026 10,601 9,884 10,908 12,602 9% 207%
4 Germany 5,030 4,990 5,339 6,784 7,534 10,082 10,435 12,291 13,981 12,079 9% 140%
5 United Kingdom 4,501 4,566 4,929 6,262 7,905 10,772 12,459 9,848 11,500 11,283 8% 151%
6 Japan 13,508 9,847 9,283 8,880 8,922 13,125 11,136 7,697 9,601 9,457 7% -30%
7 Spain 1,195 1,737 1,712 1,961 2,437 3,018 3,814 5,140 6,867 6,584 5% 451%
8 Netherlands 3,135 3,173 3,338 3,972 4,204 5,115 5,452 6,224 6,993 6,426 5% 105%
9 Sweden 1,799 1,666 2,012 2,400 2,722 3,362 3,955 4,339 4,732 4,548 3% 153%
10 Arab Donors 590 405 2,654 2,726 2,076 1,386 2,401 2,090 5,350 4,189 3% 609%
11 Norway 1,264 1,346 1,696 2,044 2,198 2,794 2,945 3,735 4,006 4,086 3% 223%
12 Canada 1,744 1,533 2,004 2,031 2,599 3,756 3,683 4,080 4,795 4,000 3% 129%
13 Italy 1,376 1,627 2,332 2,433 2,462 5,091 3,641 3,971 4,861 3,298 2% 140%
14 Denmark 1,664 1,634 1,643 1,748 2,037 2,109 2,236 2,562 2,803 2,810 2% 69%
15 Australia 987 873 989 1,219 1,460 1,680 2,123 2,669 2,954 2,762 2% 180%
16 Belgium 820 867 1,072 1,853 1,463 1,963 1,977 1,951 2,386 2,610 2% 218%
17 Switzerland 890 908 939 1,299 1,545 1,772 1,646 1,685 2,038 2,310 2% 159%
18 Finland 371 389 462 558 680 902 835 981 1,166 1,290 1% 248%
19 Austria 440 633 520 505 678 1,573 1,498 1,809 1,713 1,142 1% 160%
20 Ireland 234 287 398 504 607 719 1,022 1,192 1,328 1,006 1% 330%
E.1.3 ODA Trends by donor country (top 20, 2009)
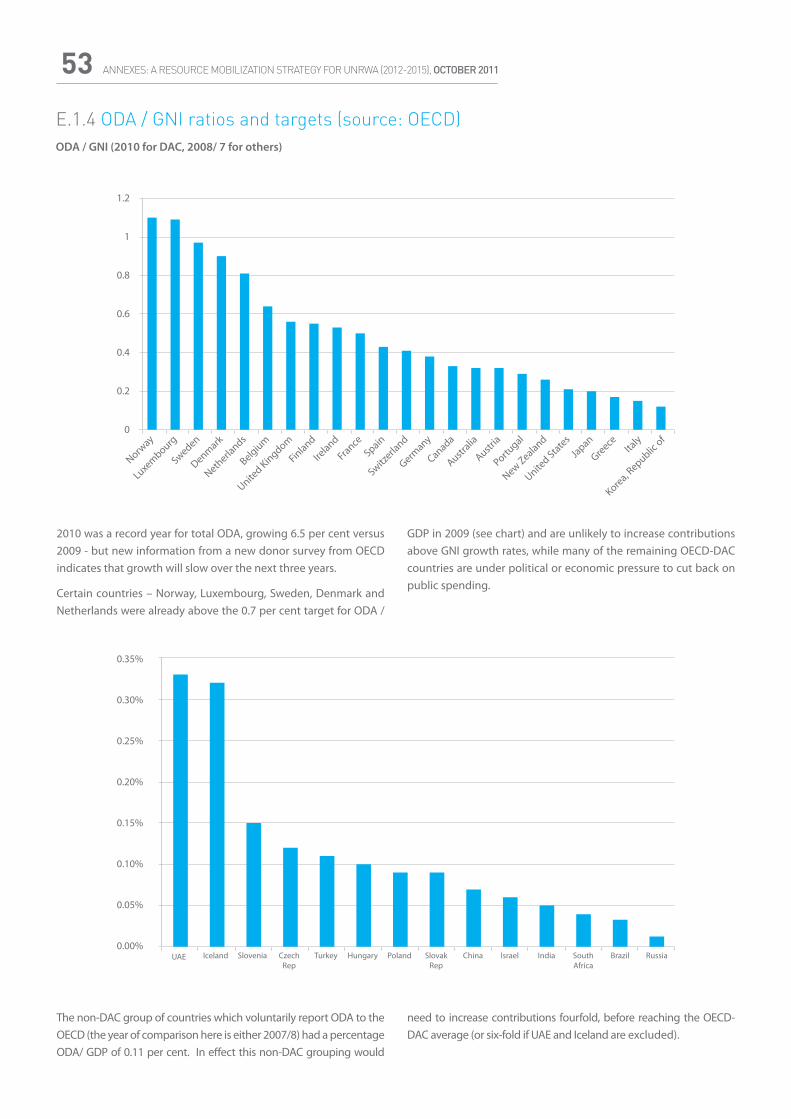
ANNEXES: A RESOURCE MOBILIZATION STRATEGY FOR UNRWA (2012-2015), OCTOBER 201153
E.1.4 ODA / GNI ratios and targets (source: OECD)ODA / GNI (2010 for DAC, 2008/ 7 for others)
2010 was a record year for total ODA, growing 6.5 per cent versus 2009 - but new information from a new donor survey from OECD indicates that growth will slow over the next three years.
Certain countries – Norway, Luxembourg, Sweden, Denmark and Netherlands were already above the 0.7 per cent target for ODA /
The non-DAC group of countries which voluntarily report ODA to the OECD (the year of comparison here is either 2007/8) had a percentage ODA/ GDP of 0.11 per cent. In effect this non-DAC grouping would
GDP in 2009 (see chart) and are unlikely to increase contributions above GNI growth rates, while many of the remaining OECD-DAC countries are under political or economic pressure to cut back on public spending.
need to increase contributions fourfold, before reaching the OECD-DAC average (or six-fold if UAE and Iceland are excluded).
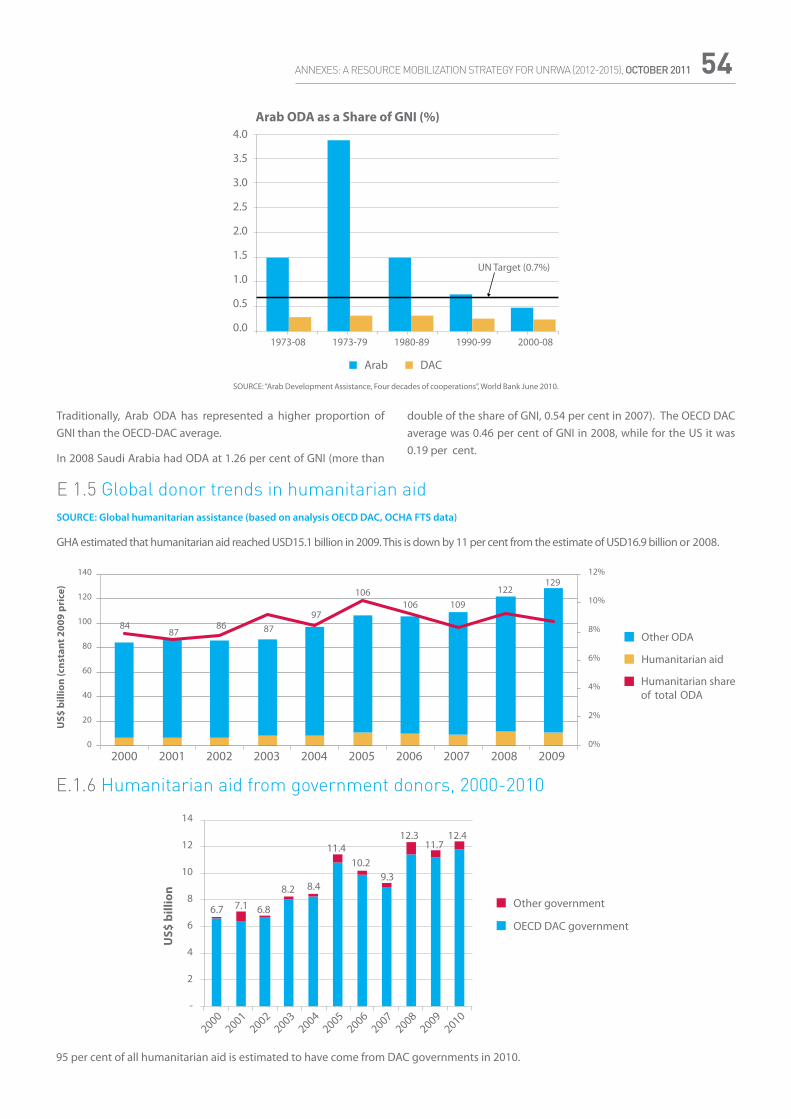
ANNEXES: A RESOURCE MOBILIZATION STRATEGY FOR UNRWA (2012-2015), OCTOBER 2011 54
SOURCE: “Arab Development Assistance, Four decades of cooperations”, World Bank June 2010.
E 1.5 Global donor trends in humanitarian aidSOURCE: Global humanitarian assistance (based on analysis OECD DAC, OCHA FTS data)
GHA estimated that humanitarian aid reached USD15.1 billion in 2009. This is down by 11 per cent from the estimate of USD16.9 billion or 2008.
Traditionally, Arab ODA has represented a higher proportion of GNI than the OECD-DAC average.
In 2008 Saudi Arabia had ODA at 1.26 per cent of GNI (more than
E.1.6 Humanitarian aid from government donors, 2000-2010
95 per cent of all humanitarian aid is estimated to have come from DAC governments in 2010.
double of the share of GNI, 0.54 per cent in 2007). The OECD DAC average was 0.46 per cent of GNI in 2008, while for the US it was 0.19 per cent.
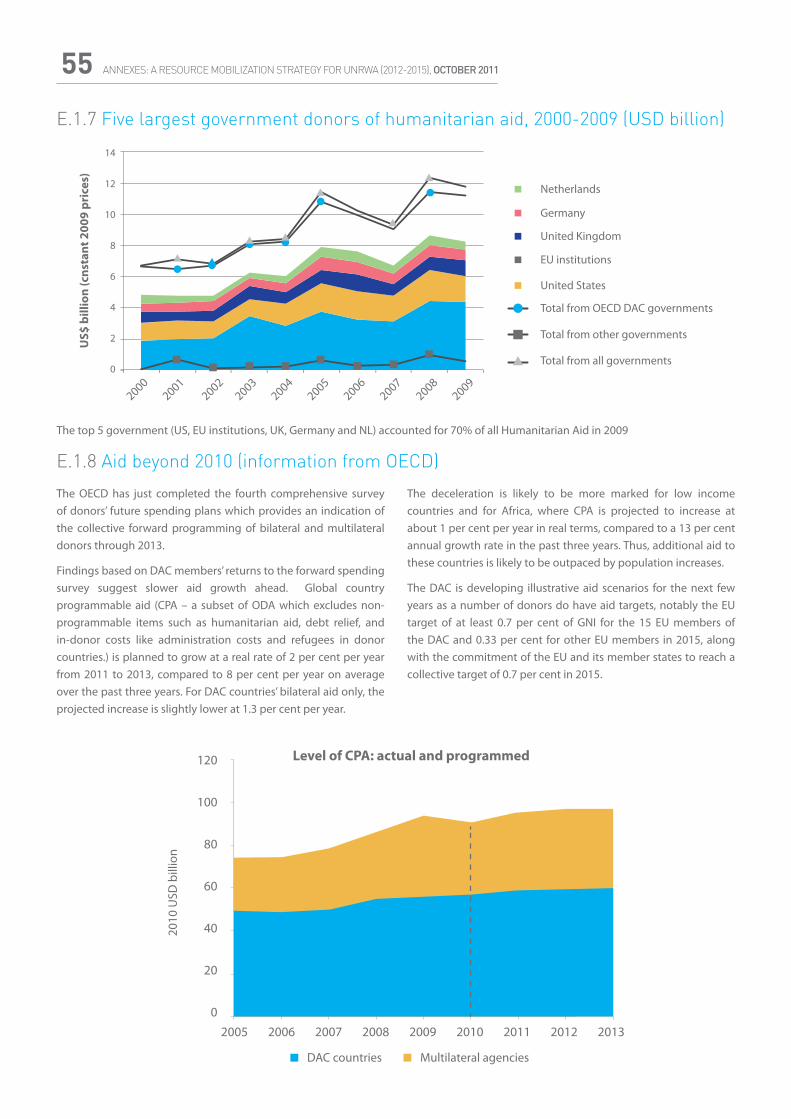
ANNEXES: A RESOURCE MOBILIZATION STRATEGY FOR UNRWA (2012-2015), OCTOBER 201155
The OECD has just completed the fourth comprehensive survey of donors’ future spending plans which provides an indication of the collective forward programming of bilateral and multilateral donors through 2013.
Findings based on DAC members’ returns to the forward spending survey suggest slower aid growth ahead. Global country programmable aid (CPA – a subset of ODA which excludes non-programmable items such as humanitarian aid, debt relief, and in-donor costs like administration costs and refugees in donor countries.) is planned to grow at a real rate of 2 per cent per year from 2011 to 2013, compared to 8 per cent per year on average over the past three years. For DAC countries’ bilateral aid only, the projected increase is slightly lower at 1.3 per cent per year.
E.1.7 Five largest government donors of humanitarian aid, 2000-2009 (USD billion)
The top 5 government (US, EU institutions, UK, Germany and NL) accounted for 70% of all Humanitarian Aid in 2009
The deceleration is likely to be more marked for low income countries and for Africa, where CPA is projected to increase at about 1 per cent per year in real terms, compared to a 13 per cent annual growth rate in the past three years. Thus, additional aid to these countries is likely to be outpaced by population increases.
The DAC is developing illustrative aid scenarios for the next few years as a number of donors do have aid targets, notably the EU target of at least 0.7 per cent of GNI for the 15 EU members of the DAC and 0.33 per cent for other EU members in 2015, along with the commitment of the EU and its member states to reach a collective target of 0.7 per cent in 2015.
E.1.8 Aid beyond 2010 (information from OECD)
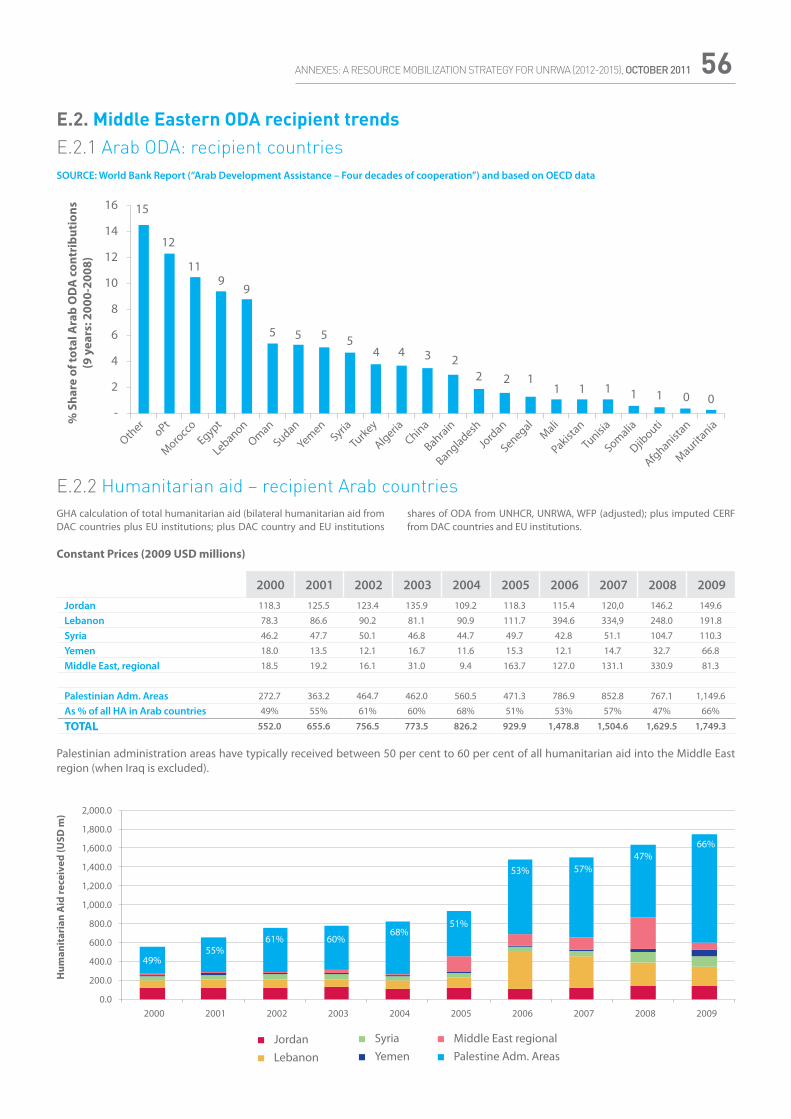
ANNEXES: A RESOURCE MOBILIZATION STRATEGY FOR UNRWA (2012-2015), OCTOBER 2011 56
E.2. Middle Eastern ODA recipient trendsE.2.1 Arab ODA: recipient countriesSOURCE: World Bank Report (“Arab Development Assistance – Four decades of cooperation”) and based on OECD data
E.2.2 Humanitarian aid – recipient Arab countriesGHA calculation of total humanitarian aid (bilateral humanitarian aid from DAC countries plus EU institutions; plus DAC country and EU institutions
shares of ODA from UNHCR, UNRWA, WFP (adjusted); plus imputed CERF from DAC countries and EU institutions.
Constant Prices (2009 USD millions)
2000 2001 2002 2003 2004 2005 2006 2007 2008 2009Jordan 118.3 125.5 123.4 135.9 109.2 118.3 115.4 120,0 146.2 149.6
Lebanon 78.3 86.6 90.2 81.1 90.9 111.7 394.6 334,9 248.0 191.8
Syria 46.2 47.7 50.1 46.8 44.7 49.7 42.8 51.1 104.7 110.3
Yemen 18.0 13.5 12.1 16.7 11.6 15.3 12.1 14.7 32.7 66.8
Middle East, regional 18.5 19.2 16.1 31.0 9.4 163.7 127.0 131.1 330.9 81.3
Palestinian Adm. Areas 272.7 363.2 464.7 462.0 560.5 471.3 786.9 852.8 767.1 1,149.6
As % of all HA in Arab countries 49% 55% 61% 60% 68% 51% 53% 57% 47% 66%
TOTAL 552.0 655.6 756.5 773.5 826.2 929.9 1,478.8 1,504.6 1,629.5 1,749.3
Palestinian administration areas have typically received between 50 per cent to 60 per cent of all humanitarian aid into the Middle East region (when Iraq is excluded).
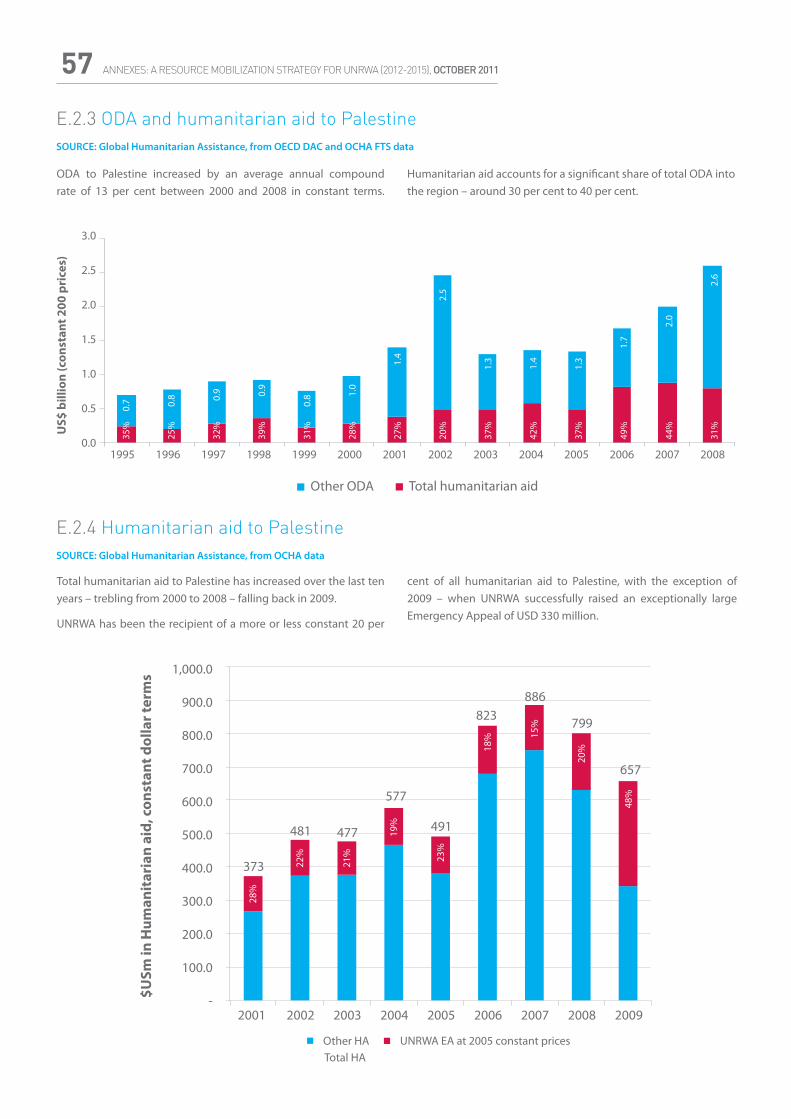
ANNEXES: A RESOURCE MOBILIZATION STRATEGY FOR UNRWA (2012-2015), OCTOBER 201157
E.2.3 ODA and humanitarian aid to PalestineSOURCE: Global Humanitarian Assistance, from OECD DAC and OCHA FTS data
E.2.4 Humanitarian aid to PalestineSOURCE: Global Humanitarian Assistance, from OCHA data
ODA to Palestine increased by an average annual compound rate of 13 per cent between 2000 and 2008 in constant terms.
Humanitarian aid accounts for a significant share of total ODA into the region – around 30 per cent to 40 per cent.
Total humanitarian aid to Palestine has increased over the last ten years – trebling from 2000 to 2008 – falling back in 2009.
UNRWA has been the recipient of a more or less constant 20 per
cent of all humanitarian aid to Palestine, with the exception of 2009 – when UNRWA successfully raised an exceptionally large Emergency Appeal of USD 330 million.
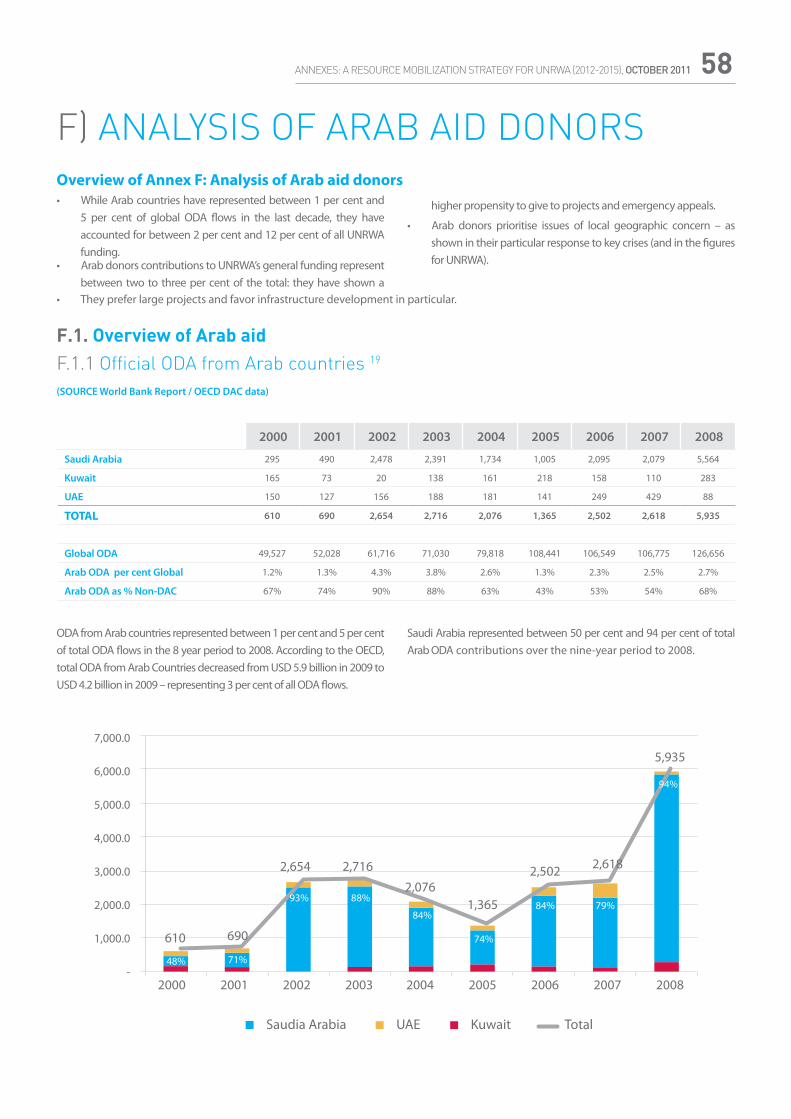
ANNEXES: A RESOURCE MOBILIZATION STRATEGY FOR UNRWA (2012-2015), OCTOBER 2011 58
F) ANALYSIS OF ARAB AID DONORSOverview of Annex F: Analysis of Arab aid donors
• They prefer large projects and favor infrastructure development in particular.
F.1. Overview of Arab aidF.1.1 Official ODA from Arab countries 19
(SOURCE World Bank Report / OECD DAC data)
2000 2001 2002 2003 2004 2005 2006 2007 2008
Saudi Arabia 295 490 2,478 2,391 1,734 1,005 2,095 2,079 5,564
Kuwait 165 73 20 138 161 218 158 110 283
UAE 150 127 156 188 181 141 249 429 88
TOTAL 610 690 2,654 2,716 2,076 1,365 2,502 2,618 5,935
Global ODA 49,527 52,028 61,716 71,030 79,818 108,441 106,549 106,775 126,656
Arab ODA per cent Global 1.2% 1.3% 4.3% 3.8% 2.6% 1.3% 2.3% 2.5% 2.7%
Arab ODA as % Non-DAC 67% 74% 90% 88% 63% 43% 53% 54% 68%
• While Arab countries have represented between 1 per cent and 5 per cent of global ODA flows in the last decade, they have accounted for between 2 per cent and 12 per cent of all UNRWA funding.
• Arab donors contributions to UNRWA’s general funding represent between two to three per cent of the total: they have shown a
higher propensity to give to projects and emergency appeals.
• Arab donors prioritise issues of local geographic concern – as shown in their particular response to key crises (and in the figures for UNRWA).
ODA from Arab countries represented between 1 per cent and 5 per cent of total ODA flows in the 8 year period to 2008. According to the OECD, total ODA from Arab Countries decreased from USD 5.9 billion in 2009 to USD 4.2 billion in 2009 – representing 3 per cent of all ODA flows.
Saudi Arabia represented between 50 per cent and 94 per cent of total Arab ODA contributions over the nine-year period to 2008.
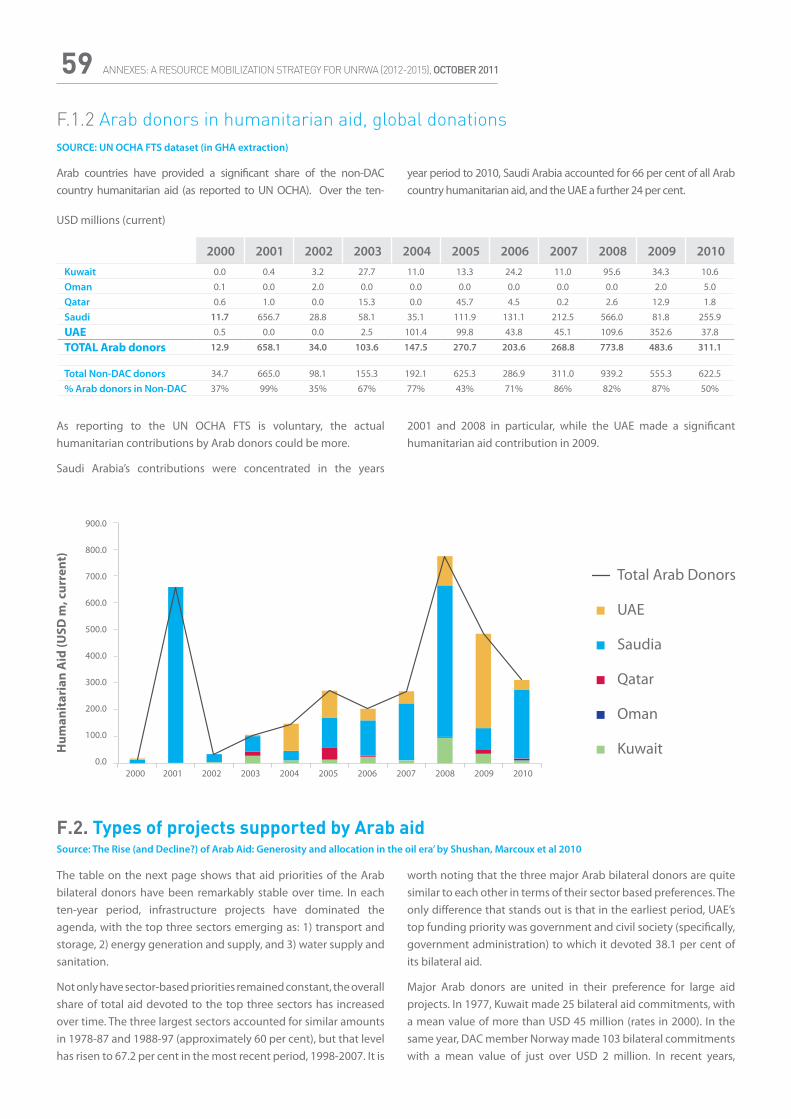
ANNEXES: A RESOURCE MOBILIZATION STRATEGY FOR UNRWA (2012-2015), OCTOBER 201159
F.1.2 Arab donors in humanitarian aid, global donationsSOURCE: UN OCHA FTS dataset (in GHA extraction)
The table on the next page shows that aid priorities of the Arab bilateral donors have been remarkably stable over time. In each ten-year period, infrastructure projects have dominated the agenda, with the top three sectors emerging as: 1) transport and storage, 2) energy generation and supply, and 3) water supply and sanitation.
Not only have sector-based priorities remained constant, the overall share of total aid devoted to the top three sectors has increased over time. The three largest sectors accounted for similar amounts in 1978-87 and 1988-97 (approximately 60 per cent), but that level has risen to 67.2 per cent in the most recent period, 1998-2007. It is
worth noting that the three major Arab bilateral donors are quite similar to each other in terms of their sector based preferences. The only difference that stands out is that in the earliest period, UAE’s top funding priority was government and civil society (specifically, government administration) to which it devoted 38.1 per cent of its bilateral aid.
Major Arab donors are united in their preference for large aid projects. In 1977, Kuwait made 25 bilateral aid commitments, with a mean value of more than USD 45 million (rates in 2000). In the same year, DAC member Norway made 103 bilateral commitments with a mean value of just over USD 2 million. In recent years,
Arab countries have provided a significant share of the non-DAC country humanitarian aid (as reported to UN OCHA). Over the ten-
year period to 2010, Saudi Arabia accounted for 66 per cent of all Arab country humanitarian aid, and the UAE a further 24 per cent.
USD millions (current)
2000 2001 2002 2003 2004 2005 2006 2007 2008 2009 2010Kuwait 0.0 0.4 3.2 27.7 11.0 13.3 24.2 11.0 95.6 34.3 10.6
Oman 0.1 0.0 2.0 0.0 0.0 0.0 0.0 0.0 0.0 2.0 5.0
Qatar 0.6 1.0 0.0 15.3 0.0 45.7 4.5 0.2 2.6 12.9 1.8
Saudi 11.7 656.7 28.8 58.1 35.1 111.9 131.1 212.5 566.0 81.8 255.9
UAE 0.5 0.0 0.0 2.5 101.4 99.8 43.8 45.1 109.6 352.6 37.8
TOTAL Arab donors 12.9 658.1 34.0 103.6 147.5 270.7 203.6 268.8 773.8 483.6 311.1
Total Non-DAC donors 34.7 665.0 98.1 155.3 192.1 625.3 286.9 311.0 939.2 555.3 622.5
% Arab donors in Non-DAC 37% 99% 35% 67% 77% 43% 71% 86% 82% 87% 50%
As reporting to the UN OCHA FTS is voluntary, the actual humanitarian contributions by Arab donors could be more.
Saudi Arabia’s contributions were concentrated in the years
2001 and 2008 in particular, while the UAE made a significant humanitarian aid contribution in 2009.
F.2. Types of projects supported by Arab aidSource: The Rise (and Decline?) of Arab Aid: Generosity and allocation in the oil era’ by Shushan, Marcoux et al 2010
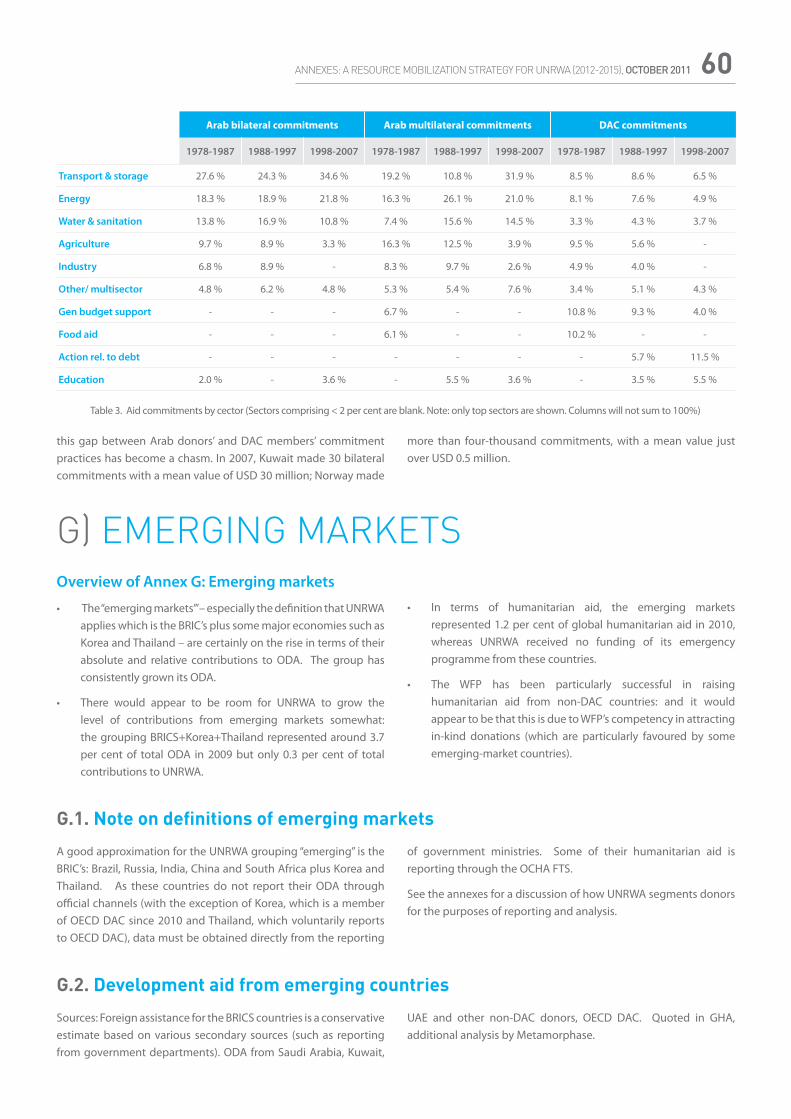
ANNEXES: A RESOURCE MOBILIZATION STRATEGY FOR UNRWA (2012-2015), OCTOBER 2011 60
this gap between Arab donors’ and DAC members’ commitment practices has become a chasm. In 2007, Kuwait made 30 bilateral commitments with a mean value of USD 30 million; Norway made
Overview of Annex G: Emerging markets
• The “emerging markets’”– especially the definition that UNRWA applies which is the BRIC’s plus some major economies such as Korea and Thailand – are certainly on the rise in terms of their absolute and relative contributions to ODA. The group has consistently grown its ODA.
• There would appear to be room for UNRWA to grow the level of contributions from emerging markets somewhat: the grouping BRICS+Korea+Thailand represented around 3.7 per cent of total ODA in 2009 but only 0.3 per cent of total contributions to UNRWA.
A good approximation for the UNRWA grouping “emerging” is the BRIC’s: Brazil, Russia, India, China and South Africa plus Korea and Thailand. As these countries do not report their ODA through official channels (with the exception of Korea, which is a member of OECD DAC since 2010 and Thailand, which voluntarily reports to OECD DAC), data must be obtained directly from the reporting
more than four-thousand commitments, with a mean value just over USD 0.5 million.
Arab bilateral commitments Arab multilateral commitments DAC commitments
1978-1987 1988-1997 1998-2007 1978-1987 1988-1997 1998-2007 1978-1987 1988-1997 1998-2007
Transport & storage 27.6 % 24.3 % 34.6 % 19.2 % 10.8 % 31.9 % 8.5 % 8.6 % 6.5 %
Energy 18.3 % 18.9 % 21.8 % 16.3 % 26.1 % 21.0 % 8.1 % 7.6 % 4.9 %
Water & sanitation 13.8 % 16.9 % 10.8 % 7.4 % 15.6 % 14.5 % 3.3 % 4.3 % 3.7 %
Agriculture 9.7 % 8.9 % 3.3 % 16.3 % 12.5 % 3.9 % 9.5 % 5.6 % -
Industry 6.8 % 8.9 % - 8.3 % 9.7 % 2.6 % 4.9 % 4.0 % -
Other/ multisector 4.8 % 6.2 % 4.8 % 5.3 % 5.4 % 7.6 % 3.4 % 5.1 % 4.3 %
Gen budget support - - - 6.7 % - - 10.8 % 9.3 % 4.0 %
Food aid - - - 6.1 % - - 10.2 % - -
Action rel. to debt - - - - - - - 5.7 % 11.5 %
Education 2.0 % - 3.6 % - 5.5 % 3.6 % - 3.5 % 5.5 %
G) EMERGING MARKETS
Table 3. Aid commitments by cector (Sectors comprising < 2 per cent are blank. Note: only top sectors are shown. Columns will not sum to 100%)
• In terms of humanitarian aid, the emerging markets represented 1.2 per cent of global humanitarian aid in 2010, whereas UNRWA received no funding of its emergency programme from these countries.
• The WFP has been particularly successful in raising humanitarian aid from non-DAC countries: and it would appear to be that this is due to WFP’s competency in attracting in-kind donations (which are particularly favoured by some emerging-market countries).
of government ministries. Some of their humanitarian aid is reporting through the OCHA FTS.
See the annexes for a discussion of how UNRWA segments donors for the purposes of reporting and analysis.
G.1. Note on definitions of emerging markets
G.2. Development aid from emerging countries
Sources: Foreign assistance for the BRICS countries is a conservative estimate based on various secondary sources (such as reporting from government departments). ODA from Saudi Arabia, Kuwait,
UAE and other non-DAC donors, OECD DAC. Quoted in GHA, additional analysis by Metamorphase.
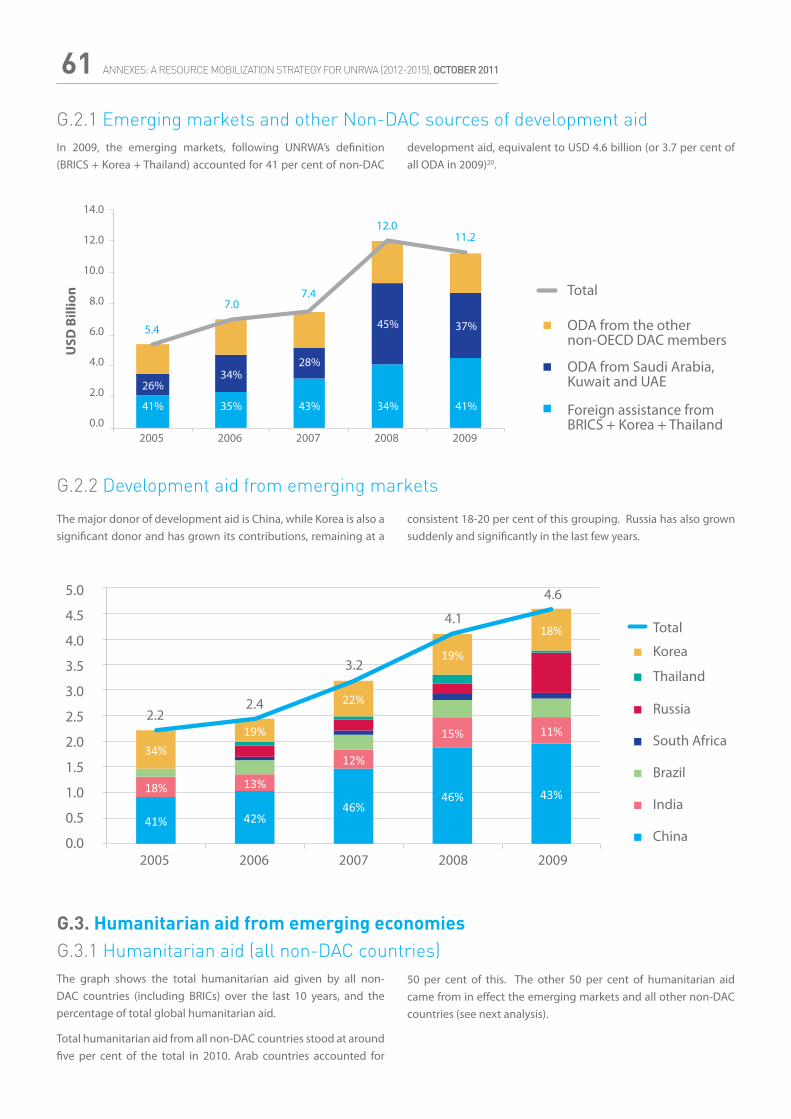
ANNEXES: A RESOURCE MOBILIZATION STRATEGY FOR UNRWA (2012-2015), OCTOBER 201161
G.2.1 Emerging markets and other Non-DAC sources of development aid
G.3.1 Humanitarian aid (all non-DAC countries)
G.2.2 Development aid from emerging markets
50 per cent of this. The other 50 per cent of humanitarian aid came from in effect the emerging markets and all other non-DAC countries (see next analysis).
In 2009, the emerging markets, following UNRWA’s definition (BRICS + Korea + Thailand) accounted for 41 per cent of non-DAC
development aid, equivalent to USD 4.6 billion (or 3.7 per cent of all ODA in 2009)20.
G.3. Humanitarian aid from emerging economies
The major donor of development aid is China, while Korea is also a significant donor and has grown its contributions, remaining at a
consistent 18-20 per cent of this grouping. Russia has also grown suddenly and significantly in the last few years.
The graph shows the total humanitarian aid given by all non-DAC countries (including BRICs) over the last 10 years, and the percentage of total global humanitarian aid.
Total humanitarian aid from all non-DAC countries stood at around five per cent of the total in 2010. Arab countries accounted for
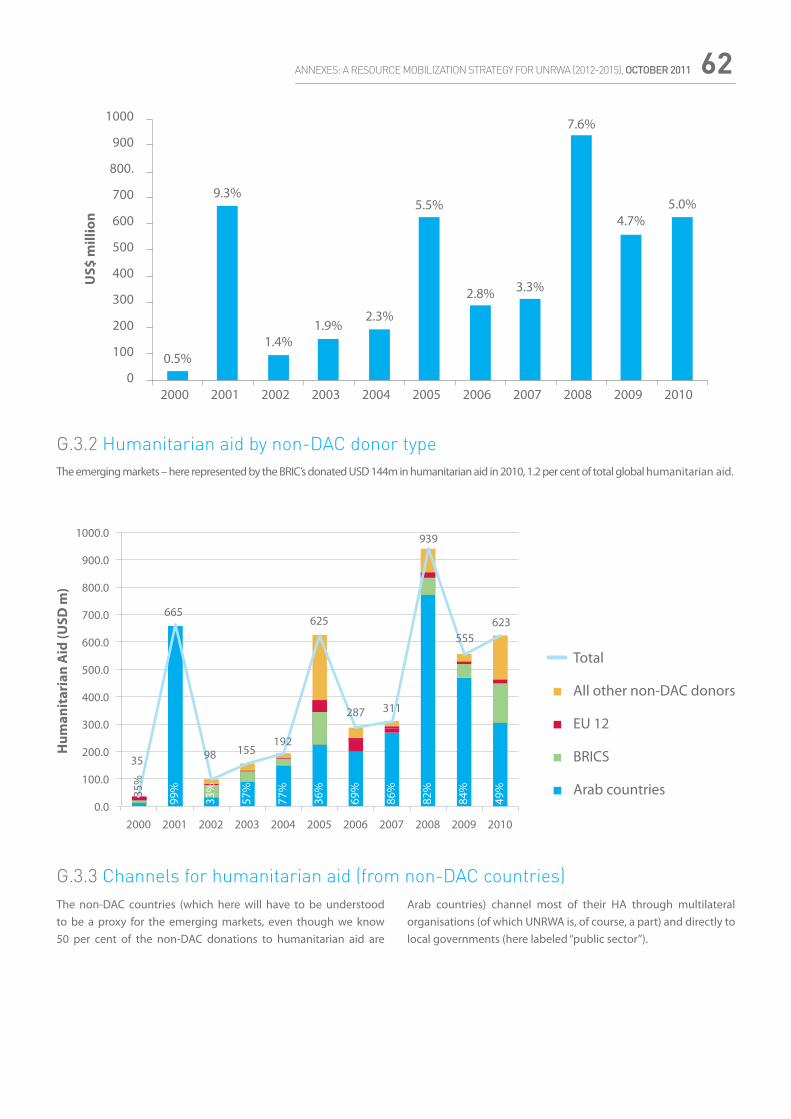
ANNEXES: A RESOURCE MOBILIZATION STRATEGY FOR UNRWA (2012-2015), OCTOBER 2011 62
G.3.2 Humanitarian aid by non-DAC donor typeThe emerging markets – here represented by the BRIC’s donated USD 144m in humanitarian aid in 2010, 1.2 per cent of total global humanitarian aid.
G.3.3 Channels for humanitarian aid (from non-DAC countries)The non-DAC countries (which here will have to be understood to be a proxy for the emerging markets, even though we know 50 per cent of the non-DAC donations to humanitarian aid are
Arab countries) channel most of their HA through multilateral organisations (of which UNRWA is, of course, a part) and directly to local governments (here labeled “public sector”).
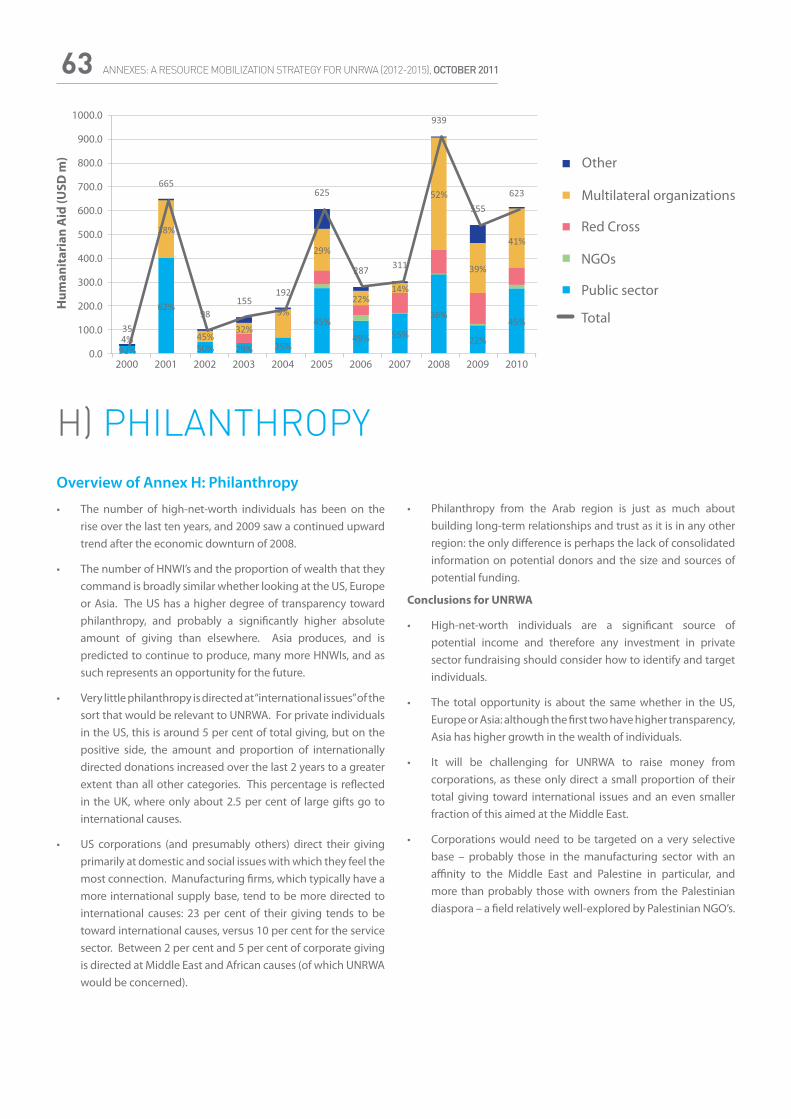
ANNEXES: A RESOURCE MOBILIZATION STRATEGY FOR UNRWA (2012-2015), OCTOBER 201163
H) PHILANTHROPYOverview of Annex H: Philanthropy
• The number of high-net-worth individuals has been on the rise over the last ten years, and 2009 saw a continued upward trend after the economic downturn of 2008.
• The number of HNWI’s and the proportion of wealth that they command is broadly similar whether looking at the US, Europe or Asia. The US has a higher degree of transparency toward philanthropy, and probably a significantly higher absolute amount of giving than elsewhere. Asia produces, and is predicted to continue to produce, many more HNWIs, and as such represents an opportunity for the future.
• Very little philanthropy is directed at “international issues” of the sort that would be relevant to UNRWA. For private individuals in the US, this is around 5 per cent of total giving, but on the positive side, the amount and proportion of internationally directed donations increased over the last 2 years to a greater extent than all other categories. This percentage is reflected in the UK, where only about 2.5 per cent of large gifts go to international causes.
• US corporations (and presumably others) direct their giving primarily at domestic and social issues with which they feel the most connection. Manufacturing firms, which typically have a more international supply base, tend to be more directed to international causes: 23 per cent of their giving tends to be toward international causes, versus 10 per cent for the service sector. Between 2 per cent and 5 per cent of corporate giving is directed at Middle East and African causes (of which UNRWA would be concerned).
• Philanthropy from the Arab region is just as much about building long-term relationships and trust as it is in any other region: the only difference is perhaps the lack of consolidated information on potential donors and the size and sources of potential funding.
Conclusions for UNRWA
• High-net-worth individuals are a significant source of potential income and therefore any investment in private sector fundraising should consider how to identify and target individuals.
• The total opportunity is about the same whether in the US, Europe or Asia: although the first two have higher transparency, Asia has higher growth in the wealth of individuals.
• It will be challenging for UNRWA to raise money from corporations, as these only direct a small proportion of their total giving toward international issues and an even smaller fraction of this aimed at the Middle East.
• Corporations would need to be targeted on a very selective base – probably those in the manufacturing sector with an affinity to the Middle East and Palestine in particular, and more than probably those with owners from the Palestinian diaspora – a field relatively well-explored by Palestinian NGO’s.
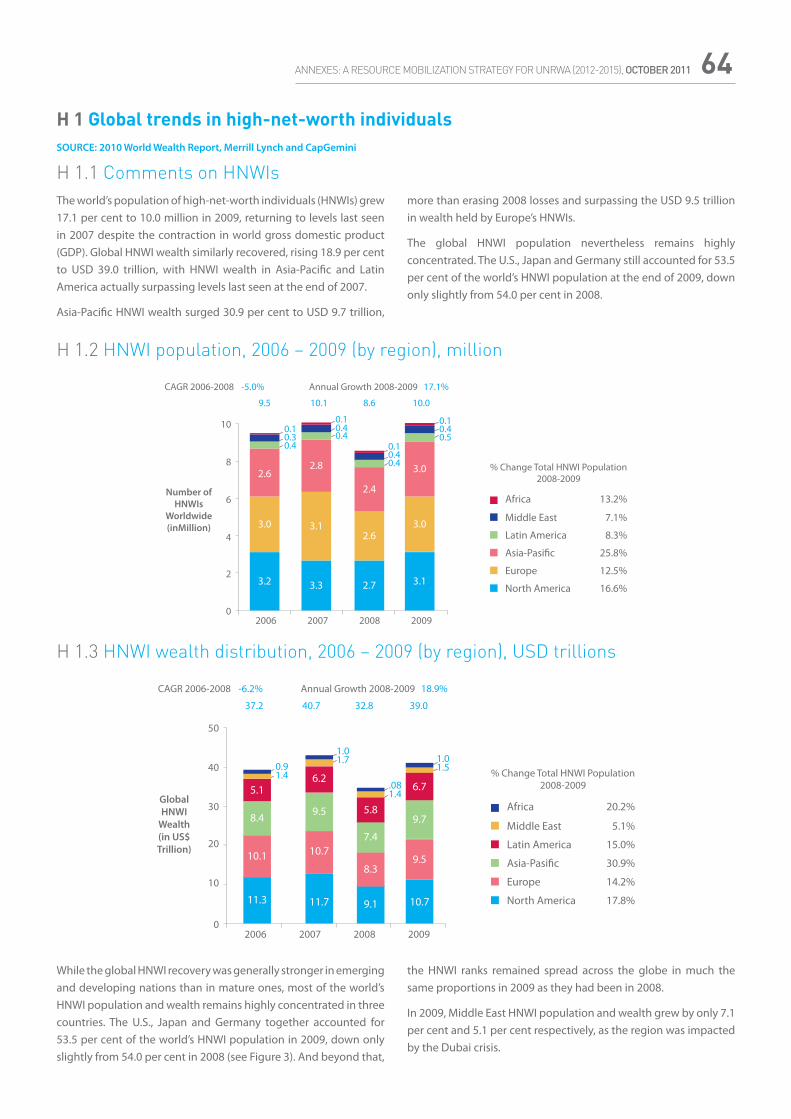
ANNEXES: A RESOURCE MOBILIZATION STRATEGY FOR UNRWA (2012-2015), OCTOBER 2011 64
The world’s population of high-net-worth individuals (HNWIs) grew 17.1 per cent to 10.0 million in 2009, returning to levels last seen in 2007 despite the contraction in world gross domestic product (GDP). Global HNWI wealth similarly recovered, rising 18.9 per cent to USD 39.0 trillion, with HNWI wealth in Asia-Pacific and Latin America actually surpassing levels last seen at the end of 2007.
Asia-Pacific HNWI wealth surged 30.9 per cent to USD 9.7 trillion,
more than erasing 2008 losses and surpassing the USD 9.5 trillion in wealth held by Europe’s HNWIs.
The global HNWI population nevertheless remains highly concentrated. The U.S., Japan and Germany still accounted for 53.5 per cent of the world’s HNWI population at the end of 2009, down only slightly from 54.0 per cent in 2008.
H 1.2 HNWI population, 2006 – 2009 (by region), million
H 1.3 HNWI wealth distribution, 2006 – 2009 (by region), USD trillions
While the global HNWI recovery was generally stronger in emerging and developing nations than in mature ones, most of the world’s HNWI population and wealth remains highly concentrated in three countries. The U.S., Japan and Germany together accounted for 53.5 per cent of the world’s HNWI population in 2009, down only slightly from 54.0 per cent in 2008 (see Figure 3). And beyond that,
the HNWI ranks remained spread across the globe in much the same proportions in 2009 as they had been in 2008.
In 2009, Middle East HNWI population and wealth grew by only 7.1 per cent and 5.1 per cent respectively, as the region was impacted by the Dubai crisis.
H 1 Global trends in high-net-worth individualsSOURCE: 2010 World Wealth Report, Merrill Lynch and CapGemini
H 1.1 Comments on HNWIs
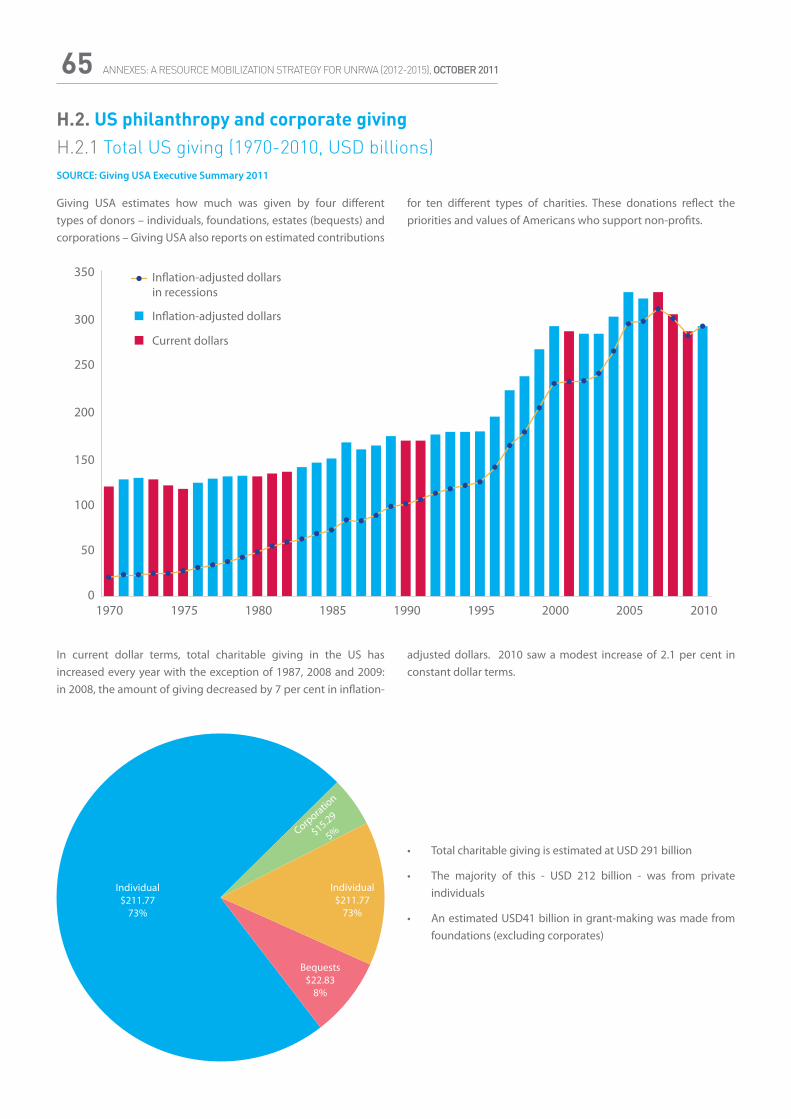
ANNEXES: A RESOURCE MOBILIZATION STRATEGY FOR UNRWA (2012-2015), OCTOBER 201165
H.2. US philanthropy and corporate givingH.2.1 Total US giving (1970-2010, USD billions)SOURCE: Giving USA Executive Summary 2011
In current dollar terms, total charitable giving in the US has increased every year with the exception of 1987, 2008 and 2009: in 2008, the amount of giving decreased by 7 per cent in inflation-
• Total charitable giving is estimated at USD 291 billion
• The majority of this - USD 212 billion - was from private individuals
• An estimated USD41 billion in grant-making was made from foundations (excluding corporates)
adjusted dollars. 2010 saw a modest increase of 2.1 per cent in constant dollar terms.
Giving USA estimates how much was given by four different types of donors – individuals, foundations, estates (bequests) and corporations – Giving USA also reports on estimated contributions
for ten different types of charities. These donations reflect the priorities and values of Americans who support non-profits.
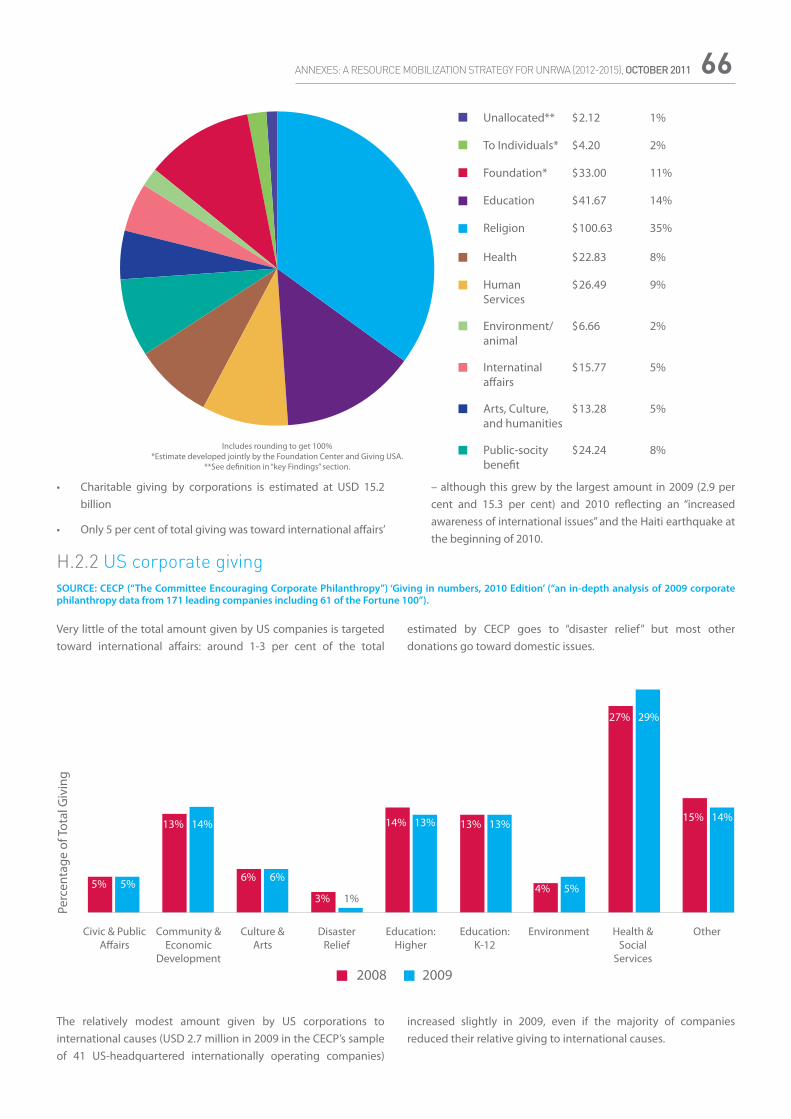
ANNEXES: A RESOURCE MOBILIZATION STRATEGY FOR UNRWA (2012-2015), OCTOBER 2011 66
• Charitable giving by corporations is estimated at USD 15.2 billion
• Only 5 per cent of total giving was toward international affairs’
H.2.2 US corporate givingSOURCE: CECP (“The Committee Encouraging Corporate Philanthropy”) ‘Giving in numbers, 2010 Edition’ (“an in-depth analysis of 2009 corporate philanthropy data from 171 leading companies including 61 of the Fortune 100”).
– although this grew by the largest amount in 2009 (2.9 per cent and 15.3 per cent) and 2010 reflecting an “increased awareness of international issues” and the Haiti earthquake at the beginning of 2010.
The relatively modest amount given by US corporations to international causes (USD 2.7 million in 2009 in the CECP’s sample of 41 US-headquartered internationally operating companies)
increased slightly in 2009, even if the majority of companies reduced their relative giving to international causes.
Very little of the total amount given by US companies is targeted toward international affairs: around 1-3 per cent of the total
estimated by CECP goes to “disaster relief” but most other donations go toward domestic issues.
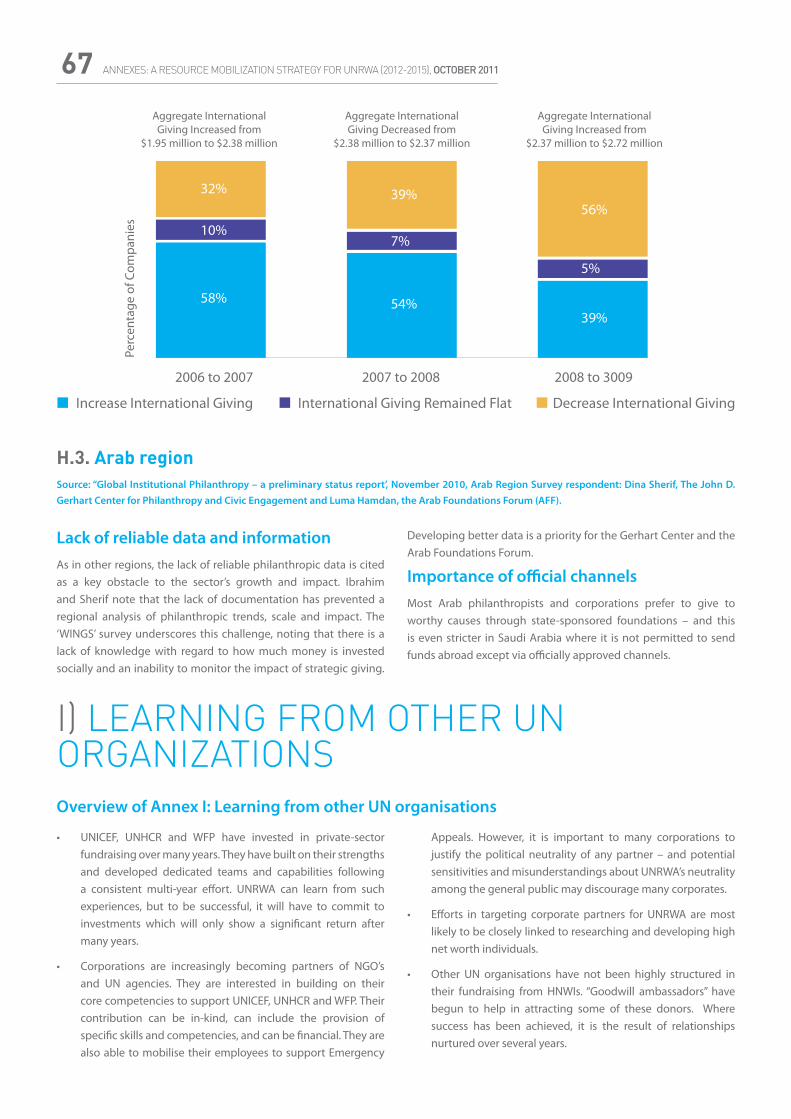
ANNEXES: A RESOURCE MOBILIZATION STRATEGY FOR UNRWA (2012-2015), OCTOBER 201167
Lack of reliable data and information As in other regions, the lack of reliable philanthropic data is cited as a key obstacle to the sector’s growth and impact. Ibrahim and Sherif note that the lack of documentation has prevented a regional analysis of philanthropic trends, scale and impact. The ‘WINGS’ survey underscores this challenge, noting that there is a lack of knowledge with regard to how much money is invested socially and an inability to monitor the impact of strategic giving.
I) LEARNING FROM OTHER UN ORGANIZATIONSOverview of Annex I: Learning from other UN organisations
Developing better data is a priority for the Gerhart Center and the Arab Foundations Forum.
Importance of official channelsMost Arab philanthropists and corporations prefer to give to worthy causes through state-sponsored foundations – and this is even stricter in Saudi Arabia where it is not permitted to send funds abroad except via officially approved channels.
• UNICEF, UNHCR and WFP have invested in private-sector fundraising over many years. They have built on their strengths and developed dedicated teams and capabilities following a consistent multi-year effort. UNRWA can learn from such experiences, but to be successful, it will have to commit to investments which will only show a significant return after many years.
• Corporations are increasingly becoming partners of NGO’s and UN agencies. They are interested in building on their core competencies to support UNICEF, UNHCR and WFP. Their contribution can be in-kind, can include the provision of specific skills and competencies, and can be financial. They are also able to mobilise their employees to support Emergency
Appeals. However, it is important to many corporations to justify the political neutrality of any partner – and potential sensitivities and misunderstandings about UNRWA’s neutrality among the general public may discourage many corporates.
• Efforts in targeting corporate partners for UNRWA are most likely to be closely linked to researching and developing high net worth individuals.
• Other UN organisations have not been highly structured in their fundraising from HNWIs. “Goodwill ambassadors” have begun to help in attracting some of these donors. Where success has been achieved, it is the result of relationships nurtured over several years.
H.3. Arab regionSource: “Global Institutional Philanthropy – a preliminary status report’, November 2010, Arab Region Survey respondent: Dina Sherif, The John D. Gerhart Center for Philanthropy and Civic Engagement and Luma Hamdan, the Arab Foundations Forum (AFF).
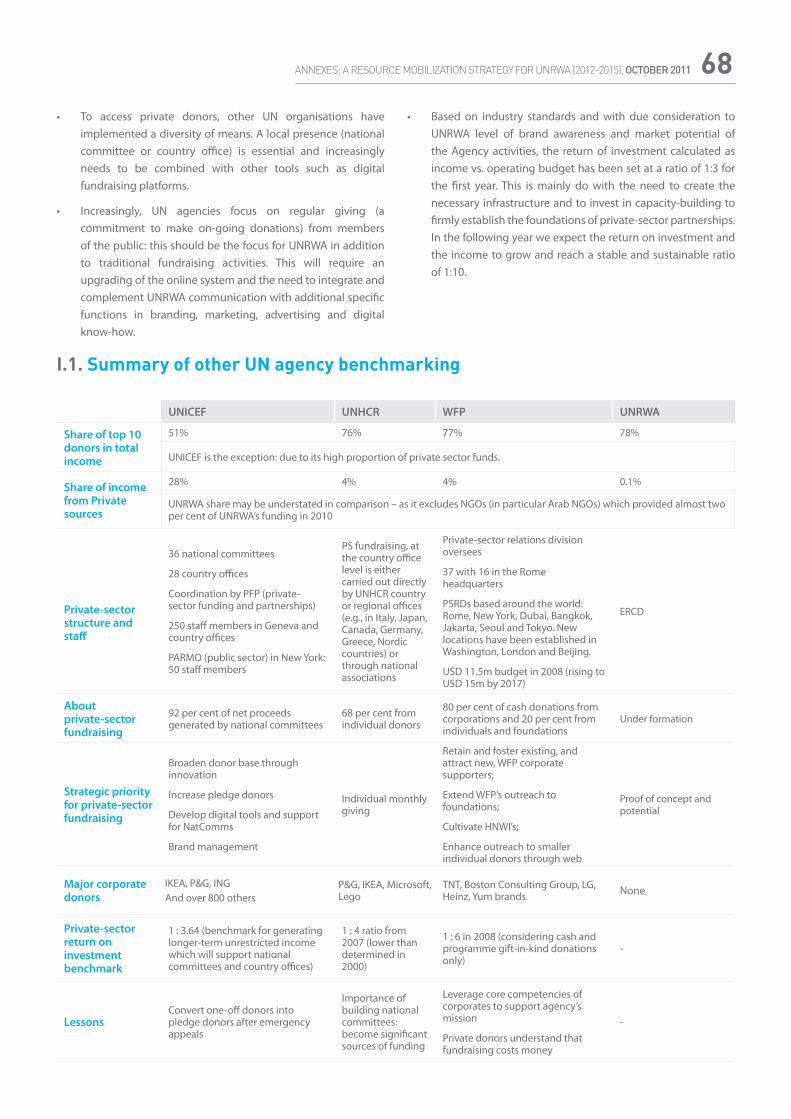
ANNEXES: A RESOURCE MOBILIZATION STRATEGY FOR UNRWA (2012-2015), OCTOBER 2011 68• To access private donors, other UN organisations have
implemented a diversity of means. A local presence (national committee or country office) is essential and increasingly needs to be combined with other tools such as digital fundraising platforms.
• Increasingly, UN agencies focus on regular giving (a commitment to make on-going donations) from members of the public: this should be the focus for UNRWA in addition to traditional fundraising activities. This will require an upgrading of the online system and the need to integrate and complement UNRWA communication with additional specific functions in branding, marketing, advertising and digital know-how.
• Based on industry standards and with due consideration to UNRWA level of brand awareness and market potential of the Agency activities, the return of investment calculated as income vs. operating budget has been set at a ratio of 1:3 for the first year. This is mainly do with the need to create the necessary infrastructure and to invest in capacity-building to firmly establish the foundations of private-sector partnerships. In the following year we expect the return on investment and the income to grow and reach a stable and sustainable ratio of 1:10.
I.1. Summary of other UN agency benchmarking
UNICEF UNHCR WFP UNRWA
Share of top 10 donors in total income
51% 76% 77% 78%
UNICEF is the exception: due to its high proportion of private sector funds.
Share of income from Private sources
28% 4% 4% 0.1%
UNRWA share may be understated in comparison – as it excludes NGOs (in particular Arab NGOs) which provided almost two per cent of UNRWA’s funding in 2010
Private-sector structure and staff
36 national committees
28 country offices
Coordination by PFP (private-sector funding and partnerships)
250 staff members in Geneva and country offices
PARMO (public sector) in New York: 50 staff members
PS fundraising, at the country office level is either carried out directly by UNHCR country or regional offices (e.g., in Italy, Japan, Canada, Germany, Greece, Nordic countries) or through national associations
Private-sector relations division oversees
37 with 16 in the Rome headquarters
PSRDs based around the world: Rome, New York, Dubai, Bangkok, Jakarta, Seoul and Tokyo. New locations have been established in Washington, London and Beijing.
USD 11.5m budget in 2008 (rising to USD 15m by 2017)
ERCD
About private-sector fundraising
92 per cent of net proceeds generated by national committees
68 per cent from individual donors
80 per cent of cash donations from corporations and 20 per cent from individuals and foundations
Under formation
Strategic priority for private-sector fundraising
Broaden donor base through innovation
Increase pledge donors
Develop digital tools and support for NatComms
Brand management
Individual monthly giving
Retain and foster existing, and attract new, WFP corporate supporters;
Extend WFP’s outreach to foundations;
Cultivate HNWI’s;
Enhance outreach to smaller individual donors through web
Proof of concept and potential
Major corporate donors
IKEA, P&G, ING And over 800 others
P&G, IKEA, Microsoft, Lego
TNT, Boston Consulting Group, LG, Heinz, Yum brands None
Private-sector return on investment benchmark
1 : 3.64 (benchmark for generating longer-term unrestricted income which will support national committees and country offices)
1 : 4 ratio from 2007 (lower than determined in 2000)
1 : 6 in 2008 (considering cash and programme gift-in-kind donations only)
-
LessonsConvert one-off donors into pledge donors after emergency appeals
Importance of building national committees: become significant sources of funding
Leverage core competencies of corporates to support agency’s mission
Private donors understand that fundraising costs money
-
ANNEXES: A RESOURCE MOBILIZATION STRATEGY FOR UNRWA (2012-2015), OCTOBER 201169
I.2. UNICEFThe UNICEF private fundraising and partnerships division (PFP) revenue is generated by the fundraising and sales activities of 36 national committees and 28 UNICEF country offices. PFP has about 250 staff members either in headquarters or in country offices.
Private-sector contributions from UNICEF national committees, individual donors, non-governmental organisations and foundations was USD 1.188 million in 2010 (an increase of 30 per cent versus 2009). A number of relationships with foundations are managed from NY PARMO office, such as the Bill and Melinda Gates Foundation, due to the geographical proximity of the partners. Relationships with Middle East foundations are often managed from New York, as the difference between private and public giving can be less distinct in this region. The following figures do not include revenue and expenditures related to Arab foundations.
While contributions from private sources for regular resources decreased 13 per cent, from USD 383 million in 2009 to USD 335 million in 2010; contributions from the private sector to other resources increased by 60 per cent, from USD 533 million to USD 853 million. In 2010, 92 per cent of net proceeds were generated by national committees and 8 per cent by country offices. Significant increase occurred due to the Haiti earthquake and Pakistan floods emergencies. Overall income growth is led by pledge and corporate donations. National committees also act as stabilising forces to raise public-sector funds.
In the early 2000’s UNICEF made a commitment to developing corporate alliances. Significant efforts were made to develop the capability to prospect, manage and nourish such relationships. This required investment in people and the development of new skills. By 2007, UNICEF had more than 800 corporate partners with a growing number of strategic long-term partnerships.
Today the sales of cards and gift items are declining in proportion to the overall private-sector revenue of UNICEF. This trend has existed for some years but was aggravated by the recent economic crisis. A rationalisation of these activities is underway.
The current strategy of UNICEF consists of building a broader support base for raising funds from individuals and the corporate sector, and testing and evaluating new income-generating initiatives. It invests in expertise and capacity to manage and increase income from corporate and private foundation and digital channels. It also aims to enhance support and media outreach in national committee countries, to improve knowledge management, and to expand new media communication channels. Digital fundraising is not a separate channel but a complementary tool to the existing channels.
Pledge giving has proven to be recession-resistant and the most stable area of private-income generation for UNICEF. It is the source of the most predictable, sustainable and flexible income. UNICEF is making what it describes as “aggressive investment in recruiting and retaining regular pledge donors”, as the competition is fierce.
One-off cash donations from individuals are the second-largest
income stream in terms of gross income, though the income and efficiency of such activities is declining in many national committee countries. As part of the focus on pledge giving, PFP intends to work with national committees to shift resources from one-off cash giving into pledge giving, in particular when attracting new supporters. Emphasis is on increasing the efficiency of generating income from cash donations through the use of the web and, increasingly, mobile fundraising, as these carry much lower costs. During emergencies, very high levels of support are achieved through these channels. PFP continues to develop its emergency fundraising capability with a focus on preparedness and rapid response. This is expected to further help attract future UNICEF supporters, many of whom donate for the first time in response to an emergency appeal. The Haiti and Pakistan emergencies have demonstrated that many supporters who donated to UNICEF for the first time go on to become pledge donors.
Corporate income has grown its share significantly since 2006. This growth has been driven by a number of global partnerships with international corporations, including IKEA, Proctor and Gamble (Pampers) and ING.
Analysis performed by UNICEF indicates that the planned USD 17 million increase in investment funds will make a significant difference in generating longer-term unrestricted income and will support the development of the national committee and country office fundraising markets. The assumption is that for every dollar of additional investment funding, a return of USD 3.64 would be generated over a four-year period. The USD 17 million would thus return a total of USD 62 million to UNICEF. It is forecast that, over ten years, the additional investment will generate over USD 130 million. These projections are based on cost and income figures from 45 markets and have been verified by an external evaluation.
The scaling-up and testing of digital channels and platforms is underway in UNICEF. PFP aims to increase the overall percentage of income generated through internet and mobile platforms in 2011. This is done by working with national committees to test various digital fundraising activities and build their overall digital knowledge and capacity through the strategic deployment of investment funds and the use of toolkits and training. Digital fundraising is increasingly a priority channel supporting all aspects of fundraising for regular resources, brand equity and supporter engagement.
In PFP, the total number of proposed posts in 2011 is 225, compared to 275 in 2010; 174 of which are in in PFP headquarters and 51 in country offices. This represents an overall net reduction of 24 posts in PFP headquarters and 26 posts funded from the PFP budget in country offices. The number of cards and gifts posts at headquarters, in Geneva, New York and Huningue, are to be reduced, from 84 in 2010 to 47 in 2011 and to 46 posts in 2012. The majority of the other 14 new posts are expected to reinforce the central fundraising and communication sections. None of the new functions are currently being performed in PFP. Some of the new functions require new sets of skills to support the roll-out of the income-generation strategy: pledge stewardship, digital know-
ANNEXES: A RESOURCE MOBILIZATION STRATEGY FOR UNRWA (2012-2015), OCTOBER 2011 70how, specialists to drive the roll-out of the toolkits that are critical to increasing less-restricted other resources, and knowledge and brand management capacity to support national committee efforts in these areas.
I.3. UNHCRIn UNHCR fundraising is led by the donor relations, resource mobilisation and the private sector fundraising unit.
The donor relations and resource mobilisation service is the main focal point within UNHCR for relations with governmental and intergovernmental donors. The service provides donors with information on policies, funding, programmes, and administration. It helps donors acquire a clear understanding of the goals and the resource requirements of the office and it helps the field and headquarters generate the information needed for this purpose. The private sector and public affairs service focuses on mobilising financial and other support from the private and corporate sectors. It also seeks to raise the general public’s awareness of refugee issues and the work of the office. The service is charged with developing and implementing the office’s private-sector fundraising strategy and forging stronger links with corporations, trusts and foundations, in order to broaden UNHCR’s donor base and promote greater commitment to the cause of refugees.
Private-sector fundraising at the country office level is either carried out directly by UNHCR country or regional offices (e.g., in Italy, Japan, Canada, Germany, Greece, Nordic countries) or through national associations, which are organisations created by UNHCR for fundraising activities, normally in the form of a charity under national law such as in in Argentina, Australia, France, Japan, Spain, United Kingdom and the United States of America. A majority of those offices or associations have been in place for more than ten years. The model that has proved the most successful in the case of UNHCR is one of decentralised fundraising activities with a coordination led from headquarters.
In 2000, income from the private sector totaled USD 15 million. Private-sector fundraising activities appeared to be successful, with a return on investment of 5:1 for the operations examined for the period 1995 to 2000. However, more detailed analysis showed that the success had varied considerably per operation.
In 2005, private-sector funding increased reached to a total of USD 30.2 million. This was 60 per cent more than in 2004. The result was due to emergency situations such as the South-east Asian tsunami, which coincided with the initiation of online giving for UNHCR. Donations amounted to USD 1.3 million.
In 2007 it was expected that private-sector fundraising would achieve a benchmark level of a 4:1 return on investment with an acceptable level of risk; and be non-earmarked to the greatest extent possible.
In the late 2000s, the priority has been on increased individual monthly giving.
In 2010, total contributions to UNHCR including public and private sector amounted to USD 1.86 billion. This was an increase of USD
148 million from 2009 contributions.
Over 75 per cent of all voluntary contributions come from the top ten donors. The top donors in 2010 consisted of governmental donations, including the United States, Japan and the European Commission, closely followed by Sweden. The contribution of the private sector represented 4 per cent of the voluntary contribution.
In 2010, private donors gave a total of USD 68.8 million to UNHCR (excluding a contribution of USD 3.9 million from the UAE Red Crescent), an increase of 36 per cent compared to 2009 - in line with the increases that had taken place over the previous five years. The growth was explained by the existence of a well-established global programme of face-to-face fundraising aimed at recruiting regular individual donors. Individual donors contributed generously in 2010 to emergency situations such as the aftermath of the Pakistan floods.
In 2011, the target is for private-sector fundraising to raise USD 100 million.
68 per cent of private-sector contributions are made by individual donors who tend to provide non-earmarked contributions. In 2010, 90,280 people joined the ranks of UNHCR’s individual donors, bringing their total number to some 412,000, representing an increase of 28 per cent compared to 2009. Of these, over 186,000 were monthly donors providing crucial regular and predictable support.
Face-to-face fundraising is a person-to-person recruitment method that involves asking individuals to make monthly donations to UNHCR via a secure credit card system. The programme is carried out at shopping malls, office buildings and other public places by fundraising representatives who have good knowledge of UNHCR. Face-to-face fundraising and online channels should be seen as complementary. Consistency of message and approach across different channels is an important factor of success.
The top ten private donors consist of: the contributions of eight national organisations raising funds for UNHCR and two corporations. Corporations and foundations represent seven of the next biggest source of funds. This shows that a small number of strong relationships can deliver a significant amount of funding.
I.4. WFPWFP has a dual structure to address fundraising. The government donor relations division addresses public-sector donations and relationships with governmental organisations. The joint communication, private partnership and policy division oversees relationships with private donors. The PSRD’s activities rely on teams based around the world: in Rome, New York, Dubai, Bangkok, Jakarta, Seoul and Tokyo. New locations are planned in Washington, London and Beijing. The structure comprises headcounts of 37 with 16 in the Rome headquarters
Partnerships with corporations were initiated in the early 2000s. Initially, the focus was on a limited number of major corporate partnerships. WFP benefited greatly from expertise and knowledge transfer to improve its work, and direct cash to
ANNEXES: A RESOURCE MOBILIZATION STRATEGY FOR UNRWA (2012-2015), OCTOBER 201171support its operations and programmes. A collaboration with TNT and the Boston Consulting Group was particularly instrumental. In 2007 WFP was ranked as one of 34 leaders in public–private partnerships, according to a survey by the Global Compact. One of the key success factors was the decision to work with corporations to leverage their core competencies and ensure the agency had access to cutting-edge private-sector approaches, technology and expertise.
In-kind contributions increased from USD 23 million in 2003 to around USD 43 million in 2007; over the same period cash contributions increased from USD 5 million to USD 38 million. Furthermore, it appeared that private donors were ready to accept that there are costs involved in raising funds and that these are higher than seeking public contributions. An important lesson was that corporate partnerships require a significant level of service in terms of engagement, communications and reporting. The number of partners and the complexity of each relationship have to be managed in accordance with the organisation’s capacity to provide support.
Other key lessons learned included:
• Strong research and due diligence ensure WFP minimises potential risk to its reputation.
• Public information is crucial; a sustainable strategy for marketing, communications and branding is essential.
• WFP’s field offices are willing to reach out to potential private-sector donors. Country offices must, however, be supported by corporate guidance, training and access to specialist advice.
• Private donors accept that there are costs involved in raising funds and that these are higher than seeking public funds. Discussions with private donors reveal that they are willing to see up to 20 per cent of their donations used to offset fundraising costs (seven per cent indirect support and 13 per cent goes to the private-sector revolving fund), enabling WFP
to finance the costs of increased private-sector fundraising.
Today WFP has a revised strategy for private-sector partnerships, which aims to raise USD 200 million a year by 2017, USD 50 million of which is to be fully flexible. WFP expects to generate about 50–60 per cent of its cash donations from corporations and 40–50 per cent from individuals and foundations. The financing model consists of a series of advances from the General Fund covering a five-year period. These will be fully repaid with interest over the subsequent five years to ensure the financial impact on the General Fund is cost-neutral
This strategy was adopted in 2008. It included:
• Retain existing WFP global humanitarian partners and recruit partners for each of WFP’s major business areas;
• Retain and foster existing, and attract new, WFP corporate supporters;
• Extend WFP’s outreach to foundations;
• Cultivate high-net-worth individuals;
• Enhance outreach to smaller individual donors through the web.
The 2008 provisional budget was USD 6.5 million; it was expected to rise to USD 11.1 million for 2017. WFP needed to expand the staff capacity in the private partnerships division, including the recruitment of a small number of technical specialists to support areas such as online fundraising. With these resources, WFP expected to generate approximately USD 81 million in 2008, of which USD 43 million were gifts-in-kind and USD 38 million in cash, rising to almost USD 270 million 2017, of which about USD 70 million would be gifts-in-kind and USD 200 million in cash
In 2009, support from the private sector totaled USD 104 million, three per cent of total contributions; this surpassed the annual goal of USD 80 million.
WFP signed a new long-term partnership with LG Electronics, the first Asian multinational to support WFP internationally, and also signed two new corporate partnerships with Heinz and Kraft, through Project Laser Beam, which was launched in September 2009 at the Clinton Global Initiative. Through Project Laser Beam, WFP is leading the way for a first-ever alliance of food companies – across competitive lines – to fight hunger.
Private partnerships continue to be a major driver of WFP’s enhanced nutrition improvement approach, bringing the expertise of the private sector to the service of the nutrition unit. Two specialists from life sciences company DSM have worked in Egypt and Kenya on specific issues, and several nutritionists were added to WFP’s roster in 2009, all funded by the private sector. WFP will continue to collaborate closely with the private sector on nutrition, and also in the area of emergency preparedness and response. The private sector continues to support WFP’s emergency response capacity, with action in all major emergencies in 2009. An example is the tropical typhoon in the Philippines, where more than USD 1 million dollars was raised rapidly through corporations’ networks. In-kind support – such as two cargo flights from TNT – was also forthcoming and prompt, and WFP aims to maintain successful partnerships in this area. In 2010, WFP aimed to continue building its geographic network of private-sector support for its strategic objectives, focusing on increasing foundation support and contributions from individuals.
WFP has successfully adopted the internet for raising funds. In 2009, a monthly average of 220,000 people visited the WFP website, including 40,000 individuals who contributed a total of more than USD 1.5 million online
WFP continues to anticipate growth in the support it receives from the private sector as it engages with more global humanitarian partners, extends its outreach to corporate partners and foundations, cultivates high-net-worth individuals, and builds a programme of better outreach to smaller donors.
WFP has also benefited from large donations from other NGO’s which do not have a programme-implementation capability. This
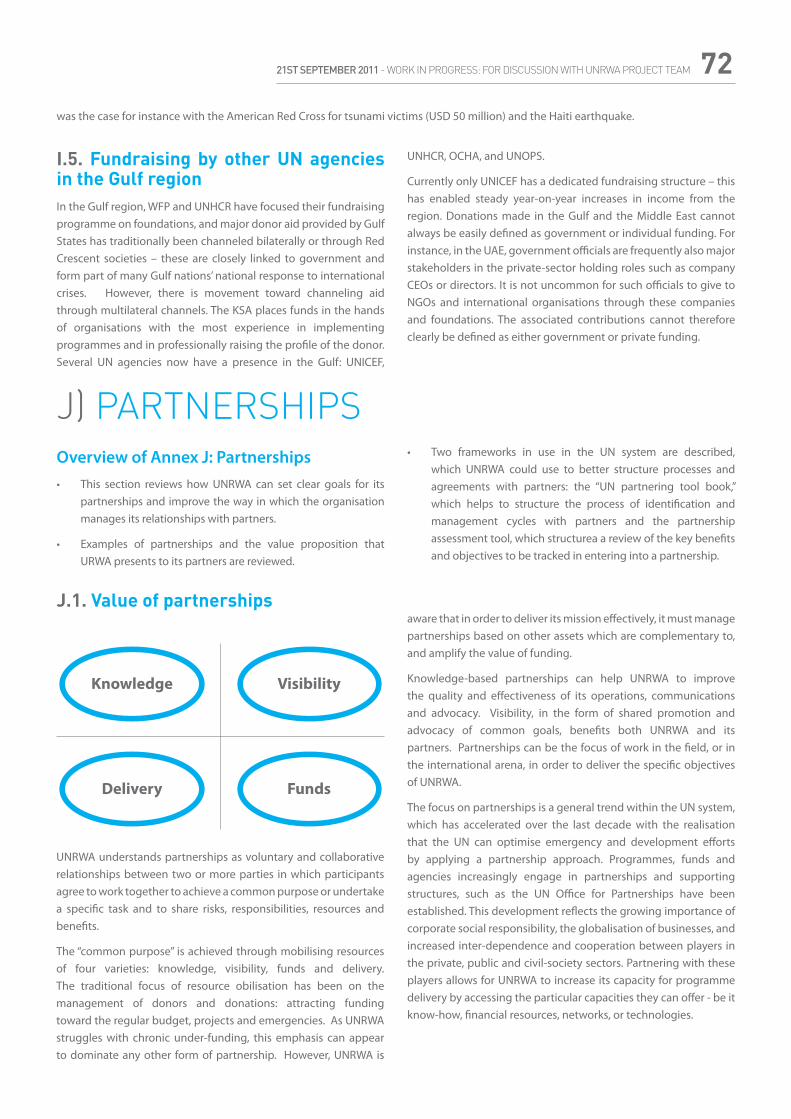
21ST SEPTEMBER 2011 - WORK IN PROGRESS: FOR DISCUSSION WITH UNRWA PROJECT TEAM 72was the case for instance with the American Red Cross for tsunami victims (USD 50 million) and the Haiti earthquake.
I.5. Fundraising by other UN agencies in the Gulf regionIn the Gulf region, WFP and UNHCR have focused their fundraising programme on foundations, and major donor aid provided by Gulf States has traditionally been channeled bilaterally or through Red Crescent societies – these are closely linked to government and form part of many Gulf nations’ national response to international crises. However, there is movement toward channeling aid through multilateral channels. The KSA places funds in the hands of organisations with the most experience in implementing programmes and in professionally raising the profile of the donor. Several UN agencies now have a presence in the Gulf: UNICEF,
UNHCR, OCHA, and UNOPS.
Currently only UNICEF has a dedicated fundraising structure – this has enabled steady year-on-year increases in income from the region. Donations made in the Gulf and the Middle East cannot always be easily defined as government or individual funding. For instance, in the UAE, government officials are frequently also major stakeholders in the private-sector holding roles such as company CEOs or directors. It is not uncommon for such officials to give to NGOs and international organisations through these companies and foundations. The associated contributions cannot therefore clearly be defined as either government or private funding.
J) PARTNERSHIPSOverview of Annex J: Partnerships• This section reviews how UNRWA can set clear goals for its
partnerships and improve the way in which the organisation manages its relationships with partners.
• Examples of partnerships and the value proposition that URWA presents to its partners are reviewed.
J.1. Value of partnerships
UNRWA understands partnerships as voluntary and collaborative relationships between two or more parties in which participants agree to work together to achieve a common purpose or undertake a specific task and to share risks, responsibilities, resources and benefits.
The “common purpose” is achieved through mobilising resources of four varieties: knowledge, visibility, funds and delivery. The traditional focus of resource obilisation has been on the management of donors and donations: attracting funding toward the regular budget, projects and emergencies. As UNRWA struggles with chronic under-funding, this emphasis can appear to dominate any other form of partnership. However, UNRWA is
• Two frameworks in use in the UN system are described, which UNRWA could use to better structure processes and agreements with partners: the “UN partnering tool book,” which helps to structure the process of identification and management cycles with partners and the partnership assessment tool, which structurea a review of the key benefits and objectives to be tracked in entering into a partnership.
aware that in order to deliver its mission effectively, it must manage partnerships based on other assets which are complementary to, and amplify the value of funding.
Knowledge-based partnerships can help UNRWA to improve the quality and effectiveness of its operations, communications and advocacy. Visibility, in the form of shared promotion and advocacy of common goals, benefits both UNRWA and its partners. Partnerships can be the focus of work in the field, or in the international arena, in order to deliver the specific objectives of UNRWA.
The focus on partnerships is a general trend within the UN system, which has accelerated over the last decade with the realisation that the UN can optimise emergency and development efforts by applying a partnership approach. Programmes, funds and agencies increasingly engage in partnerships and supporting structures, such as the UN Office for Partnerships have been established. This development reflects the growing importance of corporate social responsibility, the globalisation of businesses, and increased inter-dependence and cooperation between players in the private, public and civil-society sectors. Partnering with these players allows for UNRWA to increase its capacity for programme delivery by accessing the particular capacities they can offer ‐ be it know-how, financial resources, networks, or technologies.
21ST SEPTEMBER 2011 - WORK IN PROGRESS: FOR DISCUSSION WITH UNRWA PROJECT TEAM73
J.2. Examples of partnerships
Type Activities Examples
International NGOs
A broad range of international NGOs work to support the human development of Palestine refugees. With their respective areas of specialisation and particular strengths, international NGOs are valuable partners to UNRWA. For decades, UNRWA and international NGOs have identified areas of collaboration and benefited mutually from joining efforts within the educational, health, relief and emergency programmes.
CASPEA Foundation, Clowns Without Borders, Diakonia, Doctors without Borders, International Committee for Development of Peoples, International Islamic Relief Organization, Lutheran World Federation, Near East Council for Churches, Premier Urgence, Red Crescent Societies, Right 2 Play, Rotary International, Save the Children.
Local NGOsUNRWA’s fields of operation are rich on local NGOs. These NGOs, being firmly-rooted in local communities, are important partners to UNRWA.
Al Islah Charitable Society (oPt), Arab Cultural Centre (Lebanon), Juzoor foundation for Health and Development (oPt), Lane Al Mostaqbal (Lebanon), Mezan Law Group for Human Rights (Jordan), Najdeh Association (Jordan), United Lebanon Youth Project (Lebanon).
Private sector
UNRWA partners with private companies at the international level and locally in the Agency’s fields of operation. The private sector possesses the potential of making important contributions by fostering innovation, providing funding, and sharing expert knowledge within a variety of fields.
Examples of the Agency’s private partners are the Palestinian Pal Tel Group, providing validation of curricular, equipment for training centres and training of instructors and the World Diabetes Foundation (facilitated through partnership with international pharmaceutical company Novo Nordisk) providing training of health personnel, equipment etc.
UN organisations
Other UN agencies working in UNRWA’s five fields of operation have been central partners to the Agency for six decades.
UNRWA is continuously exploring potential synergies of cooperation with UN‐entities and seeks to promote harmonisation of UN development efforts.
The United Nations Children Fund (UNICEF), the United Nations High Commissioner for Refugees (UNHCR), the United Nations International Labor Organization (ILO), the United Nations World Health Organization (WHO) and the United Nations Educational Scientific and Cultural Organization (UNESCO).
UNRWA associations (See examples)
The Spanish Committee for UNRWA was established in 2005. The committee works to advocate for the rights of Palestine refugees and to fundraise for UNRWA’s work. It implements awareness and education activities across Spain and engages in fundraising from the public and private sector.
The American friends of UNRWA provides support for UNRWA’s work through advocacy, fundraising and education. It aims to educate the general American public about the situation of the Palestine refugees and generate awareness of UNRWA’s education, health, and social service programmes.
Italian supporters of Palestine Refugees are, together with UNRWA, in the process of establishing a third national UNRWA association in Italy.
J.3. Value proposition of UNRWA for its partners
Partnering with UNRWA means supporting the most significant and experienced UN agency in the Middle East in providing education for more than 480.000 school children and offering health care to 4.7 million refugees.
Partnering with UNRWA means engaging with a highly professional UN agency, which believes that cooperation with the private sector, non-governmental organisations and academia is necessary for
creating the optimal framework for serving the needs of Palestine refugees.
Partnering with UNRWA means putting into effect your company’s/organisation’s support for UN values and commitment to protect refugees.
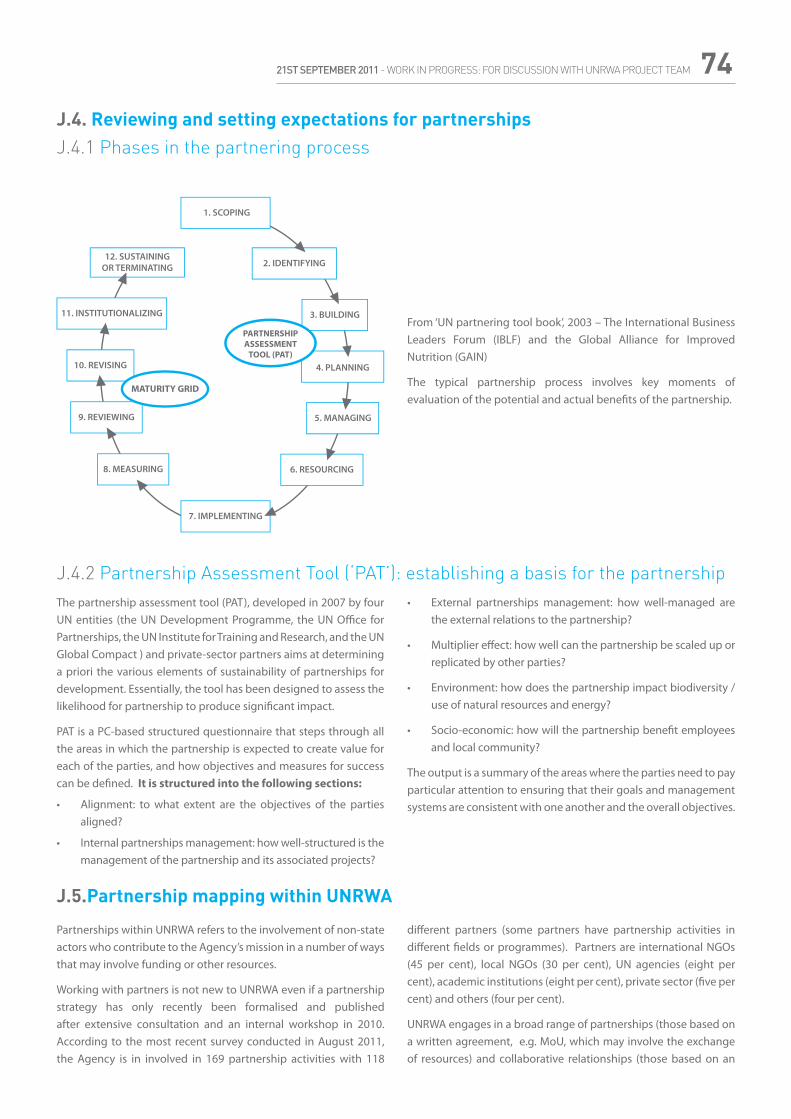
21ST SEPTEMBER 2011 - WORK IN PROGRESS: FOR DISCUSSION WITH UNRWA PROJECT TEAM 74
J.4. Reviewing and setting expectations for partnershipsJ.4.1 Phases in the partnering process
From ‘UN partnering tool book’, 2003 – The International Business Leaders Forum (IBLF) and the Global Alliance for Improved Nutrition (GAIN)
The typical partnership process involves key moments of evaluation of the potential and actual benefits of the partnership.
J.4.2 Partnership Assessment Tool (‘PAT’): establishing a basis for the partnershipThe partnership assessment tool (PAT), developed in 2007 by four UN entities (the UN Development Programme, the UN Office for Partnerships, the UN Institute for Training and Research, and the UN Global Compact ) and private-sector partners aims at determining a priori the various elements of sustainability of partnerships for development. Essentially, the tool has been designed to assess the likelihood for partnership to produce significant impact.
PAT is a PC-based structured questionnaire that steps through all the areas in which the partnership is expected to create value for each of the parties, and how objectives and measures for success can be defined. It is structured into the following sections:
• Alignment: to what extent are the objectives of the parties aligned?
• Internal partnerships management: how well-structured is the management of the partnership and its associated projects?
• External partnerships management: how well-managed are the external relations to the partnership?
• Multiplier effect: how well can the partnership be scaled up or replicated by other parties?
• Environment: how does the partnership impact biodiversity / use of natural resources and energy?
• Socio-economic: how will the partnership benefit employees and local community?
The output is a summary of the areas where the parties need to pay particular attention to ensuring that their goals and management systems are consistent with one another and the overall objectives.
J.5.Partnership mapping within UNRWA
Partnerships within UNRWA refers to the involvement of non-state actors who contribute to the Agency’s mission in a number of ways that may involve funding or other resources.
Working with partners is not new to UNRWA even if a partnership strategy has only recently been formalised and published after extensive consultation and an internal workshop in 2010. According to the most recent survey conducted in August 2011, the Agency is in involved in 169 partnership activities with 118
different partners (some partners have partnership activities in different fields or programmes). Partners are international NGOs (45 per cent), local NGOs (30 per cent), UN agencies (eight per cent), academic institutions (eight per cent), private sector (five per cent) and others (four per cent).
UNRWA engages in a broad range of partnerships (those based on a written agreement, e.g. MoU, which may involve the exchange of resources) and collaborative relationships (those based on an
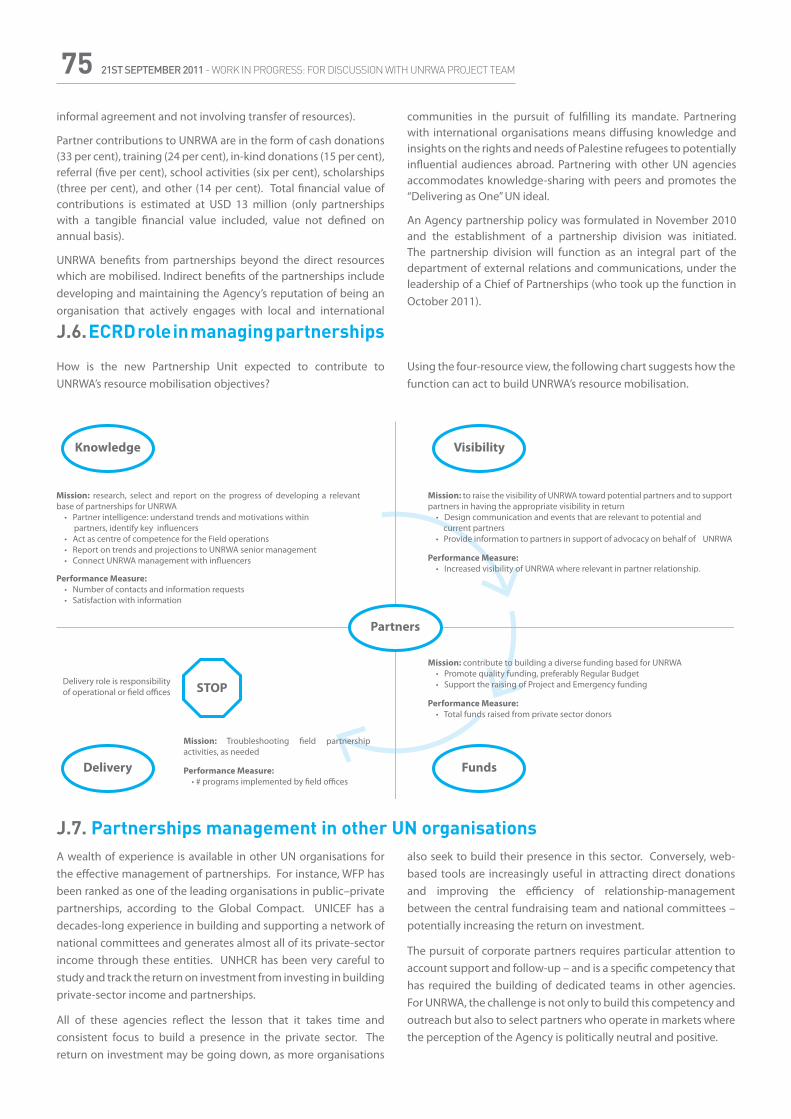
21ST SEPTEMBER 2011 - WORK IN PROGRESS: FOR DISCUSSION WITH UNRWA PROJECT TEAM75informal agreement and not involving transfer of resources).
Partner contributions to UNRWA are in the form of cash donations (33 per cent), training (24 per cent), in‐kind donations (15 per cent), referral (five per cent), school activities (six per cent), scholarships (three per cent), and other (14 per cent). Total financial value of contributions is estimated at USD 13 million (only partnerships with a tangible financial value included, value not defined on annual basis).
UNRWA benefits from partnerships beyond the direct resources which are mobilised. Indirect benefits of the partnerships include developing and maintaining the Agency’s reputation of being an organisation that actively engages with local and international
communities in the pursuit of fulfilling its mandate. Partnering with international organisations means diffusing knowledge and insights on the rights and needs of Palestine refugees to potentially influential audiences abroad. Partnering with other UN agencies accommodates knowledge-sharing with peers and promotes the “Delivering as One” UN ideal.
An Agency partnership policy was formulated in November 2010 and the establishment of a partnership division was initiated. The partnership division will function as an integral part of the department of external relations and communications, under the leadership of a Chief of Partnerships (who took up the function in October 2011).
J.6. ECRD role in managing partnerships
J.7. Partnerships management in other UN organisations
How is the new Partnership Unit expected to contribute to UNRWA’s resource mobilisation objectives?
Using the four-resource view, the following chart suggests how the function can act to build UNRWA’s resource mobilisation.
A wealth of experience is available in other UN organisations for the effective management of partnerships. For instance, WFP has been ranked as one of the leading organisations in public–private partnerships, according to the Global Compact. UNICEF has a decades-long experience in building and supporting a network of national committees and generates almost all of its private-sector income through these entities. UNHCR has been very careful to study and track the return on investment from investing in building private-sector income and partnerships.
All of these agencies reflect the lesson that it takes time and consistent focus to build a presence in the private sector. The return on investment may be going down, as more organisations
also seek to build their presence in this sector. Conversely, web-based tools are increasingly useful in attracting direct donations and improving the efficiency of relationship-management between the central fundraising team and national committees – potentially increasing the return on investment.
The pursuit of corporate partners requires particular attention to account support and follow-up – and is a specific competency that has required the building of dedicated teams in other agencies. For UNRWA, the challenge is not only to build this competency and outreach but also to select partners who operate in markets where the perception of the Agency is politically neutral and positive.
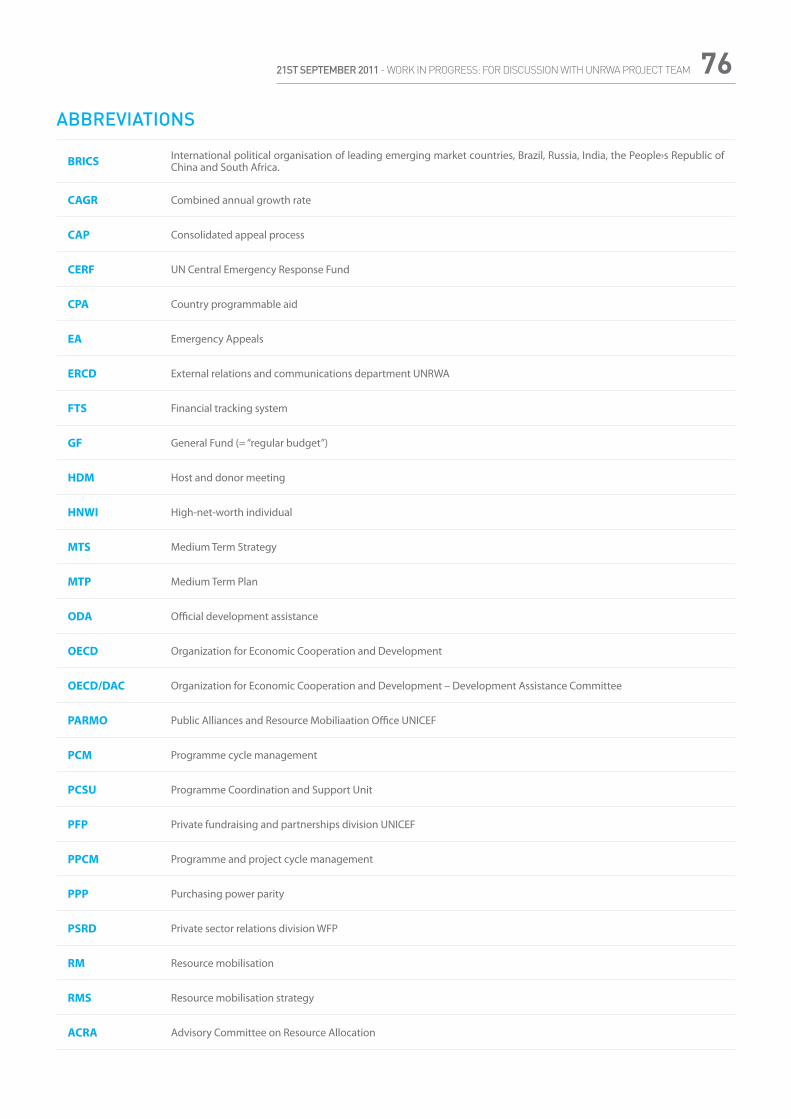
21ST SEPTEMBER 2011 - WORK IN PROGRESS: FOR DISCUSSION WITH UNRWA PROJECT TEAM 76
ABBREVIATIONS
BRICS International political organisation of leading emerging market countries, Brazil, Russia, India, the People›s Republic of China and South Africa.
CAGR Combined annual growth rate
CAP Consolidated appeal process
CERF UN Central Emergency Response Fund
CPA Country programmable aid
EA Emergency Appeals
ERCD External relations and communications department UNRWA
FTS Financial tracking system
GF General Fund (= “regular budget”)
HDM Host and donor meeting
HNWI High-net-worth individual
MTS Medium Term Strategy
MTP Medium Term Plan
ODA Official development assistance
OECD Organization for Economic Cooperation and Development
OECD/DAC Organization for Economic Cooperation and Development – Development Assistance Committee
PARMO Public Alliances and Resource Mobiliaation Office UNICEF
PCM Programme cycle management
PCSU Programme Coordination and Support Unit
PFP Private fundraising and partnerships division UNICEF
PPCM Programme and project cycle management
PPP Purchasing power parity
PSRD Private sector relations division WFP
RM Resource mobilisation
RMS Resource mobilisation strategy
ACRA Advisory Committee on Resource Allocation
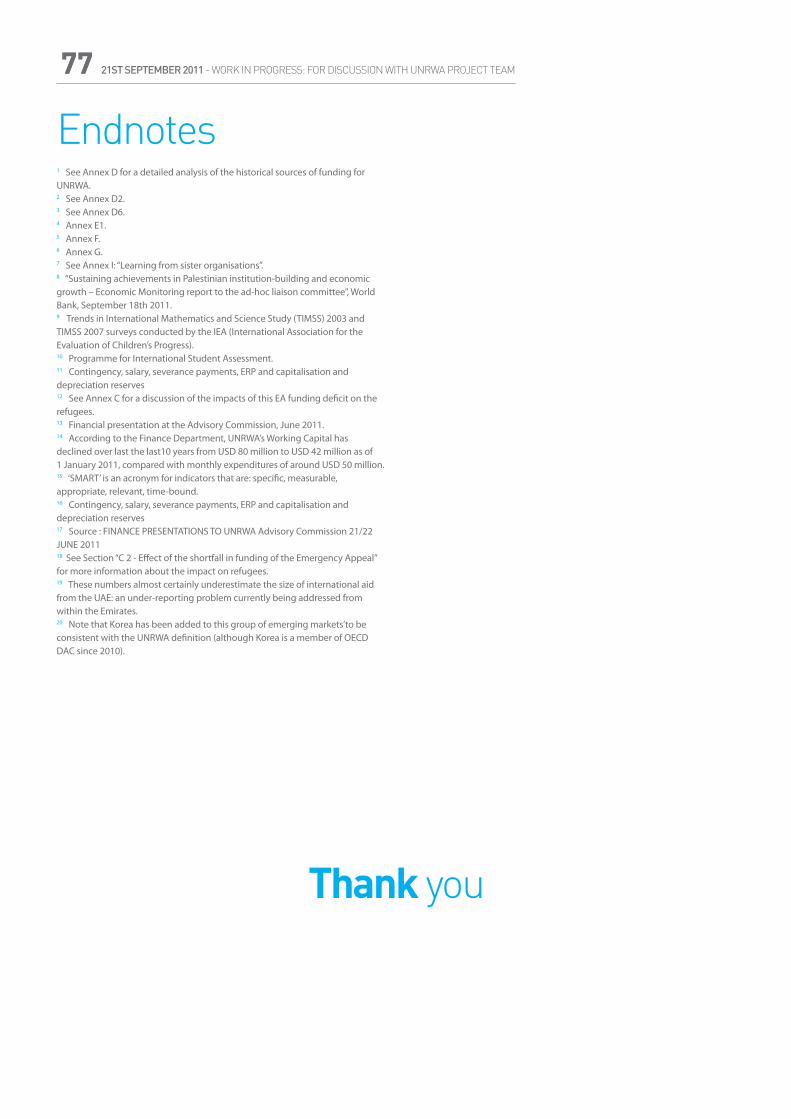
21ST SEPTEMBER 2011 - WORK IN PROGRESS: FOR DISCUSSION WITH UNRWA PROJECT TEAM7777
1 See Annex D for a detailed analysis of the historical sources of funding for UNRWA.2 See Annex D2.3 See Annex D6.4 Annex E1.5 Annex F.6 Annex G.7 See Annex I: “Learning from sister organisations”.8 “Sustaining achievements in Palestinian institution-building and economic growth – Economic Monitoring report to the ad-hoc liaison committee”, World Bank, September 18th 2011.9 Trends in International Mathematics and Science Study (TIMSS) 2003 and TIMSS 2007 surveys conducted by the IEA (International Association for the Evaluation of Children’s Progress).10 Programme for International Student Assessment.11 Contingency, salary, severance payments, ERP and capitalisation and depreciation reserves12 See Annex C for a discussion of the impacts of this EA funding deficit on the refugees.13 Financial presentation at the Advisory Commission, June 2011.14 According to the Finance Department, UNRWA’s Working Capital has declined over last the last10 years from USD 80 million to USD 42 million as of 1 January 2011, compared with monthly expenditures of around USD 50 million.15 ‘SMART’ is an acronym for indicators that are: specific, measurable, appropriate, relevant, time-bound.16 Contingency, salary, severance payments, ERP and capitalisation and depreciation reserves17 Source : FINANCE PRESENTATIONS TO UNRWA Advisory Commission 21/22 JUNE 201118 See Section “C 2 - Effect of the shortfall in funding of the Emergency Appeal” for more information about the impact on refugees.19 These numbers almost certainly underestimate the size of international aid from the UAE: an under-reporting problem currently being addressed from within the Emirates.20 Note that Korea has been added to this group of emerging markets’to be consistent with the UNRWA definition (although Korea is a member of OECD DAC since 2010).
Endnotes
Thank you

21ST SEPTEMBER 2011 - WORK IN PROGRESS: FOR DISCUSSION WITH UNRWA PROJECT TEAM
communications division unrwa jerusalem
po box 19149, 91191 east jerusalem
t: jerusalem (+972 2) 589 0224, f: jerusalem (+972 2) 589 0274t: gaza (+972 8) 677 7533/7527, f: gaza (+972 8) 677 7697
www.unrwa.orgwww.peacestartshere.org
وتشغيل إلغاثة المتحدة األمم وكالة الالجئين الفلسطينيين في الشرق األدنى
united nations relief and works agencyfor palestine refugees in the near east


