44
Public Agency Risk Sharing Authority of California 2012 Annual Report
| Date post: | 09-Apr-2017 |
| Category: |
Government & Nonprofit |
| Upload: | amanda-wright |
| View: | 137 times |
| Download: | 0 times |

Please feel free to contact us for additional information.
Public Agency Risk Sharing Authority of California1525 Response Road, Suite 1Sacramento, California 95815
(800) 400-2642 • www.parsac.org
Public Agency Risk Sharing Authority of California
2012 Annual Report
Accredited with ExcellenceSince 1996

To the Board of Directors,I consider it a real honor to serve as the President of the PARSAC Board. This is a great organization and it is my pleasure to be a part of it. PARSAC is committed to serving its members well. With an outstanding, dedicated and very talented staff, combined with quality business partners, and representatives from some of the best cities and towns in the State of California, I am truly humbled to fill the role of President.
Our agency joined PARSAC well over 20 years ago. When we did, the idea of pooling our resources in order to share the risks of others was a concept we were going to have to get used to. As I became more involved in the organization, I decided to take a proactive role to help guide and chart PARSAC’s future. After all, as the great spokesman Yogi Berra once said: “The future ain’t what it used to be.” Of course, he also once said, “A nickel ain’t worth a dime anymore.” I chose to pursue a leadership role because I believe there is value in participating at a different level. We are all leaders in certain facets of our lives, whether it is in our work environment, our community, or our family. PARSAC is an organization filled with leaders and visionaries who understand our particular industry, the impact of declining revenues and resources and the difficult decisions we must make as a Board to stay ahead of the curve in order to ensure fiscal sustainability.
Despite several years of economic downturn, our programs remain strong. Through conservative fiscal planning, PARSAC is well funded and has achieved the targeted fiscal goals, as established by the Board. The Liability and Workers’ Compensation programs are both funded above the 90% confidence level with surplus funds exceeding $6.1 million and $9.5 million, respectively. Our strong financial position provides greater assurance that (1) funds are sufficient to meet the program’s claim liabilities, (2) the programs are well positioned to absorb the impact of adverse loss development, (3) it reduces the likelihood of future assessments, and (4) we are able to offset potential rate increases through the use of those surplus funds. The Board’s conservative funding philosophies have enabled PARSAC to maintain financial strength and stability while consistently delivering quality services to each of our members.
We do not rest on past accomplishments, nor do we sacrifice long term benefit for short term gain. PARSAC is not an organization that chooses the easy path. We strive to be industry leaders. We are an organization that is innovative, proactive and resourceful, always seeking opportunities to deliver better programs and services. We will never be content to maintain the status quo. Instead, we will strive to raise the bar continually.
PARSAC strongly values the continued commitment and involvement of all our members and I believe we will only get better with a collective vision of collaboratively advancing our mission and our core values to ensure a sustainable future for both our individual agencies and PARSAC as a whole. Preparing for that future matters, especially in these uncertain economic times.
In closing, I want to thank Joanne Rennie and her staff for a job well done this past year. Your dedication and contribution have significantly enhanced membership value for all. I also want to thank Steve Wright, Carolyn Steffan, and Ronda Rivera as the PARSAC officers, for their encouragement and consistent support.
Greg Franklin, PresidentCity of Yuicaipa

2
We like to think of ourselves as rational creatures. We watch our backs, weigh the odds, and pack an umbrella. Science will say that we are more optimistic than realistic. While overly positive assumptions can lead to disastrous miscalculations, make us less likely to get a medical checkup when needed or bet the farm on an investment not fully vetted; it is the bias that protects and inspires us. In Time Magazine’s special report on “How to Live 100 Years” they found that hope keeps our minds at ease, lowers stress and improves health. Optimism may in fact be hardwired in the human brain.
While there will be significant challenges on the horizon, PARSAC has weathered the storm and there is reason to be optimistic. We are a resilient, adaptable organization, seeking new and better ways of providing services. For several years now, PARSAC has collaborated with public agencies to explore shared services and other cooperative opportunities to reduce costs, improve service delivery, or maintain existing services. These shared service partnerships have resulted in the formation of several regional SWAT units and consolidated dispatch services between member and non-member agencies.
Our conservative fiscal approach yielded surplus in the Liability and Workers’ Compensation Programs. Surplus allows the Board flexibility to determine the best use of equity, which can be used to offset future rate increases and explore options to reduce the cost of Employment Practices Coverage. While stable funding is a constant pursuit, workers’ compensation is front and center on everyone’s agenda. The Workers’ Compensation Subcommittee continues to pursue options to control costs while providing quality medical care and support for our injured workers. Some of their results are a pilot program for nurse triage services to get the right care to the right people at the right time. Continual review of service providers ensure that PARSAC members receive quality service at a reasonable cost from all our business partners. They also supported the creation of a defense panel and litigation guidelines and approved communication pieces to educate employees about the workers’ compensation system. As a group, we developed new self-insured retention levels to allow members to reduce their premium in exchange for taking on additional risk and responsibility. Finally, the experience modification formula was revised to be more sensitive to the risk posed by public safety.
We were also very active in the legislative process, monitoring bills that impact member agencies, writing letters and meeting with your representatives on your behalf. We had some success such as: the defeat of AB 2231, which imposed new duties and liability for cities to maintain sidewalks; AB 2451, which extended the period for dependents of firefighters to file a claim for death benefits; and SB 1168, which limits the ability for “professional litigants” to file ADA claims.
On behalf of staff, I would like to thank the Board of Directors, Alternates, and everyone who served on subcommittees this past year for your selfless commitment to serve your respective communities and PARSAC; for your tenacity in the throes of adversity and for the vision you promote everyday that together we are turning the tide.
Joanne Rennie, ARM SPHRGeneral Manager
General Manager’s Message
Difficulty breeds innovation, challenge creates strength; both drive success.

Public Agency Risk Sharing Authority of California 3
Our guiding values include a committment to build and maintain positive relationships through open
communication, mutual respect, and trust.
Board of Directors2011-2012
Alturas Heather MacDonnell Kenneth Barnes
Amador City Aaron Brusatori Janet Spencer
Avalon Betty Jo Garcia Audrey Clasen
Blue Lake Adrienne Nielsen John Berchtold
California City William “Tom” Weil Michelle Pengilley
Calimesa James Hyatt William Davis
Calistoga Richard Spitler Gloria Leon
Citrus Heights Ronda Rivera Amy Van
Clearlake Melissa Swanson Joan Phillipe
Coalinga Darrel Pyle Mercedes Garcia
Ferndale Jay Parrish Deb Austrus
Grass Valley Dan Holler Maryann Hoffler
Highland Sam Racadio Chuck Dantuono
Menifee Terri Willoughby William Rawlings
Nevada City Catrina Olson David Brennan
Pacific Grove Jim Becklenberg Cathy Krysyna
Placentia Troy Butzlaff Steve Pischel
Placerville Cleve Morris Dave Warren
Plymouth Gloria Stoddard Jeff Gardner
Point Arena Hunter Alexander
Rancho Cucamonga John Gillison Chris Paxton
Rancho Santa Margarita Paul Boyer Mark Taylor
Rialto Donna Vickers Paula Mohan
San Juan Bautista Trish Paetz
South Lake Tahoe Janet Emmett Michelle Beckwith
Tehama Carolyn Steffan Betty Celano
Trinidad Gabriel Adams Karen Suiker
Truckee Kim Szczurek Diane McLaughlin
Twentynine Palms Ron Peck Richard Warne
Watsonville Marc Pimentel Nathalie Manning
Wheatland Stephen Wright Rex Miller
Wildomar Bob Cashman Gary Nordquist
Yountville Steve Rogers Kathleen Bradbury
Yucaipa Greg Franklin Raymond Casey
Yucca Valley Dani Lassetter Curtis Yakimow

4
In our global economy, turmoil of the European debt crisis and decelerating growth in Asia continue to slow economic recovery, and in turn the prospect for higher fixed-income investment yields in the US. Additionally, the Federal Reserve has extended their commitment to keep interest rates low through mid-2015. In spite of the decline, we are starting to hear good news for the US economy: consumer spending is expanding; energy costs have fallen; new and existing home sales are on the rise; and borrowing costs are at record lows. PARSAC has weathered the recession through continued conservative management of investments in US Treasury, high quality municipal, and Federal Agency securities.
When the year began, PARSAC was facing the continuation of increasing claim costs and declining portfolio earnings. The Executive Committee approved a two-prong approach to the investment strategy.
To meet the increased cash flow needs, $2 million was transferred from the portfolio to the short-term LAIF account; the resulting portfolio balance was $30 million. To bolster the lagging yield, a portion of the portfolio was extended to 4 -5 years to take advantage of higher interest earnings in this maturity range.
The charts highlight the portfolio composition and one-year book returns over the past ten years. Investment earnings have declined continuously in the past five years with the average return at 3%. In response, the Board approved a 1% reduction in the Workers’ Compensation Program discount factor, from 4% to 3%. This action helps to minimize the possibility of a future shortfall by bringing the expected asset growth into alignment with the current investment earnings. Further reductions in the discount factor may be considered depending on market trends. The por t folio continues to be managed by PFM Asset Management with earnings projected in the 1% range. PFM has proactively leveraged the volatile market to find compelling, yet undervalued investment opportunities, that fit well with PARSAC’s conservative investment policy and strategies.
As the year wrapped up, PARSAC received good actuarial news: projected claim liabilities for both programs at year-end had decreased compared to the mid-year report. The Authority continues to meet the economic challenges by focusing on the basic principles of safety, liquidity and yield in the management of member funds.
Ronda Rivera, TreasurerCity of Citrus Heights
Treasurer’s Report
Portfolio Composition
0.00%
1.00%
2.00%
3.00%
4.00%
5.00%
6.00%
02/03 03/04 04/05 05/06 06/07 07/08 08/09 09/10 10/11 11/12
Portfolio PerformanceOne-Year Returns at Book Value

Public Agency Risk Sharing Authority of California 5
It is our mission
to provide quality protection at a reasonable cost to our
members by maintaining a
financially stable risk sharing pool.

6
Over the years, PARSAC’s Liability Program has successfully navigated through various challenges, doubled its membership, and matured into a well-funded program that provides members with comprehensive coverage at stable rates.
Members are encouraged to contact PARSAC for assistance with incidents before they become claims, which often reduces the cost of the claim. We promote a proactive claims management philosophy including timely investigation of losses, early liability assessment, and prompt resolution when appropriate. Cases are assigned to Defense Panel Counsel according to specialty to produce the best outcome while ensuring cost control.
PARSAC self-funds the first $1 million with an additional $34 million of excess coverage provided through a combination of pooling, excess insurance, and reinsurance. Employment Practices Liabilit y (EPL) coverage limit is $35 million through the liability program’s excess coverage with the first $1 million provided by the Employment Risk Management Association (ERMA). The pool funding rate for 2011-12 decreased from $1.16 to $1.11 due to favorable loss development. The Program remains well funded above the 90% confidence level; surplus was nearly $8.3 million at expected.
Group Purchased Programs
PEPIP Property Coverage: All-risk, replacement cost coverage with limits up to $1 billion for all insurable property and autos. Additional benefits include boiler and machinery up to $100 million; new property acquisitions up to $25 million; and new autos up to $10 million. Optional coverages include course of construction, earthquake, and flood damage.
Special Events: Protects the member from liability by providing facility users with cost-effective insurance up to a $5 million limit per occurrence. Participating members receive up to a $1,000 credit toward their Liability premium.
Bond Program: Up to $1 million per occurrence with a $2,500 deductible for Public Employee Dishonesty; Forgery or Alteration; Theft, Disappearance and Destruction; and Computer Fraud.
Ancillary Benefits: Optional employee health benefits such as dental, vision, life, accidental death & dismemberment, and disability coverage at competitive prices.
Programs and Services

Public Agency Risk Sharing Authority of California 7
PARSAC’s Workers’ Compensation Program began in 1990 as an additional coverage option for existing members. The Program delivers timely medical care and benefits to employees while providing members with affordable, financially stable coverage. PARSAC provides quality care through a dedicated claims unit, nurse advocate, expedited specialist referral, and access to selected Centers of Excellence facilities. Our proactive approach helps members to preserve positive relationships with their employees.
PARSAC self-funds the first $500,000 with statutory limits provided through a combination of pooling, reinsurance, and excess insurance. The pool loss funding rate for 2011-12 remained flat at $3.39. The Program remains well funded above the 90% confidence level; surplus of $11.3 million at expected.
Added Value Services
Consultation:
Litigation Management Proactive Incident and Claim Resolution Representation at Mediation and Settlement Conferences Preserving Governmental Immunities Specialist and Resource Referrals Legislative and Regulatory Compliance Contractual Risk Transfer
Risk Management:
On-Site Risk Assessments Post-incident Assistance and Mitigation Operational Best Practices Policy Templates Lexipol Policies and Daily Training for Law Enforcement & Fire
Training:
Safety & Loss Control Grant Program Video and Print Resource Libraries Regional and On-Site Training Programs Personalized Risk Management Training Web-based OSHA compliant Safety Courses Web-based Employment Practices Courses

8
Financial Statements
with Supplementary Information
for the years endedJUNE 30, 2012 AND 2011
including
INDEPENDENT AUDITOR’S REPORT

Public Agency Risk Sharing Authority of California 9
INDEPENDENT AUDITORS’ REPORT
Board of DirectorsPublic Agency Risk Sharing Authority of CaliforniaSacramento, California
We have audited the accompanying financial statements of the Public Agency Risk Sharing Authority of California (PARSAC) as of June 30, 2012, and the related statements of revenues, expenses and changes in net assets and cash flows for the years then ended. These financial statements are the responsibility of PARSAC’s management. Our responsibility is to express an opinion on these financial statements based on our audit. The financial statements of PARSAC as of June 30, 2011 were audited by other auditors whose report dated October 26, 2011, expressed an unqualified opinion on those statements.
We conducted our audit in accordance with auditing standards generally accepted in the United States of America, the State Controller’s Minimum Audit Requirements for California Special Districts and the standards applicable to financial audits contained in Government Auditing Standards, issued by the Comptroller General of the United States. Those standards require that we plan and perform the audit to obtain reasonable assurance about whether the financial statements are free of material misstatement. An audit includes examining on a test basis, evidence supporting the amounts and disclosures in the financial statements. An audit also includes assessing the accounting principles used and significant estimates made by management, as well as evaluating the overall financial statement presentation. We believe that our audit provides a reasonable basis for our opinion.
In our opinion, the financial statements referred to above present fairly, in all material respects, the financial position of PARSAC as of June 30, 2012, and the results of its operations and cash flows for the year then ended in conformity with accounting principles generally accepted in the United States of America, as well as accounting systems prescribed by the State Controller’s Office and state regulations governing special districts.
In accordance with Government Auditing Standards, we have also issued our report dated October 23, 2012, on our consideration of PARSAC’s internal control over financial reporting and our tests of its compliance with certain provisions of laws, regulations, contracts and other matters. The purpose of that report is to describe the scope of our testing of internal control over financial reporting and compliance and the results of that testing and not to provide an opinion on the internal control over financial reporting or on compliance. That report is an integral part of an audit performed in accordance with Government Auditing Standards and should be considered in assessing the results of our audit.
Accounting principles generally accepted in the United States of America require that the Management’s Discussion and Analysis, Claims Development Information and Schedules of Funding Progress as listed in the table of contents be presented to supplement the basic financial statements. Such information, although not a part of the basic financial statements, is required by the Governmental Accounting Standards Board, who considers it to be an essential part of financial reporting for placing the basic financial statements in an appropriate operational, economic, or historical context. We have applied certain limited procedures to the required supplementary information in accordance with auditing standards generally accepted in the United States of America, which consisted of inquiries of management about the methods of preparing the information and comparing the information for consistency with management’s responses to our inquiries, the basic financial statements, and other knowledge we obtained during our audit of the basic financial statements. We do not express an opinion or provide any assurance on the information because the limited procedures do not provide us with sufficient evidence to express an opinion or provide any assurance.
October 23, 2012

10
Our audit was conducted for the purpose of forming an opinion on the financial statements that collectively comprise PARSAC’s financial statements as a whole. The reconciliation of claims liability by type of contract and combining financial statements listed in the table of contents as supplementary information are presented for purposes of additional analysis and are not a required part of the basic financial statements. These statements are the responsibility of management and were derived from and relate directly to the underlying accounting and other records used to prepare the financial statements. The information has been subjected to the auditing procedures applied in the audit of the financial statements and certain additional procedures, including comparing and reconciling such information directly to the underlying accounting and other records used to prepare the financial statements or to the financial statements themselves, and other additional procedures in accordance with auditing standards generally accepted in the United States of America. In our opinion, the information is fairly stated in all material respects in relation to the financial statements as a whole.
Independent Auditors Report - Page 2

Public Agency Risk Sharing Authority of California 11
Management Discussion & AnalysisThe management of the Public Agency Risk Sharing Authority of California (PARSAC) is pleased to present the following discussion and analysis of the financial performance for the fiscal year ended June 30, 2012. It is provided in order to enhance the information included in the following financial report.
Formed in May 1986, the Public Agency Risk Sharing Authority of California, formerly the California Municipal Insurance Authority (CMIA) is a state-wide joint powers authority. It provides both self-insured and group purchase coverages to 35 municipalities throughout California. PARSAC operates self-insured programs for liability and workers’ compensation, and offers insured programs for property, boiler and machinery, fidelity bonds, special events and employee benefits. Additionally, PARSAC provides claims administration, loss control and training for members. PARSAC has invested in a building in Sacramento that houses its administrative office and a conference center that is available for meetings and training.
The Authority is governed by a Board of Directors comprised of representatives from each member agency. The Board of Directors elects its officers; President, Vice President, Treasurer, and Auditor/Controller.
The daily operations are administered by the General Manager who serves as the chief executive officer. The General Manager is responsible for the administration of the policies as set forth by the Authority’s organizational documents and the Board of Directors.
FINANCIAL HIGHLIGHTS
The Board approved funding at the 85% and 75% confidence levels in the Liability and Workers’ • Compensation Programs.
The Grant Program commenced. A two-year pilot program offering members grants for loss control • services and equipment in place of the regional training previously offered.
Investments earned a total return of 1.20% for the year on a $31 million portfolio, representing over • three times the average return of LAIF at 0.38%.
OVERVIEW OF THE FINANCIAL STATEMENTS
The Authority operates as an enterprise fund applying the accrual basis of accounting. Individual program accounting is maintained in-house and is provided as supplemental information to the financial statements. The Statement of Net Assets provides information about the combined financial position of PARSAC as of June 30, 2012 and 2011. The Statement of Revenues, Expenses, and Changes in Net Assets report the results of operations. The Statement of Cash Flows is presented to reflect the operations of PARSAC based strictly on the inflow and outflow of cash. The Notes to the Financial Statements provide information on unique accounting policies of the Authority, such as development of claim liabilities, and retrospective premium adjustment.

12
CONDENSED FINANCIAL INFORMATION
Statement of Net Assets
June 30, 2012 % June 30, 2011 % June 30, 2010 %
Current Assets $ 6,637,002 17% $ 12,247,017 34% $ 10,919,704 30%
Non-Current Assets 30,950,372 80% 23,103,004 63% 24,636,924 67%
Capital Assets 910,707 3% 977,879 3% 967,273 3%
Total Assets $ 38,498,081 100% $ 36,327,900 100% $ 36,523,901 100%
Current Liabilities $ 7,872,733 44% $ 5,809,887 38% $ 5,845,235 39%
Non-Current Liabilities
9 ,895,043 56% 9,619,186 62% 8,979,305 61%
Total Liabilities 17,767,776 100% 15,429,073 100% 14,824,540 100%
Capital Assets 910,707 4% 977,879 5% 967,273 4%
Net Assets 19,819,598 96% 19,920,948 95% 20,732,088 96%
Total Net Assets 20,730,305 100% 20,898,827 100% 21,699,361 100%
Total Liabilities and Net Assets
$38,498,081 100% $ 36,327,900 100% $ 36,523,901 100%
Management Discussion & Analysis
The strongest do indeed emerge through adversity.

Public Agency Risk Sharing Authority of California 13
Statement of Revenues, Expenses, and Change in Net Assets
Year EndedJune 30, 2012
Year EndedJune 30, 2011
Year EndedJune 30, 2010
Operating Revenue:
Member Contributions $10,370,943 $11,040,392 $12,321,895
Retro Premium Adjust. (RPA) 0 (656,841) (453,029)
Other 11,564 13 ,436 0
10,382,507 10,396,987 11,868,866
Operating Expenses:
Claims Expense 5,339,189 6,129,003 2,522,301
Excess Insurance Expense 3,553,110 3 ,736,213 3,939,598
Program Services Expense 589,130 556,862 449,275
General Administrative Expense 1,202,806 1,142,634 1,143,298
Total Operating Expenses 10,684,235 11,564,712 8,054,472
Operating Income (Loss) (301,728) (1,167,725) 3 ,814,394
Non-Operating Income and (Expense):
Investment Income 409,857 456,055 760,907
Rental Expense (51,695) (99 ,364) (42 ,281)
Gain on Sale 0 10,500 0
Total Non-Operating Income 358,162 367,191 718,626
Income (Loss) Before Equity Distribution
56,434 (800,534) 4 ,533,020
Equity Distribution (224,956) 0 0
Change in Net Assets (168,522) (800,534) 4 ,533,020
Beginning Net Assets 20,898,827 21,699,361 17,166,341
Ending Net Assets $20,730,305 $20,898,827 $21,699,361
ANALYSIS OF OVERALL FINANCIAL POSITION
Total assets increased by approximately $2.1 million, with net assets decreasing by $168,000 due to decreased investment earnings, decreased member payroll and increased claim costs in the Liability and Workers’ Compensation Programs.
The Authority’s $31 million investment portfolio is managed by PFM Asset Management, LLC and securities are held in a custodial account with Union Bank. The actively managed portfolio consists of fixed income and municipal securities in accordance with the Authority’s investment policy and the California Government Code. Funds not immediately needed for the payment of claims and administrative expenses are maintained in the State of California Local Agency Investment Fund (LAIF), which is administered by the State Treasurer’s Office. At June 30, 2012, the LAIF balance was approximately $3.2 million.
Liability Program41%
Workers' Compensation
Program52%
Property/Bond Program
4%
Building Fund3%
Figure 1 - Total Assets by Program

14
Declining yields and increasing claim payments resulted in a change in the investment strategy to increase the balance in LAIF and extend investments to four to five years. The ability to earn investment income has a direct impact on program rates, as this income is used to discount funding and future liabilities. When investments fall short of projections, additional funding may be required to meet actuarial estimates. The Authority takes these interest rate conditions into consideration when developing annual premium contributions. Figure 2 illustrates the portfolio’s change in maturity distribution from the prior year. In the fourth quarter of the fiscal year, the Authority’s investment advisor began to put the new strategy in place.
ANALYSIS OF OVERALL RESULTS OF OPERATIONS All members participate in the Liability Program, which is the largest revenue generator at under $5.1 million or 47% of revenue. The Workers’ Compensation Program follows representing 37% of revenue. Investment income including market value change totaled $409,857 representing 4% of total revenue.
Claims expense and excess insurance make up 83% of expenses as shown in the Figure 4 - Total Expense chart. Claims administration and loss control programs represent 6% of expenses and general administration is 10% of expenses.
Retrospective Premium Adjustments, Alternate Use of Equity and Rate Stabilization Fund
Retrospective Premium Adjustment (RPA) was the original term for equity distributions and assessments. The calculation of the RPA is based on policies requiring a minimum overall funding level as well as Target Equity equal to five times the pool self insured retention. The Liability Program did not meet its target equity goal for the year. The Workers’ Compensation Program met its goals, but the RPA process identified assessments for several members. The Board approved an alternate use of equity in the Workers’ Compensation Program to allow $99,956 of member equity to be used to offset 2012/13 premium increases.
The Liability Program established a Rate Stabilization Fund in 2009/10 from savings realized when changing excess programs. The Board approved use of $125,000 to offset premium increases in the 2012/13 year.
Management Discussion & Analysis
0% 0%
34%
26%28%
0%
15%13%
34%
38%
0% 0%
June 30, 2012 June 30,2011
Under 6 6 – 12 1 - 2 2 - 3 3 - 4 4 - 5Months Months Years Years Years Years
Figure 2 – Portfolio Maturity Distribution at June 30, 2012 and June 30, 2011
Figure 4 - Total Expense
Claims Expense50%
Excess Insurance33%
Claims Administration
4%
Loss Control Expense
2%
Consultants1%
General Administration
10%
Figure 3 - Revenue by Program
Liability Program47%
Work Comp Program37%
Prop/Bond Program12%
Investment Income4%
Other Income0%

Public Agency Risk Sharing Authority of California 15
Claims Expense
The Authority contracts with Bickmore Risk Services for actuarial valuations of the self-insured Liability and Workers’ Compensation Programs. Figure 5 illustrates the Liability Program ultimate loss by program year as determined by the actuary. The ultimate loss represents the total cost of claims expected in a given program year. Components of ultimate loss are paid and reserved claims, and incurred but not reported (IBNR) reserves. The Liability Program claims history has been erratic with claim costs ranging from a high of $5.4 million to a low of $50,000. The actuary set the ultimate cost of claims at an average of $2.5 million over the past five years.
Figure 6 illustrates the Workers’ Compensation Program Ultimate Loss by Program Year as determined by the actuary. While the Program’s history indicates a consistent pattern with claims costs averaging $1 million, the most recent five years have increased. The actuary has set the ultimate cost of claims at an average of $2.5 million over the past five years.
CAPITAL ASSETS
The majority of the Authority’s capital assets are invested in a building located in Sacramento. PARSAC’s administrative office occupies approximately 3,600 square feet of the building and the remaining 3,600 square feet, formerly tenant space, has been converted into a conference facility for meetings and training. The Authority will endeavor to lease the space when economic circumstances in the market improve.
-$1,000,000
$0
$1,000,000
$2,000,000
$3,000,000
$4,000,000
$5,000,000
$6,000,000
86/8
7
87/8
8
88/8
9
89/9
0
90/9
1
91/9
2
92/9
3
93/9
4
94/9
5
95/9
6
96/9
7
97/9
8
98/9
9
99/0
0
00/0
1
01/0
2
02/0
3
03/0
4
04/0
5
05/0
6
06/0
7
07/0
8
08/0
9
09/1
0
10/1
1
11/1
2
Paid (less recovery) Reserves for Reported Claims Discounted IBNR & Reserve
Figure 5 – Liability Program Ultimate Loss by Program Year
-$500,000
$0
$500,000
$1,000,000
$1,500,000
$2,000,000
$2,500,000
$3,000,000
$3,500,000
90/9
1
91/9
2
92/9
3
93/9
4
94/9
5
95/9
6
96/9
7
97/9
8
98/9
9
99/0
0
00/0
1
01/0
2
02/0
3
03/0
4
04/0
5
05/0
6
06/0
7
07/0
8
08/0
9
09/1
0
10/1
1
11/1
2
Paid (less recovery) Reserves for Reported Claims Discounted IBNR & Res
Figure 6 – Workers’ Compensation Program Ultimate Loss by Program Year

16
STATEMENT OF NET ASSETSJune 30, 2012 and 2011
2012 2011
ASSETS
Current Assets:
Cash and Cash Equivalents $3,889,733 $2,247,771
Interest Receivable 116,419 93,895
Member Receivable 463,134 713,867
Excess Receivable 54,827 122,708
Prepaid Expenses 2,069,284 2,095
Net Pension Asset 43 ,605 35,000
Investments 0 9,031,681
Total Current Assets 6 ,637,002 12,247,017
Non-Current Assets:
Net Pension Asset 43 ,606 95,817
Investments 30,906,766 23,007,187
Capital Assets 1,693,917 1,692,350
Accumulated Depreciation (783,210) (714,471)
Total Non-Current Assets 31,861,079 24,080,883
Total Assets $38,498,081 $36,327,900
LIABILITIES & NET ASSETS
Current Liabilities:
Accounts Payable $37,780 $121,158
Accrued Expenses 110,870 119,133
Committee Training Stipend Payable 16,607
Deferred Revenue 2,475,831 927,757
Rate Stabilization Payable 125,000
Equity Distribution Payable 99,956
Retrospective Premium Adjustment Payable 266,004 548,119
Unpaid Claims And Adjustment Expenses 4 ,740,685 4,093,720
Total Current Liabilities 7,872,733 5,809,887
Non-Current Liabilities
Unpaid Claims and Claim Adjustment Expenses 9 ,895,043 9,619,186
Total Liabilities 17,767,776 15,429,073
Net Assets:
Invested In Capital Assets 910,707 977,879
Unrestricted 19,819,598 19,920,948
Total Net Assets $20,730,305 $20,898,827
Basic Financial Statements
See independent auditors’ report and notes to financial statements.
Public Agency Risk Sharing Authority of California 17
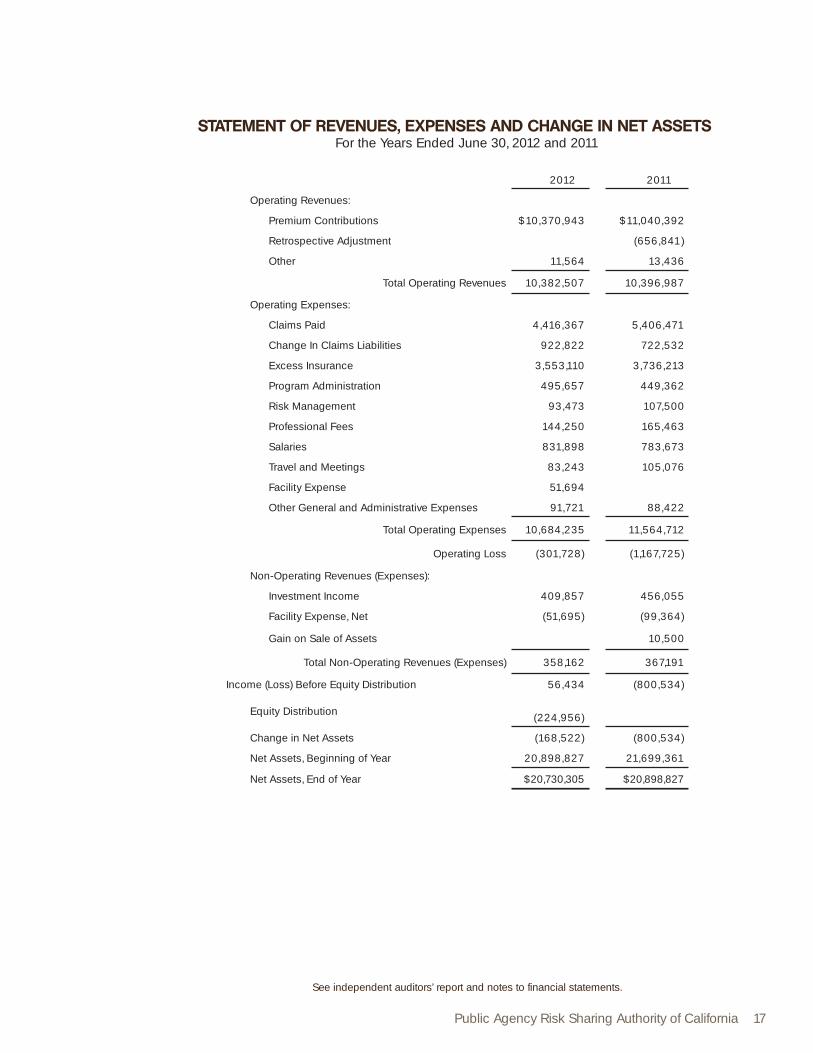
STATEMENT OF REVENUES, EXPENSES AND CHANGE IN NET ASSETSFor the Years Ended June 30, 2012 and 2011
2012 2011
Operating Revenues:
Premium Contributions $10,370,943 $11,040,392
Retrospective Adjustment (656,841)
Other 11,564 13 ,436
Total Operating Revenues 10,382,507 10,396,987
Operating Expenses:
Claims Paid 4,416,367 5,406,471
Change In Claims Liabilities 922,822 722,532
Excess Insurance 3,553,110 3,736,213
Program Administration 495,657 449,362
Risk Management 93,473 107,500
Professional Fees 144,250 165,463
Salaries 831,898 783,673
Travel and Meetings 83,243 105,076
Facility Expense 51,694
Other General and Administrative Expenses 91,721 88 ,422
Total Operating Expenses 10,684,235 11,564,712
Operating Loss (301,728) (1,167,725)
Non-Operating Revenues (Expenses):
Investment Income 409,857 456,055
Facility Expense, Net (51,695) (99 ,364)
Gain on Sale of Assets 10 ,500
Total Non-Operating Revenues (Expenses) 358,162 367,191
Income (Loss) Before Equity Distribution 56,434 (800,534)
Equity Distribution
(224,956)
Change in Net Assets (168,522) (800,534)
Net Assets, Beginning of Year 20 ,898,827 21,699,361
Net Assets, End of Year $20,730,305 $20,898,827
See independent auditors’ report and notes to financial statements.

18
STATEMENT OF CASH FLOWSFor the Years Ended June 30, 2012 and 2011
2012 2011
Cash Flows from Operating Activities:
Contributions Received $11,915,806 $9 ,734,516
Salaries and Benefits Paid (796,555) (745,670)
Claims Expense Paid (4 ,348,486) (5 ,406,471)
Premiums Paid (5 ,620,299) (3 ,689,845)
General and Administrative Expenses Paid (1,000,966)
(905,626)
Net Cash Provided (Used) By Operating Activities 149,500 (1,013,096)
Cash Flows from Investing Activities:
Interest Income Received 223,625 547,036
Loss (Gain) on Sale of Investments 163,708 106 ,734
Investments Purchased (34 ,649,982) (36 ,718,201)
Proceeds from Sales and Maturities of Investments 35,782,084 34,098,002
Facilities Expenses Paid (25 ,406) (42 ,300)
Net Cash Provided (Used) In Investing Activities 1,494,029 (2 ,008,729)
Cash Flows from Capital and Related Financing Activities:
Disposal of Fixed Assets 10,500
Purchase of Fixed Assets
(1,567) 85 ,582)
Net Cash Used In Capital and Related Financing Activities (1,567) (75 ,082)
Net Increase (Decrease) in Cash and Cash Equivalents 1,641,962 (3 ,096,907)
Cash and Cash Equivalents, Beginning of Year 2 ,247,771 5 ,344,678
Cash and Cash Equivalents, End of Year $3,889,733 $2,247,771
Reconciliation of Net Operating Loss To Net Cash Provided (Used) By Operating Activities:
Net Operating Loss (301,728) (1,167,725)
Adjustments To Reconcile Operating Loss To Net Cash Provided (Used) By Operating Activities:
Depreciation Expense 42,450 17,912
(Increase) Decrease In:
Member Receivable 250,733 (540,184)
Excess Receivable 67,881 (7,353)
Prepaid Expense (2 ,067,189) 53 ,721
Net Pension Asset 43 ,606 26,000
Increase (Decrease) In:
Accounts Payable (83 ,378) (7,715)
Accrued Expenses (8 ,263) 12 ,003
Committee Training Stipend Payable 16,607
Deferred Revenue 1,548,074 (264,885)
Retrospective Premium Adjustment (282,115) 142,598
Claims Liabilities 922,822 722,532
Net Cash Provided (Used) By Operating Activities $149,500 $(1,013,096)
Supplementary Non-Cash Flow Information
Investing Activities
Decrease in Fair Value of Investments $ 300,544 $ 43,995 See independent auditors’ report and notes to financial statements.

Public Agency Risk Sharing Authority of California 19
1. ORGANIZATION
General
The Public Agency Risk Sharing Authority of California (PARSAC), is a governmental joint powers authority pursuant to the Government Code of the State of California, commencing with Section 6500. PARSAC is a statewide agency providing California municipalities with risk management services including loss control, risk sharing and joint purchase coverage programs.
PARSAC offers self-funded Liability and Workers’ Compensation programs. In addition, PARSAC offers members access to group purchase insurance programs covering Property, Fidelity Bonds, Special Events and Employee Benefits.
Liability Program – The Liability Program, implemented in 1986, provides comprehensive general and automobile liability coverage. PARSAC is self-insured to $1 million and purchases excess coverage through the California State Association of Counties Excess Insurance Authority (CSACEIA). PARSAC also offers members Employment Practices Liability coverage through the Employment Risk Management Authority (ERMA).
Workers’ Compensation Program – The Workers’ Compensation Program, implemented in 1990, provides coverage for employee injuries arising out of and in the course of employment. From 1990 to 2007, PARSAC was self-insured to $250,000. In 2008, PARSAC increased the self-insured retention from $250,000 to $500,000. Losses in excess of PARSAC’s limit are covered through the Local Agency Workers’ Compensation Excess Pool (LAWCX) up to statutory limits.
PARSAC is a California public entity as provided in Internal Revenue Section 115; thus, it is tax-exempt. The California Office of the Controller, Division of Local Governmental Fiscal Affairs, for the purpose of filing an Annual Report of Financial Transactions of Special Districts considers PARSAC to be a “Special District.”
Reporting Entity
The reporting entity includes all activities considered to be part of PARSAC. This includes financial activity relating to all of the membership years of PARSAC. In determining its reporting entity, PARSAC considered all governmental units that were members of PARSAC since inception. The criteria did not require the inclusion of these entities in their financial statements principally because PARSAC does not exercise oversight responsibility over any members.
PARSAC has reviewed the criteria developed by the Governmental Accounting Standards Board, Codification of Governmental Accounting and Financial Reporting Standards, Section 2100, relating to the financial reporting entity to determine whether PARSAC is financially accountable for other entities. PARSAC has determined that no other outside entity meets the above criteria and, therefore, none have been included as a component unit in the financial statements. In addition, PARSAC is not aware of any entity that would be financially accountable for PARSAC that would result in PARSAC being considered a component unit of that entity.
Basis of Accounting
The accompanying financial statements are presented on the accrual basis of accounting in accordance with accounting principles generally accepted in the United States of America. Under the accrual basis, revenues and the related assets are recognized when earned, and expenses are recognized when the obligation is incurred. PARSAC applies all applicable FASB pronouncements in accounting and reporting for its proprietary operations, except where superseded by GASB pronouncements. Liabilities for reserves for open claims and claims incurred but not reported have been recorded in PARSAC’s financial statements.
Notes to Basic Financial Statements

20
PARSAC maintains separate program accounting for each program’s revenues, expenses and related reserves. The program funds are considered a Proprietary/Enterprise Fund type.
Fund Accounting
The accounts of PARSAC are organized on the basis of funds, each of which is considered to be a separate accounting entity. PARSAC’s funds have been combined for the presentation of the basic financial statements. The operations of each fund are accounted for by providing a separate set of self- balancing accounts which comprise its assets, liabilities, net assets, revenues and expenses. The general and administrative expenses of PARSAC are allocated 55% to the Liability Program, 40% to the Workers’ Compensation Program and 5% to the Property Program.
Cash and Cash Equivalents
For purposes of the statement of cash flows, PARSAC considers all highly liquid assets with a maturity of three months or less, when purchased, to be cash and cash equivalents.
Receivables
All receivables are reported at their gross value, and where appropriate, are reduced by the estimated portion that is expected to be uncollectible. As of June 30, 2012, the total accounts receivable portfolio was considered collectible. Interest on investments is recorded in the year the interest is earned.
Investments and Investment Pools
PARSAC records its investment in Local Agency Investment Fund (LAIF) and its other investments at fair value. Changes in fair value are reported as non-operating revenue in the statement of revenues, expenses and changes in net assets.
Fair value of investments and LAIF has been determined by the sponsoring government based on quoted market prices. PARSAC’s investment in LAIF has been valued based on the relative fair value of the entire external pool to the external pool’s respective amortized cost.
Capital Assets
Capital assets are carried at cost. Assets with an original purchase price over $1,000 are capitalized at cost. Depreciation and amortization is computed on the straight-line method. The estimated useful lives used for buildings and improvements is thirty years. The estimated useful life for furniture and equipment range from three to five years. The software is depreciated over five years. When assets are retired or otherwise disposed of, the cost and related accumulated depreciation are removed from the accounts, and any resulting gain or loss is recognized in income for the period. The cost of maintenance and repairs is charged to expense as incurred.
Accrued Vacation
In accordance with PARSAC’s employee policies, compensated absences for vacation are accrued at various numbers of hours per month depending on each employee’s years of service. The liability for compensated absences at June 30, 2012 and 2011 was $86,461 and $87,283, respectively, and is included in accrued expenses on the statement of net assets.
Notes to Basic Financial Statements

Public Agency Risk Sharing Authority of California 21
Provision for Unpaid Claims and Claims Adjustment Expenses
PARSAC’s policy is to establish claims liabilities based on estimates of the ultimate cost of claims that have been reported but not settled, and of claims that have been incurred but not reported. The length of time for which such costs must be estimated varies depending on the coverage involved. Estimated amounts of salvage, subrogation and insurance recoverable on unpaid claims are deducted from the liability for unpaid claims. PARSAC increases the liability for allocated and unallocated claims adjustment expenses. Because actual claims costs depend on such complex factors as inflation, changes in doctrine of legal liability and damage awards, the process used in computing claims liabilities does not necessarily result in an exact amount. Claims liabilities are recomputed periodically using a variety of actuarial and statistical techniques to produce current estimates that reflect recent settlements, claim frequency and other economic and social factors. A provision for inflation in the calculation of estimated future claims costs is implicit in the calculation because reliance is placed both on actual historical data that reflect past inflation and on other factors that are considered to be appropriate modifiers of past experience. Adjustments to claims liabilities are charged or credited to expense in the period in which they are made. The portion of claims considered currently payable has been actuarially determined.
Net Assets
PARSAC adopted a Target Equity policy to ensure adequate overall funding of the pooled programs. The policy designates that equity may be returned to members when (1) the overall confidence level exceeds 90%, (2) an additional amount equal to five times the self-insured retention has been set aside and (3) equity is available to return in eligible years. The three methods approved for returning equity to members are, (1) the Retrospective Premium Adjustment (RPA) process; (2) the Liability Program Rate Stabilization Fund, and (3) an alternate use of equity approach.
The RPA process reconciles program year revenue and expenses. Claims in the Liability Program • become eligible for an RPA in the fifth year; thus, allowing the claims sufficient time for development. Workers’ Compensation Program claims first become eligible for an RPA in the eighth year.
The Liability Program Rate Stabilization Fund was established in 2009/10 from the savings realized • when PARSAC changed excess programs. The policy limits the fund balance to $500,000 and allows these funds to be used to offset pool or excess premium rate increases.
A Rate Stabilization Fund is currently being developed for the Workers’ Compensation Program. • Meanwhile, members are allowed to use a pro-rata share of equity totaling $99,956 to reduce the rate increase.
Excess Insurance
PARSAC enters into agreements whereby it obtains excess coverage from other joint powers authorities or insurance companies. PARSAC does not report excess insured risk as a liability unless it is probable that a risk will not be covered by excess insurers. Settlements have not exceeded insurance coverage in each of the past three years.
Revenue Recognition
Premium contributions are recognized as revenue when earned based upon the coverage period of the related insurance. To the extent that allocated losses exceed premium contributions previously paid, interest and other income, PARSAC can assess its member’s additional contributions. Supplemental assessments are recognized as income in the period assessed. Operating revenues and expenses include all activities necessary to achieve the objectives of PARSAC. Non-operating revenues and expenses include investment activities, rental income and other non-essential activity.

22
Notes to Basic Financial StatementsUse of Estimates
The preparation of financial statements in conformity with accounting principles generally accepted in the United States of America requires management to make estimates and assumptions. These estimates and assumptions affect the reported amounts of assets and liabilities at the date of the financial statements and the reported amounts of revenues and expenses during the reporting period. Actual results could differ from these estimates. Income Taxes
As a governmental agency PARSAC is exempt from both federal income and California state franchise taxes. Reclassifications
Certain reclassifications have been made to the prior year balances to conform with the current year presentation.
2. CASH AND CASH EQUIVALENTS
Cash and cash equivalents as of June 30, 2012 and 2011 consisted of the following:
2012 2011
Cash and Cash Equivalents:
Cash on Hand $ 81 $ 97
Cash in Bank 627,894 1,011,932
LAIF 3,210,431 192,214
Money Market Accounts 51,327 1,043,528
Total Cash and Cash Equivalents $3,889,733 $ 2,247,771
Custodial Credit Risk
Custodial credit risk for deposits is the risk that, in the event of the failure of a depository financial institution, a government will not be able to recover its deposits or will not be able to recover collateral securities that are in the possession of an outside party. The custodial credit risk for investments is the risk that, in the event of the failure of the counterparty (e.g., broker-dealer) to a transaction, a government will not be able to recover the value of its investment or collateral securities that are in the possession of another party. None of PARSAC’s investments were subject to custodial credit risk. Custodial credit risk does not apply to a local government’s indirect investment in securities through the use of mutual funds or government investment pools (such as LAIF). The California Government Code and PARSAC’s investment policy do not contain legal or policy requirements that would limit the exposure to custodial credit risk for deposits or investments, other than the following provision of deposits: The California Government Code requires that a financial institution secure deposits made by state or local governmental units by pledging securities in an undivided collateral pool held by a depository regulated under state law (unless so waived by the governmental unit). The market value of the pledged securities in the collateral pool must equal at least 110% of the total amount deposited by the public agencies. California law also allows financial institutions to secure public entity deposits by pledging first trust deed mortgage notes having a value of 150% of the secured public deposits.
As of June 30, 2012, none of PARSAC’s deposits with financial institutions in excess of federal depository insurance limits were held in uncollateralized accounts.

Public Agency Risk Sharing Authority of California 23
Local Agency Investment Fund
PARSAC places certain funds with the State of California’s Local Agency Investment Fund (LAIF). PARSAC is a voluntary participant in LAIF, which is regulated by California Government Code Section 16429 under the oversight of the Treasurer of the State of California and the Pooled Money Investment Board. The State Treasurer’s Office pools these funds with those of other governmental agencies in the State and invests the cash. The fair value of PARSAC’s investment in this pool is reported in the accompanying financial statements based upon PARSAC’s pro-rata share of the fair value provided by LAIF for the entire LAIF portfolio (in relation to the amortized costs of that portfolio). The monies held in the pooled investment funds are not subject to categorization by risk category. The balance available for withdrawal is based on the accounting records maintained by LAIF, which are recorded on an amortized cost basis.
3. INVESTMENTS
At June 30, 2012 and 2011, investments are reported at fair value and consisted of the following:
2012 2011
Federal Agency Bonds and Notes $17,313,259 $21,257,613
U.S. Treasury Notes 12,996,327 10,781,255
Municipal Obligations 597,180
Total Investments 30,906,766 32,038,868
Investments maturing within one year 9,031,681
Long-term investments $30,906,766 $23,007,187
Disclosures Relating to Interest Risk Rate
Interest rate risk is the risk that changes in market interest rates will adversely affect the fair value of an investment. Generally, the longer the maturity of an investment, the greater the sensitivity of its fair value to changes in market interest rates. One of the ways that PARSAC manages its exposure to interest rate risk is by purchasing a combination of shorter term and longer term investments and by timing cash flows from maturities so that a portion of the portfolio is maturing or coming close to maturity evenly over time as necessary to provide the cash flow and liquidity needed for operations.
Information about the sensitivity of the fair values of PARSAC’s investments to market interest rate fluctuations is provided by the following table that shows the distribution of PARSAC’s investments by maturity:
Remaining Maturity (in Months)
Investment Type Amount12 Months
Or Less13 to 24 Months
25 to 60 Months
Federal Agency Bonds and Notes:
FHLMC $ 6,628,109 $ $ 3,598,718 $ 3,029,391
FNMA 7,224,030 3,327,743 3,896,287
FHLB 3,461,120 3,461,120
U.S. Treasury Notes 12,996,327 12,996,327
Municipal Obligations 597,180 597,180
Total $ 30,906,766 $ $ 10,387,581 $ 20,519,185

24
Disclosures Relating to Credit Risk
Generally, credit risk is the risk that an issuer of an investment will not fulfill its obligation to the holder of the investment. This is measured by the assignment of a rating by a nationally recognized statistical rating organization. Presented below is the actual Standard and Poor’s rating as of year-end for each investment type.
Rating as of Year-End
Investment Type Amount A AA AAA
Federal Agency Bonds and Notes:
FHLMC $ 6,628,109 $ $ 6,628,109 $
FNMA 7,224,030 7,224,030
FHLB 3,461,120 3,461,120
U.S. Treasury Notes 12,996,327 12,996,327
Municipal Obligations 597,180 597,180
Total $ 30,906,766 $ $ 30,309,586 $ 597,180
Concentration of Credit Risk
At June 30, 2012, PARSAC had the following investments that represent more than five percent of PARSAC’s net investments:
U.S. Treasury Notes 42% Federal Home Loan Mortgage Corporation Notes 21% Fannie Mae 23% Federal Home Loan Bank Notes 11%
Notes to Basic Financial Statements

Public Agency Risk Sharing Authority of California 25
4. CAPITAL ASSETS
PARSAC’s capital asset activity for the year ended June 30, 2012 is as follows:
Beginning Balance Additions
Retirements/Adjustments
EndingBalance
Capital Assets Not Being Depreciated
Land $ 515,861 $ $ $ 515,861
Total Capital Assets Not Being Depreciated 515,861 515,861
Capital Assets Being Depreciated
Building 805,562 805,562
Building Improvements 203,585 203,585
Equipment 126,842 1,567 128,409
Vehicles 40,500 40,500
Total Capital Assets Being Depreciated 1,176,489 1,567 1,178,056
Less Accumulated Depreciation For
Building 423,550 50,309 473,859
Building Improvements 183,343 2,269 185,612
Equipment 101,503 8,061 109,564
Vehicles 6,075 8,100 14,175
Total Accumulated Depreciation 714,471 68,739 783,210
Total Capital Assets Being Depreciated Net 462,018 (67,172) 394,846
Total Capital Assets, Net $ 977,879 $ (67,172) $ $ 910,707
Depreciation expense was charged to the various programs as follows:
Liability $ 8,889
Workers’ Compensation 6,464
Building 52,578
Property 808
$ 68,739

26
Notes to Basic Financial StatementsPARSAC’s capital asset activity for the year ended June 30, 2011 was as follows:
Beginning Balance
Additions Retirements/Adjustments
EndingBalance
Capital Assets Not Being Depreciated
Land $ 515,861 $ $ $ 515,861
Total Capital Assets Not Being Depreciated 515,861 515,861
Capital Assets Being Depreciated
Building 805,562 805,562
Building Improvements 183,770 19,815 203,585
Equipment 114,530 25,267 12,955 126,842
Vehicles 32,093 40,500 32,093 40,500
Total Capital Assets Being Depreciated
1,135,955 85,582 45,048
1,176,489
Less Accumulated Depreciation For:
Building 370,772 52,778 423,550
Building Improvements 179,057 4,286 183,343
Equipment 102,620 11,837 12,954 101,503
Vehicles 32,093 6,075 32,093 6,075
Total Accumulated Depreciation
684,542 74,976 45,047
714,471
Total Capital Assets Being Depreciated Net
451,413 10,606 1
462,018
Total Capital Assets, Net $ 967,274 $ 10,606 $ 1 $ 977,879
Depreciation expense was charged to the various programs as follows:
Liability $ 9,852
Workers’ Compensation 7,165
Building 57,064
Property 895
$ 74,976

Public Agency Risk Sharing Authority of California 27
5. OPERATING LEASES
PARSAC purchased an 8,700 square foot building in Sacramento in 1995. Of the 7,200 useable square feet, PARSAC occupies approximately 3,576 square feet and historically leased out the balance. Due to the continued downward trend in the Sacramento commercial leasing market, approximately 3,639 square feet of unoccupied tenant space was converted to a conference facility. The space is available for training and committee meetings. PARSAC will endeavor to lease the space when economic circumstances improve. The tenant space was vacant during the fiscal years 2012 and 2011. For the periods ended June 30, 2012 and 2011, the facility expenses were $103,389 and $99,364, respectively. Beginning with the 2011/2012 year, 50% of the facility expenses have been allocated to the programs in the same proportion as general and administrative expenses.
6. RETROSPECTIVE PREMIUM ADJUSTMENTS
PARSAC’s Joint Powers Agreement requires periodic evaluation of each programs’ equity. The process is referred to as a Retrospective Premium Adjustment (RPA). PARSAC did not pay RPA’s for the year ended June 30, 2012. For the year ended June 30, 2011, the Board approved RPA’s in the Liability Program totaling $656,841.
7. NET ASSETS
PARSAC’s net assets as of June 30, 2012 and 2011 consist of the following:
2012 2011
Invested in Capital Assets $ 910,707 $ 977,879
Unrestricted, Designated for:
Errors and Omission 100,000 100,000
Capital Replacement 128,139 108,276
Rate Stabilization 368,000 430,000
Target Equity 7,200,000 7,500,000
Undesignated Balance 12,023,459 11,782,672
Unrestricted Total 19,819,598 19,920,948
Total Net Assets $ 20,730,305 $ 20,898,827
28
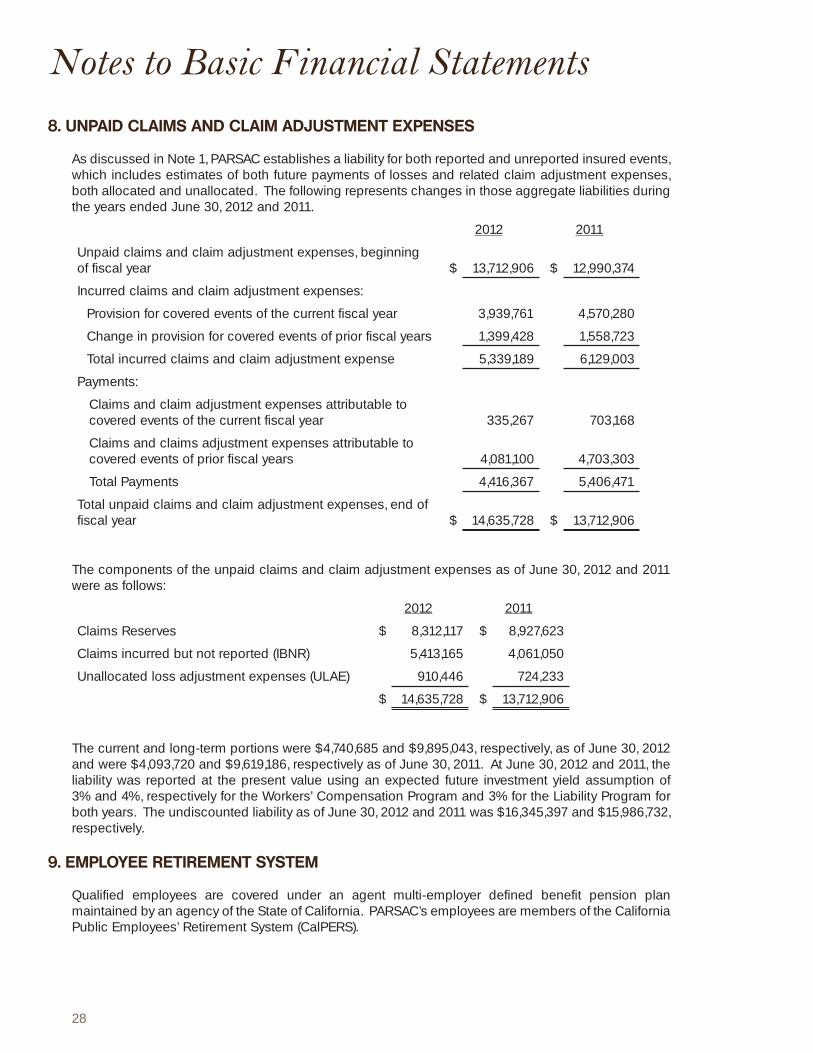
Notes to Basic Financial Statements8. UNPAID CLAIMS AND CLAIM ADJUSTMENT EXPENSES
As discussed in Note 1, PARSAC establishes a liability for both reported and unreported insured events, which includes estimates of both future payments of losses and related claim adjustment expenses, both allocated and unallocated. The following represents changes in those aggregate liabilities during the years ended June 30, 2012 and 2011.
2012 2011
Unpaid claims and claim adjustment expenses, beginning of fiscal year $ 13,712,906 $ 12,990,374
Incurred claims and claim adjustment expenses:
Provision for covered events of the current fiscal year 3,939,761 4,570,280
Change in provision for covered events of prior fiscal years 1,399,428 1,558,723
Total incurred claims and claim adjustment expense 5,339,189 6,129,003
Payments:
Claims and claim adjustment expenses attributable to covered events of the current fiscal year
335,267 703,168
Claims and claims adjustment expenses attributable to covered events of prior fiscal years 4,081,100 4,703,303
Total Payments 4,416,367 5,406,471
Total unpaid claims and claim adjustment expenses, end of fiscal year $ 14,635,728 $ 13,712,906
The components of the unpaid claims and claim adjustment expenses as of June 30, 2012 and 2011 were as follows:
2012 2011
Claims Reserves $ 8,312,117 $ 8,927,623
Claims incurred but not reported (IBNR) 5,413,165 4,061,050
Unallocated loss adjustment expenses (ULAE) 910,446 724,233
$ 14,635,728 $ 13,712,906
The current and long-term portions were $4,740,685 and $9,895,043, respectively, as of June 30, 2012 and were $4,093,720 and $9,619,186, respectively as of June 30, 2011. At June 30, 2012 and 2011, the liability was reported at the present value using an expected future investment yield assumption of 3% and 4%, respectively for the Workers’ Compensation Program and 3% for the Liability Program for both years. The undiscounted liability as of June 30, 2012 and 2011 was $16,345,397 and $15,986,732, respectively.
9. EMPLOYEE RETIREMENT SYSTEM
Qualified employees are covered under an agent multi-employer defined benefit pension plan maintained by an agency of the State of California. PARSAC’s employees are members of the California Public Employees’ Retirement System (CalPERS).

Public Agency Risk Sharing Authority of California 29
Plan Description
PARSAC’s defined benefit pension plan (the “Plan) provides retirement and disability benefits, annual cost-of-living adjustments, and death benefits to Plan members and beneficiaries. The Plan is part of the Public Agency portion of the California Public Employees Retirement System (CalPERS), an agent multiple-employer plan administered by CalPERS, which acts as a common investment and administrative agent for participating public employers within the State of California. A menu of benefit provisions as well as other requirements are established by State statutes within the Public Employees’ Retirement Law. The Plan selects optional benefit provisions from the benefit menu by contract with CalPERS and adopts those benefits through Board approval. CalPERS issues a separate comprehensive annual financial report. Copies of the CalPERS’ annual financial report may be obtained from the CalPERS Executive Office at 400 P Street; Sacramento, California 95814.
Funding Policy
PARSAC contributes 8% of the active plan members’ annual salary, representing the employees’ portion of contribution. PARSAC is required to contribute the actuarially determined remaining amounts necessary to fund the benefits for its members. The actuarial methods and assumptions used are those adopted by the CalPERS Board of Administration. The required employer contribution rate for the year ended June 30, 2012 was 15.521%. The contribution requirements of the plan are established by state statute and may be amended by CalPERS.
Annual Pension Cost
For the year ended June 30, 2012, PARSAC’s annual pension cost was $160,777 and PARSAC contributed $117,171. The required contribution was determined as part of the June 30, 2010 actuarial valuation. A summary of the principle assumptions and methods used to determine the annual required contribution is shown below.
Valuation Date June 30, 2010
Actual Cost Method Entry Age Normal Cost Method
Amortization Method Level Percent of Payroll
Average Remaining Period 19 Years as of the Valuation Date
Asset Valuation Method 15 Year Smoothed Market
Actuarial Assumptions:
Investment Rate of Return 7.75% (net of administrative expenses)
Projected Salary Increases 3.25% to 14.45% depending on Age, Service and Type of Employment
Inflation 3.00%
Payroll Growth 3.25%
Individual Salary Growth A merit scaled varying by duration of employment coupled with an assumed annual inflation growth of 3.00% and an annual production growth of 0.25%
PARSAC’s plan had less than 100 active members as of the June 30, 2010 actuarial valuation. As a result, PARSAC’s members are required to participate in a larger risk pool Miscellaneous 2.5% at 55 Risk Pool.

30
Notes to Basic Financial StatementsThe excess of the total actuarial accrued liability over the actuarial value of plan assets is called the unfunded actuarial accrued liability. Funding requirements are determined by adding the normal cost and an amortization of the unfunded liability as a level percentage of assumed future payrolls. All changes in the liability due to plan amendments, changes in actuarial assumptions, or changes in actuarial methodology are amortized separately over a 20-year period. All gains or losses are tracked and amortized over a rolling 30-year period with the exception of gains and losses in fiscal years 2008-2009, 2009-2010 and 2010-2011 in which each year’s gains or losses will be isolated and amortized over fixed and declining 30 year periods (as opposed to the current rolling 30-year amortization). If a pool’s accrued liability exceeds the actuarial value of assets, the annual contribution with respect to the total unfunded liability may not be less than the amount produced by a 30-year amortization of the unfunded liability.
The CalPERS Miscellaneous 2.5% at 55 Risk Pool Plan has an unfunded liability of $369,428,489 as of June 30, 2010. This liability will be amortized through higher employer pension rates applied over a 30 year period as determined by CalPERS.
Trend Information for CalPERS Miscellaneous2.5% at 55 Pool
Fiscal Year Ending June 30
Annual Pension Cost
(APC)
Percentage of APC
Contributed
Net Pension Obligation
(Asset)
2010 $119,297 79% $(156,817)
2011 $124,975 79% $(130,817)
2012 $160,777 73% $ (87,211)
In 2003, CalPERS established risk pools for small employers and placed PARSAC in a pool. A side fund was created to account for the difference between the funded status of the pool and the funded status of PARSAC’s individual plan. PARSAC’s remaining net pension asset of $87,211 will be amortized over 2 years.
10. OTHER POSTEMPLOYMENT BENEFITS
PARSAC provides post-retirement health care benefits for employees who satisfy the requirements for retirement under CalPERS (attained age 50 with 5 years of service). PARSAC currently pays 100% of the medical premium and 80% of the dependent’s premium for active employees and contributes an increasing percentage for retirees.
PARSAC will eventually be required to provide retiree medical benefits identical to that which it provides for active employees in the same plan at the same coverage levels. Between now and this eventual equal contribution date, the obligation increases annually by 10%. The exact dollar amount payable to any individual retiree will depend on the medical plan and level of coverage he or she selects.
PARSAC’s annual other post-employment benefit (OPEB) cost (expense) is calculated based on the annual required contribution of the employer (ARC), an amount actuarially determined in accordance with the parameters of GASB Cod. Sec. P50.108.109. The ARC represents a level of funding that, if paid on an ongoing basis, is projected to cover normal costs each year and amortize any unfunded actuarial liabilities (or funding excess) over a period not to exceed thirty years.
Public Agency Risk Sharing Authority of California 31
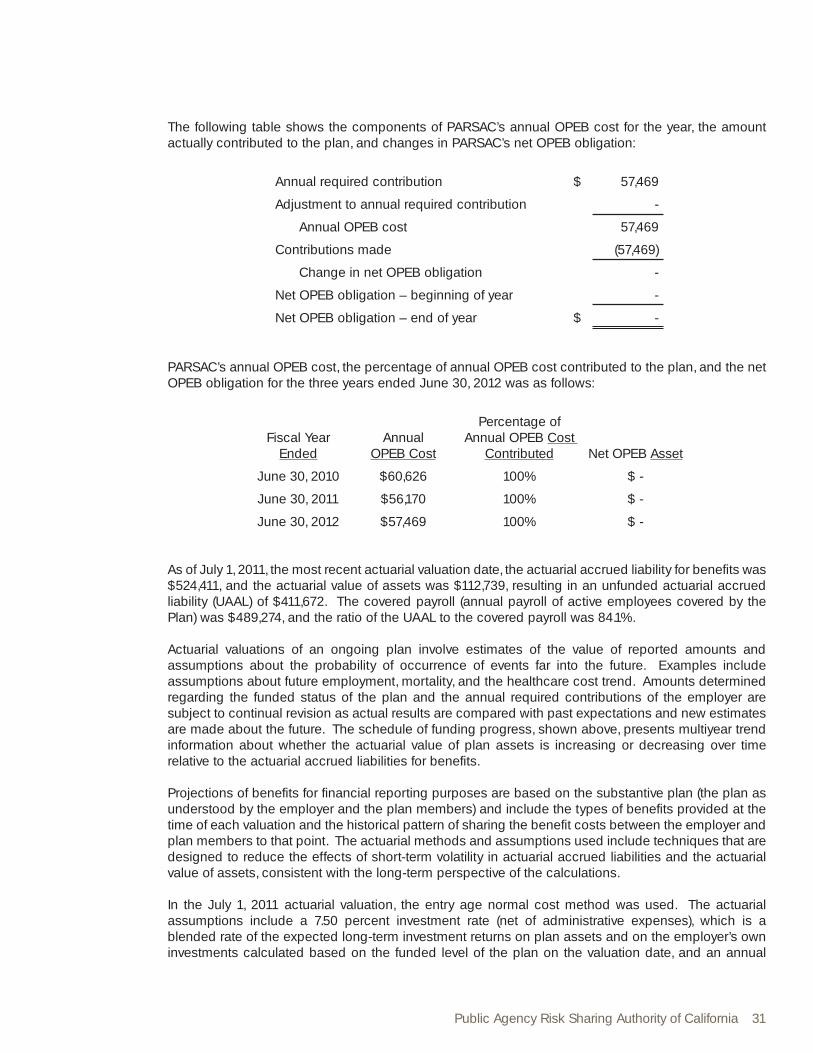
The following table shows the components of PARSAC’s annual OPEB cost for the year, the amount actually contributed to the plan, and changes in PARSAC’s net OPEB obligation:
Annual required contribution $ 57,469
Adjustment to annual required contribution -
Annual OPEB cost 57,469
Contributions made (57,469)
Change in net OPEB obligation -
Net OPEB obligation – beginning of year -
Net OPEB obligation – end of year $ -
PARSAC’s annual OPEB cost, the percentage of annual OPEB cost contributed to the plan, and the net OPEB obligation for the three years ended June 30, 2012 was as follows:
Fiscal Year Ended
AnnualOPEB Cost
Percentage of Annual OPEB Cost
Contributed Net OPEB Asset
June 30, 2010 $60,626 100% $ -
June 30, 2011 $56,170 100% $ -
June 30, 2012 $57,469 100% $ -
As of July 1, 2011, the most recent actuarial valuation date, the actuarial accrued liability for benefits was $524,411, and the actuarial value of assets was $112,739, resulting in an unfunded actuarial accrued liability (UAAL) of $411,672. The covered payroll (annual payroll of active employees covered by the Plan) was $489,274, and the ratio of the UAAL to the covered payroll was 84.1%.
Actuarial valuations of an ongoing plan involve estimates of the value of reported amounts and assumptions about the probability of occurrence of events far into the future. Examples include assumptions about future employment, mortality, and the healthcare cost trend. Amounts determined regarding the funded status of the plan and the annual required contributions of the employer are subject to continual revision as actual results are compared with past expectations and new estimates are made about the future. The schedule of funding progress, shown above, presents multiyear trend information about whether the actuarial value of plan assets is increasing or decreasing over time relative to the actuarial accrued liabilities for benefits.
Projections of benefits for financial reporting purposes are based on the substantive plan (the plan as understood by the employer and the plan members) and include the types of benefits provided at the time of each valuation and the historical pattern of sharing the benefit costs between the employer and plan members to that point. The actuarial methods and assumptions used include techniques that are designed to reduce the effects of short-term volatility in actuarial accrued liabilities and the actuarial value of assets, consistent with the long-term perspective of the calculations.
In the July 1, 2011 actuarial valuation, the entry age normal cost method was used. The actuarial assumptions include a 7.50 percent investment rate (net of administrative expenses), which is a blended rate of the expected long-term investment returns on plan assets and on the employer’s own investments calculated based on the funded level of the plan on the valuation date, and an annual

32
Notes to Basic Financial Statementshealthcare cost trend rate of 9 percent initially, reduced by decrements to an ultimate rate of 4.5 percent after 8 years. Both rates include a 3.25 percent inflation assumption. The actuarial value of assets was determined using techniques that spread the effects of short-term volatility in the market value of investments over a five-year period. The UAAL is being amortized as a level percentage of projected payroll on an open basis. The remaining amortization period at June 30, 2012, was 27 years.
11. JOINT POWERS AGREEMENTS
PARSAC participates in joint ventures under several Joint Powers Agreements (JPA) with Local Agency Workers’ Compensation Excess JPA (LAWCX), Employment Risk Management Authority (ERMA) and California State Association of Counties Excess Insurance Authority (CSAC-EIA). The relationship is such that LAWCX, ERMA and CSAC-EIA are not component units of PARSAC for financial reporting purposes.
ERMA arranges for and provides up to $975,000 employment practices liability coverage in excess of the self-insured retention while CSAC-EIA provides $34 million excess liability insurance coverage (including employment practices) above PARSAC’s $1 million retention. LAWCX provides excess workers’ compensation insurance coverage for losses in excess of $500,000 up to statutory limits.
ERMA, CSAC-EIA and LAWCX are governed by Boards with member agency representation. Their respective Boards control the operations, including selection of management and approval of operating budgets, independent of any influence by the member agencies beyond their representation on the board. Each member agency pays a premium commensurate with the level of coverage requested and shares surpluses and deficits proportionate to their participation. Complete financial statements of ERMA, CSAC-EIA and LAWCX may be obtained from each agency, respectively.
Summary of Excess Joint Powers Agreements
LAWCX CSAC-EIA ERMA
Purpose To self-insure and pool excess workers’ compensation losses
To provide coverage relating to Worker’s Compensation, General Liability, Medical Malpractice, Property and Employee Medical Plans
To provide employment liability coverage to
California public entities
Participants 23 municipalities, 9 joint powers
authorities, and one special district
54 counties and 218 public entities including cities, school districts, special districts and other joint
powers authorities
10 joint powers authorities
Governing Board Consisting of one member from each
participating agency
Consisting of one member from each participating
member county and seven members elected by the
public entity membership.
Consisting of one member from each
participating agency
Payments for the Current Year
$506,055 $738,273 $1,087,755

Public Agency Risk Sharing Authority of California 33
Condensed Financial Information
LAWCXJune 30, 2011*
CSAC-EIAJune 30, 2011*
ERMAJune 30, 2011*
Total Assets $ 62,184,207 $ 563,838,876 $ 23,630,453
Total Liabilities $ 34,242,051 $ 459,524,237 $ 13,726,234
Net Assets 27,942,156 104,314,639 9,904,219
Total Liabilities and Net Assets $ 62,184,207 $ 563,838,876 $ 23,630,453
Revenues $ 9,666,197 $ 465,622,168 $ 7,770,128
Expenses 6,872,538 479,665,134 62,144
Change in Net Assets $ 2,793,659 $ (14,042,966) $ 7,707,984
* Most recent information available.
12. CONTINGENCIES
PARSAC is subject to legal proceedings and claims which arise in the ordinary course of business. In the opinion of management, the amount of ultimate liability with respect to these actions will not materially affect the financial position or results of operations of PARSAC.

34
Required Supplementary Information
PUBLIC EMPLOYEES RETIREMENT SYSTEMSCHEDULE OF FUNDING PROGRESS
Valuation Date
Entry AgeNormal Accrued Liability
Actuarial Value of Assets
Unfunded Actuarial Accrued Liability (UAAL)
Funded Status
Annual Covered Payroll
UAAL as a Percentage of Payroll
2008 $1,537,909,933 $1,337,707,835 $200,202,098 87.0% $333,307,600 60.1%
2009 $1,834,424,640 $1,493,430,831 $340,993,809 81.4% $355,150,151 96.0%
2010 $1,972,910,641 $1,603,482,152 $369,428,489 81.3% $352,637,380 104.8%
OTHER POSTEMPLOYMENT BENEFITS (OPEB)SCHEDULE OF FUNDING PROGRESS
Fiscal Year
Ended
Actuarial Valuation
Date
Actuarial Value of Assets
Actuarial Accrued Liability (AAL)
Unfunded Actuarial Accrued Liability (UAAL)
Funded Ratio
Covered Payroll
UAAL as a Percentage of Covered
Payroll
6/30/2010 1/1/2008 $ 0 $599,286 $599,286 0% $451,220 133%
6/30/2011 1/1/2010 $ 0 $417,412 $417,412 0% $468,985 89%
6/30/2012 1/1/2011 $112,739 $524,411 $411,672 21.5% $489,274 84.1%

Public Agency Risk Sharing Authority of California 35
Supplementary InformationCLAIMS DEVELOPMENT INFORMATION
June 30, 2012
The following tables illustrate how PARSAC’s earned revenue (net of reinsurance) and investment income compare to related costs of loss (net of loss assumed by reinsurers) and other expenses assumed by the Program for its most current ten year period. The claims development information is presented on an undiscounted basis; however, all claims liabilities reported in the basic financial statements are on a discounted basis.
The rows of the tables are defined as follows:
(1) This line shows the total of each fiscal year’s earned deposit premiums and cumulative investment income less ceded (excess insurance cost) to arrive at net earned contribution..
(2) This line shows each fiscal year’s other operating costs of the Program including overhead and loss adjustment expenses not allocable to individual claims.
(3) This line shows the cumulative Retrospective Premium Adjustment attributed to the program year.
(4) This line shows the Program’s gross incurred losses and allocated loss adjustment expense, losses assumed by reinsurers, and net incurred losses and loss adjustment expense (both paid and accrued) as originally reported at the end of the year in which the event that triggered coverage occurred (called program year).
(5) This section of rows shows the cumulative net amounts paid as of the end of successive years for each program year.
(6) This line shows the latest reestimated amount of losses assumed by reinsurers for each program year.
(7) This section of rows shows how each program year’s net amount of losses increased or decreased as of the end of successive years. (This annual reestimation results from new information received on known losses, reevaluation of existing information on known losses, and emergence of new losses not previously known.)
(8) This line compares the latest reestimated net incurred losses amount to the amount originally established (line 3) and shows whether this latest estimate of losses is greater or less than originally thought. As data for individual program years mature, the correlation between original estimates and reestimated amounts is commonly used to evaluate the accuracy of net incurred losses currently recognized in less mature program years. The columns of the table show data for successive program years.

36
20
02
/20
03
20
03
/20
04
20
04
/20
05
20
05
/20
06
20
06
/20
07
20
07
/20
08
20
08
/20
09
20
09
/20
102
010
/20
112
011
/20
12
1R
eq
uir
ed
Co
ntr
ibu
tio
n,
Inte
res
t a
nd
Ce
de
d:
Ea
rne
d C
on
trib
uti
on
$4
,47
8,3
02
$4
,513
,94
7$
4,5
44
,42
6$
5,0
45
,64
6$
5,6
26
,651
$6
,85
7,8
56
$6
,76
5,0
98
$6
,151,
20
9$
5,6
11,3
97
$5
,26
0,5
91
Inve
stm
en
t In
co
me
120
,716
62
8,8
22
29
2,9
80
29
9,1
87
72
7,6
22
514
,83
92
02
,57
814
1,7
28
46
,98
19
,35
7
Ce
de
d(2
,13
6,0
29
)(2
,96
2,2
05
)(2
,16
3,4
96
)(2
,17
8,7
87
)(2
,28
8,2
78
)(2
,63
9,1
07
)(2
,25
2,2
36
)(2
,15
0,7
01
)(2
,07
6,8
35
)(1
,82
6,0
29
)
Ne
t E
arn
ed
$2
,46
2,9
89
$2
,18
0,5
64
$
2,6
73
,910
$
3,1
66
,04
6$
4,0
65
,99
5$
4,7
33
,58
8$
4,7
15,4
40
$
4,1
42
,23
6$
3,5
81,
54
3$
3,4
43
,919
2U
na
llo
ca
ted
Exp
en
se
s$
66
0,9
07
$4
68
,84
0$
810
,18
1$
714
,83
5$
68
9,3
04
$6
63
,18
5$
82
9,6
63
$8
23
,87
2$
951,
412
$9
12,8
30
3C
um
ula
tive
Re
tro
sp
ec
tive
P
rem
ium
Ad
jus
tme
nt
(19
8,0
58
)4
86
,218
(98
0,0
03
)2
72
,45
4
4E
sti
ma
ted
In
cu
rre
d
Cla
ims
an
d E
xp
en
se
En
d o
f Ye
ar
$3
,23
0,0
29
$3
,94
9,2
05
$3
,10
3,4
96
3,2
68
,78
7$
3,5
61,
27
8$
4,4
96
,10
7$
4,0
11,9
27
$3
,819
,70
1$
4,2
06
,90
4$
3,3
22
,69
1
Ce
de
d(2
,13
6,0
29
)(2
,96
2,2
05
)(2
,16
3,4
96
)(2
,17
8,7
87
)(2
,28
8,2
78
)(2
,63
9,1
07
)(2
,25
2,2
36
)(2
,15
0,7
01
)(2
,07
6,8
35
)(1
,82
6,0
29
)
Ne
t In
cu
rre
d$
1,0
94
,00
0$
98
7,0
00
$9
40
,00
0$
1,0
90
,00
0$
1,2
73
,00
0$
1,8
57,
00
0$
1,7
59
,69
1$
1,6
69
,00
0$
2
,13
0,0
69
$ 1
,49
6,6
62
5C
um
ula
tive
Pa
id
En
d o
f P
rog
ram
Ye
ar
$17
,96
5$
70
,09
9$
43
,80
0$
38
,80
6$
15,0
00
$7
5,1
61
$(3
,46
6)
$10
,18
8$
37
6,1
00
$7
6,2
44
On
e Y
ea
r L
ate
r$
70
,80
0$
22
0,0
41
$9
5,2
17$
25
5,5
62
$18
7,3
94
$19
5,3
44
$7
0,0
55
$10
7,2
03
$1,
742
,10
7
Two
Ye
ars
La
ter
$3
71,
89
3$
29
6,6
53
$1,
68
0,6
52
$6
69
,34
3$
36
3,1
05
$1,
53
2,2
85
$3
81,
94
8$
24
3,2
28
Th
ree
Ye
ars
La
ter
$7
01,
27
0$
38
5,0
72
$3
,518
,93
8$
1,2
10,4
27
$3
90
,56
6$
3,3
19,4
28
$74
7,6
38
Fo
ur
Yea
rs L
ate
r$
1,5
84
,69
2$
39
7,8
50
$5
,40
6,8
58
$1,
28
7,9
36
$1,
113
,06
2$
3,5
23
,20
5
Fiv
e Y
ea
rs L
ate
r$
1,5
91,
33
5$
38
8,2
21
$5
,42
2,6
57
$1,
43
6,8
47
$1,
108
,64
3
Six
Ye
ars
La
ter
$1,
63
8,7
26
$3
88
,22
1$
5,4
22
,65
7$
1,5
85
,67
5
Se
ven
Ye
ars
La
ter
$1,
63
8,7
26
$3
88
,22
1$
5,4
22
,65
7
Eig
ht
Yea
rs L
ate
r$
1,6
38
,72
6$
38
8,2
21
Nin
e Y
ea
rs L
ate
r$
1,6
38
,72
6
6R
ee
sti
ma
ted
Ce
de
d
Cla
ims
an
d E
xp
en
se
s$
88
5,4
07
$5
38
,86
3$
3,2
56
,113
$4
52
,52
6$
151,
60
5$
89
7,2
89
$5
86
,13
8$
39
2,8
56
$2
,30
5,0
22
$1,
418
,16
1
7R
ee
sti
ma
ted
Ne
t In
cu
rre
d
Cla
ims
an
d E
xp
en
se
s:
En
d o
f F
isc
al
Yea
r$
1,0
94
,00
0$
98
7,0
00
$9
40
,00
0$
1,0
90
,00
0$
1,2
73
,00
0$
1,8
57,
00
0$
1,7
59
,69
1$
1,8
68
,00
0$
2,1
95
,79
6$
1,4
96
,66
2
On
e Y
ea
r L
ate
r$
919
,00
0$
90
8,0
00
$1,
45
4,0
00
$1,
82
8,6
71
$1,
92
5,0
00
$3
,57
9,5
20
$2
,26
7,0
00
$1,
62
2,4
34
$4
,50
4,4
07
Two
Ye
ars
La
ter
$9
14,0
00
$8
26
,00
0$
2,9
90
,59
1$
1,8
71,
00
0$
1,4
26
,99
7$
3,8
79
,00
0$
2,2
11,3
03
$1,
218
,78
6
Th
ree
Ye
ars
La
ter
$1,
86
9,0
00
$8
02
,74
7$
6,0
83
,00
0$
1,7
52
,671
$1,
02
9,0
00
$3
,83
1,19
2$
1,5
28
,50
3
Fo
ur
Yea
rs L
ate
r$
2,0
23
,62
7$
76
1,0
00
$5
,99
5,9
68
$1,
58
8,0
00
$1,
20
2,7
35
$3
,85
9,5
45
Fiv
e Y
ea
rs L
ate
r$
1,7
69
,00
0$
42
2,2
94
$5
,42
3,0
00
$1,
86
2,0
36
$1,
146
,815
Six
Ye
ars
La
ter
$1,
66
1,9
46
$4
12,8
95
$5
,46
9,4
77
$1,
63
7,14
4
Se
ven
Ye
ars
La
ter
$1,
69
4,0
04
$4
12,1
58
$5
,42
2,6
57
Eig
ht
Yea
rs L
ate
r$
1,6
94
,00
4$
38
8,2
22
Nin
e Y
ea
rs L
ate
r$
1,6
38
,72
6
8
Incre
ase
(D
ecre
ase
) in
E
stim
ate
d I
ncu
rre
d C
laim
s E
xpe
nse
fro
m E
nd
of
Pro
gra
m Y
ea
r
$5
44
,72
6 $
(59
8,7
78)
$4
,48
2,6
57
$5
47,1
44
$(1
26
,18
5)
$2
,00
2,5
45
$(2
31,
188)
$(4
50
,214
)$
2,3
74,3
38
$-
CLAIMS DEVELOPMENT INFORMATIONLiability Program
June 30, 2012

Public Agency Risk Sharing Authority of California 37
CLAIMS DEVELOPMENT INFORMATIONWorkers’ Compensation Program
June 30, 2012
20
02
/20
03
20
03
/20
04
20
04
/20
05
20
05
/20
06
20
06
/20
07
20
07
/20
08
20
08
/20
09
20
09
/20
102
010
/20
112
011
/20
12
1R
eq
uir
ed
Co
ntr
ibu
tio
n,
Inte
res
t a
nd
Ce
de
d:
Ea
rne
d$
2,3
09
,92
5$
3,2
02
,23
7$
3,6
16,5
79
$4
,26
2,7
48
$4
,56
8,6
79
$4
,44
9,4
55
$4
,13
9,0
75
$4
,23
6,9
80
$4
,018
,63
1 $
4,1
46
,87
9
Inve
stm
en
t In
co
me
134
,18
23
09
,39
34
35
,93
34
10,9
44
46
8,3
21
33
9,7
97
169
,38
910
4,6
99
63
,59
4$
6,8
34
Ce
de
d(3
54
,519
)(6
00
,05
0)
(66
5,4
36
)(9
62
,80
8)
(99
2,9
73
)(4
92
,92
8)
(58
5,0
87
)(5
33
,13
3)
(46
6,9
73
)$
(50
4,6
76
)
Ne
t E
arn
ed
$ 2
,08
9,5
88
$
2,9
11,5
80
$
3,3
87,
07
6$
3
,710
,88
4$
4,0
44
,02
7$
4,2
96
,32
4$
3
,72
3,3
77
$3
,80
8,5
46
$
3,6
15,2
52
$ 3
,64
9,0
37
2U
na
llo
ca
ted
Exp
en
se
s$
30
2,9
71
$4
51,
216
$4
26
,33
4$
45
8,3
26
$5
08
,78
2$
63
7,6
00
$6
96
,17
0$
70
1,5
39
$6
97,
02
3$
774
,34
6
3C
um
ula
tive
Re
tro
sp
ec
tive
P
rem
ium
Ad
jus
tme
nt
$-
$-
$-
$-
$-
$-
$-
$-
$-
$-
4E
sti
ma
ted
In
cu
rre
d
Cla
ims
an
d E
xp
en
se
s
En
d o
f Ye
ar
$2
,63
5,2
60
$2
,515
,24
9$
2,6
38
,43
6$
2,6
96
,80
8$
2,8
24
,97
3$
2,9
13,9
28
$3
,10
5,0
87
$3
,04
7,13
3$
3,1
16,9
13$
2,9
47,
77
5
Ce
de
d(3
54
,519
)(6
00
,05
0)
(66
5,4
36
)(9
62
,80
8)
(99
2,9
73
)(4
92
,92
8)
(58
5,0
87
)(5
33
,13
3)
(46
6,9
73
)(5
04
,67
6)
Ne
t In
cu
rre
d$
2,2
80
,74
1$
1,9
15,1
99
$1,
97
3,0
00
$1,
73
4,0
00
$1,
83
2,0
00
$2
,42
1,0
00
$2
,52
0,0
00
$2
,514
,00
0$
2,6
49
,94
0$
2,4
43
,09
95
Cu
mu
lati
ve P
aid
En
d o
f P
rog
ram
Ye
ar
$6
28
,70
6$
29
9,3
41
$13
3,1
46
$12
2,1
34
$2
09
,39
7$
188
,27
6$
317
,371
$2
19,6
56
$3
27,
06
8$
25
9,0
23
On
e Y
ea
r L
ate
r$
1,2
74,6
77
$3
20
,32
7$
319
,55
6$
418
,87
0$
33
5,3
94
$4
18,3
18$
58
3,5
84
$9
33
,68
5$
1,0
21,
42
8
Two
Ye
ars
La
ter
$1,
35
0,9
14$
44
7,3
63
$4
31,
97
0$
60
0,1
44
$4
33
,59
3$
65
6,4
80
$9
90
,616
$1,
70
1,4
52
Th
ree
Ye
ars
La
ter
$1,
55
5,2
59
$5
35
,48
8$
516
,76
4$
66
8,8
37
$4
43
,89
8$
87
2,6
20
$1,
411
,66
6
Fo
ur
Yea
rs L
ate
r$
1,6
28
,85
4$
70
9,1
80
$6
55
,52
3$
76
2,4
89
$4
46
,36
1$
974
,60
2
Fiv
e Y
ea
rs L
ate
r$
1,8
27,
54
9$
96
4,8
43
$6
55
,66
7$
910
,94
2$
44
9,2
31
Six
Ye
ars
La
ter
$2
,12
8,2
20
$1,
00
5,9
86
$6
69
,06
2$
89
9,1
27
Se
ven
Ye
ars
La
ter
$2
,112
,06
9$
1,0
61,
54
1$
67
9,8
77
Eig
ht
Yea
rs L
ate
r$
2,1
36
,211
$1,
151,
78
6
Nin
e Y
ea
rs L
ate
r$
2,1
45
,22
1
6R
ee
sti
ma
ted
Ce
de
d
Cla
ims
an
d E
xp
en
se
s$
1,0
93
,90
3$
1,0
79
,38
4$
84
,24
6$
47
0,2
79
$-
$-
$-
$-
$-
$-
7R
ee
sti
ma
ted
Ne
t In
cu
rre
d
Cla
ims
an
d E
xp
en
se
s:
En
d o
f P
rog
ram
Ye
ar
$2
,28
0,7
41
$1,
915
,19
9$
1,9
73
,00
0$
1,7
34
,00
0$
1,8
32
,00
0$
2,4
21,
00
0$
2,5
20
,00
0$
2,1
57,
00
0$
2,6
49
,94
0$
2,4
43
,09
9
On
e Y
ea
r L
ate
r$
2,8
14,4
80
$1,
64
3,0
00
$1,
57
0,0
00
$1,
78
3,0
00
$1,
69
1,0
00
$1,
94
4,0
00
$1,
83
2,0
00
$3
,00
0,9
18$
2,8
96
,93
8
Two
Ye
ars
La
ter
$2
,45
8,0
00
$1,
37
8,0
00
$1,
24
5,0
00
$1,
42
0,0
00
$1,
111,
00
0$
1,7
35
,00
0$
2,0
58
,82
6$
3,0
54
,65
0
Th
ree
Ye
ars
La
ter
$2
,25
0,0
00
$1,
34
3,0
00
$1,
20
3,0
00
$1,
35
9,0
00
$8
96
,00
0$
1,8
47,
06
6$
2,3
31,
34
6
Fo
ur
Yea
rs L
ate
r$
2,1
22
,00
0$
1,4
72
,00
0$
98
2,0
00
$1,
213
,00
0$
79
5,7
54
$1,
78
5,0
62
Fiv
e Y
ea
rs L
ate
r$
2,1
41,
00
0$
1,4
08
,00
0$
88
4,0
00
$1,
178
,82
5$
618
,218
Six
Ye
ars
La
ter
$2
,371,
00
0$
1,3
72
,00
0$
1,0
49
,911
$1,
163
,88
3
Se
ven
Ye
ars
La
ter
$2
,39
0,0
00
$1,
42
4,1
50
$1,
03
9,8
98
Eig
ht
Yea
rs L
ate
r$
2,3
59
,49
6$
1,5
65
,12
5
Nin
e Y
ea
rs L
ate
r$
2,3
60
,34
0
8
Incre
ase
(D
ecre
ase
) in
E
stim
ate
d I
ncu
rre
d C
laim
s E
xpe
nse
fro
m E
nd
of
Pro
gra
m Y
ea
r$
79
,59
9$
(35
0,0
74)
$(9
33
,10
2)
$(5
70
,117
)$
(1,2
13,7
82
)$
(63
5,9
38
)$
(18
8,6
54
)$
54
0,6
50
$2
46
,99
8$
-

38
RECONCILIATION OF CLAIMS LIABILITIES BY TYPE OF CONTRACTLiability Program
For the Years Ended June 30, 2012 and 2011
2012 2011
Unpaid Claims and Claim Adjustment Expenses, Beginning of the Fiscal Year $ 6,170,621 $ 7,204,696
Incurred Claims and Claim Adjustment Expenses:
Provision for Covered Events of the Current Fiscal Year 1,496,662 2,163,226
Change in Provision for Covered Events of Prior Fiscal Years 869,834 264,110
Total Incurred Claims and Claim Adjustment Expense 2,366,496 2,427,336
Payments:
Claims and Claim Adjustment Expenses Attributable to Covered Events of the Current Fiscal Year 76,244 376,100
Claims and Claim Adjustment Expenses Attributable to Covered Events of Prior Fiscal Years 1,881,986 3,085,311
Total Payments 1,958,230 3,461,411
Total Unpaid Claims and Claim Adjustment Expenses, End of Fiscal Year $ 6,578,887 $ 6,170,621
The components of the unpaid claims and claim adjustment expenses as of June 30, 2012 and 2011 were as follows:
2012 2011
Claims Reserves $ 3,496,644 $ 3,506,722
Claims Incurred But Not Reported (IBNR) 2,670,470 2,263,348
Unallocated Loss Adjustment Expenses (ULAE) 411,773 400,551
$ 6,578,887 $ 6,170,621

Public Agency Risk Sharing Authority of California 39
RECONCILIATION OF CLAIMS LIABILITIES BY TYPE OF CONTRACTWorkers’ Compensation Program
For the Years Ended June 30, 2012 and 2011
2012 2011
Unpaid Claims and Claim Adjustment Expenses, Beginning of Fiscal Year $ 7,542,285 $ 5,785,678
Incurred Claims and Claim Adjustment Expenses:
Provision for Covered Events of the Current Fiscal Year 2,443,099 2,407,054
Change in Provision for Covered Events of Prior Fiscal Years 529,594 1,294,613
Total Incurred Claims and Claim Adjustment Expense 2,972,693 3,701,667
Payments:
Claims and Claim Adjustment Expenses Attributable to Covered Events of the Current Fiscal Year 259,023 327,068
Claims and Claim Adjustment Expenses Attributable to Covered Events of Prior Fiscal Years 2,199,114 1,617,992
Total Payments 2,458,137 1,945,060
Total Unpaid Claims and Claim Adjustment Expenses, End of Fiscal Year $ 8,056,841 $ 7,542,285
The components of the unpaid claims and claim adjustment expenses as of June 30, 2012 and 2011 were as follows:
2012 2011
Claims Reserves $ 4,815,473 $ 5,420,901
Claims Incurred But Not Reported (IBNR) 2,742,695 1,797,702
Unallocated Loss Adjustment Expenses (ULAE) 498,673 323,682
$ 8,056,841 $ 7,542,285

40
LiabilityWorkers’ Comp.
Property/Bond
Building2012Total
ASSETS
Current Assets
Cash and Cash Equivalents $ 486,024 $ 3,047,332 $ 138,586 $ 217,791 $ 3,889,733
Interest Receivable 52,389 64,030 116,419
Member Receivable 306,619 137,900 18,615 463,134
Excess Receivable 54,827 54,827
Due From Other Funds 843,529 562,352 1,405,881
Prepaid Expenses 663,314 79 1,405,891 2,069,284
Net Pension Asset 23,983 17,442 2,180 43,605
Total Current Assets 2,375,858 3,883,962 1,565,272 217,791 8,042,883
Noncurrent Assets:
Net Pension Asset 23,983 17,443 2,180 43,606
Investments 13,908,045 16,998,721 30,906,766
Capital Assets 22,585 22,585 865,537 910,707
Total Noncurrent Assets 13,954,613 17,038,749 2,180 865,537 31,861,079
Total Assets 16,330,471 20,922,711 1,567,452 1,083,328 39,903,962
LIABILITIES
Current Liabilities
Accounts Payable 9,984 26,375 340 1,081 37,780
Accrued Expenses 60,979 44,348 5,543 110,870
Committee Training Stipend Payable
9,134 6,643 830 16,607
Due to Other Funds 1,405,881 1,405,881
Deferred Revenue 1,150,615 1,205,309 119,907 2,475,831
Rate Stabilization Payable 125,000 125,000
Equity Distribution Payable 99,956 99,956
Retrospective Premium Adjustment Payable
111,540 154,464 266,004
Unpaid Claims and Adjustment Expenses
2,792,049 1,948,636 4,740,685
Total Current Liabilities 4,259,301 3,485,731 1,532,501 1,081 9,278,614
Noncurrent Liabilities
Unpaid Claims and Adjustment Expenses
3,786,838 6,108,205 9,895,043
Total Liabilities 8,046,139 9,593,936 1,532,501 1,081 19,173,657
NET ASSETS
Invested in Capital Assets 22,585 22,585 865,537 910,707
Unrestricted 8,261,747 11,306,190 34,951 216,710 19,819,598
Total Net Assets $ 8,284,332 $ 11,328,775 $ 34,951 $ 1,082,247 $ 20,730,305
COMBINING STATEMENT OF NET ASSETS
June 30, 2012

Public Agency Risk Sharing Authority of California 41
LiabilityWorkers’ Comp.
Property/Bond
Building2012Total
Operating RevenuesPremium Contributions $ 5,098,026 $ 3,988,605 $ 1,284,312 $ $ 10,370,943 Other 7,875 3,689 11,564
Total Revenues 5,105,901 3,992,294 1,284,312 10,370,943
Operating Expenses:Claims Paid 1,958,230 2,458,137 4,416,367Change in Claims Liabilities 408,266 514,556 922,822Excess Insurance 1,826,029 504,676 1,222,405 3,553,110Program Administration 228,500 267,157 495,657Risk Management 55,838 37,635 93,473Professional Fees 74,548 66,962 2,740 144,250Salaries 457,544 332,759 41,595 831,898Travel and Meetings 46,002 33,092 4,149 83,243Facility Expense 28,431 20,678 2,585 51,694Other General and Administrative Expenses
50,398 36,741 4,582 91,721
Total Operating Expenses
5,133,786 4,272,393 1,278,056 10,684,235
Operating (Loss) Income (124,454) (280,099) 6,256 (301,728)
Non-Operating Revenues (Expenses)
Investment Income 184,437 225,420 409,857Facility Expense (51,695) (51,695)
Total Non-Operating Revenues (Expenses)
184,437 225,420 (51,695) 358,162
Income (Loss) Before Equity Distribution
156,552 (54,679) 6,256 (51,695) 56,434
Equity Distribution (125,000) (99,956) (224,956)
Change in Net Assets 31,552 (133,957) 6,256 (51,695) (168,522)
Net Assets, Beginning of Year 8,252,780 11,483,410 28,695 1,133,942 20,898,827
Net Assets, End of Year $ 8,284,332 $ 11,328,775 $ 34,951 $ 1,082,247 $ 20,730,305
COMBINING STATEMENT OF REVENUES, EXPENSES AND CHANGES IN NET ASSETS
For The Year Ended June 30, 2012

REPORT ON INTERNAL CONTROL OVER FINANCIAL REPORTING AND ON COMPLIANCE AND OTHER MATTERS BASED ON AN AUDIT OF FINANCIAL STATEMENTS PERFORMED
IN ACCORDANCE WITH GOVERNMENT AUDITING STANDARDS
Board of DirectorsPublic Agency Risk Sharing Authority of CaliforniaSacramento, California
We have audited the financial statements of Public Agency Risk Sharing Authority of California (PARSAC), as of and for the year ended June 30, 2012, and have issued our report thereon dated October 23, 2012. We conducted our audit in accordance with auditing standards generally accepted in the United States of America, and the standards applicable to financial audits contained in Government Auditing Standards, issued by the Comptroller General of the United States.
Internal Control Over Financial Reporting
Management of PARSAC is responsible for establishing and maintaining effective internal control over financial reporting. In planning and performing our audit, we considered PARSAC’s internal control over financial reporting as a basis for designing our auditing procedures for the purpose of expressing our opinion on the financial statements, but not for the purpose of expressing an opinion on the effectiveness of PARSAC’s internal control over financial reporting. Accordingly, we do not express an opinion on the effectiveness of PARSAC’s internal control over financial reporting.
A deficiency in internal control exists when the design or operation of a control does not allow management or employees, in the normal course of performing their assigned functions, to prevent, or detect and correct misstatements on a timely basis. A material weakness is a deficiency, or a combination of deficiencies, in internal control such that there is a reasonable possibility that a material misstatement of the entity’s financial statements will not be prevented, or detected and corrected on a timely basis.
Our consideration of internal control over financial reporting was for the limited purpose described in the first paragraph of this section and was not designed to identify all deficiencies in internal control over financial reporting that might be deficiencies, significant deficiencies, or material weaknesses. We did not identify any deficiencies in internal control over financial reporting that we consider to be material weaknesses, as defined above.
Compliance and other Matters
As part of obtaining reasonable assurance about whether PARSAC’s financial statement are free of material misstatement, we performed tests of its compliance with certain provisions of laws, regulations, contracts and grant agreements, noncompliance with which could have a direct and material effect on the determination of financial statement amounts. However, providing an opinion on compliance with those provisions was not an objective of our audit and accordingly, we do not express such an opinion. The results of our tests disclose no instances of noncompliance that are required to be reported under Government Auditing Standards.
This report is intended for the information and use of PARSAC’s management and Board of Directors and is not intended to be and should not be used by anyone other than these specified parties.
October 23, 2012

Please feel free to contact us for additional information.
Public Agency Risk Sharing Authority of California1525 Response Road, Suite 1Sacramento, California 95815
(800) 400-2642 • www.parsac.org
Public Agency Risk Sharing Authority of California
2012 Annual Report
Accredited with ExcellenceSince 1996


