45
Washington Annual Report on Conservation Acquisition January 1, 2012 – December 31, 2012 Revised June 4, 2013
Washington Annual Report on
Conservation Acquisition
January 1, 2012 – December 31, 2012
Revised June 4, 2013

Page 2 of 45
(This page intentionally left blank)
Pacific Power Washington Report Table of Contents
Page 3 of 45
Table of Contents
List of Abbreviations and Acronyms ............................................................................................................ 5
Executive Summary ...................................................................................................................................... 6
Regulatory Activities .................................................................................................................................... 8
Advisory Group Activities ........................................................................................................................ 8
System Benefits Charge Balancing Account Summary ............................................................................ 9
Planning Process ......................................................................................................................................... 11
Integrated Resource Plan ........................................................................................................................ 11
Energy Efficiency Programs ....................................................................................................................... 14
Residential Programs .................................................................................................................................. 16
Home Energy Savings ............................................................................................................................. 16
Program Management ......................................................................................................................... 18
Program Administration ...................................................................................................................... 18
Infrastructure ....................................................................................................................................... 19
Demographics ..................................................................................................................................... 24
Evaluation ........................................................................................................................................... 25
Home Energy Reports ............................................................................................................................. 25
Program Management ......................................................................................................................... 26
Program Administration ...................................................................................................................... 26
Refrigerator Recycling ............................................................................................................................ 27
Program Management ......................................................................................................................... 28
Program Administration ...................................................................................................................... 28
Infrastructure ....................................................................................................................................... 29
Evaluation ........................................................................................................................................... 29
Low Income Weatherization ................................................................................................................... 29
Program Management ......................................................................................................................... 30
Program Administration ...................................................................................................................... 30
Infrastructure ....................................................................................................................................... 31
Evaluation ........................................................................................................................................... 31
Northwest Energy Efficiency Alliance ................................................................................................... 31
Program Administration ...................................................................................................................... 32
Commercial and Industrial Programs ......................................................................................................... 33
FinAnswer Express ................................................................................................................................. 33
Program Management ......................................................................................................................... 34
Pacific Power Washington Report Table of Contents
Page 4 of 45
Program Administration ...................................................................................................................... 34
Infrastructure ....................................................................................................................................... 35
Evaluation ........................................................................................................................................... 36
Energy FinAnswer .................................................................................................................................. 36
Program Management ......................................................................................................................... 37
Infrastructure ....................................................................................................................................... 38
Evaluation ........................................................................................................................................... 39
Communications, Outreach and Education ................................................................................................. 40
Earned Media .......................................................................................................................................... 40
Customer Communications ..................................................................................................................... 40
Paid Media/wattsmart campaign ............................................................................................................. 40
Program Specific ..................................................................................................................................... 42
Home Energy Savings ......................................................................................................................... 42
Residential Refrigerator Recycling ..................................................................................................... 43
FinAnswer Express and Energy FinAnswer ....................................................................................... 43
Energy Education in Schools .................................................................................................................. 43
Evaluations .................................................................................................................................................. 45

Pacific Power Washington Report Abbreviations and Acronyms
Page 5 of 45
List of Abbreviations and Acronyms
CFLs Compact Fluorescent Lights
DSM Demand-Side Management
Schedule 191 Schedule 191 System Benefits Charge Adjustment
EM&V Evaluation, Measurement & Verification
HVAC Heating, Ventilation and Air Conditioning
IRP Integrated Resource Plan
kWh Kilowatt hour
NAPEE National Action Plan for Energy Efficiency
NEEA Northwest Energy Efficiency Alliance
NTG Net-to-Gross
PCT Participant Cost Test
PTRC PacifiCorp Total Resource Cost test
RCW Revised Code of Washington
RIM Ratepayer Impact Measure Test
SBC System Benefit Charge
SYLR See ya later, refrigerator®
TRC Total Resource Cost test
UCT Utility Cost Test
WAC Washington Administrative Code
Pacific Power Washington Report Executive Summary
Page 6 of 45
Executive Summary
PacifiCorp d/b/a Pacific Power & Light Company, (“Pacific Power” or “Company”) works with
its customers to reduce the need for investment in supply side resources and infrastructure by
reducing energy and peak consumption through cost-effective energy efficiency programs.
The Company currently offers six energy efficiency programs in Washington approved by the
Washington Utilities and Transportation Commission (“Commission”), and receives energy
savings and market transformation benefits through its affiliation with the Northwest Energy
Efficiency Alliance (“NEEA”). The expenditures associated with these programs are recovered
through the System Benefits Charge Adjustment, Schedule 191 (“Schedule 191”).
This report provides details on program results and activities, expenditures, and Schedule 191
revenue for the performance period from January 1, 2012, through December 31, 2012. The
Company, on behalf of its customers invested $10.1m in energy efficiency information, services,
and incentives during the reporting period. The investment yielded approximately 49.8 gigawatt-
hours in first year savings1 and approximately 8 megawatts of capacity reduction
2. Net benefits
over the life of the individual measures are estimated at $21.9m 3
. The cost effectiveness of the
portfolio from various perspectives is provided in Table 1.
Table 1
Long-term Cost Effectiveness for the Portfolio4
B/C Ratio Net Benefits
Total Resource Test plus 10% – total resource cost with the addition of
environmental and non-energy benefits5
2.24 $21,889,314
Total Resource Cost Test – effects on both participants and non-participants6 2.04 $18,404,927
Utility Cost Test – effect on customers7 3.51 $24,926,282
Participant Cost Test – effect on participants8 2.88 $21,256,328
Ratepayer Impact – effect on the cost per kilowatt-hour of sales 0.93 ($2,788,314)
All cost effectiveness calculations will assume a net-to-gross (“NTG”) of 1.0 consistent with the
Council’s methodology. Annual performance information for 2012 is provided in detail in
Appendix 2.
1 Realized savings at generation.
2 See Appendix 1 for explanation on how the capacity contribution savings values are calculated. 3 See Table 1 – Total Resource Cost Test plus 10% Net Benefits.
4 Includes NEEA savings and Non-Energy Benefits. B/C ratios excludes portfolio level expenses i.e. the costs of the
potential study and development of measure data consistent with handling as described in the Company’s EM&V
Framework. 5 The PTRC includes the 10% Northwest Regional Credit allowed in Washington.
6 The TRC compares the total cost of a supply side resource to the total cost of energy efficiency resources,
including costs paid by the customer in excess of the program incentives. The test is used to determine if an energy
efficiency program is cost effective from a total cost perspective. 7 The UCT compares the total cost incurred by the utility to the benefits associated with displacing or deferring
supply side resources. 8 The PCT compares the portion of the resource paid directly by participants to the savings realized by the
participants.
Pacific Power Washington Report Executive Summary
Page 7 of 45
The portfolio was cost effective based on four of the five standard cost effectiveness tests for the
reporting period. The ratepayer impact measure test9 was less than 1.0 indicating near-term
upward pressure was placed on the price per kilowatt-hour given a reduction in sales.
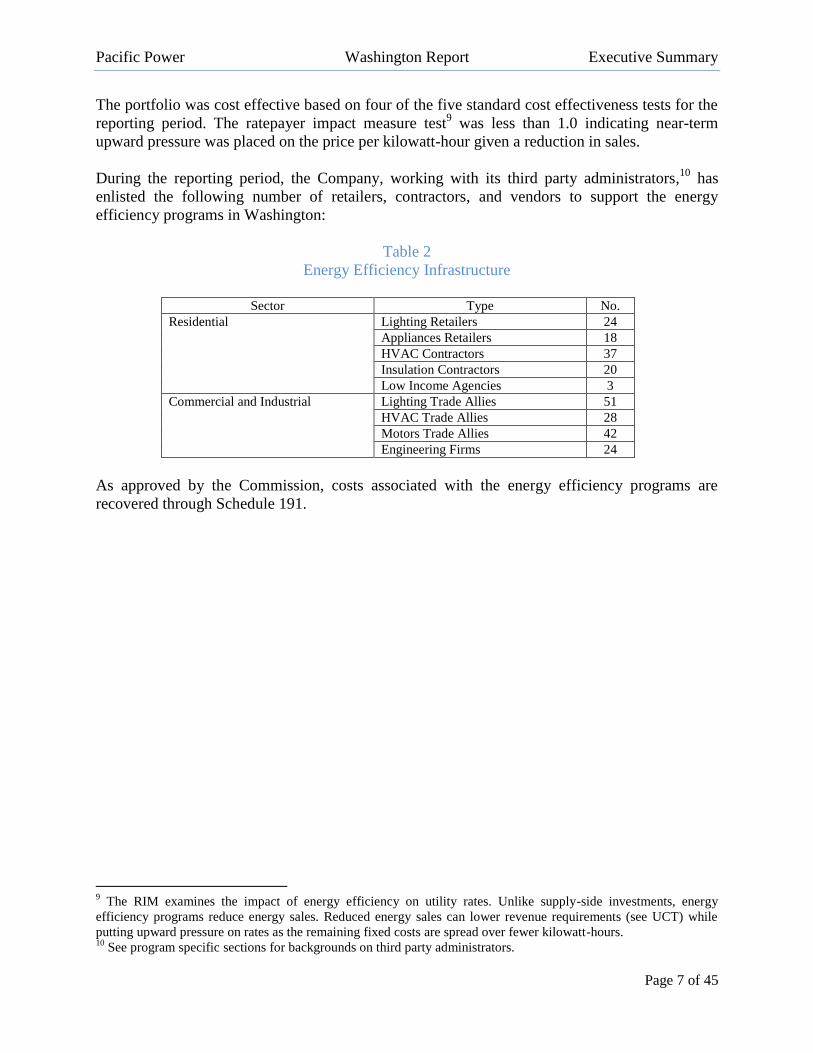
During the reporting period, the Company, working with its third party administrators,10
has
enlisted the following number of retailers, contractors, and vendors to support the energy
efficiency programs in Washington:
Table 2
Energy Efficiency Infrastructure
Sector Type No.
Residential Lighting Retailers 24
Appliances Retailers 18
HVAC Contractors 37
Insulation Contractors 20
Low Income Agencies 3
Commercial and Industrial Lighting Trade Allies 51
HVAC Trade Allies 28
Motors Trade Allies 42
Engineering Firms 24
As approved by the Commission, costs associated with the energy efficiency programs are
recovered through Schedule 191.
9 The RIM examines the impact of energy efficiency on utility rates. Unlike supply-side investments, energy
efficiency programs reduce energy sales. Reduced energy sales can lower revenue requirements (see UCT) while
putting upward pressure on rates as the remaining fixed costs are spread over fewer kilowatt-hours. 10
See program specific sections for backgrounds on third party administrators.

Pacific Power Washington Report Regulatory Activities
Page 8 of 45
Regulatory Activities
During the reporting period the Company requested and received approval of the following:
Initiative 937 compliance plans and reports
The Ten-year Achievable Conservation Potential and Biennial Conservation Target
for 2012 and 2013 filed January 31, 2012
The 2011 Conservation Acquisition Annual Report filed March 30, 2012 pursuant to
Docket UE-100170, Order 2, Paragraph 8(g)
The 2010-2011 Biennial Conservation Report filed on June 1, 2012 pursuant to RCW
19.285.070 and WAC 480-109-040 and consistent with Condition 8(h) UE-100170
Order 02
A revised Demand-Side Management Business Plan filed June 4, 2012 pursuant to
Docket 111880 Order 1, Condition 5
Joint utility proposal on consistent forecasting and reporting of the Northwest Energy
Efficiency Alliance savings pursuant to Docket UE-100170, Order 03, filed October
31, 2012
A second revised Demand-Side Management Business Plan filed November 1, 2012
Modification to FinAnswer Express – Schedule 115, effective February 24, 201211
Modification of Home Energy Savings – Schedule 118, effective April 16, 201212
Cancelation of the Energy Education in Schools – Schedule 113, effective June 30, 2012
Implementation of a Home Energy Report pilot effective July 12, 201213
Modifications to Energy FinAnswer – Schedule 125, filed November 1, 2012, pursuant to
Order 02 of Docket UE-111880
On April 26, 2012, the Commission issued Order 01 in Docket UE-111880 approving the
Company’s 2012-2021 Ten-Year Achievable Conservation Potential and 2012-2013 Biennial
Conservation Target. On September 13, 2012, the Commission issued Order 03 in Docket UE-
100170 acknowledging that the Company had met its 2010-2011 Biennial Conservation Target.
Advisory Group Activities
Consistent with the conditions set forth in Docket UE-111880, Order 01, Paragraph 3(a), Pacific
Power seeks input regarding its energy efficiency programs from the Washington Demand-Side
Management Advisory Group. This group includes representatives from a variety of constituent
organizations. Pacific Power communicated with the DSM Advisory Group throughout 2012 in
the follow matters:
On March 8, 2012:
The Company made a proposal for a Home Energy Report Pilot Program;
Provided an update on the Company’s program evaluations for 2011;
11
Utilizing the program’s flexible tariff and 45 day change noticing provision, no filing was required. 12
Utilizing the program’s flexible tariff and 45 day change noticing provision, no filing was required. 13
Non-tariffed pilot program.
Pacific Power Washington Report Regulatory Activities
Page 9 of 45
Reviewed the Energy Education in Schools program and the decision to cancel the
program; and
Reviewed the savings verification evaluation to be conducted on 2012-13 reported
savings and provided in the June, 2014, 2012-13 biennial report
On April 27, 2012:
The Company held a conference call to discuss the planned adjustment to the Schedule
191 – System Benefits Charge Adjustment.
On May 4, 2012:
The Company made a proposal for a Home Energy Report Pilot Program.
On September 10, 2012:
Reviewed the results of the Low Income Weatherization evaluation.
Provided an update on the Boise White Paper, LLC discussion.
A review of the Company’s EM&V framework; and
A review of the new School Education Outreach program.
On November 6, 2012:
An update on Distribution Efficiency study.
An update on Home Energy Reporting.
A discussion on Low Income evaluation recommendations on high usage households.
Status on November Business Plan update.
Review of Energy FinAnswer program change for Energy Project Manager co-funding;
and
An overview update on the EM&V Framework and Technical Reference Database.
System Benefits Charge Balancing Account Summary
Demand-side management activities are funded through Schedule 191, the System Benefits
Charge Adjustment. Expenditures are charged as incurred and collected from the Systems
Benefit Charge. The balancing account is the mechanism used for managing the revenue
collected and expenses incurred in the provision of DSM programs. On May 15, 2012, the
Company requested an increase to Schedule 191 to align the Company’s recovery of its costs
associated with acquiring and administering cost effective conservation in its Washington service
territory. The Commission approved the Company’s request effective July 13, 2012. The
balancing account activity for 2012 is included in this report consistent with Ordering Paragraph
8(g), Order 02, Docket UE-111880, and is outlined in Table 3 on the following page.

Pacific Power Washington Report Regulatory Activities
Page 10 of 45
Table 3
System Benefit Charge Balancing Account Summary
Column Explanations:
Deferred Expenditures: Monthly expenditures for all program activities posted in 2012, including
funding for the Northwest Energy Efficiency Alliance.
Revenue Collected: Revenue collected through Schedule 191, System Benefits Charge Adjustment.
Carrying Charge: Monthly charge based on “Accumulative Balance” of the account, accrued when
cumulative revenue exceeds cumulative expenditures. On July 29, 2010 in Docket UE-001457, the
Commission ordered that the one-way carrying charge on negative balances (balances owing to
customers) be eliminated going forward.
Accumulative Balance: A running total of account activities. If more is collected in “Revenue” than
is spent for a given month, the “Accumulated Balance” will be increased by the net amount. A
negative accumulative balance means cumulative revenue exceeds cumulative expenditures; positive
accumulative balance means cumulative expenditures exceed cumulative revenue.
Accrued Costs: Program costs incurred during the period not yet posted in system.
Accrual Basis Accumulative Balance: Current balance of account including accrued costs.
During calendar year 2012, the under-collected balance in the System Benefits Charge balancing
account increased by $68,347, and with accrued costs, the account increased by approximately
$161,363. Therefore, the Company spent approximately $68,347, and with accrued costs,
$161,363 more than what was collected for program delivery during the year.
State of Washington
SBC Summary -- Balancing Account Balance 12/31/11
765,949 530,996 1,296,944.38
Deferred
Expenditures
Schedule 191
Revenue
Collected
Carrying
Charge
Accumulative
Balance
Accrued
Costs
Accrual Basis
Accumulatiive
Balance
Jan-12 269,147 (921,780) 0.00 113,316 201,803.21 846,114.92
Feb-12 966,516 (804,573) 0.00 275,259 (210,794.01) 797,263.97
Mar-12 1,193,463 (722,893) 0.00 745,829 80,080.96 1,347,914.79
Apr-12 535,597 (652,708) 0.00 628,718 114,267.53 1,345,071.63
May-12 747,334 (592,718) 0.00 783,334 55,877.89 1,555,565.21
Jun-12 887,017 (634,001) 0.00 1,036,350 106,170.48 1,914,752.14
Jul-12 540,616 (719,434) 0.00 857,532 109,323.27 1,845,257.36
Aug-12 857,295 (1,013,611) 0.00 701,216 (39,809.63) 1,649,131.67
Sep-12 676,952 (950,412) 0.00 427,756 (94,132.25) 1,281,539.20
Oct-12 1,251,104 (897,683) 0.00 781,177 (381,622.28) 1,253,337.90
Nov-12 581,199 (928,125) 0.00 434,251 45,363.17 951,774.69
Dec-12 1,480,119 (1,080,074) 0.00 834,296 106,487.26 1,458,307.31
Total 2012 9,986,359 (9,918,012)

Pacific Power Washington Report Planning Process
Page 11 of 45
Planning Process
Integrated Resource Plan
The Company develops a biennial integrated resource plan (“IRP”) as a means of balancing cost,
risk, uncertainty, supply reliability/deliverability, and long-run public policy goals. The plan
presents a framework of future actions to ensure the Company continues to provide reliable,
reasonable-cost service with manageable risks to the Company’s customers. Energy efficiency
and peak management opportunities are incorporated into the plan based on their availability,
characteristics, and costs.
Energy efficiency and peak management resources can be divided into four general classes based
on their relative characteristics, the classes are:
Class 1 DSM (Resources from fully dispatchable or scheduled firm capacity product
offerings/programs) – Capacity savings occur as a result of active Company control or
advanced scheduling. Once customers agree to participate, the timing and persistence of
the load reduction is involuntary on their part within the agreed limits and parameters.
Class 2 DSM (Resources from non-dispatchable, firm energy and capacity product
offerings/programs) – Sustainable energy and related capacity savings are achieved
through facilitation of technological advancements in equipment, appliances, lighting and
structures or sustainable verifiable changes in operating and maintenance practices, also
commonly referred to as energy efficiency resources.
Class 3 DSM (Resources from price responsive energy and capacity product
offerings/programs) – Short-duration energy and capacity savings from actions taken by
customers voluntarily based on pricing incentives or signal.
Class 4 DSM (Resources from energy efficiency education and non-incentive based
voluntary curtailment programs/communications pleas) – Energy and/or capacity
reduction typically achieved from voluntary actions taken by customers, to reduce costs
or benefit the environment through education, communication and/or public pleas.
As technical support for the IRP, a third party analysis is conducted to estimate the magnitude,
timing and cost of alternative energy efficiency and peak management options.14
The main focus
of the study has been on resources with sufficient reliability characteristics that are anticipated to
be technically feasible and assumed achievable during the IRP’s 20-year planning horizon. The
estimated achievable energy efficiency potential identified in the 2011 study for Washington was
122 average megawatts or 22 percent of forecasted retail sales in 2030.15
By definition this was
the energy efficiency potential that may be achievable during the 20-year planning horizon if
determined least cost and cost-effective compared to supply-side alternatives within the
Company’s integrated resource planning process.
14
www.pacificorp.com/content/dam/pacificorp/doc/Energy_Sources/Demand_Side_Management/DSM_VolumeI_2
011_Study.pdf
15
Ibid.

Pacific Power Washington Report Planning Process
Page 12 of 45
The achievable technical potential for Washington by sector is shown in Table 4. The 2011
potential study indicates that 11 percent of the achievable technical potential for the Company,
excluding Oregon16
, is in Washington.17
Table 4
Washington Energy Efficiency Achievable Technical Potential by Sector
Sector
Average Megawatts in
2030 Percent of Retail Sales
Residential 68 28%
Commercial 35 18%
Industrial 17 15%
Irrigation 2 10%
Street Lights 0.5 36%
Energy efficiency resources vary in their reliability, load reduction, and persistence over time.
Based on the significant number of measures identified in the potential study it is difficult to
incorporate each measure as a stand-alone resource in the IRP. To address this issue, energy
efficiency measures are bundled by their weighted-average load shape, lives, and costs to reduce
the number of combinations to a more manageable number.
The evaluation of energy efficiency resources within the IRP is also informed by state specific
evaluation criteria. While all states generally use commonly accepted cost effectiveness tests18
,
some states require variations in calculating or prioritizing the tests.
Washington and Oregon utilize the total resource cost test adjusted for environmental and
non-energy benefits (10 percent additional benefits) as the primary determination of cost
effectiveness.
Utah utilizes the utility cost test as the primary determination of cost effectiveness.
The Company evaluates program implementation cost effectiveness (both prospectively and
retrospectively) under a variation of five tests to identify the relative impact and/or value to
customers and the Company (i.e. near-term rate impact, program value to participants, etc.).
Both the 2008 and 2011 Integrated Resource Plan preferred portfolios included the acquisition of
energy efficiency resources. The action plan targets for the 2008 and 2011 Integrated Resource
Plan updates19
are shown in Table 5.
16
Demand-side management potential studies for Oregon are performed by the Energy Trust of Oregon 17
Page 49 of the Assessment of Long-term, System-Wide Potential for Demand-Side and Other Supplemental
Resources 18
The footnotes on page 6 provide explanations of cost effectiveness tests. 19
2008 IRP update, March, 2010, and 2011 IRP LC 52 Revised IRP Action Plan, January, 2012.

Pacific Power Washington Report Planning Process
Page 13 of 45
Table 5
Preferred Portfolio Energy Efficiency Targets
2008 Preferred Portfolio Acquire 468-525 average megawatts of energy efficiency by 2018
2011 Preferred Portfolio Acquire a minimum of 517 average megawatts of energy efficiency
resource savings by 2020

Pacific Power Washington Report Energy Efficiency Programs
Page 14 of 45
Energy Efficiency Programs
Energy efficiency programs are offered to all major customer sectors: residential, commercial,
industrial and agricultural. The overall energy efficiency portfolio includes six programs: Home
Energy Savings, Schedule 118; Home Energy Reports; Residential Refrigerator Recycling,
Schedule 107; Low Income Weatherization, Schedule 114; Energy FinAnswer, Schedule 125;
and FinAnswer Express, Schedule 115. In addition to the energy efficiency programs, the
Company, on behalf of customers, invests in outreach and education regarding the efficient use
of electricity. Results for 2012 are provided in Table 6.
Table 6
Washington Results January 1, 2012 – December 31, 2012
Program
kWh/Yr
Savings
(at site)
kWh/Yr
Savings
(at generator)
aMW
Savings
(at gen)
Systems Benefits
Charge
Expenditures
Low Income Weatherization (114) 206,080 226,008 0.03 606,108$
Refrigerator Recycling (107) 1,075,254 1,179,231 0.13 247,055$
Home Energy Savings (118) 6,051,410 6,636,581 0.76 1,135,181$
Home Energy Reporting 1,778,482 1,950,461 0.22 100,257$
Northwest Energy Efficiency Alliance 12,439,200 13,610,780 1.55 1,218,412$
Total Residential 21,550,425 23,603,061 2.69 3,307,012$
Energy FinAnswer (125) 2,190,303 2,399,061 0.27 473,104$
FinAnswer Express (115) 9,982,986 10,934,464 1.25 2,092,466$
Total Commercial 12,173,289 13,333,525 1.52 2,565,569$
Energy FinAnswer (125) 9,890,551 10,697,719 1.22 1,900,245$
FinAnswer Express (115) 1,886,703 2,040,677 0.23 550,878$
Total Industrial 11,777,254 12,738,396 1.45 2,451,122$
FinAnswer Express (115) 97,532 106,963 0.01 7,734$
Total Agricultural 97,532 106,963 0.01
Total 45,598,500 49,781,945 5.68 8,331,438$
Additional residential expenditures for administration related to prior programs
Company Initiatives - Distribution Efficiency 146,618$
Company Initiatives - Production Efficiency 231,495$
School Energy Education 252,946$
New Programs (3,421)$
Res. Admin of Prior Programs 1,586$
Outreach and Communication 209,022$
Portfolio Level Expenditures (evaluation, potential study & technical reference library) 885,332$
Total System Benefits Charge expenditures 10,055,015$
The cost effectiveness of the overall portfolio was provided in Table 1.
Pacific Power Washington Report Energy Efficiency Programs
Page 15 of 45
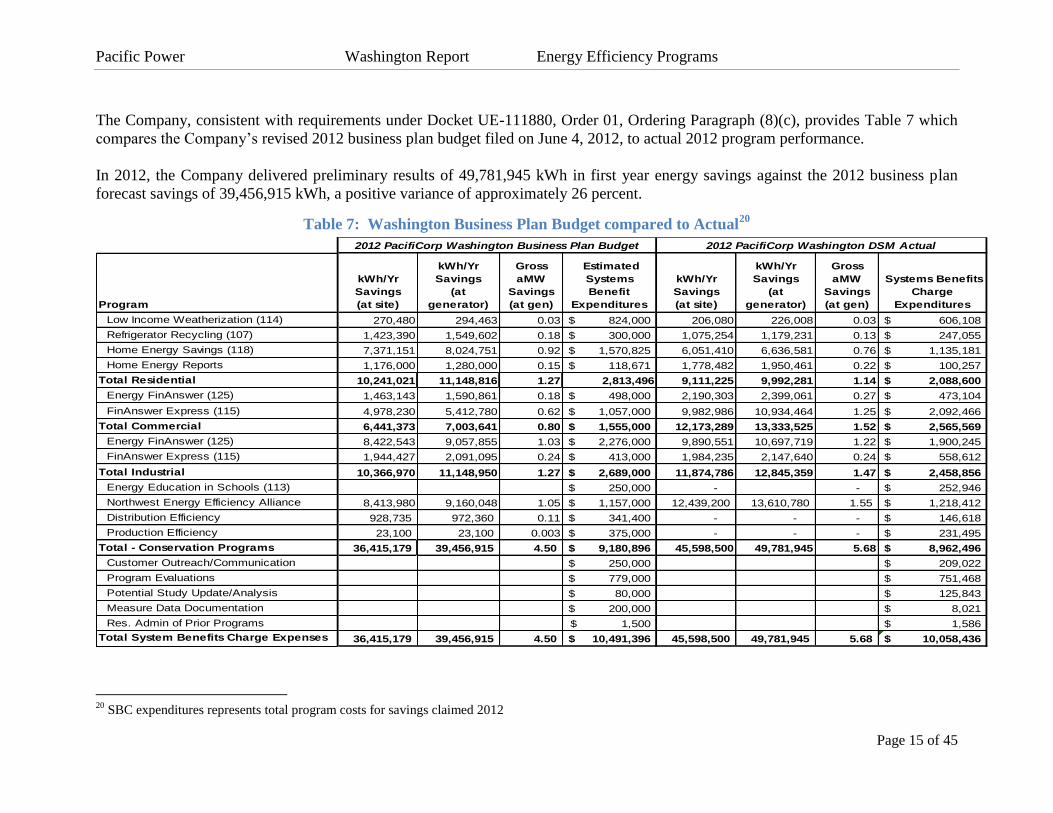
The Company, consistent with requirements under Docket UE-111880, Order 01, Ordering Paragraph (8)(c), provides Table 7 which
compares the Company’s revised 2012 business plan budget filed on June 4, 2012, to actual 2012 program performance.
In 2012, the Company delivered preliminary results of 49,781,945 kWh in first year energy savings against the 2012 business plan
forecast savings of 39,456,915 kWh, a positive variance of approximately 26 percent.
Table 7: Washington Business Plan Budget compared to Actual20
Program
kWh/Yr
Savings
(at site)
kWh/Yr
Savings
(at
generator)
Gross
aMW
Savings
(at gen)
Estimated
Systems
Benefit
Expenditures
kWh/Yr
Savings
(at site)
kWh/Yr
Savings
(at
generator)
Gross
aMW
Savings
(at gen)
Systems Benefits
Charge
Expenditures
Low Income Weatherization (114) 270,480 294,463 0.03 824,000$ 206,080 226,008 0.03 606,108$
Refrigerator Recycling (107) 1,423,390 1,549,602 0.18 300,000$ 1,075,254 1,179,231 0.13 247,055$
Home Energy Savings (118) 7,371,151 8,024,751 0.92 1,570,825$ 6,051,410 6,636,581 0.76 1,135,181$
Home Energy Reports 1,176,000 1,280,000 0.15 118,671$ 1,778,482 1,950,461 0.22 100,257$
Total Residential 10,241,021 11,148,816 1.27 2,813,496 9,111,225 9,992,281 1.14 2,088,600$
Energy FinAnswer (125) 1,463,143 1,590,861 0.18 498,000$ 2,190,303 2,399,061 0.27 473,104$
FinAnswer Express (115) 4,978,230 5,412,780 0.62 1,057,000$ 9,982,986 10,934,464 1.25 2,092,466$
Total Commercial 6,441,373 7,003,641 0.80 1,555,000$ 12,173,289 13,333,525 1.52 2,565,569$
Energy FinAnswer (125) 8,422,543 9,057,855 1.03 2,276,000$ 9,890,551 10,697,719 1.22 1,900,245$
FinAnswer Express (115) 1,944,427 2,091,095 0.24 413,000$ 1,984,235 2,147,640 0.24 558,612$
Total Industrial 10,366,970 11,148,950 1.27 2,689,000$ 11,874,786 12,845,359 1.47 2,458,856$
Energy Education in Schools (113) 250,000$ - - 252,946$
Northwest Energy Efficiency Alliance 8,413,980 9,160,048 1.05 1,157,000$ 12,439,200 13,610,780 1.55 1,218,412$
Distribution Efficiency 928,735 972,360 0.11 341,400$ - - - 146,618$
Production Efficiency 23,100 23,100 0.003 375,000$ - - - 231,495$
Total - Conservation Programs 36,415,179 39,456,915 4.50 9,180,896$ 45,598,500 49,781,945 5.68 8,962,496$
Customer Outreach/Communication 250,000$ 209,022$
Program Evaluations 779,000$ 751,468$
Potential Study Update/Analysis 80,000$ 125,843$
Measure Data Documentation 200,000$ 8,021$
Res. Admin of Prior Programs 1,500$ 1,586$
Total System Benefits Charge Expenses 36,415,179 39,456,915 4.50 10,491,396$ 45,598,500 49,781,945 5.68 10,058,436$
2012 PacifiCorp Washington Business Plan Budget 2012 PacifiCorp Washington DSM Actual
20
SBC expenditures represents total program costs for savings claimed 2012

Pacific Power Washington Report Residential Programs
Page 16 of 45
Residential Programs
The residential energy efficiency portfolio is comprised of four programs; Home Energy Savings,
Home Energy Reports, Residential Refrigerator Recycling, Low Income Weatherization, and
NEEA. As shown in Table 8, the residential portfolio was cost effective based on four of the five
standard cost effectiveness tests for the reporting period. The ratepayer impact test was less than
1.0 indicating that there is near term upward pressure placed on the price per kilowatt-hour given
a reduction in sales.
Table 8
Long-term Cost Effectiveness for Residential Portfolio21
B/C Ratio Net Benefits
Total Resource Test plus 10% – total resource cost with the addition of
environmental and non-energy benefits 3.34 $10,487,460
Total Resource Cost Test – effects on both participants and non-participants 3.06 $9,243,446
Utility Cost Test – effect on customers 3.76 $9,136,684
Participant Cost Test – effect on participants 7.01 $10,999,034
Rate Payer Impact – effect on the cost per kilowatt-hour of sales 0.88 $(1,692,500)
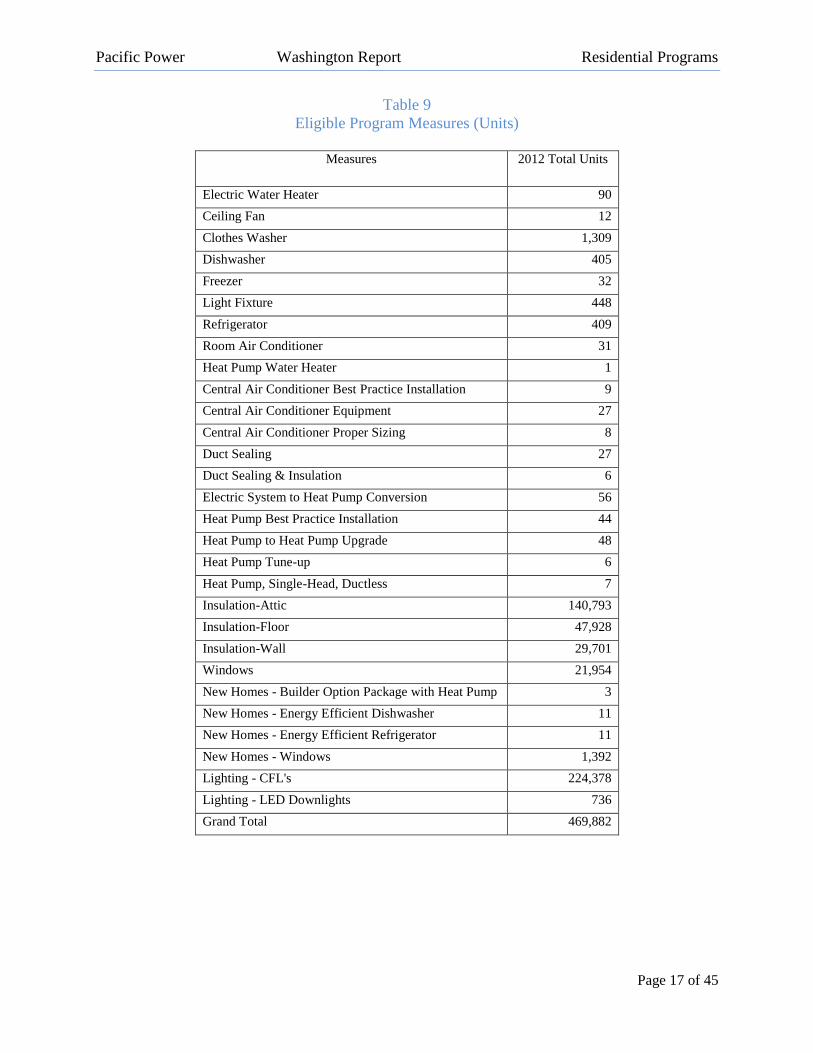
Home Energy Savings
The Home Energy Savings program is designed to provide access to and incentives for more
efficient products and services installed or received by customers in new or existing homes,
multi-family housing units or manufactured homes. Program participation by measure is
provided in Table 9.
21
Includes NEEA savings and Non-Energy Benefits
Pacific Power Washington Report Residential Programs
Page 17 of 45
Table 9
Eligible Program Measures (Units)
Measures 2012 Total Units
Electric Water Heater 90
Ceiling Fan 12
Clothes Washer 1,309
Dishwasher 405
Freezer 32
Light Fixture 448
Refrigerator 409
Room Air Conditioner 31
Heat Pump Water Heater 1
Central Air Conditioner Best Practice Installation 9
Central Air Conditioner Equipment 27
Central Air Conditioner Proper Sizing 8
Duct Sealing 27
Duct Sealing & Insulation 6
Electric System to Heat Pump Conversion 56
Heat Pump Best Practice Installation 44
Heat Pump to Heat Pump Upgrade 48
Heat Pump Tune-up 6
Heat Pump, Single-Head, Ductless 7
Insulation-Attic 140,793
Insulation-Floor 47,928
Insulation-Wall 29,701
Windows 21,954
New Homes - Builder Option Package with Heat Pump 3
New Homes - Energy Efficient Dishwasher 11
New Homes - Energy Efficient Refrigerator 11
New Homes - Windows 1,392
Lighting - CFL's 224,378
Lighting - LED Downlights 736
Grand Total 469,882
Pacific Power Washington Report Residential Programs
Page 18 of 45
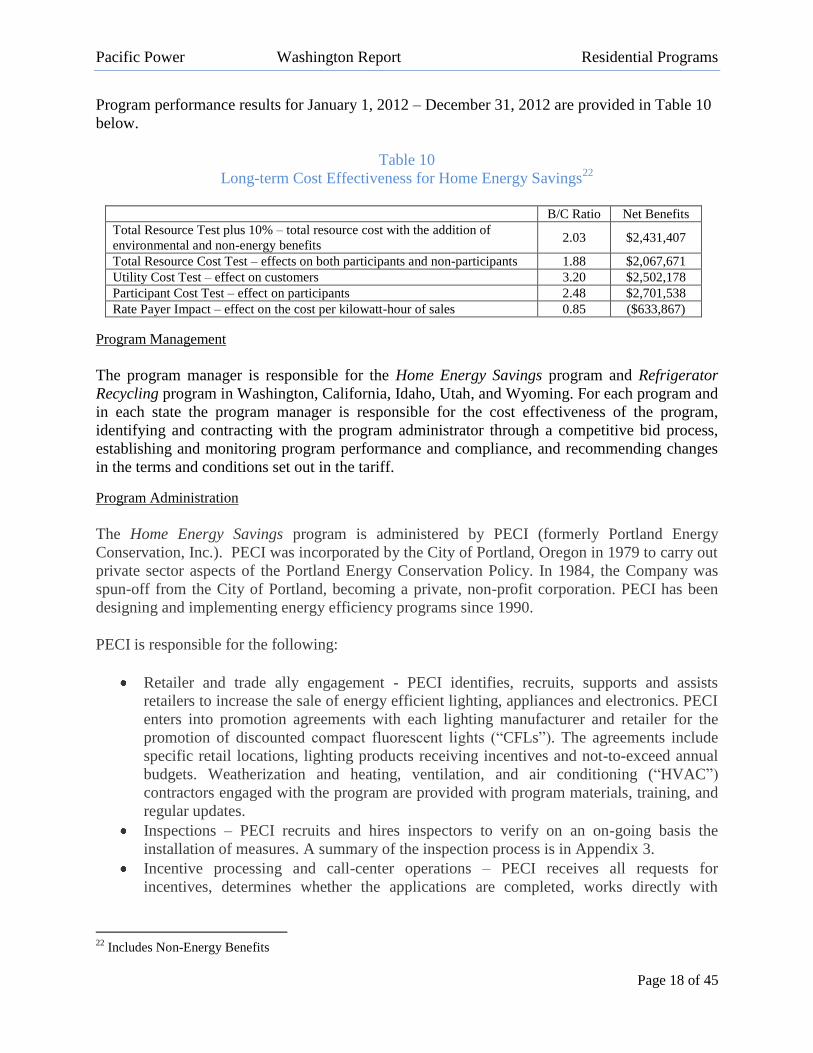
Program performance results for January 1, 2012 – December 31, 2012 are provided in Table 10
below.
Table 10
Long-term Cost Effectiveness for Home Energy Savings22
B/C Ratio Net Benefits
Total Resource Test plus 10% – total resource cost with the addition of
environmental and non-energy benefits 2.03 $2,431,407
Total Resource Cost Test – effects on both participants and non-participants 1.88 $2,067,671
Utility Cost Test – effect on customers 3.20 $2,502,178
Participant Cost Test – effect on participants 2.48 $2,701,538
Rate Payer Impact – effect on the cost per kilowatt-hour of sales 0.85 ($633,867)
Program Management
The program manager is responsible for the Home Energy Savings program and Refrigerator
Recycling program in Washington, California, Idaho, Utah, and Wyoming. For each program and
in each state the program manager is responsible for the cost effectiveness of the program,
identifying and contracting with the program administrator through a competitive bid process,
establishing and monitoring program performance and compliance, and recommending changes
in the terms and conditions set out in the tariff.
Program Administration
The Home Energy Savings program is administered by PECI (formerly Portland Energy
Conservation, Inc.). PECI was incorporated by the City of Portland, Oregon in 1979 to carry out
private sector aspects of the Portland Energy Conservation Policy. In 1984, the Company was
spun-off from the City of Portland, becoming a private, non-profit corporation. PECI has been
designing and implementing energy efficiency programs since 1990.
PECI is responsible for the following:
Retailer and trade ally engagement - PECI identifies, recruits, supports and assists
retailers to increase the sale of energy efficient lighting, appliances and electronics. PECI
enters into promotion agreements with each lighting manufacturer and retailer for the
promotion of discounted compact fluorescent lights (“CFLs”). The agreements include
specific retail locations, lighting products receiving incentives and not-to-exceed annual
budgets. Weatherization and heating, ventilation, and air conditioning (“HVAC”)
contractors engaged with the program are provided with program materials, training, and
regular updates.
Inspections – PECI recruits and hires inspectors to verify on an on-going basis the
installation of measures. A summary of the inspection process is in Appendix 3.
Incentive processing and call-center operations – PECI receives all requests for
incentives, determines whether the applications are completed, works directly with
22
Includes Non-Energy Benefits

Pacific Power Washington Report Residential Programs
Page 19 of 45
customers when information is incorrect and/or missing from the application and
processes the application for payment.
Program specific customer communication and outreach – A summary of the
communication and outreach conducted by PECI on behalf of the Company is outlined in
the Communication, Outreach, and Education section.
Infrastructure
Through the program the Company has increased the number of retailers carrying CFLs to over
20. Table 11 lists the lighting retailers participating in the program.
Table 1123
Retail Stores – Compact Fluorescent Lights
Retailer City Retailer City
Ace Hardware #14965 Walla Walla Platt Electric Supply #28 Walla Walla
Big Lots #4558 Yakima Platt Electric Supply #37 Yakima
Corner Grocery & Hardware Yakima Roy's Ace Hardware #10640 Yakima
Costco #1013 Union Gap Stein's Ace Hardware #7047 Yakima
Habitat for Humanity ReStore #2 Yakima True Value Hardware - C&H Yakima
Haggen #35 TOP Foods Yakima
True Value Hardware - Country
Farm and Garden Yakima
Home Depot #4727 Yakima True Value Hardware - Helms Selah
Home Depot #4735 College Place Walgreens #12053 Yakima
Hometown Ace Hardware #11909 Yakima Walgreens #12275 Yakima
Lowe's #160 Union Gap Walgreens #9911 Yakima
Oak Creek Ace Hardware #14426 Naches Wal-Mart - Supercenter #5078 Yakima
Platt Electric Supply #24 Grandview Wal-Mart #2269 Yakima
23 To be considered for participation for discounted CFLs, sales coming from Pacific Power customers must be a
significant majority of total sales.

Pacific Power Washington Report Residential Programs
Page 20 of 45
Over a dozen local and national retailers now consistently promote high efficiency appliances on
behalf of the program. Table 12 lists the appliance retailers participating in the program.
Table 12
Retail Stores – Appliances
Retailer City
Cei
lin
g F
an
Clo
thes
Was
her
Dis
hw
ash
er
Ele
ctri
c W
ater
Hea
ter
Fix
ture
Fre
ezer
Ref
rig
erat
or
Ro
om
AC
Inland Pipe & Supply Yakima
Adams Quality Plumbing* Walla Walla
All Your Building Needs* Pomeroy
Bemis Yakima
Best Buy #831 Yakima
Chris Johnson Plumbing Walla Walla
Ferguson Enterprises, Inc. Walla Walla
Helms True Value Selah
Home Depot #4727 Yakima
Home Depot #4735 College Place
Lowe's of Union Gap Union Gap
Sears #2029 Union Gap
Sears #3088 Sunnyside
Sears #2599 Walla Walla
Sears #6914** Walla Walla
Selah Lighting Company Selah
Suffield Furniture Company Dayton
TV Towne Yakima
*These are participating stores who had no redemptions submitted to the program in 2012.
**This is a new store location, and had no redemptions in 2012. The previous Walla Walla Sears burned down. See Sears store #2599.

Pacific Power Washington Report Residential Programs
Page 21 of 45
Table 13 and Table 14 list the HVAC contractors and weatherization (window and insulation)
contractors.
Table 13
HVAC Contractors
Contractor Name City
Cen
tral
Air
Co
nd
itio
ner
(C
AC
)
CA
C B
est
Pra
ctic
es I
nst
alla
tio
n
Hea
t P
um
p (
HP
) U
pg
rad
e
HP
Co
nv
ersi
on
HP
Bes
t P
ract
ices
In
stal
lati
on
Sin
gle
-hea
d D
uct
less
HP
HP
Tu
ne-
up
Du
ct S
eali
ng
an
d D
uct
In
sula
tio
n
AccuTemp Heating and Air Conditioning Yakima
All Phase Refrigeration & Heating Kennewick
All Seasons Heating & Air Conditioning Yakima
Allard Enterprises Yakima
Apollo Sheet Metal Inc. Kennewick
Campbell and Company Pasco
Central Mechanical Services Yakima
CK Home Comfort Systems Grandview
Clark County Mechanical Vancouver
College Place Heating and AC College
Place
Comfort Pro’s Yakima
Darby Heating & Air Richland
Dave’s Heating and Air Conditioning Inc. Yakima
Dayco Heating Kennewick
Delta Heating & Cooling Inc. Richland
E-Star Northwest LLC Sequim
Farwest Climate Control Yakima
Four Season Heating and A/C Yakima
Grassi Refrigeration Walla Walla
Intermountain West Insulation Kennewick
J and B Heating & AC Yakima
McCarl Heating & Air Yakima
Mike’s Heating & Air Pomeroy
Miller & Trujillo Heating and AC, LLC. Zillah
Olmstead Electric Walla Walla
One Hour Heating & Air Conditioning Ellensburg

Pacific Power Washington Report Residential Programs
Page 22 of 45
Contractor Name City
Cen
tral
Air
Co
nd
itio
ner
(C
AC
)
CA
C B
est
Pra
ctic
es I
nst
alla
tio
n
Hea
t P
um
p (
HP
) U
pg
rad
e
HP
Co
nv
ersi
on
HP
Bes
t P
ract
ices
In
stal
lati
on
Sin
gle
-hea
d D
uct
less
HP
HP
Tu
ne-
up
Du
ct S
eali
ng
an
d D
uct
In
sula
tio
n
Platte Heating Yakima
Quality Comfort Yakima
Schaefer Refrigeration Inc. Walla Walla
Smith Insulation Walla Walla
The Ductologist Renton
ThermalWise Heating and Refrigeration,
LLC. Walla Walla
Thermex Valley Heating and AC Yakima
TJ’s Refrigeration Heating and Air Sunnyside
TNG Heating and Refrigeration, LLC. Toppenish
Total Comfort Solutions, LLC. Walla Walla
Vance Heating and AC Yakima

Pacific Power Washington Report Residential Programs
Page 23 of 45
Table 14
Weatherization Contractors
Contractor Name City Insu
lati
on
Att
ic
Insu
lati
on
Flo
or
Insu
lati
on
Wal
l
Win
do
ws
Allard Enterprises Yakima
Central Valley Glass Yakima
Chon Insulation and Drywall Walla Walla
Comfort Pro’s Yakima
Dave’s Heating & AC Yakima
Don Jordan Energy Systems Yakima
E-Star Northwest LLC Sequim
Farwest Climate Control Yakima
High Desert Glass Prosser
Intermountain West Insulation Kennewick
Jackson Siding and Windows Walla Walla
McCarl Heating & Air Yakima
McKinney Glass Yakima
Miller Glass Yakima
Patrick Construction Naches
Pro Build Yakima
Smith Insulation Walla Walla
The Ductologist Renton
West Valley Glass and Window Yakima
Windows Walla Walla Walla Walla

Pacific Power Washington Report Residential Programs
Page 24 of 45
Demographics
Approximately 63 percent of all Home Energy Savings incentive applications for the reporting
period (January 1, 2012 – December 31, 2012) were received from customers located in Yakima
and Walla Walla. Table 15 summarizes customer applications by community.
Table 15
Customer Applications by City
City
Percent of Total
Appliance &
Fixture Applications
Percent of Total
HVAC
Applications
Percent of Total
Weatherization
Applications
Percent of Total:
All Applications
Yakima 49.0% 42.8% 42.9% 47.9%
Walla Walla 14.1% 17.8% 25.9% 15.7%
Selah 9.0% 9.1% 11.0% 9.2%
Sunnyside 3.3% 3.8% 1.1% 3.1%
College Place 2.5% 5.3% 3.2% 2.8%
Wapato 3.0% 1.0% 0.7% 2.6%
Zillah 2.6% 1.9% 2.5% 2.6%
Moxee 2.4% 1.0% 1.4% 2.2%
Toppenish 2.4% 0.5% 0.7% 2.0%
Grandview 1.8% 3.8% 1.4% 1.9%
Union Gap 1.8% 1.9% 1.4% 1.8%
Dayton 1.2% 1.9% 1.8% 1.3%
Naches 1.4% 1.0% 0.7% 1.3%
Tieton 1.0% 1.0% 0.7% 1.0%
Granger 1.0% 0.7% 0.9%
Waitsburg 0.6% 0.5% 2.1% 0.7%
Cowiche 0.7% 0.5% 0.4% 0.6%
Touchet 0.4% 1.9% 0.5%
Pomeroy 0.4% 1.0% 0.4%
Burbank 0.0% 2.9% 1.1% 0.4%
Outlook 0.3% 0.3%
Prescott 0.2% 0.2%
Harrah 0.2% 0.2%
Mabton 0.1% 0.4% 0.2%
Parker 0.2% 0.2%
Buena 0.1% 0.1%
Dixie 0.1% 0.1%
White Swan 0.05% 0.5% 0.1%
Pacific Power Washington Report Residential Programs
Page 25 of 45
Evaluation
In January 2012, a process and impact evaluation was completed by a third party evaluator for
program years 2009-2010. The impact evaluation provided data on the gross realized savings and
the NTG ratio24
. The process evaluation investigated participant satisfaction, implementation and
delivery processes, marketing methods and quality assurance. The Company’s response to the
recommendations and web link to the evaluation report are included in Appendix 4.
Home Energy Reports
The Home Energy Reports program began in August 2012. Home Energy Reports is designed to
better inform residential customers about their energy usage by providing comparative energy
usage data for similar homes located in the same geographical area. In addition, the report
provides the customer with information on how to decrease their energy usage. Equipped with
this information, customers can modify behavior and/or make structural equipment, lighting or
appliance changes to reduce their overall electric energy consumption.
Starting with the July 2012 billing cycle, customers received a monthly Home Energy Report for
the first three months and thereafter the report delivery cycle became bi-monthly. Paper reports
are mailed out following the customers’ billing cycle, which is a five-week period. Customers
may opt-out of the mailed paper copy of the report and request an electronic version delivered
via email.
The report provides a clear, graphical representation of energy use over time and provides the
comparison to the energy usage of similar homes within a one mile radius. The program is
covering a 41-month period (through December 2015) to assess the performance of the program
in the Company’s service territory. Each participating customer will receive 21 reports over the
term of the program. Reports were provided to approximately 13,500 customers. This count will
decrease (due opt-out/move-out rate) over the program’s 41-month term.
A total of 13,500 customers were randomly selected to receive the reports. Program participants
are made up of customers with an annual average electrical energy usage of 20,000 kilowatt
hours (“kWh”). To achieve this, the upper bound annual average is approximately 29,000 kWh
and the lower bound annual average is 13,500 kWh. As degradation occurs over the program
period, the average usage of the population may also change. The change in average usage will
be measured and verified in the program evaluation (program month 18 and 36). Participating
customers have access to a Web portal containing the same information about their usage and
past usage. The Web portal has other functions such as a home energy audit tool and suggestions
to improve energy conservation and efficiency of their home.
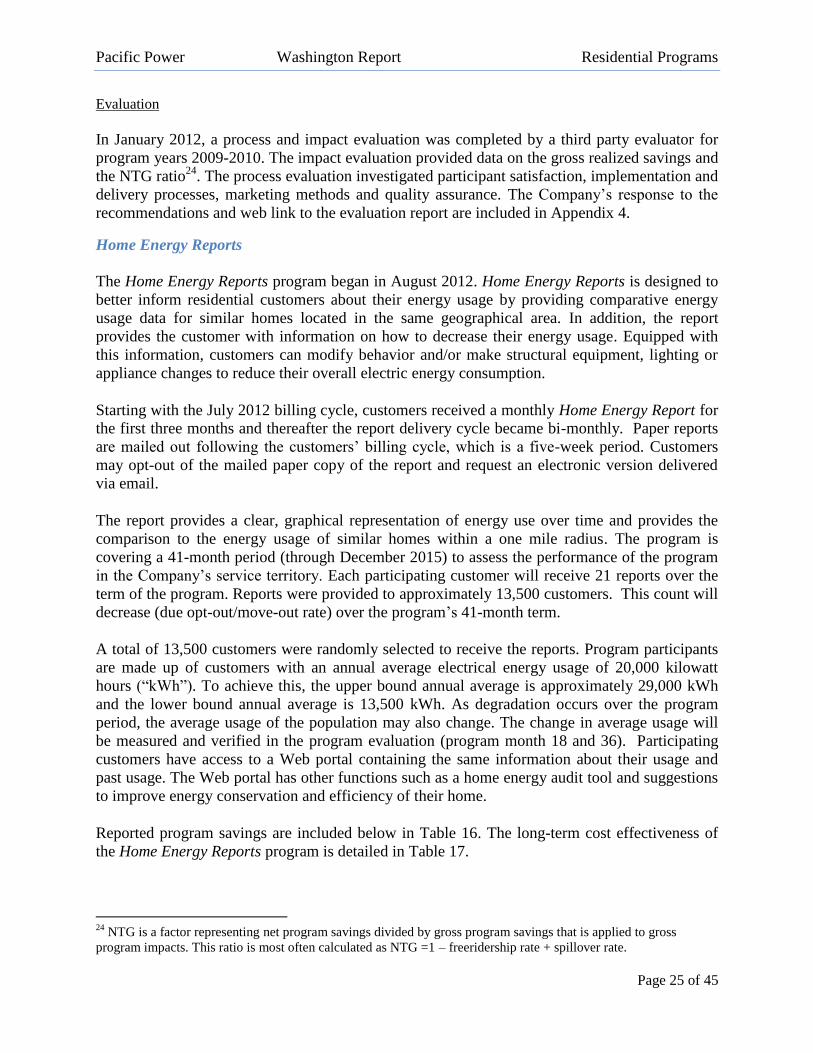
Reported program savings are included below in Table 16. The long-term cost effectiveness of
the Home Energy Reports program is detailed in Table 17.
24
NTG is a factor representing net program savings divided by gross program savings that is applied to gross
program impacts. This ratio is most often calculated as NTG =1 – freeridership rate + spillover rate.
Pacific Power Washington Report Residential Programs
Page 26 of 45
Table 16
Reported 2012 Program Savings (kWh savings at site)
Month July
25 August September October November December Total
Savings (kWh) 145,878 160,226 296,771 361,663 435,033 378,910 1,778,482
Table 17
Long-term Cost Effectiveness for Home Energy Reporting
B/C Ratio Net Benefits
Total Resource Test plus 10% – total resource cost with the addition of
environmental and non-energy benefits 1.56 $56,603
Total Resource Cost Test – effects on both participants and non-participants 1.42 $42,343
Utility Cost Test – effect on customers 1.42 $42,343
Participant Cost Test – effect on participants N/A $153,483
Rate Payer Impact – effect on the cost per kilowatt-hour of sales 0.56 ($111,140)
Program Management
The program manager is responsible for the Home Energy Reports program in Washington and
Utah. The program manager is also responsible for the New Homes and Cool Keeper programs in
Utah. For each program and in each state the program manager is responsible for the cost
effectiveness of the program, identifying and contracting with the program administrator through
a competitive bid process, establishing and monitoring program performance and compliance,
and recommending changes in the terms and conditions set in each state’s compliance
requirements.
Program Administration
The Home Energy Reports program is administered by Opower. Opower is a privately held
Software-as-a-Service company that partners with utility providers around the world to promote
energy efficiency. Opower works with more than 75 utility companies in 31 US states and five
other countries. Opower's software creates individualized energy reports for utility customers
that analyze their energy usage and offers recommendations on how to save energy and money
by making small changes to their energy consumption. The Company contracts with Opower to
provide, guaranteed energy savings, software services, and printing and delivery of energy
reports to customers.
Opower is responsible for the following:
Selecting Qualifying Customers – Opower conducts an analysis to identify qualifying
customers that are randomly selected into the treatment and control groups (verified by a
third party.
25
Due to company billing cycles, a portion of the reports were mailed to participating customers in July. Therefore,
a corresponding amount of savings were verified and reported by Opower prior to August 2012.
Pacific Power Washington Report Residential Programs
Page 27 of 45
Customer Comparison Analysis– Opower conducts statistical analysis to perform pattern
recognition in order to derive actionable insights to selected customers.
Energy Report Delivery – Provide statistical analysis to customers via Home Energy
Assessment report via mail hardcopy and email (to limited customers.)
Web Portal Delivery – Opower operates and maintains a customer Web portal that
participants may visit for additional information about their energy usage and saving
opportunities.
A third party contractor will evaluate Opower’s reported savings at 18-months (February 2014)
and at 36-months (December 2015.) The results from the 18-month evaluation will be
incorporated in the 2012-2013 Conversation Report filed by June 1, 2014.
Refrigerator Recycling
The Refrigerator Recycling26
(“See ya later, refrigerator®”) program is designed to decrease
electricity use (kWh) through voluntary removal and recycling of inefficient refrigerators and
freezers. Participants receive a $30 incentive for each qualifying refrigerator or freezer recycled
through the program and an energy-saving kit which includes two compact fluorescent lamps
(“CFLs”), a refrigerator thermometer card, energy-savings educational materials, and
information on other efficiency programs relevant to residential customers.
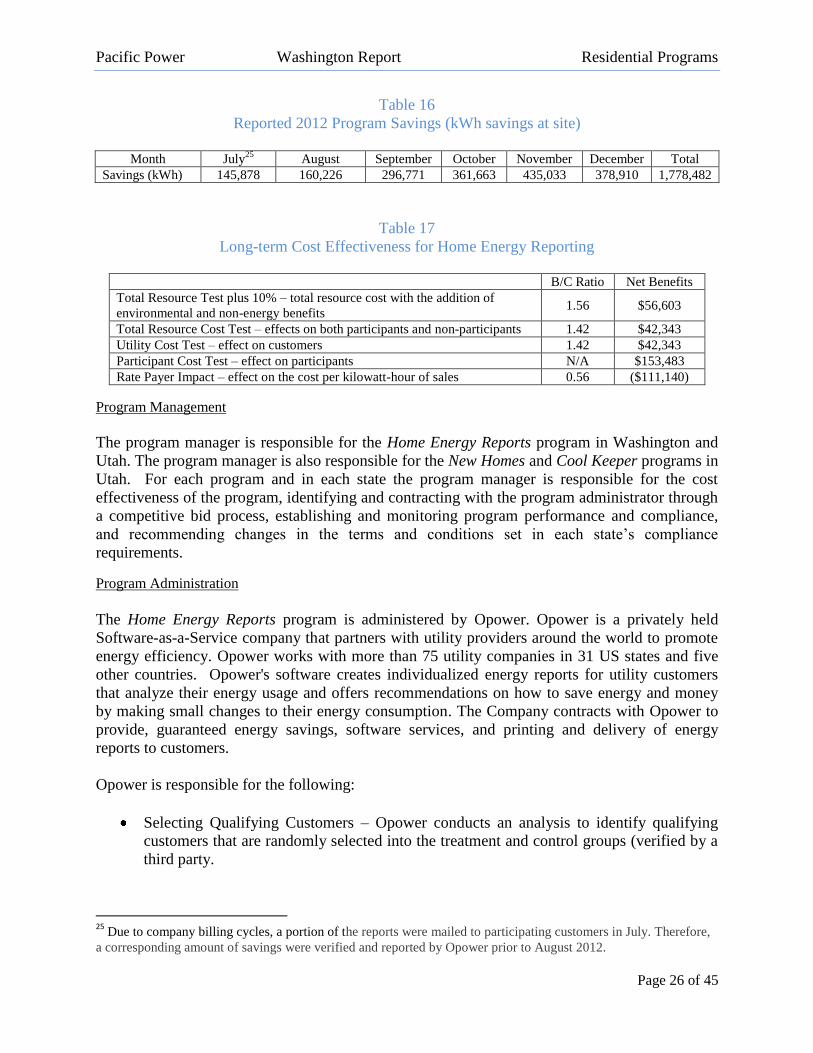
Program participation by measure is provided in Table 18.
Table 18
Eligible Program Measures (Units)
Measures 2012 Total
Refrigerator Recycling 1,229
Freezer Recycling 282
Energy Savings Kit 1,418
Program performance results for January 1, 2012 – December 31, 2012 are provided in the Table
19 below.
Table 19
Long-term Cost Effectiveness for Refrigerator Recycling
B/C Ratio Net Benefits
Total Resource Test plus 10% – total resource cost with the addition of
environmental and non-energy benefits 3.07 $400,984
Total Resource Cost Test – effects on both participants and non-participants 2.79 $346,938
Utility Cost Test – effect on customers 2.19 $293,398
Participant Cost Test – effect on participants NA $570,510
Rate Payer Impact – effect on the cost per kilowatt-hour of sales 0.71 ($223,571)
26
Also known as “See ya later, refrigerator®” (“SYLR”)
Pacific Power Washington Report Residential Programs
Page 28 of 45
In 2012, more than 93 tons (186,750 lbs) of steel, 3 tons (5,976 lbs) of aluminum and copper, 15
tons (29,880 lbs) of plastics were recycled, reducing landfill deposits by an amount sufficient to
cover an entire football field more than two and a half feet deep. In addition, the
chlorofluorocarbons (greenhouse gases) collected and destroyed during recycling equates to
approximately 3.5 tons (5,337.4 metric tons for 1,494 units) of carbon dioxide equivalents per
unit, equivalent to the annual emissions of the average car in the US.
Program Management
The program manager is responsible for the Refrigerator Recycling program and Home Energy
Savings program in Washington, California, Idaho, Utah, and Wyoming. For each program and
in each state the program manager is responsible for the cost effectiveness of the program,
identifying and contracting with the program administrator through a competitive bid process,
establishing and monitoring program performance and compliance, and recommending changes
in the terms and conditions set out in the tariff.
Program Administration
The Refrigerator Recycling program is administered by JACO Environmental (“JACO”). JACO
started over 20 years ago in Snohomish County, north of Seattle, Washington. JACO has grown
to become one of the largest recyclers of house-hold appliances in the United States. The
Company contracts with JACO to provide customer scheduling, pick-up, incentive processing
and marketing services for the See ya later, refrigerator® program.
JACO also ensures that over 95 percent of the components and materials of the discarded
appliance are either recycled for beneficial uses or eliminated in an environmentally responsible
way. The remaining 5 percent can then be productively used as “fluff” to facilitate the
decomposition of biodegradable landfill material.
JACO Environmental is responsible for the following:
Customer and field services – JACO handles all customer and field service operations for
the program. Pick-up of refrigerators and freezers from customers and transporting the
units to the de-manufacturing facility is done by JACO.
Incentive processing and call-center operations – All customer service calls, pick-up
scheduling and incentive processing are handled by JACO.
Program specific customer communication and outreach – Working in close coordination
with the Company, JACO handles all the marketing for the program. The program is
marketed through bill inserts, customer newsletters and TV, newspaper and online
advertising.
Separate third party contractors are employed to ensure JACO’s performance. The summary of
the inspection process is included in Appendix 3.

Pacific Power Washington Report Residential Programs
Page 29 of 45
Infrastructure
Refrigerators and freezers are trucked to a JACO facility in Everett, Washington for disassembly
and recycling.
Evaluation
In January 2012, a process and impact evaluation was completed by a third party evaluator for
program years 2009-2010. The impact evaluation provided data on the gross realized savings and
the NTG ratio. The process evaluation investigated participant satisfaction, implementation and
delivery processes, marketing methods and quality assurance. The Company’s response to the
recommendations and web link to the evaluation report are included in Appendix 4.
Low Income Weatherization
The Low Income Weatherization program is designed to leverage funds with state and federal
grants so that energy efficiency services can benefit income eligible households at no cost.
Program participation and number of homes receiving specific measures is provided in Table 20.
Table 20
Eligible Program Measures (Units)
2012 Total
Participation – Total # of Completed/Treated Homes 112
Number of Homes Receiving Specific Measures
Ceiling Insulation 67
Floor Insulation 97
Infiltration 107
Water Pipe Insulation and Sealing 106
Compact Fluorescent Light bulbs 105
Replacement Refrigerators 13
Caulk/Weather-stripping 65
Wall Insulation 36
Attic Ventilation 45
Duct Insulation 58
Dehumidifier 1
Showerheads 66
Water Heater Repair 12
Ground Cover 93
Aerators 81
Timed Thermostat 14
Fluorescent Light Fixture 1
Repairs 52
Pacific Power Washington Report Residential Programs
Page 30 of 45
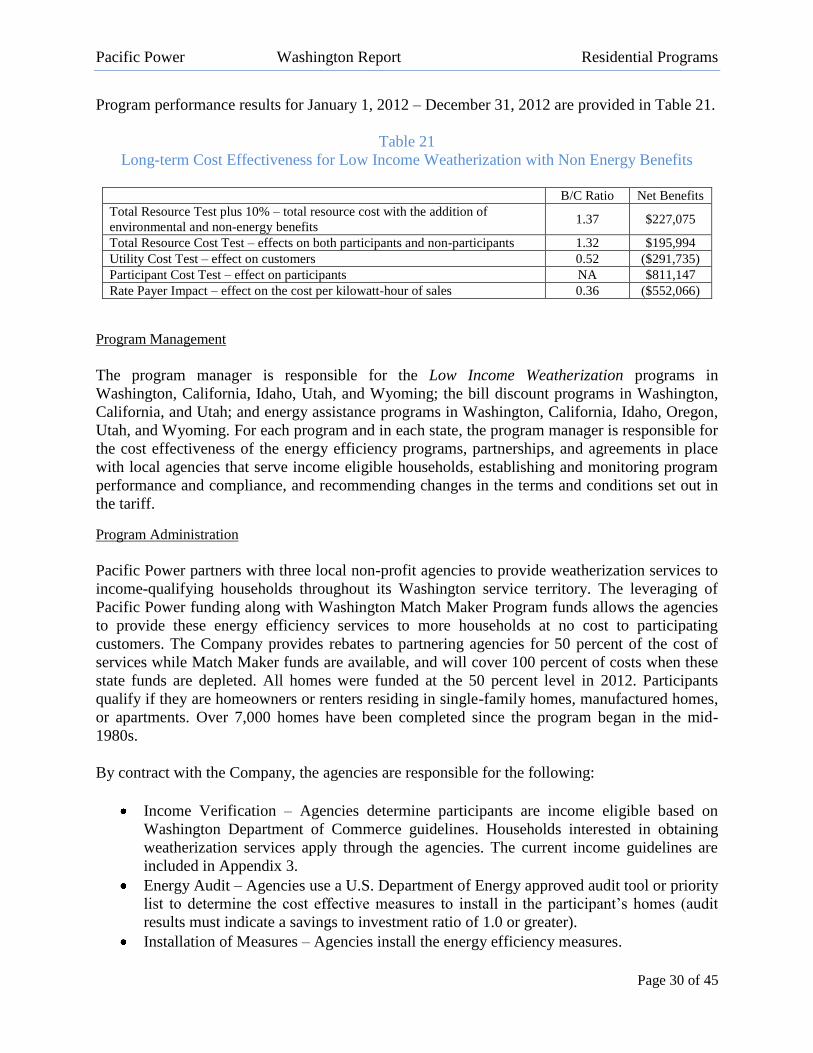
Program performance results for January 1, 2012 – December 31, 2012 are provided in Table 21.
Table 21
Long-term Cost Effectiveness for Low Income Weatherization with Non Energy Benefits
B/C Ratio Net Benefits
Total Resource Test plus 10% – total resource cost with the addition of
environmental and non-energy benefits 1.37 $227,075
Total Resource Cost Test – effects on both participants and non-participants 1.32 $195,994
Utility Cost Test – effect on customers 0.52 ($291,735)
Participant Cost Test – effect on participants NA $811,147
Rate Payer Impact – effect on the cost per kilowatt-hour of sales 0.36 ($552,066)
Program Management
The program manager is responsible for the Low Income Weatherization programs in
Washington, California, Idaho, Utah, and Wyoming; the bill discount programs in Washington,
California, and Utah; and energy assistance programs in Washington, California, Idaho, Oregon,
Utah, and Wyoming. For each program and in each state, the program manager is responsible for
the cost effectiveness of the energy efficiency programs, partnerships, and agreements in place
with local agencies that serve income eligible households, establishing and monitoring program
performance and compliance, and recommending changes in the terms and conditions set out in
the tariff.
Program Administration
Pacific Power partners with three local non-profit agencies to provide weatherization services to
income-qualifying households throughout its Washington service territory. The leveraging of
Pacific Power funding along with Washington Match Maker Program funds allows the agencies
to provide these energy efficiency services to more households at no cost to participating
customers. The Company provides rebates to partnering agencies for 50 percent of the cost of
services while Match Maker funds are available, and will cover 100 percent of costs when these
state funds are depleted. All homes were funded at the 50 percent level in 2012. Participants
qualify if they are homeowners or renters residing in single-family homes, manufactured homes,
or apartments. Over 7,000 homes have been completed since the program began in the mid-
1980s.
By contract with the Company, the agencies are responsible for the following:
Income Verification – Agencies determine participants are income eligible based on
Washington Department of Commerce guidelines. Households interested in obtaining
weatherization services apply through the agencies. The current income guidelines are
included in Appendix 3.
Energy Audit – Agencies use a U.S. Department of Energy approved audit tool or priority
list to determine the cost effective measures to install in the participant’s homes (audit
results must indicate a savings to investment ratio of 1.0 or greater).
Installation of Measures – Agencies install the energy efficiency measures.
Pacific Power Washington Report Residential Programs
Page 31 of 45
Post Inspections – Agencies inspect 100 percent of completed homes. A sample of 5 -10
percent are inspected by a Pacific Power inspector. See Appendix 3 for verification
summary.
Billing Notification - Agencies are required to submit a billing to Company within 45
days after job completion. A homeowner agreement and invoice form indicating the
measures installed and associated cost is submitted on each completed home.
Infrastructure
Pacific Power has agreements in place with three non-profit weatherizing agencies. These
agencies include Blue Mountain Action Council located in Walla Walla, Northwest Community
Action Center in Toppenish, and Opportunities Industrialization Center of Washington in
Yakima. These three agencies serve the entire Pacific Power Washington service area.
Evaluation
In September 2012, a process and impact evaluation was completed by a third party evaluator for
March 2009 – February 2011. The impact evaluation provided data on the gross realized savings
and the net-to-gross (NTG) ratio. The process evaluation investigated participant satisfaction,
implementation and delivery processes, marketing methods, and quality assurance. The
Company’s response to the recommendations and web link to the evaluation report are included
in Appendix 4.
Northwest Energy Efficiency Alliance
The Northwest Energy Efficiency Alliance (NEEA) is a non-profit corporation supported by, and
working in collaboration with, the Bonneville Power Administration, Energy Trust of Oregon,
and more than 100 Northwest utilities (including PacifiCorp).
NEEA works in collaboration with its funders and other strategic market partners to accelerate
the innovation and adoption of energy-efficient products, services, and practices.
For the 2010-2014 funding cycle, NEEA and the region are striving to achieve 200 aMW of total
regional savings. PacifiCorp’s Washington funding of NEEA’s work represents 3.01 percent of
the region’s funding; approximately $5.7 million over the five year period with expected savings
attributed to PacifiCorp’s Washington service area of roughly 6 aMW.
Program performance for 2012 are being reported based on NEEA’s preliminary results for
Pacific Power of 13,611 megawatt hours for the Company’s funding investment of
approximately $1.2m. Consistent with the reporting convention approved in Docket UE-111880,
the savings represent Pacific Power’s portion of Total Regional Savings less the Company’s
local program savings (adjustment to total movement in the market baseline for measures
impacted by NEEA’s efforts to account for savings already captured and reported through
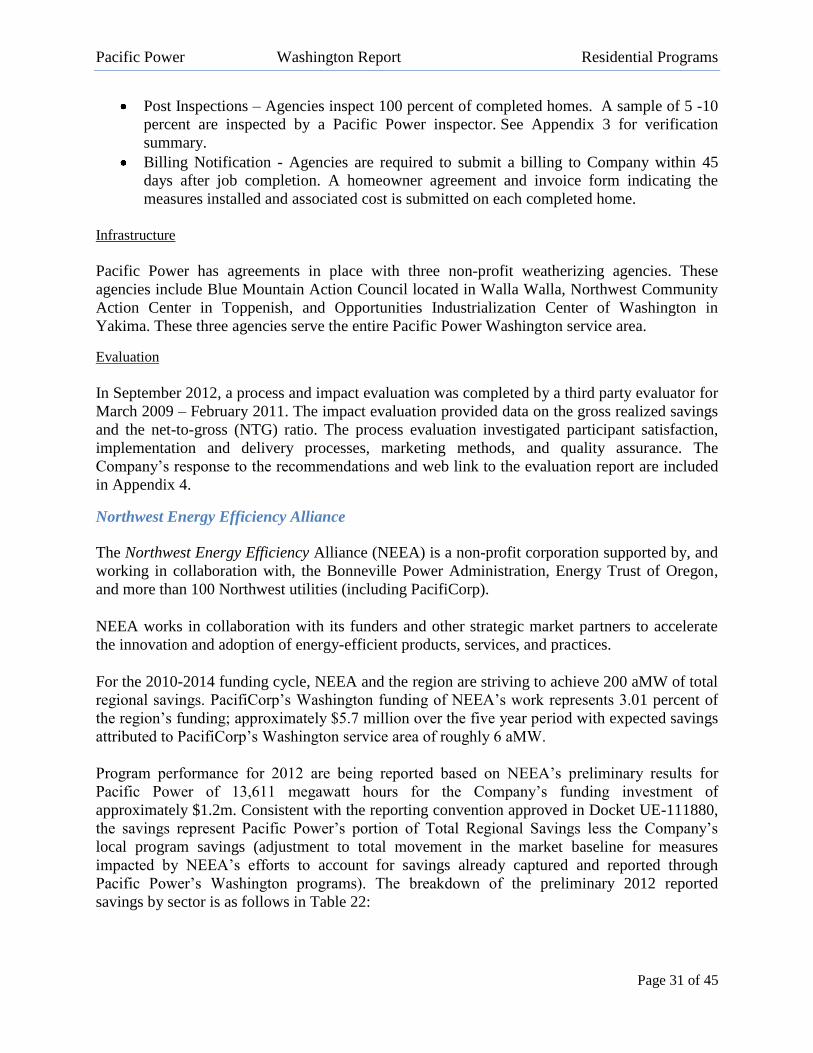
Pacific Power’s Washington programs). The breakdown of the preliminary 2012 reported
savings by sector is as follows in Table 22:
Pacific Power Washington Report Residential Programs
Page 32 of 45
Table 22
Preliminary 2012 Reported Savings by Sector
Sector Megawatt Hours Percent
Residential 8,838 65%
Commercial 2,783 20%
Industrial 1,990 15%
The primary initiatives generating savings by sector as a percent of total savings is as follows in
Table 23:
Table 23
Initiatives Savings by Sector
Initiative/Measures Residential Commercial Industrial
Televisions 65%
Appliances 21%
Lighting 10%
Efficient Homes 2%
Ductless Heat Pumps 1%
Codes 1% 16%
Desktop 60%
Building Operators Certification 10%
Real Estate 7%
Health Care 7%
Drive Power 52%
Food Processors 33%
Evaporative Fans 10%
Pneu-Logic (SAV_AIR) 5%
Total 100% 100% 100%
Program Administration
The Company has a member on the NEEA board of directors as well as representatives on each
of the sector advisory boards, residential, commercial and industrial. The Company also has
representation on NEEA’s broader Regional Portfolio Committee and participants in the regional
Northwest Research Group. Collectively the representatives work collaboratively with the other
funders, advisory group members, and NEEA to direct the efforts of NEEA in the best interest of
the region in the achievement of the region’s market transformation objectives.
Pacific Power Washington Report Commercial and Industrial Programs
Page 33 of 45
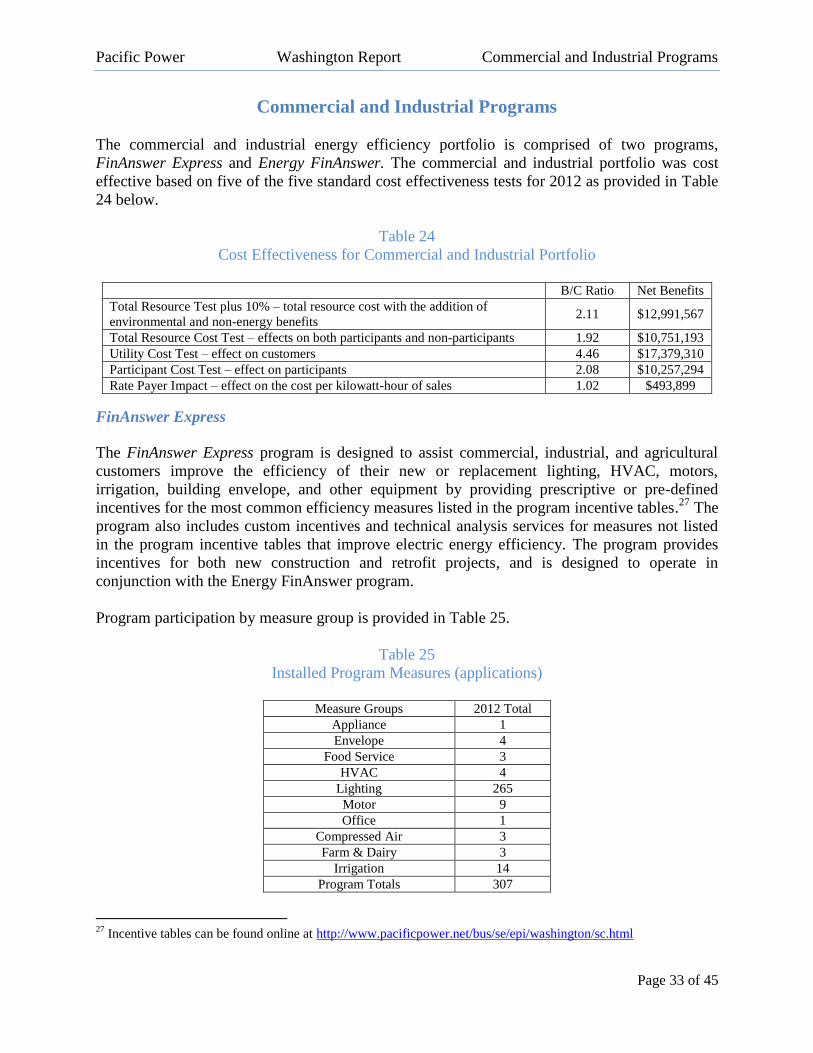
Commercial and Industrial Programs
The commercial and industrial energy efficiency portfolio is comprised of two programs,
FinAnswer Express and Energy FinAnswer. The commercial and industrial portfolio was cost
effective based on five of the five standard cost effectiveness tests for 2012 as provided in Table
24 below.
Table 24
Cost Effectiveness for Commercial and Industrial Portfolio
B/C Ratio Net Benefits
Total Resource Test plus 10% – total resource cost with the addition of
environmental and non-energy benefits 2.11 $12,991,567
Total Resource Cost Test – effects on both participants and non-participants 1.92 $10,751,193
Utility Cost Test – effect on customers 4.46 $17,379,310
Participant Cost Test – effect on participants 2.08 $10,257,294
Rate Payer Impact – effect on the cost per kilowatt-hour of sales 1.02 $493,899
FinAnswer Express
The FinAnswer Express program is designed to assist commercial, industrial, and agricultural
customers improve the efficiency of their new or replacement lighting, HVAC, motors,
irrigation, building envelope, and other equipment by providing prescriptive or pre-defined
incentives for the most common efficiency measures listed in the program incentive tables.27
The
program also includes custom incentives and technical analysis services for measures not listed
in the program incentive tables that improve electric energy efficiency. The program provides
incentives for both new construction and retrofit projects, and is designed to operate in
conjunction with the Energy FinAnswer program.
Program participation by measure group is provided in Table 25.
Table 25
Installed Program Measures (applications)
Measure Groups 2012 Total
Appliance 1
Envelope 4
Food Service 3
HVAC 4
Lighting 265
Motor 9
Office 1
Compressed Air 3
Farm & Dairy 3
Irrigation 14
Program Totals 307
27
Incentive tables can be found online at http://www.pacificpower.net/bus/se/epi/washington/sc.html
Pacific Power Washington Report Commercial and Industrial Programs
Page 34 of 45
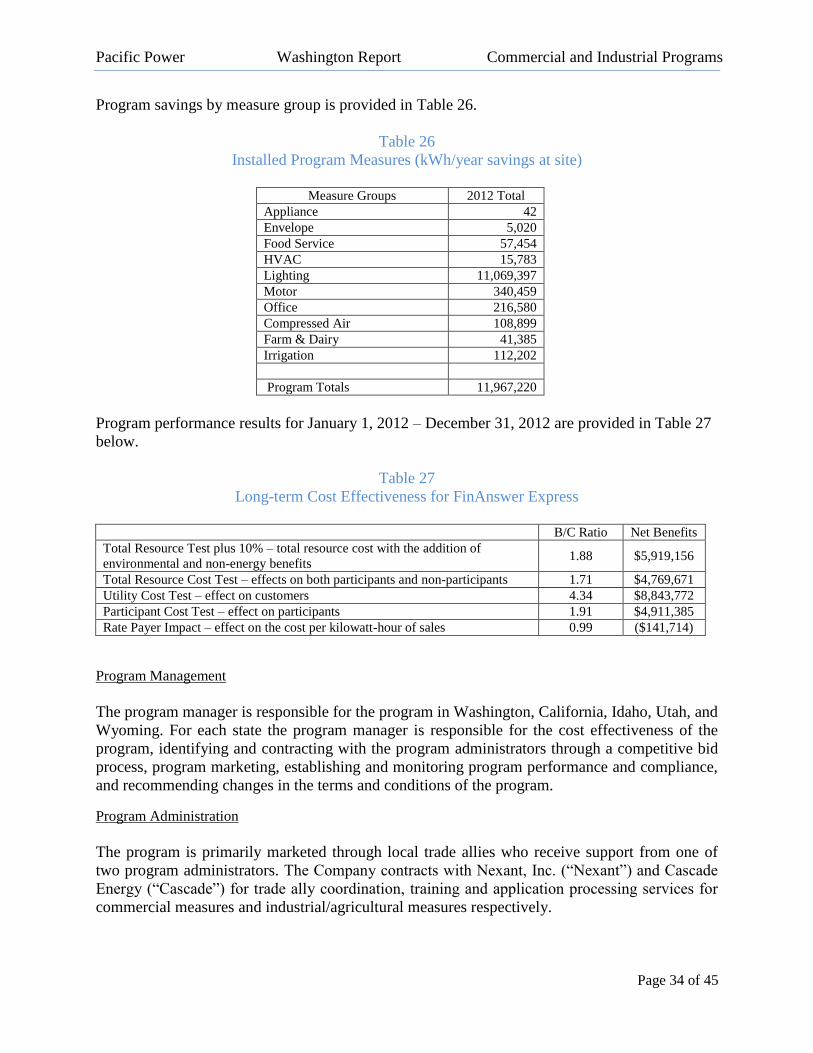
Program savings by measure group is provided in Table 26.
Table 26
Installed Program Measures (kWh/year savings at site)
Measure Groups 2012 Total
Appliance 42
Envelope 5,020
Food Service 57,454
HVAC 15,783
Lighting 11,069,397
Motor 340,459
Office 216,580
Compressed Air 108,899
Farm & Dairy 41,385
Irrigation 112,202
Program Totals 11,967,220
Program performance results for January 1, 2012 – December 31, 2012 are provided in Table 27
below.
Table 27
Long-term Cost Effectiveness for FinAnswer Express
B/C Ratio Net Benefits
Total Resource Test plus 10% – total resource cost with the addition of
environmental and non-energy benefits 1.88 $5,919,156
Total Resource Cost Test – effects on both participants and non-participants 1.71 $4,769,671
Utility Cost Test – effect on customers 4.34 $8,843,772
Participant Cost Test – effect on participants 1.91 $4,911,385
Rate Payer Impact – effect on the cost per kilowatt-hour of sales 0.99 ($141,714)
Program Management
The program manager is responsible for the program in Washington, California, Idaho, Utah, and
Wyoming. For each state the program manager is responsible for the cost effectiveness of the
program, identifying and contracting with the program administrators through a competitive bid
process, program marketing, establishing and monitoring program performance and compliance,
and recommending changes in the terms and conditions of the program.
Program Administration
The program is primarily marketed through local trade allies who receive support from one of
two program administrators. The Company contracts with Nexant, Inc. (“Nexant”) and Cascade
Energy (“Cascade”) for trade ally coordination, training and application processing services for
commercial measures and industrial/agricultural measures respectively.
Pacific Power Washington Report Commercial and Industrial Programs
Page 35 of 45
Nexant services include design, implementation, and evaluation of commercial, industrial, and
residential energy efficiency programs in the United States. The Company contracts with Nexant
to provide trade ally coordination and application processing services for the commercial
measures in the FinAnswer Express program.
Cascade is an industrial energy efficiency consulting firm providing both retrofit and new
construction capital studies; tune-ups and retro-commissioning; utility demand-side management
program design and administration; research and development; and energy management services.
The Company contracts with Cascade Energy to provide trade ally coordination and application
processing services for the industrial and agricultural measures in the FinAnswer Express
program.
Nexant and Cascade are responsible for the following:
Trade ally engagement – Nexant and Cascade identify, recruit, train, support and assist
trade allies to increase sales and installation of energy efficient equipment at qualifying
business customer facilities.
Incentive processing and administrative support – Nexant and Cascade handle incoming
inquiries as assigned, process FinAnswer Express incentive applications, develop and
maintain simplified analysis tools and provide program design services, evaluation and
regulatory support upon request.
Inspections – Nexant and Cascade verify on an on-going basis the installation of
measures. Summary of the inspection process is in Appendix 4.
In addition, the Company’s project managers coordinate FinAnswer Express projects and
provide customers with program services and incentives using the energy engineering
consultants described further in the Energy FinAnswer program section.
Infrastructure
To help increase and improve the supplier and installation contractor infrastructure for energy-
efficient equipment and services, the Company established and developed trade ally networks for
lighting, HVAC, motors and irrigation. This work includes identifying and recruiting trade allies,
providing program and technical training and providing sales support on an ongoing basis. The
current lists of the trade allies who have applied and been approved as participating vendors are
posted on the Company website and is included as Appendix 5 to this report. Customers are not
required to select a vendor from these lists to receive an incentive.
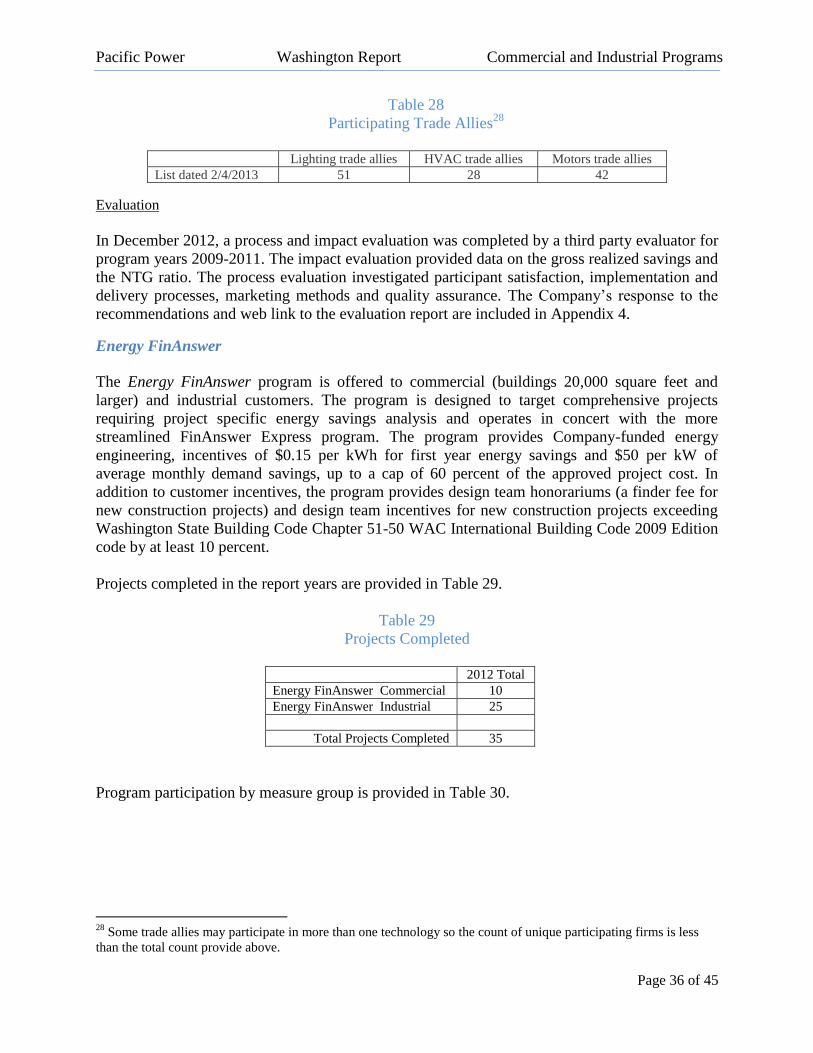
The total number of participating trade allies is currently 85. The current counts of participating
trade allies by technology are in the Table 28.
Pacific Power Washington Report Commercial and Industrial Programs
Page 36 of 45
Table 28
Participating Trade Allies28
Lighting trade allies HVAC trade allies Motors trade allies
List dated 2/4/2013 51 28 42
Evaluation
In December 2012, a process and impact evaluation was completed by a third party evaluator for
program years 2009-2011. The impact evaluation provided data on the gross realized savings and
the NTG ratio. The process evaluation investigated participant satisfaction, implementation and
delivery processes, marketing methods and quality assurance. The Company’s response to the
recommendations and web link to the evaluation report are included in Appendix 4.
Energy FinAnswer
The Energy FinAnswer program is offered to commercial (buildings 20,000 square feet and
larger) and industrial customers. The program is designed to target comprehensive projects
requiring project specific energy savings analysis and operates in concert with the more
streamlined FinAnswer Express program. The program provides Company-funded energy
engineering, incentives of $0.15 per kWh for first year energy savings and $50 per kW of
average monthly demand savings, up to a cap of 60 percent of the approved project cost. In
addition to customer incentives, the program provides design team honorariums (a finder fee for
new construction projects) and design team incentives for new construction projects exceeding
Washington State Building Code Chapter 51-50 WAC International Building Code 2009 Edition
code by at least 10 percent.
Projects completed in the report years are provided in Table 29.
Table 29
Projects Completed
2012 Total
Energy FinAnswer Commercial 10
Energy FinAnswer Industrial 25
Total Projects Completed 35
Program participation by measure group is provided in Table 30.
28
Some trade allies may participate in more than one technology so the count of unique participating firms is less
than the total count provide above.

Pacific Power Washington Report Commercial and Industrial Programs
Page 37 of 45
Table 30
Installed Program Measures
Measure Groups 2012 Total 2012 Totals
Applications kWh savings
at site
Additional Measure 2 569,034
Building Shell 1 6,704
Compressed Air 1 35,887
Controls 3 175,238
HVAC 7 2,222,154
Irrigation 1 122,197
Lighting 2 493,512
Motors 6 799,774
Refrigeration 11 7,656,354
Program Totals 35 12,080,854
Program performance results for January 1, 2012 – December 31, 2012 are provided in Table 31
below.
Table 31
Long-term Cost Effectiveness for Energy FinAnswer
B/C Ratio Net Benefits
Total Resource Test plus 10% – total resource cost with the addition of
environmental and non-energy benefits 2.44 $7,072,411
Total Resource Cost Test – effects on both participants and non-participants 2.21 $5,981,522
Utility Cost Test – effect on customers 4.60 $8,535,538
Participant Cost Test – effect on participants 2.32 $5,345,909
Rate Payer Impact – effect on the cost per kilowatt-hour of sales 1.06 $635,613
Program Management
The program manager is responsible for the Energy FinAnswer program in Washington,
California, Idaho, Utah, and Wyoming; the Self-Direction Credit program in Utah and
Wyoming; the Agricultural Energy Services program in Idaho; and the Commercial & Industrial
Re-Commissioning program in Utah. The Company employs four full-time project managers29
in
support of the program manager.
Energy FinAnswer program is administered by the Company. Consequently, the program
manager is responsible for the following:
Program cost effectiveness and performance
Ensuring the program is operated in compliance with commission tariffs and Company
guidelines including but not limited to qualification of customers
29
Based on the volume of projects, temporary project managers and/or support staff are employed from time-to-
time.
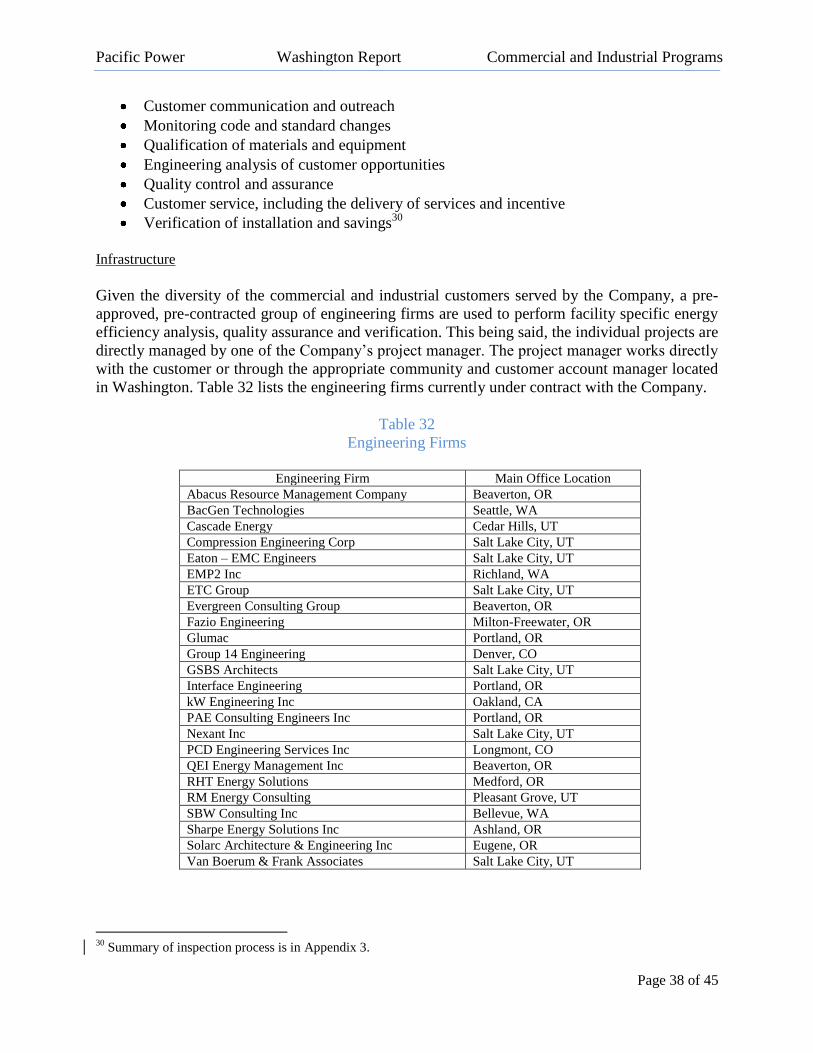
Pacific Power Washington Report Commercial and Industrial Programs
Page 38 of 45
Customer communication and outreach
Monitoring code and standard changes
Qualification of materials and equipment
Engineering analysis of customer opportunities
Quality control and assurance
Customer service, including the delivery of services and incentive
Verification of installation and savings30
Infrastructure
Given the diversity of the commercial and industrial customers served by the Company, a pre-
approved, pre-contracted group of engineering firms are used to perform facility specific energy
efficiency analysis, quality assurance and verification. This being said, the individual projects are
directly managed by one of the Company’s project manager. The project manager works directly
with the customer or through the appropriate community and customer account manager located
in Washington. Table 32 lists the engineering firms currently under contract with the Company.
Table 32
Engineering Firms
Engineering Firm Main Office Location
Abacus Resource Management Company Beaverton, OR
BacGen Technologies Seattle, WA
Cascade Energy Cedar Hills, UT
Compression Engineering Corp Salt Lake City, UT
Eaton – EMC Engineers Salt Lake City, UT
EMP2 Inc Richland, WA
ETC Group Salt Lake City, UT
Evergreen Consulting Group Beaverton, OR
Fazio Engineering Milton-Freewater, OR
Glumac Portland, OR
Group 14 Engineering Denver, CO
GSBS Architects Salt Lake City, UT
Interface Engineering Portland, OR
kW Engineering Inc Oakland, CA
PAE Consulting Engineers Inc Portland, OR
Nexant Inc Salt Lake City, UT
PCD Engineering Services Inc Longmont, CO
QEI Energy Management Inc Beaverton, OR
RHT Energy Solutions Medford, OR
RM Energy Consulting Pleasant Grove, UT
SBW Consulting Inc Bellevue, WA
Sharpe Energy Solutions Inc Ashland, OR
Solarc Architecture & Engineering Inc Eugene, OR
Van Boerum & Frank Associates Salt Lake City, UT
30
Summary of inspection process is in Appendix 3.
Pacific Power Washington Report Commercial and Industrial Programs
Page 39 of 45
Evaluation
In December 2012, a process and impact evaluation was completed by a third party evaluator for
program years 2009-2011. The impact evaluation provided data on the gross realized savings and
the NTG ratio. The process evaluation investigated participant satisfaction, implementation and
delivery processes, marketing methods and quality assurance. The Company’s response to the
recommendations and web link to access the evaluation report are included in Appendix 4.
A combination of in-depth project file reviews, interviews with facility staff, and on-site
measurement and verification activities involving spot measurements and end-use metering of
incented equipment informed the evaluated savings estimates for each project sampled during the
evaluation.
Pacific Power Washington Report Communication
Page 40 of 45
Communications, Outreach and Education
The Company utilizes earned media, customer communications, paid media and program
specific media in an effort to communicate the value of energy efficiency, provide information
regarding low-cost, no-cost energy efficiency measures, and to educate customers on the
availability of technical assistance, services, and incentives. The overall goal is to engage
customers in reducing their energy usage through behavioral changes as well as changes in
equipment, appliances and structures.
Earned Media
Earned media is managed by Pacific Power’s external communications department in
cooperation with the regional community managers located in Washington. “Earned media”
generally refers to favorable television, radio, newspaper, or internet news coverage gained
through press releases, media events, opinion pieces, story pitches, or other communication with
news editors and reporters. A list of the news stories, date of publication or airing, media outlet,
and web links (where available) is included in Appendix 6.
Customer Communications
As part of the Company’s regular communications to its customers, newsletters across all
customer classes promote energy efficiency initiatives and case studies on a regular basis. Inserts
and outer envelopes featuring energy efficiency messages have also been used on a consistent
basis. In 2012, the Company also issued two newsletters focused entirely on seasonal energy
efficiency information (in the fall and spring).
The Company also uses its website and social media, such as Twitter and Facebook to
communicate and engage customers on DSM offers and incentives.
Paid Media/wattsmart campaign
In 2012, Pacific Power implemented its DSM communication and outreach campaign called
wattsmart. This communications campaign was designed to create awareness of the importance
of being energy efficient and to help increase participation in the Company’s DSM programs.
Key strategies with this plan, keeping objectives and budgets in the forefront included:
Moving all energy efficiency programs, tips, and resources under the wattsmart
program umbrella.
Implementing an advertising campaign featuring wattsmart energy efficiency
messaging.
Promoting customer conservation (behavioral changes) and increasing participation
and savings through Pacific Power wattsmart DSM programs.
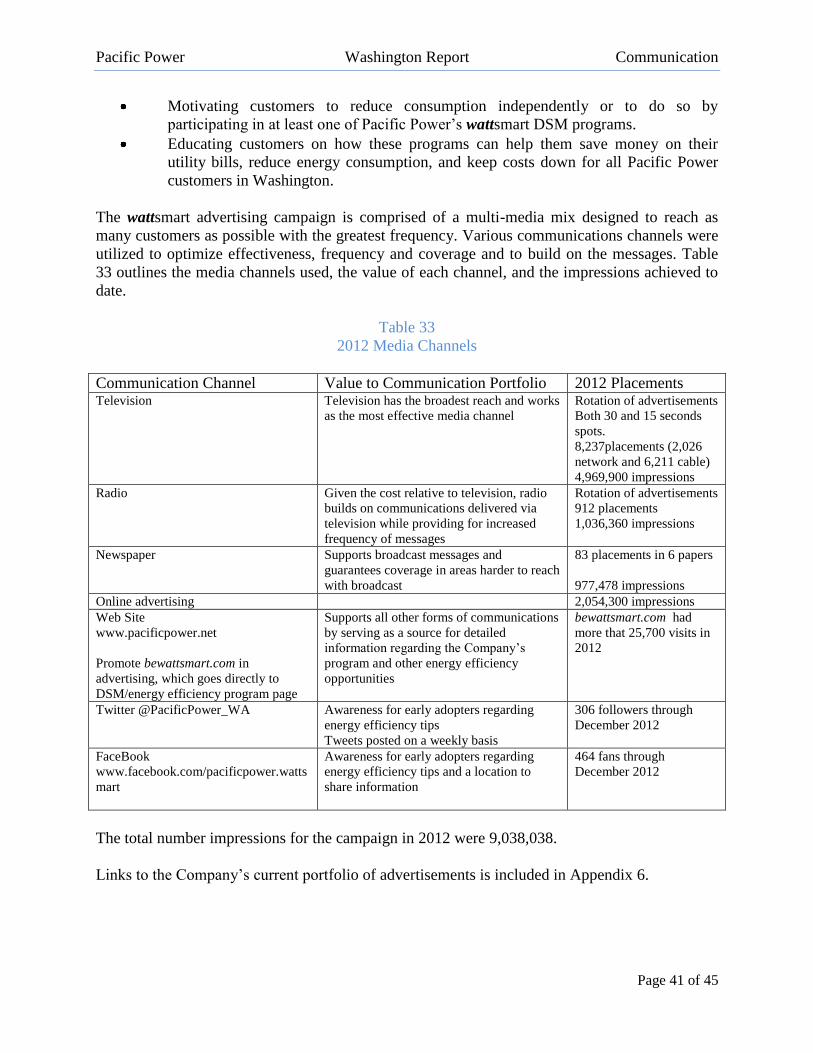
Pacific Power Washington Report Communication
Page 41 of 45
Motivating customers to reduce consumption independently or to do so by
participating in at least one of Pacific Power’s wattsmart DSM programs.
Educating customers on how these programs can help them save money on their
utility bills, reduce energy consumption, and keep costs down for all Pacific Power
customers in Washington.
The wattsmart advertising campaign is comprised of a multi-media mix designed to reach as
many customers as possible with the greatest frequency. Various communications channels were
utilized to optimize effectiveness, frequency and coverage and to build on the messages. Table
33 outlines the media channels used, the value of each channel, and the impressions achieved to
date.
Table 33
2012 Media Channels
Communication Channel Value to Communication Portfolio 2012 Placements Television
Television has the broadest reach and works
as the most effective media channel
Rotation of advertisements
Both 30 and 15 seconds
spots.
8,237placements (2,026
network and 6,211 cable)
4,969,900 impressions
Radio
Given the cost relative to television, radio
builds on communications delivered via
television while providing for increased
frequency of messages
Rotation of advertisements
912 placements
1,036,360 impressions
Newspaper
Supports broadcast messages and
guarantees coverage in areas harder to reach
with broadcast
83 placements in 6 papers
977,478 impressions
Online advertising 2,054,300 impressions
Web Site
www.pacificpower.net
Promote bewattsmart.com in
advertising, which goes directly to
DSM/energy efficiency program page
Supports all other forms of communications
by serving as a source for detailed
information regarding the Company’s
program and other energy efficiency
opportunities
bewattsmart.com had
more that 25,700 visits in
2012
Twitter @PacificPower_WA Awareness for early adopters regarding
energy efficiency tips
Tweets posted on a weekly basis
306 followers through
December 2012
www.facebook.com/pacificpower.watts
mart
Awareness for early adopters regarding
energy efficiency tips and a location to
share information
464 fans through
December 2012
The total number impressions for the campaign in 2012 were 9,038,038.
Links to the Company’s current portfolio of advertisements is included in Appendix 6.

Pacific Power Washington Report Communication
Page 42 of 45
The audiences for these messages were prioritized as follows:
• PRIMARY: Households in Pacific Power’s service area
• SECONDARY: Small and large business
Program Specific
All energy efficiency program communications are branded under the wattsmart umbrella to
reinforce the campaign and to link changes in behavior to actions customers can take by
participating in specific programs. Separate marketing activities administered by and specific to
the programs ran in conjunction with the wattsmart campaign in 2012.
Home Energy Savings
The Home Energy Savings program communicates to customers, retailers and trade allies
through a variety of channels. In January and February 2012, new heat pump sales pieces were
developed and a retailer resource manual was distributed. Communications promoting online
application processing were provided to retailers during the first part of the year.
In March, Home Energy Savings program staff sponsored a booth at the Central Washington
Home & Garden Show. Discounted admission coupons were inserted in customer bills in
advance of the show.
Program changes were implemented and communicated in April. This provided an opportunity
to promote new incentive measures and increased incentive amounts to customers in Washington
through print ads, bill messages and social media.
In the summer, program communications focused on cooling measures. The cooling campaign
included:
Room air conditioner point of purchase material
Handout material for retailers and trade allies to use in their sales to customers
Web features
Online and print ads
Bill insert
Results from the campaign indicate increased savings from cooling measures in 2012 compared
to the previous year.
A case study brochure was created to showcase the 60-unit affordable housing project with
Walla Walla Housing Authority. This piece was distributed to multi-family property owners,
trade allies and industry stakeholders.
In the fall, the Home Energy Savings program developed a heating campaign (similar to the
cooling campaign), including:
Web features
Sales handout and outreach to trade allies
Bill insert
Social media
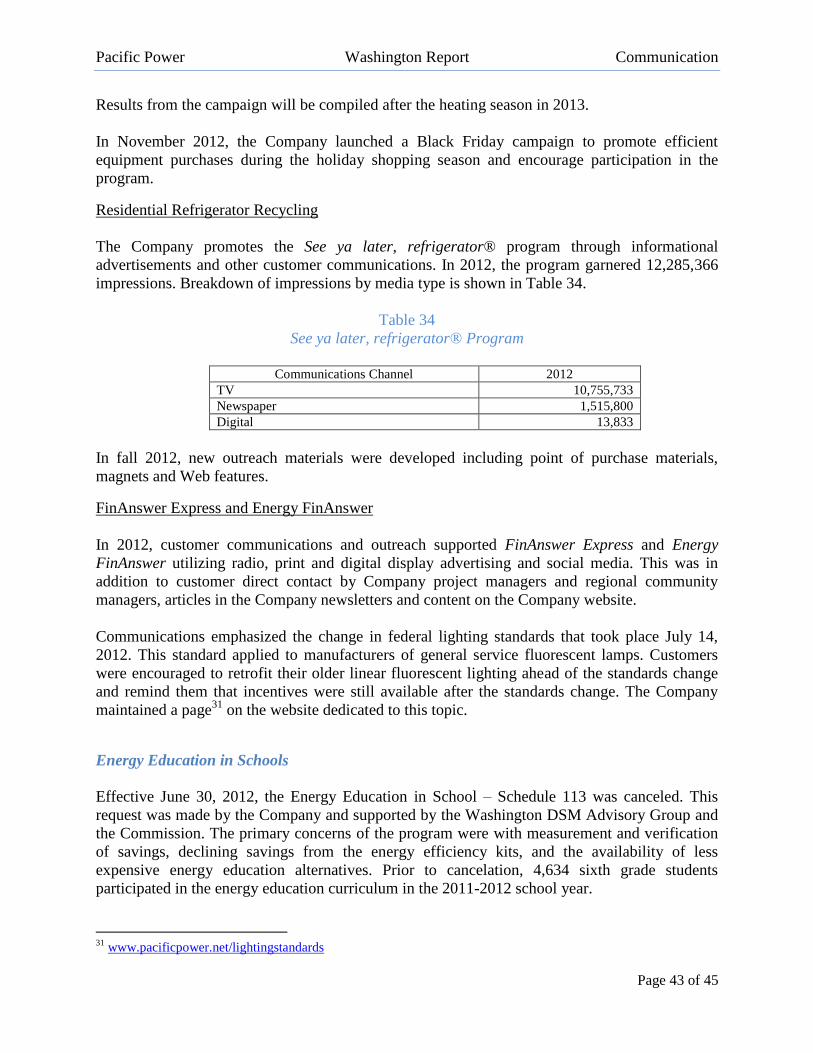
Pacific Power Washington Report Communication
Page 43 of 45
Results from the campaign will be compiled after the heating season in 2013.
In November 2012, the Company launched a Black Friday campaign to promote efficient
equipment purchases during the holiday shopping season and encourage participation in the
program.
Residential Refrigerator Recycling
The Company promotes the See ya later, refrigerator® program through informational
advertisements and other customer communications. In 2012, the program garnered 12,285,366
impressions. Breakdown of impressions by media type is shown in Table 34.
Table 34
See ya later, refrigerator® Program
Communications Channel 2012
TV 10,755,733
Newspaper 1,515,800
Digital 13,833
In fall 2012, new outreach materials were developed including point of purchase materials,
magnets and Web features.
FinAnswer Express and Energy FinAnswer
In 2012, customer communications and outreach supported FinAnswer Express and Energy
FinAnswer utilizing radio, print and digital display advertising and social media. This was in
addition to customer direct contact by Company project managers and regional community
managers, articles in the Company newsletters and content on the Company website.
Communications emphasized the change in federal lighting standards that took place July 14,
2012. This standard applied to manufacturers of general service fluorescent lamps. Customers
were encouraged to retrofit their older linear fluorescent lighting ahead of the standards change
and remind them that incentives were still available after the standards change. The Company
maintained a page31
on the website dedicated to this topic.
Energy Education in Schools
Effective June 30, 2012, the Energy Education in School – Schedule 113 was canceled. This
request was made by the Company and supported by the Washington DSM Advisory Group and
the Commission. The primary concerns of the program were with measurement and verification
of savings, declining savings from the energy efficiency kits, and the availability of less
expensive energy education alternatives. Prior to cancelation, 4,634 sixth grade students
participated in the energy education curriculum in the 2011-2012 school year.
31
www.pacificpower.net/lightingstandards

Pacific Power Washington Report Communication
Page 44 of 45
In the latter half of 2012, the Company issued a competitive Request for Proposal for a wattsmart
Schools education program and awarded the contract to the National Energy Foundation (NEF).
The new program is designed to develop a culture of energy efficiency among teachers, students,
and families. The centerpiece is a series of one hour presentations with hands-on, large group
activities for 4th
, 5th
, or 6th
grade students. Teachers are provided instructional materials for use in
their classrooms, and students are sent home with a Household Report Card to explore energy
use in their homes and to encourage efficient behaviors.
The costs reported at the beginning of the report in Table 8 include the Energy Education in
Schools program during the first half of 2012 as well as the costs associated with planning and
development of the new program. The costs for this education program falls under Docket UE-
111880, Order 01, Condition (7)(d) Conservation Efforts without Approved EM&V Protocol.
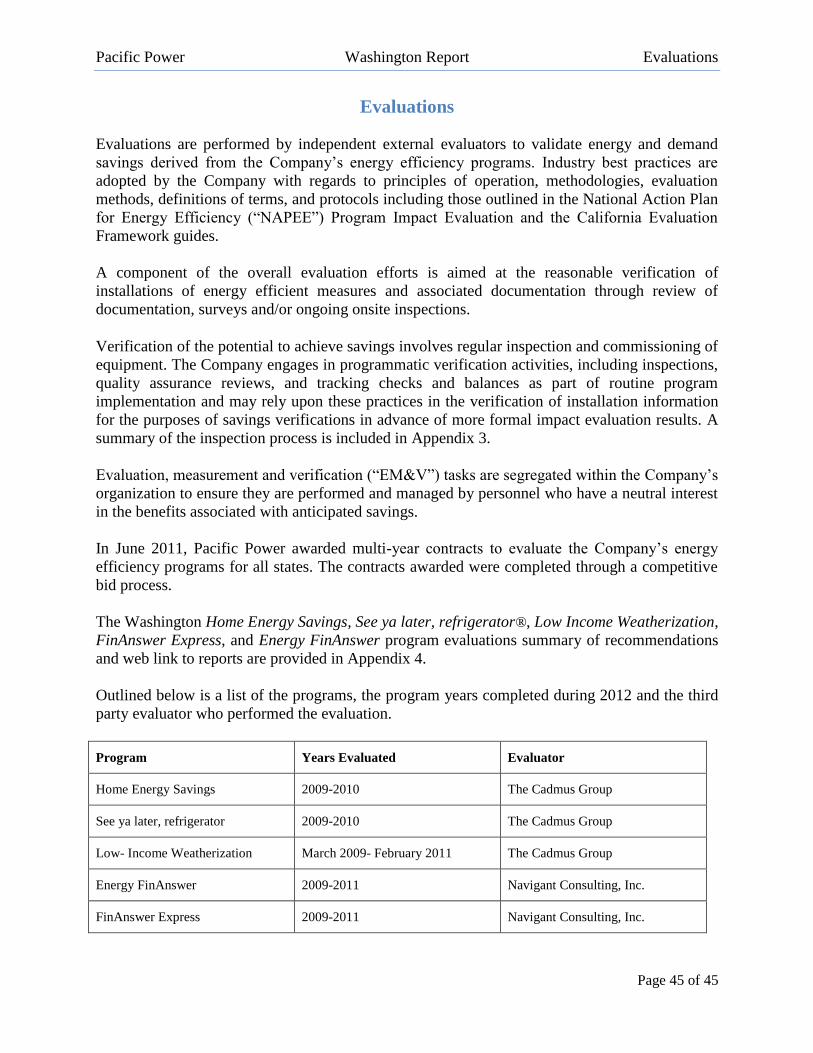
Pacific Power Washington Report Evaluations
Page 45 of 45
Evaluations
Evaluations are performed by independent external evaluators to validate energy and demand
savings derived from the Company’s energy efficiency programs. Industry best practices are
adopted by the Company with regards to principles of operation, methodologies, evaluation
methods, definitions of terms, and protocols including those outlined in the National Action Plan
for Energy Efficiency (“NAPEE”) Program Impact Evaluation and the California Evaluation
Framework guides.
A component of the overall evaluation efforts is aimed at the reasonable verification of
installations of energy efficient measures and associated documentation through review of
documentation, surveys and/or ongoing onsite inspections.
Verification of the potential to achieve savings involves regular inspection and commissioning of
equipment. The Company engages in programmatic verification activities, including inspections,
quality assurance reviews, and tracking checks and balances as part of routine program
implementation and may rely upon these practices in the verification of installation information
for the purposes of savings verifications in advance of more formal impact evaluation results. A
summary of the inspection process is included in Appendix 3.
Evaluation, measurement and verification (“EM&V”) tasks are segregated within the Company’s
organization to ensure they are performed and managed by personnel who have a neutral interest
in the benefits associated with anticipated savings.
In June 2011, Pacific Power awarded multi-year contracts to evaluate the Company’s energy
efficiency programs for all states. The contracts awarded were completed through a competitive
bid process.
The Washington Home Energy Savings, See ya later, refrigerator®, Low Income Weatherization,
FinAnswer Express, and Energy FinAnswer program evaluations summary of recommendations
and web link to reports are provided in Appendix 4.
Outlined below is a list of the programs, the program years completed during 2012 and the third
party evaluator who performed the evaluation.
Program Years Evaluated Evaluator
Home Energy Savings 2009-2010 The Cadmus Group
See ya later, refrigerator 2009-2010 The Cadmus Group
Low- Income Weatherization March 2009- February 2011 The Cadmus Group
Energy FinAnswer 2009-2011 Navigant Consulting, Inc.
FinAnswer Express 2009-2011 Navigant Consulting, Inc.


