1 2012 Budget: An Introduction to the 2012 Budget Mission. Vision and Values The City of Greater Sudbury is a growing, world-class community bringing talent technology and a great northern lifestyle together. We are committed to providing excellent access to quality municipal services and leadership in the social, environmental and economic development. In fulfilling our roles we commit ourselves to providing high quality service with a citizen focus; managing the resources in our trust efficiently, responsibility and effectively; encouraging innovation and accepting risks; maintaining honest and open communication; creating a climate of trust and a collegial working environment; and, acting today in the interests of tomorrow. Toward Fiscal Sustainability Plan Over the next few years, the City will face a number of challenges that required us to rethink some of the ways we work. In 2010, the City tabled the Toward Fiscal Sustainability Plan and laid out priorities and action items to manage fiscal challenges and opportunities. In 2011, Council approved $185,000 of fiscal sustainability proposals that reduced the municipal tax levy. The 2012 budget includes an additional $1 .1 million of fiscal sustainability initiatives that will reduce the municipal tax levy or provide a source of capital funding. Strategic Goals and Strategies The City of Greater Sudbury provides municipal services to approximately 160,000 citizens within its vast geographic boundaries. The broad strategic goals of the organization are: 1 . Healthy Community: Offering a high quality of life to its residents 2. Economic Development: Essential to the future of the community 3. Sustainable Development: Healthy and prosperous future depends on CGS being a sustainable community 4. Focus on Opportunities: Build on its strengths and recognize where opportunities exist to improve the community These broad strategic goals help the City of Greater Sudbury in managing an annual operating budget of in excess of $480 million. The annual budget process is guided by City Council, through the Finance department, and spans seven departments. Each are responsible for overseeing numerous programs and services that keep the City running every day, and provide a great northern lifestyle to residents. Also, included are the City's organizational charts on Appendix A and B.
Transcript
1
0123456789
2012 Budget: An Introduction to the 2012 Budget
Mission. Vision and Values
The City of Greater Sudbury is a growing, world-class community bringing talent technology and a great northern lifestyle together. We are committed to providing excellent access to quality municipal services and leadership in the social, environmental and economic development. In fulfilling our roles we commit ourselves to providing high quality service with a citizen focus; managing the resources in our trust efficiently, responsibility and effectively; encouraging innovation and accepting risks; maintaining honest and open communication; creating a climate of trust and a collegial working environment; and, acting today in the interests of tomorrow.
Toward Fiscal Sustainability Plan
Over the next few years, the City will face a number of challenges that required us to rethink some of the ways we work. In 2010, the City tabled the Toward Fiscal Sustainability Plan and laid out priorities and action items to manage fiscal challenges and opportunities. In 2011, Council approved $185,000 of fiscal sustainability proposals that reduced the municipal tax levy. The 2012 budget includes an additional $1 .1 million of fiscal sustainability initiatives that will reduce the municipal tax levy or provide a source of capital funding.
Strategic Goals and Strategies
The City of Greater Sudbury provides municipal services to approximately 160,000 citizens within its vast geographic boundaries. The broad strategic goals of the organization are:
1 . Healthy Community: Offering a high quality of life to its residents 2. Economic Development: Essential to the future of the community 3. Sustainable Development: Healthy and prosperous future depends on CGS being a
sustainable community 4. Focus on Opportunities: Build on its strengths and recognize where opportunities
exist to improve the community
These broad strategic goals help the City of Greater Sudbury in managing an annual operating budget of in excess of $480 million.
The annual budget process is guided by City Council, through the Finance department, and spans seven departments. Each are responsible for overseeing numerous programs and services that keep the City running every day, and provide a great northern lifestyle to residents. Also, included are the City's organizational charts on Appendix A and B.
2
0123456789
Long Term Financial Policies
In 2002, Council adopted the Long Term Financial Plan and related policies and principles. These principles and policies are used in managing the financial affairs of the City. The nine principles are:
l. Ensure Long Term Financial Sustainability 2. Deliver Services in a Cost-effective and efficient manner 3. Ensure operating revenues are sustainable and Consider Community-wide and Individual
Benefits (Taxes versus User Fees) 4. Meet Social Equity Objectives Through Specific Programs 5. Manage the City's Capital Assets to Maximize Long Term Community Benefit 6. Recognize that funding from Senior levels of Government is a crucial element of fiscal
sustainability 7. Use Debt Financing where appropriate 8. Maintain Reserve and Reserve Funds at appropriate levels 9. Identify and quantify long term liabilities
The financial policies, as well as the action items identified in the 'Toward Fiscal Sustainobility Plan' have been designed to ensure that the City is fiscally sustainable and has sufficient resources to provide the services that the community expects.
Liabilities
Reserves
Debt Financing
Senior Government
Operating and Capital Budgets
Capital Assets
Service Delivery
Sustainable Revenue
Social Equity
The City of Greater Sudbury has two budgets: operating and capital.
The operating budget is used for ongoing costs that recur year after year. These costs are related to the City's day-to-day operation. The largest part of the operating budget is paid to staff who provide City services -like police officers, fire fighters, transit drivers, roads and parks maintenance staff. The operating budgets for services such as these are funded largely by property taxes and user fees. In addition Water and Wastewater, such as clean drinking water and the treatment and disposal of wastewater, are fully supported by user fees.
3
0123456789
The capital budget for one-time costs related to long-term investments that have a useful life, such as roads, bridges, recreation facilities and libraries. This budget is largely funded through contributions from the property tax levy, grants from senior levels of government, and reserves and reserve funds. The capital budget document includes the current year capital projects and the outlook for the next four years.
City's Operating Budget Planning at a Glance
The budget preparation is a three stage process.
The first stage of budget process commences in May of each year, and includes the preparation of a Preliminary Forecast of the upcoming budget and/or Three Year Forecast. This forecast is presented to Council for review and comment.
The second stage of the budget process is prepared and in accordance with the Base Budget Preparation Policy. An analysis is prepared of inflationary pressures such as wage adjustments in accordance with collective bargaining agreements, contract and material price increases. The following price increase assumptions were used to develop the 2012 budget.
• Electricity prices 5% • Natural gas prices- 0% • Inflation- 0%; Note: Consumer Price Index was in excess of 3% however was not applied
due to budget constraints • Water- 5% • Fuel prices have been volatile in the recent past and are difficult to forecast. Therefore, $1 .12
per litre for both diesel and gasoline was assumed, which is a slight increase from 2011 budget.
Operating departments and Finance staff review projected year end actuals against budgets and see if there are any overruns, areas that need more resources to maintain service levels or items that can be cut or reduced while still maintaining service levels. Also, a review of historical trend analysis is performed to verify the accuracy of the budget. Any adjustments are in accordance with the Base Budget Preparation Policy. The budget also reflects any known funding approvals from seniors levels of government or partnerships. Any requests for additional permanent staff must be approved by Council. The program support allocations and internal recoveries are in accordance with OMBI methodology.
A review is also conducted of mandatory pressures, such as, provincially mandated programs and service contracts, costs to service growth, as well as annualization pressures of prior year Council decisions and commitments.
Assessment growth is applied to total pressures to reduce the impact on tax levy requirements.
The 2012 base budget increase would maintain existing service levels and standards, with an inflation based goal.
The final stage of budget review addresses enhancement requests. All enhancement requests, if approved by the CAO, are presented to a Standing Committee for review and referral to the Finance Committee for final approval.
4
0123456789
Approved Budget Steps
The 2012 to 2016 Capital Budget and Outlook was presented to Finance Committee October 5th,
2011.
The 2012 Proposed Operating Budget was tabled to the Finance Committee on November 8th, 2011 . The Finance Committee reviewed the departmental operating budgets at various meetings throughout November and December.
The Finance Committee approved or recommended amendments to the operating budget and budget options throughout the budget process.
The Capital budget was approved by Finance Committee and City Council in December 2011, and the Operating budget in February 2012, after the receipt of the OMPF allocation notice.
Tax Policy and final tax rates will be approved by Council in the Spring 2012.
The Council approved budgets are monitored on a daily and monthly basis by departments. Monitoring and or amendments to the Council Approved Budgets are only made in accordance with Operating Budget Policy or the Capital Policy.
Reserve and Reserve Funds
The City maintains reserve and reserve funds in accordance with the Reserve and Reserve Fund Bylaw. They are a critical component of a municipality's long-term financing plan. The purpose for maintaining reserves, is to:
.. Provide stability of tax rates in the face of variable and uncontrollable factors (consumption, interest rates, unemployment rates, changes in subsidies)
.. Provide financing for one-time or short term requirements without permanently impacting tax and utility rates
.. Make provisions for replacements/acquisitions of assets/infrastructure that are currently being consumed and depreciated
.. Avoid spikes in funding requirements of the capital budget by reducing their reliance on long-term debt borrowings
.. Provide a source of internal financing
.. Ensure adequate cash flows
.. Provide flexibility to manage debt levels and protect the municipality's financial position
.. Provide for future liabilities incurred in the current year but paid for in the future
Reserves offer liquidity which enhances the municipality's flexibility, both in addressing unplanned operating requirements and in permitting the municipality to temporarily fund capital projects internally. The level of reserves and reserve funds is a key measure of the financial health of a municipality.
5
0123456789
The following is the historical trend in the City's Reserve and Reserve Funds:
$105,000
$90,000
$75,000
$60,000
$45,000
$30,000 $15,000
$0 2002 2003 2004 2005 2006 2007 2008
• Reserves • Reserve Funds
2009 2010
The City of Greater Sudbury's Reserve and Reserve Funds have increased since 2002 from $62,703 to $91,640 at the end of 201 0. However, compared to other municipalities in Ontario, the City is below the median as it pertains to reserves and reserve funds as a percentage of total taxation, as identified in the 2010 BMA municipal study.
Long Term Debt
One of the principles in the Long term financial plan, states that debt financing should be used, where appropriate. More specifically, debt financing should only be considered for:
... Programs and facilities which are self-supporting; and
... Projects where the cost of deferring expenditures exceeds debt servicing costs
The City's debt interest as a percentage of Revenues was 0.5%, and well below the 201 0 BMA Study median of 1 . 1 %.
6
0123456789
Five Year Historical Trend Analysis
2007 to 2011 and 2012 Approved Budget
The difference between total expenditures and revenues, is the municipal tax levy. This is the amount required to be raised by property taxes to ensure a balanced budget.
As illustrated in Appendix C and D, the City's Gross Budget has decreased to $486 million for 2012. The decline is mainly attributed to the Provincial uploading of Ontario Drug Benefits, Ontario Disability Support Program, and a corresponding decrease in Provincial Grant revenues occurred. These reductions were off set by increases in salaries and benefits expenses, in accordance with contractual obligations, energy costs, increased investments in capital and general inflation requirements, and Council approved initiatives and service enhancements.
The composition of the 2012 Gross Budget is as follows:
Capital Res $70M
Purchased/Cant Services $101M
Material& Operating
$28 Energy$20M
Salaries & Benefits $213M
Appendix E provides the definitions for the expenditure and revenue categories.
2007 to 2011 Historical Staffing and 2012 Approved Staffing Levels
Appendix F, illustrates the historical full-time positions. In accordance with the base budget preparation policy, any increase to full time positions must be approved by Council.
Since 2007, full time positions increased by 160. The increases are primarily attributed to Pioneer Manor, Regional Geriatric Program, Children Services, Roads operations, transit ridership initiatives, building services, and planning and development. A number of these full time positions were funded from Provincial Grants or conversion of temporary hours to permanent positions. In addition, Police Services full time positions increased by 14 since 2007.
7
0123456789
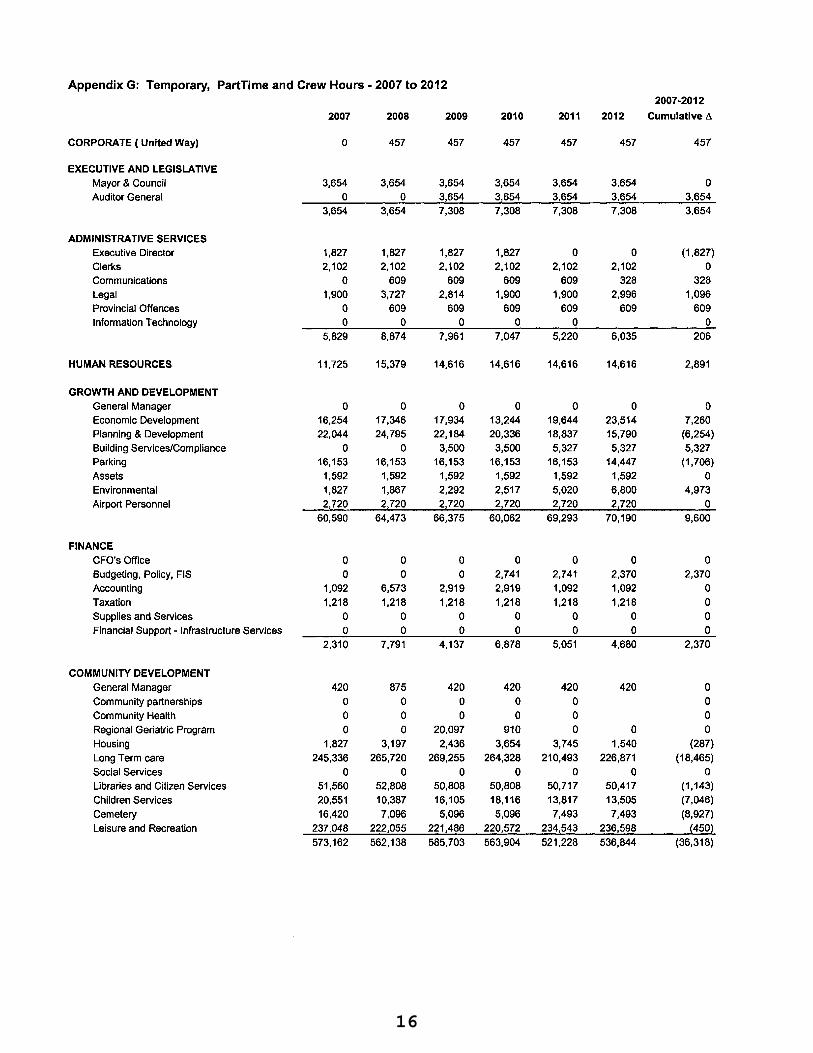
Appendix G illustrates the historical budgeted part time and temporary hours. In accordance with the base budget preparation policy, any increase in part time or temporary hours must be funded by a offsetting savings or revenues, unless otherwise approved by Council or Committee.
Since 2007, part time and temporary hours increased by 49,104, from 967,766 to 1,019,930. The majority of the increase is attributed to the roads and water wastewater operations work plan, economic development programs, and hours required for land ambulance services. These increases are offset by the reductions in community development as a result of temporary to full time conversions.
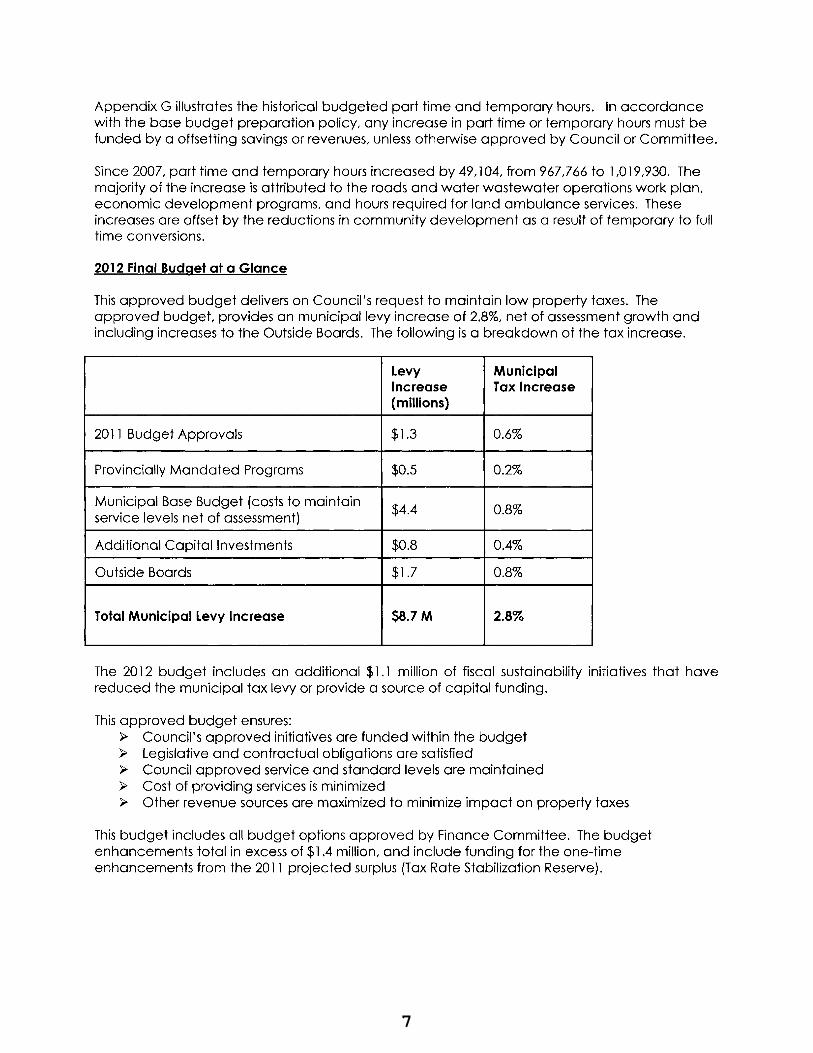
2012 Final Budget at a Glance
This approved budget delivers on Council's request to maintain low property taxes. The approved budget, provides an municipal levy increase of 2.8%, net of assessment growth and including increases to the Outside Boards. The following is a breakdown of the tax increase.
Levy Municipal Increase Tax Increase (millions)
2011 Budget Approvals $1.3 0.6%
Provincially Mandated Programs $0.5 0.2%
Municipal Base Budget (costs to maintain $4.4 0.8%
service levels net of assessment)
Additional Capital Investments $0.8 0.4%
Outside Boards $1.7 0.8%
Total Municipal Levy Increase $8.7M 2.8%
The 2012 budget includes an additional $1.1 million of fiscal sustainability initiatives that have reduced the municipal tax levy or provide a source of capital funding.
This approved budget ensures: »- Council's approved initiatives are funded within the budget )o> Legislative and contractual obligations are satisfied )o> Council approved service and standard levels are maintained » Cost of providing services is minimized )o> Other revenue sources are maximized to minimize impact on property taxes
This budget includes all budget options approved by Finance Committee. The budget enhancements total in excess of $1 .4 million, and include funding for the one-time enhancements from the 2011 projected surplus (Tax Rate Stabilization Reserve).
8
0123456789
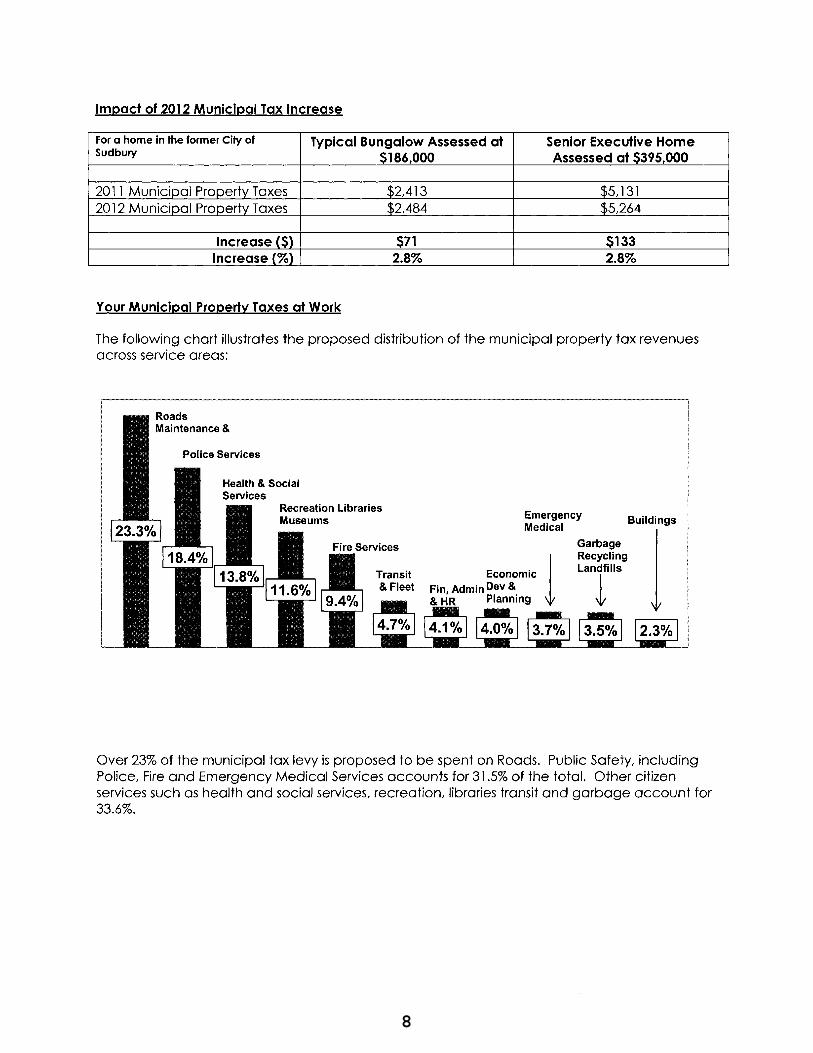
Impact of 2012 Municipal Tax Increase
For a home In the former City of Typical Bungalow Assessed at Senior Executive Home Sudbury $186,000 Assessed at $395,000
2011 Municipal Property Taxes $2,413 $5,131 2012 Municipal Property Taxes $2,484 $5,264
Increase($) $71 $133 Increase(%) 2.8% 2.8%
Your Municipal Property Taxes at Work
The following chart illustrates the proposed distribution of the municipal property tax revenues across service areas:
Recreation Libraries Emergency Medical
Economic l Fin Admin Dev &
' Planning
Garbage Recycling Landfills
t
Buildings
Over 23% of the municipal tax levy is proposed to be spent on Roads. Public Safety, including Police, Fire and Emergency Medical Services accounts for 31.5% of the total. Other citizen services such as health and social services, recreation, libraries transit and garbage account for 33.6%.
9
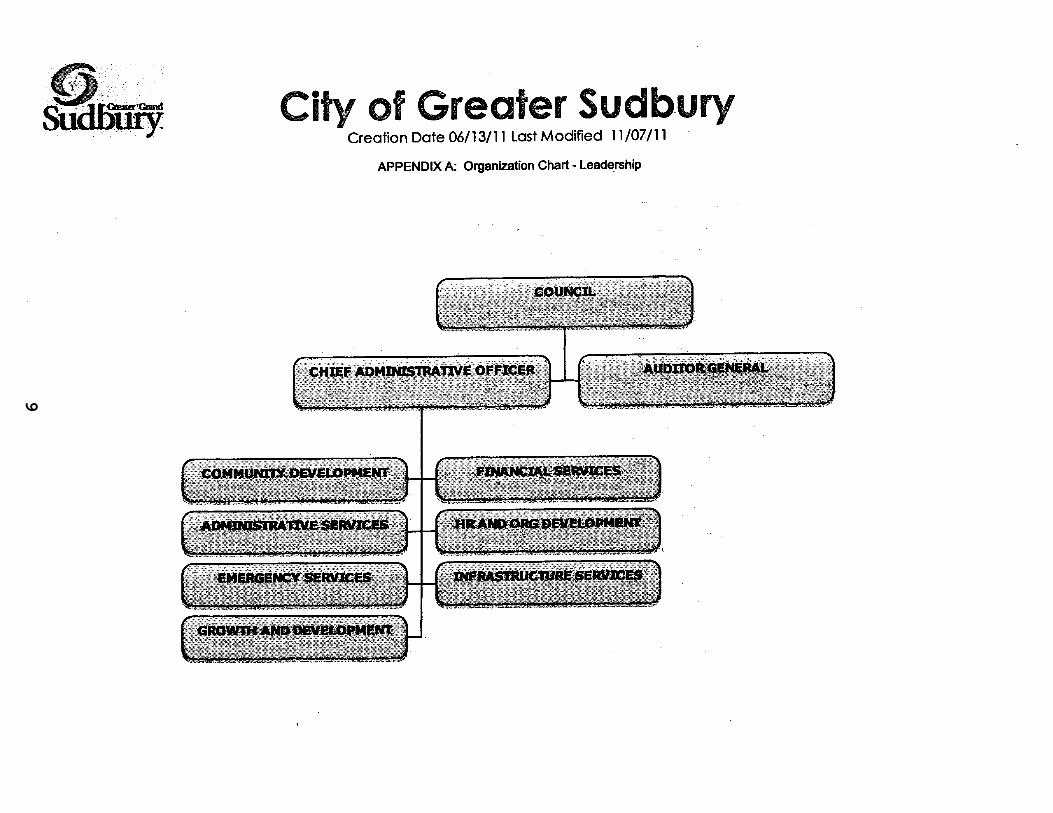
0123456789 City of Greater Sudbury
Creation Date 06/13/11 Last Modified 11/07/11
APPENDIX A: Organization Chart - lead~rship
10
0123456789
q,,~··~: Su ury City of Greater Sudbury Creation Dote 06/13/11 Last Modified 11/07/ ll
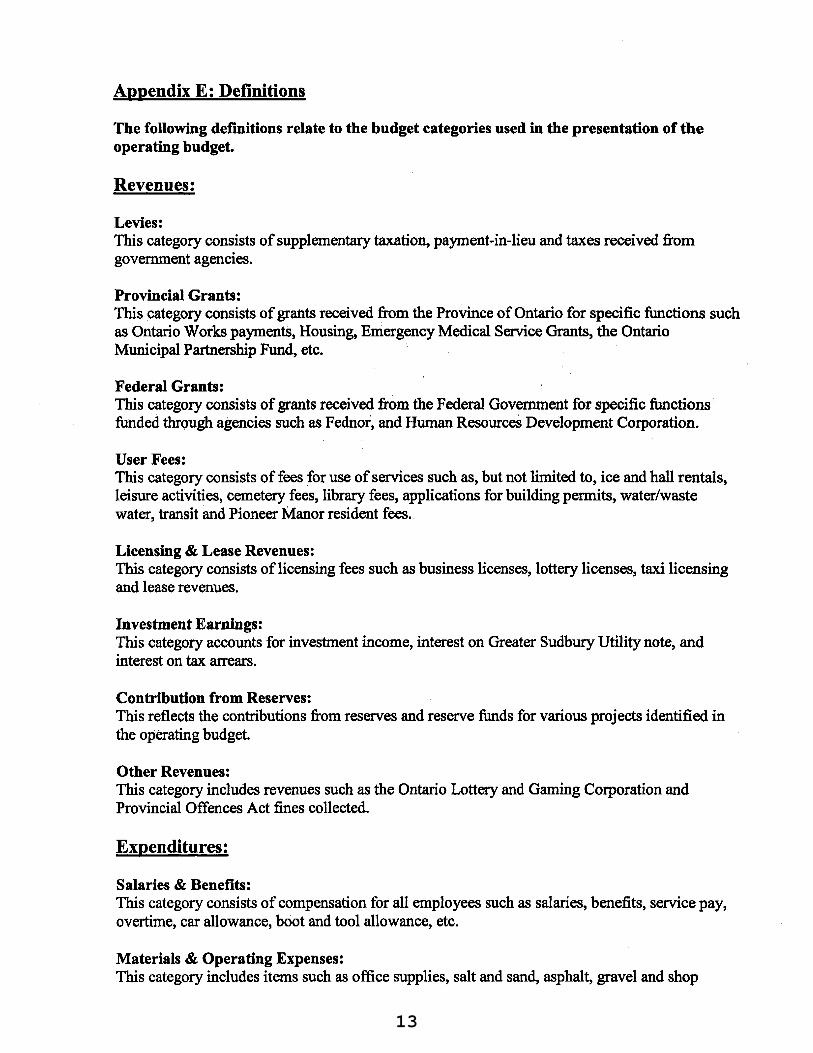
The following defmitions relate to the budget categories used in the presentation of the operating budget.
Revenues:
Levies: This category consists of supplementary taxation, payment·in-lieu and taxes received from govenunent agencies.
Provincial Grants: This category consists of grants received from the Province of Ontario for specific functions such as Ontario Works payments, Housing, Emergency Medical Service Grants, the Ontario Municipal Partnership Fund, etc. ,
Federal Grants: This category consists of grants received from the Federal Government for specific functions funded through agencies such as Fednor, andHUIIlan Resources Development Corporation.
User Fees: This category consists of fees for use of services such as, but not limited to, ice and hall rentals, leisure activities, cemetery fees, library fees, applications for building permits, water/waste water, transit and Pioneer Manor resident fees.
Licensing & Lease Revenues: This category consists of licensing fees such as business licenses, lottery licenses, taxi licensing and lease revenues.
Investment Earnings: This category accounts for investment income, interest on Greater Sudbury Utility note, and interest on tax arrears.
Contribution from Reserves: This reflects the contributions from reserves and reserve funds for various projects identified in the operating budget.
Other Revenues: This category includes revenues such as the Ontario Lottery and Gaming Corporation and Provincial Offences Act fines collected.
Expenditures:
Salaries & Benefits: This category consists of compensation for all employees such as salaries, benefits, service pay, overtime, car allowance, boot and tool allowance, etc.
Materials & Operating Expenses: This category includes items such as office supplies, salt and sand, asphalt, gravel and shop
14
0123456789
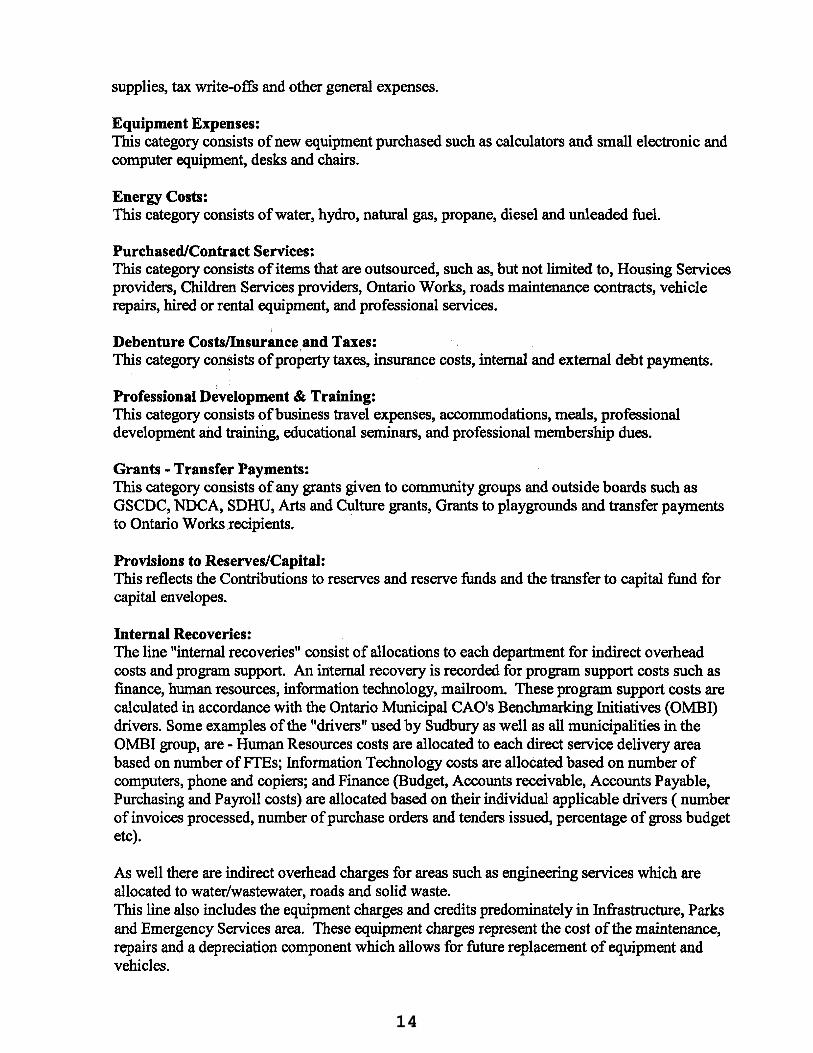
supplies, tax write-offs and other general expenses.
Equipment Expenses: This category consists of new equipment purchased such as calculators and small electronic and computer equipment, desks and chairs.
Energy Costs: This category consists of water, hydro, natural gas, propane, diesel and unleaded fuel.
Purchased/Contract Services: This category consists of items that are outsourced, such as, but not limited to, Housing Services providers, Children Services providers, Ontario Works, roads maintenance contracts, vehicle repairs, hired or rental equipment, and professional services.
Debenture Costs/Insurance and Taxes: This category consists of property taxes, insurance costs, internal and external debt payments.
Professional Development & Training: This category consists of business travel expenses, accommodations, meals, professional development and training, educational seminars, and professional membership dues.
Grants - Transfer Payments: This category consists of any grants given to community groups and outside boards such as GSCDC, NDCA, SDHU, Arts and Culture grants, Grants to playgrounds and transfer payments to Ontario Works recipients.
Provisions to Reserves/Capital: This reflects the Contributions to reserves and reserve funds and the transfer to capital fund for capital envelopes.
Internal Recoveries: The line "internal recoveries" consist of allocations to each department for indirect overhead costs and program support. An internal recovery is recorded for program support costs such as finance, human resources, information technology, mailroom. These program support costs are calculated in accordance with the Ontario Municipal CAO's Benchmarking Initiatives (OMBI) drivers. Some examples of the "drivers" used by Sudbury as well as all municipalities in the OMBI group, are - Human Resources costs are allocated to each direct service delivery area based on number ofFTEs; Information Technology costs are allocated based on number of computers, phone and copiers; and Finance (Budget, Accounts receivable, Accounts Payable, Purchasing and Payroll costs) are allocated based on their individual applicable drivers (number of invoices processed, number of purchase orders and tenders issued, percentage of gross budget etc).
As well there are indirect overhead charges for areas such as engineering services which are allocated to water/wastewater, roads and solid waste. This line also includes the equipment charges and credits predominately in Infrastructure, Parks and Emergency Services area. These equipment charges represent the cost of the maintenance, repairs and a depreciation component which allows for future replacement of equipment and vehicles.
15
0123456789
APPENDIXF: Full Time Positions· 2007 to 2012 2007-2012
TOTAL Part Time, Temporary and Crew Hours 967,766 1,018,232 1,049,857 1,008,450 1,000,078 110191930 49,104
18
0123456789
AFFS
AHP
AODA
CAO
CCAC
CEMC
CGS
CIO
CLELC
CMI
C.O.P.
esc EMS
ERP
FTE
GIS
GPS
GSDC
GSHC
GSU
HIFIS
HPS
HR
HR/OD
IT
KM
LICO
LTC
MER
MFIPPA
MMMS
MNDMF
MOE
MPAC
MPMP
NDCA
NOSOA
OACP
OCTA
ODSP
OGRA
OMBI
OM BITS
OMERS
OMPF
OTMP
PAP
PERC
POA
V.E.
woo wwvv YTD
2012 Operating Budget Acronyms
Airport Fire Fighting Services
Affordable Housing Program
Access for Ontarians with Disabilities Act
Chief Administrative Officer
Community Care Access Centre
Community Emergency Management Co-ordinator
City of Greater Sudbury
Chief Information Ofllcer
Centre Lionel E. Lalonde Centre
Case Mix Index
Citizens on P•trol
Cltlztm Service Centre
E.,-.ergency Med~l Services
Enterprise Resource Planning' System
F,~;~ll Time Equivalent
G~raphkllnformation System
Global Positioning System
GreaterSud~ury' Development Corporation
Greater Sudbury Housing Corporation
Greater Sudbury Utilities
Homeless Individuals and Families Information System
Homelessness Partnering Strategy
Human R&sources
Human Resources I Organizational Development
Information ·TeChnology
Kilometer
Low Income Cut-Off
Long Term Care
Management Expense Ratio
Municipal Freedom of Information & Protection of Privacy Act
Municipal Maintenance Management System
Ministry of Northam Development, Mines, Forestry
Ministry of the Environment
Municipal Property Assessment Corporation
Municipal Performance Measurement Program
Nickel District Conservation Authority
Northam Ontario School of Architecture
Ontario Association Chiefs of Pollee
Ontario Community Transport Association
Ontario Disability Support Program
Ontario Good Roads Association
Ontario Municipal CAO's Benchmarking Initiative
Ontario Municipal Benchmarking Initiative
Ontario Municipal Employees Retirement System
Ontario Municipal Partnership Fund
Ontario Tourism Marketing Partnership
Pre-authorized Payment
Parking Excellence Recognized in Canada Program
Provincial Offences Act
Valley East
Waste Diversion Ontario
Water Waste Water
Year To Date
1
0123456789
Ontario Municipal Benchmarking Initiative
OVERVIEW
Performance Measurement at the City of Greater Sudbury
Over the past decade, the City of Greater Sudbury has participated in .tWo comprehensive benchmarking initiatives. Both the Municipal Performance Merasurement Program (MPMP) and Ontario Municipal CAOs Benchmarking Initiative {OMBI} are based upon well-developed methodologies~ Performance. Measurement is more than data gatherin,g; a fully implemented program incorporates analysis of results in order to determine opportunities for performance improvement.
The City of Gre~ter Sudbury'focuses'its,corporate performance measurement efforts o~ these two. programs, Which are mostly}~Cl.JSed Q.nOntario ni~ni~lpal:fies, and does not participate :in· other multj:.jurisdictional benchmarking·, initiatives. In addition, the City belongs tq Se'{eral; industry-specific .argani~atidns,, which cqllabordtively .. compile and analYze benchmarking data to determine where service improvements can be made. Among these: Ontario Good Roads Association (OGRA), Ontario Community Transport Association (OCTA), and Ontario Association of Chiefs of Police (OACP).
Municipal Performance Measurement Program (MPMP):
• Provincially mandated (mandatory); • Covers twelve ( 12) service areas, with 86 separate effectiveness and efficiency
measures. • Report to Citizens is posted each September on the City's website.
Ontario Municipal CAOs Benchmarking Initiative (OMBI):
• A voluntary collaboration of 14 Ontario municipalities (representing more than 70% of province's population) plus two larger non-Ontario cities (Calgary and Winnipeg);
• Covers thirty~seven (37) service areas, with more than 800 measures collected (includes the MPMP measures);
• OMBI's annual Performance Benchmarking Reports are posted on City's website.
MPMP and OMBI reports are made available to citizens on the City's website, at http://www.greatersudbury.ca/cms/index.cfm?app=mpmp&lang=en .
2
0123456789
Ontario Municipal Benchmarking lnttiative
WHAT IS BENCHMARKING?
Performance Measurement at the City of Greater Sudbury
Benchmarking provides an objective, measurable way to determine how well a municipality is performing. It provides an established point of reference against which performance can be measured a!')d compared. Result trends can be examined over several years and compared to other municipalities' results, to gain a better understanding of the information and to.identify best or better practices to enhance service delivery to citizens.
The OMBI. ?a to-set methodology comprises four differe~t types of measures: Community lmpa~t,Service Levei,.Ef~~ie7cy,.and Customer.Se.rvic.e. Reviewing the results in several measure types, in p serv!ce area, provides more context than one measure alone can provide, and helps to assess performance and outcomes.
ANALYSIS OF RESULTS:
Performance measurement results can provide valuable insights, and translate into 'rewards' for our citizens, when that data is comprehensively analyzed to determine viable service delivery alternatives. A key benefit of benchmark activities .such as MPMP and OMBI is the opportunity for service experts to candidly exchange ideas and experiences on different service delivery methodologies. Subsequent deeper analysis can determine the feasibility of applying the processes locally.
Unique environmental and policy factors exist in each municipality that can impact the results. While performance measures can enhance understanding of service outcomes and aid the determination of where resources might be applied to improve service levels, caution should be exercised when drawing conclusions based only upon the measures. Comparing results between municipalities should include review of influencing factors that provides context to the variation in results achieved.
Benchmark data continues to support efforts to Rethink, Refocus, Rebalance Initiative on Fiscal Sustainability. During the past year, performance measurement results. helped pin-point several service areas for more comprehensive review. In selecting analysis projects, consideration is given to factors such as: the 3-year trend-line in the City's results (on its own and as compared to OMBI median}; extent to which the area is funded by the tax levy; and whether and to what extent the benefit of a service delivery change is quantifiable. Some lessons learned during the course of analysis projects in the past year:
)- While the number of POA (Provincial Offences) tickets processed by each staff continues to be at the low end of OMBI peer group, the section has refined its
3
0123456789
OI1IBits Ontario Municipal Benchmarking Initiative
Performance Measurement at the City of Greater Sudbury
paper filing practices based upon input from peers. As well, more specialization of tasks is being attempted to improve efficiencies, to the extent possible with a relatively small staff complement as compared to other POA offices.
> Freedom of Information (MFIPPA) requests: Based on a review of the high number of MFIPPA requests compared to other municipalities, a new process was identified·for Building Services.requests.
> Methods of tracking By-law Enforcement activities, including on-s.ite inspections to. confirm .infractions· and subsequent adher~nce, ,is ~eing r~fin~d to better determine whet~er; ~h,e nl;Jmber of ~isits is. nec,essa~Y .• reasonable and. cost.:. effective,, d~pending upo'l the type of by-law being enforced ..
The GOnch!Jsions. reachedJrom analysis projects can support internal proc;essreviews, decision-making, and, in cases of substantive change or opportunities, will inform reports to Council.
PERFORMANCE MEASUREMENT DATA IN 2012 BUDGET DOCUMENT:
Performance measurement data is located in the Supplementary pages of applicable cost centres. Multi-year OMBI results, CGS and median, are provided.
All OMBI performance measurement data quoted.in the 2012 Budget document is current as of the date indicated on the individual tables.
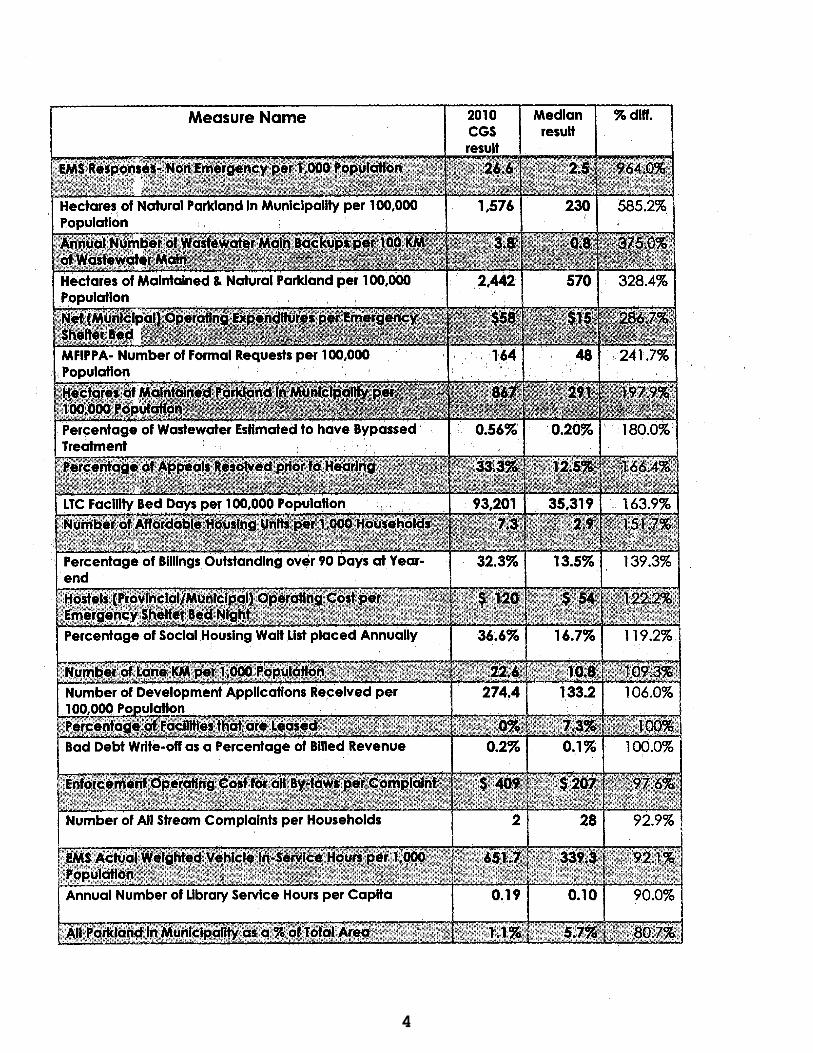
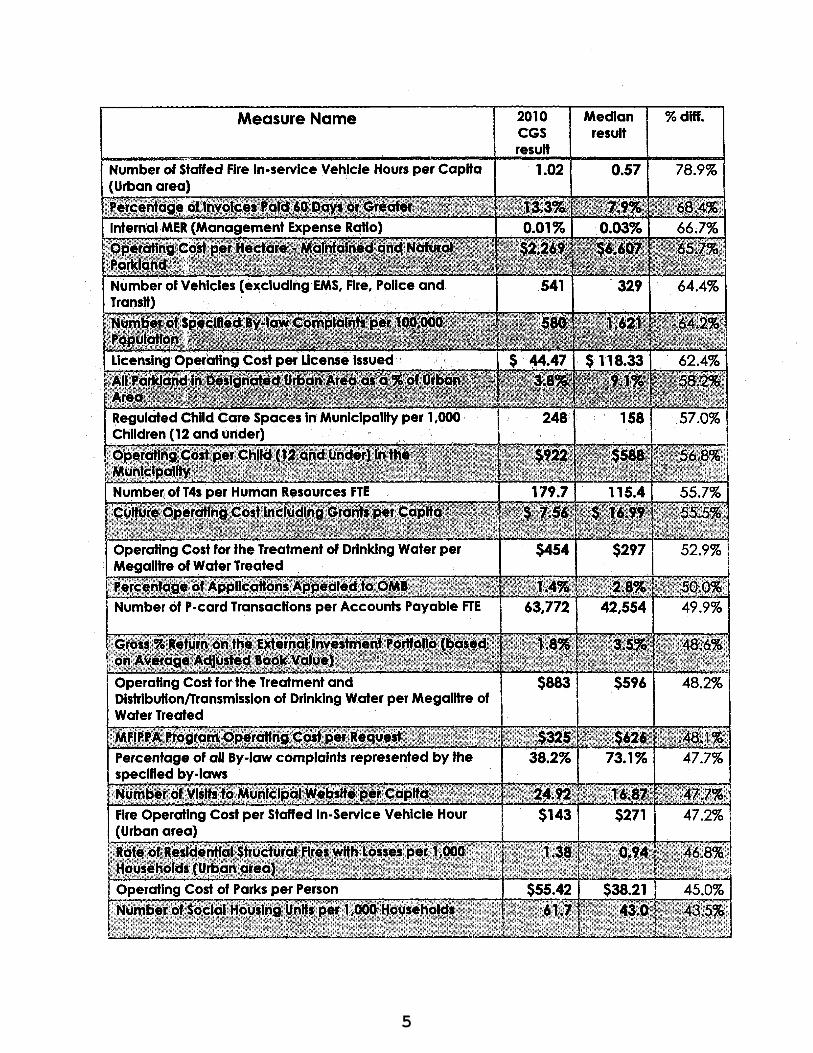
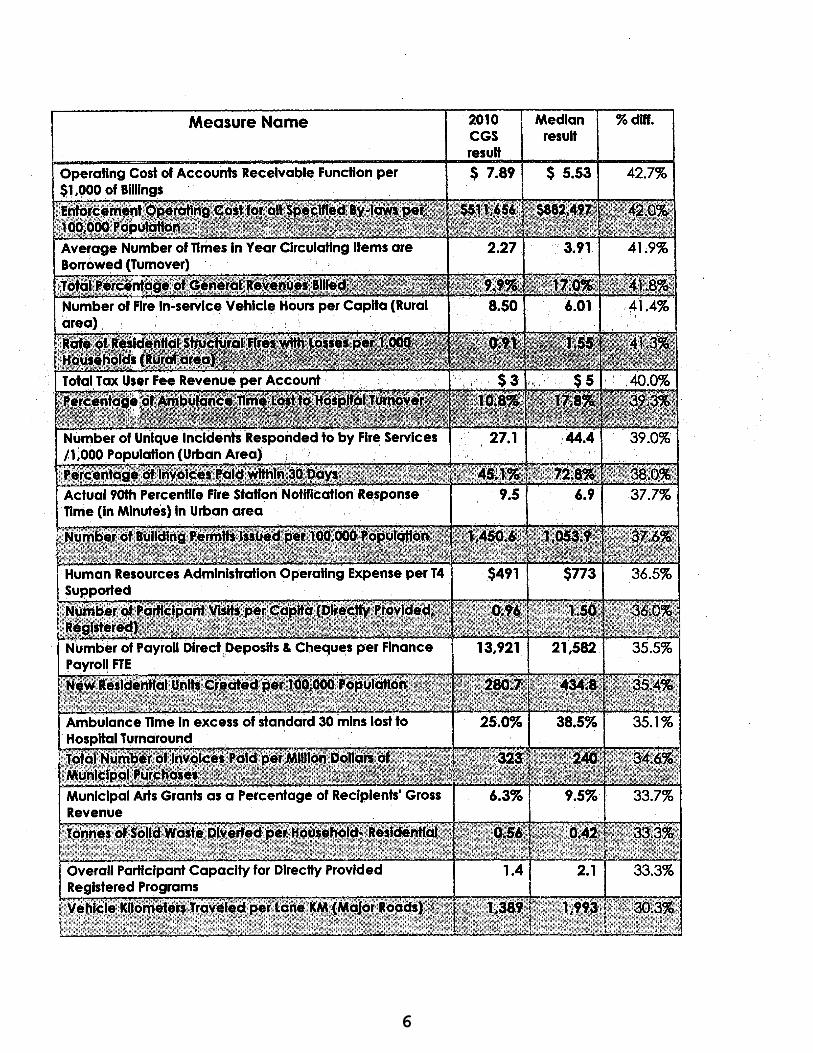
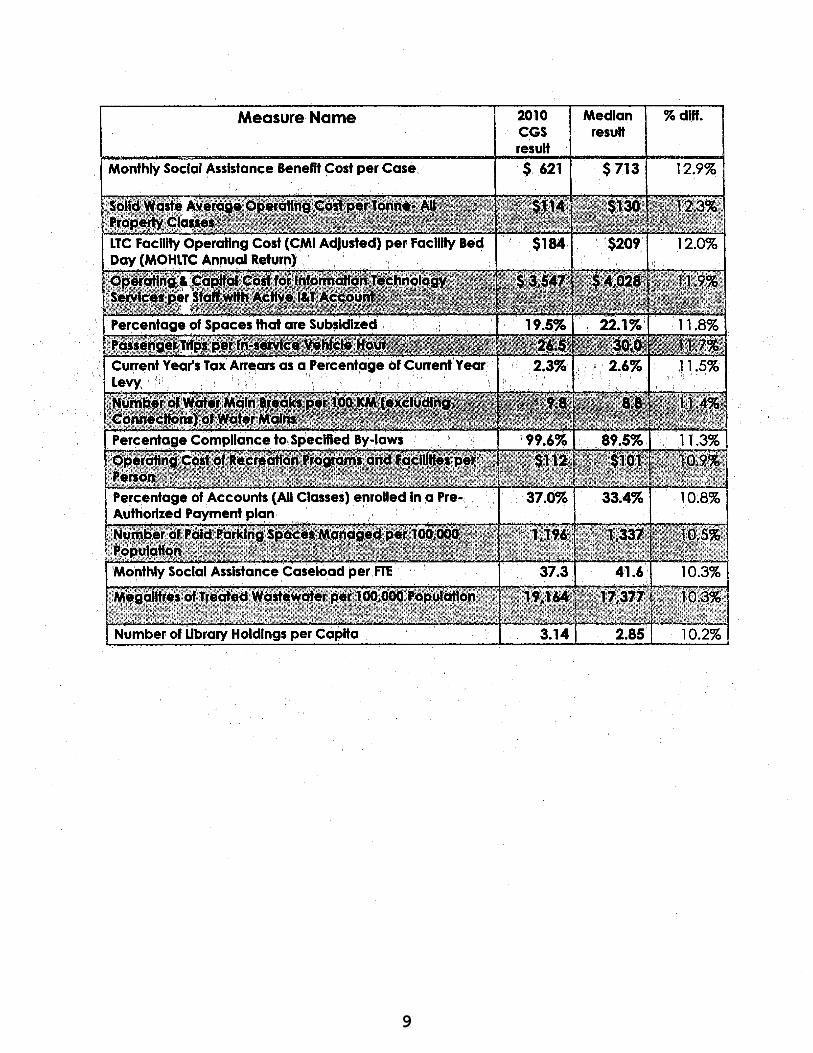
Commencing on the. next page is a listing of those OMBI-designated Priority Measures for which the 201 0 CGS result differed from the median of OMBI peers, in absolute terms, by greater than 10%. Whether CGS' result .is .. better" or "worse" than the OMBI peer median is dependent in part on the reader's interpretation of the results.
The list is intended as a guide only to potential analysis projects. No one OMBI measure in isolation provides a complete picture of performance, which is why OMBI strives to include the four measure types in each service area. (The results on the list are current as at July 14, 2011.)
For further information about OMBI and MPMP, contact: Sue McCullough, Co-ordinator of Quality & Performance Initiatives
4
0123456789
Measure Name Median result
ex, dlff.
5
0123456789
Measure Name
Number of Staffed Fire In-service Vehicle Hours per Capita (Urban area)
2010 Median % diff. CGS result resuH
1.02 0.57 78.9%
6
0123456789
Measure Name
Operating Cost of Accounts Receivable Funcflon per $1,000 of Billings
2010 Median % diff. CGS resuH result
$ 7.89 $ 5.53 42.7%
7
0123456789
Measure Name
Development Planning Applications Operating Cost per Application Received
2010 Median % dlff. CGS result resuH
$4,618 $6,548 29.5%
8
0123456789
Measure Name 2010 Median % dlff. CGS result result
Average Nightly Number of Emergency SheHer Beds 45.31 37.62 20.4% Available 100,00() Population
9
0123456789
Measure Name 2010 Median % dlff. CGS result result
Monthly Social Assistance Benefit Cost per Case $ 621 $713 12.9%
1
0123456789
the: next few years. the City will a nurnber
of til at will require us to rethink some of
the ways we work. As an organization. this is a call
to action to ensure that we conti11ue to deliver the
excelle11t services we provide. It 1s a11 opportunity
The City of Greater Sudbury I Toward Fiscal Sustainability
Fiscal Sustainability - Generate reliable and predictable revenues sufficient
to meet current and future expenses - Build and replace capital assets to support CitYs
infrastructure requirements - Provide expected level of municipal services efficiently and effectively
-Achieve stability in property taxes increases and intergenerational equity
- Ensure sound financial management and health
The Challenges - Need for additional capital funding; - Ontario Municipal Partnership Fund Grant at risk; - Desire to maintain low property taxes; -Program expansion and growth-related expenditures; - Council priority projects;
Strategic Documents - Healthy Community Strategy - Official Plan -Digging Deeper: Economic Strategic Plan - Long-Term Financial Plan
Figure 1
There is no doubt the challenges are significant, but fiscal sustainability is achievable by looking to the City's Long-Term Financial Plan (LTFP}, which was approved by Council in 2002 and is a foundational document of the City of Greater Sudbury.
The LTFP is designed to be flexible and adaptable; it fits within the framework of established strategic plans, and ~
it works to promote a healthy and sustainable service delivery model for our community.
Much of the groundwork has already been completed to determine a way forward for our corporation. The LTFP identifies nine key principles that promote a strategic review of corporate practices. Progress has already been made in many areas but there is more to be done to realign budget expectations, refocus activities and streamline operational priorities and procedures.
The next step is to integrate identified priorities and action items within a corporate-wide business strategy that will target the following areas:
- cost efficiencies and service delivery - revenue streams, - capital assets, - social equity objectives, - government partnerships, - debt financing,
reserves and quantification of long-term liabilities.
Your municipality is prepared to manage fiscal challenges. Action items have been identified for short, medium and long-term implementation and delivery. A regular business cycle will invite ongoing review, management and creative solutions. (figure 1) Regular updates to Council and citizens have been built into the cycle to ensure transparency and accountability.
While the following action ttems are directed to corporate practices, long-term sustainability of our City as a whole rests with each of us. Collectively, we must adopt a new perspective that requires us to rethink, refocus and rebalance our fiscal outlook.
Rethink I Refocus I Rebalance
3
0123456789
The City of Greater Sudbury I Toward Fiscal Sustainability
Key Principles and Action Items
1 Ensure long-term • financial sustainability
• Regular review of the C~t¥'s finances • Prepare regular budget variance reports • Update Long-Term Financial Plan
and multi-year forecasts • Implement DMdend Policy with
Greater Sudbury Utilities Inc. • Update financial policies and processes, including:
- operating budget polic.y - capital bUdget policy - procure to pay process reviews
2 Deliver services in a cost-effective • and efficient manner
• Review shared or common services to find synergjes
5 Manage the City's capital • assets to maximize long-term
community benefit
• Implement recommendations from the Green Space Advisory Panel and dispose of surplus parkland
• Identify and dispose of underutilized land • Review fleet to identify and
implement efficiencies • Identify and dispose of surplus equipment
and assets • Identify municipal facilities for potential
consolidation or disposal • Update Long-Term Cspital Financing Plan and
recommend options to achieve sustainability
• Review benchmarking indicators to identify 1\~. ~· areas where improvements can be made \l,
• Identify efficiencies in cost and service delively in "" '~~ each department and develop proposals "'-, , , \~\
• Review operating contracts to identify savings ',, \~ • Ensure city is maximizing value of "-, '~
human resources --......., \ .. , ~
• Implement Green IT strategy --. :~ ... .., ""' ..... , \ ~ Investigate options for energy manageme~=~-':::~ ;\;"~ Revisit corporate program support costs, ··~- ......._ ··~ ', \:\ Including fleet rental rates ._ __ ~, , \
• Review results of Auditor General reports --and Implement recommendations --·~=-=--=
3 Ensure operating revenues • are sustainable and consider
community-wide and individual benefits
• lden'l:ifY opportunities to increase revenue streams
• Explore service provision to other municipalities to increase revenues
• Enhance tax collection efforts for failed tax sales
4 Meet social equity objectives • through specific programs
• Identify grants to community groups across the organization and standardize process for approval, streamlining and monitoring
• lden'l:ifY aCtivities that can and should be aligned with existing corporate strategies such as the healthy community strategy to promote social and environmental well-being Integrate the Healthy Communities Strategy in financial decision making processes
I I I I.
~
Rethink I Refocus I Rebalance
6 Recognize that funding from • senior governments is a crucial
element of financial sustainability
• Develop business case to support maintaining or increasing the Ontario Municipal Partnership Fund grant
• Allocate the Federal Gas Tax grant to eligible funding envelopes (2011- 2014)
• Continue to lobby provincial and federal partners for grants
7 Use debt financing • where appropriate
• Investigate use of debt financing in financial plans for specific projects
8 Maintain reserves and reserve • funds at appropriate levels
9 Identify & quantify • long~tenn liabilities
• Report long-term liabilities to Council on an annual basis
4
0123456789
FISCAL SUSTAINABILITV:
Included in the Included in 2012 Fiscal Sustainability Options 2011 Final Budget Final Budget
Snowplowing of Municipal Facilities $ 33,500
Snowplowing of Parking Lot Facilities* $ 54,874
Advertising $ 75,000
Increase in Consent Application Fees $ 48,400 $ 24,200
Increase in Overnight Parking $ 8,800 $ 17,600
Increase the Parking Fine Structure $ 93,600
Winter control standby $ 60,000 $ 60,000
Hire part time paralegals/reduce contract costs $ 19,000
New user fee for construction dump sites $ 2,100
Increase fees for culvert replacements and resets $ 26,000
Increase entrance permit fees $ 8,400
Hire a full time Custodian for Lionel E Lalonde Centre $ 25,366
Implement a new user fee for firefighter recruitment $ 6,000
Subtotal committed from 2011 $ 185,066 $ 377,774
Other Fiscal Sustainability Options identified in 2011 Budget (Medium and Long· Term)
Parking Revenue- Building services to pay parking for vehicles* $ 16,500
Reduction of Leased Vehicles $ 120,000
Fleet Vehicle Reductions (26) $ 35,700
Mailroom Reorganization $ 10,000
Subtotal Other Options Implemented in 2012 $ 182,200
FISCAL SUSTAINABILITY REDUCTIONS IMPLEMENTED (IN BASE BUDGET) $ 185,066 $ 559,974
Increase Parking Revenue * $ 424,310
Increase in Planning Fees (consent application/site inspections) $ 91,000
TOTAL FISCAL SUSTAINABILITY REDUCTIONS $ 1,075,284
CONSISTS OF:
*FISCAL SUSTAINABILITY REVENUE TO BE CONTIBUTED TO PARKING RESERVE $ 495,684
FISCAL SUSTAINABILITY REDUCTIONS TO THE TAX LEVY $ 579,600
$ 1,075,284
1
0123456789
2012 Operating
Budget
Full Time Positions
Crew Hours
Overtime Hours
Part Time Hours
Volunteers
Revenues
Levies
Provincial Grants & Subsidies
Federal Grants & Subsidies
User Fees
licensing & Lease Revenues
Investment Earnings
Contr from Reserve and Capital
Other Revenues
Total Revenues
Expenses
Salaries & Benefits
Materials Operating Expenses
Equipment Expenses
Energy Costs
Purchased/Contract Services
Debenture & Insurance Costs
Prof Development & Training
Grants • Transfer Payments
Contr to Reserve and Capital
Internal Recoveries
Total Expenses
Net Budget
Description
Less: Assessment Growth
Tax Increase
(11,850,960)
(131,296,404)
(839,933)
(93,630,316)
(3, 718,180)
(11,481,174)
(7,854,855)
(12,260,039)
(272,931 ,861)
205,223,175
27,627,373
1,805,655
18,574,227
101,235,781
8,853,208
1,562,617
41,686,907
67,380,645
(658,169)
473,291,419
200,359,558
All Current Departments
2,006 2,008
187,778 191,226
26,213 26,120
812,300 828,704
335 335
(10,309,768) (10,295,174)
(131 ,328,524) (131,225,712)
(994,134) (1,011 ,299)
(92,326,968) (95,319,216)
(3,770,990) (3,710,737)
(9,165,417) {9,562,872)
(7,784,860) (4,369,815)
(12,641,177) (12,492,153)
(268,321,778} (267 ,986,978)
205,558,336 213,392,964
27,938,021 27,797,065
1,618,787 1,789,408
18,806,016 20,199,194
102,459,763 99,699,295
8,546,944 8,633,604
1,566,406 1,619,914
41,890,779 . 42,922,996
65,807,787 68,129,738
(698,809) (956,087)
473,494,030 483,228,092
205,172,252 215,241,114
0.1 0 2,008 0.1
1.8 5 191,231 1.8
(0.4) 40 26,160 (0.2
2.0 187 828,891 2.0
0 335
0.1 (400,000) (10,695,174) (3.7
0.1 (50,000) (131,275,712)
(1.7) 0 (1 ,011,299) (1.7
(3.2) (1,372,343) (96,691,559) (4.7
1.6 0 (3,710,737) 1.6
(4.3) (300,000) {9,862,872) (7.6
43.9 (2,258,281) (6,628,096) 14.9
1.2 0 (12,492,153) 1.2
0.1 (4,380,624} (272,367 ,602) (1.5;
3.8 6,548 213,399,512 3.8
(0.5) 72,500 27,869,565 (0.2:
10.5 0 1,789,408 10.5
7.4 0 20,199,194 7.4
(2.7) . 761,188 100,460,483 (2.0:
1.0 0 8,633,604 1.0
3.4 0 1,619,914 3.4
2.5 118,545 43,041,541 2.7
3.5 2,075,277 70,205,015 6.7
(36.8) 0 (956,087) (3e.a:
2.1 3,034,058 486,262,150 2.7
4.9 (1,346.566) 213.894,548 4.3
(1.5)
2.8
2
0123456789
ALL CURRENT DEPARTMENTS
The City of Greater Sudbury was formed on January 1st 2001. With a geographic area encompassing some 3,200 square kilometers, the City of Greater Sudbury is the second largest city in Canada and the largest municipality in Ontario based on land mass. The City of Greater Sudbury provides municipal services to approximately 160,000 citizens within its vast geographic boundaries. These services are essential to the wellbeing of citizens and enhance their quality of life: water, roads, fire, police, emergency medical services, waste management, public transit, recreation programs, economic development and land use planning, health and social services and so much more.
3
0123456789
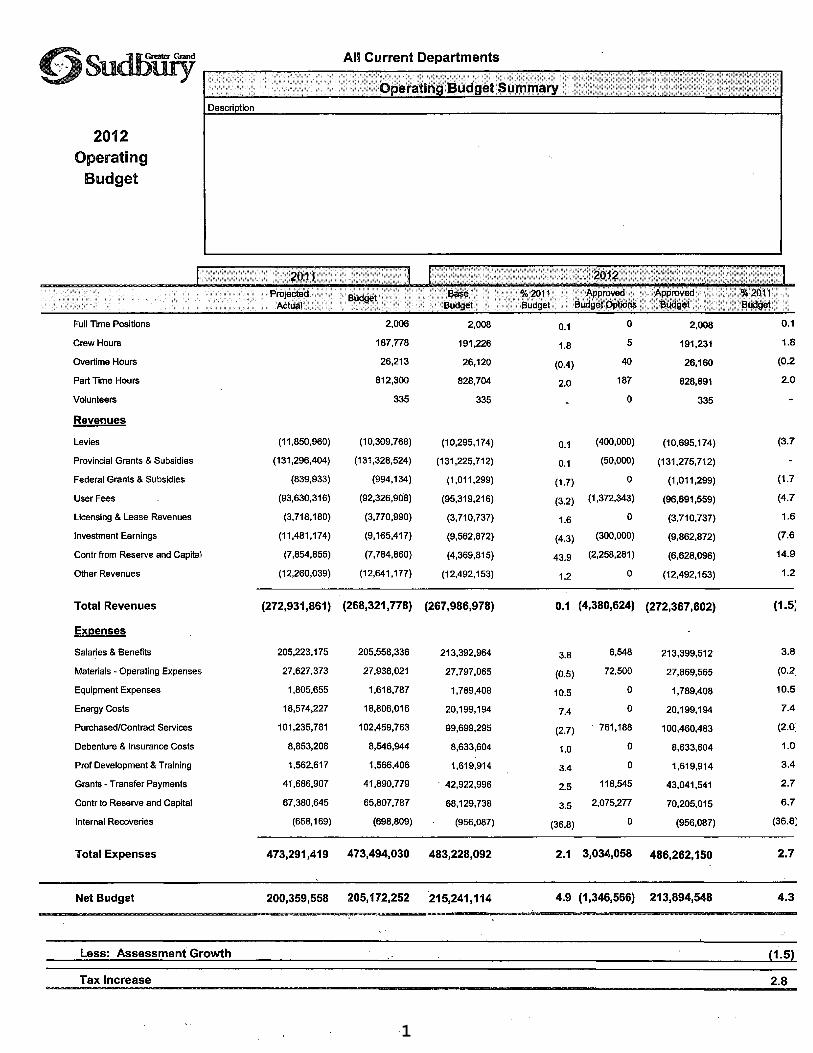
OPERATING BUDGET SUMMARY
This 2012 budget document contains information on the 2011 projected year end position, the 2011 approved budget, and the 2012 budget including any budget options that were approved by Council. The 2011 projected actual costs are based on staff's best estimate as of September month end as to the expected year end position. Also included are the budgeted number of full time positions, crew hours, part time hours and number of volunteer firefighters for 2011 and 2012.
Major Variance Analysis:
Revenues:
Overall, budgeted revenues other than taxation increased 1.5o/o to $272.4 Million, including approved budget options. The variances by revenue category are as follows:
1. Levies which consist of supplementary taxation and payments in-lieu of taxes have increased $400,000 or 3. 7 o/o as a result of increases in budgeted supplementary tax revenue.
2. Overall Provincial Grants decreased $50,000. There were increases in Social Services of $2.4 Million, Long Term Care of $1.0 Million, and other areas totaling $1.4 Million, which were offset by decreases in OMPF funding of$ 3 Million, and Housing Program Grants of $1.7 Million.
3. Federal Grants have a budgeted net increase of $17,000 or 1.7°/o. The decreases of $76,000 for Downtown Master Plan, $48,000 for Settlement Program, and $75,000 for School of Architecture are offset by increases in grants of $18,000 for Regional Business Centre and $198,000 for Homelessness Partnering Strategy. All of these Federal Grants are considered funded programs and changes in grant funding result in offsetting changes in expenditures with no tax levy impacts.
4. User Fees have increased by approximately $4.4 million or 4. 7o/o. A general user fee rate increase of 3°/o in accordance with user fee by-law was approved, along with increases in water wastewater rates, and increases in the sale of recycled materials. The user fee by-law prescribes increases of 3o/o or September CPI , whichever is higher. Also included are approved budget options for increases to users fees for parking, planning applications and site inspections.
5. Licensing and Lease Revenues which consists of licensing fees such as business licenses, lottery licenses, taxi licensing and lease revenues. The budgeted net decrease of $60,000 primarily relates to decreases in lottery licensing revenue.
6. Investment earnings have increased$ 700,000 or 7.6o/o, based on cash flow and projected interest rates.
4
0123456789
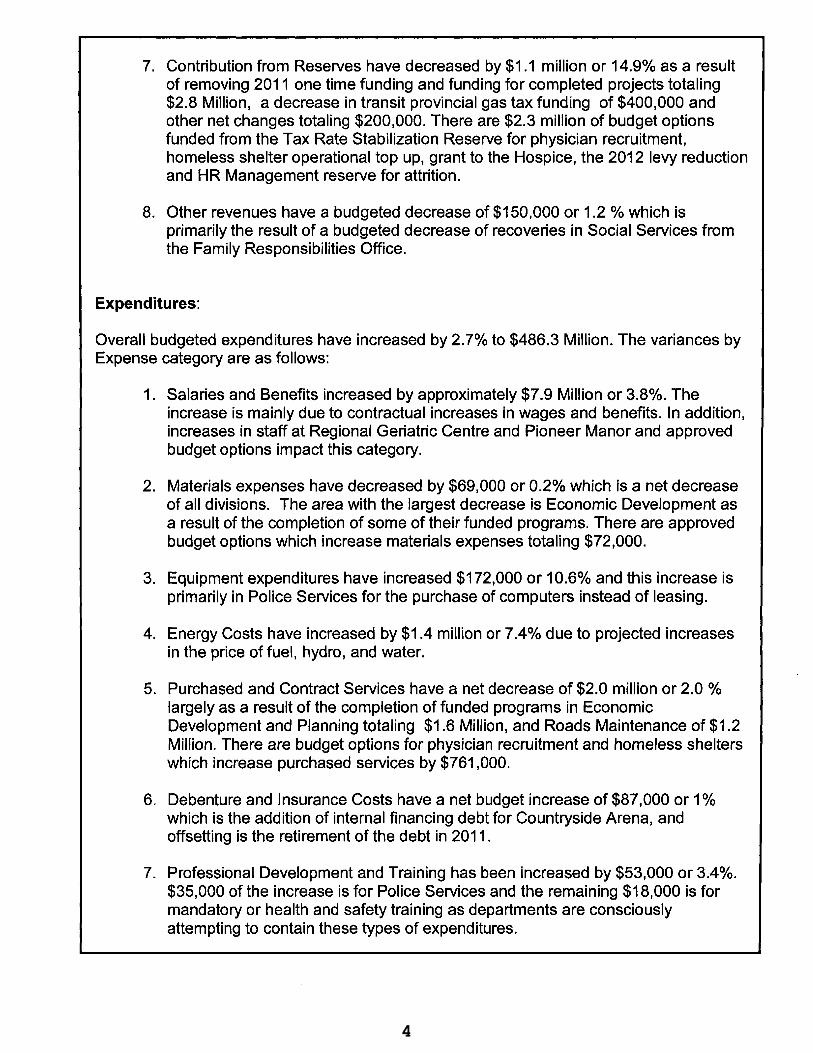
7. Contribution from Reserves have decreased by $1.1 million or 14.9% as a result of removing 2011 one time funding and funding for completed projects totaling $2.8 Million, a decrease in transit provincial gas tax funding of $400,000 and other net changes totaling $200,000. There are $2.3 million of budget options funded from the Tax Rate Stabilization Reserve for physician recruitment, homeless shelter operational top up, grant to the Hospice, the 2012 levy reduction and HR Management reserve for attrition.
8. Other revenues have a budgeted decrease of $150,000 or 1.2 °/o which is primarily the result of a budgeted decrease of recoveries in Social Services from the Family Responsibilities Office.
Expenditures:
Overall budgeted expenditures have increased by 2. 7°/o to $486.3 Million. The variances by Expense category are as follows:
1. Salaries and Benefits increased by approximately $7.9 Million or 3.8°/o. The increase is mainly due to contractual increases in wages and benefits. In addition, increases in staff at Regional Geriatric Centre and Pioneer Manor and approved budget options impact this category.
2. Materials expenses have decreased by $69,000 or 0.2% which is a net decrease of all divisions. The area with the largest decrease is Economic Development as a result of the completion of some of their funded programs. There are approved budget options which increase materials expenses totaling $72,000.
3. Equipment expenditures have increased $172,000 or 1 0.6o/o and this increase is primarily in Police Services for the purchase of computers instead of leasing.
4. Energy Costs have increased by $1.4 million or 7.4o/o due to projected increases in the price of fuel, hydro, and water.
5. Purchased and Contract Services have a net decrease of $2.0 million or 2.0 °/o largely as a result of the completion of funded programs in Economic Development and Planning totaling $1.6 Million, and Roads Maintenance of $1.2 Million. There are budget options for physician recruitment and homeless shelters which increase purchased services by $761 ,000.
6. Debenture and Insurance Costs have a net budget increase of $87,000 or 1% which is the addition of internal financing debt for Countryside Arena, and offsetting is the retirement of the debt in 2011.
7. Professional Development and Training has been increased by $53,000 or 3.4°/o. $35,000 of the increase is for Police Services and the remaining $18,000 is for mandatory or health and safety training as departments are consciously attempting to contain these types of expenditures.
5
0123456789
8. Grants and Transfer Payments increased $1.1 million or 2. 7o/o. This is a net change of a decrease in Housing Program Grants of $1.6 Million, and an increase in Social Service Programs Grants of $2.1 Million, and a Funded Economic Development Grant for Mining Programs of $.5 Million. There is also a budget option for a grant to the Vale I nco Hospice of $54,000.
9. Provision to Reserves and Capital increased by $4.4 million or 6. 7°/o. This increase is attributable to annual inflationary increases of 2o/o on capital envelopes and provisions to reserve, $285,000 increase for communication infrastructure replacement debt repayment, $190,000 increase in Healthy Communities Initiatives funding and additional transfer to roads reserves for proposed pavement degradation fees and Quadra FNX Mining fees for year round loading on MR 84 of $350,000. Also included is an increase in the transfer to the Parking Reserve as a result of the budget option.
1 O.lnternal recoveries reflect the net effect of services performed by operating departments for other departments.
6
0123456789
:~':i''~:·i.~~!t .. ~~~~!~.~::;i;
2011 Approved Operating Budget ( as restated) $ 473.5
Provincially Mandated Programs:
Social Housing Contribution to Greater Sudbury Housing Corporation 0.1 Contribution to Non-Profit Housing Corporations 0.1 Reduction In Affordable Housing Strategy (1.6) Social Services Increase In Ontario Works Programs 2.3 Ontario Works Upload (from 18.8% to 17.2% municipal share) Children Services 0.5 Emergency Medical Services (Land ambulance) 0.4
1.8 Revenue Changes·
Net reduction In OMPF Grant Increase In Investment Income Increase in Transit user fees Reduction In contribution from Provincial Gas taxes (Transit) Reduction In Economic Development Grants (0.6) Increase In Building Services Fees 0.1 Increase In sale of recyclables 0.5 Increase In tipping fees Increase in Leisure Services user fees Increase In Roads users fees 0.3
0.3
Exoendlture Changes·
Increase in Regional Geriatric Services 0.4 Increase in Pioneer Manor 1.5 Increase In fuel and energy costs 1.0 Increase on Capital Envelopes (except WWW) 0.7 Increase in Fire Services 0.6 Increase for Lorne Street Transit and Fleet Depot 0.2 Increase in OMERS contributions 1.4 Increase In other contractual obligations, salaries, benefits and other changes 0.9
6.7
Water/WasteWater Operations
Increase In Water I Wastewater expenses and user fees 1.0
Previous Budget Aporoyals Reduction In One-Time 2011 budget options- Roads (0.8) Reduction In One-Time 2011 budget options - Physlcan Recruitment (0.4) Reduction In One-Time 2011 budget options- Mise grants and projects (0.4) Reduction In One-Time 2011 budget options- Homelessness (0.4) Reduction In One-Time Funding from Reserves to Reduce Levy Increase In Healthy Communities Initiatives Funding 0.2 Increase In Operating Budgets approved in 2011 Budget 0.1 Increase In Tax Levy for Transit Service and Reduction of Provincial Gas Taxes
(1.7) Outside Boards·
Nickel District Conservation Authority Sudbury and District Health Unit 0.1 Police Services 2.1
Reorganization In year Council CGS 2.0 Final Restated Approvals
- 8 -
1 75 -
- 22 -
(145) 165 -
19 75 -
- 547 4 1
125 480 -
- ;> 261 -
- 373 -
- 2,006 4
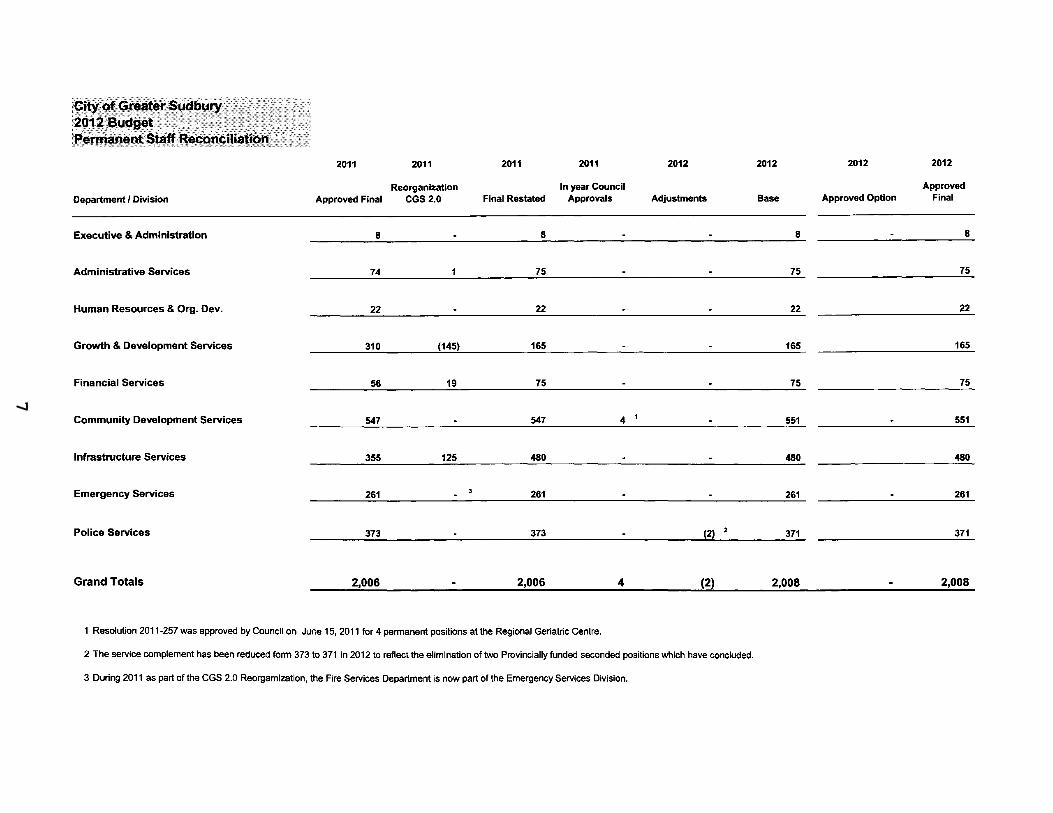
1 Resolution 2011-257 was approved by Council on June 15, 2011 for 4 permanent positions at the Regional Geriatric Centre.
2012
Adjustments
-
-
-
-
-
-
-
-
(2) 2
(2)
2 The service complement has been reduced form 373 to 371 in 2012 to reflect the elimination of two Provincially funded seconded positions which have concluded.
3 During 2011 as part of the CGS 2.0 Reorgamization, the Fire Services Department is now part of the Emergency Services Division.
2012 2012 2012
Approved Base Approved Option Final
8 - 8
75 75
22 22
165 165
75 75
551 - 551
480 480
261 - 261
371 371
2,008 - 2,008
8
0123456789
)\;ltyOI"
!201 ,....:;.::· .~: -..;.;;;,;
Department I Division
Corporate Revenues
Executive & Administration
Administrative Services
Human Resources & Org. Dev.
Growth & Development Services
Financial Services
Community Development Services
Infrastructure Services
Emergency Services
Police Services
Grand Totals
Explanation of Footnotes 1, 2, 3, 4, 5, 6 see next page.
2011
Approved Final
457
7,308
5,220
14,616
148,071
5,051
521,228
33,570
33,319
43,460
812,300
2011
Reorganization
CGS2.0
(78,778)
78,778
2011
Approved Restated CGS 2.0
457
7,308
5,220
14,616
69,293
5,051
521,228
112,348
33,319
43,460
812,300
2011
Council Approvals
2012
Adjustments
815
897
(371)
15,616 4
(553) 5
16,404
2012
Base
457
7,308
6,035
14,616
70,190
4,680
536,844
111,795
33,319
43,460
828,704
2012 Approved Options
187 6
187
2012
Final
457
7,308
6,035
14,616
70,377
4,680
536,844
111,795
33,319
43,460
828,891
9
0123456789
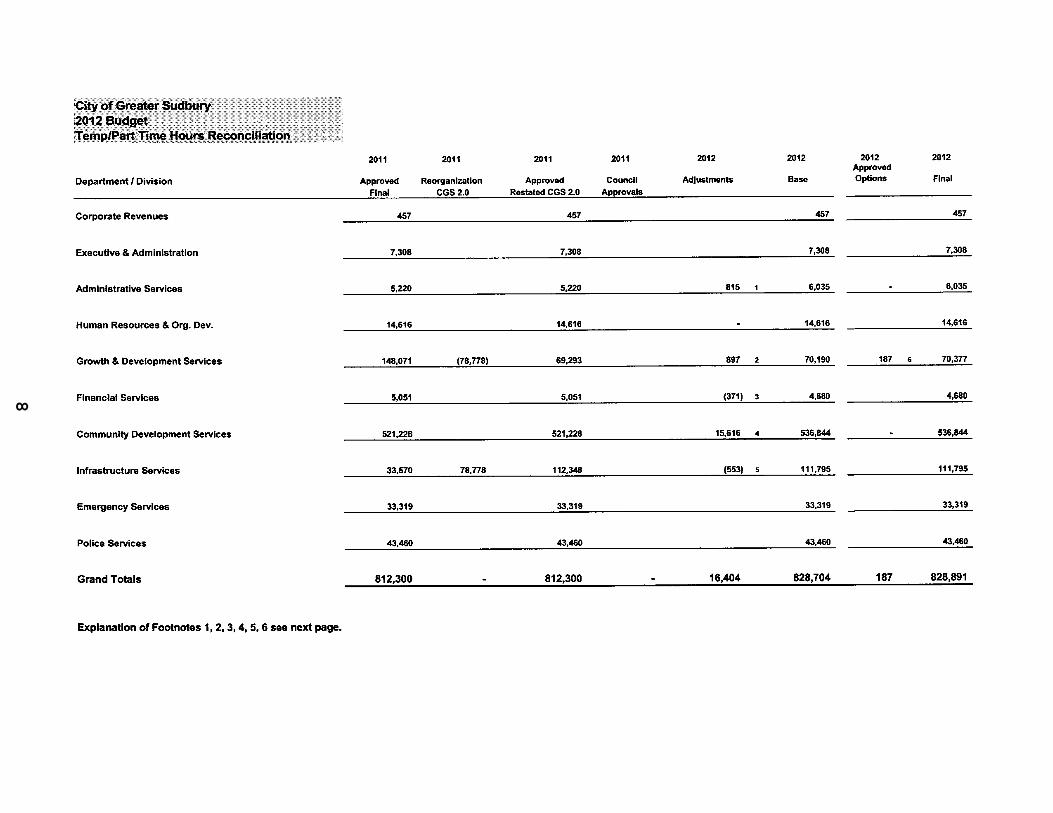
TEMPORARY HOURS RECONCILIATION
Variance Explanations:
1. Administrative Services: The increase of 815 hours is net change in the following areas: an increase of 1 ,096 part time hours in legal services which was approved through a fiscal sustainability option during 2011 budget deliberations and a reduction of 281 student hours in the Communications section.
2. Growth and Development : The increase of 897 hours is a net change in the following areas: Economic Development has an increase of 823 hours as a result of changes in funded programs. Solid Waste increased 1416 hours for projects and studies and 364 for blue box recycling. Parking has a decrease of 1706 hours as a result of operational efficiencies. These changes to part time hours are in accordance with the base budget preparation policy and funded from offsetting savings or identified funding sources.
3. Financial Services: The reduction of 371 hours in Financial Information Systems is for a contract position funded from reserve, as a result of the project completion.
4. Community Development Services: The increase of 15,616 hours is a net change in the following divisions: increases in Pioneer Manor of 16,378 for additional funded Health Care Aides, and increased sick leave utilization, Leisure and Recreation 655 hours for outdoor rinks approved during 2011 budget deliberations and 1 ,400 hours for Valley East Youth Centre and reductions in Housing Funded Programs (2,205) and Children Services (312).and Citizen Service Centres ( 300).
5. Infrastructure Services: The decrease of 553 part time hours is to reflect a change in Transit service hours related to the elimination of two time slots for the New Sudbury Shopping Route, the removal of two Lively routes and the annualized impact of previously approved 2011 options
6. Environmental Services Options: The increase of 187 part time hours in Environmental Services is a result of the approved budget options for the truckload sale of big blues and banning leaf and yard trimmings from the residential garbage stream.
10
0123456789
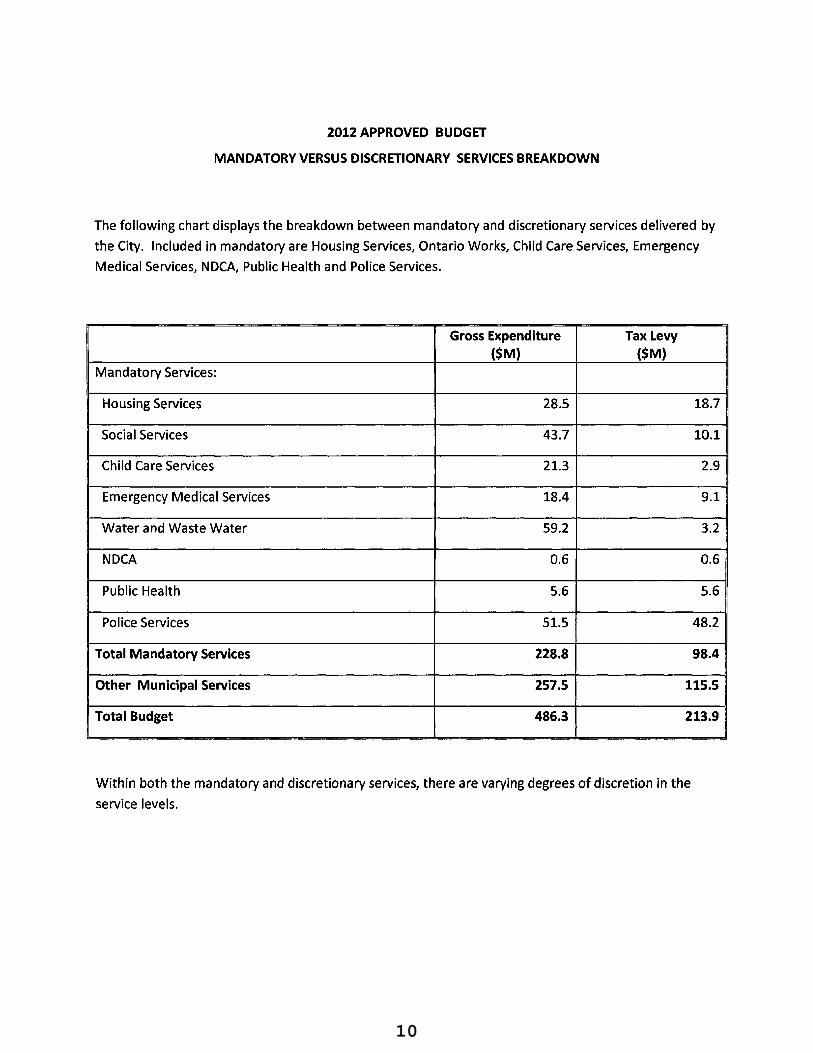
2012 APPROVED BUDGET
MANDATORY VERSUS DISCRETIONARY SERVICES BREAKDOWN
The following chart displays the breakdown between mandatory and discretionary services delivered by
the City. Included in mandatory are Housing Services~ Ontario Works~ Child Care Services~ Emergency
Medical Services~ NDCAI Public Health and Police Services.
Gross Expenditure Tax Levy ($M) {$M)
Mandatory Services:
Housing Services 28.5 18.7
Social Services 43.7 10.1
Child Care Services 21.3 2.9
Emergency Medical Services 18.4 9.1
Water and Waste Water 59.2 3.2
NDCA 0.6 0.6
Public Health 5.6 5.6
Police Services 51.5 48.2
Total Mandatory Services 228.8 98.4
Other Municipal Services 257.5 115.5
Total Budget 486.3 213.9
Within both the mandatory and discretionary services~ there are varying degrees of discretion in the


![Budget Presentation 4-2-12 [Read-Only]2012/04/02 · 2012‐13 District Budget Proposal Final Budget Presentation April 2, 2012 Budget Update ˜Budget passed – Additional $180,688](https://static.documents.pub/doc/80x56/60029453d7a89163df46803e/budget-presentation-4-2-12-read-only-20120402-2012a13-district-budget-proposal.jpg)


