132
2012 CAPITAL INVESTMENT PROGRAMME Published following airline consultation in July 2012 - August 2012 Figures correct as at 01.04.2012

2012 CAPITAL INVESTMENT PROGRAMMEPublished following airline consultation in July 2012 - August 2012Figures correct as at 01.04.2012


CONTENTS
3
Section Subject Page
Foreword by Stewart Wingate 5
Introduction 7
CHAPTER 11.1 Updated Traffic forecasts 1.2 Gatwick Draft Airport Master Plan
922
CHAPTER 22.1 Competing to grow and become London’s airport of choice2.2. Beyond Q5 Capital Plan
2530
CHAPTER 3 Consultation on the Capital Investment Programme 35
CHAPTER 4 Project Descriptions 43
APPENDIX A Phased Capital Investment Programme 2012 89
APPENDIX B Phased Capital Investment Programme 2011 91
APPENDIX C Changes to Investment Programme - Tracker ( 2008 – 2012) 93
APPENDIX D Previous Traffic Forecasts 101
APPENDIX E Meetings, Working Groups and Governance Boards 105
APPENDIX F Decision Log 109
APPENDIX G Annex G 113
APPENDIX H Gatwick in 2020 - Land Use Plan 119
APPENDIX I Gatwick‘s Product Matrix 121
APPENDIX J Tollgate Process 127
GlossARy 128
PAGE FOOTER
KEy
CHAPTER 1 CHAPTER 3 CHAPTER 4CHAPTER 2
1 2 3 4

5
Gatwick is changing and at a great pace, 64 % of our £1.172 billion investment is either completed or under construction. This investment is important to correct the under investment of the past and will enable us to compete effectively as we retain, attract and grow airline and passenger traffic at the world’s busiest single runway airport.
The impact of such capital investment and improved service offerings at Gatwick is reflected in the latest ASQ ratings and the growth of new carriers at Gatwick. In 2011/12 Gatwick introduced 4 new routes to the world’s high growth economies as well as a new service to Istanbul. easyJet, our largest customer, introduced 5 new routes and BA moved its long haul leisure flight to Mauritius from Heathrow to Gatwick and returned its Malaga service to Gatwick from Heathrow, after 18 months of absence. New carriers including the world’s largest carrier Air China along with Korean Air and Vietnam Airways have also recently joined Gatwick. This demonstrates the genuine competition now thriving in the London and South East airport market, since Gatwick came under new ownership in December 2009.
To compete effectively we need to deliver continued improvement in passenger experience, innovate and increase efficiency in what we offer and how we deliver it. The execution of the South Terminal Consolidated Central Search facility is a prime example of where Gatwick has set the benchmark standard for UK airports. As a service - oriented airport it is imperative we maintain this pace and continue raising the profile of Gatwick by carrying out investment that cost effectively delivers facilities and services required by our customers, both existing and future.
In the last year there has been an extensive development activity all across Gatwick and the Gatwick CIP now consists of projects in increasing maturity of development and delivery on the ground. The North Terminal Extension project was successfully delivered in December 2011, the South Terminal Forecourt, providing a completely new entrance plaza to the South Terminal was completed in March 2012. Several improvement works comprising improvements to Taxiways as well as remedial works to the northern runway were executed to support our airline partners’ operations on the airfield and make Gatwick’s runway even more efficient.
This CIP document sets out our capital plans for the period up to 2013/14. It forms part of our consultation with our airline partners about the future of Gatwick.
The delivery of additional pier service to meet forecast growth in traffic in the North Terminal, which will continue beyond Q5, is an important development and will enable our airlines more flexibility and ultimately improve the passenger experience.
The South Terminal Baggage and Pier 1 project remains the most significant investment project in the South Terminal in terms of both complexity and benefits to be realised. This major upgrade to the baggage system will increase capacity and improve efficiency. This combined with the replacement of Pier 1, Gatwick’s oldest pier, will transform the passenger experience in the South Terminal and enable a more efficient operation on the airfield. These two projects will continue beyond Q5.
Out in the airfield, the rehabilitation of Gatwick’s main runway undertaken every 12-15 years, which commenced in March 2012, is due for completion in November 2012. Equipping the world’s busiest single runway airport with Code F capability on a pier-served stand is another key project we have embarked on because we believe it is crucial to Gatwick’s ambition and strategy to become London’s Airport of Choice and will offer real choice to airlines and passengers flying to and from London.
We look forward to working together with our airline partners in delivering the remaining capital investment in the last two years of the extended Q5 period.
Yours faithfully
Stewart WingateChief Executive
FOREWORDBY STEWART WINGATE (CHIEF EXECUTIVE)


7
INTRODUCTION
submitted to the airlines in April 2012, represents Gatwick’s initial submission to the constructive engagement process beyond Q5, which is the period starting 1 April 2014.
Both the Master Plan and the CIP form an important part of the regulatory framework within which Gatwick operates.
ASSUMPTIONS FOR ThE CIPThe CIP outlined is based on the assumption that Gatwick will remain a single runway airport up to the 2020s. This single runway-two terminal scenario is the key premise upon which the ten year airport investment programme is based. There are no current plans for an additional runway but we will continue to safeguard for that eventuality should it be needed.
Despite the constraints of a single runway on longer term growth, there is still room to grow in the short to medium term, by using unutilised runway capacity during off-peak periods. By making use of the full potential of the single runway we believe Gatwick can build capacity to accommodate up to 41.1 million passengers (high case scenario) with 281,600 aircraft movements by 2018/2019, as outlined in Chapter 1 - Traffic Forecasts.
REGULATORy PERIODS Q5 ExTENSIONIn February 2011 the CAA consulted on extending the current five-year regulatory period by one year to end on 31 March 2014. In March 2011 the CAA confirmed that, exercising its powers under Section 40 of the Airports Act, it had decided to extend Q5 to 31 March 2014. The extension of Q5 by a year was largely due to the CAA’s desire that the Airport Economic Regulation (AER) Bill be enacted prior to determining the terms for the next regulatory period.
The capital programme for the extension year 2013/14 (‘’Q5+1’’) presented to the airlines in July 2011 amounted to £250.6m (2011/12 prices). Since July 2011 there has been continued consultation on the Q5+1 programme of projects. The figures included within this document reflect the position as at 1 April 2012. Consultation continues and therefore as with the whole capital plan, projects and budgets will change to reflect the latest decisions. Any changes will be highlighted in the next CIP publication.The 2012 CIP also includes high level information for the period beyond Q5, commencing 1 April 2014.
ThE STRUCTURE OF ThE CIPThe content of the CIP is guided by the CAA’s Annex G requirements for the Capital Investment Programme and is intended to describe the capital investment for Gatwick over an extended Q5. It aims to provide details regarding the drivers and priorities for investment as well as giving specific information on current and future projects.
The 2012 Capital Investment Programme (CIP) is a key document around which consultation between airlines and Gatwick Airport Ltd (GAL) takes place, in line with Annex G’s requirements. It provides information to airlines on current and future development plans until 2018/2019.
The 2012 CIP outlines Gatwick’s performance in the first four years of the fifth quinquennium, commonly referred to as Q5. Q5 commenced on 1st April 2008 and was due to end in March 2013. In March 2011, the CAA published its decision to extend the current Q5 price control period by one year to 2013-2014. The CIP therefore also sets out the capital investment projects being proposed by GAL for the remainder of the extended Q5, namely till 31 March 2014. For the purposes of this document, the Q5 price control period and the extension year 2013/2014 will henceforth be referred to as ‘Q5’.
The content of GAL’s CIP is revised and re-published on an annual basis.
ThE CIP IN CONTExT As one of the three regulated airports in the UK, Gatwick is subject to regulatory review by the CAA every five years. Accordingly Annex G requires GAL to produce information within annual capital planning documents covering at least 10 years, around which consultation takes place. It states that the purpose of the CIP document is to allow the airport to consult on a number of matters relating to Q5 (and future price control periods)
Under Annex G, the key aspects to the airport - airline consultation on airport development plans consist of the following main documents:
• Gatwick Airport Master Plan • Gatwick Capital Investment Programme (CIP)• Consultation on individual projects.
Together the Master Plan and CIP documents provide a clear picture of Gatwick’s roadmap of development within the current, medium and long term view.
The Gatwick Master Plan identifies the high-level strategic development direction for Gatwick comprising current and future land use plans. A draft Master Plan was published in 2011. A finalised master plan that takes account of the responses from the consultation process will be published in summer 2012.
The Gatwick Capital Investment Programme (CIP) includes a detailed description of individual projects designed to address these development requirements and reports on consultation with the airlines. The Gatwick Business Plan,

8
INTRODUCTIONCONTINUED
A copy of Annex G is also included for reference (Appendix G ). A copy of the indicative 2020 Gatwick Airport Layout plan, extracted from the 2011 Draft Master Plan, is provided in Appendix H.
A copy of the GAL Product Matrix is included in Appendix I.
The Design for Six Sigma (DfSS) process, as explained in Chapter 4 of the 2011CIP, is outlined in Appendix J for reference.
In line with Annex G this CIP document should be regarded as a product of consultation at the time of publication and also as a basis for future consultation and thus, does not represent a mandatory investment programme.
yOUR FEEDbACkThe feedback regarding the provision of a clear linkage between the Master Plan, Development Strategy and CIP has been noted. We are considering how illustrative plans and diagrams might be prepared to show how the projects described in the CIP fit within a holistic development plan for Gatwick. For the time being we have reproduced a future land use plan from the draft master plan in (Appendix H) but we may seek to develop more detailed plans in due course to show the phased development of the airport, in a way that is compatible with the master plan principles.
The feedback regarding the status of Q5+1 projects has also been considered in Chapter 2 and Chapter 4 (project description sheets) where we indicate where the major Q5+1 projects are within the consultation process as at 1 April 2012.
This document was originally circulated amongst the Gatwick Community as a draft publication for consultation in july 2011, together with a request for feedback. The period for formal feedback has since expired and this is the final version of the Gatwick 2012 CIP.
We do of course value feedback throughout the year. The feedback will help us improve the airport’s future capital plans.
If you have any queries on this document, or would like to comment on the programme, please contact [email protected]
Electronic access to this document is available at www.gatwickairport.com
The structure of the document follows a broadly similar format to the CIP2011 document, starting with the latest outlook on traffic forecasts as well as an overview of the 2011 Draft Master Plan including an indicative Airport Land Use Plan of Gatwick in 2020 and how they drive the required investment at Gatwick, through to a detailed description of the overall capital investment at Gatwick.
The structure of this document is as follows:
• Chapter 1 describes Gatwick’s existing traffic and provides details of our latest traffic forecasts. It also articulates how these forecasts are translated into facility requirements. Also included is a separate section on the draft Master Plan published in October 2011.
• Chapter 2 describes the Gatwick Investment Strategy, setting out the principal drivers and priorities for investment at the airport. It also includes a more detailed look at some of the investment initiatives at Gatwick that have already been delivered, are currently being delivered and will be delivered at Gatwick in the future. We have also included a high level overview of the ‘Beyond Q5’ Capital plan.
• Chapter 3 provides an update on the consultative process undertaken at Gatwick and an overview of how we comply with the requirements of Annex G - outlining how we engage with all our customers and stakeholders comprising airlines, passengers and the wider Gatwick community. It highlights key elements of this consultation.
• Chapter 4 contains individual project descriptions, including details on costs, for all projects or programmes over £5 million (out-turn prices).
Appendices are also included showing the CIP 2012 forecast phased expenditure of all major projects and programmes of greater value than £1 million (Appendix A), the CIP 2011 forecast phasing of expenditure of all major projects and programmes of greater value than £1 million (Appendix B) and a tracker that highlights where and how changes have been made (Appendix C).
Also included in the appendices are the previously published traffic forecasts (Appendix D) and a log of all the consultation forums and working groups since the publication of the previous CIP, highlighting subjects discussed and decisions made (Appendix E & F).

9
1ChAPTER 11.1 UpDATED TRAFFIC FORECASTS
INTRODUCTIONIn 2011 we commissioned ICF SH&E, a leading aviation consultancy company, to produce an independent view on the prospects for air traffic at Gatwick. These forecasts were published in the 2011 Draft Master Plan. Subsequently, we invited ICF SH&E to update their forecasts in early 2012 in line with the latest economic outlook. These latest forecasts are outlined in the following sections and were included in the initial GAL business plan.
OVERVIEW OF 2011/ 2012Gatwick is the UK’s second busiest airport. It is a vital part of the UK’s transport infrastructure and while it offers more travel destinations than any other London airport, its operations are very much aligned to the needs of those travelling to and from London and the South East.
In 2011/12, Gatwick handled 33.8 million passengers, 4.9% fewer than its peak of 35.6m in 2007/08. The total number of aircraft movements was 248,678 and cargo (belly-hold) carried 88,111 tonnes.
The 2011/12 total of 248,678 aircraft movements comprised:
• 242,149 passenger air transport movements (PATMs), giving an average aircraft load of 140 passengers. These flights also carried the great majority of Gatwick’s freight as belly-hold cargo.
• 349 cargo air transport movements (CATMs). These were a mixture of international flights, and domestic and Channel Island flights
• 2,082 general aviation (GA) and air taxi movements • 4,098 other flights, the majority by empty civil aircraft
on positioning flights.
Note on the Department for Transport (DfT) forecasts, published in their document “UK Aviation Forecasts - August 2011”. It would seem that the DfT’s view of traffic growth at Gatwick has not deviated greatly from the assumptions in the South East and east of England Regional Air Services (SERAS) study published in 2002. A key assumption of these forecasts is the maximum annual traffic movement ceiling set at 260,000. The independently produced SH&E forecasts included in this chapter assume that this level of annual movements can be exceeded, given the right mix of airlines and traffic.
PASSENGER TRAFFICMost passengers travel from residences, hotels and businesses within London and the South East.
In 2011 63% of all Gatwick passengers had their journey origins or destinations in London and the counties to the south and east, 28.8% in other areas of the UK and 8.2% were transferring between flights.
The majority of Gatwick passengers are travelling for leisure and are residents of the UK. However, the proportion of both business and non-UK passengers is increasing. The proportion of business travellers increased from 14.3% in 2010 to 16.3% in 2011 and the proportion of non-UK passengers increased from 23.4% in 2010 to 27.0% in 2011.
AIRLINESOne of Gatwick’s strengths is its range of airline services and routes. Typically in 2011, Gatwick was served by 60 regularly operating passenger airlines, comprising a mix of full service, low cost, and charter airlines. On average, passenger airlines operated 670 daily flights and served over 200 destinations - more destinations than any other UK airport. In comparison, Heathrow operated an average of 1,305 daily flights, with 89 airlines flying to 176 destinations, while Stansted operated 375 daily flights on average, with 13 airlines serving 150 destinations.
Gatwick’s two largest carriers account for just over half the passenger traffic at Gatwick. easyJet is the largest, accounting for 37% of passenger traffic, while British Airways accounts for 14%.
ROUTESIn 2011, airlines operating at Gatwick flew at least one flight a week to over 200 destinations. In 2011, 89.0% of passengers travelled on international services and 11.0% on domestic. The majority of passengers were on short-haul routes to destinations in the UK and Europe, though a number of long-haul destinations such as Orlando, Dubai, Sharm El Sheikh and Bridgetown are among Gatwick’s busiest services.
AIRCRAFTThe variety of aircraft types operating at Gatwick reflects a diverse mix of airlines and routes. Narrow-body jet aircraft such as the Boeing 737 and Airbus A320 are the most common type, reflecting the dominance of short-haul operations. These account for 78.8% of total passenger operations.
1 2 3 4
10
1ChAPTER 11.1 UpDATED TRAFFIC FORECASTS
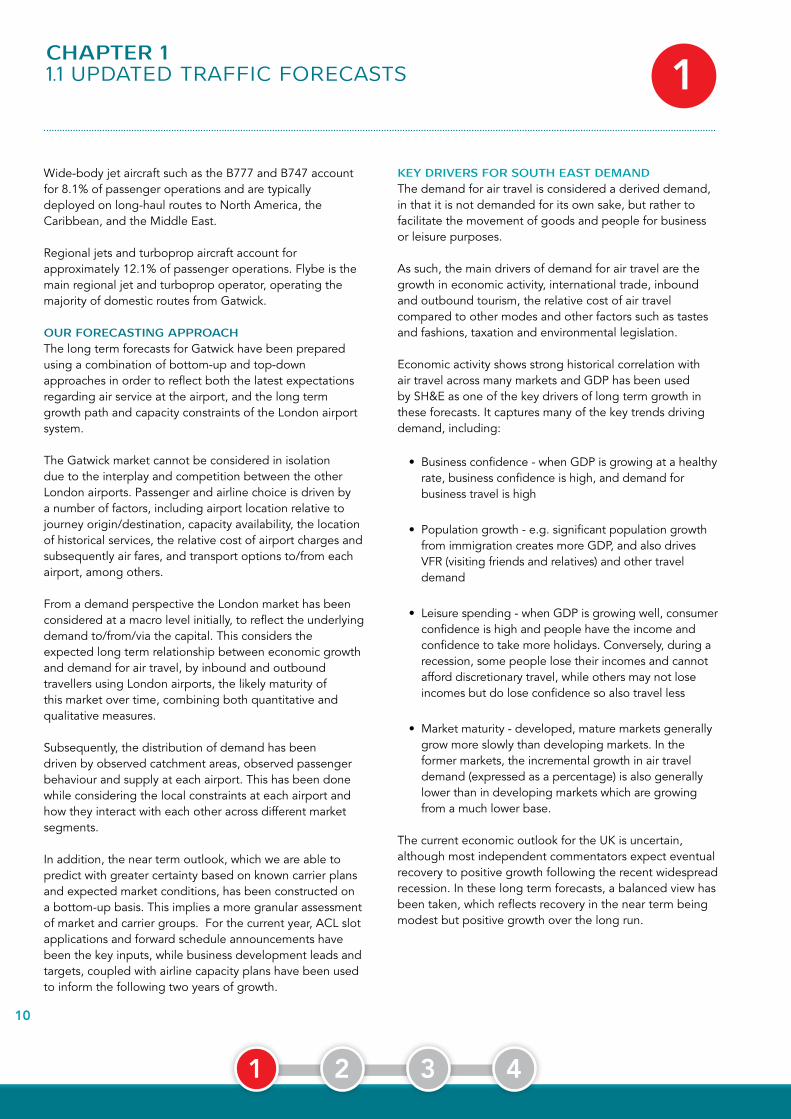
Wide-body jet aircraft such as the B777 and B747 account for 8.1% of passenger operations and are typically deployed on long-haul routes to North America, the Caribbean, and the Middle East.
Regional jets and turboprop aircraft account for approximately 12.1% of passenger operations. Flybe is the main regional jet and turboprop operator, operating the majority of domestic routes from Gatwick.
OUR FORECASTING APPROAChThe long term forecasts for Gatwick have been prepared using a combination of bottom-up and top-down approaches in order to reflect both the latest expectations regarding air service at the airport, and the long term growth path and capacity constraints of the London airport system.
The Gatwick market cannot be considered in isolation due to the interplay and competition between the other London airports. Passenger and airline choice is driven by a number of factors, including airport location relative to journey origin/destination, capacity availability, the location of historical services, the relative cost of airport charges and subsequently air fares, and transport options to/from each airport, among others.
From a demand perspective the London market has been considered at a macro level initially, to reflect the underlying demand to/from/via the capital. This considers the expected long term relationship between economic growth and demand for air travel, by inbound and outbound travellers using London airports, the likely maturity of this market over time, combining both quantitative and qualitative measures.
Subsequently, the distribution of demand has been driven by observed catchment areas, observed passenger behaviour and supply at each airport. This has been done while considering the local constraints at each airport and how they interact with each other across different market segments.
In addition, the near term outlook, which we are able to predict with greater certainty based on known carrier plans and expected market conditions, has been constructed on a bottom-up basis. This implies a more granular assessment of market and carrier groups. For the current year, ACL slot applications and forward schedule announcements have been the key inputs, while business development leads and targets, coupled with airline capacity plans have been used to inform the following two years of growth.
kEy DRIVERS FOR SOUTh EAST DEMANDThe demand for air travel is considered a derived demand, in that it is not demanded for its own sake, but rather to facilitate the movement of goods and people for business or leisure purposes.
As such, the main drivers of demand for air travel are the growth in economic activity, international trade, inbound and outbound tourism, the relative cost of air travel compared to other modes and other factors such as tastes and fashions, taxation and environmental legislation.
Economic activity shows strong historical correlation with air travel across many markets and GDP has been used by SH&E as one of the key drivers of long term growth in these forecasts. It captures many of the key trends driving demand, including:
• Business confidence - when GDP is growing at a healthy rate, business confidence is high, and demand for business travel is high
• Population growth - e.g. significant population growth from immigration creates more GDP, and also drives VFR (visiting friends and relatives) and other travel demand
• Leisure spending - when GDP is growing well, consumer
confidence is high and people have the income and confidence to take more holidays. Conversely, during a recession, some people lose their incomes and cannot afford discretionary travel, while others may not lose incomes but do lose confidence so also travel less
• Market maturity - developed, mature markets generally
grow more slowly than developing markets. In the former markets, the incremental growth in air travel demand (expressed as a percentage) is also generally lower than in developing markets which are growing from a much lower base.
The current economic outlook for the UK is uncertain, although most independent commentators expect eventual recovery to positive growth following the recent widespread recession. In these long term forecasts, a balanced view has been taken, which reflects recovery in the near term being modest but positive growth over the long run.
1 2 3 4

11
1ChAPTER 11.1 UpDATED TRAFFIC FORECASTS
The economic headwinds buffeting aviation in the UK, such as fuel prices, APD, environmental legislation, dampened disposable incomes amongst others are reflected in the low elasticity of demand assumed for the London market as a whole, considerably below the levels experienced historically.
ExTERNAL NEGATIVE ShOCkSIn the UK, there has historically been a strong and consistent relationship between GDP and Air Travel, consistent with the basic premise that as incomes and economic activity increase, business and leisure demand also increase. This relationship has generally held during downturns also. For example, when there has been a recession, and economic growth has turned negative, demand for UK air travel has fallen also.
At individual airport level, traffic growth tends to show greater variability, due to other market-specific shocks such as the arrival or departure of a new airline, or based on local disruption weather, construction or political unrest.
Gatwick’s traffic has also experienced shocks over time, due to a combination of both broader national and international shocks such as war, oil price hikes and recessions, as well as more local shocks such as weather disruption or the arrival or departure of based airlines.
ASSUMPTIONS - GENERALThe three cases produced in these forecasts are intended to provide a likely range of growth profiles for Gatwick over the forecast horizon. A set of optimistic and pessimistic assumptions have been analyzed and a set of scenarios created, which provide a reasonable boundary for upside and downside risk. It may be seen that over the very long term, the three cases converge towards the assumed runway capacity of Gatwick, beyond which they all grow very modestly.
LOW CASE SCENARIOThe low case reflects the downside risk in the forecasts, with a more pessimistic set of assumptions in both the short and the long term. Possible scenarios include:
• Even lower economic growth, for a prolonged period• Fuel price hike, leading to higher fares• Loss of recently gained long haul services, and/or
established carriers due to competition
bASE CASE SCENARIOIn the first three years, growth is driven by known and expected capacity additions by existing and new carriers. The base case takes a balanced view of both positive and negative factors. Over the long term, a GDP elasticity of around unity is assumed in the base case, reflecting an on-going link to economic growth, but also increasing market maturity and a combination of negative influences on demand, such as increasing air travel costs relative to other modes.
hIGh CASE SCENARIOThe high case is intended to reflect a reasonable optimistic scenario, illustrating a set of positive conditions but remaining within previously sustained growth rates seen at Gatwick. Possible scenarios include:
• Faster economic recovery and higher sustained growth rates
• Greater success in capturing market share from other London airports
The High case is considered appropriate for the purposes of capacity planning, as it provides an indication of the maximum likely traffic volume at Gatwick over the planning horizon.
As with all forecasts, actual events may, and probably will, differ from those assumed previously.
1 2 3 4

12
1
COMPARISON bETWEEN 2011 FORECASTS AND 2012 UPDATED FORECASTSThe tables below show the passenger and air traffic movement forecasts prepared in May 2011 by ICF SH&E and the subsequent re-forecast exercise by ICF SH&E in February 2012. The updated 2012 Forecast will be adopted by Gatwick for the three scenarios, Base, High and Low.
For the purpose of comparison the passenger forecasts included in the 2008, 2009, 2010 and 2011 CIP reports are included in Appendix D.
Since the production of these new forecasts, the overall economic outlook has deteriorated, with a growing consensus around subdued short term growth and question marks around the extent and speed of any recovery. The fortunes of the Eurozone will be critical and the likely future sale of Stansted Airport by BAA will intensify the competition with Gatwick for airlines and passengers. These current uncertainties make traffic forecasting particularly challenging at this time.
ChAPTER 11.1 UpDATED TRAFFIC FORECASTS
May 2011 February 2012Low Base High Low Base High
Q5
2008/09 actual 33.1 33.1 33.1 33.1 33.1 33.12009/10 actual 32.4 32.4 32.4 32.4 32.4 32.42010/11 actual 31.6 31.6 31.6 31.6 31.6 31.62011/12 actual 32.5 33.3 33.9 33.8 33.8 33.82012/13 32.8 34.1 35.2 33.8 34.3 35.22013/14 33.1 34.9 36.3 34.0 35.2 36.7
Beyond Q5
2014/15 33.6 35.6 37.4 34.2 35.7 37.82015/16 34.1 36.3 38.6 34.3 36.0 38.82016/17 34.6 37.1 40.0 34.6 36.4 39.72017/18 35.0 37.9 41.6 34.8 36.8 40.42018/19 35.5 38.7 42.2 35.1 37.2 41.1
Growth Rate per annum2010/11 – 2013/14 1.5% 3.3% 4.6%2011/12 – 2013/14 0.2% 2.1% 4.2%2013/14 - 2018/19 1.4% 2.1% 3.1% 0.7% 1.1% 2.3%
February 2012Low Base High CATM* Non-ATM**
Q5
2008/09 actual - - - - -2009/10 actual 244.4 244.4 244.4 0.06 6.82010/11 actual 235.6 235.6 235.6 0.16 6.82011/12 actual 242.1 242.1 242.1 0.35 6.22012/13 244.2 247.6 251.1 0.35 6.32013/14 243.2 249.9 258.5 0.36 6.42014/15 242.7 252.6 264.6 0.36 6.42015/16 242.3 253.5 270.4 0.36 6.42016/17 242.1 254.6 276.1 0.37 6.32017/18 242.2 255.6 279.4 0.37 6.22018/19 242.2 256.8 281.6 0.37 6.3
Growth Rate p.a. (2011/12 – 2013/14
0.2% 1.6% 3.3% - –
Growth Rate p.a. (2011/12 – 2013/14
-0.1% 0.4% 1.6% - -
USING GATWICk TRAFFIC FORECASTS TO DETERMINE FACILITy REQUIREMENTSThe driver for infrastructure capacity is peak demand. The need for infrastructure to satisfy the peak demand remains, regardless of annual passenger numbers as some slots will always be more commercially viable as certain times of the day are more attractive to passengers. It is for this reason that the busy day schedule and medium term forecasts are used to model facility requirements looking forward ten years.
GENERATION OF A bUSy DAy SChEDULEGenerating a busy day profile for Gatwick involves creating an interlace scheduled based on assumptions relating to peak spreading and future airline groups, fleets and markets served.
The annual forecasts are used as a starting point from which peak spreading assumptions are made. In producing these interlaced schedules, due care is taken to reflect the current and expected future mix of services during the busy day (expected to remain in August), with assumptions made regarding the timing of new routes, additional frequencies, likely aircraft types, load factors and expected turnaround times.
From these future indicative schedules, it is possible to derive expected future service requirements throughout Gatwick’s busiest periods. In addition, these schedules have been used to inform some of the derivative forecasts such as stand demand, terminal splits of passenger flows and noise.
The main constraint when creating a busy day flight schedule is runway capacity, and new slots can only be allocated in the future schedules where there is spare capacity, which is now very limited at Gatwick. The schedules need to meet control totals for each carrier, market sector and fleet mix, for maximum runway arrivals and departures by hour, and reasonable turnaround constraints for each carrier and market combination.
Since November 2010, these busy day schedules have been prepared for GAL by SH&E, and are aligned with their forecasts at annual level, using assumptions on changes over time to busy day to annual flight movement and passenger volume ratios.
* CATM: Cargo Air Transport Movements i.e. Commercial Cargo flights **Non-ATM: Non Air Traffic Movements i.e. General Aviation, Air Taxi
1 2 3 4

13
1ChAPTER 11.1 UpDATED TRAFFIC FORECASTS
CONVERTING ThE bUSy DAy SChEDULE INTO DEMAND FOR FACILITIESThe busy day schedules are put through spreadsheets or simulation models to assess facility requirements, with the main terminal simulation model being the CAST modelling system.
The CAST model requires a large number of input parameters, which need to be updated prior to model runs. These parameters can come from regular survey data (e.g. EU / non-EU passenger breakdowns by airline from the CAA survey), ad-hoc survey data (e.g. average transaction times through immigration or at check-in), or data collected from the airport operation or airlines (e.g. numbers of bags by flight, or breakdown of passenger method of check-in). In some cases it may be necessary to agree to parameters that are suitable for the year being assessed with other areas of the business (e.g. agreeing reasonable assumptions on methods of check-in in future years, rather than assuming latest observed values will continue to apply).
In addition, service level targets that the airport will seek to achieve in the assessment year are in line with our longer term service level proposition. A notable example is security queuing times, for which the airport has measurable SQR targets. Gatwick has undertaken a significant exercise to work up service standards for a wide variety of areas, as defined in the Product Matrix, which takes into account IATA standards, regulatory SQR targets, customer insight, and benchmarking against other airports - A copy of the GAL Product Matrix is attached in Appendix I. It is also important to bear in mind reasonable assumptions on what can be achieved operationally, and the cost of meeting different service standards.
The simulation model can then be run to determine the facilities that are required to ensure forecast busy day demand is met, given the agreed processing parameters and service level targets. Where the results are particularly sensitive to assumptions, ‘what if’ scenarios can be run in order to highlight the scale of risk. The end result of this process is a recommendation for the type and size of facilities required and by when, with a further suggestion of where capacity for additional facilities may need to be safeguarded. In some cases the required facilities may already be in place, in which case no further development is needed, but in many cases there will be a shortfall in current provision.
The forecast busy day schedules have been used to project facilities demand in 2014/15, 2018/19 and 2027/28, albeit with greater uncertainty and risks attached for the latter scenarios. Given the long lifespan of most facilities, the
longer term projection can be used to inform decisions on development, in particular on safeguarding for future expansion and the overall sizing of different areas of the airport.
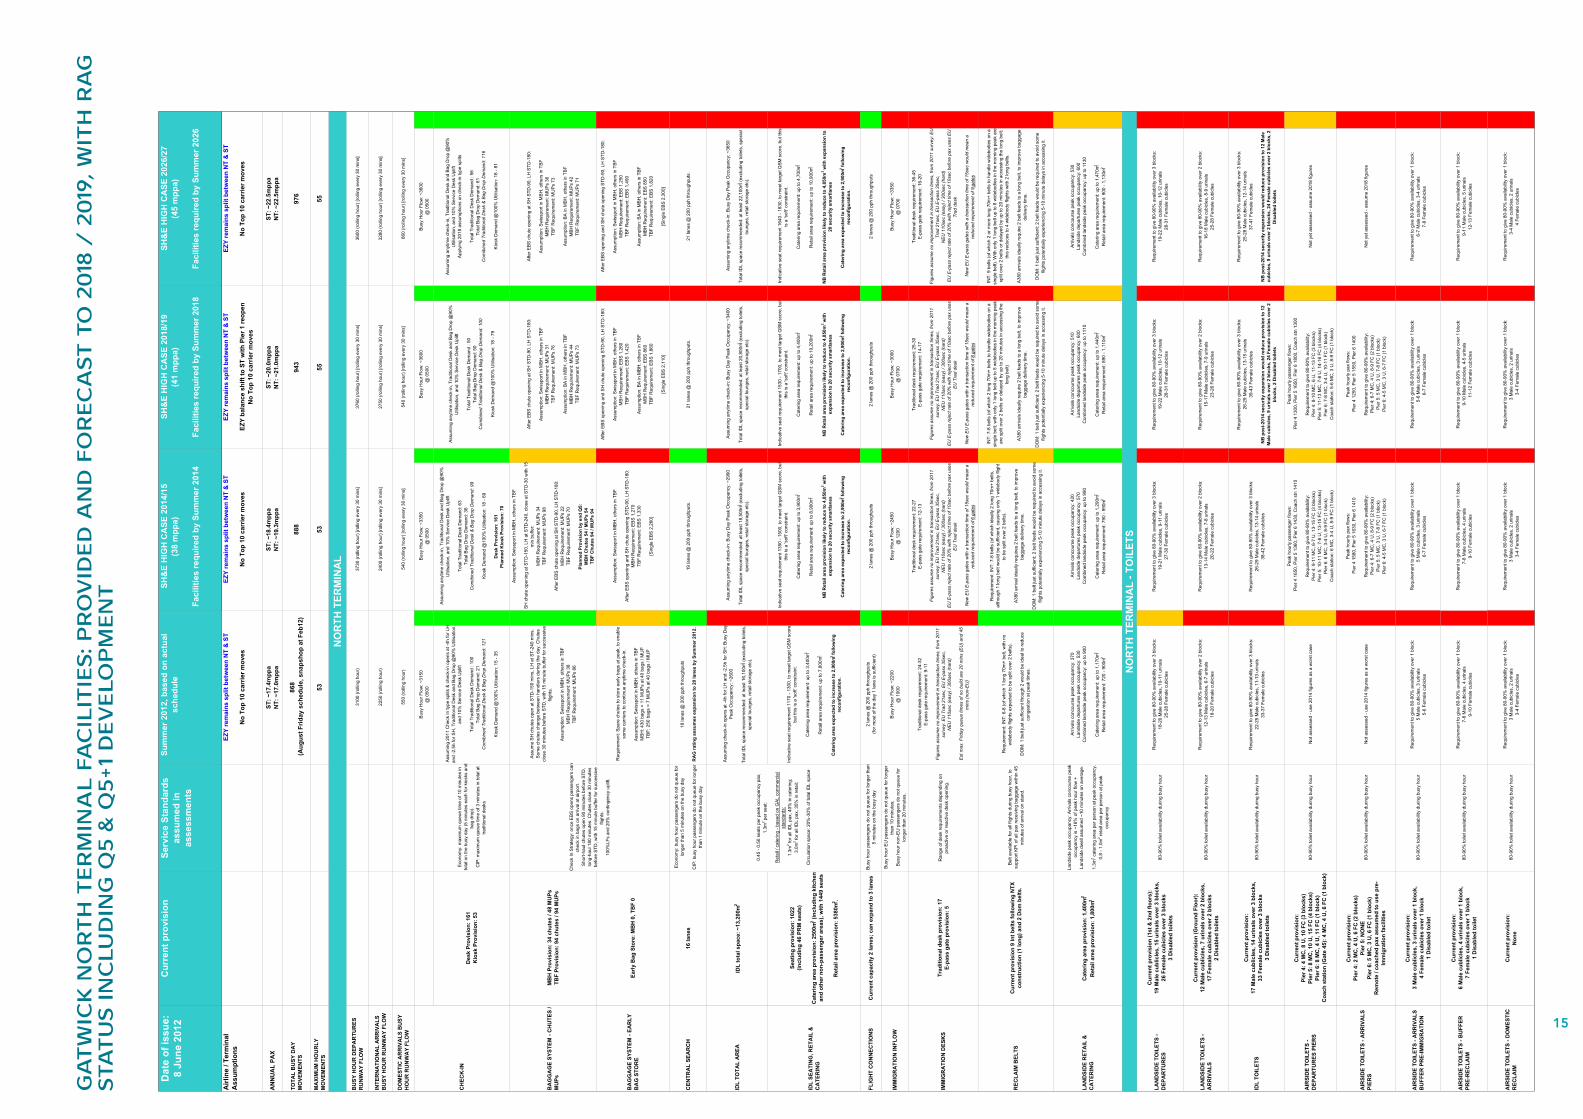
GATWICk TERMINAL FACILITIES - CURRENT AND FORECASTThe tables that follow show the future forecast terminal facility requirements at Gatwick until 2014/15 in North Terminal, South Terminal and the Airfield, using the busy day schedules to assess demand. The service level assumptions that have been used in these assessments are quoted in the tables that follow.
1 2 3 4

GA
TW
ICk
NO
RTh
TER
MIN
AL F
AC
ILIT
IES: P
RO
VID
ED
AN
D F
OR
EC
AST T
O 2
018
/ 2
019
, WIT
h R
AG
STA
TU
S IN
CLU
DIN
G Q
5 &
Q5+1
DEV
ELO
PM
EN
T
Dat
e of
issu
e:
8 Ju
ne 2
012
Cur
rent
pro
visi
onSe
rvic
e St
anda
rds
assu
med
in
asse
ssm
ents
Sum
mer
201
2, b
ased
on
actu
al
sche
dule
SH&
E H
IGH
CA
SE 2
014/
15
(38
mpp
a)
Faci
litie
s re
quire
d by
Sum
mer
201
4
Airl
ine
/ Ter
min
al
Ass
umpt
ions
AN
NU
AL
PAX
TOTA
L B
USY
DA
Y M
OVE
MEN
TS
MA
XIM
UM
HO
UR
LY
MO
VEM
ENTS
BU
SY H
OU
R D
EPA
RTU
RES
R
UN
WA
Y FL
OW
INTE
RN
ATI
ON
AL
AR
RIV
ALS
B
USY
HO
UR
RU
NW
AY
FLO
W
DO
MES
TIC
AR
RIV
ALS
BU
SY
HO
UR
RU
NW
AY
FLO
W
Bus
y H
our F
low
: ~31
50@
050
0B
usy
Hou
r Flo
w: ~
3350
@ 0
500
Bus
y H
our F
low
: ~36
00@
050
0B
usy
Hou
r Flo
w: ~
3600
@ 0
500
Des
k Pr
ovis
ion:
161
Kio
sk P
rovi
sion
: 53
Eco
nom
y: m
axim
um q
ueue
tim
e of
10
min
utes
in
tota
l on
the
busy
day
(5 m
inut
es e
ach
for k
iosk
s an
dba
g dr
op).
CIP
: max
imum
que
ue ti
me
of 3
min
utes
in to
tal a
t tra
ditio
nal d
esks
Ass
umin
g 20
11 C
heck
In ty
pe s
plits
& c
heck
-in o
pens
at -
4h fo
r LH
an
d -2
.5h
for S
H, T
radi
tiona
l Des
k an
d B
ag D
rop
@90
% U
tilis
atio
n,an
d 10
% S
ervi
ce D
esk
Upl
ift
Tota
l Tra
ditio
nal D
esk
Dem
and
: 100
Tota
l Bag
Dro
p D
eman
d: 2
1C
omib
ined
Tra
ditio
nal D
esk
& B
ag D
rop
Dem
and:
121
Kio
sk D
eman
d @
100%
Util
isat
ion:
15
- 35
Ass
umin
g an
ytim
e ch
eck-
in, T
radi
tiona
l Des
k an
d B
ag D
rop
@90
%
Util
isat
ion,
and
10%
Ser
vice
Des
k U
plift
Tota
l Tra
ditio
nal D
esk
Dem
and:
63
Tota
l Bag
Dro
p D
eman
d: 3
6C
omib
ined
Tra
ditio
nal D
esk
& B
ag D
rop
Dem
and:
99
Kio
sk D
eman
d @
100%
Util
isat
ion:
18
- 69
Des
k Pr
ovis
ion:
161
Plan
ned
Kio
sk P
rovi
sion
: 70
Ass
umin
g an
ytim
e ch
eck-
in, T
radi
tiona
l Des
k an
d B
ag D
rop
@90
%
Util
isat
ion,
and
10%
Ser
vice
Des
k U
plift
Tota
l Tra
ditio
nal D
esk
Dem
and
: 50
Tota
l Bag
Dro
p D
eman
d: 5
0C
omib
ined
Tra
ditio
nal D
esk
& B
ag D
rop
Dem
and:
100
Kio
sk D
eman
d @
100%
Util
isat
ion:
18
- 79
Ass
umin
g an
ytim
e ch
eck-
in, T
radi
tiona
l Des
k an
d B
ag D
rop
@90
%
Util
isat
ion,
and
10%
Ser
vice
Des
k U
plift
App
lyin
g 20
18 a
ssum
ptio
ns o
n ch
eck-
in ty
pe s
plits
Tota
l Tra
ditio
nal D
esk
Dem
and
: 56
Tota
l Bag
Dro
p D
eman
d: 6
1C
omib
ined
Tra
ditio
nal D
esk
& B
ag D
rop
Dem
and:
116
Kio
sk D
eman
d @
100%
Util
isat
ion:
18
- 81
BA
GG
AG
E SY
STEM
- C
HU
TES
/ M
UPs
MB
H P
rovi
sion
: 34
chut
es /
48 M
UPs
TBF
Prov
isio
n: 9
4 ch
utes
/ 94
MU
Ps
Ass
ume
SH
chu
tes
open
at S
TD-1
50 m
ins,
LH
at S
T-24
0 m
ins.
S
ome
chut
es c
hang
e be
twee
n ha
ndle
rs d
urin
g th
e da
y. C
hute
s cl
ose
30 m
inut
es b
efor
e S
TD, w
ith 1
5 m
inut
e bu
ffer f
or s
ucce
ssiv
e fli
ghts
.
Ass
umpt
ion:
Sw
issp
ort i
n M
BH
, oth
ers
in T
BF
MB
H R
equi
rem
ent:
MU
Ps
38TB
F R
equi
rem
ent:
MU
Ps
86
Ass
umpt
ion:
Sw
issp
ort i
n M
BH
, oth
ers
in T
BF
SH
chu
te o
peni
ng a
t STD
-150
, LH
at S
TD-2
40, c
lose
at S
TD-3
0 w
ith 1
5 m
in b
uffe
r: M
BH
Req
uire
men
t: M
UP
s 34
TB
F R
equi
rem
ent:
MU
Ps
98
Afte
r EB
S c
hute
ope
ning
at S
H S
TD-9
0, L
H S
TD-1
80:
MB
H R
equi
rem
ent:
MU
Ps
22
TBF
Req
uire
men
t: M
UP
s 70
Plan
ned
Prov
isio
n by
end
Q5:
M
BH
Chu
tes
54 /
MU
Ps 5
4TB
F C
hute
s 94
/ M
UPs
94
Afte
r EB
S c
hute
ope
ning
at S
H S
TD-9
0, L
H S
TD-1
80:
Ass
umpt
ion:
Sw
issp
ort i
n M
BH
, oth
ers
in T
BF
MB
H R
equi
rem
ent:
MU
Ps
31TB
F R
equi
rem
ent:
MU
Ps
76
Ass
umpt
ion:
BA
in M
BH
, oth
ers
in T
BF
MB
H R
equi
rem
ent:
MU
Ps
44TB
F R
equi
rem
ent:
MU
Ps
73
Afte
r EB
S c
hute
ope
ning
at S
H S
TD-9
0, L
H S
TD-1
80:
Ass
umpt
ion:
Sw
issp
ort i
n M
BH
, oth
ers
in T
BF
MB
H R
equi
rem
ent:
MU
Ps
36TB
F R
equi
rem
ent:
MU
Ps
73
Ass
umpt
ion:
BA
in M
BH
, oth
ers
in T
BF
MB
H R
equi
rem
ent:
MU
Ps
42TB
F R
equi
rem
ent:
MU
Ps
71
BA
GG
AG
E SY
STEM
- EA
RLY
B
AG
STO
RE
Early
Bag
Sto
re: M
BH
0, T
BF
0
Req
uire
men
t: S
pare
chu
tes
to s
tore
ear
ly b
ags
at p
eak,
to e
nabl
e so
me
carr
iers
to c
ontin
ue a
nytim
e ch
eck-
in.
Ass
umpt
ion:
Sw
issp
ort i
n M
BH
, oth
ers
in T
BF
MB
H: 4
30 b
ags
= 11
MU
Ps
at 4
0 ba
gs /
MU
PTB
F: 2
50 b
ags
= 7
MU
Ps
at 4
0 ba
gs /
MU
P
A
ssum
ptio
n: S
wis
spor
t in
MB
H, o
ther
s in
TB
F
Afte
r EB
S o
peni
ng a
nd S
H c
hute
ope
ning
STD
-90,
LH
STD
-180
: M
BH
Req
uire
men
t: E
BS
1,2
70
TBF
Req
uire
men
t: E
BS
1,3
30
[Sin
gle
EB
S 2
,260
]
Afte
r EB
S o
peni
ng a
nd S
H c
hute
ope
ning
STD
-90,
LH
STD
-180
:
Ass
umpt
ion:
Sw
issp
ort i
n M
BH
, oth
ers
in T
BF
MB
H R
equi
rem
ent:
EB
S 1
,260
TBF
Req
uire
men
t: E
BS
1,4
20
Ass
umpt
ion:
BA
in M
BH
, oth
ers
in T
BF
MB
H R
equi
rem
ent:
EB
S 8
60TB
F R
equi
rem
ent:
EB
S 1
,860
[Sin
gle
EB
S 2
,110
]
Afte
r EB
S o
peni
ng a
nd S
H c
hute
ope
ning
STD
-90,
LH
STD
-180
:
Ass
umpt
ion:
Sw
issp
ort i
n M
BH
, oth
ers
in T
BF
MB
H R
equi
rem
ent:
EB
S 1
,250
TBF
Req
uire
men
t: E
BS
1,4
90
Ass
umpt
ion:
BA
in M
BH
, oth
ers
in T
BF
MB
H R
equi
rem
ent:
EB
S 8
50TB
F R
equi
rem
ent:
EB
S 1
,820
[Sin
gle
EB
S 2
,300
]
CEN
TRA
L SE
AR
CH
16 la
nes
Eco
nom
y: b
usy
hour
pas
seng
ers
do n
ot q
ueue
for
long
er th
an 5
min
utes
on
the
busy
day
CIP
: bus
y ho
ur p
asse
nger
s do
not
que
ue fo
r lon
ger
than
1 m
inut
e on
the
busy
day
18 la
nes
@ 2
00 p
ph th
roug
hput
s
RA
G ra
ting
assu
mes
exp
ansi
on to
20
lane
s by
Sum
mer
201
2.
19 la
nes
@ 2
00 p
ph th
roug
hput
s.
21 la
nes
@ 2
00 p
ph th
roug
hput
s.
21 la
nes
@ 2
00 p
ph th
roug
hput
s.
IDL
TOTA
L A
REA
IDL
tota
l spa
ce: ~
13,2
00m
2
Ass
umin
g ch
eck-
in o
pens
at -
4h fo
r LH
and
-2.5
h fo
r SH
: Bus
y D
ay
Pea
k O
ccup
ancy
: ~26
00
Tota
l ID
L sp
ace
reco
mm
ende
d: a
t lea
st 1
6,10
0m2
(exc
ludi
ng to
ilets
, sp
ecia
l lou
nges
, ret
ail s
tora
ge e
tc).
A
ssum
ing
anyt
ime
chec
k-in
: Bus
y D
ay P
eak
Occ
upan
cy: ~
2990
Tota
l ID
L sp
ace
reco
mm
ende
d: a
t lea
st 1
8,50
0m2 (e
xclu
ding
toile
ts,
spec
ial l
oung
es, r
etai
l sto
rage
etc
).
Ass
umin
g an
ytim
e ch
eck-
in: B
usy
Day
Pea
k O
ccup
ancy
: ~34
00
Tota
l ID
L sp
ace
reco
mm
ende
d: a
t lea
st 2
0,80
0m2 (e
xclu
ding
toile
ts,
spec
ial l
oung
es, r
etai
l sto
rage
etc
).
Ass
umin
g an
ytim
e ch
eck-
in: B
usy
Day
Pea
k O
ccup
ancy
: ~36
50
Tota
l ID
L sp
ace
reco
mm
ende
d: a
t lea
st 2
2,10
0m2 (e
xclu
ding
toile
ts, s
peci
al
loun
ges,
reta
il st
orag
e et
c).
IDL
SEA
TIN
G, R
ETA
IL &
C
ATE
RIN
G
Seat
ing
prov
isio
n: 1
022
(incl
udin
g 46
PR
M s
eats
)
Cat
erin
g ar
ea p
rovi
sion
: 250
0m2 (i
nclu
ding
kitc
hen
and
othe
r non
-pas
seng
er a
reas
), w
ith 1
449
seat
s
Ret
ail a
rea
prov
isio
n: 5
380m
2 .
Indi
cativ
e se
at re
quire
men
t 117
0 - 1
300,
to m
eet t
arge
t QS
M s
core
, bu
t thi
s is
a 's
oft'
cons
train
t.
Cat
erin
g ar
ea re
quire
men
t: up
to 3
,400
m2
Ret
ail a
rea
requ
irem
ent:
up to
7,8
00m2.
Cat
erin
g ar
ea e
xpec
ted
to in
crea
se to
2,9
00m2 fo
llow
ing
reco
nfig
urat
ion.
Indi
cativ
e se
at re
quire
men
t 135
0 - 1
500,
to m
eet t
arge
t QS
M s
core
, but
th
is is
a 's
oft'
cons
train
t.
Cat
erin
g ar
ea re
quire
men
t: up
to 3
,900
m2
Ret
ail a
rea
requ
irem
ent:
up to
8,9
00m2.
NB
Ret
ail a
rea
prov
isio
n lik
ely
to re
duce
to 4
,850
m2 w
ith
expa
nsio
n to
20
secu
rity
smar
tlane
s
Cat
erin
g ar
ea e
xpec
ted
to in
crea
se to
2,9
00m2 fo
llow
ing
reco
nfig
urat
ion.
Indi
cativ
e se
at re
quire
men
t 153
0 - 1
700,
to m
eet t
arge
t QS
M s
core
, but
th
is is
a 's
oft'
cons
train
t.
Cat
erin
g ar
ea re
quire
men
t: up
to 4
,400
m2
Ret
ail a
rea
requ
irem
ent:
up to
10,
200m
2.
NB
Ret
ail a
rea
prov
isio
n lik
ely
to re
duce
to 4
,850
m2 w
ith
expa
nsio
n to
20
secu
rity
smar
tlane
s
Cat
erin
g ar
ea e
xpec
ted
to in
crea
se to
2,9
00m2 fo
llow
ing
reco
nfig
urat
ion.
Indi
cativ
e se
at re
quire
men
t 164
0 - 1
830,
to m
eet t
arge
t QS
M s
core
, but
this
is
a 's
oft'
cons
train
t.
Cat
erin
g ar
ea re
quire
men
t: up
to 4
,700
m2
Ret
ail a
rea
requ
irem
ent:
up to
10,
900m
2.
NB
Ret
ail a
rea
prov
isio
n lik
ely
to re
duce
to 4
,850
m2 w
ith e
xpan
sion
to
20 s
ecur
ity s
mar
tlane
s
Cat
erin
g ar
ea e
xpec
ted
to in
crea
se to
2,9
00m2 fo
llow
ing
reco
nfig
urat
ion.
FLIG
HT
CO
NN
ECTI
ON
SC
urre
nt c
apac
ity 2
lane
s; c
an e
xpan
d to
3 la
nes
Bus
y ho
ur p
asse
nger
s do
not
que
ue fo
r lon
ger t
han
5 m
inut
es o
n th
e bu
sy d
ay2
lane
s @
200
pph
thro
ughp
uts
(for m
ost o
f the
day
1 la
ne is
suf
ficie
nt)
2
lane
s @
200
pph
thro
ughp
uts
2
lane
s @
200
pph
thro
ughp
uts
2
lane
s @
200
pph
thro
ughp
uts
IM
MIG
RA
TIO
N IN
FLO
WB
usy
hour
EU
pas
seng
ers
do n
ot q
ueue
for l
onge
r th
an 1
0 m
inut
es;
Bus
y ho
ur n
on-E
U p
asse
nger
s do
not
que
ue fo
r lo
nger
than
20
min
utes
.
Bus
y H
our F
low
: ~22
00
@ 1
900
Bus
y H
our F
low
: ~24
50
@ 1
200
Bus
y H
our F
low
: ~30
00@
070
0B
usy
Hou
r Flo
w: ~
3350
@ 0
700
IMM
IGR
ATI
ON
DES
KS
Trad
ition
al d
esk
prov
isio
n: 1
7E-
pass
gat
e pr
ovis
ion:
5R
ange
of d
esk
requ
irem
ents
dep
endi
ng o
n pr
oact
ive
or re
activ
e de
sk o
peni
ng.
Trad
ition
al d
esk
requ
irem
ent:
24-3
2E
-pas
s ga
te re
quire
men
t: 9-
11
Figu
res
assu
me
no im
prov
emen
t in
trans
actio
n tim
es, f
rom
201
1 su
rvey
: EU
Tra
d 21
sec,
EU
E-p
ass
35se
c,
NE
U 1
10se
c (e
asy)
/ 30
0sec
(har
d)
Est
max
. Frid
ay q
ueue
tim
es o
f no
build
are
20
min
s (E
U) a
nd 4
5 m
ins
(non
-EU
)
Trad
ition
al d
esk
requ
irem
ent:
22-2
7E
-pas
s ga
te re
quire
men
t: 12
-13
Figu
res
assu
me
no im
prov
emen
t in
trans
actio
n tim
es, f
rom
201
1 su
rvey
: EU
Tra
d 21
sec,
EU
E-p
ass
35se
c,
NE
U 1
10se
c (e
asy)
/ 30
0sec
(har
d)E
U E
-pas
s re
ject
rate
of 2
0% w
ith re
ject
tim
e of
10s
ec b
efor
e pa
x us
es
EU
Tra
d de
sk
New
EU
E-p
ass
gate
s w
ith a
tran
sact
ion
time
of 1
5sec
wou
ld m
ean
a re
duce
d re
quire
men
t of 6
gat
es
Trad
ition
al d
esk
requ
irem
ent:
25-3
0E
-pas
s ga
te re
quire
men
t: 14
-17
Figu
res
assu
me
no im
prov
emen
t in
trans
actio
n tim
es, f
rom
201
1 su
rvey
: EU
Tra
d 21
sec,
EU
E-p
ass
35se
c,
NE
U 1
10se
c (e
asy)
/ 30
0sec
(har
d)E
U E
-pas
s re
ject
rate
of 2
0% w
ith re
ject
tim
e of
10s
ec b
efor
e pa
x us
es
EU
Tra
d de
sk
New
EU
E-p
ass
gate
s w
ith a
tran
sact
ion
time
of 1
5sec
wou
ld m
ean
a re
duce
d re
quire
men
t of 8
gat
es
Trad
ition
al d
esk
requ
irem
ent:
36-4
5E
-pas
s ga
te re
quire
men
t: 16
-20
Figu
res
assu
me
no im
prov
emen
t in
trans
actio
n tim
es, f
rom
201
1 su
rvey
: EU
Tr
ad 2
1sec
, EU
E-p
ass
35se
c,
NE
U 1
10se
c (e
asy)
/ 30
0sec
(har
d)E
U E
-pas
s re
ject
rate
of 2
0% w
ith re
ject
tim
e of
10s
ec b
efor
e pa
x us
es E
U
Trad
des
k
New
EU
E-p
ass
gate
s w
ith a
tran
sact
ion
time
of 1
5sec
wou
ld m
ean
a re
duce
d re
quire
men
t of 9
gat
es
REC
LAIM
BEL
TSC
urre
nt p
rovi
sion
9 In
t bel
ts fo
llow
ing
NTX
co
nstr
uctio
n (1
long
) and
2 D
om b
elts
.
Bel
t ava
ilabl
e fo
r all
fligh
ts d
urin
g bu
sy h
our,
to
supp
ort K
PI o
f all
pax
rece
ivin
g ba
ggag
e w
ithin
45
min
utes
of a
rriv
al o
n st
and.
Req
uire
men
t: IN
T: 6
-8 (o
f whi
ch 1
long
70m
+ be
lt, w
ith n
o w
ideb
ody
fligh
ts e
xpec
ted
to b
e sp
lit o
ver 2
bel
ts).
DO
M: 1
bel
t jus
t suf
ficie
nt th
ough
2 w
ould
be
idea
l to
redu
ce
cong
estio
n at
pea
k tim
es.
Req
uire
men
t: IN
T: 7
-8 b
elts
(of w
hich
idea
lly 2
long
70m
+ be
lts,
alth
ough
1 lo
ng b
elt w
ould
be
suffi
cien
t, ca
usin
g on
ly 1
wid
ebod
y fli
ght
to b
e sp
lit o
ver 2
bel
ts).
A38
0 ar
rival
idea
lly re
quire
s 2
belt
feed
s to
a lo
ng b
elt,
to im
prov
e ba
ggag
e de
liver
y tim
e.
DO
M: 1
bel
t jus
t suf
ficie
nt; 2
bel
t fee
ds w
ould
be
requ
ired
to a
void
som
efli
ghts
pot
entia
lly e
xper
ienc
ing
5-10
min
ute
dela
ys in
acc
essi
ng it
.
INT:
7-8
bel
ts (o
f whi
ch 2
long
70m
+ be
lts to
han
dle
wid
ebod
ies
on a
si
ngle
bel
t; w
ith o
nly
1 lo
ng b
elt u
p to
5 w
ideb
odie
s in
the
mor
ning
pea
k ar
e sp
lit o
ver 2
bel
ts o
r del
ayed
by
up to
20
min
utes
in a
cces
sing
the
long
bel
t)
A38
0 ar
rival
s id
eally
requ
ire 2
bel
t fee
ds to
a lo
ng b
elt,
to im
prov
e ba
ggag
e de
liver
y tim
e.
DO
M: 1
bel
t jus
t suf
ficie
nt; 2
bel
t fee
ds w
ould
be
requ
ired
to a
void
som
efli
ghts
pot
entia
lly e
xper
ienc
ing
5-10
min
ute
dela
ys in
acc
essi
ng it
.
INT:
9 b
elts
(of w
hich
2 o
r mor
e lo
ng 7
0m+
belts
to h
andl
e w
ideb
odie
s on
a
sing
le b
elt).
With
onl
y 1
long
bel
t up
to 8
wid
ebod
ies
in th
e m
orni
ng p
eak
are
split
ove
r 2 b
elts
or d
elay
ed b
y up
to 2
0 m
inut
es in
acc
essi
ng th
e lo
ng b
elt;
this
redu
ces
to 4
wid
ebod
y fli
ghts
with
2 lo
ng b
elts
.
A38
0 ar
rival
s id
eally
requ
ire 2
bel
t fee
ds to
a lo
ng b
elt,
to im
prov
e ba
ggag
e de
liver
y tim
e.
DO
M: 1
bel
t jus
t suf
ficie
nt; 2
bel
t fee
ds w
ould
be
requ
ired
to a
void
som
e fli
ghts
pot
entia
lly e
xper
ienc
ing
5-10
min
ute
dela
ys in
acc
essi
ng it
.
LAN
DSI
DE
RET
AIL
&
CA
TER
ING
Cat
erin
g ar
ea p
rovi
sion
: 1,4
00m
2
Ret
ail a
rea
prov
isio
n: 1
,800
m2
Land
side
pea
k oc
cupa
ncy:
Arr
ival
s co
ncou
rse
peak
oc
cupa
ncy
is ~
16%
of p
eak
hour
flow
+La
ndsi
de d
wel
l ass
umed
~10
min
utes
on
aver
age.
1.3m
2 cat
erin
g ar
ea p
er p
erso
n at
pea
k oc
cupa
ncy.
0.8
- 1.0
m2 re
tail
area
per
per
son
at p
eak
occu
panc
y
Arr
ival
s co
ncou
rse
peak
occ
upan
cy: 3
70La
ndsi
de d
epar
ture
s pe
ak o
ccup
ancy
: 530
Com
bine
d la
ndsi
de p
eak
occu
panc
y: u
p to
900
Cat
erin
g ar
ea re
quire
men
t: up
to 1
,170
m2
Ret
ail a
rea
requ
irem
ent:
720
- 900
m2
A
rriv
als
conc
ours
e pe
ak o
ccup
ancy
: 420
Land
side
dep
artu
res
peak
occ
upan
cy: 5
70C
ombi
ned
land
side
pea
k oc
cupa
ncy:
up
to 9
90
Cat
erin
g ar
ea re
quire
men
t: up
to 1
,290
m2
Ret
ail a
rea
requ
irem
ent:
790
- 990
m2
A
rriv
als
conc
ours
e pe
ak o
ccup
ancy
: 510
Land
side
dep
artu
res
peak
occ
upan
cy: 6
00C
ombi
ned
land
side
pea
k oc
cupa
ncy:
up
to 1
110
Cat
erin
g ar
ea re
quire
men
t: up
to 1
,440
m2
Ret
ail a
rea
requ
irem
ent:
890
- 1,1
10m2
A
rriv
als
conc
ours
e pe
ak o
ccup
ancy
: 530
Land
side
dep
artu
res
peak
occ
upan
cy: 6
00C
ombi
ned
land
side
pea
k oc
cupa
ncy:
up
to 1
130
Cat
erin
g ar
ea re
quire
men
t: up
to 1
,470
m2
Ret
ail a
rea
requ
irem
ent:
900
- 1,1
30m2
LAN
DSI
DE
TOIL
ETS
- D
EPA
RTU
RES
Cur
rent
pro
visi
on (1
st &
2nd
floo
rs):
19 M
ale
cubl
icle
s, 1
5 ur
inal
s ov
er 3
blo
cks,
26
Fem
ale
cubi
cles
ove
r 3 b
lock
s3
Dis
able
d to
ilets
80-9
0% to
ilet a
vaila
bilit
y du
ring
busy
hou
rR
equi
rem
ent t
o gi
ve 8
0-90
% a
vaila
bilit
y ov
er 3
blo
cks:
18-2
0 M
ale
cubi
cles
, 10-
11 u
rinal
s25
-28
Fem
ale
cubi
cles
R
equi
rem
ent t
o gi
ve 8
0-90
% a
vaila
bilit
y ov
er 3
blo
cks:
19-2
1 M
ale
cubi
cles
, 9-1
1 ur
inal
s27
-30
Fem
ale
cubi
cles
R
equi
rem
ent t
o gi
ve 8
0-90
% a
vaila
bilit
y ov
er 3
blo
cks:
19-2
2 M
ale
cubi
cles
, 10-
12 u
rinal
s28
-31
Fem
ale
cubi
cles
R
equi
rem
ent t
o gi
ve 8
0-90
% a
vaila
bilit
y ov
er 3
blo
cks:
19-2
2 M
ale
cubi
cles
, 10-
12 u
rinal
s28
-31
Fem
ale
cubi
cles
LAN
DSI
DE
TOIL
ETS
- A
RR
IVA
LS
Cur
rent
pro
visi
on (G
roun
d Fl
oor)
: 12
Mal
e cu
blic
les,
7 u
rinal
s ov
er 2
blo
cks,
17
Fem
ale
cubi
cles
ove
r 2 b
lock
s2
Dis
able
d to
ilets
80-9
0% to
ilet a
vaila
bilit
y du
ring
busy
hou
rR
equi
rem
ent t
o gi
ve 8
0-90
% a
vaila
bilit
y ov
er 2
blo
cks:
12-1
3 M
ale
cubi
cles
, 6-7
urin
als
18-2
0 Fe
mal
e cu
bicl
es
Req
uire
men
t to
give
80-
90%
ava
ilabi
lity
over
2 b
lock
s:13
-14
Mal
e cu
bicl
es, 7
-8 u
rinal
s20
-22
Fem
ale
cubi
cles
R
equi
rem
ent t
o gi
ve 8
0-90
% a
vaila
bilit
y ov
er 2
blo
cks:
15-1
7 M
ale
cubi
cles
, 7-9
urin
als
23-2
6 Fe
mal
e cu
bicl
es
Req
uire
men
t to
give
80-
90%
ava
ilabi
lity
over
2 b
lock
s:16
-18
Mal
e cu
bicl
es, 8
-9 u
rinal
s25
-28
Fem
ale
cubi
cles
IDL
TOIL
ETS
Cur
rent
pro
visi
on:
17 M
ale
cubl
icle
s, 1
4 ur
inal
s ov
er 3
blo
cks,
33
Fem
ale
cubi
cles
ove
r 3 b
lock
s3
Dis
able
d to
ilets
80-9
0% to
ilet a
vaila
bilit
y du
ring
busy
hou
rR
equi
rem
ent t
o gi
ve 8
0-90
% a
vaila
bilit
y ov
er 3
blo
cks:
22-2
5 M
ale
cubi
cles
, 11-
13 u
rinal
s33
-37
Fem
ale
cubi
cles
R
equi
rem
ent t
o gi
ve 8
0-90
% a
vaila
bilit
y ov
er 3
blo
cks:
26-2
9 M
ale
cubi
cles
, 13-
14 u
rinal
s38
-42
Fem
ale
cubi
cles
R
equi
rem
ent t
o gi
ve 8
0-90
% a
vaila
bilit
y ov
er 3
blo
cks:
26-2
9 M
ale
cubi
cles
, 13-
15 u
rinal
s39
-43
Fem
ale
cubi
cles
NB
pos
t-201
4 se
curit
y ex
pans
ion
wou
ld re
duce
pro
visi
on to
12
Mal
e cu
bicl
es, 9
urin
als
over
2 b
lock
s, 2
4 Fe
mal
e cu
bicl
es o
ver 2
bl
ocks
, 2 D
isab
led
toile
ts
R
equi
rem
ent t
o gi
ve 8
0-90
% a
vaila
bilit
y ov
er 3
blo
cks:
25-2
8 M
ale
cubi
cles
, 12-
14 u
rinal
s37
-41
Fem
ale
cubi
cles
NB
pos
t-201
4 se
curit
y ex
pans
ion
wou
ld re
duce
pro
visi
on to
12
Mal
e cu
bicl
es, 9
urin
als
over
2 b
lock
s, 2
4 Fe
mal
e cu
bicl
es o
ver 2
blo
cks,
2
Dis
able
d to
ilets
AIR
SID
E TO
ILET
S -
DEP
AR
TUR
ES P
IER
S
Cur
rent
pro
visi
on:
Pier
4: 4
MC
, 8 U
, 10
FC (3
blo
cks)
Pier
5: 8
MC
, 10
U, 1
5 FC
(4 b
lock
s)Pi
er 6
: 8 M
C, 4
U, 1
1 FC
(1 b
lock
)C
oach
sta
tion
(Gat
e 45
): 4
MC
, 4 U
, 6 F
C (1
blo
ck)
80-9
0% to
ilet a
vaila
bilit
y du
ring
busy
hou
rN
ot a
sses
sed
- use
201
4 fig
ures
as
a w
orst
cas
e
Pea
k ho
urly
pas
seng
er fl
ows:
Pie
r 4 1
650,
Pie
r 5 1
360,
Pie
r 6 1
430,
Coa
ch s
tn 1
410
Req
uire
men
t to
give
80-
90%
ava
ilabi
lity:
P
ier 4
: 9-1
1 M
C, 6
-7 U
, 13-
15 F
C (3
blo
cks)
Pie
r 5: 1
0-11
MC
, 7-8
U, 1
3-15
FC
(4 b
lock
s)P
ier 6
: 6 M
C, 3
-4 U
, 8-9
FC
(1 b
lock
)C
oach
sta
tion:
6 M
C, 3
-4 U
, 8-9
FC
(1 b
lock
)
Pea
k ho
urly
pas
seng
er fl
ows:
Pie
r 4 1
300,
Pie
r 5 1
650,
Pie
r 6 1
800,
Coa
ch s
tn 1
300
Req
uire
men
t to
give
80-
90%
ava
ilabi
lity:
P
ier 4
: 8-1
0 M
C, 6
U, 1
1-13
FC
(3 b
lock
s)P
ier 5
: 11-
13 M
C, 7
-8 U
, 14-
16 F
C (4
blo
cks)
Pie
r 6: 7
-8 M
C, 3
-4 U
, 10-
11 F
C (1
blo
ck)
Coa
ch s
tatio
n: 5
-6 M
C, 3
U, 8
-9 F
C (1
blo
ck)
N
ot y
et a
sses
sed
- ass
ume
2018
figu
res
AIR
SID
E TO
ILET
S - A
RR
IVA
LS
PIER
S
Cur
rent
pro
visi
on:
Pier
4: 2
MC
, 4 U
, 6 F
C (2
blo
cks)
Pier
5: N
ON
EPi
er 6
: 5 M
C, 3
U, 6
FC
(1 b
lock
)R
emot
e / c
oach
ed p
ax a
ssum
ed to
use
pre
-Im
mig
ratio
n fa
cilit
ies
80-9
0% to
ilet a
vaila
bilit
y du
ring
busy
hou
rN
ot a
sses
sed
- use
201
4 fig
ures
as
a w
orst
cas
e
Pea
k ho
urly
pax
flow
s:P
ier 4
158
0, P
ier 5
163
0, P
ier 6
141
0
Req
uire
men
t to
give
80-
90%
ava
ilabi
lity:
P
ier 4
: 6-7
MC
, 4 U
, 8-9
FC
(2 b
lock
s)P
ier 5
: 5 M
C, 3
U, 7
-8 F
C (1
blo
ck)
Pie
r 6: 4
-5 M
C, 3
U, 6
-7 F
C (1
blo
ck)
P
eak
hour
ly p
ax fl
ows:
Pie
r 4 1
250,
Pie
r 5 1
550,
Pie
r 6 1
400
Req
uire
men
t to
give
80-
90%
ava
ilabi
lity:
P
ier 4
: 6-7
MC
, 4 U
, 8-9
FC
(2 b
lock
s)P
ier 5
: 5 M
C, 3
U, 7
-8 F
C (1
blo
ck)
Pie
r 6: 4
-5 M
C, 3
U, 6
-7 F
C (1
blo
ck)
N
ot y
et a
sses
sed
- ass
ume
2018
figu
res
AIR
SID
E TO
ILET
S - A
RR
IVA
LS
BU
FFER
PR
E-IM
MIG
RA
TIO
N
Cur
rent
pro
visi
on:
3 M
ale
cubl
icle
s, 3
urin
als
over
1 b
lock
, 4
Fem
ale
cubi
cles
ove
r 1 b
lock
1 D
isab
led
toile
t
80-9
0% to
ilet a
vaila
bilit
y du
ring
busy
hou
rR
equi
rem
ent t
o gi
ve 8
0-90
% a
vaila
bilit
y ov
er 1
blo
ck:
5 M
ale
cubi
cles
, 3 u
rinal
s5-
6 Fe
mal
e cu
bicl
es
Req
uire
men
t to
give
80-
90%
ava
ilabi
lity
over
1 b
lock
:5
Mal
e cu
bicl
es, 3
urin
als
6-7
Fem
ale
cubi
cles
R
equi
rem
ent t
o gi
ve 8
0-90
% a
vaila
bilit
y ov
er 1
blo
ck:
5-6
Mal
e cu
bicl
es, 3
urin
als
6-7
Fem
ale
cubi
cles
R
equi
rem
ent t
o gi
ve 8
0-90
% a
vaila
bilit
y ov
er 1
blo
ck:
6-7
Mal
e cu
bicl
es, 3
-4 u
rinal
s7-
8 Fe
mal
e cu
bicl
es
AIR
SID
E TO
ILET
S - B
UFF
ER
PRE-
REC
LAIM
Cur
rent
pro
visi
on:
6 M
ale
cubl
icle
s, 4
urin
als
over
1 b
lock
, 7
Fem
ale
cubi
cles
ove
r 1 b
lock
1 D
isab
led
toile
t
80-9
0% to
ilet a
vaila
bilit
y du
ring
busy
hou
rR
equi
rem
ent t
o gi
ve 8
0-90
% a
vaila
bilit
y ov
er 1
blo
ck:
7-8
Mal
e cu
bicl
es, 4
urin
als
9-10
Fem
ale
cubi
cles
R
equi
rem
ent t
o gi
ve 8
0-90
% a
vaila
bilit
y ov
er 1
blo
ck:
7-8
Mal
e cu
bicl
es, 4
urin
als
9-10
Fem
ale
cubi
cles
R
equi
rem
ent t
o gi
ve 8
0-90
% a
vaila
bilit
y ov
er 1
blo
ck:
9-10
Mal
e cu
bicl
es, 4
-5 u
rinal
s11
-12
Fem
ale
cubi
cles
R
equi
rem
ent t
o gi
ve 8
0-90
% a
vaila
bilit
y ov
er 1
blo
ck:
9-11
Mal
e cu
bicl
es, 5
urin
als
12-1
3 Fe
mal
e cu
bicl
es
AIR
SID
E TO
ILET
S - D
OM
ESTI
C
REC
LAIM
Cur
rent
pro
visi
on:
Non
e80
-90%
toile
t ava
ilabi
lity
durin
g bu
sy h
our
Req
uire
men
t to
give
80-
90%
ava
ilabi
lity
over
1 b
lock
:3
Mal
e cu
bicl
es, 2
urin
als
3-4
Fem
ale
cubi
cles
R
equi
rem
ent t
o gi
ve 8
0-90
% a
vaila
bilit
y ov
er 1
blo
ck:
3 M
ale
cubi
cles
, 2 u
rinal
s3-
4 Fe
mal
e cu
bicl
es
Req
uire
men
t to
give
80-
90%
ava
ilabi
lity
over
1 b
lock
:3
Mal
e cu
bicl
es, 2
urin
als
3-4
Fem
ale
cubi
cles
R
equi
rem
ent t
o gi
ve 8
0-90
% a
vaila
bilit
y ov
er 1
blo
ck:
3-4
Mal
e cu
bicl
es, 2
urin
als
4 Fe
mal
e cu
bicl
es
GA
TWIC
K N
OR
TH T
ERM
INA
L FA
CIL
ITIE
S: P
RO
VID
ED A
ND
FO
REC
AST
TO
201
8/19
, WIT
H R
AG
STA
TUS
INC
LUD
ING
Q5
& Q
5+1
DEV
ELO
PMEN
T
3600
(rol
ling
hour
) [ro
lling
eve
ry 3
0 m
ins]
3280
(rol
ling
hour
) [ro
lling
eve
ry 3
0 m
ins]
660
(rol
ling
hour
) [ro
lling
eve
ry 3
0 m
ins]
3730
(rol
ling
hour
) [ro
lling
eve
ry 3
0 m
ins]
SH&
E H
IGH
CA
SE 2
026/
27
(45
mpp
a)
Faci
litie
s re
quire
d by
Sum
mer
202
6
EZY
rem
ains
spl
it be
twee
n N
T &
ST
No
Top
10 c
arrie
r mov
es
ST: ~
22.5
mpp
aN
T: ~
22.5
mpp
a
976
NO
RTH
TER
MIN
AL
- TO
ILET
S
2400
(rol
ling
hour
) [ro
lling
eve
ry 3
0 m
ins]
CH
ECK
-IN
2250
(rol
ling
hour
)
550
(rol
ling
hour
)
53
NO
RTH
TER
MIN
AL
55
Che
ck In
Stra
tegy
: onc
e E
BS
ope
ns p
asse
nger
s ca
nch
eck
in b
ags
on a
rriv
al a
t airp
ort.
Sho
rt-ha
ul c
hute
s op
en 9
0 m
inut
es b
efor
e S
TD,
long
-hau
l 180
min
utes
. Chu
tes
clos
e 30
min
utes
be
fore
STD
, with
15
min
ute
buffe
r for
suc
cess
ive
fligh
ts.
100%
LFs
and
20%
con
tinge
ncy
uplif
t.
0.45
- 0.
50 s
eats
per
pea
k oc
cupa
ncy
pax;
1.
3m2 p
er s
eat;
Ret
ail /
cat
erin
g - b
ased
on
GA
L co
mm
erci
al
stan
dard
s:1.
3m2 fo
r all
IDL
pax,
40%
in c
ater
ing;
3.
0m2 fo
r all
IDL
pax,
35%
in re
tail;
Circ
ulat
ion
spac
e: 2
0%-3
0% o
f tot
al ID
L sp
ace
EZY
rem
ains
spl
it be
twee
n N
T &
ST
No
Top
10 c
arrie
r mov
es
888
3100
(rol
ling
hour
)
ST: ~
17.4
mpp
aN
T: ~
17.0
mpp
aST
: ~18
.4m
ppa
NT:
~19
.3m
ppa
EZY
rem
ains
spl
it be
twee
n N
T &
ST
No
Top
10 c
arrie
r mov
es
868
(Aug
ust F
riday
sch
edul
e, s
naps
hop
at F
eb12
)
53
SH&
E H
IGH
CA
SE 2
018/
19
(41
mpp
a)
Faci
litie
s re
quire
d by
Sum
mer
201
8
ST: ~
20.0
mpp
aN
T: ~
21.0
mpp
a
943
55
EZY
rem
ains
spl
it be
twee
n N
T &
ST
EZY
bala
nce
shift
to S
T w
ith P
ier 1
reop
en
No
Top
10 c
arrie
r mov
es
3760
(rol
ling
hour
) [ro
lling
eve
ry 3
0 m
ins]
2750
(rol
ling
hour
) [ro
lling
eve
ry 3
0 m
ins]
540
(rol
ling
hour
) [ro
lling
eve
ry 3
0 m
ins]
540
(rol
ling
hour
) [ro
lling
eve
ry 3
0 m
ins]
15


GA
TW
ICk
SO
UTh
TER
MIN
AL F
AC
ILIT
IES: P
RO
VID
ED
AN
D F
OR
EC
AST T
O 2
018
/ 2
019
, WIT
h R
AG
STA
TU
S IN
CLU
DIN
G Q
5 &
Q5+1
DEV
ELO
PM
EN
T
Dat
e of
issu
e:
8 Ju
ne 2
012
Cur
rent
pro
visi
onSe
rvic
e St
anda
rds
assu
med
in
asse
ssm
ents
Airl
ine
/ Ter
min
al
Ass
umpt
ions
AN
NU
AL
PAX
TOTA
L B
USY
DA
Y M
OVE
MEN
TS
MA
XIM
UM
HO
UR
LY
MO
VEM
ENTS
BU
SY H
OU
R D
EPA
RTU
RES
R
UN
WA
Y FL
OW
INTE
RN
ATI
ON
AL
AR
RIV
ALS
B
USY
HO
UR
RU
NW
AY
FLO
W
DO
MES
TIC
AR
RIV
ALS
BU
SY
HO
UR
RU
NW
AY
FLO
W
Bus
y H
our F
low
: ~36
00@
070
0B
usy
Hou
r Flo
w: ~
3600
@ 0
700
Bus
y H
our F
low
: ~35
20@
070
0B
usy
Hou
r Flo
w: ~
3930
@ 0
700
Tota
l Tra
ditio
nal /
Bag
Dro
p D
esk
Prov
isio
n: 1
89To
tal K
iosk
Pro
visi
on: 3
5
Eco
nom
y: m
axim
um q
ueue
tim
e of
10
min
utes
in
tota
l on
the
busy
day
(5 m
inut
es e
ach
for k
iosk
s an
d ba
g dr
op).
CIP
: max
imum
que
ue ti
me
of 3
min
utes
in to
tal a
t tra
ditio
nal d
esks
Ass
umin
g 20
11 C
heck
In ty
pe s
plits
& c
heck
-in o
pens
at -
4h fo
r LH
an
d -2
.5h
for S
H, T
radi
tiona
l Des
k an
d B
ag D
rop
@90
% U
tilis
atio
n,
and
10%
Ser
vice
Des
k U
plift
:
Tota
l Tra
ditio
nal D
esk
Dem
and:
159
Tota
l Bag
Dro
p D
eman
d: 3
5C
omib
ined
Tra
ditio
nal D
esk
& B
ag D
rop
Dem
and:
194
Kio
sk D
eman
d @
100%
Util
isat
ion:
14
- 34
Plan
ned
Des
k Pr
ovis
ion:
189
Plan
ned
Kio
sk P
rovi
sion
: 35
Ass
umin
g an
ytim
e ch
eck-
in, T
radi
tiona
l Des
k an
d B
ag D
rop
@90
%
Util
isat
ion,
and
10%
Ser
vice
Des
k U
plift
Tota
l Tra
ditio
nal D
esk
Dem
and:
104
Tota
l Bag
Dro
p D
eman
d: 3
0C
omib
ined
Tra
ditio
nal D
esk
& B
ag D
rop
Dem
and:
134
Kio
sk D
eman
d @
100%
Util
isat
ion:
16
- 47
Plan
ned
Des
k Pr
ovis
ion:
189
(168
if L
ower
B re
mov
ed)
Plan
ned
Kio
sk P
rovi
sion
: 35
Ass
umin
g an
ytim
e ch
eck-
in, T
radi
tiona
l Des
k an
d B
ag D
rop
@90
%
Util
isat
ion,
and
10%
Ser
vice
Des
k U
plift
Tota
l Tra
ditio
nal D
esk
Dem
and:
70
Tota
l Bag
Dro
p D
eman
d: 4
4C
omib
ined
Tra
ditio
nal D
esk
& B
ag D
rop
Dem
and:
114
Kio
sk D
eman
d @
100%
Util
isat
ion:
17
- 67
Ass
umin
g an
ytim
e ch
eck-
in, T
radi
tiona
l Des
k an
d B
ag D
rop
@90
%
Util
isat
ion,
and
10%
Ser
vice
Des
k U
plift
App
lyin
g 20
18 a
ssum
ptio
ns o
n ch
eck-
in ty
pe s
plits
Tota
l Tra
ditio
nal D
esk
Dem
and:
85
Tota
l Bag
Dro
p D
eman
d: 4
6C
omib
ined
Tra
ditio
nal D
esk
& B
ag D
rop
Dem
and:
131
Kio
sk D
eman
d @
100%
Util
isat
ion:
14
- 69
BA
GG
AG
E SY
STEM
- M
AK
E U
P PO
SITI
ON
SPr
ovis
ion:
~14
8 us
eabl
e M
UPs
Ass
ume
SH
chu
tes
open
at S
TD-1
50 m
ins,
LH
at S
T-24
0 m
ins.
S
ome
chut
es c
hang
e be
twee
n ha
ndle
rs d
urin
g th
e da
y. C
hute
s cl
ose
30 m
inut
es b
efor
e S
TD, w
ith 1
5 m
inut
e bu
ffer f
or s
ucce
ssiv
e fli
ghts
.
Req
uire
men
t: M
UP
s 14
0 (in
c 20
% c
ontin
genc
y)
S
H c
hute
ope
ning
at S
TD-1
50, L
H a
t STD
-240
, clo
se a
t STD
-30
with
15
min
buf
fer:
MU
Ps
138
Afte
r EB
S c
hute
ope
ning
at S
H S
TD-9
0, L
H S
TD-1
80: M
UP
s 10
9
Plan
ned
MU
P Pr
ovis
ion:
108
A
fter E
BS
chu
te o
peni
ng a
t SH
STD
-90,
LH
STD
-180
: MU
Ps
104
Plan
ned
MU
P Pr
ovis
ion:
108
A
fter E
BS
chu
te o
peni
ng a
t SH
STD
-90,
LH
STD
-180
: MU
Ps
113
Plan
ned
MU
P Pr
ovis
ion:
108
BA
GG
AG
E SY
STEM
- EA
RLY
B
AG
STO
RE
Early
Bag
Sto
re: 0
Req
uire
men
t: S
pare
chu
tes
to s
tore
ear
ly b
ags
at p
eak,
to e
nabl
e so
me
carr
iers
to c
ontin
ue a
nytim
e ch
eck-
in.
Req
uire
men
t: 67
5 ba
g st
orag
e =
17 M
UP
s at
40
bags
/ M
UP
Afte
r EB
S o
peni
ng a
nd S
H c
hute
ope
ning
STD
-90,
LH
STD
-180
: 1,
940
bag
capa
city
A
fter E
BS
ope
ning
and
SH
chu
te o
peni
ng S
TD-9
0, L
H S
TD-1
80:
1,95
0 ba
g ca
paci
ty
Plan
ned
Prov
isio
n by
Dec
201
4:
Early
Bag
Sto
re 2
500+
A
fter E
BS
ope
ning
and
SH
chu
te o
peni
ng S
TD-9
0, L
H S
TD-1
80:
2,06
0 ba
g ca
paci
ty
Plan
ned
Prov
isio
n by
Dec
201
4:
Early
Bag
Sto
re 2
500+
CEN
TRA
L SE
AR
CH
Cur
rent
pro
visi
on: 1
9 la
nes
Eco
nom
y: b
usy
hour
pas
seng
ers
do n
ot q
ueue
for
long
er th
an 5
min
utes
on
the
busy
day
CIP
: bus
y ho
ur p
asse
nger
s do
not
que
ue fo
r lon
ger
than
1 m
inut
e on
the
busy
day
20-2
1 la
nes
@ 2
00 p
ph th
roug
hput
s
20 la
nes
@ 2
00 p
ph th
roug
hput
s
19 la
nes
@ 2
00 p
ph th
roug
hput
s.
21
lane
s @
200
pph
thro
ughp
uts.
IDL
TOTA
L A
REA
IDL
tota
l spa
ce: ~
14,7
00m2
Ass
umin
g ch
eck-
in o
pens
at -
4h fo
r LH
and
-2.5
h fo
r SH
: Bus
y D
ay
Pea
k O
ccup
ancy
: ~35
00
Tota
l ID
L sp
ace
reco
mm
ende
d: a
t lea
st 2
1,80
0m2
(exc
ludi
ng to
ilets
, sp
ecia
l lou
nges
, ret
ail s
tora
ge e
tc).
NB
Tot
al a
rea
prov
isio
n lik
ely
to in
crea
se to
~16
,200
m2
with
Ph
ase
1 &
2
A
ssum
ing
anyt
ime
chec
k-in
: Bus
y D
ay P
eak
Occ
upan
cy: ~
3920
Tota
l ID
L sp
ace
reco
mm
ende
d: a
t lea
st 2
4,10
0m2 (e
xclu
ding
toile
ts,
spec
ial l
oung
es, r
etai
l sto
rage
etc
).
NB
Tot
al a
rea
prov
isio
n lik
ely
to in
crea
se to
~16
,200
m2
with
sec
urity
re
loca
tion
A
ssum
ing
anyt
ime
chec
k-in
: Bus
y D
ay P
eak
Occ
upan
cy: ~
3820
Tota
l ID
L sp
ace
reco
mm
ende
d: a
t lea
st 2
3,30
0m2 (e
xclu
ding
toile
ts,
spec
ial l
oung
es, r
etai
l sto
rage
etc
).
NB
Tot
al a
rea
prov
isio
n lik
ely
to in
crea
se to
~16
,200
m2
with
sec
urity
re
loca
tion
A
ssum
ing
anyt
ime
chec
k-in
: Bus
y D
ay P
eak
Occ
upan
cy: ~
4130
Tota
l ID
L sp
ace
reco
mm
ende
d: a
t lea
st 2
5,30
0m2 (e
xclu
ding
toile
ts,
spec
ial l
oung
es, r
etai
l sto
rage
etc
).
NB
Tot
al a
rea
prov
isio
n lik
ely
to in
crea
se to
~16
,200
m2 w
ith s
ecur
ity
relo
catio
n
IDL
SEA
TIN
G, R
ETA
IL &
C
ATE
RIN
G
Seat
ing
prov
isio
n: 1
486
Cat
erin
g ar
ea p
rovi
sion
: 350
0m2 (i
nclu
ding
kitc
hen
and
othe
r non
-pas
seng
er a
reas
) with
158
9 se
ats
Ret
ail a
rea
prov
isio
n: 6
500m
2 .
Indi
cativ
e se
at re
quire
men
t 157
5 - 1
750,
to m
eet t
arge
t QS
M s
core
on
bus
y da
y, b
ut th
is is
a 's
oft'
cons
train
t.
Cat
erin
g ar
ea re
quire
men
t: up
to 4
,600
m2
Ret
ail a
rea
requ
irem
ent:
up to
10,
500m
2.
NB
Ret
ail a
rea
prov
isio
n lik
ely
to in
crea
se to
~6,
800m
2 with
Ph
ase
1 &
2
Indi
cativ
e se
at re
quire
men
t 176
0 - 1
960,
to m
eet t
arge
t QS
M s
core
, but
th
is is
a 's
oft'
cons
train
t.
Cat
erin
g ar
ea re
quire
men
t: up
to 5
,100
m2
Ret
ail a
rea
requ
irem
ent:
up to
11,
700m
2.
NB
Ret
ail a
rea
prov
isio
n lik
ely
to in
crea
se to
~6,
800m
2w
ith s
ecur
ity
relo
catio
n
Indi
cativ
e se
at re
quire
men
t 172
0 - 1
910,
to m
eet t
arge
t QS
M s
core
, but
th
is is
a 's
oft'
cons
train
t.
Cat
erin
g ar
ea re
quire
men
t: up
to 5
,000
m2
Ret
ail a
rea
requ
irem
ent:
up to
11,
400m
2.
NB
Ret
ail a
rea
prov
isio
n lik
ely
to in
crea
se to
~6,
800m
2w
ith s
ecur
ity
relo
catio
n
Indi
cativ
e se
at re
quire
men
t 186
0 - 2
070,
to m
eet t
arge
t QS
M s
core
, but
th
is is
a 's
oft'
cons
train
t.
Cat
erin
g ar
ea re
quire
men
t: up
to 5
,400
m2
Ret
ail a
rea
requ
irem
ent:
up to
12,
400m
2.
NB
Ret
ail a
rea
prov
isio
n lik
ely
to in
crea
se to
~6,
800m
2 with
sec
urity
re
loca
tion
FLIG
HT
CO
NN
ECTI
ON
SC
urre
nt p
rovi
sion
: 1 la
ne; c
an e
xpan
d to
2 la
nes
Bus
y ho
ur p
asse
nger
s do
not
que
ue fo
r lon
ger t
han
5 m
inut
es o
n th
e bu
sy d
ay1
lane
@ 2
00pp
h th
roug
hput
s
1 la
ne @
200
pph
thro
ughp
uts
1
lane
@ 2
00pp
h th
roug
hput
s
1 la
ne @
200
pph
thro
ughp
uts
IM
MIG
RA
TIO
N IN
FLO
WB
usy
hour
EU
pas
seng
ers
do n
ot q
ueue
for l
onge
r th
an 1
0 m
inut
es;
Bus
y ho
ur n
on-E
U p
asse
nger
s do
not
que
ue fo
r lo
nger
than
20
min
utes
.
Bus
y H
our F
low
: ~27
00
@ 1
000
Bus
y H
our F
low
: ~27
20@
120
0B
usy
Hou
r Flo
w: 2
900
@ 1
200
Bus
y H
our F
low
: 325
0@
150
0
IMM
IGR
ATI
ON
DES
KS
Trad
ition
al d
esk
prov
isio
n: 1
8E-
pass
gat
e pr
ovis
ion:
5R
ange
of d
esk
requ
irem
ents
dep
endi
ng o
n pr
oact
ive
or re
activ
e de
sk o
peni
ng.
Trad
ition
al d
esk
requ
irem
ent:
20-2
4E
-pas
s ga
te re
quire
men
t: 12
-16
Figu
res
assu
me
no im
prov
emen
t in
trans
actio
n tim
es, f
rom
201
1 su
rvey
: EU
Tra
d 18
sec,
EU
E-p
ass
40se
c,
NE
U 1
10se
c (e
asy)
/ 30
0sec
(har
d)
Est
max
. Frid
ay q
ueue
tim
es o
f no
build
are
16
min
s (E
U) a
nd 3
3 m
ins
(non
-EU
)
Spac
e sa
fegu
arde
d fo
r 10
e-pa
ss g
ates
.
Trad
ition
al d
esk
requ
irem
ent:
18-2
3E
-pas
s ga
te re
quire
men
t: 16
-20
Figu
res
assu
me
no im
prov
emen
t in
trans
actio
n tim
es, f
rom
201
1 su
rvey
: E
U T
rad
18se
c, E
U E
-pas
s 40
sec,
N
EU
110
sec
(eas
y) /
300s
ec (h
ard)
EU
E-p
ass
reje
ct ra
te o
f 20%
with
reje
ct ti
me
of 1
0sec
bef
ore
pax
uses
E
U T
rad
desk
New
EU
E-p
ass
gate
s w
ith a
tran
sact
ion
time
of 1
5sec
wou
ld m
ean
a re
duce
d re
quire
men
t of
9 ga
tes
Trad
ition
al d
esk
requ
irem
ent:
14-1
8E
-pas
s ga
te re
quire
men
t: 21
-28
Figu
res
assu
me
no im
prov
emen
t in
trans
actio
n tim
es, f
rom
201
1 su
rvey
: E
U T
rad
18se
c, E
U E
-pas
s 40
sec,
N
EU
110
sec
(eas
y) /
300s
ec (h
ard)
EU
E-p
ass
reje
ct ra
te o
f 20%
with
reje
ct ti
me
of 1
0sec
bef
ore
pax
uses
E
U T
rad
desk
New
EU
E-p
ass
gate
s w
ith a
tran
sact
ion
time
of 1
5sec
wou
ld m
ean
a re
duce
d re
quire
men
t of
12 g
ates
Trad
ition
al d
esk
requ
irem
ent:
15-2
0E
-pas
s ga
te re
quire
men
t: 22
-29
Figu
res
assu
me
no im
prov
emen
t in
trans
actio
n tim
es, f
rom
201
1 su
rvey
: E
U T
rad
18se
c, E
U E
-pas
s 40
sec,
N
EU
110
sec
(eas
y) /
300s
ec (h
ard)
EU
E-p
ass
reje
ct ra
te o
f 20%
with
reje
ct ti
me
of 1
0sec
bef
ore
pax
uses
E
U T
rad
desk
New
EU
E-p
ass
gate
s w
ith a
tran
sact
ion
time
of 1
5sec
wou
ld m
ean
a re
duce
d re
quire
men
t of
12 g
ates
REC
LAIM
BEL
TSC
urre
nt p
rovi
sion
8 In
t bel
ts (o
f whi
ch 2
long
70m
+)an
d 1
Dom
bel
t.B
elt a
vaila
ble
for a
ll fli
ghts
dur
ing
busy
hou
r, to
su
ppor
t KP
I of a
ll pa
x re
ceiv
ing
bagg
age
with
in 4
5 m
inut
es o
f arr
ival
on
stan
d.
Req
uire
men
t: IN
T: 7
-8 (i
nc 2
long
bel
ts, t
houg
h th
ere
may
be
an
issu
e w
ith 3
Virg
in 7
47 a
rriv
als
sche
dule
d w
ithin
20
min
utes
- th
e 3r
d fli
ght m
ay n
eed
to b
e sp
lit o
ver 2
bel
ts, e
lse
dela
yed
in
acce
ssin
g a
long
bel
t or u
se a
sho
rter b
elt w
ith re
sulti
ng p
ax
crow
ding
)
DO
M: 1
bel
t jus
t suf
ficie
nt
Req
uire
men
t: IN
T: 7
(inc
2 lo
ng b
elts
; cur
rent
bel
t len
gths
suf
ficie
nt,
thou
gh o
ne w
ideb
ody
may
nee
d to
be
split
ove
r 2 s
mal
ler b
elts
, or b
e de
laye
d by
up
to 2
0 m
ins
in a
cces
sing
a lo
ng b
elt),
DO
M: 1
bel
t suf
ficie
nt.
Q5
plan
to re
duce
num
ber o
f Int
bel
ts to
7, u
sing
the
exis
ting
8th
belt
as a
repl
acem
ent D
om b
elt
Req
uire
men
t: IN
T: 7
-8 (i
nc 2
long
bel
ts; c
urre
nt b
elt l
engt
hs s
uffic
ient
, th
ough
one
wid
ebod
y m
ay n
eed
to b
e sp
lit o
ver 2
sm
alle
r bel
ts, o
r be
dela
yed
by u
p to
20
min
s in
acc
essi
ng a
long
bel
t),
DO
M: 1
bel
t suf
ficie
nt.
Q5
plan
to re
duce
num
ber o
f Int
bel
ts to
7, u
sing
the
exis
ting
8th
belt
as a
repl
acem
ent D
om b
elt
Req
uire
men
t: IN
T: 8
(inc
2 lo
ng b
elts
; cur
rent
bel
t len
gths
suf
ficie
nt,
thou
gh o
ne w
ideb
ody
may
nee
d to
be
split
ove
r 2 s
mal
ler b
elts
, or b
e de
laye
d by
up
to 2
0 m
ins
in a
cces
sing
a lo
ng b
elt),
DO
M: 1
bel
t suf
ficie
nt.
Q5
plan
to re
duce
num
ber o
f Int
bel
ts to
7, u
sing
the
exis
ting
8th
belt
as a
repl
acem
ent D
om b
elt
LAN
DSI
DE
RET
AIL
& C
ATE
RIN
GC
ater
ing
area
pro
visi
on: 1
,320
m2
Ret
ail a
rea
prov
isio
n: 8
50m2
Land
side
pea
k oc
cupa
ncy:
Arr
ival
s co
ncou
rse
peak
oc
cupa
ncy
is ~
20%
of p
eak
hour
flow
+La
ndsi
de d
wel
l ass
umed
~10
min
utes
on
aver
age.
1.3m
2 cat
erin
g ar
ea p
er p
erso
n at
pea
k oc
cupa
ncy.
0.8
- 1.0
m2 re
tail
area
per
per
son
at p
eak
occu
panc
y
Arr
ival
s co
ncou
rse
peak
occ
upan
cy: 5
60La
ndsi
de d
epar
ture
s pe
ak o
ccup
ancy
: 600
Com
bine
d la
ndsi
de p
eak
occu
panc
y: u
p to
116
0
Cat
erin
g ar
ea re
quire
men
t: 1,
560m
2
Ret
ail a
rea
requ
irem
ent:
930
- 1,1
60m
2
A
rriv
als
conc
ours
e pe
ak o
ccup
ancy
: 560
Land
side
dep
artu
res
peak
occ
upan
cy: 6
00C
ombi
ned
land
side
pea
k oc
cupa
ncy:
up
to 1
160
Cat
erin
g ar
ea re
quire
men
t: 1,
560m
2
Ret
ail a
rea
requ
irem
ent:
930
- 1,1
60m
2
A
rriv
als
conc
ours
e pe
ak o
ccup
ancy
: 610
Land
side
dep
artu
res
peak
occ
upan
cy: 5
90C
ombi
ned
land
side
pea
k oc
cupa
ncy:
up
to 1
200
Cat
erin
g ar
ea re
quire
men
t: 1,
610m
2
Ret
ail a
rea
requ
irem
ent:
960
- 1,2
00m
2
A
rriv
als
conc
ours
e pe
ak o
ccup
ancy
: 660
Land
side
dep
artu
res
peak
occ
upan
cy: 6
60C
ombi
ned
land
side
pea
k oc
cupa
ncy:
up
to 1
320
Cat
erin
g ar
ea re
quire
men
t: 1,
720m
2
Ret
ail a
rea
requ
irem
ent:
1,06
0 - 1
,320
m2
LAN
DSI
DE
TOIL
ETS
Cur
rent
pro
visi
on:
21 M
ale
cubl
icle
s, 2
3 ur
inal
s ov
er 4
blo
cks
(inc
1 bl
ock,
11
cubi
cles
8 u
rinal
s, w
ith w
ashb
asin
with
in
cubi
cle)
,38
Fem
ale
cubi
cles
ove
r 4 b
lock
s (in
c 1
bloc
k, 2
0 cu
bicl
es, w
ith w
ashb
asin
with
in c
ubic
le)
3 D
isab
led
toile
ts
80-9
0% to
ilet a
vaila
bilit
y du
ring
busy
hou
r
Req
uire
men
t to
give
80-
90%
ava
ilabi
lity
over
4 b
lock
s:31
-35
Mal
e cu
bicl
es, 1
6-18
urin
als
47-5
2 Fe
mal
e cu
bicl
es
NB
toile
t occ
upan
cies
not
incr
ease
d fo
r the
1 b
lock
with
was
hbas
in
with
in c
ubic
les,
to re
flect
long
er o
ccup
ancy
tim
e
R
equi
rem
ent t
o gi
ve 8
0-90
% a
vaila
bilit
y ov
er 4
blo
cks:
31-3
5 M
ale
cubi
cles
, 16-
18 u
rinal
s47
-52
Fem
ale
cubi
cles
NB
toile
t occ
upan
cies
not
incr
ease
d fo
r the
1 b
lock
with
was
hbas
in
with
in c
ubic
les,
to re
flect
long
er o
ccup
ancy
tim
e
R
equi
rem
ent t
o gi
ve 8
0-90
% a
vaila
bilit
y ov
er 4
blo
cks:
32-3
5 M
ale
cubi
cles
, 16-
18 u
rinal
s48
-53
Fem
ale
cubi
cles
R
equi
rem
ent t
o gi
ve 8
0-90
% a
vaila
bilit
y ov
er 4
blo
cks:
34-3
8 M
ale
cubi
cles
, 17-
19 u
rinal
s51
-56
Fem
ale
cubi
cles
IDL
TOIL
ETS
Cur
rent
pro
visi
on:
33 M
ale
cubl
icle
s, 1
8 ur
inal
s ov
er 4
blo
cks,
49
Fem
ale
cubi
cles
ove
r 4 b
lock
s4
Dis
able
d to
ilets
80-9
0% to
ilet a
vaila
bilit
y du
ring
busy
hou
rR
equi
rem
ent t
o gi
ve 8
0-90
% a
vaila
bilit
y ov
er 4
blo
cks:
26-3
0 M
ale
cubi
cles
, 14-
16 u
rinal
s39
-43
Fem
ale
cubi
cles
R
equi
rem
ent t
o gi
ve 8
0-90
% a
vaila
bilit
y ov
er 4
blo
cks:
29-3
2 M
ale
cubi
cles
, 15-
17 u
rinal
s43
-47
Fem
ale
cubi
cles
R
equi
rem
ent t
o gi
ve 8
0-90
% a
vaila
bilit
y ov
er 4
blo
cks:
30-3
4 M
ale
cubi
cles
, 15-
18 u
rinal
s45
-50
Fem
ale
cubi
cles
R
equi
rem
ent t
o gi
ve 8
0-90
% a
vaila
bilit
y ov
er 4
blo
cks:
31-3
5 M
ale
cubi
cles
, 16-
18 u
rinal
s47
-52
Fem
ale
cubi
cles
AIR
SID
E TO
ILET
S -
DEP
AR
TUR
ES P
IER
S
Cur
rent
pro
visi
on:
Pier
1: 3
MC
, 3 U
, 4 F
C (3
blo
cks)
Pier
2: 9
MC
, 7 U
, 11
FC (3
blo
cks)
Pier
3: 8
MC
, 8 U
, 10
FC (2
blo
cks)
Coa
ch s
tatio
n (G
ate
90):
NO
NE
80-9
0% to
ilet a
vaila
bilit
y du
ring
busy
hou
rN
ot a
sses
sed
- use
201
4 fig
ures
as
a w
orst
cas
e
Pea
k ho
urly
pas
seng
er fl
ows:
Pie
r 1 n
/a, P
ier 2
270
0, P
ier 3
220
0, C
oach
stn
900
Req
uire
men
t to
give
80-
90%
ava
ilabi
lity:
P
ier 1
: N/A
(ass
umed
to b
e cl
osed
)P
ier 2
: 13-
14 M
C, 7
-8 U
, 18-
20 F
C (3
blo
cks)
Pie
r 3: 1
0-11
MC
, 5-6
U, 1
4-15
FC
(2 b
lock
s)C
oach
sta
tion:
4-5
MC
, 2-3
U, 6
FC
(1 b
lock
)
Pea
k ho
urly
pas
seng
er fl
ows:
Pie
r 1 6
70, P
ier 2
340
0, P
ier 3
115
0, C
oach
stn
600
Req
uire
men
t to
give
80-
90%
ava
ilabi
lity:
P
ier 1
: 4 M
C, 2
U, 5
-6 F
C (1
blo
ck)
Pie
r 2: 1
5-17
MC
, 8-9
U, 2
1-24
FC
(3 b
lock
s)P
ier 3
: 6-7
MC
, 4-5
U, 9
-10
FC (2
blo
cks)
Coa
ch s
tatio
n: 3
-4 M
C, 2
U, 4
-5 F
C (1
blo
ck)
N
ot y
et a
sses
sed
- ass
ume
2018
figu
res
AIR
SID
E TO
ILET
S - A
RR
IVA
LS
PIER
S
Cur
rent
pro
visi
on:
Pier
1: 1
MC
, 1 U
, 1 F
C (1
blo
ck)
Pier
2: 6
MC
, 3 U
, 9 F
C (1
blo
ck)
Pier
3: 5
MC
, 3 U
, 7 F
C (1
blo
ck)
Rem
ote
/ coa
ched
pax
ass
umed
to u
se p
re-
Imm
igra
tion
faci
litie
s
80-9
0% to
ilet a
vaila
bilit
y du
ring
busy
hou
rN
ot a
sses
sed
- use
201
4 fig
ures
as
a w
orst
cas
e
Pea
k ho
urly
pax
flow
s:P
ier 2
290
0, P
ier 3
145
0
Req
uire
men
t to
give
80-
90%
ava
ilabi
lity:
P
ier 1
: N/A
(ass
umed
to b
e cl
osed
)P
ier 2
: 7-8
MC
, 4 U
, 11-
12 F
C (1
blo
ck)
Pie
r 3: 4
-5 M
C, 3
U, 7
FC
(1 b
lock
)
P
eak
hour
ly p
ax fl
ows:
Pie
r 1 6
70, P
ier 2
278
0, P
ier 3
137
0
Req
uire
men
t to
give
80-
90%
ava
ilabi
lity:
P
ier 1
: 3 M
C, 2
U, 4
-5 F
C (1
blo
ck)
Pie
r 2: 7
-8 M
C, 4
U, 1
1-12
FC
(1 b
lock
)P
ier 3
: 4-5
MC
, 2-3
U, 6
-7 F
C (1
blo
ck)
N
ot y
et a
sses
sed
- ass
ume
2018
figu
res
AIR
SID
E TO
ILET
S - A
RR
IVA
LS
PRE-
IMM
IGR
ATI
ON
Cur
rent
pro
visi
on:
4 M
ale
cubl
icle
s, 8
urin
als
over
1 b
lock
, 7
Fem
ale
cubi
cles
ove
r 1 b
lock
1 D
isab
led
toile
t
80-9
0% to
ilet a
vaila
bilit
y du
ring
busy
hou
rR
equi
rem
ent t
o gi
ve 8
0-90
% a
vaila
bilit
y ov
er 1
blo
ck:
5-6
Mal
e cu
bicl
es, 3
urin
als
6-7
Fem
ale
cubi
cles
R
equi
rem
ent t
o gi
ve 8
0-90
% a
vaila
bilit
y ov
er 1
blo
ck:
5-6
Mal
e cu
bicl
es, 3
urin
als
6-7
Fem
ale
cubi
cles
R
equi
rem
ent t
o gi
ve 8
0-90
% a
vaila
bilit
y ov
er 1
blo
ck:
6 M
ale
cubi
cles
, 3 u
rinal
s7-
8 Fe
mal
e cu
bicl
es
Req
uire
men
t to
give
80-
90%
ava
ilabi
lity
over
1 b
lock
:6
Mal
e cu
bicl
es, 3
urin
als
7-8
Fem
ale
cubi
cles
AIR
SID
E TO
ILET
S -
INTE
RN
ATI
ON
AL
REC
LAIM
Cur
rent
pro
visi
on:
7 M
ale
cubl
icle
s, 4
urin
als
over
1 b
lock
, 10
Fem
ale
cubi
cles
ove
r 1 b
lock
1 D
isab
led
toile
t
80-9
0% to
ilet a
vaila
bilit
y du
ring
busy
hou
rR
equi
rem
ent t
o gi
ve 8
0-90
% a
vaila
bilit
y ov
er 1
blo
ck:
8-9
Mal
e cu
bicl
es, 4
-5 u
rinal
s10
-12
Fem
ale
cubi
cles
R
equi
rem
ent t
o gi
ve 8
0-90
% a
vaila
bilit
y ov
er 1
blo
ck:
8-9
Mal
e cu
bicl
es, 4
-5 u
rinal
s10
-12
Fem
ale
cubi
cles
R
equi
rem
ent t
o gi
ve 8
0-90
% a
vaila
bilit
y ov
er 1
blo
ck:
9-10
Mal
e cu
bicl
es, 4
-5 u
rinal
s11
-13
Fem
ale
cubi
cles
R
equi
rem
ent t
o gi
ve 8
0-90
% a
vaila
bilit
y ov
er 1
blo
ck:
10-1
1 M
ale
cubi
cles
, 5 u
rinal
s12
-14
Fem
ale
cubi
cles
AIR
SID
E TO
ILET
S - D
OM
ESTI
C
REC
LAIM
Cur
rent
pro
visi
on:
Non
e80
-90%
toile
t ava
ilabi
lity
durin
g bu
sy h
our
Req
uire
men
t to
give
80-
90%
ava
ilabi
lity
over
1 b
lock
:3
Mal
e cu
bicl
es, 2
urin
als
3-4
Fem
ale
cubi
cles
R
equi
rem
ent t
o gi
ve 8
0-90
% a
vaila
bilit
y ov
er 1
blo
ck:
3 M
ale
cubi
cles
, 2 u
rinal
s3
Fem
ale
cubi
cles
R
equi
rem
ent t
o gi
ve 8
0-90
% a
vaila
bilit
y ov
er 1
blo
ck:
3 M
ale
cubi
cles
, 2 u
rinal
s3
Fem
ale
cubi
cles
R
equi
rem
ent t
o gi
ve 8
0-90
% a
vaila
bilit
y ov
er 1
blo
ck:
2-3
Mal
e cu
bicl
es, 2
urin
als
3 Fe
mal
e cu
bicl
es
SOU
TH T
ERM
INA
L - T
OIL
ETS
Che
ck In
Stra
tegy
: onc
e E
BS
ope
ns p
asse
nger
s ca
n ch
eck
in b
ags
on a
rriv
al a
t airp
ort.
Sho
rt-ha
ul c
hute
s op
en 9
0 m
inut
es b
efor
e S
TD, l
ong-
haul
180
min
utes
. Chu
tes
clos
e 30
min
utes
bef
ore
STD
, with
15
min
ute
buffe
r for
suc
cess
ive
fligh
ts.
100%
LFs
and
20%
con
tinge
ncy
uplif
t.
0.45
- 0.
50 s
eats
per
pea
k oc
cupa
ncy
pax;
1.
3m2 p
er s
eat;
Ret
ail /
cat
erin
g - b
ased
on
GA
L co
mm
erci
al
stan
dard
s:1.
3m2 fo
r all
IDL
pax,
40%
in c
ater
ing;
3.
0m2 fo
r all
IDL
pax,
35%
in re
tail;
Circ
ulat
ion
spac
e: 2
0%-3
0% o
f tot
al ID
L sp
ace
380
(rol
ling
hour
) [ro
lling
eve
ry 3
0 m
in]
310
(rol
ling
hour
) [ro
lling
eve
ry 3
0 m
in]
CH
ECK
-IN
430
(rol
ling
hour
)38
0 (r
ollin
g ho
ur) [
rolli
ng e
very
30
min
]
3100
(rol
ling
hour
) [ro
lling
eve
ry 3
0 m
in]
3130
(rol
ling
hour
) [ro
lling
eve
ry 3
0 m
in]
2800
(rol
ling
hour
)26
80 (r
ollin
g ho
ur) [
rolli
ng e
very
30
min
]
4250
(rol
ling
hour
) [ro
lling
eve
ry 3
0 m
in]
4475
(rol
ling
hour
) [ro
lling
eve
ry 3
0 m
in]
3700
(rol
ling
hour
)39
50 (r
ollin
g ho
ur) [
rolli
ng e
very
30
min
]
SOU
TH T
ERM
INA
L
943
976
5353
5555
868
(Aug
ust F
riday
sch
edul
e, s
naps
hop
at F
eb12
)88
8
ST: ~
20.0
mpp
aN
T: ~
21.0
mpp
aST
: ~22
.5m
ppa
NT:
~22
.5m
ppa
ST: ~
17.4
mpp
aN
T: ~
17.0
mpp
aST
: ~18
.4m
ppa
NT:
~19
.3m
ppa
EZY
rem
ains
spl
it be
twee
n N
T &
ST
EZY
bala
nce
shift
to S
T w
ith P
ier 1
reop
en
No
Top
10 c
arrie
r mov
es
EZY
rem
ains
spl
it be
twee
n N
T &
ST
No
Top
10 c
arrie
r mov
es
EZY
rem
ains
spl
it be
twee
n N
T &
ST
No
Top
10 c
arrie
r mov
es
EZY
rem
ains
spl
it be
twee
n N
T &
ST
No
Top
10 c
arrie
r mov
es
GA
TWIC
K S
OU
TH T
ERM
INA
L FA
CIL
ITIE
S: P
RO
VID
ED A
ND
FO
REC
AST
TO
201
8/19
, WIT
H R
AG
STA
TUS
INC
LUD
ING
Q5
& Q
5+1
DEV
ELO
PMEN
T
Sum
mer
201
2, b
ased
on
actu
al
sche
dule
SH&
E H
IGH
CA
SE 2
014/
15
(38
mpp
a)
Faci
litie
s re
quire
d by
Sum
mer
201
4
SH&
E H
IGH
CA
SE 2
018/
19
(41
mpp
a)
Faci
litie
s re
quire
d by
Sum
mer
201
8
SH&
E H
IGH
CA
SE 2
026/
27
(45
mpp
a)
Faci
litie
s re
quire
d by
Sum
mer
202
6
17


GA
TW
ICk
AIR
FIE
LD
FA
CIL
ITIE
S: P
RO
VID
ED
AN
D F
OR
EC
AST T
O 2
014
, WIT
h R
AG
STA
TU
S
INC
LUD
ING
PLA
NN
ED
DEV
ELO
PM
EN
T F
RO
M 2
012
Serv
ice
Stan
dard
s as
sum
ed in
as
sess
men
ts
AN
NU
AL
PAX
BU
SY D
AY
ATM
S
PEA
K H
OU
R A
TMs
DA
ILY
CA
PAC
ITY
RU
NW
AY
3 R
ETs
and
3 R
ATs
on
26L
& 0
8RM
axim
um 1
0 m
inut
e de
lay.
On
a bu
sy d
ay a
lmos
t all
the
avai
labl
e ca
paci
ty is
util
ised
and
Gat
wic
k is
not
abl
e to
sa
tisfy
all
dem
and
for s
lots
. H
owev
er, o
n ot
her d
ays
of
the
year
util
isat
ion
is m
uch
redu
ced.
96.4
%
94.0
%
A38
0 C
apab
ility
Rem
ote
park
ing
on N
Wzo
ne fo
r tw
o co
de F
.D
iver
sion
ary
(AA
CG
) com
plia
nce
on ta
xiw
ays
only
. C
ompl
ianc
e w
ith C
AA
CA
P 1
68 re
quire
d fo
r ful
l ser
vice
sc
hedu
led
oper
atio
ns.
Pie
r Ser
vice
for A
380
turn
s.A
AC
G c
ompl
ianc
e su
ffici
ent
New
A38
0 st
and
on P
ush
& H
old
125,
Jul
iet
min
or w
orks
. Res
trict
ions
on
P6
depa
rture
ga
tes
and
Alp
ha h
old.
TAXI
WA
YS5
Taxi
way
s N
-S a
nd 3
taxi
way
s E
-W p
rovi
ding
al
tern
ativ
e ro
utes
to p
iers
Ther
e is
no
spec
ific
serv
ice
stan
dard
for t
axiw
ays
alth
ough
on
rout
e de
lays
bet
wee
n th
e ru
nway
and
sta
nd
shou
ld b
e ke
pt to
a m
inim
um a
nd n
ew d
evel
opm
ents
sh
ould
ser
ve to
mai
ntai
n or
redu
ce ta
xi ti
mes
.
Cur
rent
pro
blem
s in
Pie
r 1 c
ul-d
e sa
c. S
imila
r bu
t les
s se
vere
pro
blem
in P
ier 2
-3 c
ul d
e sa
c w
here
pus
h ba
ck c
onfli
cts
can
occu
r.
Pie
r 1 o
ut o
f ser
vice
, im
prov
ed m
anag
emen
t of
pus
hbac
k co
nflic
ts th
roug
h st
and
allo
catio
n.
Pro
visi
on: 1
10, 5
3E +
2F,
16
MA
RS
Pro
visi
on: 9
8, 5
5E +
3F,
18
MA
RS
Req
uire
men
t: 10
9, 3
3E/D
Req
uire
men
t: 11
3, 3
7E/D
Not
e 73
4 M
AR
S a
re e
xclu
ded
from
cou
nt.
Sta
nd 5
7 in
clud
ed
as E
MA
RS
. H
oldi
ng s
tand
s ex
clud
ed.
Sta
nds
60-6
3 cl
osed
, gat
e 59
clo
sed
for d
eps
P5
reco
nfig
, 6 re
mot
es c
lose
d (1
30's
/140
's),
3 st
ands
cl
osed
on
P6
and
Pie
r 1 c
lose
d
Pro
visi
on: 2
7, 1
1E, 3
MA
RS
Pro
visi
on: 2
9, 1
6E, 5
MA
RS
.
3 co
de C
clo
sed
on P
6.
Dem
and:
57,
10E
/DD
eman
d: 6
2, 1
7E/D
93%
PS
L94
% P
SL
AR
RIV
ALS
CO
AC
H B
AYS
2 In
t (TB
C) &
1 D
om95
% o
f arr
ival
s co
ache
s sh
ould
not
nee
d to
hol
d fo
r of
fload
ing
pass
enge
rs.
2 In
t (TB
C) &
1 D
om
2-3
new
faci
lity
in T
BF
C
OA
CH
ING
GA
TES
11 In
tern
atio
nal c
oach
ing
gate
s (g
ate
45) p
lus
one
dom
estic
on
P5
Suf
ficie
nt c
oach
ing
gate
s sh
ould
be
prov
ided
so
that
th
ere
is a
lway
s a
coac
hing
gat
e av
aila
ble
to
acco
mm
odat
e bu
sy d
ay d
eman
dD
eman
d fo
r 9-1
0 co
achi
ng g
ates
. 11
pro
vide
d
Dem
and
for 9
-10
coac
hing
gat
es.
11 p
rovi
ded
Pro
visi
on: 3
6, 1
6E, 7
MA
RS
Pro
visi
on: 3
5, 1
5E, 7
MA
RS
P
ier 1
clo
sed
Dem
and:
44, 1
6E/D
Dem
and:
40,
16E
/D
100%
PS
L97
%
AR
RIV
ALS
CO
AC
H B
AYS
1 in
t (ga
te 3
0) &
1 d
om95
% o
f arr
ival
s co
ache
s sh
ould
not
nee
d to
hol
d fo
r of
fload
ing
pass
enge
rs.
1 in
t & 1
dom
1
int &
1 d
om
CO
AC
HIN
G G
ATE
SA
lthou
gh th
ere
are
5 co
achi
ng g
ates
pro
vide
d on
gat
es 9
0 - 9
5 ,
only
3 c
an b
e us
ed s
imul
tane
ousl
y du
e to
spa
ce c
onst
rain
ts.
plus
one
add
ition
al d
omes
tic to
be
prov
ided
on
10A
.
Suf
ficie
nt c
oach
ing
gate
s sh
ould
be
prov
ided
so
that
th
ere
is a
lway
s a
coac
hing
gat
e av
aila
ble
to
acco
mm
odat
e bu
sy d
ay d
eman
dD
eman
d fo
r 1 g
ate.
4 p
rovi
ded
Pie
r 1 c
lose
d fo
r rec
onfig
urat
ion
all 4
gat
es a
re re
quire
d
Pro
visi
on: 3
6, 1
6E, 7
MA
RS
Pro
visi
on: 1
10, 5
3E +
2F,
16
MA
RS
Pro
visi
on: 2
7, 1
1E, 3
MA
RS
GA
TWIC
K A
IRFI
ELD
FA
CIL
ITIE
S: P
RO
VID
ED A
ND
FO
REC
AST
TO
201
4, W
ITH
RA
G S
TATU
S IN
CLU
DIN
G P
LAN
NED
D
EVEL
OPM
ENT
FRO
M 2
012.
Cur
rent
Pro
visi
on20
12 B
ased
on
actu
al s
ched
ule
SH&
E H
igh
Cas
e 20
14/1
5
ST: 1
7.4m
ppa
NT:
17.
0mpp
aST
: 18.
4mpp
aN
T: 1
9.3m
ppa
868
888
5353
900
945
STA
ND
SA
ny a
rriv
al s
houl
d ha
ve a
n av
aila
ble
stan
d of
the
right
si
ze to
par
k on
at a
ll tim
es.
Req
uire
men
t equ
als
Bus
y da
y pe
ak o
ccup
ancy
+ 1
0%
NO
RTH
TER
MIN
AL
PIER
SER
VED
STA
ND
S95
% o
f pas
seng
ers
shou
ld b
e pi
er s
erve
d an
d th
ere
shou
ld b
e su
ffici
ent c
oach
ing
capa
city
to a
ccom
mod
ate
all r
emot
e se
rvic
es. V
ery
depe
nden
t on
tow
ing
leve
ls
SOU
TH T
ERM
INA
L
PIER
SER
VED
STA
ND
S97
% o
f pas
seng
ers
shou
ld b
e pi
er s
erve
d as
ther
e ar
e on
ly 4
coa
chin
g ga
tes
to a
ccom
mod
ate
all r
emot
e se
rvic
es w
hils
t Pie
r 1 is
bei
ng b
uilt.
19

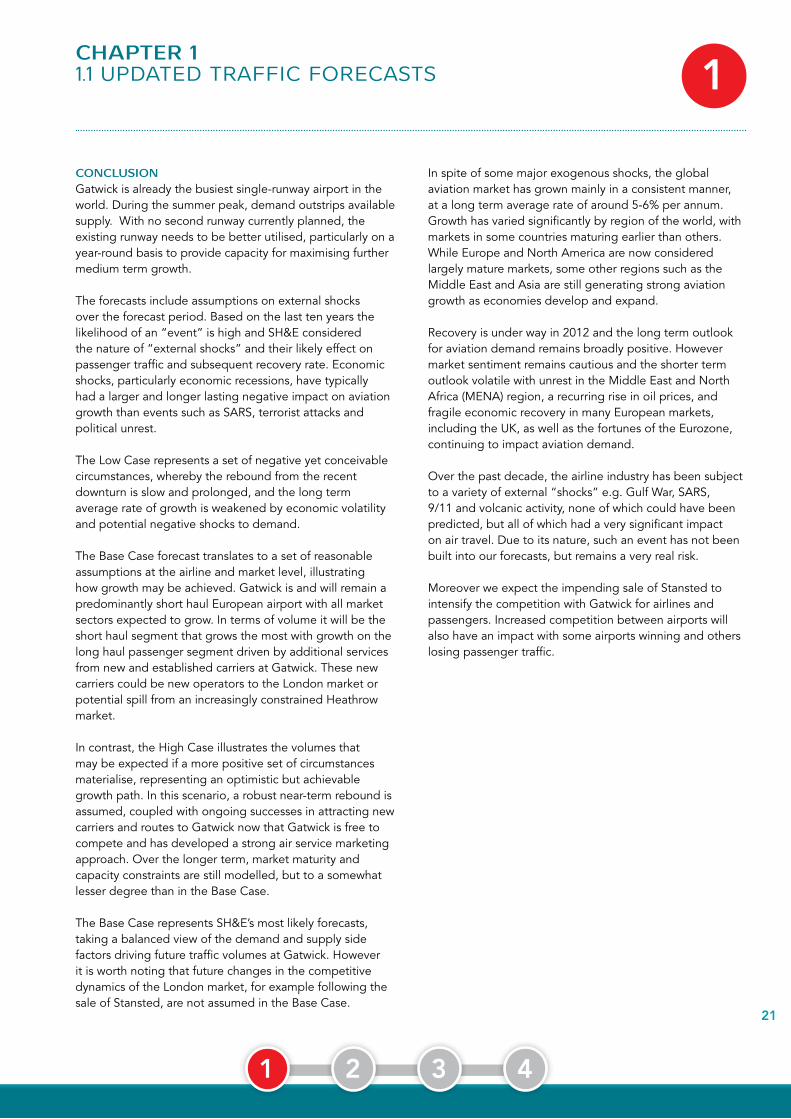
21
ChAPTER 11.1 UpDATED TRAFFIC FORECASTS 1
CONCLUSIONGatwick is already the busiest single-runway airport in the world. During the summer peak, demand outstrips available supply. With no second runway currently planned, the existing runway needs to be better utilised, particularly on a year-round basis to provide capacity for maximising further medium term growth.
The forecasts include assumptions on external shocks over the forecast period. Based on the last ten years the likelihood of an “event” is high and SH&E considered the nature of “external shocks” and their likely effect on passenger traffic and subsequent recovery rate. Economic shocks, particularly economic recessions, have typically had a larger and longer lasting negative impact on aviation growth than events such as SARS, terrorist attacks and political unrest.
The Low Case represents a set of negative yet conceivable circumstances, whereby the rebound from the recent downturn is slow and prolonged, and the long term average rate of growth is weakened by economic volatility and potential negative shocks to demand.
The Base Case forecast translates to a set of reasonable assumptions at the airline and market level, illustrating how growth may be achieved. Gatwick is and will remain a predominantly short haul European airport with all market sectors expected to grow. In terms of volume it will be the short haul segment that grows the most with growth on the long haul passenger segment driven by additional services from new and established carriers at Gatwick. These new carriers could be new operators to the London market or potential spill from an increasingly constrained Heathrow market.
In contrast, the High Case illustrates the volumes that may be expected if a more positive set of circumstances materialise, representing an optimistic but achievable growth path. In this scenario, a robust near-term rebound is assumed, coupled with ongoing successes in attracting new carriers and routes to Gatwick now that Gatwick is free to compete and has developed a strong air service marketing approach. Over the longer term, market maturity and capacity constraints are still modelled, but to a somewhat lesser degree than in the Base Case.
The Base Case represents SH&E’s most likely forecasts, taking a balanced view of the demand and supply side factors driving future traffic volumes at Gatwick. However it is worth noting that future changes in the competitive dynamics of the London market, for example following the sale of Stansted, are not assumed in the Base Case.
In spite of some major exogenous shocks, the global aviation market has grown mainly in a consistent manner, at a long term average rate of around 5-6% per annum. Growth has varied significantly by region of the world, with markets in some countries maturing earlier than others. While Europe and North America are now considered largely mature markets, some other regions such as the Middle East and Asia are still generating strong aviation growth as economies develop and expand.
Recovery is under way in 2012 and the long term outlook for aviation demand remains broadly positive. However market sentiment remains cautious and the shorter term outlook volatile with unrest in the Middle East and North Africa (MENA) region, a recurring rise in oil prices, and fragile economic recovery in many European markets, including the UK, as well as the fortunes of the Eurozone, continuing to impact aviation demand.
Over the past decade, the airline industry has been subject to a variety of external “shocks” e.g. Gulf War, SARS, 9/11 and volcanic activity, none of which could have been predicted, but all of which had a very significant impact on air travel. Due to its nature, such an event has not been built into our forecasts, but remains a very real risk.
Moreover we expect the impending sale of Stansted to intensify the competition with Gatwick for airlines and passengers. Increased competition between airports will also have an impact with some airports winning and others losing passenger traffic.
1 2 3 4

22
1ChAPTER 11.2 GATWICk’S DRAFT MASTER plAN 1
PURPOSE OF ThE MASTER PLANThe primary purpose of the Gatwick Master Plan is to look forward to 2020 and explain the implications of making the best use of our single runway. Its second purpose is to look onwards to 2030. Gatwick could, in 2030, handle around 45 million passengers on one runway and perhaps more if there were to be a second runway.
The 2012 CIP is based on the assumption that Gatwick will remain a single runway - two terminal airport up to the 2020s and possibly beyond.
Gatwick Airport last published a master plan 6 years ago (Gatwick Airport Interim Master Plan, October 2006). Since then there have been several significant changes to the overall environment that Gatwick operates in, the most notable changes being the formation of a new coalition Government, which has taken a different approach to the issue of runway capacity in the South East of England and the change in ownership of Gatwick and introduction of real competition for the first time into the London and South East airport market. The change in the overall characteristics of the global aviation market, resulting in a noticeable, yet limited, decline in traffic to and from the airport as well as the initiation of ‘Open Skies Air Services Agreement’ between the United States and the UK and the rapid growth in short-haul low-cost services also impacted on the operating environment at Gatwick.
These changes in the operating environment and best practices as advised by the Department for Transport’s (DfT) prompted Gatwick to formulate and publish a new airport master plan in draft form in October 2011.
PUbLIC CONSULTATIONFollowing a three-month public consultation on its draft master plan, which closed in January 2012, Gatwick Airport published a report detailing the views and opinions of local residents, businesses, MPs and Councils in April 2012. The detailed document ‘Gatwick Airport: Draft Master Plan Summary Report on Public & Community Consultation’ is available to read and can be downloaded from the Gatwick Airport website gatwickairport.com/masterplan.
PUbLICATION OF FINAL MASTER PLAN IN SUMMER 2012The final Master Plan document will be published in summer 2012 and will show how we have taken into account the views and opinions expressed by the local community and its stakeholders.
The Gatwick Master Plan both informs and is informed by a variety of statutory planning documents that are produced by regional and local authorities, as well wider Government policy and the regulatory environment in which Gatwick operates.
Shortly after the 2010 general elections, the new Government ruled out a second runway at Gatwick and commenced a two year process to develop a new aviation policy framework, a process which we are actively contributing to. Our development and growth will take place in the context of the new policy framework expected in 2013.
hIGhLIGhTS OF ThE 2011 DRAFT GATWICk MASTER PLANIn 2011 we commissioned ICF SH&E, a leading aviation consultancy company, to produce an independent view on the prospects for air traffic at Gatwick. These forecasts were published in the 2011 Draft Master Plan. Subsequently, we invited ICF SH&E to update their forecasts in early 2012 in line with the latest economic outlook. The updated forecasts show a slight slow-down in growth projections in the medium to long term owing to the prolonged recovery from worldwide recession and recent upsets such as the Euro crisis. For example we now expect to reach a throughput of 40mppa (million passengers per annum) in 2021/22 rather than 2020/21 as envisaged in the Draft Master Plan.
As the achievement of 40mppa is a key milestone target for Gatwick, the forecasts description below includes comparisons between the actual traffic experienced in 2011/12 and that expected in 2021/22 with a passenger throughput of 40mppa.
The Draft Master Plan is currently being updated with the latest forecasts.
The key traffic highlights of the Base case Scenario, taking into account the latest updated traffic forecasts are as follows:
BAsE CAsE FoRECAsTs - sUMMARy
2011/12 Actual 2021/2022 Forecast
Passengers 33.8 million 40.2 million
Air Traffic Movements 248,679 278,956
1 2 3 4

23
1ChAPTER 11.2 GATWICk’S DRAFT MASTER plAN 1
By 2020/2021 we expect our annual throughput to grow to around 39.1mppa, reaching the 40.2 million passengers milestone target in 2021/22. In accommodating this growth, we do not expect any significant change to the airport’s size or the way we use the land.
We do however anticipate important changes to our airport infrastructure. Obviously the exact scope of these changes will be shaped by discussions with our airlines and business partners. Potential capital developments over the next 10 years, outlined in the 2011 Draft Master Plan and the April 2012 GAL Business Plan comprise:
i. optimisation of the runway and taxiway system;
ii. work to enable Airbus A380 operations;iii. completion of current terminal projects, plus:iv. expansion of North Terminal (NT)
security searchv. reconfiguration of NT departure loungevi. baggage system improvementsvii. reconfiguration of check-in facilities in both
terminalsviii. pier redevelopment and additional NT pier-served
stands;ix. apron reconfiguration.
In addition the Draft Master Plan refers to additional projects including surface access improvements comprising additional car parking and road junction improvements.
GATWICk MASTER PLAN AND LAND USE PLANSThe expected airport layout in 2020 is shown in Figures A.7 and A.8 in the 2011 Master Plan. Figure A.7 provides an indicative 2020 Gatwick Airport Layout Plan and shows how the land use zones (in terms of activities pertaining to airfield, Apron cargo, maintenance, terminal, surface transport) may change compared with the current airport. A copy of the indicative 2020 Gatwick Airport Layout Plan (Figure A.7) is provided in Appendix H.
Figure A.8 in the Draft Master Plan identifies likely changes in infrastructure, outlining potential development opportunities. Figure 6.1 in the draft Master Plan provides a comparison of land use zones in 2011 and 2020. For more information about the future land use plans at Gatwick, please visit the Gatwick web site www.gatwickairport.com/masterplan.
While some infrastructure changes are anticipated to address future needs, the overall pattern of land use will be largely the same as today as illustrated in Chapter 6 of
the 2011 Draft Master Plan. In 2020 Gatwick will still be a single runway, two-terminal airport. The general location and arrangement of infrastructure will be as it is today and there are unlikely to be any changes to the boundary. However, the forecast increase in passengers to 39.1million in 2020/21 is likely to drive the requirement for additional processing capacity. In order to deliver our other strategies for Gatwick, further changes to the airport infrastructure are likely.
We have no current plans for a second runway and we remain fully committed to the 1979 legal agreement precluding the construction of a new runway before 2019. However, while our focus is firmly on improving the existing single runway airport, we believe that there is a possibility that a second runway may be needed sometime in the future. Existing Government policy requires Gatwick, and several other UK airports to safeguard land for such an eventuality. We will continue to safeguard land for future expansion because we believe it to be sensible business practice and it supports current Government policy.
MASTER PLAN, DEVELOPMENT STRATEGy AND CAPITAL INVESTMENT PROGRAMMEAs mentioned in the 2011 CIP document, together the Gatwick Airport Master plan, the Development Strategy and the Capital Investment Programme are intended to present a clear picture of Gatwick’s development within the current, medium and long term view and are intrinsically linked through a common ambition and strategy.
GAL recognises the importance of demonstrating a strong linkage between the CIP and our strategic ambition for Gatwick as described in our draft master plan. In the past we have used the term ‘Development Strategy’ to describe this linkage. We believe chapters 1, 2 and 3 of our initial business plan to 2020 (‘Connecting London to the World’, published in April 2012), go a long way to making this connection. These chapters describe our vision and strategic priorities for the airport, our traffic forecasts and the results of our passenger insight research. They also explain how we have used this material to create our product matrix which identifies future service outcomes, designed to deliver our ambition for Gatwick.
We are also considering how illustrative plans and diagrams might be prepared to show how the projects described in the CIP fit within a holistic development plan for Gatwick, which again is aligned to our strategic ambition. For the time being we have reproduced a future land use plan from the draft master plan in [Appendix H] but we may seek to develop more detailed plans in due course to show the phased development of the airport, in a way that is compatible with the master plan principles.
1 2 3 4


25
12ChAPTER 2 2.1 COMpETING TO GROW AND BECOME lONDON’S AIRpORT OF CHOICE
INTRODUCTIONThe purchase of Gatwick by new owners led by Global Infrastructure Partners in December 2009 opened up a fresh new start at the world’s busiest single-runway airport. Scheduling up to 53 aircraft movements per hour in peak times and handling nearly 34 million passengers in 2011/12, Gatwick is the UK’s second major airport.
Now that we are an independently owned airport, operating in the competitive South East airport market, we are determined to correct the under investment of the past and take a service-based approach to investment at Gatwick. In effect that means undertaking investment that cost effectively delivers facilities for both our airline partners and passengers. It is only by delivering continued improvement in the passenger experience at Gatwick and meeting the needs of a varying customer base that we will become London’s airport of choice.
London and the South East has long been one of the most competitive markets in terms of airline competition. Competition amongst airports is increasingly a fact of life with the six London airports led by four different consortia. Passengers have more choice as to which airport they fly from and airlines have alternative bases from which to operate. The impending sale of Stansted will further intensify the competition amongst the London airports.
OUR AMbITIONGatwick has set out its ambition to ‘’compete to grow and become London’s airport of choice”.
In the 2011 CIP, we explained how our ambition to ‘’compete to grow and become London’s airport of choice” is translated into six strategic priorities and how these strategic priorities provide a high level strategic direction for our development planning.
1. Deliver the best passenger experience by listening to our passengers and delivering the kind of service that will make them choose to fly from Gatwick.
2. Help our airlines grow by understanding their goals and developing commercial partnerships
3. Increase value and efficiency by maximising income from retail, property and car parks, lowering our operating costs and investing efficiently
4. Protect and enhance our reputation by building strong and constructive relationships with our stakeholders based on openness and trust
5. Build a strong environment, health and safety culture by maintaining a relentless focus on achieving zero incidents
6. Develop the best people, processes and technology by investing in high performing people, driving continuous improvement and deploying the right systems.
These strategic priorities are then cascaded down to the individual objectives of each of our members of staff.
OUR PASSENGER COMMITMENTS
We think it’s quite simple:
We’ll treat you as our guest - We’ll always try to offer you the very best possible airport experience or make it right if we don’t.
We hate queues - We know you do too, so Gatwick is working hard with our staff and airport partners to keep queues in all areas to a minimum.
We love to be on time - We’ll do our best to get you away on time.
Gatwick wants to deliver the service you expect at everystage of the airport journey.Everyone who works at the airport - airlines, handling agents and other service partners - has a role to play in getting you to and from your aircraft and departing promptly. We’re working hard every day with our staff, airlines, and our partners to deliver the high standards of service that we know you expect.
Disclaimer
Please note this artwork should not be reproduced without the permission of the airline
Before going to print please ensure you have the Pantone colour references.
This airline logo is only current and up to date on theday it is downloaded from this site. Do not keep andreprint from it at a later date as it may be supersededby a more up to date version.
Current contact: BAA Simon Edwards
On screen
In partnership with
Disclaimer
Please note this artwork should not be reproduced without the permission of the airline
Before going to print please ensure you have the Pantone colour references.
This airline logo is only current and up to date on theday it is downloaded from this site. Do not keep andreprint from it at a later date as it may be supersededby a more up to date version.Disclaimer
Please note this artwork should not be reproduced without the permission of the airline
Before going to print please ensure you have the Pantone colour references.
This airline logo is only current and up to date on theday it is downloaded from this site. Do not keep andreprint from it at a later date as it may be supersededby a more up to date version.
Current contact: [email protected]
Disclaimer
Please note this artwork should not be reproduced without the permission of the airline
Before going to print please ensure you have the Pantone colour references.
This airline logo is only current and up to date on theday it is downloaded from this site. Do not keep andreprint from it at a later date as it may be supersededby a more up to date version.
Current contact: Not up to date
1 2 3 4
FROM STRATEGIC PRIORITIES TO PASSENGER COMMITMENTSUnderpinning these six strategic priorities is the recognition that to become London’s airport of choice in a competitive market, we need to put the passenger first. In 2010, Gatwick became the first UK airport to publish passenger commitments, which are central to our service focus and have been endorsed by our airline partners, handling agents and the UK Border Agency.
These passenger commitments, outlining the service standards our passengers can expect, are the results of the collaborative work undertaken with our partners and centre on three core pledges:
• We’ll treat you as our guest• We hate queues• We love to be on time

26
2ChAPTER 2 2.1 COMpETING TO GROW AND BECOME lONDON’S AIRpORT OF CHOICE
SUMMARy OF OUR CAPITAL INVESTMENT AT GATWICk IN Q5There have been extensive development activities all across Gatwick and the Gatwick CIP now consists of projects in increasing maturity of development and delivery on the ground with 64 % of the £1,172 billion capital investment programme either completed or nearing completion.
These projects have been developed and delivered with input from the airline community through project working groups, the Capital Programme Board (CPB) and the Joint Steering Group (JSG).
The capital investment plans inherited from the previous owner had to be re-shaped and worked with our airline partners to revise the initial programme to ensure they were appropriate for the future ambition of Gatwick in meeting the needs of passengers and our airline customers and that costs were being efficiently incurred. Whilst some projects were removed completely ( Pier 7), other projects were combined where synergies existed ( Pier 1 and ST Baggage system) and new projects (19 lanes consolidated Central Search area in South Terminal) made possible through savings and re-prioritisation.
The completion of the North Terminal Extension project in December 2011 extended the NT landside envelope by approximately 12,500m2 of floor area comprising additional check-in (total of 156 check in desks) and arrivals baggage reclaim facilities, relieving congestion associated with check- in at peak hours.
Multi Storey Car Park 6 (MSCP6), a short stay car park in the NT which ties into the NT Extension, NT Forecourt and NT Interchange in a seamless way with 1,177 spaces including 24 disabled, passenger pick up, rental car and premium parking was completed in April 2011.
The South Terminal Forecourt project completed in March 2012 has provided a modern new entrance plaza to the South Terminal, offering clearer lines of sight and a brighter, more contemporary space with new flooring and lighting and altogether improved the accessibility from the forecourt and multi-storey car parks with new lifts and simplified the way-finding routes in and out of the terminal.
Gatwick South Terminal state of the art 19-lane Central Search Security area is currently the benchmark for UK airports, providing a range of facilities to meet different passenger market segments. The project also delivered the first dedicated family and assistance search lanes in the UK in November 2011. We have been becoming more consistent in delivering a maximum queue of less than 10 minutes.
Out in the airfield, the Northern Runway remedial works were completed in February 2012. Taxiway Lima, which aircraft use to pass under the landmark Pier 6 Bridge at North Terminal, was re-surfaced in April 2011. Improvements to Taxiway Juliet were also undertaken to support our airline partners’ operations and make access to Gatwick’s single runway even more efficient.
The 2012 CIP outlines an investment plan for an extended Q5, totalling £1,172 million (out-turn prices). Appendix A - Phased Capital Investment Programme 2012 shows a phased forecast spend for the current regulatory cycle including the extended 2013/14 (Q5+1) year.
Q5 - kEy METRICThe graph below shows actual capital expenditure per financial year for Q5 to date and the forecast for the remaining two years:
0.02008 2009
Q5 Capital Expenditure
Financial Year ending 31 March Actual Forecast
£m
illio
n
2010 2011 2012 2013
100.0
200.0
300.0
50.0
150.0
250.0
1 2 3 4

27
2ChAPTER 2 2.1 COMpETING TO GROW AND BECOME lONDON’S AIRpORT OF CHOICE
ONGOING CAPITAL PROGRAMME AT GATWICkThe following section describes on-going capital works across Gatwick that this phased forecast spend represents that will enable Gatwick to ‘compete to grow and become London’s Airport of Choice’
NORTh TERMINALThe largest programme of development in the North Terminal is the delivery of additional pier service to meet future growth in passenger numbers and fleet mix in the North Terminal (NT), ensuring efficient operations by maintaining Pier Service levels above 95% as passengers increase. The provision of additional pier service in the NT will cater for Code F , short and long haul capability and improve PRM (Passengers with Restricted Mobility) facilities.
As part of the Pier 5 reconfiguration project, aircraft stands will be reconfigured, providing independent access to each aircraft parking position, dedicated refurbished gate rooms for each stand, and removing passenger cross flows within the pier. Pier 5 in the North Terminal also serves stands with the closest direct access for passengers from the IDL. Maximising the utilisation of Pier 5 stands will provide passengers with shorter walking distances to their aircraft and more time to dwell in the IDL while assisting our airline partners by facilitating on time performance (OTP).
A380 enabling works have also started to deliver a Code F stand and associated facilities by converting push and hold stand 125 and stand 110. The node and air-bridge on stand 110 will be demolished and a new node and air-bridge created to service the new stand for A380 operations. The A380 aircraft provides an increase in passenger numbers per air traffic movement (ATM), and is in line with future fleet mix and forecasts at the airport. Given Gatwick’s runway constraints, the strategy of increasing the number of passengers on board each flight is key to GAL achieving its passenger targets over the next 10 years.
Three of the four additional security high throughput search lanes to accommodate traffic growth in the North Terminal are operational with the fourth one being completed in June 2012. The upgrade of the NT Baggage System, due for completion in December 2012, will support the NT Extension, providing infrastructure in line with future passenger and fleet mix forecasts and enabling bag tracking through the system and full compliance with the latest DfT requirements for baggage halls.
The retail and catering offering in the NT IDL is also being upgraded through the provision of additional Food and Beverage outlets, including a Jamie Oliver restaurant and additional new brands as well as external terraces. The NT IDL Reconfiguration project will thus help to rectify the impact of prioritisation of security development on NT retail income.
SOUTh TERMINALThe South Terminal Baggage and Pier 1 remains the most significant investment project in the South Terminal in terms of both complexity and benefits to be realised. This major upgrade to the baggage system will increase capacity and improve efficiency. This combined with the replacement of Pier 1, Gatwick’s oldest pier, will transform the passenger experience in the South Terminal and enable a more efficient operation on the airfield. This project commencing in Q5 with the demolition of Pier 1 by September 2013 will commence in Q5 and will continue beyond Q5 (April 2014 onwards).
AIRFIELDUndertaken every 12-15 years, depending on volume and use, the rehabilitation of Gatwick’s main runway is by far the most ‘critical’ airfield project, in terms of its potential operational impacts. The resurfacing of the runway which started in March 2012 will be a 9 month project with completion due in December 2012.
The regeneration of the airfield is well underway with the renovation of Taxiways Papa and November due for completion in August 2012. Also planned is the construction of a new airfield operations building as well as the on-going programme of airfield asset replacement comprising stand rehabilitation, replacement of airfield ground lighting, Fixed Electrical Ground Power units and Lighting columns.
The above lists are not exhaustive but give an indication of the scale and range of improvements that are underway or planned in the current Q5 regulatory cycle to enable Gatwick to compete to grow and retain airline and passenger traffic. In Chapter 5 individual project description sheets (PDS) have been provided, outlining cost breakdowns for all the major projects and programmes in the Q5 CIP with a budget greater than £5 million.
The phased CIP for 2012 (in constant and out-turn prices) is outlined in Appendix A - Phased Capital Investment Programme 2012.
1 2 3 41 2 3 4

28
2ChAPTER 2 2.1 COMpETING TO GROW AND BECOME lONDON’S AIRpORT OF CHOICE
OVERVIEW OF RECENTLy COMPLETED PROjECTS AND CURRENT & FUTURE MILESTONESThe following sections provide an overview of recently completed projects, significant milestones achieved since November 2011 as well as future milestones (2012 and beyond).
MAjOR PROjECTS COMPLETED SINCE NOVEMbER 2011
• Pier 2 (North side ) - Trigger date November 2011 • ST Security - Trigger date December 2011• NT Extension (NTX) Baggage Reclaim & Check-in
Extension - Trigger date December 2011• Northern Runway: Tollgate 5 in December 2011.• ST Immigration Hall Reconfiguration - Tollgate 5 in
March 2012.
OThER SIGNIFICANT MILESTONES AChIEVED SINCE NOVEMbER 2011
• Pier 5 (phase 1) - Tollgate 4 ( March 2012)• Main Runway Rehabilitation: Start on Site (March 2012) • Northern Runway - Tollgate 6 (February 2012)• Papa November Taxiways - Tollgate 4 (November 2011),
Start on Site (February 2012), Phase 1 complete in February 2012.
• ST IDL Reconfiguration - Tollgate 2 (February 2012)• NT IDL Reconfiguration - Tollgate 3 &4 - Project 1
(November 2011) , Tollgate 3 ( June 2012)
FUTURE MILESTONES: 2012 /2013 AND bEyONDNORTh TERMINAL
• North Terminal Security (Phase 2) - Tollgate 5 for 3 additional lanes ( April 2012) and Tollgate 6 for 4 lanes (June 2012)
• North Terminal Baggage (NTB) - Tollgate 5 - Full System ( December 2012)
• Pier 5 - Phase 1 Tollgate 5 (June 2013), Tollgate 6 ( July 2013) ; Phase 2 Tollgate 5 & 6 (May 2014)
• NT Additional Pier Service - Tollgate 3 (June 2012), Tollgate 4 (June 2013)
• NT Baggage Voids - Tollgate 4 (Start on Site September 2012) ,Tollgate 5 (April 2013) ; Tollgate 6 ( May 2013)
• NT IDL Reconfiguration - Tollgate 5 - Project 1 (June 2012), Tollgate 5 - Project 2 ( February 2013)
SOUTh TERMINAL
• Surface Water - Pond D - Start on Site (May 2012), Tollgate 5 (January 2013), Tollgate 6 (February 2013);Pond E - Tollgate 4 ( May 2012) ; Tollgate 5 : (February 2013)
• South Terminal Baggage Phase 1 - HBS Installation Tollgate 5 (August 2012), Tollgate 6 (October 2012)
• South Terminal Baggage Phase 2 - Pier 1 closed (December 2012), Baggage Factory Tollgate 5 ( January 2015), Baggage Factory Tollgate 6 ( March 2015), Pier 1 Gates 1-5 ( March 2015)
• South Terminal Security - Phase 3 IDL works Tollgates 5 (May 2012), Tollgate 6 (July 2012)
• ST IDL Reconfiguration - Tollgate 3 (June 2012), Tollgate 4 (October 2012).
AIRFIELD
• Papa November Taxiways - Tollgate 5 (May 2012), Tollgate 6 (August 2012)
• Main Runway Rehabilitation - Tollgate 5 (November 2012), Tollgate 6 (February 2013)
• Airfield Operations Building (AOB) - Tollgate 4 (June 2012), Start on Site (October 2012), Tollgate 5 (July 2013), Tollgate 6 (August 2013)
• A380 on stand 125 : Tollgate 4 ( June 2012) , Tollgate 5 ( March 2013) ,Tollgate 6 ( April 2013)
IT SEPARATION AND TRANSFORMATIONAn independent Gatwick means that the development of its IT systems network must be commensurate with the sizeof Gatwick’s operation. Gatwick continues its focus on developing people, processes and technology and also driving efficiency. Fundamental to this is the need to separate and transform GAL operational IT systems from BAA legacy systems. Various IT projects were completed during the year, and a new enterprise resource planning (SAP) system was implemented in October 2011.
1 2 3 4

29
2ChAPTER 2 2.1 COMpETING TO GROW AND BECOME lONDON’S AIRpORT OF CHOICE
Q5 +1 AIRLINE DECISIONThe now 6 year Q5 capital programme consists of a number of major projects and programmes which include currentlive projects, rolling programmes and a number of new projects as outlined in Chapter 4 - Project Description sheets. Whilst some projects have had their benefits and spend brought forward such as the NT IDL Reconfiguration project to be delivered in the original 5 year Q5 period, others like the ST Domestic Arrivals and ST IDL reconfiguration projects will be completed in the extension year 2013/2014.
The NT Early Bag Store project has been put on hold and deferred to post Q5 in line with JSG’s decision in January2012.
The purchase of Snow Equipment, jointly decided by both the airlines and GAL in December 2010, has yet to beformally endorsed by the airlines.
The A380 on stand project is currently not supported by the airline community at Gatwick. However GAL believes thatthe provision of Code F capability with the delivery of a single Code F pier-served stand to the west end of Pier 6 is in line with Gatwick’s growth aspiration and crucial to Gatwick’s ambition and strategy as London’s Airport of Choice. Code F capability will enable Gatwick to accommodate all current passenger aircraft types, facilitate growth in long haul airline traffic and is line with future passenger and fleet mix forecasts. Above all, equipping the world’s busiest single runway airport with Code F capability on a pier served stand will offer real choice to airlines and passengers flying to and from London. GAL believes that failure to provide one Code F pier served facility will compromise Gatwick’s competitive position.
As we look ahead there are a couple of projects that rollover from Q5 into future years. These rollover projects are the North Terminal Additional Pier Service, South Terminal Baggage and Pier 1 projects and Rail Station contribution. The former two continue to be developed in conjunction with the airline community.
1 2 3 4

30
2ChAPTER 2 2.2 BEYOND q5 CApITAl plAN
bEyOND Q5 – OUR EMERGING CAPITAL PROGRAMME AS FROM 1 APRIL 2014As requested by the CAA and pending the CAA’s review of the regulatory framework at Gatwick , if any, beyond 2014Gatwick has commenced the formal process of Constructive Engagement for the post Q5 period in April 2012 with our airlines with the submission and publication of the GAL Business plan.
GAL has thus started consultation with the airline community on the strategic issues which will influence the overall size and shape of the ten-year investment programme and has integrated this into its initial business plan submission as part of the beyond Q5 regulatory process. This includes traffic forecasts and other critical assumptions.
GAL’s initial business plan consultation document issued in April 2012 enables airlines to see the high level options fora five year investment programme within the overall context of the service delivered at the airport and estimates of the range of charges.
The initial business plan defines the GAL service proposition and the resultant emerging capital programme for the period from April 2014 up to March 2019. A proposed future service quality scheme, aimed at addressing the entire passenger experience at Gatwick, is included in Chapter 5.
A forecast of commercial and other non-aeronautical revenue and operating costs as well as a price path is outlined in Chapter 6. Chapter 7 indicates what risks GAL perceives exist in the plans, and what issues GAL believes need to be addressed as part of this review. The latter chapters have been provided to our airline partners having signed non - disclosure agreements (NDAs).
Following the issue of the initial GAL business plan in April 2012, business cases are being developed and shared withour airlines as part of the constructive engagement process.
The table below provides a high level summary (in 2013/2014 prices) of the annual emerging Capital Programme for the period between the end of Q5 (1 April 2014) and 31 March 2019, totalling £1.115 billion.
1 2 3 4

Emer
ging
‘Bey
ond
Q5’
Cap
ital P
rogr
amm
e: S
umm
ary
by Y
ear
£m a
t 201
3/14
pri
ces
2018
23
41
23
41
23
41
23
41
23
41
ASSE
T ST
EWAR
DSH
IP
AIR
FIEL
D
£68.
3
FAC
ILIT
IES
£183
.4
CO
MM
ERC
IAL
£42.
9
CO
MPL
IAN
CE
& R
ISK
£13.
5
I.T.
£56.
5£3
65.0
EMER
GIN
G P
RO
JEC
TSSU
RFA
CE
ACC
ESS
Addi
tiona
l Lon
g St
ay C
apac
ity£2
9.0
Long
Sta
y C
ar P
arki
ng£1
3.5
NT
Shor
t Sta
y C
ar P
ark
£20.
0PT
I & S
urfa
ce A
cces
s£3
8.5
£101
.0C
HEC
K-IN
CO
NC
OU
RSE
Early
Bag
Sto
re£2
4.0
ST B
agga
ge &
Pie
r 1£6
9.0
Upg
rade
Che
ck In
& B
ag D
rop
& N
T C
eilin
gs a
nd F
loor
s£4
2.0
£135
.0SE
CU
RIT
YN
T Se
curit
y - R
econ
figur
atio
n to
ST
Stan
dard
£28.
0D
EPAR
TUR
E LO
UN
GE
CIP
Dep
artu
res
£2.0
NT
IDL
Rec
onfig
urat
ion
& Ex
pans
ion
£105
.0ST
IDL
Cap
acity
£79.
0ST
IDL
Rec
onfig
urat
ion
(Pha
ses
3 &
4 &
Food
Cou
rt)£2
5.0
£211
.0PI
ERS
Del
iver
y of
95%
Pie
r Ser
vice
(Nor
th T
erm
inal
)£1
57.6
Pier
3 m
oder
nist
atio
n£6
0.0
Pier
5£1
.45
£219
.0AR
RIV
ALS
BO
RD
ER Z
ON
ESAr
rival
s Bo
rder
Zon
es
£20.
0R
ECLA
IMN
T Ba
ggag
e R
ecla
im£2
.8ST
Bag
gage
Rec
laim
£12.
0
£15.
0O
NW
ARD
TR
AVEL
& A
RR
IVAL
SC
IP A
rriv
als
£2.0
OTH
ER P
ASSE
NG
ER F
ACIN
G P
RO
DU
CTS
Car
Ren
tal
£5.0
Dig
ital M
edia
- R
etur
n£5
.3Pa
ssen
ger S
ervi
ce Im
prov
emen
ts th
roug
h IT
£14.
0
£24.
0N
ON
PAS
SEN
GER
FAC
ING
PR
OD
UC
TSAd
ditio
nal S
taff
Car
Par
k C
apac
ity£4
.4C
onso
lidat
ed M
otor
Tra
nspo
rt Fa
cilit
y£4
.0Fu
ture
Cap
ital P
lann
ing
Post
201
9£1
0.0
Han
gar F
acilit
ies
£6.3
NT
Ener
gy C
entre
£6.0
Run
way
Saf
egua
rdin
g£4
.0
£34.
0
TOTA
L
£
M @
201
3/14
pric
es£1
,154
.0
Tota
l C
ost £
m
Sub-
Tota
l
Sub-
Tota
l
Sub-
Tota
l
Sub-
Tota
l
Sub-
Tota
l
Sub-
Tota
l
Sub-
Tota
l
Sub-
Tota
l
£17.
2
Cos
t per
Reg
ulat
ory
Year
(£m
at 2
013/
14 p
rices
)20
1320
1420
1520
1620
17
£24.
7£3
8.5
£48.
6£4
4.6
£12.
3£1
3.7
£13.
3£1
1.8
£27.
0
£8.6
£0.5
0
£8.3
£7.6
£2.7
0£2
.50
£3.5
0£4
.30
£8.1
£10.
1
£18.
6£1
2.2
£9.6
£9.9
£0.0
£1.9
£7.3
£51.
4£4
0.1
Sub-
Tota
l
£6.1
£0.0
Sub-
Tota
l
£55.
5
£61.
7£3
1.4
£10.
4£3
5.3
£46.
2£6
4.3
£32.
8£8
.8
£26.
5£6
2.0
£62.
0£4
7.6
£5.0
£0.0
£1.3
£1.9
£9.8
Sub-
Tota
l
£21.
0
£7.0
£0.0
£0.0
£1.1
£0.0
£0.5
£1.1
£0.5
£1.6
£7.1
£13.
2
£8.1
£4.3
£5.0
£4.1
£186
.9£2
26.6
£303
.8£2
73.1
£2.9
£1.3
£2.0
PRO
JEC
T N
AME
£10.
5£6
.9£1
0.5
£0.0
£0.0
£164
.0
£8.2
£10.
1
31
EM
ER
GIN
G ‘b
EyO
ND
Q5’ C
AP
ITA
L P
RO
GR
AM
ME: S
UM
MA
Ry
by
yEA
R£M
AT 2
013
/14
PR
ICES

33
2ChAPTER 2 2.2 BEYOND q5 CApITAl plAN
SUMMARyThe total expenditure outlined in this investment plan for the 6 year Q5 totals £1,172 million in out-turn prices. Weare continually striving to deliver more value for less by working more efficiently, ensuring that the right projectsappearing in the CIP have been fully explored considering people, process, systems and infrastructure.
Beyond Q5, we are forecasting over £1.115 billion of capital expenditure between 2014 and 2019, thereby continuinga similar rate of expenditure since the airport changed hands.
This document represents a CIP issued as an output of and for the purposes of further consultation and thus does notrepresent a mandatory investment programme.
We look forward to the continuation of this consultative process especially as we focus our joint attention ondeveloping future investment plans with the airline community to achieve the ambition of transforming Gatwick into London’s Airport of choice.
1 2 3 4

35
13ChAPTER 3CONSUlTATION ON THE CApITAl INVESTMENT pROGRAMME
INTRODUCTIONIn March 2008 the Civil Aviation Authority (CAA) published its price control review for Gatwick Airport for the fiveyear period ending 31 March 2013 (the 5th regulatory quinquennium known as ‘Q5’). 31 March 2012 completes the fourth year of Q5.
In 2011 the CAA consulted on whether to extend Q5 by an extra year to 31 March 2014. The extension was confirmedon 31 March 2011. The CAA indicated that this extension was in part influenced by the potential delay in the passagethrough Parliament of the Airports Economic Regulation Bill (“AER”). The CAA invited Gatwick to agree the terms ofthe extension directly with the airlines operating at Gatwick.
Following this decision, Gatwick and its airlines, through its Joint Steering Group (JSG), reached an agreement thatprice increases for the year ending 31 March 2014 will be no higher than RPI-0.5% compared to the RPI+2% allowedin each of the years ending 31 March 2012 and 2013.
It was also agreed that all capital expenditure triggers relating to Q5 will be terminated on 31 March 2013. GAL and the airline community will replace these with new triggers, to be agreed and submitted to the CAA by end June 2012, covering 60% of the forecast capital expenditure in the year ending 31 March 2014. Unless they jointly seek an extension of time, any failure by Gatwick to agree triggers with its airline partners by June 2012 will lead to the parties seeking a binding determination from the CAA. Gatwick’s 2013/14 capital expenditure programme will be consulted on using the normal price control consultation processes.
In December 2009 the Department for Transport (DfT) published its Decision on Reforming the Framework for theEconomic Regulation of Airports. The review concluded that the CAA should be given a new primary duty to promote the interests of passengers and a new licensing regime should be introduced similar to many other regulated sectors allowing a more effective and flexible approach to regulating airports.
Under these proposals, the CAA would also have concurrent competition and enforcement powers with the Office of Fair Trading. These reforms would enable the CAA to develop a more passenger focused, flexible and tailored set of arrangements for each airport that continues to require regulation. GAL’s current understanding is that the Civil Aviation Bill is going through the House of Commons in May 2012 and that the Government is intending to introduce this in the first half of 2012.
CONSULTATIVE STRUCTURE AND ANNEx GThe current consultative structure at Gatwick was borne out of the Constructive Engagement process, which startedin July 2005 and which was initially focussed on the collaborative development Q5 between GAL and its airlinecommunity.
Four years into Q5, the consultative dialogue between GAL and its airlines continues as an on-going process atGatwick, helping in the assessment the high-level options for the development of the airport, including details ofcosts for each option, impact on user charges, constructability, future-proofing, operational efficiency and, where possible, future airline costs.
1 2 3 4

36
Communicationsand feedbackJoint Steering Group
Decisions, guidance,recommendations &
feedback
Recommendations,escalations & feedback
CE Jo
int W
orki
ng G
roup
s
Joint Working Structure AOC/IATA Structure
AOCAOC consultative
structure
AOC members will also be represented at
CE Groups
ACCACC consultative structure eg. ACC
airport charges annual meeting, ACC members will also be
represented at CE Groups
Capital Programme Board Plus working
groups - set up to fact find for specific issues& projects - scheduled throughout the year
ConstructiveEngagement
WorkingGroup
(CEWG)
Charges Group
Plus specified charges sub-
group and other sub-groups as
required
Input through
membership groups
and comms/feedback
ANNEx GPrior to the commencement of Q5, Gatwick airport and its airlines were invited by the CAA to consult on updating theexisting agreement on information disclosure and consultation on investment plans. The outputs of this consultative process were passed over to the CAA for final adjudication.
The CAA published the final agreement, namely Annex G incorporating its verdict on the outstanding issues ofdisagreement in its March 2008 Decision Document. A copy of Annex G can be seen in Appendix G.
Appendix E contains a summary of airline consultation at Gatwick since the publication of CIP2011. This summaryincludes details of meetings and working groups relating to the development of Gatwick. The agenda items and topicsof discussion between Gatwick and the airline community are listed by date and forum.
Also included is a list of the agreements and disagreements in Appendix F since the publication of CIP2011.
CONSULTATION AND ThE DESIGN FOR SIx SIGMA (DFSS) PROCESSIn order to adhere to Annex G consultation between the airport and airlines must take place:
• prior to Tollgate 2 (Brief) and• prior to Tollgate 3 (Options) and• prior to Tollgate 4 (Construction Decision)
Summary business cases are henceforth provided as soon as possible in draft form and finalised at Tollgate 4 as amethod of articulating both the business case and cost benefit analysis. The actual business case template evolvedthrough consultation but has now reached an agreed format. Business case summaries in effect provide a clear and concise summary including details of costs for each option, impact on user charges, constructability, future-proofing, operational efficiency and, where possible, future airline costs.
The DfSS process is summarised below:
CONSULTATIVE STRUCTURE The following diagram represents the current consultative structure at Gatwick:
3ChAPTER 3CONSUlTATION ON THE CApITAl INVESTMENT pROGRAMME
DfSS Stage 1 DfSS Stage 2 DfSS Stage 3 DfSS Stage 4 DfSS Stage 5 DfSS Stage 6 DfSS Stage 7
Design &
Development
(Options)
Design,
Pre-
Construction,
Procurement
Award
Contract,
Construction
Airport
Operational
Readiness
‘Go Live’
Commercial
Completion
Close Out
Project
Project &
Process
Specification
(Brief)
Customer &
Business
RequirementsInitiate Scope Options Build Handover Operate Close
Out
Re-quire-ments
TG = Tollgate Review Meeting
TG 0 TG 1 TG 2 TG 3 TG 4 TG 5 TG 6 TG 7
1 2 3 4

37
ENGAGEMENT WITh OUR PASSENGERS AND ThE WIDER GATWICk COMMUNITyThe established formal structure for the collection of feedback and recommendations from Gatwick’s passengers and the wider Gatwick community can be seen next:
Established in 1956, GATCOM (Gatwick Airport Consultative Committee) is a statutory advisory body constituted by Gatwick in accordance with the Civil Aviation Act 1982 (as amended by the Airports Act 1986). It has 28 appointed representatives from a wide range of interests including local authorities, civil aviation, passenger, business and community and environmental groups. A Government representative is also present at the main Committeemeetings, together with Gatwick’s Chief Executive Officer (CEO) and his senior management team.
GATCOM meets quarterly to consider any question in connection with the operation and development of Gatwickand its effect on local communities, passengers, airlines and other users of the airport. As can be seen from thediagram above GATCOM has two Sub-Groups, the GATCOM Steering Group and the Passenger Advisory Group (PAG).
The role of the Steering Group is to give preliminary consideration to new or detailed matters to be dealt with by the Consultative Committee and to identify the facts and major issues, and make recommendations thereon.
Dialogue with the airport community will continue as we shape our future and build Gatwick’s reputation as London’sairport of choice. The key functions of the Passenger Advisory Group are:
• To monitor the procedures and facilities available to passengers and to make recommendations for their improvement.
• To identify any issues arising from passenger experiences and make recommendations.
• To identify any gaps in services available to passengers.
• To consider procedures for handling and responding to passenger complaints.
• To provide a passenger overview on airport developments at the design stage.
• To establish and maintain a positive working relationship with relevant Gatwick managers and airline contacts, including consultation in respect of key developments for passenger services and facilities.
• To report regularly to GATCOM and to make recommendations in respect of its conclusions and concerns about the provision of passenger facilities and service quality at Gatwick.
Further information about GATCOM can be accessed at http://www.ukaccs.info/gatwick/
As well as the formal structure outlined above, more informal communications are commissioned through thecompany website, YouGov ( international online market research agency) surveys and using posters and other media.
GATCOM
GATCOM Steering Group
Decisions, guidance,recommendations
& feedback
Decisions, guidance,recommendations
& feedback
PAG
3ChAPTER 3CONSUlTATION ON THE CApITAl INVESTMENT pROGRAMME
1 2 3 4

38
LIST OF AGREED STRATEGIC ChANGES TO ThE CIPThe strategic change control process is well established at Gatwick as the agreed mechanism to facilitate changes tothe CIP. Any significant change to the CIP occurs at a strategic level worked through at the working groups andCapital Programme Board (CPB) for submission to the Joint Steering Group (JSG).
Tactical changes associated with the day- to- day project delivery continue to happen through the capital projectchange control process at project board and working group level.
Strategic change control applies to projects that are identified in the CIP by a GAL Number. The criterion for listing a project in the CIP and thus allocation of a GAL Number is that the total Future Spend (including current year) or Anticipated Final Cost (AFC) is greater than £5 million. Any other projects that do not appear in the CIP as a separate line are included in the identified ‘Programme’ lines.
Changes to the CIP are tracked and submitted to the CPB and JSG for approval at milestone decision points in thedevelopment process. The triggers for evoking change control are:
• Spend in the year +/- 10% (or greater than £500k)• Anticipated Final Cost (AFC) +/- 10%
(or greater than £500k)• Start/Finish +/- 1 year• New projects• Deleted projects
The process for making changes to triggers, as laid out in the CAA’s decision paper on trigger definition [GatwickAirport - CAA decision on the specification of capital expenditure triggers March 2009] is outlined later in this chapter.
Since the publication of the Gatwick CIP 2011 a number of changes to the Capital Investment Programme (includingR2 drawdowns) have been agreed through the Joint Steering Group (JSG). These changes are summarised below:
A list of changes brought through the established CCRS (Change Control Request Sheet) change control process is provided in Appendix C - Changes to Investment Programme - Tracker (2008 - 2012).
CCRslGWRef No
GAlProjectNo.
Project Name Description of Change Date Approvedat JsG
0081 GAL149 ST Immigration R2 Drawdown for additional scope & budget 12/01/2012
0082 GAL169 NT Early Baggage Store Increase of budget from £13 to £22.98m Project Deferred
- Beyond Q5
0083 GAL124 Asset Replacement R2 Drawdown for creation of a new project to replace the NT HBS Level 3equipment 08/02/12
0084 -0092 GAL137 NT Baggage Upgrade x
9 CCRS R2 Drawdown for additional scope In discussion
0093 GAL126 Commercial & PropertyAsset Stewardship R2 Drawdown for additional scope 07/03/2012
0094 GAL176 Facilities AssetStewardship S1+S2 Switchboard Replacement 07/03/2012
3ChAPTER 3CONSUlTATION ON THE CApITAl INVESTMENT pROGRAMME
1 2 3 4

39
RISk MANAGEMENT (R2 DRAWDOWN PROCESS)New processes and practices have been implemented at Gatwick regarding the management of risk at a portfoliolevel. These new processes and practices demonstrate a clear view of remaining risk allowances and where it hasbeen allocated, driving project performance to deliver within their budgets and holding CIP funds outside of theprojects for unforeseen portfolio risks. The portfolio risk (R2) / contingency procedures that have been implemented:
• Recognise the requirements of Annex G.
• Remove exposure by projects to uncontrolled allocation/expenditure.
• Demonstrate improved reporting, managed within Project Controls.
• All portfolio risk (R2) / contingency drawdown greater than £250k is to be consulted prior to drawdown with the airlines. If a portfolio risk (R2) / contingency drawdown is less than £250k, but a previous drawdown has been made for a particular project then this is also consulted prior to draw down with the airlines.
The drawdown of risk from the portfolio fund uses the already agreed change control process, as outlined previously in this chapter.
The full list of R2 drawdowns that have been consulted with the airline community at Gatwick since the publication of2011 CIP has been provided above.
TRIGGERSCapital investment triggers have been a feature at Gatwick since the beginning of the five-year price control periodQ5 that commenced on 1 April 2008.
In the broadest sense the trigger projects specify a reduction to the level of the revenues that the airport can expect in airport charges if certain milestones are not reached in respect of relevant capital projects by defined dates. The CAA considers capital investment triggers to be an important aspect of the financial incentives placed on Gatwick, to encourage timely and efficient delivery of the investment projects that airline users have discussed in constructive engagement and for which they are paying through airport charges.
The CAA published its final decision regarding trigger definition at Gatwick on 25 March 2009 [Gatwick Airport - CAA decision on the specification of capital expenditure triggers]. It establishes a baseline specification against which any proposed changes could be measured and assessed. The CAA has confirmed the link between the scale of the capital investment for each relevant project and airport charges revenue that would be at risk in Q5. The definitions included in the CAA publication relate to the scope and phasing of projects consistent with the capital programme underpinning the price determination decision in March 2008. The CAA outlined the incentive to encourage efficient project management as:
• In respect of each relevant project, the allowable revenue from airport charges will be reduced by a specified monthly sum (defined in cash terms) for every month that the project milestone remains undelivered.
• With the exception of relatively small projects, the specified monthly sum will be determined based on one 12th of the return on the completed value of the asset as projected in the capital investment plan on which the price cap is based, re-valued to the money value of the day.
• Relatively small projects will be subject to a minimum monthly payment of £100,000. The CAA’s decision for projects legal interpretation is set out in the price control condition for each airport.
It is worth noting that changes have been made with agreement and approval since then and are documented on the restricted website for Constructive Engagement.
3ChAPTER 3CONSUlTATION ON THE CApITAl INVESTMENT pROGRAMME
1 2 3 4

40
PROCESS FOR TESTING WhEThER TRIGGERS hAVE bEEN METAs laid out in the ‘Proposed Change to trigger verification process for Gatwick Airport, CAA Decision – september2011’ the process for testing whether triggers have been met is as follows:
The airport and the ACC at Gatwick send a joint letter certifying the completed works to the CAA and confirmingsuccessful performance against the triggered project milestone(s).
This letter should state
• how the views of airlines have been sought, and
either that:
• no airlines objected;• certain named airlines objected, and a brief summary of
these objections and• how they have been addressed; or• the AOC/ACC as a whole does not agree with the
airport that the trigger has been met, setting out the reasons for the disagreement.
ii. Where the CAA receives a joint letter from the airport and AOC/ACC agreeing to the trigger and confirming that no objections exist, the CAA will not consult further before agreeing the trigger.
iii. Where the CAA receives a joint letter from the airport and AOC/ACC agreeing to the trigger but stating that certain airlines objected, the CAA may investigate these objections before deciding whether to agree to the trigger.
iv. Where the AOC/ACC does not agree with the airport that the trigger has been met then the CAA will investigate any objections before deciding whether to agree to the trigger.
The CAA expects the letter stating that the trigger has been met to be a joint one from the airport and the AOC/ACC.Where this is not provided, the CAA will ask the airport to submit a joint letter before agreeing the trigger unlessthere are compelling reasons not to.
The following extract from ‘Proposed Change to trigger verification process for Gatwick Airport, CAA Decision –september 2011’ sets out the new trigger verification process, effective from 8 September 2011.
PROCESS FOR MAkING ChANGES TO TRIGGERSIn line with the ‘CAA decision on the specification of capital expenditure triggers - March 2009 ‘, changes to triggerscan occur in the following 2 scenarios:
i. Airport & Airlines agree regarding changes to the CIPA joint agreement is sent to CAA including: changes to the triggers (including substitute or new triggers), anyother agreements such as pricing below the cap and evidence of airline support. The process is as follows:
• CAA then allows 28 days for any objections.
• CAA would expect to approve the agreement within 14 days of the end of the consultation period.
ii. Airport does not have sufficient support from airlinesA proposal from the airport can be submitted including changes to the triggers (including substitute or newtriggers), any other agreements such as pricing below the cap and evidence of airline support. The process is asfollows:
• Airport submission to CAA.
• CAA would publish proposals for consultation and invite interested parties to respond. Period for written submissions would not be less than 12 weeks.
TRIGGER COMPLETION DATE
CAA receives JOINT letterfrom airport AND airline committee1
Letter states that certain airlines OBJECTED to
trigger completion
Letter states that theairline committee does not agree with the airport that the trigger has been met
Letter confirms NO objections to the trigger
were made by airlines
CAA writes to airport to confirm triggerhas been met
CAA reserves right to investigate objections
prior to issuing a decision
CAA investigatesobjections prior
to issuing a decision
(1) Gatwick Airport Limited: Alan Peever; Simon Elliot, JSG Representative;
3ChAPTER 3CONSUlTATION ON THE CApITAl INVESTMENT pROGRAMME
1 2 3 4
41
been identified as the delivery of one single project comprising both the construction of a new South TerminalBaggage Factory and Pier 1.
Gatwick believes that this is a more cost effective way to replace current baggage facility and Pier 1 than the originalscheme whilst addressing shortfalls in service to airlines and passengers and facilitating latest check-in products andprocesses. Airlines have been supportive of the new solution, the project being supported at Tollgate 3 (TG3) inNovember 2011.
The trigger date for delivery of benefits associated with the ST Baggage project is 31st January 2013. By this date, the Hold Baggage equipment will have been replaced and this enables the flexibility to allow any baggage to be delivered to any chute. GAL is currently discussing a further trigger with the airlines for this project during Q5+1.
TRIGGERS FOR ThE ExTENSION yEAR (Q5+1)Following the ACC’s request that Pier 5 be a trigger project for Q5+1, a draft definition was provided to ACC in March 2012. Comments from the ACC have been received and consultation is on-going. ACC advised in May 2012 that the other projects they want triggered are ST Baggage & Pier 1, Crew Reporting and ST IDL Reconfiguration.
The ACC and GAL have agreed with the CAA to submit trigger definitions by August 2012.
FUTURE ENGAGEMENT PLANLooking ahead to 2012 and beyond, a series of meetings have been planned to engage with our airline partnersregarding on-going Q5 development and beyond Q5 capital plans at Gatwick.
The formal consultation process of Constructive Engagement (CE) for the period beyond Q5 officially commenced in April 2012, with the initial GAL business plan submitted to the airline community in April 2012, representing Gatwick’s initial submission to the constructive engagement process. Our initial business plan explains how our service proposition results in the Capital expenditure proposals contained in the business plan, outlining how we will bridge the gap between our current capability and our future service proposition that we firmly believe will confer us a competitive advantage and help us achieve our ambition to ‘become London’s airport of Choice’.
Weekly Constructive Engagement Working Group (CEWG) meetings have been scheduled in order to consult on GAL’sinitial Business Plan until mid-December thus informing GAL’s second regulatory Business Plan submission in January 2013.
• Depending on the significance of the changes the CAA might then decide to hold meetings with some of the respondents.
• The CAA would publish a decision with reasoning together with any revision to the price control to reflect the new triggers.
The CAA, however, would expect to withhold approval regarding changes to triggers where such agreements:
• Did not give adequate weight to the interests of passengers as users.
• On the basis of objections made, the agreement did not seem to the CAA to represent the interests of users generally or appeared unreasonably to discriminate against any user or class of user.
The CAA has also emphasised that it expects the process of change control applied to triggers, as highlighted above,to enable an airport and its users to adapt to circumstances where priorities change.
Capital expenditure originally projected on one project may be diverted to extend the scope of, or bring forward,some other project. Although, whilst the CAA would be prepared to approve changes, which either added to, orreduced the amounts at risk, it did not anticipate that this would be likely and would normally seek to limit changesto the price control under these arrangements to triggers and would not seek to make other changes.
Examples where capital expenditure has been re-allocated are as follows:
• Pier 7 project to Pier 2 and Pier 1• Pier 7 to Pier 5 (Additional NT Pier Service)
ST FORECOURT TRIGGER AChIEVEMENTSouth Terminal Forecourt, the last active trigger project in the original Q5 (five year period ending 31 March 2013)was confirmed as being achieved by the CAA in March 2012.
ST bAGGAGE PROjECT TRIGGERThere was an operational requirement to address shortfalls in service to airlines and passengers when GAL went intoQ5, which at that time was thought, would be solved by replacing the current baggage facility and refurbishment ofPier 1 under two separate projects. Gatwick has challenged itself to provide the most efficient solution which has
3ChAPTER 3CONSUlTATION ON THE CApITAl INVESTMENT pROGRAMME
1 2 3 4


43
14ChAPTER 4pROjECT DESCRIpTIONS
INTRODUCTIONThis chapter contains both individual projects and programme descriptions, including cost breakdowns for allindividual projects over £5 million (out- turn) within the 6 year period of Q5 . The drivers for investment at projectlevel, the cost breakdowns of the projects as well as the outputs that will be delivered, in terms of infrastructure andbenefits to airlines and passengers are also outlined.
CRITERIA FOR PROVISION OF INFORMATIONCriteria for provision of information are as follows:
• Project Descriptions for all projects or programmes over £5 million (out -turn) within the 6 year period of Q5 provided
• Cost breakdowns have only been provided for Projects that are ‘in delivery’ but not for ‘Programmes’ as the latter consist of various initiatives , such as GAL 096 - Airfield Programme including Main Runway and Northern Runway re-surfacing.
• No cost breakdowns are provided post Tollgate 5 following completion of construction, however a total cost is provided.
• The project description sheets of Projects shown as completed in 2011CIP have not been re-produced in the following pages.
The table on the next page outlines the contents of Chapter 4.
1 2 3 4

44
GAL Number
Project / Programme NameQ5
(CIP11)Cost
BreakdownQ5 +1Project
CommentPage
Number
GAL 063 Security Development Programme Y Programme 61
GAL 096Airfield Programme including RunwayResurfacing
Y Programme 59
GAL 111North Terminal Additional PierService (Pier 5)
Y Y Y 49
GAL 120 South Terminal Forecourt Y Y 55
GAL 125 & GAL 005
South Terminal Baggage & Pier 1 Y Y Y 53
GAL 128 Operational Efficiency Programme Y Programme 60
GAL 134North Terminal Additional PierService
Y 51
GAL 137 North Terminal Baggage Upgrade Y 57
GAL 143 Clean, Working & Friendly Y Programme 63
GAL 149 South Terminal Immigration Y 58
GAL 157 North Terminal Security Y Y 47
GAL 159 & GAL 135
IT Transformation & IT Programme Y Programme 62
GAL 160 &161 & 162
Surface Water inclu Pond D Y Programme 85
GAL 165 & GAL 166
Taxiway Papa & November Y Y 45
GAL 167 Railway Contribution Y Y 64
GAL 171 A380 on Stand Y Y Programme 65
GAL 172 Airfield Peak Capacity Expansion Y Programme 67
GAL 173 Crew Reporting Y Y 68
GAL 174 South Terminal Domestic Arrivals Y 70
GAL 175a North Terminal IDL Reconfiguration Y Y Y 71
GAL 175b South Terminal IDL Reconfiguration Y Y Y 73
GAL 176 Facilities Asset Stewardship Y Y Programme 75
GAL 177 Commercial Asset Stewardship Y Y Programme 76
GAL 178 Airfield Asset Stewardship Y Y Programme 77
GAL 179 Airfield Operations Building Y Y 78
GAL 180 Q5 Minor Projects Y Programme 80
GAL 181 Beyond Q5 Development 81
GAL 182 Q5+1 Minor Projects Y Programme 82
GAL 183 Flood Alleviation Programme 83
ChAPTER 4 - PROjECT DESCRIPTIONS ShEET - SUMMARy OF INFORMATION PROVIDED
1 2 3 4

45
GAL 165 & 166TAXIWAYS pApA & NOVEMBER
CURRENT STATUS WIThINGATWICk PROjECT PROCESS
REQUIREMENTS
bENEFITS
TOTAL CAPITAL ExPENDITURE
£ MILLIONS (EST.)
PROjECT START DATE
PROjECT END DATE
LIkELy IMPACT ON OPERATING COSTS
INDICATIVE IMPACT ON AIRPORT ChARGES IN Q5 AND/OR bEyOND Q5
IMPACT ON GATWICk’SCOMPETITIVE POSITION
bASIS OF DECISION (OPTIONS)
ASSET LIFECyCLE
LINkED PROjECTS /INTERDEPENDENCIES
SCOPE:Full rehabilitation to re-life the pavement:• Resurfacing 100mm of existing bituminous surfacing & re-profile• Replacement of AGL luminaire, primary and secondary cabling and transformers• Rectification of full Code E taxiway non-conformances to CAP 168
Taxiways Papa and November are main arteries for the airport and are critical to maintaining airside operations, contributing to the airport achieving its targets on runway capacity and pier service for both the North Terminal and South Terminal. Full rehabilitation of the northern sections of Papa and November to re-life the pavement condition for a further 15 years for the bituminous pavements is required, as well as pavement, drainage and AGL repairs to the southern sections.
Rehabilitating at this time will:• prevent future deterioration of the pavement sub-layers;• ensure maintenance of CAP168 compliance and the ability to operate safely;• mitigate against high maintenance (planned and unplanned) costs;• mitigate against unplanned closures and associated delays;• mitigate against a reduction in capacity and service to the main and northern runways and
service to piers 1 (during northern runway ops) 2, 3, 4, and 5.
Q5 - £7.3m Q5+1 - £0m
As this project has passed through Tollgate 4 this value represents a cost amount attributable to a defined scope and programme that will, or has been delivered.
December 2011
August 2012
The main runway rehabilitation business case summary, as submitted to the JSG,highlighted the likely impact on operating costs
Additional airport charges per total Gatwick passenger beyond Q5 £0.03
Rehabilitation of taxiways Papa and November assures on-going delivery of service for the airport’s primary asset, thereby enabling airlines to operate and provide consistent levels of service for passengers.
Required to maintain Gatwick’s aerodrome license with options to improve performance and optimise capacity. Option evaluation has thus far focused on the location and size of the future developments as part of the master plan and Constructive Engagement work.
15 years
• Main Runway Rehabilitation• A380 on Pier• Airfield Peak Capacity Expansion• Airfield Asset Stewardship
DfSSStage 2
DfSSStage 3
DfSSStage 4
DfSSStage 5
DfSSStage 6
DfSSStage 7
DfSSStage 1
Initiate Scope Req’ments Options Build Handover Operate Closeout
TG0 TG1 TG2 TG3 TG4 TG5 TG6 TG7
1 2 3 4

46
CURRENT STAGE COST bREAkDOWN
bASE CONSTRUCTION / DIRECT COSTS
PROjECT DESIGN / ON-COSTS
RISkS: PROjECT RISk (R1)OVERALL TOTAL
DRAWING/IMAGE ShOWING LOCATION
Total £ M % of Total Cost
5.9 81
0.8 11
0.6 8
7.3 100
1 2 3 4

47
GAL 157NORTH TERMINAl SECURITY
DfSSStage 2
DfSSStage 3
DfSSStage 4
DfSSStage 5
DfSSStage 6
DfSSStage 7
DfSSStage 1
Initiate Scope Req’ments Options Build Handover Operate Closeout
TG0 TG1 TG2 TG3 TG4 TG5 TG6 TG7
CURRENT STATUS WIThINGATWICk PROjECT PROCESS
REQUIREMENTS
bENEFITS
TOTAL CAPITAL ExPENDITURE
£ MILLIONS (EST.)
PROjECT START DATE
PROjECT END DATE
LIkELy IMPACT ON OPERATING COSTS
INDICATIVE IMPACT ON AIRPORT ChARGES IN Q5 AND/OR bEyOND Q5
IMPACT ON GATWICk’SCOMPETITIVE POSITION
bASIS OF DECISION (OPTIONS)
ASSET LIFECyCLE
LINkED PROjECTS /INTERDEPENDENCIES
SCOPE:This project aims to provide additional Security lanes for use during peak periods to maintain or improve the passenger experience. Failure to deliver this enhancement will degrade customer service levels and increase queue times as passenger numbers increase at peak operational times.
Delivering of capacity of an additional 4 lanes within central search. It is assumed 17 lanes are delivered in Q5 with safeguarding for an eventual 24 lanes in the future.Delivery of a professional, efficient and courteous experience for passengers.
Supports Gatwick’s strategic priority to “deliver the best passenger experience “through the provision of infrastructure that provides resilience for our security product at peak times in the North Terminal. Supports Gatwick’s strategic priority to “help airlines grow” by providing facilities to support on time departure by delivering appropriate capacity requirements.
Q5 - £11.5m Q5+1 - £0m
As this project has passed through Tollgate 4 this value represents a cost amount attributable to a defined scope and programme that will, or has been delivered.
October 2010
May 2012
Increases to utilities and rates.Operating costs may see reductions
It has been agreed that summary business cases will be provided at either Tollgate 4 (Construction Decision) or potentially at Tollgate 3 (Options Decision) for some projects as a method of articulating business case and cost benefit analysis [Joint Steering Group, 7th September, 2011]. This particular project was past Tollgate 4 prior to this agreement.
Fast, efficient and effective security search processes enhance Gatwick’s ability to compete through provision of efficient passenger process facilitating the airlines’ ability to depart on time.
The option evaluation focused on the development in the context of Gatwick’s master plan and included non-build options. The conclusion recommended a consolidated area with sufficient flexibility to safeguard for future expansion.
20 years
• North Terminal Extension• North Terminal Baggage• North Terminal Forecourt• North Terminal Interchange
1 2 3 4

48
CURRENT STAGE COST bREAkDOWN
bASE CONSTRUCTION / DIRECT COSTS
PROjECT DESIGN / ON-COSTS
RISkS: PROjECT RISk (R1)OVERALL TOTAL
DRAWING/IMAGE ShOWING LOCATION
Total £ M % of Total Cost
8.3 72
2.2 19
1.0 9
11.5 100
1 2 3 4

49
GAL 111NORTH TERMINAl ADDITIONAl pIER SERVICE (pIER 5)
DfSSStage 2
DfSSStage 3
DfSSStage 4
DfSSStage 5
DfSSStage 6
DfSSStage 7
DfSSStage 1
Initiate Scope Req’ments Options Build Handover Operate Closeout
TG0 TG1 TG2 TG3 TG4 TG5 TG6 TG7
CURRENT STATUS WIThINGATWICk PROjECT PROCESS
REQUIREMENTS
bENEFITS
TOTAL CAPITAL ExPENDITURE
£ MILLIONS (EST.)
PROjECT START DATE
PROjECT END DATE
LIkELy IMPACT ON OPERATING COSTS
INDICATIVE IMPACT ON AIRPORT ChARGES IN Q5 AND/OR bEyOND Q5
SCOPE:The Pier 5 project has the overall business objective of delivering improved Pier Service Levels to meet future growth in passenger numbers in the North Terminal and support the overall Pier Service Level target of 95%. This will be achieved by reconfiguring the stands, providing independent access to each aircraft parking position, dedicated gate rooms for each stand and removing passenger cross flows within the pier. Additional objectives include ensuring efficient operations, improving passenger experience and improving the quality of service.
• Modernisation of outdated facility to improve passenger experience• Reconfiguration of stands to accommodate Full Code C• Removal of passenger cross flows within the Pier to allow simultaneous gate and stand
operations• Full Code C MARs capability to all parking positions• Provision of dedicated gate rooms for MARs stands
• 0.8 million additional passengers rising to 1.1 million by 2024 will be Pier served (equivalent to 4% of North Terminal passengers rising to 5% by 2024)
• A greater number of people will walk less distance to gate, and spend more time in the IDL• Improved PRM facilities• Reduced dwell time at gate• Flexible stands accommodate different aircraft types with independent and simultaneous
embarkation/disembarkation on MARs stands• Additional nodes allow simultaneous operations• Provision of facilities for additional 3 x Full Code C and 1 x Code D/E• Greater flexibility to respond to schedule change, positively impacting On Time
Performance and Punctuality• Removal of current stand planning constraints• More efficient utilisation of space for servicing of aircraft• Removal of passenger cross-flows and associated operations inefficiency• Current segregation of arrivals and departures relies on adherence to operating
procedures. Vertical segregation will mitigate risk of security breaches
Q5 - £41.5m Q5+1 - £30.7m
As this project has passed through Tollgate 4 this value represents a cost amount attributable to a defined scope and programme that will, or has been delivered.
January 2011
May 2014
Reduction in airline coaching costs of £1.00 per passenger (estimated benefit of £820k in 2015/16) Increased IDL dwell time of up to 5 mins per incremental pier served passenger (an estimated benefit of £170K in 2015/16)
Beyond Q5 Over Pier 5 Life (20 yrs)Additional airport charges per total Gatwick passenger £0.26 £0.18Airline Cost per incremental Pier 5 served passenger £10.6 £6.2(Includes airline pier coaching saving)
1 2 3 4

50
CURRENT STAGE COST bREAkDOWN
bASE CONSTRUCTION / DIRECT COSTS
PROjECT DESIGN / ON-COSTS
RISkS: PROjECT RISk (R1)
OVERALL TOTAL
DRAWING/IMAGE ShOWING LOCATION
Total £ M % of Total Cost
54.2 75
10.8 15
7.2 10
72.2 100
IMPACT ON GATWICk’SCOMPETITIVE POSITION
bASIS OF DECISION (OPTIONS)
ASSET LIFECyCLE
LINkED PROjECTS /INTERDEPENDENCIES
The project will give Gatwick improved facilities, bringing it in line with other airports in the South East. It provides additional flexibility for the forecast fleet mix and the increase in passenger numbers, and from a passenger experience perspective, gives shorter walking distances and increased time spent in the IDL.
Do nothing – implications of the do-nothing scenario include:• Pier Service Level in the North Terminal will reduce from 96% (2011) to 89% in 2018.• Remote stand coaching requirements will increase• 17 Construction options identified
20 years
• North Terminal Interchange• North Terminal Extension• North Terminal Multi-storey Car Park• North Terminal Early Bag Store Expansion• North Terminal Security• North Terminal IDL Capacity Expansion• North Terminal Landside Arrivals/Onward Travel• Check-in Hall Reconfiguration• North Terminal Pier Service
1 2 3 4

51
GAL 134NORTH TERMINAl ADDITIONAl pIER SERVICE
DfSSStage 2
DfSSStage 3
DfSSStage 4
DfSSStage 5
DfSSStage 6
DfSSStage 7
DfSSStage 1
Initiate Scope Req’ments Options Build Handover Operate Closeout
TG0 TG1 TG2 TG3 TG4 TG5 TG6 TG7
CURRENT STATUS WIThINGATWICk PROjECT PROCESS
REQUIREMENTS
bENEFITS
TOTAL CAPITAL ExPENDITURE
£ MILLIONS (EST.)
PROjECT START DATE
PROjECT END DATE
LIkELy IMPACT ON OPERATING COSTS
INDICATIVE IMPACT ON AIRPORT ChARGES IN Q5 AND/OR bEyOND Q5
IMPACT ON GATWICk’SCOMPETITIVE POSITION
SCOPE:To deliver the required Pier Service Levels to meet the future growth in passenger numbers and fleet mix in the North Terminal. This will ensure efficient operations and an improved passenger experience. The purpose of the project is to continue to maintain evels above 95%, and to safeguard operations and Pier Service Levels for future forecasts.
• To meet 95% Pier Service Levels in line with future forecasts• To meet future fleet mix requirements including the provision for Code F• Acceptable travelling time to gate and passenger journey quality• New air bridges and MARS capable stands with independent aircraft parking positions
serving short and long haul aircraft
• Maintain Pier Service Levels above 95% as passenger numbers increase• Provision of A380/Code F and increased long haul capability• Provision of IATA Level of Service C gate lounges• Improved PRM facilities• Greater flexibility to respond to schedule change, and improve On Time Performance• More efficient utilisation of space for aircraft servicing• Independent embarkation/disembarkation on MARS stands
Lower range : £50m Q5 - £7.1Upper range : £400m
This is a cost estimate which equates to a rough order of magnitude (ROM) estimate, based on the available scope definition at this preliminary conceptual design phase. As such it is subject to change and refinement aligned with a more detailed definition of the scope as options are clarified and prioritised throughout the development process.
April 2008
To Be Confirmed - Dependant on chosen option
Impact on operating costs will depend on chosen option, however likely impacts include an increase to utilities and rates for the chosen Pier option, with a potential further increase to operational costs if the solution involves additional coaching.
To be provided at TG3. At time of going to print, this project was not at this stage.
Ensures Gatwick can compete with other airports in the South East by providing an improved passenger service and experience. In addition, the provision of increased long haul, together with Code F capability, will enable Gatwick to increase its passenger numbers within the constraints of the runway movements.
1 2 3 4

52
DRAWING/IMAGE ShOWING LOCATION
bASIS OF DECISION (OPTIONS)
ASSET LIFECyCLE
LINkED PROjECTS /INTERDEPENDENCIES
Do nothing – implications of the do-nothing scenario include:• Pier Service Level in the North Terminal will reduce from 96% (2011) to 89% in 2018.• Remote stand coaching requirements will increase• The Strategic Options Viability Study has assessed the key options to facilitate the decision
making process. The key options to compliment Pier 5 in providing additional North Terminal Pier Service include:
• Cargo Pier • Tower Stands Shuttle Pier (single mode or mixed mode) • Pier 6 South Extension • Pier 6 DeepeningThe cost ranges stated above do not take into account whether an option provides for the future increase in passenger numbers and fleet mix. A combination of options may be required to meet the future forecasts.
25 years
• North Terminal Interchange• North Terminal Extension• North Terminal Multi-storey Car Park• North Terminal Early Bag Store Expansion• North Terminal Security• North Terminal Pier Service (Pier 5)• North Terminal IDL Capacity Expansion• North Terminal Landside Arrivals/Onward Travel• Check-in Hall Reconfiguration
1 2 3 4
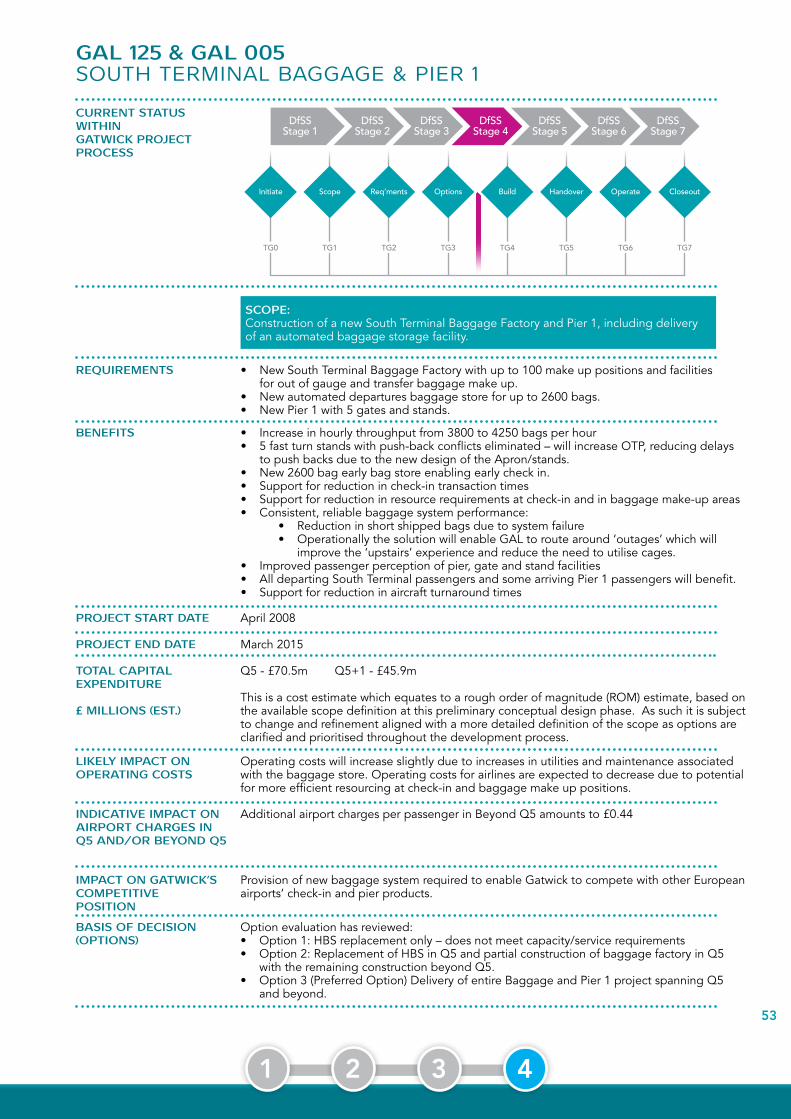
53
GAL 125 & GAL 005SOUTH TERMINAl BAGGAGE & pIER 1
DfSSStage 2
DfSSStage 3
DfSSStage 4
DfSSStage 5
DfSSStage 6
DfSSStage 7
DfSSStage 1
Initiate Scope Req’ments Options Build Handover Operate Closeout
TG0 TG1 TG2 TG3 TG4 TG5 TG6 TG7
CURRENT STATUS WIThINGATWICk PROjECT PROCESS
REQUIREMENTS
bENEFITS
TOTAL CAPITAL ExPENDITURE
£ MILLIONS (EST.)
PROjECT START DATE
PROjECT END DATE
LIkELy IMPACT ON OPERATING COSTS
INDICATIVE IMPACT ON AIRPORT ChARGES IN Q5 AND/OR bEyOND Q5
IMPACT ON GATWICk’SCOMPETITIVE POSITION
bASIS OF DECISION (OPTIONS)
SCOPE:Construction of a new South Terminal Baggage Factory and Pier 1, including delivery of an automated baggage storage facility.
• New South Terminal Baggage Factory with up to 100 make up positions and facilities for out of gauge and transfer baggage make up.
• New automated departures baggage store for up to 2600 bags.• New Pier 1 with 5 gates and stands.
• Increase in hourly throughput from 3800 to 4250 bags per hour• 5 fast turn stands with push-back conflicts eliminated – will increase OTP, reducing delays
to push backs due to the new design of the Apron/stands.• New 2600 bag early bag store enabling early check in.• Support for reduction in check-in transaction times• Support for reduction in resource requirements at check-in and in baggage make-up areas• Consistent, reliable baggage system performance: • Reduction in short shipped bags due to system failure • Operationally the solution will enable GAL to route around ‘outages’ which will
improve the ‘upstairs’ experience and reduce the need to utilise cages.• Improved passenger perception of pier, gate and stand facilities• All departing South Terminal passengers and some arriving Pier 1 passengers will benefit.• Support for reduction in aircraft turnaround times
Q5 - £70.5m Q5+1 - £45.9m
This is a cost estimate which equates to a rough order of magnitude (ROM) estimate, based on the available scope definition at this preliminary conceptual design phase. As such it is subject to change and refinement aligned with a more detailed definition of the scope as options are clarified and prioritised throughout the development process.
April 2008
March 2015
Operating costs will increase slightly due to increases in utilities and maintenance associated with the baggage store. Operating costs for airlines are expected to decrease due to potential for more efficient resourcing at check-in and baggage make up positions.
Additional airport charges per passenger in Beyond Q5 amounts to £0.44
Provision of new baggage system required to enable Gatwick to compete with other European airports’ check-in and pier products.
Option evaluation has reviewed:• Option 1: HBS replacement only – does not meet capacity/service requirements • Option 2: Replacement of HBS in Q5 and partial construction of baggage factory in Q5
with the remaining construction beyond Q5.• Option 3 (Preferred Option) Delivery of entire Baggage and Pier 1 project spanning Q5
and beyond.
1 2 3 4

54
CURRENT STAGE COST bREAkDOWN
bASE CONSTRUCTION / DIRECT COSTS
PROjECT DESIGN / ON-COSTS
RISkS: PROjECT RISk (R1)
OVERALL TOTAL
DRAWING/IMAGE ShOWING LOCATION
Total £ M % of Total Cost
72.2 62
30.2 26
14.0 12
116.4 100
ASSET LIFECyCLE
LINkED PROjECTS ANDPRIORITISATION bASED ON ChRONOLOGICAL REQUIREMENT
25 years
• South Terminal IDL Reconfiguration• Crew reporting improvement• Domestic Arrivals• Airfield projects
1 2 3 4
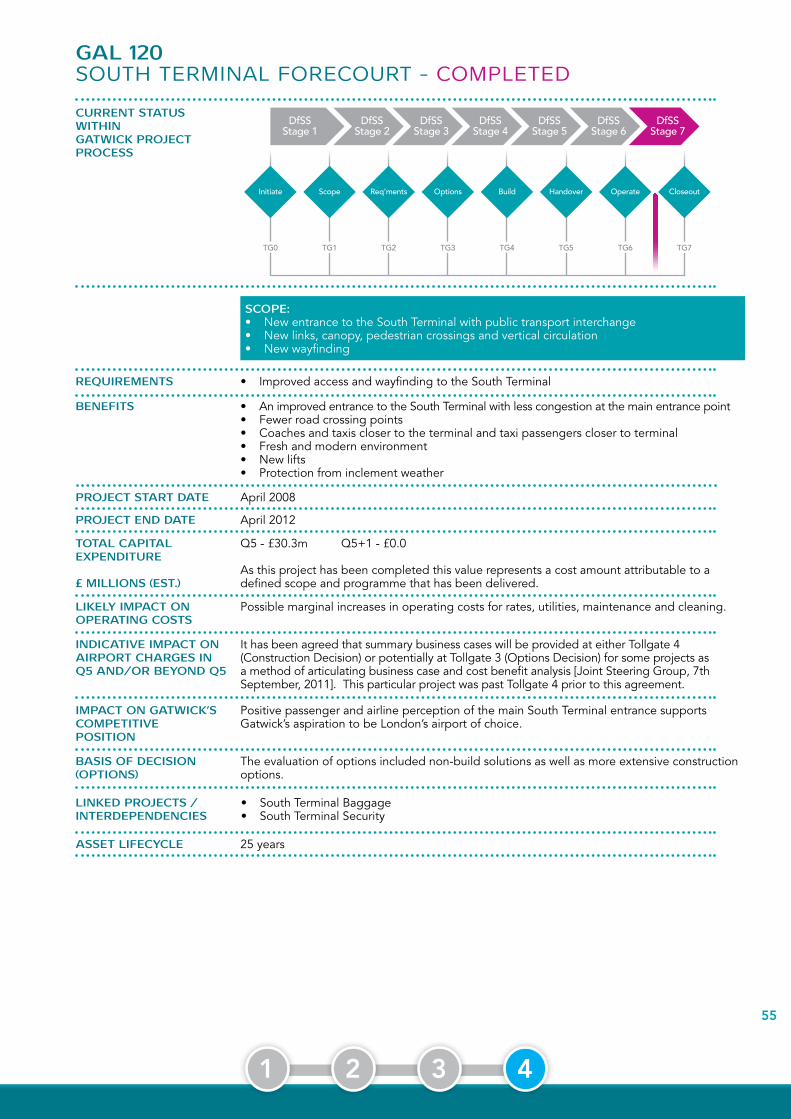
55
GAL 120SOUTH TERMINAl FORECOURT - COMplETED
DfSSStage 2
DfSSStage 3
DfSSStage 4
DfSSStage 5
DfSSStage 6
DfSSStage 7
DfSSStage 1
Initiate Scope Req’ments Options Build Handover Operate Closeout
TG0 TG1 TG2 TG3 TG4 TG5 TG6 TG7
CURRENT STATUS WIThINGATWICk PROjECT PROCESS
REQUIREMENTS
bENEFITS
TOTAL CAPITAL ExPENDITURE
£ MILLIONS (EST.)
PROjECT START DATE
PROjECT END DATE
LIkELy IMPACT ON OPERATING COSTS
INDICATIVE IMPACT ON AIRPORT ChARGES IN Q5 AND/OR bEyOND Q5
IMPACT ON GATWICk’SCOMPETITIVE POSITION
bASIS OF DECISION (OPTIONS)
ASSET LIFECyCLE
LINkED PROjECTS /INTERDEPENDENCIES
SCOPE:• New entrance to the South Terminal with public transport interchange• New links, canopy, pedestrian crossings and vertical circulation• New wayfinding
• Improved access and wayfinding to the South Terminal
• An improved entrance to the South Terminal with less congestion at the main entrance point• Fewer road crossing points• Coaches and taxis closer to the terminal and taxi passengers closer to terminal• Fresh and modern environment• New lifts• Protection from inclement weather
Q5 - £30.3m Q5+1 - £0.0
As this project has been completed this value represents a cost amount attributable to a defined scope and programme that has been delivered.
April 2008
April 2012
Possible marginal increases in operating costs for rates, utilities, maintenance and cleaning.
It has been agreed that summary business cases will be provided at either Tollgate 4 (Construction Decision) or potentially at Tollgate 3 (Options Decision) for some projects as a method of articulating business case and cost benefit analysis [Joint Steering Group, 7th September, 2011]. This particular project was past Tollgate 4 prior to this agreement.
Positive passenger and airline perception of the main South Terminal entrance supports Gatwick’s aspiration to be London’s airport of choice.
The evaluation of options included non-build solutions as well as more extensive construction options.
25 years
• South Terminal Baggage• South Terminal Security
1 2 3 4

56
CURRENT STAGE COST bREAkDOWN
bASE CONSTRUCTION / DIRECT COSTS
PROjECT DESIGN / ON-COSTS
RISkS: PROjECT RISk (R1)OVERALL TOTAL
DRAWING/IMAGE ShOWING LOCATION
Total £ M % of Total Cost
22.8 75
6.6 22
0.9 3
30.3 100
1 2 3 4

57
GAL 137NORTH TERMINAl BAGGAGE (NTB)
DfSSStage 2
DfSSStage 3
DfSSStage 4
DfSSStage 5
DfSSStage 6
DfSSStage 7
DfSSStage 1
Initiate Scope Req’ments Options Build Handover Operate Closeout
TG0 TG1 TG2 TG3 TG4 TG5 TG6 TG7
CURRENT STATUS WIThINGATWICk PROjECT PROCESS
REQUIREMENTS
bENEFITS
TOTAL CAPITAL ExPENDITURE
£ MILLIONS (EST.)
PROjECT START DATE
PROjECT END DATE
LIkELy IMPACT ON OPERATING COSTS
INDICATIVE IMPACT ON AIRPORT ChARGES IN Q5 AND/OR bEyOND Q5
IMPACT ON GATWICk’SCOMPETITIVE POSITION
bASIS OF DECISION (OPTIONS)
LINkED PROjECTS /INTERDEPENDENCIES
SCOPE:The North Terminal Baggage Upgrade specifically supports the North Terminal extension, providing infrastructure in line with future passenger and fleet mix growth forecasts.
• Any input/ output.• Direct bag processing• Integrated transfer operation• Intra-terminal transfer time within 15 minutes• Baggage storage
• Safe traffic segregation in bag halls• Manual Handling - compliance to latest HSE requirement.• Security – compliance to latest DfT requirements for baggage halls• Full bag tracking through the system
Q5 - £50.2m Q5+1 - £0m
As this project has passed through Tollgate 4 this value represents a cost amount attributable to a defined scope and programme that will, or has been delivered.
April 2008
September 2012
Increases to utilities, operating costs and rates.
It has been agreed that summary business cases will be provided at either Tollgate 4 (Construction Decision) or potentially at Tollgate 3 (Options Decision) for some projects as a method of articulating business case and cost benefit analysis [Joint Steering Group, 7th September, 2011]. This particular project was past Tollgate 4 prior to this agreement.
To support the capacity increases in the North Terminal, in line with future growth forecasts, and providing a flexible efficient baggage system to support out airlines and passengers.
Option evaluation focused on the location and size of the development as part of the master plan and Constructive Engagement work and the delivery of associated benefits to all airport users. The image shown is for illustrative purposes only. Option evaluation reviewed all potential build and non-build options.
• North Terminal Extension
ASSET LIFECyCLE 20 years
DRAWING/IMAGE ShOWING LOCATION
1 2 3 4

58
GAL 149SOUTH TERMINAl IMMIGRATION - COMplETED
DfSSStage 2
DfSSStage 3
DfSSStage 4
DfSSStage 5
DfSSStage 6
DfSSStage 7
DfSSStage 1
Initiate Scope Req’ments Options Build Handover Operate Closeout
TG0 TG1 TG2 TG3 TG4 TG5 TG6 TG7
CURRENT STATUS WIThINGATWICk PROjECT PROCESS
REQUIREMENTS
bENEFITS
TOTAL CAPITAL ExPENDITURE
£ MILLIONS (EST.)
PROjECT START DATE
PROjECT END DATE
LIkELy IMPACT ON OPERATING COSTS
INDICATIVE IMPACT ON AIRPORT ChARGES IN Q5 AND/OR bEyOND Q5
IMPACT ON GATWICk’SCOMPETITIVE POSITION
bASIS OF DECISION (OPTIONS)
LINkED PROjECTS /INTERDEPENDENCIES
SCOPE:• Removal of asbestos from Immigration area• Upgrade of mechanical and electrical services• Installation of new ceiling and lighting
• Upgrade of immigration hall infrastructure
• Removal of risk associated with the presence of asbestos• Enabling of installation of new fire system• Enabling of effective maintenance protocols• Enhanced perception of immigration area
Q5 - £6.4m Q5+1 - £0.0m
As this project has passed through Tollgate 4 this value represents a cost amount attributable to a defined scope and programme that will, or has been delivered.
April 2008
March 2012
None anticipated
It has been agreed that summary business cases will be provided at either Tollgate 4 (Construction Decision) or potentially at Tollgate 3 (Options Decision) for some projects as a method of articulating business case and cost benefit analysis [Joint Steering Group, 7th September, 2011]. This particular project was past Tollgate 4 prior to this agreement.
Supports positive passenger perception and prevents negative impacts on reputation due to maintenance issues associated with the presence of asbestos.
Options considered included non-invasive upgrades of infrastructure in the area.
Asset replacements, including South Terminal Arrivals Reconfiguration
ASSET LIFECyCLE 25 years
DRAWING/IMAGE ShOWING LOCATION
1 2 3 4

59
GAL 096AIRFIElD pROGRAMME INClUDING RUNWAY RESURFACING
DfSSStage 2
DfSSStage 3
DfSSStage 4
DfSSStage 5
DfSSStage 6
DfSSStage 7
DfSSStage 1
Initiate Scope Req’ments Options Build Handover Operate Closeout
TG0 TG1 TG2 TG3 TG4 TG5 TG6 TG7
CURRENT STATUS WIThINGATWICk PROjECT PROCESS
REQUIREMENTS
bENEFITS
TOTAL CAPITAL ExPENDITURE
£ MILLIONS (EST.)
PROjECT START DATE
PROjECT END DATE
LIkELy IMPACT ON OPERATING COSTS
INDICATIVE IMPACT ON AIRPORT ChARGES IN Q5 AND/OR bEyOND Q5
IMPACT ON GATWICk’SCOMPETITIVE POSITION
bASIS OF DECISION (OPTIONS)
LINkED PROjECTS /INTERDEPENDENCIES
SCOPE:Programme of airfield works incorporating a project to resurface the northern andmain runways as well as other airfield works.
Requirements of the main runway rehabilitation are as follows:The rehabilitation of block pavements and replacement of airfield ground lighting toassure compliance with CAP 683 and CAP 168• Potential provision of additional Rapid Exit Taxiways• Targeted operational cost reductions• Targeted reduction in CO² emissions
Protecting and enhancing Gatwick’s reputation and helping our airlines grow through rehabilitation of the airport’s primary asset, meeting the requirements of the forecast fleet mix with potential opportunity to enhance value and efficiency.
Q5 - £61.5m Q5+1 - £0.0m
As this project has passed through Tollgate 4 this value represents a cost amount attributable to a defined scope and programme that will, or has been delivered.
November 2011
March 2013
The main runway rehabilitation business case summary, as submitted to the JSG, includes additional information and highlights the likely impact on operating costs
Additional airport charges per total Gatwick passenger in Beyond Q5 £0.18
Rehabilitation of the main runway assures ongoing delivery of service for the airport’s primary asset, thereby enabling airlines to operate and provide consistent levels of service for passengers.
Required to maintain Gatwick’s aerodrome license with options to improve performance and optimise capacity. Option evaluation has thus far focused on the location and size of the future developments as part of the master plan and Constructive Engagement work.
• Taxiways Papa & November• A380 on Pier• Airfield Peak Capacity Expansion• Airfield Asset Stewardship
ASSET LIFECyCLE 11 years
DRAWING/IMAGE ShOWING LOCATION
1 2 3 4

60
VARIOUS PROjECTS AT VARIOUS STAGES
GAL 128OpERATIONAl EFFICIENCY pROGRAMME - COMplETED
DfSSStage 2
DfSSStage 3
DfSSStage 4
DfSSStage 5
DfSSStage 6
DfSSStage 7
DfSSStage 1
Initiate Scope Req’ments Options Build Handover Operate Closeout
TG0 TG1 TG2 TG3 TG4 TG5 TG6 TG7
CURRENT STATUS WIThINGATWICk PROjECT PROCESS
REQUIREMENTS
bENEFITS
TOTAL CAPITAL ExPENDITURE
£ MILLIONS (EST.)
PROjECT START DATE
PROjECT END DATE
LIkELy IMPACT ON OPERATING COSTS
INDICATIVE IMPACT ON AIRPORT ChARGES IN Q5 AND/OR bEyOND Q5
IMPACT ON GATWICk’SCOMPETITIVE POSITION
bASIS OF DECISION (OPTIONS)
LINkED PROjECTS /INTERDEPENDENCIES
SCOPE:A range of initiatives maximising airport efficiencies undertaken in priority order.
A range of initiatives that aim to:• Reduce cost• Utilise resources• Increase efficiency• Increase productivity
The Operational Efficiency Programme is designed to maximise efficiency minimising costs and maximising service quality through the use of technological and service innovation.
Q5 - £12.1m Q5+1 - £0.0m
April 2008
March 2013
We expect each project to support our focus on operational excellence and therefore make a contribution to reducing our total cost to operate or our airline partners total cost to operate.
Not provided as this is a programme of works with various individual elements that attract different opex, revenue and asset life assumptions
Gatwick needs to be able to compete with other airports and local market offers, by reducing our total cost to operate or our airline partners’ total cost to operate.
Portfolio of projects at various stages of development supporting our focus on operational excellence through investment in process and technology across the end-to-end passenger journey, which in turn should support a reduction in our total cost to operate.
Portfolio of projects that are linked with many other projects in the CIP by the location within which they are executed
ASSET LIFECyCLE Various projects with varying asset lifecycles
1 2 3 4
61
GAL 063SECURITY DEVElOpMENT pROGRAMME
DfSSStage 2
DfSSStage 3
DfSSStage 4
DfSSStage 5
DfSSStage 6
DfSSStage 7
DfSSStage 1
Initiate Scope Req’ments Options Build Handover Operate Closeout
TG0 TG1 TG2 TG3 TG4 TG5 TG6 TG7
CURRENT STATUS WIThINGATWICk PROjECT PROCESS
REQUIREMENTS
bENEFITS
TOTAL CAPITAL ExPENDITURE
£ MILLIONS (EST.)
PROjECT START DATE
PROjECT END DATE
LIkELy IMPACT ON OPERATING COSTS
INDICATIVE IMPACT ON AIRPORT ChARGES IN Q5 AND/OR bEyOND Q5
IMPACT ON GATWICk’SCOMPETITIVE POSITION
bASIS OF DECISION (OPTIONS)
LINkED PROjECTS /INTERDEPENDENCIES
SCOPE:Portfolio of projects designed to broaden the airport security footprint to constantly reduce vulnerability at our airport campus.
Provision of a safe environment for travellers and other stakeholders by mitigating security risks. The types of protection provided by this programme provides and enhances can be physical, technological and process improvements.
Security Development Programme ensuring the provision of a safe environment for travellers and other stakeholders by mitigating security risks.
Q5 - £6.5m Q5+1 - £0.0m
April 2008
March 2013
It is unlikely there will be an impact on handling agent and airline costs. Airport impacts are expected to be minimal.
Not provided as this is a programme of works with various individual elements that attract different opex, revenue and asset life assumptions
This programme will ensure that Gatwick can ‘Protect and enhance our reputation’ through ensuring operational availability of its assets, and no H&S risk to our passengers.
Portfolio of projects at various development stages.
Portfolio of projects that are linked with many other projects in the CIP by the location within which they are executed
VARIOUS PROjECTS AT VARIOUS STAGES
ASSET LIFECyCLE Various projects with varying asset lifecycles
1 2 3 4

62
GAL 159 & GAL 135IT TRANSFORMATION & IT pROGRAMME
DfSSStage 2
DfSSStage 3
DfSSStage 4
DfSSStage 5
DfSSStage 6
DfSSStage 7
DfSSStage 1
Initiate Scope Req’ments Options Build Handover Operate Closeout
TG0 TG1 TG2 TG3 TG4 TG5 TG6 TG7
CURRENT STATUS WIThINGATWICk PROjECT PROCESS
REQUIREMENTS
bENEFITS
TOTAL CAPITAL ExPENDITURE
£ MILLIONS (EST.)
PROjECT START DATE
PROjECT END DATE
LIkELy IMPACT ON OPERATING COSTS
INDICATIVE IMPACT ON AIRPORT ChARGES IN Q5 AND/OR bEyOND Q5
IMPACT ON GATWICk’SCOMPETITIVE POSITION
bASIS OF DECISION (OPTIONS)
LINkED PROjECTS /INTERDEPENDENCIES
SCOPE:Continued transformation, and replacement of Gatwick’s operational systems, infrastructure and processes
A range of initiatives designed to separate and transform Gatwick’s systems, infrastructure and processes, maximising airport efficiencies, undertaken in priority order.
The primary strategic driver of the IT Programme is to ‘Deliver the best passenger experience “by improving our operational systems and thereby facilitating operational efficiencies.
Q5 - £48.1m Q5+1 - £0.0m
April 2008
March 2013
This programme seeks to facilitate operational efficiencies and thereby improve the passenger journey.
Not provided as this is a programme of works with various individual elements that attract different opex, revenue and asset life assumptions
Gatwick needs to take advantage of technological advances in order to ensure it can provide the best passenger experience and thereby compete with other airports.
Portfolio of projects at various development stages.
Various linked projects with interdependencies across the airport campus
ASSET LIFECyCLE Various minor projects with varying asset lifecycles
VARIOUS PROjECTS AT VARIOUS STAGES
DRAWING/IMAGE ShOWING LOCATION
1 2 3 4

63
GAL 143ClEAN, WORkING AND FRIENDlY pROGRAMME
DfSSStage 2
DfSSStage 3
DfSSStage 4
DfSSStage 5
DfSSStage 6
DfSSStage 7
DfSSStage 1
Initiate Scope Req’ments Options Build Handover Operate Closeout
TG0 TG1 TG2 TG3 TG4 TG5 TG6 TG7
CURRENT STATUS WIThINGATWICk PROjECT PROCESS
REQUIREMENTS
bENEFITS
TOTAL CAPITAL ExPENDITURE
£ MILLIONS (EST.)
PROjECT START DATE
PROjECT END DATE
LIkELy IMPACT ON OPERATING COSTS
INDICATIVE IMPACT ON AIRPORT ChARGES IN Q5 AND/OR bEyOND Q5
IMPACT ON GATWICk’SCOMPETITIVE POSITION
bASIS OF DECISION (OPTIONS)
LINkED PROjECTS /INTERDEPENDENCIES
SCOPE:The Clean, Working and Friendly programme demonstrates Gatwick’s on-going commitment to invest in passenger-facing infrastructure such as flooring and seating, in order to fix the basics
A range of investments in passenger facing and core operational infrastructure in North and South Terminals, undertaken under prioritisation and in conjunction with other developments at Gatwick
The Clean, Working and Friendly programme demonstrates Gatwick’s on-going commitment to invest in passenger-facing infrastructure such as flooring and seating, in order to fix the basics.
Q5 - £15.4m Q5+1 - £0.0m
April 2008
March 2013
Airport impacts are expected to be minimal.
Not provided as this is a programme of works with various individual elements that attract different opex, revenue and asset life assumptions
The Clean, Working and friendly programme ensures that Gatwick can ‘Protect and enhance our reputation’.
Portfolio of projects at various development stages.
Portfolio of projects that are linked with many other projects in the CIP by the location within which they are executed
ASSET LIFECyCLE Various projects with varying asset lifecycles
VARIOUS PROjECTS AT VARIOUS STAGES
1 2 3 4
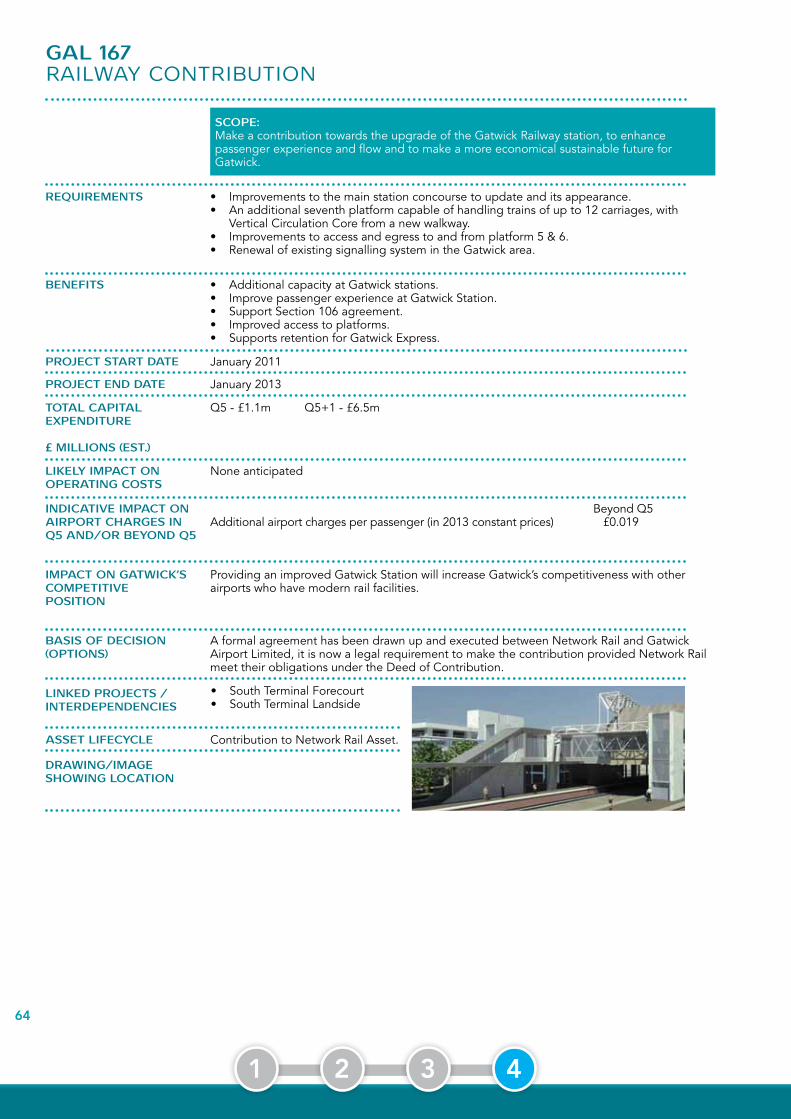
64
GAL 167RAIlWAY CONTRIBUTION
REQUIREMENTS
bENEFITS
TOTAL CAPITAL ExPENDITURE
£ MILLIONS (EST.)
PROjECT START DATE
PROjECT END DATE
LIkELy IMPACT ON OPERATING COSTS
INDICATIVE IMPACT ON AIRPORT ChARGES IN Q5 AND/OR bEyOND Q5
IMPACT ON GATWICk’SCOMPETITIVE POSITION
bASIS OF DECISION (OPTIONS)
LINkED PROjECTS /INTERDEPENDENCIES
SCOPE:Make a contribution towards the upgrade of the Gatwick Railway station, to enhance passenger experience and flow and to make a more economical sustainable future for Gatwick.
• Improvements to the main station concourse to update and its appearance.• An additional seventh platform capable of handling trains of up to 12 carriages, with
Vertical Circulation Core from a new walkway.• Improvements to access and egress to and from platform 5 & 6.• Renewal of existing signalling system in the Gatwick area.
• Additional capacity at Gatwick stations.• Improve passenger experience at Gatwick Station.• Support Section 106 agreement.• Improved access to platforms.• Supports retention for Gatwick Express.
Q5 - £1.1m Q5+1 - £6.5m
January 2011
January 2013
None anticipated
Beyond Q5 Additional airport charges per passenger (in 2013 constant prices) £0.019
Providing an improved Gatwick Station will increase Gatwick’s competitiveness with other airports who have modern rail facilities.
A formal agreement has been drawn up and executed between Network Rail and Gatwick Airport Limited, it is now a legal requirement to make the contribution provided Network Rail meet their obligations under the Deed of Contribution.
• South Terminal Forecourt• South Terminal Landside
ASSET LIFECyCLE Contribution to Network Rail Asset.
DRAWING/IMAGE ShOWING LOCATION
1 2 3 4

65
CURRENT STATUS WIThINGATWICk PROjECT PROCESS
REQUIREMENTS
bENEFITS
TOTAL CAPITAL ExPENDITURE
£ MILLIONS (EST.)
PROjECT START DATE
PROjECT END DATE
LIkELy IMPACT ON OPERATING COSTS
INDICATIVE IMPACT ON AIRPORT ChARGES IN Q5 AND/OR bEyOND Q5
(ASSUMES UNCONSTRAINED TRAFFIC GROWTh)
IMPACT ON GATWICk’SCOMPETITIVE POSITION
bASIS OF DECISION (OPTIONS)
ASSET LIFECyCLE
LINkED PROjECTS /INTERDEPENDENCIES
SCOPE:Deliver a single Code F pier-serviced stand to the west end of Pier 6. In line with Gatwick’s growth aspirations and projected passenger and aircraft fleet mix.
• To accommodate future fleet mix.• It is currently proposed to create a Code F stand and associated facilities on Pier 6, by
converting push and hold stand 125 and stand 110. The node and air-bridge on stand 110 will be demolished and a new node and air-bridge created to service the new stand.
• Earliest possible provision of A380 capable infrastructure• Delivery of infrastructure to support future passenger and fleet mix forecasts• Value solution providing good passenger proposition• No loss of code C stands• Provision of products meeting a wider mix of passenger types• Flexible infrastructure accommodates various aircraft types
Q5 - £0.6m Q5+1 - £5.9m
This is a cost estimate which equates to a rough order of magnitude (ROM) estimate, based on the available scope definition at this preliminary conceptual design phase. As such it is subject to change and refinement aligned with a more detailed definition of the scope as options are clarified and prioritised throughout the development process.
August 2011
March 2013
Minimal impact expected on resourcing for A380 operations.
Beyond Q5 Over Asset Life (6 yrs)Reduction in airport charges per passenger £0.01 £0.01
Tollgate 4 business case submitted to CPB on 23 May, 2012.This project is currently not supported by the airlines (Joint Steering Group, 11th January, 2012)
Gatwick’s growth aspirations, projected passengers and aircraft fleet mix projections together with its ability compete with other airports would be compromised without the delivery of one Code F pier served product facility.
Further investigation into the various options for providing a facility for the A380 is underway to ensure the best value solution is developed.
10 years
• North Terminal Additional Pier Service (option dependant)• Runway & Taxiway projects
GAL 171A380 ON STAND 125 - NOT CURRENTlY SUppORTED BY THE AIRlINES
DfSSStage 2
DfSSStage 3
DfSSStage 4
DfSSStage 5
DfSSStage 6
DfSSStage 7
DfSSStage 1
Initiate Scope Req’ments Options Build Handover Operate Closeout
TG0 TG1 TG2 TG3 TG4 TG5 TG6 TG7
1 2 3 4

66
CURRENT STAGE COST bREAkDOWN
bASE CONSTRUCTION / DIRECT COSTS
PROjECT DESIGN / ON-COSTS
RISkS: PROjECT RISk (R1)OVERALL TOTAL
DRAWING/IMAGE ShOWING LOCATION
Total £ M % of Total Cost
5.3 80
0.6 10
0.6 10
6.5 100
1 2 3 4

67
GAL 172AIRFIElD pEAk CApACITY EXpANSION (ACDM55)
DfSSStage 2
DfSSStage 3
DfSSStage 4
DfSSStage 5
DfSSStage 6
DfSSStage 7
DfSSStage 1
Initiate Scope Req’ments Options Build Handover Operate Closeout
TG0 TG1 TG2 TG3 TG4 TG5 TG6 TG7
CURRENT STATUS WIThINGATWICk PROjECT PROCESS
REQUIREMENTS
bENEFITS
TOTAL CAPITAL ExPENDITURE
£ MILLIONS (EST.)
PROjECT START DATE
PROjECT END DATE
LIkELy IMPACT ON OPERATING COSTS
INDICATIVE IMPACT ON AIRPORT ChARGES IN Q5 AND/OR bEyOND Q5
IMPACT ON GATWICk’SCOMPETITIVE POSITION
bASIS OF DECISION (OPTIONS)
LINkED PROjECTS /INTERDEPENDENCIES
SCOPE:Aircraft movement processes, turn around (Ramp) processes and upgrade/New NATS, Gatwick, Airline, Ground-handlers systems
• Adherence to schedule, optimized aircraft movement and increase punctuality• Stand Designation 2 hours prior to planned departure time• Accurate Estimated In Block Time (EIBT)• Target start up time (TSAT), optimized sequencing to maximize runway throughput• Stand ready / Safedock on arrival and accurate Target Off Block Time (TOBT)• Ready to move at TSAT• Reduced variance to enable reducing mean for ADA and ADDA spacing• Full compliance Eurocontrol CDM requirements and maximize ATM flow rate +55• Airline and Ground handler cost minimize
• Increase peak hours throughput runway capacity to 55 on a consistent basis• Improve on time performance during busy period to maintain greater than 85%• Maintain delays below average 10 minutes on arrivals and departures• Reduced holding at runway departure queue and more efficient taxiing• Reduce ground handler and service providers’ costs• Reduced Turnaround time variance• Ability to prioritize late inbound or outbound flights to help get back on schedule• Increase utilization of constrained assets to create incremental capacity• Improved operational efficiency through improved analysis and reporting tools• Improved analysis to support slot declaration process using more robust models
Q5 - £1.5m Q5+1 - £5.5m
This is a cost estimate which equates to a rough order of magnitude (ROM) estimate, based on the available scope definition at this preliminary conceptual design phase. As such it is subject to change and refinement aligned with a more detailed definition of the scope as options are clarified and prioritised throughout the development process.
February 2012
January 2014
Reduce airline fuel cost and costs associated with delays. Reduce ground handler cost through more predictable planning and minimization of people/asset movement
Not provided as this is a programme of works with various individual elements that attract different opex, revenue and asset life assumptions
Increase in airfield movements at critical peak times, generating further business and improving Gatwick’s capability to cope with projected rises in service levels.
Portfolio of projects at various development stages.
• Alpha Box• Stands Replacement• Taxiway Rehabilitation
ASSET LIFECyCLE 10 years
1 2 3 4

68
GAL 173CREW REpORTING SINCE pUBlICATION FOR AIRlINE CONSUlTATION, THIS pROjECT HAS CHANGED
SCOpE AND COST. FUll UpDATE WIll BE pROVIDED IN NEXT pUBlICATION.
DfSSStage 2
DfSSStage 3
DfSSStage 4
DfSSStage 5
DfSSStage 6
DfSSStage 7
DfSSStage 1
Initiate Scope Req’ments Options Build Handover Operate Closeout
TG0 TG1 TG2 TG3 TG4 TG5 TG6 TG7
CURRENT STATUS WIThINGATWICk PROjECT PROCESS
REQUIREMENTS
bENEFITS
TOTAL CAPITAL ExPENDITURE
£ MILLIONS (EST.)
PROjECT START DATE
PROjECT END DATE
LIkELy IMPACT ON OPERATING COSTS
INDICATIVE IMPACT ON AIRPORT ChARGES IN Q5 AND/OR bEyOND Q5
IMPACT ON GATWICk’SCOMPETITIVE POSITION
bASIS OF DECISION (OPTIONS)
LINkED PROjECTS /INTERDEPENDENCIES
SCOPE:South Terminal and North Terminal crew reporting solution, as well as a UKBA operations solution for the South Terminal.
• South Terminal and North Terminal crew report facilities• Relocation of United Kingdom Border Agency Custody Suite and operations functions
from Concorde House to Ashdown House• Relocation of ST crew reporting from Concorde House to Atlantic House• Optimised layout for Jubilee House requirements
• Enhances crew report processes• Improves on-time departure performance• Enhances security capability and provides compliant and effective UKBA operational facility• Additional ST landside coach drop lane• Elimination of vehicle / pedestrian conflict at airside coach pick up
Q5 - £0.0m Q5+1 - £12.0m (Tollgate 3 Budget)
This is a cost estimate which equates to a rough order of magnitude (ROM) estimate, based on the available scope definition at the conceptual design phase. As such it is subject to change and refinement aligned with a more detailed definition of the scope as options are clarified and prioritised throughout the development process.
April 2011
March 2015
Potential increase in operating costs for airport and airlines due to provision of compliant hold baggage screening for crew baggage and additional security screening facility.
Beyond Q5 Over Crew Reporting Life (15 yrs)Additional airport charges per passenger £0.041 £0.029
Efficient and effective crew reporting supports on time performance for airlines and enhances Gatwick’s reputation. Provision of safe and secure detention facilities for UKBA protects Gatwick’s reputation.
Provision of a crew reporting, hold baggage, coach and vehicle solution in an alternative location
• South Terminal Baggage and Pier 1
ASSET LIFECyCLE Dependent upon final solution
1 2 3 4
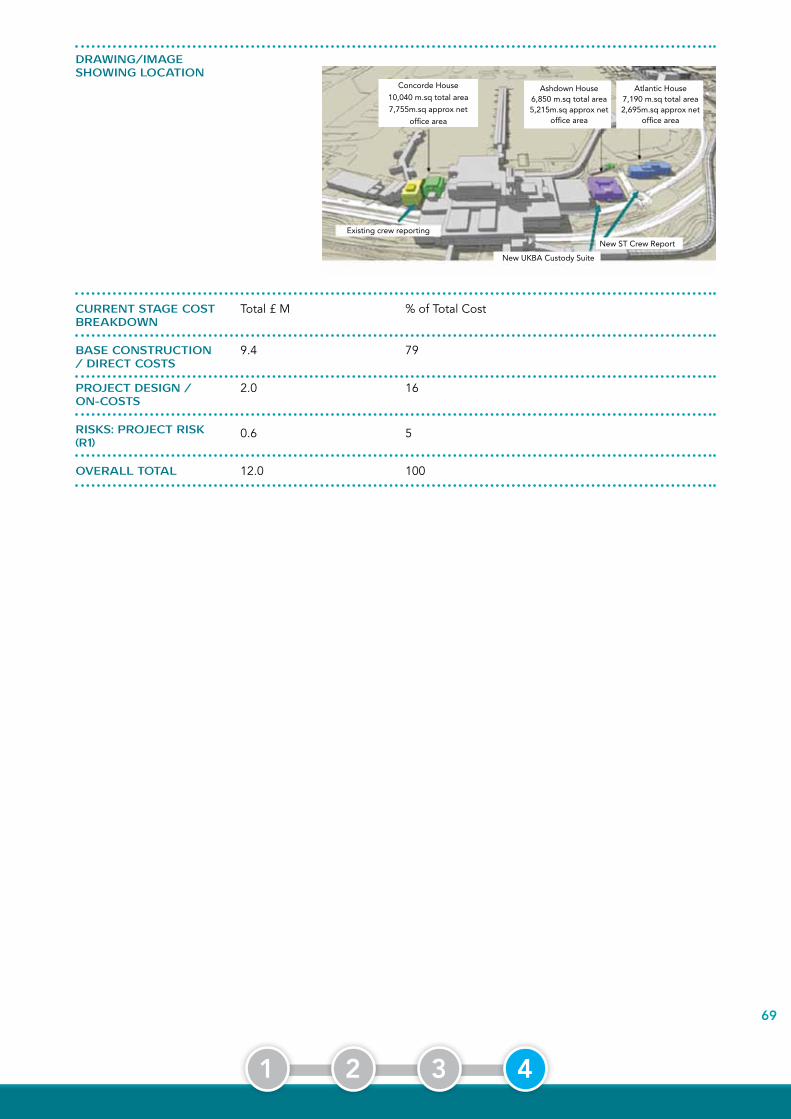
69
CURRENT STAGE COST bREAkDOWN
bASE CONSTRUCTION / DIRECT COSTS
PROjECT DESIGN / ON-COSTS
RISkS: PROjECT RISk (R1)
OVERALL TOTAL
Total £ M % of Total Cost
9.4 79
2.0 16
0.6 5
12.0 100
DRAWING/IMAGE ShOWING LOCATION
1 2 3 4
Ashdown House6,850 m.sq total area5,215m.sq approx net
office area
Atlantic House7,190 m.sq total area2,695m.sq approx net
office area
Concorde House
10,040 m.sq total area
7,755m.sq approx net
office area
Existing crew reporting
New ST Crew Report
New UKBA Custody Suite

70
GAL 174SOUTH TERMINAl DOMESTIC ARRIVAlS
CURRENT STATUS WIThINGATWICk PROjECT PROCESS
REQUIREMENTS
bENEFITS
TOTAL CAPITAL ExPENDITURE
£ MILLIONS (EST.)
PROjECT START DATE
PROjECT END DATE
LIkELy IMPACT ON OPERATING COSTS
INDICATIVE IMPACT ON AIRPORT ChARGES IN Q5 AND/OR bEyOND Q5(ASSUMES UNCONSTRAINED TRAFFIC GROWTh)
IMPACT ON GATWICk’SCOMPETITIVE POSITION
bASIS OF DECISION (OPTIONS)
ASSET LIFECyCLE
LINkED PROjECTS /INTERDEPENDENCIES
SCOPE:Reconfiguration of the South Terminal Arrivals area to enhance the Arrivals experience, facilitating seamless process whilst maximising commercial revenues.
• Relocate selected retail outlets• Reconfigure onward travel
• Reconfiguration of the South Terminal Arrivals area to create an enhanced passenger experience.
• Improved ground transportation, hotel, and baggage services.• Reduced coaching costs.• Improved stand operations.• Consolidate arrivals
Q5 - £0.0m Q5+1 - £9.5m
April 2011
Phase 1 - December 2012Phase 2 - November 2013Phase 3 - March 2015
Operating costs will increase marginally whilst income will be increased.
Beyond Q5 Over Asset Life (25 yrs)Increase in airport charges per passenger £0.0 £0.014
Reconfiguration required to ensure no degradation to passenger service levels, which could mean that passengers would choose to fly from other airports.
• Option evaluation: • Do nothing – implications of the do-nothing scenario include: • No improvement in passenger experience – remain at status quo. • Limited retail income opportunities • Limited improvement in participation of onward travel • Reconfigure existing • Reconfigure existing and install new retail units.
25 years
• South Terminal Baggage and Pier 1• South Terminal Landside Arrivals/Onward Travel• Check in hall reconfigurations• PRM & DDA Infrastructure• South Terminal IDL Reconfiguration• Railway Station• Crew Reporting
DfSSStage 2
DfSSStage 3
DfSSStage 4
DfSSStage 5
DfSSStage 6
DfSSStage 7
DfSSStage 1
Initiate Scope Req’ments Options Build Handover Operate Closeout
TG0 TG1 TG2 TG3 TG4 TG5 TG6 TG7
1 2 3 4

71
DfSSStage 2
DfSSStage 3
DfSSStage 4
DfSSStage 5
DfSSStage 6
DfSSStage 7
DfSSStage 1
Initiate Scope Req’ments Options Build Handover Operate Closeout
TG0 TG1 TG2 TG3 TG4 TG5 TG6 TG7
CURRENT STATUS WIThINGATWICk PROjECT PROCESS
REQUIREMENTS
bENEFITS
TOTAL CAPITAL ExPENDITURE
£ MILLIONS (EST.)
PROjECT START DATE
PROjECT END DATE
LIkELy IMPACT ON OPERATING COSTS
INDICATIVE IMPACT ON AIRPORT ChARGES IN Q5 AND/OR bEyOND Q5
(ASSUMES UNCONSTRAINED TRAFFIC GROWTh)
IMPACT ON GATWICk’SCOMPETITIVE POSITION
bASIS OF DECISION (OPTIONS)
ASSET LIFECyCLE
LINkED PROjECTS /INTERDEPENDENCIES
SCOPE:To reconfigure the North Terminal departures lounge in order to enhance the passenger experience and support commercial returns.
• The enhancement of the passenger experience through the reconfiguration of the existing lounge.
• Provision of additional Food and Beverage• Provision of additional department store by re-use of underutilised space.• This project will provide resilience to GAL’s Business As Usual.• To remedy the impact of prioritisation of security development on NT retail income.
• Improved passenger experience• Retention of existing retail revenue, and expansion through new brands.• Smoking area.• Increased catering on offer (4,000 square feet).
Q5 - £9.5m Q5+1 - £0.7m
This is a cost estimate which equates to a rough order of magnitude, based on the available scope definition at This is a cost estimate which equates to a rough order of magnitude (ROM) estimate, based on the available scope definition at this preliminary conceptual design phase. As such it subject to change and refinement aligned with a more detailed definition of the scope as options are clarified and prioritised throughout the development process.
October 2011
Project 2 Project 1
November 2012
There is no anticipated increase in operating costs associated with this reconfiguration as no new terminal gross floor area is added by way of this expenditure. It is anticipated that there will be an uplift in retail income.
Beyond Q5 Over Asset Life (15 yrs)Reduction in airport chargesper passenger – Project 1 £0.010 £0.010
Reduction in airport chargesper passenger – Project 2 £0.019 £0.020
Enhances Gatwick’s reputation for Departures Lounge product.
Options: 1) Do all 2) Partial / Phased implementation3) Do nothing.
20 years
• North Terminal Security
GAL 175ANORTH TERMINAl IDl RECONFIGURATION
1 2 3 4

72
CURRENT STAGE COST bREAkDOWN
bASE CONSTRUCTION / DIRECT COSTS
PROjECT DESIGN / ON-COSTS
RISkS: PROjECT RISk (R1)OVERALL TOTAL
Total £ M % of Total Cost
8.2 80
1.2 12
0.8 8
10.2 100
1 2 3 4

73
DfSSStage 2
DfSSStage 3
DfSSStage 4
DfSSStage 5
DfSSStage 6
DfSSStage 7
DfSSStage 1
Initiate Scope Req’ments Options Build Handover Operate Closeout
TG0 TG1 TG2 TG3 TG4 TG5 TG6 TG7
CURRENT STATUS WIThINGATWICk PROjECT PROCESS
REQUIREMENTS
bENEFITS
TOTAL CAPITAL ExPENDITURE
£ MILLIONS (EST.)
PROjECT START DATE
PROjECT END DATE
LIkELy IMPACT ON OPERATING COSTS
INDICATIVE IMPACT ON AIRPORT ChARGES IN Q5 AND/OR bEyOND Q5
IMPACT ON GATWICk’SCOMPETITIVE POSITION
bASIS OF DECISION (OPTIONS)
ASSET LIFECyCLE
LINkED PROjECTS /INTERDEPENDENCIES
SCOPE:To maximise the retail space available and to provide appropriate facilities to improve passenger experience and maximise revenue. New retail space in previous World Duty Free (WDF) space.
• Current retail space in South is 1/3 less per passenger than North.• Prioritisation of security development impacts South Terminal IDL retail income.• Offers and adjacencies in South inconsistent with segmentation.• Re-configuration of lower level WDF to accommodate additional retail facilities.• Remedy ‘dated’ look and feel of IDL.
• Improved passenger experience• Increased income driven by a reconfigured layout.• Maximises passenger exposure to offers that are designed with Gatwick passengers in
mind.• Increased Retail footprint without compromise to passenger service (i.e. seating)• Improve circulation space
Q5 - £8.3m Q5+1 - £16.1m
This is a cost estimate which equates to a rough order of magnitude (ROM) estimate, based on the available scope definition at the conceptual design phase. As such it is subject to change and refinement aligned with a more detailed definition of the scope as options are clarified and prioritised throughout the development process.
March 2012
October 2013
Potential slight increase in operating costs.
It has been agreed that summary business cases will be provided at either Tollgate 4 (Construction Decision) or potentially at Tollgate 3 (Options Decision) for some projects as a method of articulating business case and cost benefit analysis [Joint Steering Group, 7th September, 2011]. At time of going to print this project was not at that stage.
Enhances Gatwick’s reputation for Departures Lounge product and thus enables the differentiation with other South East and other European airports
Option evaluation will focus on the location and size of the development as part of the master plan and Constructive Engagement work and the delivery of associated benefits to all airport users. Option evaluation will review all potential build and non-build options.
20 years
• South Terminal Security• South Terminal Baggage & Pier 1
GAL 175bSOUTH TERMINAl IDl RECONFIGURATION
1 2 3 4

74
CURRENT STAGE COST bREAkDOWN
bASE CONSTRUCTION / DIRECT COSTS
PROjECT DESIGN / ON-COSTS
RISkS: PROjECT RISk (R1)OVERALL TOTAL
DRAWING/IMAGE ShOWING LOCATION
Total £ M % of Total Cost
18.00 74
3.15 13
3.15 13
24.3 100
1 2 3 4

75
GAL 176FACIlITIES ASSET STEWARDSHIp pROGRAMME
DfSSStage 2
DfSSStage 3
DfSSStage 4
DfSSStage 5
DfSSStage 6
DfSSStage 7
DfSSStage 1
Initiate Scope Req’ments Options Build Handover Operate Closeout
TG0 TG1 TG2 TG3 TG4 TG5 TG6 TG7
CURRENT STATUS WIThINGATWICk PROjECT PROCESS
REQUIREMENTS
bENEFITS
TOTAL CAPITAL ExPENDITURE
£ MILLIONS (EST.)
PROjECT START DATE
PROjECT END DATE
LIkELy IMPACT ON OPERATING COSTS
INDICATIVE IMPACT ON AIRPORT ChARGES IN Q5 AND/OR bEyOND Q5
IMPACT ON GATWICk’SCOMPETITIVE POSITION
bASIS OF DECISION (OPTIONS)
LINkED PROjECTS /INTERDEPENDENCIES
SCOPE:A continuing programme of asset replacements / refurbishments across the whole asset base to support Gatwick’s service levels.
• A range of investment in passenger facing and core operational infrastructure undertaken in priority order and in conjunction with other developments at Gatwick to ensure that maximum benefit is gained without duplication of efforts.
• Passenger service assets must be maintained to meet regulatory and service standards.• Identified safety and environment risks must be mitigated.
• Provide fit for purpose facilities which enable consistent delivery of core services, such as the functionality of passenger facing equipment and infrastructure. This will enable Gatwick to meet service expectations, maintain a safe and reliable operation while improving business resilience.
• Less frequent disruptions• Maintain ability of equipment performance• Compliance with Publicly Available Specification (PAS) 55.• Protect & maintain Service Quality Rebate measures across the airport estate.
Q5 - £9.1m Q5+1 - £9.8m
April 2013
March 2015
It is unlikely that there will be a significant impact on handling agent and airline costs.Airport impacts are expected to be minimal. Where CAPEX is spent in upgrading, improving or replacing existing infrastructure Gatwick may realise OPEX savings.
Not provided as this is a programme of works with various individual elements that attract different opex, revenue and asset life assumptions
Gatwick’s ability to compete would be compromised without the delivery of a comprehensive Facility Asset Stewardship Programme. The Facility Asset Stewardship Programme will ensure that Gatwick can ‘Protect and enhance our reputation’ through ensuring availability of critical assets.
Portfolio of projects at various development stages. Option evaluation has thus far focused on the location and size of the future developments as part of the master plan and Constructive Engagement work.
Various
ASSET LIFECyCLE Various
DRAWING/IMAGE ShOWING LOCATION
VARIOUS PROjECTS AT VARIOUS STAGES
1 2 3 4

76
GAL 177COMMERCIAl ASSET STEWARDSHIp pROGRAMME
DfSSStage 2
DfSSStage 3
DfSSStage 4
DfSSStage 5
DfSSStage 6
DfSSStage 7
DfSSStage 1
Initiate Scope Req’ments Options Build Handover Operate Closeout
TG0 TG1 TG2 TG3 TG4 TG5 TG6 TG7
CURRENT STATUS WIThINGATWICk PROjECT PROCESS
REQUIREMENTS
bENEFITS
TOTAL CAPITAL ExPENDITURE
£ MILLIONS (EST.)
PROjECT START DATE
PROjECT END DATE
LIkELy IMPACT ON OPERATING COSTS
INDICATIVE IMPACT ON AIRPORT ChARGES IN Q5 AND/OR bEyOND Q5
IMPACT ON GATWICk’SCOMPETITIVE POSITION
bASIS OF DECISION (OPTIONS)
LINkED PROjECTS /INTERDEPENDENCIES
SCOPE:A continuing programme to sustain airport facilities core to Gatwick’scommercial operation.
• A range of investments to enable the continuing provision of commercial space within the airport campus.
• The product areas that benefit from the Commercial Asset Stewardship Programme are retail space, CIP space, office space and industrial space.
• Replacement of Commercial, Property, and Staff Assets as prioritised by condition surveys and compliance requirements.
• Protect the current and future commercial income from revenue generating assets across the estate.
• Maintain commercially acceptable building standards across GAL’s portfolio, thus protecting commercial propositions to the airlines, passengers and GAL customers including staff and statutory bodies.
• Environment, Health and Safety compliance• Operational reliability.• Avoidance of excessive maintenance costs.• Provide fit for purpose facilities that provide high quality commercial and property
products in order to attract future Airline growth at Gatwick
Q5+1 - £4.7m
April 2013
March 2015
Indicative reduced OPEX costs of £0.2m per annum (indicative).
Not provided as this is a programme of works with various individual elements that attract different opex, revenue and asset life assumptions
Gatwick needs to be able to compete with other airports and local market offers, by ensuring the provision of high quality commercial and property products in order to maintain airline operations, and to give passengers more choice.
Portfolio of projects at pre-tollgate zero stage. Option evaluation has thus far focused on the location and size of the future developments as part of the master plan and Constructive Engagement work.
Various
ASSET LIFECyCLE Various
DRAWING/IMAGE ShOWING LOCATION
VARIOUS PROjECTS AT VARIOUS STAGES
1 2 3 4
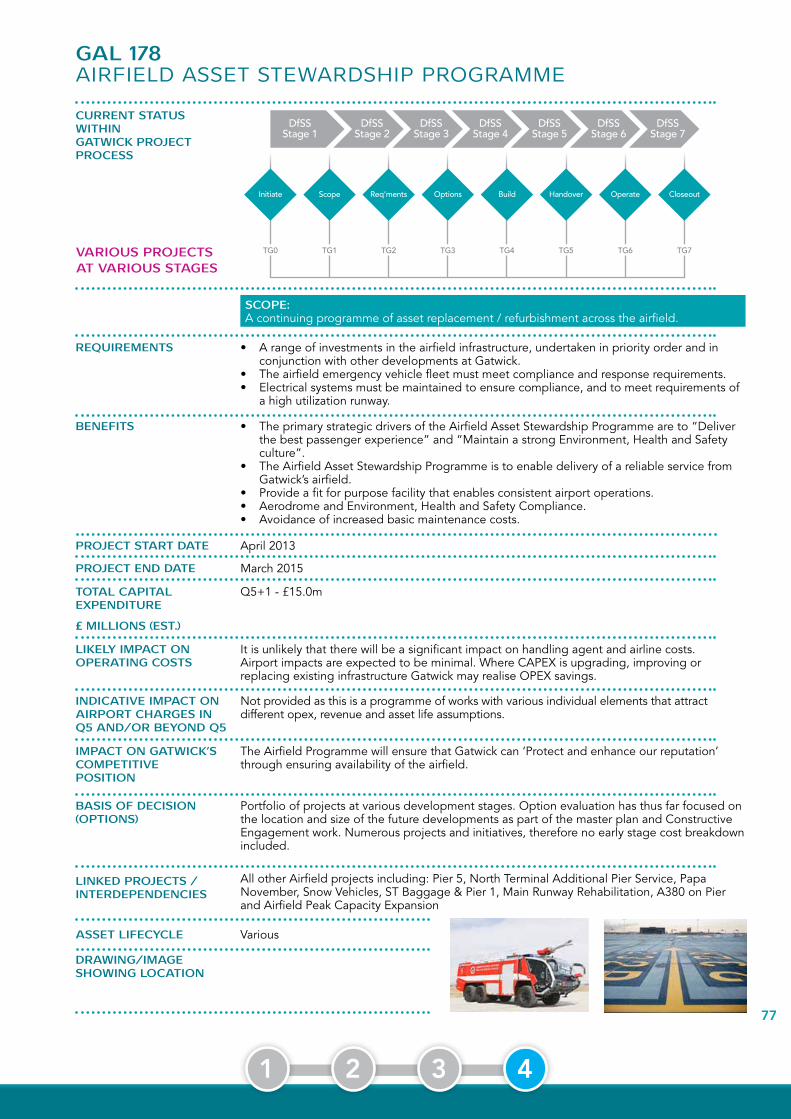
77
GAL 178AIRFIElD ASSET STEWARDSHIp pROGRAMME
DfSSStage 2
DfSSStage 3
DfSSStage 4
DfSSStage 5
DfSSStage 6
DfSSStage 7
DfSSStage 1
Initiate Scope Req’ments Options Build Handover Operate Closeout
TG0 TG1 TG2 TG3 TG4 TG5 TG6 TG7
CURRENT STATUS WIThINGATWICk PROjECT PROCESS
REQUIREMENTS
bENEFITS
TOTAL CAPITAL ExPENDITURE
£ MILLIONS (EST.)
PROjECT START DATE
PROjECT END DATE
LIkELy IMPACT ON OPERATING COSTS
INDICATIVE IMPACT ON AIRPORT ChARGES IN Q5 AND/OR bEyOND Q5
IMPACT ON GATWICk’SCOMPETITIVE POSITION
bASIS OF DECISION (OPTIONS)
LINkED PROjECTS /INTERDEPENDENCIES
SCOPE: A continuing programme of asset replacement / refurbishment across the airfield.
• A range of investments in the airfield infrastructure, undertaken in priority order and in conjunction with other developments at Gatwick.
• The airfield emergency vehicle fleet must meet compliance and response requirements.• Electrical systems must be maintained to ensure compliance, and to meet requirements of
a high utilization runway.
• The primary strategic drivers of the Airfield Asset Stewardship Programme are to “Deliver the best passenger experience” and “Maintain a strong Environment, Health and Safety culture”.
• The Airfield Asset Stewardship Programme is to enable delivery of a reliable service from Gatwick’s airfield.
• Provide a fit for purpose facility that enables consistent airport operations.• Aerodrome and Environment, Health and Safety Compliance.• Avoidance of increased basic maintenance costs.
Q5+1 - £15.0m
April 2013
March 2015
It is unlikely that there will be a significant impact on handling agent and airline costs.Airport impacts are expected to be minimal. Where CAPEX is upgrading, improving or replacing existing infrastructure Gatwick may realise OPEX savings.
Not provided as this is a programme of works with various individual elements that attract different opex, revenue and asset life assumptions.
The Airfield Programme will ensure that Gatwick can ‘Protect and enhance our reputation’ through ensuring availability of the airfield.
Portfolio of projects at various development stages. Option evaluation has thus far focused on the location and size of the future developments as part of the master plan and Constructive Engagement work. Numerous projects and initiatives, therefore no early stage cost breakdown included.
VariousASSET LIFECyCLE
All other Airfield projects including: Pier 5, North Terminal Additional Pier Service, Papa November, Snow Vehicles, ST Baggage & Pier 1, Main Runway Rehabilitation, A380 on Pier and Airfield Peak Capacity Expansion
DRAWING/IMAGE ShOWING LOCATION
VARIOUS PROjECTS AT VARIOUS STAGES
1 2 3 4

78
GAL 179AIRFIElD OpERATIONS BUIlDING
DfSSStage 2
DfSSStage 3
DfSSStage 4
DfSSStage 5
DfSSStage 6
DfSSStage 7
DfSSStage 1
Initiate Scope Req’ments Options Build Handover Operate Closeout
TG0 TG1 TG2 TG3 TG4 TG5 TG6 TG7
CURRENT STATUS WIThINGATWICk PROjECT PROCESS
REQUIREMENTS
bENEFITS
TOTAL CAPITAL ExPENDITURE
£ MILLIONS (EST.)
PROjECT START DATE
PROjECT END DATE
LIkELy IMPACT ON OPERATING COSTS
INDICATIVE IMPACT ON AIRPORT ChARGES IN Q5 AND/OR bEyOND Q5
IMPACT ON GATWICk’SCOMPETITIVE POSITION
bASIS OF DECISION (OPTIONS)
SCOPE:Create a new Airfield Operations building for Gatwick to facilitate any future development of the area south of Pier 6.
The current ‘base’ facility housing the Airfield Operations team (located between the 130s and 140s stands) has been identified as the location for the provision of future pier served stands. The project presents the opportunity to improve the airfield operations facilities and resolve the issues which exist with the current building which is now 25 years old and no longer fit for purpose.
• Help our airlines grow by providing the flexibility required to change key stands to meet future needs in terms of fleet mix and aircraft type. Vacates the only feasible area left to grow pier served stand capability
• Upgrades all critical operational facilities (built in the 1980s) including telecoms and welfare.
• Increase value and efficiency by improving the efficiency of the airside operations team• Provides a new modern, energy efficient facility which will reduce operational costs and
creates a facility in a central location with better airfield sightlines.• Protect and enhance our reputation by removing the single point of failure which currently
exists for Idaho on airport• Improves coordination between Airfield Operations, AGL and AFS teams and allowing
more efficient processes. Improves response times to critical areas of the runway.
Q5 - £3.8m Q5+1 - £4.1m
June 2012
August 2013
Operating costs are assumed to be neutral: any expected increase in rates to be offset by increased energy efficiencies
£0.02 per passenger increase (in 2013 constant prices)
The project will give Gatwick a fit for purpose facility positioned in a prime airfield position adjacent to the runway.
1. Do nothing – implications of the do-nothing scenario include: • Increased pressure on existing facility and inadequate working conditions for key
operational staff • Impact on programme of future pier works • Requirement to spend circa £4m to refurbish the existing facility
2. The minimal scope is assumed to be the refurbishment of the existing facility which is 25 years old
VARIOUS PROjECTS AT VARIOUS STAGES
1 2 3 4

79
LINkED PROjECTS /INTERDEPENDENCIES
This project is part of the overall programme to increase capacity and flexibility of the airfield and has links to the following projects :
1. Pier 6 southern extension2. Foul main3. Snow base
ASSET LIFECyCLE Assumed at this stage to be 40 years
Location of the Airfield Operations Building on Stand 169 :DRAWING/IMAGE ShOWING LOCATION
CURRENT STAGE COST bREAkDOWN
bASE CONSTRUCTION / DIRECT COSTS
PROjECT DESIGN / ON-COSTS
RISkS: PROjECT RISk (R1)
OVERALL TOTAL
Total £ M % of Total Cost
4.8 62
2.1 26
1.0 12
7.9 100
1 2 3 4

80
GAL 180q5 MINOR pROjECTS pROGRAMME
DfSSStage 2
DfSSStage 3
DfSSStage 4
DfSSStage 5
DfSSStage 6
DfSSStage 7
DfSSStage 1
Initiate Scope Req’ments Options Build Handover Operate Closeout
TG0 TG1 TG2 TG3 TG4 TG5 TG6 TG7
CURRENT STATUS WIThINGATWICk PROjECT PROCESS
REQUIREMENTS
bENEFITS
TOTAL CAPITAL ExPENDITURE
£ MILLIONS (EST.)
PROjECT START DATE
PROjECT END DATE
LIkELy IMPACT ON OPERATING COSTS
INDICATIVE IMPACT ON AIRPORT ChARGES IN Q5 AND/OR bEyOND Q5
IMPACT ON GATWICk’SCOMPETITIVE POSITION
bASIS OF DECISION (OPTIONS)
LINkED PROjECTS /INTERDEPENDENCIES
SCOPE:The Minor Projects programme is a range of investment, typically projects of a value less than £250k and of a tactical nature, undertaken in priority.
The Minor Projects programme is a range of investments which supplements the asset replacement programme, typically projects of a value less than £250k and of a tactical nature, undertaken in priority order. The typical make-up of project is: • 35-40% each year have Environmental Health and Safety, issues as the main driver with
around 10-15% of these are unplanned, arising from recommendations following incidents, risk assessments & audits.
• 35-40% of projects each year have ‘Deliver the best passenger experience’ Infrastructure as main driver.
• 15-20% of projects each year are related to investment in tenanted accommodation to protect existing income
• 5-10% of projects each year are related to investment in retail accommodation to protect existing income.
The primary strategic drivers of the Minor Projects programme are to ‘Deliver the best passenger experience’ and “ Maintain a strong EH&S culture”.
Q5 - £9.3m
April 2008
March 2013
Airport impacts are expected to be minimal.
Not provided as this is a programme of works with various individual elements that attract different opex, revenue and asset life assumptions
The Minor Projects programme will ensure that Gatwick can ‘Protect and enhance our reputation’ through ensuring operational availability of its assets, and no H&S risk to our passengers.
Portfolio of projects at various development stages.
Portfolio of minor projects that are linked with many other projects in the CIP by the location within which they are executed
ASSET LIFECyCLE Various minor projects with varying asset lifecycles
VARIOUS PROjECTS AT VARIOUS STAGES
1 2 3 4

81
GAL 181BEYOND q5 DEVElOpMENT
DfSSStage 2
DfSSStage 3
DfSSStage 4
DfSSStage 5
DfSSStage 6
DfSSStage 7
DfSSStage 1
Initiate Scope Req’ments Options Build Handover Operate Closeout
TG0 TG1 TG2 TG3 TG4 TG5 TG6 TG7
CURRENT STATUS WIThINGATWICk PROjECT PROCESS
REQUIREMENTS
bENEFITS
TOTAL CAPITAL ExPENDITURE
£ MILLIONS (EST.)
PROjECT START DATE
PROjECT END DATE
LIkELy IMPACT ON OPERATING COSTS
INDICATIVE IMPACT ON AIRPORT ChARGES IN Q5 AND/OR bEyOND Q5
IMPACT ON GATWICk’SCOMPETITIVE POSITION
bASIS OF DECISION (OPTIONS)
LINkED PROjECTS /INTERDEPENDENCIES
SCOPE: It is a regulatory requirement that GAL submits a Business Plan by 1st April 2012, necessitating the submission of a set of capital plans with sufficient detail (scope, cost and programme) to facilitate the airline consultation process for the post Q5 period. Programme (CIP) content.
Detail scope and costing on major projects as per the following phases:• Phase 1 up to 01/04/2012 : commence detail scope & costing on major projects prior to
Beyond Q5• Phase 2 up to 01/01/2013: Business Cases submitted as part of the Business Plan to be
further developed with airlines.• Phase 3 up to 31/03/2014: Post Consultation: agree on outcomes. Progress projects up to
Tollgate 4
• To develop a Beyond Q5 CIP submission in the most efficient manner that achieves the maximum benefit for all parties for the Beyond Q5 settlement.
• The development of a robust Beyond Q5 CIP will enable the implementation to be planned and executed in the most efficient manner and will provide maximum benefit for all parties from the Beyond Q5 regulatory settlement
• Learning from the Q5 Constructive Engagement process would support the value of early investment of time and resources to develop a robust plan.
• Identify assets which will be life expired and need replacing or will require capital investment to extend asset life during Beyond Q5.
Q5 - £10m
September 2011
March 2014
On-going operating costs : None assumedOne-off costs: None assumed
Beyond Q5 Over Asset Life (7 yrs)Increase in airport charges per passenger £0.050 £0.046
To continue to deliver passenger improvements in line with our aim of being London’s airport of choice. Whilst Safeguarding and maintaining existing facilities in a timely and efficient fashion is important to maintain Gatwick’s competitive position
Option 1 – Do nothing and we start Airline consultation without a business plan or capital plan.Option 2 – Produce a business plan and a capital plan without any scope, costs, programme or suggested options for consultation process.Option 3 – Progress development of capital plan for the business plan with an understanding what our customers are looking for from airports. Developing our master plan, development strategy leading into our traffic analysis, market research and understanding our gaps. To formulate an emerging capital programme which is focused on delivery of a service proposition, whilst maintaining our current assets in an efficient way.
Linked to the Q5 + Q5+1 programme
ASSET LIFECyCLE 7 years
VARIOUS PROjECTS AT VARIOUS STAGES
1 2 3 4

82
GAL 182q5+1 MINOR pROjECTS pROGRAMME < £5M
DfSSStage 2
DfSSStage 3
DfSSStage 4
DfSSStage 5
DfSSStage 6
DfSSStage 7
DfSSStage 1
Initiate Scope Req’ments Options Build Handover Operate Closeout
TG0 TG1 TG2 TG3 TG4 TG5 TG6 TG7
CURRENT STATUS WIThINGATWICk PROjECT PROCESS
REQUIREMENTS
bENEFITS
TOTAL CAPITAL ExPENDITURE
£ MILLIONS (EST.)
PROjECT START DATE
PROjECT END DATE
LIkELy IMPACT ON OPERATING COSTS
INDICATIVE IMPACT ON AIRPORT ChARGES IN Q5 AND/OR bEyOND Q5
IMPACT ON GATWICk’SCOMPETITIVE POSITION
bASIS OF DECISION (OPTIONS)
LINkED PROjECTS /INTERDEPENDENCIES
SCOPE: The Q5 + 1 Minor Projects programme is a range of investment, typically projects of a value less than £5m and of a tactical nature, that will be undertaken in priority in the extension year, 2013/2014.
The Q5 + 1 Minor Projects programme is a range of investments which supplements the asset replacement programme, typically projects of a value less than £5m and of a tactical nature, undertaken in priority order.
Whilst some of the projects have Environmental Health and Safety issues as the main driver with around 10-15% of these being urgent unplanned, arising from recommendations following incidents, risk assessments & audits, other projects have ‘Deliver the best passenger experience’ Infrastructure as main driver. The remaining projects each year are related to investment in tenanted accommodation to protect existing income.
The primary strategic drivers of the Q5 + 1 Minor Projects programme are to ‘Deliver the best passenger experience’ and “Maintain a strong EH&S culture”.
Q5 - £5.7m Q5+1 - £31.6m
April 2013
March 2014
Airport impacts are expected to be minimal.
Not provided as this is a programme of works with various individual elements that attract different opex, revenue and asset life assumptions
The Minor Projects programme will ensure that Gatwick can ‘Protect and enhance our reputation’ through ensuring operational availability of its assets, and no H&S risk to our passengers.
Portfolio of projects at various development stages.
Portfolio of minor projects that are linked with many other projects in the CIP by the location within which they are executed
ASSET LIFECyCLE Various minor projects with varying asset lifecycles
VARIOUS PROjECTS AT VARIOUS STAGES
1 2 3 4
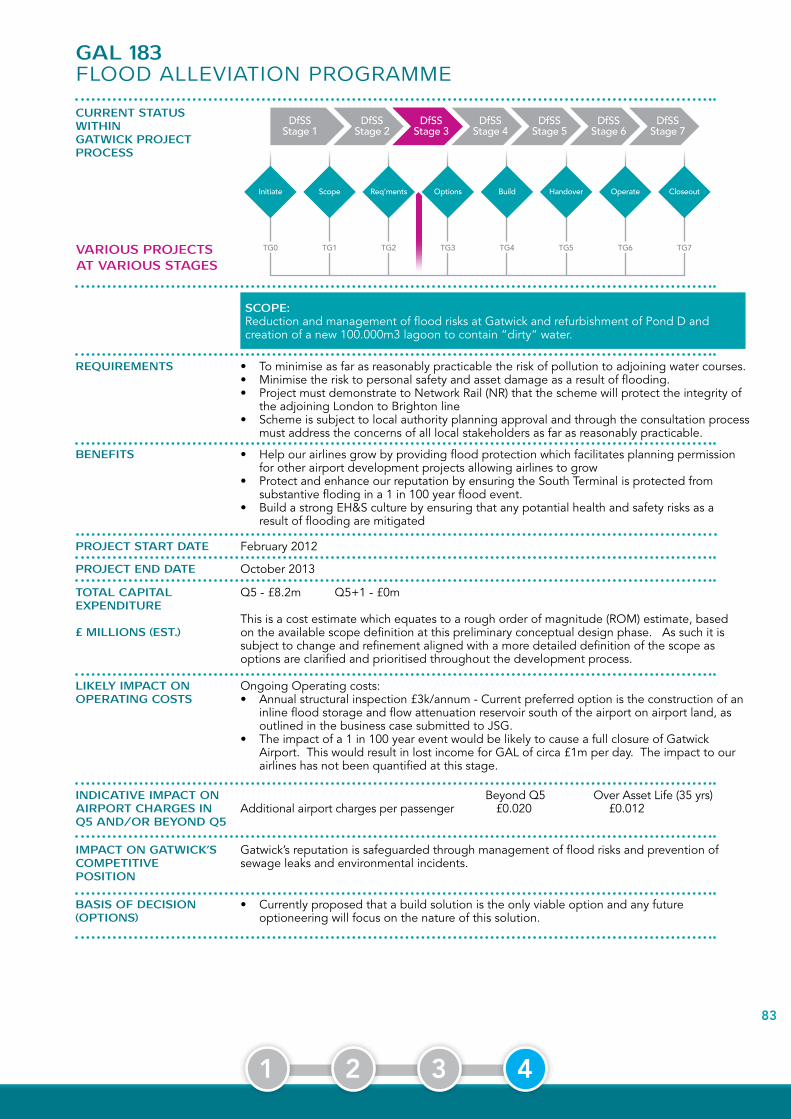
83
GAL 183FlOOD AllEVIATION pROGRAMME
DfSSStage 2
DfSSStage 3
DfSSStage 4
DfSSStage 5
DfSSStage 6
DfSSStage 7
DfSSStage 1
Initiate Scope Req’ments Options Build Handover Operate Closeout
TG0 TG1 TG2 TG3 TG4 TG5 TG6 TG7
CURRENT STATUS WIThINGATWICk PROjECT PROCESS
REQUIREMENTS
bENEFITS
TOTAL CAPITAL ExPENDITURE
£ MILLIONS (EST.)
PROjECT START DATE
PROjECT END DATE
LIkELy IMPACT ON OPERATING COSTS
INDICATIVE IMPACT ON AIRPORT ChARGES IN Q5 AND/OR bEyOND Q5
IMPACT ON GATWICk’SCOMPETITIVE POSITION
bASIS OF DECISION (OPTIONS)
SCOPE:Reduction and management of flood risks at Gatwick and refurbishment of Pond D and creation of a new 100.000m3 lagoon to contain “dirty” water.
• To minimise as far as reasonably practicable the risk of pollution to adjoining water courses.• Minimise the risk to personal safety and asset damage as a result of flooding.• Project must demonstrate to Network Rail (NR) that the scheme will protect the integrity of
the adjoining London to Brighton line• Scheme is subject to local authority planning approval and through the consultation process
must address the concerns of all local stakeholders as far as reasonably practicable.
• Help our airlines grow by providing flood protection which facilitates planning permission for other airport development projects allowing airlines to grow
• Protect and enhance our reputation by ensuring the South Terminal is protected from substantive floding in a 1 in 100 year flood event.
• Build a strong EH&S culture by ensuring that any potantial health and safety risks as a result of flooding are mitigated
Q5 - £8.2m Q5+1 - £0m
This is a cost estimate which equates to a rough order of magnitude (ROM) estimate, based on the available scope definition at this preliminary conceptual design phase. As such it is subject to change and refinement aligned with a more detailed definition of the scope as options are clarified and prioritised throughout the development process.
February 2012
October 2013
Ongoing Operating costs:• Annual structural inspection £3k/annum - Current preferred option is the construction of an
inline flood storage and flow attenuation reservoir south of the airport on airport land, as outlined in the business case submitted to JSG.
• The impact of a 1 in 100 year event would be likely to cause a full closure of Gatwick Airport. This would result in lost income for GAL of circa £1m per day. The impact to our airlines has not been quantified at this stage.
Beyond Q5 Over Asset Life (35 yrs)Additional airport charges per passenger £0.020 £0.012
Gatwick’s reputation is safeguarded through management of flood risks and prevention of sewage leaks and environmental incidents.
• Currently proposed that a build solution is the only viable option and any future optioneering will focus on the nature of this solution.
VARIOUS PROjECTS AT VARIOUS STAGES
1 2 3 4
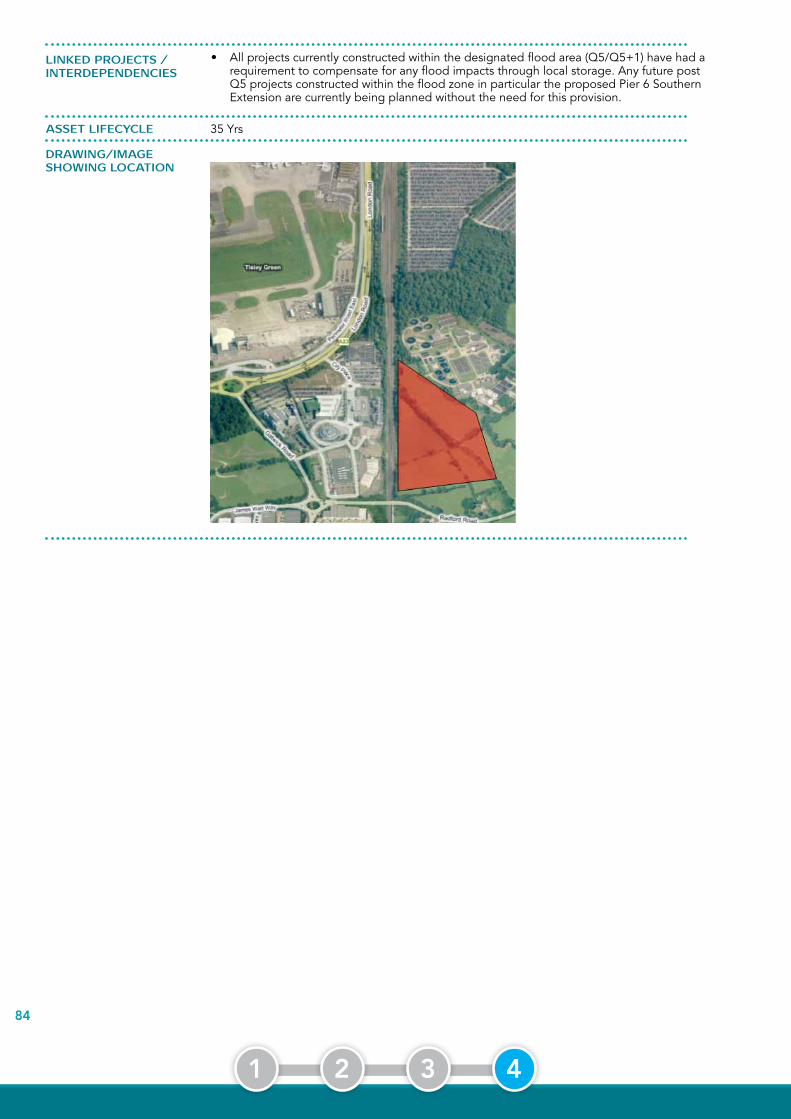
84
LINkED PROjECTS /INTERDEPENDENCIES
• All projects currently constructed within the designated flood area (Q5/Q5+1) have had a requirement to compensate for any flood impacts through local storage. Any future post Q5 projects constructed within the flood zone in particular the proposed Pier 6 Southern Extension are currently being planned without the need for this provision.
ASSET LIFECyCLE 35 Yrs
DRAWING/IMAGE ShOWING LOCATION
1 2 3 4

85
GAL 160 & 161 & 162SURFACE WATER INClUDING pOND D
DfSSStage 2
DfSSStage 3
DfSSStage 4
DfSSStage 5
DfSSStage 6
DfSSStage 7
DfSSStage 1
Initiate Scope Req’ments Options Build Handover Operate Closeout
TG0 TG1 TG2 TG3 TG4 TG5 TG6 TG7
CURRENT STATUS WIThINGATWICk PROjECT PROCESS
REQUIREMENTS
bENEFITS
TOTAL CAPITAL ExPENDITURE
£ MILLIONS (EST.)
PROjECT START DATE
PROjECT END DATE
LIkELy IMPACT ON OPERATING COSTS
INDICATIVE IMPACT ON AIRPORT ChARGES IN Q5 AND/OR bEyOND Q5
(ASSUMES UNCONSTRAINED TRAFFIC GROWTh)
IMPACT ON GATWICk’SCOMPETITIVE POSITION
bASIS OF DECISION (OPTIONS)
SCOPE: The key objectives of the surface water project are to minimise as far as reasonably practicable the risk of pollution to adjoining water courses and minimise the risk to personal safety and asset damage as a result of flooding
• To build a 100,000m3 pollution lagoon which will reduce the volume of polluted water being discharge to the river mole by a further 9% (based on design year 2010/11).
• To renew the core pollution control/flood alleviation infrastructure at Pond D to provide a further 25 years of life.
• To renew the airfield standby fire main providing a key enabler for the project and securing the integrity of this core infrastructure.
• Help our airlines grow by ensuring GAL has the ability to continue de-icing the airfield operational area.
• Build a strong EH&S culture by reducing the risk of Gatwick breaching the current discharge consent to the river mole.
Q5 - £12.2m
November 2011
May 2013
On-going Operating costs:• Net effect to operating costs will be negligibleOne-off costs:• Net effect to operating costs will be negligible
Beyond Q5 Over Asset Life (25 yrs)Additional airport charges per passenger £(0.03) £(0.57)
Gatwick’s reputation is safeguarded through management of flood risks and prevention of sewage leaks and environmental incidents.
• As part of the agreed procurement strategy and during this phase of the project, Gatwick approached the market looking for options which would completely eliminate the potential to breach the current discharge consent except during exceptional weather events. This option has been discounted due to a lack of budget, high operational costs, and a lack of maturity and detail on the technology proposed by bidders.
• Between tollgate 1 and 2, workshops were held to consider alternative means of de-icing and methods by which the use of de-icent could be optimise. This resulted in new vehicles being procured which attempt to optimise the use of current de-icent.
• Finally, discussions with both Thames water and the EA to maximize our discharge consents have been progressed and while these are on-going they continue not to yield any contribution to the current challenge.
VARIOUS PROjECTS AT VARIOUS STAGES
1 2 3 4

86
LINkED PROjECTS /INTERDEPENDENCIES
This project is part of the overall surface water infrastructure programme to: • Eliminate the risk of prosecution from surface water discharges in to adjoining water
courses • Protect Gatwick in the event of a 1:100 year storm
Project InterdependenciesThis project is required to be delivered before any long term options can be considered.
ASSET LIFECyCLE 25 Yrs
1. New Lagoon shown in red adjacent to existing lagoon
2. Pond shown in white
DRAWING/IMAGE ShOWING LOCATION
NOTES
1 2 3 4
87
APPENDICESa
APPENDIX A Phased Capital Investment Programme 2012
APPENDIX B Phased Capital Investment Programme 2011
APPENDIX C Changes to Investment Programme - Tracker ( 2008 – 2012)
APPENDIX D Previous Traffic Forecasts
APPENDIX E Meetings, Working Groups and Governance Boards
APPENDIX F Decision Log
APPENDIX G Annex G
APPENDIX H Gatwick in 2020 - Land Use Plan
APPENDIX I Gatwick‘s Product Matrix
APPENDIX J Tollgate Process


Gat
wic
k Ai
rpor
t Pha
sed
Cap
ital I
nves
tmen
t Pro
gram
me
2012
(in
cons
tant
pric
es)
0.0%
-0.7
%10
0.0%
100.
0%99
.3%
Lond
on G
atw
ick
Airp
ort
Proj
ecte
d Sp
end
(Con
stan
t Pric
es)
Q5
Tota
lQ
5Q
5Q
5Q
5Q
5Q
5Q
5 To
tal
£ m
illio
ns(c
onst
ant 2
012
pric
es)
(Fut
ure
Spe
nd in
cl
2008
/09,
200
9/10
, 20
10/1
1 &
201
1/12
)
2008
/09
(Act
ual)
2009
/10
(Act
ual)
2010
/11
(Act
ual)
2011
/12
(Act
ual)
2012
/13
2013
/14
Out
-turn
E
quiv
alen
t
Proj
ects
in D
evel
opm
ent o
r Des
ign
Stag
eG
AL1
70N
orth
Ter
min
al B
agga
ge V
oids
3.
20.
00.
00.
00.
32.
70.
33.
2G
AL1
71A
380
on S
tand
( n
ot c
urre
ntly
sup
porte
d by
airl
ines
)6.
50.
00.
00.
00.
65.
90.
06.
5G
AL1
72A
irfie
ld P
eak
Cap
acity
Exp
ansi
on
7.0
0.0
0.0
0.0
0.2
1.3
5.5
7.0
GA
L173
Cre
w R
epor
ting
12
.00.
00.
00.
00.
811
.30.
012
.0G
AL1
74S
outh
Ter
min
al D
omes
tic A
rriv
als
9.5
0.0
0.0
0.0
0.9
8.6
0.0
9.5
GA
L175
bS
outh
Ter
min
al ID
L R
econ
figur
atio
n24
.40.
00.
00.
00.
08.
316
.124
.3G
AL1
79A
irfie
ld O
pera
tions
Bui
ldin
g7.
90.
00.
00.
01.
02.
84.
17.
9G
AL1
69N
T E
arly
Bag
Sto
re (
Def
erre
d - B
eyon
d Q
5)0.
40.
00.
00.
00.
40.
00.
00.
4
Tota
l for
Pro
ject
s in
Dev
elop
men
t or D
esig
n S
tage
71.1
0.0
0.0
0.0
4.2
40.8
26.0
70.9
Proj
ects
in Im
plem
enta
tion
Stag
eG
AL1
25 &
GA
L005
Sou
th T
erm
inal
Bag
gage
& P
ier 1
116.
74.
312
.79.
819
.224
.745
.911
6.4
GA
L111
Nor
th T
erm
inal
Add
ition
al P
ier S
ervi
ce (P
ier 5
)72
.50.
30.
00.
44.
936
.130
.772
.2G
AL0
96A
irfie
ld P
rogr
amm
e in
clud
ing
Run
way
Res
urfa
cing
61.5
1.4
10.9
0.8
9.1
39.4
0.0
61.5
GA
L155
Sou
th T
erm
inal
Sec
urity
52.3
0.0
0.2
14.4
30.0
7.8
0.0
52.3
GA
L137
Nor
th T
erm
inal
Bag
gage
(NTB
) Upg
rade
50.2
3.8
1.9
11.8
19.1
13.7
0.0
50.2
GA
L175
aN
orth
Ter
min
al ID
L R
econ
figur
atio
n10
.30.
00.
00.
01.
58.
10.
710
.2G
AL1
57N
orth
Ter
min
al S
ecur
ity11
.50.
00.
01.
55.
74.
40.
011
.5G
AL1
68S
now
Equ
ipm
ent
11.7
0.0
0.0
5.0
6.7
0.0
0.0
11.7
GA
L122
Sou
th T
erm
inal
Lan
dsid
e17
.21.
94.
62.
64.
33.
70.
017
.2G
AL1
60P
ond
D R
ehab
ilita
tion
8.3
0.0
0.1
0.5
1.8
5.8
0.0
8.3
GA
L167
Rai
lway
Con
tribu
tion
7.
60.
00.
00.
01.
10.
06.
57.
6G
AL1
65 &
GA
L166
Taxi
way
Pap
a &
Nov
embe
r7.
30.
00.
00.
02.
74.
60.
07.
3G
AL1
34N
orth
Ter
min
al A
dditi
onal
Pie
r Ser
vice
7.1
1.4
0.6
0.2
1.4
3.5
0.0
7.1
GA
L150
Nor
th T
erm
inal
For
ecou
rt (N
TF)
11.4
0.7
3.4
3.6
1.3
2.4
0.0
11.4
Tota
l for
Pro
ject
s in
Impl
emen
tatio
n S
tage
445.
613
.834
.450
.610
8.8
154.
183
.944
5.0
Com
plet
ed P
roje
cts
GA
L027
Inte
r Ter
min
al S
huttl
e36
.79.
017
.210
.30.
20.
10.
036
.7G
AL0
31b
Sou
th T
erm
inal
Fire
Pro
tect
ion
Sys
tem
14.4
3.4
5.9
4.9
0.2
0.0
0.0
14.4
GA
L058
Tele
com
ms
Pro
gram
me
(Dat
a &
Voi
ce)
1.0
0.9
0.1
0.0
0.0
0.0
0.0
1.0
GA
L069
Sou
th T
erm
inal
Dep
artu
re L
oung
e C
apac
ity19
.813
.95.
60.
30.
00.
00.
019
.8G
AL1
09N
orth
Wes
t Zon
e39
.12.
423
.812
.80.
20.
00.
039
.1G
AL1
15N
orth
Ter
min
al S
hort
Term
Car
Par
king
(MS
CP
6)16
.91.
00.
714
.31.
00.
00.
016
.9G
AL1
16 &
GA
L117
Nor
th T
erm
inal
Ext
ensi
on (N
TX)
85.9
4.6
11.6
28.6
39.8
1.4
0.0
85.9
GA
L120
Sou
th T
erm
inal
For
ecou
rt30
.31.
22.
17.
119
.01.
00.
030
.3G
AL1
40P
ier 2
mod
ifica
tions
38.1
0.1
10.0
20.8
7.1
0.0
0.0
38.1
GA
L141
Roa
dway
Impr
ovem
ents
1.0
0.0
0.0
0.0
0.0
1.0
0.0
1.0
GA
L144
Sou
th T
erm
inal
Tun
nel S
ecur
ity &
Roa
d C
apac
ity2.
20.
51.
20.
50.
00.
00.
02.
2G
AL1
45S
outh
Ter
min
al T
unne
l Ref
urbi
shm
ent
1.2
0.2
0.5
0.4
0.1
0.0
0.0
1.2
GA
L147
Dig
ital M
edia
Upg
rade
2.5
0.1
0.1
0.8
1.1
0.5
0.0
2.5
GA
L149
Sou
th T
erm
inal
Imm
igra
tion
6.4
1.3
3.6
1.5
0.0
0.0
0.0
6.4
GA
L151
Nor
th T
erm
inal
Inte
rcha
nge
(NTI
)24
.61.
218
.15.
30.
00.
00.
024
.6G
AL1
53A
lpha
Hol
d (T
axiw
ay &
Hol
ds, J
AZ)
0.2
0.0
0.1
0.0
0.0
0.0
0.0
0.2
GA
L154
Sou
th T
erm
inal
Arr
ival
s C
onco
urse
Rec
onfig
urat
ion
7.6
1.2
0.3
2.0
2.0
2.0
0.0
7.6
GA
L156
Julie
t Kin
k3.
10.
00.
52.
60.
00.
00.
03.
1G
AL1
61R
iver
Mol
e Fl
ood
Alle
viat
ion
4.0
0.0
0.0
0.0
2.7
1.3
0.0
4.0
GA
L162
Pol
lutio
n La
goon
1.5
0.0
0.0
1.3
0.1
0.1
0.0
1.5
GA
L164
Taxi
way
Lim
a2.
60.
00.
02.
60.
00.
00.
02.
60.
0To
tal f
or P
roje
cts
Com
plet
ed33
9.1
40.9
101.
511
5.9
73.4
7.4
0.0
339.
1
Prog
ram
mes
GA
L063
Sec
urity
Dev
elop
men
t Pro
gram
me
6.5
1.9
1.4
0.4
1.9
0.9
0.0
6.5
GA
L124
Ass
et R
epla
cem
ent P
rogr
amm
e62
.519
.314
.06.
812
.59.
80.
062
.5G
AL1
26C
omm
erci
al a
nd P
rope
rty P
rogr
amm
e25
.95.
83.
88.
56.
21.
70.
025
.9G
AL1
28O
pera
tiona
l Effi
cien
cy P
rogr
amm
e12
.13.
87.
21.
10.
00.
00.
012
.1G
AL1
31A
irfie
ld A
sset
5.0
0.6
0.6
3.1
0.0
0.7
0.0
5.0
GA
L143
Cle
an, W
orki
ng &
Frie
ndly
15.4
5.7
3.3
2.0
2.6
1.8
0.0
15.4
GA
L159
& G
AL1
35IT
Tra
nsfo
rmat
ion
& IT
Pro
gram
me
48.1
1.7
4.1
19.6
20.9
1.7
0.0
48.1
GA
L176
Faci
litie
s A
sset
Ste
war
dshi
p19
.00.
00.
00.
00.
29.
09.
818
.9G
AL1
77C
omm
erci
al A
sset
Ste
war
dshi
p
4.7
0.0
0.0
0.0
0.0
0.0
4.7
4.7
GA
L178
Airf
ield
Ass
et S
tew
ards
hip
15.1
0.0
0.0
0.0
0.0
0.0
15.1
15.0
GA
L180
Q5
Min
or P
roje
cts
9.3
2.1
3.9
1.1
1.0
1.3
0.0
9.3
GA
L182
Q5+
1 M
inor
Pro
ject
s <
£5m
37.4
0.0
0.0
0.0
0.0
5.7
31.6
37.1
GA
L183
Floo
d A
llevi
atio
n8.
20.
00.
00.
00.
08.
20.
08.
2
Tota
l for
Pro
gram
mes
269.
040
.838
.342
.545
.340
.861
.226
8.6
Oth
er P
roje
cts
0.0
0.0
0.0
GA
L181
Bey
ond
Q5
Dev
elop
men
t10
.00.
00.
00.
82.
66.
60.
010
.0R
2/C
ontin
genc
yR
2/C
ontin
genc
y12
.30.
00.
00.
00.
012
.30.
012
.3G
AL
not n
eede
dO
ther
Pro
ject
s26
.28.
56.
33.
04.
83.
50.
026
.2
Tota
ls fo
r All
Proj
ects
1,17
3.2
104.
018
0.4
212.
923
9.2
265.
617
1.1
1,17
2.0
Sub
co C
ar P
arks
*0.
00.
020
.80.
00.
0
*Sub
co (p
revi
ousl
y kn
own
as E
nter
pris
e) C
ar P
arks
hav
e be
en s
how
n fo
r ref
eren
ce b
ut h
ave
not b
een
incl
uded
in th
e to
tal c
apex
val
ueP
leas
e no
te 2
009/
10 a
nd 2
010/
11 to
tals
hav
e be
en a
djus
ted
to a
ccou
nt fo
r rec
lass
ified
cap
ital s
pend
. T
his
shou
ld h
ave
been
incl
uded
in th
e pr
evio
us C
IP10
.
CO
PI A
ssum
ptio
n:20
13/1
4 @
-0.7
%
The
2013
/14
prog
ram
me
may
be
subj
ect t
o ch
ange
s in
pha
sing
. Th
is is
cur
rent
ly in
dis
cuss
ion
APPENDIx ApHASED CApITAl INVESTMENT pROGRAMME 2012 a
89


Gat
wic
k Ai
rpor
t Pha
sed
Cap
ital I
nves
tmen
t Pro
gram
me
2011
(in
cons
tant
pric
es)
Lond
on G
atw
ick
Airp
ort
Proj
ecte
d Sp
end
(Con
stan
t Pric
es)
Q5
Tota
lQ
5Q
5Q
5Q
5Q
5Q
5Q
5 To
tal
£ m
illio
ns(c
onst
ant 2
011
pric
es)
(Fut
ure
Spen
d in
cl
2008
/09,
200
9/10
&
2010
/11)
2008
/09
(Act
ual)
2009
/10
(Act
ual)
2010
/11
(Act
ual)
2011
/12
2012
/13
2013
/14
Out
-turn
Eq
uiva
lent
Proj
ects
in D
evel
opm
ent o
r Des
ign
Stag
eG
AL16
9N
orth
Ter
min
al E
arly
Bag
Sto
re12
.30.
00.
00.
00.
00.
012
.313
.0G
AL17
1A3
80 O
n Pi
er
4.7
0.0
0.0
0.0
0.0
0.0
4.7
5.0
GAL
172
Airfi
eld
Peak
Cap
acity
Exp
ansi
on6.
60.
00.
00.
00.
00.
06.
67.
0G
AL17
3C
rew
Rep
ortin
g
11.3
0.0
0.0
0.0
0.0
0.0
11.3
12.0
GAL
174
Sout
h Te
rmin
al D
omes
tic A
rriv
als
9.0
0.0
0.0
0.0
0.0
0.0
9.0
9.5
GAL
175a
Nor
th T
erm
inal
IDL
Rec
onfig
urat
ion
6.6
0.0
0.0
0.0
0.0
0.0
6.6
7.0
GAL
175b
Sout
h Te
rmin
al ID
L R
econ
figur
atio
n18
.90.
00.
00.
00.
00.
018
.920
.0G
AL17
0N
orth
Ter
min
al B
agga
ge V
oids
2.
40.
00.
00.
02.
40.
00.
02.
4G
AL16
5 &
GAL
166
Taxi
way
s Pa
pa &
Nov
embe
r7.
90.
00.
00.
03.
34.
60.
08.
0G
AL16
7R
ail S
tatio
n C
ontri
butio
n7.
20.
00.
00.
01.
10.
06.
17.
6G
AL16
1R
iver
Mol
e Fl
ood
Alle
viat
ion
2.8
0.0
0.0
0.0
1.4
1.4
0.0
2.8
GAL
111
Nor
th T
erm
inal
Add
ition
al P
ier S
ervi
ce (P
ier 5
)79
.30.
30.
00.
46.
237
.634
.982
.5G
AL13
4N
orth
Ter
min
al A
dditi
onal
Pie
r Ser
vice
12.3
1.4
0.6
0.2
4.6
5.5
0.0
12.5
GAL
160
Pond
D R
ehab
ilita
tion
8.2
0.0
0.1
0.5
4.8
2.8
0.0
8.3
Tota
l for
Pro
ject
s in
Dev
elop
men
t or D
esig
n St
age
189.
51.
70.
71.
123
.851
.811
0.4
197.
6Pr
ojec
ts in
Impl
emen
tatio
n St
age
GAL
168
Snow
Equ
ipm
ent
7.3
0.0
0.0
5.0
2.3
0.0
0.0
7.3
GAL
157
Nor
th T
erm
inal
Sec
urity
12.8
0.0
0.0
1.5
11.3
0.0
0.0
12.8
GAL
163
Nor
th T
erm
inal
Can
opy
& Pa
ving
Low
er F
orec
ourt
1.4
0.0
0.0
0.0
1.4
0.0
0.0
1.4
GAL
155
Sout
h Te
rmin
al S
ecur
ity47
.90.
00.
214
.428
.74.
70.
048
.0G
AL12
5 &
GAL
005
Sout
h Te
rmin
al B
agga
ge &
Pie
r 113
2.7
4.3
12.7
9.8
29.8
26.7
49.3
136.
4G
AL12
0So
uth
Term
inal
For
ecou
rt31
.01.
22.
17.
119
.31.
40.
031
.1G
AL12
2So
uth
Term
inal
Lan
dsid
e21
.61.
94.
62.
611
.21.
20.
021
.6G
AL13
7N
orth
Ter
min
al B
agga
ge U
pgra
de39
.63.
81.
911
.822
.10.
00.
039
.6G
AL11
6 &
GAL
117
Nor
th T
erm
inal
Ext
ensi
on (N
TX)
75.5
4.6
11.6
28.6
30.7
0.0
0.0
75.5
GAL
147
Dig
ital M
edia
Upg
rade
3.4
0.1
0.1
0.8
1.5
1.0
0.0
3.4
GAL
154
Sout
h Te
rmin
al A
rriv
als
Con
cour
se R
econ
figur
atio
n5.
81.
20.
32.
02.
30.
00.
05.
8G
AL14
9So
uth
Term
inal
Imm
igra
tion
6.4
1.3
3.6
1.5
0.0
0.0
0.0
6.4
GAL
140
Pier
2 M
odifi
catio
ns
40.3
0.1
10.0
20.8
9.3
0.0
0.0
40.3
Tota
l for
Pro
ject
s in
Impl
emen
tatio
n St
age
425.
618
.447
.110
5.8
169.
934
.949
.342
9.5
Com
plet
ed P
roje
cts
GAL
164
Taxi
way
Lim
a2.
80.
00.
02.
60.
20.
00.
02.
8G
AL16
2Po
llutio
n La
goon
1.3
0.0
0.0
1.3
0.0
0.0
0.0
1.3
GAL
141
Roa
dway
Impr
ovem
ents
1.0
0.0
1.0
0.0
0.0
0.0
0.0
1.0
GAL
115
Nor
th T
erm
inal
Sho
rt Te
rm C
ar P
arki
ng (M
SCP6
)16
.91.
00.
714
.30.
90.
00.
016
.9G
AL14
5So
uth
Term
inal
Tun
nel R
efur
bish
men
t1.
10.
20.
50.
40.
00.
00.
01.
1G
AL14
4So
uth
Term
inal
Tun
nel S
ecur
ity &
Roa
d C
apac
ity2.
20.
51.
20.
50.
00.
00.
02.
2G
AL15
0N
orth
Ter
min
al F
orec
ourt
(NTF
)7.
70.
73.
43.
60.
00.
00.
07.
7G
AL15
1N
orth
Ter
min
al In
terc
hang
e (N
TI)
24.6
1.2
18.1
5.3
0.0
0.0
0.0
24.6
GAL
109
Nor
th W
est Z
one
39.6
2.4
23.8
12.8
0.7
0.0
0.0
39.6
GAL
027
Inte
r Ter
min
al S
huttl
e36
.09.
017
.210
.3-0
.40.
00.
036
.0G
AL06
9So
uth
Term
inal
Dep
artu
re L
oung
e C
apac
ity19
.813
.95.
60.
30.
00.
00.
019
.8G
AL03
1bSo
uth
Term
inal
Fire
Pro
tect
ion
Syst
em14
.73.
45.
94.
90.
50.
00.
014
.7G
AL05
8Te
leco
mm
s Pr
ogra
mm
e (D
ata
& Vo
ice)
1.0
0.9
0.1
0.0
0.0
0.0
0.0
1.0
GAL
156
Julie
t Kin
k3.
10.
00.
52.
60.
00.
00.
03.
1G
AL15
3Al
pha
Hol
d (T
axiw
ay &
Hol
ds, J
AZ)
0.2
0.0
0.1
0.0
0.0
0.0
0.0
0.2
Tota
l for
Pro
ject
s C
ompl
eted
172.
033
.278
.158
.81.
90.
00.
017
2.0
Prog
ram
mes
GAL
096
Airfi
eld
Prog
ram
me
incl
udin
g R
unw
ay R
esur
faci
ng57
.21.
410
.90.
84.
140
.00.
058
.3G
AL12
8O
pera
tiona
l Effi
cien
cy P
rogr
amm
e12
.13.
87.
21.
10.
00.
00.
012
.1G
AL06
3Se
curit
y D
evel
opm
ent P
rogr
amm
e6.
71.
91.
40.
42.
01.
00.
06.
7G
AL15
9 &
GAL
135
IT T
rans
form
atio
n &
IT P
rogr
amm
e 48
.01.
74.
119
.617
.15.
40.
048
.1G
AL12
6C
omm
erci
al a
nd P
rope
rty P
rogr
amm
e27
.05.
83.
88.
57.
01.
90.
027
.0G
AL12
4As
set R
epla
cem
ent P
rogr
amm
e55
.919
.314
.06.
810
.55.
20.
056
.0G
AL13
1Ai
rfiel
d As
set
7.2
0.6
0.6
3.1
0.8
2.1
0.0
7.3
GAL
143
Cle
an, W
orki
ng &
Frie
ndly
13.3
5.7
3.3
2.0
2.0
0.3
0.0
13.3
GAL
176
Faci
litie
s As
set S
tew
ards
hip
Prog
ram
me
22.3
0.0
0.0
0.0
0.0
0.0
22.3
23.6
GAL
177
Com
mer
cial
Ass
et S
tew
ards
hip
Prog
ram
me
5.7
0.0
0.0
0.0
0.0
0.0
5.7
6.0
GAL
178
Airfi
eld
Asse
t Ste
war
dshi
p Pr
ogra
mm
e13
.80.
00.
00.
00.
00.
013
.814
.6Q
5+1
Com
plia
nce
Proj
ects
16.6
0.0
0.0
0.0
0.0
0.0
16.6
17.6
Q5+
1 O
ther
Pro
ject
s <£
5.0
mill
ion
18.4
0.0
0.0
0.0
0.0
0.0
18.4
19.5
Min
or P
roje
cts
8.5
2.1
3.9
1.1
1.0
0.6
0.0
8.5
Tota
l for
Pro
gram
mes
312.
542
.249
.243
.344
.556
.676
.731
8.7
Oth
er P
roje
cts
Q6
Dev
elop
men
t9.
90.
00.
00.
84.
24.
90.
010
.0R
2/C
ontin
genc
y16
.80.
00.
00.
00.
016
.80.
017
.2O
ther
Pro
ject
s26
.98.
56.
33.
05.
43.
60.
027
.0
Tota
ls fo
r All
Proj
ects
1,15
3.1
104.
018
1.4
212.
924
9.7
168.
623
6.4
1,17
2.0
0.0
0.0
Subc
o C
ar P
arks
*0.
00.
020
.80.
020
.8
*Sub
co (p
revi
ousl
y kn
own
as E
nter
pris
e) C
ar P
arks
hav
e be
en s
how
n fo
r ref
eren
ce b
ut h
ave
not b
een
incl
uded
in th
e to
tal c
apex
val
uePl
ease
not
e 20
09/1
0 an
d 20
10/1
1 to
tals
hav
e be
en a
djus
ted
to a
ccou
nt fo
r rec
lass
ified
cap
ital s
pend
. T
his
shou
ld h
ave
been
incl
uded
in th
e pr
evio
us C
IP10
.
The
2013
/14
prog
ram
me
may
be
subj
ect t
o ch
ange
s in
pha
sing
. Th
is is
cur
rent
ly in
dis
cuss
ion
and
full
upda
te w
ill b
e sh
own
in th
e ne
xt C
IP s
ubm
issi
on
APPENDIx bpHASED CApITAl INVESTMENT pROGRAMME 2011 b
91


2008
GAL
No
Nam
eFi
rst A
ppea
red
Tota
l Q5
Spe
nd
(£ m
illio
ns, o
ut-tu
rn)
GA
L146
Port
als
(Sta
ndar
disa
tion
ATI
X)C
IP 2
008
3.2
-▼
--
--
--
GA
L147
Dig
ital M
edia
Upg
rade
CIP
200
81.
41.
6▲
New
Pro
ject
▲-
--
-
GA
L128
Ope
ratio
nal E
ffici
ency
Pro
gram
me
CIP
200
822
.137
.4▲
Star
t/Fin
ish
-1 Y
ear
Com
pare
d to
CIP
2008
◄-
--
-
GA
L096
cN
orth
ern
Run
way
Res
urfa
ceC
IP 2
008
10.9
-▼
Star
t/Fin
ish
+1 Y
ear
Com
pare
d to
CIP
2008
►-
--
-
GA
L027
Inte
r Ter
min
al S
huttl
eC
IP 2
008
38.2
35.9
--
-LG
W/0
005
LGW
/000
8-
-
GA
L031
bSo
uth
Term
inal
Fire
Pro
tect
ion
Syst
emC
IP 2
008
13.6
15.8
▲St
art/F
inis
h +1
Yea
r C
ompa
red
to C
IP20
08►
--
--
GA
L144
Sout
h Te
rmin
al T
unne
l Sec
urity
& R
oad
Cap
acity
CIP
200
81.
22.
2▲
Star
t/Fin
ish
-1 Y
ear
Com
pare
d to
CIP
2008
◄-
--
-
GA
L039
Gro
und
Run
Pen
CIP
200
82.
5-
▼-
--
--
-G
AL1
45So
uth
Term
inal
Tun
nel R
efur
bish
men
tC
IP 2
008
1.1
1.7
▲-
--
--
-G
AL1
33A
dditi
onal
Sec
urity
Cap
acity
CIP
200
83.
01.
3▼
--
--
--
GA
L080
DEE
Pro
gram
me
CIP
200
81.
80.
5▼
--
--
--
GA
L034
bFI
DS
CIP
200
86.
31.
7▼
--
--
--
GA
L041
Load
ing
Brid
ge P
rogr
amm
eC
IP 2
008
7.6
2.6
▼St
art/F
inis
h +1
Yea
r C
ompa
red
to C
IP20
08►
--
--
GA
L070
bN
orth
Ter
min
al T
oile
t Ref
urbi
shm
ent P
rogr
amm
eC
IP 2
008
0.5
0.4
▼St
art/F
inis
h -1
Yea
r C
ompa
red
to C
IP20
08◄
--
--
GA
L067
bN
orth
Ter
min
al A
dditi
onal
Bag
gage
Cap
acity
CIP
200
80.
40.
1▼
--
--
--
GA
L063
Secu
rity
Dev
elop
men
t Pro
gram
me
CIP
200
813
.17.
4▼
--
LGW
/000
7LG
W/0
008
--
GA
L069
Sout
h Te
rmin
al D
epar
ture
Lou
nge
Cap
acity
CIP
200
812
.819
.8▲
--
--
--
GA
L058
Tele
com
ms
Prog
ram
me
(Dat
a &
Voi
ce)
CIP
200
82.
62.
5-
Star
t/Fin
ish
+1 Y
ear
Com
pare
d to
CIP
2008
►-
--
-
GA
L124
Ass
et R
epla
cem
ent P
rogr
amm
eC
IP 2
008
53.8
52.0
--
-LG
W/0
001
LGW
/002
2-
-
GA
L131
Airf
ield
Ass
etC
IP 2
008
2.6
2.4
--
--
--
-G
AL1
43C
lean
, Wor
king
& F
riend
lyC
IP 2
008
12.6
15.1
▲-
--
--
-M
inor
Pro
ject
sC
IP 2
008
6.3
8.8
▲-
--
--
-G
AL0
96A
irfie
ld P
rogr
amm
e in
clud
ing
Run
way
Res
urfa
cing
CIP
200
824
.535
.0▲
--
--
--
GA
L126
Com
mer
cial
and
Pro
pert
y Pr
ogra
mm
eC
IP 2
008
11.6
16.8
▲-
--
--
-G
AL1
35IT
Pro
gram
me
CIP
200
82.
511
.1▲
--
--
--
GA
L116
& G
AL1
17N
orth
Ter
min
al E
xten
sion
(NTX
)C
IP 2
008
91.5
84.3
--
-
LGW
/000
3LG
W/0
007
LGW
/000
8LG
W/0
016
LGW
/001
9LG
W/0
021
LGW
/002
3
--
GA
L134
Nor
th T
erm
inal
Add
ition
al P
ier S
ervi
ceC
IP 2
008
214.
510
1.3
Star
t/Fin
ish
+1 Y
ear
Com
pare
d to
CIP
2008
►LG
W/0
006
LGW
/000
9LG
W/0
010
--
GA
L136
Airl
ine
Rel
ocat
ions
CIP
200
86.
06.
3-
--
--
--
GA
L125
& G
AL0
05So
uth
Term
inal
Bag
gage
Fac
tory
& P
ier 1
CIP
200
811
5.3
115.
8-
--
--
--
GA
L137
Nor
th T
erm
inal
Bag
gage
Upg
rade
CIP
200
814
.127
.0▲
--
LGW
/001
6LG
W/0
017
LGW
/002
1LG
W/0
022
--
GA
L115
Nor
th T
erm
inal
Sho
rt T
erm
Car
Par
king
(MSC
P6)
CIP
200
827
.920
.4▼
Star
t/Fin
ish
+1 Y
ear
Com
pare
d to
CIP
2008
►
LGW
/000
4LG
W/0
007
LGW
/000
8LG
W/0
024
--
GA
L109
Nor
th W
est Z
one
CIP
200
849
.946
.7-
Star
t/Fin
ish
+ Ye
ar
Com
pare
d to
CIP
2008
►LG
W/0
017
LGW
/001
8Sc
ope/
Dat
e C
hang
e►
GA
L111
Stan
d R
econ
figur
atio
nsC
IP 2
008
39.3
14.9
▼-
-LG
W/0
011
LGW
/001
2-
-
GA
L122
Sout
h Te
rmin
al L
ands
ide
CIP
200
819
.144
.2▲
Star
t/Fin
ish
+1 Y
ear
Com
pare
d to
CIP
2008
►LG
W/0
014
LGW
/002
0-
-
GA
L120
Sout
h Te
rmin
al F
orec
ourt
CIP
200
854
.848
.1▼
Star
t/Fin
ish
+1 Y
ear
Com
pare
d to
CIP
2008
►LG
W/0
013
LGW
/001
4LG
W/0
020
--
GA
L138
Early
Bag
Sto
reC
IP 2
008
11.6
-▼
--
--
--
GA
L139
Pier
4 M
odifi
catio
nsC
IP 2
008
1.1
0.4
▼-
--
--
-
GA
L140
Pier
2 M
odifi
catio
ns
CIP
200
824
.044
.9▲
Star
t/Fin
ish
+1 Y
ear
Com
pare
d to
CIP
2008
►LG
W/0
011
LGW
/001
2LG
W/0
015
Turn
on
new
Trig
ger▲
GA
L152
Pier
3 M
odifi
catio
ns
CIP
200
9-
6.5
▲-
-LG
W/0
015
--
GA
L132
Sout
h Te
rmin
al A
irsid
eC
IP 2
008
10.5
-▼
--
LGW
/000
2-
-
GA
L141
Roa
dway
Impr
ovem
ents
CIP
200
811
.26.
0▼
Star
t/Fin
ish
+1 Y
ear
Com
pare
d to
CIP
2008
►-
--
-
GA
L005
Pier
1C
IP 2
008
11.0
80.7
▲St
art/F
inis
h +1
Yea
r C
ompa
red
to C
IP20
08►
LGW
/000
9LG
W/0
010
Turn
off
Trig
ger
▼
GA
L142
Sout
hern
For
ecou
rt E
nhan
cem
ents
CIP
200
817
.5-
▼-
-LG
W/0
013
--
GA
L153
Alp
ha H
old
(Tax
iway
& H
olds
, JA
Z)C
IP 2
009
-20
.0▲
--
LGW
/000
6-
-
GA
L149
Sout
h Te
rmin
al Im
mig
ratio
nC
IP 2
009
-10
.5▲
--
LGW
/000
1LG
W/0
002
--
Oth
er P
roje
cts
CIP
200
89.
54.
7▼
--
--
--
GA
L154
Sout
h Te
rmin
al A
rriv
als
Con
cour
se R
econ
figur
atio
nC
IP 2
009
-1.
2▲
--
--
--
GA
L150
Nor
th T
erm
inal
For
ecou
rt (N
TF)
CIP
200
9-
7.1
▲-
-
LGW
/000
3LG
W/0
004
LGW
/000
7LG
W/0
019
--
GA
L151
Nor
th T
erm
inal
Inte
rcha
nge
(NTI
)C
IP 2
009
-21
.8▲
--
LGW
/000
3LG
W/0
004
LGW
/000
5LG
W/0
008
LGW
/001
9
--
GA
L159
& G
AL1
35IT
Tra
nsfo
rmat
ion
CIP
201
0-
--
--
--
--
GA
L155
Sout
h Te
rmin
al S
ecur
ityC
IP 2
010
--
--
--
--
-G
AL1
60Po
nd D
Reh
abili
tatio
nC
IP 2
010
--
--
--
--
-G
AL1
61R
iver
Mol
e Fl
ood
Alle
viat
ion
CIP
201
0-
--
--
--
--
GA
L162
Pollu
tion
Lago
onC
IP 2
010
--
--
--
--
-G
AL1
63N
orth
Ter
min
al C
anop
y &
Pav
ing
Low
er F
orec
ourt
CIP
201
0-
--
--
--
--
GA
L157
Nor
th T
erm
inal
Sec
urity
CIP
201
0-
--
--
--
--
GA
L156
Julie
t Kin
kC
IP 2
010
--
--
--
--
-G
AL1
64Ta
xiw
ay L
ima
CIP
2010
--
--
--
--
-G
AL1
65 &
GA
L166
Taxi
way
s Pa
pa &
Nov
embe
rC
IP20
10-
--
--
--
--
GA
L167
Rai
l Sta
tion
Con
trib
utio
nC
IP20
10-
--
--
--
--
GA
L168
Snow
Equ
ipm
ent
CIP
2010
--
--
--
--
-Q
6 D
evel
opm
ent
CIP
2010
--
--
--
--
-G
AL1
69N
orth
Ter
min
al E
arly
Bag
Sto
reC
IP20
11-
--
--
--
--
GA
L170
Nor
th T
erm
inal
Bag
gage
Voi
dsC
IP20
11-
--
--
--
--
GA
L172
A38
0 O
n Pi
er
CIP
2011
--
--
--
--
-G
AL1
73A
irfie
ld P
eak
Cap
acity
Exp
ansi
onC
IP20
11-
--
--
--
--
GA
L174
Cre
w R
epor
ting
C
IP20
11-
--
--
--
--
GA
L175
Sout
h Te
rmin
al D
omes
tic A
rriv
als
CIP
2011
--
--
--
--
-G
AL1
76a
Nor
th T
erm
inal
IDL
Rec
onfig
urat
ion
CIP
2011
--
--
--
--
-G
AL1
76b
Sout
h Te
rmin
al ID
L R
econ
figur
atio
nC
IP20
11-
--
--
--
--
GA
L177
Faci
litie
s A
sset
Ste
war
dshi
p C
IP20
11-
--
--
--
--
GA
L178
Com
mer
cial
Ass
et S
tew
ards
hip
CIP
2011
--
--
--
--
-G
AL1
79A
irfie
ld A
sset
Ste
war
dshi
pC
IP20
11-
--
--
--
--
Q5+
1 C
ompl
ianc
e Pr
ojec
tsC
IP20
11-
--
--
--
--
Q5+
1 O
ther
Pro
ject
s <£
5.0
mill
ion
CIP
2011
--
--
--
--
-
2009
Tota
l Q5
Spe
nd
(£ m
illio
ns, o
ut-tu
rn)
Prog
ram
me
Cha
nge
Cha
nge
Con
trol
Rec
ord
Shee
t (C
CR
S)Tr
igge
r Cha
nge
(CAA
App
rove
d)
APPENDIx C1CHANGES TO INVESTMENT pROGRAMME - TRACkER (2008 - 2009)
c
93


GAL
No
Nam
eFi
rst A
ppea
red
GA
L146
Port
als
(Sta
ndar
disa
tion
ATI
X)C
IP 2
008
-▼
--
--
--
--
--
--
--
GA
L147
Dig
ital M
edia
Upg
rade
CIP
200
81.
6▲
New
Pro
ject
▲-
--
-3.
4▲
--
--
--
GA
L128
Ope
ratio
nal E
ffic
ienc
y Pr
ogra
mm
eC
IP 2
008
37.4
▲St
art/F
inis
h -1
Yea
r C
ompa
red
to C
IP20
08◄
--
--
12.1
▼-
--
--
-
GA
L096
cN
orth
ern
Run
way
Res
urfa
ceC
IP 2
008
-▼
Star
t/Fin
ish
+1 Y
ear
Com
pare
d to
CIP
2008►
--
--
--
--
--
--
GA
L027
Inte
r Ter
min
al S
huttl
eC
IP 2
008
35.9
--
-LG
W/0
005
LGW
/000
8-
-36
.0-
--
--
--
GA
L031
bSo
uth
Term
inal
Fire
Pro
tect
ion
Syst
emC
IP 2
008
15.8
▲St
art/F
inis
h +1
Yea
r C
ompa
red
to C
IP20
08►
--
--
14.4
--
--
--
-
GA
L144
Sout
h Te
rmin
al T
unne
l Sec
urity
& R
oad
Cap
acity
CIP
200
82.
2▲
Star
t/Fin
ish
-1 Y
ear
Com
pare
d to
CIP
2008◄
--
--
2.2
-St
art/F
inis
h +1
Yea
r C
ompa
red
to C
IP20
09►
--
--
GA
L039
Gro
und
Run
Pen
CIP
200
8-
▼-
--
--
--
--
--
--
-G
AL1
45So
uth
Term
inal
Tun
nel R
efur
bish
men
tC
IP 2
008
1.7
▲-
--
--
-1.
1▼
--
--
--
GA
L133
Add
ition
al S
ecur
ity C
apac
ityC
IP 2
008
1.3
▼-
--
--
--
--
--
--
-G
AL0
80D
EE P
rogr
amm
eC
IP 2
008
0.5
▼-
--
--
--
--
--
--
-G
AL0
34b
FID
SC
IP 2
008
1.7
▼-
--
--
--
--
--
--
-
GA
L041
Load
ing
Brid
ge P
rogr
amm
eC
IP 2
008
2.6
▼St
art/F
inis
h +1
Yea
r C
ompa
red
to C
IP20
08►
--
--
--
--
--
--
GA
L070
bN
orth
Ter
min
al T
oile
t Ref
urbi
shm
ent P
rogr
amm
eC
IP 2
008
0.4
▼St
art/F
inis
h -1
Yea
r C
ompa
red
to C
IP20
08◄
--
--
--
--
--
--
GA
L067
bN
orth
Ter
min
al A
dditi
onal
Bag
gage
Cap
acity
CIP
200
80.
1▼
--
--
--
--
--
--
--
GA
L063
Secu
rity
Dev
elop
men
t Pro
gram
me
CIP
200
87.
4▼
--
LGW
/000
7LG
W/0
008
--
6.7
-St
art/F
inis
h +1
Yea
r C
ompa
red
to C
IP20
09►
--
--
GA
L069
Sout
h Te
rmin
al D
epar
ture
Lou
nge
Cap
acity
CIP
200
819
.8▲
--
--
--
19.8
--
--
--
-
GA
L058
Tele
com
ms
Prog
ram
me
(Dat
a &
Voi
ce)
CIP
200
82.
5-
Star
t/Fin
ish
+1 Y
ear
Com
pare
d to
CIP
2008►
--
--
1.0
▼St
art/F
inis
h -1
Yea
r C
ompa
red
to C
IP20
09◄
--
--
GA
L124
Ass
et R
epla
cem
ent P
rogr
amm
eC
IP 2
008
52.0
--
-LG
W/0
001
LGW
/002
2-
-56
.0-
--
--
--
GA
L131
Airf
ield
Ass
etC
IP 2
008
2.4
--
--
--
-7.
3▲
--
--
--
GA
L143
Cle
an, W
orki
ng &
Frie
ndly
CIP
200
815
.1▲
--
--
--
13.3
▼-
--
--
-M
inor
Pro
ject
sC
IP 2
008
8.8
▲-
--
--
-8.
5-
--
--
--
GA
L096
Airf
ield
Pro
gram
me
incl
udin
g R
unw
ay R
esur
faci
ngC
IP 2
008
35.0
▲-
--
--
-46
.3▲
Star
t/Fin
ish
+1 Y
ear
Com
pare
d to
CIP
2009
►-
--
-
GA
L126
Com
mer
cial
and
Pro
pert
y Pr
ogra
mm
eC
IP 2
008
16.8
▲-
--
--
-27
.0▲
--
--
--
GA
L135
IT P
rogr
amm
eC
IP 2
008
11.1
▲-
--
--
--
--
--
--
-
GA
L116
& G
AL11
7N
orth
Ter
min
al E
xten
sion
(NTX
)C
IP 2
008
84.3
--
-
LGW
/000
3LG
W/0
007
LGW
/000
8LG
W/0
016
LGW
/001
9LG
W/0
021
LGW
/002
3
--
68.9
▼-
--
-Sc
ope
Cha
nge
-
GA
L134
Nor
th T
erm
inal
Add
ition
al P
ier S
ervi
ceC
IP 2
008
101.
3St
art/F
inis
h +1
Yea
r C
ompa
red
to C
IP20
08►
LGW
/000
6LG
W/0
009
LGW
/001
0-
-73
.6▼
Star
t/Fin
ish
-1 Y
ear
Com
pare
d to
CIP
2009
◄-
--
-
GA
L136
Airl
ine
Rel
ocat
ions
CIP
200
86.
3-
--
--
--
--
--
--
--
GA
L125
& G
AL00
5So
uth
Term
inal
Bag
gage
Fac
tory
& P
ier 1
CIP
200
811
5.8
--
--
--
-91
.6▼
--
--
--
GA
L137
Nor
th T
erm
inal
Bag
gage
Upg
rade
CIP
200
827
.0▲
--
LGW
/001
6LG
W/0
017
LGW
/002
1LG
W/0
022
--
39.6
▲St
art/F
inis
h +1
Yea
r C
ompa
red
to C
IP20
09►
LGW
/002
6-
--
GA
L115
Nor
th T
erm
inal
Sho
rt T
erm
Car
Par
king
(MSC
P6)
CIP
200
820
.4▼
Star
t/Fin
ish
+1 Y
ear
Com
pare
d to
CIP
2008►
LGW
/000
4LG
W/0
007
LGW
/000
8LG
W/0
024
--
16.9
▼-
--
-Sc
ope
Cha
nge
-
GA
L109
Nor
th W
est Z
one
CIP
200
846
.7-
Star
t/Fin
ish
+ Ye
ar
Com
pare
d to
CIP
2008►
LGW
/001
7LG
W/0
018
Scop
e/D
ate
Cha
nge►
39.6
▼St
art/F
inis
h -1
Yea
r C
ompa
red
to C
IP20
09◄
--
--
GA
L111
Stan
d R
econ
figur
atio
nsC
IP 2
008
14.9
▼-
-LG
W/0
011
LGW
/001
2-
-14
.2-
--
--
--
GA
L122
Sout
h Te
rmin
al L
ands
ide
CIP
200
844
.2▲
Star
t/Fin
ish
+1 Y
ear
Com
pare
d to
CIP
2008►
LGW
/001
4LG
W/0
020
--
21.6
▼-
--
--
-
GA
L120
Sout
h Te
rmin
al F
orec
ourt
CIP
200
848
.1▼
Star
t/Fin
ish
+1 Y
ear
Com
pare
d to
CIP
2008►
LGW
/001
3LG
W/0
014
LGW
/002
0-
-29
.7▼
--
--
Scop
e/D
ate
Cha
nge
-
GA
L138
Early
Bag
Sto
reC
IP 2
008
-▼
--
--
--
--
--
--
--
GA
L139
Pier
4 M
odifi
catio
nsC
IP 2
008
0.4
▼-
--
--
--
--
--
--
-
GA
L140
Pier
2 M
odifi
catio
ns
CIP
200
844
.9▲
Star
t/Fin
ish
+1 Y
ear
Com
pare
d to
CIP
2008►
LGW
/001
1LG
W/0
012
LGW
/001
5Tu
rn o
n ne
w T
rigge
r▲
39.1
▼-
-LG
W/0
028
--
-
GA
L152
Pier
3 M
odifi
catio
ns
CIP
200
96.
5▲
--
LGW
/001
5-
--
--
--
--
-G
AL1
32So
uth
Term
inal
Airs
ide
CIP
200
8-
▼-
-LG
W/0
002
--
--
--
--
--
GA
L141
Roa
dway
Impr
ovem
ents
CIP
200
86.
0▼
Star
t/Fin
ish
+1 Y
ear
Com
pare
d to
CIP
2008►
--
--
1.0
▼St
art/F
inis
h -1
Yea
r C
ompa
red
to C
IP20
09►
--
--
GA
L005
Pier
1C
IP 2
008
80.7
▲St
art/F
inis
h +1
Yea
r C
ompa
red
to C
IP20
08►
LGW
/000
9LG
W/0
010
Turn
off
Trig
ger
▼-
-Pr
ojec
t red
evel
oped
in
conj
unct
ion
with
ST
Bag
gage
►-
--
-
GA
L142
Sout
hern
For
ecou
rt E
nhan
cem
ents
CIP
200
8-
▼-
-LG
W/0
013
--
--
--
--
--
GA
L153
Alp
ha H
old
(Tax
iway
& H
olds
, JA
Z)C
IP 2
009
20.0
▲-
-LG
W/0
006
--
0.2
▼St
art/F
inis
h -1
Yea
r C
ompa
red
to C
IP20
09◄
--
--
GA
L149
Sout
h Te
rmin
al Im
mig
ratio
nC
IP 2
009
10.5
▲-
-LG
W/0
001
LGW
/000
2-
-6.
4▼
Star
t/Fin
ish
-1 Y
ear
Com
pare
d to
CIP
2009
◄-
--
-
Oth
er P
roje
cts
CIP
200
84.
7▼
--
--
--
21.9
▲-
--
--
-
GA
L154
Sout
h Te
rmin
al A
rriv
als
Con
cour
se R
econ
figur
atio
nC
IP 2
009
1.2
▲-
--
--
-5.
8▲
Star
t/Fin
ish
+1 Y
ear
Com
pare
d to
CIP
2009
►-
--
-
GA
L150
Nor
th T
erm
inal
For
ecou
rt (N
TF)
CIP
200
97.
1▲
--
LGW
/000
3LG
W/0
004
LGW
/000
7LG
W/0
019
--
7.7
--
--
--
-
GA
L151
Nor
th T
erm
inal
Inte
rcha
nge
(NTI
)C
IP 2
009
21.8
▲-
-
LGW
/000
3LG
W/0
004
LGW
/000
5LG
W/0
008
LGW
/001
9
--
24.6
▲-
--
--
-
GA
L159
& G
AL13
5IT
Tra
nsfo
rmat
ion
CIP
201
0-
--
--
--
-44
.3▲
--
--
--
GA
L155
Sout
h Te
rmin
al S
ecur
ityC
IP 2
010
--
--
--
--
45.0
▲-
--
--
-G
AL1
60Po
nd D
Reh
abili
tatio
nC
IP 2
010
--
--
--
--
8.3
▲-
--
--
-G
AL1
61R
iver
Mol
e Fl
ood
Alle
viat
ion
CIP
201
0-
--
--
--
-2.
8▲
--
--
--
GA
L162
Pollu
tion
Lago
onC
IP 2
010
--
--
--
--
1.3
▲-
--
--
-G
AL1
63N
orth
Ter
min
al C
anop
y &
Pav
ing
Low
er F
orec
ourt
CIP
201
0-
--
--
--
-1.
4▲
--
--
--
GA
L157
Nor
th T
erm
inal
Sec
urity
CIP
201
0-
--
--
--
-5.
0▲
--
LGW
/003
0-
--
GA
L156
Julie
t Kin
kC
IP 2
010
--
--
--
--
3.1
▲-
--
--
-G
AL1
64Ta
xiw
ay L
ima
CIP
2010
--
--
--
--
2.8
▲-
--
--
-G
AL1
65 &
GAL
166
Taxi
way
s Pa
pa &
Nov
embe
rC
IP20
10-
--
--
--
-4.
0 +
4.0
▲-
--
--
-G
AL1
67R
ail S
tatio
n C
ontr
ibut
ion
CIP
2010
--
--
--
--
1.1
▲-
--
--
-G
AL1
68Sn
ow E
quip
men
tC
IP20
10-
--
--
--
-7.
3▲
--
--
--
Q6
Dev
elop
men
tC
IP20
10-
--
--
--
-10
.0▲
--
--
--
GA
L169
Nor
th T
erm
inal
Ear
ly B
ag S
tore
CIP
2011
--
--
--
--
--
--
--
--
GA
L170
Nor
th T
erm
inal
Bag
gage
Voi
dsC
IP20
11-
--
--
--
--
--
--
--
-G
AL1
72A
380
On
Pier
C
IP20
11-
--
--
--
--
--
--
--
-G
AL1
73A
irfie
ld P
eak
Cap
acity
Exp
ansi
onC
IP20
11-
--
--
--
--
--
--
--
-G
AL1
74C
rew
Rep
ortin
g
CIP
2011
--
--
--
--
--
--
--
--
GA
L175
Sout
h Te
rmin
al D
omes
tic A
rriv
als
CIP
2011
--
--
--
--
--
--
--
--
GA
L176
aN
orth
Ter
min
al ID
L R
econ
figur
atio
nC
IP20
11-
--
--
--
--
--
--
--
-G
AL1
76b
Sout
h Te
rmin
al ID
L R
econ
figur
atio
nC
IP20
11-
--
--
--
--
--
--
--
-G
AL1
77Fa
cilit
ies
Ass
et S
tew
ards
hip
CIP
2011
--
--
--
--
--
--
--
--
GA
L178
Com
mer
cial
Ass
et S
tew
ards
hip
CIP
2011
--
--
--
--
--
--
--
--
GA
L179
Airf
ield
Ass
et S
tew
ards
hip
CIP
2011
--
--
--
--
--
--
--
--
Q5+
1 C
ompl
ianc
e Pr
ojec
tsC
IP20
11-
--
--
--
--
--
--
--
-Q
5+1
Oth
er P
roje
cts
<£5.
0 m
illio
nC
IP20
11-
--
--
--
--
--
--
--
-
All V
alue
s in
out
-turn
cos
ts
2009
2010
Tota
l Q5
Spe
nd
(£ m
illio
ns, o
ut-tu
rn)
Prog
ram
me
Cha
nge
Cha
nge
Con
trol
Rec
ord
Shee
t (C
CR
S)Tr
igge
r Cha
nge
(CAA
App
rove
d)To
tal Q
5 S
pend
(£
mill
ions
, out
-turn
)Pr
ogra
mm
e C
hang
eC
hang
e C
ontr
ol R
ecor
d Sh
eet
(CC
RS)
Trig
ger C
hang
e (C
AA A
ppro
ved)
APPENDIx C2CHANGES TO INVESTMENT pROGRAMME - TRACkER (2009 - 2010)
c
95


GAL
No
Nam
eFi
rst A
ppea
red
GA
L146
Port
als
(Sta
ndar
disa
tion
ATI
X)C
IP 2
008
--
--
--
--
--
--
--
--
GA
L147
Dig
ital M
edia
Upg
rade
CIP
200
83.
4▲
--
--
--
3.4
--
--
--
-G
AL1
28O
pera
tiona
l Eff
icie
ncy
Prog
ram
me
CIP
200
812
.1▼
--
--
--
12.1
--
--
--
-G
AL0
96c
Nor
ther
n R
unw
ay R
esur
face
CIP
200
8-
--
--
--
--
--
--
--
-G
AL0
27In
ter T
erm
inal
Shu
ttle
CIP
200
836
.0-
--
--
--
36.0
--
--
--
-G
AL0
31b
Sout
h Te
rmin
al F
ire P
rote
ctio
n Sy
stem
CIP
200
814
.4-
--
--
--
14.7
--
--
--
-
GA
L144
Sout
h Te
rmin
al T
unne
l Sec
urity
& R
oad
Cap
acity
CIP
200
82.
2-
Star
t/Fin
ish
+1 Y
ear
Com
pare
d to
CIP
2009►
--
--
2.2
--
--
--
-
GA
L039
Gro
und
Run
Pen
CIP
200
8-
--
--
--
--
--
--
--
-G
AL1
45So
uth
Term
inal
Tun
nel R
efur
bish
men
tC
IP 2
008
1.1
▼-
--
--
-1.
1-
--
--
--
GA
L133
Add
ition
al S
ecur
ity C
apac
ityC
IP 2
008
--
--
--
--
--
--
--
--
GA
L080
DEE
Pro
gram
me
CIP
200
8-
--
--
--
--
--
--
--
-G
AL0
34b
FID
SC
IP 2
008
--
--
--
--
--
--
--
--
GA
L041
Load
ing
Brid
ge P
rogr
amm
eC
IP 2
008
--
--
--
--
--
--
--
--
GA
L070
bN
orth
Ter
min
al T
oile
t Ref
urbi
shm
ent P
rogr
amm
eC
IP 2
008
--
--
--
--
--
--
--
--
GA
L067
bN
orth
Ter
min
al A
dditi
onal
Bag
gage
Cap
acity
CIP
200
8-
--
--
--
--
--
--
--
-
GA
L063
Secu
rity
Dev
elop
men
t Pro
gram
me
CIP
200
86.
7-
Star
t/Fin
ish
+1 Y
ear
Com
pare
d to
CIP
2009►
--
--
6.7
--
--
--
-
GA
L069
Sout
h Te
rmin
al D
epar
ture
Lou
nge
Cap
acity
CIP
200
819
.8-
--
--
--
19.8
--
--
--
-
GA
L058
Tele
com
ms
Prog
ram
me
(Dat
a &
Voi
ce)
CIP
200
81.
0▼
Star
t/Fin
ish
-1 Y
ear
Com
pare
d to
CIP
2009◄
--
--
1.0
--
--
--
-
GA
L124
Ass
et R
epla
cem
ent P
rogr
amm
eC
IP 2
008
56.0
--
--
--
-56
.0-
--
--
--
GA
L131
Airf
ield
Ass
etC
IP 2
008
7.3
▲-
--
--
-7.
3-
--
--
--
GA
L143
Cle
an, W
orki
ng &
Frie
ndly
CIP
200
813
.3▼
--
--
--
13.3
--
--
--
-M
inor
Pro
ject
sC
IP 2
008
8.5
--
--
--
-8.
5▲
--
--
--
GA
L096
Airf
ield
Pro
gram
me
incl
udin
g R
unw
ay R
esur
faci
ngC
IP 2
008
46.3
▲St
art/F
inis
h +1
Yea
r C
ompa
red
to C
IP20
09►
--
--
58.3
▲-
--
--
-
GA
L126
Com
mer
cial
and
Pro
pert
y Pr
ogra
mm
eC
IP 2
008
27.0
▲-
--
--
-27
.0-
--
--
--
GA
L135
IT P
rogr
amm
eC
IP 2
008
--
--
--
--
--
--
--
--
GA
L116
& G
AL11
7N
orth
Ter
min
al E
xten
sion
(NTX
)C
IP 2
008
68.9
▼-
--
-Sc
ope
Cha
nge
-75
.5▲
--
LGW
/004
2LG
W/0
059
-D
ate
Cha
nge
-
GA
L134
Nor
th T
erm
inal
Add
ition
al P
ier S
ervi
ceC
IP 2
008
73.6
▼St
art/F
inis
h -1
Yea
r C
ompa
red
to C
IP20
09◄
--
--
12.5
▼St
art/F
inis
h +1
Yea
r C
ompa
red
to C
IP20
09►
--
--
GA
L136
Airl
ine
Rel
ocat
ions
CIP
200
8-
--
--
--
--
--
--
--
-G
AL1
25 &
GAL
005
Sout
h Te
rmin
al B
agga
ge F
acto
ry &
Pie
r 1C
IP 2
008
91.6
▼-
--
--
-13
6.4
▲-
-LG
W/0
035
--
-
GA
L137
Nor
th T
erm
inal
Bag
gage
Upg
rade
CIP
200
839
.6▲
Star
t/Fin
ish
+1 Y
ear
Com
pare
d to
CIP
2009►
LGW
/002
6-
--
39.6
--
--
--
-
GA
L115
Nor
th T
erm
inal
Sho
rt T
erm
Car
Par
king
(MSC
P6)
CIP
200
816
.9▼
--
--
Scop
e C
hang
e-
16.9
--
--
--
-
GA
L109
Nor
th W
est Z
one
CIP
200
839
.6▼
Star
t/Fin
ish
-1 Y
ear
Com
pare
d to
CIP
2009◄
--
--
39.6
--
--
--
-
GA
L111
Stan
d R
econ
figur
atio
nsC
IP 2
008
14.2
--
--
--
-82
.5▲
Star
t/Fin
ish
-1 Y
ear
Com
pare
d to
CIP
2009
◄LG
W/0
0354
--
-
GA
L122
Sout
h Te
rmin
al L
ands
ide
CIP
200
821
.6▼
--
--
--
21.6
--
--
--
-G
AL1
20So
uth
Term
inal
For
ecou
rtC
IP 2
008
29.7
▼-
--
-Sc
ope/
Dat
e C
hang
e-
31.1
--
-LG
W/0
035
--
-G
AL1
38Ea
rly B
ag S
tore
CIP
200
8-
--
--
--
--
--
--
--
-G
AL1
39Pi
er 4
Mod
ifica
tions
CIP
200
8-
--
--
--
--
--
--
--
-G
AL1
40Pi
er 2
Mod
ifica
tions
C
IP 2
008
39.1
▼-
-LG
W/0
028
--
-40
.3-
--
LGW
/003
7-
--
GA
L152
Pier
3 M
odifi
catio
ns
CIP
200
9-
--
--
--
--
--
--
--
-G
AL1
32So
uth
Term
inal
Airs
ide
CIP
200
8-
--
--
--
--
--
--
--
-
GA
L141
Roa
dway
Impr
ovem
ents
CIP
200
81.
0▼
Star
t/Fin
ish
-1 Y
ear
Com
pare
d to
CIP
2009►
--
--
1.0
--
--
--
-
GA
L005
Pier
1C
IP 2
008
--
Proj
ect r
edev
elop
ed in
co
njun
ctio
n w
ith S
T B
agga
ge►
--
--
--
--
--
--
GA
L142
Sout
hern
For
ecou
rt E
nhan
cem
ents
CIP
200
8-
--
--
--
--
--
--
--
-
GA
L153
Alp
ha H
old
(Tax
iway
& H
olds
, JA
Z)C
IP 2
009
0.2
▼St
art/F
inis
h -1
Yea
r C
ompa
red
to C
IP20
09◄
--
--
0.2
--
--
--
-
GA
L149
Sout
h Te
rmin
al Im
mig
ratio
nC
IP 2
009
6.4
▼St
art/F
inis
h -1
Yea
r C
ompa
red
to C
IP20
09◄
--
--
6.4
--
--
--
-
Oth
er P
roje
cts
CIP
200
821
.9▲
--
--
--
27.0
▲-
--
--
-
GA
L154
Sout
h Te
rmin
al A
rriv
als
Con
cour
se R
econ
figur
atio
nC
IP 2
009
5.8
▲St
art/F
inis
h +1
Yea
r C
ompa
red
to C
IP20
09►
--
--
5.8
--
--
--
-
GA
L150
Nor
th T
erm
inal
For
ecou
rt (N
TF)
CIP
200
97.
7-
--
--
--
7.7
--
--
--
-G
AL1
51N
orth
Ter
min
al In
terc
hang
e (N
TI)
CIP
200
924
.6▲
--
--
--
24.6
--
--
--
-
GA
L159
& G
AL13
5IT
Tra
nsfo
rmat
ion
CIP
201
044
.3▲
--
--
--
48.1
▲-
-
LGW
/004
4LG
W/0
045
LGW
/004
6LG
W/0
047
LGW
/004
8LG
W/0
049
LGW
/005
0LG
W/0
053
--
-
GA
L155
Sout
h Te
rmin
al S
ecur
ityC
IP 2
010
45.0
▲-
--
--
-48
.0-
--
LGW
/003
6-
Turn
on
new
Trig
ger
-G
AL1
60Po
nd D
Reh
abili
tatio
nC
IP 2
010
8.3
▲-
--
--
-8.
3-
--
--
--
GA
L161
Riv
er M
ole
Floo
d A
llevi
atio
nC
IP 2
010
2.8
▲-
--
--
-2.
8-
--
--
--
GA
L162
Pollu
tion
Lago
onC
IP 2
010
1.3
▲-
--
--
-1.
3-
--
--
--
GA
L163
Nor
th T
erm
inal
Can
opy
& P
avin
g Lo
wer
For
ecou
rtC
IP 2
010
1.4
▲-
--
--
-1.
4-
--
--
--
GA
L157
Nor
th T
erm
inal
Sec
urity
CIP
201
05.
0▲
--
LGW
/003
0-
--
12.8
▲St
art/F
inis
h -1
Yea
r C
ompa
red
to C
IP20
09◄
LGW
/005
7-
--
GA
L156
Julie
t Kin
kC
IP 2
010
3.1
▲-
--
--
-3.
1-
--
--
--
GA
L164
Taxi
way
Lim
aC
IP20
102.
8▲
--
--
--
2.8
--
--
--
-G
AL1
65 &
GAL
166
Taxi
way
s Pa
pa &
Nov
embe
rC
IP20
104.
0 +
4.0
▲-
--
--
-8.
0-
--
LGW
/003
9-
--
GA
L167
Rai
l Sta
tion
Con
trib
utio
nC
IP20
101.
1▲
--
--
--
7.6
▲-
--
--
-G
AL1
68Sn
ow E
quip
men
tC
IP20
107.
3▲
--
--
--
7.3
--
-LG
W/0
055
--
-Q
6 D
evel
opm
ent
CIP
2010
10.0
▲-
--
--
-10
.0-
--
--
--
GA
L169
Nor
th T
erm
inal
Ear
ly B
ag S
tore
CIP
2011
--
--
--
--
13.0
▲-
-LG
W/0
060
--
-G
AL1
70N
orth
Ter
min
al B
agga
ge V
oids
CIP
2011
--
--
--
--
2.4
▲-
-LG
W/0
061
--
-G
AL1
72A
380
On
Pier
C
IP20
11-
--
--
--
-5.
0▲
--
--
--
GA
L173
Airf
ield
Pea
k C
apac
ity E
xpan
sion
CIP
2011
--
--
--
--
7.0
▲-
--
--
-G
AL1
74C
rew
Rep
ortin
g
CIP
2011
--
--
--
--
12.0
▲-
--
--
-G
AL1
75So
uth
Term
inal
Dom
estic
Arr
ival
sC
IP20
11-
--
--
--
-9.
5▲
--
--
--
GA
L176
aN
orth
Ter
min
al ID
L R
econ
figur
atio
nC
IP20
11-
--
--
--
-7.
0▲
--
--
--
GA
L176
bSo
uth
Term
inal
IDL
Rec
onfig
urat
ion
CIP
2011
--
--
--
--
20.0
▲-
--
--
-G
AL1
77Fa
cilit
ies
Ass
et S
tew
ards
hip
CIP
2011
--
--
--
--
23.6
▲-
--
--
-G
AL1
78C
omm
erci
al A
sset
Ste
war
dshi
p C
IP20
11-
--
--
--
-6.
0▲
--
--
--
GA
L179
Airf
ield
Ass
et S
tew
ards
hip
CIP
2011
--
--
--
--
14.6
▲-
--
--
-Q
5+1
Com
plia
nce
Proj
ects
CIP
2011
--
--
--
--
17.6
▲-
--
--
-Q
5+1
Oth
er P
roje
cts
<£5.
0 m
illio
nC
IP20
11-
--
--
--
-19
.5▲
--
--
--
Tota
l Q5
(ext
ende
d) S
pend
(£
mill
ions
, out
-turn
)Pr
ogra
mm
e C
hang
eC
hang
e C
ontr
ol R
ecor
d Sh
eet
(CC
RS)
Trig
ger C
hang
e (C
AA A
ppro
ved)
All V
alue
s in
out
-turn
cos
ts
2010
2011
Tota
l Q5
Spe
nd
(£ m
illio
ns, o
ut-tu
rn)
Prog
ram
me
Cha
nge
Cha
nge
Con
trol
Rec
ord
Shee
t Tr
igge
r Cha
nge
(CAA
App
rove
d)
APPENDIx C3CHANGES TO INVESTMENT pROGRAMME - TRACkER (2010 - 2011)
c
97


GAL
No
Nam
eFi
rst
Appe
ared
GA
L146
Port
als
(Sta
ndar
disa
tion
ATI
X)C
IP 2
008
--
--
--
--
--
--
--
GA
L147
Dig
ital M
edia
Upg
rade
CIP
200
83.
4-
--
--
2.5
--
--
--
-G
AL1
28O
pera
tiona
l Effi
cien
cy P
rogr
amm
eC
IP 2
008
12.1
--
--
-12
.1-
--
--
--
GA
L096
cN
orth
ern
Run
way
Res
urfa
ceC
IP 2
008
--
--
--
--
--
--
--
GA
L027
Inte
r Ter
min
al S
huttl
eC
IP 2
008
36.0
--
--
-36
.7-
--
--
--
GA
L031
bSo
uth
Term
inal
Fire
Pro
tect
ion
Syst
emC
IP 2
008
14.7
--
--
-14
.4▼
--
--
--
GA
L144
Sout
h Te
rmin
al T
unne
l Sec
urity
& R
oad
Cap
acity
CIP
200
82.
2-
--
--
2.2
--
--
--
-G
AL0
39G
roun
d R
un P
enC
IP 2
008
--
--
--
--
--
--
--
GA
L145
Sout
h Te
rmin
al T
unne
l Ref
urbi
shm
ent
CIP
200
81.
1-
--
--
1.2
--
--
--
-G
AL1
33A
dditi
onal
Sec
urity
Cap
acity
CIP
200
8-
--
--
--
--
--
--
-G
AL0
80D
EE P
rogr
amm
eC
IP 2
008
--
--
--
--
--
--
--
GA
L034
bFI
DS
CIP
200
8-
--
--
--
--
--
--
-G
AL0
41Lo
adin
g B
ridge
Pro
gram
me
CIP
200
8-
--
--
--
--
--
--
-G
AL0
70b
Nor
th T
erm
inal
Toi
let R
efur
bish
men
t Pro
gram
me
CIP
200
8-
--
--
--
--
--
--
-G
AL0
67b
Nor
th T
erm
inal
Add
ition
al B
agga
ge C
apac
ityC
IP 2
008
--
--
--
--
--
--
--
GA
L063
Secu
rity
Dev
elop
men
t Pro
gram
me
CIP
200
86.
7-
--
--
6.5
--
--
--
-G
AL0
69So
uth
Term
inal
Dep
artu
re L
oung
e C
apac
ityC
IP 2
008
19.8
--
--
-19
.8-
--
--
--
GA
L058
Tele
com
ms
Prog
ram
me
(Dat
a &
Voi
ce)
CIP
200
81.
0-
--
--
1.0
--
--
--
-
GA
L124
Ass
et R
epla
cem
ent P
rogr
amm
eC
IP 2
008
56.0
--
--
-62
.5▲
Scop
e C
hang
e
- TB
F H
BS
-LG
W /0
083
--
GA
L131
Airf
ield
Ass
etC
IP 2
008
7.3
--
--
-5.
0-
--
--
--
GA
L143
Cle
an, W
orki
ng &
Frie
ndly
CIP
200
813
.3-
--
--
15.4
--
--
--
-M
inor
Pro
ject
sC
IP 2
008
8.5
▲-
--
--
--
--
--
-
GA
L096
Airf
ield
Pro
gram
me
incl
udin
g R
unw
ay R
esur
faci
ngC
IP 2
008
58.3
▲-
--
-61
.5▲
--
--
--
GA
L126
Com
mer
cial
and
Pro
pert
y Pr
ogra
mm
eC
IP 2
008
27.0
--
--
-25
.9▼
Scop
e C
hang
e
-LG
W/0
093
--
-
GA
L135
IT P
rogr
amm
eC
IP 2
008
--
--
--
--
--
--
--
GA
L116
& G
AL1
17N
orth
Ter
min
al E
xten
sion
(NTX
)C
IP 2
008
75.5
▲-
-LG
W/0
042
LGW
/005
9D
ate
Cha
nge
85.9
▲-
--
--
GA
L134
Nor
th T
erm
inal
Add
ition
al P
ier S
ervi
ceC
IP 2
008
12.5
▼St
art/F
inis
h +1
Ye
ar C
ompa
red
to C
IP20
09►
--
7.1
▼-
--
-
GA
L136
Airl
ine
Rel
ocat
ions
CIP
200
8-
--
--
--
--
--
--
-
GA
L125
& G
AL0
05So
uth
Term
inal
Bag
gage
Fac
tory
& P
ier 1
CIP
200
813
6.4
▲-
-LG
W/0
035
-11
6.4
▼C
onfir
mat
ion
of P
refe
rred
sc
ope
-LG
W/0
062
--
-
GA
L137
Nor
th T
erm
inal
Bag
gage
Upg
rade
CIP
200
839
.6-
--
--
50.2
▲Sc
ope
Cha
nge
-
LGW
/ 008
4 - 0
092
( 9 N
os C
CR
Ss)
--
-
GA
L115
Nor
th T
erm
inal
Sho
rt T
erm
Car
Par
king
(MSC
P6)
CIP
200
816
.9-
--
--
16.9
--
--
--
-G
AL1
09N
orth
Wes
t Zon
eC
IP 2
008
39.6
--
--
-39
.1▼
--
--
--
GA
L111
Nor
th T
erm
inal
Add
ition
al P
ier S
ervi
ce -
Pier
5
(pre
viou
sly
' Sta
nd R
econ
figur
atio
n' )
CIP
200
882
.5▲
Star
t/Fin
ish
-1
Year
Com
pare
d to
CIP
2009
◄LG
W/0
0354
-72
.9▼
Con
firm
atio
n of
Fin
al s
cope
-LG
W/0
077
--
-
GA
L122
Sout
h Te
rmin
al L
ands
ide
CIP
200
821
.6-
--
--
17.2
▼-
--
--
-G
AL1
20So
uth
Term
inal
For
ecou
rtC
IP 2
008
31.1
--
-LG
W/0
035
-30
.3▼
--
--
-G
AL1
38Ea
rly B
ag S
tore
CIP
200
8-
--
--
--
--
--
--
-G
AL1
39Pi
er 4
Mod
ifica
tions
CIP
200
8-
--
--
--
--
--
--
-G
AL1
40Pi
er 2
Mod
ifica
tions
C
IP 2
008
40.3
--
-LG
W/0
037
-38
.1▼
--
--
-G
AL1
52Pi
er 3
Mod
ifica
tions
C
IP 2
009
--
--
--
--
--
--
--
GA
L132
Sout
h Te
rmin
al A
irsid
eC
IP 2
008
--
--
--
--
--
--
--
GA
L141
Roa
dway
Impr
ovem
ents
CIP
200
81.
0-
--
--
1.0
--
--
--
-G
AL0
05Pi
er 1
CIP
200
8-
--
--
--
--
--
--
-G
AL1
42So
uthe
rn F
orec
ourt
Enh
ance
men
tsC
IP 2
008
--
--
--
--
--
--
--
GA
L153
Alp
ha H
old
(Tax
iway
& H
olds
, JA
Z)C
IP 2
009
0.2
--
--
-0.
2-
--
--
--
GA
L149
Sout
h Te
rmin
al Im
mig
ratio
nC
IP 2
009
6.4
--
--
-6.
4-
--
LGW
/006
4
LGW
/006
5
LG
W/0
081
--
-
Oth
er P
roje
cts
CIP
200
827
.0▲
--
--
-▲
--
--
--
GA
L154
Sout
h Te
rmin
al A
rriv
als
Con
cour
se R
econ
figur
atio
nC
IP 2
009
5.8
--
--
-7.
6-
--
--
--
GA
L150
Nor
th T
erm
inal
For
ecou
rt (N
TF)
CIP
200
97.
7-
--
--
11.4
--
--
--
-G
AL1
51N
orth
Ter
min
al In
terc
hang
e (N
TI)
CIP
200
924
.6-
--
--
24.6
--
--
--
-
GA
L159
& G
AL1
35IT
Tra
nsfo
rmat
ion
CIP
201
048
.1▲
--
LGW
/004
4LG
W/0
045
LGW
/004
6-
48.1
--
-LG
W/0
071
LGW
/007
2-
--
GA
L155
Sout
h Te
rmin
al S
ecur
ityC
IP 2
010
48.0
--
-LG
W/0
036
Turn
on
new
Tr
igge
r52
.3▲
Scop
e C
hang
e
-LG
W/0
073
LG
W/0
074
--
GA
L160
Pond
D R
ehab
ilita
tion
CIP
201
08.
3-
--
--
8.3
--
--
--
-G
AL1
61R
iver
Mol
e Fl
ood
Alle
viat
ion
CIP
201
02.
8-
--
--
4.0
--
--
--
-G
AL1
62Po
llutio
n La
goon
CIP
201
01.
3-
--
--
1.3
--
--
--
-
GA
L163
Nor
th T
erm
inal
Can
opy
& P
avin
g Lo
wer
For
ecou
rtC
IP 2
010
1.4
--
--
-1.
4-
--
--
--
GA
L157
Nor
th T
erm
inal
Sec
urity
CIP
201
012
.8▲
Star
t/Fin
ish
-1
Year
Com
pare
d to
CIP
2009
◄LG
W/0
057
-11
.5▼
--
--
GA
L156
Julie
t Kin
kC
IP 2
010
3.1
--
--
-3.
1-
--
--
--
GA
L164
Taxi
way
Lim
aC
IP20
102.
8-
--
--
2.6
--
--
--
-G
AL1
65 &
GA
L166
Taxi
way
s Pa
pa &
Nov
embe
rC
IP20
108.
0-
--
LGW
/003
9-
7.3
▼-
--
--
GA
L167
Rai
lway
Con
trib
utio
nC
IP20
107.
6▲
--
--
7.6
--
--
--
-G
AL1
68Sn
ow E
quip
men
tC
IP20
107.
3-
--
LGW
/005
5-
11.7
▲-
--
--
GA
L169
Nor
th T
erm
inal
Ear
ly B
ag S
tore
CIP
2011
13.0
▲-
-LG
W/0
060
-0.
4▼
Def
erre
d to
B
eyon
d Q
5-
LGW
/008
2-
--
GA
L170
Nor
th T
erm
inal
Bag
gage
Voi
dsC
IP20
112.
4▲
--
LGW
/006
1-
3.2
▲-
--
--
GA
L171
A38
0 O
n Pi
er
CIP
2011
5.0
▲-
--
-6.
5▲
--
LGW
/006
7-
--
GA
L172
Airf
ield
Pea
k C
apac
ity E
xpan
sion
CIP
2011
7.0
▲-
--
-7.
0▲
--
--
--
GA
L173
Cre
w R
epor
ting
C
IP20
1112
.0▲
--
--
12.0
--
--
--
-G
AL1
74So
uth
Term
inal
Dom
estic
Arr
ival
sC
IP20
119.
5▲
--
--
9.5
--
--
--
-G
AL1
75a
Nor
th T
erm
inal
IDL
Rec
onfig
urat
ion
CIP
2011
7.0
▲-
--
-10
.2▲
--
--
--
GA
L175
bSo
uth
Term
inal
IDL
Rec
onfig
urat
ion
CIP
2011
20.0
▲-
--
-24
.4▲
--
--
--
GA
L176
Faci
litie
s A
sset
Ste
war
dshi
p C
IP20
1123
.6▲
--
--
18.9
▼Sc
ope
Cha
nge
LGW
/006
6
LG
W /0
094
-
-
GA
L177
Com
mer
cial
Ass
et S
tew
ards
hip
CIP
2011
6.0
▲-
--
-4.
7▼
--
--
--
GA
L178
Airf
ield
Ass
et S
tew
ards
hip
CIP
2011
14.6
▲-
--
-15
.0▲
--
--
--
GA
L179
Airf
ield
Ope
ratio
ns B
uild
ing
CIP
2012
--
--
7.9
▲N
ew P
roje
ct-
LGW
/008
0-
--
GA
L180
Q5
Min
or P
roje
cts
Prog
ram
me
<£5.
0 m
illio
nC
IP20
1119
.5▲
--
--
9.3
▼Pr
ogra
mm
e-
--
--
GA
L181
Bey
ond
Q5
Dev
elop
men
tC
IP20
1010
.0-
--
--
10.0
--
-LG
W/0
079
--
GA
L182
Q5+
1 M
inor
Pro
ject
s Pr
ogra
mm
eC
IP20
1119
.537
.1▲
Prog
ram
me
GA
L183
Floo
d A
llevi
atio
n Pr
ogra
mm
eC
IP20
128.
2-
Prog
ram
me
Tota
l Q5
(ext
ende
d) S
pend
(£
mill
ions
, out
-turn
)Pr
ogra
mm
e C
hang
eC
hang
e C
ontr
ol R
ecor
d Sh
eet
(CC
RS)
Trig
ger C
hang
e (C
AA A
ppro
ved)
All V
alue
s in
out
-turn
cos
ts
2011
2012
Tota
l Q5
(ext
ende
d) S
pend
(£
mill
ions
, out
-turn
)Pr
ogra
mm
e C
hang
eC
hang
e C
ontr
ol
Rec
ord
Shee
t (C
CR
S)
Trig
ger
Cha
nge
(CAA
Ap
prov
ed)
APPENDIx C4CHANGES TO INVESTMENT pROGRAMME - TRACkER (2011 - 2012)
c
99


101
YearDecember 2010 May 2011
Low Base High Low Base High
Q5
2008/09 (actual) 33.1 33.1 33.1 33.1 33.1 33.1
2009/10 (actual) 32.4 32.4 32.4 32.4 32.4 32.4
2010/11 (actual) 33.4 33.4 33.4 31.6 31.6 31.6
2011/12 33.6 34.0 34.2 32.5 33.3 33.9
2012/13 34.3 35.2 35.3 32.8 34.1 35.2
2013/14 35.1 36.0 36.4 33.1 34.9 36.3
2014/15 35.8 37.2 37.7 33.6 35.6 37.4
2015/16 36.6 38.2 38.8 34.1 36.3 38.6
2016/17 37.3 39.2 40.0 34.6 37.1 40.0
2017/18 38.1 40.2 41.2 35.0 37.9 41.6
2018/19 - - - 35.5 38.7 42.2
Growth Rate p.a. (Q5) 1.6% 3.4% 4.7%
Growth Rate p.a. (2014/15 - 2018/19)
2.1% 2.8% 3.1% 1.4% 2.1% 3.1%
Year
May 2011
Passenger ATMs Base Case
Low Base High CATM Non-ATM
Q5
2008/09 (actual) - - - - -
2009/10 (actual) 244.4 244.4 244.4 0.06 6.8
2010/11 (actual) 235.6 235.6 235.6 0.16 6.8
2011/12 241.4 247.0 251.3 0.14 6.8
2012/13 241.4 251.3 259.4 0.12 6.8
2013/14 242.3 255.2 265.3 0.10 6.8
2014/15 244.0 258.2 271.1 0.09 6.7
2015/16 245.0 261.2 277.4 0.08 6.7
2016/17 246.3 264.1 285.0 0.07 6.7
2017/18 247.5 267.6 291.2 0.06 6.7
2018/19 248.8 271.3 293.1 0.05 6.7
Growth Rate p.a. (Q5) 0.9% 2.7% 4.0% - -
Growth Rate p.a. (2014/15 - 2018/19)
0.5% 1.2% 2.0% - -
CIP 2011
CIP2011 Annual Passenger Forecasts (millions) Published January 2012
CIP2011 Annual Aircraft Movements (thousands)
DAPPENDIx DpREVIOUS TRAFFIC FORECASTS

102
YearMay 2010
Base High Low
Q5
2008/09 (actual) 33.1 33.1 33.1
2009/10 (actual) 32.4 32.4 32.4
2010/11 33.4 33.4 33.4
2011/12 35.5 35.8 34.9
2012/13 36.6 37.2 35.8
Q6
2013/14 37.7 38.7 36.5
2014/15 38.8 40.0 37.3
2015/16 39.8 41.2 38.1
2016/17 40.8 42.5 38.7
2017/18 41.8 43.9 39.4
Growth Rate p.a. (Q6) 2.6% 3.2% 2.0%
Dec 2010
Base High Low
34.0 34.2 33.6
35.2 35.3 34.3
36.0 36.4 35.1
37.2 37.7 35.8
38.2 38.8 36.6
39.2 40.0 37.3
40.2 41.2 38.1
2.8% 3.1% 2.1%
CIP 2010
CIP 2010 Annual Passenger Forecasts (millions) - Published
January 2011
Year Q5 Q6
2008/09 actual 33.1 -
2009/10 33.0 -
2010/11 34.5 -
2011/12 35.5 -
2012/13 36.5 -
2013/14 - 37.3
2014/15 38.0
2015/16 - 38.0
2016/17 - 38.5
2017/18 - 39.0
CIP 2009
CIP 2009 Annual Passenger Forecasts
(millions)
Year PATMs CATMs Non - A TOTAL
2008/09 actual 250.3 0.2 7.1 257.6
2009/10 246.9 0.1 7.1 254.1
2010/11 255.0 0.1 7.1 262.2
2011/12 262.1 0.1 7.0 269.2
2012/13 266.4 0.1 7.0 273.5
2013/14 269.5 0.1 7.0 276.6
2014/15 270.3 0.1 7.0 277.4
2015/16 271.3 0.1 6.5 277.9
2016/17 271.9 0.1 6.5 278.5
2017/18 272.4 0.1 6.5 279.0
CIP 2009 Annual Aircraft Movements (000s)
DAPPENDIx DpREVIOUS TRAFFIC FORECASTS

103
Year BAA / Airlines Q5 CAA Q5 BAA Q6
2008/09 35.1 – 36.2 35.9 -
2009/10 35.7 – 36.6 36.4 -
2010/11 36.0 – 37.0 36.8 -
2011/12 37.1 – 37.5 37.2 -
2012/13 37.4 – 38.2 37.7 -
2013/14 - - 37.8
2014/15 - - 38.3
2015/16 - - 38.8
2016/17 - - 39.3
2017/18 - - 39.7
CIP 2008
CIP 2008 Annual Passenger Forecasts
(millions)
Year PATMs CATMs Non - AT TOTAL
2008/09 264.6 0.1 7.8 272.5
2009/10 267.7 0.1 7.5 275.3
2010/11 268.7 0.1 7.2 276.0
2011/12 273.2 0.1 7.2 280.5
2012/13 272.7 0.1 7.2 280.0
2013/14 272.7 0.1 7.2 280.0
2014/15 272.7 0.1 7.2 280.0
2015/16 273.8 0.1 6.5 280.4
2016/17 273.4 0.1 6.5 280.0
2017/18 273.4 0.1 6.5 280.0
CIP 2008 Annual Aircraft Movements
(000s)
Definitions:PATM = Passenger Air Transport Movements i.e. commercial passenger flightsCATM = Cargo Air Transport Movements i.e. commercial cargo flightNATM = Non-commercial flights e.g. General Aviation, Air Taxi
DAPPENDIx DpREVIOUS TRAFFIC FORECASTS


105
Date Meeting Discussion / Items on the Agenda
03 January 2012 South Terminal Stakeholder Working Group Discuss impacts of construction work to airport and airlinesoperations. Advise of upcoming planned work and majorworks over the next 5 weeks.
04 January 2012 North Terminal Stakeholder Working Group NT projects construction work impacts for safety, disruptionover previous week, communication of planned work forfollowing week and discussion of planned works for thefollowing 5 weeks.
05 January 2012 GAL/AOC Executive Airlinks. UKBA. Crew Access. Publication of CommerciallySensitive Data. Airfield Operational Efficiency. Baggage Hall.PRMs. Baggage Gauges. Premium Gatwick. Stand Planning.Call to Gate. Terms of Reference for NT Security QueueManagement new contractors. Service Metrics. Q6 Update.Project Block Plans. SQR Monitoring. SQR Exclusions.
10 January 2012 South Terminal Stakeholder Working Group Discuss impacts of construction work to airport and airlinesoperations. Advise of upcoming planned work and majorworks over the next 5 weeks.
10 January 2012 Service Quality Exclusions Group Monthly agreement of exclusions for the 6 week look ahead,Review of previous month exclusions and service performance.Review of pier service exceptions.
10 January 2012 South Terminal Stakeholder Working Group Discuss impacts of construction work to airport and airlinesoperations. Advise of upcoming planned work and majorworks over the next 5 weeks.
11 January 2012 North Terminal Stakeholder Working Group NT projects construction work impacts for safety, disruptionover previous week, communication of planned work forfollowing week and discussion of planned works for thefollowing 5 weeks.
11 January 2012 Joint Steering Group Q5+1 Update including A380 on Stand 125 - Tollgate 3 andBeyond Q5 Process. Capital Programme Board Update: Pier 5 -Tollgate 4; ST Immigration R2 Draw-down (CCRS); NT Bag Store- Tollgate 3; NT IDL Reconfiguration - Tollgate 3; Surface WaterProjects - Tollgate 3/4. Service Quality Update. AOC ExecutiveUpdate. Finance Performance & Regulatory Charging GroupUpdate. AOB: ST Security Trigger Achievement; LongbridgeHouse Lease.
12 January 2012 Q5+1 Working Group ACC Working Group update. Q5+1 Programme Overview inclSummary Breakdown of Business Case Provision. BusinessCase Discussion. Next Steps.
17 January 2012 South Terminal Stakeholder Working Group Discuss impacts of construction work to airport and airlinesoperations. Advise of upcoming planned work and majorworks over the next 5 weeks.
18 January 2012 North Terminal Stakeholder Working Group NT projects construction work impacts for safety, disruptionover previous week, communication of planned work forfollowing week and discussion of planned works for thefollowing 5 weeks.
24 January 2012 South Terminal Stakeholder Working Group Discuss impacts of construction work to airport and airlinesoperations. Advise of upcoming planned work and majorworks over the next 5 weeks.
eAPPENDIx EMEETINGS, WORkING GROUpS AND GOVERNANCE BOARDS, jANUARY 2012 - MARCH 2012

106
Date Meeting Discussion / Items on the Agenda
25 January 2012 Capital Programme Board NT Baggage. Juliet Taxiway 47 North. Foul Rising Main. HBSLevel 3 Machine Replacement in TBF - R2 Draw-down. ST & NTUKBA Arrivals Zones. CIP Performance Pack. ProjectsOverview. AOB - ST Forecourt Trigger Walk Around; ConcourseCeilings
25 January 2012 North Terminal Stakeholder Working Group NT projects construction work impacts for safety, disruptionover previous week, communication of planned work forfollowing week and discussion of planned works for thefollowing 5 weeks.
31 January 2012 South Terminal Stakeholder Working Group Discuss impacts of construction work to airport and airlinesoperations. Advise of upcoming planned work and majorworks over the next 5 weeks.
01 February 2012 North Terminal Stakeholder Working Group NT projects construction work impacts for safety, disruptionover previous week, communication of planned work forfollowing week and discussion of planned works for thefollowing 5 weeks.
02 February 2012 GAL/AOC Executive Key items for discussion (maximum of 5); GAL Service Metrics;Capital Project Update
03 February 2012 Q5+1 Working Group Introduction. Capital Programme Board referrals: Foul RisingMain; HBS Machine Replacement in TBF. Asset Stewardship. STStatutory Accommodation Compliance (Minor Works). FireStrategy (Life Safety Systems).
06 February 2012 Baggage Strategy Meeting Gatwick Baggage Strategy presentation
07 February 2012 Service Quality Exclusions Group Monthly agreement of exclusions for the 6 week look ahead,Review of previous month exclusions and service performance.Review of pier service exceptions.
07 February 2012 South Terminal Stakeholder Working Group Discuss impacts of construction work to airport and airlinesoperations. Advise of upcoming planned work and majorworks over the next 5 weeks.
08 February 2012 North Terminal Stakeholder Working Group NT projects construction work impacts for safety, disruptionover previous week, communication of planned work forfollowing week and discussion of planned works for thefollowing 5 weeks.
08 February 2012 Joint Steering Group Q5+1 Update. ST Security IDL Tollgate 4. Capital ProgrammeBoard Update - Minor Projects Tollgate Process; Juliet Taxiway47 North Tollgate 1; Foul Rising Main Minor Projects Tollgate A;HBS Level 3 Machine Replacement in TBF R2 Draw-down. Q6Engagement. Service Delivery Update. AOC Executive Update.Charges Group Update.
09 February 2012 Q6 Working Group Introduction. Service Quality - Overview of current SQRscheme; Impact of Q5 CIP on current SQR elements. GALAspirations - Performance Metrics: Copenhagen Case Study.Content for next meeting.
14 February 2012 South Terminal Stakeholder Working Group Discuss impacts of construction work to airport and airlinesoperations. Advise of upcoming planned work and majorworks over the next 5 weeks.
15 February 2012 North Terminal Stakeholder Working Group NT projects construction work impacts for safety, disruptionover previous week, communication of planned work forfollowing week and discussion of planned works for thefollowing 5 weeks.
17 February 2012 Q5+1 Working Group Terms of Reference. Overview Update of Q5+1 Projects inclS1/S2 Switchboard Replacement; UKBA Arrivals; Staff CarParks). Airfield Asset Project - Lighting Columns; Stand EntryGuidance System (SEGS). Facilities Asset Project - LEPC.Gateroom Seating & Coaching Gates Update. Trigger DefinitionPlan.
21 February 2012 South Terminal Stakeholder Working Group Discuss impacts of construction work to airport and airlinesoperations. Advise of upcoming planned work and majorworks over the next 5 weeks.

107
Date Meeting Discussion / Items on the Agenda
22 February 2012 North Terminal Stakeholder Working Group NT projects construction work impacts for safety, disruptionover previous week, communication of planned work forfollowing week and discussion of planned works for thefollowing 5 weeks.
22 February 2012 Capital Programme Board Engineering Store R2 Draw-down. HV Pits & Ducts Tollgate 4.S1 & S2 Switchboard Replacement Tollgate 2. ST & NT UKBAArrvials Zones Tollgate 2. Staff Car Parks Tollgate 2. STBaggage & Pier 1 Update. NT Baggage CCRSs. CIP PerformancePack. Projects Overview. ITTS Financial Close Out. GALDevelopment & Product Development Organisation Charts
22 February 2012 Q6 Working Group CAA Constructive Engagement Mandate
28 February 2012 South Terminal Stakeholder Working Group Discuss impacts of construction work to airport and airlinesoperations. Advise of upcoming planned work and majorworks over the next 5 weeks.
29 February 2012 North Terminal Stakeholder Working Group NT projects construction work impacts for safety, disruptionover previous week, communication of planned work forfollowing week and discussion of planned works for thefollowing 5 weeks.
01 March 2012 GAL/AOC Executive Key items for discussion (maximum of 5); GAL Service Metrics;Capital Project Update
02 March 2012 Q5+1 Working Group Staff Car Parking Refurbishment. Norfolk House. ST IDLRefurbishment - Phase 2. Airfield Asset Project - VehicleReplacement. Facilities Asset Projects - LV Electrical; FireStrategy; Electronics; Baggage Systems Asset Replacement;Buildings & Civils & Minor Works. Flood Alleviation. GateroomSeating.
06 March 2012 Pier 1 Working Group Project update & Pier 1 animation from stakeholder session 7thFebruary; Domestic Arrivals – discussed Scope, Programme &Process – during and after construction of Pier 1.
06 March 2012 ST Baggage Working Group Feedback from stakeholder session 7th February; Activities toTollgate 4 prior to main contractor award; Process workstreams for baggage
06 March 2012 Service Quality Exclusions Group Monthly agreement of exclusions for the 6 week look ahead,Review of previous month exclusions and service performance.Review of pier service exceptions.
06 March 2012 South Terminal Stakeholder Working Group Discuss impacts of construction work to airport and airlinesoperations. Advise of upcoming planned work and majorworks over the next 5 weeks.
07 March 2012 North Terminal Stakeholder Working Group NT projects construction work impacts for safety, disruptionover previous week, communication of planned work forfollowing week and discussion of planned works for thefollowing 5 weeks.
07 March 2012 Joint Steering Group Snow SLA. Q5+1 Projects Update. ST Security IDL Tollgate 4.Capital Programme Board - Engineering Store R2 Draw-down;HV Pits & Ducts Tollgate 4, NT Baggage CCRSs. Q6 EngagementUpdate. AOC Executive Update. Service Delivery Update.Charges Group Update. ST Forecourt Trigger.
08 March 2012 Q6 Working Group CAA Constructive Engagement Mandate. Proposed Timetablefor Q6 CE. Code of Conduct/Terms of Reference for Q6WG.Dispute Resolution Procedure proposal.
13 March 2012 South Terminal Stakeholder Working Group Discuss impacts of construction work to airport and airlinesoperations. Advise of upcoming planned work and majorworks over the next 5 weeks.
14 March 2012 North Terminal Stakeholder Working Group NT projects construction work impacts for safety, disruptionover previous week, communication of planned work forfollowing week and discussion of planned works for thefollowing 5 weeks.

108
Date Meeting Discussion / Items on the Agenda
16 March 2012 Q5+1 Working Group Commercial Projects update. PRM/CCA - Phase 1. FacilitiesAsset Projects - Life Safety Systems; HVAC Systems. AirfieldAsset Projects - Taxiway inc AGL rehabilitation; StandsRefurbishment; FEGP Replacement; Substations; Konsin De-icerTanks. IT Projects - IT Core Infrastructure Node RoomRemediation; IT Infrastructure Platform Upgrade; CCTVSoftware Replacement.
20 March 2012 South Terminal Stakeholder Working Group Discuss impacts of construction work to airport and airlinesoperations. Advise of upcoming planned work and majorworks over the next 5 weeks.
21 March 2012 North Terminal Stakeholder Working Group NT projects construction work impacts for safety, disruptionover previous week, communication of planned work forfollowing week and discussion of planned works for thefollowing 5 weeks.
21 March 2012 Capital Programme Board Olympics Update. Procurement/Contracting Strategy. STEntrance Bridge Cladding Tollgate 4. Fire Strategy R2 Drawdown.NT Baggage Hall Access CCRS. NT Baggage CCRSsFeedback. Q6 Capitalisation Facilitation CCRS. CIPPerformance Pack. Projects Overview. Operational ImpactsMeetings.
21 March 2012 Q6 Working Group CAA Constructive Engagement Mandate. Dispute Resolution.Administrative Resource. Code of Conduct/Terms of Referencefor Q6WG. CE Timetable.
23 March 2012 Q5+1 Working Group Commercial Projects updates - NT IDL Refurbishment; NTLandside Arrivals; NT Avenue; ST Landside Arrivals. TerminalAsset Projects - ST Landside Arrivals Ceiling; ST Check-in Ceiling;NT Ceilings (Check-in). Minor Works. Pier 5 Draft TriggerDefinition. Check-in: Common Use Bag Drop. IT Projects -Passenger Facing IT, Airfield Peak Capacity (ACDM 55).
27 March 2012 South Terminal Stakeholder Working Group Discuss impacts of construction work to airport and airlinesoperations. Advise of upcoming planned work and majorworks over the next 5 weeks.
28 March 2012 North Terminal Stakeholder Working Group NT projects construction work impacts for safety, disruptionover previous week, communication of planned work forfollowing week and discussion of planned works for thefollowing 5 weeks.
30 March 2012 Q5+1 Working Group UKBA Arrivals Projects. ACC Feedback on Q5+1 Projects Status.

109
Issue Forum Meeting Date Agree/ Disagree Reason/Comment
1 Endorsement of Pier 5 to progressthrough Tollgate 4 (ConstructionDecision) (CCRS LGW0077)
CPB 21 December 2011 Agree
2 Endorsement of NT IDLReconfiguration to progress throughTollgate 3 (Options Decision) (CCRSLGW0078)
CPB 21 December 2011 Disagree Airlines wished to undertake Q5+1 projectprioritisation work before being in aposition to endorse
3 Endorsement of NT Bag Store toprogress through Tollgate 3 (OptionsDecision) (CCRS LGW0082)
CPB 21 December 2011 Disagree Airlines wished to undertake Q5+1 projectprioritisation work before being in aposition to endorse
4 Endorsement of Surface WaterProjects to progress through Tollgates3 & 4 (Options and ConstructionDecision) (CCRS LGW0076)
CPB 21 December 2011 Disagree Airlines wished to undertake Q5+1 projectprioritisation work before being in aposition to endorse
5 Endorsement of ST Immigration R2Draw-down of £212,000 for asbestosremoval (CCRS LGW 0081)
CPB 21 December 2011 Agree Change control record form signed-off
6 Endorsement of ST Security IDL toprogress through Tollgates 3 and 4(Options and Construction Decsions)(CCRS LGW0074)
JSG 11 January 2012 Disagree Airlines requested information on GAL’sretail strategy before being in a position toendorse (see line 17 below)
7 Endorsement of A380 on Stand 125to progress through Tollgate 3(Options Decision)
JSG 11 January 2012 Disagree Airlines were not opposed to the projectitself but objected to the timing as they feltevidence for demand had not beendemonstrated
8 Endorsement of Pier 5 to progressthrough Tollgate 4 (ConstructionDecision) (CCRS LGW0077)
JSG 11 January 2012 Agree Airlines requested further information onPier 5 which was provided following themeeting and subsequently the project wasendorsed with the change control recordform signed-off
9 Endorsement of ST Immigration R2Draw-down of £212,000 for asbestosremoval (CCRS LGW 0081)
JSG 11 January 2012 Agree Change control record form signed-off
10 Endorsement of NT Bag Store toprogress through Tollgate 3 (OptionsDecision) (CCRS LGW0082)
JSG 11 January 2012 Disagree GAL agreed to review the project and bringfurther solutions to the airlines
11 Endorsement of NT IDLReconfiguration to progress throughTollgate 3 (Options Decision) (CCRSLGW0078)
JSG 11 January 2012 Disagree Airlines requested information on GAL’sretail strategy before being in a position toendorse
FAPPENDIx FDECISION lOG, jANUARY 2012 – MARCH 2012

110
Issue Forum Meeting Date Agree/ Disagree Reason/Comment
12 Endorsement of Surface WaterProjects to progress through Tollgates3 & 4 (Options and ConstructionDecision) (CCRS LGW0076)
JSG 11 January 2012 Agree Change control record form signed-off
13 Endorsement that the STConsolidated Security trigger hadbeen achieved
JSG 11 January 2012 Agree Joint Letter to be sent to the CAA
14 Endorsement of Juliet Taxiway 47North to progress through Tollgate 1
CPB 25 January 2012 Agree With the caveat that the business caseprovided to the ACC was updated to reflectthe timing, savings to maintenance costsand the correct asset life
15 Endorsement of Foul Rising Main toprogress through Tollgate 1
CPB 25 January 2012 Agree With the caveat of the project having asatisfactory review at the Q5+1 WorkingGroup and the provision of an updatedbusiness case with supporting materials
16 Endorsement of R2 Draw-down of£1m for the HBS Level 3 MachineReplacement in TBF
CPB 25 January 2012 Disagree Airlines required further information on theproject before being in a position to recommend endorsement (see line 20 below)
17 Endorsement of ST Security IDL toprogress through Tollgate 4(Construction Decision) (CCRSLGW0074)
JSG 08 February 2012 Undecided GAL had attempted to address the airlinesrequest for more specific details of GAL’sretail strategy at a meeting with the ACC the previous day which had been abandoned.Airlines therefore postponed their decision until the next JSG meeting (see line 27 below).
18 Endorsement of Juliet Taxiway 47North to progress through Tollgate 1
JSG 08 February 2012 Agree
19 Endorsement of Foul Rising Main toprogress through Tollgate A
JSG 08 February 2012 Agree
20 Endorsement of R2 Draw-down of£1m for the HBS Level 3 MachineReplacement in TBF
JSG 08 February 2012 Agree
21 Endorsement of the EngineeringStore R2 Draw-down of £440K foradditional scope (CCRS LGW0093)
CPB 22 February 2012 Agree
22 Endorsement of HV Pits & Ducts toprogress through Tollgate 4(Construction Decision)
CPB 22 February 2012 Agree
23 Endorsement of S1 & S2 SwitchboardReplacment to progress throughTollgate 2 (Brief Decision) (CCRSLGW0094)
CPB 22 February 2012 Agree
24 Endorsement of ST & NT UKBAArrivals Zones to progress throughTollgate 2 (Brief Decsion) (CCRSLGW0095)
CPB 22 February 2012 Agree

111
Issue Forum Meeting Date Agree/ Disagree Reason/Comment
25 Endorsement of Staff Car parks toprogress through Tollgate 2 (BriefDecision)
CPB 22 February 2012 Disagree Airlines requested supporting data to beprovided for the Q5+1 Working Group
26 Endorsment of 9 CCRSs on NTBaggage for scope and AFC changes(CCRS LGW0084-92)
CPB 22 February 2012 Disagree Airlines to draw-up a list of questions forGAL to address (see line 30 below)
27 Endorsement of ST Security IDL toprogress through Tollgate 4(Construction Decision) (CCRSLGW0074)
JSG 07 March 2012 Agree Change control record form to be amendedprior to sign-off
28 Endorsement of the EngineeringStore R2 Draw-down of £440K foradditional scope (CCRS LGW0093)
JSG 07 March 2012 Agree Change control record form signed-off
29 Endorsement of HV Pits & Ducts toprogress through Tollgate 4(Construction Decision)
JSG 07 March 2012 Agree
30 Endorsment of 9 CCRSs on NTBaggage for scope and AFC changes(CCRS LGW0084-92)
JSG 07 March 2012 Undecided Deferred as the airlines has not provided toGAL their list of questions on the CCRSspresented at the CPB
31 Endorsement of Fire Strategy R2draw-down of £3.6m to removesafety related risks (CCRS LGW0096)
CPB 21 March 2012 Agree
32 Endorsement of ST Entrance BridgeCladding to progress through Tollgate4 (Construction Decision)
CPB 21 March 2012 Disagree Airlines requested further information totake to the ACC on 11 April
33 Endorsement of NT Baggage HallAccess CCRS to transfer £827K intothe NT Baggage Upgrade projects(CCRS LGW0097)
CPB 21 March 2012 Disagree Airlines requested further information totake to the ACC on 11 April
34 Endorsement of Q6 CapitalFacilitation of £815K to fund thepreparatory work for the Q6 capitalplan (CCRS LGW0079)
CPB 21 March 2012 Disagree Airlines requested further information totake to the ACC on 11 April


113
G.5 This consultation will take place within and be aligned to the broader context of consultation, typically on the elements covered by the constructive engagement process used to inform the Q5 regulatory review.
AIRPORT MASTER PLAN AND LONG-TERM LAND USE PLAN
G.6 Each airport will produce and maintain a Master Plan document in consultation with airlines. The timing of this document depends partly on Government airport policy consultations/decisions and on the need to keep the overall vision for the airport up to date. Updates will also be necessary to deal with strategic aspects (such as scope and timing) of major developments left open in a previous version. Consultations on the airport’s development strategy and also on the necessity and scope of specific projects need to proceed in the confidence that the proposals are aligned with the overall airport Masterplan. It is envisaged that the annual CIP document will be supported with a long-term land use plan, highlighting the infrastructure to be delivered across the airport campus by the investment proposals. The annual CIP document would also provide updated information on the long-term land use plan (at a level of granularity that permits informed discussion) which is likely to be relevant to airlines’ consideration of the CIP. The long term land use plan will provide a view on how best to use the land well into the future, and from which the incremental infrastructure plans (next 5 to 10 years), both above and below the surface, can be considered and shown to align with the long term land use plan within the context of the current Masterplan.
G.7 Consultation on the long-term land use plan should also incorporate information on asset disposals. The airport will consult airlines before disposing of any land or buildings from the Regulated Airport Base, whether through sale, partial sale, long lease or joint venture, including disposals from the respective airport company (Heathrow Airport Limited (HAL) or Gatwick Airport Limited (GAL)) to other entities within the BAA group. Consultation information will include the timing of the proposed disposal, potential impact on both current airport operations and on future airport development, and measures taken to protect future airport development (e.g. proposed buy back options and their terms). The airport will also inform users and the CAA on any
G. [GATWICk’S] AGREEMENT ON ENhANCED INFORMATION DISCLOSURE AND CONSULTATION AT hEAThROW AND GATWICk AIRPORTS - UPDATE FOR Q5
G.1 [Gatwick] recognises that consultation with airlines on its proposals for the development of the airport is critical to ensure its plans are both fully understood by airlines and informed by their knowledge and requirements. To facilitate this, [Gatwick] proposes to provide airlines with the following information, detailed below as part of the constructive engagement process. This proposal is intended to address consultation on the delivery of the plan in Q5 as well as issues that will need to be discussed in preparation for future price control periods. To ensure effective consultation this proposal also outlines the requirements for the consultative process, including a high level view on the remit of airport-airline consultative bodies established for this purpose.
G.2 Ultimately, decisions on capital expenditure are fundamental to [Gatwick’s] business and as such [Gatwick] is accountable for the final decision with regard to how capital expenditure monies are deployed. Equally, the CAA has stated that it will take account of this constructive engagement process when establishing the regulatory settlement for a period, basing decisions on agreement wherever possible.
G.3 [Gatwick] anticipates that through the provision of the information detailed in this paper and with the constructive engagement of all parties in the process, the level of consultation supporting the airport’s development proposals will be enhanced. This should result in a greater understanding of the drivers for investment, the cost of the plan and the outputs that will be delivered, in terms of infrastructure and benefits to airlines and passengers as well as the impact on user charges.
G.4 There will be three key aspects to the consultation on airport development plans:
1 The Airport Master Plan and long term land use plan; 2 The Capital Investment Plan (CIP); 3 Consultation on individual projects.
gAPPENDIx GANNEX G

114
3 Options for the development of the airport: Consulting with airlines on the high level options for the development of the airport, including details of the cost and output trade-offs involved in each option, and the relative impact on user charges and, where possible, on future airline costs. This user charge impact assessment should be conducted on a per passenger basis, and employ high level assumptions on incremental passenger numbers, costs and income associated with alternate options. Assumptions employed should be clearly stated, with reasons, so that airlines can understand the inherent risks and sensitivities. This should include similar analyses of reasonable options formally requested by airlines at the JSG/JST.
Consultation with airlines will also be required to take account of their views on current and future operational processes, requirements and airline moves. This may involve discussions about future airline plans for check-in, fleet, baggage etc.
The airport and airlines need to respect the agreed process and timescales when making their contributions. Where airlines cannot provide inputs in time, the airport may need to make informed assumptions which can be adjusted through the stakeholder project boards or the JSG/JST if necessary. It may also be necessary to revise assumptions later, but the aim should be to ensure that delays caused by airlines’ limited resource do not put at risk [Gatwick’s] ability to deliver the investment programme or specific projects or the functional needs of airlines.
4 The capacities that the airport intends to provide: Consulting with airlines on the facilities the airport intends to supply, and the extent to which the different parts of the infrastructure (passenger areas, stands, baggage belts, runways and airfield facilities etc.) will meet demand forecasts under the different scenarios. This will provide users with a forecast of the extent to which the airport will be able to meet expected demand for outputs, and the implications of this for the quality of service that airlines receive at the airports. This should also quantify other benefits to be delivered by the plan. As with consultation on options for airport development, the discussion on specific capacities to be provided should also encompass airlines’ views on current and future operational processes, requirements and airline moves. This may involve discussions about airlines’ future plans for check-in, fleet, baggage etc.
subsequent disposal of assets which were formerly within the Regulated Asset Base and which had been transferred out of the HAL or GAL Regulated Asset Base during the Q5 price control period to another entity within the BAA group. Where there may be reasonable doubt as to whether or not a particular asset does or does not fall within the Regulated Asset Base, the airport will consult with airlines on its disposal in advance.
CAPITAL INVESTMENT PLAN (CIP)
G.8 Consultation will require the provision by [Gatwick] of information within a capital planning document covering a period of at least 10 years. This document will provide information to airlines on development plans for each airport and will be a key document around which airline-airport consultation will take place. It is recognized that some elements of the data may need to be covered by a confidentiality agreement (and/or disclosed in a restricted manner) to ensure that consultation does not prejudice commercial interests.
G.9 The purpose of the document will be to allow the airport to consult airlines on the following matters relating both to Q5 and to future price control periods:
1 The principal business drivers behind the airport’s development strategy: Including assumptions made by [Gatwick] regarding the future operating environment of the airports including desired levels of service, those constraints faced by the airports that are a material influence on the plans and jointly developed benchmarks of external performance.
2 The forecast demand for airport outputs for the duration of the plan: Consulting airlines on the disaggregated forecast levels of demand for airport capacities and services, under one or more future scenarios developed following consultation with airlines, including scenarios that may be recommended formally by airlines at the Joint Steering Group (JSG) at Gatwick / Joint Steering Team (JST) at Heathrow, together with the principal factors that are expected to drive different categories of the demand. Use of different forecast scenarios may be particularly important where there is some uncertainty or risk about future demand and where it is necessary to test the robustness of the plan against uncertain outcomes.
gAPPENDIx GANNEX G

115
G.10 [Gatwick] will share with the appropriate airlines and/or or their representative bodies the commercial revenues it anticipates the investment will generate, except where [Gatwick] considers that disclosure of the information could jeopardise either its, or a third party’s, commercial interests. It is recognised by all parties that this may require a limit on the number of consultees and that confidentiality agreements (or other restrictions) may be needed to ensure the security of the information. [Gatwick] will make best endeavours to find practical means by which information can be both shared appropriately as necessary and given adequate protection from wider release, where this may be contrary to [Gatwick’s] or other parties’ commercial interests. There may be cases where [Gatwick] does not consider it appropriate to release this information even with the above safeguards and in these instances the airport will explain why disclosure is not possible.
G.11 Where [Gatwick] considers that its commercial or operational interests will not be compromised, it will provide information on the relative impact upon operating costs resulting from the development.
CONSULTATION ON INDIVIDUAL PROjECTS
G.12 Consultation will concentrate on the delivery of key projects or programmes of investment. The projects/programmes that will be subject to individual consultation will be agreed by stakeholder programme boards or via the JSG/JST. These will, as a minimum, be those projects with triggers attached and should be selected after consideration has been given as to how best to utilise airline and airport resource to facilitate this consultation without compromising the delivery of the overall plan. In addition to consultation on those projects agreed at the outset via Programme Boards or JSG/JST, [Gatwick] will try to accommodate all reasonable requests made by airlines for information/consultation about the progress of individual projects. These requests should be made via the relevant programme board. If agreement cannot be reached through this forum, the matter may be raised at JSG/JST.
5 The cost of the capital investment plan: Giving airlines an overall picture of the estimated total cost of the plan and pricing implications (informed, where appropriate, by the price control formula imposed by the CAA, and any long term pricing policies laid out by the CAA). This should state what major assumptions have been made, including timing of key projects and the expected levels of any operational disruption. Consultation on the total cost of the investment plan for future price control periods will also encompass consultation on the appropriate level of risk that should be incorporated into the cost of the programme. This will be informed by the future scenarios work and will be required before the capital investment programme for any future price control period is finalised.
6 Cost estimates and efficiencies of individual projects: Providing airlines with information, to an appropriate level of detail, on total capital expenditure and the anticipated incremental impact upon the operating costs of both [Gatwick] and the airline community. The amount of cost detail will be related to the stage of the development process. For those projects that have reached a high level of definition, specific cost estimates and indications of benefits will be expected. For projects envisaged in the longer term more general capital cost provisions may be appropriate and, if so, this should be stated. Where costs are shown for specific projects these should be broken down into base construction costs, risk allowances, on-costs and any other provisions such as site-specific costs. Information on anticipated asset lives associated with the development proposal should also be included. The costs for individual projects should be accompanied by an explanation of any positive or negative cost comparison with similar past projects. Specific data, including details of alternatives considered, should be provided. This information may be given in individual project consultations, rather than in the overall plan. Some information may need to be provided in confidence to individual occupiers of projects.
7 The outputs that are expected from individual projects: This should be both in terms of infrastructure that will be provided/replaced and the benefits that will be realized in terms of increased capacity, improved service levels, statutory compliance etc. The outputs should be quantified and provided on an incremental basis at a level of detail appropriate to the stage of the project. For any project, it should be clear how the benefits justify the costs: information should, therefore, be shared by the airport operator, as provider of the facility, and by those that operate the facility to enable users to assess the relative financial and operational benefits of the proposed development.
gAPPENDIx GANNEX G

116
G.17 An important part of each CIP document will be to provide airlines with an account of how the plan has changed from both previous versions and the plan that was anticipated in the Q5 price control. It should also provide an explanation for the change, whether to individual projects or at a higher level. It is not intended that the airport should be required to consult in advance about minor modifications to the plan unless they have significant effects; however airlines should be consulted before decisions are taken in relation to significant changes. In instances where [Gatwick] feels it is necessary to make significant changes to the plan, even when there is strong opposition from the airline community as a whole, [Gatwick] will commit to providing detailed reasons for its decision.
G.18 In addition to providing airlines with transparency on changes to projections of future investment, it will also be necessary to review the out-turn performance of completed projects against the outputs anticipated in previous plans. Project evaluation should highlight performance in terms of cost, infrastructure delivered and benefits realised.
ThE CONSULTATION PROCESS
G.19 The Capital Investment Plan should form the basis of an effective consultation process, designed to provide airport facilities to best meet the current and future needs of airlines. Within this process, [Gatwick] should ensure that the material stated above is provided to, and consulted with, all major airlines at the individual airports. As well as publishing an annual document containing this information, each airport and its airlines are expected to establish the appropriate consultative bodies to facilitate this process.
G.20 Proposals from [Gatwick] for the consultative structure to be applied at Heathrow and Gatwick have been developed and are attached as annexes to this paper.
G.21 These consultative bodies should agree membership and term s of reference supporting a structure of consultation that ensures a logical sequence of information flow is followed in order for the linkages between the different information requirements stated above to be understood.
G.13 It is envisaged that this consultation will be structured to support the key decision points in [Gatwick’s] Gateway process. For those key projects subject to individual consultation, [Gatwick] will ensure that airlines are consulted in a timely fashion at the following stages: (i) prior to [Gatwick] moving the project from brief description to options development, (ii) prior to option decision, and (iii) prior to construction design. [Gatwick] expects that the airlines involved in this process will make best endeavours to ensure that their inputs to such consultation are timely and do not delay the overall timeliness of programme and project delivery. If airlines do not participate when invited and subsequently try to hold up or reject the project proposals, [Gatwick] may need to proceed (and document the reasons why) without airline sign-off, in order to protect delivery for the wider user benefit.
G.14 Consultation on those selected projects will encompass the progression of the design and delivery of the project and best endeavours should be made to keep to the master delivery programme agreed at the outset of a project. Consultation should also focus on the utilisation of the risk allowance factored into the project cost. [Gatwick] will provide reports to show how risk money has been used and airlines will be consulted in advance of any significant use of risk monies.
ChANGE CONTROL
G.15 The CIP acts as a basis for consultation only and does not represent a mandatory investment programme.
G.16 The plan produced at any one time will be subject to change as the external environment alters, as project information become more detailed or as operational issues become apparent. Best endeavours should be made however to stick to the plan and changes should be proportionate, and the rationale for significant changes should be discussed with airlines before decisions are taken. These changes need to be made transparently and may involve difficult choices. All parties need to recognise that changes to the plan are inevitable and prioritisation of the plan will be ongoing within a fixed level of expenditure within the quinquennium. Where significant disagreements arise reasonable efforts should be undertaken by all parties to resolve disputes. Depending on the significance of the matter in dispute this may involve the use of the Dispute Resolution Process established for Q4.
gAPPENDIx GANNEX G

117
G.22 An important part of the work of these consultative bodies will be to track progress against the plan, to review implementation issues such as airline moves, and to act as a consultative forum for any proposed changes to the plan, for example changes to the scope, timing, costs or benefits of a project. These bodies should also provide the forum to discuss and agree any changes to the triggers identified for the Q5 price control period. Beyond the current price control period these bodies should also provide the consultative platform to agree future ‘trigger’ projects and the detailed definition of the associated milestones, which will be used to adjudicate whether or not the trigger has been successfully met.
G.23 Consultation should encompass the exchange of information and subsequent discussion between [Gatwick] and airlines with the objective of achieving agreement within an appropriate timescale to enable the successful delivery of the plan. A project plan will be developed by [Gatwick] which will show reasonable timescales for consultation commensurate with project complexity. The plan will show the timing of key decisions needed to maintain project programme in line with the CIP. All parties will endeavour to meet this timescale. However, it is recognised that agreement may not always be achieved in the time available to progress the investments. With this in mind it will be the responsibility of these bodies on a yearly basis to provide an agreed record of the agreements reached and those areas where there has been disagreement. This record of agreement/disagreement should also highlight the process undertaken to attempt to resolve any disputes.
gAPPENDIx GANNEX G


119
APPE
NDI
X H
– G
ATW
ICK
IN 2
020
– LA
ND
USE
PLA
N
[Ext
ract
from
201
1 Dr
aft M
aste
r Pla
n]
HAPPENDIx hGATWICk IN 2020 - lAND USE plAN


121
PRO
DU
CT
MA
TRIX
Pass
eng
er F
acin
g P
rod
ucts
AB
CD
E
Co
reP
rem
ium
Bus
ines
sP
RM
Fam
ily(M
anag
ed b
y H
oriz
ont
al O
wne
rs)
(And
rew
Lew
is)
(And
rew
Lew
is)
(Ric
hard
To
wns
end
)(R
icha
rd T
ow
nsen
d)
Surf
ace
Acc
ess
(Jul
ia G
reg
ory
)
1.1
Serv
ice
offe
r th
at e
nco
urag
e th
e us
e o
f pub
lic t
rans
po
rt m
od
es1.
1D
edic
ated
cha
uffe
ur /
lim
o d
rop
off
area
1.1
Prio
rity
par
king
are
as
(fast
co
nnec
tion)
1.1
Ded
icat
ed d
rop
off
area
1.1
Ded
icat
ed p
arki
ng
1.2
No
road
tra
ffic
que
ues
on
airp
ort
1.2
Prem
ium
and
val
et p
arki
ng1.
2M
axim
um w
ait
5 m
inut
es1.
2A
cces
sib
le ro
utes
in
to T
erm
inal
s
1.3
Rea
l tim
e tr
ansp
ort
net
wo
rk a
nd
serv
ice
info
rmat
ion
1.3
Ker
b s
ide
loun
ge
w
ith c
onc
ierg
e1.
3C
hild
frie
ndly
co
ncie
rge
serv
ice
1.4
Bag
dro
p v
alet
par
king
faci
lity
1.5
Fit
for
pur
po
se s
mo
king
faci
litie
s
1.6
Co
ntem
po
rary
des
ign
fo
r ex
tern
al a
reas
1.7
Cle
ar ro
utin
g fo
r p
ax
fro
m /
to
onw
ard
tra
vel
1.8
Acc
essi
ble
dro
p-o
ff ar
eas
to
mat
ch d
eman
d
1.9
Suffi
cien
t p
ublic
car
par
k ca
pac
ity t
o
mee
t d
eman
d fo
r o
n-ai
rpo
rt p
arki
ng
Che
ck-in
Con
cour
se(P
aul F
itch)
2.1
Max
imum
10
min
ute
que
ue2.
1N
o q
ueue
2.1
Bus
ines
s se
gre
gat
ed c
heck
-in2.
1D
edic
ated
che
ck-in
(n
ear
to re
cep
tion)
2.1
Ded
icat
ed a
rea
for
fam
ilies
2.2
Intu
itive
flo
w t
hro
ugh
des
ign
2.2
Ded
icat
ed a
rea,
aes
thet
ical
ly
diff
eren
tiate
d2.
2Sy
stem
for
pre
-ord
er
in-fl
ight
pro
duc
ts2.
2Sp
ace
= IA
TA A
2.3
Spac
e =
no
t le
ss t
han
IATA
C (a
t p
eak)
2.3
Spac
e =
IATA
A2.
3Te
chno
log
y fo
r
“sw
ipe”
che
ck-in
2.3
Dis
trac
tions
for
child
ren
2.4
Wel
l lit
and
clu
tter
free
env
ironm
ent
2.4
Ker
b s
ide
chec
k-in
& b
ag
dro
p2.
4O
ff si
te b
ag d
rop
2.5
Rem
ote
che
ck-in
(p
asse
nger
acc
epta
nce)
2.5
Min
imal
tra
vel d
ista
nces
2.6
Co
mm
on
use
area
s fo
r
bag
tag
& d
rop
2.6
Off
site
bag
dro
p
2.7
Any
time
chec
k-in
2.7
Prem
ium
che
ck-in
loun
ge
2.8
Seg
reg
ated
gro
up c
heck
-in2.
8Pr
emiu
m P
RM
pic
k up
ser
vice
fr
om
ho
me
2.9
Any
bag
to
any
chu
te
2.10
Staf
f and
mo
bile
tec
hno
log
y to
p
roac
tivel
y as
sist
pas
seng
ers
2.11
Dis
pla
y o
f che
ck-in
loca
tion
and
q
ueue
(via
sm
art
pho
ne a
pp
)
2.12
Dis
pla
y o
f sec
urity
que
ue (v
isua
l d
isp
lay
scre
ens
& v
ia s
mar
t p
hone
ap
p)
iAPPENDIx IGATWICk’S pRODUCT MATRIX

122
Co
reP
rem
ium
Bus
ines
sP
RM
Fam
ily(M
anag
ed b
y H
oriz
ont
al O
wne
rs)
(And
rew
Lew
is)
(And
rew
Lew
is)
(Ric
hard
To
wns
end
)(R
icha
rd T
ow
nsen
d)
Secu
rity
(Geo
ff W
illia
ms)
3.1
Max
imum
10
min
ute
que
ue3.
1N
o q
ueue
3.1
Max
imum
que
ue 5
min
utes
3.1
Max
imum
10
min
ute
que
ue3.
1D
edic
ated
lane
s
(no
t w
ith P
RM
)
3.2
Spac
e =
no
t le
ss t
han
IATA
C3.
2D
edic
ated
are
a w
ith
per
sona
l ser
vice
3.2
Ded
icat
ed la
ne w
ith
effic
ient
ser
vice
3.2
Ded
icat
ed la
nes
(n
ot
with
fam
ilies
)3.
2Sp
ace
= IA
TA A
3.3
Frie
ndly
, hel
pfu
l and
effi
cien
t st
aff
3.3
Spac
e =
IATA
A3.
3Lo
yalty
bas
ed s
egre
gat
ion
3.3
Spac
e =
IATA
A3.
3C
heer
ful a
esth
etic
s (v
isua
ls e
tc.)
3.4
Effe
ctiv
e m
ultil
ing
ual c
om
ms
3.4
DD
A c
om
plia
nt s
eatin
g
for
reco
mp
osu
re3.
4H
elp
ful s
taff
3.5
Elim
inat
e cl
oth
ing
rem
ova
l
3.6
Mo
bile
tec
hno
log
y fo
r
bo
ard
ing
pas
ses
3.7
Spac
e an
d s
eatin
g fo
r re
com
po
sure
3.8
Dis
pla
y o
f sec
urity
que
ue (v
isua
l d
isp
lay
scre
ens
& v
ia s
mar
t p
hone
ap
p)
IDL
(Sp
ence
r Sh
een
& P
aul F
itch)
4.1
Seg
reg
ated
/ q
uiet
zo
nes
4.1
Dire
ct ro
utes
thr
oug
h
to lo
ung
es4.
1B
usin
ess
cent
re fa
cilit
ies
4.1
Rec
eptio
n p
oin
ts c
lose
to
sec
urity
exi
t4.
1Fa
mily
are
as (k
ids
and
tee
ns)
4.2
Airs
ide
smo
king
are
as fo
r p
asse
nger
s4.
2Pe
rso
nal s
hop
pin
g /
re
tail
po
ds
4.2
Qui
et a
reas
for
b
usin
ess
trav
elle
rs4.
2Se
atin
g w
ith re
al t
ime
info
rmat
ion
4.2
Fam
ily F
&B
offe
rs
4.3
Push
info
to
pas
seng
ers
4.3
Seg
reg
ated
Pre
miu
m lo
ung
es4.
3C
lose
to
to
ilet
faci
litie
s4.
3C
rèch
e fa
cilit
ies
4.4
Pers
ona
lised
cal
l to
gat
e(v
ia S
MS
& s
mar
t p
hone
ap
p)
4.4
Exc
lusi
ve /
luxu
ry re
tail
4.4
Acc
ess
to F
&B
and
sho
ps
4.4
Leis
ure
loun
ges
4.5
FID
S w
ith d
epar
ture
gat
e sp
ecifi
c d
ista
nce
/ tim
es &
flig
ht s
tatu
s4.
5M
assa
ge
&
rela
xatio
n fa
cilit
ies
4.5
Ent
erta
inm
ent
4.6
Co
mfo
rtab
le s
eatin
g /
so
cial
are
as4.
6Sh
ow
ers
4.7
Airfi
eld
vie
ws
(out
do
or
or
ind
oo
r)
4.8
Ret
ail t
o s
uit
who
le s
ched
ule
(late
nig
ht)
4.9
Spac
e =
min
imum
IATA
C /
co
mm
erci
al b
ench
mar
k
4.10
Gat
eway
/ P
ort
al t
o d
istin
gui
sh p
ier
entr
y p
oin
ts
4.11
Unc
lutt
ered
str
uctu
red
reta
il la
yout
4.12
Effi
cien
t VA
T re
fund
ser
vice
iAPPENDIx IGATWICk’S pRODUCT MATRIX

123
Co
reP
rem
ium
Bus
ines
sP
RM
Fam
ily(M
anag
ed b
y H
oriz
ont
al O
wne
rs)
(And
rew
Lew
is)
(And
rew
Lew
is)
(Ric
hard
To
wns
end
)(R
icha
rd T
ow
nsen
d)
Pier
s(P
aul F
itch)
5.1
95%
Pie
r Se
rvic
e5.
1Se
par
ate
pas
seng
er a
cces
s5.
1G
ate
roo
m b
usin
ess
faci
litie
s5.
1To
ilet
pro
visi
on
at
reco
mm
end
ed fr
eque
ncy
5.1
Exp
erie
ntia
l act
iviti
es in
g
ate
roo
ms
5.2
Clo
sed
gat
e ro
om
s5.
2Pr
iorit
y b
oar
din
g5.
2O
pen
gat
e ro
om
s (a
cces
s to
ser
vice
s)5.
2C
hang
ing
are
as w
ith a
dul
t b
ed fa
cilit
ies
5.2
5.3
Min
imum
gat
e ro
om
dw
ell t
ime
5.3
Seg
reg
ated
sea
ting
in
the
gat
e ro
om
5.3
Lift
s fo
r al
l ver
tical
m
ove
men
ts5.
3St
rolle
rs a
t ai
rcra
ft s
ide
on
inb
oun
d fl
ight
s
5.4
Co
mfo
rtab
le g
ate
roo
m s
eatin
g
(cus
tom
er g
roup
)
5.5
Airl
ine
cons
olid
ated
on
pie
rs /
gat
es
5.6
Vert
ical
seg
reg
atio
n o
f p
asse
nger
s in
pie
rs
5.7
Lift
s cl
ose
to
sta
nds
(for
w/c
hairs
etc
.)
5.8
Aut
om
ate
bo
ard
ing
& d
isp
lays
for
airc
raft
sta
tus
5.9
Spac
e =
no
t le
ss t
han
IATA
C
Tran
sfer
s(G
eoff
Will
iam
s)
6.1
Airs
ide
tran
sfer
faci
litie
s
(do
mes
tic &
inte
rnat
iona
l)
6.2
Spac
e =
no
t le
ss t
han
IATA
C
6.3
Vis
ual d
isp
lay
for
“nex
t se
rvic
e”
real
tim
e in
form
atio
n
6.4
Cal
l fac
ility
for
on
dem
and
o
ff p
eak
serv
ice
Arr
ival
s B
ord
er
Zone
s(G
eoff
Will
iam
s)
7.1
Max
Q =
10
min
s E
U
No
n-E
U =
20
min
s7.
1N
o q
ueue
7.1
Max
imum
5 m
inut
e q
ueue
7.1
Max
imum
10
min
ute
que
ue7.
1M
axim
um 1
0 m
inut
e q
ueue
7.2
Spac
e =
no
t le
ss t
han
IATA
C7.
2Sp
ace
= IA
TA A
7.2
Reg
iste
red
tra
velle
r p
rog
ram
me
7.2
Ded
icat
ed la
ne7.
2D
edic
ated
lane
7.3
A “
War
m w
elco
me
to G
atw
ick”
& U
K7.
3D
edic
ated
lane
s7.
3Se
gre
gat
ed la
nes
7.4
Dis
pla
y o
f bo
rder
que
ue (v
isua
l d
isp
lay
scre
ens
& v
ia s
mar
t p
hone
ap
p)
7.4
Arr
ival
loun
ge
/ fa
cilit
ies
an
d/o
r se
atin
g
7.5
Reg
iste
red
tra
velle
r p
rog
ram
me
iAPPENDIx IGATWICk’S pRODUCT MATRIX

124
Co
reP
rem
ium
Bus
ines
sP
RM
Fam
ily(M
anag
ed b
y H
oriz
ont
al O
wne
rs)
(And
rew
Lew
is)
(And
rew
Lew
is)
(Ric
hard
To
wns
end
)(R
icha
rd T
ow
nsen
d)
Rec
laim
(Pau
l Fitc
h)
8.1
Onw
ard
tra
vel t
icke
ts /
info
rmat
ion
8.1
Mee
t &
gre
et in
hal
l (in
clud
ing
bag
s)8.
1Pr
iorit
y b
ag id
entifi
catio
n
& d
eliv
ery
8.1
DD
A c
om
plia
nt re
serv
ed
seat
s b
y re
clai
m8.
1O
wn
stro
llers
at
lo
adin
g b
ridg
e
8.2
Max
imum
45
min
ute
last
bag
8.2
Prio
rity
bag
iden
tifica
tion
&
del
iver
y8.
2B
aby
chan
ge
faci
litie
s
8.3
Bag
reco
very
pro
cess
es o
n fa
ilure
8.3
Ho
tel /
ho
me
dro
p o
ff8.
3Lu
gg
age
del
iver
ed t
o
your
car
8.4
Cat
erin
g fa
cilit
ies
8.5
Aut
om
ated
kio
sks
for
lost
bag
gag
e
8.6
Bag
del
iver
y st
atus
(vis
ual d
isp
lay
scre
ens
& v
ia s
mar
t p
hone
ap
p)
8.7
Rea
l tim
e tr
ansp
ort
net
wo
rk
and
ser
vice
info
rmat
ion
Onw
ard
Trav
el &
A
rriv
als
Con
cour
se(P
aul F
itch
&
Julia
Gre
go
ry)
9.1
Stre
ss fr
ee p
ick
up9.
1C
hauf
feur
pic
k up
are
as
at le
vel
9.1
Cle
ar ro
utin
g t
o p
riorit
y p
arki
ng /
pic
k up
9.1
Ker
b s
ide
loun
ge
with
co
ncie
rge
9.1
Mo
ther
and
bab
y ro
om
s
9.2
Min
imis
e p
asse
nger
rout
ing
co
nflic
ts (a
rriv
als)
9.2
Co
ncie
rge
serv
ice
9.2
Ded
icat
ed p
ick
up a
rea
9.3
Ro
amin
g, h
elp
ful s
taff
9.3
Vale
t p
ick
up a
reas
9.4
Airl
ine
bra
nded
arr
ival
s p
rod
ucts
9.5
Co
nso
lidat
ed o
nwar
d t
rave
l fac
ilitie
s &
info
rmat
ion
9.6
Cle
ar ro
utin
g t
o p
rod
ucts
9.7
Ho
tel d
esk,
F&
B, R
etai
l & B
urea
ux
9.8
Rea
l tim
e tr
ansp
ort
net
wo
rk a
nd
serv
ice
info
rmat
ion
iAPPENDIx IGATWICk’S pRODUCT MATRIX
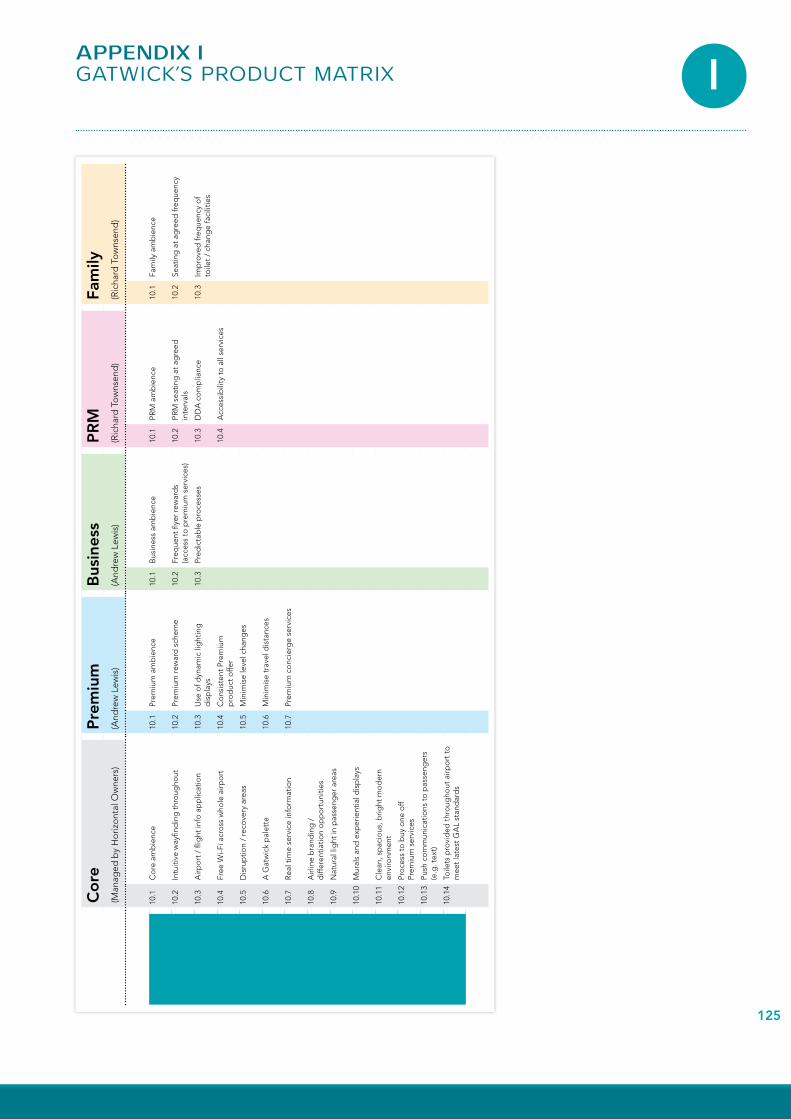
125
Co
reP
rem
ium
Bus
ines
sP
RM
Fam
ily(M
anag
ed b
y H
oriz
ont
al O
wne
rs)
(And
rew
Lew
is)
(And
rew
Lew
is)
(Ric
hard
To
wns
end
)(R
icha
rd T
ow
nsen
d)
10.1
Co
re a
mb
ienc
e10
.1Pr
emiu
m a
mb
ienc
e10
.1B
usin
ess
amb
ienc
e10
.1PR
M a
mb
ienc
e10
.1Fa
mily
am
bie
nce
10.2
Intu
itive
way
find
ing
thr
oug
hout
10.2
Prem
ium
rew
ard
sch
eme
10.2
Freq
uent
flye
r re
war
ds
(acc
ess
to p
rem
ium
ser
vice
s)10
.2PR
M s
eatin
g a
t ag
reed
in
terv
als
10.2
Seat
ing
at
agre
ed fr
eque
ncy
10.3
Airp
ort
/ fl
ight
info
ap
plic
atio
n10
.3U
se o
f dyn
amic
lig
htin
g
dis
pla
ys10
.3Pr
edic
tab
le p
roce
sses
10.3
DD
A c
om
plia
nce
10.3
Imp
rove
d fr
eque
ncy
of
toile
t /
chan
ge
faci
litie
s
10.4
Free
Wi-F
i acr
oss
who
le a
irpo
rt10
.4C
ons
iste
nt P
rem
ium
p
rod
uct
offe
r10
.4A
cces
sib
ility
to
all
serv
ices
10.5
Dis
rup
tion
/ re
cove
ry a
reas
10.5
Min
imis
e le
vel c
hang
es
10.6
A G
atw
ick
pal
ette
10.6
Min
imis
e tr
avel
dis
tanc
es
10.7
Rea
l tim
e se
rvic
e in
form
atio
n10
.7Pr
emiu
m c
onc
ierg
e se
rvic
es
10.8
Airl
ine
bra
ndin
g /
d
iffer
entia
tion
op
po
rtun
ities
10.9
Nat
ural
lig
ht in
pas
seng
er a
reas
10.1
0M
ural
s an
d e
xper
ient
ial d
isp
lays
10.1
1C
lean
, sp
acio
us, b
right
mo
der
n en
viro
nmen
t
10.1
2Pr
oce
ss t
o b
uy o
ne o
ff
Prem
ium
ser
vice
s
10.1
3Pu
sh c
om
mun
icat
ions
to
pas
seng
ers
(e.g
. tex
t)
10.1
4To
ilets
pro
vid
ed t
hro
ugho
ut a
irpo
rt t
o
mee
t la
test
GA
L st
and
ard
s
iAPPENDIx IGATWICk’S pRODUCT MATRIX


127
jAPPENDIx jTOllGATE pROCESS
DESIGN FOR SIX SIGMA, TOllGATE pROCESS OVERVIEW
DfSSStage 2
DfSSStage 3
DfSSStage 4
DfSSStage 5
DfSSStage 6
DfSSStage 7
DfSSStage 1
Initiate Scope Req’ments Options Build Handover Operate Closeout
TG0 TG1 TG2 TG3 TG4 TG5 TG6 TG7
TG 0 – Initiate - Approval to start the Dfss Tollgate Process
TG 1 – scope - Approving the Start Up of the Project
TG 2 – Requirements - Approval of Brief, procurement plan, authority to appoint Prime Designer & release of funds to Tollgate 3
TG 3 – options - Option Approval, Budget Update, Procurement Plan Update, release of funds to Tollgate 4
TG 4 – Build - Authority to Appoint Prime Contractor, Release of full funds
TG 5 – Handover - Readiness for Handover & start of Airport Operational Readiness
TG 6 – operate - Airport Operational Readiness Complete, ready to ‘Go Live’
TG 7 – Close out - Project Close Down

128
GLOSSARy
CWF CLEAN, WORKING AND FRIENDLY
DFT DEPARTMENT FOR TRANSPORT
DOM DOMESTIC
DFSS DESIGN FOR SIX SIGMA
EU EUROPEAN UNION
FIDS FLIGHT INFORMATION DISPLAY SCREEN
GA GENERAL AVIATION
GAL GATWICK AIRPORT LIMITED
GAL NUMBER GATWICK PROJECT / PROGRAMME REFERENCE NUMBER
GATCOM GATWICK CONSULTATIVE COMMITTEE
GDP GROSS DOMESTIC PRODUCT
HBS HOLD BAGGAGE SCANNER
IDL INTERNATIONAL DEPARTURE LOUNGE
INT INTERNATIONAL
IT INFORMATION TECHNOLOGY
ITTS INTER TERMINAL TRANSIT SYSTEM
JSG JOINT STEERING GROUP
KPI KEY PERFORMANCE INDICATOR
LACC LONDON AIRPORTS CONSULTATIVE COMMITTEE
M MILLION
MARS MULTI AIRCRAFT RAMP SYSTEM
MENA MIDDLE EAST AND NORTH AFRICA (REGION)
MPPA MILLION PASSENGERS PER ANNUM
MSCP6 MULTI STOREY CAR PARK (SIX)
NATS NATIONAL AIR TRAFFIC SERVICES
NON ATM’S NON-COMMERCIAL FLIGHTS E.G. GENERAL AVIATION, AIR TAXI
A380 / B787 / A380 TYPES OF AIRCRAFT
ACC AIRLINE CONSULTATIVE COMMITTEE
ACL AIRPORT CO-ORDINATION LIMITED
AFC ANTICIPATED FINAL COST
ANNEX G BAA’S AGREEMENT ON ENHANCED INFORMATION DISCLOSURES AND CONSULTATION AT HEATHROW AND GATWICK AIRPORTS – UPDATE FOR Q5
AOC AIRLINE OPERATORS COMMITTEE
APD AIRPORT PASSENGER DUTY
APM AUTOMATED PEOPLE MOVER
CAA CIVIL AVIATION AUTHORITY
CAPEX CAPITAL EXPENDITURE
CAST COMPREHENSIVE AIRPORT SIMULATION TOOL
CATMS CARGO AIR TRANSPORT MOVEMENTS I.E. COMMERCIAL CARGO FLIGHTS
CPB CAPITAL PROGRAMME BOARD
CC COMPETITION COMMISSION
CCRS CHANGE CONTROL RECORD SHEET
CE CONSTRUCTIVE ENGAGEMENT
CIP CAPITAL INVESTMENT PROGRAMME
CIP08 2008 CAPITAL INVESTMENT PROGRAMME
CIP09 2009 CAPITAL INVESTMENT PROGRAMME
CIP10 2010 CAPITAL INVESTMENT PROGRAMME
CIP11 2011 CAPITAL INVESTMENT PROGRAMME
CEO CHIEF EXECUTIVE OFFICER
COPI CONSTRUCTION OUTPUT PRICE INDEX

129
SDP SECURITY DEVELOPMENT PROGRAMME
SERAS SOUTH EAST AND EAST OF ENGLAND REGIONAL AIR SERVICES
SH&E CONSULTANCY
ST SOUTH TERMINAL
SQR SERVICE QUALITY REBATE
SQWG SERVICE QUALITY WORKING GROUP
TRIGGER FINANCIAL INCENTIVES PLACED/ TRIGGERS ON BAA TO ENCOURAGE
UK UNITED KINGDOM
UKBA UNITED KINGDOM BORDER AGENCY
USA UNITED STATES OF AMERICA
NT NORTH TERMINAL
NTF NORTH TERMINAL FORECOURT
NTI NORTH TERMINAL INTERCHANGE
NTX NORTH TERMINAL EXTENSION
NWZ NORTH WEST ZONE
OPEX OPERATING COST
P5 PIER 5
P.A. PER ANNUM
PATM’S PASSENGER AIR TRANSPORT MOVEMENTS IE COMMERCIAL PASSENGER FLIGHTS
PAG PASSENGER ADVISORY GROUP
PAX PASSENGERS
PCBT PRICE CONTROL BUSINESS PLAN
PPH PASSENGERS PER HOUR
PRM PASSENGERS WITH RESTRICTED MOBILITY
Q5 THE 5TH QUINQUENNIUM (REGULATORY PERIOD)
BEYOND Q5 THE NEXT QUINQUENNIUM AFTER Q5 (REGULATORY PERIOD)
QSM QUALITY SERVICE MEASURE
R1 RISK HELD AT PROJECT LEVEL
R2 RISK HELD AT PORTFOLIO LEVEL
TRIGGER/ TRIGGERS TIMELY AND EFFICIENT (CONTINUED) DELIVERY OF STRATEGICALLY IMPORTANT PROJECTS.

130
NOTES

131
NOTES

GATWICk AIRPORTWest Sussex RH6 0NP
T +44 (0) 844 335 1802E [email protected]
The publication of this report supports our decade of change. We’ve used a recycled paper containing 100 % post consumer waste and manufactured in a mill certified with ISO 14001 environmental management standard. We’ve also used a local design agency and a local printing firm to produce this report.


