Submitted to: The City of Pickering, 1 The Esplanade Pickering, Ontario L1V 6K7 submitted by: Aquafor Beech Limited 11 February, 2013 Aquafor Beech Reference: 65273 2600 Skymark Avenue Bldg 6, Suite 202 Mississauga, ON L4W 5B2 2012 DUFFINS CREEK HYDROLOGY UPDATE FINAL REPORT
Transcript
Submitted to:
The City of Pickering,
1 The Esplanade Pickering, Ontario
L1V 6K7
submitted by:
Aquafor Beech Limited
11 February, 2013
Aquafor Beech Reference: 65273
2600 Skymark Avenue
Bldg 6, Suite 202
Mississauga, ON L4W 5B2
2012 DUFFINS CREEK HYDROLOGY UPDATE
FINAL REPORT
City Of Pickering / TRCA 11 February 2013 2012 Duffins Creek Hydrology Update
Aquafor Beech Limited
Table of Contents 1.0 INTRODUCTION ............................................................................................................ 1 2.0 HYDROLOGIC MODEL SETUP ....................................................................................... 2
2.1 Model Selection................................................................................................................ 2 2.2 Model Discretization ........................................................................................................ 2 2.3 Model Parameters ............................................................................................................. 2 2.4 Channel Routing ............................................................................................................... 4 2.5 Stormwater Management Facilities .................................................................................. 4 2.6 Stouffville Dam and Reservoir ......................................................................................... 5 2.7 Model Setup Summary ..................................................................................................... 5
3.0 MODEL CALIBRATION AND VALIDATION ................................................................ 7 3.1 Model Calibration ............................................................................................................ 7 3.2 Model Validation.............................................................................................................. 9 3.3 Calibration-Validation Summary ................................................................................... 10
City Of Pickering / TRCA 11 February 2013 2012 Duffins Creek Hydrology Update
Aquafor Beech Limited
APPENDICES: APPENDIX A: Hydrologic Model Setup: Model Parameters, Channel Routing, Soils and
Landuse Mapping APPENDIX B: Model Calibration: Hydrograph Separation APPENDIX C: Model Calibration: Rainfall Data Application APPENDIX D: Model Calibration: Observed vs. Simulated Calibration Event Results APPENDIX E: Model Calibration: Antecedent Rainfall Relationships APPENDIX F: Model Calibration: Observed vs. Simulated Validation Event Results APPENDIX G: Model Calibration: Review of Radar Data APPENDIX H: Design Storm Hyetographs
City Of Pickering / TRCA 11 February 2013 2012 Duffins Creek Hydrology Update
Aquafor Beech Limited 1
1.0 INTRODUCTION
Aquafor Beech Limited was retained by the City of Pickering and Toronto and Region
Conservation Authority (TRCA) to undertake a Hydrology Update Study for Duffins Creek. The
watershed is approximately 280 square kilometres and is situated within parts of Pickering, Ajax,
Uxbridge, Whitchurch-Stouffville, and Markham, as illustrated in Figure 1.1.
A hydrologic model based on HYMO was initially developed for Duffins Creek in 1979 (James
F. MacLaren Limited, 1979). The 1979 model was subsequently updated by Aquafor Beech Ltd
using the INTERHYMO/OTTHYMO model in 1991, and again in 2002 using the VISUAL
OTTHYMO model. Since that time, urban development within the watershed has increased,
including the construction of new stormwater management facilities. Planning has also
continued to progress in support of further urban development and associated stormwater
management within an area referred to as the Seaton Lands (Figure 1.1).
The current Duffins Creek Hydrology Update Study is being undertaken with the following key
objectives:
• Update the hydrologic modelling to reflect the landuse changes since the 2002 study;
• Calibrate the updated model using rainfall-runoff data from recent storm events;
• Test and update the stormwater management criteria developed as part of the previous
2002 study;
• Assess impacts to Regional Storm flows associated with proposed future urban
development; and
• Develop flood (quantity) control criteria to be implemented within proposed future
development lands.
HWY 47
HWY 7
Regional Road 5
Bro ck Rd
York-Dur ham Line
Kingston Rd
HWY 401
HWY 407
HWY 48
B ro ck Rd
Taunton Rd
Rossland Rd
FD u f f i n s C r e e k W a t e r s h e dD u f f i n s C r e e k W a t e r s h e d
Whitchurch-Stouffville
Uxbridge
Ajax
Pickering
D U R H A MY O R K
Markham
Stouffville
Whitevale
Brougham
Claremont
Goodwood
Ajax
Pickering
Duf f ins Creek Watershed
Figure 1.1: Duffins Creek Watershed
0 2 4 6 81kms
River / Stream
Roads
Municipal Boundary
Duffins Creek Watershed
Federal Airport Lands
Seaton Lands
Legend:
Jan 2013
Whitby
City Of Pickering / TRCA 11 February 2013 2012 Duffins Creek Hydrology Update
Aquafor Beech Limited 2
2.0 HYDROLOGIC MODEL SETUP
2.1 Model Selection
The hydrologic model selected for application in the study was VISUAL OTTHYMO, version
2.4. The model simulates watershed runoff response to individual storm events, and is an
updated version of the same model applied as part of the previous 2002 Hydrology Update
Study.
The main advantage of version 2.4 from the previous versions of the VISUAL OTTHYMO is
that version 2.4 allows the use of unlimited rain gauges, a function which allows users to more
accurately reflect rainfall distribution across a watershed (previous versions limited the user to 4
rain gauges).
2.2 Model Discretization
As illustrated in Figure 2.1, the Duffins Creek Watershed was divided into 56 subcatchments in
order to provide peak flow estimates at key locations throughout the watershed. The
subcatchment boundaries are based on a detailed delineation of drainage boundaries from
Toronto and Region Conservation Authority’s (TRCA) GIS database, using updated topographic
information and a digital elevation model (DEM).
2.3 Model Parameters
The following techniques and model parameters were applied with the VISUAL OTTHYMO
model to simulate rural and urban rainfall-runoff responses:
• the CN* approach was used to determine direct runoff from pervious areas;
• the Nash unit hydrograph was applied to simulate runoff response from rural areas;
HWY 47
HWY 7
Regional Road 5
Bro ck Rd
York-Durham Line
Kingston Rd
HWY 401
HWY 407
HWY 48
B ro ck Rd
29
52
28
22
27
17
51
26
48
21
20
19
4750
24
18
14
13
46
45
25
44
1211
39
7
34
10
5631
35
43
40
54
42
6 32
41
5
4
2
1
23
49
53
55
3
9
8
30
38
37
36
33
16
15
FD u f f i n s C r e e k W a t e r s h e dD u f f i n s C r e e k W a t e r s h e d
Whitchurch-Stouffville
Uxbridge
Ajax
Pickering
D U R H A M
Y O R K
Markham
Stouffville
Whitevale
Brougham
Claremont
Goodwood
Ajax
Pickering
Subcatchment Boundaries
Figure 2.1 : Duffins Creek Hydrologic Model - Subcatchment Boundaries
0 2 4 6 81kms
River / Stream
Roads
Municipal Boundary
Subcatchment Boundary
Duffins Creek Watershed
Legend:
Nov 2012
City Of Pickering / TRCA 11 February 2013 2012 Duffins Creek Hydrology Update
Aquafor Beech Limited 3
• the Standard unit hydrograph was applied to simulated runoff response from urban areas;
and
• subcatchment time-to-peak was determined using an equation for basin lag time
described by Watt and Chow (1985).
The soils and landuse mapping in the TRCA geographical information system (GIS) database
was used to derive the model parameters, including drainage areas, CN* values, percent
imperviousness, basin slopes, and channel slopes. Table 2.1 summarizes the assumed CN values
based on soil types and land cover. These were used to derive an initial estimate of the CN*
values for each catchment in the hydrologic model. Table 2.1 also summarizes the assumed
percent impervious values based on landuse. A summary of subcatchment parameters is
provided in Appendix A. Soils mapping, landuse maps and land cover maps used to derive the
model parameters are also provided in Appendix A.
Table 2.1
Summary of Applied CN* Values and Impervious Percentage by Soils Type and Landuse
City Of Pickering / TRCA 11 February 2013 2012 Duffins Creek Hydrology Update
Aquafor Beech Limited 4
2.4 Channel Routing
Hydrographs were routed through channel elements within the model using the Variable Storage
Coefficient method. Previous TRCA HEC-RAS hydraulic modelling was used to estimate
typical channel/valley cross-section dimensions for use in the VISUAL OTTYMO channel
routing routines. A summary of the information used for the channel routing elements is
provided in Appendix A.
2.5 Stormwater Management Facilities
Where information was available, existing stormwater management facilities were incorporated
into the updated hydrologic model using reservoir routing elements. Information including
contributing drainage area, control functionality, and pond rating curves were estimated from a
review of TRCA’s stormwater pond database and the previous 2002 hydrologic model. Table
2.2 summarizes the stormwater management facilities incorporated into the hydrologic model.
In summary, a total of twenty-seven existing facilities were included in the existing conditions
model.
A further ten approved facilities were included in the simulations for future landuse conditions
(see Section 4.3). These facilities represent those which have been approved between the years
2010, and 2012, such as ponds associated with the Duffins Heights and Ajax A9 development
areas, or facilities which had approval prior to 2010, but have not been constructed
In addition to the ponds outlined above, a number of reservoir routing elements were included in
the model as part of the stormwater assessment completed for the Seaton development area. It is
understood that over 60 stormwater management facilities are proposed for the Seaton lands,
however, for the stormwater management assessment, a single reservoir routing command was
included per catchment to simulate the quantity control storage for all of the aggregate or
“lumped” future urban development lands within those catchment. The stormwater management
assessment for the Seaton Lands is discussed in further detail in Section 5.
City of Pickering / TRCA 11 February 20132012 Duffins Creek Hydrology Update
Pond ID Pond Name Municipality Catchment Facility Type Drainage Area Source of Rating Curve Info. Model ScenarioNo. (Wet/Dry) Quality Erosion Flood (ha) (existing/future)
93.2 Pond 3 - Forest Ridge Subdivision Town of Ajax 8015 3 Wetland Yes No Yes 43.3 2002 hydrologic model Existing, Future103 Voss Water Quality Pond City of Pickering 8009 4 Wet Pond Yes No Yes 5.3 2002 hydrologic model Existing, Future
263.1 Rougecrest Pond (Pond 2 of Liverpool Community) City of Pickering 8008 4 Dry Pond No Yes No 53.8 2002 hydrologic model Existing, Future263 J.D.S. Investments Detention Pond: (Pond 1 Of Liverpool Community) City of Pickering 8007 5 Dry Pond No Yes No 35.2 2002 hydrologic model Existing, Future
228.3 Stouffville SC1 Town of Whitchurch Stouffville 8031 15 n/a n/a Yes Yes 65 TRCA Existing, Future228.4 Stouffville SC2 Town of Whitchurch Stouffville 8032 15 n/a n/a Yes Yes 43 2002 hydrologic model Existing, Future166 West Hill Developments Pond Town of Whitchurch Stouffville 8003 16 Wet Pond Single Celled Yes Yes Yes 52 2002 hydrologic model Existing, Future185 Dulverton Holdings Swm Pond - Lehman's Pond Town of Whitchurch Stouffville 8001 16 Wet Pond Yes Yes Yes 5.8 2002 hydrologic model Existing, Future
228.2 Hillmount Properties Town of Whitchurch Stouffville 8002 17 Wet Pond Yes Yes Yes 44.5 TRCA Existing, Future228 Tresstown Pond Town of Whitchurch Stouffville 8030 18 n/a n/a Yes Yes 54.92* TRCA Existing, Future
228.1 Countryview Estates Pond Town of Whitchurch Stouffville 8043 20 Wet Pond Yes Yes Yes 33.1 2002 hydrologic model Future295 Uxville Properties - West Pond Township of Uxbridge 8004 22 Dry Pond No Yes No 36 2002 hydrologic model Existing, Future
295.1 Uxville Properties - East Pond Township of Uxbridge 8005 22 Dry Pond No Yes No 133.6 2002 hydrologic model Existing, Future1287 Goodwood SWM Facility n/a 8042 29 n/a n/a n/a n/a 24.5 TRCA Future1288 Duffin Heights SWM Facility 1 City of Pickering 8039 33 Wet Pond Yes Yes Yes 28.15 TRCA Future1289 Duffin Heights SWM Facility 2 City of Pickering 8040 33 Wet Pond Yes Yes Yes 17.5 TRCA FutureA9A A9 - Pond A n/a 8035 36 n/a n/a n/a n/a 11.9 TRCA Future133 Barrett Meadows Pond City of Pickering 8010 36 Wet Pond Yes Yes Yes 21.2 2002 hydrologic model Existing, Future320 Duffin Meadow Cemetery n/a 8011 36 Wet Pond Yes Yes Yes 12 2002 hydrologic model Existing, Future
1291 Duffin Heights SWM Facility 4 City of Pickering 8037 36 Wet Pond n/a n/a n/a 38.5 TRCA Future1290 Duffin Heights SWM Facility 3 City of Pickering 8041 37 Wet Pond n/a n/a n/a 38.6 TRCA Future
93 Pond 1 - Forest Ridge Subdivision Town of Ajax 8013 41 Wet Pond Yes Yes Yes 91.6 2002 hydrologic model Existing, Future93.1 Pond 2 - Forest Ridge Subdivision Town of Ajax 8014 41 Wet Pond Yes No Yes 9.7 2002 hydrologic model Existing, Future92 Devonside Estates Pond Town of Ajax 8012 42 Wet Pond Yes Yes Yes 21.81 2002 hydrologic model Existing, Future
A9B A9 - Pond B Town of Ajax 8036 42 n/a Yes Yes n/a 15.6 TRCA FutureA9C A9 - Pond C Town of Ajax 8038 42 n/a Yes Yes n/a 12.2 TRCA Future167 A7 Development Area Extended Detention Pond Town of Ajax 8019 54 Wet Pond Yes No Yes 39.6 2002 hydrologic model Existing, Future
207.2 Pond 3 - Neighbourhood 2 Area A6 Town of Ajax 8020 54 Wet Pond Yes No Yes 49.2 2002 hydrologic model Existing, Future207.3 Pond 4 - A6N2 South SWM Facility Town of Ajax 8021 54 Hybrid Yes No Yes 64.9 2002 hydrologic model Existing, Future279 A6 Community Nbh 1 - Pond 1 Town of Ajax 8018 55 Wet Pond Yes Yes Yes 16.3 TRCA Existing, Future
279.1 A6 Community Nbh 1 - Pond 2 Town of Ajax 8022 54 Wet Pond Yes Yes Yes 69 TRCA Existing, Future279.2 Landwin Swm Pond Town of Ajax 8023 54 Wet Pond Yes Yes Yes 24.3 2002 hydrologic model Existing, Future279.3 A6 Community Nbh 1 - Pond 4 (Schmigelsky) Town of Ajax 8024 54 Wet Pond Yes Yes Yes 10 2002 hydrologic model Existing, Future184 Miller's Creek Pond - Area 8 Town of Ajax 8033 55 n/a Yes Yes Yes 70.11 TRCA Existing, Future
207.1 Pond 2 - Neighbourhood 2 Area A6 Town of Ajax 8017 55 Wet Pond Yes No Yes 70.5 2002 hydrologic model Existing, Future1271 Stokegrove Town of Ajax 8016 55 Dry Pond No Yes No 6.1 TRCA Existing, Future1273 Tauton-Westney Commercial Town of Ajax 8034 55 Wet Pond Yes Yes Yes 6.6 TRCA Future
* Note - Drainage area for Existing Landuse Scenario = 34.1 ha. Drainage area for Future Landuse Scenario = 54.9 ha
Aquafor Beech Limited.
Table 2.2 Summary of Stormwater Management Facilities
Control TypeModel HYD Ref No.
City Of Pickering / TRCA 11 February 2013 2012 Duffins Creek Hydrology Update
Aquafor Beech Limited 5
2.6 Stouffville Dam and Reservoir
The updated Duffins Creek hydrologic model included a reservoir routing element to simulate
the Stouffville dam and reservoir, located on Stouffville Creek, in the upper west portion of the
Table 3.4 - Comparison of Observed vs. Simulated Runoff Volumes
May 15-17, 2003 May 23-24, 2003 July 29-30, 2006 July 22-23, 2008 June 24, 2010 June 27-28, 2010 July 23, 201029.0 mm 55.8 mm54.0 mm 30.0 mm 19.8 mm 16.4 mm 35.2 mm
Duffins Creek Calibration: May 15‐17, 2003Ob d Si l t d R ff V l
Duffins Creek Calibration: May 23‐24, 2003Ob d Si l d R ff V l
Duffins Creek Calibration: July 29‐30, 2006 Duffins Creek Calibration: July 22‐23, 2008
5
10
15
20
25
30
35
40
Simulated Runoff (mm)
Duffins Creek Calibration: May 15‐17, 2003Observed vs. Simulated Runoff Volumes
5
10
15
20
25
30
35
40
Simulated Runoff (mm)
Duffins Creek Calibration: May 23‐24, 2003Observed vs. Simulated Runoff Volumes
5
10
15
20
25
30
35
40
Simulated Runoff (mm)
Duffins Creek Calibration: July 29‐30, 2006Observed vs. Simulated Runoff Volumes
5
10
15
20
25
30
35
40
Simulated Runoff (mm)
Duffins Creek Calibration: July 22‐23, 2008Observed vs. Simulated Runoff Volumes
0
5
0 5 10 15 20 25 30 35 40
Observed Runoff (mm)
0
5
0 5 10 15 20 25 30 35 40
Observed Runoff (mm)
0
5
0 5 10 15 20 25 30 35 40
Observed Runoff (mm)
0
5
0 5 10 15 20 25 30 35 40
Observed Runoff (mm)
20
25
30
35
40
ated Runoff (mm)
Duffins Creek Calibration: May23‐24, 2003Observed vs. Simulated Runoff Volumes
20
25
30
35
40
ated Runoff (mm)
Duffins Creek Calibration: July 29‐30, 2006Observed vs. Simulated Runoff Volumes
20
25
30
35
40
ated Runoff (mm)
Duffins Creek Calibration: July 22‐23, 2008Observed vs. Simulated Runoff Volumes
Table 3.5 - Comparison of Observed vs. Simulated Peak Flow Rates
June 24, 2010 June 27-28, 2010 July 23, 2010May 15-17, 2003 May 23-24, 2003 July 29-30, 2006 July 22-23, 200829.0 mm 55.8 mm54.0 mm 30.0 mm 19.8 mm 16.4 mm 35.2 mm
Duffins Creek Calibration: May 15‐17, 2003Observed vs. Simulated Peak Flows
Duffins Creek Calibration: May 23‐24, 2003Observed vs. Simulated Peak Flows
Duffins Creek Calibration: July 29‐30, 2006Observed vs. Simulated Peak Flows
Duffins Creek Calibration: July 22‐23, 2008Observed vs. Simulated Peak Flows
10
20
30
40
50
60
70
80
Simulated Peak Flow (m3/s)
Duffins Creek Calibration: May 15‐17, 2003Observed vs. Simulated Peak Flows
10
20
30
40
50
60
70
80
Simulated Peak Flow (m3/s)
Duffins Creek Calibration: May 23‐24, 2003Observed vs. Simulated Peak Flows
10
20
30
40
50
60
70
80
Simulated Peak Flow (m3/s)
Duffins Creek Calibration: July 29‐30, 2006Observed vs. Simulated Peak Flows
10
20
30
40
50
60
70
80
Simulated Peak Flow (m3/s)
Duffins Creek Calibration: July 22‐23, 2008Observed vs. Simulated Peak Flows
0
10
0 10 20 30 40 50 60 70 80
Observed Peak Flow (m3/s)
0
10
0 10 20 30 40 50 60 70 80
Observed Peak Flow (m3/s)
0
10
0 10 20 30 40 50 60 70 80
Observed Peak Flow (m3/s)
0
10
0 10 20 30 40 50 60 70 80
Observed Peak Flow (m3/s)
40
50
60
70
80
Peak Flow (m3/s)
Duffins Creek Calibration: May 23‐24, 2003Observed vs. Simulated Peak Flows
40
50
60
70
80
Peak Flow (m3/s)
Duffins Creek Calibration: July 29‐30, 2006Observed vs. Simulated Peak Flows
20
25
30
35
40
Peak Flow (m3/s)
Duffins Creek Calibration: July 22‐23, 2008Observed vs. Simulated Peak Flows
0
10
20
30
40
0 10 20 30 40 50 60 70 80
Simulated Peak Fl
Observed Peak Flow (m3/s))
0
10
20
30
40
0 10 20 30 40 50 60 70 80
Simuluated Peak Fl
Observed Peak Flow (m3/s)
0
5
10
15
20
0 5 10 15 20 25 30 35 40
Simulated Peak Flo
Observed Peak Flow (m3/s)
Storm:Rainfall Depth (mm)
Observed Simulated Difference Observed Simulated Difference Observed Simulated Difference Observed Simulated Difference Observed Simulated Difference Observed Simulated Difference Observed Simulated DifferenceTime to Time to Time to Time to Time to Time to Time to Time to Time to Time to Time to Time to Time to Time toPeak (h) Peak (h) Peak (h) Peak (h) Peak (h) Peak (h) Peak (h) Peak (h) Peak (h) Peak (h) Peak (h) Peak (h) Peak (h) Peak (h)
Table 3.6 - Comparison of Observed vs. Simulated Time-to-Peak
June 27-28, 2010 July 23, 2010May 15-17, 2003 May 23-24, 2003 July 29-30, 2006 July 22-23, 2008 June 24, 201029.0 mm 55.8 mm54.0 mm 30.0 mm 19.8 mm 16.4 mm 35.2 mm
Duffins Creek Calibration: May 15‐17, 2003Observed vs. Simulated Time‐to‐Peak
Duffins Creek Calibration: May 23‐24, 2003Observed vs. Simulated Time‐to‐Peak
Duffins Creek Calibration: July 29‐30, 2006Observed vs. Simulated Time‐to‐Peak
Duffins Creek Calibration: July 22‐23, 2008Observed vs. Simulated Time‐to‐Peak
10
20
30
40
50
60
Simulated Tim
e to Peak (h)
Duffins Creek Calibration: May 15‐17, 2003Observed vs. Simulated Time‐to‐Peak
10
20
30
40
50
60
Simulated Tim
e to Peak (h)
Duffins Creek Calibration: May 23‐24, 2003Observed vs. Simulated Time‐to‐Peak
10
20
30
40
50
60
Simulated Tim
e to Peak (h)
Duffins Creek Calibration: July 29‐30, 2006Observed vs. Simulated Time‐to‐Peak
10
20
30
40
50
60
Simulated Tim
e to Peak (h)
Duffins Creek Calibration: July 22‐23, 2008Observed vs. Simulated Time‐to‐Peak
0
0 10 20 30 40 50 60
Observed Time to Peak (h)
0
0 10 20 30 40 50 60
Observed Time to Peak (h)
0
0 10 20 30 40 50 60
Observed Time to Peak (h)
0
0 10 20 30 40 50 60
Observed Time to Peak (h)
30
40
50
60
lated Tim
e to Peak (h)
Duffins Creek Calibration: June 24, 2010Observed vs. Simulated Time‐to‐Peak
30
40
50
60
ulated Tim
e to Peak (h)
Duffins Creek Calibration: June 27‐28, 2010Observed vs. Simulated Time‐to‐Peak
30
40
50
60
ated
Tim
e to Peak (h)
Duffins Creek Calibration: June 23, 2010Observed vs. Simulated Time‐to‐Peak
0
10
20
0 10 20 30 40 50 60
Simulated T
Observed Time to Peak (h)
0
10
20
0 10 20 30 40 50 60
Simulated T
Observed Time to Peak (h)
0
10
20
0 10 20 30 40 50 60
Simulated Ti
Observed Time to Peak (h)
City Of Pickering / TRCA 11 February 2013 2012 Duffins Creek Hydrology Update
Aquafor Beech Limited 9
3.2 Model Validation
Upon completion of the calibration process, the model was verified using three additional
rainfall-runoff events from 2000. Data from six streamflow gauges are available for the
validation events (Table 3.1), however, only one rainfall gauge was operational at the time
(Table 3.2).
As noted in Section 3.1 above, the runoff volume for each event was calibrated by adjusting the
CN* parameter (Table 3.3). In doing so, the calibration process was accounting for the varying
antecedent moisture conditions present at the time of each calibration storm event. All other
model parameters were held constant through the calibration process.
Therefore, before the verification could be undertaken, a set of CN* adjustments had to be
selected which would reflect the antecedent moisture conditions for each of the verification
storm events. In order to estimate appropriate CN* adjustments for these events, relationships
were developed from the calibration results. Specifically, relationships were developed between
the CN* adjustments and the amount of precipitation recorded at the rain gauges in the days
preceding the calibration storm events. A 10-day antecedent precipitation index (API) was used
for each storm (Bruce et al). Plots of these relationships are provided in Appendix E. Results
from the corresponding calibration exercise from the 2002 Duffins Creek Hydrology Update
Study (Aquafor Beech Ltd.) were also added to the plots to provide a greater range in values.
The CN* adjustment values selected for the three 2000 validation storm events are also
illustrated in the plots.
Results from the model verification process are tabulated and illustrated in Table 3.7, 3.8 and 3.9
which provides a summary of the observed versus simulated runoff depths, peak flow rates and
times-to-peak for each event. Corresponding observed versus simulated runoff hydrograph plots
for each verification event are also provided in Appendix F. As shown, although the model
tended to marginally underestimate peak flows and volumes at some gauge sites for the
Reesor Creek (HY999) 9 7.94 -12.0% 7.84 5.21 -34% 6.51 5.62 -14%Duffiins Creek Above Pickering (HC019) 16.47 20.32 23.4% 24.64 27.12 10% 18.90 20.44 8%Duffins Creek at Ajax (HC049) 68.24 50.27 -26.3% 68.91 58.03 -16% 54.78 46.32 -15%West Duffins Above Green River (HC038) 8.84 8.16 -7.7% 10.32 7.63 -26% 7.04 6.30 -10%Urfe Creek (HY065) 9.35 4.44 -52.5% 7.16 5.17 -28% 5.04 4.24 -16%Brougham Creek (HY010) 7.03 5.16 -26.7% 9.02 5.11 -43% 6.22 5.03 -19%
Table 3.8 - Comparison of Observed vs. Simulated Peak Flow for Validation Events
May 11, 2000 June 13, 2000 June 24, 200061.8 mm 45.4 mm 41.0 mm
80
Duffins Creek Validation: May 11, 2000Observed vs. Simulated Peak Flow Rate
80
Duffins Creek Validation: June 13, 2000Observed vs. Simulated Peak Flow Rate
80
Duffins Creek Validation: June 24, 2000Observed vs. Simulated Peak Flow Rate
20
30
40
50
60
70
80
Simulated Peak Flow (m3/s)
20
30
40
50
60
70
80
Simulated Peak Flow (m3/s)
20
30
40
50
60
70
80
Simulated Peak Flow (m3/s)
0 080 80
0
10
20
0 10 20 30 40 50 60 70 80
Observed Peak Flow (m3/s)
0
10
20
0 10 20 30 40 50 60 70 80
Observed Peak Flow (m3/s)
0
10
20
0 10 20 30 40 50 60 70 80
Observed Peak Flow (m3/s)
Storm:Rainfall Depth (mm)
Observed Simulated Difference Observed Simulated Difference Observed Simulated DifferenceTime to Time to Time to Time to Time to Time toPeak (h) Peak (h) Peak (h) Peak (h) Peak (h) Peak (h)
Time: HoursReesor Creek (HY999) 51 51.50 0.50 11.00 13.75 2.75 36.00 34.25 -1.75Duffiins Creek Above Pickering (HC019) 53.00 52.25 -0.75 13.00 14.00 1.00 35.00 35.25 0.25Duffins Creek at Ajax (HC049) 56.25 54.75 -1.50 17.25 16.50 -0.75 37.25 37.75 0.50West Duffins Above Green River (HC038) 49.00 54.50 5.50 10.00 16.25 6.25 34.00 38.00 4.00Urfe Creek (HY065) 54.00 51.00 -3.00 16.00 13.25 -2.75 35.00 34.00 -1.00Brougham Creek (HY010) 51.00 50.25 -0.75 14.00 12.75 -1.25 34.00 33.25 -0.75
May 11, 2000 June 13, 2000 June 24, 2000
Table 3.9 - Comparison of Observed vs. Simulated Time to Peak for Validation Events
61.8 mm 45.4 mm 41.0 mm
60
Duffins Creek Validation: May 11, 2000Observed vs. Simulated Time to Peak
60
Duffins Creek Validation: June 13, 2000Observed vs. Simulated Time to Peak
60
Duffins Creek Validation: June 24, 2000Observed vs. Simulated Time to Peak
20
30
40
50
60
Simulated Tim
e to Peak (h)
Observed vs. Simulated Time to Peak
20
30
40
50
60
Simulated Tim
e to Peak (h)
Observed vs. Simulated Time to Peak
20
30
40
50
60
Simulated Tim
e to Peak (h)
Observed vs. Simulated Time to Peak
45 45 0 0 25 2560 60 25 25 45 45
0
10
0 10 20 30 40 50 60
Observed Time to Peak (h)
0
10
0 10 20 30 40 50 60
Observed Time to Peak (h)
0
10
0
0 10 20 30 40 50 60
Simulated Time to Peak (h)
City Of Pickering / TRCA 11 February 2013 2012 Duffins Creek Hydrology Update
Aquafor Beech Limited 10
validation events, it does provide a good representation of the rainfall-runoff response for the
events.
3.3 Calibration-Validation Summary
As demonstrated through the calibration and validation process, good model results were
achieved, on average, for the various storm events and gauge sites.
Differences between the observed and simulated streamflow results were investigated further by
the City of Pickering through a review of available radar data for each of the calibration and
validation storm events. This was important for the validation events, in particular, where data
from only a single rainfall gauge was available to simulate the storm events over the whole
watershed. The results of this review are provided in Appendix G, and include a description of
how each storm moved through the Duffins Creek watershed and a comparison of the rainfall
amounts recorded with the radar data versus the rainfall gauges used in the modelling. In many
cases, the storm direction, rainfall patterns, and differences between rainfall amounts can help to
explain some of the differences between the observed streamflows and the model results.
In general, the simulated hydrograph characteristics (i.e. volume, peak flow, shape) were found
to be reasonable given the variability and uncertainty associated with rainfall data and
streamflow measurements. In summary, the calibrated hydrologic model can be considered
representative of the watershed.
City Of Pickering / TRCA 11 February 2013 2012 Duffins Creek Hydrology Update
Aquafor Beech Limited 11
4.0 HYDROLOGIC ASSESSMENT AND DESIGN STORM FLOW ESTIMATES
Peak flows were established at key locations in the study area for the existing and projected
future landuse scenarios. A design storm approach was used to estimate the 2, 5, 10, 25, 50, and
100-year peak flows, and the Regulatory Storm. The Regulatory Storm in the study area for
floodplain management purposes is based on Hurricane Hazel.
With a design storm approach, a rainfall input (i.e. duration, return period depth, and temporal
distribution) is selected and design flows are determined using specified antecedent moisture
conditions and a computational technique such as a hydrologic model. It is assumed with this
approach that peak flows which are generated are of approximately the same return period as the
applied design storm.
While the antecedent conditions present at the time of the storm events used in the calibration-
validation process were measurable from recorded data, the antecedent conditions prior to a
future storm event or a synthetic design storm event are unknown and therefore assumptions
must be made. For the purposes of this study, average antecedent moisture conditions were
assumed for the 2-year through 100-year design storms, while saturated antecedent moisture
conditions were assumed for the Regional Storm event. The CN parameters within the model
were set accordingly for these combinations of design storms and antecedent conditions.
4.1 Design Storm Selection
The 12-hour AES design storm was selected for application to the Duffins Creek watershed. The
AES distribution was selected over both the U.S. Soil Conservation Service (SCS) and Chicago
distributions, as it is more suitable for a Southern Ontario study area. The 12-hour duration was
selected as it is representative of the predominant type of storm which will cause flooding on a
primarily rural watershed of this size. Further, the 12-hour storm was typically found to be the
critical duration in previous hydrologic studies of Duffins Creek (Aquafor, 1991). Hyetographs
for the 2-year through 100-year and Regulatory Storm events are provided in Appendix H.
City Of Pickering / TRCA 11 February 2013 2012 Duffins Creek Hydrology Update
Future (Official Plan) Landuses 2002 Unit Flows over Seaton Lands none 36.9 61.1 76.6 100.5 118.2 137.5
Future (Official Plan) Landuses 2012 Unit Flows over Seaton Lands none 36.0 60.0 75.3 98.8 116.4 135.5
* Areal Reduction Factor applied to Regional Storm
3.5 100.0%
97.1%
3.6 100.0%
3.4 100.0%
97.1%
119.5 89.4%
255.6 89.4%
4.6 100.0%
7.8 99.2%
12.7 98.2%
16.1 98.2%
258.0 86.7%
280.2 86.7%
* Note:
1. For proposed small drainage diversions between adjacent catchments which both require quantity control, the 2-year through 100-year release rates and storage targets for the receiving catchment should be applied.
2. For proposed small drainage diversions directly to the Duffins Creek West Branch, quantity control is not required.
3. For proposed small drainage diversions to small tributaries of the Duffins Creek West Branch, quantity control is required, and the 2-year through 100-year release rates and storage targets for the originating catchment should be applied.
Existing Pre-developmentRural Urban (rural) Area (ha) Area (ha) % Impervious (L/s/ha) (L/s/imp-ha) (m3/ha) (m3/imp-ha)
Storm Event Unit Flow Release Rate Target Storage Requirements2012 Unit Flow Stormwater Management*
83
3301 3304 359 153.0 81
* Note:
1. For proposed small drainage diversions between adjacent catchments which both require quantity control, the 2-year through 100-year release rates and storage targets for the receiving catchment should be applied.
2. For proposed small drainage diversions directly to the Duffins Creek West Branch, quantity control is not required.
3. For proposed small drainage diversions to small tributaries of the Duffins Creek West Branch, quantity control is required, and the 2-year through 100-year release rates and storage targets for the originating catchment should be applied.
Existing Pre-developmentRural Urban (rural) Area (ha) Area (ha) % Impervious (L/s/ha) (L/s/imp-ha) (m3/ha) (m3/imp-ha)
City Of Pickering / TRCA 11 February 2013 2012 Duffins Creek Hydrology Update
Aquafor Beech Limited 20
• for small drainage diversions between adjacent catchments which both require flood
control (i.e. those listed in Table 5.2), the 2-year through 100-year release rates and
storage targets for the receiving catchment should be applied, and should be based on the
existing conditions drainage area to that catchment.
• for small drainage diversions directly to the Duffins Creek West Branch, flood control is
not required.
• for small drainage diversions which discharge indirectly to the Duffins Creek West
Branch (i.e. via small tributaries or gullies), flood control is required, and the 2-year
through 100-year release rates and storage targets for the originating catchment should
be applied. The rates should be based on the existing conditions drainage area of the
receiving catchment.
City Of Pickering / TRCA 11 February 2013 2012 Duffins Creek Hydrology Update
Aquafor Beech Limited 21
6.0 SUMMARY AND CONCLUSIONS
1. A hydrologic model was setup for the Duffins Creek Watershed using the Visual
Otthymo model, version 2.4, with model parameters derived from TRCA’s GIS database.
The model was calibrated and verified based on a series of rainfall events which occurred
between 2000 and 2010.
2. Design flows for the 2-year to 100-year return periods and the Regional Storm were
estimated for three scenarios using landuse information from TRCA’s GIS database:
• Existing landuses;
• Future landuses as defined in municipal Official Plans; and
• Future Landuses with Airport which include a conservative assessment of the
development of the Airport Lands.
3. Based on the Future (Official Plan) landuse scenario, without stormwater management
controls, large increases in peak flows are anticipated where significant future
development is planned within smaller tributaries, including Whitevale, Urfe, and
Ganatsekiagon Creeks. Smaller increases are also anticipated within Stouffville, Reesor,
and Millers Creeks. Negligible changes are predicted for the major tributary reaches.
4. Based on the “Future Landuses with Airport” scenario, without stormwater management
controls, peak flow increases are expected at most locations throughout the watershed for
both the 100-year event and Regional Storm.
5. A stormwater control strategy using the unit flow relationships derived as part of the
2002 Hydrology Update Study for Duffins Creek was tested over the future development
areas within the Seaton Lands. This strategy was found to only partially mitigate the
increases in peak flows that would occur due to the urban development, with many flood
City Of Pickering / TRCA 11 February 2013 2012 Duffins Creek Hydrology Update
Aquafor Beech Limited 22
flows on Whitevale, Urfe, and Ganetsekiagon Creeks still exceeding the pre-development
rates by up to approximately 30%.
6. A second stormwater control strategy based on pre-development unit flow rates from the
updated 2012 model results was also tested over the future development areas within the
Seaton Lands. This strategy was found to successfully mitigate the large flow increases
that would otherwise occur on Whitevale, Urfe, and Ganetsekiagon Creeks. Further, the
2012 strategy is marginally better at matching existing flow rates on the West, East and
downstream Main Branches.
City Of Pickering / TRCA 11 February 2013 2012 Duffins Creek Hydrology Update
Aquafor Beech Limited 23
7.0 RECOMMENDATIONS
1. The hydrologic model should be further verified when rainfall and streamflow data
becomes available for future storm events which are larger than those used for the
calibration. In addition, TRCA should consider the placement of additional precipitation
and stream gauges, located at key locations within the watershed. Specifically, locations
such as Millers Creek, and sub watersheds within the Airport Lands should be
considered.
2. On a routine basis, the model should be updated by development proponents as future
development proceeds and future stormwater management facilities are constructed. The
Seaton development lands are expected to contain a significant number of ponds,
including multiple ponds in each catchment. In order to simplify the modelling
procedures, and maintain the same approach used to generate unit flow rates, the model is
to be updated by pond designers using a “lumped” approach to modelling for this
development area. These catchments generally contain three commands in VISUAL
OTTHYMO to model the hydrology: one Nashyd and two Standhyd commands. Of the
two Standhyd commands, one represents all drainage directed to ponds, and one
represents uncontrolled drainage.
As part of each development application, the three commands for each catchment are to
be updated based on the information collected as part of the detailed design for each pond
- no additional commands are required. In the event that a given catchment does not
currently have three commands assigned, the model may be updated to maintain the
format described above (1 for developed areas with ponds, 1 for developed areas without
ponds, 1 for undeveloped areas). The proponent must reassess the watershed hydrology
to ensure that no increases (both locally and/or globally) have occurred due to the
development.
At the functional servicing and draft plan stage, the proponent should complete the
City Of Pickering / TRCA 11 February 2013 2012 Duffins Creek Hydrology Update
Aquafor Beech Limited 24
modelling as described above based on the preliminary information available. The report
should outline the criteria for the pond and provide volumes to establish appropriate
block sizing at a conceptual level. The hydrology model is not to be formally updated
until the detailed design stage.
3. As part of the Future Official Plan landuse scenario, the following stormwater
management recommendations should be applied to future urban development within the
Seaton Lands:
• Post-to-pre flood control for the 2-year through 100-year events should be
implemented for drainage to the following tributaries:
o Unnamed Tributaries No. 1, 2 and 3 to West Duffins Creek (catchments 32, 8
and 9);
o Whitevale Creek Main and East Branches (catchments 30 and 31);
o Ganatsekiagon Creek Main, West and East Branches (catchments 33, 34 and
35);
o Urfe Creek Upper Main, Upper West, Upper East, and Lower East Branches
(catchments 37, 38, 39 and 40); and
o Brougham Creek (catchment 44).
• Future stormwater management facilities within the above catchments should be
designed using the unit release rates and storage targets summarized in Table 5.2.
• In the case of proposed future drainage diversions within the Seaton Lands:
o small diversions between adjacent catchments should be controlled using the
target criteria for the receiving catchment;
o for small diversions directly to the Duffins Creek West Branch, flood control
is not required;
o small diversions which drain indirectly to the Duffins Creek West Branch via
smaller tributaries or gullies will require flood control, and the targets for the
originating catchment should be applied.
• Flood control for the Regional Storm is not required within the Seaton Lands.
City Of Pickering / TRCA 11 February 2013 2012 Duffins Creek Hydrology Update
Aquafor Beech Limited 25
4. A further hydrology update should be considered, if and when the Airport Lands are
brought forward for development.
5. The 2012 Duffins Creek Hydrology Update Report has included reasonable assumptions
based on the best information available from current land use plans to delineate future
land use conditions. Any material deviations from the future land use conditions that
have been outlined in this report may be subject to a Flood Remediation Environmental
Assessment or Regional Control Analysis to be prepared to the satisfaction of the
affected Municipality and TRCA. Pre-consultation to determine the need for these
studies should be arranged with TRCA.
Respectfully submitted,
AQUAFOR BEECH LIMITED
Greg R. Frew, P.Eng.
City Of Pickering / TRCA 11 February 2013 2012 Duffins Creek Hydrology Update
Aquafor Beech Limited 26
REFERENCES Annable, W.K., 1996. Morphologic Relationships of Rural Watercourses in Southern Ontario and Selected Field Methods in Fluvial Geomorphology. Aquafor Engineering Limited. July, 1991. Duffins Creek Watershed Study, Phase 1: Hydrology. Final Report for Metropolitan Toronto and Region Conservation Authority. Aquafor Beech Limited. May, 2002. Duffins Creek Hydrology Update. Final Report for Toronto and Region Conservation Authority. Aquafor Beech Limited. November, 1997. Humber River Watershed Hydrology/Hydraulics and Stormwater Management Study. Final Report prepared for the Toronto and Region Conservation Authority. Bruce, J.P. and Clark, R.H., Introduction to Hydrometeorology. The Commonwealth and International Library of Science Technology Engineering and Liberal Studies. Cole Engineering Group September 27, 2011 Visual Otthymo Version 2.4 Users Guide.
Hogg, W.D. 1980. Time Distribution of Short Duration Rainfall in Canada. Proceedings of the Canadian Hydrology Symposium: 80, NRCC, Ottawa, Ontario. James F. MacLaren Limited. 1979. Hydrologic Model Study for the Humber, Don and Rouge Rivers, Highland, Duffin, Petticoat and Carruthers Creeks. Report prepared for the MTRCA. Linsley, R.K., and Kohler, M., and Paulhus, J.L. Hydrology for Engineers. 1982. Ontario Ministry of the Natural Resources. 1987. Flood Plain Management in Ontario: Technical Guidelines. Conservation Authorities and Water management Branch. Paul Wisner and Associates Inc. 1989. Interhymo/Otthymo 89 Users Manual. Ottawa, Ontario. Pugsley, W.I. (Ed.). 1981. Flood Hydrology Guide for Canada: Hydrometeorological Design Techniques. CL 13-81, AES, Environment Canada, Downsview, Ontario. Watt, W.E. and K.C.A. Chow. 1985. A General Expression for Basin Lag Time. Canadian Journal of Civil Engineering, 12(2): 294-300. Greater Toronto Airport Authority. November 2004. Pickering Airport Draft Plan Report. www.gtaa.com.
City Of Pickering / TRCA 11 February 2013 2012 Duffins Creek Hydrology Update
Aquafor Beech Limited
APPENDIX A:
Hydrologic Model Setup: Model Parameters, Channel Routing, Soils and Landuse Mapping
HWY 47
HWY 7
Regional Road 5
Bro ck Rd
York-Durham Line
Kingston Rd
HWY 401
HWY 407
HWY 48
B ro ck Rd
FD u f f i n s C r e e k W a t e r s h e dD u f f i n s C r e e k W a t e r s h e d
Whitchurch-Stouffville
Uxbridge
Ajax
Pickering
D U R H A M
Y O R K
Markham
Stouffville
Whitevale
Brougham
Claremont
Goodwood
Ajax
Pickering
Soi ls Mapping
Figure A.1 :Soils Mapping
0 2 4 6 81kms
River / Stream
Roads
Municipal Boundary
Watershed Boundary
SOILS (HSG)
A
B
C
D
Legend:
Nov 2012
HWY 47
HWY 7
Regional Road 5
Bro ck Rd
York-Durham Line
Kingston Rd
HWY 401
HWY 407
HWY 48
B ro ck Rd
FD u f f i n s C r e e k W a t e r s h e dD u f f i n s C r e e k W a t e r s h e d
Whitchurch-Stouffville
Uxbridge
Ajax
Pickering
D U R H A M
Y O R K
Markham
Stouffville
Whitevale
Brougham
Claremont
Goodwood
Ajax
Pickering
Exist ing Landuse
Figure A.2 :Existing Landuse
0 2 4 6 81kms
River / Stream
Roads
Municipal Boundary
Watershed Boundary
Legend:
Nov 2012
Landuse (Indicating Impervious Percentage)
1 (Natural Areas)
2 (Agricultural)
3 (Urban - Very Low)
4 (Urban - Average)
5 (Urban - High)
6 (Urban - Very High)
HWY 47
HWY 7
Regional Road 5
Bro ck Rd
York-Durham Line
Kingston Rd
HWY 401
HWY 407
HWY 48
B ro ck Rd
FD u f f i n s C r e e k W a t e r s h e dD u f f i n s C r e e k W a t e r s h e d
Whitchurch-Stouffville
Uxbridge
Ajax
Pickering
D U R H A M
Y O R KMarkham
Stouffville
Whitevale
Brougham
Claremont
Goodwood
Ajax
Pickering
Exist ing Land Cover
Figure A.3 :Existing Land Cover
0 2 4 6 81kms
River / Stream
Roads
Municipal Boundary
Watershed Boundary
Land Cover
Natural Areas
Agricultural
Urban
Legend:
Nov 2012
HWY 47
HWY 7
Regional Road 5
Bro ck Rd
York-Durham Line
Kingston Rd
HWY 401
HWY 407
HWY 48
B ro ck Rd
FD u f f i n s C r e e k W a t e r s h e dD u f f i n s C r e e k W a t e r s h e d
Whitchurch-Stouffville
Uxbridge
Ajax
Pickering
D U R H A M
Y O R K
Markham
Stouffville
Whitevale
Brougham
Claremont
Goodwood
Ajax
Pickering
Future Landuse
Figure A.4 :Future (Official Plan) Landuses
0 2 4 6 81kms
River / Stream
Roads
Municipal Boundary
Watershed Boundary
Legend:
Nov 2012
Landuse (Official Plan)
Natural Areas
Agricultual
Urban (Very Low)
Urban (Average)
Urban (High)
Urban (Very High)
Future - Low Density Residential
Future - Med Density Residential
Future - High Density Residential
Future - Institutional
Future - Employment/Industrial
Future - Commercial
Roads
HWY 47
HWY 7
Regional Road 5
Bro ck Rd
York-Durham Line
Kingston Rd
HWY 401
HWY 407
HWY 48
B ro ck Rd
FD u f f i n s C r e e k W a t e r s h e dD u f f i n s C r e e k W a t e r s h e d
Whitchurch-Stouffville
Uxbridge
Ajax
Pickering
D U R H A M
Y O R K
Markham
Stouffville
Whitevale
Brougham
Claremont
Goodwood
Ajax
Pickering
Future Land Cover
Figure A.5 :Future (Official Plans) Land Cover
0 2 4 6 81kms
River / Stream
Roads
Municipal Boundary
Watershed Boundary
Land Cover
Natural Areas
Agricultual
Urban
Legend:
Nov 2012
HWY 47
HWY 7
Regional Road 5
Bro ck Rd
York-Dur ham Line
Kingston Rd
HWY 401
HWY 407
HWY 48
B ro ck Rd
Taunton Rd
Rossland Rd
FD u f f i n s C r e e k W a t e r s h e dD u f f i n s C r e e k W a t e r s h e d
Whitchurch-Stouffville
Uxbridge
Ajax
Pickering
D U R H A MY O R K
Markham
Stouffville
Whitevale
Brougham
Claremont
Goodwood
Ajax
Pickering
Future Landuse(wi th Ai rport )
Figure A.6: Future Landuse with Airport
0 2 4 6 81kms
River / Stream
Roads
Municipal Boundary
Watershed Boundary
Legend:
Jan 2013
Whitby
Landuse
Natural Areas
Agricultual
Urban (Very Low)
Urban (Average)
Urban (High)
Urban (Very High)
New- Low Density Residential
New- Med Density Residential
New- High Density Residential
New- Institutional
New- Employment/Industrial
New- Commercial
Roads
Airport
HWY 47
HWY 7
Regional Road 5
Bro ck Rd
York-Dur ham Line
Kingston Rd
HWY 401
HWY 407
HWY 48
B ro ck Rd
Taunton Rd
Rossland Rd
FD u f f i n s C r e e k W a t e r s h e dD u f f i n s C r e e k W a t e r s h e d
Whitchurch-Stouffville
Uxbridge
Ajax
Pickering
D U R H A MY O R K
Markham
Stouffville
Whitevale
Brougham
Claremont
Goodwood
AjaxPickering
Future Land Cover(wi th Ai rport )
Figure A.7 :Future Land Cover with Airport
0 2 4 6 81kms
River / Stream
Roads
Municipal Boundary
Watershed Boundary
Legend:
Jan 2013
Whitby
Natural Areas
Agricultual
Urban
Airport Development
Land Cover
Landuse Scenario Subcatchment SWM Pond # Total Area Rural Area Area Slope IA Urban IA DPI % imp % Direct Manning's "n"Length Slope Unadjusted AMC II AMC III Rural base calibrated base calibrated Area Unadjusted AMC II AMC III pervious (IA imp) Connected Impervious Pervious Impervious Pervious
Rural Parameters Urban ParametersFlow Path Rural CN Nashyd "n" Time to Peak Urban CN Length
Landuse Scenario Subcatchment SWM Pond # Total Area Rural Area Area Slope IA Urban IA DPI % imp % Direct Manning's "n"Length Slope Unadjusted AMC II AMC III Rural base calibrated base calibrated Area Unadjusted AMC II AMC III pervious (IA imp) Connected Impervious Pervious Impervious Pervious
Table A.1 Model Setup
Rural Parameters Urban ParametersFlow Path Rural CN Nashyd "n" Time to Peak Urban CN Length
TRCA HY047 MichellJune 27-28, 2010 TRCA HY047 Michell Creek
BaseflowRunoff
0.00
0.20
0.40
0.60
0.80
1.00
1.20
1.40
26/06/2010 0:00
27/06/2010 0:00
28/06/2010 0:00
29/06/2010 0:00
30/06/2010 0:00
01/07/2010 0:00
02/07/2010 0:00
03/07/2010 0:00
04/07/2010 0:00
Flow
(cm
s)
Date
TRCA HY010 Brougham CreekJune 27-28, 2010
TRCA HY010 Brougham Creek
Baseflow
Runoff
0.000
0.500
1.000
1.500
2.000
2.500
3.000
3.500
4.000
26/06/2010 0:00
27/06/2010 0:00
28/06/2010 0:00
29/06/2010 0:00
30/06/2010 0:00
01/07/2010 0:00
02/07/2010 0:00
03/07/2010 0:00
04/07/2010 0:00
Flow
(cm
s)
Date
TRCA HY023 East Duffins CreekJune 27-28, 2010
TRCA HY023 East Duffins Creek
Baseflow
Runoff
0.00
1.00
2.00
3.00
4.00
5.00
6.00
7.00
8.00
9.00
26/06/2010 0:00
27/06/2010 0:00
28/06/2010 0:00
29/06/2010 0:00
30/06/2010 0:00
01/07/2010 0:00
02/07/2010 0:00
03/07/2010 0:00
04/07/2010 0:00
Flow
(cm
s)
Date
TRCA HY028 Ganatsekiagon CreekJune 27-28, 2010
TRCA HY028 Ganatsekiagon Creek
BaseflowRunoff
0.00
0.50
1.00
1.50
2.00
2.50
3.00
26/06/2010 0:00
27/06/2010 0:00
28/06/2010 0:00
29/06/2010 0:00
30/06/2010 0:00
01/07/2010 0:00
02/07/2010 0:00
03/07/2010 0:00
04/07/2010 0:00
Flow
(cm
s)
Date
TRCA HY065 Urfe CreekJune 27-28, 2010
TRCA HY065 Urfe Creek
Baseflow
Runoff
0
5
10
15
20
25
30
26/06/2010 0:00
27/06/2010 0:00
28/06/2010 0:00
29/06/2010 0:00
30/06/2010 0:00
01/07/2010 0:00
02/07/2010 0:00
03/07/2010 0:00
04/07/2010 0:00
Flow
(cm
s)
Date
WSC 02HC049 Duffins Creek at AjaxJune 27-28, 2010
WSC 02HC049 Duffins Creek at Ajax
Baseflow
Runoff
0.00
1.00
2.00
3.00
4.00
5.00
6.00
22/07/2010 0:00
23/07/2010 0:00
24/07/2010 0:00
25/07/2010 0:00
26/07/2010 0:00
27/07/2010 0:00
28/07/2010 0:00
29/07/2010 0:00
30/07/2010 0:00
Flow
(cm
s)
Date
TRCA HY999 Reesor CreekJuly 23, 2010
TRCA HY999 Reesor CreekBaseflow
Runoff
0.00
1.00
2.00
3.00
4.00
5.00
6.00
7.00
8.00
9.00
10.00
22/07/2010 0:00
23/07/2010 0:00
24/07/2010 0:00
25/07/2010 0:00
26/07/2010 0:00
27/07/2010 0:00
28/07/2010 0:00
29/07/2010 0:00
30/07/2010 0:00
Flow
(cm
s)
Date
TRCA HY066 West Duffins at Hwy 7July 23, 2010
TRCA HY066 West Duffins at Hwy 7
Baseflow
Runoff
0.00
0.50
1.00
1.50
2.00
2.50
22/07/2010 0:00
23/07/2010 0:00
24/07/2010 0:00
25/07/2010 0:00
26/07/2010 0:00
27/07/2010 0:00
28/07/2010 0:00
29/07/2010 0:00
30/07/2010 0:00
Flow
(cm
s)
Date
TRCA HY047 Michell CreekJuly 23, 2010
TRCA HY047 Michell CreekBaseflowRunoff
0.00
0.50
1.00
1.50
2.00
2.50
3.00
3.50
4.00
22/07/2010 0:00
23/07/2010 0:00
24/07/2010 0:00
25/07/2010 0:00
26/07/2010 0:00
27/07/2010 0:00
28/07/2010 0:00
29/07/2010 0:00
30/07/2010 0:00
Flow
(cm
s)
Date
TRCA HY010 Brougham CreekJuly 23, 2010
TRCA HY010 Brougham CreekBaseflowRunoff
0.000
1.000
2.000
3.000
4.000
5.000
6.000
22/07/2010 0:00
23/07/2010 0:00
24/07/2010 0:00
25/07/2010 0:00
26/07/2010 0:00
27/07/2010 0:00
28/07/2010 0:00
29/07/2010 0:00
30/07/2010 0:00
Flow
(cm
s)
Date
TRCA HY023 East Duffins CreekJuly 23, 2010
TRCA HY023 East Duffins CreekBaseflowRunoff
0.00
0.50
1.00
1.50
2.00
2.50
3.00
3.50
4.00
22/07/2010 0:00
23/07/2010 0:00
24/07/2010 0:00
25/07/2010 0:00
26/07/2010 0:00
27/07/2010 0:00
28/07/2010 0:00
29/07/2010 0:00
30/07/2010 0:00
Flow
(cm
s)
Date
TRCA HY028 Ganatsekiagon CreekJuly 23, 2010
TRCA HY028 Ganatsekiagon CreekBaseflowRunoff
0.00
0.50
1.00
1.50
2.00
2.50
3.00
22/07/2010 0:00
23/07/2010 0:00
24/07/2010 0:00
25/07/2010 0:00
26/07/2010 0:00
27/07/2010 0:00
28/07/2010 0:00
29/07/2010 0:00
30/07/2010 0:00
Flow
(cm
s)
Date
TRCA HY065 Urfe CreekJuly 23, 2010
TRCA HY065 Urfe CreekBaseflowRunoff
0
5
10
15
20
25
30
35
22/07/2010 0:00
23/07/2010 0:00
24/07/2010 0:00
25/07/2010 0:00
26/07/2010 0:00
27/07/2010 0:00
28/07/2010 0:00
29/07/2010 0:00
30/07/2010 0:00
Flow
(cm
s)
Date
WSC 02HC049 Duffins Creek at AjaxJuly 23, 2010
WSC 02HC049 Duffins Creek at Ajax
Baseflow
Runoff
Baseflow Separation - Storm Event July 23, 2010
Baseflow Seperation - Storm Event - May 11, 2000
0
1
2
3
4
5
6
7
8
9
10
0 20 40 60 80 100
120
140
160
180
Flow
(cm
s)
Time (hours)
Reesor Creek (02HC039)May 11-12, 2000
Gauged Runoff
Reesor Creek (02HC039)
Baseflow
0
2
4
6
8
10
12
14
16
18
20
0 20 40 60 80 100
120
140
160
180
Flow
(cm
s)
Time (hours)
East Duffins Creek (02HC019)May 11-12, 2000
Gauged Runoff
East Duffins Creek (02HC019)
Baseflow
0
10
20
30
40
50
60
70
80
0 20 40 60 80 100
120
140
160
180
Flow
(cm
s)
Time (hours)
Duffins Creek at Ajax (02HC049)May 11-12, 2000
Gauged Runoff
Duffins Creek at Ajax (02HC049)
Baseflow
0
1
2
3
4
5
6
7
8
9
10
0 20 40 60 80 100
120
140
160
180
Flow
(cm
s)
Time (hours)
W.Duffins Creek @Green River (02HC038)May 11-12, 2000
Gauged Runoff
W.Duffins Creek@Green River (02HC038)
Baseflow
0
1
2
3
4
5
6
7
8
9
10
0 20 40 60 80 100
120
140
160
180
Flow
(cm
s)
Time (hours)
Urfe Creek (gauge #37)May 11-12, 2000
Gauged Runoff
Urfe Creek (gauge #37)
Baseflow
0
1
2
3
4
5
6
7
8
0 20 40 60 80 100
120
140
160
180
Flow
(cm
s)
Time (hours)
Brougham Creek (gauge #36)May 11-12, 2000
Gauged Runoff
Brougham Creek (gauge#36)
Baseflow
Baseflow Seperation - Storm Event - June 13, 2000
0
1
2
3
4
5
6
7
8
9
0 20 40 60 80 100
120
140
Flow
(cm
s)
Time (hours)
June 13'00 StormReesor Creek (02HC039)
Gauged Runoff
Reesor Creek (02HC039)
Baseflow
0
5
10
15
20
25
30
0 20 40 60 80 100
120
140
Title
Title
June 13'00 StormEast Duffins Creek (02HC019)
Gauged Runoff
East Duffins Creek (02HC019)
Baseflow
0
10
20
30
40
50
60
70
80
0 20 40 60 80 100
120
140
Title
Title
June 13'00 StormDuffins Creek at Ajax (02HC049)
Gauged Runoff
Duffins Creek at Ajax (02HC049)
Baseflow
0
2
4
6
8
10
12
0 20 40 60 80 100
120
140
Flow
(cm
s)
Time (hours)
June 13'00 StormW.Duffins Creek @Green River (02HC038)
Gauged Runoff
W.Duffins Creek @ Green River (02HC038)
Baseflow
0
1
2
3
4
5
6
7
8
0 20 40 60 80 100
120
140
Flow
(cm
s)
Time (hours)
June 13'00 StormUrfe Creek (guage #37)
Gauged Runoff
Urfe Creek (guage #37)
Baseflow
0
1
2
3
4
5
6
7
8
9
10
0 20 40 60 80 100
120
140
Flow
(cm
s)
Time (hours)
June 13'00 StormBrougham Creek (guage #36)
Gauged Runoff
Brougham Creek (guage #36)
Baseflow
Baseflow Seperation - Storm Event - June 24, 2000
0
1
2
3
4
5
6
7
8
0 20 40 60 80 100
120
140
160
180
Title
Title
Reesor Creek (02HC039)June 24, 2000
Gauged Runoff
Reesor Creek (02HC039)
Baseflow
0
5
10
15
20
25
0 20 40 60 80 100
120
140
160
180
Title
Title
East Duffins Creek (02HC019)June 24, 2000
Gauged Runoff
East Duffins Creek (02HC019)
Baseflow
0
10
20
30
40
50
60
0 20 40 60 80 100
120
140
160
180
Title
Title
Duffins Creek at Ajax (02HC049)June 24, 2000
Gauged Runoff
Duffins Creek at Ajax (02HC049)
Baseflow
0
1
2
3
4
5
6
7
8
0 20 40 60 80 100
120
140
160
180
Title
Title
W.Duffins Creek @Green River (02HC038)June 24, 2000
Gauged Runoff
W.Duffins Creek@ Green River (02HC038)Baseflow
0
1
2
3
4
5
6
0 20 40 60 80 100
120
140
160
180
Title
Title
Urfe Creek (gauge #37)June 24, 2000
Gauged Runoff
Urfe Creek (gauage #37)
Baseflow
0
1
2
3
4
5
6
7
0 20 40 60 80 100
120
140
160
180
Title
Title
Brougham Creek (gauge #36)June 24, 2000
Gauged Runoff
Brougham Creek (gauage #36)
Baseflow
City Of Pickering / TRCA 11 February 2013 2012 Duffins Creek Hydrology Update
Aquafor Beech Limited
APPENDIX C:
Model Calibration: Rainfall Data Application
Catchment # May15-17, 2003 May 23-24, 2003 July 29-30,2006 July 22-23, 2008 July 23,2010 June 24, 2010 June 27-28, 20101 Ajax Works Yard HY001 Ajax Works Yard HY001 02HC018 Ajax Works Yard HY001 Ajax Works Yard HY001 Ajax Works Yard HY001 Ajax Works Yard HY0012 Ajax Works Yard HY001 Ajax Works Yard HY001 Little Rouge at 16th HY043 Ajax Works Yard HY001 Ajax Works Yard HY001 Ajax Works Yard HY001 Ajax Works Yard HY0013 Ajax Works Yard HY001 Ajax Works Yard HY001 Little Rouge at 16th HY043 Ajax Works Yard HY001 Ajax Works Yard HY001 Brock West Landfill HY009 Brock West Landfill HY0094 Ajax Works Yard HY001 Ajax Works Yard HY001 Little Rouge at 16th HY043 Ajax Works Yard HY001 Ajax Works Yard HY001 Brock West Landfill HY009 Brock West Landfill HY0095 Ajax Works Yard HY001 Ajax Works Yard HY001 Little Rouge at 16th HY043 Little Rouge at 16th HY043 Little Rouge at 16th HY043 Brock West Landfill HY009 Brock West Landfill HY0096 Claremont Shop HY015 Claremont Shop HY015 Little Rouge at 16th HY043 Little Rouge at 16th HY043 Little Rouge at 16th HY043 Brock West Landfill HY009 Brock West Landfill HY0097 Claremont Shop HY015 Claremont Shop HY015 Little Rouge at 16th HY043 Little Rouge at 16th HY043 Little Rouge at 16th HY043 Little Rouge at 16th HY043 Little Rouge at 16th HY0438 Claremont Shop HY015 Claremont Shop HY015 Little Rouge at 16th HY043 Little Rouge at 16th HY043 Little Rouge at 16th HY043 Little Rouge at 16th HY043 Little Rouge at 16th HY0439 Claremont Shop HY015 Claremont Shop HY015 Little Rouge at 16th HY043 Little Rouge at 16th HY043 Little Rouge at 16th HY043 Little Rouge at 16th HY043 Little Rouge at 16th HY043
10 Claremont Shop HY015 Claremont Shop HY015 Little Rouge at 16th HY043 Little Rouge at 16th HY043 Little Rouge at 16th HY043 Little Rouge at 16th HY043 Little Rouge at 16th HY04311 Claremont Shop HY015 Claremont Shop HY015 Little Rouge at 16th HY043 Little Rouge at 16th HY043 Little Rouge at 16th HY043 Little Rouge at 16th HY043 Little Rouge at 16th HY04312 Claremont Shop HY015 Claremont Shop HY015 Little Rouge at 16th HY043 Little Rouge at 16th HY043 Little Rouge at 16th HY043 Little Rouge at 16th HY043 Little Rouge at 16th HY04313 Claremont Shop HY015 Claremont Shop HY015 Stouffville Works York02 Little Rouge at 16th HY043 Little Rouge at 16th HY043 Little Rouge at 16th HY043 Little Rouge at 16th HY04314 Claremont Shop HY015 Claremont Shop HY015 Stouffville Works York02 Little Rouge at 16th HY043 Little Rouge at 16th HY043 Little Rouge at 16th HY043 Little Rouge at 16th HY04315 Claremont Shop HY015 Claremont Shop HY015 Stouffville Works York02 Little Rouge at 16th HY043 Little Rouge at 16th HY043 Little Rouge at 16th HY043 Little Rouge at 16th HY04316 Claremont Shop HY015 Claremont Shop HY015 Stouffville Works York02 Goodwood Pumping Station HY031 Goodwood Pumping Station HY031 Goodwood Pumping Station HY031 Goodwood Pumping Station HY03117 Claremont Shop HY015 Claremont Shop HY015 Stouffville Works York02 Goodwood Pumping Station HY031 Goodwood Pumping Station HY031 Goodwood Pumping Station HY031 Goodwood Pumping Station HY03118 Claremont Shop HY015 Claremont Shop HY015 Stouffville Works York02 Little Rouge at 16th HY043 Little Rouge at 16th HY043 Little Rouge at 16th HY043 Little Rouge at 16th HY04319 Claremont Shop HY015 Claremont Shop HY015 Stouffville Works York02 Little Rouge at 16th HY043 Little Rouge at 16th HY043 Little Rouge at 16th HY043 Little Rouge at 16th HY04320 Claremont Shop HY015 Claremont Shop HY015 Stouffville Works York02 Goodwood Pumping Station HY031 Goodwood Pumping Station HY031 Goodwood Pumping Station HY031 Goodwood Pumping Station HY03121 Claremont Shop HY015 Claremont Shop HY015 Stouffville Works York02 Goodwood Pumping Station HY031 Goodwood Pumping Station HY031 Goodwood Pumping Station HY031 Goodwood Pumping Station HY03122 Claremont Shop HY015 Claremont Shop HY015 Stouffville Works York02 Goodwood Pumping Station HY031 Goodwood Pumping Station HY031 Goodwood Pumping Station HY031 Goodwood Pumping Station HY03123 Claremont Shop HY015 Claremont Shop HY015 Little Rouge at 16th HY043 Little Rouge at 16th HY043 Little Rouge at 16th HY043 Little Rouge at 16th HY043 Little Rouge at 16th HY04324 Claremont Shop HY015 Claremont Shop HY015 Little Rouge at 16th HY043 Little Rouge at 16th HY043 Claremont Shop HY015 Claremont Shop HY015 Claremont Shop HY01525 Claremont Shop HY015 Claremont Shop HY015 Little Rouge at 16th HY043 Little Rouge at 16th HY043 Little Rouge at 16th HY043 Little Rouge at 16th HY043 Little Rouge at 16th HY04326 Claremont Shop HY015 Claremont Shop HY015 Goodwood Pumping Station HY031 Goodwood Pumping Station HY031 Goodwood Pumping Station HY031 Goodwood Pumping Station HY031 Goodwood Pumping Station HY03127 Claremont Shop HY015 Claremont Shop HY015 Goodwood Pumping Station HY031 Goodwood Pumping Station HY031 Goodwood Pumping Station HY031 Goodwood Pumping Station HY031 Goodwood Pumping Station HY03128 Claremont Shop HY015 Claremont Shop HY015 Goodwood Pumping Station HY031 Goodwood Pumping Station HY031 Goodwood Pumping Station HY031 Goodwood Pumping Station HY031 Goodwood Pumping Station HY03129 Claremont Shop HY015 Claremont Shop HY015 Goodwood Pumping Station HY031 Goodwood Pumping Station HY031 Goodwood Pumping Station HY031 Goodwood Pumping Station HY031 Goodwood Pumping Station HY03130 Claremont Shop HY015 Claremont Shop HY015 Little Rouge at 16th HY043 Little Rouge at 16th HY043 Little Rouge at 16th HY043 Little Rouge at 16th HY043 Little Rouge at 16th HY04331 Claremont Shop HY015 Claremont Shop HY015 Little Rouge at 16th HY043 Little Rouge at 16th HY043 Little Rouge at 16th HY043 Brock West Landfill HY009 Brock West Landfill HY00932 Claremont Shop HY015 Claremont Shop HY015 Little Rouge at 16th HY043 Little Rouge at 16th HY043 Little Rouge at 16th HY043 Brock West Landfill HY009 Brock West Landfill HY00933 Ajax Works Yard HY001 Ajax Works Yard HY001 Little Rouge at 16th HY043 Little Rouge at 16th HY043 Claremont Shop HY015 Brock West Landfill HY009 Brock West Landfill HY00934 Claremont Shop HY015 Claremont Shop HY015 Little Rouge at 16th HY043 Little Rouge at 16th HY043 Claremont Shop HY015 Brock West Landfill HY009 Brock West Landfill HY00935 Claremont Shop HY015 Claremont Shop HY015 Little Rouge at 16th HY043 Claremont Shop HY015 Claremont Shop HY015 Brock West Landfill HY009 Brock West Landfill HY00936 Ajax Works Yard HY001 Ajax Works Yard HY001 Little Rouge at 16th HY043 Ajax Works Yard HY001 Ajax Works Yard HY001 Brock West Landfill HY009 Brock West Landfill HY00937 Claremont Shop HY015 Claremont Shop HY015 Little Rouge at 16th HY043 Claremont Shop HY015 Claremont Shop HY015 Brock West Landfill HY009 Brock West Landfill HY00938 Claremont Shop HY015 Claremont Shop HY015 Little Rouge at 16th HY043 Claremont Shop HY015 Claremont Shop HY015 Claremont Shop HY015 Claremont Shop HY01539 Claremont Shop HY015 Claremont Shop HY015 Little Rouge at 16th HY043 Claremont Shop HY015 Claremont Shop HY015 Claremont Shop HY015 Claremont Shop HY01540 Claremont Shop HY015 Claremont Shop HY015 Little Rouge at 16th HY043 Ajax Works Yard HY001 Claremont Shop HY015 Brock West Landfill HY009 Brock West Landfill HY00941 Ajax Works Yard HY001 Ajax Works Yard HY001 Little Rouge at 16th HY043 Ajax Works Yard HY001 Ajax Works Yard HY001 Brock West Landfill HY009 Brock West Landfill HY00942 Ajax Works Yard HY001 Ajax Works Yard HY001 Little Rouge at 16th HY043 Ajax Works Yard HY001 Ajax Works Yard HY001 Brock West Landfill HY009 Brock West Landfill HY00943 Claremont Shop HY015 Claremont Shop HY015 02HC055 Claremont Shop HY015 Claremont Shop HY015 Brock West Landfill HY009 Brock West Landfill HY00944 Claremont Shop HY015 Claremont Shop HY015 Little Rouge at 16th HY043 Little Rouge at 16th HY043 Claremont Shop HY015 Claremont Shop HY015 Claremont Shop HY01545 Claremont Shop HY015 Claremont Shop HY015 02HC055 Claremont Shop HY015 Claremont Shop HY015 Claremont Shop HY015 Claremont Shop HY01546 Claremont Shop HY015 Claremont Shop HY015 02HC055 Claremont Shop HY015 Claremont Shop HY015 Claremont Shop HY015 Claremont Shop HY01547 Claremont Shop HY015 Claremont Shop HY015 Little Rouge at 16th HY043 Claremont Shop HY015 Claremont Shop HY015 Claremont Shop HY015 Claremont Shop HY01548 Claremont Shop HY015 Claremont Shop HY015 Goodwood Pumping Station HY031 Goodwood Pumping Station HY031 Claremont Shop HY015 Goodwood Pumping Station HY031 Goodwood Pumping Station HY03149 Claremont Shop HY015 Claremont Shop HY015 Goodwood Pumping Station HY031 Goodwood Pumping Station HY031 Goodwood Pumping Station HY031 Goodwood Pumping Station HY031 Goodwood Pumping Station HY03150 Claremont Shop HY015 Claremont Shop HY015 02HC055 Claremont Shop HY015 Claremont Shop HY015 Claremont Shop HY015 Claremont Shop HY01551 Claremont Shop HY015 Claremont Shop HY015 Goodwood Pumping Station HY031 Goodwood Pumping Station HY031 Goodwood Pumping Station HY031 Goodwood Pumping Station HY031 Goodwood Pumping Station HY03152 CLOCA5 CLOCA5 CLOCA5 CLOCA5 CLOCA5 CLOCA5 CLOCA553 Ajax Works Yard HY001 Ajax Works Yard HY001 02HC018 Ajax Works Yard HY001 Ajax Works Yard HY001 Ajax Works Yard HY001 Ajax Works Yard HY00154 Ajax Works Yard HY001 Ajax Works Yard HY001 02HC018 Ajax Works Yard HY001 Ajax Works Yard HY001 Ajax Works Yard HY001 Ajax Works Yard HY00155 Ajax Works Yard HY001 Ajax Works Yard HY001 02HC055 Ajax Works Yard HY001 Ajax Works Yard HY001 Ajax Works Yard HY001 Ajax Works Yard HY00156 Claremont Shop HY015 Claremont Shop HY015 02HC055 Claremont Shop HY015 Claremont Shop HY015 Claremont Shop HY015 Claremont Shop HY015
Calibration Event
Appendix C - Rainfall Data Application for Calibration Events
$+
$+
$+
$+
$+
$+
$+
$+
$+
HWY 47
HWY 7
Regional Road 5
Bro ck Rd
York-Du rham Line
Kingston Rd
HWY 401
HWY 407
HWY 48
Bro ck Rd
Taunton Rd
Rossland Rd
York02
HY001
HY009
HY015
HY031
HY043
Gauge5
02HC055
02HC018
29
52
28
22
27
17
51
26
48
21
20
19
4750
24
18
14
13
46
45
25
44
1211
39
7
34
10
5631
35
43
40
54
42
6 32
41
5
4
2
1
23
49
53
55
3
9
8
30
38
37
36
33
16
15
FD u f f i n s C r e e k W a t e r s h e dD u f f i n s C r e e k W a t e r s h e d
Whitchurch-Stouffville
Uxbridge
Ajax
Pickering
D U R H A M
Y O R K
Markham
Stouffville
Whitevale
Brougham
Claremont
Goodwood
Ajax
Pickering
Gauging Network(Prec ipi ta t ion S tat ions)
Figure C.1: (May 15-17, 2003)
0 2 4 6 81kms
$+ Precipitation Station
River / Stream
Subcatchment Boundary
Roads
Municipal Boundary
Legend:
Jan 2013
WhitbyMAY 15-17, 2003
Event6
HY001
HY015
CLOCA5
$+
$+
$+
$+
$+
$+
$+
$+
$+
HWY 47
HWY 7
Regional Road 5
Bro ck Rd
York-Du rham Line
Kingston Rd
HWY 401
HWY 407
HWY 48
Bro ck Rd
Taunton Rd
Rossland Rd
York02
HY001
HY009
HY015
HY031
HY043
Gauge5
02HC055
02HC018
29
52
28
22
27
17
51
26
48
21
20
19
4750
24
18
14
13
46
45
25
44
1211
39
7
34
10
5631
35
43
40
54
42
6 32
41
5
4
2
1
23
49
53
55
3
9
8
30
38
37
36
33
16
15
FD u f f i n s C r e e k W a t e r s h e dD u f f i n s C r e e k W a t e r s h e d
Whitchurch-Stouffville
Uxbridge
Ajax
Pickering
D U R H A M
Y O R K
Markham
Stouffville
Whitevale
Brougham
Claremont
Goodwood
Ajax
Pickering
Gauging Network(Prec ipi ta t ion S tat ions)
Figure C.2: (May 23-24, 2003)
0 2 4 6 81kms
$+ Precipitation Station
River / Stream
Subcatchment Boundary
Roads
Municipal Boundary
Legend:
Jan 2013
WhitbyMAY 23-24, 2003
Event6
HY001
HY015
CLOCA5
$+
$+
$+
$+
$+
$+
$+
$+
$+
HWY 47
HWY 7
Regional Road 5
Bro ck Rd
York-Du rham Line
Kingston Rd
HWY 401
HWY 407
HWY 48
Bro ck Rd
Taunton Rd
Rossland Rd
York02
HY001
HY009
HY015
HY031
HY043
Gauge5
02HC055
02HC018
29
52
28
22
27
17
51
26
48
21
20
19
4750
24
18
14
13
46
45
25
44
1211
39
7
34
10
5631
35
43
40
54
42
6 32
41
5
4
2
1
23
49
53
55
3
9
8
30
38
37
36
33
16
15
FD u f f i n s C r e e k W a t e r s h e dD u f f i n s C r e e k W a t e r s h e d
Whitchurch-Stouffville
Uxbridge
Ajax
Pickering
D U R H A M
Y O R K
Markham
Stouffville
Whitevale
Brougham
Claremont
Goodwood
Ajax
Pickering
Gauging Network(Prec ipi ta t ion S tat ions)
Figure C.3: (July 29-30, 2006)
0 2 4 6 81kms
$+ Precipitation Station
River / Stream
Subcatchment Boundary
Roads
Municipal Boundary
Legend:
Jan 2013
Whitby
JULY 29-30, 2006
Event6
HY031
HY043
02HC018
02HC055
CLOCA5
YORK02
$+
$+
$+
$+
$+
$+
$+
$+
$+
HWY 47
HWY 7
Regional Road 5
Bro ck Rd
York-Du rham Line
Kingston Rd
HWY 401
HWY 407
HWY 48
Bro ck Rd
Taunton Rd
Rossland Rd
York02
HY001
HY009
HY015
HY031
HY043
Gauge5
02HC055
02HC018
29
52
28
22
27
17
51
26
48
21
20
19
4750
24
18
14
13
46
45
25
44
1211
39
7
34
10
5631
35
43
40
54
42
6 32
41
5
4
2
1
23
49
53
55
3
9
8
30
38
37
36
33
16
15
FD u f f i n s C r e e k W a t e r s h e dD u f f i n s C r e e k W a t e r s h e d
Whitchurch-Stouffville
Uxbridge
Ajax
Pickering
D U R H A M
Y O R K
Markham
Stouffville
Whitevale
Brougham
Claremont
Goodwood
Ajax
Pickering
Gauging Network(Prec ipi ta t ion S tat ions)
Figure C.4: (July 22-23, 2008)
0 2 4 6 81kms
$+ Precipitation Station
River / Stream
Subcatchment Boundary
Roads
Municipal Boundary
Legend:
Jan 2013
WhitbyJULY 22-23, 2008
Event6
HY001
HY015
HY031
HY043
CLOCA5
$+
$+
$+
$+
$+
$+
$+
$+
$+
HWY 47
HWY 7
Regional Road 5
Bro ck Rd
York-Du rham Line
Kingston Rd
HWY 401
HWY 407
HWY 48
Bro ck Rd
Taunton Rd
Rossland Rd
York02
HY001
HY009
HY015
HY031
HY043
Gauge5
02HC055
02HC018
29
52
28
22
27
17
51
26
48
21
20
19
4750
24
18
14
13
46
45
25
44
1211
39
7
34
10
5631
35
43
40
54
42
6 32
41
5
4
2
1
23
49
53
55
3
9
8
30
38
37
36
33
16
15
FD u f f i n s C r e e k W a t e r s h e dD u f f i n s C r e e k W a t e r s h e d
Whitchurch-Stouffville
Uxbridge
Ajax
Pickering
D U R H A M
Y O R K
Markham
Stouffville
Whitevale
Brougham
Claremont
Goodwood
Ajax
Pickering
Gauging Network(Prec ipi ta t ion S tat ions)
Figure C.5: (July 23, 2010)
0 2 4 6 81kms
$+ Precipitation Station
River / Stream
Subcatchment Boundary
Roads
Municipal Boundary
Legend:
Jan 2013
WhitbyJULY 23, 2010
Event6
HY001
HY015
HY031
HY043
CLOCA5
$+
$+
$+
$+
$+
$+
$+
$+
$+
HWY 47
HWY 7
Regional Road 5
Bro ck Rd
York-Du rham Line
Kingston Rd
HWY 401
HWY 407
HWY 48
Bro ck Rd
Taunton Rd
Rossland Rd
York02
HY001
HY009
HY015
HY031
HY043
Gauge5
02HC055
02HC018
29
52
28
22
27
17
51
26
48
21
20
19
4750
24
18
14
13
46
45
25
44
1211
39
7
34
10
5631
35
43
40
54
42
6 32
41
5
4
2
1
23
49
53
55
3
9
8
30
38
37
36
33
16
15
FD u f f i n s C r e e k W a t e r s h e dD u f f i n s C r e e k W a t e r s h e d
Whitchurch-Stouffville
Uxbridge
Ajax
Pickering
D U R H A M
Y O R K
Markham
Stouffville
Whitevale
Brougham
Claremont
Goodwood
Ajax
Pickering
Gauging Network(Prec ipi ta t ion S tat ions)
Figure C.6: (June 24, 2010)
0 2 4 6 81kms
$+ Precipitation Station
River / Stream
Subcatchment Boundary
Roads
Municipal Boundary
Legend:
Jan 2013
Whitby
JUNE 24, 2010
Event6
HY001
HY009
HY015
HY031
HY043
CLOCA5
$+
$+
$+
$+
$+
$+
$+
$+
$+
HWY 47
HWY 7
Regional Road 5
Bro ck Rd
York-Du rham Line
Kingston Rd
HWY 401
HWY 407
HWY 48
Bro ck Rd
Taunton Rd
Rossland Rd
York02
HY001
HY009
HY015
HY031
HY043
Gauge5
02HC055
02HC018
29
52
28
22
27
17
51
26
48
21
20
19
4750
24
18
14
13
46
45
25
44
1211
39
7
34
10
5631
35
43
40
54
42
6 32
41
5
4
2
1
23
49
53
55
3
9
8
30
38
37
36
33
16
15
FD u f f i n s C r e e k W a t e r s h e dD u f f i n s C r e e k W a t e r s h e d
Whitchurch-Stouffville
Uxbridge
Ajax
Pickering
D U R H A M
Y O R K
Markham
Stouffville
Whitevale
Brougham
Claremont
Goodwood
Ajax
Pickering
Gauging Network(Prec ipi ta t ion S tat ions)
Figure C.7: (June 27-28, 2010)
0 2 4 6 81kms
$+ Precipitation Station
River / Stream
Subcatchment Boundary
Roads
Municipal Boundary
Legend:
Jan 2013
Whitby
JUNE 27-28, 2010
Event6
HY001
HY009
HY015
HY031
HY043
CLOCA5
City Of Pickering / TRCA 11 February 2013 2012 Duffins Creek Hydrology Update
Aquafor Beech Limited
APPENDIX D:
Model Calibration: Observed vs. Simulated Calibration Event Results
Calibration Results - Storm Event - May 15-17, 2003
0.00
10.00
20.00
30.00
40.00
50.00
60.00
0 40 80 120
160
Flow
(cm
s)
Time (Hours)
Model Calibration: May 15-17, 2003Mitchel Creek at Claremont (HY047)
Gauged Runoff Modelled Runoff
0.000
10.000
20.000
30.000
40.000
50.000
60.000
0 40 80 120
160
Flow
(cm
s)
Time (Hours)
Model Calibration: May 15-17, 2003E. Duffins at Claremont (HY023)
Gauged Runoff Modelled Runoff
0.00
10.00
20.00
30.00
40.00
50.00
60.00
0 40 80 120
160
Flow
(cm
s)
Time (Hours)
Model Calibration: May 15-17, 2003Brougham Creek (HY010)
Gauged Runoff Modelled Runoff
0.0
10.0
20.0
30.0
40.0
50.0
60.0
0 40 80 120
160
Flow
(cm
s)
Time (Hours)
Model Calibration: May 15-17, 2003Duffins above Pickering (HC019)
Gauged Runoff Modelled Runoff
0.0
20.0
40.0
60.0
80.0
100.0
0 40 80 120
160
Flow
(cm
s)
Time (Hours)
Model Calibration: May 15-17, 2003Duffins Creek at Ajax (HC049)
Gauged Runoff Modelled Runoff
0.0
10.0
20.0
30.0
40.0
50.0
0 12 24 36 48 60 72 84 96 108
120
Flow
(cm
s)
Time (Hours)
Model Calibration: May 23-24, 2003Duffins Creek at Ajax (HC049)
Gauged Runoff Modelled Runoff
0.0
10.0
20.0
30.0
0 12 24 36 48 60 72 84 96 108
120
Flow
(cm
s)
Time (Hours)
Model Calibration: May 23-24, 2003Urfe Creek (HC065)
Gauged Runoff Modelled Runoff
0.00
10.00
20.00
30.00
0 12 24 36 48 60 72 84 96 108
120
Flow
(cm
s)
Time (Hours)
Model Calibration: May 23-24, 2003Mitchel Creek at Claremont (HY047)
Gauged Runoff Modelled Runoff
0.0
10.0
20.0
30.0
0 12 24 36 48 60 72 84 96 108
120
Flow
(cm
s)
Time (Hours)
Model Calibration: May 23-24, 2003E. Duffins at Claremont (HY023)
Gauged Runoff Modelled Runoff
0.0
10.0
20.0
30.0
0 12 24 36 48 60 72 84 96 108
120
Flow
(cm
s)
Time (Hours)
Model Calibration: May 23-24, 2003Brougham Creek (HY010)
Gauged Runoff Modelled Runoff
0.0
10.0
20.0
30.00 12 24 36 48 60 72 84 96 108
120
Flow
(cm
s)
Time (Hours)
Model Calibration: May 23-24, 2003Duffins above Pickering (HC019)
Gauged Runoff Modelled Runoff
Calibration Results - Storm Event - May23-24,2003
0.0
10.0
20.0
30.0
40.0
50.0
0 12 24 36 48 60 72 84 96 108
120
Flow
(cm
s)
Time (Hours)
Model Calibration: July 29-30, 2006Duffins Creek at Ajax (HC049)
Gauged Runoff Modelled Runoff
0.0
10.0
20.0
30.0
0 12 24 36 48 60 72 84 96 108
120
Flow
(cm
s)
Time (Hours)
Model Calibration: July 29-30, 2006W. Duffins above Green River (HC038)
Gauged Runoff Modelled Runoff
0.0
10.0
20.0
30.0
0 12 24 36 48 60 72 84 96 108
120
Flow
(cm
s)
Time (Hours)
Model Calibration: July 29-30, 2006Urfe Creek (HC065)
Gauged Runoff Modelled Runoff
0.0
10.0
20.0
30.0
40.0
50.0
0 12 24 36 48 60 72 84 96 108
120
Flow
(cm
s)
Time (Hours)
Model Calibration: July 29-30, 2006Duffins above Pickering (HC019)
Gauged Runoff Modelled Runoff
0.0
10.0
20.0
30.0
0 12 24 36 48 60 72 84 96 108
120
Flow
(cm
s)
Time (Hours)
Model Calibration: July 29-30, 2006Brougham Creek (HY010)
Gauged Runoff Modelled Runoff
0.0
10.0
20.0
30.0
0 12 24 36 48 60 72 84 96 108
120
Flow
(cm
s)
Time (Hours)
Model Calibration: July 29-30, 2006E. Duffins at Claremont (HY023)
Gauged Runoff Modelled Runoff
0.0
10.0
20.0
30.0
0 12 24 36 48 60 72 84 96 108
120
Flow
(cm
s)
Time (Hours)
Model Calibration: July 29-30, 2006Mitchel Creek at Claremont (HY047)
Model Calibration: July 23, 2010Duffins Creek at Ajax (HC049)
Gauged Runoff Modelled Runoff
0.00
10.00
20.00
0.00
12.00
24.00
36.00
48.00
60.00
72.00
84.00
Flow
(cm
s)
Time (Hours)
Model Calibration: July 23, 2010W. Duffins at HWY 7 (HY066)
Gauged Runoff Modelled Runoff
0.00
10.00
20.00
0.00
12.00
24.00
36.00
48.00
60.00
72.00
84.00
Flow
(cm
s)
Time (Hours)
Model Calibration: July 23, 2010Reesor Creek at 8th Conc. (HY999)
Gauged Runoff Modelled Runoff
0.00
10.00
20.00
30.00
0.00
12.00
24.00
36.00
48.00
60.00
72.00
84.00
Flow
(cm
s)
Time (Hours)
Model Calibration: July 23, 2010Ganetsekiagon Creek (HC028)
Gauged Runoff Modelled Runoff
0.00
10.00
20.00
0.00
12.00
24.00
36.00
48.00
60.00
72.00
84.00
Flow
(cm
s)
Time (Hours)
Model Calibration: July 23, 2010Urfe Creek (HC065)
Gauged Runoff Modelled Runoff
0.00
10.00
20.00
0.00
12.00
24.00
36.00
48.00
60.00
72.00
84.00
Flow
(cm
s)
Time (Hours)
Model Calibration: July 23, 2010Brougham Creek (HY010)
Gauged Runoff Modelled Runoff
0.00
10.00
20.00
0 12 24 36 48 60 72 84
Flow
(cm
s)
Time (Hours)
Model Calibration: July 23, 2010E. Duffins at Claremont (HY023)
Gauged Runoff Modelled Runoff
0.00
10.00
20.00
0.00
12.00
24.00
36.00
48.00
60.00
72.00
84.00
Flow
(cm
s)
Time (Hours)
Model Calibration: July 23, 2010Mitchel Creek Claremont (HY047)
Gauged Runoff Modelled Runoff
Calibration Results - Storm Event -July 23,2010
City Of Pickering / TRCA 11 February 2013 2012 Duffins Creek Hydrology Update
Aquafor Beech Limited
APPENDIX E:
Model Calibration: Antecedent Rainfall Relationships
-100%-80%-60%-40%-20%
0%20%40%
0 5 10 15 20 25 30 35
CN
adj
ustm
ent
API (mm)
Reesor Creek (HY999)
2002 model results ('99 storms) 2012 model results ('03-'10 storms) 2012 Verification ('00 storms)
-100%-80%-60%-40%-20%
0%20%40%
0 5 10 15 20 25 30 35
CN
adj
ustm
ent
API (mm)
West Duffins - Green River (HC038)
2002 model results ('99 storms) 2012 model results ('03-'10 storms) - HC038 2012 Verification ('00 storms)
-100%-80%-60%-40%-20%
0%20%40%
0 5 10 15 20 25 30 35
CN
adj
ustm
ent
API (mm)
East Duffins Creek (HY019)
2002 model results ('99 storms) 2012 model results ('03-'12 storms) - HY019 2012 Verification ('00 storms)
-100%-80%-60%-40%-20%
0%20%40%
0 5 10 15 20 25 30 35
CN
adj
ustm
ent
API (mm)
Urfe Creek (HY065)
2002 model results ('99 storms) 2012 model results ('03-'10 storms) - HY065 2012 Verification ('00 storms)
-100%-80%-60%-40%-20%
0%20%40%
0 5 10 15 20 25 30 35
CN
adj
ustm
ent
API (mm)
Brougham Creek (HY010)
2002 model results ('99 storms) 2012 model results ('03-'10 storms) 2012 Verification
-100%-80%-60%-40%-20%
0%20%40%
0 5 10 15 20 25 30 35
CN
adj
ustm
ent
API (mm)
Duffins Creek at Ajax (HY049)
2002 model results ('99 storms) 2012 model results ('03-'10 storms) 2012 Verification ('00 storms)
City Of Pickering / TRCA 11 February 2013 2012 Duffins Creek Hydrology Update
Aquafor Beech Limited
APPENDIX F:
Model Calibration: Observed vs. Simulated Validation Event Results
Validation Results - May 11, 2000
0
4
8
12
0 20 40 60 80 100
120
140
160
180
Flow
(m3/
s)
Time (Hours)
Model Calibration: May 11-12'00 StormReesor Creek (02HC039)
Gauged Runoff Modelled Runoff
0
10
20
30
0 20 40 60 80 100
120
140
160
180Fl
ow (m
3/s)
Time (Hours)
Model Calibration: May 11-12'00 StormEast Duffins Creek (02HC019)
Gauged Runoff Modelled Runoff
0
20
40
60
80
0 20 40 60 80 100
120
140
160
180
Flow
(m3/
s)
Time (Hours)
Model Calibration:May 11-12'00 StormDuffins Creek at Ajax (02HC049)
Gauged Runoff Modelled Runoff
0
4
8
12
0 20 40 60 80 100
120
140
160
180
Flow
(m3/
s)
Time (Hours)
Model Calibration:May 11-12'00 StormW.Duffins Creek @Green River (02HC038)
Gauged Runoff Modelled Runoff
0
4
8
12
0 20 40 60 80 100
120
140
160
180
Flow
(m3/
s)
Time (Hours)
Model Calibration:May 11-12'00 StormUrfe Creek (gauge #37)
Gauged Runoff Modelled Runoff
0
4
8
12
0 20 40 60 80 100
120
140
160
180Fl
ow (m
3/s)
Time (Hours)
Model Calibration:May 11-12'00 StormBrougham Creek (gauge #36)
Gauged Runoff Modelled Runoff
Validation Results - June 13, 2000
0
4
8
12
0 20 40 60
Flow
(m3/
s)
Time (Hours)
Model Calibration: June 13'00 StormReesor Creek (02HC039)
Gauged Runoff Modelled Runoff
0
10
20
30
0 20 40 60Fl
ow (m
3/s)
Time (Hours)
Model Calibration: June 13'00 StormEast Duffins Creek (02HC019)
Gauged Runoff Modelled Runoff
0
20
40
60
80
0 20 40 60
Flow
(m3/
s)
Time (Hours)
Model Calibration: June 13'00 StormDuffins Creek at Ajax (02HC049)
Gauged Runoff Modelled Runoff
0
4
8
12
0 20 40 60
Flow
(m3/
s)
Time (Hours)
Model Calibration: June 13'00 StormW.Duffins Creek @Green River (02HC038)
Gauged Runoff Modelled Runoff
0
4
8
12
0 20 40 60
Flow
(m3/
s)
Time (Hours)
Model Calibration: June 13'00 StormUrfe Creek (guage #37)
Gauged Runoff Modelled Runoff
0
4
8
12
0 20 40 60Fl
ow (m
3/s)
Time (Hours)
Model Calibration: June 13'00 StormBrougham Creek (guage #36)
Gauged Runoff Modelled Runoff
Validation Results - June 24, 2000
0
4
8
12
0 20 40 60 80 100
120
140
160
180
Flow
(m3/
s)
Time (Hours)
Model Calibration: June 24 '00 StormReesor Creek (02HC039)
Gauged Runoff Modelled Runoff
0
10
20
30
0 20 40 60 80 100
120
140
160
180Fl
ow (m
3/s)
Time (Hours)
Model Calibration: June 24 '00 StormEast Duffins Creek (02HC019)
Gauged Runoff Modelled Runoff
0
20
40
60
80
0 20 40 60 80 100
120
140
160
180
Flow
(m3/
s)
Time (Hours)
Model Calibration: June 24 '00 StormDuffins Creek at Ajax (02HC049)
Gauged Runoff Modelled Runoff
0
4
8
12
0 20 40 60 80 100
120
140
160
180
Flow
(m3/
s)
Time (Hours)
Model Calibration: June 24 '00 StormW.Duffins Creek @Green River (02HC038)
Gauged Runoff Modelled Runoff
0
4
8
12
0 20 40 60 80 100
120
140
160
180
Flow
(m3/
s)
Time (Hours)
Model Calibration: June 24 '00 StormUrfe Creek (gauge #37)
Gauged Runoff Modelled Runoff
0
4
8
12
0 20 40 60 80 100
120
140
160
180Fl
ow (m
3/s)
Time (Hours)
Model Calibration: June 24 '00 StormBrougham Creek (gauge #36)
Gauged Runoff Modelled Runoff
City Of Pickering / TRCA 11 February 2013 2012 Duffins Creek Hydrology Update
Aquafor Beech Limited
APPENDIX G:
Model Calibration: Review of Radar Data
To: Nick Lorrain
Water Resources Coordinator November 9, 2012
From: Tom Dole
Water Resources Engineer Copy: Senior Water Resources Engineer Subject: 2012 Duffins Creek Hydrology Update - Calibration/ Validation Event Summary The following is a brief description of the calibration and validation results. The intent of the analysis is to explain large discrepancies (greater than 25%) between simulated and observed flows. .
Memo
November 9th, 2012 2012 Duffins Creek Hydrology Update
Page 2
Event: May 15-17, 2003 Rainfall Total: HY001 –53mm HY015 – 62.1 CLOCA 5 – 51.8 mm Average 5-Day API 26 mm
The event came from the southeast with the highest rainfall totals in the southern and eastern portion of the watershed. The calibration model used rainfall from HY001, HY015 and CLOCA 5. According to the rainfall totals from the radar data, gauges HY001 and HY015 had some of the highest rainfall totals. The calibration model was run using rainfall from the portions of the watershed which received the most rainfall. Given that, it is understandable that the simulated flows tended to be higher than observed.
November 9th, 2012 2012 Duffins Creek Hydrology Update
Page 3
Event: May 23-24, 2003 Rainfall Total: HY001 –30 mm HY009 – 26.4 mm CLOCA 5 – 30.9 Average 5-Day API 10 mm
The event came from the southwest with the highest rainfall totals in the southwest part of the watershed according to the rainfall data. The calibration model used rainfall from HY001, HY015 and CLOCA 5. The recorded rainfall at these gauges was fairly uniform which is confirmed by the radar data. The simulated and observed flows were very close at the lake. However, the model did tend to overpredict flows at the subwatershed level.
November 9th, 2012 2012 Duffins Creek Hydrology Update
Page 4
Event: July 29-30, 2006 Rainfall Total: HY031 – 57.8mm 02HC018 – 98.5mm 02HC055 – 103.3mm CLOCA 5 – 53.1mm HY043 – 19.8mm Average 5-Day API 8
The event came in a narrow band from the northwest. The highest rainfall totals were throughout the centre of the watershed. The radar data and recorded rainfall differed rather significantly. Despite the non-uniform rainfall pattern, the use of multiple rain gauges led to good agreement between simulated and observed results.
November 9th, 2012 2012 Duffins Creek Hydrology Update
Page 5
Event: July 23, 2008 Rainfall Total: HY001 – 16.4mm HY015 – 41mm HY031 – 11.8mm CLOCA 5 – 8.1mm HY043 – 19.8mm Average 5-Day API 52 mm
Rainfall distribution in this event was very uneven. The radar showed characteristics of localized thunderstorm cells. The highest rainfall amounts were concentrated in a band through the centre of the watershed. From the radar data it is apparent that the available rain gauges missed the areas with the highest rainfall amounts. This is confirmed by the observed flows being significantly higher than simulated in the more central subwatersheds such as Urfe Creek.
November 9th, 2012 2012 Duffins Creek Hydrology Update
Page 6
Simulated flows were significantly higher than observed on the East Duffins Creek and Michell Creek. Rainfall data for these catchments was taken from HY015, HY031 and CLOCA 5. The radar data confirms that the use of data from HY015 for Catchments 4701, 4702 and 5001 is appropriate given that the rainfall was most intense in these catchments. However, the flows from the catchments using data from HY015 are driving up the flows which suggests that the rainfall totals within these catchments were lower.
November 9th, 2012 2012 Duffins Creek Hydrology Update
Page 7
Event: June 24, 2010 Rainfall Total: HY001 – 26.4mm HY009 – 35.2mm HY015 – 29.2mm HY031 – 27.2mm HY043 – 31.2mm CLOCA 5 – 23.6mm Average 5-Day API 18 mm
This system came from the west. The rainfall distribution for this event was relatively even with some more intense pockets through the centre of the watershed. Rainfall totals from the gauges were quite close. However, there are no gauges within the central areas which had the higher rainfall totals.
November 9th, 2012 2012 Duffins Creek Hydrology Update
Page 8
There was good agreement between simulated and observed peak flows. The simulated flows for Mitchell Creek were relatively higher than observed. This can be explained by the areal distribution of rainfall as the radar data indicates that there was a lot less rain within the Mitchell Creek subwatershed than what fell at the surrounding gauges.
November 9th, 2012 2012 Duffins Creek Hydrology Update
Page 9
Event: June 27, 28, 2010 Rainfall Total: HY001 –31.0 mm HY009 – 29.0 mm HY015 – 18.0 mm HY031 – 19.2 mm HY043 –19.6 mm CLOCA 5 –18.6 mm Average 5-Day API 57 mm
This system came from the west. The model showed good agreement with the observed data. The notable exception being Michell Creek where simulated flows were higher than observed. According to the radar data the rainfall totals within the catchment were slightly lower than the recorded data at the gauges. This may explain some of the difference between simulated and observed.
November 9th, 2012 2012 Duffins Creek Hydrology Update
Page 10
Event: July 23, 2010 Rainfall Total: HY001 –55.8 mm HY015 – 47.6 mm HY031 – 41.6 mm HY043 – 57.2 mm CLOCA 5 – 39.0mm Average 5-Day API 11 mm
This system came from the west. According to the radar data this was a fairly uniform event although the radar’s rainfall totals were lower than the recorded values. The simulated and observed flows were in good agreement. Event: May 11, 2000
November 9th, 2012 2012 Duffins Creek Hydrology Update
Page 11
Rainfall Total: York 02 – Stouffville WWTP – 61.2 mm Average 5-Day API 10 mm
This system came from the west. With the exception of the East Duffins HC019 gauge, observed flows were all higher than simulated. This is to be expected given that the rainfall data is taken from York 02-Stouffville WWTP which, according to the radar data, experienced lower rainfall totals than other parts of the watershed. Observed flows in Urfe Creek were much higher than simulated. This is to be expected as, according to the radar data, the Urfe Creek subwatershed experienced significantly higher rainfall totals than Stouffville.
November 9th, 2012 2012 Duffins Creek Hydrology Update
Page 12
Event: June 13, 2000 Rainfall Total: York 02-Stouffville WWTP – 45.4 mm Average 5-Day API 8 mm
This system came from the west. The rainfall was relatively evenly distributed. Simulated and observed flows were in good agreement.
November 9th, 2012 2012 Duffins Creek Hydrology Update
Page 13
Event: June 24, 2000 Rainfall Total York02-WWTP Stouffville – 41.0 mm Average 5-Day API 9 mm
The system came from the south. The rainfall distribution was relatively even although there were higher rainfall totals in the very southern portion of the watershed. There was good agreement between simulated and observed flows. Trends
City Of Pickering / TRCA 11 February 2013 2012 Duffins Creek Hydrology Update


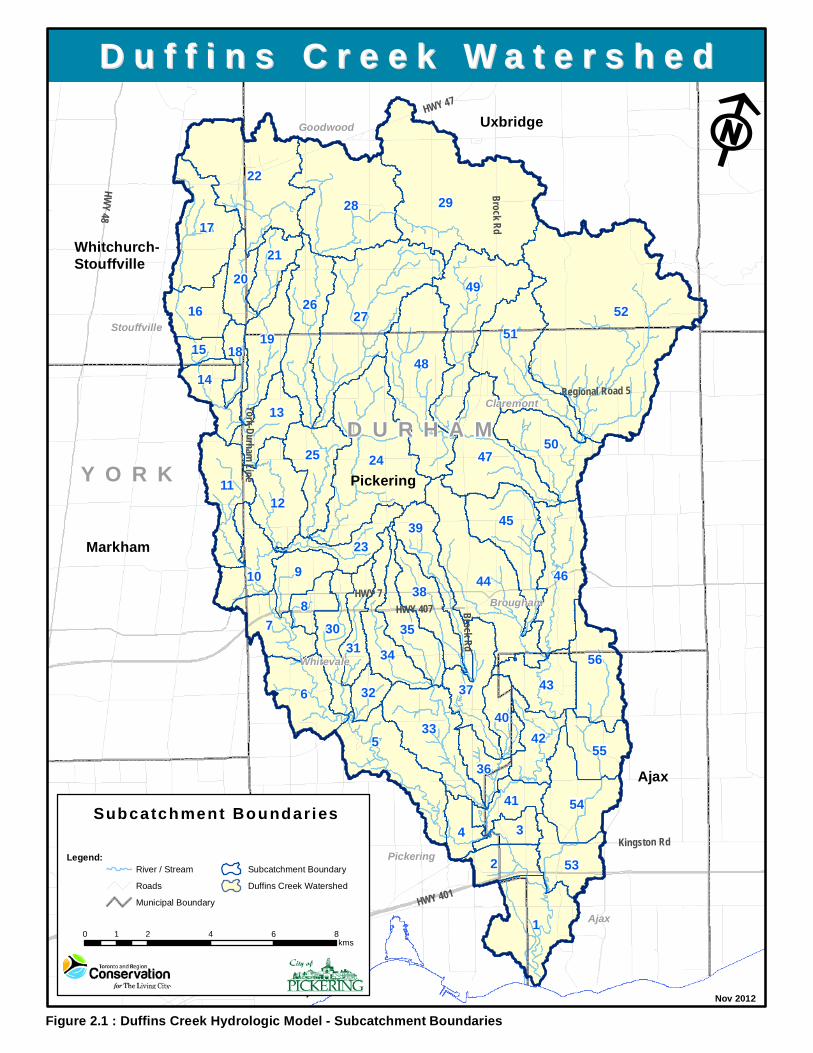


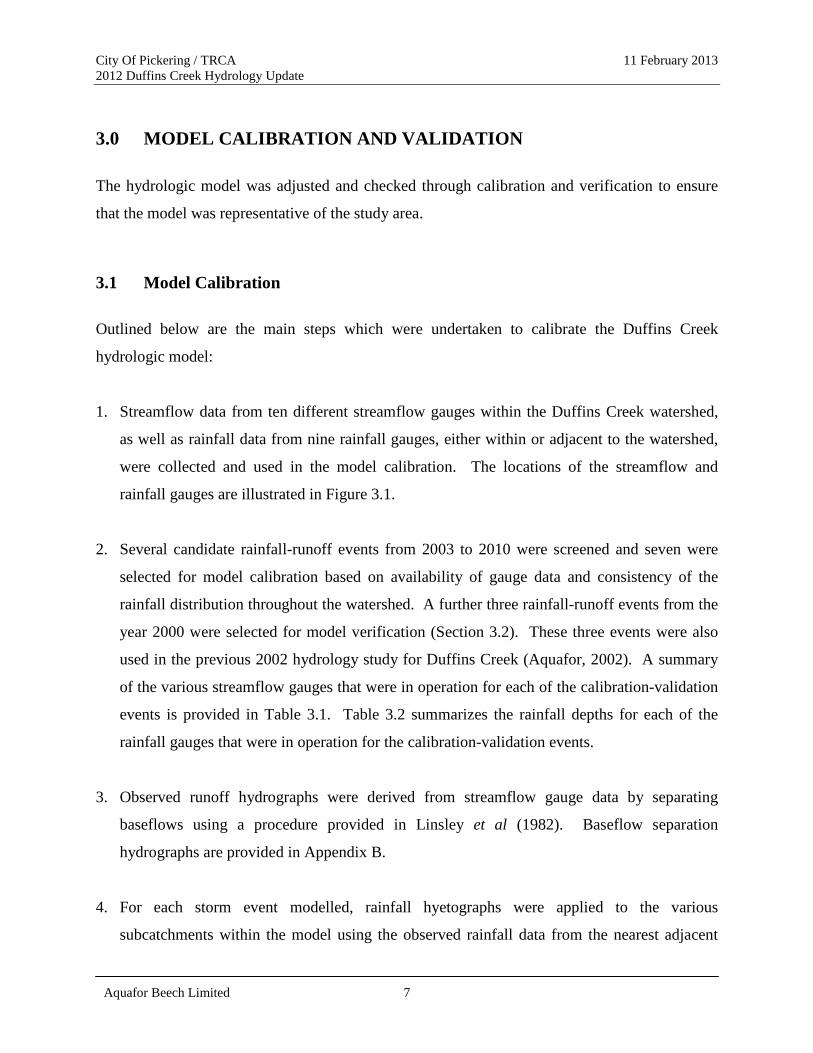


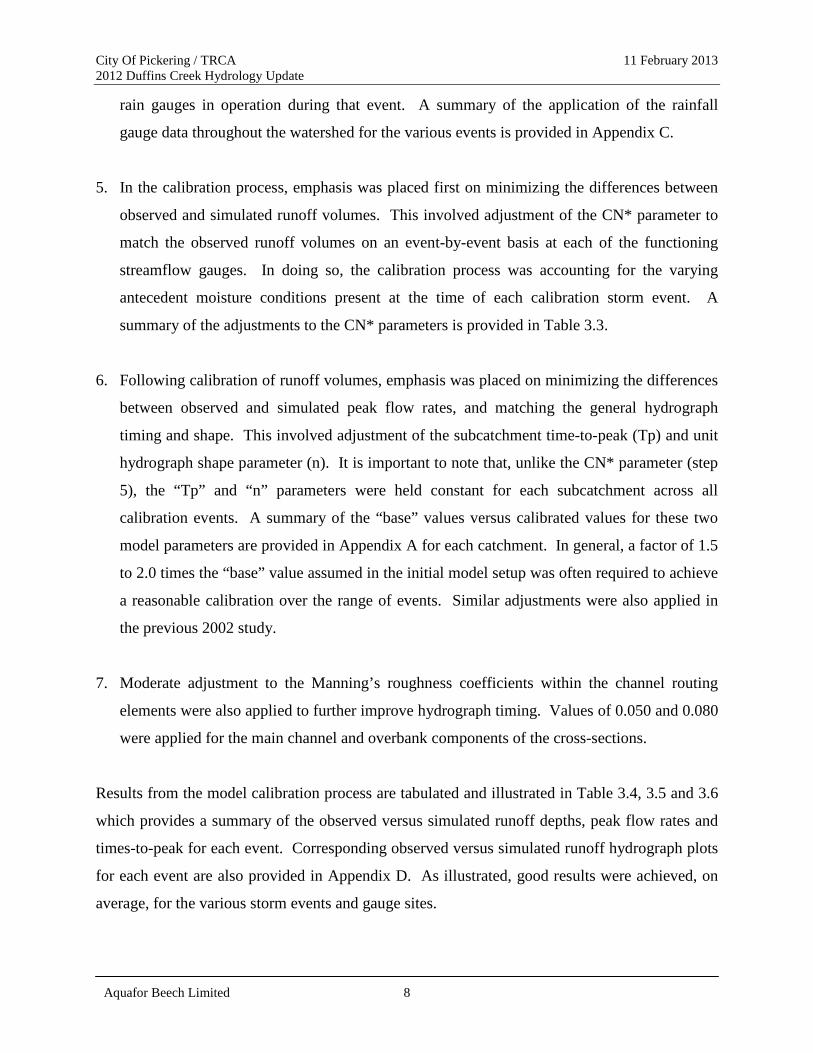


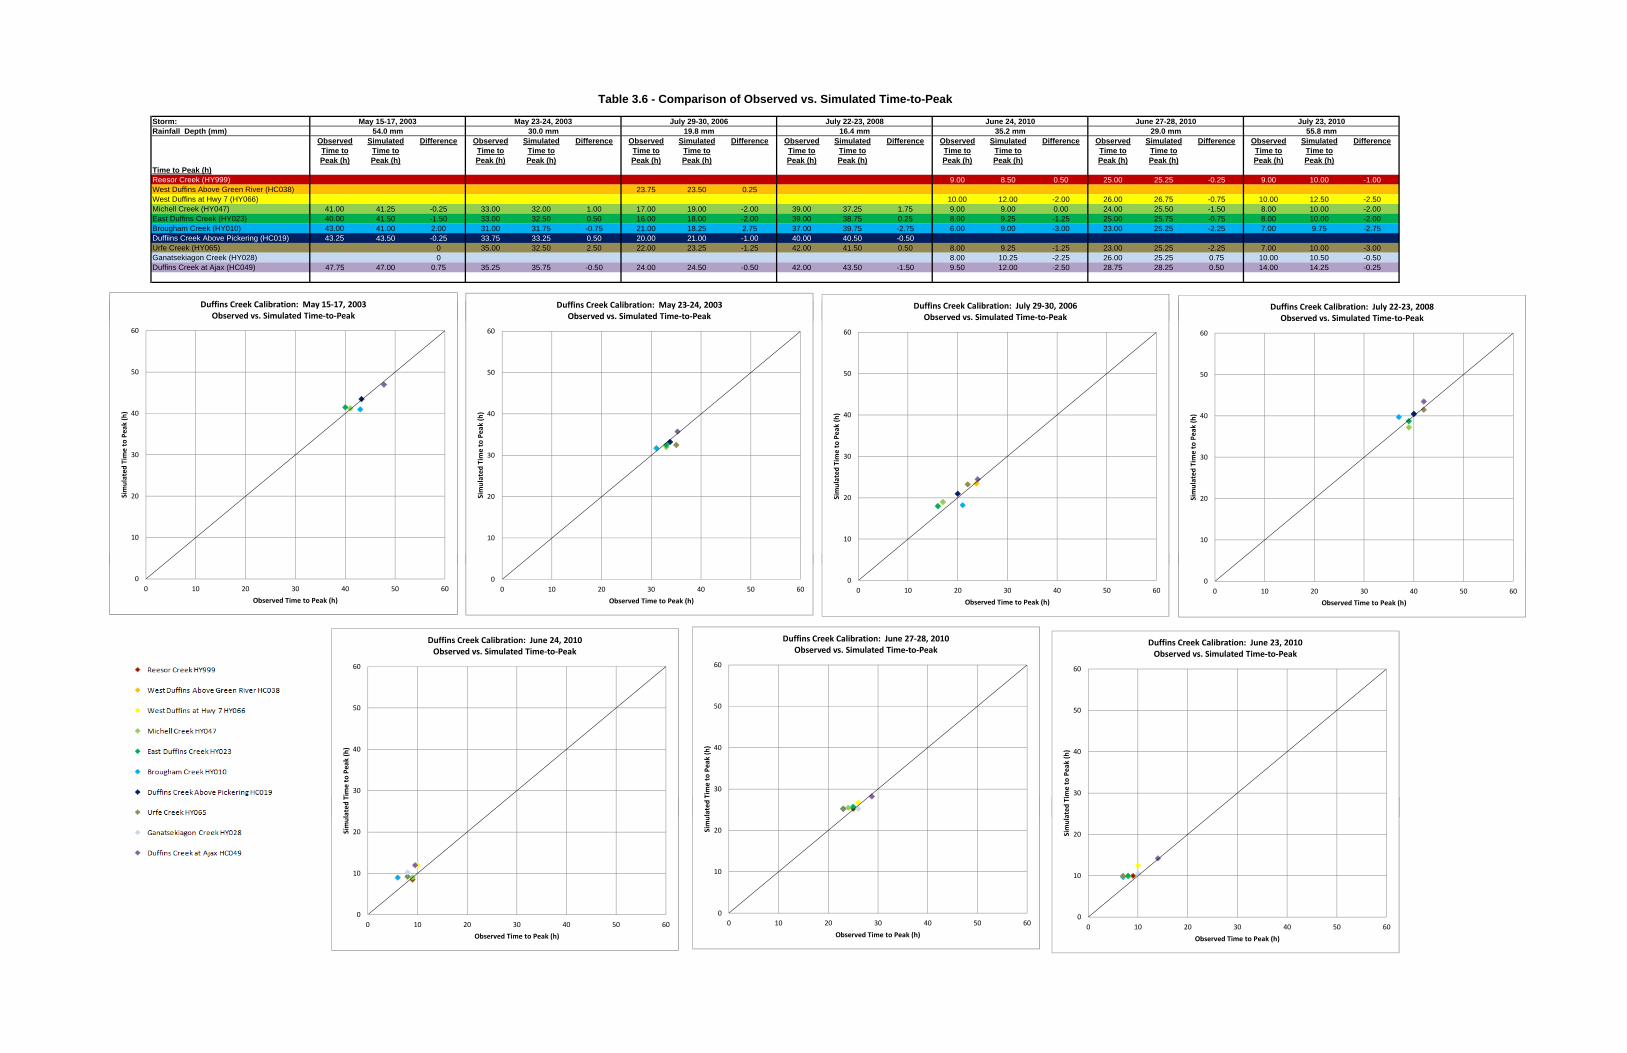

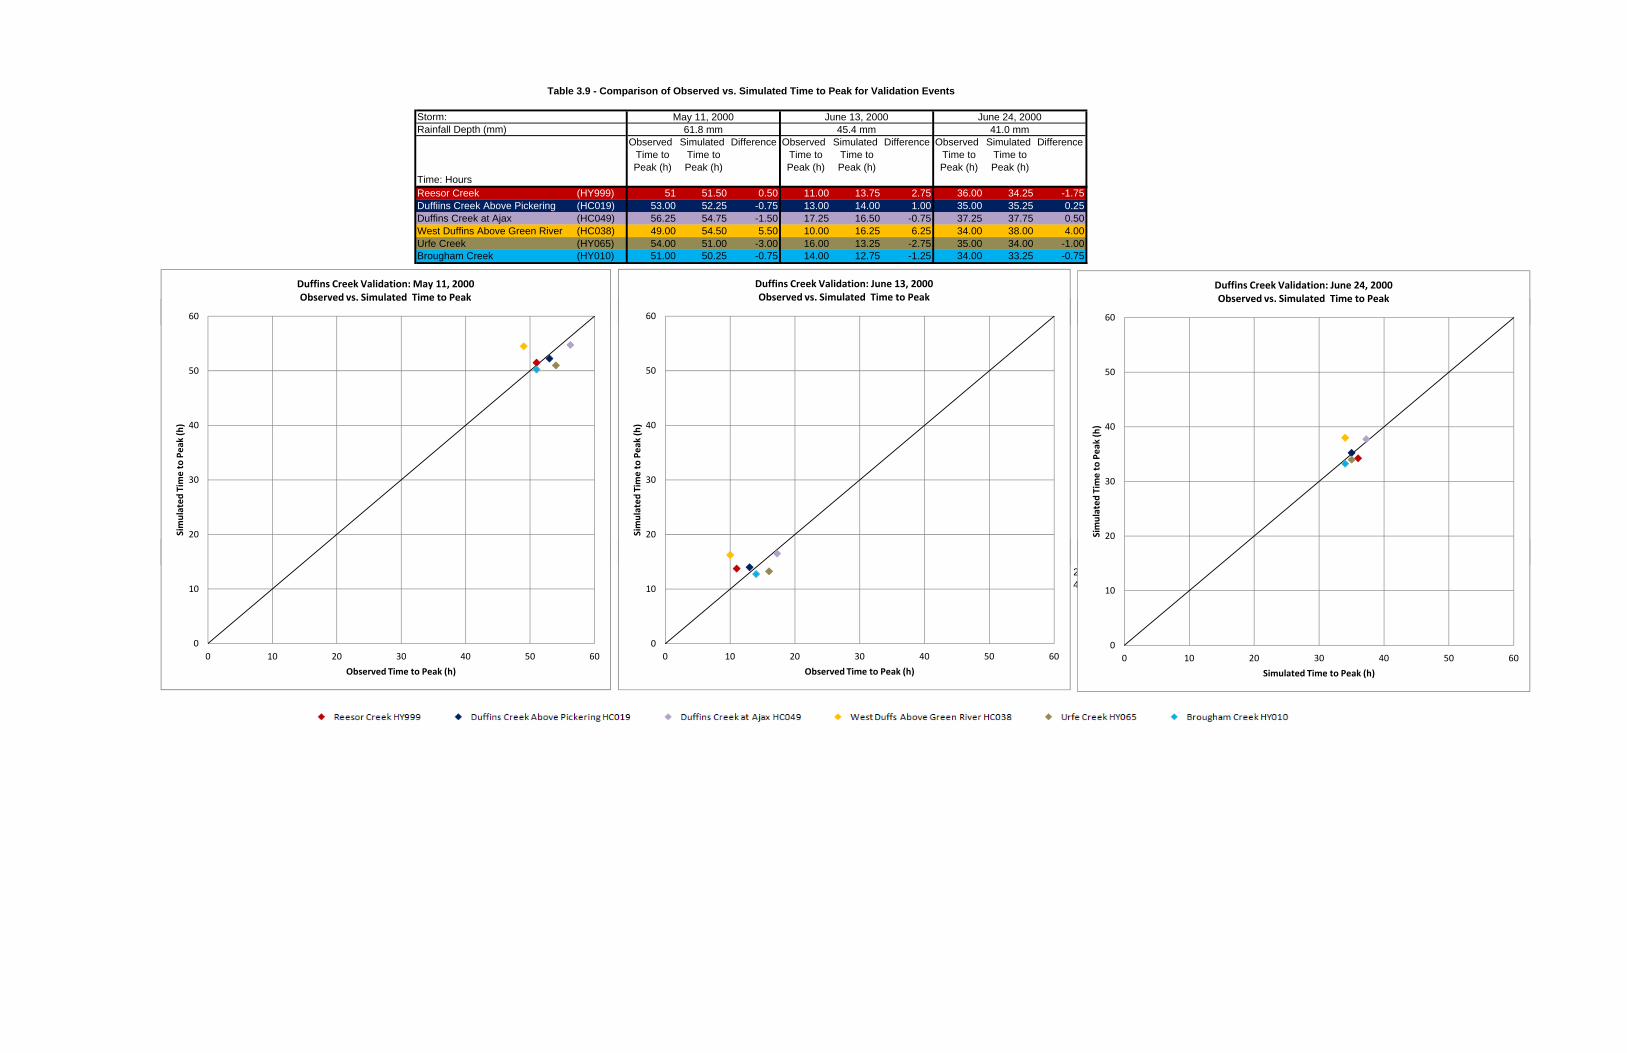

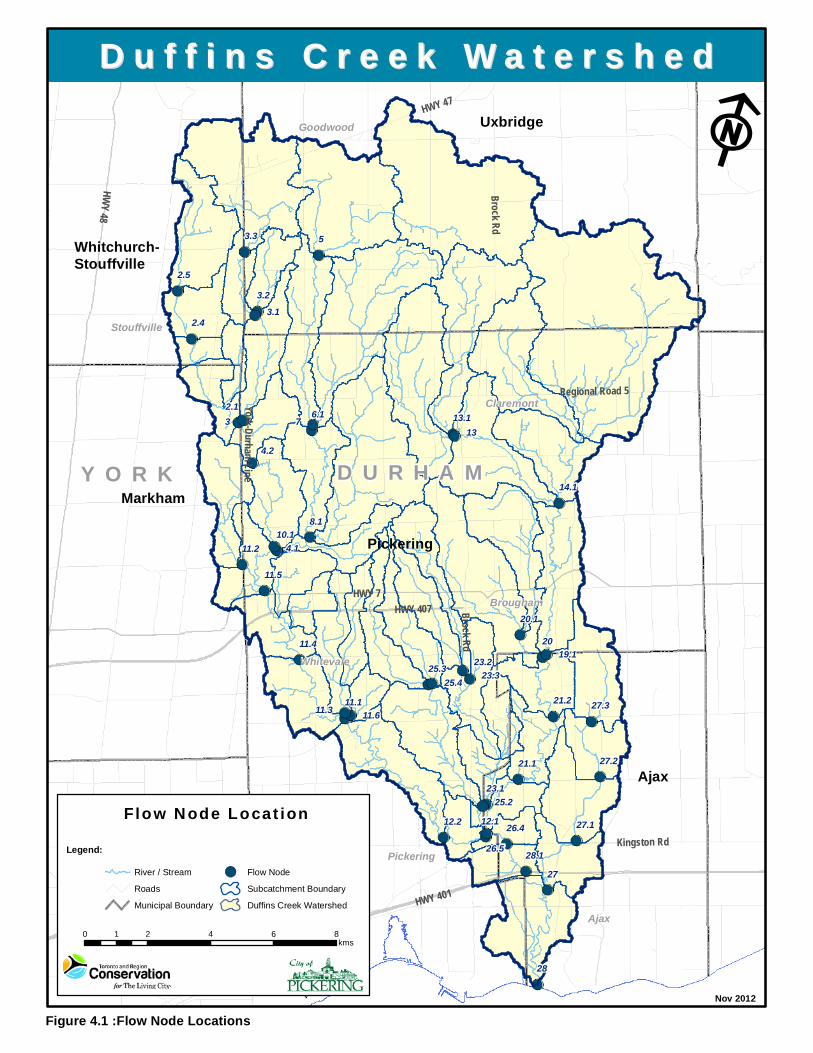


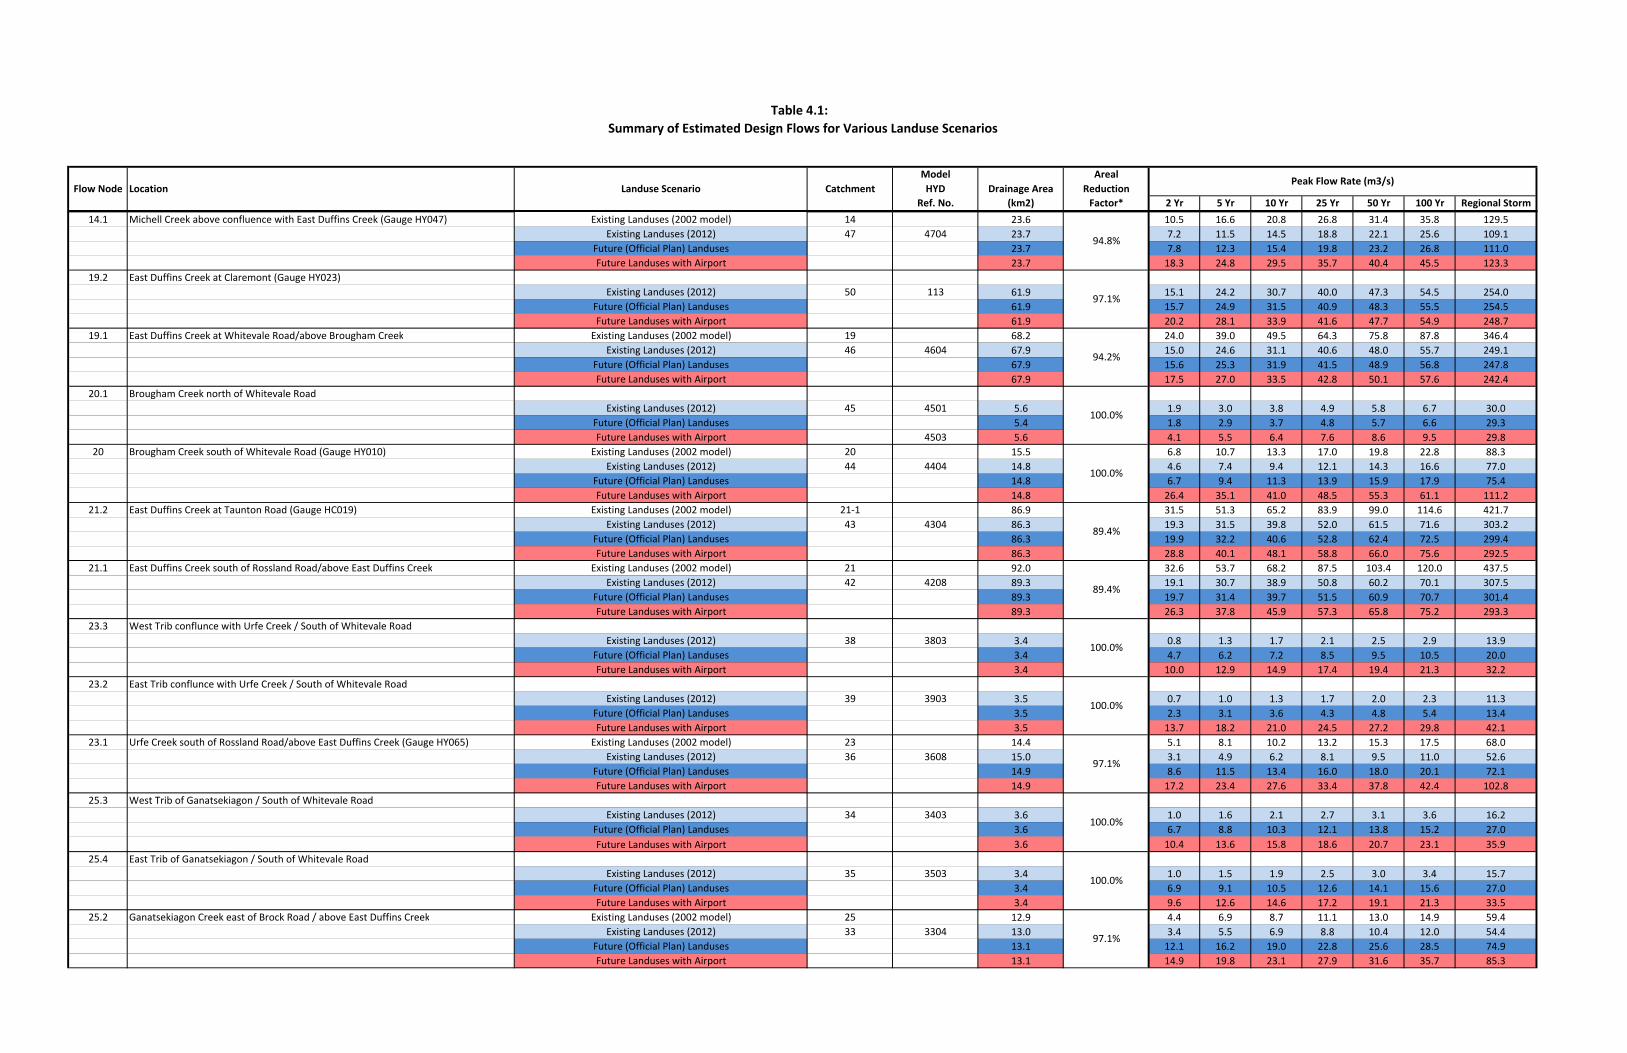


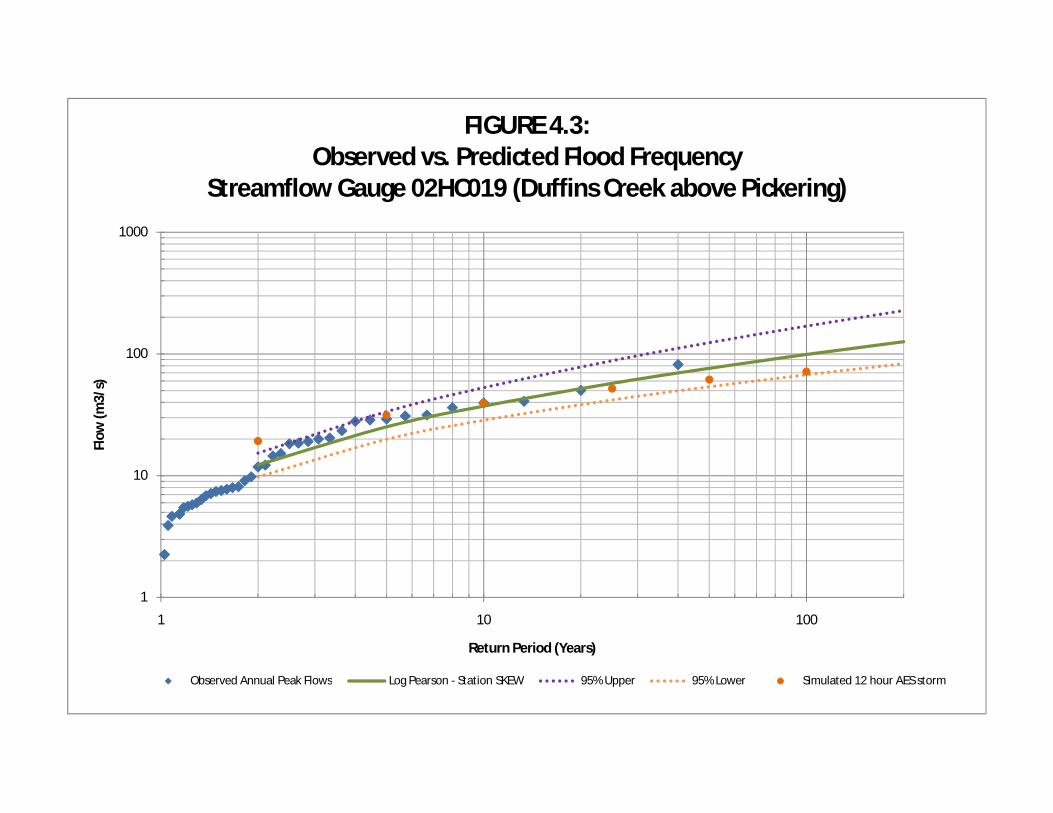
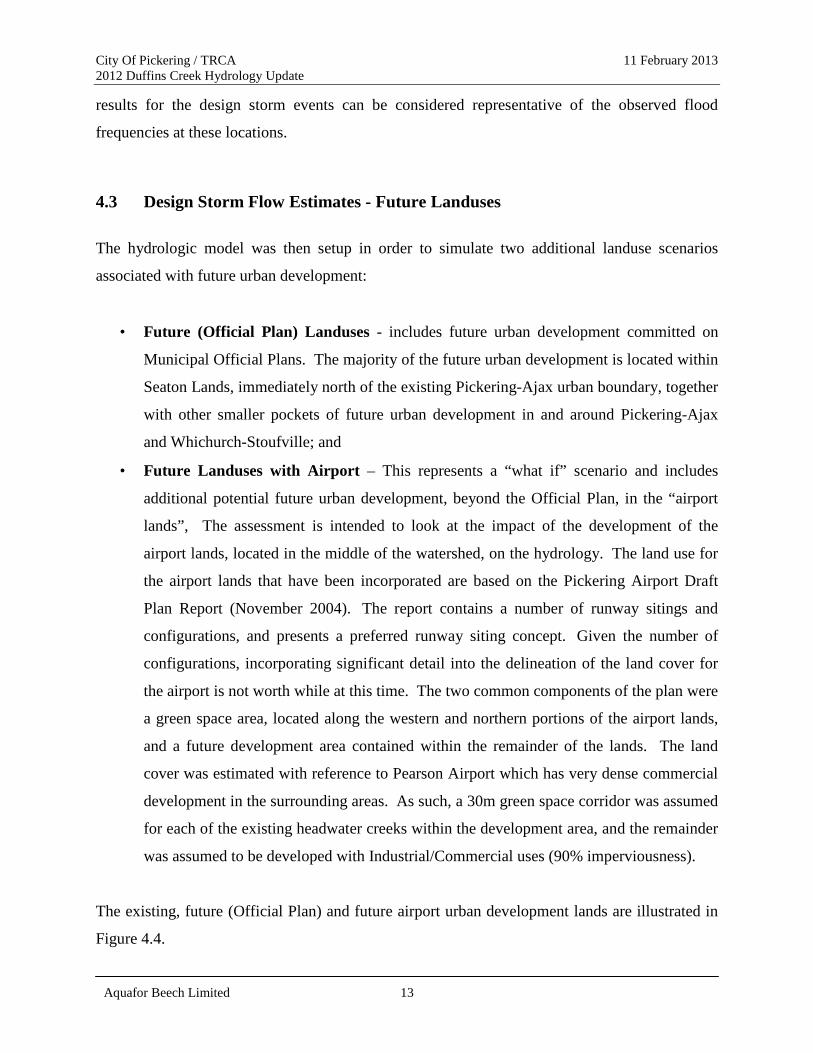

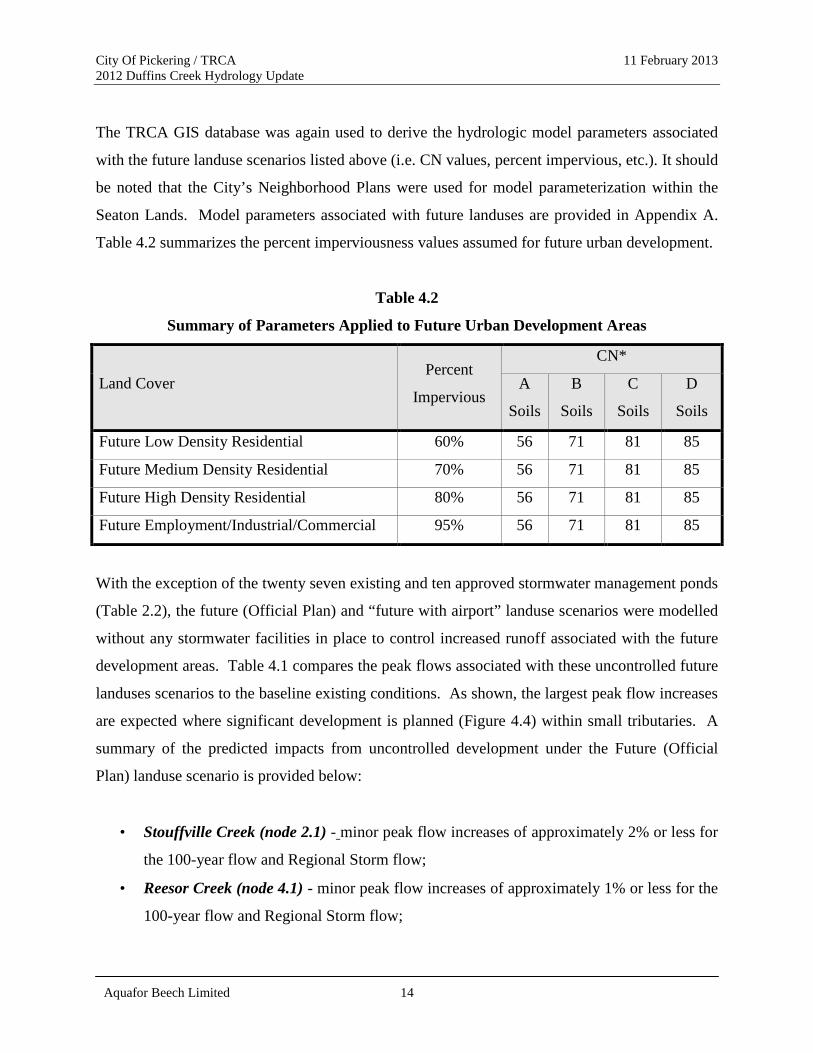


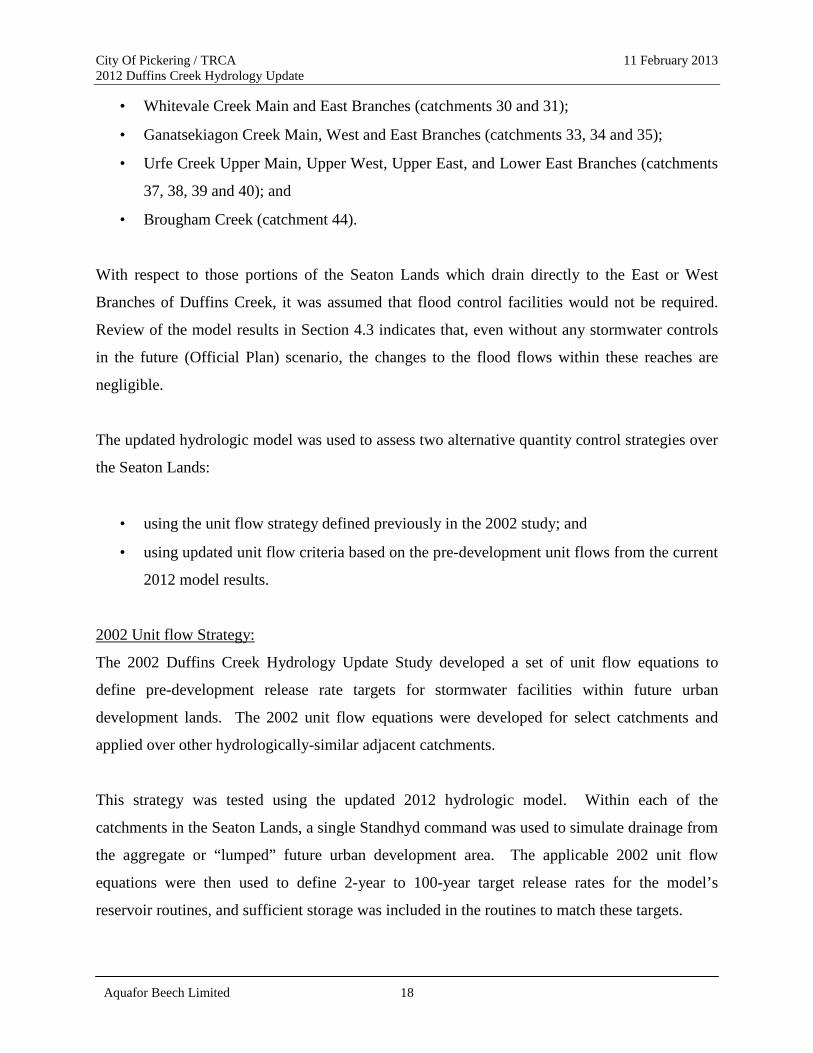


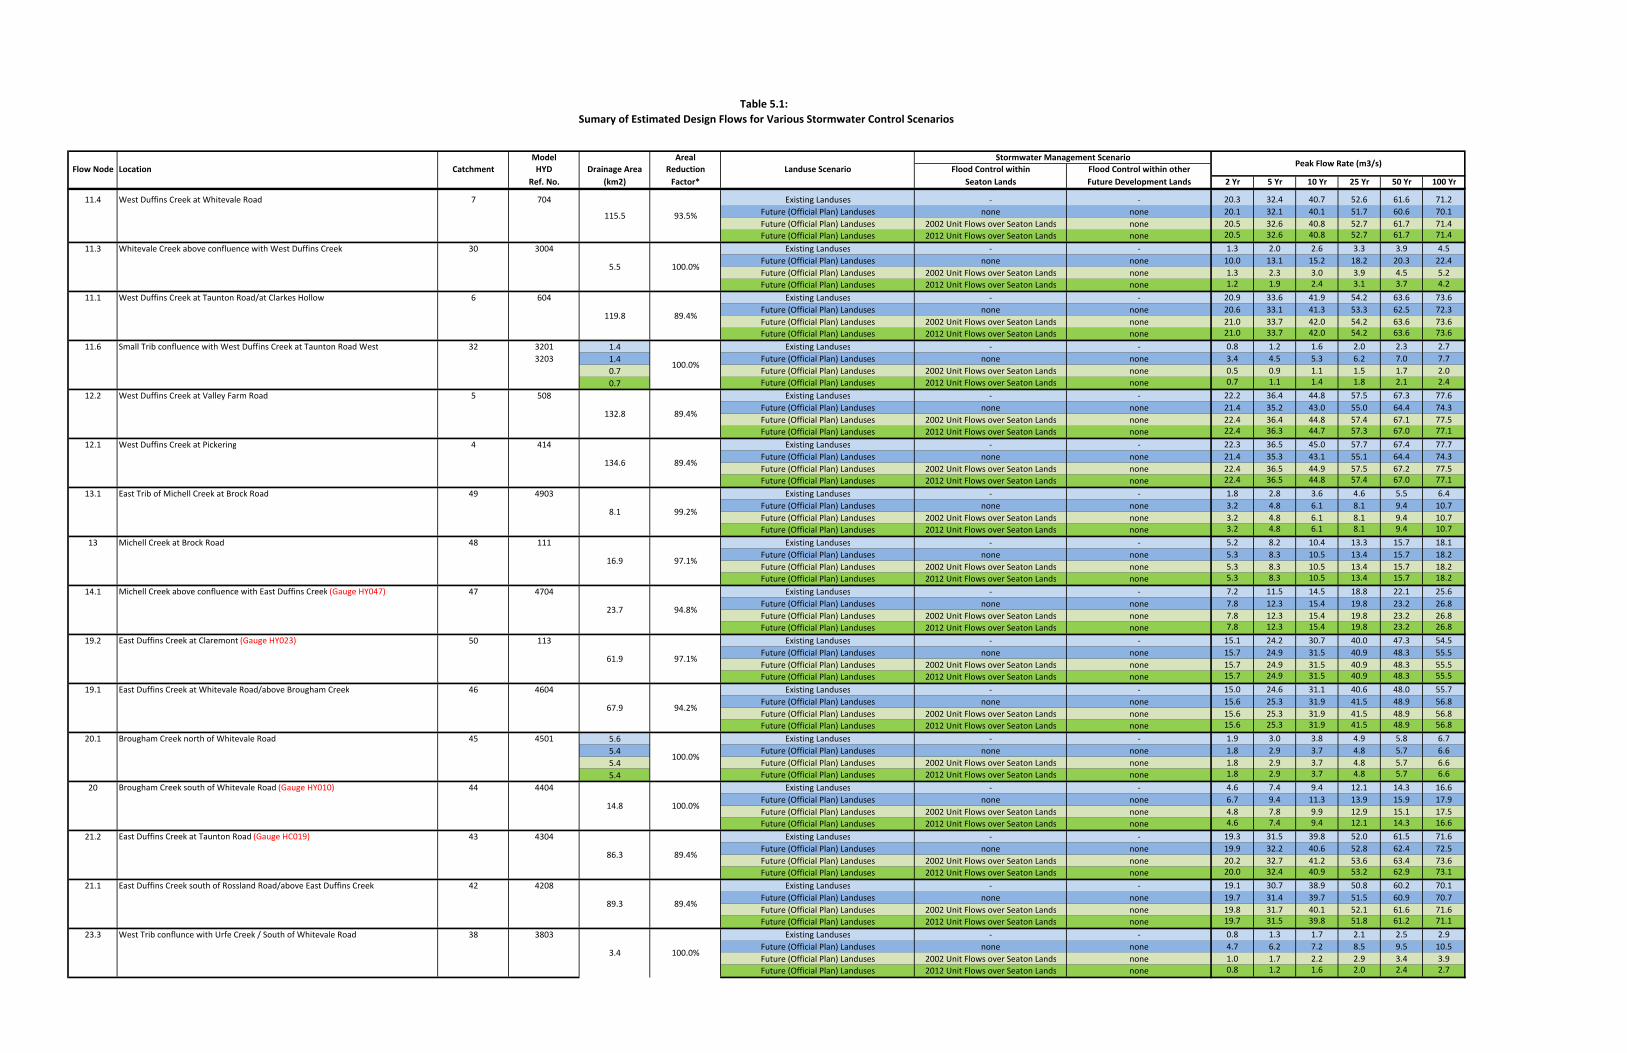

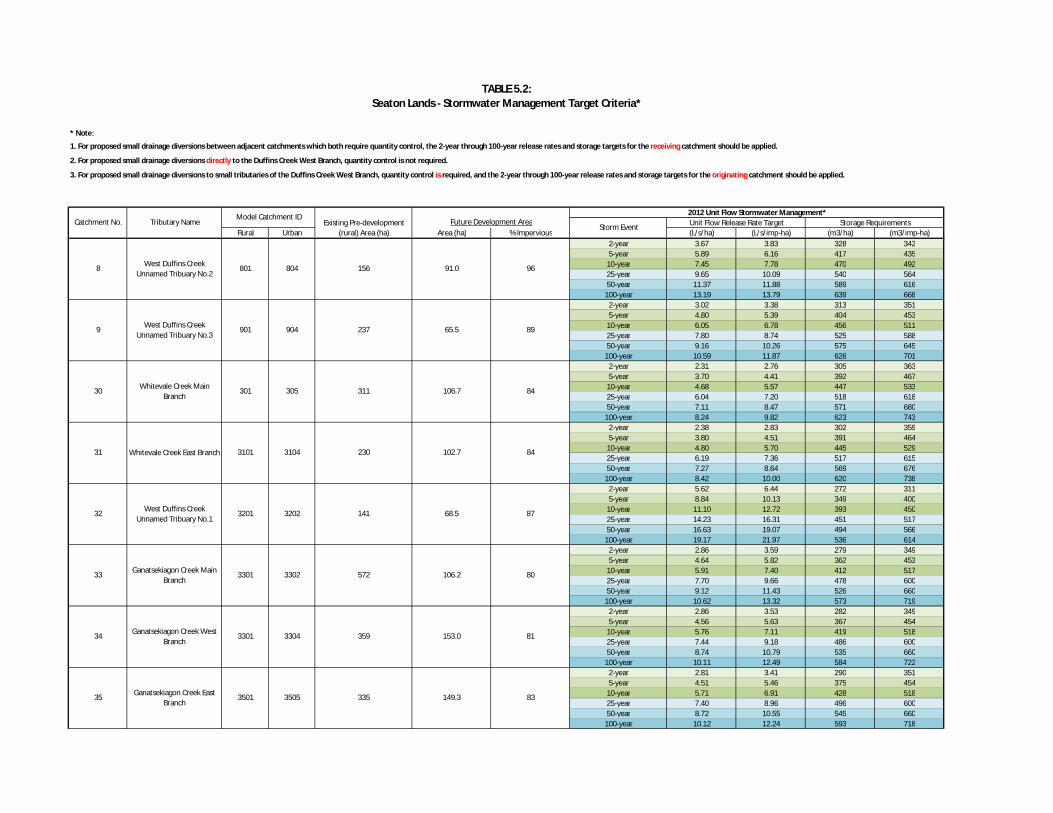


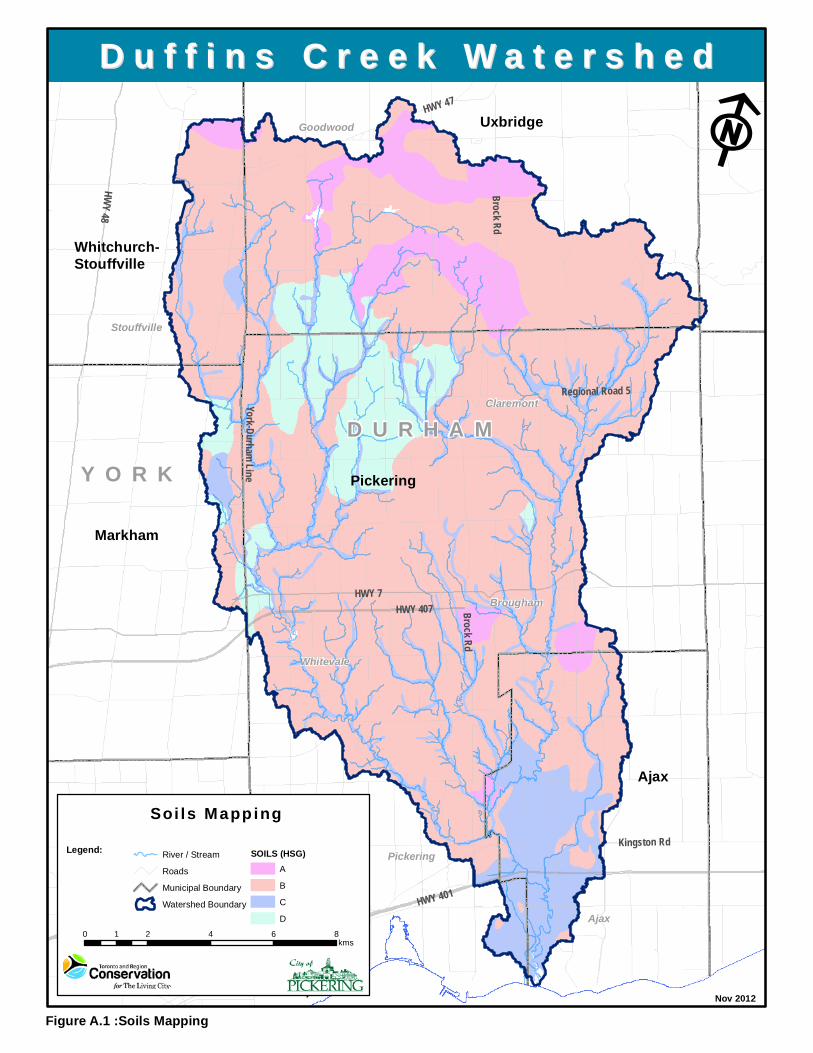

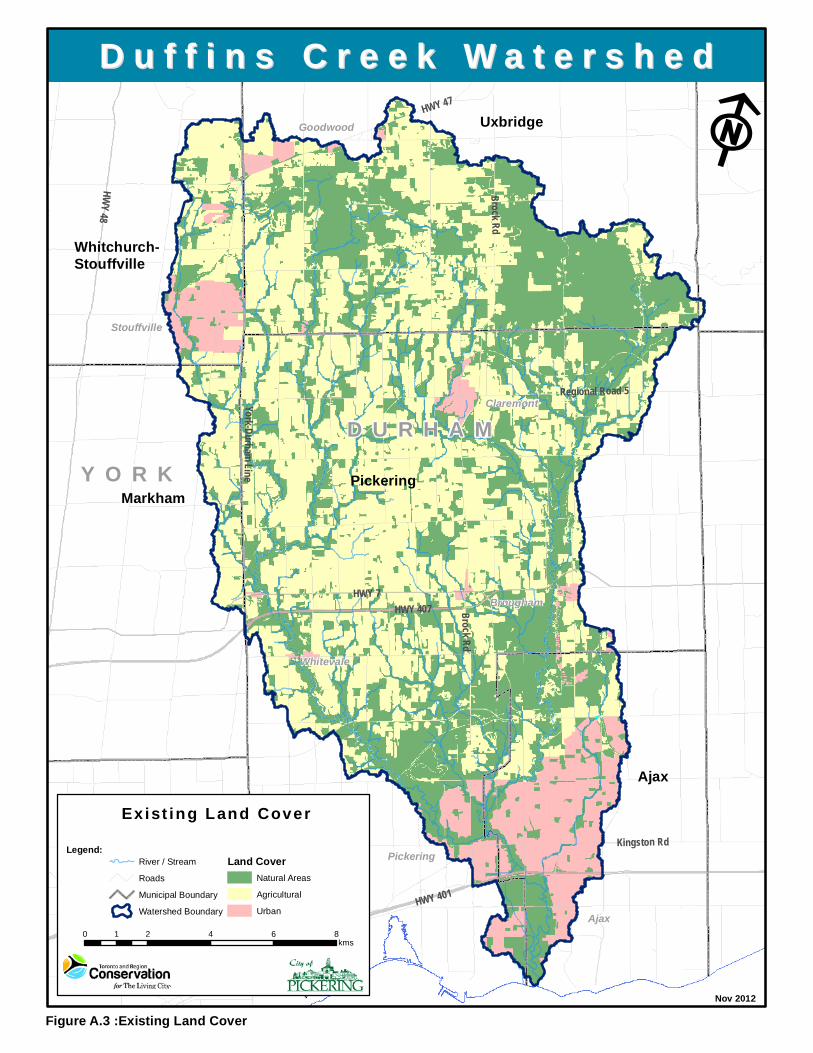
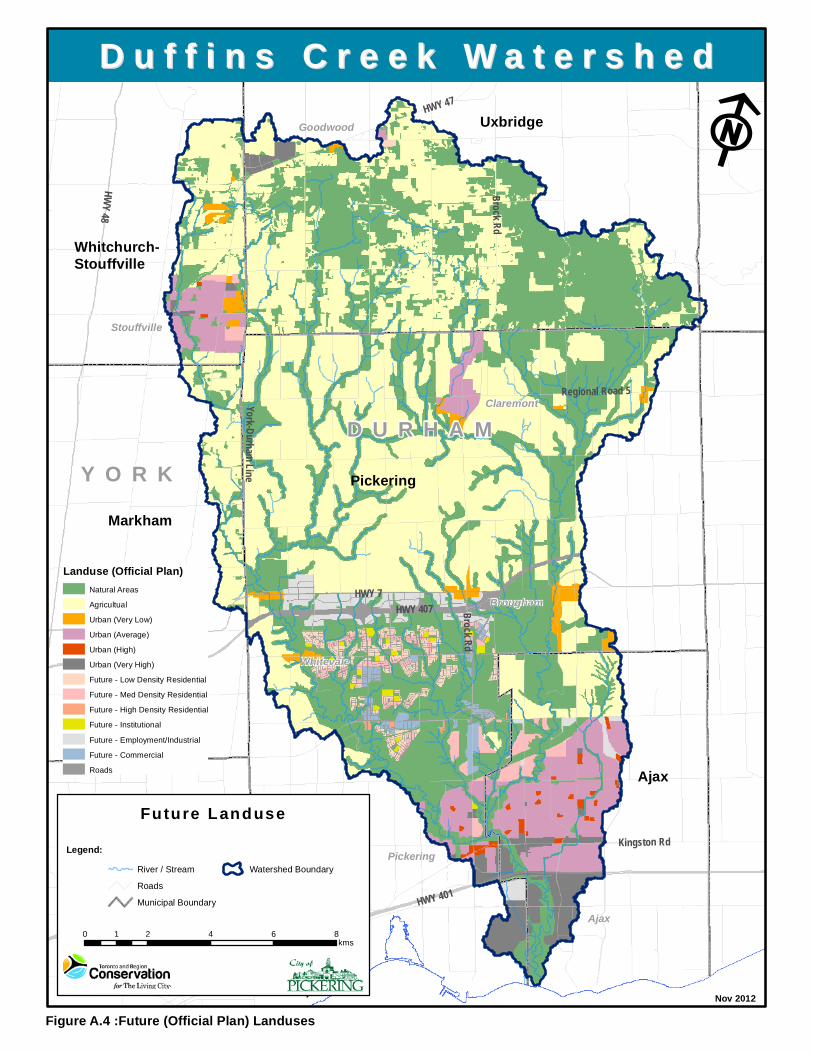

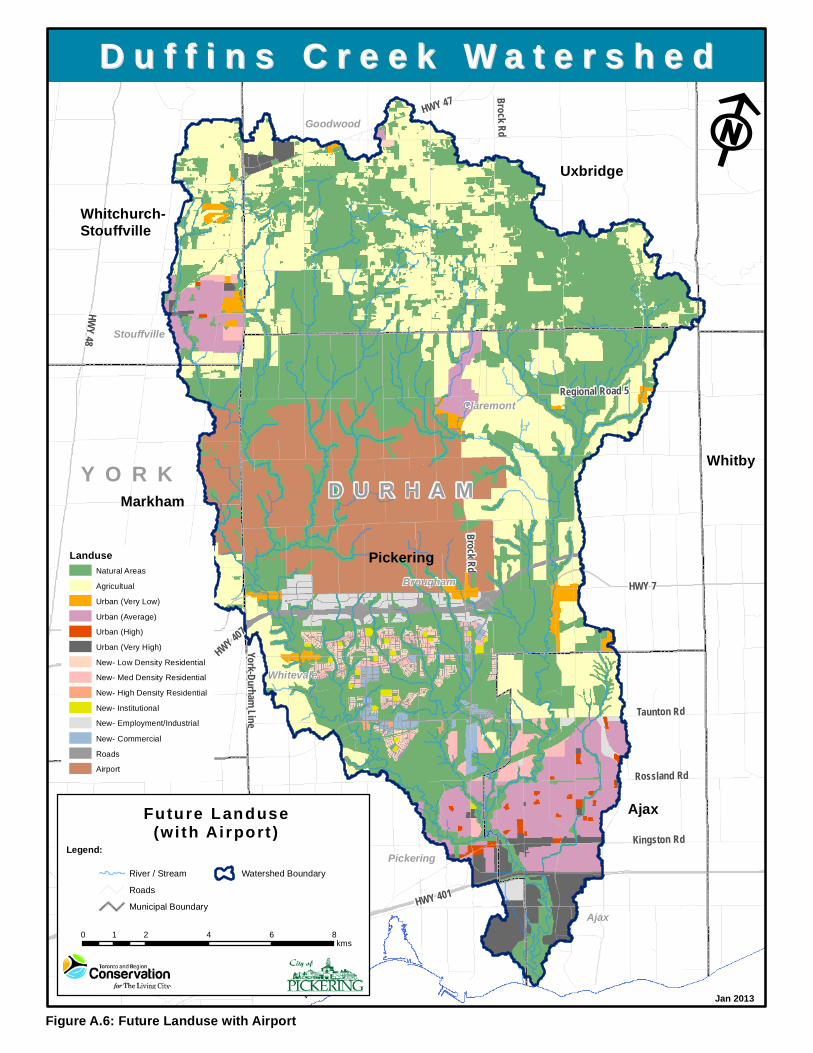

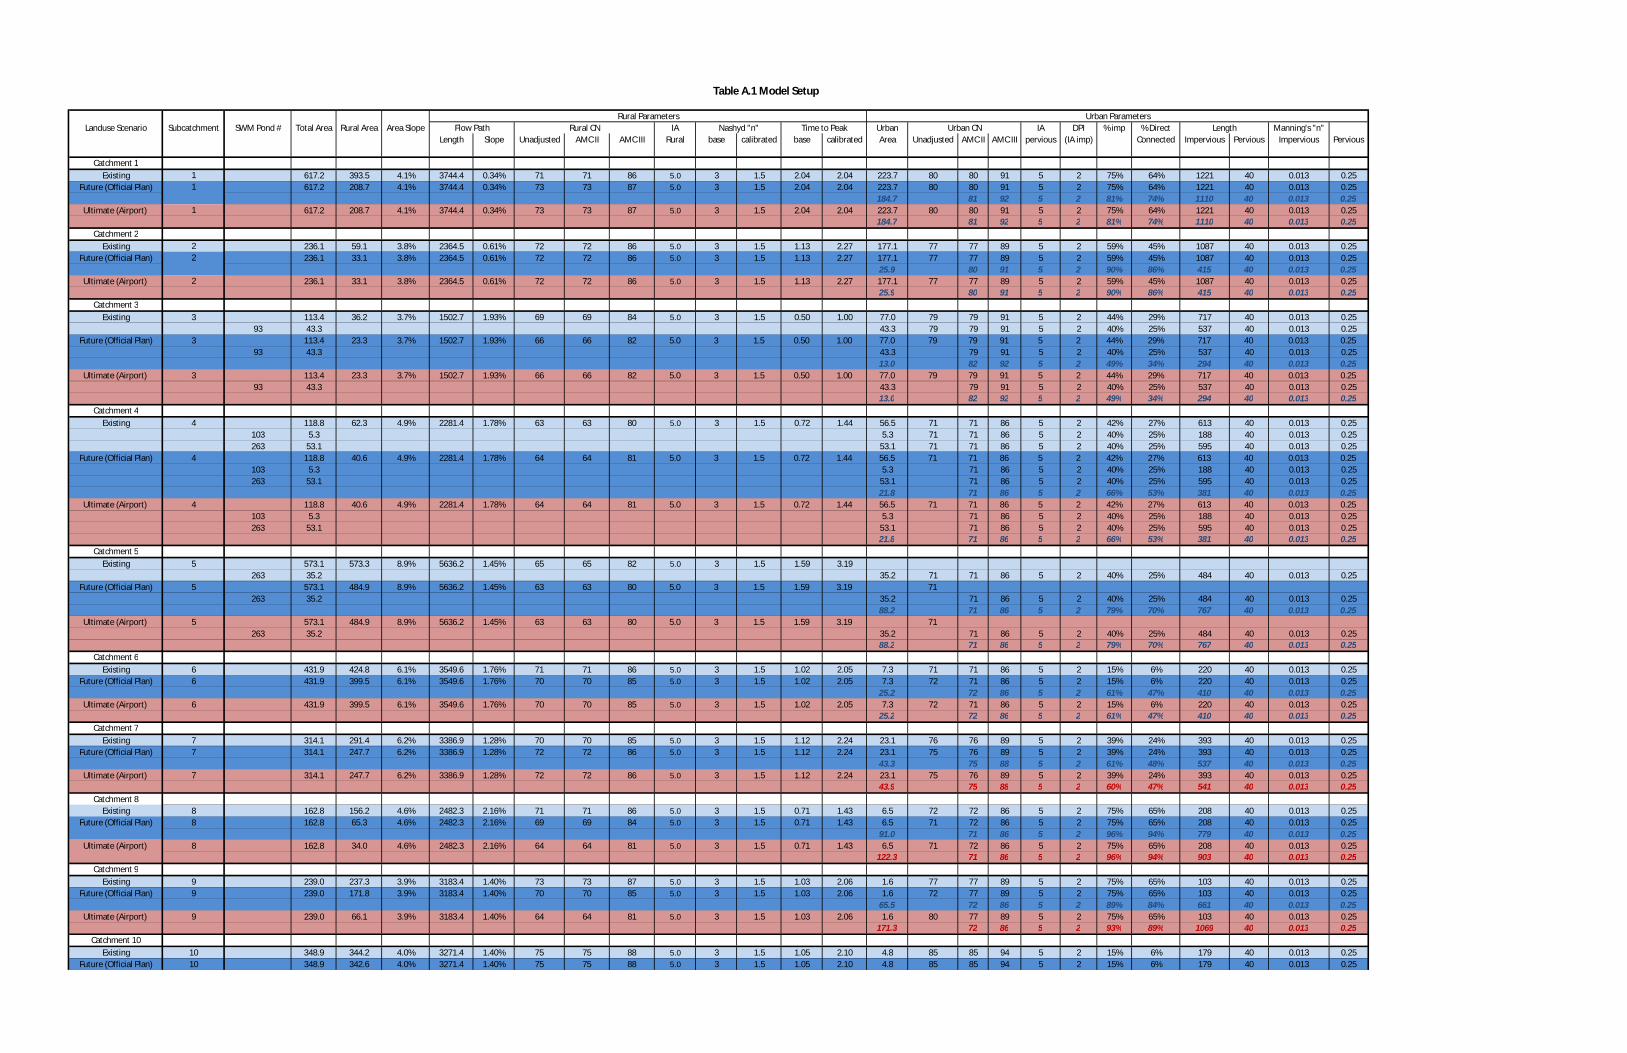


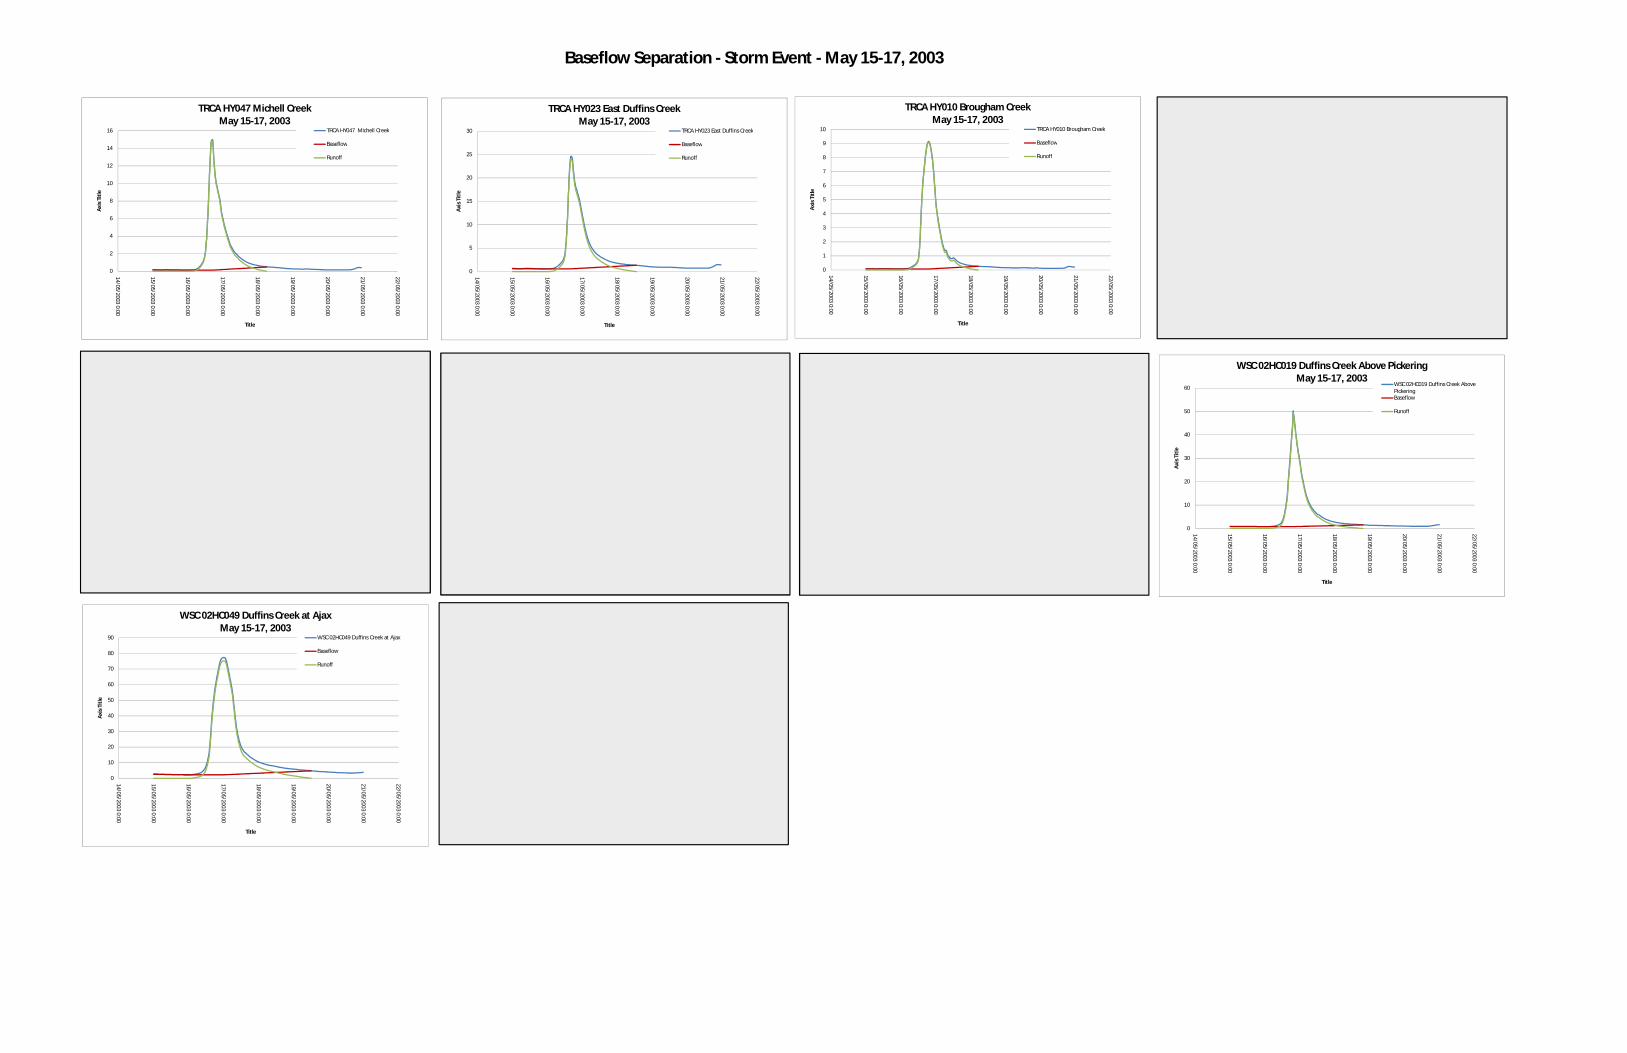
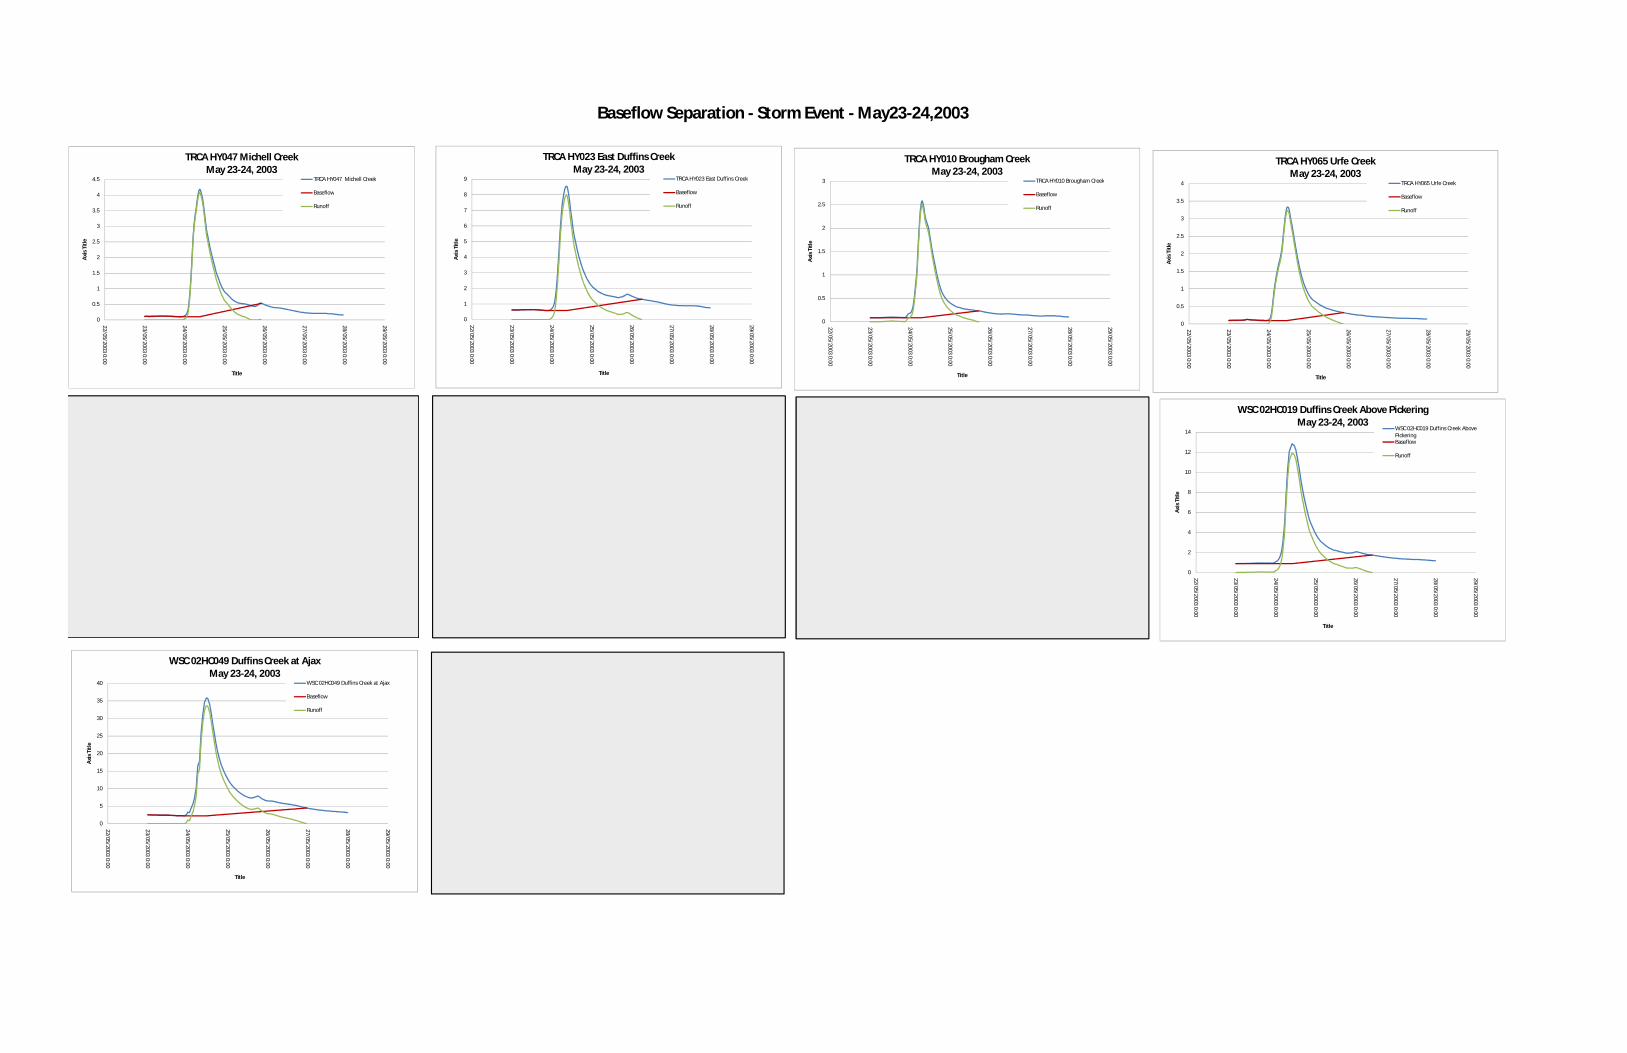

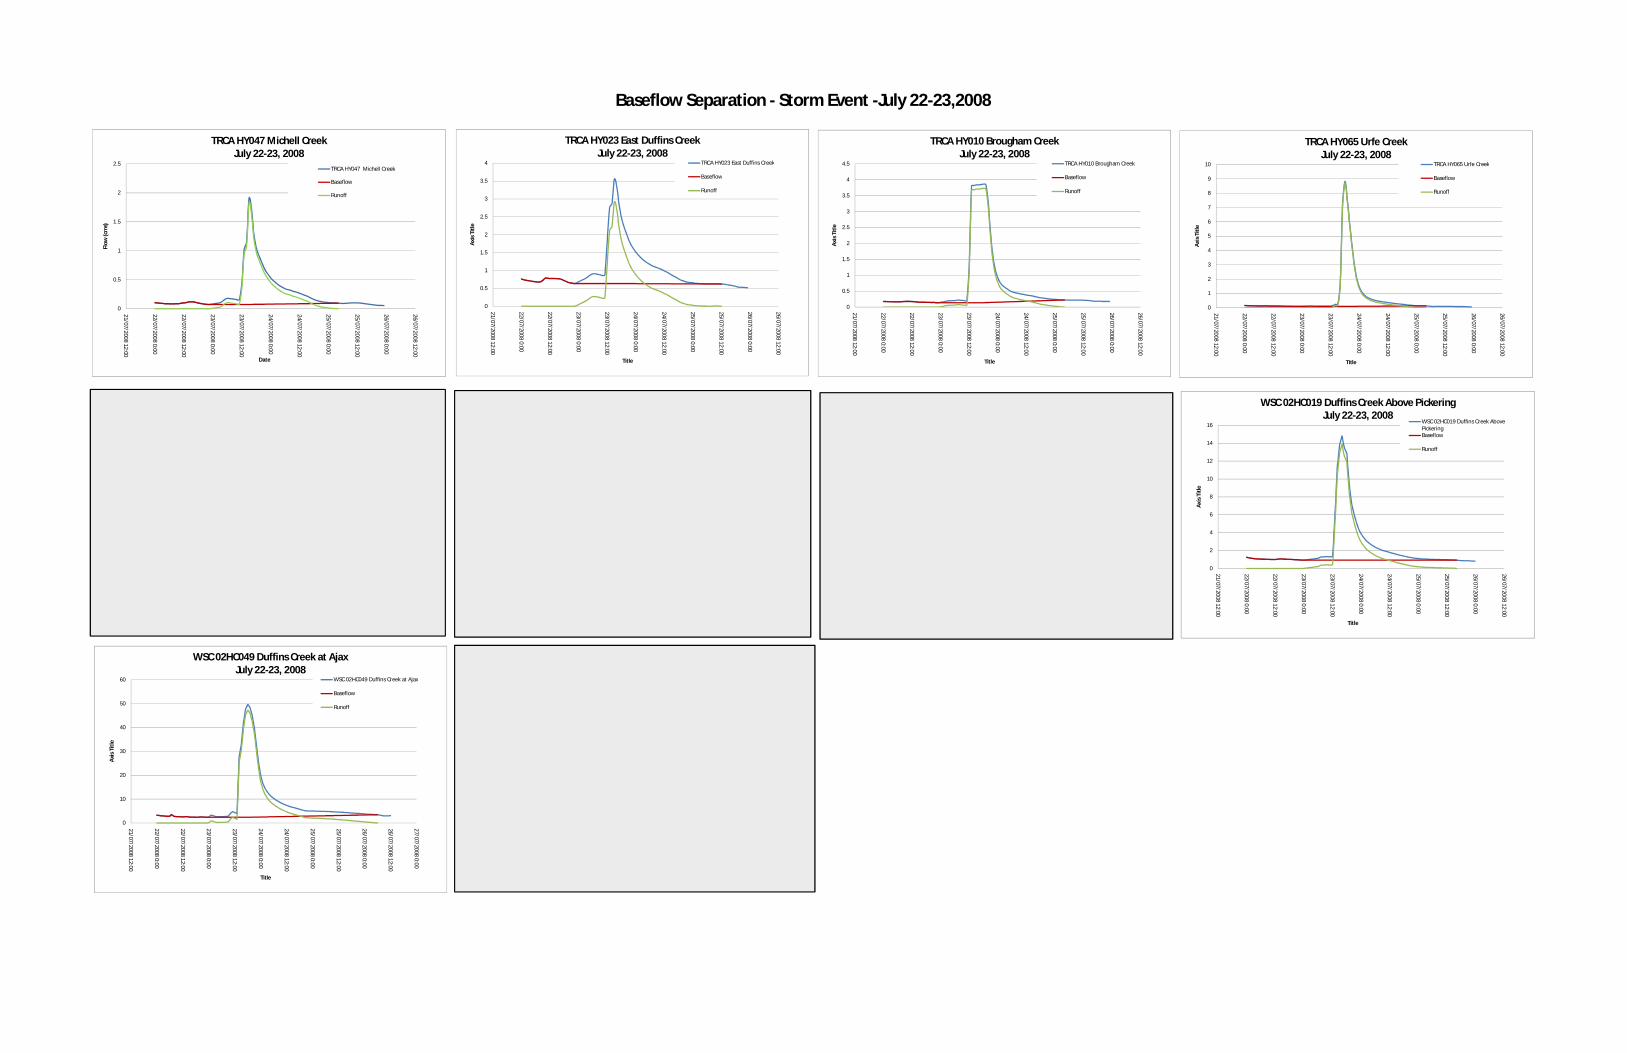


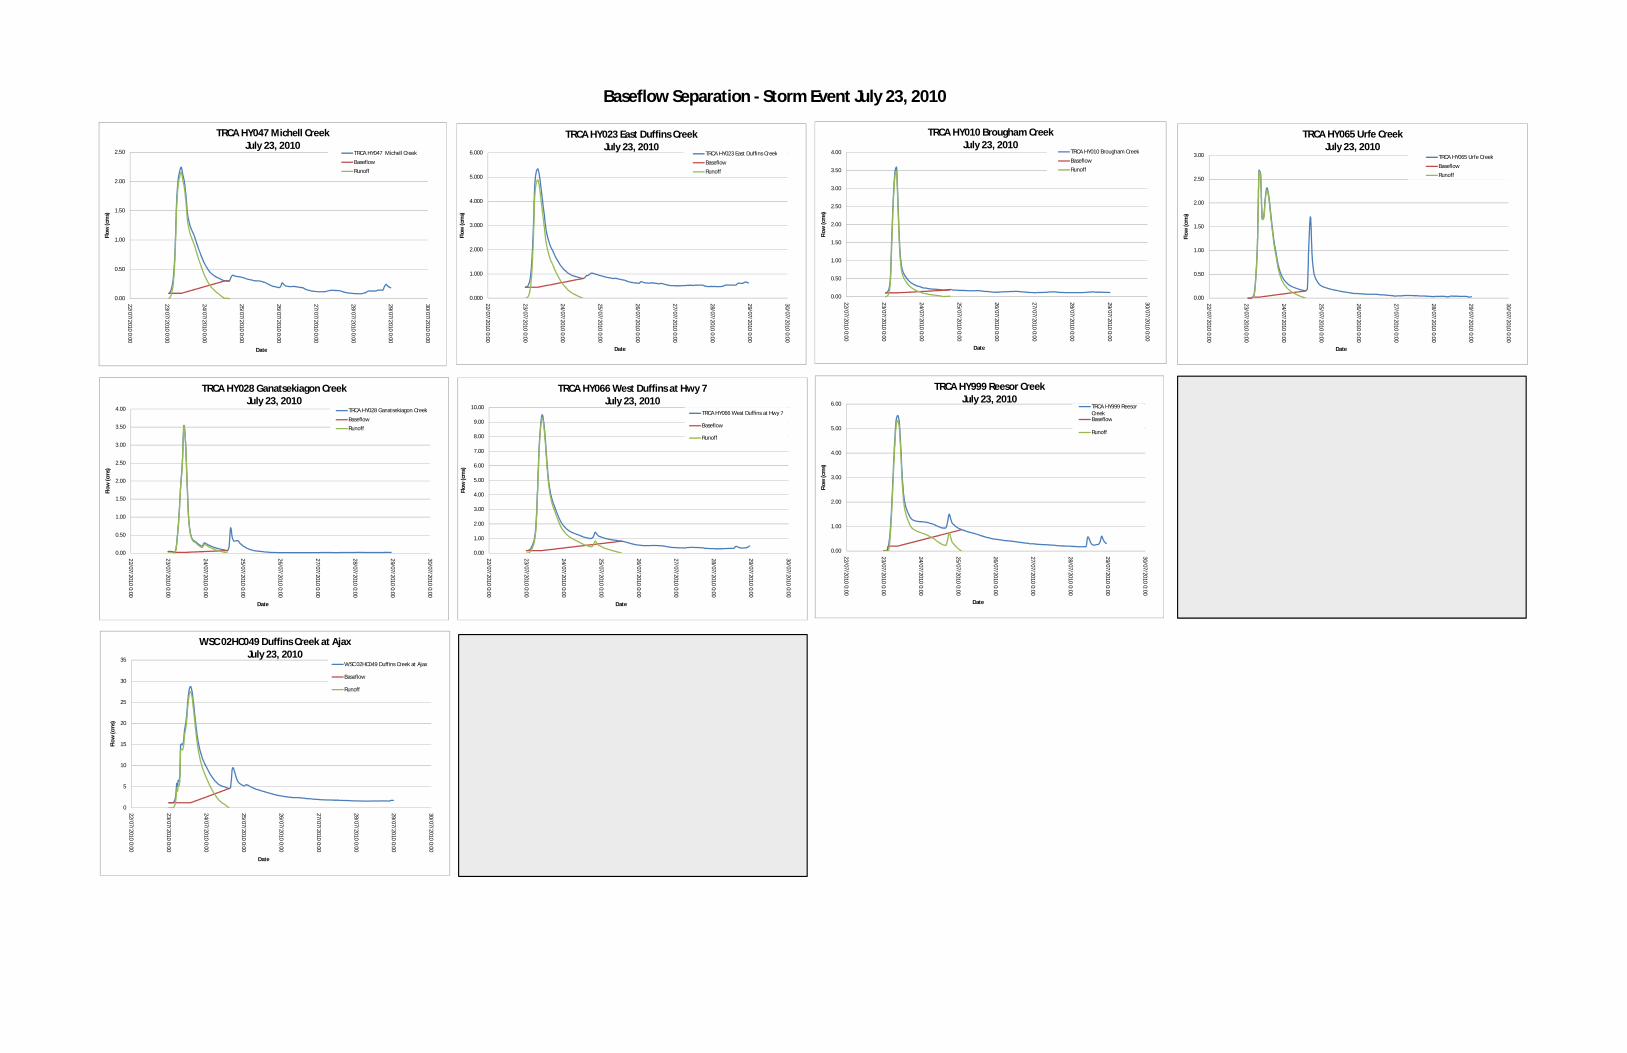

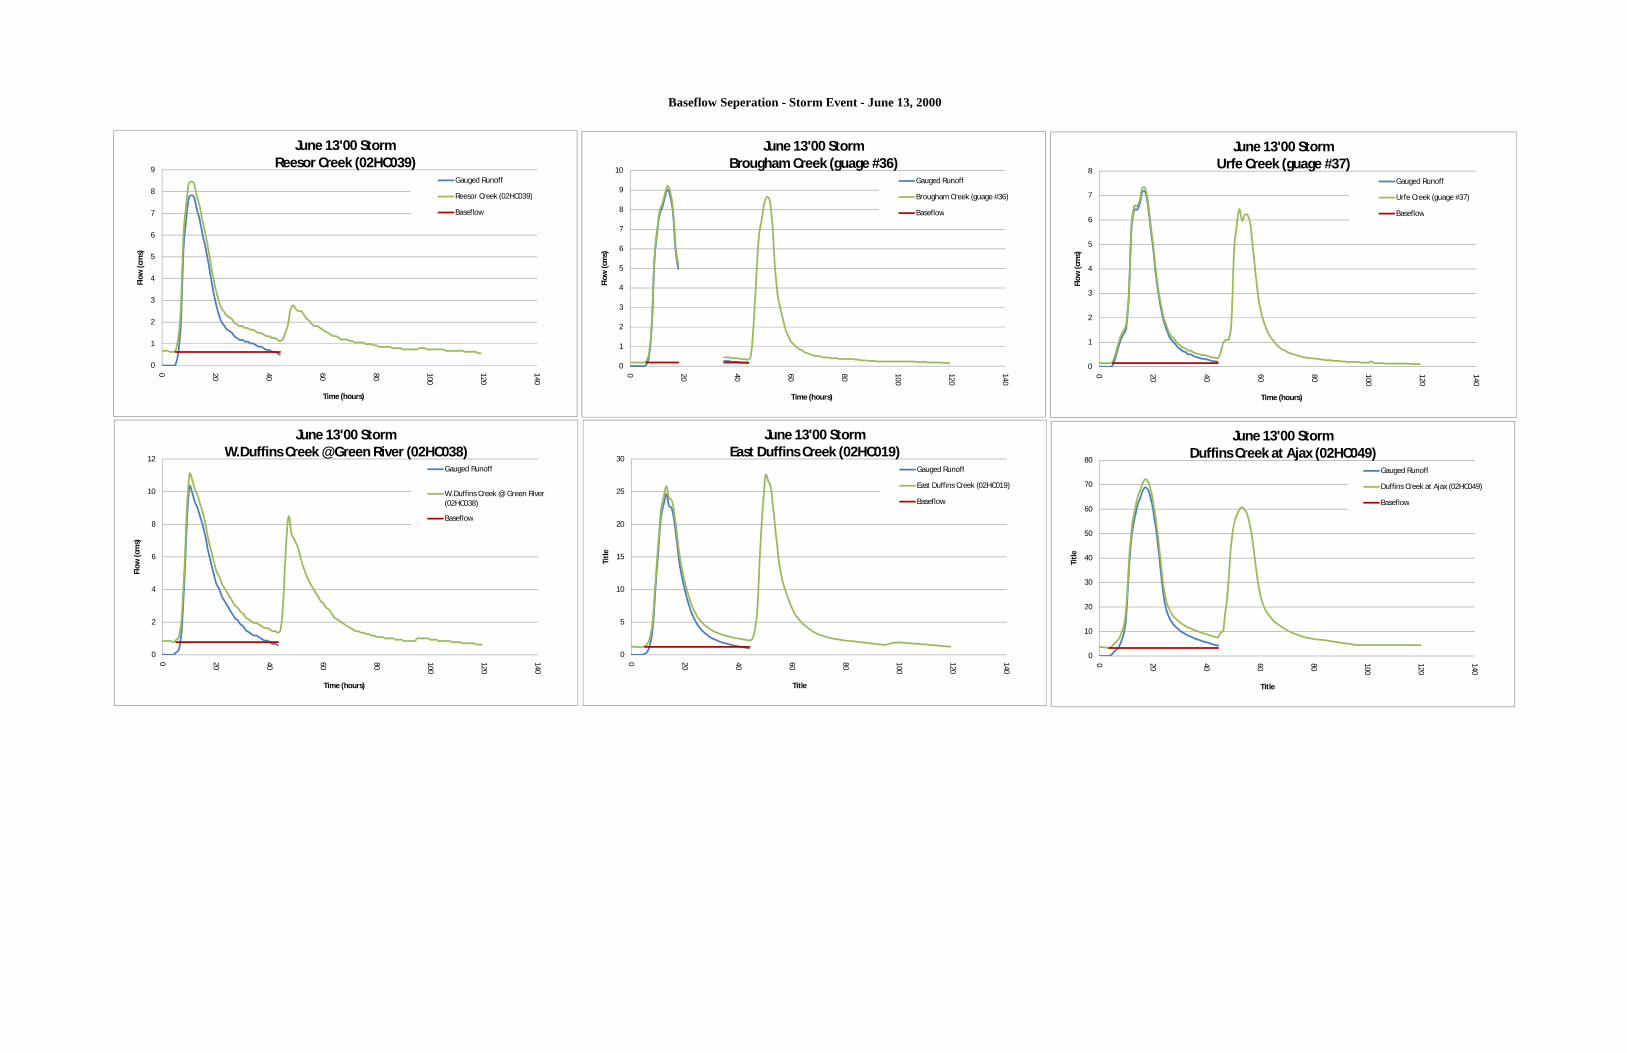


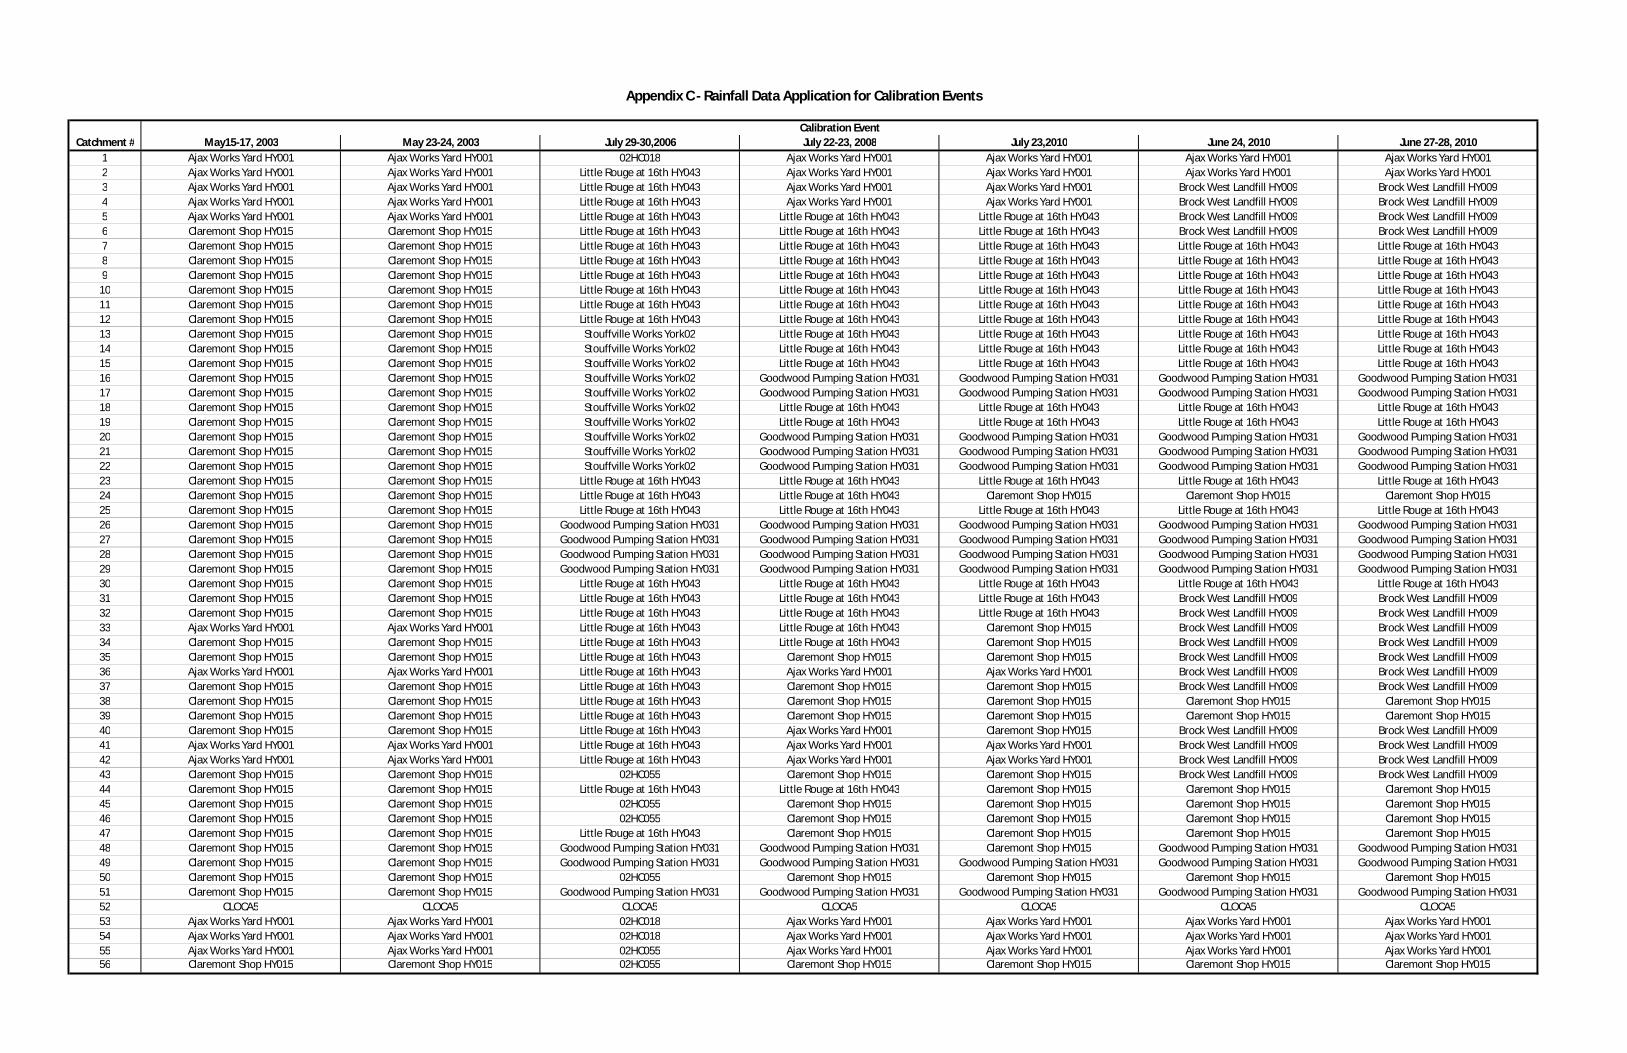
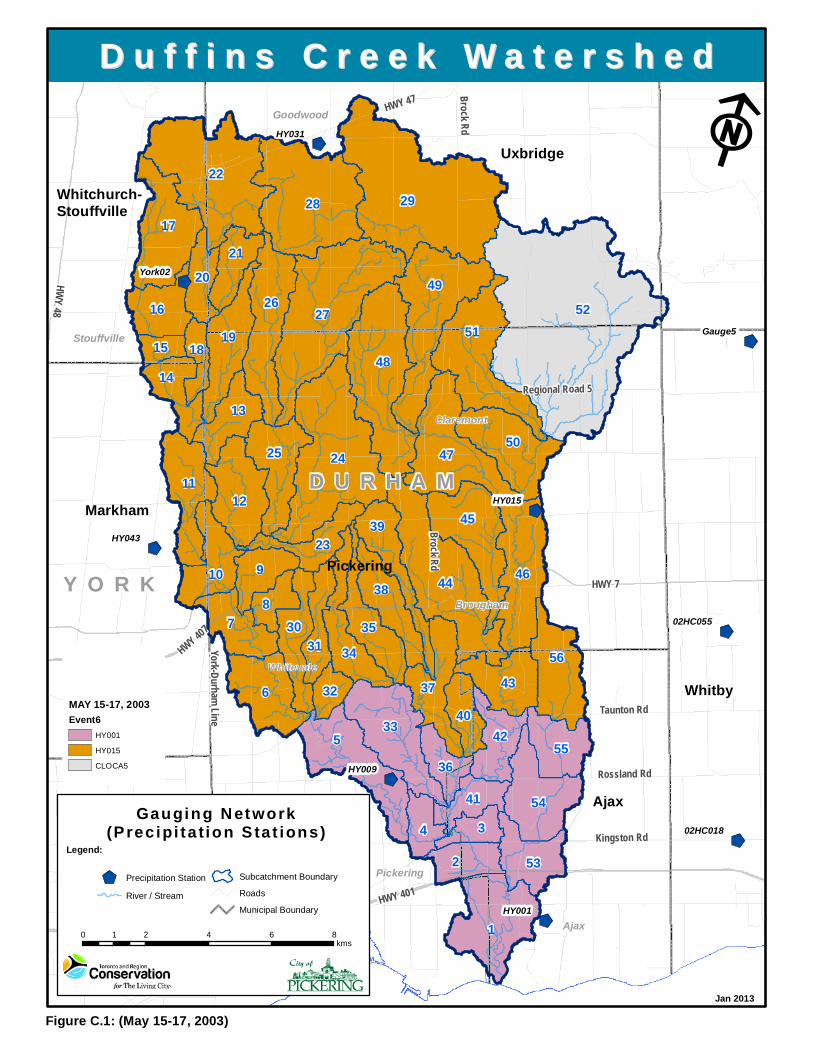


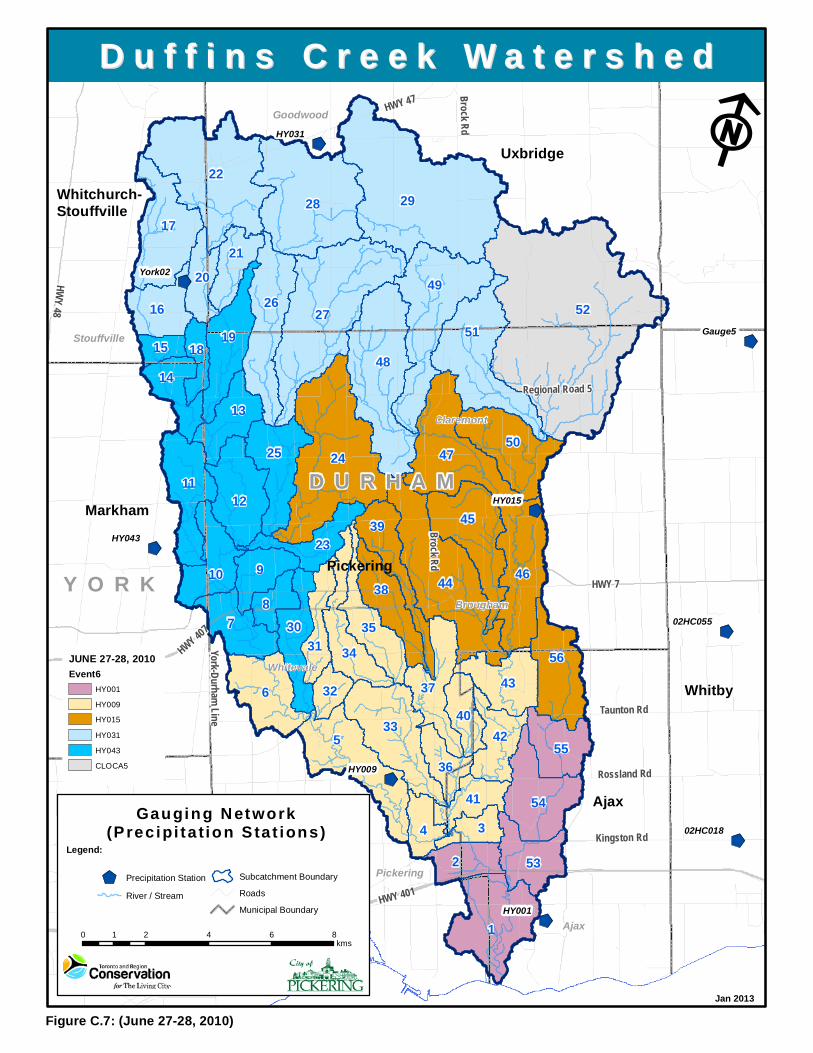
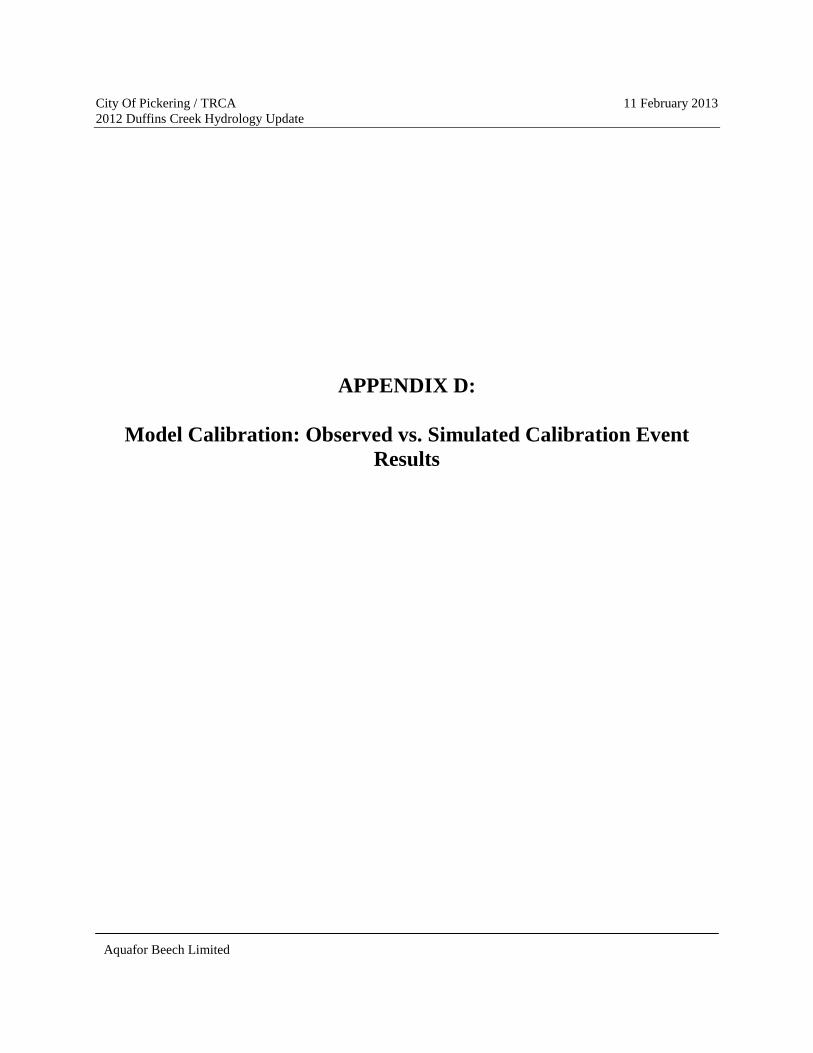

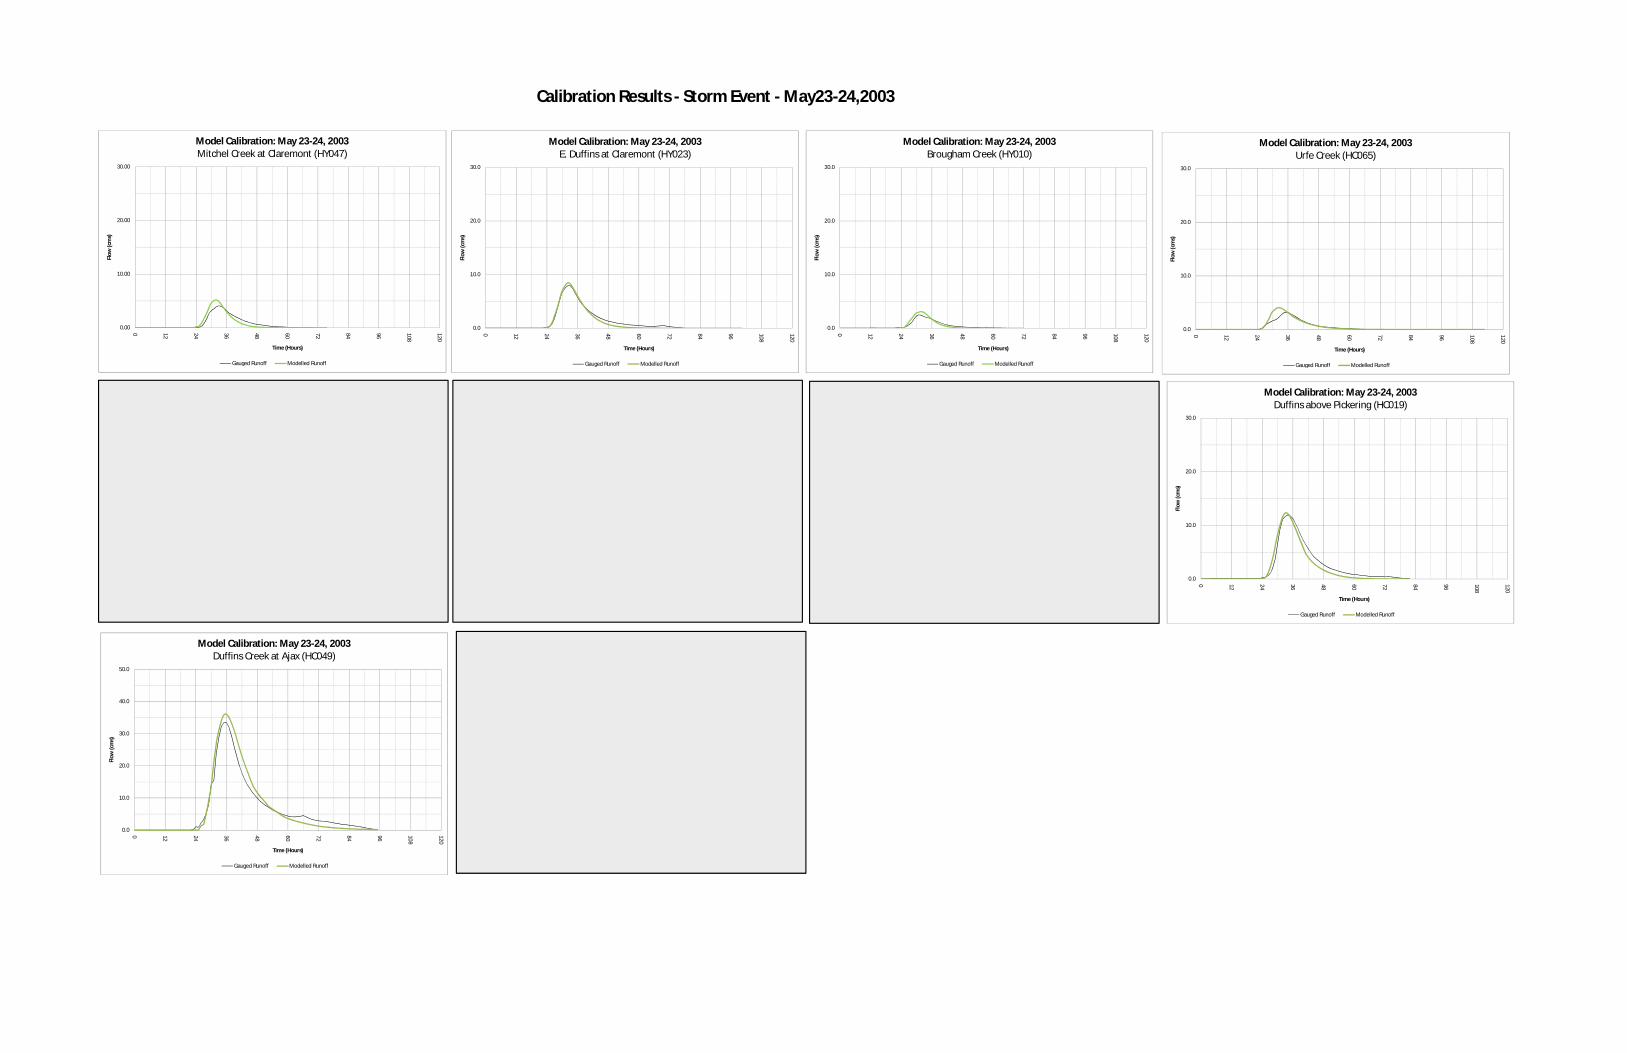

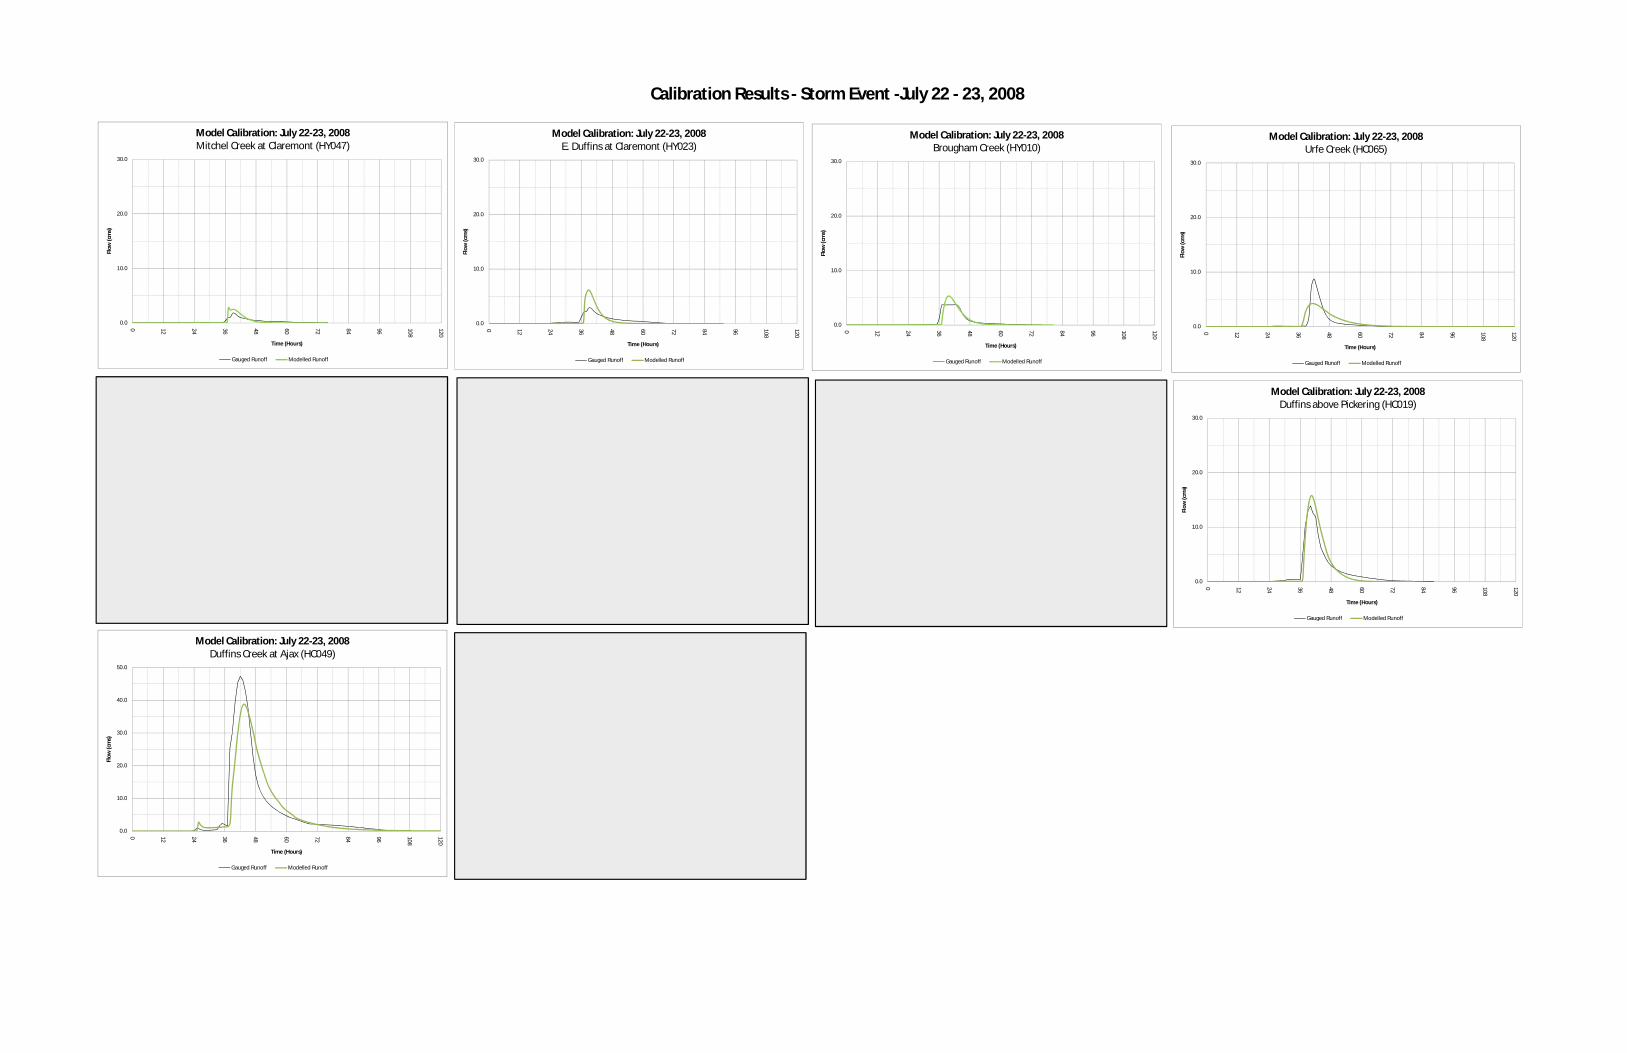
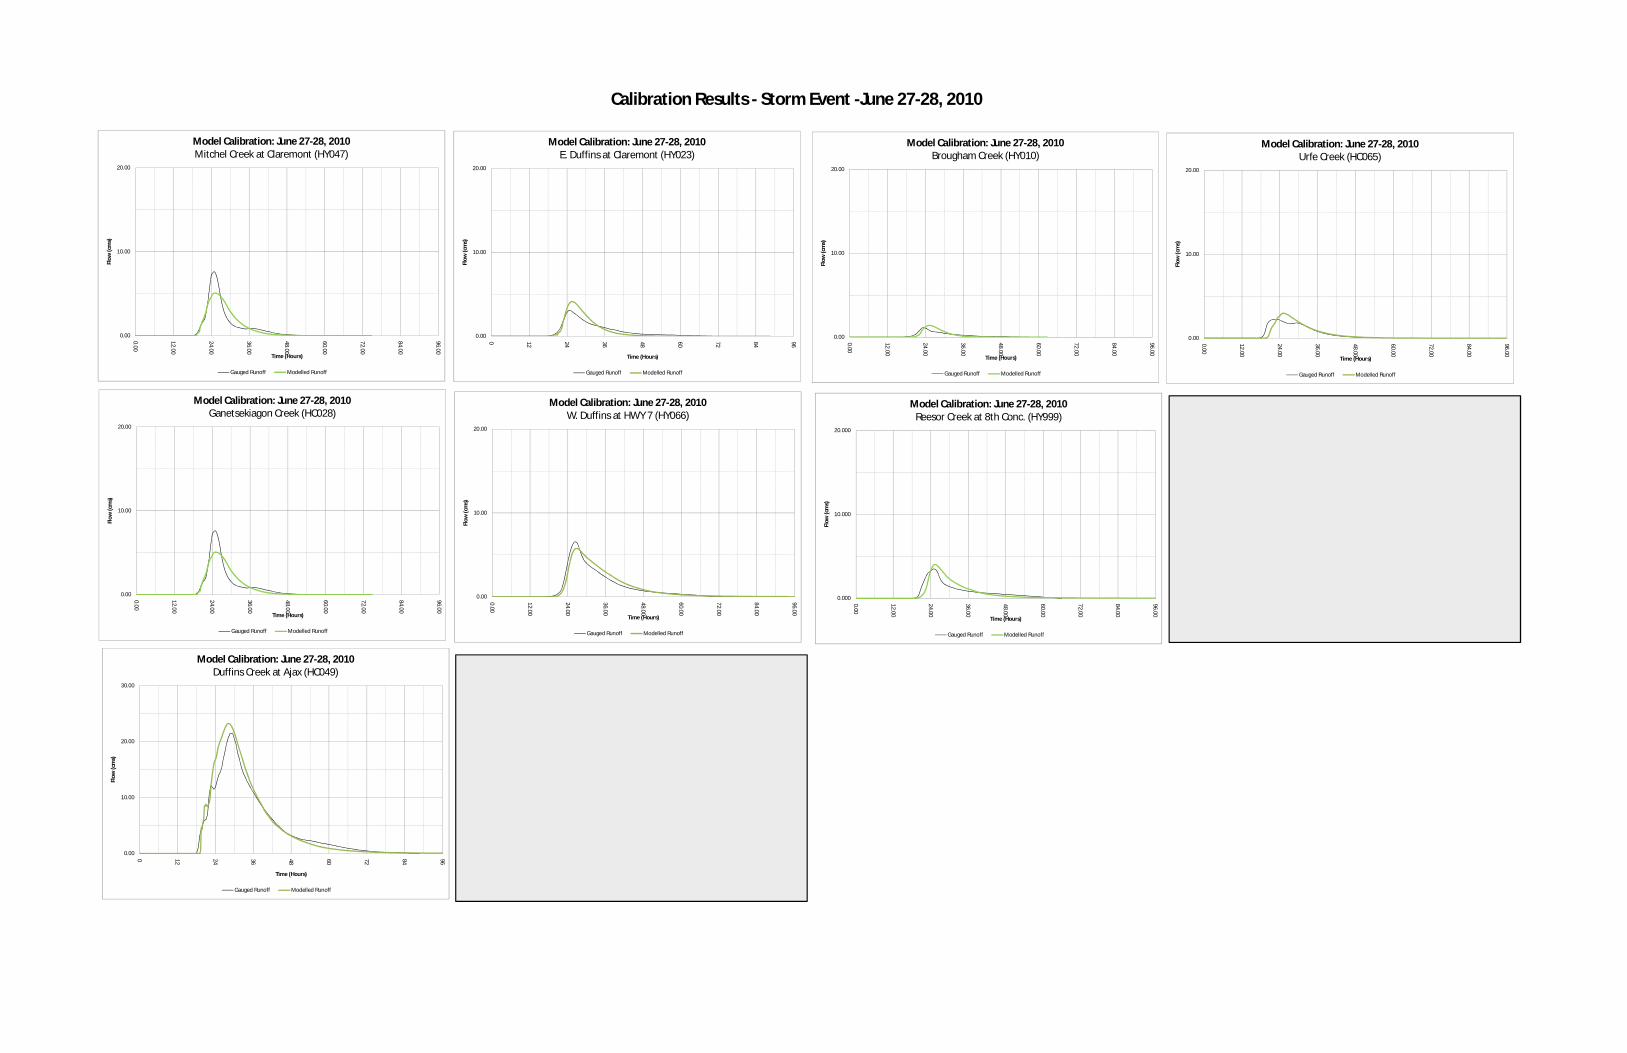


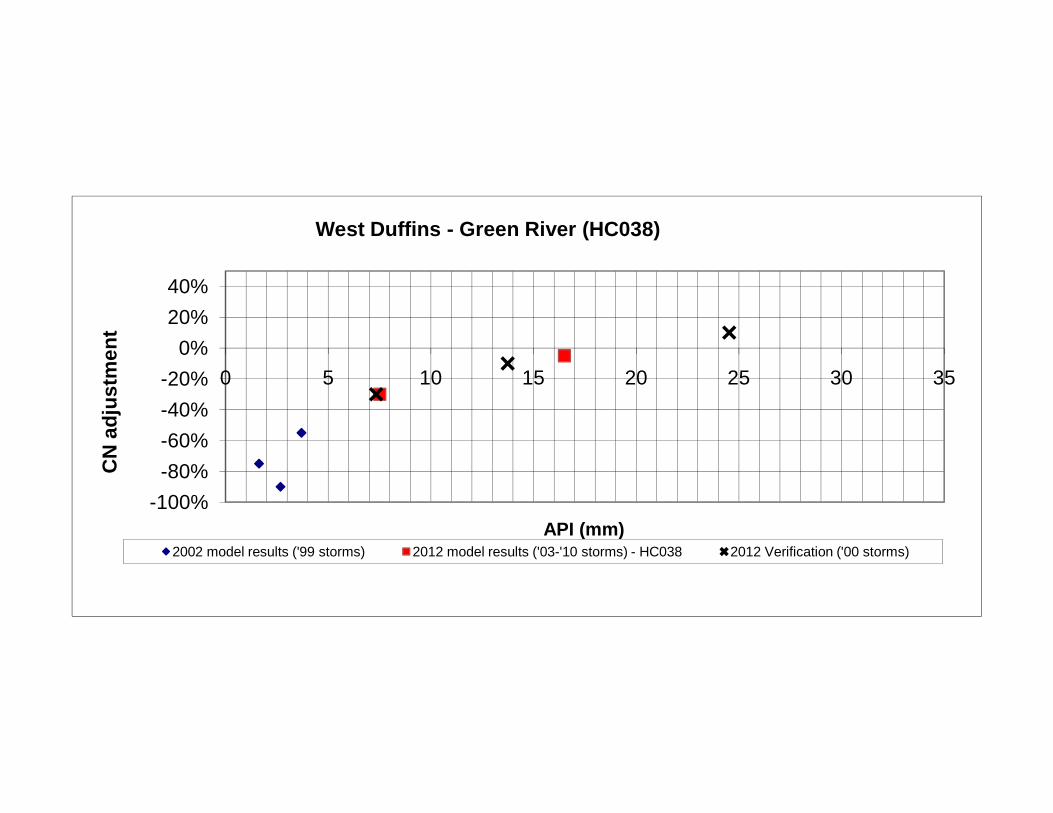
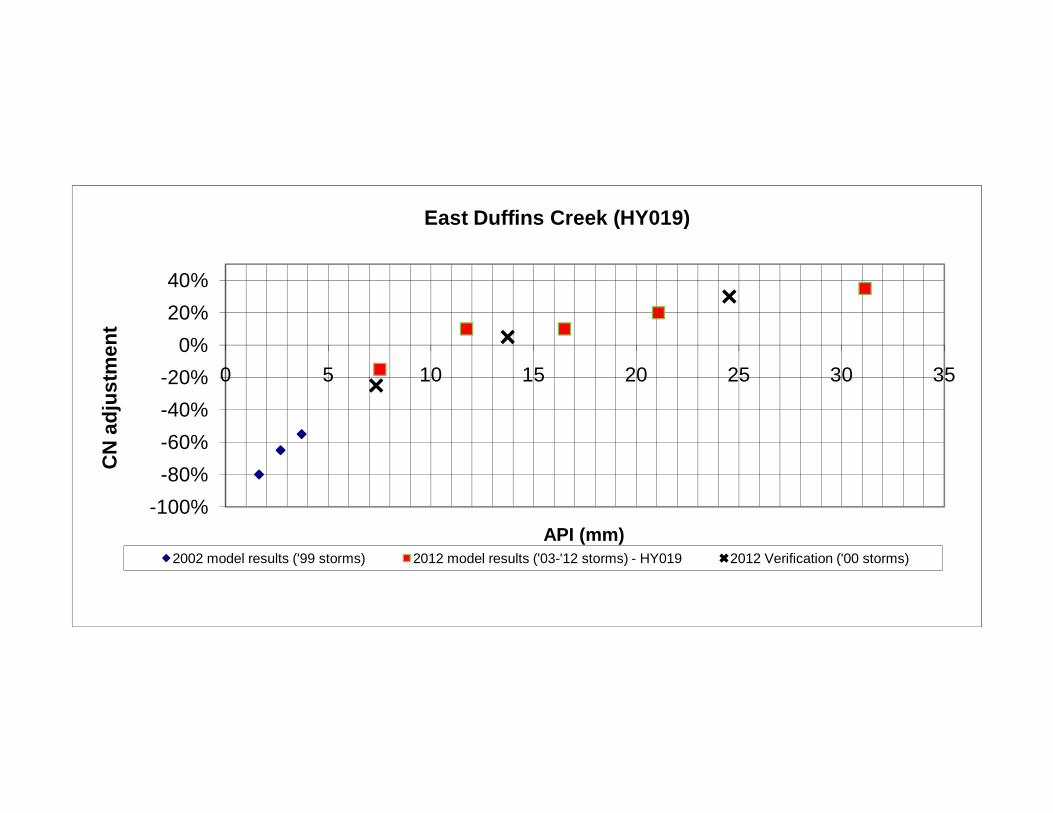
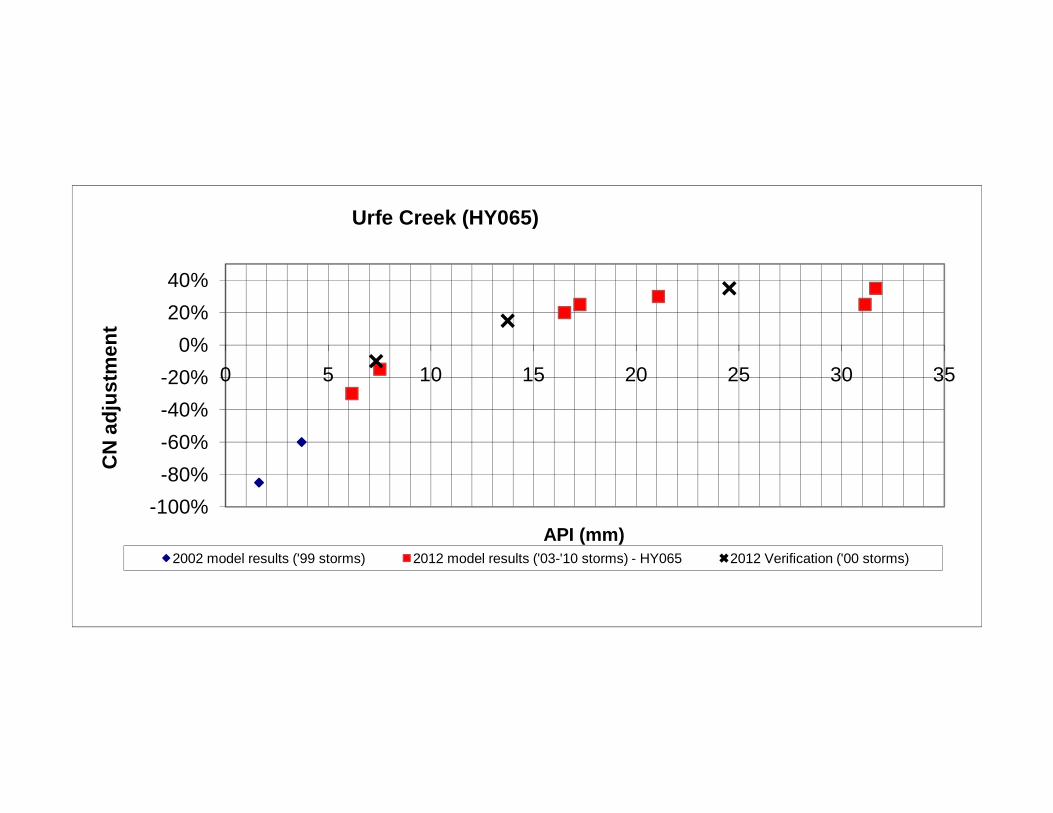

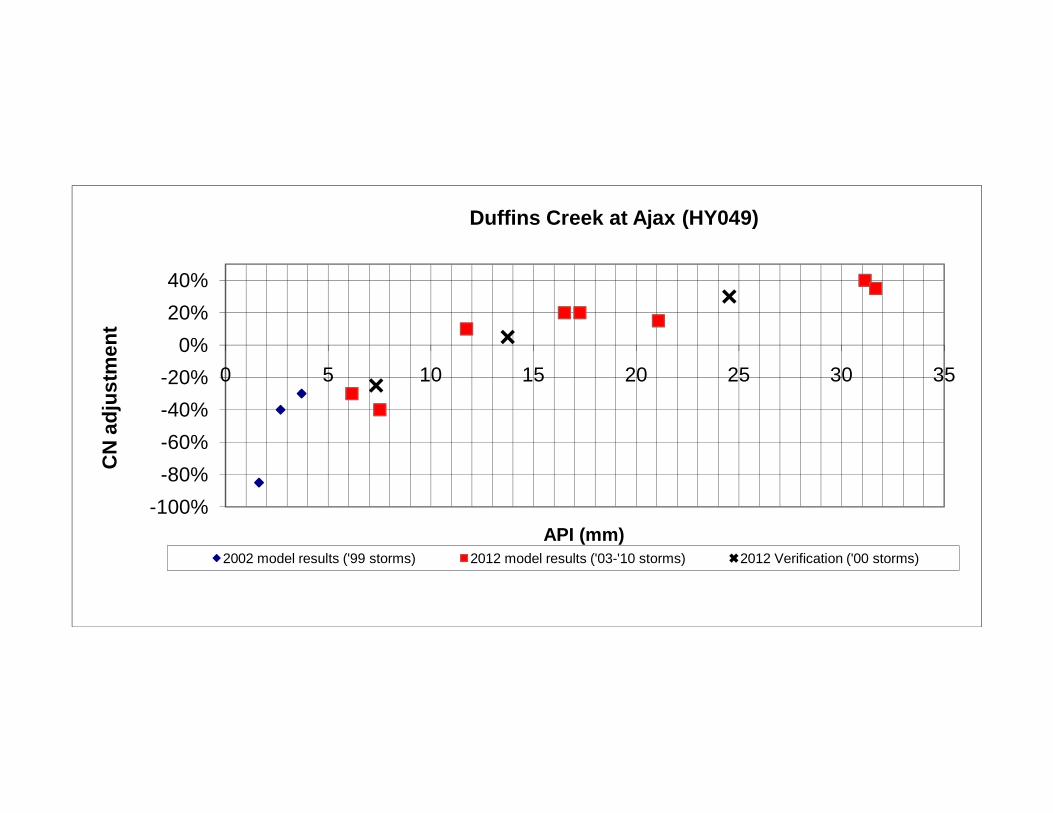

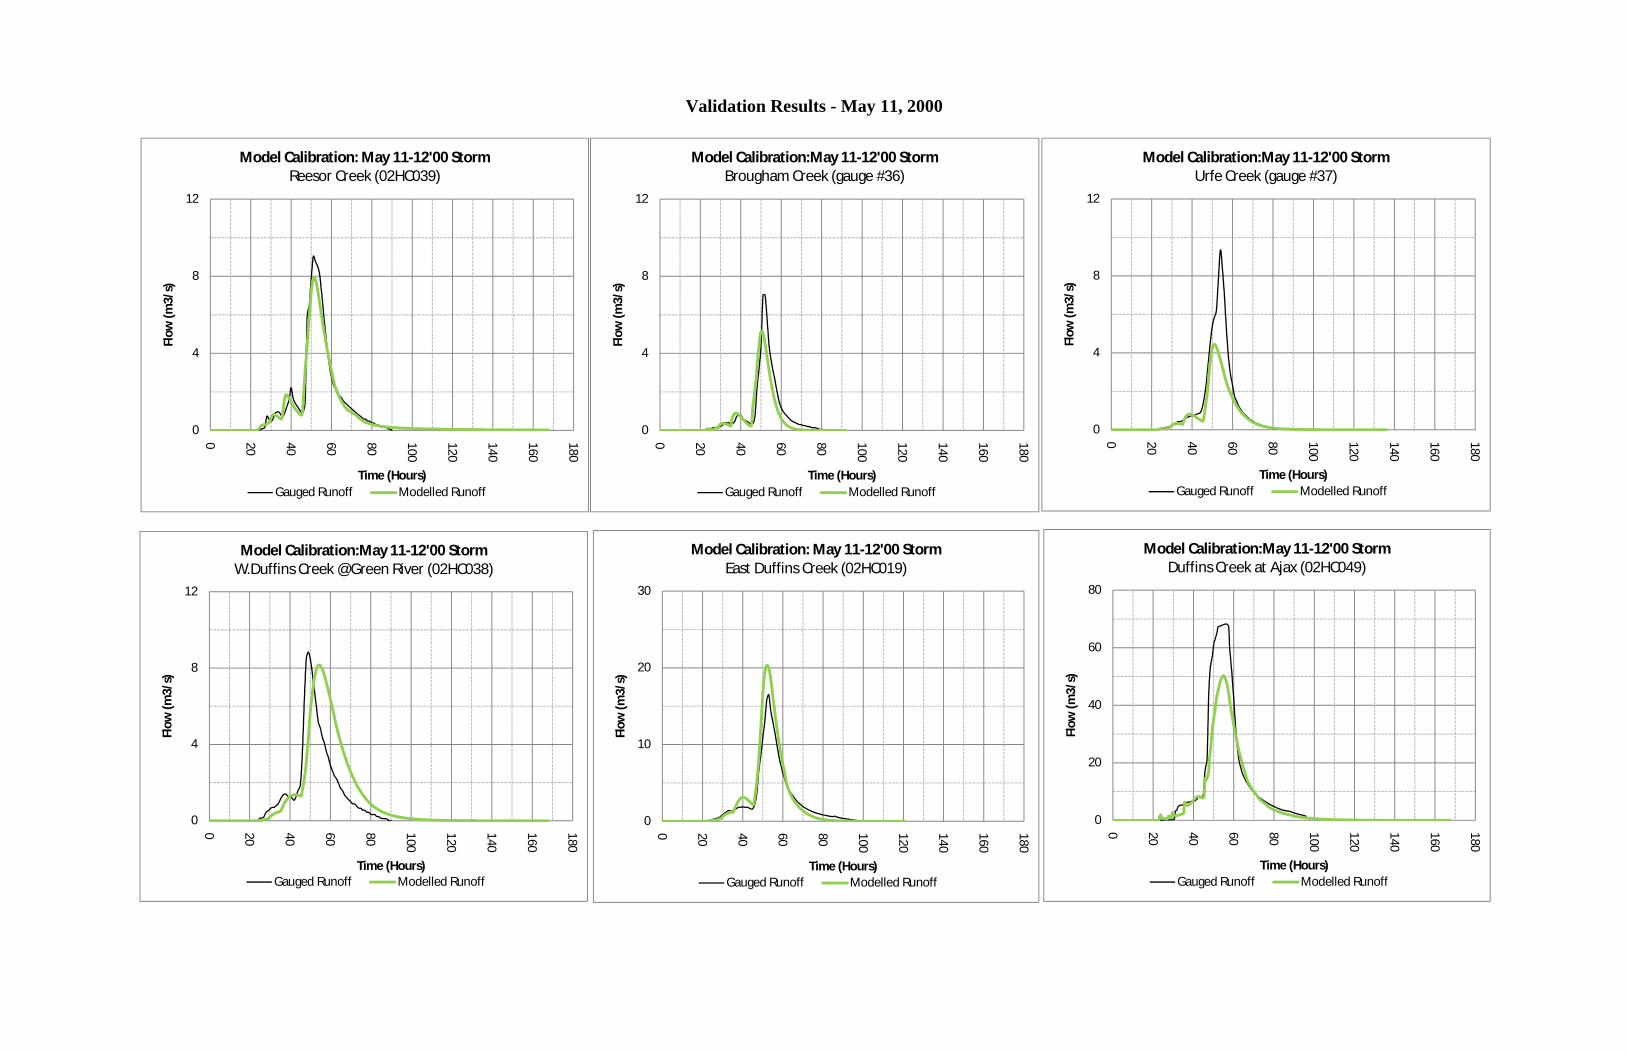
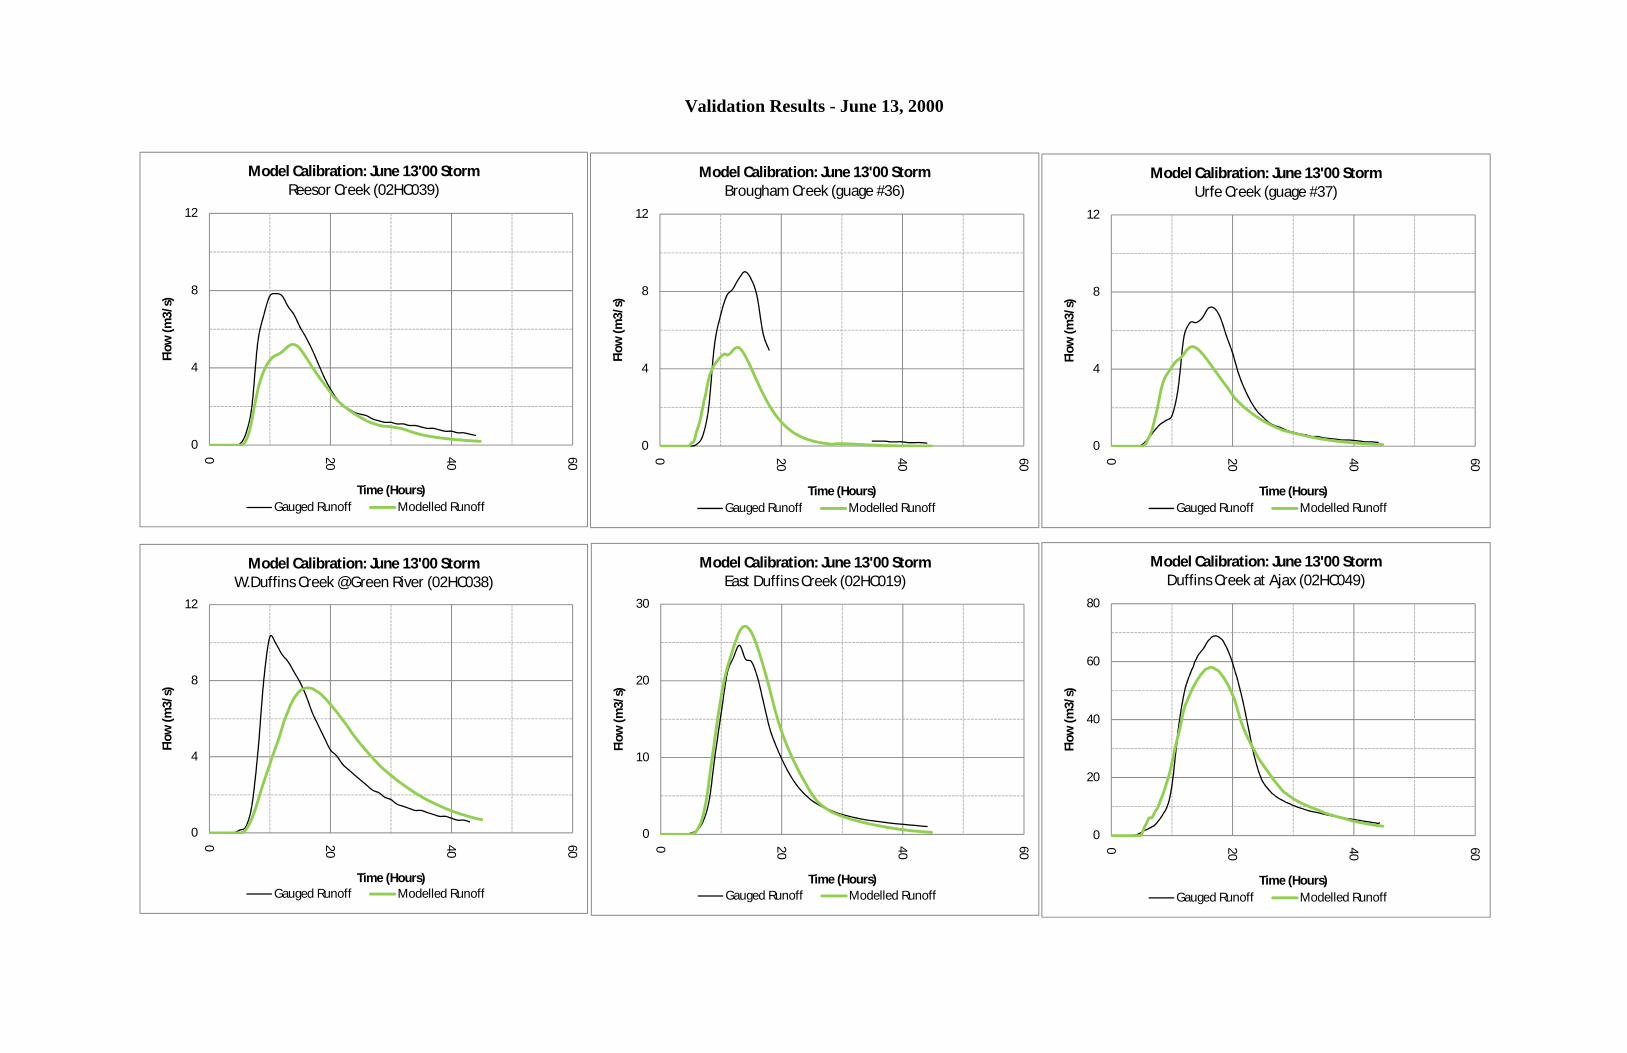
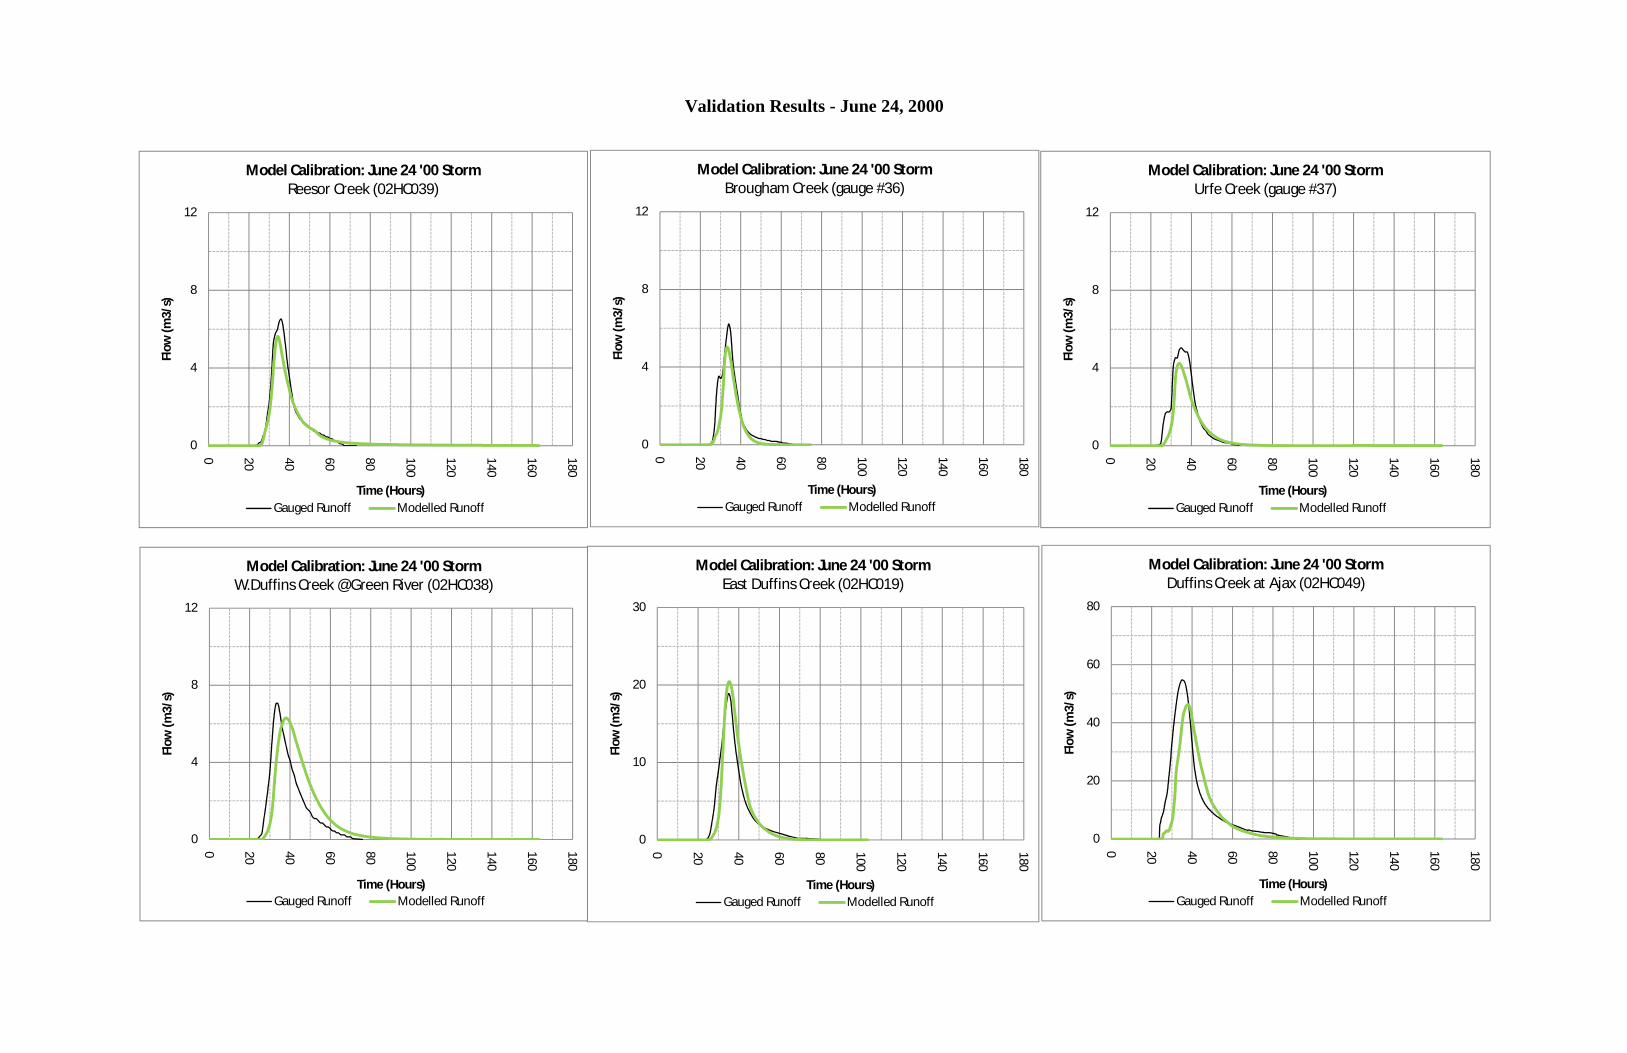

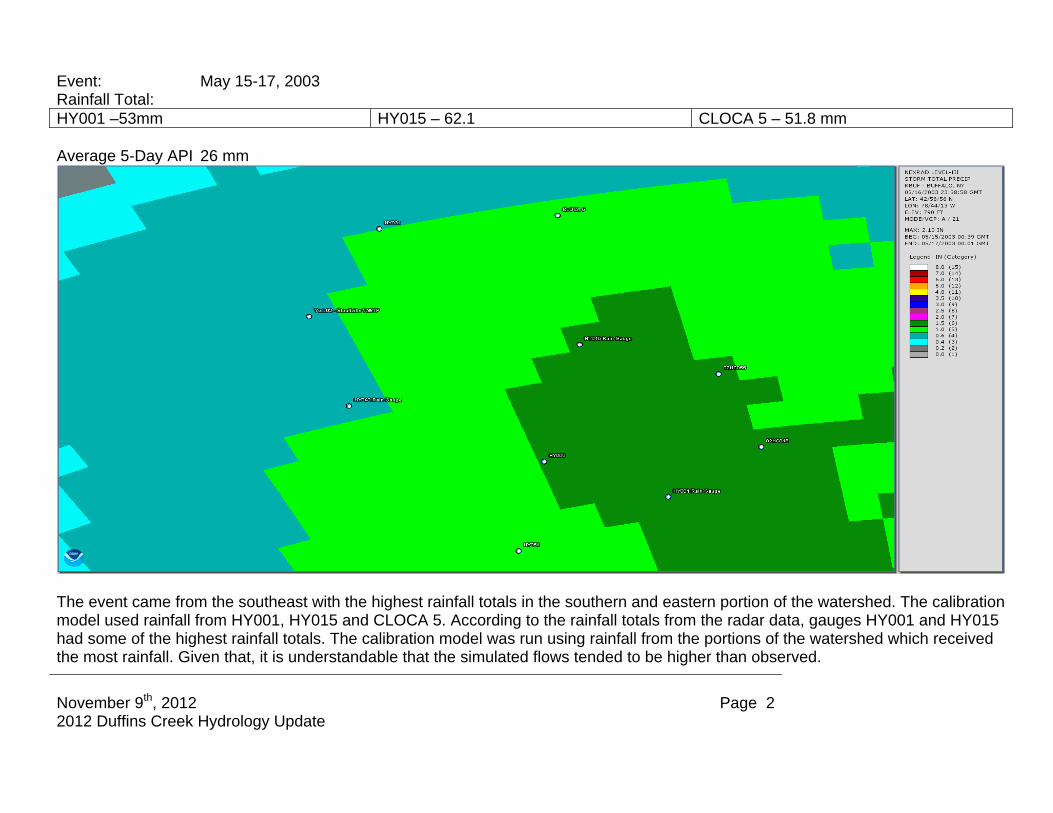


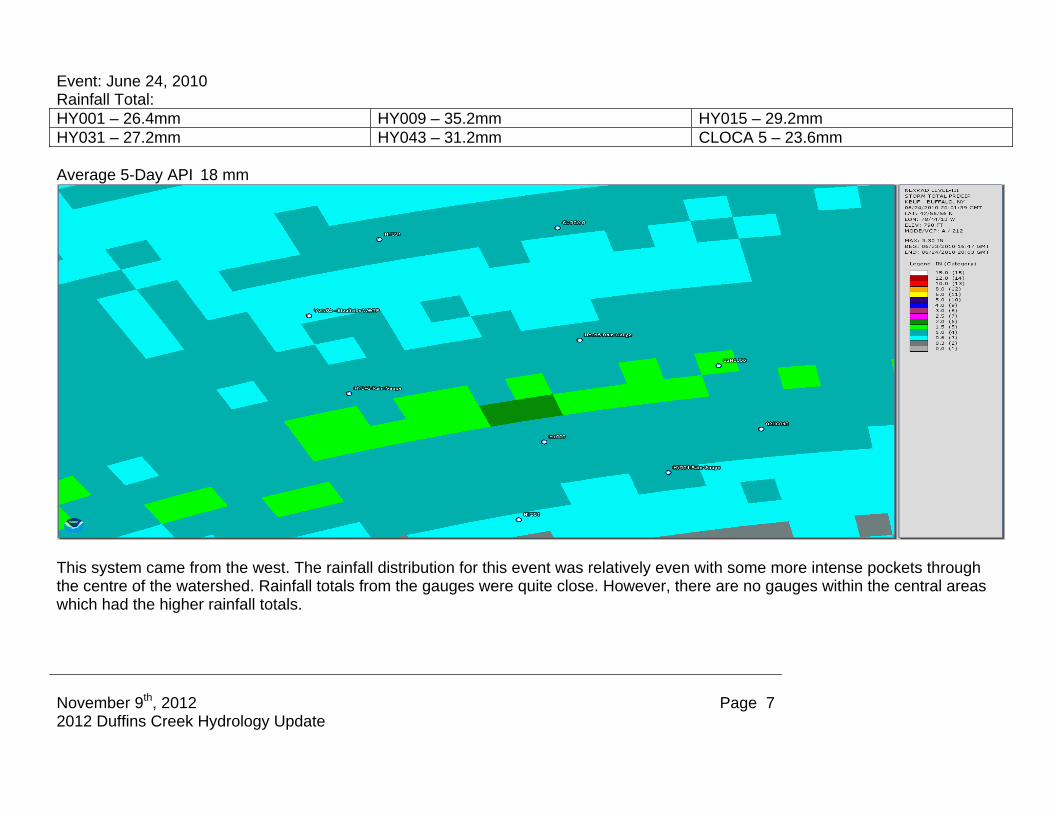


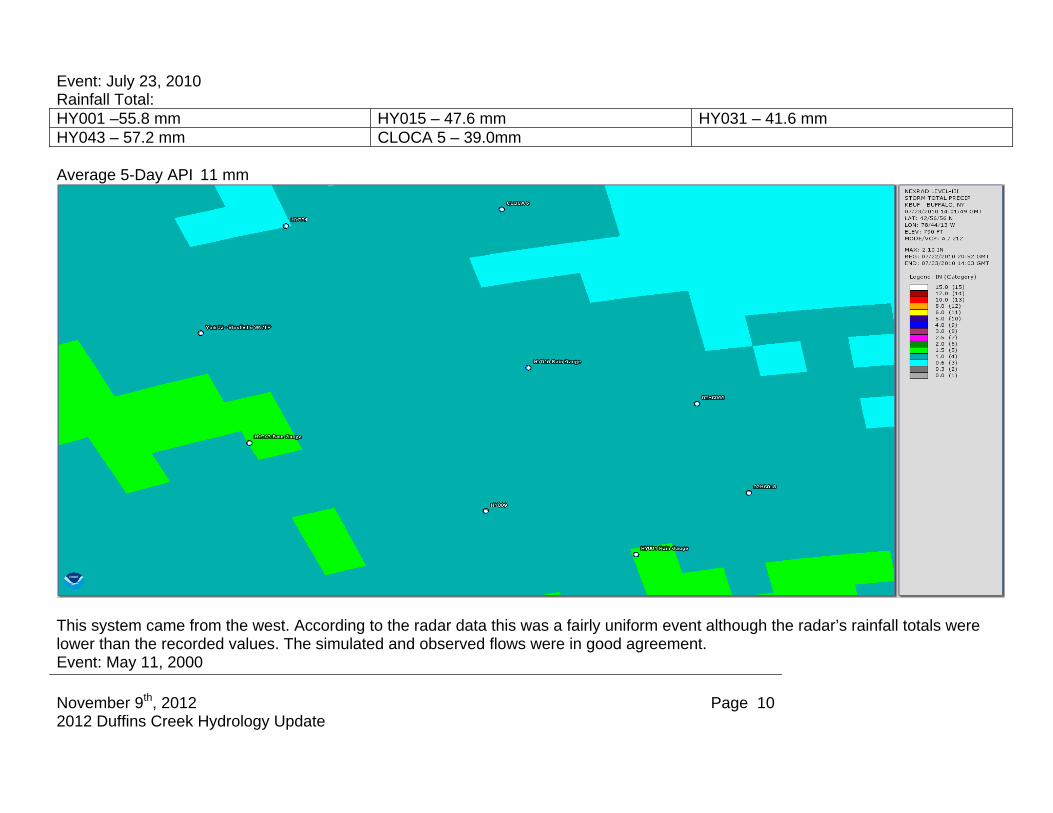
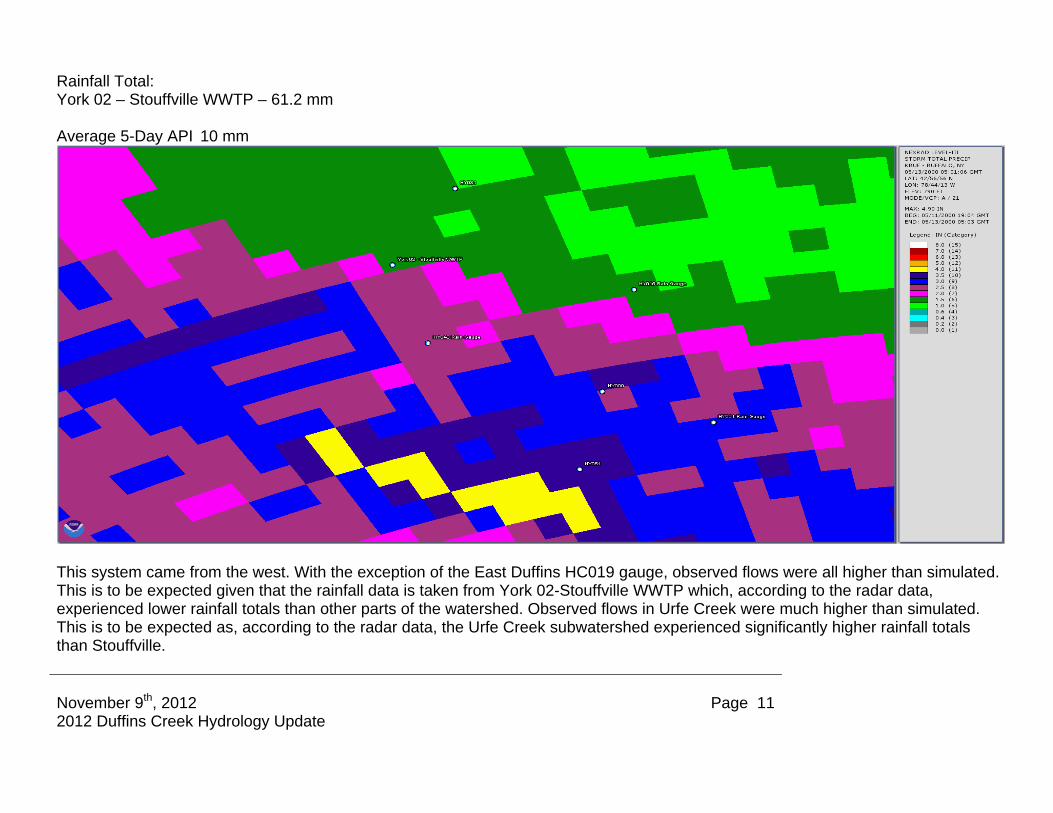


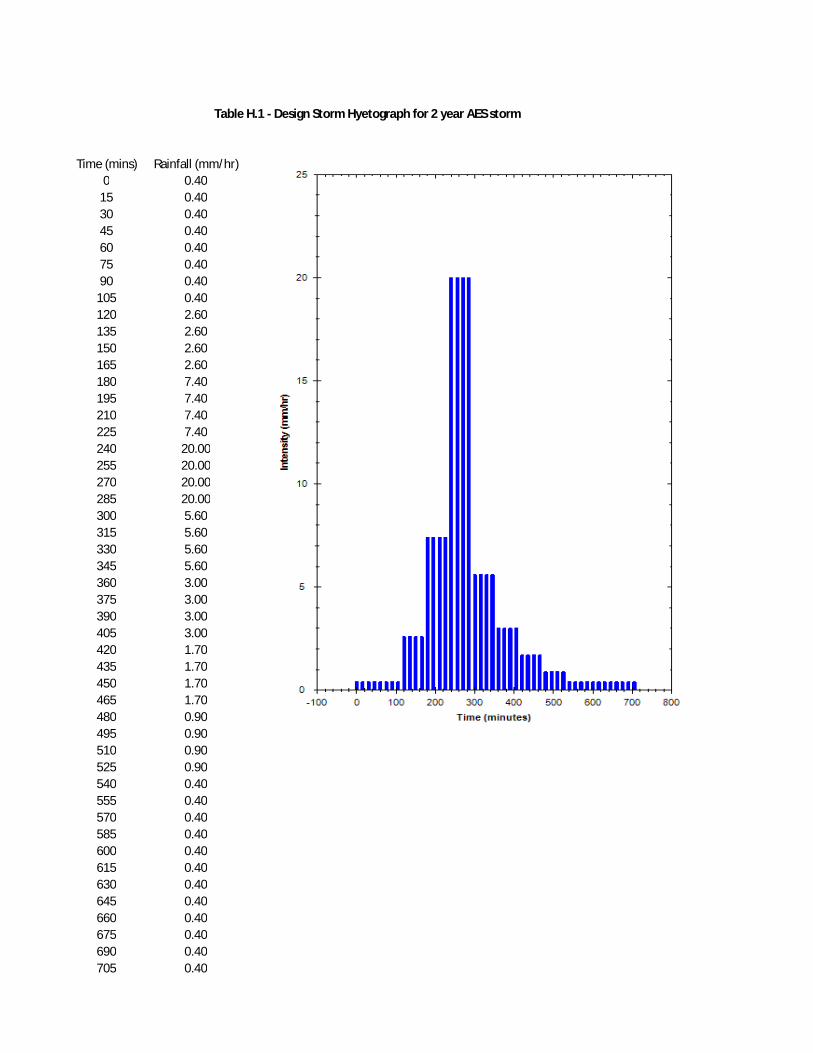
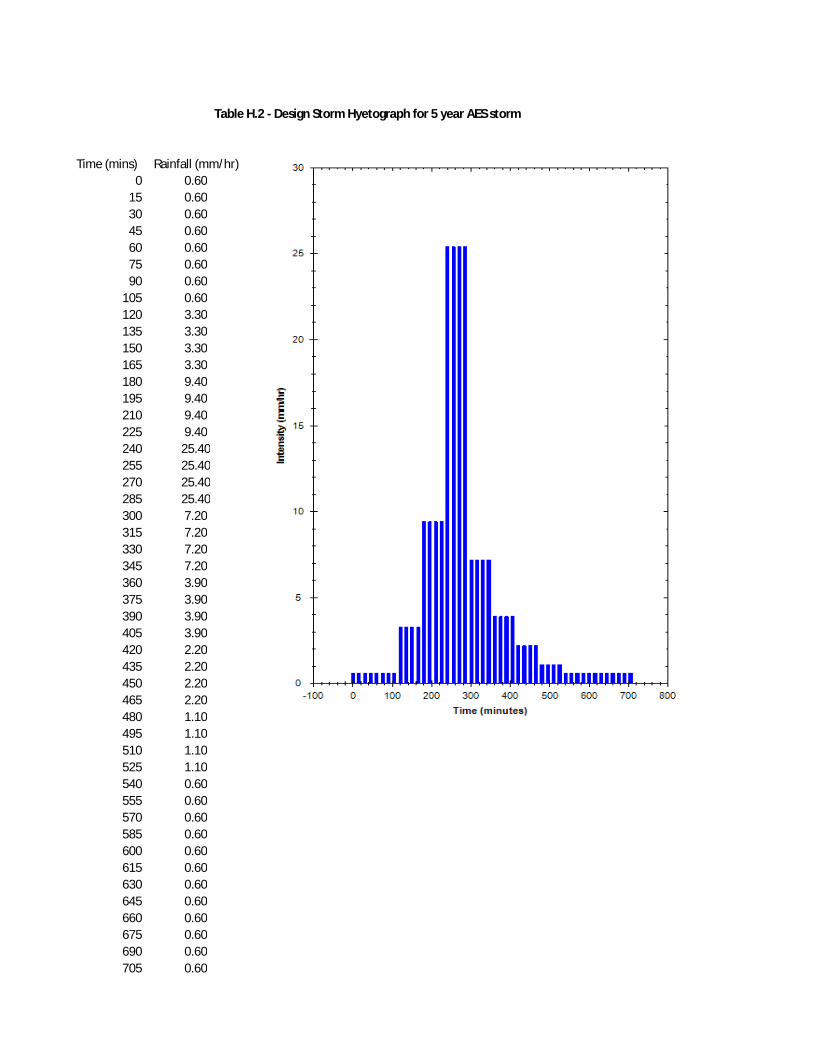
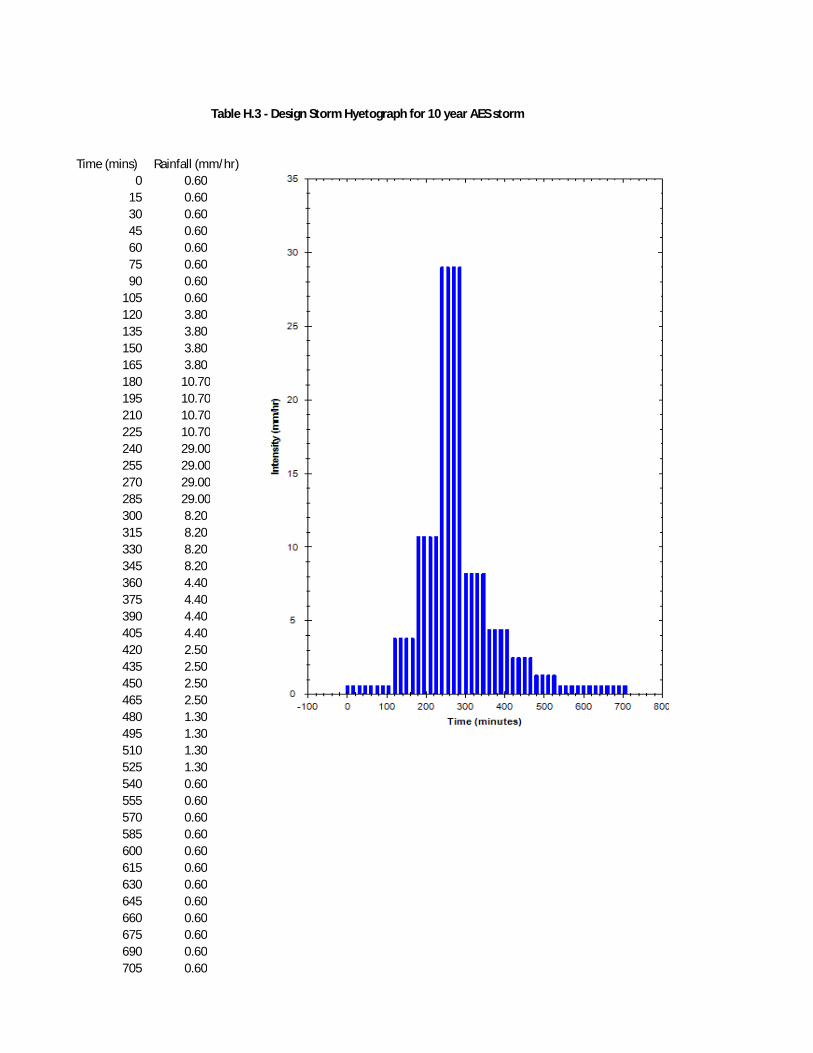
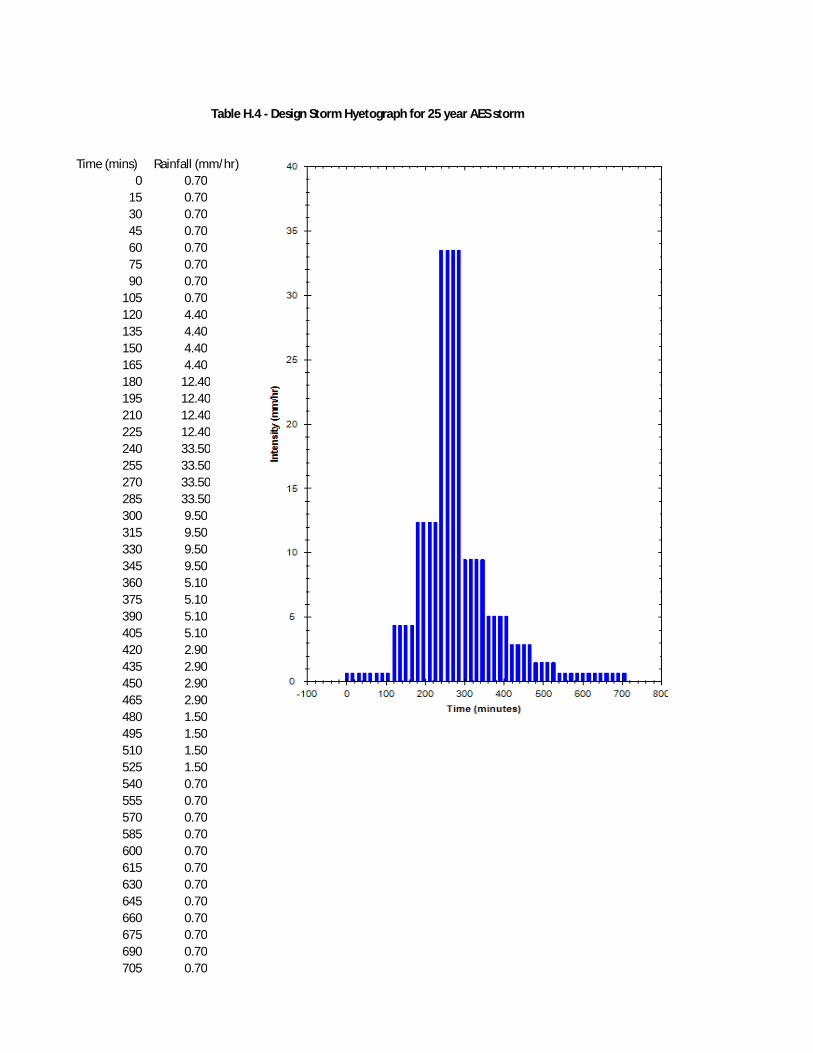


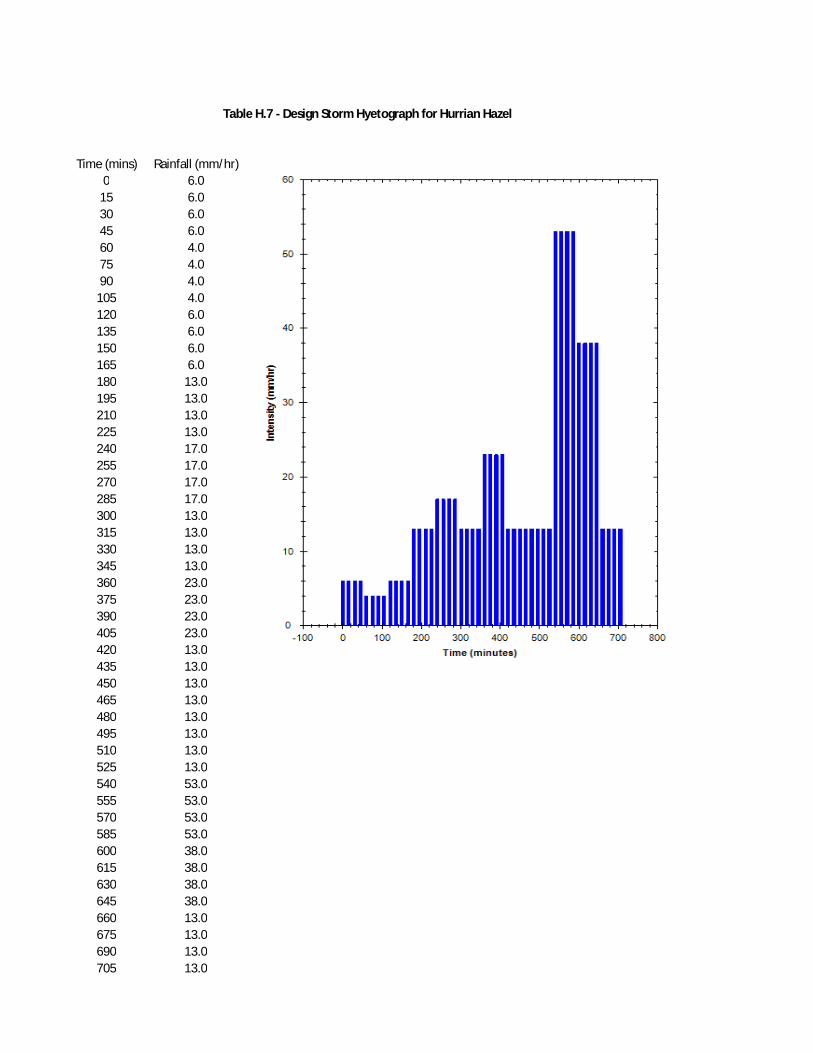


![[Hydrology] Groundwater Hydrology - David K. Todd (2005)](https://static.documents.pub/doc/80x56/548ce7beb47959e2288b45f9/hydrology-groundwater-hydrology-david-k-todd-2005.jpg)


