28
2012 Duff & Phelps YOUniversity Deal Challenge February 18, 2012 YOUniversity Deal Challenge

2012 Duff & PhelpsYOUniversity Deal Challenge
February 18, 2012
YOUniversity Deal Challenge

I. Executive Summary
II. Company Overview
III. Management Plan
IV.Additional Information
Table of Contents
IV.Additional Information
V. Deliverables
2

I. Executive Summary
C O N F I D E N T I A L

Executive Summary
Barkley Enterprises is a private consumer goods company based in the United States.
• Barkley manufactures and sells products throughout North and South America.
• The company operates two separate business lines:
o Snacks; and
o Personal Hygiene.
• Revenue in 2010 was approximately $882 million, and is forecast to be $925 million
in 2011. EBITDA in 2010 was approximately $140 million, and is forecast to be $152
million in 2011.
Barkley has been family-owned and operated since its founding. However, after careful
consideration, the current management team decided recently to put the company up for
sale. In the interest of maximizing proceeds, management is open to selling segments of
the business separately but has not yet determined an optimal deal structure.
4
II. Company Overview
C O N F I D E N T I A L

Barkley was founded by George Barkley in 1935 and the company has been family-
owned and operated ever since. The current CEO is the great-granddaughter of
the founder.
Headquartered in Atlanta, GA.
Overview of the Snacks business:
• Began by selling peanuts throughout the Southeastern U.S.
Business Description
• Began by selling peanuts throughout the Southeastern U.S.
• Expanded products over time to include pretzels, potato chips, corn chips, and
various other snack foods.
• Expanded into Latin America through the acquisition of a Puerto Rican
company in the 1990’s.
• Current footprint includes all of North America, Colombia, Peru, and Venezuela.
• The company owns over 20 different brands. The majority are well-recognized,
local brands.
6

Overview of the Personal Hygiene business:
• Started in the 1950’s by a cousin of George Barkley’s. Merged with Barkley
Enterprises several years later.
• Products include soaps, shampoos, and deodorants.
• The business was originally focused on branded products, but it has recently
expanded into private label manufacturing. Private label customers include
Business Description, continued
expanded into private label manufacturing. Private label customers include
primarily large retailers and hotel chains.
• Footprint only includes the United States and Canada.
• Branded products sold under three main brands. The price point for Barkley’s
products is near the low end of the range for products in their categories.
The company manufactures all of its products.
Workforce includes approximately 3,500 employees and a highly experienced senior
management team.
7

Historical Financial Information - Snacks
2007A – 2010A Highlights
Revenue growth over the past four
years driven by continued
expansion in Latin America
• New markets include Peru
Revenue (‘000s) & Margin Trends
16.0%
16.5%
17.0%
17.5%
$550,000
$600,000
$650,000
$700,000
EB
ITD
AM
arg
in
Rev
en
ue
• New markets include Peru
and Colombia
EBITDA margin reduction in recent
years caused by difficult economic
environment and higher marketing
costs associated with expansion
8
14.5%
15.0%
15.5%
16.0%
$400,000
$450,000
$500,000
$550,000
2007A 2008A 2009A 2010A
EB
ITD
AM
arg
in
Rev
en
ue
Revenue EBITDA Margin

Historical Financial Information - Snacks
Detailed Financial Results (thousands)
2007A 2008A 2009A 2010A
North America Revenue 477,900$ 498,928$ 507,908$ 536,859$
Latin America Revenue 92,850 106,499 113,847 130,014
Total Revenue 570,750$ 605,427$ 621,756$ 666,873$
Costs of Goods Sold 290,512$ 308,768$ 333,261$ 350,775$
Sales & Marketing 95,886 99,895 98,237 106,700
9
Sales & Marketing 95,886 99,895 98,237 106,700
General & Admin 86,183 92,630 94,507 98,697
Total Expenses 472,581$ 501,293$ 526,005$ 556,172$
EBITDA 98,169$ 104,133$ 95,750$ 110,701$
Depreciation 22,985 22,985 23,448 23,910
EBIT 75,184$ 81,148$ 72,303$ 86,791$
Capital Expenditures 30,000$ 23,000$ 23,500$ 24,000$

Historical Financial Information - Snacks
Common Size (% of Revenue)
2007A 2008A 2009A 2010A
North America Revenue 83.7% 82.4% 81.7% 80.5%
Latin America Revenue 16.3% 17.6% 18.3% 19.5%
Total Revenue 100.0% 100.0% 100.0% 100.0%
Costs of Goods Sold 50.9% 51.0% 53.6% 52.6%
Sales & Marketing 16.8% 16.5% 15.8% 16.0%
10
Sales & Marketing 16.8% 16.5% 15.8% 16.0%
General & Admin 15.1% 15.3% 15.2% 14.8%
Total Expenses 82.8% 82.8% 84.6% 83.4%
EBITDA 17.2% 17.2% 15.4% 16.6%
Depreciation 4.0% 3.8% 3.8% 3.6%
EBIT 13.2% 13.4% 11.6% 13.0%
Capital Expenditures 5.3% 3.8% 3.8% 3.6%

Historical Financial Information - Snacks
Growth Trends
2007A 2008A 2009A 2010A
North America Revenue N/A 4.4% 1.8% 5.7%
Latin America Revenue N/A 14.7% 6.9% 14.2%
Total Revenue N/A 6.1% 2.7% 7.3%
Costs of Goods Sold N/A 6.3% 7.9% 5.3%
Sales & Marketing N/A 4.2% -1.7% 8.6%
11
Sales & Marketing N/A 4.2% -1.7% 8.6%
General & Admin N/A 7.5% 2.0% 4.4%
Total Expenses N/A 6.1% 4.9% 5.7%
EBITDA N/A 6.1% -8.1% 15.6%
Depreciation N/A 0.0% 2.0% 2.0%
EBIT N/A 7.9% -10.9% 20.0%
Capital Expenditures N/A -23.3% 2.2% 2.1%

Historical Financial Information – PersonalHygiene
2007A – 2010A Highlights
Significant revenue growth in 2008
and 2009 driven in part by the
addition of two large private label
customers
Revenue (‘000s) & Margin Trends
15.0%
16.0%
17.0%
$180,000
$200,000
$220,000
$240,000
EB
ITD
AM
arg
in
Rev
en
ue
Overall EBITDA margin decreased
because private label is a lower
margin business and margins
continue to contract due to
increased pricing pressure from
large retailers
12
11.0%
12.0%
13.0%
14.0%
$100,000
$120,000
$140,000
$160,000
2007A 2008A 2009A 2010A
EB
ITD
AM
arg
in
Rev
en
ue
Revenue EBITDA Margin

Historical Financial Information – PersonalHygiene
Detailed Financial Results (thousands)
2007A 2008A 2009A 2010A
Branded Products 120,750$ 123,769$ 125,006$ 128,132$
Private Label 42,000 58,800 79,380 87,318
Total Revenue 162,750$ 182,569$ 204,386$ 215,450$
Costs of Goods Sold 87,502$ 101,373$ 116,622$ 123,880$
Sales & Marketing 20,722 22,678 24,504 24,471
13
General & Admin 28,197 31,373 36,238 37,931
Total Expenses 136,421$ 155,424$ 177,364$ 186,282$
EBITDA 26,330$ 27,145$ 27,023$ 29,168$
Depreciation 4,508 5,348 5,625 5,810
EBIT 21,822$ 21,797$ 21,398$ 23,358$
Capital Expenditures 8,000$ 8,000$ 5,000$ 5,200$
Other Metrics
Gross Margin - Branded 49.1% 48.5% 48.3% 48.5%
Gross Margin - Private 38.0% 36.0% 34.5% 33.7%
EBITDA - Branded 17.8% 17.5% 16.8% 17.4%
EBITDA - Private 11.5% 9.3% 7.6% 7.9%

Historical Financial Information – PersonalHygiene
Common Size (% of Revenue)
2007A 2008A 2009A 2010A
Branded Products 74.2% 67.8% 61.2% 59.5%
Private Label 25.8% 32.2% 38.8% 40.5%
Total Revenue 100.0% 100.0% 100.0% 100.0%
Costs of Goods Sold 53.8% 55.5% 57.1% 57.5%
Sales & Marketing 12.7% 12.4% 12.0% 11.4%
14
Sales & Marketing 12.7% 12.4% 12.0% 11.4%
General & Admin 17.3% 17.2% 17.7% 17.6%
Total Expenses 83.8% 85.1% 86.8% 86.5%
EBITDA 16.2% 14.9% 13.2% 13.5%
Depreciation 2.8% 2.9% 2.8% 2.7%
EBIT 13.4% 11.9% 10.5% 10.8%
Capital Expenditures 4.9% 4.4% 2.4% 2.4%
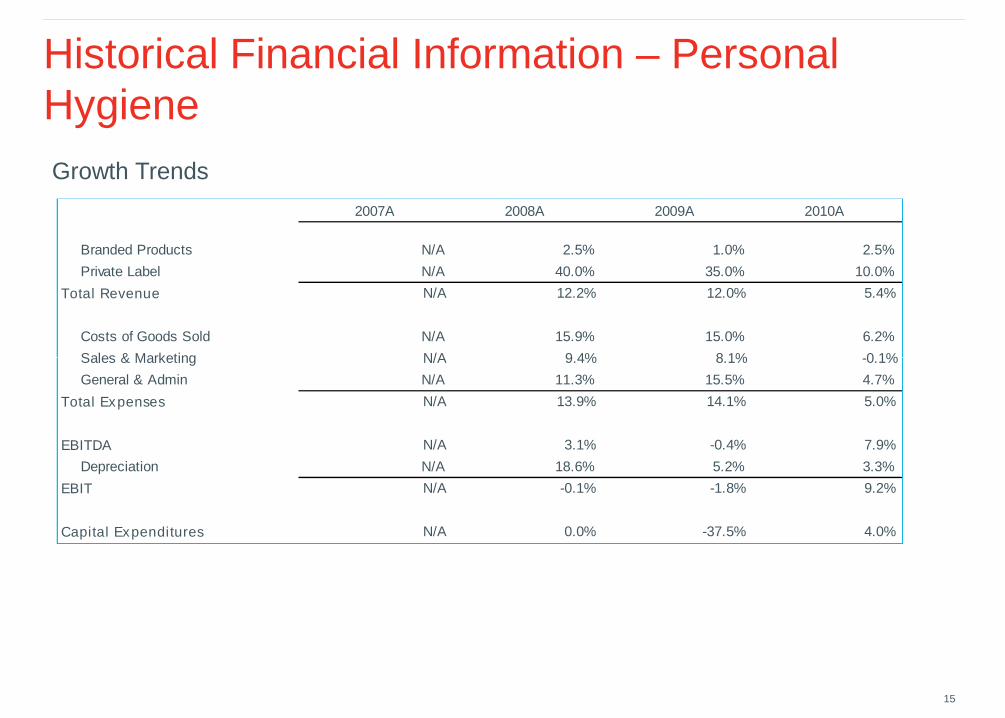
Historical Financial Information – PersonalHygiene
Growth Trends
2007A 2008A 2009A 2010A
Branded Products N/A 2.5% 1.0% 2.5%
Private Label N/A 40.0% 35.0% 10.0%
Total Revenue N/A 12.2% 12.0% 5.4%
Costs of Goods Sold N/A 15.9% 15.0% 6.2%
Sales & Marketing N/A 9.4% 8.1% -0.1%
15
Sales & Marketing N/A 9.4% 8.1% -0.1%
General & Admin N/A 11.3% 15.5% 4.7%
Total Expenses N/A 13.9% 14.1% 5.0%
EBITDA N/A 3.1% -0.4% 7.9%
Depreciation N/A 18.6% 5.2% 3.3%
EBIT N/A -0.1% -1.8% 9.2%
Capital Expenditures N/A 0.0% -37.5% 4.0%

Historical Financial Information – OverallBalance Sheet
September 30, 2011
30-Sep-2011 30-Sep-2011
Cash & Cash Equivalents 152,549$ Accounts Payable 120,438$
Accounts Receivable 75,920 Accrued Expenses 34,975
Inventories 122,452 Current Portion of Debt 24,555
Deferred Taxes 8,943 Income Taxes Payable 2,031
Other Current Assets 24,300 Total Current Liabilities 181,999
16
Other Current Assets 24,300 Total Current Liabilities 181,999
Total Current Assets 384,164 Long-term Debt 85,342
PP&E (net) 246,390 Deferred Income Taxes 23,298
Intangibles 7,483 Other Long-term Liabilities 10,498
Goodwill 25,320 Pension Liability 74,332
Other Assets 45,322 Total Liabilities 375,469
Total Assets 708,679$
Equity 333,210
Total Liabilities and Equity 708,679$

III. Management Plan
C O N F I D E N T I A L

2011 Budget and 2012-2014 Estimates - Snacks
2011B 2012E 2013E 2014E
North America Revenue 554,039$ 569,552$ 584,930$ 600,138$
Latin America Revenue 145,095 159,605 173,969 187,887
Total Revenue 699,134$ 729,156$ 758,899$ 788,025$
Costs of Goods Sold 365,647$ 379,161$ 394,627$ 409,773$
Sales & Marketing 110,463 114,478 118,388 122,144
18
Sales & Marketing 110,463 114,478 118,388 122,144
General & Admin 102,773 105,728 106,246 106,383
Total Expenses 578,883$ 599,367$ 619,261$ 638,300$
EBITDA 120,251$ 129,790$ 139,637$ 149,725$
Depreciation 24,373 24,835 25,728 25,900
EBIT 95,879$ 104,955$ 113,910$ 123,825$
Capital Expenditures 24,500$ 25,000$ 33,500$ 31,000$
Note: 2011B is a combination of actual results through September 2011 and a forecast for Q4 2011.

2011 Budget and 2012-2014 Estimates – Snacks,Continued
Highlights:
• Barkley projects continued moderate revenue growth in North America due to
limited expansion opportunities
• Higher revenue growth is expected in Latin America as the company expands within
existing markets and enters new ones
19
existing markets and enters new ones
• Gross margins are expected to remain relatively stable
• As the business increases its scale in Latin America, marketing and overhead costs
are expected to decrease (as a % of overall revenue)
• Capital expenditures are expected to be high in 2013/2014 as the company builds
additional manufacturing and distribution facilities in Latin America

2011 Budget and 2012-2014 Estimates –Personal Hygiene
2011B 2012E 2013E 2014E
Branded Products 131,976$ 134,615$ 137,307$ 140,054$
Private Label 94,303 99,962 105,959 112,317
Total Revenue 226,279$ 234,577$ 243,267$ 252,370$
Costs of Goods Sold 130,378$ 135,528$ 141,020$ 146,680$
Sales & Marketing 24,624 25,133 25,796 26,481
General & Admin 39,471 40,226 40,415 42,071
Total Expenses 194,473$ 200,887$ 207,230$ 215,232$
20
EBITDA 31,806$ 33,690$ 36,037$ 37,139$
Depreciation 5,995 6,180 6,365 6,020
EBIT 25,811$ 27,510$ 29,672$ 31,119$
Capital Expenditures 5,400$ 5,600$ 5,800$ 6,000$
Other Metrics
Gross Margin - Branded 48.8% 49.0% 49.0% 49.0%
Gross Margin - Private 33.4% 33.1% 33.0% 33.0%
EBITDA - Branded 18.2% 18.8% 19.3% 19.3%
EBITDA - Private 8.3% 8.4% 9.0% 9.0%
Note: 2011B is a combination of actual results through September 2011 and a forecast for Q4 2011.
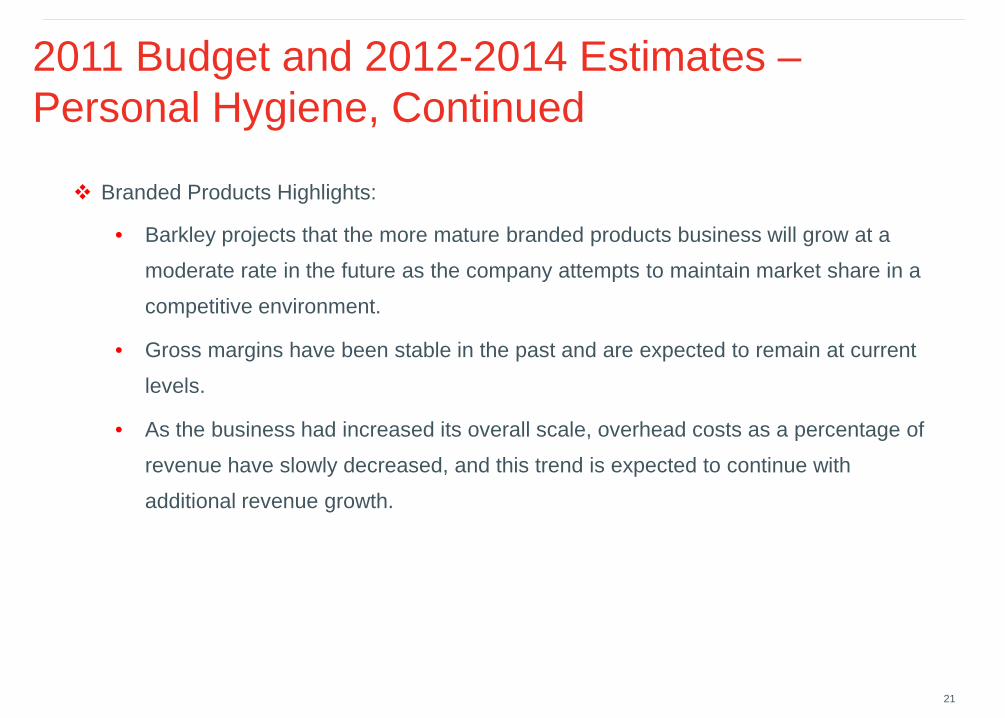
2011 Budget and 2012-2014 Estimates –Personal Hygiene, Continued
Branded Products Highlights:
• Barkley projects that the more mature branded products business will grow at a
moderate rate in the future as the company attempts to maintain market share in a
competitive environment.
• Gross margins have been stable in the past and are expected to remain at current
21
• Gross margins have been stable in the past and are expected to remain at current
levels.
• As the business had increased its overall scale, overhead costs as a percentage of
revenue have slowly decreased, and this trend is expected to continue with
additional revenue growth.

2011 Budget and 2012-2014 Estimates –Personal Hygiene, Continued
Private Label Highlights:
• Management’s primary initiative is continuing the expansion of the private label business. While
lower margin, management sees opportunities to add new private label customers as the current
economic situation in the United States has resulted in more and more retailers planning to offer
their own low-cost versions of basic personal hygiene products.
• Historically, pricing pressures from large retailers have resulted in a steady decrease in gross
22
• Historically, pricing pressures from large retailers have resulted in a steady decrease in gross
margin. However, the company has recently been able to streamline its manufacturing process
to lower costs and believes that flat gross margins can be maintained in the future.
• The business is driven less by consumer demand and more heavily by the ability to maintain
relationships with customers and provide product at a low cost. Customer attrition is therefore
generally higher in this business compared to branded products; however, the company already
has an average customer tenure of seven years, which is above the industry average. While
customers are currently particularly price-sensitive as consumers seek out the best values, the
company expects customer additions to more than offset any customer losses going forward.

IV. Additional Information
C O N F I D E N T I A L
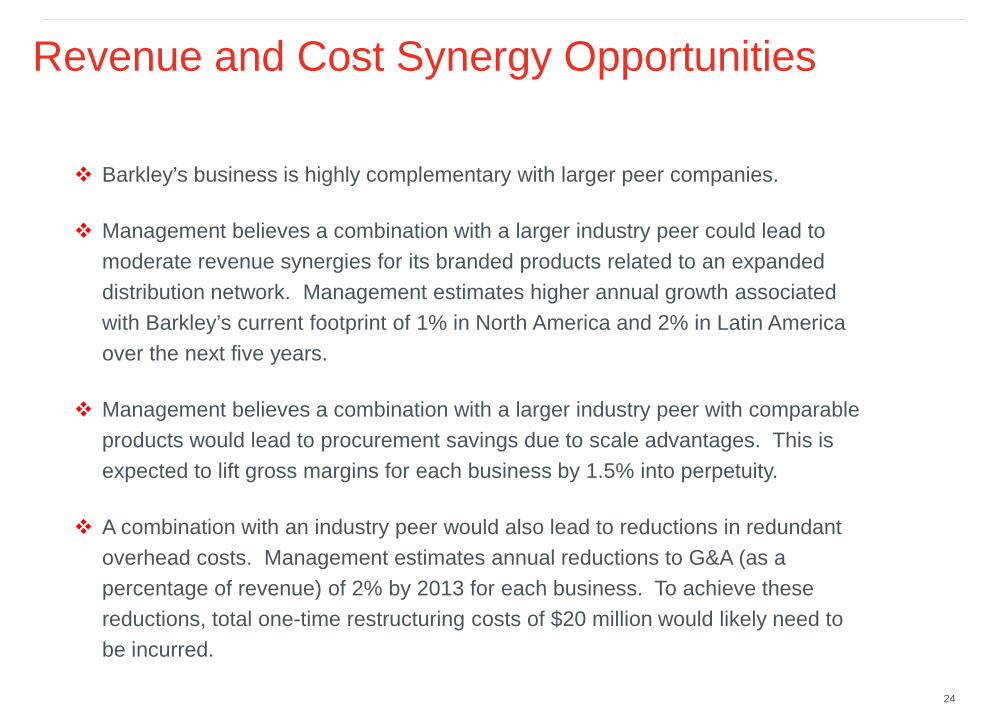
Revenue and Cost Synergy Opportunities
Barkley’s business is highly complementary with larger peer companies.
Management believes a combination with a larger industry peer could lead to
moderate revenue synergies for its branded products related to an expanded
distribution network. Management estimates higher annual growth associated
with Barkley’s current footprint of 1% in North America and 2% in Latin America
over the next five years.over the next five years.
Management believes a combination with a larger industry peer with comparable
products would lead to procurement savings due to scale advantages. This is
expected to lift gross margins for each business by 1.5% into perpetuity.
A combination with an industry peer would also lead to reductions in redundant
overhead costs. Management estimates annual reductions to G&A (as a
percentage of revenue) of 2% by 2013 for each business. To achieve these
reductions, total one-time restructuring costs of $20 million would likely need to
be incurred.
24

Other Details – Personal Hygiene
Personal Hygiene private label business:
• All customers generally have a similar gross margin and fixed asset
requirement per dollar of revenue as the overall business.
• Barkley has generally been able to achieve revenue growth for existing
customers in the range of 2-3% annually.
• S&M costs have averaged approximately 4-5% of revenue historically,
25
compared to branded products S&M costs of approximately 15-16% of
revenue. These S&M expense levels are expected to remain constant into
the future.
• Fixed costs have historically represented approximately 20% of COGS, 25%
of S&M costs and 90% of G&A costs.
V. Deliverables
C O N F I D E N T I A L

Deliverables
Deliverable #1
Research potential buyers of Barkley Enterprises in the consumer products industry. What are the
important characteristics for a potential buyer or buyers? Based on your analysis, recommend a buyer
or buyers.
What would the buyer(s) be willing to pay and why? Conclusions should assess all facts and
circumstances, including consideration of the value perspective of opposing parties (e.g., you must
consider value perspectives of the potential buyer(s) and the seller). Assume a deal close (and
valuation date) of October 31, 2011.
Deliverables must include, but are not limited to: Deliverables must include, but are not limited to:
• Your team’s recommendation for best buyer(s)
• Discounted cash flow (DCF) model(s) for Barkley showing concluded enterprise value(s) and
calculations for revenue, EBITDA , depreciation, capital expenditures, working capital, present
value factors, and residual period amounts. Synergy considerations, if any, should be shown
separately. Key inputs should also be detailed in the models.
• Calculation of the weighted average cost of capital (WACC) for use in the DCF model(s)
• Market approach analysis showing indicated enterprise value(s) and using public information on
comparable companies and/or recent transactions
• Qualitative list of issues analyzed, and support for final assumptions
27
Deliverables, continued
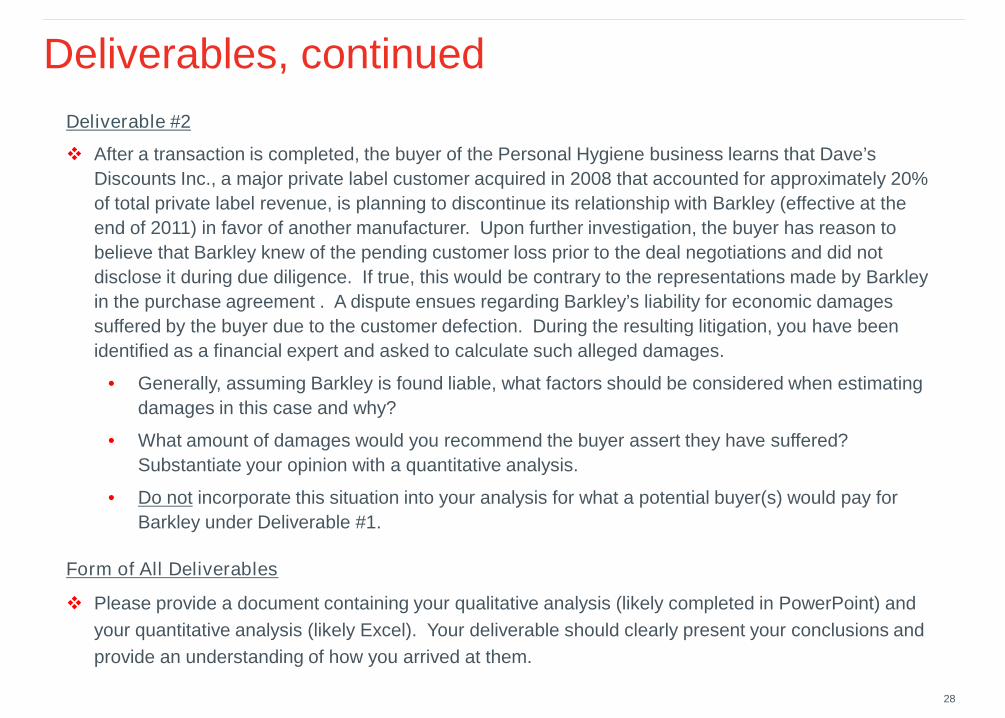
Deliverable #2
After a transaction is completed, the buyer of the Personal Hygiene business learns that Dave’s
Discounts Inc., a major private label customer acquired in 2008 that accounted for approximately 20%
of total private label revenue, is planning to discontinue its relationship with Barkley (effective at the
end of 2011) in favor of another manufacturer. Upon further investigation, the buyer has reason to
believe that Barkley knew of the pending customer loss prior to the deal negotiations and did not
disclose it during due diligence. If true, this would be contrary to the representations made by Barkley
in the purchase agreement . A dispute ensues regarding Barkley’s liability for economic damages
suffered by the buyer due to the customer defection. During the resulting litigation, you have been
identified as a financial expert and asked to calculate such alleged damages.identified as a financial expert and asked to calculate such alleged damages.
• Generally, assuming Barkley is found liable, what factors should be considered when estimating
damages in this case and why?
• What amount of damages would you recommend the buyer assert they have suffered?
Substantiate your opinion with a quantitative analysis.
• Do not incorporate this situation into your analysis for what a potential buyer(s) would pay for
Barkley under Deliverable #1.
Form of All Deliverables
Please provide a document containing your qualitative analysis (likely completed in PowerPoint) and
your quantitative analysis (likely Excel). Your deliverable should clearly present your conclusions and
provide an understanding of how you arrived at them.
28


