2012 Dutchess County Rental Housing Survey Marcus J. Molinaro Dutchess County Executive Kealy Salomon Commissioner of Planning and Development Prepared by Dutchess County Department of Planning and Development Division of Housing and Community Development Prepared by: Anne Saylor, Community Development Administrator Heather LaVarnway, Senior Planner Monica Rusko, Senior Program Assistant
Transcript
2012 Dutchess County Rental Housing Survey
Marcus J. Molinaro Dutchess County Executive
Kealy Salomon
Commissioner of Planning and Development
Prepared by Dutchess County Department of Planning and Development Division of Housing and Community Development
Prepared by: Anne Saylor, Community Development Administrator Heather LaVarnway, Senior Planner Monica Rusko, Senior Program Assistant
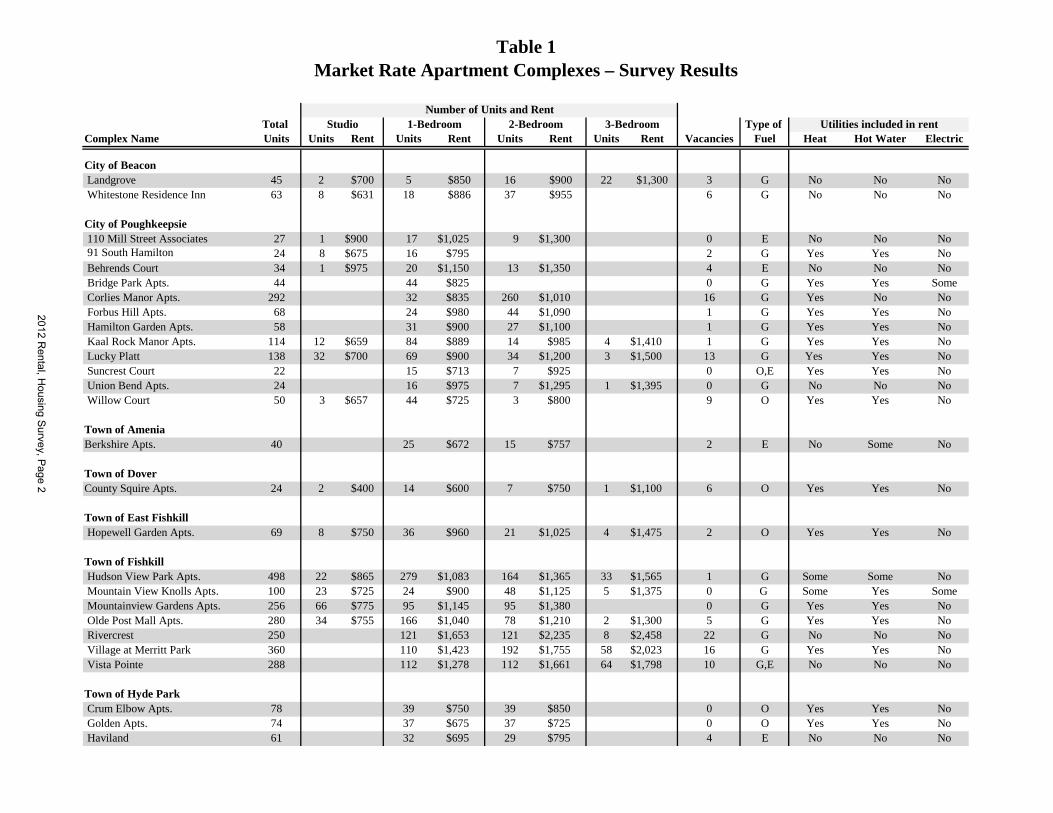
INTRODUCTION With this report, the Dutchess County Department of Planning and Development has been surveying the rental market in Dutchess County for thirty years. The market has experienced some significant changes during this time including the “heated” market in the late 1980’s, the decline of the rental market caused by the downsizing of IBM in the 1990’s, the subsequent recovery, and the end of the current housing bubble. The report assesses the rental housing market by collecting and analyzing data on the four major sectors: market rate apartment complexes, tax credit apartment complexes, multi-family housing, and subsidized housing. Tax credit apartment complexes, with their restricted rents and very low vacancy rates, have their own category because they are an increasing share of our rental market and their inclusion with the market rate apartments skews the average rents and vacancy rate. We have not included these projects in our subsidized housing list since, although they are income restricted, the rents are based on a set restricted rent and not a percentage of a household’s income as it is with traditional subsidized housing. Survey information is used by a variety of participants in the rental housing market. Market experts use it to determine the level of demand for rental housing in Dutchess County. Appraisers, marketing consultants and realtors use the survey to help determine the value of units and properties. Businesses use the information when making location decisions, and the public sector, at both the State and local level, uses the information to shape housing policies and programs that will address the needs and gaps identified in this survey. METHOD A master database of apartment complexes has been developed and maintained by the Department of Planning and Development using real property records and other pertinent sources. In October 2012, a self-administered survey was sent to all complexes with 20 or more units. The respondents were asked to provide current rental information. Follow-up telephone calls were made to those who did not respond. In total, 99 complexes were contacted with 83 responding, for a complex response rate of 84 percent. The number of units covered by the response was 7,752, which represents 83 percent of the 20-unit or more apartment complex units. The complexes that did not respond include 30 complexes with 1,570 units. The other form of data collection was information on multi-family rental units in Dutchess County from the Poughkeepsie Journal (chosen for its countywide circulation) and Craigslist. Traditionally, the review also used information from the now-defunct Taconic Newspapers. In an effort to replace the data from the Taconic Newspapers and be sure the review captures the major advertising avenues, Craigslist has been used as a data source since 2009. Previous reports also used the Pennysaver, but limited local distribution and the increasing popularity of Craigslist resulted in the removal of the Pennysaver as a resource. In addition, the survey includes information collected from subsidized rental units. Unlike the market rate and tax credit complexes, units that fall into this “subsidized” category have variable rents based on one’s ability to pay and determined as a certain percentage of household income (typically 30%). Current data was gathered from an existing list of subsidized complexes. Telephone calls were made directly to the complex or appropriate housing authority. Table 1 provides details on the market rate apartment complexes who responded to the survey.
Total Type of Complex Name Units Units Rent Units Rent Units Rent Units Rent Vacancies Fuel Heat Hot Water Electric
City of Beacon Landgrove 45 2 $700 5 $850 16 $900 22 $1,300 3 G No No No Whitestone Residence Inn 63 8 $631 18 $886 37 $955 6 G No No No
City of Poughkeepsie 110 Mill Street Associates 27 1 $900 17 $1,025 9 $1,300 0 E No No No 91 South Hamilton 24 8 $675 16 $795 2 G Yes Yes No Behrends Court 34 1 $975 20 $1,150 13 $1,350 4 E No No No Bridge Park Apts. 44 44 $825 0 G Yes Yes Some Corlies Manor Apts. 292 32 $835 260 $1,010 16 G Yes No No Forbus Hill Apts. 68 24 $980 44 $1,090 1 G Yes Yes No Hamilton Garden Apts. 58 31 $900 27 $1,100 1 G Yes Yes No Kaal Rock Manor Apts. 114 12 $659 84 $889 14 $985 4 $1,410 1 G Yes Yes No Lucky Platt 138 32 $700 69 $900 34 $1,200 3 $1,500 13 G Yes Yes No Suncrest Court 22 15 $713 7 $925 0 O,E Yes Yes No Union Bend Apts. 24 16 $975 7 $1,295 1 $1,395 0 G No No No Willow Court 50 3 $657 44 $725 3 $800 9 O Yes Yes No
Town of AmeniaBerkshire Apts. 40 25 $672 15 $757 2 E No Some No
Town of DoverCounty Squire Apts. 24 2 $400 14 $600 7 $750 1 $1,100 6 O Yes Yes No
Town of East Fishkill Hopewell Garden Apts. 69 8 $750 36 $960 21 $1,025 4 $1,475 2 O Yes Yes No
Town of Fishkill Hudson View Park Apts. 498 22 $865 279 $1,083 164 $1,365 33 $1,565 1 G Some Some No Mountain View Knolls Apts. 100 23 $725 24 $900 48 $1,125 5 $1,375 0 G Some Yes Some Mountainview Gardens Apts. 256 66 $775 95 $1,145 95 $1,380 0 G Yes Yes No Olde Post Mall Apts. 280 34 $755 166 $1,040 78 $1,210 2 $1,300 5 G Yes Yes No Rivercrest 250 121 $1,653 121 $2,235 8 $2,458 22 G No No No Village at Merritt Park 360 110 $1,423 192 $1,755 58 $2,023 16 G Yes Yes No Vista Pointe 288 112 $1,278 112 $1,661 64 $1,798 10 G,E No No No
Town of Hyde Park Crum Elbow Apts. 78 39 $750 39 $850 0 O Yes Yes No Golden Apts. 74 37 $675 37 $725 0 O Yes Yes No Haviland 61 32 $695 29 $795 4 E No No No
Utilities included in rentNumber of Units and Rent
Total Type of Utilities included in rentComplex Name Units Units Rent Units Rent Units Rent Units Rent Vacancies Fuel Heat Hot Water Electric
Town of Hyde Park (cont'd) Hyde Park Estates 70 26 $950 42 $1,175 2 $1,300 2 G Yes Yes No Hyde Park Heights 130 61 $950 69 $1,058 2 O Yes Yes No Mill Run 66 33 $825 33 $925 0 O Yes Yes No Partridge Hill Estates 60 4 $550 16 $585 40 $950 3 G No No No
Town of Pleasant Valley Arbor Arms Apts. 21 1 $950 15 $1,225 5 $1,325 1 O No Yes Yes Brookside Meadows 222 75 $1,325 74 $1,703 73 $2,148 4 G No No No Country Commons 60 36 $850 24 $1,125 2 E No No No Pleasant Valley Estates 48 48 $830 3 E No No No Spring Creek Properties 34 34 $1,300 4 G No No No Village Park Apts. 178 88 $1,110 90 $1,520 0 G No No No
Town of Poughkeepsie Canterbury Gardens 204 122 $900 82 $1,125 4 G Yes Yes No Cherry Hill North 68 52 $950 16 $1,125 1 G Yes Yes No Cherry Hill Townhouses 128 128 $1,050 5 G No No No Circle View Apts. 33 9 $625 21 $825 3 $838 2 O Yes Yes Yes Colonial Manor 116 100 $950 16 $1,275 2 G Yes Yes No Country Club Apts. 120 2 $540 65 $1,040 48 $1,275 5 $1,475 5 G Yes Yes No Dutchess Apts. 100 20 $1,020 80 $1,125 5 O Yes Yes No Hudson Harbor Apts. 352 288 $1,087 54 $1,465 10 $2,100 2 E Some Some Some Hudson Row Apts. 96 48 $1,265 40 $1,650 8 $1,950 5 O Yes Yes No Manchester Gardens 214 152 $930 62 $1,105 4 G Yes Yes No Mountain Brook Estates 288 4 $895 192 $915 88 $1,110 4 $1,425 25 G Yes Yes No Oak Tree Garden Apts. 46 2 $800 21 $990 19 $1,110 4 $1,520 2 O Yes Yes No Ridgefield Apts. 292 176 $1,005 116 $1,230 20 G Yes Yes No Vassar Garden Apts. 60 16 $965 20 $1,100 24 $1,375 4 O Yes No Yes
Town of Rhinebeck Village Green Apts. 144 103 $990 41 $1,150 2 O Yes Yes No
Town of Wappinger Chelsea Ridge Apts. 775 498 $1,066 265 $1,441 12 $2,022 12 G Yes Yes No Dutchess Falls 47 34 $1,200 13 $1,500 0 G Yes Yes No Riverbend 123 35 $1,400 88 $1,750 4 G No No No Sky View Apts. 30 2 $675 12 $835 16 $945 1 G Yes Yes No Village Crest Apts. 246 11 $865 114 $992 102 $1,138 19 $1,413 10 G Yes Yes No
TOTALS 7,752 256 3,944 3,168 384 260
Studio 1-Bedroom 2-Bedroom 3-BedroomNumber of Units and Rent
2012 Rental, H
ousing Survey, P
age 3
MARKET RATE APARTMENT COMPLEXES The information listed on the following tables is based on Table 1 (Market Rate Apartment Complex – Survey Results). Please note when comparing information in this section of the survey to information in the multi-family section that apartment complex rents generally include heat and hot water, while tenants generally pay all utilities separately in the other types of housing. It should be noted this is changing as newer complexes generally do not include utilities in the rent. The municipality with the largest number of responding market rate apartment complex units is the Town of Poughkeepsie with 2,117 units. Fishkill and Wappinger also have significant numbers of units with 2,030 and 1,223, respectively. The units in these three municipalities make up 69 percent of the market rate units that responded to the survey. A review of Table 2 shows that 92 percent of market rate apartment complex units are one- or two-bedrooms. Only 5 percent are three-bedrooms. These percentages are relatively consistent with previous surveys.
*Town listings include village and unincorporated areas.
2012 Rental Housing Survey, Page 4
Table 4 shows the distribution of apartment complex units throughout Dutchess County. These percentages are similar to the results of previous surveys.
Table 4
Market Rate Apartment Complexes Percentage of Apartment Complex Units by Location
*Town listings include village and unincorporated areas. Tables 5 and 6 show the average county rents by unit size and the percent change in average rents from the last several surveys.
Total Type of Complex Name Units Units Rent Units Rent Units Rent Units Rent Vacancies Fuel Heat Hot Water Electric
City of Beacon Meadow Ridge 1 54 20 $1,123 34 $1,297 4 G Yes Yes No Meadow Ridge II 52 12 $785 11 $940 2 G Yes Yes No
8 $1,050 21 $1,110City of Poughkeepsie Cannon Street Apts. 39 39 $753 0 G Yes Yes No Livingston Arms 34 12 $860 22 $1,022 0 G Yes Yes No The Hamilton 54 24 $706 28 $852 2 $958 6 G No No No
Town of Fishkill Horizons at Fishkill 90 47 $846 43 $1,010 3 G Yes Yes No Views at Rocky Glen 82 32 $1,000 38 $1,190 12 $1,060 0 G No No No
Town of Hyde Park Heritage Pointe Apts. 82 62 $669 20 $855 1 O Yes Yes No Stone Ledge 84 69 $725 15 $870 0 G Yes Yes No
Town of Pawling Dutcher House 46 14 $620 29 $825 3 $1,030 0 E No Yes No
Town of Poughkeepsie Grand Pointe Park 156 40 $870 80 $1,035 36 $1,192 0 G No Yes No Hillside Terrace 64 24 $700 35 $840 5 $968 0 G Yes Yes No Pendell Commons 72 24 $618 36 $898 12 $998 0 G No Yes No Spring Manor Apts. 88 44 $875 44 $1,040 G No No No
Town of Red Hook Red Hook Commons I 48 48 $620 0 G No Yes No Red Hook Commons II 48 48 $617 0 G No Yes No
Town of Wappinger DiMarco Place I 32 32 $944 0 G Yes Yes Yes DiMarco Place II 32 5 $484 1 G Yes Yes Yes
27 $605
TOTALS 1,157 14 626 416 101 17
Studio 1-BedroomNumber of Units and Rent
2-Bedroom 3-Bedroom Utilities included in rent
2012 Rental H
ousing Survey, P
age 6
TAX CREDIT APARTMENT COMPLEXES The information listed in Tables 8 and 9 is based on Table 7 (Tax Credit Apartment Complexes – Survey Results). They summarize the average county rents for tax credit apartment complexes and the number of units by municipality, for those complexes that responded to the survey. Rents for studio units in tax credit complexes remain unchanged since 2011. One-bedroom rents increased 2.6%, two-bedroom rents increased 8.7%, and three-bedroom rents decreased by 0.3%.
Table 9 Tax Credit Apartment Complexes Number of Units by Municipality
Total Number
Municipality* Of Rental Units C/Beacon 106 C/Poughkeepsie 127 T/Fishkill 172 T/Hyde Park 166 T/Pawling 46 T/Poughkeepsie 380 T/Red Hook 96 T/Wappinger 64 TOTAL 985
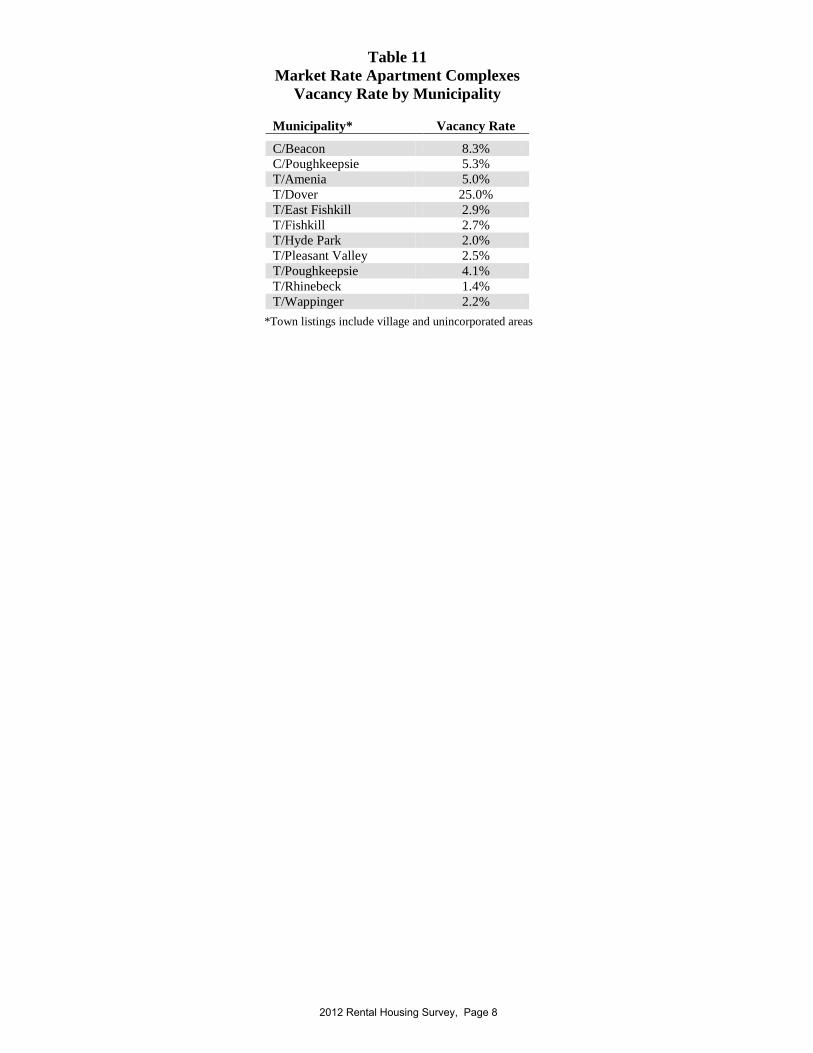
*Town listings include village and unincorporated areas. VACANCIES The vacancy rate in the market rate apartment complexes surveyed in 2012 was 3.4 percent. A total of 260 units were vacant out of a total of 7,752 units. It should be noted that the vacancy rate for tax credit developments was 1.5 percent. Tax credit developments generally have very low vacancies due to their subsidized rents. Housing experts recognize a 5.0 percent vacancy rate as an indicator of a healthy rental market. It is low enough not to negatively affect landlords, but high enough to permit tenant mobility. Table 10 summarizes the vacancy rates from 2008-2012. Table 11 shows the 2012 vacancy rate for each municipality.
*Town listings include village and unincorporated areas
2012 Rental Housing Survey, Page 8
CONSTRUCTION Tables 12 and 13 show the construction history of Dutchess County apartment complexes.
Table 12 Apartment Complexes - Construction History Summary
2012 2011 2010 2009 2008 1982-2007 Total Units Constructed 0 72 0 225 136 2,804 3,237
Table 13 Apartment Complexes – Detailed Construction History
Survey Year(s) Complex Location # Units Constructed 2012 N/A N/A 0 2011 Pendell Commons T/Poughkeepsie 72 2010 N/A N/A 0 2009 Views at Rocky Glen T/Fishkill 82 Lucky Platt City of Poughkeepsie 143 2008 Red Hook I and II1 T/Red Hook 96 Cannon Street 1 C/Poughkeepsie 40 2007 Brookside Meadows2 T/Pleasant Valley 14 Rivercrest T/Fishkill 250 Riverbend T/Wappinger 123 Meadow Ridge II1 C/Beacon 52 Stoneledge1 T/Hyde Park 82 2006 Horizons at Fishkill1 T/Fishkill 90 Brookside Meadows2 T/Pleasant Valley 41 2005 Brookside Meadows2 T/Pleasant Valley 77 Spring Manor1 T/Poughkeepsie 88 Castle Court1 T/Poughkeepsie 60 2004 Lexington Club1 T/Poughkeepsie 160 DiMarco II1 T/Wappinger 32 2003 Meadow Ridge1 C/Beacon 54 2002 N/A N/A 0 2001 Jefferson at Merritt Park T/Fishkill 28 Berkeley Square Apts1 T/Wappinger 50 Heritage Pointe Apts 1 T/Hyde Park 82 2000 Jefferson at Merritt Park T/Fishkill 332 Berkeley Square Apts1 T/Wappinger 100 Hillside Terrace1 T/Poughkeepsie 64 1995-1999 Grande Pointe Park1 T/Poughkeepsie 156 1990–1994 Spring Creek Townhouses T/Pleasant Valley 34 Avalon View(originally Townview) T/Fishkill 288 1986-1989 Village Park Apartments T/Pleasant Valley 178 Cherry Hill North Section IV T/Poughkeepsie 70 Colonial Manor T/Poughkeepsie 116 1982-1985 Cherry Hill Townhouses T/Poughkeepsie 130 Crum Elbow Apts. T/Hyde Park 29 110 Mill Street C/Poughkeepsie 24
Total = 3,237 1Project subsidized by a government housing program(s).
2Project built and occupied in phases across several years. CONVERSIONS A list of conversions from apartment complexes to condominiums from 1982-1989 is available in the 2002 Rental Housing Survey (see http://www.co.dutchess.ny.us/CountyGov/Departments/Planning/2002rhs.pdf).
2012 Rental Housing Survey, Page 9
NON-RESPONDENTS The following listing represents market rate and tax credit apartment complexes that are not included in the 2012 survey results (Tables 1 through 11). Current rental information was not available either because of an inability to contact the complex or the complex not wishing to participate in the survey. MUNICIPALITY: # of UNITS: City of Beacon 73-75 South Ave 25
City of Poughkeepsie 73 Garden Street 22 199 Mill Street Apartments 24 509 Main Street 20
521-527 Main Street 46 82 South Hamilton 27 Carlton Court 25 Eden Roc 36
Fallkill Properties 56 Franklin and Carroll Apartments 24
Town of East Fishkill 170 Clove Branch Rd. 24
Town of Fishkill
Cecilwood Center Apartments 23 Jamestown Farm 42
Town of Hyde Park
Cedar Garden Apartments 24 Coveview 26
Hyde Park Terrace 24 Town of LaGrange Elliot’s Apartments 30
Town of Pleasant Valley Palmer Apartments 40 Pleasant Valley Gardens 24 Town of Poughkeepsie Brookside Gardens 101
Cherry Hill 72 Collegeview Apartments 40 Collegeview Towers 104
Lexington Club 160 Oak Crest1 25
Town of Stanford Lakeview Apartments 39 Town of Wappinger Berkeley Square Apartments1 150 Imperial Gardens 250
Stonegate Apartments 34 Town of Washington Millbrook Properties 33 Total # Non-Respondent Units = 1,570
1 Project subsidized by a government housing program(s).
2012 Rental Housing Survey, Page 10
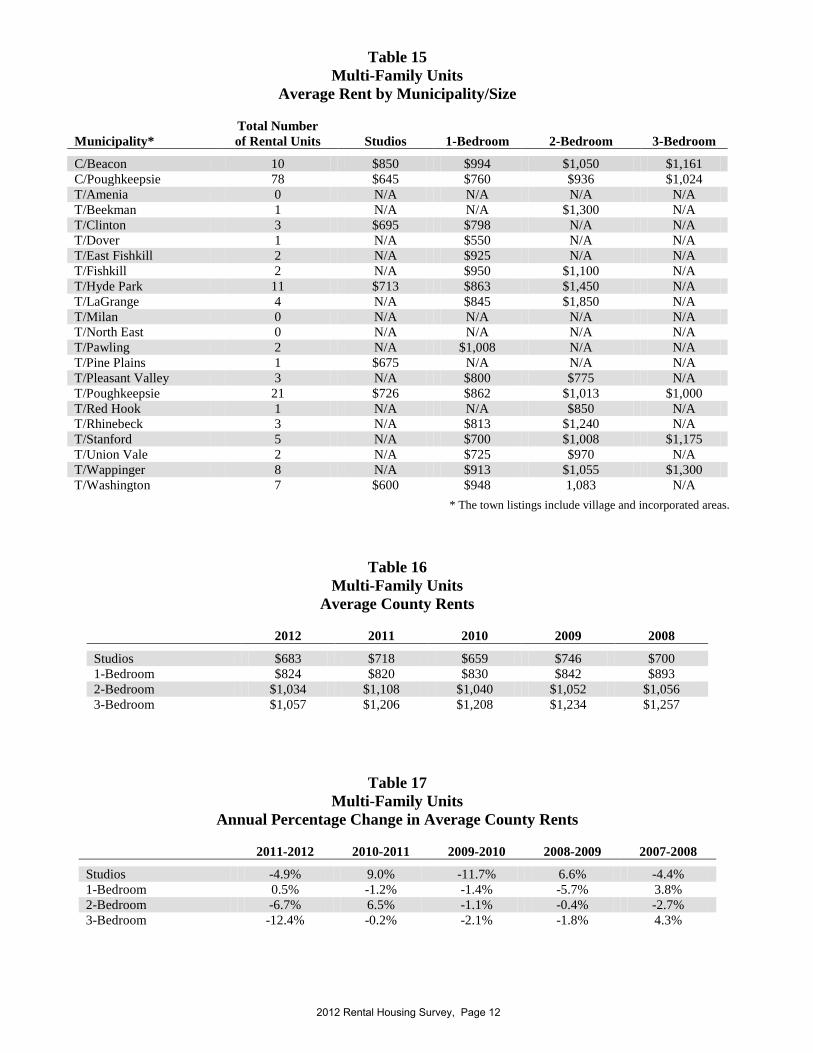
MULTI-FAMILY UNITS This section shows a snapshot in time that summarizes the results of a newspaper and online review of available multi-family rental units in Dutchess County. The review included units listed in the Poughkeepsie Journal and Craigslist Hudson Valley. In past years, the Pennysaver was also used as a resource, but limited local distribution and the increasing popularity of Craigslist resulted in the removal of the Pennysaver as a source. The available units included those listed in the Poughkeepsie Journal’s "Unfurnished Apartments for Rent" section of October 7th, 14th, and 21st, 2012; and Craigslist Hudson Valley for October 20th, 21st, 22nd, and 25th, 2012. This year's survey covers a total of 164 units, which is significantly less than last year. As in previous years’ surveys, the municipality with the largest number of available rental units was the City of Poughkeepsie with 77 units. On the other end of the spectrum, the towns of Amenia, Milan, and North East had no rental listings. This does not mean that there aren’t apartments in these municipalities, but rather that none were listed as available during the review period. The average multi-family rent for available one-bedroom units increased by 0.5 percent. The average rent for two-bedroom units decreased by 6.7 percent. Studio rents decreased by 4.9 percent, while three-bedroom rents decreased by 12.4 percent. Median numbers are often considered more reliable indicators of a market as they remove the exaggerating influence of extremely high and low rents. Median rents for one-bedroom units decreased by 1.6 percent, while the median for a two-bedroom remained the same as in 2011. Table 14 shows the distribution of available multi-family units throughout the County, while Table 15 shows the average rents by municipality. Tables 16-19 show the average and median rents from 2008-2012 and calculate the percent change over that same period.
Table 14 Multi-Family Units
Total Number of Available Rental Units by Municipality/Size
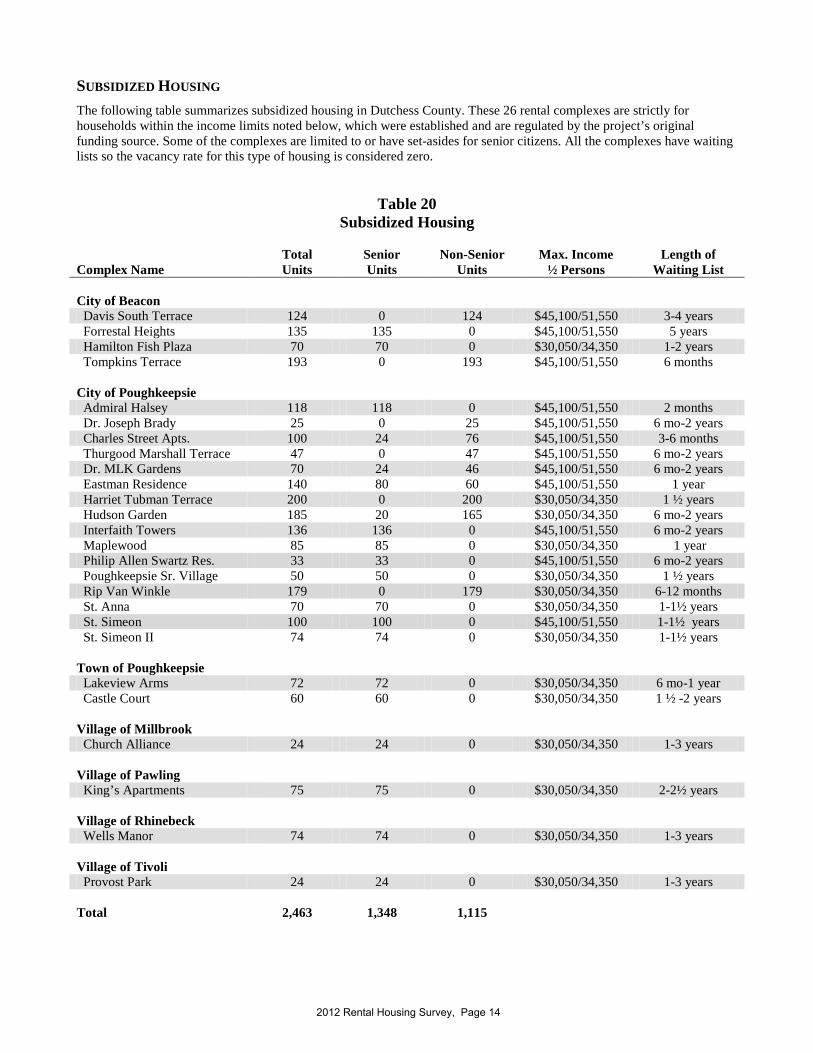
SUBSIDIZED HOUSING The following table summarizes subsidized housing in Dutchess County. These 26 rental complexes are strictly for households within the income limits noted below, which were established and are regulated by the project’s original funding source. Some of the complexes are limited to or have set-asides for senior citizens. All the complexes have waiting lists so the vacancy rate for this type of housing is considered zero.
Table 20 Subsidized Housing
Complex Name
Total Units
Senior Units
Non-Senior Units
Max. Income ½ Persons
Length of Waiting List
City of Beacon Davis South Terrace 124 0 124 $45,100/51,550 3-4 years Forrestal Heights 135 135 0 $45,100/51,550 5 years Hamilton Fish Plaza 70 70 0 $30,050/34,350 1-2 years Tompkins Terrace 193 0 193 $45,100/51,550 6 months City of Poughkeepsie Admiral Halsey 118 118 0 $45,100/51,550 2 months Dr. Joseph Brady 25 0 25 $45,100/51,550 6 mo-2 years Charles Street Apts. 100 24 76 $45,100/51,550 3-6 months Thurgood Marshall Terrace 47 0 47 $45,100/51,550 6 mo-2 years Dr. MLK Gardens 70 24 46 $45,100/51,550 6 mo-2 years Eastman Residence 140 80 60 $45,100/51,550 1 year Harriet Tubman Terrace 200 0 200 $30,050/34,350 1 ½ years Hudson Garden 185 20 165 $30,050/34,350 6 mo-2 years Interfaith Towers 136 136 0 $45,100/51,550 6 mo-2 years Maplewood 85 85 0 $30,050/34,350 1 year Philip Allen Swartz Res. 33 33 0 $45,100/51,550 6 mo-2 years Poughkeepsie Sr. Village 50 50 0 $30,050/34,350 1 ½ years Rip Van Winkle 179 0 179 $30,050/34,350 6-12 months St. Anna 70 70 0 $30,050/34,350 1-1½ years St. Simeon 100 100 0 $45,100/51,550 1-1½ years St. Simeon II 74 74 0 $30,050/34,350 1-1½ years Town of Poughkeepsie Lakeview Arms 72 72 0 $30,050/34,350 6 mo-1 year Castle Court 60 60 0 $30,050/34,350 1 ½ -2 years Village of Millbrook Church Alliance 24 24 0 $30,050/34,350 1-3 years Village of Pawling King’s Apartments 75 75 0 $30,050/34,350 2-2½ years Village of Rhinebeck Wells Manor 74 74 0 $30,050/34,350 1-3 years Village of Tivoli Provost Park 24 24 0 $30,050/34,350 1-3 years Total 2,463 1,348 1,115
2012 Rental Housing Survey, Page 14
CONCLUSION As stated in the introduction, the purpose of this survey is to give interested parties an overview of the rental housing market. This year's survey shows that rents for market rate apartment complexes have increased slightly but their vacancy rates remain low. Compared to average sale prices, rents have remained quite stable over the past several years. More specifically, average market rate apartment complex rents increased for all bedroom sizes ranging from a 1.4 percent increase for three-bedroom units to 2.8 percent for the one-bedroom units. The vacancy rate in market rate apartment complex units is 3.4 percent, a 6.3 percent increase from last year. We expect the vacancy rate has remained low due to multiple factors including: movement of homeowners into the rental market as a result of the foreclosure crisis; inability of some renters to purchase due to tight credit; and incentives, such as a free month’s rent, being offered by some complexes. In multi-family housing the average rent for one-bedroom units increased by 0.5 percent while the average rent for three-bedroom units decreased by 12.4 percent. The low vacancy rate in apartment complexes remains a concern. A rate closer to 5 percent is a sign of a healthier rental market. A low vacancy rate may benefit landlords but it negatively affects tenants by limiting their mobility and choices. Each year, as part of the survey, the Dutchess County Department of Planning and Development calculates the annual household income that would be required to afford an apartment at the average rents listed in this survey. Using the U.S. Department of Housing and Urban Development's guidelines that a household should not pay more than 30 percent of its gross income for housing, households would need the following incomes to afford the average rents in this survey:
While the income levels noted above may not be difficult for two-income families to attain, they are difficult for senior citizens, single-income families and entry-level employees. In addition, although two-income families are better able to afford these rents than the groups noted above, these rents consume such a large portion of their income that it is difficult to save money for the down payment and closing costs associated with the purchasing of a home.