51
2012 ANNUAL REPORT

2012 ANNUAL REPORT

HIGHERSTANDARD

GROWING IN OUR NICHE MARKETS AND LEADING THE INDUSTRY TOWARDS A HIGHER STANDARD, CENVEO IS A LEADER IN THE MANAGEMENT AND DISTRIBUTION OF PRINT AND RELATED PRODUCTS AND SOLUTIONS. We specialize in labels, packaging, content management, commercial print and envelopes on a global platform that continues to expand. Providing solutions and resources to our customers, Cenveo offers a vast network of production, fulfillment and distribution centers that deliver value and quality service every day.
2 0 1 2 C E N V E O L E A D + I N V E S T 2 0 1 2 C E N V E O L E A D + I N V E S T
MESSAGESHAREHOLDERSto
ROBERT G. BURTON, SR.Chairman & Chief Executive Off icer
Shareholder
Bondholder
DEAR FELLOW SHAREHOLDERS,
In the seven years since I became Cenveo’s Chairman and Chief Executive Officer, your company has undergone a significant transformation from what was once regarded as an envelope manufacturer and commercial printer into a highly diversified manufacturing company that is uniquely positioned to thrive going forward. This transformation was well thought out and a deliberate part of our operating strategy and will continue as we go forward.
It is also important to note that during the past few years, we lived through several significant events that had a long lasting negative impact including a severe economic downturn, global sovereign debt crises and more recently, several “government created” issues such as the “fiscal cliff”, the “debt ceiling” fiasco and ever changing tax policies. When you combine these issues with continued advancements in technology that we have seen over the past few years, the face of our industry has changed forever.
During this time, every one of us at Cenveo was committed to emerging from these events by employing a strategy of leading and investing. Throughout the years, we kept our focus by employing our proven successful strategy, investing in our people, technology, products, services and brands in order to position ourselves for sustainable revenue growth, while leading our team to continue to find ways to improve profitability and grow operating cash flow.
As I look back at our company’s performance in 2012, although I am proud of our people and their accomplishments in the face of a difficult operating environment, I am not completely satisfied with the end results.
While we successfully refinanced our near term debt and paid down debt, finished the integration of a strategic acquisition, and divested some non-strategic operations, I am very disappointed that the market does not appropriately value our company. While the current share price is disappointing to me; our Board of Directors and our entire senior management team, I, as our largest shareholder, am more convinced than ever that our hard work will be handsomely rewarded over the long-run.
Here are a few initiatives that we completed last year that I want to highlight ...
STRENGTHENING THE BALANCE SHEETIn a world where the terms “debt ceiling” and “fiscal cliff” are front-page news and recent headlines regarding the debt crisis in Italy and Greece remain fresh in investors’ minds, it was crucial for Cenveo to complete its refinancing efforts last year. I am very pleased to report that 2012 was the year that Cenveo addressed its 2013 debt maturity and paid down over $63 million in debt to continue to strengthen our balance sheet.
1P A G E
Continue to invest in our growth areas + We will look to continue to invest our capital into our higher margin growth businesses such as labels, packaging, content and direct mail. As these areas continue to become a larger part of the Cenveo platform, we will significantly focus our capital expenditures into these areas by investing in equipment, infrastructure and e-commerce. We also will continue to monitor the acquisition landscape, acting on value-play buying opportunities that strengthen our business platform and increase market share in these areas.
Lead the industry’s best team + Without a doubt, I feel our team here at Cenveo is the best in the industry. We are truly fortunate to have some outstanding people working with us at every level at each of our locations. This is no accident; we work really hard to bring people with character, integrity, and intelligence to this company.
Our team’s expertise, experience and fortitude allowed us to not only survive, but thrive over the past few years.
Many members of this team, including all of the senior field management team, have worked with me before and are a battle-tested group that has succeeded in challenging times.
Our employees are financially aligned with shareholders, as our senior management purchases Cenveo stock on a monthly basis. The largest shareholder of Cenveo stock is the Burton family, which owns approximately 10% of the outstanding stock and continues to purchase additional shares in the open market. This past year, I personally purchased over $5,583,000 of Cenveo stock and bonds.
Lead effort on costs + As I have said many times before, in a business environment like the one we are currently facing, dimes, nickels and pennies add up. Improving margins is a way of life at Cenveo; it is in our DNA as a management team. As we enter 2013, we will continue this effort. We continue to remove costs from our operations and pass the savings on to our customers. We will look to compress our cost structure, and will leverage our size to negotiate with our vendors to achieve efficiencies and economies of scale.
Continue to deleverage our balance sheet + As we continue to look to drive strong cash flow, we will look to use these funds to aggressively pay down debt and deleverage our balance sheet. In 2013, we intend to lower our cost of capital by paying off our highest cost debt and potentially refinancing our credit facility.
Hold ourselves accountable + In 2012, we held our employees to exceptionally high standards of accountability, customer service, and bottom-line performance. We were able to deliver strong results despite the challenges we faced. We will continue to strive for performances like this in 2013, as we ask our employees to continue to wear multiple hats and do more with less.
Seven years ago, my team and I began to transform Cenveo into a market leader in the niche areas we serve today. In 2012, demand has begun to normalize despite some factors outside of our control. Margins have improved. Cash flow is improving. Our debt load has been reduced, refinanced and termed out. And the results of our hard work are evident in the form of a stronger balance sheet. Now, as we look forward to 2013 with our near term bond maturity now behind us, it’s time to keep that momentum going, and to grow in the strategic areas we’ve identified.
On behalf of our Board of Directors, management team and employees worldwide, we look forward to making the most of the opportunities that lie ahead and strive to create significant future value for our owners, the shareholders.
While it took us longer than we envisioned, we completed the refinancing of our 2013 bonds. We now have no bond maturities until 2017, giving us the flexibility to focus all of our attention on our operations. I want to personally thank our lender group for their support in helping us complete this undertaking.
Another way we brought in additional cash was to divest non-core businesses that were not central to our long-term growth plans. As I previously mentioned, we will strategically evaluate all of our operations to determine which, if any, alternatives are in the best interests of our stakeholders. As we did in 2012 with the disposition of our forms and documents group, we will look to potentially dispose of businesses that we view as non-strategic to our future.
Our focus on cash flow is not new and continues to deliver results. During the fourth quarter alone, we reduced our debt by $33 million. Looking toward 2013, we will continue to focus our efforts on cash flow on a daily basis, as it remains a central part of our longer-term goal to lower our leverage to 4.0x over the next few years.
GROWTH LEADERSHIP
We continue to invest and expand our business in the industry’s most enduring categories and growth areas. They are:
Labels + As an industry leader in labels, we offer a diverse platform that services ultra-short-run custom products to longer-run shipping and pharmaceutical labels. While there has been technological change in several of our product lines, there is no substitute for a label. Every food, beverage and pharmaceutical product has a label on it, and that is simply not going to change anytime soon. Labels serve to inform consumers of a package’s contents, differentiate that product on the retail shelf, and share a message. As I stated last year, the outlook for our label business is as strong as it’s ever been—and so is Cenveo’s commitment to this business.
Specialty Packaging + Marketers continue to depend on unique packaging to win the battle for the prized possession known as shelf space. Cenveo’s capability to provide high-quality printing, integrated with the unique designs of today’s most visible products, distinguishes us from the competition. Over the past few years, we’ve entered into a notable growth area within the packaging space: “full body shrink sleeves” that, unlike traditional cut-stack labels, wholly envelop a package to uniquely convey premium-level product positioning. In a market that is expanding, Cenveo will continue to be a major player in the packaging category.
Content Management + Gone are the days when the only way to distribute content was through a printing press. Much of today’s communication is disseminated directly to consumers’ laptops, tablets and smart phones. The enabling process to make that happen is content management—formatting and designing raw content for distribution, both printed and digitally. Given the market trends, this is a truly exciting growth area for us.
Direct Mail + Despite the well documented issues we faced in 2012, we remain very excited about the direct mail market. Look in your mailbox. Direct mail just isn’t going away. In fact, in a world where personal communications have become increasingly electronic, direct mail comprises a greater and greater share of the mailbox. One key reason is the growing importance of one-to-one interactive marketing and its role in effectively engaging millions of prospective customers on a personal level. We believe that as we enter 2013, the direct mail market will stabilize as marketers return to normalized ordering patterns.
KEYS FOR SUCCESS IN 2013 AND BEYONDAs the business landscape evolves at a rapid pace, Cenveo adapts and evolves along with it. At the same time, though, we remain true to our five proven successful bedrock strategies:
ROBERT G. BURTON, SR.Chairman & Chief Executive Off icer
Shareholder
Bondholder
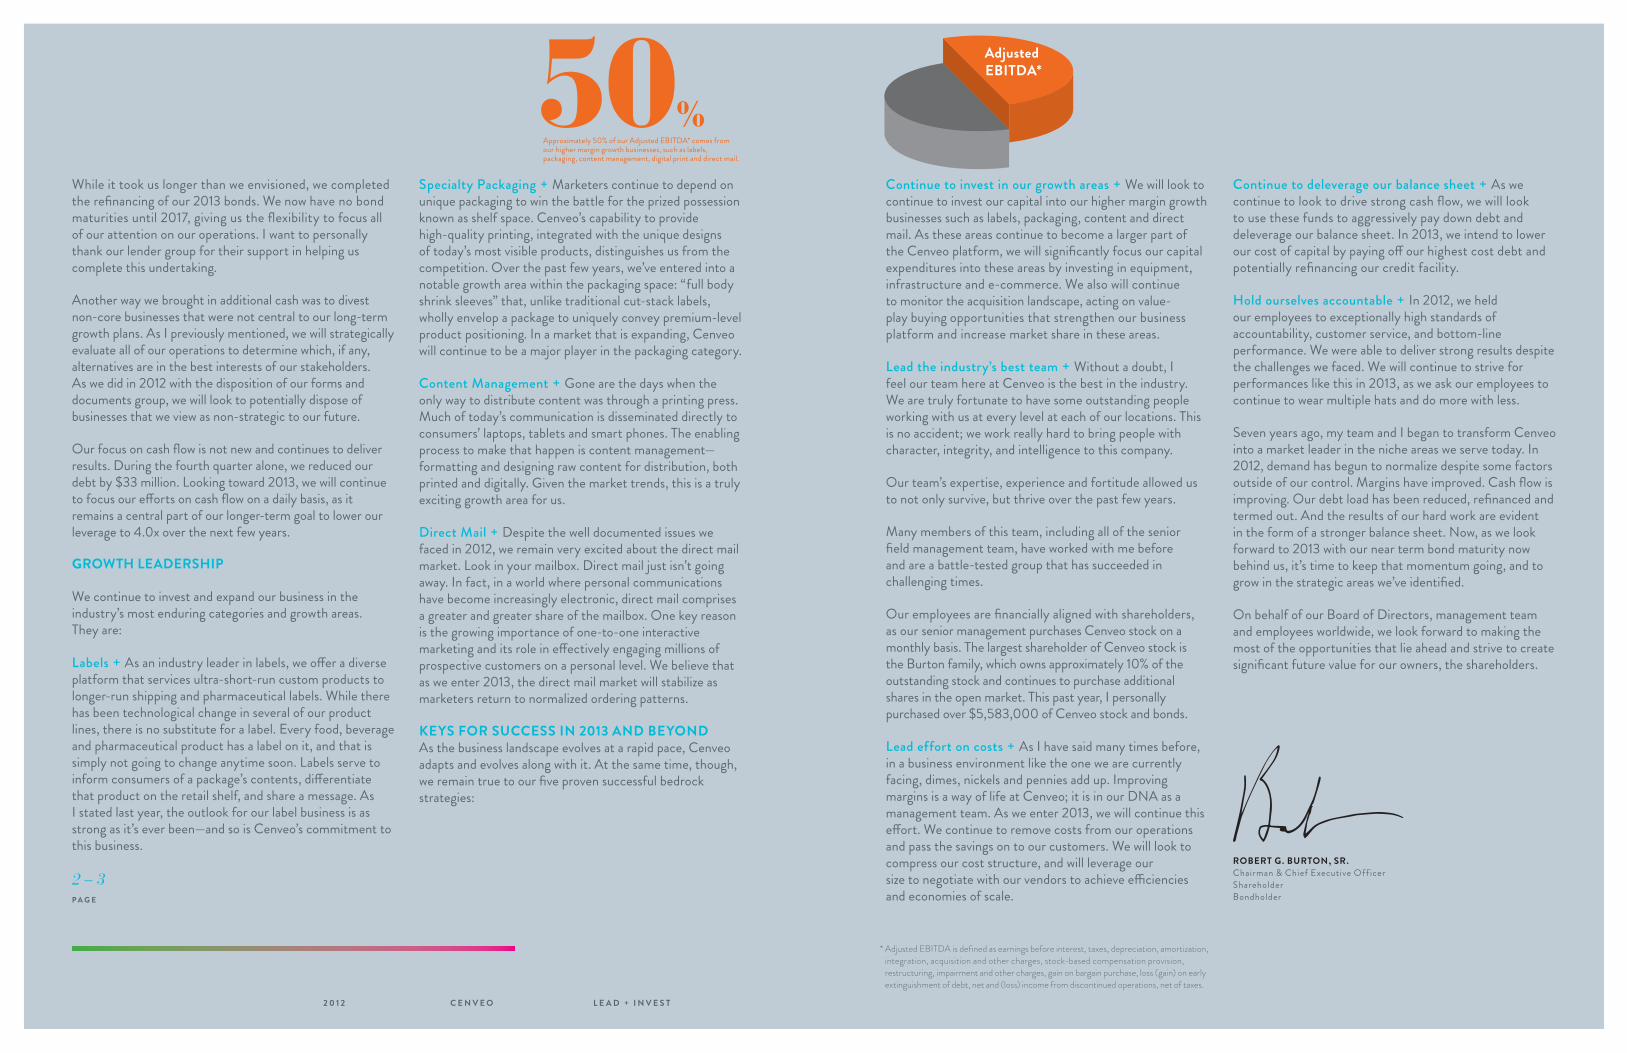
Approximately 50% of our Adjusted EBITDA* comes from our higher margin growth businesses, such as labels, packaging, content management, digital print and direct mail.
50%
Adjusted EBITDA*
* Adjusted EBITDA is defined as earnings before interest, taxes, depreciation, amortization,
integration, acquisition and other charges, stock-based compensation provision,
restructuring, impairment and other charges, gain on bargain purchase, loss (gain) on early
extinguishment of debt, net and (loss) income from discontinued operations, net of taxes.
2 – 3P A G E
2 0 1 2 C E N V E O L E A D + I N V E S T

LEAD + INVESTStrengthening our business platform and increasing market share have been our mottos here at Cenveo. With a focus on the label and packaging division, we are expanding our presence in strong product markets that have withstood unstable economic conditions. As we build upon our solid business foundation, we will continue to explore growth opportunities in these areas.
4 – 5P A G E
2 0 1 2 C E N V E O L E A D + I N V E S T

100,000 CUSTOMERSCenveo has over 100,000 customers with no single client representing 3% or more of revenue. Such diversity has kept Cenveo a leader in the printing industry despite the uncertainty in the economy. From Fortune 50 corporations and publicly traded companies to non-profit organizations and small businesses, Cenveo caters to a wide variety of customers and their printing needs.
100,000 BUSINESS CARDSFROM CUSTOMERS
2 0 1 2 C E N V E O L E A D + I N V E S T
6 –7P A G E
8 – 9P A G E
2 0 1 2 C E N V E O L E A D + I N V E S T
STRATEGIC + FOCUSEDWe have spent the past seven years strategically positioning Cenveo to be able to take advantage of growth areas in our industry. As we have diversified into the label and packaging arenas, we believe we are uniquely positioned to thrive in the future.

CREATING +VALUEWe are focused on creating value for all our stakeholders. From providing world class solutions for our customers, to using our cash flow to de-lever and invest in our operations, we are constantly striving to create value. 2013 will be a year where we continue to deliver for our customers every day in the areas of accountability, service and performance while at the same time we will look to unlock value for our shareholders.
10 – 11P A G E
2 0 1 2 C E N V E O L E A D + I N V E S T

12 – 13P A G E
2 0 1 2 C E N V E O L E A D + I N V E S T
LARGE + DIVERSIFIEDRepresenting over 100,000 customers, Cenveo serves nearly every industry including healthcare, technology, education, retail and financial services. With a broad spectrum of clientele, Cenveo is able to showcase its diverse printing platform in a variety of business markets.
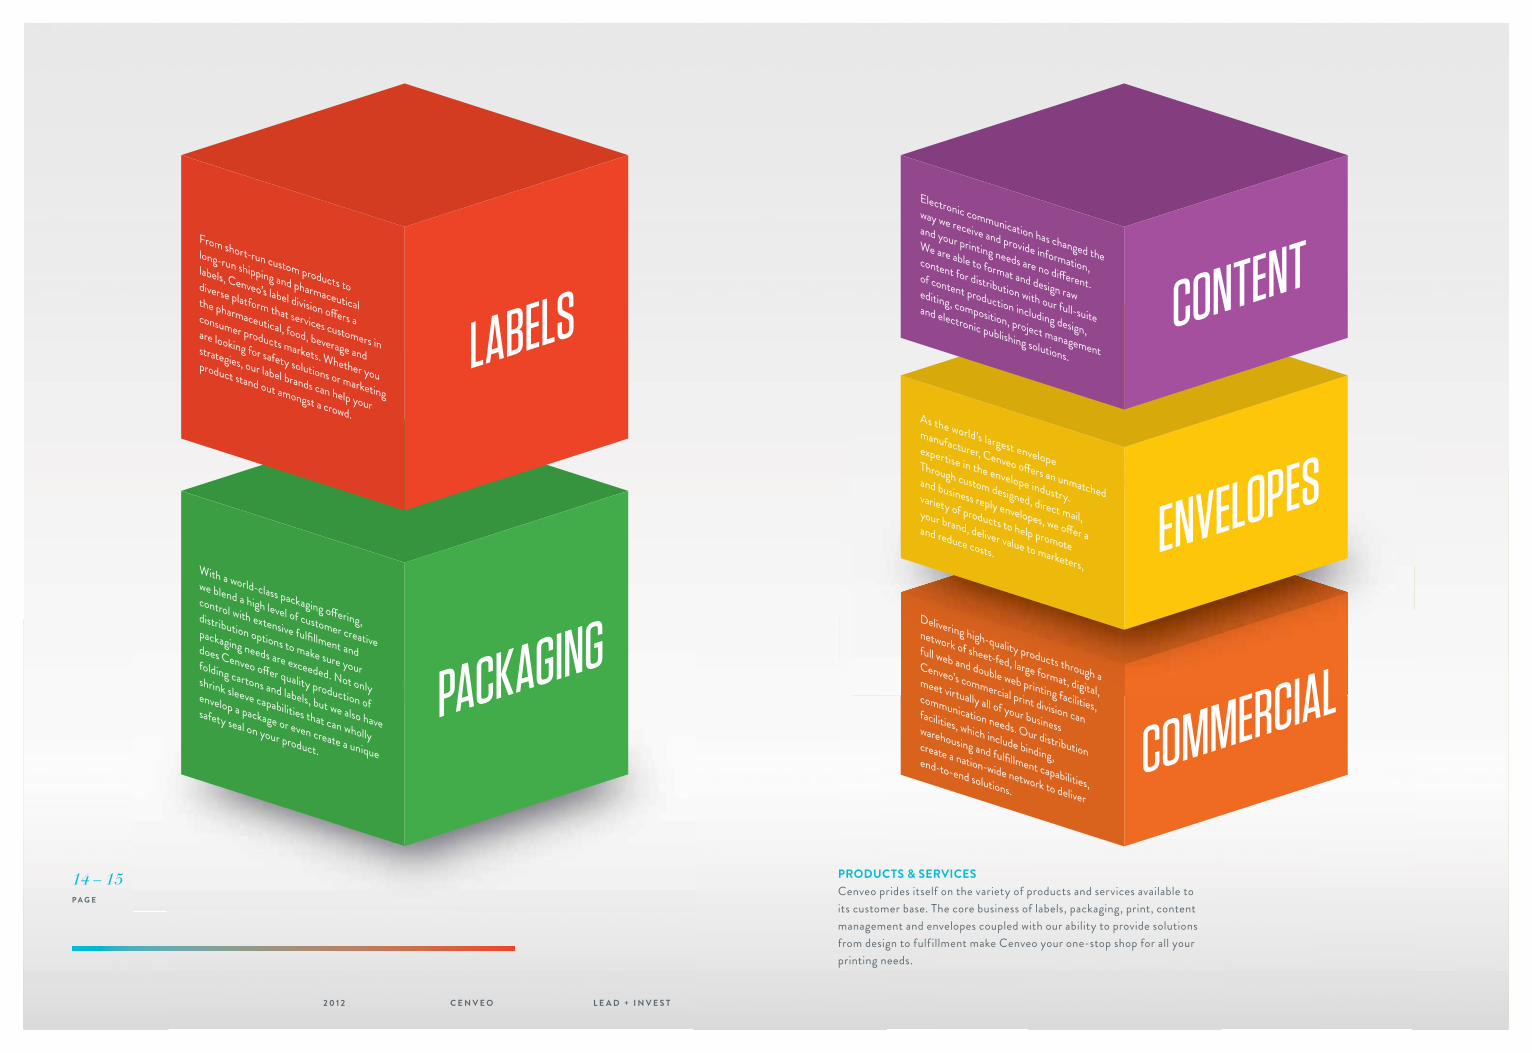
LABELS
PACKAGING
From short-run custom products to
long-run shipping and pharmaceutical
labels, Cenveo’s label division offers a
diverse platform that services customers in
the pharmaceutical, food, beverage and
consumer products markets. Whether you
are looking for safety solutions or marketing
strategies, our label brands can help your
product stand out amongst a crowd.
With a world-class packaging offering,
we blend a high level of customer creative
control with extensive fulfillment and
distribution options to make sure your
packaging needs are exceeded. Not only
does Cenveo offer quality production of
folding cartons and labels, but we also have
shrink sleeve capabilities that can wholly
envelop a package or even create a unique
safety seal on your product.
CONTENT
ENVELOPES
As the world’s largest envelope
manufacturer, Cenveo offers an unmatched
expertise in the envelope industry.
Through custom designed, direct mail,
and business reply envelopes, we offer a
variety of products to help promote
your brand, deliver value to marketers,
and reduce costs.
Electronic communication has changed the
way we receive and provide information,
and your printing needs are no different.
We are able to format and design raw
content for distribution with our full-suite
of content production including design,
editing, composition, project management
and electronic publishing solutions.
COMMERCIALDelivering high-quality products through a
network of sheet-fed, large format, digital,
full web and double web printing facilities,
Cenveo’s commercial print division can
meet virtually all of your business
communication needs. Our distribution
facilities, which include binding,
warehousing and fulfillment capabilities,
create a nation-wide network to deliver
end-to-end solutions.
PRODUCTS & SERVICESCenveo prides itself on the variety of products and services available to
its customer base. The core business of labels, packaging, print, content
management and envelopes coupled with our ability to provide solutions
from design to fulf illment make Cenveo your one-stop shop for all your
printing needs.
14 – 15P A G E
2 0 1 2 C E N V E O L E A D + I N V E S T


GEOGRAPHICREACH
DOMINICAN REPUBLIC
ASIA
COSTA RICA
LOCATIONSWith over 60 facilities strategically located in North America, Latin America, and Asia, Cenveo has a geographic diversity that mitigates the impact of region-specific downturns. Our global scope provides for a full range of production, fulf illment, distribution and program management services.
16 – 17P A G E
2 0 1 2 C E N V E O L E A D + I N V E S T

EXEXXPEPEP RTRTTR ISSI EE
TTRTRTRRRRTT UUSUSUSSSSUUSU TWTWTWTWWWWWWTTT OOOORORORRRROO TTTHTHHHHHHTT YYYYYYY
SERVICE +QUALITYQuality service and customer satisfaction are underlying principles of the Cenveo community. From providing the best quality paper stock to delivering a product on schedule, Cenveo puts forth a 100% effort to make sure our customer needs are met. We also recognize our responsibility to be stewards of a greener environment and have taken measures to apply a sustainability policy company-wide. At Cenveo, we stand behind our products and our service with pride and integrity.
18 – 19P A G E
2 0 1 2 C E N V E O L E A D + I N V E S T

1 Executive Committee
2 Nominating & Governance Committee
3 Compensation Committee
4 Audit Committee
LEONARD C. GREEN
Managing Partner
of
The Green Group
GERALD S. ARMSTRONG
Managing Director
of
Arena Capital
Partners, LLC
ROBERT G. BURTON, SR.
Chairman
and CEO
of
Cenveo
ROBERT B. OBERNIER
Chairman
and CEO
of
Horizon Paper
Company
DR. MARK J. GRIFFIN
Former Headmaster
and Founder
of
Eagle Hill School
C O M M I T T E E S
1 + 2 + 3 + 4
C O M M I T T E E S
1 + 2 + 3 + 4
C O M M I T T E E S
1 + 2 + 3 + 4
C O M M I T T E E S
1 + 2 + 3 + 4
C O M M I T T E E S
1
> > > >>
BOARDDIRECTORSof
2 0 1 2 C E N V E O L E A D + I N V E S T
20P A G E
The following table sets forth our selected financial and operating data for the years ended December 29, 2012, December 31, 2011, January 1,
2011, January 2, 2010 and January 3, 2009, which we refer to as the years ended 2012, 2011, 2010, 2009 and 2008, respectively.
The following consolidated selected financial data has been derived from, and should be read in conjunction with, the related consolidated
financial statements, either elsewhere in this report or in reports we have previously filed with the SEC.
Years Ended
(in thousands, except per share data) 2012 2011 2010 2009 2008Statement of Operations:Net sales $ 1,797,582 $ 1,909,187 $ 1,708,529 $ 1,614,596 $ 1,982,884
Restructuring, impairment and other charges 27,100 17,812 226,150(4) 68,034 399,066(6)
Operating income (loss) 112,196 117,760 (117,944)(4) 17,150 (241,361)(6)
Loss (gain) on early extinguishment of debt 12,487 (4,011) 9,592 (16,917) (14,642)
Loss from continuing operations (73,864)(1) (1,028) (197,698)(5) (49,036) (307,859)(7)
(Loss) income from discontinued operations, net of taxes (6,023)(2) (7,537
)(3) 11,321 18,097 9,832
Net loss (79,887)(1) (8,565) (186,377)(5) (30,939) (298,027)(7)
Income (loss) per share from continuing operations:
Basic (1.16) (0.02) (3.17) (0.86) (5.71)
Diluted (1.16) (0.02) (3.17) (0.86) (5.71)
Income (loss) per share from discontinued operations:
Basic (0.10) (0.12) 0.18 0.32 0.18
Diluted (0.10) (0.12) 0.18 0.32 0.18
Net income (loss) per share:
Basic (1.26) (0.14) (2.99) (0.54) (5.53)
Diluted (1.26) (0.14) (2.99) (0.54) (5.53)
Balance Sheet data: Total assets $ 1,200,555 $ 1,385,588 $ 1,406,911 $ 1,530,723 $ 1,552,114
Total long-term debt, including current maturities 1,183,618 1,246,343 1,294,003 1,233,917 1,306,355
(1) Includes $56.5 million valuation allowance related to deferred tax assets.(2) Includes $6.3 million loss on sale of discontinued operations, net of tax benefit of $2.6 million.(3) Includes $13.5 million goodwill impairment charges.(4) Includes $181.4 million pre-tax goodwill and other long-lived asset impairment charges.(5) Includes $157.3 million goodwill and other long-lived asset impairment charges, net of tax benefit of $24.1 million.(6) Includes $372.8 million pre-tax goodwill impairment charges.(7) Includes $330.7 million goodwill impairment charges, net of tax benefit of $42.1 million.
C E N V E O 2 0 1 2 | L E A D + I N V E S T - 2 1 -
SELECTED FINANCIAL DATA

This Management’s Discussion and Analysis of Financial Condition and Results of Operations, which we refer to as MD&A, of Cenveo, Inc.
and its subsidiaries, which we refer to as Cenveo, should be read in conjunction with our consolidated financial statements included in this Annual
Report. Certain statements in this report constitute “forward-looking” statements under the Private Securities Litigation Reform Act of 1995. In
addition, we or our representatives have made or continue to make forward-looking statements, orally or in writing, in other contexts. These forward-
looking statements generally can be identified by the use of terminology such as “may,” “will,” “expect,” “intend,” “estimate,” “anticipate,” “plan,”
“foresee,” “believe” or “continue” and similar expressions, or as other statements that do not relate solely to historical facts. These statements are
not guarantees of future performance and involve risks, uncertainties and assumptions that are difficult to predict or quantify. Management believes
these statements to be reasonable when made. However, actual outcomes and results may differ materially from what is expressed or forecasted in
these forward-looking statements. As a result, these statements speak only as of the date they were made. We undertake no obligation to publicly
update or revise any forward-looking statements, whether as a result of new information, future events or otherwise. In view of such uncertainties,
investors should not place undue reliance on our forward-looking statements.
Such forward-looking statements involve known and unknown risks, including, but not limited to, changes in general economic, business and
labor conditions.
Introduction and Executive OverviewWe are a diversified manufacturing company focused on print related products. Our broad portfolio of products includes commercial printing,
envelope converting, label manufacturing and specialty packaging. We operate a global network of strategically located manufacturing facilities,
serving a diverse base of over 100,000 customers.
Our business strategy has been and continues to be focused on pursuing strategic acquisitions, improving our cost structure, providing a diverse
quality product offering portfolio to our customers and maintaining reasonable levels of financial flexibility. We believe this strategy has allowed us
to diversify our revenue base, maintain our low cost producer focus and deliver quality product offerings to our customers.
2012 OverviewDuring 2012, our print and envelope operations have focused on completing the integration of EPG into our existing operations, mitigating
the decline in direct mail sales due to our financial institution customers decreased demand for customer solicitations and mitigating the decline in
our publisher services group revenue due to the decline in the circulation of journals and periodicals. We believe we are nearing the completion of
the integration of EPG into our existing operations and our efforts to mitigate sales declines have resulted in new sales opportunities that should
partly offset the decline in sales volumes attributable to direct mail and journals and periodicals.
During 2012, our label and packaging operations have focused on enhancing our e-commerce customer solutions, enhancing our long-run
labels business with a focus on prime label capabilities and aligning our operating platform subsequent to the divestiture of two product lines in
early 2012. We believe these efforts will provide greater sales opportunities for these businesses and provide focus on our growth business lines.
In addition to the operations focus noted above, we recently completed the refinancing and full repayment of our 2013 debt maturity. We
began the year with a planned approach to eliminate this debt maturity, and despite a number of challenges, we were able to complete this goal
in January 2013. For further discussion related to our capital structure and activities taken in 2012 to address our 2013 debt maturity, see the
Long-Term Debt section below.
2013 OutlookWe believe that the mild recovery the general economy experienced in 2012 will continue into 2013. We believe our efforts to reduce our
operating cost structure, which we began implementing at the beginning of the economic downturn, allowed us to mitigate significant impacts
to our operating performance and to our business over the past three years. The print-related industries are highly fragmented and extremely
competitive. We believe these factors combined with a slow general economic recovery will continue to impact our results of operations due to
over capacity and pricing pressures.
Our management focus for 2013 is on driving net sales through focused initiatives, investments in our e-commerce technology to support
expansion across our platform and reduction of our debt by maintaining or improving our cash flow.
Our sales focus will be on our top accounts across each of our businesses ensuring we meet our customer demands and work to expand our
relationship with them through cross-selling initiatives across our platform. We have implemented a customer relationship management tool within
our label and packaging segment and are looking to expand that into our other business lines. We began these initiatives as well as a few others in
2012 and experienced success within our envelope, label and packaging operations as result of their implementation. We believe these focus points,
along with our current customer experience, may allow us to experience modest sales growth despite operating in challenging industries and an
uncertain economy.
Our e-commerce platform is in its infancy and, with minimal investments over the past several years, was in need of enhancement. We began
small yet accurate enhancements of this platform in 2011. With a focused approach and small successes to date we have experienced positive
results. For example, our e-commerce sales within our label group grew 10% in 2012 as compared to 2011. In 2013, we are looking to expand our
investment, through both capital investments and incremental support headcount, and believe in the future of this platform with our label and
packaging operations as well as potential opportunities that may lie within our print and envelope operations.
Our deleveraging strategy is still a primary focus. We have repaid in excess of $110 million in outstanding debt over the past two years. We
believe that despite the industry and economic challenges we experience on a routine basis, we can maintain similar debt repayment trends for
the foreseeable future by managing our cash flow and investing strategically in our businesses. Along with debt reduction, we believe there is an
opportunity for us to reduce our average interest rate as we seek to pay down the unsecured loan we used to address our 2013 maturity and explore
opportunities for lower interest rates on our first lien debt. Lower cash interest rates will further improve our cash flow over the next several years
as we would not encounter another sizeable debt maturity until 2017.
Lastly, we will continue to monitor our cost structure as marketplace conditions warrant and explore consolidation opportunities that may
present themselves. We will also continue to focus on strategic investments, capital expenditure and acquisition, in areas that further strengthen
our manufacturing platform and product offerings while reviewing strategic alternatives for business lines we believe are underperforming or non-
strategic to our future operations.
AcquisitionsIn August of 2011, we completed the acquisition of Nesbitt. Nesbitt is a niche content management business that focuses on high end book
content development and project management offerings and was acquired to further enhance our content management operations. Additionally,
we expect that Nesbitt will enable us to provide additional cross-selling opportunities to our existing customer base.
In February of 2011, we acquired the assets of EPG. EPG manufactures and distributes envelope products for the billing, financial, direct mail
and office products markets. We believe EPG strengthened our envelope operations and has provided manufacturing efficiencies given EPG’s asset
base and geographic overlap of facilities between EPG and our pre-existing envelope operations.
In November of 2010, we completed the acquisition of Gilbreth. Gilbreth utilizes specialized printing technologies as a manufacturer and
marketer of full body shrink sleeves and tamper evident neck bands. The acquisition of Gilbreth expands our packaging product portfolio and allowed
us to internally produce product that we historically had to purchase from an outsourced partner. Additionally, we expect that Gilbreth will enable
us to provide additional cross-selling opportunities to our existing customer base.
In May of 2010, we completed the acquisition of Glyph, which we believe enhanced our content management operations.
In February of 2010, we completed the acquisition of Clixx. Clixx has provided our Canadian print operations with end-of-production
capabilities that we previously lacked.
Discontinued OperationsIn 2011, we began exploring our opportunities to divest certain non-strategic or underperforming businesses within our manufacturing
platform. As a result, in the fourth quarter of 2011, the financial results of our documents and forms business as well as our wide-format papers
business were accounted for as discontinued operations, which we refer to collectively as the Discontinued Operations, resulting in our historical
consolidated balance sheets, statement of operations and comprehensive income (loss) and statement of cash flows being reclassified to reflect
these discontinued operations separately from our continuing operations.
In February of 2012, we completed the sale of our Documents Group. Net cash proceeds were approximately $35.5 million. In January of
2012, we completed the sale of our wide-format papers business and received proceeds of approximately $4.7 million.
MANAGEMENT’S DISCUSSION AND ANALYSIS OF FINANCIAL CONDITION AND RESULTS OF OPERATIONS
- 2 2 - C E N V E O 2 0 1 2 | L E A D + I N V E S T C E N V E O 2 0 1 2 | L E A D + I N V E S T - 2 3 -
MANAGEMENT’S DISCUSSION AND ANALYSIS OF FINANCIAL CONDITION AND RESULTS OF OPERATIONS(CONTINUED)
Reportable Segments
In the first quarter of 2012, we realigned our reportable segments as a result of the sale of the Discontinued Operations combined with
the realignment of management responsibilities. Previously, we reported our segments as envelopes, forms and labels and commercial printing.
Beginning January 1, 2012, we realigned our segments into two complementary reportable segments: the print and envelope segment and the
label and packaging segment.
Deferred Taxes
In the fourth quarter of 2012, we recorded a non-cash valuation allowance charge of $56.5 million related to the realizability of our net
deferred tax assets due to excess capacity and pricing pressure combined with the recent decline in net sales from our print and envelope segment
during 2012.
Goodwill and Intangible Asset Impairments
In 2012 we did not record any goodwill and intangible asset impairment charges.
In the fourth quarter of 2011, we recorded non-cash goodwill impairment charges of $13.5 million related to the Discontinued Operations.
These charges were due to our carrying value of the assets, including goodwill and intangible assets, of the Discontinued Operations being in excess
of the fair value we received from divesting these businesses.
During the third quarter of 2010, given the continued economic uncertainty that remained in the United States and global economies at the
time and revisions to our forecasted operating results within our print and envelope segment, we believed that there were sufficient indicators that
would require us to perform an interim goodwill and long-lived asset impairment analysis as of October 2, 2010.
As a result of our goodwill and long-lived asset impairment analysis, we recorded non-cash impairment charges of $132.2 million related to
goodwill and $49.2 million related to other long-lived assets, of which $22.0 million related to an indefinite lived tradename and $27.2 million
related to customer relationships. We believe that these charges primarily resulted from reductions in the estimated fair value of this reporting unit
due to: (i) higher discount rates applied to lower estimated future cash flows as compared to our prior year analysis, and (ii) continued economic
uncertainty, which has increased customer cost awareness resulting in continued price pressures, lower page counts, and a shift from historical web
and sheet-fed print products to lower cost digital print products.
Consolidated Operating Results
This MD&A includes an overview of our consolidated results of operations for 2012, 2011 and 2010 followed by a discussion of the results of
operations of each of our reportable segments for the same periods. Our results for the year ended 2011 include the operating results of EPG and
Nesbitt for less than a full twelve months. Our results of operations for the year ended 2010 include the operating results of Gilbreth, Clixx and
Glyph, subsequent to their respective acquisition dates.
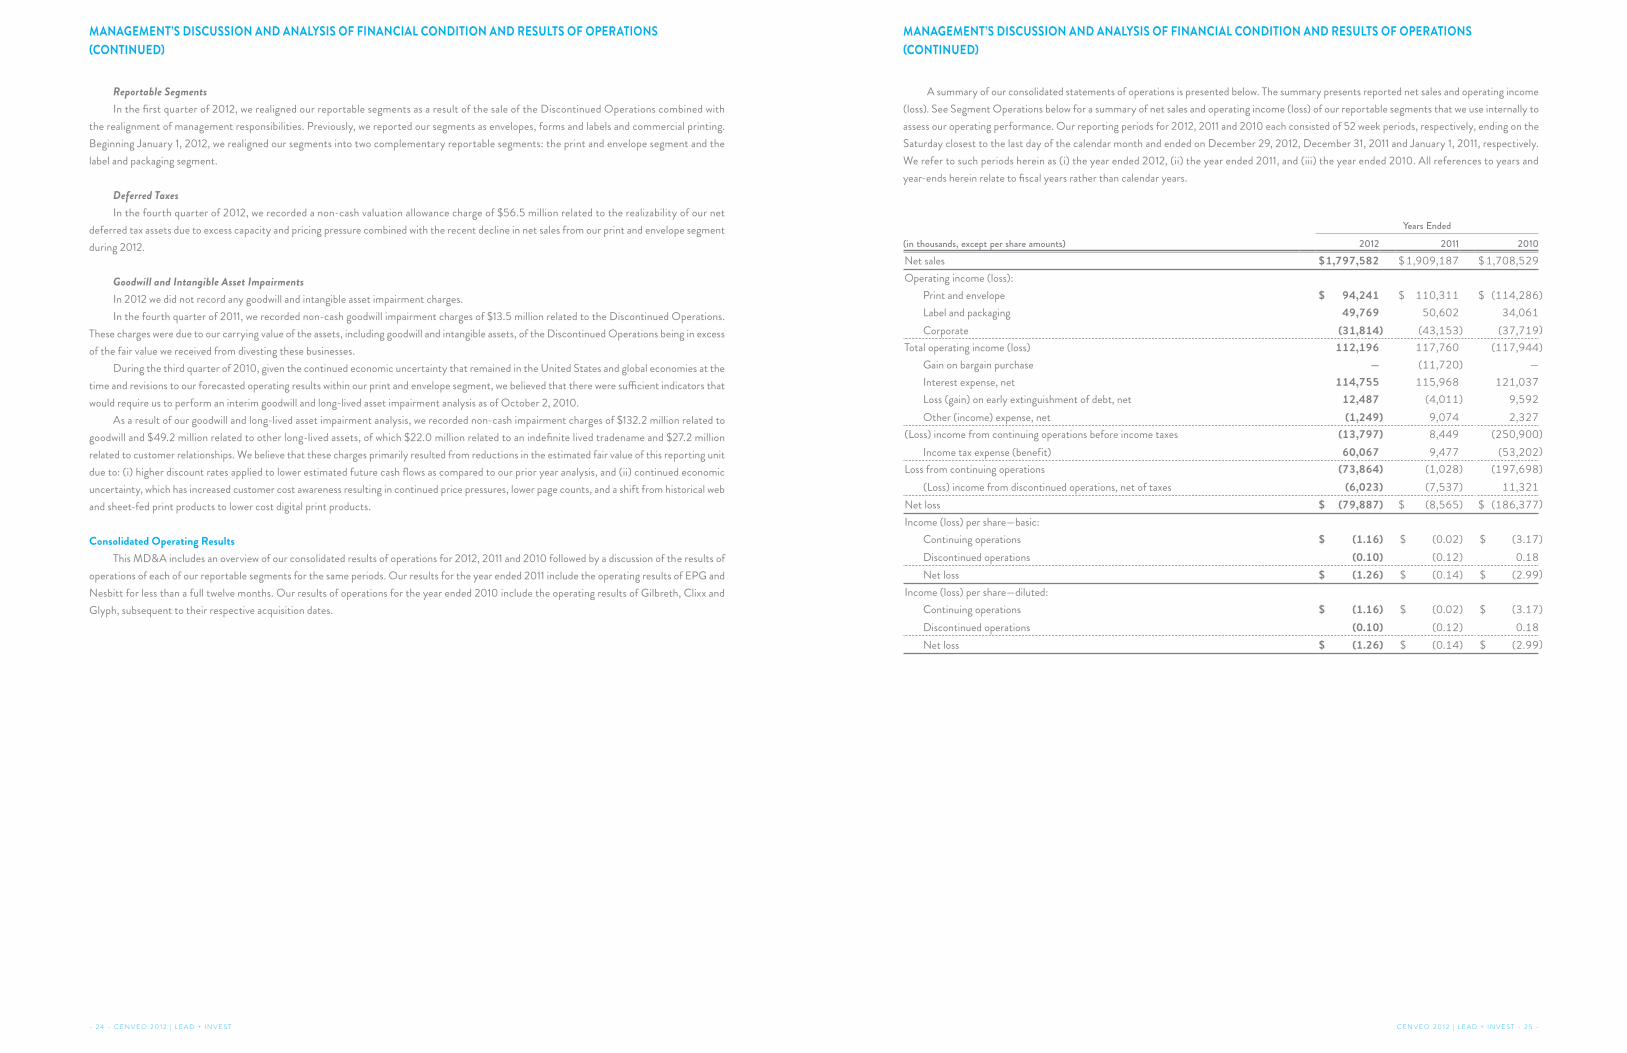
A summary of our consolidated statements of operations is presented below. The summary presents reported net sales and operating income
(loss). See Segment Operations below for a summary of net sales and operating income (loss) of our reportable segments that we use internally to
assess our operating performance. Our reporting periods for 2012, 2011 and 2010 each consisted of 52 week periods, respectively, ending on the
Saturday closest to the last day of the calendar month and ended on December 29, 2012, December 31, 2011 and January 1, 2011, respectively.
We refer to such periods herein as (i) the year ended 2012, (ii) the year ended 2011, and (iii) the year ended 2010. All references to years and
year-ends herein relate to fiscal years rather than calendar years.
Years Ended
(in thousands, except per share amounts) 2012 2011 2010Net sales $1,797,582 $ 1,909,187 $ 1,708,529
Operating income (loss):
Print and envelope $ 94,241 $ 110,311 $ (114,286)
Label and packaging 49,769 50,602 34,061
Corporate (31,814) (43,153) (37,719)
Total operating income (loss) 112,196 117,760 (117,944)
Gain on bargain purchase — (11,720) —
Interest expense, net 114,755 115,968 121,037
Loss (gain) on early extinguishment of debt, net 12,487 (4,011) 9,592
Other (income) expense, net (1,249) 9,074 2,327
(Loss) income from continuing operations before income taxes (13,797) 8,449 (250,900)
Income tax expense (benefit) 60,067 9,477 (53,202)
Loss from continuing operations (73,864) (1,028) (197,698)
(Loss) income from discontinued operations, net of taxes (6,023) (7,537) 11,321
Net loss $ (79,887) $ (8,565) $ (186,377)
Income (loss) per share—basic:
Continuing operations $ (1.16) $ (0.02) $ (3.17)
Discontinued operations (0.10) (0.12) 0.18
Net loss $ (1.26) $ (0.14) $ (2.99)
Income (loss) per share—diluted:
Continuing operations $ (1.16) $ (0.02) $ (3.17)
Discontinued operations (0.10) (0.12) 0.18
Net loss $ (1.26) $ (0.14) $ (2.99)
- 2 4 - C E N V E O 2 0 1 2 | L E A D + I N V E S T C E N V E O 2 0 1 2 | L E A D + I N V E S T - 2 5 -
MANAGEMENT’S DISCUSSION AND ANALYSIS OF FINANCIAL CONDITION AND RESULTS OF OPERATIONS
(CONTINUED)
MANAGEMENT’S DISCUSSION AND ANALYSIS OF FINANCIAL CONDITION AND RESULTS OF OPERATIONS
(CONTINUED)
Net Sales
Net sales decreased $111.6 million, or 5.8%, in 2012, as compared to 2011, due to lower sales from our print and envelope segment of
$105.5 million and our label and packaging segment of $6.1 million. See Segment Operations below for a detailed discussion of the primary factors
affecting the change in our net sales by reportable segment.
Net sales increased $200.7 million, or 11.7%, in 2011, as compared to 2010, due to higher sales from our print and envelope segment of
$195.3 million and our label and packaging segment of $5.4 million. See Segment Operations below for a detailed discussion of the primary factors
affecting the change in our net sales by reportable segment.
Operating Income
Operating income decreased $5.6 million, or 4.7%, in 2012, as compared to 2011. This decrease was primarily due to decreases from (i) our
print and envelope segment of $16.1 million and (ii) our label and packaging segment of $0.8 million, partially offset by lower corporate expenses
of $11.3 million. See Segment Operations below for a more detailed discussion of the primary factors for the changes in operating income by
reportable segment.
Operating income in 2011 increased $235.7 million or 199.8% in 2011, as compared to 2010. This increase was primarily due to increases from
(i) our print and envelope segment of $224.6 million and (ii) our label and packaging segment of $16.5 million, partially offset by higher corporate
expenses of $5.4 million. See Segment Operations below for a more detailed discussion of the primary factors for the changes in operating income
by reportable segment.
Gain on Bargain Purchase
During 2011, in connection with the acquisition of EPG, we recognized a bargain purchase gain of approximately $11.7 million.
Interest Expense
Interest expense decreased $1.2 million to $114.8 million in 2012, as compared to $116.0 million in 2011. The decrease was primarily due to the
lower average outstanding debt balances primarily as a result of debt repayments using cash flow from operations and the proceeds from the sale
of the Discontinued Operations, offset in part by higher interest expense as a result of our refinancing activities in 2012. Interest expense in 2012
reflected average outstanding debt of approximately $1.3 billion and a weighted average interest rate of 8.2%, as compared to average outstanding
debt of $1.4 billion and a weighted average interest rate of 8.0% in 2011. We expect interest expense in 2013 will be higher than 2012 primarily due
to non-cash interest charges associated with the amortization of deferred debt issuance costs that we capitalized in 2012.
Interest expense decreased $5.1 million to $116.0 million in 2011, from $121.0 million in 2010. The decrease was primarily due to the
redemption of higher cost interest rate swaps, partially offset by higher average outstanding debt balances primarily resulting from the EPG
acquisition. Interest expense in 2011 reflected average outstanding debt of approximately $1.4 billion and a weighted average interest rate of 8.0%,
as compared to average outstanding debt of $1.3 billion and a weighted average interest rate of 8.7% in 2010.
Loss (Gain) on Early Extinguishment of Debt
During 2012, in connection with refinancing activities, we incurred a loss on early extinguishment of debt of $14.9 million, of which $11.7 million
related to tender and consent fees paid to consenting lenders and $3.2 million related to the write-off of previously unamortized debt issuance
costs. The loss on early extinguishment was partially offset by the gains on early extinguishment of debt of $2.4 million related to the repurchase
of $217.1 million of our 7.875% senior subordinated notes, due 2013, which we refer to as the 7.875% Notes, $170.0 million of our 10.5% senior
notes due 2016, which we refer to as the 10.5% Notes, and $25.4 million of our 8.375% senior subordinated notes due 2014, which we refer to as
the 8.375% Notes, plus in each case accrued and unpaid interest thereon.
During 2011, we repurchased $11.4 million of our 7.875% Notes for $9.0 million plus accrued and unpaid interest and $7.0 million of our
8.375% Notes, for $5.4 million plus accrued and unpaid interest. As a result, we recognized gains on early extinguishment of debt of $4.0 million.
During 2010, in connection with our refinancing activities, we incurred a loss on early extinguishment of debt of $9.6 million of which
$6.3 million related to fees paid to consenting lenders and $3.3 million related to the write-off of previously unamortized debt issuance costs.
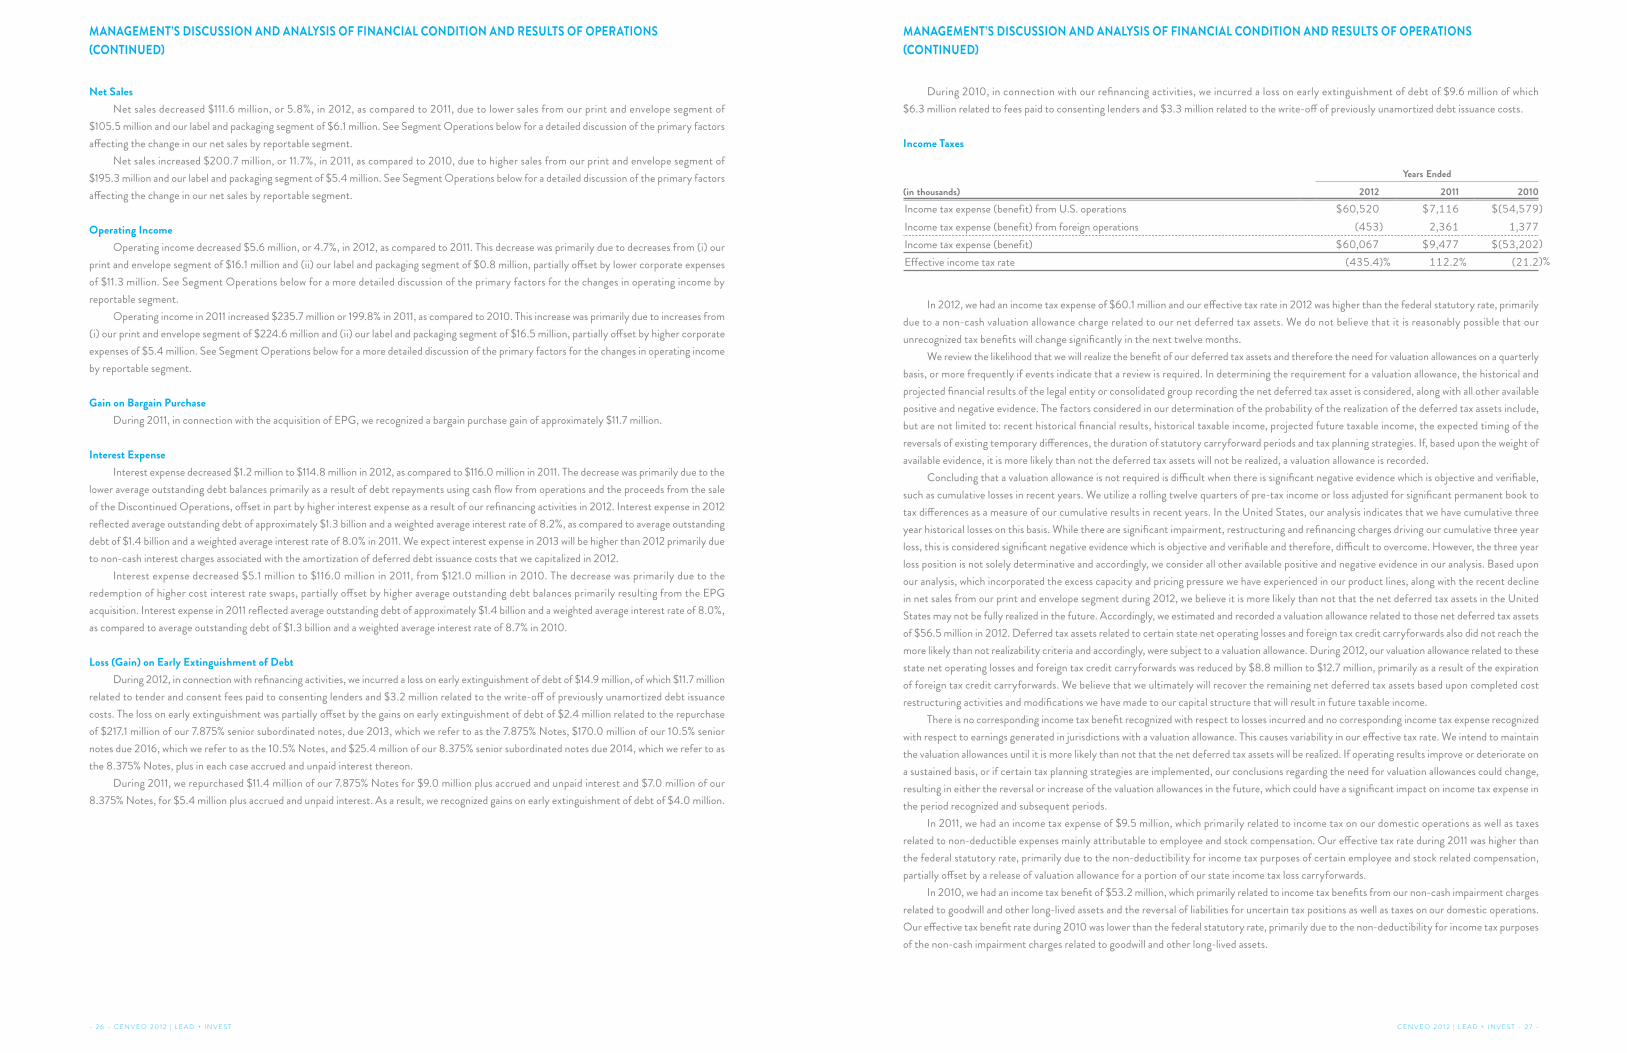
Income Taxes
Years Ended
(in thousands) 2012 2011 2010
Income tax expense (benefit) from U.S. operations $60,520 $7,116 $(54,579)
Income tax expense (benefit) from foreign operations (453) 2,361 1,377
Income tax expense (benefit) $60,067 $9,477 $(53,202)
Effective income tax rate (435.4)% 112.2% (21.2)%
In 2012, we had an income tax expense of $60.1 million and our effective tax rate in 2012 was higher than the federal statutory rate, primarily
due to a non-cash valuation allowance charge related to our net deferred tax assets. We do not believe that it is reasonably possible that our
unrecognized tax benefits will change significantly in the next twelve months.
We review the likelihood that we will realize the benefit of our deferred tax assets and therefore the need for valuation allowances on a quarterly
basis, or more frequently if events indicate that a review is required. In determining the requirement for a valuation allowance, the historical and
projected financial results of the legal entity or consolidated group recording the net deferred tax asset is considered, along with all other available
positive and negative evidence. The factors considered in our determination of the probability of the realization of the deferred tax assets include,
but are not limited to: recent historical financial results, historical taxable income, projected future taxable income, the expected timing of the
reversals of existing temporary differences, the duration of statutory carryforward periods and tax planning strategies. If, based upon the weight of
available evidence, it is more likely than not the deferred tax assets will not be realized, a valuation allowance is recorded.
Concluding that a valuation allowance is not required is difficult when there is significant negative evidence which is objective and verifiable,
such as cumulative losses in recent years. We utilize a rolling twelve quarters of pre-tax income or loss adjusted for significant permanent book to
tax differences as a measure of our cumulative results in recent years. In the United States, our analysis indicates that we have cumulative three
year historical losses on this basis. While there are significant impairment, restructuring and refinancing charges driving our cumulative three year
loss, this is considered significant negative evidence which is objective and verifiable and therefore, difficult to overcome. However, the three year
loss position is not solely determinative and accordingly, we consider all other available positive and negative evidence in our analysis. Based upon
our analysis, which incorporated the excess capacity and pricing pressure we have experienced in our product lines, along with the recent decline
in net sales from our print and envelope segment during 2012, we believe it is more likely than not that the net deferred tax assets in the United
States may not be fully realized in the future. Accordingly, we estimated and recorded a valuation allowance related to those net deferred tax assets
of $56.5 million in 2012. Deferred tax assets related to certain state net operating losses and foreign tax credit carryforwards also did not reach the
more likely than not realizability criteria and accordingly, were subject to a valuation allowance. During 2012, our valuation allowance related to these
state net operating losses and foreign tax credit carryforwards was reduced by $8.8 million to $12.7 million, primarily as a result of the expiration
of foreign tax credit carryforwards. We believe that we ultimately will recover the remaining net deferred tax assets based upon completed cost
restructuring activities and modifications we have made to our capital structure that will result in future taxable income.
There is no corresponding income tax benefit recognized with respect to losses incurred and no corresponding income tax expense recognized
with respect to earnings generated in jurisdictions with a valuation allowance. This causes variability in our effective tax rate. We intend to maintain
the valuation allowances until it is more likely than not that the net deferred tax assets will be realized. If operating results improve or deteriorate on
a sustained basis, or if certain tax planning strategies are implemented, our conclusions regarding the need for valuation allowances could change,
resulting in either the reversal or increase of the valuation allowances in the future, which could have a significant impact on income tax expense in
the period recognized and subsequent periods.
In 2011, we had an income tax expense of $9.5 million, which primarily related to income tax on our domestic operations as well as taxes
related to non-deductible expenses mainly attributable to employee and stock compensation. Our effective tax rate during 2011 was higher than
the federal statutory rate, primarily due to the non-deductibility for income tax purposes of certain employee and stock related compensation,
partially offset by a release of valuation allowance for a portion of our state income tax loss carryforwards.
In 2010, we had an income tax benefit of $53.2 million, which primarily related to income tax benefits from our non-cash impairment charges
related to goodwill and other long-lived assets and the reversal of liabilities for uncertain tax positions as well as taxes on our domestic operations.
Our effective tax benefit rate during 2010 was lower than the federal statutory rate, primarily due to the non-deductibility for income tax purposes
of the non-cash impairment charges related to goodwill and other long-lived assets.
- 2 6 - C E N V E O 2 0 1 2 | L E A D + I N V E S T C E N V E O 2 0 1 2 | L E A D + I N V E S T - 2 7 -
MANAGEMENT’S DISCUSSION AND ANALYSIS OF FINANCIAL CONDITION AND RESULTS OF OPERATIONS
(CONTINUED)
MANAGEMENT’S DISCUSSION AND ANALYSIS OF FINANCIAL CONDITION AND RESULTS OF OPERATIONS
(CONTINUED)

(Loss) Income from Discontinued Operations, net of taxes
Discontinued Operations represents the results of operations, including tax effects of our Discontinued Operations. The results for 2012
include the loss on sale of our Discontinued Operations of $6.3 million, net of a tax benefit of $2.6 million. Income from discontinued operations
of $0.3 million, net of taxes of $0.1 million for 2012, include the reduction of a liability of $1.8 million, net of tax expense of $1.2 million, due to the
expiration of certain statutes of limitations related to the Supremex Income Fund, which we refer to as the Fund.
The results for 2011 include a non-cash goodwill impairment charge of $13.5 million, which had no tax effect as it was non-deductible goodwill.
There is no allocation of interest expense on our debt within our Discontinued Operations results.
Income from discontinued operations for 2010 also includes the reduction of our liability for uncertain tax positions of $4.4 million, net
of deferred tax assets of $1.6 million, as a result of the expiration of certain statute of limitations on uncertain tax positions related to the Fund.
Segment Operations
Our Chief Executive Officer monitors the performance of the ongoing operations of our two reportable segments. We assess performance
based on net sales and operating income.
Print and Envelope
Years Ended
(in thousands) 2012 2011 2010
Segment net sales $1,362,030 $1,467,558 $1,272,271
Segment operating income (loss) $ 94,241 $ 110,311 $ (114,286)
Operating income (loss) margin 6.9% 7.5% (9.0)%
Restructuring, impairment and other charges $ 25,045 $ 15,828 $ 213,348
Segment Net Sales
Segment net sales for our print and envelope segment decreased $105.5 million, or 7.2%, in 2012, as compared to 2011. Net sales for our
commercial printing operations declined $54.4 million, primarily due to: (i) lower sales volumes due to the closure and consolidation of a print
plant into our existing operations, customer product launches that occurred in 2011, but did not repeat in 2012, and continued declines in the
circulation of journals and periodicals, and (ii) lower sales due to price pressures that continue to exist within the print industry, offset slightly by
higher sales from the integration of Nesbitt into our operations, as Nesbitt was not included in our results for a full year in 2011. Net sales of our
envelope operations decreased $51.1 million primarily due to: (i) lower sales volumes from our direct mail customers, primarily financial institutions,
related to lower demand for customer solicitations, (ii) lower sales volumes due to the closure and consolidations of two envelope plants into our
existing operations, and (iii) lower sales volumes from our office product customers due to our decision to exit certain lower margin business. These
decreases in our envelope net sales were offset by: (i) higher sales from the integration of EPG into our operations, including the impact of work
transitioned from our existing operations to EPG and vice versa, as EPG was not included in our results for a full year in 2011, and (ii) higher sales
due to our ability to pass along material price increases to our customers.
Segment net sales for our print and envelope segment increased $195.3 million, or 15.3%, in 2011, as compared to 2010. Net sales of our
envelope operations increased $222.4 million primarily due to: (i) higher sales generated from the integration of EPG acquisition into our operations
including the impact of work transitioned from our existing operations to EPG and vice versa, as EPG was not included in our results in 2010, and
(ii) higher sales from price and product mix changes primarily from our financial institution envelope customers increasing their demand for direct
mail products, as well as our ability to pass along price increases to our envelope customers. These increases were offset in part by: (i) product mix
changes from our higher cost envelope office product offerings to our lower cost envelope office product offerings, and (ii) lower sales volumes
primarily due to our decision to exit certain low margin envelope businesses. Net sales for our commercial printing operations declined $27.1 million,
primarily due to: (i) lower sales from pricing and product mix changes in our scientific, technical and medical journals, which we refer to as our STM
journals business, and (ii) lower sales volumes from our digital business primarily due to lower customer demand and our STM journal business due
to continued declines in the circulation of journal and periodicals. These decreases are offset in part by: (i) higher sales from the integration of our
2010 acquisitions of Glyph and Clixx, as they were not included in our operations for a full year in 2010, and (ii) higher sales from the integration
of our acquisition of Nesbitt, as Nesbitt was not included in our results in 2010.
Segment Operating Income
Segment operating income for our print and envelope segment decreased $16.1 million, or 14.6%, in 2012, as compared to 2011. This decrease
was primarily due to: (i) lower gross margins of $23.9 million, primarily due to increased pension expense, lower byproduct recoveries and continued
price pressures, and (ii) higher restructuring, impairment and other charges of $9.2 million, primarily due to the closure and consolidations of a
print plant and two envelope plants into our existing operations. These decreases were offset in part by lower selling, general and administrative
expenses of $17.2 million, primarily due to lower commission expense and a lower cost structure due to the integration of EPG into our existing
envelope operations.
Segment operating income for our print and envelope segment increased $224.6 million, or 196.5%, in 2011, as compared to 2010. This
increase was primarily due to: (i) the non-cash goodwill and other long-lived assets impairment charges of $181.4 million recorded in 2010, (ii)
increased gross margins of $31.8 million primarily due to gross margins generated from our 2011 acquisitions of EPG and Nesbitt as they were
not included in our results in 2010 and our 2010 acquisitions of Glyph and Clixx, as they were not included in our results for the full year in 2010,
(iii) lower fixed costs resulting from three envelope plant closures in 2011, (iv) lower restructuring and impairment charges, excluding the 2010
non-cash goodwill and other long-lived impairment charges of $181.4 million, of $16.2 million, and (v) lower amortization expense of $0.7 million.
This was offset by higher selling, general and administrative expenses of $5.5 million from our 2011 acquisitions of EPG and Nesbitt as they were
not included in our results in 2010 and our 2010 acquisitions of Glyph and Clixx, as they were not included in our results for the full year in 2010,
partially offset by our cost savings initiatives.
Label and Packaging
Years Ended
(in thousands) 2012 2011 2010Segment net sales $ 435,552 $441,629 $436,258
Segment operating income $ 49,769 $ 50,602 $ 34,061
Operating income margin 11.4% 11.5% 7.8%
Restructuring, impairment and other charges $ 1,219 $ 1,345 $ 9,757
Segment Net Sales
Segment net sales for our label and packaging segment decreased $6.1 million, or 1.4%, in 2012, as compared to 2011. Net sales from our label
operations declined $3.1 million, primarily due to our decision to exit certain low margin business within our long-run label customer accounts, offset
in part by increased sales from our custom label business, primarily due to initiatives taken to enhance our e-commerce solution for our customers.
Net sales from our packaging operations declined $2.9 million, primarily due to lower sales resulting from our decision to exit certain low margin
customer accounts, offset in part by our ability to pass along material price increases to our customers.
Segment net sales for our label and packaging segment increased $5.4 million, or 1.2%, in 2011, as compared to 2010. Net sales of our
packaging operations increased $15.0 million primarily due to: (i) higher sales from our acquisition of Gilbreth, as Gilbreth was not included in
our results for a full year in 2010, and (ii) higher sales from pricing and product mix changes related to our specialty packaging operations. These
increases were offset by lower sales volumes relating to our decision to exit certain low margin business. Net sales of our labels operations declined
$9.6 million due to lower sales volumes, primarily from our long-run labels business due to lost sales from a plant closure in 2010 and our decision
to exit certain low margin labels businesses. This decrease was offset in part by our ability to pass along price increases to our short-run and long-
run labels customers.
Segment Operating Income
Segment operating income for our label and packaging segment decreased $0.8 million, or 1.7%, in 2012, as compared to 2011. This decrease
was due to lower gross margins of $2.6 million, primarily due to margin decline in our labels operations as a result of increased pension expense,
offset in part by increased margins in our packaging segment due to our decision to exit certain low margin customer accounts and our ability to
pass along material price increases to our customers and, offset in part by lower selling, general and administrative expenses of $1.5 million due to
cost savings initiatives executed in 2011.
Segment operating income for our label and packaging segment increased $16.5 million, or 48.6%, in 2011, as compared to 2010. This increase
was primarily due to: (i) increased gross margins of $10.4 million primarily due to our Gilbreth acquisition in 2010, as Gilbreth was not included in
- 2 8 - C E N V E O 2 0 1 2 | L E A D + I N V E S T C E N V E O 2 0 1 2 | L E A D + I N V E S T - 2 9 -
MANAGEMENT’S DISCUSSION AND ANALYSIS OF FINANCIAL CONDITION AND RESULTS OF OPERATIONS
(CONTINUED)
MANAGEMENT’S DISCUSSION AND ANALYSIS OF FINANCIAL CONDITION AND RESULTS OF OPERATIONS
(CONTINUED)
our results for the full year in 2010 and our lower cost structure as a result of cost savings initiatives taken in prior years, and (ii) lower restructuring
and impairment charges of $8.4 million. These increases were offset by: (i) higher selling, general and administrative expenses of $1.8 million,
resulting from our Gilbreth acquisition in 2010, as Gilbreth was not included in our results for the full year 2010 offset in part by our cost savings
initiatives in prior years, and (ii) higher amortization expense of $0.4 million.
Corporate Expenses
Corporate expenses include the costs of running our corporate headquarters. Corporate expenses were lower by $11.3 million, or 26.3%, in
2012, as compared to 2011, primarily due to lower compensation-related expenses. Corporate expenses were higher by $5.4 million, or 14.4%,
in 2011, as compared to 2010, primarily due to higher compensation-related expenses and lower vendor related discounts, offset in part by lower
restructuring and impairment charges from our cost savings initiatives.
Restructuring, Impairment and Other Charges
We currently have two active cost savings, restructuring and integration plans: (i) the plan related to the implementation of cost savings
initiatives along with the closure and consolidations of a print plant and an envelope plant, which we refer to as the 2012 Plan, and (ii) the plan
related to the integration of the EPG acquisition, which we refer to as the EPG Plan.
We currently have six residual cost savings, restructuring and integration plans: (i) the 2011 plan implemented by the print and envelope and
the label and packaging segments for further cost savings initiatives, which we refer to as the Other Restructuring Plans, (ii) the plans related to
the integration of the Nashua Corporation and Glyph acquisitions, collectively with the EPG Plan we refer to as the Acquisition Integration Plans,
and (iii) the 2009 Cost Savings and Restructuring Plan, the 2007 Cost Savings and Integration Plan and the 2005 Cost Savings and Restructuring
Plan, which collectively with the Other Restructuring Plans we refer to as the Residual Plans.
During 2012, we continued the integration of our EPG acquisition and announced the closure and consolidation of a manufacturing facility.
We also implemented the 2012 Plan, which included the announcement of the closure and consolidations of a print and an envelope plant into
our existing operations. Additionally, we began implementing a cost savings initiative, which primarily focused on our print and envelope segment
and our corporate expenses. This initiative was focused on consolidation of office and warehouse space and other overhead cost elimination plans,
including targeted headcount reductions of approximately 900 employees. We expect to be substantially complete with the 2012 Plan in 2013. We
are substantially complete with the Acquisition Integration Plans but may have additional closures or consolidation due to EPG. We have completed
the implementation of the Residual Plans.
2012. During 2012, as a result of our restructuring and integration activities, we incurred $27.1 million of restructuring, impairment and
other charges, which included $7.6 million of employee separation costs, asset impairments, net of $8.4 million, equipment moving expenses of
$1.1 million, lease termination expenses of $1.2 million, multi-employer pension withdrawal expenses of $5.1 million and building clean-up and other
expenses of $3.8 million.
2011. During 2011, as a result of our restructuring and integration activities, we incurred $17.8 million of restructuring, impairment and
other charges, which included $4.3 million of employee separation costs, asset impairments, net of $3.0 million, equipment moving expenses of
$2.5 million, lease termination expenses of $2.6 million, multi-employer pension withdrawal expenses of $1.4 million and building clean-up and
other expenses of $3.9 million.
2010. During 2010, as a result of our restructuring and integration activities, we incurred $44.7 million of restructuring and impairment
charges, which included $11.3 million of employee separation costs, asset impairments, net of $5.8 million, equipment moving expenses of
$3.1 million, lease termination expenses of $8.2 million, multi-employer pension withdrawal expenses of $8.8 million and building clean-up and
other expenses of $7.5 million.
Also during 2010, we recorded non-cash impairment charges of $132.2 million related to goodwill and $49.2 million related to other long-
lived assets, of which $22.0 million related to an indefinite lived tradename and $27.2 million related to customer relationships within our print
and envelope segment.
As of the year ended 2012, our total restructuring liability was $30.1 million, of which $7.5 million is included in other current liabilities and
$22.7 million, which is expected to be paid through 2032, is included in other liabilities in our consolidated balance sheet. Our multi-employer
pension withdrawal liabilities are $24.9 million of our remaining restructuring liabilities. We believe these liabilities represent our anticipated ultimate
withdrawal liabilities; however, we are exposed to significant risks and uncertainties arising from our participation in these multi-employer pension
plans. While it is not possible to quantify the potential impact of our future actions or the future actions of other participating employers from the
multi-employer pension plans for which we have exited, our anticipated ultimate withdrawal liabilities may be significantly impacted in the future
due to lower future contributions or increased withdrawals from other participating employers.
Liquidity and Capital Resources
Net Cash Provided By Operating Activities of Continuing Operations. Net cash provided by operating activities of continuing operations
was $56.8 million in 2012, which was primarily due to our net loss adjusted for non-cash items of $87.2 million, offset by a use of working capital
of $14.8 million and pension and post-retirement plan contributions, net of pension expense, of $12.3 million. The use of working capital primarily
resulted from: (i) a decrease in other working capital changes primarily due to the timing of interest payments on our outstanding debt and a
payment of a litigation settlement, and (ii) a decrease in accounts payable due to the timing of vendor payments. These uses of working capital were
offset in part by a decrease in accounts receivables due to the timing of collections from and sales to our customers.
Cash provided by operating activities is generally sufficient to meet daily disbursement needs. On days when our cash receipts exceed
disbursements, we reduce our revolving credit balance or place excess funds in conservative, short-term investments until there is an opportunity
to pay down debt. On days when our cash disbursements exceed cash receipts, we use invested cash balances and/or our revolving credit to fund
the difference. As a result, our daily revolving credit balance fluctuates depending on working capital needs. Regardless, at all times we believe we
have sufficient liquidity available to us to fund our cash needs.
Net cash provided by operating activities of continuing operations was $83.8 million in 2011, which was primarily due to our net income
adjusted for non-cash items of $96.5 million and a source of working capital of $10.9 million, offset by pension and post-retirement plan
contributions, net of pension expense, of $21.3 million. The source of working capital primarily resulted from: (i) an increase in accounts payable
due to the timing of vendor payments, and (ii) a decrease in our inventories primarily due to our inventory management initiative, which began
in the third quarter of 2011. These increases were offset in part by: (i) a decrease in other working capital changes primarily due to the timing of
customer related payments and the timing of interest payments on our outstanding debt, and (ii) an increase in our accounts receivables due to
the timing of collections from and sales to our customers.
Net Cash (Used in) Provided by Operating Activities of Discontinued Operations. Represents the net cash (used in) provided by the
Discontinued Operations operating activities.
Net Cash Used in Investing Activities of Continuing Operations. Net cash used in investing activities of continuing operations was
$8.3 million in 2012, primarily resulting from capital expenditures of $21.0 million and $0.6 million of cash consideration for the acquisition of
Nesbitt related to working capital settlement provisions. These uses of cash were offset in part by proceeds received from the sale of property,
plant and equipment of $8.0 million and proceeds received from the sale of assets of $5.7 million.
Our debt agreements limit capital expenditures to $40.0 million in 2013 plus any proceeds received from the sale of property, plant and
equipment and, if certain conditions are satisfied, any unused permitted amounts from 2012. We estimate that we will spend approximately
$25.0 million on capital expenditures in 2013, before considering proceeds from the sale of property, plant and equipment. Our primary sources
for our capital expenditures are cash generated from operations, proceeds from the sale of property, plant and equipment, and financing capacity
within our current debt arrangements. These sources of funding are consistent with prior years’ funding of our capital expenditures.
Net cash used in investing activities of continuing operations was $64.3 million in 2011, primarily resulting from $59.7 million of cash
consideration for the acquisitions of EPG and Nesbitt and capital expenditures of $15.7 million, offset in part by $11.1 million of proceeds from the
sale of property, plant and equipment.
Net Cash Provided by (Used in) Investing Activities of Discontinued Operations. Represents the net cash provided by (used in)
Discontinued Operations related to investing activities. In 2012, the cash provided by discontinued investing activities relates to net cash proceeds
of approximately $39.9 million from the sale of the Discontinued Operations.
Net Cash Used In Financing Activities of Continuing Operations. Net cash used in financing activities of continuing operations was
$91.8 million in 2012, primarily due to refinancing activities, including the issuance of $15 million and $65 million aggregate principal amounts of
additional term loans in December 2012 and June 2012, respectively, which we refer to as the Term Loan Add-On, the repayment of $48.0 million
of term loans primarily as a result of a required excess cash flow sweep and the open market repurchases and retirements of our 7.875% Notes,
10.5% Notes and 8.375% Notes, of approximately $98.6 million, $5.0 million and $2.0 million, respectively, for $96.4 million, $4.9 million and
$1.6 million, respectively, plus accrued and unpaid interest. These refinancing activities also included: (i) the repayment of $118.4 million of our
7.875% Notes, $165.0 million of our 10.5% Notes, and $23.2 million of our 8.375% Notes, (ii) the payment of $37.8 million of tender and consent
fees and related transaction costs, (iii) the issuance of our $225.0 million 11.5% senior notes due 2017, which we refer to as the 11.5% Notes, with
an original issuance discount of $8.3 million, (iv) the issuance of our $86.3 million 7% senior exchangeable notes due 2017, which we refer to as
the 7% Notes, and (v) repayment of other long term debt. These decreases were offset by (i) proceeds from the issuance of our 11.5% Notes, (ii)
proceeds from the issuance of our 7% Notes, and (iii) borrowings under our revolving credit facility.
Net cash used in financing activities was $48.1 million in 2011, primarily due to: (i) the repayment of $23.8 million of our Term Loan B due
2016, (ii) open market purchases of our 7.875% Notes and 8.375% Notes of $9.0 million and $5.4 million, respectively, (iii) repayment of other
long-term debt of $6.4 million, and (iv) fees paid to consenting lenders of $2.7 million related to the refinancing activities.
- 3 0 - C E N V E O 2 0 1 2 | L E A D + I N V E S T C E N V E O 2 0 1 2 | L E A D + I N V E S T - 3 1 -
MANAGEMENT’S DISCUSSION AND ANALYSIS OF FINANCIAL CONDITION AND RESULTS OF OPERATIONS
(CONTINUED)
MANAGEMENT’S DISCUSSION AND ANALYSIS OF FINANCIAL CONDITION AND RESULTS OF OPERATIONS
(CONTINUED)

Net Cash Used in Financing Activities of Discontinued Operations. Represents the net cash used in Discontinued Operations related to
financing activities. In 2012, the cash used in discontinued financing activities relates to fees paid by us to amend our 2010 Credit Facilities of
$1.7 million.
Contractual Obligations and Other Commitments. The following table details our significant contractual obligations and other commitments
as of the year ended (in thousands):
Payments DueLong-Term
Debt (1)Operating
Leases Other (2) Total2013 $ 114,015 $21,513 $36,975 $ 172,503
2014 144,595 15,519 8,076 168,190
2015 107,133 12,623 6,569 126,325
2016 477,403 9,025 5,761 492,189
2017 413,172 6,649 5,026 424,847
Thereafter 402,958 9,803 29,451 442,212
Total $1,659,276 $75,132 $91,858 $1,826,266
(1) Includes $463.7 million of estimated interest expense over the term of our long-term debt, with variable rate debt having an average interest rate of approximately 7.0%.
(2) Includes pension and other postretirement contributions of $16.5 million, anticipated worker’s compensation paid losses of $12.1 million, restructuring related liabilities of $55.8 million, including interest expense on lease terminations and multi-employer pension withdrawal liabilities, and purchase commitments for equipment of $7.2 million. Excluded from the table are $4.2 million income tax contingencies as we are unable to reasonably estimate the ultimate amount payable or timing of settlement.
Long-Term Debt. Our total outstanding long-term debt, including current maturities, was approximately $1.2 billion as of the year ended 2012,
a decrease of $62.7 million from 2011. This decrease was primarily due to cash flow from operations and proceeds from the sale of Discontinued
Operations, partially offset by fees paid for refinancing activities in 2012. As of the year ended 2012, approximately 66% of our debt outstanding
was subject to fixed interest rates. As of February 25, 2013, we had approximately $38.0 million borrowing availability under our $170 million
revolving credit facility due 2014, which we refer to as our 2010 Revolving Credit Facility. From time to time we may refinance our debt obligations
as business needs and market conditions warrant.
On December 17, 2012, we announced that we had initiated a mandatory and irrevocable redemption of all of the outstanding 7.875% Notes.
Pursuant to the terms of the indenture, governing the 7.875% Notes, the 7.875% Notes were redeemed on January 22, 2013, which we refer to
as the Redemption Date, at a redemption price of 100.0% of the unpaid principal amount of the 7.875% Notes, together with accrued and unpaid
interest thereon up to the Redemption Date.
On December 14, 2012, we issued $15 million aggregate principal amount of additional term loans, which we refer to as the $15 million Term
Loan Add-On, under our senior secured credit agreement, which includes the 2010 Revolving Credit Facility and a $380 million term loan due
2016, which we refer to as the Term Loan B (collectively with the Term Loan Add-On and 2010 Revolving Credit Facility, we refer to as the 2010
Credit Facilities). The $15 million Term Loan Add-On was issued at par. Concurrently with the $15 million Term Loan Add-On, we amended the
2010 Credit Facilities, which we refer to as the December 2012 Amendment, to allow us to incur up to $50 million of indebtedness under a new
unsecured term loan to be prepaid on substantially similar terms as our 7.875% Notes, subject to maintaining certain liquidity thresholds and
other customary conditions. We capitalized debt issuance costs of $2.7 million, which will be amortized over the remaining life of the 2010 Credit
Facilities. Consenting lenders received $2.6 million, which was capitalized and will be amortized over the remaining life of the 2010 Credit Facilities.
On June 8, 2012, we issued an additional term loan in the principal amount of $65 million, which we refer to as the $65 million Term Loan
Add-On, under our 2010 Credit Facilities. The $65 million Term Loan Add-On was issued at a discount of approximately $0.7 million. Concurrently
with the $65 million Term Loan Add-On, we amended the 2010 Credit Facilities, which we refer to as the Add-On Amendment, to allow for the
repurchase of up to $135 million of our 7.875% Notes, subject to maintaining certain liquidity thresholds and other customary conditions. We
capitalized debt issuance costs of $1.1 million, which will be amortized over the remaining life of the 2010 Credit Facilities. Consenting lenders
received $2.0 million for the Add-On Amendment, of which $1.8 million was capitalized and will be amortized over the remaining life of our 2010
Credit Facilities.
On March 28, 2012, we issued $225 million aggregate principal amount of our 11.5% Notes that were sold with registration rights to qualified
institutional buyers in accordance with Rule 144A under the Securities Act of 1933, and to certain non-U.S. persons in accordance with Regulation
S under the Securities Act of 1933. The 11.5% Notes were issued at a discount of approximately $8.3 million, of which $7.3 million remains
unamortized as of the year ended 2012. The 11.5% Notes were issued pursuant to an indenture, which we refer to as the 11.5% Indenture, among
us, certain subsidiary guarantors and U.S. Bank National Association, as trustee. We will pay interest on the 11.5% Notes semi-annually, in cash in
arrears, on May 15 and November 15 of each year, commencing May 15, 2012. The 11.5% Notes have no required principal payments prior to their
maturity on May 15, 2017. The 11.5% Notes are guaranteed on a senior unsecured basis by us and substantially all of our existing and future North
American subsidiaries. As such, the 11.5% Notes rank pari passu with all of our existing and future senior debt and senior to any of our subordinated
debt. We may redeem the 11.5% Notes, in whole or in part, on or after May 15, 2015, at redemption prices ranging from 100.0% to 105.75%, plus
accrued and unpaid interest. In addition, at any time prior to May 15, 2015, we may redeem up to 35% of the aggregate principal amount of the notes
originally issued with the net cash proceeds of certain public equity offerings, at a redemption price of 111.50% plus accrued and unpaid interest. We
may also redeem some or all of the 11.5% Notes before May 15, 2015 at a redemption price of 100% of the principal amount, plus accrued and unpaid
interest, if any, to the redemption date, plus a “make whole” premium. Each holder of the 11.5% Notes has the right to require us to repurchase such
holder’s notes at a purchase price of 101% of the principal amount thereof, plus accrued and unpaid interest thereon, upon the occurrence of certain
events specified in the indenture that constitute a change of control. The 11.5% Indenture contains a number of covenants that, among other things,
restrict, subject to certain exceptions, our ability and the ability of our subsidiaries, to incur or guarantee additional indebtedness, make restricted
payments (including paying dividends on, redeeming or repurchasing our capital stock), permit restricted subsidiaries to pay dividends or make
other distributions or payments, dispose of assets, make investments, grant liens on assets, merge or consolidate or transfer certain assets, and
enter into transactions with affiliates. The 11.5% Indenture also contains certain customary affirmative covenants. In order to fulfill our registration
rights obligations, on May 10, 2012, we launched a registered exchange offer, which we refer to as the Exchange Offer, to exchange any and all of
our unregistered 11.5% Notes for publicly tradable notes having substantially identical terms, except for the elimination of some transfer restrictions,
registration rights and additional interest payments relating to the outstanding notes. The Exchange Offer expired on June 18, 2012.
Concurrently with the issuance of the 11.5% Notes, we issued $86.3 million aggregate principal amount of our 7% Notes that were sold to
qualified institutional buyers in accordance with Rule 144A under the Securities Act of 1933. The 7% Notes were issued pursuant to an indenture,
which we refer to as the 7% Indenture, among us, certain subsidiary guarantors and U.S. Bank National Association, as trustee. We will pay interest
on the 7% Notes semi-annually, in cash in arrears, on May 15 and November 15 of each year, commencing November 15, 2012. The 7% Notes
have no required principal payments prior to their maturity on May 15, 2017. The 7% Notes are guaranteed on a senior unsecured basis by us and
substantially all of our existing and future North American subsidiaries. As such, the 7% Notes rank pari passu with all of our existing and future
senior debt and senior to any of our subordinated debt. We may not redeem the notes at our option. Upon a fundamental change, as defined in the
7% Indenture, each holder of the 7% Notes may require us to repurchase all or a portion of such holder’s notes for cash at a repurchase price equal
to 100% of the principal amount of the notes to be repurchased, plus any accrued and unpaid interest to, but excluding, the fundamental change
repurchase date, as defined in the 7% Indenture. The 7% Indenture does not contain any financial covenants or any restrictions, among other things,
on the payment of dividends, the incurrence of other indebtedness, or the issuance or repurchase of securities by us. The 7% Indenture does not
contain any covenants or other provisions to protect holders of the notes in the event of a highly leveraged transaction or a change of control,
except to the extent described in the 7% Indenture.
The 7% Notes are exchangeable at any time prior to the close of business on the business day immediately preceding the maturity date for
shares of our common stock at an exchange rate of 241.5167 shares per $1,000 principal amount of 7% Notes, which is equal to an exchange price
of approximately $4.14 per share, subject to adjustment under certain specified circumstances. This represents a premium of 22.5% above the last
reported sale price of our common stock on the New York Stock Exchange on Thursday, March 22, 2012, which was $3.38 per share. If a holder
elects to exchange notes in connection with a make-whole fundamental change, as described in the 7% Indenture, such holder may also be entitled
to receive a make-whole premium upon exchange in certain circumstances.
Net proceeds of the 11.5% Notes and 7% Notes together with borrowings under our 2010 Revolving Credit Facility were used to fund the
cash tender offers for any and all of our 8.375% Notes and 10.5% Notes, plus $45 million aggregate principal amount of our 7.875% Notes and to
repurchase an additional $73.4 million of 7.875% Notes through open market, negotiated purchases to refinance such indebtedness, and to pay
related fees and expenses. In connection with the issuance of the 11.5% Notes and the 7% Notes, we capitalized debt issuance costs of $6.0 million
and $3.0 million, respectively, all of which will be amortized over the life of the 11.5% Notes and the 7% Notes.
Effective March 5, 2012, we increased our borrowing capacity under the 2010 Revolving Credit Facility to $170 million from $150 million as
a result of receiving an additional commitment, as permitted under the 2010 Credit Facilities. In connection with this increase, we capitalized debt
issuance costs of $1.0 million, which will be amortized over the life of the 2010 Revolving Credit Facility. On March 9, 2012, we repaid $34.7 million
of Term Loan B as part of our required excess cash flow pre-payment.
On February 3, 2012, we amended our 2010 Credit Facilities, which we refer to as the 2012 Amendment, to increase our restricted
dispositions basket in connection with the sale of the Documents Group. The 2012 Amendment required that 25% of the net proceeds of such
sale be used to repay the Term Loan B and required that the remaining amount be used to reinvest in our business or refinance certain existing
debt. On February 14, 2012, we repaid $9.5 million of the Term Loan B in connection with this provision. The 2012 Amendment required us to
prepay unsecured debt, second lien debt and/or the loans under the 2010 Credit Facilities within 360 days after the effective date of the 2012
- 3 2 - C E N V E O 2 0 1 2 | L E A D + I N V E S T C E N V E O 2 0 1 2 | L E A D + I N V E S T - 3 3 -
MANAGEMENT’S DISCUSSION AND ANALYSIS OF FINANCIAL CONDITION AND RESULTS OF OPERATIONS
(CONTINUED)
MANAGEMENT’S DISCUSSION AND ANALYSIS OF FINANCIAL CONDITION AND RESULTS OF OPERATIONS
(CONTINUED)
Amendment, in an amount equal to 75% of the net proceeds. In connection with the 2012 Amendment we paid $1.7 million to consenting lenders
and related fees.
Note RepurchasesIn 2012, we purchased in the open market approximately $98.6 million of our 7.875% Notes and retired them for $96.4 million plus accrued
and unpaid interest. In connection with the retirement, we recorded a gain on early extinguishment of debt of $1.9 million, which includes the write-
off of $0.3 million of unamortized debt issuance costs. In 2012, we purchased in the open market approximately $5.0 million and $2.0 million of
our 10.5% Notes and 8.375% Notes, respectively, and retired them for $4.9 million and $1.6 million, respectively, plus accrued and unpaid interest.
2010 Credit Facilities and Debt ComplianceThe 2010 Credit Facilities contain certain restrictions that, among other things and with certain exceptions, limit our ability to incur additional
indebtedness, prepay other debt, transfer assets outside of Cenveo, pay dividends or repurchase shares of our common stock. The 2010 Credit
Facilities also contain customary financial covenants, including a maximum consolidated leverage covenant, a maximum consolidated first lien
leverage covenant and a minimum consolidated interest coverage covenant.
Additionally, pursuant to the December 2012 Amendment, the interest rate margin for all loans under the 2010 Credit Facilities increased
to (i) 5.50% from 5.125% per annum for London Interbank Offered Rate (“LIBOR”) based loans and (ii) 4.50% from 4.125% per annum for prime
rate loans. A LIBOR floor of 1.50% for the 2010 Revolving Credit Facility was also established. The December 2012 Amendment also modified
the financial covenants, including (i) increasing the maximum consolidated first lien leverage ratio covenant to 2.65x with a step-down to 2.40x
in the first quarter of 2014 and to 2.25x in the first quarter of 2015, (ii) delaying a step down in the maximum consolidated leverage ratio from
6.50x to 6.25x until the fourth quarter of 2013 and from 6.25x to 6.0x until the third quarter of 2014, and (iii) delaying a step-up in the minimum
consolidated interest coverage ratio from 1.60x to 1.75x until the first quarter of 2014.
The obligations under the 2010 Credit Facilities are guaranteed by us and each existing and future direct and indirect domestic subsidiary of
Cenveo. The 2010 Credit Facilities are secured by a first priority perfected security interest in substantially all assets of Cenveo and our domestic
subsidiaries. As the 2010 Credit Facilities have senior secured and first priority lien position in our capital structure and the most restrictive
covenants, then provided we are in compliance with the 2010 Credit Facilities, we would also be in compliance, in most circumstances, with our
debt incurrence tests within all of our debt indentures.
Any default under the 2010 Credit Facilities would prevent us from borrowing additional amounts and could cause the indebtedness
outstanding under the 2010 Credit Facilities and, by reason of cross-acceleration or cross-default provisions, all of the aforementioned notes and
any other indebtedness we may then have, to become immediately due and payable.
As of the year ended 2012, we were in compliance with all debt agreement covenants. We anticipate being in compliance with all debt
agreement covenants through our fiscal year ending 2013.
Subsequent EventsOn January 18, 2013, we entered into an unsecured credit agreement, which we refer to as the Unsecured Credit Agreement, with Macquarie
US Trading LLC, as administrative agent, whom we refer to as the Administrative Agent, and the lenders named therein, which provides for an
unsecured $50 million aggregate principal amount term loan due March 31, 2017, which we refer to as the Unsecured Term Loan. In connection with
the Unsecured Credit Agreement we capitalized debt issuance costs of $1.5 million in 2012. In connection with the Unsecured Credit Agreement,
all of our domestic subsidiaries (other than Cenveo Corporation) as guarantors, entered into a guaranty agreement, dated as of January 18, 2013,
which we refer to as the Guaranty, in favor of the Administrative Agent. Proceeds from the Unsecured Term Loan together with borrowings on our
2010 Revolving Credit Facility were used to redeem, satisfy and discharge in full the 7.875% Notes, and to pay certain fees and expenses incurred
in connection with the Unsecured Credit Agreement and the redemption, satisfaction and discharge of the 7.875% Notes. On January 22, 2013,
U.S. Bank National Association, the trustee for the 7.875% Notes officially canceled the 7.875% Notes.
The Unsecured Term Loan bears interest at a rate of 15% per annum, payable quarterly in arrears on the 25th day of each February, May,
August and November prior to the maturity of the Unsecured Term Loan and on the maturity date of the Unsecured Term Loan. If we do not pay
in full a quarterly excess cash flow mandatory prepayment pursuant to the terms of the Unsecured Credit Agreement, interest on the outstanding
principal amount of the Unsecured Term Loan will instead accrue at 25% per annum until the first prepayment date thereafter when the full excess
cash flow mandatory prepayment is made. In addition, for so long as the increased interest rate pursuant to the previous sentence is not applicable, if
on any interest payment date the outstanding principal amount of the Unsecured Term Loan exceeds a specified threshold amount, which threshold
amount equals $43.8 million on May 25, 2013 and decreases by $6.3 million on each interest payment date thereafter, then on and after each
such interest payment date an additional 10% per annum will accrue on such excess. The Unsecured Credit Agreement is guaranteed by us and
each existing and future direct and indirect domestic subsidiary of Cenveo on an unsecured basis pursuant to the Guaranty. The Unsecured Credit
Agreement contains customary covenants that, among other things, place limits on our ability to incur debt, create liens, make investments and
acquisitions, sell assets, pay dividends, prepay debt, merge with other entities or sell all or substantially all of our assets, engage in transactions with
affiliates, and make capital expenditures. The Unsecured Credit Agreement also contains customary representations and warranties and events
of default.
Letters of CreditAs of the year ended 2012, we had outstanding letters of credit of approximately $22.4 million related to performance and payment
guarantees. Based on our experience with these arrangements, we do not believe that any obligations that may arise will be significant.
Credit RatingsOur current credit ratings are as follows:
Rating AgencyCorporate
Rating2010
Credit Facilities8.875%
Notes11.5%
Notes Outlook Last UpdateMoody’s B3 Ba3 B3 Caa2 Negative December 2012
Standard & Poor’s B BB- B- CCC+ Negative December 2012
In December 2012, Moody’s Investors Services, which we refer to as Moody’s, reaffirmed our Corporate Rating and the ratings on our 2010
Credit Facilities, 8.875% Notes and 11.5% Notes. The detail of our current ratings have been provided in the table above. In December 2012,
Standard & Poor’s Ratings Services, which we refer to as Standard & Poor’s, reaffirmed our Corporate Rating and the ratings on our 2010 Credit
Facilities, 8.875% Notes and 11.5% Notes. The detail of our current ratings have been provided in the table above.
The terms of our existing debt do not have any rating triggers that impact our funding availability or influence our daily operations, including
planned capital expenditures. We do not believe that our current ratings will unduly influence our ability to raise additional capital if and/or when
needed. Some of our constituents closely track rating agency actions and would note any raising or lowering of our credit ratings; however, we
believe that along with reviewing our credit ratings, additional quantitative and qualitative analysis must be performed to accurately judge our
financial condition.
We expect that our internally generated cash flows and financing available under our 2010 Revolving Credit Facility will be sufficient to fund
our working capital needs for the next twelve months; however, this cannot be assured.
Off-Balance Sheet Arrangements. It is not our business practice to enter into off-balance sheet arrangements. Accordingly, as of the years
ended 2012 and 2011, we do not have any off-balance sheet arrangements.
- 3 4 - C E N V E O 2 0 1 2 | L E A D + I N V E S T C E N V E O 2 0 1 2 | L E A D + I N V E S T - 3 5 -
MANAGEMENT’S DISCUSSION AND ANALYSIS OF FINANCIAL CONDITION AND RESULTS OF OPERATIONS(CONTINUED)
MANAGEMENT’S DISCUSSION AND ANALYSIS OF FINANCIAL CONDITION AND RESULTS OF OPERATIONS(CONTINUED)
Critical Accounting Matters
The preparation of our consolidated financial statements in conformity with accounting principles generally accepted in the United States of
America requires us to make estimates and assumptions that affect the reported amounts of assets and liabilities and the disclosure of contingent
assets and liabilities at the date of the consolidated financial statements and the reported amount of revenues and expenses during the reporting
period. We evaluate these estimates and assumptions on an ongoing basis based on historical experience and on various other factors which we
believe are reasonable under the circumstances. Actual results could differ from estimates.
We believe that the following represent our more critical estimates and assumptions used in the preparation of our consolidated financial
statements:
Allowance for Losses on Accounts Receivable. We maintain a valuation allowance based on the expected collectability of our accounts
receivable, which requires a considerable amount of judgment in assessing the current creditworthiness of customers and related aging of past
due balances. As of the years ended 2012 and 2011, the allowance provided for potentially uncollectible accounts receivable was $4.7 million and
$5.6 million, respectively. Charges for bad debts recorded to the statement of operations for the years ended 2012, 2011 and 2010 were $2.1 million,
$2.3 million and $5.0 million, respectively. We cannot guarantee that our current credit losses will be consistent with those in the past. These
estimates may prove to be inaccurate, in which case we may have overstated or understated the allowance for losses required for uncollectible
accounts receivable.
Inventory Valuation. Inventories are stated at the lower of cost or market, with cost determined on a first-in, first-out or average cost basis.
Cost includes materials, labor and overhead related to the purchase and production of inventories. When there is a significant decrease in demand
for our products and market price is below cost, we are required to reduce our inventory balances accordingly.
Provision for Impairment of Long-Lived Assets. We evaluate long-lived assets, including property, plant and equipment and intangible assets
other than goodwill and indefinite lived intangible assets, for impairment whenever events or changes in circumstances indicate that the carrying
amounts of specific assets or group of assets may not be recoverable. When an evaluation is required, we estimate the future undiscounted cash flows
associated with the specific asset or group of assets. If the cost of the asset or group of assets cannot be recovered by these undiscounted cash flows,
we would assess the fair value of the asset or asset group and if necessary, an impairment charge would be recorded. Our estimates of future cash
flows are based on our experience and internal business plans. Our internal business plans require judgments regarding future economic conditions,
product demand and pricing. During 2012, 2011 and 2010, in connection with our restructuring and integration programs, we recorded non-cash
impairment charges, net on long-lived assets of $8.4 million, $3.0 million and $33.1 million, respectively. Our 2010 non-cash impairment charges
include a $27.2 million non-cash impairment charge related to customer relationships within our print and envelope segment. Although we believe
our estimates are appropriate, significant differences in the actual performance of an asset or group of assets may materially affect our evaluation
of the recoverability of the asset values currently recorded. Additional impairment charges may be necessary in future years.
Provision for Impairment of Goodwill and Indefinite Lived Intangible Assets. We evaluate the carrying value of our goodwill and indefinite
lived intangible assets annually at the beginning of December and whenever events or circumstances make it more likely than not that an impairment
may have occurred. Accounting Standards Codification (“ASC”) 350, Goodwill and Other Intangible Assets, provides us with the option of performing
a qualitative assessment, if elected, prior to calculating the fair value of an indefinite lived intangible asset or the fair value of a reporting unit for
goodwill under a quantitative approach. If we determine, based on qualitative factors, the fair value of an indefinite lived intangible asset or the fair
value of a reporting unit is more likely than not to be less than the respective carrying value, a quantitative impairment test would be required to
be performed. Otherwise, further impairment testing would not be needed.
ASC 350 prescribes a two-step quantitative method for determining goodwill impairment. In the first step, we compare the estimated fair
value of each reporting unit to its carrying amount, including goodwill. If the carrying amount of a reporting unit exceeds the estimated fair value,
step two is completed to determine the amount of the impairment loss. Step two requires the allocation of the estimated fair value of the reporting
unit to the assets, including any unrecognized intangible assets, and liabilities in a hypothetical purchase price allocation. Any remaining unallocated
fair value represents the implied fair value of goodwill, which is compared to the corresponding carrying value of goodwill to compute the goodwill
impairment amount.
As part of our quantitative impairment analysis for each reporting unit, we estimate the fair value of each reporting unit, primarily using the
income approach. The income approach requires management to estimate a number of factors for each reporting unit, including projected future
operating results, economic projections, anticipated future cash flows, discount rates, and the allocation of shared service or corporate items. The
market approach was used as a test of reasonableness of the conclusions reached in the income approach. The market approach estimates fair value
using comparable marketplace fair value data from within a comparable industry grouping.
The determination of the fair value of the reporting units and the allocation of that value to individual assets and liabilities within those
reporting units requires management to make significant estimates and assumptions. These estimates and assumptions primarily include, but are not
limited to: the selection of appropriate peer group companies; control premiums appropriate for acquisitions in the industries in which we compete;
the discount rate; terminal growth rates; and forecasts of net sales, operating income, depreciation and amortization and capital expenditures. The
allocation requires several analyses to determine the fair value of assets and liabilities including, among others, trade names, customer relationships,
and property, plant and equipment. Although we believe our estimates of fair value are reasonable, actual financial results could differ from those
estimates due to the inherent uncertainty involved in making such estimates. Changes in assumptions concerning future financial results or other
underlying assumptions could have a significant impact on either the fair value of the reporting units, the amount of the goodwill impairment charge,
or both. We also compared the sum of the estimated fair values of the reporting units to our total enterprise value as implied by the market value
of our equity securities. This comparison indicated that, in total, our assumptions and estimates were reasonable. However, future declines in the
overall market value of our equity securities may indicate that the fair value of one or more reporting units has declined below their carrying value.
In 2012, we elected to bypass the qualitative only assessment and perform quantitative assessments on both goodwill and indefinite lived
intangible assets. We did not record any goodwill or indefinite lived intangible asset impairment charges.
In 2011, we allocated approximately $16.3 million of goodwill to the Discontinued Operations based on a relative fair value allocation. As a
result of our relative fair value calculation for these businesses, we recorded a non-cash goodwill impairment charge of $13.5 million in discontinued
operations, net of taxes on the consolidated statement of operations.
In 2010, we recorded non-cash goodwill and indefinite lived intangible asset impairment charges of $154.2 million, of which $132.2 million
related to goodwill and $22.0 million related to an indefinite lived trade name within our print and envelope segment.
One measure of the sensitivity of the amount of goodwill impairment charges to key assumptions is the amount by which each reporting unit
had fair value in excess of its carrying amount or had carrying amount in excess of fair value for the first step of the goodwill impairment test. In
2012, our four reporting units had fair value in excess of carrying value with fair value exceeding carrying value by at least 50%. Generally, changes
in estimates of expected future cash flows would have a similar effect on the estimated fair value of the reporting unit. That is, a 1% change in
estimated future cash flows would decrease the estimated fair value of the reporting unit by approximately 1%. Of the other key assumptions that
impact the estimated fair values, most reporting units have the greatest sensitivity to changes in the estimated discount rate. In 2012, the discount
rate for each reporting unit was estimated to be 11%. A 100 basis point increase in our estimated discount rates would not have resulted in any
additional reporting units failing step one.
Determining whether an impairment of indefinite lived intangible assets has occurred requires an analysis of the fair value of each of the related
trade names. However, if our estimates of the valuations of our trade names prove to be inaccurate, an impairment charge could be necessary in
future periods.
Our quantitative impairment analysis for trade names utilizes a relief-from-royalty method in which the hypothetical benefits of owning each
respective trade name are valued by discounting hypothetical royalty revenue over projected revenues covered by the trade names. We utilized
royalty rates of 1.0% to 4.0% for the use of the subject trade names based on comparable market rates, the profitability of the product employing
the trade name, and qualitative factors, such as the strength of the name and years in usage. We utilized a discount rate of 12.0%, which was based
on the weighted average cost of capital for the respective business plus a premium to account for the relative risks of the subject trade name.
In order to evaluate the sensitivity of the fair value calculations for all of our indefinite lived trade names, we applied hypothetical 5% and 10%
decreases to the estimated fair value of our trade names. Such hypothetical decreases in fair value could be due to changes in discount rates and/
or assumed royalty rates. These hypothetical 5% and 10% decreases in estimated fair value would not have resulted in an impairment of any of our
identifiable indefinite lived trade names.
Self-Insurance Reserves. We are self-insured for the majority of our workers’ compensation and health insurance costs, subject to specific
retention levels. We rely on claims experience and the advice of consulting actuaries and administrators in determining an adequate liability for
self-insurance claims. While we believe that the estimates of our self-insurance liabilities are reasonable, significant differences in our experience
or a significant change in any of our assumptions could materially affect the amount of workers’ compensation and healthcare expenses we record
on an annual basis.
- 3 6 - C E N V E O 2 0 1 2 | L E A D + I N V E S T C E N V E O 2 0 1 2 | L E A D + I N V E S T - 3 7 -
MANAGEMENT’S DISCUSSION AND ANALYSIS OF FINANCIAL CONDITION AND RESULTS OF OPERATIONS
(CONTINUED)
MANAGEMENT’S DISCUSSION AND ANALYSIS OF FINANCIAL CONDITION AND RESULTS OF OPERATIONS
(CONTINUED)
Our self-insurance workers’ compensation liability is estimated based on reserves for claims that are established by a third-party administrator.
The estimate of these reserves is adjusted from time to time to reflect the estimated future development of the claims. Our liability for workers’
compensation claims is the estimated total cost of the claims on a fully-developed and discounted basis that considers anticipated payment patterns.
As of the years ended 2012 and 2011, the undiscounted liability was $13.5 million and $15.3 million, respectively, and the discounted liability was
$12.1 million and $13.2 million, respectively, using discount rates of 3% and 4%, respectively.
Our self-insured healthcare liability represents our estimate of claims that have been incurred, but not reported as of the years ended 2012
and 2011. We rely on claims experience and the advice of consulting actuaries to determine an adequate liability for self-insured plans. This liability
was $3.8 million and $6.0 million as of the years ended 2012 and 2011, respectively, and was estimated based on an analysis of actuarial completion
factors that estimated incurred but unreported liabilities derived from the historical claims experience. The estimate of our liability for employee
healthcare represents between 30 and 35 days of unreported claims.
Revenue Recognition. We recognize revenue when persuasive evidence of an arrangement exists, product delivery has occurred, pricing is
fixed or determinable, and collection is reasonably assured. Since a significant portion of our products are customer specific, it is common for our
customers to inspect the quality of the product at our facilities prior to shipment. Products shipped are not subject to contractual right of return
provisions.
We record sales net of applicable sales tax and freight costs that are included in the price of the product and are included in net sales while
the costs of delivering finished goods to customers are recorded as freight costs and included in cost of sales.
Accounting for Income Taxes. We are required to estimate our income taxes in each jurisdiction in which we operate, which primarily
includes the United States, Canada and India. This process involves estimating our actual current tax expense, together with assessing temporary
differences resulting from differing treatment of items for tax and financial reporting purposes. The tax effects of these temporary differences are
recorded as deferred tax assets or deferred tax liabilities. Deferred tax assets generally represent items that can be used as a tax deduction or credit
in our tax return in future years for which we have already recorded an expense in our consolidated financial statements. Deferred tax liabilities
generally represent tax items that have been deducted for tax purposes, but have not yet been recorded as an expense in our consolidated financial
statements. As of the years ended 2012 and 2011, we had net deferred tax assets of $12.9 million and $72.9 million, respectively, from our United
States operations. The change in United States net deferred taxes is primarily due to the recording of a valuation allowance of $56.5 million in 2012.
As of the years ended 2012 and 2011, we had foreign net deferred tax liabilities of $2.7 million and $3.3 million, respectively.
We review the likelihood that we will realize the benefit of our deferred tax assets and therefore the need for valuation allowances on a quarterly
basis, or more frequently if events indicate that a review is required. In determining the requirement for a valuation allowance, the historical and
projected financial results of the legal entity or consolidated group recording the net deferred tax asset is considered, along with all other available
positive and negative evidence. The factors considered in our determination of the probability of the realization of the deferred tax assets include,
but are not limited to: recent historical financial results, historical taxable income, projected future taxable income, the expected timing of the
reversals of existing temporary differences, the duration of statutory carryforward periods and tax planning strategies. If, based upon the weight of
available evidence, it is more likely than not the deferred tax assets will not be realized, a valuation allowance is recorded.
Concluding that a valuation allowance is not required is difficult when there is significant negative evidence which is objective and verifiable,
such as cumulative losses in recent years. We utilize a rolling twelve quarters of pre-tax income or loss adjusted for significant permanent book to
tax differences as a measure of our cumulative results in recent years. In the United States, our analysis indicates that we have cumulative three
year historical losses on this basis. While there are significant impairment, restructuring and refinancing charges driving our cumulative three year
loss, this is considered significant negative evidence which is objective and verifiable and therefore, difficult to overcome. However, the three year
loss position is not solely determinative and accordingly, we consider all other available positive and negative evidence in our analysis. Based upon
our analysis, which incorporated the excess capacity and pricing pressure we have experienced in our product lines, along with the recent decline
in net sales from our print and envelope segment during 2012, we believe it is more likely than not that the net deferred tax assets in the United
States may not be fully realized in the future. Accordingly, we estimated and recorded a valuation allowance related to those net deferred tax assets
of $56.5 million in 2012. Deferred tax assets related to certain state net operating losses and foreign tax credit carryforwards also did not reach the
more likely than not realizability criteria and accordingly, were subject to a valuation allowance. During 2012, our valuation allowance related to these
state net operating losses and foreign tax credit carryforwards was reduced by $8.8 million to $12.7 million, primarily as a result of the expiration
of foreign tax credit carryforwards. We believe that we ultimately will recover the remaining net deferred tax assets based upon completed cost
restructuring activities and modifications we have made to our capital structure that will result in future taxable income.
There is no corresponding income tax benefit recognized with respect to losses incurred and no corresponding income tax expense recognized
with respect to earnings generated in jurisdictions with a valuation allowance. This causes variability in our effective tax rate. We intend to maintain
the valuation allowances until it is more likely than not that the net deferred tax assets will be realized. If operating results improve or deteriorate on
a sustained basis, or if certain tax planning strategies are implemented, our conclusions regarding the need for valuation allowances could change,
resulting in either the reversal or increase of the valuation allowances in the future, which could have a significant impact on income tax expense in
the period recognized and subsequent periods.
We recognize a tax position in our consolidated financial statements when it is more likely than not that the position would be sustained upon
examination by tax authorities. This recognized tax position is then measured at the largest amount of benefit that is greater than fifty percent likely
of being realized upon ultimate settlement. Although we believe that our estimates are reasonable, the final outcome of uncertain tax positions may
be materially different from that which is reflected in our consolidated financial statements. We adjust such reserves upon changes in circumstances
that would cause a change to the estimate of the ultimate liability, upon effective settlement or upon the expiration of the statute of limitations, in
the period in which such event occurs. During 2012 and 2011, we did not reduce our liabilities for uncertain tax positions.
Pension and Other Postretirement Benefit Plans. We record annual amounts relating to our pension and other postretirement benefit plans
based on calculations which include various actuarial assumptions including discount rates, anticipated rates of return, compensation increases and
current expected mortality rates. We review our actuarial assumptions on an annual basis and make modifications to the assumptions based on
current rates and trends when it is appropriate to do so. The effects of modifications are recognized immediately on our consolidated balance sheet,
but are generally amortized into our consolidated statement of operations over future periods, with the deferred amount recorded in accumulated
other comprehensive loss. We believe that the assumptions utilized in recording our obligations under our plans are reasonable based on our
experience, market conditions and input from our actuaries and investment advisers. We determine our assumption for the discount rate to be used
for purposes of computing annual service and interest costs based on the Citigroup Pension Liability Index as of our respective year end dates. The
weighted-average discount rate for pension and other postretirement benefits rounded to the nearest quarter of one percent was 3.75% and 4.25%
for the years ended 2012 and 2011, respectively. A one percentage point decrease in the discount rate at year end 2012 would increase the pension
and other postretirement plans’ projected benefit obligation by approximately $52.1 million. A one percentage point increase in the discount rate
at the year ended 2012 would decrease the pension and other postretirement plans’ projected benefit obligation by approximately $42.6 million.
Our investment objective is to maximize the long-term return on the pension plan assets within prudent levels of risk. Investments are primarily
diversified with a blend of equity securities, fixed income securities and alternative investments. Equity investments are diversified by including
United States and non-United States stocks, growth stocks, value stocks and stocks of large and small companies. Fixed income securities are
primarily United States governmental and corporate bonds, including mutual funds. Alternative investments are primarily private equity hedge
funds and hedge fund-of-funds. We consult with our financial advisers on a regular basis regarding our investment objectives and asset performance.
New Accounting Pronouncements
We are required to adopt certain new accounting pronouncements. See Note 1 to our consolidated financial statements.
Commitments and Contingencies
Our business and operations are subject to a number of significant risks, the most of which are summarized in Note 13 to our consolidated
financial statements.
Quantitative and Qualitative Disclosures About Market Risk
We are exposed to market risks such as changes in interest and foreign currency exchange rates, which may adversely affect our results of
operations and financial position.
As of December 29, 2012, we had variable rate debt outstanding of $404.8 million. Our Term Loan B is subject to a LIBOR floor of 1.5%.
As such, a change of 1% to current LIBOR rates would have a minimal impact to our interest expense.
Our changes in foreign currency exchange rates are managed through normal operating and financing activities. We have foreign operations,
primarily in Canada and India, and thus are exposed to market risk for changes in foreign currency exchange rates. For the year ended 2012, a
uniform 10% strengthening of the United States dollar relative to the local currency of our foreign operations would have resulted in a decrease in
sales and operating income of approximately $8.2 million, and $0.5 million, respectively.
- 3 8 - C E N V E O 2 0 1 2 | L E A D + I N V E S T C E N V E O 2 0 1 2 | L E A D + I N V E S T - 3 9 -
MANAGEMENT’S DISCUSSION AND ANALYSIS OF FINANCIAL CONDITION AND RESULTS OF OPERATIONS
(CONTINUED)
MANAGEMENT’S DISCUSSION AND ANALYSIS OF FINANCIAL CONDITION AND RESULTS OF OPERATIONS
(CONTINUED)
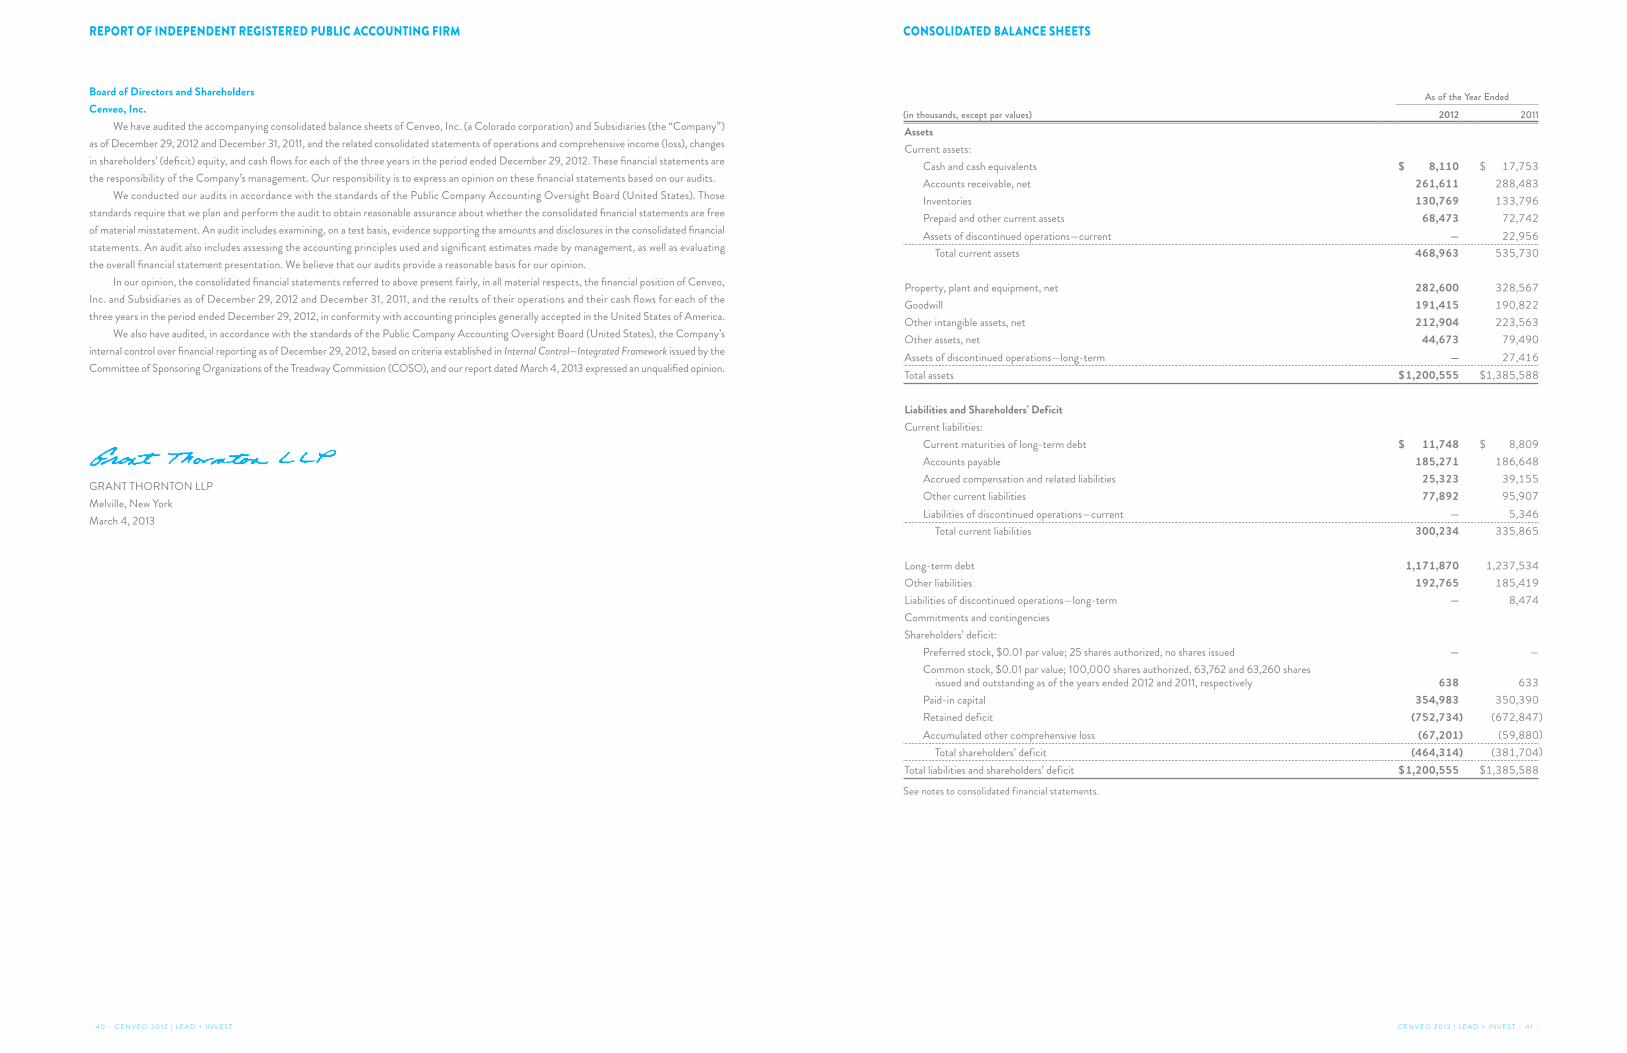
Board of Directors and ShareholdersCenveo, Inc.
We have audited the accompanying consolidated balance sheets of Cenveo, Inc. (a Colorado corporation) and Subsidiaries (the “Company”)
as of December 29, 2012 and December 31, 2011, and the related consolidated statements of operations and comprehensive income (loss), changes
in shareholders’ (deficit) equity, and cash flows for each of the three years in the period ended December 29, 2012. These financial statements are
the responsibility of the Company’s management. Our responsibility is to express an opinion on these financial statements based on our audits.
We conducted our audits in accordance with the standards of the Public Company Accounting Oversight Board (United States). Those
standards require that we plan and perform the audit to obtain reasonable assurance about whether the consolidated financial statements are free
of material misstatement. An audit includes examining, on a test basis, evidence supporting the amounts and disclosures in the consolidated financial
statements. An audit also includes assessing the accounting principles used and significant estimates made by management, as well as evaluating
the overall financial statement presentation. We believe that our audits provide a reasonable basis for our opinion.
In our opinion, the consolidated financial statements referred to above present fairly, in all material respects, the financial position of Cenveo,
Inc. and Subsidiaries as of December 29, 2012 and December 31, 2011, and the results of their operations and their cash flows for each of the
three years in the period ended December 29, 2012, in conformity with accounting principles generally accepted in the United States of America.
We also have audited, in accordance with the standards of the Public Company Accounting Oversight Board (United States), the Company’s
internal control over financial reporting as of December 29, 2012, based on criteria established in Internal Control—Integrated Framework issued by the
Committee of Sponsoring Organizations of the Treadway Commission (COSO), and our report dated March 4, 2013 expressed an unqualified opinion.
GRANT THORNTON LLP
Melville, New York
March 4, 2013
As of the Year Ended
(in thousands, except par values) 2012 2011AssetsCurrent assets:
Cash and cash equivalents $ 8,110 $ 17,753
Accounts receivable, net 261,611 288,483
Inventories 130,769 133,796
Prepaid and other current assets 68,473 72,742
Assets of discontinued operations—current — 22,956
Total current assets 468,963 535,730
Property, plant and equipment, net 282,600 328,567
Goodwill 191,415 190,822
Other intangible assets, net 212,904 223,563
Other assets, net 44,673 79,490
Assets of discontinued operations—long-term — 27,416
Total assets $1,200,555 $1,385,588
Liabilities and Shareholders’ DeficitCurrent liabilities:
Current maturities of long-term debt $ 11,748 $ 8,809
Accounts payable 185,271 186,648
Accrued compensation and related liabilities 25,323 39,155
Other current liabilities 77,892 95,907
Liabilities of discontinued operations—current — 5,346
Total current liabilities 300,234 335,865
Long-term debt 1,171,870 1,237,534
Other liabilities 192,765 185,419
Liabilities of discontinued operations—long-term — 8,474
Commitments and contingencies
Shareholders’ deficit:
Preferred stock, $0.01 par value; 25 shares authorized, no shares issued — —
Common stock, $0.01 par value; 100,000 shares authorized, 63,762 and 63,260 shares issued and outstanding as of the years ended 2012 and 2011, respectively 638 633
Paid-in capital 354,983 350,390
Retained deficit (752,734) (672,847)
Accumulated other comprehensive loss (67,201) (59,880)
Total shareholders’ deficit (464,314) (381,704)
Total liabilities and shareholders’ deficit $1,200,555 $1,385,588
See notes to consolidated financial statements.
- 4 0 - C E N V E O 2 0 1 2 | L E A D + I N V E S T C E N V E O 2 0 1 2 | L E A D + I N V E S T - 4 1 -
REPORT OF INDEPENDENT REGISTERED PUBLIC ACCOUNTING FIRM CONSOLIDATED BALANCE SHEETS
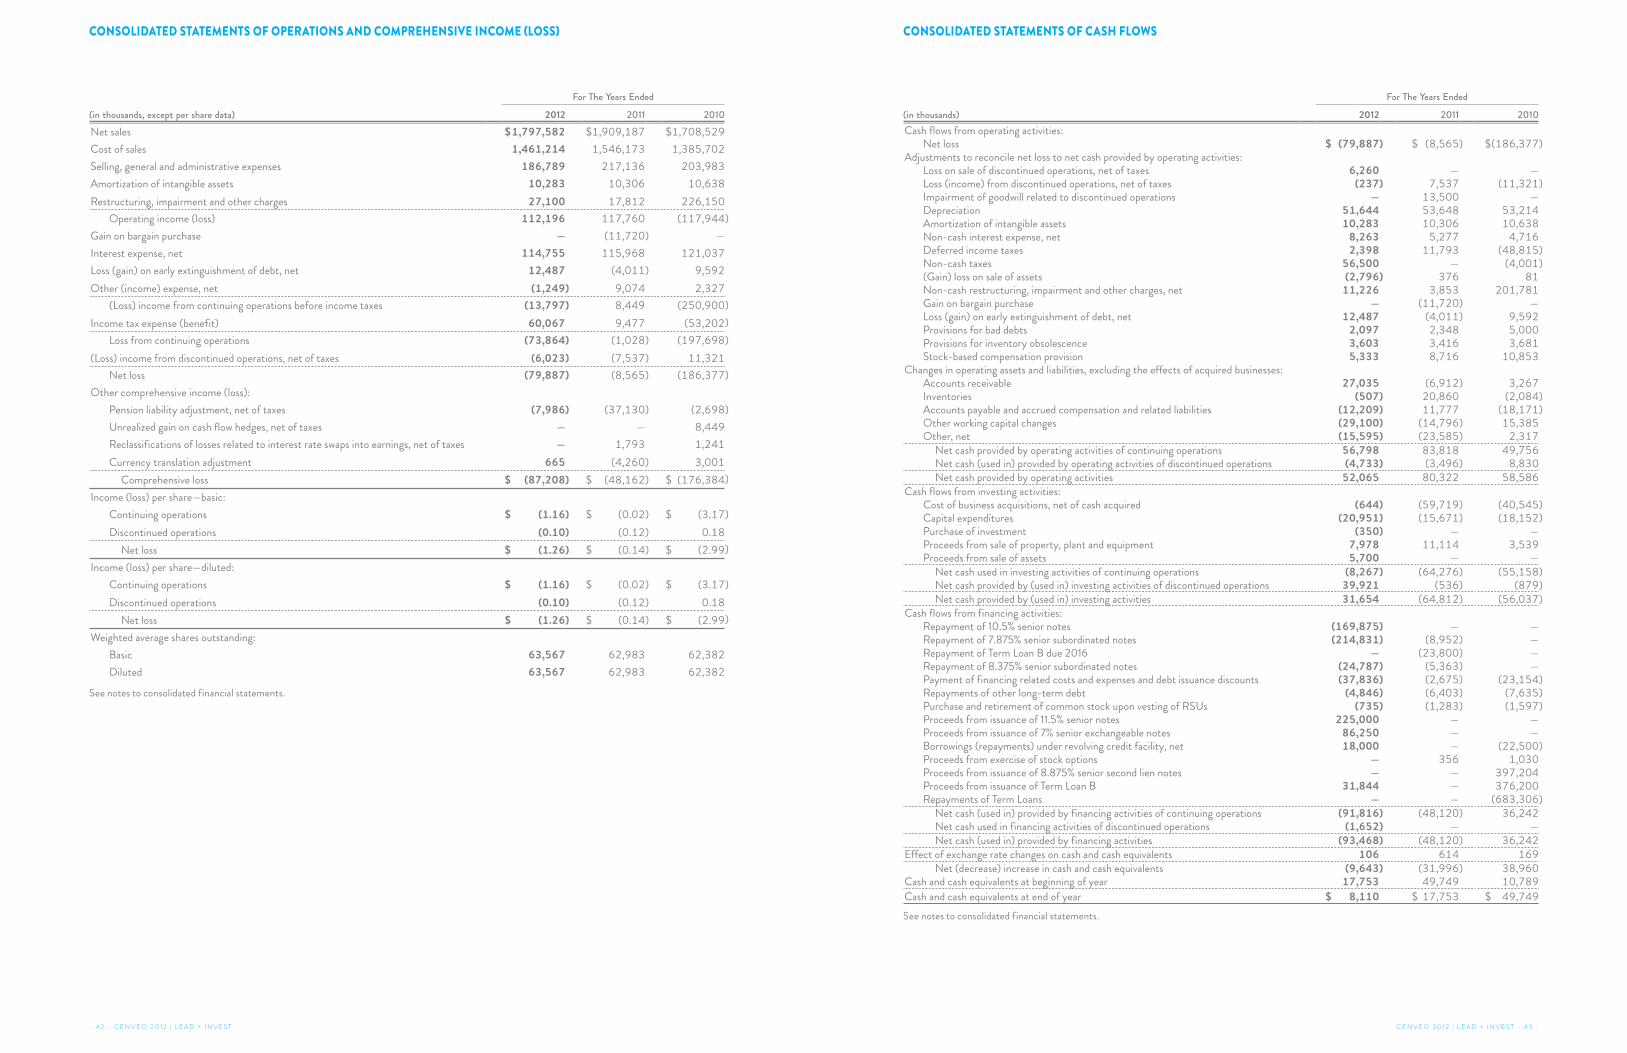
For The Years Ended
(in thousands, except per share data) 2012 2011 2010Net sales $1,797,582 $1,909,187 $1,708,529
Cost of sales 1,461,214 1,546,173 1,385,702
Selling, general and administrative expenses 186,789 217,136 203,983
Amortization of intangible assets 10,283 10,306 10,638
Restructuring, impairment and other charges 27,100 17,812 226,150
Operating income (loss) 112,196 117,760 (117,944)
Gain on bargain purchase — (11,720) —
Interest expense, net 114,755 115,968 121,037
Loss (gain) on early extinguishment of debt, net 12,487 (4,011) 9,592
Other (income) expense, net (1,249) 9,074 2,327
(Loss) income from continuing operations before income taxes (13,797) 8,449 (250,900)
Income tax expense (benefit) 60,067 9,477 (53,202)
Loss from continuing operations (73,864) (1,028) (197,698)
(Loss) income from discontinued operations, net of taxes (6,023) (7,537) 11,321
Net loss (79,887) (8,565) (186,377)
Other comprehensive income (loss):
Pension liability adjustment, net of taxes (7,986) (37,130) (2,698)
Unrealized gain on cash flow hedges, net of taxes — — 8,449
Reclassifications of losses related to interest rate swaps into earnings, net of taxes — 1,793 1,241
Currency translation adjustment 665 (4,260) 3,001
Comprehensive loss $ (87,208) $ (48,162) $ (176,384)
Income (loss) per share—basic:
Continuing operations $ (1.16) $ (0.02) $ (3.17)
Discontinued operations (0.10) (0.12) 0.18
Net loss $ (1.26) $ (0.14) $ (2.99)
Income (loss) per share—diluted:
Continuing operations $ (1.16) $ (0.02) $ (3.17)
Discontinued operations (0.10) (0.12) 0.18
Net loss $ (1.26) $ (0.14) $ (2.99)
Weighted average shares outstanding:
Basic 63,567 62,983 62,382
Diluted 63,567 62,983 62,382
See notes to consolidated financial statements.
For The Years Ended
(in thousands) 2012 2011 2010Cash flows from operating activities:
Net loss $ (79,887) $ (8,565) $(186,377)Adjustments to reconcile net loss to net cash provided by operating activities:
Loss on sale of discontinued operations, net of taxes 6,260 — —Loss (income) from discontinued operations, net of taxes (237) 7,537 (11,321)Impairment of goodwill related to discontinued operations — 13,500 —Depreciation 51,644 53,648 53,214Amortization of intangible assets 10,283 10,306 10,638Non-cash interest expense, net 8,263 5,277 4,716Deferred income taxes 2,398 11,793 (48,815)Non-cash taxes 56,500 — (4,001)(Gain) loss on sale of assets (2,796) 376 81Non-cash restructuring, impairment and other charges, net 11,226 3,853 201,781Gain on bargain purchase — (11,720) —Loss (gain) on early extinguishment of debt, net 12,487 (4,011) 9,592Provisions for bad debts 2,097 2,348 5,000Provisions for inventory obsolescence 3,603 3,416 3,681Stock-based compensation provision 5,333 8,716 10,853
Changes in operating assets and liabilities, excluding the effects of acquired businesses:Accounts receivable 27,035 (6,912) 3,267Inventories (507) 20,860 (2,084)Accounts payable and accrued compensation and related liabilities (12,209) 11,777 (18,171)Other working capital changes (29,100) (14,796) 15,385Other, net (15,595) (23,585) 2,317
Net cash provided by operating activities of continuing operations 56,798 83,818 49,756 Net cash (used in) provided by operating activities of discontinued operations (4,733) (3,496) 8,830
Net cash provided by operating activities 52,065 80,322 58,586
Cash flows from investing activities:Cost of business acquisitions, net of cash acquired (644) (59,719) (40,545)Capital expenditures (20,951) (15,671) (18,152)Purchase of investment (350) — —Proceeds from sale of property, plant and equipment 7,978 11,114 3,539Proceeds from sale of assets 5,700 — —
Net cash used in investing activities of continuing operations (8,267) (64,276) (55,158) Net cash provided by (used in) investing activities of discontinued operations 39,921 (536) (879)
Net cash provided by (used in) investing activities 31,654 (64,812) (56,037)
Cash flows from financing activities:Repayment of 10.5% senior notes (169,875) — —Repayment of 7.875% senior subordinated notes (214,831) (8,952) —Repayment of Term Loan B due 2016 — (23,800) —Repayment of 8.375% senior subordinated notes (24,787) (5,363) —Payment of financing related costs and expenses and debt issuance discounts (37,836) (2,675) (23,154)Repayments of other long-term debt (4,846) (6,403) (7,635)Purchase and retirement of common stock upon vesting of RSUs (735) (1,283) (1,597)Proceeds from issuance of 11.5% senior notes 225,000 — —Proceeds from issuance of 7% senior exchangeable notes 86,250 — —Borrowings (repayments) under revolving credit facility, net 18,000 — (22,500)Proceeds from exercise of stock options — 356 1,030Proceeds from issuance of 8.875% senior second lien notes — — 397,204Proceeds from issuance of Term Loan B 31,844 — 376,200Repayments of Term Loans — — (683,306)
Net cash (used in) provided by financing activities of continuing operations (91,816) (48,120) 36,242 Net cash used in financing activities of discontinued operations (1,652) — —
Net cash (used in) provided by financing activities (93,468) (48,120) 36,242
Effect of exchange rate changes on cash and cash equivalents 106 614 169
Net (decrease) increase in cash and cash equivalents (9,643) (31,996) 38,960Cash and cash equivalents at beginning of year 17,753 49,749 10,789
Cash and cash equivalents at end of year $ 8,110 $ 17,753 $ 49,749
See notes to consolidated financial statements.
- 4 2 - C E N V E O 2 0 1 2 | L E A D + I N V E S T C E N V E O 2 0 1 2 | L E A D + I N V E S T - 4 3 -
CONSOLIDATED STATEMENTS OF CASH FLOWSCONSOLIDATED STATEMENTS OF OPERATIONS AND COMPREHENSIVE INCOME (LOSS)

Common StockPaid-In Capital
Retained Deficit
Accumulated Other
Comprehensive (Loss) Income
Total Shareholders’
Equity (Deficit)
(in thousands) Shares AmountBalance as of the year ended 2009 62,033 $620 $331,051 $(477,905) $(30,276) $(176,510)
Comprehensive income (loss):
Net loss (186,377) (186,377)
Other comprehensive income (loss):
Pension liability adjustment, net of tax benefit of $1,718 (2,698) (2,698)
Unrealized gain on cash flow hedges, net of tax expense of $5,063 8,449 8,449
Reclassification of losses related to interest rate swaps into earnings, net of tax expense of $587 1,241 1,241
Currency translation adjustment 3,001 3,001
Other comprehensive income 9,993
Total comprehensive loss (176,384)
Exercise of stock options 694 7 1,023 1,030
Purchase and retirement of common stock upon vesting of RSUs (1,597 ) (1,597)
Amortization of stock based compensation 12,130 12,130
Balance as of the year ended 2010 62,727 627 342,607 (664,282) (20,283) (341,331)
Comprehensive income (loss):
Net loss (8,565) (8,565)
Other comprehensive income (loss):
Pension liability adjustment, net of tax benefit of $23,217 (37,130) (37,130)
Reclassification of losses related to interest rate swaps into earnings, net of tax expense of $863 1,793 1,793
Currency translation adjustment (4,260) (4,260)
Other comprehensive loss (39,597)
Total comprehensive loss (48,162)
Exercise of stock options 533 6 350 356
Purchase and retirement of common stock upon vesting of RSUs (1,283 ) (1,283)
Amortization of stock based compensation 8,716 8,716
Balance as of the year ended 2011 63,260 633 350,390 (672,847) (59,880) (381,704)
Comprehensive income (loss):
Net loss (79,887) (79,887)
Other comprehensive income (loss):
Pension liability adjustment, net of tax benefit of $5,225 (7,986) (7,986)
Currency translation adjustment 665 665
Other comprehensive loss (7,321)
Total comprehensive loss (87,208)
Purchase and retirement of common stock upon vesting of RSUs 502 5 (740 ) (735)
Amortization of stock based compensation 5,333 5,333
Balance as of the year ended 2012 63,762 $638 $354,983 $(752,734) $(67,201) $(464,314)
See notes to consolidated financial statements.
1. Summary of Significant Accounting Policies
Basis of Presentation. The consolidated financial statements include the results of Cenveo, Inc. and its subsidiaries and have been prepared
in accordance with accounting principles generally accepted in the United States of America (“GAAP”). All intercompany transactions have been
eliminated.
Cenveo, Inc. and its wholly-owned subsidiaries (collectively, the “Company” or “Cenveo”) are engaged in the manufacturing of commercial
printing, envelope converting, label manufacturing and specialty packaging products. The Company is headquartered in Stamford, Connecticut, is
organized under Colorado law, and its common stock is traded on the New York Stock Exchange under the symbol “CVO”. The Company operates
a primarily domestic network of strategically located manufacturing facilities, serving a diverse base of over 100,000 customers. The Company’s
operations are primarily based in North America, Latin America and Asia.
The Company’s reporting periods for 2012, 2011 and 2010 in this report each consist of 52 week periods ending on the Saturday closest to
the last day of the calendar month, and ended on December 29, 2012, December 31, 2011, and January 1, 2011, respectively. Such periods are
referred to herein as (i) “as of the year ended 2012”, “the year ended 2012” or “2012”, (ii) “as of the year ended 2011”, “the year ended 2011” or
“2011” and (iii) “as of the year ended 2010”, “the year ended 2010” or “2010”. All references to years and year-ends herein relate to fiscal years
rather than calendar years.
The Company acquired Nesbitt Graphics, Inc. (“Nesbitt”), in the third quarter of 2011 and assets of MeadWestvaco Corporation’s Envelope
Product Group (“EPG”) in the first quarter of 2011. The Company’s results for the year ended 2011 include the operating results of these
acquisitions subsequent to their respective acquisition dates. The Company acquired Impaxx, Inc., the sole owner of CMS Gilbreth Packaging
Solutions, Inc. (“Gilbreth”), in the fourth quarter of 2010, Glyph International and its subsidiaries (“Glyph”) in the second quarter of 2010 and
Clixx Direct Marketing Services, Inc. (“Clixx”) in the first quarter of 2010. The Company’s results for the year ended 2010 include the operating
results of these acquisitions subsequent to their respective acquisition dates.
In 2011, the Company began exploring opportunities to divest certain non-strategic or underperforming businesses within its manufacturing
platform. As a result, beginning in the fourth quarter of 2011, the financial results of the Company’s documents and forms business as well as the
Company’s wide-format papers business have been accounted for as discontinued operations (collectively the “Discontinued Operations”) resulting
in the Company’s historical consolidated balance sheets, statements of operations and comprehensive income (loss) (“statement of operations”)
and statements of cash flows being reclassified to reflect these discontinued operations separately from the Company’s continuing operations
for all periods presented. These businesses were sold in the first quarter of 2012. Effective January 1, 2012, the Company realigned operating
responsibilities. In connection with this change in management reporting and strategy, the Company realigned its reportable segments, resulting
in the prior year disclosure being updated to reflect current year presentation.
Use of Estimates. The preparation of financial statements in conformity with GAAP requires management to make estimates and assumptions
that affect the reported amounts of assets and liabilities and disclosure of contingent assets and liabilities at the date of the financial statements and
the reported amounts of revenues and expenses during the reporting periods. Estimates and assumptions are used for, but not limited to, establishing
the allowance for doubtful accounts, purchase price allocation, depreciation and amortization lives, asset impairment evaluations, tax assets and
liabilities, self-insurance accruals, stock-based compensation and other contingencies. Actual results could differ from estimates.
Fair Value Measurements. Certain assets and liabilities of the Company are required to be recorded at fair value. Fair value is determined
based on the exchange price that would be received for an asset or paid to transfer a liability in an orderly transaction between market participants.
The fair value of cash and cash equivalents, accounts receivable, short-term debt and accounts payable approximate their carrying values due to
their short-term nature. The Company also has other assets or liabilities that it records at fair value, such as its pension and other postretirement
plan assets and liabilities, long-lived assets held and used, long-lived assets held for sale, goodwill and other intangible assets. The three-tier value
hierarchy, which prioritizes the inputs used in the valuation methodologies, is as follows:
Level 1 —Valuations based on quoted prices for identical assets and liabilities in active markets.
Level 2 —Valuations based on observable inputs other than quoted prices included in Level 1, such as quoted prices for similar assets and
liabilities in active markets, quoted prices for identical or similar assets and liabilities in markets that are not active, or other inputs
that are observable or can be corroborated by observable market data.
Level 3 —Valuations based on unobservable inputs reflecting the Company’s own assumptions, consistent with reasonably available assumptions
made by other market participants.
Cash and Cash Equivalents. Cash and cash equivalents include cash on deposit and highly liquid investments with original maturities of
three months or less. The Company places its cash and cash equivalents with institutions with high credit quality. However, at certain times, such
cash and cash equivalents may be in excess of FDIC insurance limits. Cash and cash equivalents are stated at cost, which approximates fair value.
Accounts Receivable. Trade accounts receivable are stated net of allowances for doubtful accounts. Specific customer provisions are made
when a review of significant outstanding amounts, customer creditworthiness and current economic trends indicate that collection is doubtful.
- 4 4 - C E N V E O 2 0 1 2 | L E A D + I N V E S T C E N V E O 2 0 1 2 | L E A D + I N V E S T - 4 5 -
CONSOLIDATED STATEMENTS OF CHANGES IN SHAREHOLDERS’ (DEFICIT) EQUITY NOTES TO CONSOLIDATED FINANCIAL STATEMENTS
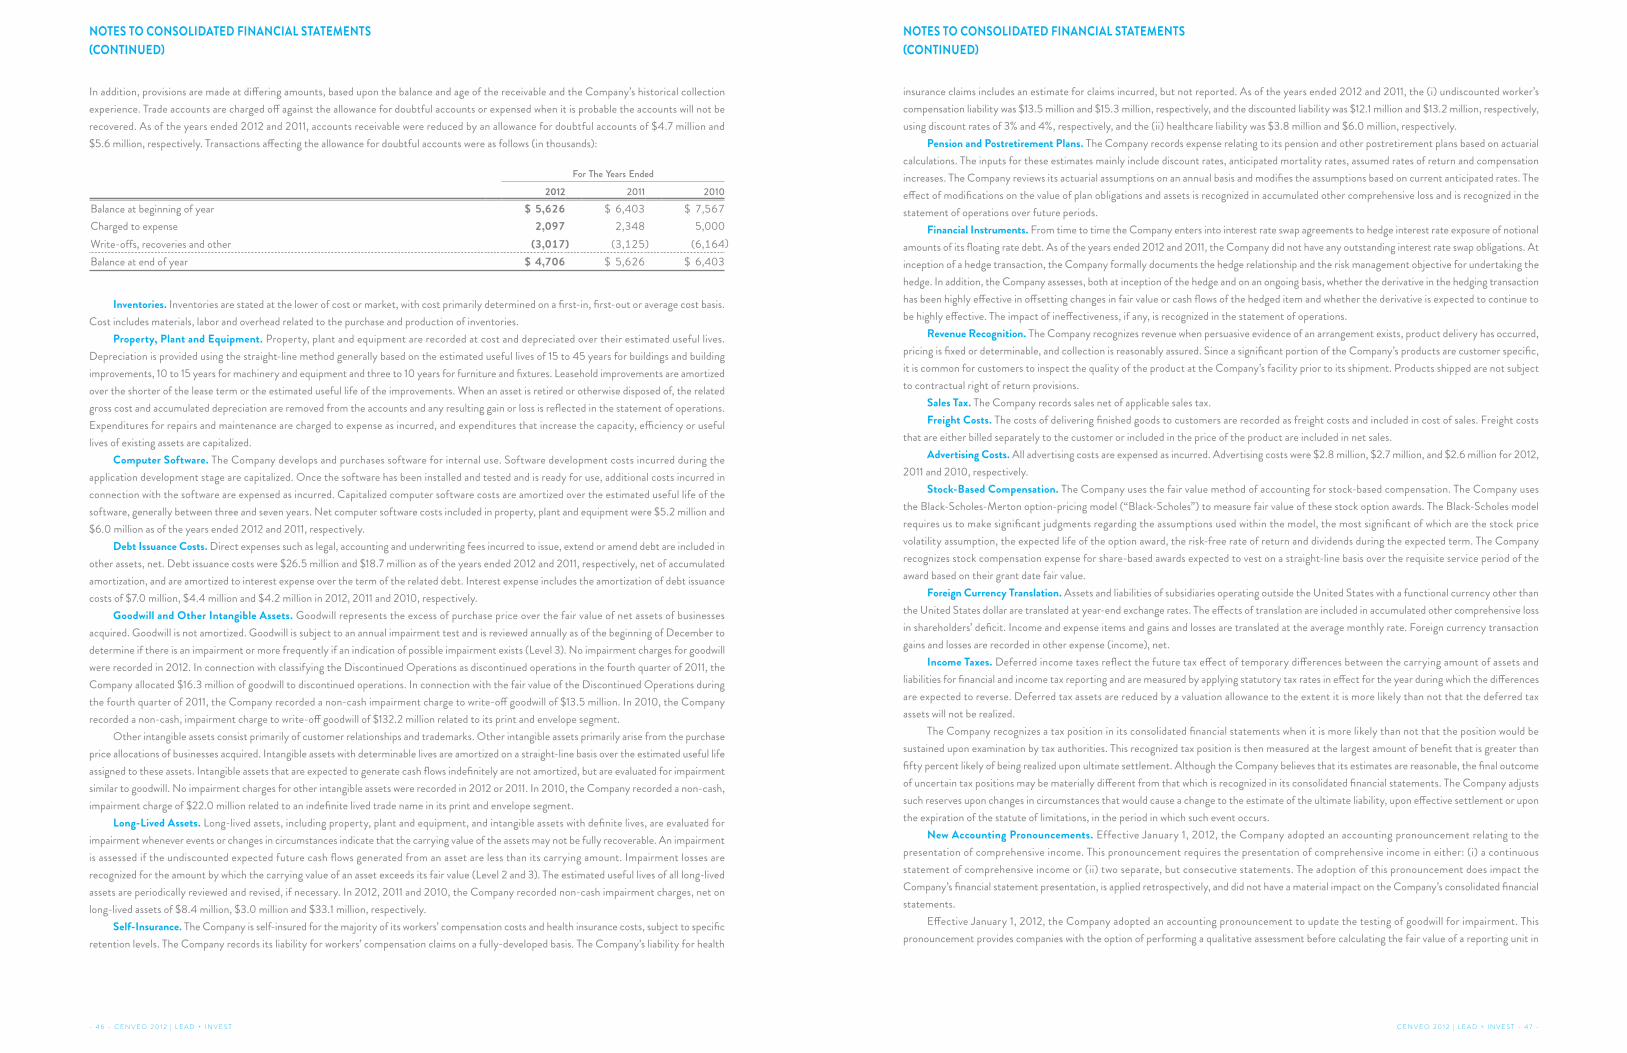
In addition, provisions are made at differing amounts, based upon the balance and age of the receivable and the Company’s historical collection
experience. Trade accounts are charged off against the allowance for doubtful accounts or expensed when it is probable the accounts will not be
recovered. As of the years ended 2012 and 2011, accounts receivable were reduced by an allowance for doubtful accounts of $4.7 million and
$5.6 million, respectively. Transactions affecting the allowance for doubtful accounts were as follows (in thousands):
For The Years Ended
2012 2011 2010Balance at beginning of year $ 5,626 $ 6,403 $ 7,567
Charged to expense 2,097 2,348 5,000
Write-offs, recoveries and other (3,017) (3,125) (6,164)
Balance at end of year $ 4,706 $ 5,626 $ 6,403
Inventories. Inventories are stated at the lower of cost or market, with cost primarily determined on a first-in, first-out or average cost basis.
Cost includes materials, labor and overhead related to the purchase and production of inventories.
Property, Plant and Equipment. Property, plant and equipment are recorded at cost and depreciated over their estimated useful lives.
Depreciation is provided using the straight-line method generally based on the estimated useful lives of 15 to 45 years for buildings and building
improvements, 10 to 15 years for machinery and equipment and three to 10 years for furniture and fixtures. Leasehold improvements are amortized
over the shorter of the lease term or the estimated useful life of the improvements. When an asset is retired or otherwise disposed of, the related
gross cost and accumulated depreciation are removed from the accounts and any resulting gain or loss is reflected in the statement of operations.
Expenditures for repairs and maintenance are charged to expense as incurred, and expenditures that increase the capacity, efficiency or useful
lives of existing assets are capitalized.
Computer Software. The Company develops and purchases software for internal use. Software development costs incurred during the
application development stage are capitalized. Once the software has been installed and tested and is ready for use, additional costs incurred in
connection with the software are expensed as incurred. Capitalized computer software costs are amortized over the estimated useful life of the
software, generally between three and seven years. Net computer software costs included in property, plant and equipment were $5.2 million and
$6.0 million as of the years ended 2012 and 2011, respectively.
Debt Issuance Costs. Direct expenses such as legal, accounting and underwriting fees incurred to issue, extend or amend debt are included in
other assets, net. Debt issuance costs were $26.5 million and $18.7 million as of the years ended 2012 and 2011, respectively, net of accumulated
amortization, and are amortized to interest expense over the term of the related debt. Interest expense includes the amortization of debt issuance
costs of $7.0 million, $4.4 million and $4.2 million in 2012, 2011 and 2010, respectively.
Goodwill and Other Intangible Assets. Goodwill represents the excess of purchase price over the fair value of net assets of businesses
acquired. Goodwill is not amortized. Goodwill is subject to an annual impairment test and is reviewed annually as of the beginning of December to
determine if there is an impairment or more frequently if an indication of possible impairment exists (Level 3). No impairment charges for goodwill
were recorded in 2012. In connection with classifying the Discontinued Operations as discontinued operations in the fourth quarter of 2011, the
Company allocated $16.3 million of goodwill to discontinued operations. In connection with the fair value of the Discontinued Operations during
the fourth quarter of 2011, the Company recorded a non-cash impairment charge to write-off goodwill of $13.5 million. In 2010, the Company
recorded a non-cash, impairment charge to write-off goodwill of $132.2 million related to its print and envelope segment.
Other intangible assets consist primarily of customer relationships and trademarks. Other intangible assets primarily arise from the purchase
price allocations of businesses acquired. Intangible assets with determinable lives are amortized on a straight-line basis over the estimated useful life
assigned to these assets. Intangible assets that are expected to generate cash flows indefinitely are not amortized, but are evaluated for impairment
similar to goodwill. No impairment charges for other intangible assets were recorded in 2012 or 2011. In 2010, the Company recorded a non-cash,
impairment charge of $22.0 million related to an indefinite lived trade name in its print and envelope segment.
Long-Lived Assets. Long-lived assets, including property, plant and equipment, and intangible assets with definite lives, are evaluated for
impairment whenever events or changes in circumstances indicate that the carrying value of the assets may not be fully recoverable. An impairment
is assessed if the undiscounted expected future cash flows generated from an asset are less than its carrying amount. Impairment losses are
recognized for the amount by which the carrying value of an asset exceeds its fair value (Level 2 and 3). The estimated useful lives of all long-lived
assets are periodically reviewed and revised, if necessary. In 2012, 2011 and 2010, the Company recorded non-cash impairment charges, net on
long-lived assets of $8.4 million, $3.0 million and $33.1 million, respectively.
Self-Insurance. The Company is self-insured for the majority of its workers’ compensation costs and health insurance costs, subject to specific
retention levels. The Company records its liability for workers’ compensation claims on a fully-developed basis. The Company’s liability for health
insurance claims includes an estimate for claims incurred, but not reported. As of the years ended 2012 and 2011, the (i) undiscounted worker’s
compensation liability was $13.5 million and $15.3 million, respectively, and the discounted liability was $12.1 million and $13.2 million, respectively,
using discount rates of 3% and 4%, respectively, and the (ii) healthcare liability was $3.8 million and $6.0 million, respectively.
Pension and Postretirement Plans. The Company records expense relating to its pension and other postretirement plans based on actuarial
calculations. The inputs for these estimates mainly include discount rates, anticipated mortality rates, assumed rates of return and compensation
increases. The Company reviews its actuarial assumptions on an annual basis and modifies the assumptions based on current anticipated rates. The
effect of modifications on the value of plan obligations and assets is recognized in accumulated other comprehensive loss and is recognized in the
statement of operations over future periods.
Financial Instruments. From time to time the Company enters into interest rate swap agreements to hedge interest rate exposure of notional
amounts of its floating rate debt. As of the years ended 2012 and 2011, the Company did not have any outstanding interest rate swap obligations. At
inception of a hedge transaction, the Company formally documents the hedge relationship and the risk management objective for undertaking the
hedge. In addition, the Company assesses, both at inception of the hedge and on an ongoing basis, whether the derivative in the hedging transaction
has been highly effective in offsetting changes in fair value or cash flows of the hedged item and whether the derivative is expected to continue to
be highly effective. The impact of ineffectiveness, if any, is recognized in the statement of operations.
Revenue Recognition. The Company recognizes revenue when persuasive evidence of an arrangement exists, product delivery has occurred,
pricing is fixed or determinable, and collection is reasonably assured. Since a significant portion of the Company’s products are customer specific,
it is common for customers to inspect the quality of the product at the Company’s facility prior to its shipment. Products shipped are not subject
to contractual right of return provisions.
Sales Tax. The Company records sales net of applicable sales tax.
Freight Costs. The costs of delivering finished goods to customers are recorded as freight costs and included in cost of sales. Freight costs
that are either billed separately to the customer or included in the price of the product are included in net sales.
Advertising Costs. All advertising costs are expensed as incurred. Advertising costs were $2.8 million, $2.7 million, and $2.6 million for 2012,
2011 and 2010, respectively.
Stock-Based Compensation. The Company uses the fair value method of accounting for stock-based compensation. The Company uses
the Black-Scholes-Merton option-pricing model (“Black-Scholes”) to measure fair value of these stock option awards. The Black-Scholes model
requires us to make significant judgments regarding the assumptions used within the model, the most significant of which are the stock price
volatility assumption, the expected life of the option award, the risk-free rate of return and dividends during the expected term. The Company
recognizes stock compensation expense for share-based awards expected to vest on a straight-line basis over the requisite service period of the
award based on their grant date fair value.
Foreign Currency Translation. Assets and liabilities of subsidiaries operating outside the United States with a functional currency other than
the United States dollar are translated at year-end exchange rates. The effects of translation are included in accumulated other comprehensive loss
in shareholders’ deficit. Income and expense items and gains and losses are translated at the average monthly rate. Foreign currency transaction
gains and losses are recorded in other expense (income), net.
Income Taxes. Deferred income taxes reflect the future tax effect of temporary differences between the carrying amount of assets and
liabilities for financial and income tax reporting and are measured by applying statutory tax rates in effect for the year during which the differences
are expected to reverse. Deferred tax assets are reduced by a valuation allowance to the extent it is more likely than not that the deferred tax
assets will not be realized.
The Company recognizes a tax position in its consolidated financial statements when it is more likely than not that the position would be
sustained upon examination by tax authorities. This recognized tax position is then measured at the largest amount of benefit that is greater than
fifty percent likely of being realized upon ultimate settlement. Although the Company believes that its estimates are reasonable, the final outcome
of uncertain tax positions may be materially different from that which is recognized in its consolidated financial statements. The Company adjusts
such reserves upon changes in circumstances that would cause a change to the estimate of the ultimate liability, upon effective settlement or upon
the expiration of the statute of limitations, in the period in which such event occurs.
New Accounting Pronouncements. Effective January 1, 2012, the Company adopted an accounting pronouncement relating to the
presentation of comprehensive income. This pronouncement requires the presentation of comprehensive income in either: (i) a continuous
statement of comprehensive income or (ii) two separate, but consecutive statements. The adoption of this pronouncement does impact the
Company’s financial statement presentation, is applied retrospectively, and did not have a material impact on the Company’s consolidated financial
statements.
Effective January 1, 2012, the Company adopted an accounting pronouncement to update the testing of goodwill for impairment. This
pronouncement provides companies with the option of performing a qualitative assessment before calculating the fair value of a reporting unit in
- 4 6 - C E N V E O 2 0 1 2 | L E A D + I N V E S T C E N V E O 2 0 1 2 | L E A D + I N V E S T - 4 7 -
NOTES TO CONSOLIDATED FINANCIAL STATEMENTS
(CONTINUED)
NOTES TO CONSOLIDATED FINANCIAL STATEMENTS
(CONTINUED)
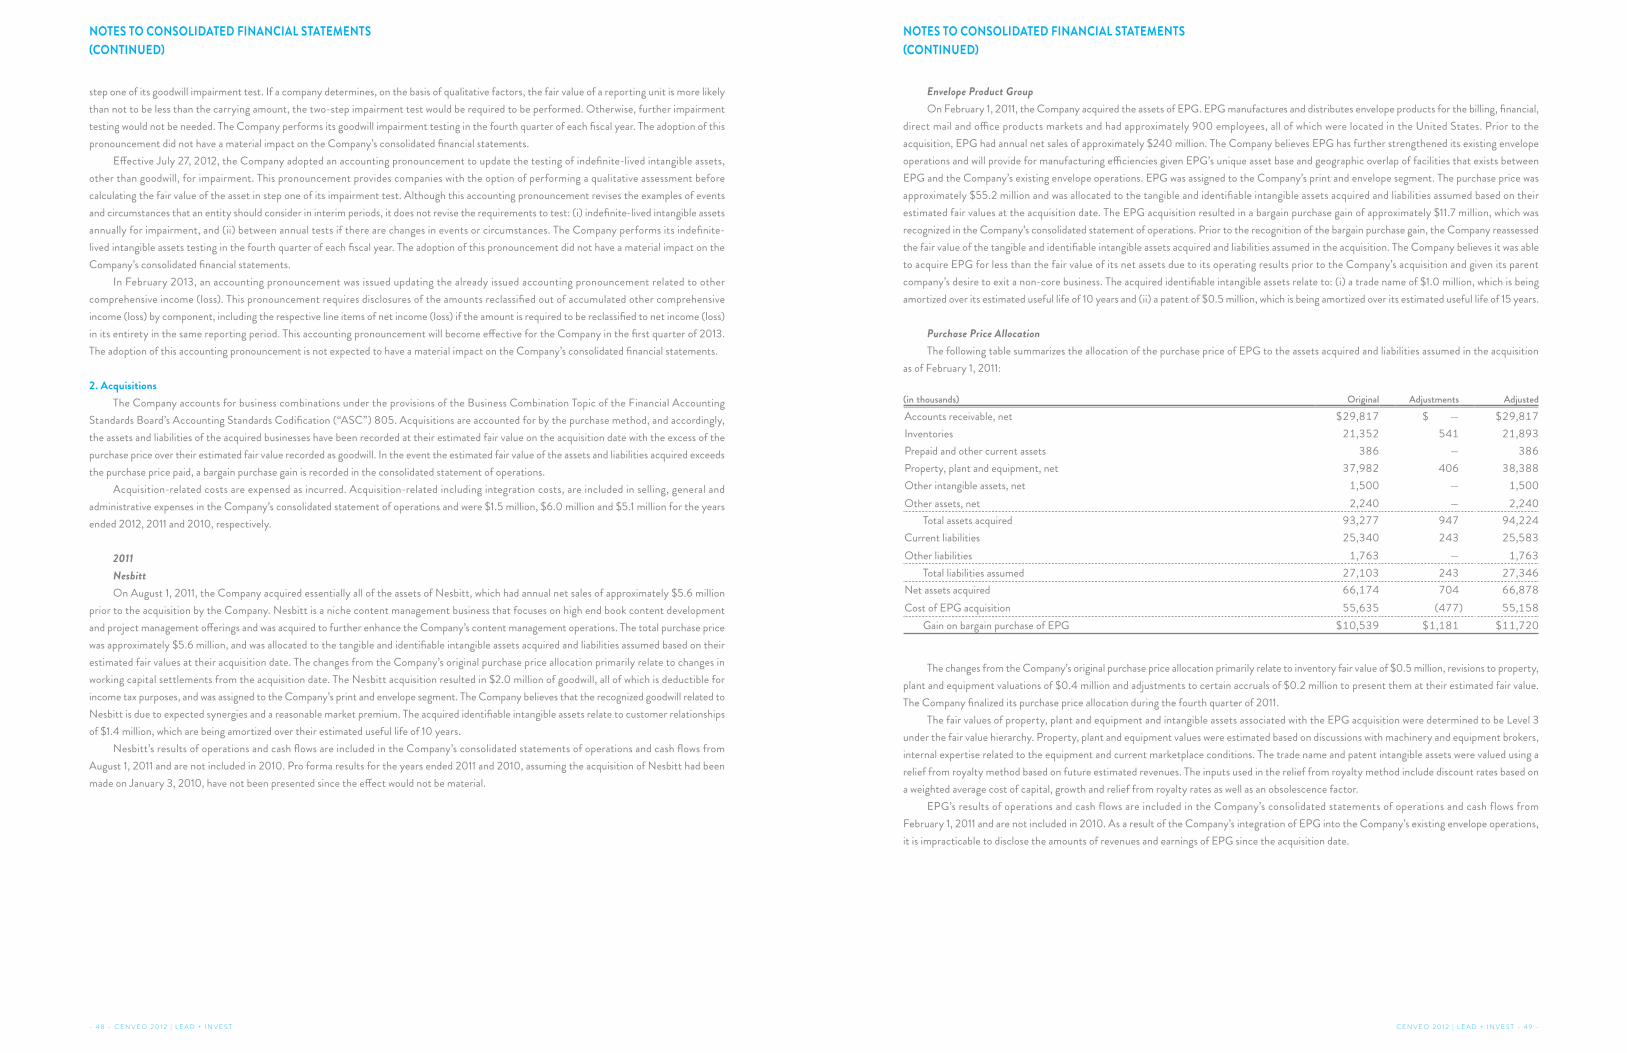
step one of its goodwill impairment test. If a company determines, on the basis of qualitative factors, the fair value of a reporting unit is more likely
than not to be less than the carrying amount, the two-step impairment test would be required to be performed. Otherwise, further impairment
testing would not be needed. The Company performs its goodwill impairment testing in the fourth quarter of each fiscal year. The adoption of this
pronouncement did not have a material impact on the Company’s consolidated financial statements.
Effective July 27, 2012, the Company adopted an accounting pronouncement to update the testing of indefinite-lived intangible assets,
other than goodwill, for impairment. This pronouncement provides companies with the option of performing a qualitative assessment before
calculating the fair value of the asset in step one of its impairment test. Although this accounting pronouncement revises the examples of events
and circumstances that an entity should consider in interim periods, it does not revise the requirements to test: (i) indefinite-lived intangible assets
annually for impairment, and (ii) between annual tests if there are changes in events or circumstances. The Company performs its indefinite-
lived intangible assets testing in the fourth quarter of each fiscal year. The adoption of this pronouncement did not have a material impact on the
Company’s consolidated financial statements.
In February 2013, an accounting pronouncement was issued updating the already issued accounting pronouncement related to other
comprehensive income (loss). This pronouncement requires disclosures of the amounts reclassified out of accumulated other comprehensive
income (loss) by component, including the respective line items of net income (loss) if the amount is required to be reclassified to net income (loss)
in its entirety in the same reporting period. This accounting pronouncement will become effective for the Company in the first quarter of 2013.
The adoption of this accounting pronouncement is not expected to have a material impact on the Company’s consolidated financial statements.
2. AcquisitionsThe Company accounts for business combinations under the provisions of the Business Combination Topic of the Financial Accounting
Standards Board’s Accounting Standards Codification (“ASC”) 805. Acquisitions are accounted for by the purchase method, and accordingly,
the assets and liabilities of the acquired businesses have been recorded at their estimated fair value on the acquisition date with the excess of the
purchase price over their estimated fair value recorded as goodwill. In the event the estimated fair value of the assets and liabilities acquired exceeds
the purchase price paid, a bargain purchase gain is recorded in the consolidated statement of operations.
Acquisition-related costs are expensed as incurred. Acquisition-related including integration costs, are included in selling, general and
administrative expenses in the Company’s consolidated statement of operations and were $1.5 million, $6.0 million and $5.1 million for the years
ended 2012, 2011 and 2010, respectively.
2011NesbittOn August 1, 2011, the Company acquired essentially all of the assets of Nesbitt, which had annual net sales of approximately $5.6 million
prior to the acquisition by the Company. Nesbitt is a niche content management business that focuses on high end book content development
and project management offerings and was acquired to further enhance the Company’s content management operations. The total purchase price
was approximately $5.6 million, and was allocated to the tangible and identifiable intangible assets acquired and liabilities assumed based on their
estimated fair values at their acquisition date. The changes from the Company’s original purchase price allocation primarily relate to changes in
working capital settlements from the acquisition date. The Nesbitt acquisition resulted in $2.0 million of goodwill, all of which is deductible for
income tax purposes, and was assigned to the Company’s print and envelope segment. The Company believes that the recognized goodwill related to
Nesbitt is due to expected synergies and a reasonable market premium. The acquired identifiable intangible assets relate to customer relationships
of $1.4 million, which are being amortized over their estimated useful life of 10 years.
Nesbitt’s results of operations and cash flows are included in the Company’s consolidated statements of operations and cash flows from
August 1, 2011 and are not included in 2010. Pro forma results for the years ended 2011 and 2010, assuming the acquisition of Nesbitt had been
made on January 3, 2010, have not been presented since the effect would not be material.
Envelope Product GroupOn February 1, 2011, the Company acquired the assets of EPG. EPG manufactures and distributes envelope products for the billing, financial,
direct mail and office products markets and had approximately 900 employees, all of which were located in the United States. Prior to the
acquisition, EPG had annual net sales of approximately $240 million. The Company believes EPG has further strengthened its existing envelope
operations and will provide for manufacturing efficiencies given EPG’s unique asset base and geographic overlap of facilities that exists between
EPG and the Company’s existing envelope operations. EPG was assigned to the Company’s print and envelope segment. The purchase price was
approximately $55.2 million and was allocated to the tangible and identifiable intangible assets acquired and liabilities assumed based on their
estimated fair values at the acquisition date. The EPG acquisition resulted in a bargain purchase gain of approximately $11.7 million, which was
recognized in the Company’s consolidated statement of operations. Prior to the recognition of the bargain purchase gain, the Company reassessed
the fair value of the tangible and identifiable intangible assets acquired and liabilities assumed in the acquisition. The Company believes it was able
to acquire EPG for less than the fair value of its net assets due to its operating results prior to the Company’s acquisition and given its parent
company’s desire to exit a non-core business. The acquired identifiable intangible assets relate to: (i) a trade name of $1.0 million, which is being
amortized over its estimated useful life of 10 years and (ii) a patent of $0.5 million, which is being amortized over its estimated useful life of 15 years.
Purchase Price AllocationThe following table summarizes the allocation of the purchase price of EPG to the assets acquired and liabilities assumed in the acquisition
as of February 1, 2011:
(in thousands) Original Adjustments AdjustedAccounts receivable, net $29,817 $ — $29,817
Inventories 21,352 541 21,893
Prepaid and other current assets 386 — 386
Property, plant and equipment, net 37,982 406 38,388
Other intangible assets, net 1,500 — 1,500
Other assets, net 2,240 — 2,240
Total assets acquired 93,277 947 94,224
Current liabilities 25,340 243 25,583
Other liabilities 1,763 — 1,763
Total liabilities assumed 27,103 243 27,346
Net assets acquired 66,174 704 66,878
Cost of EPG acquisition 55,635 (477) 55,158
Gain on bargain purchase of EPG $10,539 $1,181 $11,720
The changes from the Company’s original purchase price allocation primarily relate to inventory fair value of $0.5 million, revisions to property,
plant and equipment valuations of $0.4 million and adjustments to certain accruals of $0.2 million to present them at their estimated fair value.
The Company finalized its purchase price allocation during the fourth quarter of 2011.
The fair values of property, plant and equipment and intangible assets associated with the EPG acquisition were determined to be Level 3
under the fair value hierarchy. Property, plant and equipment values were estimated based on discussions with machinery and equipment brokers,
internal expertise related to the equipment and current marketplace conditions. The trade name and patent intangible assets were valued using a
relief from royalty method based on future estimated revenues. The inputs used in the relief from royalty method include discount rates based on
a weighted average cost of capital, growth and relief from royalty rates as well as an obsolescence factor.
EPG’s results of operations and cash flows are included in the Company’s consolidated statements of operations and cash flows from
February 1, 2011 and are not included in 2010. As a result of the Company’s integration of EPG into the Company’s existing envelope operations,
it is impracticable to disclose the amounts of revenues and earnings of EPG since the acquisition date.
- 4 8 - C E N V E O 2 0 1 2 | L E A D + I N V E S T C E N V E O 2 0 1 2 | L E A D + I N V E S T - 4 9 -
NOTES TO CONSOLIDATED FINANCIAL STATEMENTS(CONTINUED)
NOTES TO CONSOLIDATED FINANCIAL STATEMENTS(CONTINUED)
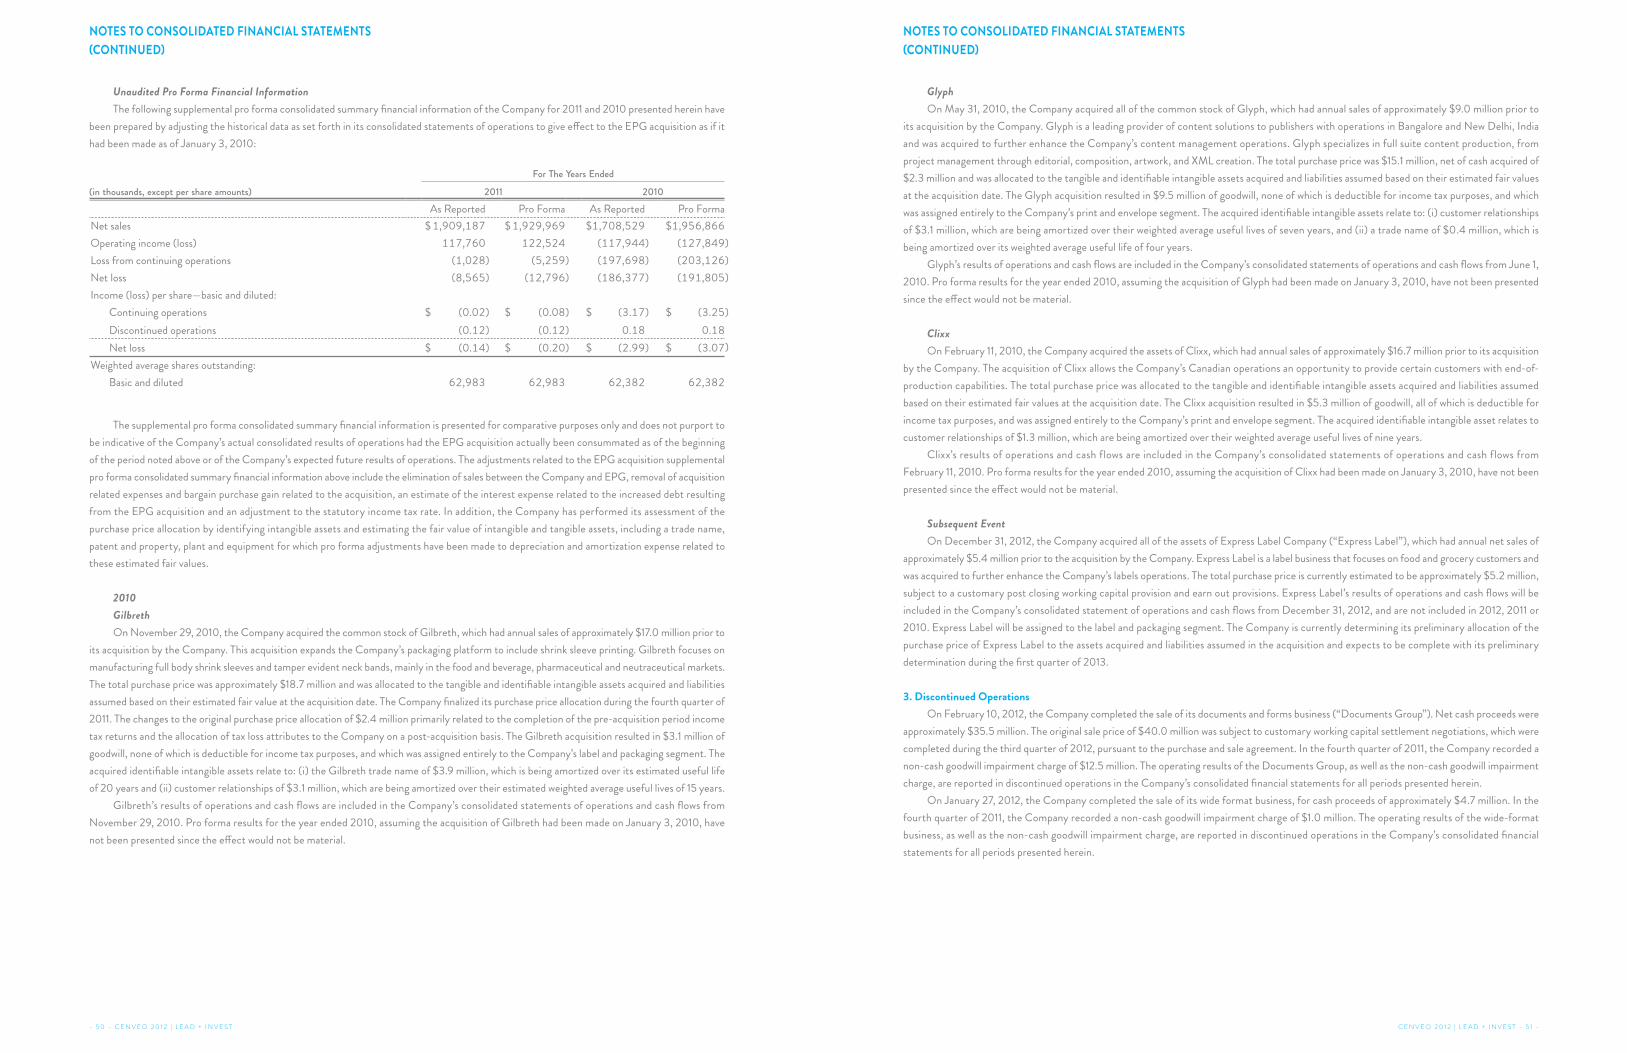
Unaudited Pro Forma Financial InformationThe following supplemental pro forma consolidated summary financial information of the Company for 2011 and 2010 presented herein have
been prepared by adjusting the historical data as set forth in its consolidated statements of operations to give effect to the EPG acquisition as if it
had been made as of January 3, 2010:
For The Years Ended
(in thousands, except per share amounts) 2011 2010As Reported Pro Forma As Reported Pro Forma
Net sales $ 1,909,187 $ 1,929,969 $1,708,529 $1,956,866
Operating income (loss) 117,760 122,524 (117,944) (127,849)
Loss from continuing operations (1,028) (5,259) (197,698) (203,126)
Net loss (8,565) (12,796) (186,377) (191,805)
Income (loss) per share—basic and diluted:
Continuing operations $ (0.02) $ (0.08) $ (3.17) $ (3.25)
Discontinued operations (0.12) (0.12) 0.18 0.18
Net loss $ (0.14) $ (0.20) $ (2.99) $ (3.07)
Weighted average shares outstanding:
Basic and diluted 62,983 62,983 62,382 62,382
The supplemental pro forma consolidated summary financial information is presented for comparative purposes only and does not purport to
be indicative of the Company’s actual consolidated results of operations had the EPG acquisition actually been consummated as of the beginning
of the period noted above or of the Company’s expected future results of operations. The adjustments related to the EPG acquisition supplemental
pro forma consolidated summary financial information above include the elimination of sales between the Company and EPG, removal of acquisition
related expenses and bargain purchase gain related to the acquisition, an estimate of the interest expense related to the increased debt resulting
from the EPG acquisition and an adjustment to the statutory income tax rate. In addition, the Company has performed its assessment of the
purchase price allocation by identifying intangible assets and estimating the fair value of intangible and tangible assets, including a trade name,
patent and property, plant and equipment for which pro forma adjustments have been made to depreciation and amortization expense related to
these estimated fair values.
2010GilbrethOn November 29, 2010, the Company acquired the common stock of Gilbreth, which had annual sales of approximately $17.0 million prior to
its acquisition by the Company. This acquisition expands the Company’s packaging platform to include shrink sleeve printing. Gilbreth focuses on
manufacturing full body shrink sleeves and tamper evident neck bands, mainly in the food and beverage, pharmaceutical and neutraceutical markets.
The total purchase price was approximately $18.7 million and was allocated to the tangible and identifiable intangible assets acquired and liabilities
assumed based on their estimated fair value at the acquisition date. The Company finalized its purchase price allocation during the fourth quarter of
2011. The changes to the original purchase price allocation of $2.4 million primarily related to the completion of the pre-acquisition period income
tax returns and the allocation of tax loss attributes to the Company on a post-acquisition basis. The Gilbreth acquisition resulted in $3.1 million of
goodwill, none of which is deductible for income tax purposes, and which was assigned entirely to the Company’s label and packaging segment. The
acquired identifiable intangible assets relate to: (i) the Gilbreth trade name of $3.9 million, which is being amortized over its estimated useful life
of 20 years and (ii) customer relationships of $3.1 million, which are being amortized over their estimated weighted average useful lives of 15 years.
Gilbreth’s results of operations and cash flows are included in the Company’s consolidated statements of operations and cash flows from
November 29, 2010. Pro forma results for the year ended 2010, assuming the acquisition of Gilbreth had been made on January 3, 2010, have
not been presented since the effect would not be material.
GlyphOn May 31, 2010, the Company acquired all of the common stock of Glyph, which had annual sales of approximately $9.0 million prior to
its acquisition by the Company. Glyph is a leading provider of content solutions to publishers with operations in Bangalore and New Delhi, India
and was acquired to further enhance the Company’s content management operations. Glyph specializes in full suite content production, from
project management through editorial, composition, artwork, and XML creation. The total purchase price was $15.1 million, net of cash acquired of
$2.3 million and was allocated to the tangible and identifiable intangible assets acquired and liabilities assumed based on their estimated fair values
at the acquisition date. The Glyph acquisition resulted in $9.5 million of goodwill, none of which is deductible for income tax purposes, and which
was assigned entirely to the Company’s print and envelope segment. The acquired identifiable intangible assets relate to: (i) customer relationships
of $3.1 million, which are being amortized over their weighted average useful lives of seven years, and (ii) a trade name of $0.4 million, which is
being amortized over its weighted average useful life of four years.
Glyph’s results of operations and cash flows are included in the Company’s consolidated statements of operations and cash flows from June 1,
2010. Pro forma results for the year ended 2010, assuming the acquisition of Glyph had been made on January 3, 2010, have not been presented
since the effect would not be material.
ClixxOn February 11, 2010, the Company acquired the assets of Clixx, which had annual sales of approximately $16.7 million prior to its acquisition
by the Company. The acquisition of Clixx allows the Company’s Canadian operations an opportunity to provide certain customers with end-of-
production capabilities. The total purchase price was allocated to the tangible and identifiable intangible assets acquired and liabilities assumed
based on their estimated fair values at the acquisition date. The Clixx acquisition resulted in $5.3 million of goodwill, all of which is deductible for
income tax purposes, and was assigned entirely to the Company’s print and envelope segment. The acquired identifiable intangible asset relates to
customer relationships of $1.3 million, which are being amortized over their weighted average useful lives of nine years.
Clixx’s results of operations and cash flows are included in the Company’s consolidated statements of operations and cash flows from
February 11, 2010. Pro forma results for the year ended 2010, assuming the acquisition of Clixx had been made on January 3, 2010, have not been
presented since the effect would not be material.
Subsequent EventOn December 31, 2012, the Company acquired all of the assets of Express Label Company (“Express Label”), which had annual net sales of
approximately $5.4 million prior to the acquisition by the Company. Express Label is a label business that focuses on food and grocery customers and
was acquired to further enhance the Company’s labels operations. The total purchase price is currently estimated to be approximately $5.2 million,
subject to a customary post closing working capital provision and earn out provisions. Express Label’s results of operations and cash flows will be
included in the Company’s consolidated statement of operations and cash flows from December 31, 2012, and are not included in 2012, 2011 or
2010. Express Label will be assigned to the label and packaging segment. The Company is currently determining its preliminary allocation of the
purchase price of Express Label to the assets acquired and liabilities assumed in the acquisition and expects to be complete with its preliminary
determination during the first quarter of 2013.
3. Discontinued OperationsOn February 10, 2012, the Company completed the sale of its documents and forms business (“Documents Group”). Net cash proceeds were
approximately $35.5 million. The original sale price of $40.0 million was subject to customary working capital settlement negotiations, which were
completed during the third quarter of 2012, pursuant to the purchase and sale agreement. In the fourth quarter of 2011, the Company recorded a
non-cash goodwill impairment charge of $12.5 million. The operating results of the Documents Group, as well as the non-cash goodwill impairment
charge, are reported in discontinued operations in the Company’s consolidated financial statements for all periods presented herein.
On January 27, 2012, the Company completed the sale of its wide format business, for cash proceeds of approximately $4.7 million. In the
fourth quarter of 2011, the Company recorded a non-cash goodwill impairment charge of $1.0 million. The operating results of the wide-format
business, as well as the non-cash goodwill impairment charge, are reported in discontinued operations in the Company’s consolidated financial
statements for all periods presented herein.
- 5 0 - C E N V E O 2 0 1 2 | L E A D + I N V E S T C E N V E O 2 0 1 2 | L E A D + I N V E S T - 5 1 -
NOTES TO CONSOLIDATED FINANCIAL STATEMENTS(CONTINUED)
NOTES TO CONSOLIDATED FINANCIAL STATEMENTS(CONTINUED)
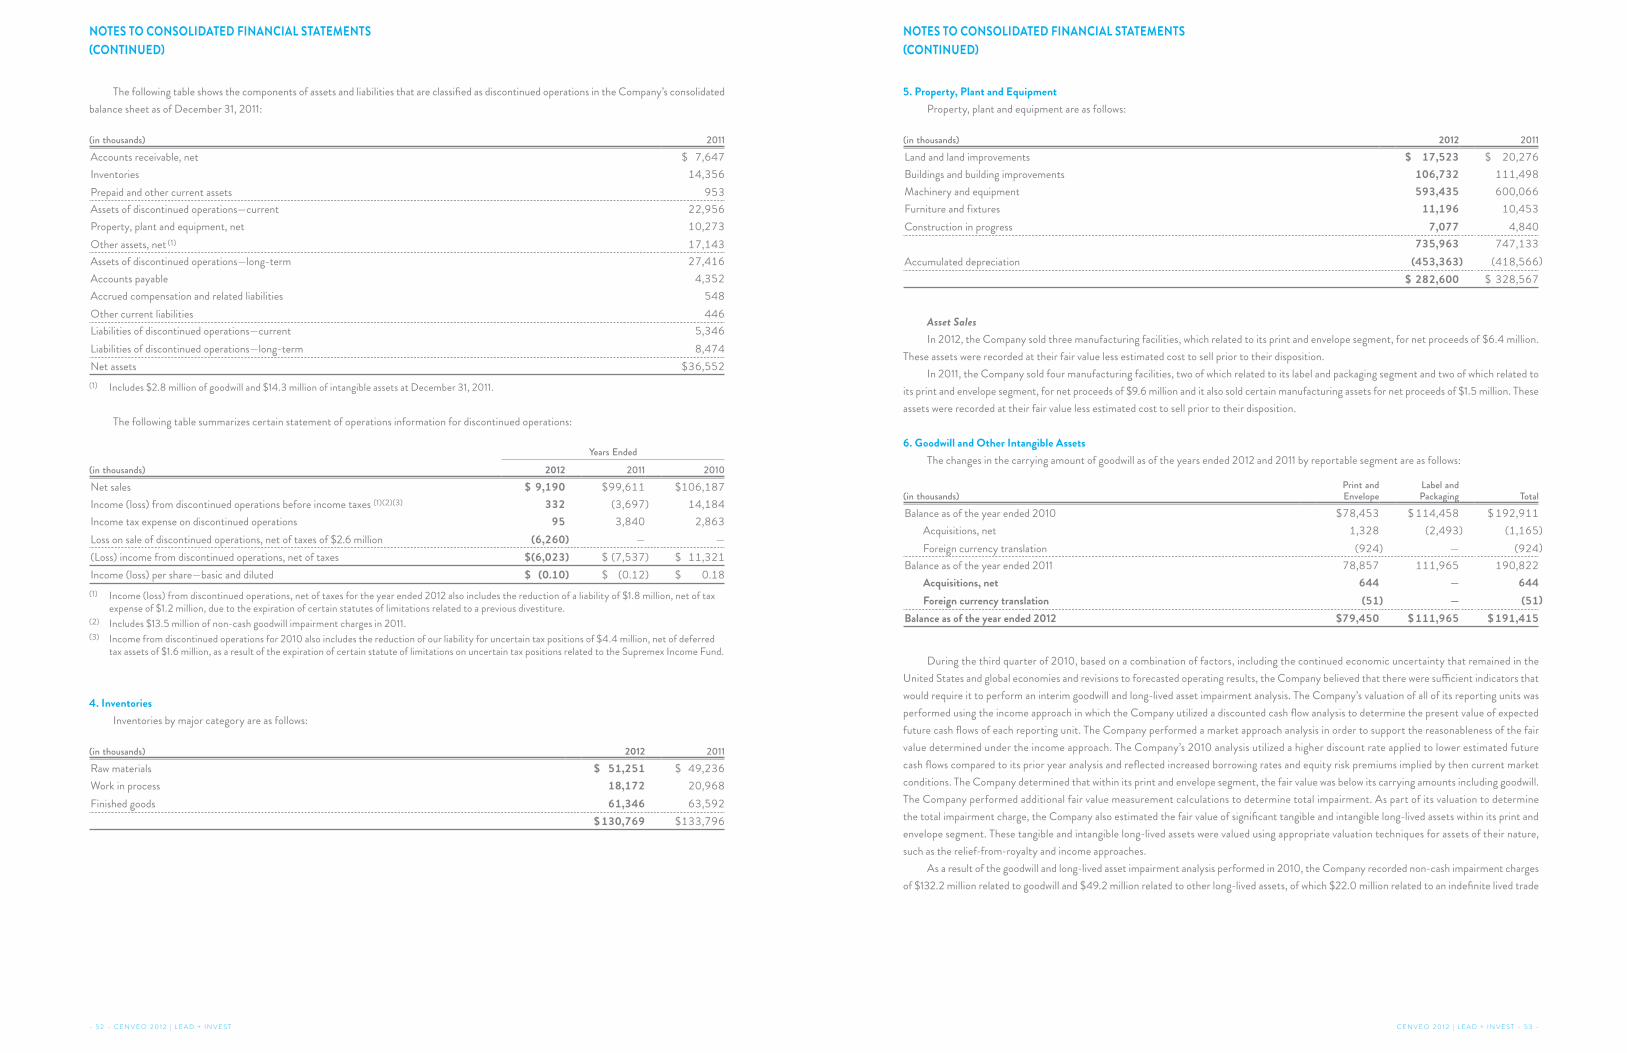
The following table shows the components of assets and liabilities that are classified as discontinued operations in the Company’s consolidated
balance sheet as of December 31, 2011:
(in thousands) 2011
Accounts receivable, net $ 7,647
Inventories 14,356
Prepaid and other current assets 953
Assets of discontinued operations—current 22,956
Property, plant and equipment, net 10,273
Other assets, net (1) 17,143
Assets of discontinued operations—long-term 27,416
Accounts payable 4,352
Accrued compensation and related liabilities 548
Other current liabilities 446
Liabilities of discontinued operations—current 5,346
Liabilities of discontinued operations—long-term 8,474
Net assets $36,552
(1) Includes $2.8 million of goodwill and $14.3 million of intangible assets at December 31, 2011.
The following table summarizes certain statement of operations information for discontinued operations:
Years Ended
(in thousands) 2012 2011 2010
Net sales $ 9,190 $99,611 $106,187
Income (loss) from discontinued operations before income taxes (1)(2)(3) 332 (3,697) 14,184
Income tax expense on discontinued operations 95 3,840 2,863
Loss on sale of discontinued operations, net of taxes of $2.6 million (6,260) — —
(Loss) income from discontinued operations, net of taxes $(6,023) $ (7,537) $ 11,321
Income (loss) per share—basic and diluted $ (0.10) $ (0.12) $ 0.18
(1) Income (loss) from discontinued operations, net of taxes for the year ended 2012 also includes the reduction of a liability of $1.8 million, net of tax expense of $1.2 million, due to the expiration of certain statutes of limitations related to a previous divestiture.
(2) Includes $13.5 million of non-cash goodwill impairment charges in 2011.(3) Income from discontinued operations for 2010 also includes the reduction of our liability for uncertain tax positions of $4.4 million, net of deferred
tax assets of $1.6 million, as a result of the expiration of certain statute of limitations on uncertain tax positions related to the Supremex Income Fund.
4. Inventories
Inventories by major category are as follows:
(in thousands) 2012 2011
Raw materials $ 51,251 $ 49,236
Work in process 18,172 20,968
Finished goods 61,346 63,592
$ 130,769 $133,796
5. Property, Plant and Equipment
Property, plant and equipment are as follows:
(in thousands) 2012 2011
Land and land improvements $ 17,523 $ 20,276
Buildings and building improvements 106,732 111,498
Machinery and equipment 593,435 600,066
Furniture and fixtures 11,196 10,453
Construction in progress 7,077 4,840
735,963 747,133
Accumulated depreciation (453,363) (418,566)
$ 282,600 $ 328,567
Asset SalesIn 2012, the Company sold three manufacturing facilities, which related to its print and envelope segment, for net proceeds of $6.4 million.
These assets were recorded at their fair value less estimated cost to sell prior to their disposition.
In 2011, the Company sold four manufacturing facilities, two of which related to its label and packaging segment and two of which related to
its print and envelope segment, for net proceeds of $9.6 million and it also sold certain manufacturing assets for net proceeds of $1.5 million. These
assets were recorded at their fair value less estimated cost to sell prior to their disposition.
6. Goodwill and Other Intangible Assets
The changes in the carrying amount of goodwill as of the years ended 2012 and 2011 by reportable segment are as follows:
(in thousands)Print and Envelope
Label and Packaging Total
Balance as of the year ended 2010 $78,453 $ 114,458 $ 192,911
Acquisitions, net 1,328 (2,493) (1,165)
Foreign currency translation (924) — (924)
Balance as of the year ended 2011 78,857 111,965 190,822
Acquisitions, net 644 — 644
Foreign currency translation (51) — (51)
Balance as of the year ended 2012 $79,450 $ 111,965 $ 191,415
During the third quarter of 2010, based on a combination of factors, including the continued economic uncertainty that remained in the
United States and global economies and revisions to forecasted operating results, the Company believed that there were sufficient indicators that
would require it to perform an interim goodwill and long-lived asset impairment analysis. The Company’s valuation of all of its reporting units was
performed using the income approach in which the Company utilized a discounted cash flow analysis to determine the present value of expected
future cash flows of each reporting unit. The Company performed a market approach analysis in order to support the reasonableness of the fair
value determined under the income approach. The Company’s 2010 analysis utilized a higher discount rate applied to lower estimated future
cash flows compared to its prior year analysis and reflected increased borrowing rates and equity risk premiums implied by then current market
conditions. The Company determined that within its print and envelope segment, the fair value was below its carrying amounts including goodwill.
The Company performed additional fair value measurement calculations to determine total impairment. As part of its valuation to determine
the total impairment charge, the Company also estimated the fair value of significant tangible and intangible long-lived assets within its print and
envelope segment. These tangible and intangible long-lived assets were valued using appropriate valuation techniques for assets of their nature,
such as the relief-from-royalty and income approaches.
As a result of the goodwill and long-lived asset impairment analysis performed in 2010, the Company recorded non-cash impairment charges
of $132.2 million related to goodwill and $49.2 million related to other long-lived assets, of which $22.0 million related to an indefinite lived trade
- 5 2 - C E N V E O 2 0 1 2 | L E A D + I N V E S T C E N V E O 2 0 1 2 | L E A D + I N V E S T - 5 3 -
NOTES TO CONSOLIDATED FINANCIAL STATEMENTS
(CONTINUED)
NOTES TO CONSOLIDATED FINANCIAL STATEMENTS
(CONTINUED)

name and $27.2 million related to customer relationships within its print and envelope segment. The Company believes that these charges primarily
resulted from reductions in the estimated fair value of this reporting unit due to: (i) higher discount rates applied to lower estimated future cash
flows and (ii) continued economic uncertainty, which has increased customer cost awareness resulting in continued price pressures, lower page
counts, and a shift from historical web and sheet-fed print products to lower cost digital print products.
Other intangible assets are as follows:
2012 2011
(in thousands)
Weighted Average
Remaining Amortization
Period (Years)
Gross Carrying Amount
Accumulated Impairment
ChargesAccumulated Amortization
Net Carrying Amount
Gross Carrying Amount
Accumulated Impairment
ChargesAccumulated Amortization
Net Carrying Amount
Intangible assets with definite lives:
Customerrelationships 10 $166,600 $(27,234) $(63,772) $ 75,594 $166,652 $(27,234) $(54,911) $ 84,507
Trademarks and trade names 23 23,471 — (6,590) 16,881 23,481 — (5,620) 17,861
Patents 9 3,528 — (2,839) 689 3,528 — (2,583) 945
Non-compete agreements 510 — (510) — 510 — (439) 71
Other — — — — 600 — (161) 439
Subtotal 13 194,109 (27,234) (73,711) 93,164 194,771 (27,234) (63,714) 103,823
Intangible assets with indefinite lives:
Trademarks 141,740 (22,000) — 119,740 141,740 (22,000) — 119,740
Total $335,849 $(49,234) $(73,711) $212,904 $336,511 $(49,234) $(63,714) $223,563
Annual amortization expense of intangible assets for the next five years is estimated to be as follows:
(in thousands) Annual
Estimated Expense2013 $9,959
2014 9,718
2015 9,631
2016 7,876
2017 7,153
Sale of AssetsIn 2012, the Company received proceeds of $5.7 million related to the buyout of a royalty agreement by a third party and certain other
intellectual property. Prior to its sale, the royalty agreement was accounted for as an intangible asset in the Company’s consolidated balance sheet.
As a result of these transactions, the Company recorded a gain of $2.8 million in other (income) expense, net in its consolidated statement of
operations.
7. Other Current Liabilities
Other current liabilities are as follows:
(in thousands) 2012 2011Accrued interest expense $20,671 $24,547
Accrued customer rebates 16,281 20,557
Restructuring liabilities 7,474 6,241
Other accrued liabilities 33,466 44,562
$77,892 $95,907
8. Long-Term Debt
Long-term debt is as follows:
(in thousands) 2012 2011Revolving credit facility, due 2014 $ 18,000 $ —
7.875% senior subordinated notes, due 2013 67,848 284,878
8.375% senior subordinated notes, due 2014 ($25.2 million outstanding principal amount as of the year ended 2011) — 25,424
Term Loan B, due 2016 ($388.2 million and $356.2 million outstanding principal amount as of the years ended 2012 and 2011, respectively) 385,547 353,033
10.5% senior notes, due 2016 — 170,000
7% senior exchangeable notes, due 2017 86,250 —
11.5% senior notes, due 2017 ($225.0 million outstanding principal amount as of the year ended 2012) 217,675 —
8.875% senior second lien notes, due 2018 ($400.0 million outstanding principal amount as of the years ended 2012 and 2011) 398,001 397,704
Other debt including capital leases 10,297 15,304
1,183,618 1,246,343
Less current maturities (11,748) (8,809)
Long-term debt $1,171,870 $1,237,534
The estimated fair value of the Company’s long-term debt was approximately $1.2 billion and $1.1 billion as of the years ended 2012 and 2011,
respectively. The fair value was determined by the Company to be Level 2 under the fair value hierarchy and was based upon review of observable
pricing in secondary markets for each debt instrument. Interest expense in 2012 reflected average outstanding debt of approximately $1.3 billion
and a weighted average interest rate of 8.2%, compared to the average outstanding debt of approximately $1.4 billion and a weighted average
interest rate of 8.0% in 2011. Cash interest payments on long-term debt were $110.7 million, $111.0 million and $102.7 million in 2012, 2011 and
2010, respectively.
2010 Credit FacilitiesOn December 14, 2012, the Company issued $15 million aggregate principal amount of additional term loans (the “$15 million Term Loan
Add-On” and together with a $65 million aggregate principal amount of additional term loans issued in June 2012, the “Term Loan Add-On”) under
its senior secured credit agreement, which includes a $170 million revolving credit facility due 2014 (the “2010 Revolving Credit Facility”) and a
$380 million term loan due 2016 (the “Term Loan B”) (collectively with the Term Loan Add-On and 2010 Revolving Credit Facility, the “2010
Credit Facilities”). The $15 million Term Loan Add-On was issued at par. Concurrently with the $15 million Term Loan Add-On, the Company
amended the 2010 Credit Facilities (the “December 2012 Amendment”) to allow the Company to incur up to $50 million of indebtedness under
a new unsecured term loan to be prepaid on substantially similar terms as the Company’s 7.875% senior subordinated notes due 2013 (the “7.875%
Notes”), subject to maintaining certain liquidity thresholds and other customary conditions. The Company capitalized debt issuance costs of
$2.7 million, which is amortized over the remaining life of the 2010 Credit Facilities. Consenting lenders received $2.6 million, which was capitalized
and is amortized over the remaining life of the 2010 Credit Facilities.
On June 8, 2012, the Company issued $65 million aggregate principal amount of additional term loans (the “$65 million Term Loan Add-On”)
under its 2010 Credit Facilities. The $65 million Term Loan Add-On was issued at a discount of approximately $0.7 million. Concurrently with the
$65 million Term Loan Add-On, the Company amended the 2010 Credit Facilities (the “Add-On Amendment”) to allow for the repurchase of up
to $135 million of its 7.875% Notes, subject to maintaining certain liquidity thresholds and other customary conditions. The Company capitalized
debt issuance costs of $1.1 million, which is amortized over the remaining life of the 2010 Credit Facilities. Consenting lenders received $2.0 million
for the Add-On Amendment, of which $1.8 million was capitalized and is amortized over the remaining life of the 2010 Credit Facilities.
On February 3, 2012, the Company amended the 2010 Credit Facilities (the “2012 Amendment”) to increase its restricted dispositions
basket in connection with the sale of the Documents Group. The 2012 Amendment required that 25% of the net proceeds of such sale be used
to repay the Term Loan B and requires that the remaining amount be used to reinvest in the business or refinance certain existing debt. On
February 14, 2012, the Company repaid $9.5 million of the Term Loan B in connection with this provision. The 2012 Amendment required the
Company to prepay unsecured debt, second lien debt and/or the loans under the 2010 Credit Facilities within 360 days after the effective date of
the 2012 Amendment in an amount equal to 75% of the net proceeds. In connection with the 2012 Amendment, the Company paid $1.7 million
to consenting lenders and related fees, which are included in discontinued operations in the consolidated statement of operations.
- 5 4 - C E N V E O 2 0 1 2 | L E A D + I N V E S T C E N V E O 2 0 1 2 | L E A D + I N V E S T - 5 5 -
NOTES TO CONSOLIDATED FINANCIAL STATEMENTS
(CONTINUED)
NOTES TO CONSOLIDATED FINANCIAL STATEMENTS
(CONTINUED)

Effective March 5, 2012, the Company increased its borrowing capacity under the 2010 Revolving Credit Facility to $170 million from
$150 million as a result of receiving an additional commitment, as permitted under the 2010 Credit Facilities. In connection with this increase, the
Company capitalized debt issuance costs of $1.0 million, which is amortized over the life of the 2010 Revolving Credit Facility. On March 9, 2012,
the Company repaid $34.7 million of its Term Loan B as part of its required excess cash flow pre-payment.
On October 28, 2011, the Company completed an amendment to allow the Company to repurchase up to $30.0 million of its outstanding
notes, subject to a maximum leverage ratio and the satisfaction of certain other conditions. In connection with the amendment, the Company paid
$2.6 million to consenting lenders and related fees, which is capitalized and amortized to interest expense, net in the consolidated statement of
operations over the remaining life of the 2010 Credit Facilities.
In connection with the issuance of the 2010 Credit Facilities, the Term Loan B was issued at a discount of $3.8 million, of which $2.7 million
and $3.2 million remains unamortized as of the years ended 2012 and 2011. The Company incurred a loss on early extinguishment of debt of
$7.0 million, of which $4.8 million relates to fees paid to consenting lenders and $2.2 million relates to the write-off of previously unamortized debt
issuance costs. In addition, the Company capitalized $5.3 million, of which $3.4 million relates to fees paid to consenting lenders and $1.9 million
relates to expenses, both of which are being amortized over the remaining life of the 2010 Credit Facilities.
The Company may from time to time seek to purchase its outstanding notes in open market purchases, privately negotiated transactions or
other means. Such repurchases, if any, will depend on prevailing market conditions, the Company’s liquidity requirements, contractual restrictions
and other factors.
7.875% NotesIn 2004, the Company issued $320.0 million of the 7.875% Notes, with semi-annual interest payments due on June 1 and December 1, and no
required principal payments prior to the maturity on December 1, 2013. The Company may redeem these notes, in whole or in part, at redemption
prices from 103.938% to 100%, plus accrued and unpaid interest.
On December 17, 2012, the Company announced that it had initiated a mandatory and irrevocable redemption of all of the outstanding
7.875% Notes. Pursuant to the terms of the indenture governing these notes, the 7.875% Notes were redeemed on January 22, 2013 (the
“Redemption Date”) at a redemption price of 100.0% of the unpaid principal amount of the 7.875% Notes, together with accrued and unpaid
interest thereon up to the Redemption Date. As a result, the amount outstanding as of the year ended 2012 were reclassified to long-term debt
on the consolidated balance sheet.
In 2012, the Company purchased in the open market approximately $98.6 million of its 7.875% Notes and retired them for $96.4 million plus
accrued and unpaid interest. In connection with the retirement of these 7.875% Notes, the Company recorded a gain on early extinguishment of
debt of $1.9 million, which included the write-off of $0.3 million of unamortized debt issuance costs. In 2011, the Company purchased in the open
market approximately $11.4 million of its 7.875% Notes and retired them for $9.0 million plus accrued and unpaid interest. In connection with the
retirement of these 7.875% Notes, the Company recorded a gain on early extinguishment of debt of $2.4 million, which included the write-off of
$0.1 million of unamortized debt issuance costs.
8.375% NotesOn March 7, 2007, in connection with the acquisition of Cadmus Communications Corporation (“Cadmus”), the Company assumed the
8.375% senior subordinated notes due 2014 (“8.375% Notes”), which pay interest semi-annually on June 15 and December 15, and require no
principal payments prior to maturity on June 15, 2014.
In 2012, the Company purchased in the open market approximately $2.0 million of its 8.375% Notes and retired them for $1.6 million plus
accrued and unpaid interest. In connection with the retirement of these 8.375% Notes, the Company recorded a gain on early extinguishment of
debt of $0.4 million, which included the write-off of $0.1 million of unamortized debt issuance costs. In 2011, the Company purchased in the open
market approximately $7.0 million of its 8.375% Notes and retired them for $5.4 million plus accrued and unpaid interest. In connection with the
retirement of these 8.375% Notes, the Company recorded a gain on early extinguishment of debt of $1.7 million, which included the write-off of
$0.1 million of the above noted fair value increase to the 8.375% Notes.
10.5% NotesOn June 13, 2008, the Company issued the 10.5% senior notes due 2016 (“10.5% Notes”) upon the conversion of the Company’s Senior
Unsecured Loan. The 10.5% Notes were then sold to qualified institutional buyers in accordance with Rule 144A under the Securities Act of 1933,
and to certain non-United States persons in accordance with Regulation S under the Securities Act of 1933. The Company did not receive any net
proceeds as a result of this transaction. The 10.5% Notes pay interest semi-annually on February 15 and August 15, and have no required principal
payments prior to their maturity on August 15, 2016. The Company can redeem the 10.5% Notes, in whole or in part, on or after August 15, 2012,
at redemption prices ranging from 100% to 105.25%, plus accrued and unpaid interest.
In 2012, the Company purchased in the open market approximately $5.0 million of its 10.5% Notes and retired them for $4.9 million plus
accrued and unpaid interest. In connection with the retirement of these 10.5% Notes, the Company recorded a gain on early extinguishment of
debt of $0.1 million, which included the write-off of $0.1 million of unamortized debt issuance costs.
11.5% Senior NotesOn March 28, 2012, the Company issued $225 million aggregate principal amount of 11.5% senior notes due 2017 (the “11.5% Notes”) that
were sold with registration rights to qualified institutional buyers in accordance with Rule 144A under the Securities Act of 1933, and to certain
non-U.S. persons in accordance with Regulation S under the Securities Act of 1933. The 11.5% Notes were issued at a discount of approximately
$8.3 million, of which $7.3 million remains unamortized as of the year ended 2012. The 11.5% Notes were issued pursuant to an indenture (the
“11.5% Indenture”) among the Company, certain subsidiary guarantors and U.S. Bank National Association, as trustee. The Company will pay
interest on the 11.5% Notes, semi-annually, in cash in arrears, on May 15 and November 15 of each year commencing May 15, 2012. The 11.5%
Notes have no required principal payments prior to their maturity on May 15, 2017. The 11.5% Notes are guaranteed on a senior unsecured basis
by the Company and substantially all of its existing and future North American subsidiaries. As such, the 11.5% Notes rank pari passu with all of the
Company’s existing and future senior debt and senior to any of the Company’s subordinated debt. The Company may redeem the 11.5% Notes, in
whole or in part, on or after May 15, 2015, at redemption prices ranging from 100% to 105.75%, plus accrued and unpaid interest. In addition, at
any time prior to May 15, 2015, the Company may redeem up to 35% of the aggregate principal amount of the notes originally issued with the net
cash proceeds of certain public equity offerings, at a redemption price of 111.50%, plus accrued and unpaid interest. The Company may also redeem
some or all of the 11.5% Notes before May 15, 2015 at a redemption price of 100% of the principal amount, plus accrued and unpaid interest, if
any, to the redemption date, plus a “make whole” premium. Each holder of the 11.5% Notes has the right to require the Company to repurchase
such holder’s notes at a purchase price of 101% of the principal amount thereof, plus accrued and unpaid interest thereon, upon the occurrence of
certain events specified in the indenture that constitute a change of control. The 11.5% Indenture contains a number of covenants that, among other
things, restrict, subject to certain exceptions, the Company’s ability and the ability of the Company’s subsidiaries to incur or guarantee additional
indebtedness, make restricted payments (including paying dividends on, redeeming or repurchasing our capital stock), permit restricted subsidiaries
to pay dividends or make other distributions or payments, dispose of assets, make investments, grant liens on assets, merge or consolidate or transfer
certain assets, and enter into transactions with affiliates. The 11.5% Indenture also contains certain customary affirmative covenants. In order to fulfill
its registration rights obligations, on May 10, 2012, the Company launched a registered exchange offer (the “Exchange Offer”) to exchange any
and all of its unregistered 11.5% Notes for publicly tradable notes having substantially identical terms, except for the elimination of some transfer
restrictions, registration rights and additional interest payments relating to the outstanding notes. The Exchange Offer expired on June 18, 2012.
7% Senior Exchangeable NotesConcurrently with the issuance of the 11.5% Notes, the Company issued $86.3 million aggregate principal amount of senior exchangeable
notes due 2017 (the “7% Notes”) that were sold to qualified institutional buyers in accordance with Rule 144A under the Securities Act of 1933.
The 7% Notes were issued pursuant to an indenture (the “7% Indenture”) among the Company, certain subsidiary guarantors and U.S. Bank
National Association, as trustee. The Company will pay interest on the 7% Notes semi-annually, in cash in arrears, on May 15 and November 15 of
each year, commencing November 15, 2012. The 7% Notes have no required principal payments prior to their maturity on May 15, 2017. The 7%
Notes are guaranteed on a senior unsecured basis by the Company and substantially all of its existing and future North American subsidiaries. As
such, the 7% Notes rank pari passu with all of the Company’s existing and future senior debt and senior to any of the Company’s subordinated debt.
The Company may not redeem the notes at its option. Upon a fundamental change, as defined in the 7% Indenture, each holder of 7% Notes may
require the Company to repurchase all or a portion of such holder’s notes for cash at a repurchase price equal to 100% of the principal amount of
the notes to be repurchased, plus any accrued and unpaid interest to, but excluding, the fundamental change repurchase date, as defined in the 7%
Indenture. The 7% Indenture does not contain any financial covenants or any restrictions, among other things, on the payment of dividends, the
incurrence of other indebtedness, or the issuance or repurchase of securities by the Company. The 7% Indenture does not contain any covenants or
other provisions to protect holders of the notes in the event of a highly leveraged transaction or a change of control, except to the extent described
in the 7% Indenture.
The 7% Notes are exchangeable at any time prior to the close of business on the business day immediately preceding the maturity date for
shares of the Company’s common stock at an exchange rate of 241.5167 shares per $1,000 principal amount of 7% Notes, which is equal to an
exchange price of approximately $4.14 per share, subject to adjustment under certain specified circumstances. This represents a premium of 22.5%
above the last reported sale price of Cenveo’s common stock on the New York Stock Exchange on Thursday, March 22, 2012, which was $3.38 per
- 5 6 - C E N V E O 2 0 1 2 | L E A D + I N V E S T C E N V E O 2 0 1 2 | L E A D + I N V E S T - 5 7 -
NOTES TO CONSOLIDATED FINANCIAL STATEMENTS(CONTINUED)
NOTES TO CONSOLIDATED FINANCIAL STATEMENTS(CONTINUED)

share. If a holder elects to exchange notes in connection with a make-whole fundamental change, as described in the 7% Indenture, such holder
may also be entitled to receive a make-whole premium upon exchange in certain circumstances.
Net proceeds of the 11.5% Notes and 7% Notes together with borrowings under the Company’s 2010 Revolving Credit Facility were used to
fund the cash tender offers for any and all of the Company’s 8.375% Notes and 10.5% Notes, plus $45 million aggregate principal amount of the
Company’s 7.875% Notes and to repurchase an additional $73.4 million of 7.875% Notes through open market, negotiated purchases to refinance
such indebtedness, and to pay related fees and expenses. In connection with the issuance of the 11.5% Notes and the 7% Notes, the Company
capitalized debt issuance costs of $6.0 million and $3.0 million, respectively, all of which will be amortized over the life of the 11.5% Notes and the
7% Notes.
8.875% NotesIn 2010, the Company issued $400 million of 8.875% senior second lien notes (“8.875% Notes”) that were sold with registration rights
to qualified institutional buyers in accordance with Rule 144A under the Securities Act of 1933, and to certain non-United States persons in
accordance with Regulation S under the Securities Act of 1933. The 8.875% Notes were issued at a discount of approximately $2.8 million, of
which approximately $2.0 million and $2.3 million remained unamortized as of the years ended 2012 and 2011, respectively. Net proceeds after
fees and expenses were used to pay down $300.0 million of the Company’s outstanding senior secured term loans and $88.0 million outstanding
under the Company’s then existing senior secured revolving credit facility.
The 8.875% Notes were issued pursuant to an indenture among Cenveo Corporation, certain subsidiary guarantors and Wells Fargo Bank,
National Association, as trustee, and an Intercreditor Agreement among Cenveo Corporation, certain subsidiary guarantors, Bank of America,
N.A., as first lien agent and control agent, and Wells Fargo Bank, National Association, as second lien collateral agent. The 8.875% Notes pay
interest semi-annually on February 1 and August 1, commencing August 1, 2010. The 8.875% Notes have no required principal payments prior to
their maturity on February 1, 2018. The 8.875% Notes are guaranteed on a senior secured basis by Cenveo, Inc. and substantially all of its domestic
subsidiaries with a second priority lien on substantially all of the assets that secure the 2010 Credit Facilities, and on a senior unsecured basis by
substantially all of the Canadian subsidiaries. As such the 8.875% Notes rank pari passu with all the Company’s senior debt and senior in right of
payment to all of the Company’s subordinated debt. The Company can redeem the 8.875% Notes, in whole or in part, on or after February 1,
2014, at redemption prices ranging from 100.0% to approximately 104.4%, plus accrued and unpaid interest. In addition, at any time prior to
February 1, 2013, the Company may redeem up to 35% of the aggregate principal amount of the notes originally issued with the net cash proceeds
of certain public equity offerings. The Company may also redeem up to 10% of the aggregate principal amount of notes per twelve-month period
before February 1, 2014 at a redemption price of 103% of the principal amount, plus accrued and unpaid interest, and redeem some or all of the
notes before February 1, 2014 at a redemption price of 100% of the principal amount, plus accrued and unpaid interest, if any, to the redemption
date, plus a “make whole” premium. Each holder of the 8.875% Notes has the right to require the Company to repurchase such holder’s notes at a
purchase price of 101% of the principal amount thereof, plus accrued and unpaid interest thereon, upon the occurrence of certain events specified
in the indenture that constitute a change in control. The 8.875% Notes contain customary covenants, representations and warranties, plus a
consolidated secured debt to consolidated cash flow liens incurrence test. In order to fulfill its registration rights obligations, on April 28, 2010,
the Company launched a registered exchange offer (“Exchange Offer”) to exchange any and all of its outstanding unregistered 8.875% Notes for
publicly tradable notes having substantially identical terms and guarantees, except that the exchange notes will be freely tradable. The Exchange
Offer expired on May 26, 2010, and nearly all unregistered 8.875% Notes were exchanged for registered 8.875% Notes.
In connection with this refinancing, the Company incurred a loss on early extinguishment of debt of $2.6 million, of which $1.1 million relates
to the write-off of previously unamortized debt issuance costs and $1.5 million relates to fees paid to consenting lenders. In addition, the Company
capitalized $2.1 million of which $1.5 million relates to amendment expenses and $0.6 million relates to fees paid to consenting lenders, both of
which will be amortized over the remaining life of the 2010 Credit Facilities. In connection with the issuance of the 8.875% Notes, the Company
capitalized $9.4 million of which $7.6 million relates to fees paid to consenting lenders and $1.8 million relates to offering expenses, all of which will
be amortized over the eight year life of the 8.875% Notes.
Debt ComplianceThe 2010 Credit Facilities contain certain restrictions that, among other things and with certain exceptions, limit the ability of the Company
to incur additional indebtedness, prepay subordinated debt, transfer assets outside of the Company, pay dividends or repurchase shares of the
Company’s common stock. The 2010 Credit Facilities also contain customary financial covenants, including a maximum consolidated leverage
covenant, a maximum consolidated first lien leverage covenant and a minimum consolidated interest coverage covenant.
Additionally, pursuant to the December 2012 Amendment, the interest rate margin for all loans under the 2010 Credit Facilities increased to
(i) 5.50% from 5.125% per annum for London Interbank Offered Rate (“LIBOR”) based loans and (ii) 4.50% from 4.125% per annum for prime rate
loans. A LIBOR floor of 1.50% for the 2010 Revolving Credit Facility was also established. This amendment also modified the financial covenants,
including (i) increasing the maximum consolidated first lien leverage ratio covenant to 2.65x with a step-down to 2.40x in the first quarter of 2014
and to 2.25x in the first quarter of 2015, (ii) delaying a step down in the maximum consolidated leverage ratio from 6.50x to 6.25x until the fourth
quarter of 2013 and from 6.25x to 6.0x until the third quarter of 2014, and (iii) delaying a step-up in the minimum consolidated interest coverage
ratio from 1.60x to 1.75x until the first quarter of 2014.
The obligations under the 2010 Credit Facilities are guaranteed by the Company and each existing and future direct and indirect domestic
subsidiary of the Company. The 2010 Credit Facilities are secured by a first priority perfected security interest in substantially all assets of the
Company and its domestic subsidiaries. As the 2010 Credit Facilities have senior secured and first priority lien position in the Company’s capital
structure and the most restrictive covenants, then provided the Company is in compliance with the 2010 Credit Facilities, the Company would
also be in compliance, in most circumstances, with the Company’s incurrence tests within all of the Company’s debt indentures.
Any default under the 2010 Credit Facilities would prevent the Company from borrowing additional amounts and could cause the indebtedness
outstanding under the 2010 Credit Facilities and, by reason of cross-acceleration or cross-default provisions, all of the aforementioned notes and
any other indebtedness the Company may then have, to become immediately due and payable.
As of the year ended 2012, the Company was in compliance with all debt agreement covenants. The Company anticipates being in compliance
with all of its debt agreements throughout its 2013 fiscal year.
Other DebtOther debt as of the year ended 2012 primarily consisted of equipment loans. Of this debt, $9.1 million had an average fixed interest rate of
4.6%, while $1.2 million had variable interest rates with an average interest rate of 1.1%.
The aggregate annual maturities for long-term debt are as follows:
(in thousands) 2013 $ 11,748
2014 40,474
2015 5,805
2016 376,322
2017 361,250
Thereafter 400,000
$1,195,599
Interest Rate SwapsFrom time to time the Company enters into interest rate swap agreements to hedge interest rate exposure of notional amounts of its floating
rate debt. As of the years ended 2012 and 2011, the Company did not have any outstanding interest rate swap obligations.
Subsequent EventOn January 18, 2013, the Company entered into an unsecured credit agreement (the “Unsecured Credit Agreement”) with Macquarie US
Trading LLC, as administrative agent (the “Administrative Agent”), and the lenders named therein, which provides for an unsecured $50.0 million
aggregate principal amount term loan due March 31, 2017 (the “Unsecured Term Loan”). In connection with the Unsecured Credit Agreement,
the Company capitalized debt issuance costs of $1.5 million in 2012. In connection with the Unsecured Credit Agreement, all of the Company’s
domestic subsidiaries (other than Cenveo Corporation) as guarantors, entered into a guaranty agreement, dated as of January 18, 2013 (the
“Guaranty”), in favor of the Administrative Agent. Proceeds from the Unsecured Term Loan together with borrowings on its 2010 Revolving
Credit Facility were used to redeem, satisfy and discharge in full the Company’s 7.875% Notes, and to pay certain fees and expenses incurred in
connection with the Unsecured Credit Agreement and the redemption, satisfaction and discharge of the 7.875% Notes. On January 22, 2013,
U.S. Bank National Association, the trustee for the 7.875% Notes officially canceled the 7.875% Notes.
The Unsecured Term Loan will bear interest at a rate of 15% per annum, payable quarterly in arrears on the 25th day of each February, May,
August and November prior to the maturity of the Unsecured Term Loan and on the maturity date of the Unsecured Term Loan. If the Company
does not pay in full a quarterly excess cash flow mandatory prepayment pursuant to the terms of the Unsecured Credit Agreement, interest on
the outstanding principal amount of the Unsecured Term Loan will instead accrue at 25% per annum until the first prepayment date thereafter
when the full excess cash flow mandatory prepayment is made by the Company. In addition, for so long as the increased interest rate pursuant to
the previous sentence is not applicable, if on any interest payment date the outstanding principal amount of the Unsecured Term Loan exceeds a
specified threshold amount, which threshold amount equals $43.8 million on May 25, 2013 and decreases by $6.3 million on each interest payment
- 5 8 - C E N V E O 2 0 1 2 | L E A D + I N V E S T C E N V E O 2 0 1 2 | L E A D + I N V E S T - 5 9 -
NOTES TO CONSOLIDATED FINANCIAL STATEMENTS(CONTINUED)
NOTES TO CONSOLIDATED FINANCIAL STATEMENTS(CONTINUED)

date thereafter, then on and after each such interest payment date an additional 10% per annum will accrue on such excess. The Unsecured Credit
Agreement is guaranteed by the Company and each existing and future direct and indirect domestic subsidiary of Cenveo on an unsecured basis
pursuant to the Guaranty. The Unsecured Credit Agreement contains customary covenants that, among other things, place limits on the ability of
Cenveo, the Company, and/or the other guarantors to incur debt, create liens, make investments and acquisitions, sell assets, pay dividends, prepay
debt, merge with other entities or sell all or substantially all their assets, engage in transactions with affiliates, and make capital expenditures. The
Unsecured Credit Agreement also contains customary representations and warranties and events of default.
9. Fair Value MeasurementsCertain assets and liabilities of the Company are required to be recorded at fair value on either a recurring or non-recurring basis. Fair value is
determined based on the price that would be received for an asset or paid to transfer a liability in an orderly transaction between market participants.
The fair value of the Company’s cash and cash equivalents, accounts receivable, net, current maturities of long-term debt (Note 8) and
accounts payable approximate their carrying value due to their short term nature. On a recurring basis, the Company records its pension plan
assets (Note 13) at fair value.
The table below presents the carrying value and fair value of these assets and liabilities of the Company as of the years ended 2012 and 2011,
respectively:
2012 2011
(in thousands) Carrying Value Fair Value Carrying Value Fair ValueCash and cash equivalents $ 8,110 $ 8,110 $ 17,753 $ 17,753
Accounts receivable, net 261,611 261,611 288,483 288,483
Current maturities of long-term debt 11,748 11,748 8,809 8,809
Accounts payable 185,271 185,271 186,648 186,648
The Company is required, on a non-recurring basis, to adjust the carrying value of its long-lived assets held (Note 5), goodwill and other
intangible assets (Note 6). These assets were determined by the Company to be Level 2 and Level 3 under the fair value hierarchy and are not
measured at fair value on an ongoing basis; however, they are subject to fair value adjustments in certain circumstances, such as when there is
evidence that impairment may exist. The Company also records the assets and liabilities assumed in its acquisitions (Note 2) at fair value.
10. Income TaxesIncome Tax Expense (Benefit)Income (loss) from continuing operations before income taxes was as follows for the years ended:
(in thousands) 2012 2011 2010Domestic $(15,561) $3,617 $(259,866)
Foreign 1,764 4,832 8,966
$(13,797) $8,449 $(250,900)
Income tax expense (benefit) on income (loss) from continuing operations consisted of the following for the years ended:
(in thousands) 2012 2011 2010Current tax expense (benefit):
Federal $ — $(4,113) $ (5,574)
Foreign 295 1,361 1,655
State 874 436 (468)
1,169 (2,316) (4,387)
Deferred expense (benefit):
Federal 44,568 11,165 (39,373)
Foreign (748) 1,000 (278)
State 15,078 (372) (9,164)
58,898 11,793 (48,815)
Income tax expense (benefit) $60,067 $ 9,477 $(53,202)
The Company’s deferred tax expense (benefit) for the year ended 2012 includes a tax charge of $56.5 million related to a valuation allowance
against its deferred tax assets.
The Company’s current tax expense (benefit) for the year ended 2011 includes a tax benefit of $5.1 million for the utilization of income tax
loss carryforwards and credits.
A reconciliation of the expected tax expense (benefit) based on the federal statutory tax rate to the Company’s actual income tax expense
(benefit) is summarized as follows for the years ended:
(in thousands) 2012 2011 2010Expected tax expense (benefit) at federal statutory income tax rate $ (4,836) $ 2,957 $(87,815)
State and local income tax expense (benefit) (592) 2,314 (5,686)
Change in valuation allowance 55,374 (2,592) (352)
Change in contingency reserves (94) (84) (3,810)
Non-U.S. tax rate differences (1,063) 670 (1,762)
Non-deductible goodwill — — 41,522
Non-deductible expenses 2,437 6,863 3,236
Change in state tax rates 1,564 (547) (1,112)
Expiration of stock option contracts 7,007 — —
Other 270 (104) 2,577
Income tax expense (benefit) $60,067 $ 9,477 $(53,202)
- 6 0 - C E N V E O 2 0 1 2 | L E A D + I N V E S T C E N V E O 2 0 1 2 | L E A D + I N V E S T - 6 1 -
NOTES TO CONSOLIDATED FINANCIAL STATEMENTS(CONTINUED)
NOTES TO CONSOLIDATED FINANCIAL STATEMENTS(CONTINUED)
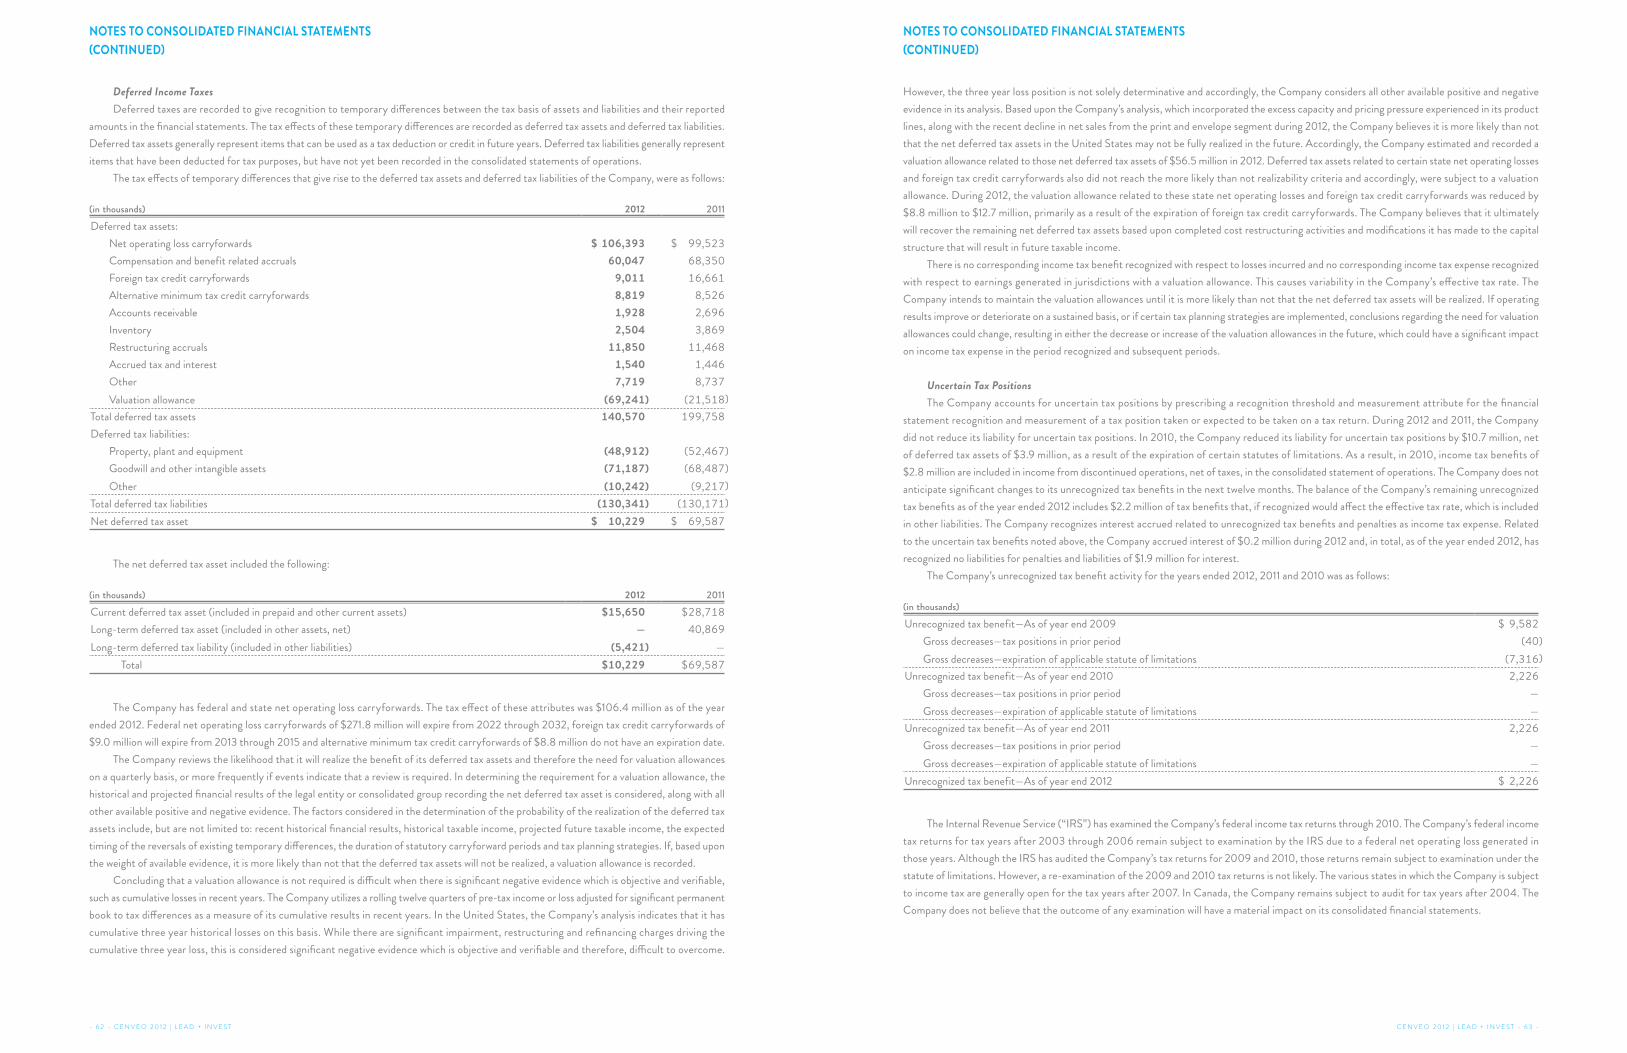
Deferred Income TaxesDeferred taxes are recorded to give recognition to temporary differences between the tax basis of assets and liabilities and their reported
amounts in the financial statements. The tax effects of these temporary differences are recorded as deferred tax assets and deferred tax liabilities.
Deferred tax assets generally represent items that can be used as a tax deduction or credit in future years. Deferred tax liabilities generally represent
items that have been deducted for tax purposes, but have not yet been recorded in the consolidated statements of operations.
The tax effects of temporary differences that give rise to the deferred tax assets and deferred tax liabilities of the Company, were as follows:
(in thousands) 2012 2011
Deferred tax assets:
Net operating loss carryforwards $ 106,393 $ 99,523
Compensation and benefit related accruals 60,047 68,350
Foreign tax credit carryforwards 9,011 16,661
Alternative minimum tax credit carryforwards 8,819 8,526
Accounts receivable 1,928 2,696
Inventory 2,504 3,869
Restructuring accruals 11,850 11,468
Accrued tax and interest 1,540 1,446
Other 7,719 8,737
Valuation allowance (69,241) (21,518)
Total deferred tax assets 140,570 199,758
Deferred tax liabilities:
Property, plant and equipment (48,912) (52,467)
Goodwill and other intangible assets (71,187) (68,487)
Other (10,242) (9,217)
Total deferred tax liabilities (130,341) (130,171)
Net deferred tax asset $ 10,229 $ 69,587
The net deferred tax asset included the following:
(in thousands) 2012 2011
Current deferred tax asset (included in prepaid and other current assets) $15,650 $28,718
Long-term deferred tax asset (included in other assets, net) — 40,869
Long-term deferred tax liability (included in other liabilities) (5,421) —
Total $10,229 $69,587
The Company has federal and state net operating loss carryforwards. The tax effect of these attributes was $106.4 million as of the year
ended 2012. Federal net operating loss carryforwards of $271.8 million will expire from 2022 through 2032, foreign tax credit carryforwards of
$9.0 million will expire from 2013 through 2015 and alternative minimum tax credit carryforwards of $8.8 million do not have an expiration date.
The Company reviews the likelihood that it will realize the benefit of its deferred tax assets and therefore the need for valuation allowances
on a quarterly basis, or more frequently if events indicate that a review is required. In determining the requirement for a valuation allowance, the
historical and projected financial results of the legal entity or consolidated group recording the net deferred tax asset is considered, along with all
other available positive and negative evidence. The factors considered in the determination of the probability of the realization of the deferred tax
assets include, but are not limited to: recent historical financial results, historical taxable income, projected future taxable income, the expected
timing of the reversals of existing temporary differences, the duration of statutory carryforward periods and tax planning strategies. If, based upon
the weight of available evidence, it is more likely than not that the deferred tax assets will not be realized, a valuation allowance is recorded.
Concluding that a valuation allowance is not required is difficult when there is significant negative evidence which is objective and verifiable,
such as cumulative losses in recent years. The Company utilizes a rolling twelve quarters of pre-tax income or loss adjusted for significant permanent
book to tax differences as a measure of its cumulative results in recent years. In the United States, the Company’s analysis indicates that it has
cumulative three year historical losses on this basis. While there are significant impairment, restructuring and refinancing charges driving the
cumulative three year loss, this is considered significant negative evidence which is objective and verifiable and therefore, difficult to overcome.
However, the three year loss position is not solely determinative and accordingly, the Company considers all other available positive and negative
evidence in its analysis. Based upon the Company’s analysis, which incorporated the excess capacity and pricing pressure experienced in its product
lines, along with the recent decline in net sales from the print and envelope segment during 2012, the Company believes it is more likely than not
that the net deferred tax assets in the United States may not be fully realized in the future. Accordingly, the Company estimated and recorded a
valuation allowance related to those net deferred tax assets of $56.5 million in 2012. Deferred tax assets related to certain state net operating losses
and foreign tax credit carryforwards also did not reach the more likely than not realizability criteria and accordingly, were subject to a valuation
allowance. During 2012, the valuation allowance related to these state net operating losses and foreign tax credit carryforwards was reduced by
$8.8 million to $12.7 million, primarily as a result of the expiration of foreign tax credit carryforwards. The Company believes that it ultimately
will recover the remaining net deferred tax assets based upon completed cost restructuring activities and modifications it has made to the capital
structure that will result in future taxable income.
There is no corresponding income tax benefit recognized with respect to losses incurred and no corresponding income tax expense recognized
with respect to earnings generated in jurisdictions with a valuation allowance. This causes variability in the Company’s effective tax rate. The
Company intends to maintain the valuation allowances until it is more likely than not that the net deferred tax assets will be realized. If operating
results improve or deteriorate on a sustained basis, or if certain tax planning strategies are implemented, conclusions regarding the need for valuation
allowances could change, resulting in either the decrease or increase of the valuation allowances in the future, which could have a significant impact
on income tax expense in the period recognized and subsequent periods.
Uncertain Tax PositionsThe Company accounts for uncertain tax positions by prescribing a recognition threshold and measurement attribute for the financial
statement recognition and measurement of a tax position taken or expected to be taken on a tax return. During 2012 and 2011, the Company
did not reduce its liability for uncertain tax positions. In 2010, the Company reduced its liability for uncertain tax positions by $10.7 million, net
of deferred tax assets of $3.9 million, as a result of the expiration of certain statutes of limitations. As a result, in 2010, income tax benefits of
$2.8 million are included in income from discontinued operations, net of taxes, in the consolidated statement of operations. The Company does not
anticipate significant changes to its unrecognized tax benefits in the next twelve months. The balance of the Company’s remaining unrecognized
tax benefits as of the year ended 2012 includes $2.2 million of tax benefits that, if recognized would affect the effective tax rate, which is included
in other liabilities. The Company recognizes interest accrued related to unrecognized tax benefits and penalties as income tax expense. Related
to the uncertain tax benefits noted above, the Company accrued interest of $0.2 million during 2012 and, in total, as of the year ended 2012, has
recognized no liabilities for penalties and liabilities of $1.9 million for interest.
The Company’s unrecognized tax benefit activity for the years ended 2012, 2011 and 2010 was as follows:
(in thousands)
Unrecognized tax benefit—As of year end 2009 $ 9,582
Gross decreases—tax positions in prior period (40)
Gross decreases—expiration of applicable statute of limitations (7,316)
Unrecognized tax benefit—As of year end 2010 2,226
Gross decreases—tax positions in prior period —
Gross decreases—expiration of applicable statute of limitations —
Unrecognized tax benefit—As of year end 2011 2,226
Gross decreases—tax positions in prior period —
Gross decreases—expiration of applicable statute of limitations —
Unrecognized tax benefit—As of year end 2012 $ 2,226
The Internal Revenue Service (“IRS”) has examined the Company’s federal income tax returns through 2010. The Company’s federal income
tax returns for tax years after 2003 through 2006 remain subject to examination by the IRS due to a federal net operating loss generated in
those years. Although the IRS has audited the Company’s tax returns for 2009 and 2010, those returns remain subject to examination under the
statute of limitations. However, a re-examination of the 2009 and 2010 tax returns is not likely. The various states in which the Company is subject
to income tax are generally open for the tax years after 2007. In Canada, the Company remains subject to audit for tax years after 2004. The
Company does not believe that the outcome of any examination will have a material impact on its consolidated financial statements.
- 6 2 - C E N V E O 2 0 1 2 | L E A D + I N V E S T C E N V E O 2 0 1 2 | L E A D + I N V E S T - 6 3 -
NOTES TO CONSOLIDATED FINANCIAL STATEMENTS(CONTINUED)
NOTES TO CONSOLIDATED FINANCIAL STATEMENTS(CONTINUED)
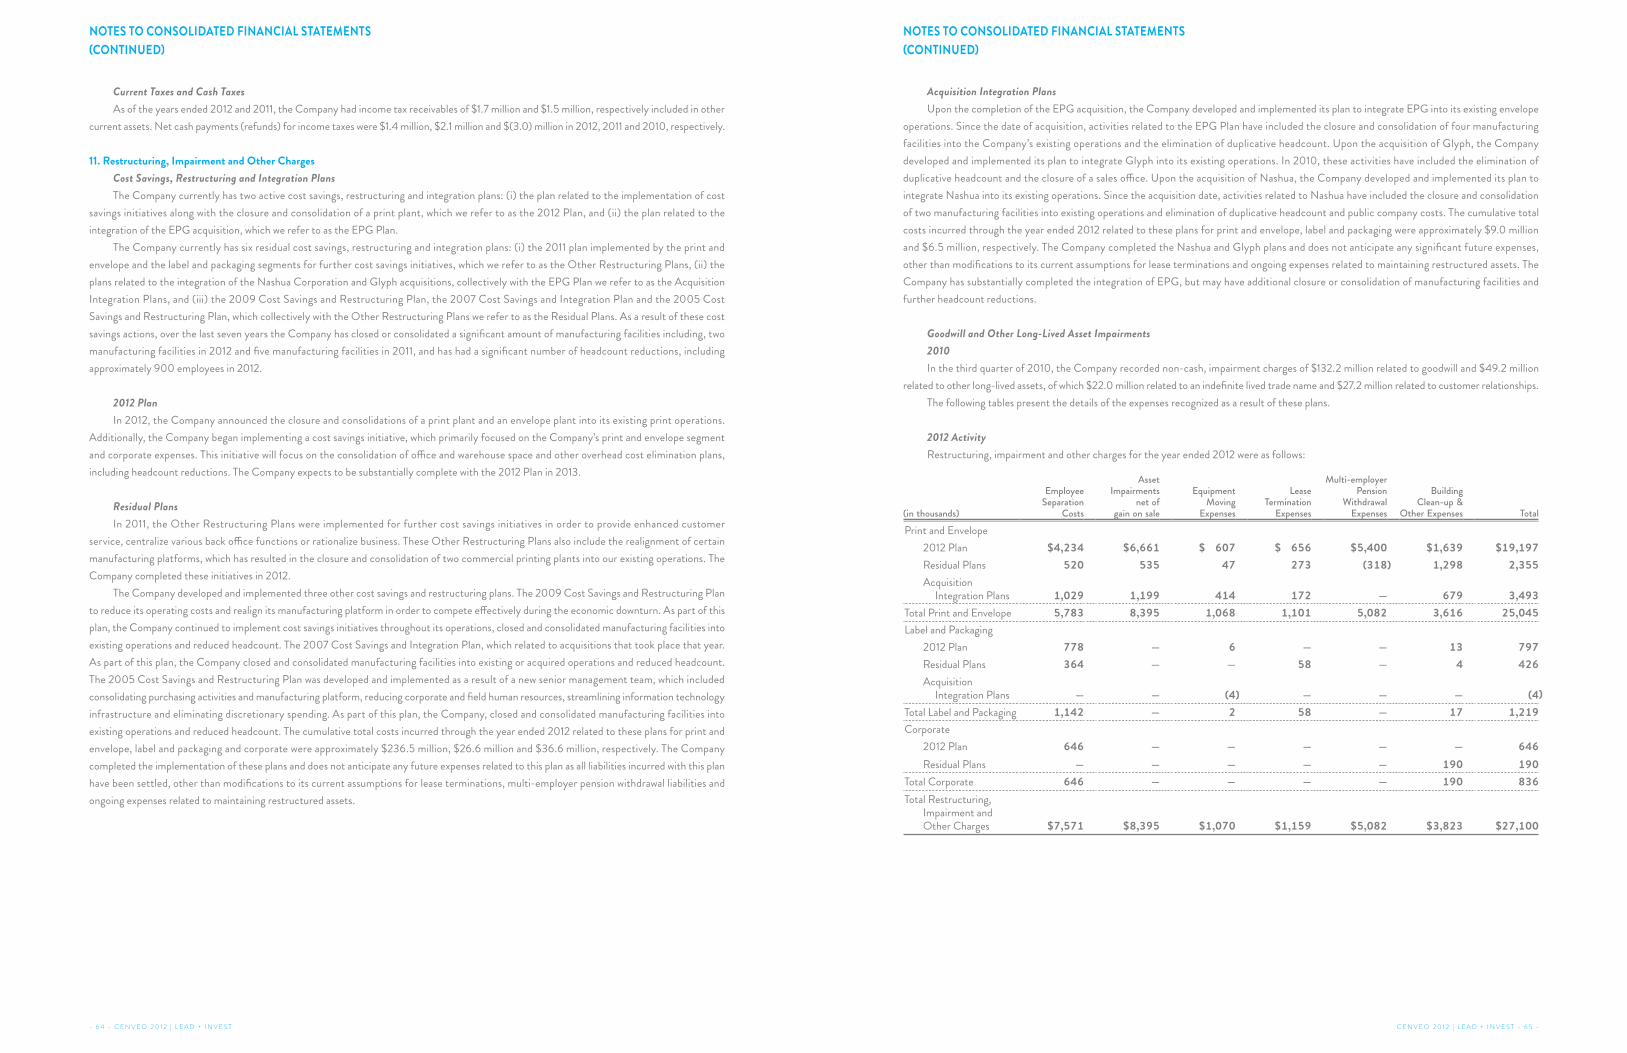
Current Taxes and Cash Taxes
As of the years ended 2012 and 2011, the Company had income tax receivables of $1.7 million and $1.5 million, respectively included in other
current assets. Net cash payments (refunds) for income taxes were $1.4 million, $2.1 million and $(3.0) million in 2012, 2011 and 2010, respectively.
11. Restructuring, Impairment and Other Charges
Cost Savings, Restructuring and Integration Plans
The Company currently has two active cost savings, restructuring and integration plans: (i) the plan related to the implementation of cost
savings initiatives along with the closure and consolidation of a print plant, which we refer to as the 2012 Plan, and (ii) the plan related to the
integration of the EPG acquisition, which we refer to as the EPG Plan.
The Company currently has six residual cost savings, restructuring and integration plans: (i) the 2011 plan implemented by the print and
envelope and the label and packaging segments for further cost savings initiatives, which we refer to as the Other Restructuring Plans, (ii) the
plans related to the integration of the Nashua Corporation and Glyph acquisitions, collectively with the EPG Plan we refer to as the Acquisition
Integration Plans, and (iii) the 2009 Cost Savings and Restructuring Plan, the 2007 Cost Savings and Integration Plan and the 2005 Cost
Savings and Restructuring Plan, which collectively with the Other Restructuring Plans we refer to as the Residual Plans. As a result of these cost
savings actions, over the last seven years the Company has closed or consolidated a significant amount of manufacturing facilities including, two
manufacturing facilities in 2012 and five manufacturing facilities in 2011, and has had a significant number of headcount reductions, including
approximately 900 employees in 2012.
2012 Plan
In 2012, the Company announced the closure and consolidations of a print plant and an envelope plant into its existing print operations.
Additionally, the Company began implementing a cost savings initiative, which primarily focused on the Company’s print and envelope segment
and corporate expenses. This initiative will focus on the consolidation of office and warehouse space and other overhead cost elimination plans,
including headcount reductions. The Company expects to be substantially complete with the 2012 Plan in 2013.
Residual Plans
In 2011, the Other Restructuring Plans were implemented for further cost savings initiatives in order to provide enhanced customer
service, centralize various back office functions or rationalize business. These Other Restructuring Plans also include the realignment of certain
manufacturing platforms, which has resulted in the closure and consolidation of two commercial printing plants into our existing operations. The
Company completed these initiatives in 2012.
The Company developed and implemented three other cost savings and restructuring plans. The 2009 Cost Savings and Restructuring Plan
to reduce its operating costs and realign its manufacturing platform in order to compete effectively during the economic downturn. As part of this
plan, the Company continued to implement cost savings initiatives throughout its operations, closed and consolidated manufacturing facilities into
existing operations and reduced headcount. The 2007 Cost Savings and Integration Plan, which related to acquisitions that took place that year.
As part of this plan, the Company closed and consolidated manufacturing facilities into existing or acquired operations and reduced headcount.
The 2005 Cost Savings and Restructuring Plan was developed and implemented as a result of a new senior management team, which included
consolidating purchasing activities and manufacturing platform, reducing corporate and field human resources, streamlining information technology
infrastructure and eliminating discretionary spending. As part of this plan, the Company, closed and consolidated manufacturing facilities into
existing operations and reduced headcount. The cumulative total costs incurred through the year ended 2012 related to these plans for print and
envelope, label and packaging and corporate were approximately $236.5 million, $26.6 million and $36.6 million, respectively. The Company
completed the implementation of these plans and does not anticipate any future expenses related to this plan as all liabilities incurred with this plan
have been settled, other than modifications to its current assumptions for lease terminations, multi-employer pension withdrawal liabilities and
ongoing expenses related to maintaining restructured assets.
Acquisition Integration Plans
Upon the completion of the EPG acquisition, the Company developed and implemented its plan to integrate EPG into its existing envelope
operations. Since the date of acquisition, activities related to the EPG Plan have included the closure and consolidation of four manufacturing
facilities into the Company’s existing operations and the elimination of duplicative headcount. Upon the acquisition of Glyph, the Company
developed and implemented its plan to integrate Glyph into its existing operations. In 2010, these activities have included the elimination of
duplicative headcount and the closure of a sales office. Upon the acquisition of Nashua, the Company developed and implemented its plan to
integrate Nashua into its existing operations. Since the acquisition date, activities related to Nashua have included the closure and consolidation
of two manufacturing facilities into existing operations and elimination of duplicative headcount and public company costs. The cumulative total
costs incurred through the year ended 2012 related to these plans for print and envelope, label and packaging were approximately $9.0 million
and $6.5 million, respectively. The Company completed the Nashua and Glyph plans and does not anticipate any significant future expenses,
other than modifications to its current assumptions for lease terminations and ongoing expenses related to maintaining restructured assets. The
Company has substantially completed the integration of EPG, but may have additional closure or consolidation of manufacturing facilities and
further headcount reductions.
Goodwill and Other Long-Lived Asset Impairments
2010
In the third quarter of 2010, the Company recorded non-cash, impairment charges of $132.2 million related to goodwill and $49.2 million
related to other long-lived assets, of which $22.0 million related to an indefinite lived trade name and $27.2 million related to customer relationships.
The following tables present the details of the expenses recognized as a result of these plans.
2012 Activity
Restructuring, impairment and other charges for the year ended 2012 were as follows:
(in thousands)
Employee Separation
Costs
AssetImpairments
net of gain on sale
Equipment Moving
Expenses
LeaseTermination
Expenses
Multi-employer Pension
Withdrawal Expenses
Building Clean-up &
Other Expenses Total
Print and Envelope
2012 Plan $4,234 $6,661 $ 607 $ 656 $5,400 $1,639 $19,197
Residual Plans 520 535 47 273 (318) 1,298 2,355
AcquisitionIntegration Plans 1,029 1,199 414 172 — 679 3,493
Total Print and Envelope 5,783 8,395 1,068 1,101 5,082 3,616 25,045
Label and Packaging
2012 Plan 778 — 6 — — 13 797
Residual Plans 364 — — 58 — 4 426
AcquisitionIntegration Plans — — (4) — — — (4)
Total Label and Packaging 1,142 — 2 58 — 17 1,219
Corporate
2012 Plan 646 — — — — — 646
Residual Plans — — — — — 190 190
Total Corporate 646 — — — — 190 836
Total Restructuring, Impairment and Other Charges $7,571 $8,395 $1,070 $1,159 $5,082 $3,823 $27,100
- 6 4 - C E N V E O 2 0 1 2 | L E A D + I N V E S T C E N V E O 2 0 1 2 | L E A D + I N V E S T - 6 5 -
NOTES TO CONSOLIDATED FINANCIAL STATEMENTS
(CONTINUED)
NOTES TO CONSOLIDATED FINANCIAL STATEMENTS
(CONTINUED)
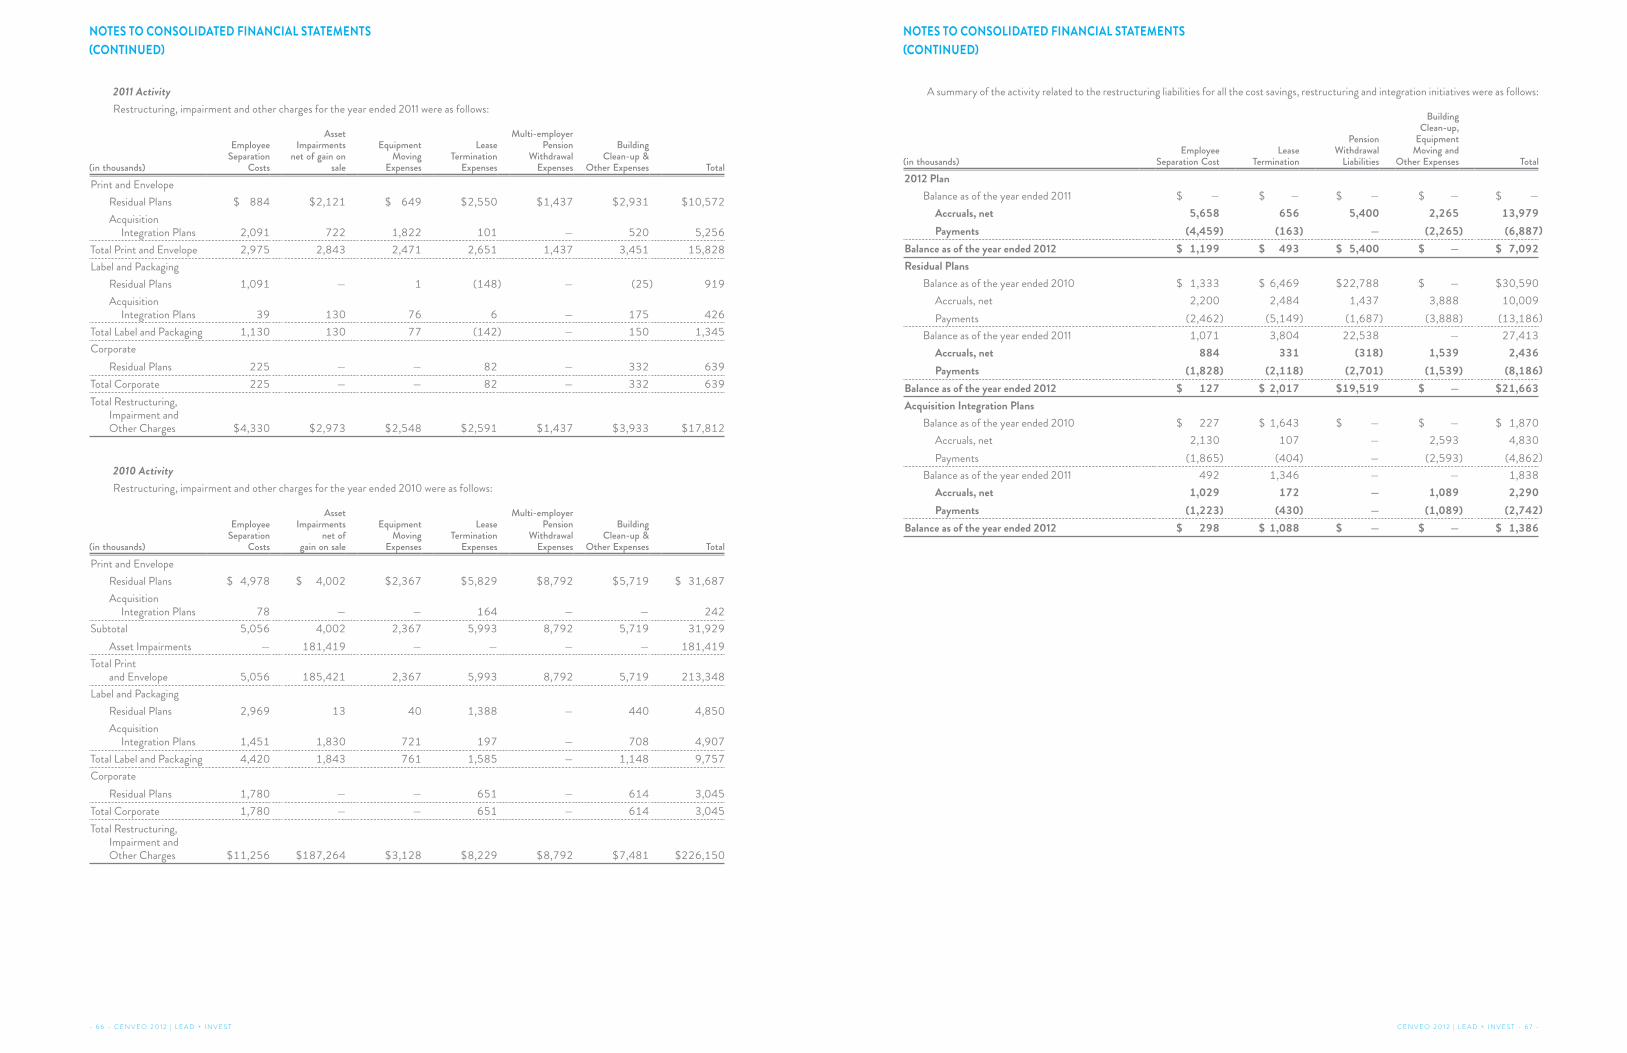
2011 ActivityRestructuring, impairment and other charges for the year ended 2011 were as follows:
(in thousands)
Employee Separation
Costs
AssetImpairments
net of gain on sale
Equipment Moving
Expenses
LeaseTermination
Expenses
Multi-employer Pension
Withdrawal Expenses
Building Clean-up &
Other Expenses Total
Print and Envelope
Residual Plans $ 884 $2,121 $ 649 $2,550 $1,437 $2,931 $10,572
AcquisitionIntegration Plans 2,091 722 1,822 101 — 520 5,256
Total Print and Envelope 2,975 2,843 2,471 2,651 1,437 3,451 15,828
Label and Packaging
Residual Plans 1,091 — 1 (148) — (25) 919
AcquisitionIntegration Plans 39 130 76 6 — 175 426
Total Label and Packaging 1,130 130 77 (142) — 150 1,345
Corporate
Residual Plans 225 — — 82 — 332 639
Total Corporate 225 — — 82 — 332 639
Total Restructuring, Impairment and Other Charges $4,330 $2,973 $2,548 $2,591 $1,437 $3,933 $17,812
2010 ActivityRestructuring, impairment and other charges for the year ended 2010 were as follows:
(in thousands)
Employee Separation
Costs
AssetImpairments
net of gain on sale
Equipment Moving
Expenses
LeaseTermination
Expenses
Multi-employer Pension
Withdrawal Expenses
Building Clean-up &
Other Expenses Total
Print and Envelope
Residual Plans $ 4,978 $ 4,002 $2,367 $5,829 $8,792 $5,719 $ 31,687
AcquisitionIntegration Plans 78 — — 164 — — 242
Subtotal 5,056 4,002 2,367 5,993 8,792 5,719 31,929
Asset Impairments — 181,419 — — — — 181,419
Total Print and Envelope 5,056 185,421 2,367 5,993 8,792 5,719 213,348
Label and Packaging
Residual Plans 2,969 13 40 1,388 — 440 4,850
AcquisitionIntegration Plans 1,451 1,830 721 197 — 708 4,907
Total Label and Packaging 4,420 1,843 761 1,585 — 1,148 9,757
Corporate
Residual Plans 1,780 — — 651 — 614 3,045
Total Corporate 1,780 — — 651 — 614 3,045
Total Restructuring, Impairment and Other Charges $11,256 $187,264 $3,128 $8,229 $8,792 $7,481 $226,150
A summary of the activity related to the restructuring liabilities for all the cost savings, restructuring and integration initiatives were as follows:
(in thousands)Employee
Separation CostLease
Termination
Pension Withdrawal
Liabilities
Building Clean-up,
Equipment Moving and
Other Expenses Total
2012 Plan
Balance as of the year ended 2011 $ — $ — $ — $ — $ —
Accruals, net 5,658 656 5,400 2,265 13,979
Payments (4,459) (163) — (2,265) (6,887)
Balance as of the year ended 2012 $ 1,199 $ 493 $ 5,400 $ — $ 7,092
Residual Plans
Balance as of the year ended 2010 $ 1,333 $ 6,469 $22,788 $ — $30,590
Accruals, net 2,200 2,484 1,437 3,888 10,009
Payments (2,462) (5,149) (1,687) (3,888) (13,186)
Balance as of the year ended 2011 1,071 3,804 22,538 — 27,413
Accruals, net 884 331 (318) 1,539 2,436
Payments (1,828) (2,118) (2,701) (1,539) (8,186)
Balance as of the year ended 2012 $ 127 $ 2,017 $19,519 $ — $21,663
Acquisition Integration Plans
Balance as of the year ended 2010 $ 227 $ 1,643 $ — $ — $ 1,870
Accruals, net 2,130 107 — 2,593 4,830
Payments (1,865) (404) — (2,593) (4,862)
Balance as of the year ended 2011 492 1,346 — — 1,838
Accruals, net 1,029 172 — 1,089 2,290
Payments (1,223) (430) — (1,089) (2,742)
Balance as of the year ended 2012 $ 298 $ 1,088 $ — $ — $ 1,386
- 6 6 - C E N V E O 2 0 1 2 | L E A D + I N V E S T C E N V E O 2 0 1 2 | L E A D + I N V E S T - 6 7 -
NOTES TO CONSOLIDATED FINANCIAL STATEMENTS
(CONTINUED)
NOTES TO CONSOLIDATED FINANCIAL STATEMENTS
(CONTINUED)

12. Stock-Based Compensation
The Company’s 2007 Long-Term Equity Incentive Plan, as amended, approved in May 2008 (the “2007 Plan”) authorizes the issuance of
up to 4,500,000 shares of the Company’s common stock. Upon approval of the 2007 Plan, the Company ceased making awards under its prior
equity plans, including the Company’s 2001 Long-Term Equity Incentive Plan. Unused shares previously authorized under prior plans have been
rolled over into the 2007 Plan and increased the total number of shares authorized for issuance under the 2007 Plan by 707,500 shares in 2012.
The Company’s outstanding unvested stock options have maximum contractual terms of up to six years, principally vest ratably over four years
and were granted at exercise prices equal to the market price of the Company’s common stock on the date of grant. The Company’s outstanding
stock options are exercisable into shares of the Company’s common stock. The Company’s outstanding restricted share units (“RSUs”) principally
vest ratably over four years. Upon vesting, RSUs convert into shares of the Company’s common stock. The Company currently issues authorized
shares of common stock upon vesting of restricted shares or the exercise of other equity awards. The Company’s restricted shares were assumed in
connection with its acquisition of Nashua Corporation and all of which expired in 2011. The Company has no outstanding stock appreciation rights.
The Company measures the cost of employee services received in exchange for an award of equity instruments, including grants of employee
stock options and RSUs, based on the fair value of the award at the date of grant in accordance with the modified prospective method. The Company
uses the Black-Scholes model for purposes of determining the fair value of stock options granted and recognizes compensation costs ratably over
the requisite service period for each separately vesting portion of the award, net of estimated forfeitures. The Black-Scholes model has limitations
on its effectiveness including that it was developed for use in estimating the fair value of traded options which have no vesting restrictions and are
fully transferable and that the model requires the use of parameters, such as stock price volatility that must be estimated from historical data. The
Company’s stock option awards to employees have characteristics significantly different from those of traded options and parameter estimation
methodologies can materially affect fair value estimates.
Total share-based compensation expense recognized in selling, general and administrative expenses in the Company’s consolidated statements
of operations was $5.3 million, $8.7 million and $10.9 million for the years ended 2012, 2011 and 2010, respectively. Income tax benefit related
to the Company’s stock-based compensation expense was $1.2 million, $1.5 million and $2.1 million for the years ended 2012, 2011 and 2010,
respectively.
As of the year ended 2012, there was approximately $5.3 million of total unrecognized compensation cost related to unvested share-based
compensation grants, which is expected to be amortized over the remaining weighted-average period of 1.6 years.
Stock OptionsA summary of the Company’s outstanding stock options as of and for the years ended 2012, 2011 and 2010 are as follows:
Options
Weighted Average
Exercise Price
Weighted Average
Remaining Contractual
Term (In Years)
Aggregate Intrinsic
Value(in thousands)
(a)
Outstanding as of the year ended 2009 3,917,851 $11.73 3.7 $5,513
Granted 660,000 7.02
Exercised (179,773) 4.73 $ 418
Forfeited (592,854) 15.23
Outstanding as of the year ended 2010 3,805,224 $10.70 3.1 $1,075
Granted 590,000 5.62
Exercised (70,598) 4.04 $ 141
Forfeited (131,646) 6.89
Outstanding as of the year ended 2011 4,192,980 $10.21 2.5 $ —
Granted — —
Exercised — — $ —
Forfeited (1,966,980) 13.00
Outstanding as of the year ended 2012 2,226,000 $ 7.75 2.7 $ —
Exercisable as of the year ended 2010 2,371,974 $13.27 2.2 $ 334
Exercisable as of the year ended 2011 2,761,230 $12.59 1.6 $ —
Exercisable as of the year ended 2012 1,405,125 $ 8.94 2.3 $ —
(a) Intrinsic value for purposes of this table represents the amount by which the fair value of the underlying stock, based on the respective market prices as of the years ended 2012, 2011 and 2010 or, if exercised, the exercise dates, exceeds the exercise prices of the respective options.
There were no stock option grants in 2012. The weighted-average grant date fair value of stock options granted in 2011, were at exercise prices
equal to the market price of the stock on the grant dates, as calculated under the Black-Scholes Model with the weighted-average assumptions
are as follows:
2011
Weighted average fair value of option grants during the year $2.28
Assumptions:
Expected option life in years 4.25
Risk-free interest rate 1.46%
Expected volatility 49.1%
Expected dividend yield 0.0%
The risk-free interest rate represents the United States Treasury Bond constant maturity yield approximating the expected option life of
stock options granted during the period. The expected option life represents the period of time that the stock options granted during the period
are expected to be outstanding, based on the mid-point between the vesting date and contractual expiration date of the option. The expected
volatility is based on the historical market price volatility of the Company’s common stock for the expected term of the options, adjusted for
expected mean reversion.
- 6 8 - C E N V E O 2 0 1 2 | L E A D + I N V E S T C E N V E O 2 0 1 2 | L E A D + I N V E S T - 6 9 -
NOTES TO CONSOLIDATED FINANCIAL STATEMENTS
(CONTINUED)
NOTES TO CONSOLIDATED FINANCIAL STATEMENTS
(CONTINUED)

Restricted Shares and RSUsA summary of the Company’s non-vested restricted shares and RSUs as of and for the three years ended 2012, 2011 and 2010 is as follows:
Restricted Shares
Weighted Average Grant
Date Fair Value RSUs
Weighted Average Grant
Date Fair ValueUnvested as of the year ended 2009 161,144 $6.53 1,896,585 $ 9.72
Granted — — 756,924 7.02
Vested (1,447) 6.53 (904,710) 10.48
Forfeited (134,397) 6.53 (28,125) 9.49
Unvested as of the year ended 2010 25,300 $6.53 1,720,674 $ 8.13
Granted — — 806,084 5.62
Vested — — (745,674) 9.42
Forfeited (25,300) 6.53 (26,250) 6.57
Unvested as of the year ended 2011 — $ — 1,754,834 $ 6.46
Granted — — 136,840 1.90
Vested — — (795,459) 7.02
Forfeited — — (21,875) 7.32
Unvested as of the year ended 2012 — $ — 1,074,340 $ 5.44
The total fair value of RSUs which vested during 2012, 2011 and 2010 was $2.0 million, $3.7 million and $5.6 million, respectively, as of the
respective vesting dates.
13. Retirement Plans
Pension Plans. The Company currently has two defined benefit pension plans for certain of its employees in the United States. The defined
benefit plans provide benefit payments using formulas based on an employee’s compensation and length of service, or stated amounts for each
year of service. The Company expects to continue to fund these plans based on governmental requirements, amounts deductible for income tax
purposes and as needed to ensure that plan assets are sufficient to satisfy plan liabilities. Most of the employee benefits under the Company’s
defined benefit plans are frozen.
Supplemental Executive Retirement Plans. The Company has various supplemental executive retirement plans (“SERP”), which provide
benefits to certain former directors and executives. For accounting purposes, these plans are unfunded, however, one plan has annuities that cover
a portion of the liability to the participants in its plan and the income from the annuities offsets a portion of the cost of the plan. These annuities
are included in other assets, net in the consolidated balance sheets.
Other Postretirement Plans. The Company has various other-postretirement benefit plans (“OPEB”), primarily focused on postretirement
healthcare, such as medical insurance and life insurance and related benefits for certain of its former employees and, in some instances, their
spouses. Benefits, eligibility and cost-sharing provisions vary by plan documents or union collective bargaining arrangements.
Savings Plan. The Company sponsors a defined contribution plan to provide substantially all United States salaried and certain hourly
employees an opportunity to accumulate personal funds for their retirement. In 2012, the Company did not make any voluntary contributions.
In 2011 and 2010, the Company matched only certain union employee’s voluntary contributions and contributions required under the collective
bargaining agreements. Company contributions to the plan were less than $0.1 million in 2011 and 2010. Employees participating in the plan held
2,719,312 shares of the Company’s common stock as of the year ended 2012.
Funded Status and Net Periodic Cost. The following table provides a reconciliation of the changes in the Company’s pension, SERP and
OPEB plans benefit obligations and fair value of assets for 2012 and 2011, a statement of the funded status as of the years ended 2012 and 2011,
respectively, and the amounts recognized in the consolidated balance sheets as of the years ended 2012 and 2011.
The following table provides a reconciliation of the Company’s benefit obligation:
Pensions SERPs OPEBs
(in thousands) 2012 2011 2012 2011 2012 2011Benefit obligation at beginning of year $ 328,523 $280,275 $19,538 $18,881 $2,551 $2,801
Service cost 1,932 1,382 — — — —
Interest cost 13,657 14,299 786 940 103 138
Actuarial (gain) loss 23,733 47,115 1,398 1,773 (24) (219)
Benefits paid (15,836) (15,160) (2,119) (2,056) (151) (169)
Prior service cost due to acquisition — 612 — — — —
Benefit obligation at end of year $ 352,009 $328,523 $19,603 $19,538 $2,479 $2,551
The following table provides a reconciliation of the Company’s fair value of plan assets:
Pensions SERPs OPEBs
(in thousands) 2012 2011 2012 2011 2012 2011Fair value of plan assets at beginning of year $ 210,577 $202,839 $ — $ — $ — $ —
Actual return on plan assets 21,198 3,735 — — — —
Employer contributions 15,958 19,163 2,119 2,056 151 169
Benefits paid (15,836) (15,160) (2,119) (2,056) (151) (169)
Fair value of plan assets at end of year $ 231,897 $210,577 $ — $ — $ — $ —
The following table shows the funded status at the end of the year:
Pensions SERPs OPEBs
(in thousands) 2012 2011 2012 2011 2012 2011Funded status at end of year $(120,112) $(117,946) $(19,603) $(19,538) $(2,479) $(2,551)
The following table shows amounts recognized in accumulated other comprehensive loss:
Pensions SERPs OPEBs
(in thousands) 2012 2011 2012 2011 2012 2011Net actuarial loss $ 110,682 $97,567 $4,766 $3,502 $(200) $(181)
Prior service cost — — — — (23) (29)
Total $ 110,682 $97,567 $4,766 $3,502 $(223) $(210)
The following table shows amounts recognized in the consolidated balance sheets:
Pensions SERPs OPEBs
(in thousands) 2012 2011 2012 2011 2012 2011Other current liabilities $ — $ — $ 2,135 $ 2,059 $ 262 $ 267
Other liabilities 120,112 117,946 17,468 17,479 2,217 2,284
Total liabilities $ 120,112 $117,946 $19,603 $19,538 $2,479 $2,551
- 7 0 - C E N V E O 2 0 1 2 | L E A D + I N V E S T C E N V E O 2 0 1 2 | L E A D + I N V E S T - 7 1 -
NOTES TO CONSOLIDATED FINANCIAL STATEMENTS
(CONTINUED)
NOTES TO CONSOLIDATED FINANCIAL STATEMENTS
(CONTINUED)
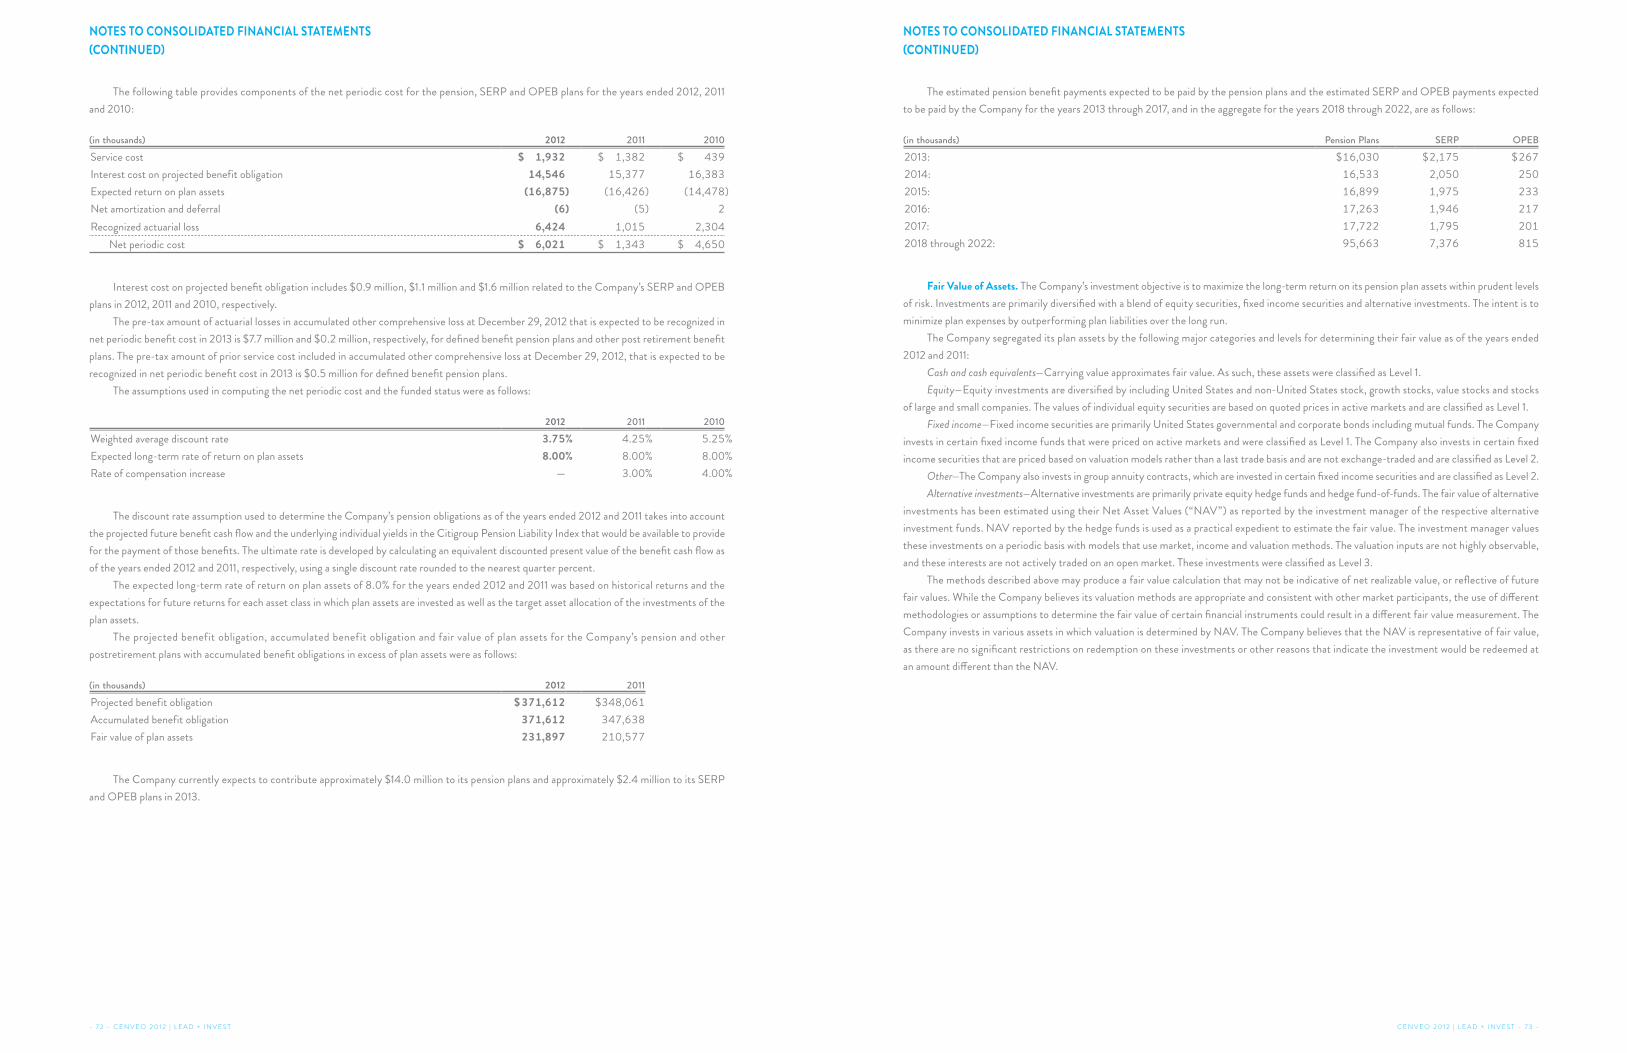
The following table provides components of the net periodic cost for the pension, SERP and OPEB plans for the years ended 2012, 2011
and 2010:
(in thousands) 2012 2011 2010
Service cost $ 1,932 $ 1,382 $ 439
Interest cost on projected benefit obligation 14,546 15,377 16,383
Expected return on plan assets (16,875) (16,426) (14,478)
Net amortization and deferral (6) (5) 2
Recognized actuarial loss 6,424 1,015 2,304
Net periodic cost $ 6,021 $ 1,343 $ 4,650
Interest cost on projected benefit obligation includes $0.9 million, $1.1 million and $1.6 million related to the Company’s SERP and OPEB
plans in 2012, 2011 and 2010, respectively.
The pre-tax amount of actuarial losses in accumulated other comprehensive loss at December 29, 2012 that is expected to be recognized in
net periodic benefit cost in 2013 is $7.7 million and $0.2 million, respectively, for defined benefit pension plans and other post retirement benefit
plans. The pre-tax amount of prior service cost included in accumulated other comprehensive loss at December 29, 2012, that is expected to be
recognized in net periodic benefit cost in 2013 is $0.5 million for defined benefit pension plans.
The assumptions used in computing the net periodic cost and the funded status were as follows:
2012 2011 2010
Weighted average discount rate 3.75% 4.25% 5.25%
Expected long-term rate of return on plan assets 8.00% 8.00% 8.00%
Rate of compensation increase — 3.00% 4.00%
The discount rate assumption used to determine the Company’s pension obligations as of the years ended 2012 and 2011 takes into account
the projected future benefit cash flow and the underlying individual yields in the Citigroup Pension Liability Index that would be available to provide
for the payment of those benefits. The ultimate rate is developed by calculating an equivalent discounted present value of the benefit cash flow as
of the years ended 2012 and 2011, respectively, using a single discount rate rounded to the nearest quarter percent.
The expected long-term rate of return on plan assets of 8.0% for the years ended 2012 and 2011 was based on historical returns and the
expectations for future returns for each asset class in which plan assets are invested as well as the target asset allocation of the investments of the
plan assets.
The projected benefit obligation, accumulated benefit obligation and fair value of plan assets for the Company’s pension and other
postretirement plans with accumulated benefit obligations in excess of plan assets were as follows:
(in thousands) 2012 2011
Projected benefit obligation $ 371,612 $348,061
Accumulated benefit obligation 371,612 347,638
Fair value of plan assets 231,897 210,577
The Company currently expects to contribute approximately $14.0 million to its pension plans and approximately $2.4 million to its SERP
and OPEB plans in 2013.
The estimated pension benefit payments expected to be paid by the pension plans and the estimated SERP and OPEB payments expected
to be paid by the Company for the years 2013 through 2017, and in the aggregate for the years 2018 through 2022, are as follows:
(in thousands) Pension Plans SERP OPEB
2013: $16,030 $2,175 $267
2014: 16,533 2,050 250
2015: 16,899 1,975 233
2016: 17,263 1,946 217
2017: 17,722 1,795 201
2018 through 2022: 95,663 7,376 815
Fair Value of Assets. The Company’s investment objective is to maximize the long-term return on its pension plan assets within prudent levels
of risk. Investments are primarily diversified with a blend of equity securities, fixed income securities and alternative investments. The intent is to
minimize plan expenses by outperforming plan liabilities over the long run.
The Company segregated its plan assets by the following major categories and levels for determining their fair value as of the years ended
2012 and 2011:
Cash and cash equivalents—Carrying value approximates fair value. As such, these assets were classified as Level 1.
Equity—Equity investments are diversified by including United States and non-United States stock, growth stocks, value stocks and stocks
of large and small companies. The values of individual equity securities are based on quoted prices in active markets and are classified as Level 1.
Fixed income—Fixed income securities are primarily United States governmental and corporate bonds including mutual funds. The Company
invests in certain fixed income funds that were priced on active markets and were classified as Level 1. The Company also invests in certain fixed
income securities that are priced based on valuation models rather than a last trade basis and are not exchange-traded and are classified as Level 2.
Other—The Company also invests in group annuity contracts, which are invested in certain fixed income securities and are classified as Level 2.
Alternative investments—Alternative investments are primarily private equity hedge funds and hedge fund-of-funds. The fair value of alternative
investments has been estimated using their Net Asset Values (“NAV”) as reported by the investment manager of the respective alternative
investment funds. NAV reported by the hedge funds is used as a practical expedient to estimate the fair value. The investment manager values
these investments on a periodic basis with models that use market, income and valuation methods. The valuation inputs are not highly observable,
and these interests are not actively traded on an open market. These investments were classified as Level 3.
The methods described above may produce a fair value calculation that may not be indicative of net realizable value, or reflective of future
fair values. While the Company believes its valuation methods are appropriate and consistent with other market participants, the use of different
methodologies or assumptions to determine the fair value of certain financial instruments could result in a different fair value measurement. The
Company invests in various assets in which valuation is determined by NAV. The Company believes that the NAV is representative of fair value,
as there are no significant restrictions on redemption on these investments or other reasons that indicate the investment would be redeemed at
an amount different than the NAV.
- 7 2 - C E N V E O 2 0 1 2 | L E A D + I N V E S T C E N V E O 2 0 1 2 | L E A D + I N V E S T - 7 3 -
NOTES TO CONSOLIDATED FINANCIAL STATEMENTS(CONTINUED)
NOTES TO CONSOLIDATED FINANCIAL STATEMENTS(CONTINUED)

The fair values of the Company’s pension plan assets as of the years ended 2012 and 2011, by asset category are as follows:
2012
(in thousands) Level 1 Level 2 Level 3 Total
Cash and cash equivalents $ 6,817 $ — $ — $ 6,817
Equity 121,600 — — 121,600
Fixed income 15,229 40,152 — 55,381
Other — 1,802 — 1,802
Alternative investments — — 46,297 46,297
Total pension plan assets $ 143,646 $41,954 $46,297 $ 231,897
2011
(in thousands) Level 1 Level 2 Level 3 Total
Cash and cash equivalents $ 27,066 $ — $ — $ 27,066
Equity 101,716 — — 101,716
Fixed income 44,093 7,018 — 51,111
Other — 1,922 — 1,922
Alternative investments — — 28,762 28,762
Total pension plan assets $172,875 $8,940 $28,762 $210,577
The following table provides a summary of changes in the fair value of the Company’s Level 3 assets:
(in thousands)Alternative
Investments
Balance as of the year ended 2010 $37,422
Purchases, sales and settlements (9,002)
Unrealized gains 342
Balance as of the year ended 2011 28,762
Purchases, sales and settlements 14,056
Unrealized gains 3,479
Balance as of the year ended 2012 $46,297
The range of asset allocations and the target allocations for the pension and other post-retirement asset investments were as follows:
2012 2011 Target
Equity securities 51% 64% 55% 55% 60% 75%
Fixed income securities 25% 32% 25% 39% 25% 35%
Alternative investments and other 4% 24% 6% 20% 10% 30%
Multi-Employer Plans. Certain of the Company’s employees are included in multi-employer pension plans to which the Company
makes contributions in accordance with contractual union agreements. Such contributions are made on a monthly basis in accordance with the
requirements of the plans and the actuarial computations and assumptions of the administrators of the plans. Contributions to multi-employer plans
were $1.1 million in 2012, $1.6 million in 2011 and $2.4 million in 2010. In 2012 and 2011, the Company recorded withdrawal liabilities of $5.1 million
and $1.4 million, respectively, as a result of exiting certain multi-employer pension plans in connection with its cost savings and restructuring plans.
The Company’s participation in these plans for the year ended 2012, is outlined in the table below:
Pension FundEIN/Pension
Plan NumberPension Protection
Act Reported Status (1) FIP/RP Status (2) ContributionsSurcharge
imposed
Expiration Date of Collective
Bargaining Agreement
(in thousands) 2012 2011 2012 2011 2010
GCC/IBT National Pension Fund
526118568/001 Red Red Implemented $ 236 $ 249 $ 231 Yes 6/30/2013
GCC/IBT National Pension Fund
526118568/001 Red Red Implemented 102 206 333 Yes 12/31/2014
GCC/IBT National Pension Fund
526118568/001 Red Red Implemented 15 25 41 Yes 4/30/2014
Graphic Communications Pension Trust Fund Of Canada
M5000050/223 Red Red Implemented 225 250 250 No 6/30/2012
Graphic Communications Supplemental Retirement and Disability Fund
M5000050/226,251 Red Red Implemented 479 523 575 No 6/30/2012
CWA/ITU Negotiated Pension Plan
136212879/001 Red Red Implemented 86 347 408 No 2/28/2013
Total contributions $1,143 $1,600 $1,838
(1) Unless otherwise noted, the most recent Pension Protection Act (“PPA”) zone status available in 2012 and 2011 is for the plan’s year end, not the Company’s year end. The zone status is based on information that the Company received from the plan and is certified by the plan’s actuary. Among other factors, plans in the red zone are generally less than 65 percent funded, plans in the yellow zone are less than 80 percent funded, and plans in the green zone are at least 80 percent funded.
(2) The FIP/RP Status column indicates plans for which a financial improvement plan (“FIP”) or a rehabilitation plan (“RP”) is either pending or has been implemented.
- 7 4 - C E N V E O 2 0 1 2 | L E A D + I N V E S T C E N V E O 2 0 1 2 | L E A D + I N V E S T - 7 5 -
NOTES TO CONSOLIDATED FINANCIAL STATEMENTS
(CONTINUED)
NOTES TO CONSOLIDATED FINANCIAL STATEMENTS
(CONTINUED)
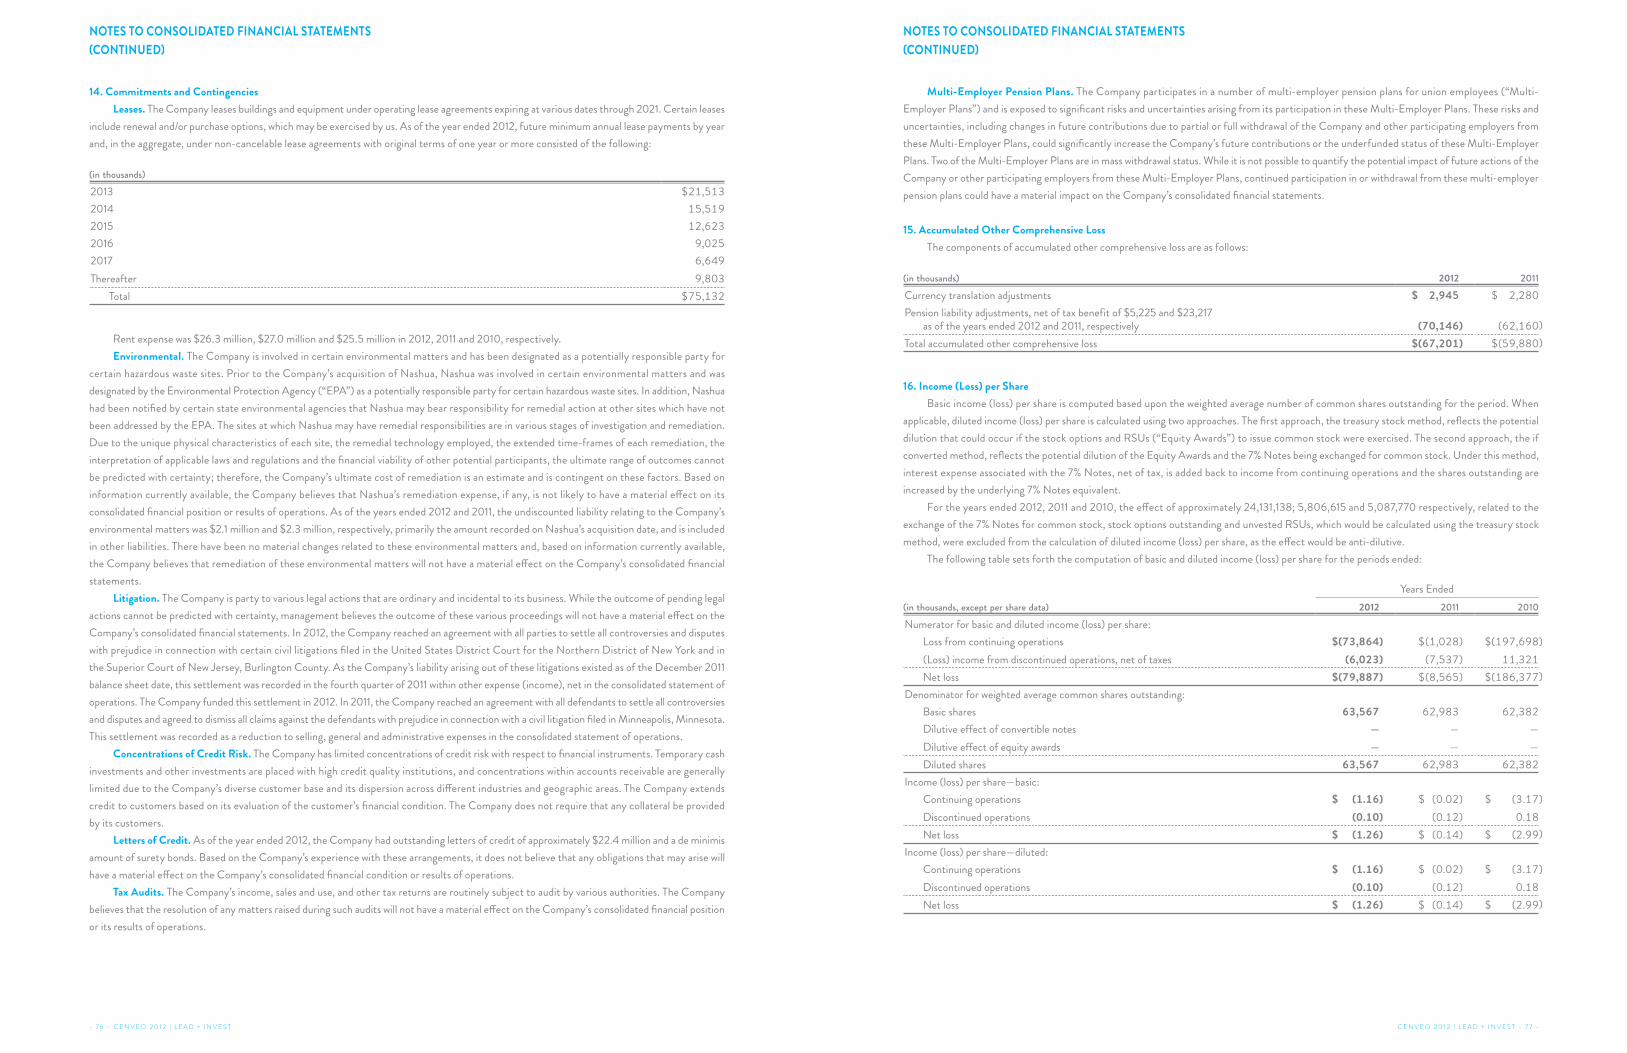
14. Commitments and Contingencies
Leases. The Company leases buildings and equipment under operating lease agreements expiring at various dates through 2021. Certain leases
include renewal and/or purchase options, which may be exercised by us. As of the year ended 2012, future minimum annual lease payments by year
and, in the aggregate, under non-cancelable lease agreements with original terms of one year or more consisted of the following:
(in thousands)2013 $21,513
2014 15,519
2015 12,623
2016 9,025
2017 6,649
Thereafter 9,803
Total $75,132
Rent expense was $26.3 million, $27.0 million and $25.5 million in 2012, 2011 and 2010, respectively.
Environmental. The Company is involved in certain environmental matters and has been designated as a potentially responsible party for
certain hazardous waste sites. Prior to the Company’s acquisition of Nashua, Nashua was involved in certain environmental matters and was
designated by the Environmental Protection Agency (“EPA”) as a potentially responsible party for certain hazardous waste sites. In addition, Nashua
had been notified by certain state environmental agencies that Nashua may bear responsibility for remedial action at other sites which have not
been addressed by the EPA. The sites at which Nashua may have remedial responsibilities are in various stages of investigation and remediation.
Due to the unique physical characteristics of each site, the remedial technology employed, the extended time-frames of each remediation, the
interpretation of applicable laws and regulations and the financial viability of other potential participants, the ultimate range of outcomes cannot
be predicted with certainty; therefore, the Company’s ultimate cost of remediation is an estimate and is contingent on these factors. Based on
information currently available, the Company believes that Nashua’s remediation expense, if any, is not likely to have a material effect on its
consolidated financial position or results of operations. As of the years ended 2012 and 2011, the undiscounted liability relating to the Company’s
environmental matters was $2.1 million and $2.3 million, respectively, primarily the amount recorded on Nashua’s acquisition date, and is included
in other liabilities. There have been no material changes related to these environmental matters and, based on information currently available,
the Company believes that remediation of these environmental matters will not have a material effect on the Company’s consolidated financial
statements.
Litigation. The Company is party to various legal actions that are ordinary and incidental to its business. While the outcome of pending legal
actions cannot be predicted with certainty, management believes the outcome of these various proceedings will not have a material effect on the
Company’s consolidated financial statements. In 2012, the Company reached an agreement with all parties to settle all controversies and disputes
with prejudice in connection with certain civil litigations filed in the United States District Court for the Northern District of New York and in
the Superior Court of New Jersey, Burlington County. As the Company’s liability arising out of these litigations existed as of the December 2011
balance sheet date, this settlement was recorded in the fourth quarter of 2011 within other expense (income), net in the consolidated statement of
operations. The Company funded this settlement in 2012. In 2011, the Company reached an agreement with all defendants to settle all controversies
and disputes and agreed to dismiss all claims against the defendants with prejudice in connection with a civil litigation filed in Minneapolis, Minnesota.
This settlement was recorded as a reduction to selling, general and administrative expenses in the consolidated statement of operations.
Concentrations of Credit Risk. The Company has limited concentrations of credit risk with respect to financial instruments. Temporary cash
investments and other investments are placed with high credit quality institutions, and concentrations within accounts receivable are generally
limited due to the Company’s diverse customer base and its dispersion across different industries and geographic areas. The Company extends
credit to customers based on its evaluation of the customer’s financial condition. The Company does not require that any collateral be provided
by its customers.
Letters of Credit. As of the year ended 2012, the Company had outstanding letters of credit of approximately $22.4 million and a de minimis
amount of surety bonds. Based on the Company’s experience with these arrangements, it does not believe that any obligations that may arise will
have a material effect on the Company’s consolidated financial condition or results of operations.
Tax Audits. The Company’s income, sales and use, and other tax returns are routinely subject to audit by various authorities. The Company
believes that the resolution of any matters raised during such audits will not have a material effect on the Company’s consolidated financial position
or its results of operations.
Multi-Employer Pension Plans. The Company participates in a number of multi-employer pension plans for union employees (“Multi-
Employer Plans”) and is exposed to significant risks and uncertainties arising from its participation in these Multi-Employer Plans. These risks and
uncertainties, including changes in future contributions due to partial or full withdrawal of the Company and other participating employers from
these Multi-Employer Plans, could significantly increase the Company’s future contributions or the underfunded status of these Multi-Employer
Plans. Two of the Multi-Employer Plans are in mass withdrawal status. While it is not possible to quantify the potential impact of future actions of the
Company or other participating employers from these Multi-Employer Plans, continued participation in or withdrawal from these multi-employer
pension plans could have a material impact on the Company’s consolidated financial statements.
15. Accumulated Other Comprehensive Loss
The components of accumulated other comprehensive loss are as follows:
(in thousands) 2012 2011Currency translation adjustments $ 2,945 $ 2,280
Pension liability adjustments, net of tax benefit of $5,225 and $23,217 as of the years ended 2012 and 2011, respectively (70,146) (62,160)
Total accumulated other comprehensive loss $(67,201) $(59,880)
16. Income (Loss) per Share
Basic income (loss) per share is computed based upon the weighted average number of common shares outstanding for the period. When
applicable, diluted income (loss) per share is calculated using two approaches. The first approach, the treasury stock method, reflects the potential
dilution that could occur if the stock options and RSUs (“Equity Awards”) to issue common stock were exercised. The second approach, the if
converted method, reflects the potential dilution of the Equity Awards and the 7% Notes being exchanged for common stock. Under this method,
interest expense associated with the 7% Notes, net of tax, is added back to income from continuing operations and the shares outstanding are
increased by the underlying 7% Notes equivalent.
For the years ended 2012, 2011 and 2010, the effect of approximately 24,131,138; 5,806,615 and 5,087,770 respectively, related to the
exchange of the 7% Notes for common stock, stock options outstanding and unvested RSUs, which would be calculated using the treasury stock
method, were excluded from the calculation of diluted income (loss) per share, as the effect would be anti-dilutive.
The following table sets forth the computation of basic and diluted income (loss) per share for the periods ended:
Years Ended
(in thousands, except per share data) 2012 2011 2010Numerator for basic and diluted income (loss) per share:
Loss from continuing operations $(73,864) $(1,028) $(197,698)
(Loss) income from discontinued operations, net of taxes (6,023) (7,537) 11,321
Net loss $(79,887) $(8,565) $(186,377)
Denominator for weighted average common shares outstanding:
Basic shares 63,567 62,983 62,382
Dilutive effect of convertible notes — — —
Dilutive effect of equity awards — — —
Diluted shares 63,567 62,983 62,382
Income (loss) per share—basic:
Continuing operations $ (1.16) $ (0.02) $ (3.17)
Discontinued operations (0.10) (0.12) 0.18
Net loss $ (1.26) $ (0.14) $ (2.99)
Income (loss) per share—diluted:
Continuing operations $ (1.16) $ (0.02) $ (3.17)
Discontinued operations (0.10) (0.12) 0.18
Net loss $ (1.26) $ (0.14) $ (2.99)
- 7 6 - C E N V E O 2 0 1 2 | L E A D + I N V E S T C E N V E O 2 0 1 2 | L E A D + I N V E S T - 7 7 -
NOTES TO CONSOLIDATED FINANCIAL STATEMENTS
(CONTINUED)
NOTES TO CONSOLIDATED FINANCIAL STATEMENTS
(CONTINUED)

17. Segment InformationIn the first quarter of 2012, the Company realigned its reportable segments as a result of the sale of the Discontinued Operations combined
with the realignment of management responsibilities. Previously, the Company reported its segments as envelopes, forms and labels and commercial
printing. Beginning January 1, 2012, the Company realigned its segments into two complementary reportable segments—the print and envelope
segment and the label and packaging segment. The print and envelope segment provides a wide array of print offerings such as high-end printed
materials including car brochures, advertising literature, corporate identity and brand marketing material, digital printing and content management;
and direct mail offerings and custom and stock envelopes. The label and packaging segment specializes in the design, manufacturing and printing
of labels such as, custom labels, overnight packaging labels, pressure-sensitive prescription labels and high quality packaging offerings, full body
shrink sleeves, and specialized folded carton packaging. Segment information for the years ended 2011 and 2010 have been reclassified to reflect
the 2012 reportable segment presentation.
Operating income (loss) of each segment includes substantially all costs and expenses directly related to the segment’s operations. Corporate
expenses include corporate general and administrative expenses including stock-based compensation.
Corporate identifiable assets primarily consist of cash and cash equivalents, miscellaneous receivables, deferred financing fees, deferred tax
assets and other assets.
The following tables present certain segment information:
Years Ended
(in thousands) 2012 2011 2010Net sales:
Print and envelope $1,362,030 $1,467,558 $1,272,271
Label and packaging 435,552 441,629 436,258
Total $1,797,582 $1,909,187 $1,708,529
Operating income:
Print and envelope $ 94,241 $ 110,311 $ (114,286)
Label and packaging 49,769 50,602 34,061
Corporate (31,814) (43,153) (37,719)
Total $ 112,196 $ 117,760 $ (117,944)
Restructuring, impairment and other charges:
Print and envelope $ 25,045 $ 15,828 $ 213,348
Label and packaging 1,219 1,345 9,757
Corporate 836 639 3,045
Total $ 27,100 $ 17,812 $ 226,150
Significant non-cash charges:
Print and envelope $ 21,676 $ 16,412 $ 202,694
Label and packaging 1,575 3,302 3,958
Corporate 2,408 1,449 1,622
Total $ 25,659 $ 21,163 $ 208,274
Depreciation and intangible asset amortization:
Print and envelope $ 42,464 $ 44,368 $ 44,871
Label and packaging 15,136 16,408 16,512
Corporate 4,327 3,178 2,469
Total $ 61,927 $ 63,954 $ 63,852
Capital expenditures:
Print and envelope $ 10,322 $ 8,185 $ 13,028
Label and packaging 3,987 2,476 1,454
Corporate 6,642 5,010 3,670
Total $ 20,951 $ 15,671 $ 18,152
Net sales by product line:
Print $ 666,185 $ 720,558 $ 747,681
Envelope 695,845 747,000 524,590
Label 331,543 334,671 344,266
Packaging 104,009 106,958 91,992
Total $1,797,582 $1,909,187 $1,708,529
Intercompany sales:
Print and envelope to label and packaging $ 5,483 $ 4,262 $ 5,426
Label and packaging to print and envelope 9,267 7,884 1,912
Total $ 14,750 $ 12,146 $ 7,338
- 7 8 - C E N V E O 2 0 1 2 | L E A D + I N V E S T C E N V E O 2 0 1 2 | L E A D + I N V E S T - 7 9 -
NOTES TO CONSOLIDATED FINANCIAL STATEMENTS(CONTINUED)
NOTES TO CONSOLIDATED FINANCIAL STATEMENTS(CONTINUED)

(in thousands) 2012 2011
Total assets:
Print and envelope $ 796,739 $ 867,329
Label and packaging 327,726 392,417
Corporate 76,090 125,842
Total $1,200,555 $1,385,588
Geographic information is as follows for the years ended:
(in thousands) 2012 2011 2010
Net sales:
US $1,714,878 $1,813,093 $1,605,832
Foreign 82,704 96,094 102,697
Total $1,797,582 $1,909,187 $1,708,529
(in thousands) 2012 2011
Long-lived assets (property, plant and equipment, goodwill and intangible assets):
US $ 651,409 $702,853
Foreign 35,510 40,099
Total $ 686,919 $742,952
18. Condensed Consolidating Financial Information
Cenveo, Inc. is a holding company (the “Parent Company”), which is the ultimate parent of all Cenveo subsidiaries. The Parent Company’s
wholly owned subsidiary, Cenveo Corporation (the “Subsidiary Issuer”), issued the 7.875% Notes, the 8.875% Notes and the 11.5% Notes
(collectively with the 7.875% Notes and the 8.875% Notes, the “Subsidiary Issuer Notes”), which are fully and unconditionally guaranteed, on a
joint and several basis, by the Parent Company and substantially all of its wholly-owned subsidiaries (the “Guarantor Subsidiaries”).
Presented below is condensed consolidating financial information for the Parent Company, the Subsidiary Issuer, the Guarantor Subsidiaries
and the Non-Guarantor Subsidiaries as of 2012 and 2011 and for the three years ended 2012, 2011 and 2010. The condensed consolidating financial
information has been presented to show the financial position, results of operations and cash flows of the Parent Company, the Subsidiary Issuer,
the Guarantor Subsidiaries and the Non-Guarantor Subsidiaries, assuming the guarantee structure of the Subsidiary Issuer Notes was in effect at
the beginning of the periods presented.
The supplemental condensed consolidating financial information reflects the investments of the Parent Company in the Subsidiary Issuer,
the Guarantor Subsidiaries and the Non-Guarantor Subsidiaries using the equity method of accounting. The Company’s primary transactions
with its subsidiaries other than the investment account and related equity in net income (loss) of unconsolidated subsidiaries are the intercompany
payables and receivables between its subsidiaries.
CENVEO, INC. AND SUBSIDIARIES
CONDENSED CONSOLIDATING BALANCE SHEET
2012
(in thousands)Parent
CompanySubsidiary
IssuerGuarantor
SubsidiariesNon-Guarantor
Subsidiaries Eliminations Consolidated
Assets
Current assets:
Cash and cash equivalents $ — $ 5,763 $ 286 $ 2,061 $ — $ 8,110
Accounts receivable, net — 100,779 159,830 1,002 — 261,611
Inventories — 61,900 68,787 82 — 130,769
Notes receivable from subsidiaries — 36,938 — — (36,938) —
Prepaid and other current assets — 53,612 12,078 2,783 — 68,473
Total current assets — 258,992 240,981 5,928 (36,938) 468,963
Investment in subsidiaries (464,314) 1,758,007 7,671 6,725 (1,308,089) —
Property, plant and equipment, net — 88,941 192,450 1,209 — 282,600
Goodwill — 29,540 155,849 6,026 — 191,415
Other intangible assets, net — 6,621 204,460 1,823 — 212,904
Other assets, net — 40,301 3,868 504 — 44,673
Total assets $(464,314) $2,182,402 $ 805,279 $22,215 $(1,345,027) $1,200,555
Liabilities and Shareholders’ (Deficit) Equity
Current liabilities:
Current maturities of long-term debt $ — $ 6,961 $ 4,787 $ — $ — $ 11,748
Accounts payable — 107,443 77,313 515 — 185,271
Accrued compensation and related liabilities — 14,608 10,201 514 — 25,323
Other current liabilities — 56,995 20,365 532 — 77,892
Intercompany payable (receivable) — 1,177,669 (1,185,665) 7,996 — —
Notes payable to issuer — — 36,938 — (36,938) —
Total current liabilities — 1,363,676 (1,036,061) 9,557 (36,938) 300,234
Long-term debt — 1,166,360 5,510 — — 1,171,870
Other liabilities — 116,680 77,823 (1,738) — 192,765
Shareholders’ (deficit) equity (464,314) (464,314) 1,758,007 14,396 (1,308,089) (464,314)
Total liabilities and shareholders’ (deficit) equity $(464,314) $2,182,402 $ 805,279 $22,215 $(1,345,027) $1,200,555
- 8 0 - C E N V E O 2 0 1 2 | L E A D + I N V E S T C E N V E O 2 0 1 2 | L E A D + I N V E S T - 8 1 -
NOTES TO CONSOLIDATED FINANCIAL STATEMENTS
(CONTINUED)
NOTES TO CONSOLIDATED FINANCIAL STATEMENTS
(CONTINUED)

CENVEO, INC. AND SUBSIDIARIESCONDENSED CONSOLIDATING STATEMENT OF OPERATIONS AND COMPREHENSIVE INCOME (LOSS)For the year ended 2012
(in thousands)Parent
CompanySubsidiary
IssuerGuarantor
SubsidiariesNon-Guarantor
Subsidiaries Eliminations ConsolidatedNet sales $ — $ 710,943 $1,071,396 $15,243 $ — $1,797,582Cost of sales — 593,043 854,652 13,519 — 1,461,214Selling, general and administrative
expenses — 102,308 83,716 765 — 186,789Amortization of intangible assets — 582 9,179 522 — 10,283Restructuring, impairment and other
charges — 5,917 21,087 96 — 27,100Operating income — 9,093 102,762 341 — 112,196
Interest expense, net — 114,164 607 (16) — 114,755Intercompany interest expense
(income) — (1,476) 1,404 72 — —Loss on early extinguishment of debt,
net — 12,487 — — — 12,487Other (income) expense, net — (1,125) 46 (170) — (1,249)Income (loss) from continuing
operations before income taxes and equity in income of unconsolidated subsidiaries — (114,957) 100,705 455 — (13,797)
Income tax expense (benefit) — 35,280 25,193 (406) — 60,067Income (loss) from continuing
operations before equity in income of unconsolidated subsidiaries — (150,237) 75,512 861 — (73,864)
Equity in income of unconsolidated subsidiaries (79,887) 68,896 861 — 10,130 —
Income (loss) from continuing operations (79,887) (81,341) 76,373 861 10,130 (73,864)
(Loss) income from discontinued operations, net of taxes — 1,454 (7,477) — — (6,023)
Net (loss) income (79,887) (79,887) 68,896 861 10,130 (79,887)Other comprehensive income (loss):
Other comprehensive income (loss) of unconsolidated subsidiaries (7,321) (64) (589) — 7,974 —
Pension liability adjustment, net of taxes — (7,257) (729) — — (7,986)
Currency translation adjustment — — 1,254 (589) — 665Comprehensive (loss) income $(87,208) $ (87,208) $ 68,832 $ 272 $18,104 $ (87,208)
CENVEO, INC. AND SUBSIDIARIESCONDENSED CONSOLIDATING STATEMENT OF CASH FLOWSFor the year ended 2012
(in thousands)Parent
CompanySubsidiary
IssuerGuarantor
Subsidiaries
Non- Guarantor
Subsidiaries Eliminations ConsolidatedCash flows from operating activities:
Net cash provided by (used in) operating activities of continuing operations $ 5,333 $(105,650) $ 154,621 $ 2,494 $ — $ 56,798
Net cash used in operating activities of discontinued operations — (1,799) (2,934) — — (4,733)
Net cash provided by (used in) operating activities 5,333 (107,449) 151,687 2,494 — 52,065
Cash flows from investing activities:
Cost of business acquisitions, net of cash acquired — (644) — — — (644)
Capital expenditures — (10,563) (10,223) (165) — (20,951)Purchase of investment — (350) — — — (350)Proceeds from sale of property,
plant and equipment — 360 7,618 — — 7,978Proceeds from sale of
intangible assets — 5,700 — — — 5,700Intercompany note — 3,900 — — (3,900) —
Net cash used in investing activities of continuing operations — (1,597) (2,605) (165) (3,900) (8,267)
Net cash provided by investing activities of discontinued operations — 16,414 23,507 — — 39,921
Net cash provided by (used in) investing activities — 14,817 20,902 (165) (3,900) 31,654
Cash flows from financing activities:
Repayment of 10.5% senior notes — (169,875) — — — (169,875)Repayment of 7.875% senior
subordinated notes — (214,831) — — — (214,831)Repayment of 8.375% senior
subordinated notes — (24,787) — — — (24,787)Payment of financing related costs and
expenses and debt issuance discounts — (37,836) — — — (37,836)Repayments of other long-term debt — (147) (4,699) — — (4,846)Purchase and retirement of common
stock upon vesting of RSUs (735) — — — — (735)Proceeds from issuance of 11.5%
senior notes — 225,000 — — — 225,000Proceeds from issuance of 7%
senior exchangeable notes — 86,250 — — — 86,250Borrowings under revolving
credit facility, net — 18,000 — — — 18,000Proceeds from issuance of Term Loan B — 31,844 — — — 31,844Intercompany note — — — (3,900) 3,900 —Intercompany advances (4,598) 170,396 (167,988) 2,190 — —
Net cash (used in) provided by financing activities of continuing operations (5,333) 84,014 (172,687) (1,710) 3,900 (91,816)
Net cash used in financing activities of discontinued operations — (1,652) — — — (1,652)
Net cash (used in) provided by financing activities (5,333) 82,362 (172,687) (1,710) 3,900 (93,468)
Effect of exchange rate changes on cash and cash equivalents — — 104 2 — 106
Net increase (decrease) in cash and cash equivalents — (10,270) 6 621 — (9,643)
Cash and cash equivalents at beginning of year — 16,033 280 1,440 — 17,753
Cash and cash equivalents at end of year $ — $ 5,763 $ 286 $ 2,061 $ — $ 8,110
- 8 2 - C E N V E O 2 0 1 2 | L E A D + I N V E S T C E N V E O 2 0 1 2 | L E A D + I N V E S T - 8 3 -
NOTES TO CONSOLIDATED FINANCIAL STATEMENTS(CONTINUED)
NOTES TO CONSOLIDATED FINANCIAL STATEMENTS(CONTINUED)

CENVEO, INC. AND SUBSIDIARIESCONDENSED CONSOLIDATING BALANCE SHEET2011
(in thousands)Parent
CompanySubsidiary
IssuerGuarantor
SubsidiariesNon-Guarantor
Subsidiaries Eliminations ConsolidatedAssetsCurrent assets:
Cash and cash equivalents $ — $ 16,033 $ 280 $ 1,440 $ — $ 17,753Accounts receivable, net — 113,368 174,003 1,112 — 288,483Inventories — 63,234 70,434 128 — 133,796Notes receivable
from subsidiaries — 40,838 — — (40,838) —Prepaid and other
current assets — 57,967 10,953 3,822 — 72,742Assets of discontinued
operations—current — 9,455 13,501 — — 22,956 Total current assets — 300,895 269,171 6,502 (40,838) 535,730Investment in subsidiaries (381,704) 1,681,084 7,399 6,725 (1,313,504) —Property, plant and equipment, net — 96,680 229,932 1,955 — 328,567Goodwill — 29,244 155,361 6,217 — 190,822Other intangible assets, net — 6,785 214,435 2,343 — 223,563Other assets, net — 107,286 (29,400) 1,604 — 79,490Assets of discontinued
operations—long-term — 5,717 21,699 — — 27,416 Total assets $(381,704) $2,227,691 $ 868,597 $25,346 $(1,354,342) $1,385,588Liabilities and Shareholders’
(Deficit) EquityCurrent liabilities:
Current maturities of long-term debt $ — $ 4,109 $ 4,700 $ — $ — $ 8,809
Accounts payable — 94,503 91,311 834 — 186,648Accrued compensation and
related liabilities — 26,173 12,760 222 — 39,155Other current liabilities — 72,813 22,634 460 — 95,907Liabilities of discontinued
operations—current — 2,492 2,854 — — 5,346Intercompany payable
(receivable) — 1,005,396 (1,011,202) 5,806 — —Notes payable to issuer — — 36,938 3,900 (40,838) —
Total current liabilities — 1,205,486 (840,005) 11,222 (40,838) 335,865Long-term debt — 1,227,238 10,296 — — 1,237,534Other liabilities — 175,088 10,331 — — 185,419Liabilities of discontinued
operations—long-term — 1,583 6,891 — — 8,474Shareholders’ (deficit) equity (381,704) (381,704) 1,681,084 14,124 (1,313,504) (381,704)
Total liabilities and shareholders’ (deficit) equity $(381,704) $2,227,691 $ 868,597 $25,346 $(1,354,342) $1,385,588
CENVEO, INC. AND SUBSIDIARIESCONDENSED CONSOLIDATING STATEMENT OF OPERATIONS AND COMPREHENSIVE INCOME (LOSS)For the year ended 2011
(in thousands)Parent
CompanySubsidiary
IssuerGuarantor
SubsidiariesNon-Guarantor
Subsidiaries Eliminations ConsolidatedNet sales $ — $ 726,420 $1,164,013 $18,754 $ — $1,909,187Cost of sales — 595,529 935,360 15,284 — 1,546,173Selling, general and
administrative expenses — 118,807 97,247 1,082 — 217,136Amortization of intangible assets — 426 9,344 536 — 10,306Restructuring, impairment and
other charges — 8,773 9,010 29 — 17,812Operating income (loss) — 2,885 113,052 1,823 — 117,760
Gain on bargain purchase — (11,720) — — — (11,720)Interest expense, net — 115,307 712 (51) — 115,968Intercompany interest expense
(income) — (1,180) 975 205 — —(Gain) loss on early extinguishment
of debt, net — (4,011) — — — (4,011)Other (income) expense, net — 9,832 378 (1,136) — 9,074Income (loss) from continuing
operations before income taxes and equity in income of unconsolidated subsidiaries — (105,343) 110,987 2,805 — 8,449
Income tax expense (benefit) — 16,226 (8,396) 1,647 — 9,477Income (loss) from continuing
operations before equity in income of unconsolidated subsidiaries — (121,569) 119,383 1,158 — (1,028)
Equity in income of unconsolidated subsidiaries (8,565) 111,454 1,158 — (104,047) —
Income (loss) from continuing operations (8,565) (10,115) 120,541 1,158 (104,047) (1,028)
Income (loss) from discontinued operations, net of taxes — 1,550 (9,087) — — (7,537)
Net income (loss) (8,565) (8,565) 111,454 1,158 (104,047) (8,565)Other comprehensive income (loss):
Other comprehensive income (loss) of unconsolidated subsidiaries (39,597) (4,260) (5,006) — 48,863 —
Pension liability adjustment, net of taxes — (37,130) — — — (37,130)
Reclassifications of losses related to interest rate swaps into earnings, net of taxes — 1,793 — — — 1,793
Currency translation adjustment — — 746 (5,006) — (4,260)Comprehensive income (loss) $(48,162) $ (48,162) $ 107,194 $ (3,848) $ (55,184) $ (48,162)
- 8 4 - C E N V E O 2 0 1 2 | L E A D + I N V E S T C E N V E O 2 0 1 2 | L E A D + I N V E S T - 8 5 -
NOTES TO CONSOLIDATED FINANCIAL STATEMENTS(CONTINUED)
NOTES TO CONSOLIDATED FINANCIAL STATEMENTS(CONTINUED)

CENVEO, INC. AND SUBSIDIARIESCONDENSED CONSOLIDATING STATEMENT OF CASH FLOWSFor the year ended 2011
(in thousands)Parent
CompanySubsidiary
IssuerGuarantor
Subsidiaries
Non-Guarantor
Subsidiaries Eliminations ConsolidatedCash flows from operating activities:
Net cash provided by (used in) operating activities of continuing operations $ 8,716 $(105,375) $ 178,872 $ 1,605 $ — $ 83,818
Net cash provided by operating activities of discontinued operations — 3,886 (7,382) — — (3,496)
Net cash provided by (used in) operating activities 8,716 (101,489) 171,490 1,605 — 80,322
Cash flows from investing activities:
Cost of business acquisitions, net of cash acquired — (59,719) — — — (59,719)
Capital expenditures — (9,972) (5,004) (695) — (15,671)
Proceeds from sale of property, plant and equipment — 1,298 9,816 — — 11,114
Intercompany note — 5,600 — — (5,600) —
Net cash (used in) provided by investing activities of continuing operations — (62,793) 4,812 (695) (5,600) (64,276)
Net cash used in investing activities of discontinued operations — (536) — — — (536)
Net cash (used in) provided by investing activities — (63,329) 4,812 (695) (5,600) (64,812)
Cash flows from financing activities:
Repayment of 7.875% senior subordinated notes — (8,952) — — — (8,952)
Repayment of Term Loan B due 2016 — (23,800) — — — (23,800)
Repayment of 8.375% senior subordinated notes — (5,363) — — — (5,363)
Payment of financing related costs and expenses — (2,675) — — — (2,675)
Repayments of other long-term debt — (107) (6,296) — — (6,403)
Purchase and retirement of common stock upon vesting of RSUs (1,283) — — — — (1,283)
Proceeds from exercise of stock options 356 — — — — 356
Intercompany note — — — (5,600) 5,600 —
Intercompany advances (7,789) 174,867 (170,730) 3,652 — —
Net cash provided by (used in) financing activities (8,716) 133,970 (177,026) (1,948) 5,600 (48,120)
Effect of exchange rate changes on cash and cash equivalents — — — 614 — 614
Net increase (decrease) in cash and cash equivalents — (30,848) (724) (424) — (31,996)
Cash and cash equivalents at beginning of year — 46,881 1,004 1,864 — 49,749
Cash and cash equivalents at end of year $ — $ 16,033 $ 280 $ 1,440 $ — $ 17,753
CENVEO, INC. AND SUBSIDIARIESCONDENSED CONSOLIDATING STATEMENT OF OPERATIONS AND COMPREHENSIVE INCOME (LOSS)For the year ended 2010
(in thousands)Parent
CompanySubsidiary
IssuerGuarantor
Subsidiaries
Non-Guarantor
Subsidiaries Eliminations ConsolidatedNet sales $ — $ 681,636 $1,000,555 $26,338 $ — $1,708,529
Cost of sales — 570,082 797,747 17,873 — 1,385,702
Selling, general and administrative expenses — 106,469 95,840 1,674 — 203,983
Amortization of intangible assets — 421 9,949 268 — 10,638
Restructuring, impairment and other charges — 25,415 200,735 — — 226,150
Operating income (loss) — (20,751 ) (103,716) 6,523 — (117,944)
Interest expense, net — 119,965 1,161 (89 ) — 121,037
Intercompany interest expense (income) — (1,116 ) 990 126 — —
(Gain) loss on early extinguishment of debt, net — 9,592 — — — 9,592
Other (income) expense, net — 1,137 923 267 — 2,327
Income (loss) from continuing operations before income taxes and equity in income of unconsolidated subsidiaries — (150,329 ) (106,790) 6,219 — (250,900)
Income tax expense (benefit) — (26,254 ) (27,341) 393 — (53,202)
Income (loss) from continuing operations before equity in income of unconsolidated subsidiaries — (124,075 ) (79,449) 5,826 — (197,698)
Equity in income of unconsolidated subsidiaries (186,377 ) (67,754 ) 5,826 — 248,305 —
Income (loss) from continuing operations (186,377 ) (191,829 ) (73,623) 5,826 248,305 (197,698)
Income (loss) from discontinued operations, net of taxes — 5,452 5,869 — — 11,321
Net income (loss) (186,377 ) (186,377 ) (67,754) 5,826 248,305 (186,377)
Other comprehensive income (loss):
Other comprehensive income (loss) of unconsolidated subsidiaries 9,993 25,763 1,152 — (36,908 ) —
Pension liability adjustment, net of taxes — (25,460 ) 22,762 — — (2,698)
Unrealized gain on cash flow hedges, net of taxes — 8,449 — — — 8,449
Reclassifications of losses related to interest rate swaps into earnings, net of taxes — 1,241 — — — 1,241
Currency translation adjustment — — 1,849 1,152 — 3,001
Comprehensive income (loss) $(176,384 ) $(176,384 ) $ (41,991) $ 6,978 $ 211,397 $ (176,384)
- 8 6 - C E N V E O 2 0 1 2 | L E A D + I N V E S T C E N V E O 2 0 1 2 | L E A D + I N V E S T - 8 7 -
NOTES TO CONSOLIDATED FINANCIAL STATEMENTS(CONTINUED)
NOTES TO CONSOLIDATED FINANCIAL STATEMENTS(CONTINUED)
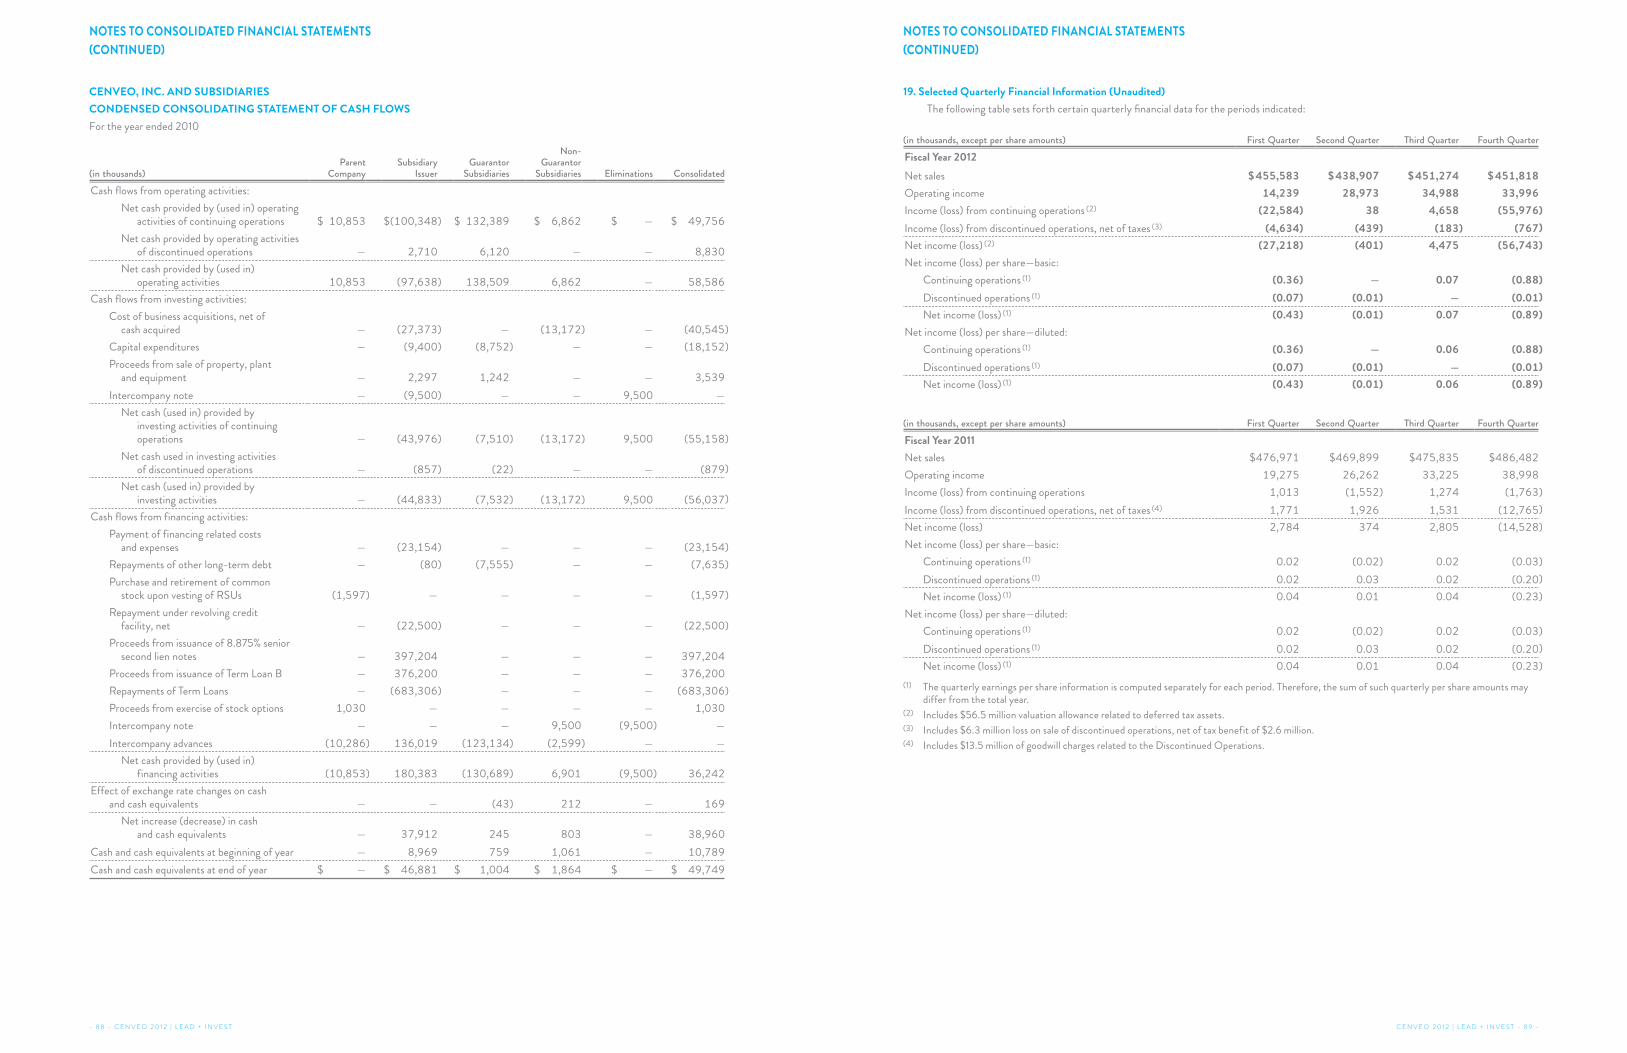
CENVEO, INC. AND SUBSIDIARIESCONDENSED CONSOLIDATING STATEMENT OF CASH FLOWSFor the year ended 2010
(in thousands)Parent
CompanySubsidiary
IssuerGuarantor
Subsidiaries
Non-Guarantor
Subsidiaries Eliminations ConsolidatedCash flows from operating activities:
Net cash provided by (used in) operating activities of continuing operations $ 10,853 $(100,348) $ 132,389 $ 6,862 $ — $ 49,756
Net cash provided by operating activities of discontinued operations — 2,710 6,120 — — 8,830
Net cash provided by (used in) operating activities 10,853 (97,638) 138,509 6,862 — 58,586
Cash flows from investing activities:
Cost of business acquisitions, net of cash acquired — (27,373) — (13,172) — (40,545)
Capital expenditures — (9,400) (8,752) — — (18,152)
Proceeds from sale of property, plant and equipment — 2,297 1,242 — — 3,539
Intercompany note — (9,500) — — 9,500 —
Net cash (used in) provided by investing activities of continuing
operations — (43,976) (7,510) (13,172) 9,500 (55,158)
Net cash used in investing activities of discontinued operations — (857) (22) — — (879)
Net cash (used in) provided by investing activities — (44,833) (7,532) (13,172) 9,500 (56,037)
Cash flows from financing activities:
Payment of financing related costs and expenses — (23,154) — — — (23,154)
Repayments of other long-term debt — (80) (7,555) — — (7,635)
Purchase and retirement of common stock upon vesting of RSUs (1,597) — — — — (1,597)
Repayment under revolving credit facility, net — (22,500) — — — (22,500)
Proceeds from issuance of 8.875% senior second lien notes — 397,204 — — — 397,204
Proceeds from issuance of Term Loan B — 376,200 — — — 376,200
Repayments of Term Loans — (683,306) — — — (683,306)
Proceeds from exercise of stock options 1,030 — — — — 1,030
Intercompany note — — — 9,500 (9,500) —
Intercompany advances (10,286) 136,019 (123,134) (2,599) — —
Net cash provided by (used in) financing activities (10,853) 180,383 (130,689) 6,901 (9,500) 36,242
Effect of exchange rate changes on cash and cash equivalents — — (43) 212 — 169
Net increase (decrease) in cash and cash equivalents — 37,912 245 803 — 38,960
Cash and cash equivalents at beginning of year — 8,969 759 1,061 — 10,789
Cash and cash equivalents at end of year $ — $ 46,881 $ 1,004 $ 1,864 $ — $ 49,749
19. Selected Quarterly Financial Information (Unaudited)The following table sets forth certain quarterly financial data for the periods indicated:
(in thousands, except per share amounts) First Quarter Second Quarter Third Quarter Fourth QuarterFiscal Year 2012Net sales $ 455,583 $ 438,907 $ 451,274 $ 451,818Operating income 14,239 28,973 34,988 33,996Income (loss) from continuing operations (2) (22,584) 38 4,658 (55,976)Income (loss) from discontinued operations, net of taxes (3) (4,634) (439) (183) (767)Net income (loss) (2) (27,218) (401) 4,475 (56,743)Net income (loss) per share—basic:
Continuing operations (1) (0.36) — 0.07 (0.88)Discontinued operations (1) (0.07) (0.01) — (0.01)Net income (loss) (1) (0.43) (0.01) 0.07 (0.89)
Net income (loss) per share—diluted:
Continuing operations (1) (0.36) — 0.06 (0.88)Discontinued operations (1) (0.07) (0.01) — (0.01)Net income (loss) (1) (0.43) (0.01) 0.06 (0.89)
(in thousands, except per share amounts) First Quarter Second Quarter Third Quarter Fourth QuarterFiscal Year 2011Net sales $476,971 $469,899 $475,835 $486,482
Operating income 19,275 26,262 33,225 38,998
Income (loss) from continuing operations 1,013 (1,552) 1,274 (1,763)
Income (loss) from discontinued operations, net of taxes (4) 1,771 1,926 1,531 (12,765)
Net income (loss) 2,784 374 2,805 (14,528)
Net income (loss) per share—basic:
Continuing operations (1) 0.02 (0.02) 0.02 (0.03)
Discontinued operations (1) 0.02 0.03 0.02 (0.20)
Net income (loss) (1) 0.04 0.01 0.04 (0.23)
Net income (loss) per share—diluted:
Continuing operations (1) 0.02 (0.02) 0.02 (0.03)
Discontinued operations (1) 0.02 0.03 0.02 (0.20)
Net income (loss) (1) 0.04 0.01 0.04 (0.23)
(1) The quarterly earnings per share information is computed separately for each period. Therefore, the sum of such quarterly per share amounts may differ from the total year.
(2) Includes $56.5 million valuation allowance related to deferred tax assets.(3) Includes $6.3 million loss on sale of discontinued operations, net of tax benefit of $2.6 million.(4) Includes $13.5 million of goodwill charges related to the Discontinued Operations.
- 8 8 - C E N V E O 2 0 1 2 | L E A D + I N V E S T C E N V E O 2 0 1 2 | L E A D + I N V E S T - 8 9 -
NOTES TO CONSOLIDATED FINANCIAL STATEMENTS(CONTINUED)
NOTES TO CONSOLIDATED FINANCIAL STATEMENTS(CONTINUED)
Management is responsible for establishing and maintaining adequate internal control over financial reporting, as such term is defined in Rule
13a-15(f) of the Exchange Act. The Company’s internal control over financial reporting is a process designed under the supervision of the Company’s
Chief Executive Officer and Chief Financial Officer to provide reasonable assurance regarding the reliability of financial reporting and the
preparation of the Company’s consolidated financial statements for external reporting purposes in accordance with accounting principles generally
accepted in the United States. Our internal control over financial reporting includes policies and procedures that pertain to the maintenance of
records that, in reasonable detail, accurately and fairly reflect transactions and dispositions of assets; provide reasonable assurances that transactions
are recorded as necessary to permit preparation of financial statements in accordance with accounting principles generally accepted in the United
States and that receipts and expenditures are being made only in accordance with authorizations of management and the directors of the Company;
and provide reasonable assurance regarding prevention or timely detection of unauthorized acquisition, use or disposition of the Company’s assets
that could have a material effect on the financial statements.
Management has conducted an assessment of the effectiveness of the Company’s internal control over financial reporting based on the
framework established in Internal Control—Integrated Framework issued by the Committee of Sponsoring Organizations of the Treadway
Commission. Based on this assessment, management has determined that the Company’s internal control over financial reporting as of the year
ended 2012 is effective.
The Company’s internal control over financial reporting as of the year ended 2012 has been audited by Grant Thornton LLP, an independent
registered public accounting firm, as stated in their report appearing on page 91.
Robert G. Burton, Sr. Scott J. Goodwin
Chairman and Chief Executive Officer Chief Financial Officer
Board of Directors and ShareholdersCenveo, Inc.
We have audited the internal control over financial reporting of Cenveo, Inc. (a Colorado corporation) and Subsidiaries (the “Company”) as of
December 29, 2012, based on criteria established in Internal Control—Integrated Framework issued by the Committee of Sponsoring Organizations
of the Treadway Commission (COSO). The Company’s management is responsible for maintaining effective internal control over financial reporting
and for its assessment of the effectiveness of internal control over financial reporting, included in the accompanying Management’s Report on
Internal Control Over Financial Reporting. Our responsibility is to express an opinion on the Company’s internal control over financial reporting
based on our audit.
We conducted our audit in accordance with the standards of the Public Company Accounting Oversight Board (United States). Those
standards require that we plan and perform the audit to obtain reasonable assurance about whether effective internal control over financial reporting
was maintained in all material respects. Our audit included obtaining an understanding of internal control over financial reporting, assessing the
risk that a material weakness exists, testing and evaluating the design and operating effectiveness of internal control based on the assessed risk,
and performing such other procedures as we considered necessary in the circumstances. We believe that our audit provides a reasonable basis for
our opinion.
A company’s internal control over financial reporting is a process designed to provide reasonable assurance regarding the reliability of
financial reporting and the preparation of financial statements for external purposes in accordance with generally accepted accounting principles.
A company’s internal control over financial reporting includes those policies and procedures that (1) pertain to the maintenance of records that, in
reasonable detail, accurately and fairly reflect the transactions and dispositions of the assets of the company; (2) provide reasonable assurance that
transactions are recorded as necessary to permit preparation of financial statements in accordance with generally accepted accounting principles,
and that receipts and expenditures of the company are being made only in accordance with authorizations of management and directors of the
company; and (3) provide reasonable assurance regarding prevention or timely detection of unauthorized acquisition, use, or disposition of the
company’s assets that could have a material effect on the financial statements.
Because of its inherent limitations, internal control over financial reporting may not prevent or detect misstatements. Also, projections of
any evaluation of effectiveness to future periods are subject to the risk that controls may become inadequate because of changes in conditions, or
that the degree of compliance with the policies or procedures may deteriorate.
In our opinion, the Company maintained, in all material respects, effective internal control over financial reporting as of December 29, 2012,
based on criteria established in Internal Control—Integrated Framework issued by COSO.
We have also audited, in accordance with the standards of the Public Company Accounting Oversight Board (United States), the consolidated
balance sheets of the Company as of December 29, 2012 and December 31, 2011, and the related consolidated statements of operations and
comprehensive income (loss), changes in shareholders’ (deficit) equity, and cash flows for each of the three fiscal years in the period ended
December 29, 2012, and our report dated March 4, 2013 expressed an unqualified opinion on those financial statements.
GRANT THORNTON LLP
Melville, New York
March 4, 2013
- 9 0 - C E N V E O 2 0 1 2 | L E A D + I N V E S T C E N V E O 2 0 1 2 | L E A D + I N V E S T - 9 1 -
REPORT OF INDEPENDENT REGISTERED PUBLIC ACCOUNTING FIRMMANAGEMENT’S REPORT ON INTERNAL CONTROL OVER FINANCIAL REPORTING
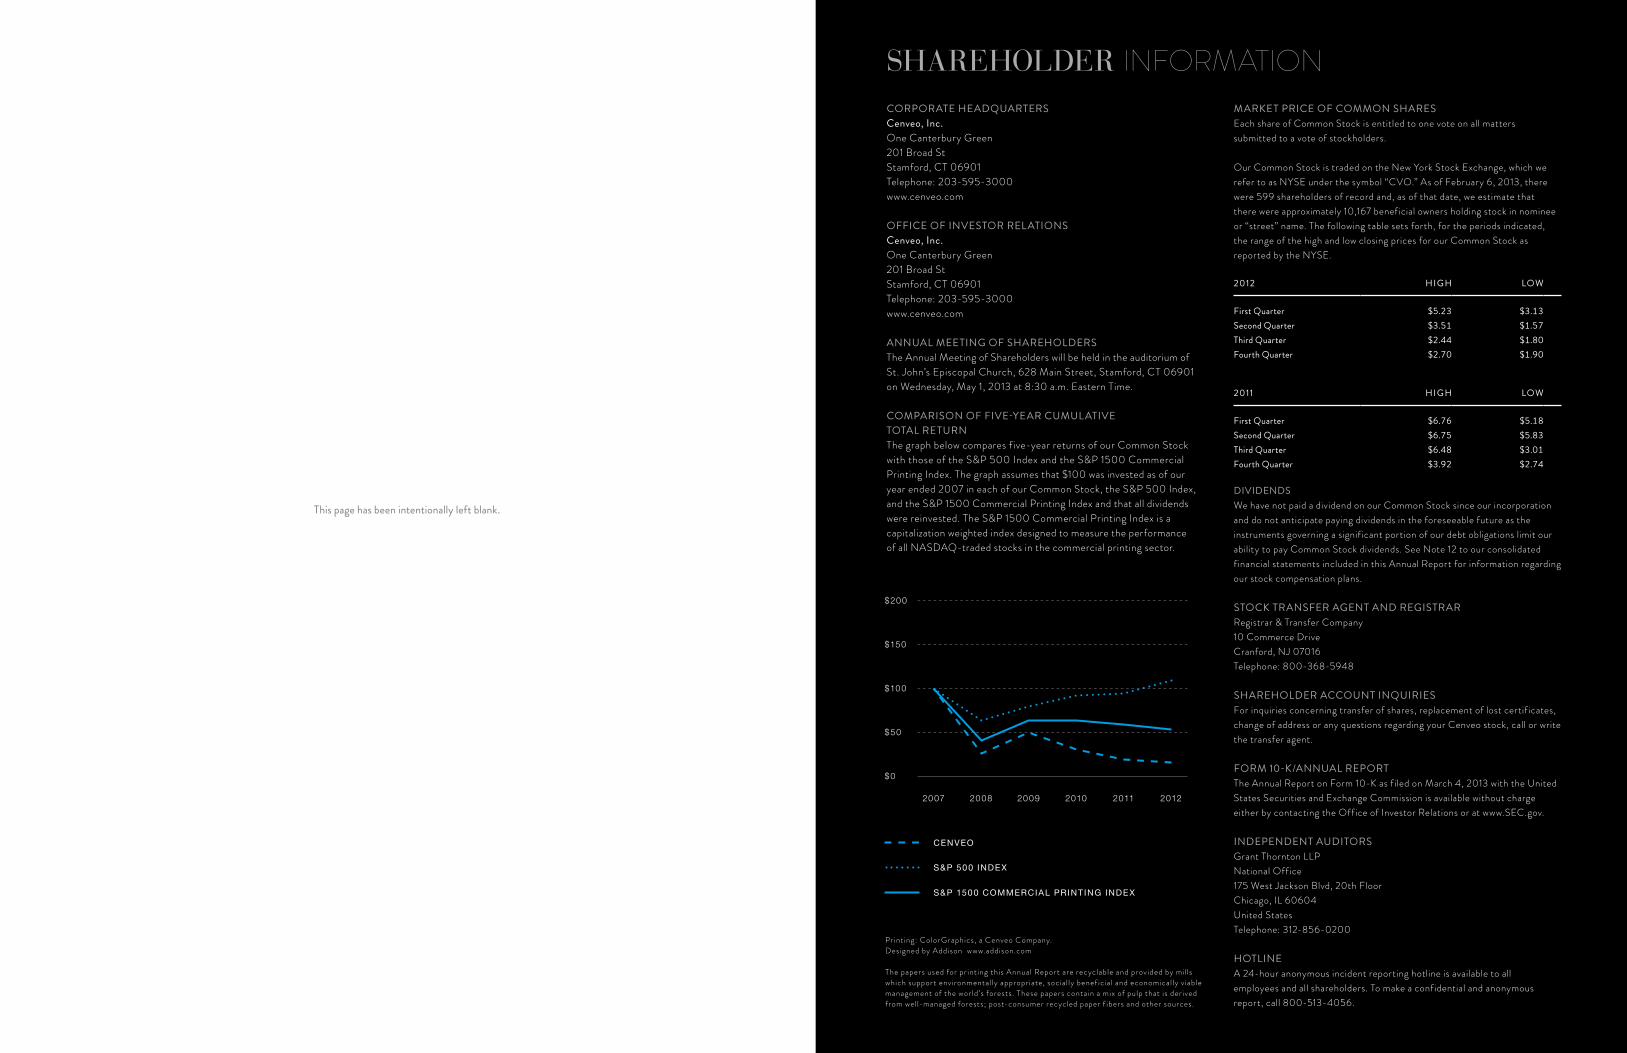
This page has been intentionally left blank.
128150_Financials.r2.indd 92 3/19/13 3:47 PM
CENVEO
S&P 500 INDE X
S&P 1500 COMMERCIAL PRINTING INDE X
$200
$150
$100
$50
$0
2007 2008 2009 2010 2011 2012
higherSTANDArD
MARKET PRICE OF COMMON SHARESEach share of Common Stock is entitled to one vote on all matters submitted to a vote of stockholders.
Our Common Stock is traded on the New York Stock Exchange, which we refer to as NYSE under the symbol “CVO.” As of February 6, 2013, there were 599 shareholders of record and, as of that date, we estimate that there were approximately 10,167 beneficial owners holding stock in nominee or “street” name. The following table sets forth, for the periods indicated, the range of the high and low closing prices for our Common Stock as reported by the NYSE.
2012 HIGH LOW
First Quarter $5.23 $3.13Second Quarter $3.51 $1.57Third Quarter $2.44 $1.80Fourth Quarter $2.70 $1.90
2011 HIGH LOW
First Quarter $6.76 $5.18Second Quarter $6.75 $5.83Third Quarter $6.48 $3.01Fourth Quarter $3.92 $2.74
DIVIDENDSWe have not paid a dividend on our Common Stock since our incorporation and do not anticipate paying dividends in the foreseeable future as the instruments governing a signif icant portion of our debt obligations limit our ability to pay Common Stock dividends. See Note 12 to our consolidated f inancial statements included in this Annual Report for information regarding our stock compensation plans.
STOCK TRANSFER AGENT AND REGISTRARRegistrar & Transfer Company 10 Commerce Drive Cranford, NJ 07016Telephone: 800-368-5948
SHAREHOLDER ACCOUNT INQUIRIESFor inquiries concerning transfer of shares, replacement of lost certif icates, change of address or any questions regarding your Cenveo stock, call or write the transfer agent.
FORM 10-K/ANNUAL REPORTThe Annual Report on Form 10-K as f iled on March 4, 2013 with the United States Securities and Exchange Commission is available without charge either by contacting the Off ice of Investor Relations or at www.SEC.gov.
INDEPENDENT AUDITORSGrant Thornton LLP National Off ice 175 West Jackson Blvd, 20th Floor Chicago, IL 60604 United StatesTelephone: 312-856-0200
HOTLINEA 24-hour anonymous incident reporting hotline is available to all employees and all shareholders. To make a confidential and anonymous report, call 800-513-4056.
SHAREHOLDER iNFOrMATiONCORPORATE HEADQUARTERSCenveo, Inc. One Canterbury Green 201 Broad St Stamford, CT 06901 Telephone: 203-595-3000 www.cenveo.com
OFFICE OF INVESTOR RELATIONSCenveo, Inc. One Canterbury Green 201 Broad St Stamford, CT 06901 Telephone: 203-595-3000 www.cenveo.com
ANNUAL MEETING OF SHAREHOLDERSThe Annual Meeting of Shareholders will be held in the auditorium of St. John’s Episcopal Church, 628 Main Street, Stamford, CT 06901 on Wednesday, May 1, 2013 at 8:30 a.m. Eastern Time.
COMPARISON OF FIVE-YEAR CUMULATIVE TOTAL RETURNThe graph below compares f ive-year returns of our Common Stock with those of the S&P 500 Index and the S&P 1500 Commercial Printing Index. The graph assumes that $100 was invested as of our year ended 2007 in each of our Common Stock, the S&P 500 Index, and the S&P 1500 Commercial Printing Index and that all dividends were reinvested. The S&P 1500 Commercial Printing Index is a capitalization weighted index designed to measure the performance of all NASDAQ-traded stocks in the commercial printing sector.
Pr inting: ColorGraphics, a Cenveo Company. Designed by Addison www.addison.com
The papers used for pr inting this Annual Repor t are recyclable and provided by mil ls which suppor t environmental ly appropr iate, social ly benef icial and economical ly v iable management of the wor ld ’s forests. These papers contain a mix of pulp that is der ived from well-managed forests; post-consumer recycled paper f ibers and other sources.
128150_CVO_AR12_cover.indd 2 3/19/13 3:03 PM
One Canterbury Green201 Broad St
Stamford, CT 06901203-595-3000
www.cenveo.com
One Canterbury Green201 Broad St
Stamford, CT 06901203-595-3000
www.cenveo.com


