35
INSURANCE AND PENSIONS COMMISSION (IPEC) REPORT ON SHORT TERM (NON-LIFE) INSURANCE FOR THE QUARTER ENDED 30 JUNE 2012
| Date post: | 30-Oct-2014 |
| Category: |
Documents |
| Upload: | ishmaelchibvuri |
| View: | 282 times |
| Download: | 6 times |

INSURANCE AND PENSIONS COMMISSION (IPEC)
REPORT ON
SHORT TERM (NON-LIFE) INSURANCE
FOR THE QUARTER ENDED 30 JUNE 2012

I P E C / 2 0 1 2 / 0 2 |2
Contents
1. List of Acronyms and Abbreviations .......................................................................................3
2. Executive Summary ...............................................................................................................4
SECTION A ...................................................................................................................................5
3. Short-Term Insurance Companies ..........................................................................................5
3.1. Update on Number of Operational Institutions ..................................................................6
3.2. Business Written ................................................................................................................6
3.3. Distribution of Gross Premium Written by Business Class ..................................................8
3.4. Earnings .............................................................................................................................9
3.5. Capitalization ...................................................................................................................10
3.6. Asset Quality ....................................................................................................................14
3.7. Market Share for Short-Term Insurers..............................................................................15
3.8. Reinsurance .....................................................................................................................17
SECTION B .................................................................................................................................20
4. Reinsurance Companies ......................................................................................................20
4.1. Update on Number of Operational Institutions ................................................................21
4.2. Business Written ..............................................................................................................21
4.3. Distribution of Gross Premium Written by Business Class ................................................22
4.4. Earnings ...........................................................................................................................23
4.5. Capitalization ...................................................................................................................24
4.6. Asset Quality ....................................................................................................................26
4.7. Market Share for Reinsurers ............................................................................................27
4.8. Retrocession ....................................................................................................................28
SECTION C..................................................................................................................................30
5. Insurance Brokers ................................................................................................................30
SECTION D .................................................................................................................................31
6. Appendices ..........................................................................................................................31

I P E C / 2 0 1 2 / 0 2 |3
1. List of Acronyms and Abbreviations
GPW – Gross Premium Written
NPW – Net Premium Written
IBNR – Incurred But Not Reported
ROE – Return on Equity
NEP – Net Earned Premium
O/S – Outstanding
UPR – Unearned Premium Reserve
IPEC/Commission – Insurance and Pensions Commission
NOTE: Unless stated otherwise, all monetary figures are in United States Dollars

I P E C / 2 0 1 2 / 0 2 |4
2. Executive Summary
This report details the performance of the short term insurance industry during the quarter
ended 30 June 2012. The number of registered and operational short term direct insurers
decreased from twenty six (26) to twenty four (24) following the voluntary surrender of the
licence by Suremed Insurance Company and the directive issued to Jupiter Insurance Company
to stop writing new business. The number of operational short term reinsurers remained 9. The
direct short term insurers reported gross premium written of $109.54 million for the half year
ended 30 June 2012 compared with $84.09 million reported in the comparative period
2011.Non-life reinsurers, on the other hand reported total gross premium written of $52.37
million for the six months ended 30 June 2012, which compares favorably with $37.75 million
that was reported for the six months ended 30 June 2011.Notwithstanding the increase in the
volumes of business underwritten, both direct short term insurers and reinsurers reported
decreases in profitability emanating mainly from unrealized losses from valuation of equities as
well as depressed investment income. Total profit after tax for short term insurers decreased
from $7.86 million reported for the half year ended 30 June 2011 to $6.08 million for the half
year period under review. On the other hand, total profit after tax for short-term reinsurers
decreased from $4.63 million for the six months ended 30 June 2011 to negative $1.72 million
for the six months ended 30 June 2012.The sector reported an increase in underwriting profits,
in line with the increased business volumes. The decrease in the overall profits of the sector
driven by the loss in the value of shares, given improved underwriting profits shows that the
short term insurance industry is currently highly sensitive to market risk. As at 30 June 2012, all
operational short term direct insurers and reinsurers, except SFG Insurance Company, complied
with minimum regulatory capital requirements, stipulated in Statutory Instrument 183 of
2009.However, some insurers did not provide for reserves such as IBNR and UPR, thereby
overstating their capital positions. Direct short term insurers and reinsurers reported a
combined total asset base of $244.60 million as at 30 June 2012, which reflects an increase from
$237.74 million reported as at 31 March 2012.The combined total asset base for is skewed
towards current assets, in tandem with the short term nature of non-life insurance business.
Short term insurers reported average premium retention ratio of 46.67% while reinsurers
reported an average retention ratio of 70.11%.
I P E C / 2 0 1 2 / 0 2 |5
SECTION A
3. Short-Term Insurance Companies

I P E C / 2 0 1 2 / 0 2 |6
3.1. Update on Number of Operational Institutions
There were twenty eight (28) registered direct short term insurers as at 30 June 2012, reflecting
no change from the number of registered insurers reported as at 31 March 2012. Out of these
registered direct short term insurers, twenty four (24) insurers were operational as at 30 June
2012 compared with twenty six (26) reported as at 31 March 2012.
Jupiter Insurance Company and Suremed Insurance Company, which were operational as at 31
March 2012, were no longer operational as at 30 June 2012. Suremed Insurance Company
surrendered its licence during the quarter under review owing to viability challenges which were
emanating from the inadequate capitalization of the institution. Jupiter Insurance Company was
directed by the Commission to stop writing new business on the back of its insolvency that
resulted in failure to meet claims.
In a related matter, Agricultural Insurance Company (AICO) surrendered its licence during the
quarter, pending cancellation of the same in terms of section 22(1) a(x) of the Insurance Act
[Chapter 24:07]. Export Credit Guarantee Corporation of Zimbabwe (Private) Limited (ECGC)
remained closed to new business and efforts to resuscitate its operations are still ongoing.
3.2. Business Written
The volume of business written by direct short term insurers continued to be on the upward
trend with gross premium written amounting to $109.54 million for the half year ended 30 June
2012 reflecting a 30.27% increase from $84.09million reported in the comparative period 2011.
The increase in gross premium written was largely driven by increases in motor and engineering
insurance which recorded gains of 43.25% and 144.21% from $30.66 million and $2.86 million,
reported for the half year ended 30 June 2011, respectively.
Table 1 and Table 2 below show an extract of key indicators from the aggregated statement of
comprehensive income and a breakdown of gross premiums written by class of business
respectively.

I P E C / 2 0 1 2 / 0 2 |7
Table 1: Performance Indicators ($000)
Indicator Half Year Ended 30
June 2012 Half Year Ended 30
June 2011 Percentage
Change Gross Premium Written 109,535 84,086 30.27%
Net Premium Written 58,319 42,069 38.63%
Net Earned Premium 48,938 38,711 26.42%
Net Claims Incurred 19,378 17,389 11.44%
Net Commission Incurred 1,837 2,346 -21.69%
Management Expenses 19,746 16,107 22.59%
Underwriting Profit 6,605 2,399 175.32%
Investment Income 1,390 2,143 -35.13%
Profit Before Tax 4,902 7,340 -33.21%
Table 2: Gross Premium Written by Class of Business
Contribution by Class Half Year Ended 30 June 2012
Half Year Ended 30 June 2012
Percentage Change
Fire 22,931,823 21,847,147 4.96%
Motor 43,921,701 30,659,904 43.25%
Engineering 6,973,836 2,855,693 144.21%
Marine 3,002,011 2,578,348 16.43%
Aviation 2,042,637 852,227 139.68%
Personal Accident 10,043,166 6,775,959 48.22%
Personal Liability 1,552,313 1,071,408 44.89%
Miscellaneous Accident 7,524,187 5,361,833 40.33%
Bonds/Guarantee 4,135,528 3,855,297 7.27%
Hire Purchase 845,698 843,355 0.28%
Hail 4,198,705 4,186,824 0.28%
Health 631,424 8,632 7,214.92%
Farming 1,731,683 3,189,331 -45.70%
Total 109,534,712 84,085,958 30.27%

I P E C / 2 0 1 2 / 0 2 |8
3.3. Distribution of Gross Premium Written by Business Class
There was no significant change in the distribution of business with motor and fire insurance
remaining the major sources of business accounting for 40.1% and 20.94% of the total gross
premium written during the half year period under review. Notwithstanding the fact that fire
insurance continued to be one of the dominant classes of business, the proportion attributable
to the same business class declined from 25.94% for the half year ended 30 June 2011 to 20.94%
for the period under review. However, the decline may not be significant enough to enable the
short term direct insurers to enjoy diversification benefits.
Motor and engineering insurance recorded increase of 3.7 and 2.98 percentage points,
respectively, in their share of total gross premium written. This implies an increased dominance
of business written by motor insurance. There is need for the industry to devise strategies to
diversify their portfolio, to reduce the portion attributable to motor insurance which
traditionally has frequent claims which may translate into high loss ratios. Figure 1 below shows
the distribution of gross premium written by class of business for the half year ended 30 June
2012.
Figure 1: Distribution of Business by Gross Premium Written
20.94%
40.10%6.37%
2.74%
1.86%
9.17%
1.42%
6.87%
3.78%0.77% 3.83% 0.58%
1.58% Fire
Motor
Engineering
Marine
Aviation
Personal Accident
Personal Liability
Misc Accident
Bonds/Guarantee
Hire Purchase
Hail
Health
Farming
I P E C / 2 0 1 2 / 0 2 |9
3.4. Earnings
Notwithstanding the increase in the volume of business underwritten, short term direct insurers
reported a decrease in total profit after tax from $7.86 million for the half year ended 30 June
2011 to $6.08 million for the half year period under review. (See Table 1 above for more
information). The decrease in profit was mainly attributable to a decrease in unrealized profit
from valuation of equities which amounted to $2.92million coupled with depressed investment
income. Net commission incurred decreased by 21.69%, although the volume of business
underwritten increased. The decrease was on the back of an increase in commission received by
local insurers for the insurance business they facilitate for reinsurers.
Out of the twenty four (24) operational direct short term insurers, five reported losses during
the period under review (See Appendix A). Such losses are impacting negatively on the capital
positions of the said entities, especially in the absence of fresh capital injections.
The average combined ratio decreased from 92.5% for the half year ended 30 June 2011 to
83.7% for the period under review, reflecting an improvement in cost management. The direct
short term insurers reported an average loss ratio of 39.6% for the half year ended 30 June
2012, down from 44.6% reported in the comparative period in 2011. The loss ratio compares
favorably to an international benchmark of 60%.
Underwriting profits increased from $3.82 million for the half year ended 30 June 2011 to $6.60
million for the period under review. The increase is in line with the growth in business volumes
highlighted in 3.2 above. The underwriting margin also improved from 7.5% for the half year
ended 30 June 2011 to 16.3% for the period under review, reflecting an improvement in
underwriting profitability. An analysis of the underwriting profit vis-à-vis the sector’s profit after
tax of $6.08 million indicates that the sector is generating the bulk of its profits from its core
business of underwriting.
The sector reported a decrease in the average return on equity from 17% for the half year ended
30 June 2011 to 14.5% for the for the period under review. The decrease in the average return
on equity is attributable to subdued performance by the sector’s investments. This comes to
light given the deteriorated overall profitability vis-à-vis improved underwriting profitability. The

I P E C / 2 0 1 2 / 0 2 |10
decrease in the return on equity adversely affects the ability of the direct short term insurers to
organically grow their capital bases.
3.5. Capitalization
As at 30 June 2012, all operational short term direct insurers, except SFG Insurance Company
reported capital levels which were compliant with the regulatory minimum requirement of $300
000 stipulated in Statutory Instrument 183 of 2009 as shown in Table 3 below. The Commission
has since engaged SFG Insurance Company with a view to having the institution come up with
recapitalization initiatives to address its undercapitalization and the engagements are ongoing.
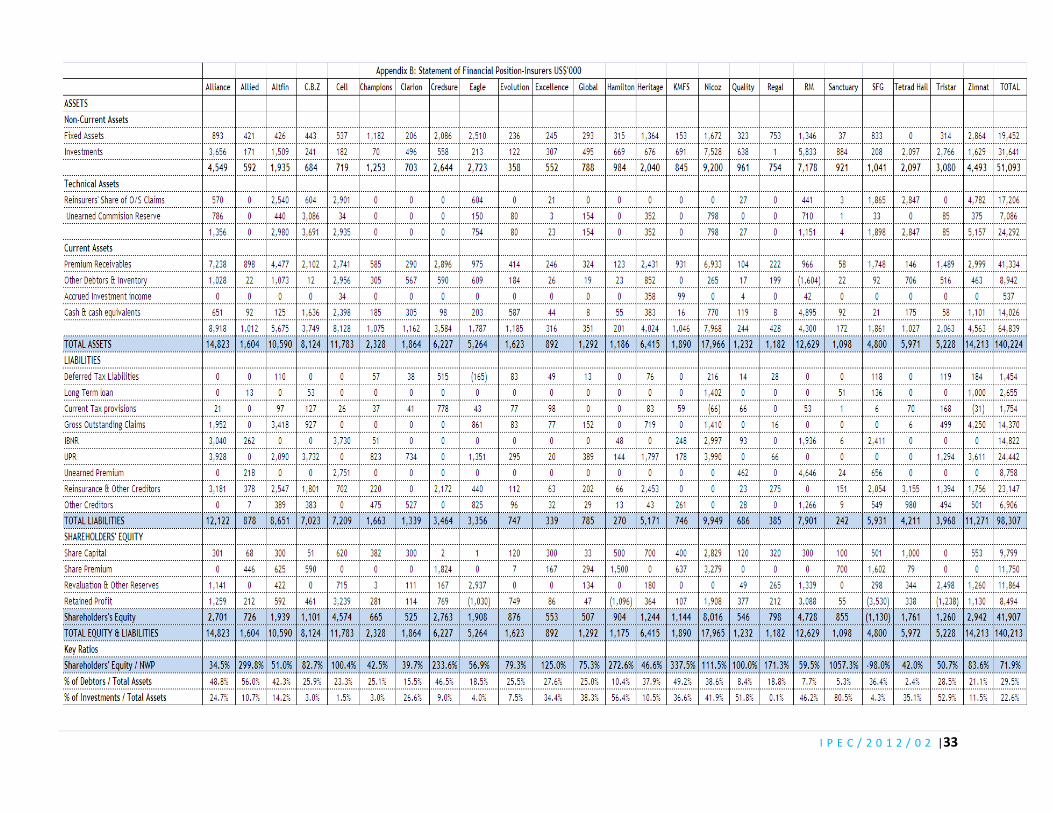
The median1 shareholders’ equity was$1.12 million as at 30 June 2012. An analysis of the figures
submitted indicate that some insurers did not submit figures relating to technical liabilities such
as Incurred But Not Reported (IBNR) claims, outstanding claims, Unearned Premium Reserve
(UPR) (see statements of financial position in Appendix B for names of the said insurers). This
implies that the said insurers understated their liabilities thereby overstating their capital and
profitability positions. Failure to provide for IBNR is in contravention of section 25(2c) of the
Insurance Act [Chapter 24:07], which stipulates that every registered insurer who carries on
insurance business other than life insurance business is required to maintain unimpaired assets
in respect of provision for net claims incurred, but not reported. Failure to quantify incurred but
not reported claims results in insurers facing challenges in determining assets to set aside in
respect of the same. All insurers are required to provide for all liabilities so that they do not
overstate their capital positions.
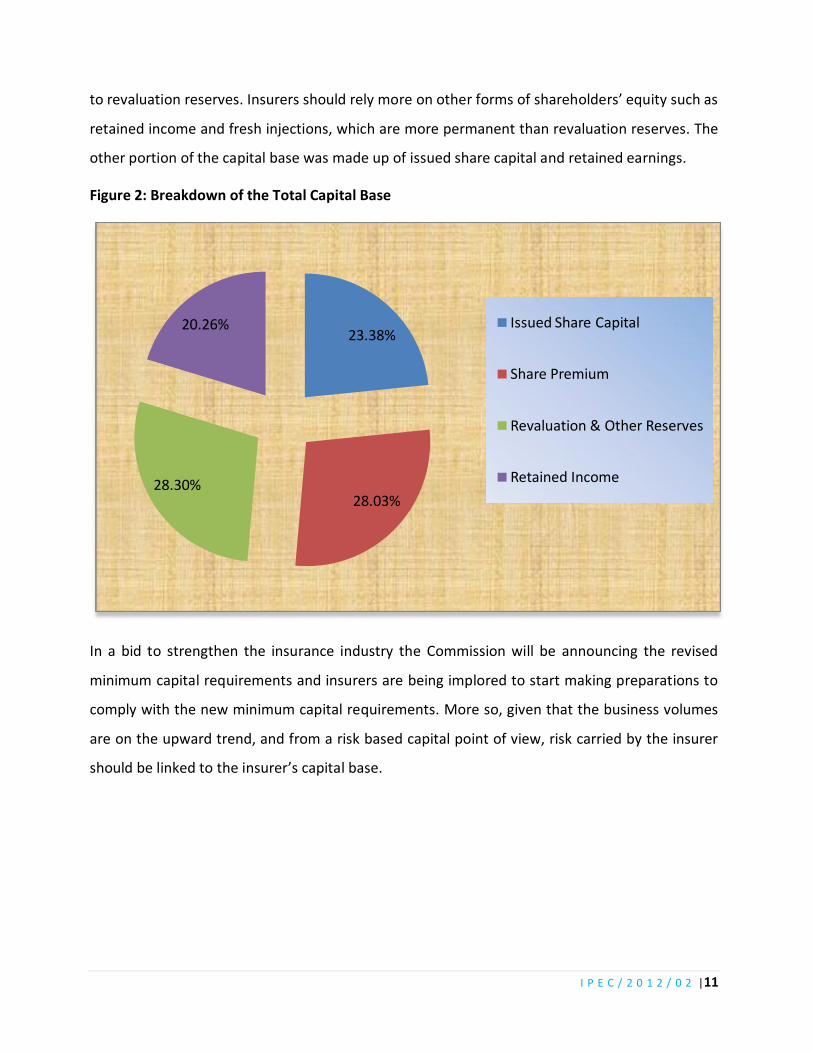
The total capital base for direct short term insurers was skewed towards revaluation and other
reserves which attributed for 28.3%of the same, followed by share premium which constituted
28.03%. Figure 2 below shows the breakdown of the capital base as at 30 June 2012. Revaluation
reserves may not be stable especially when market conditions result in huge swings in market
values, and this may bring to question the permanence of that proportion of capital attributable
1 The median is the numerical value separating the higher half of a population from the lower half. The median of a finite list of numbers can be found by arranging all the observations from lowest value to highest value and picking the middle one. If there is an even number of observations, then there is no single middle value; the median is then usually defined to be the average of the two middle values.
I P E C / 2 0 1 2 / 0 2 |11
to revaluation reserves. Insurers should rely more on other forms of shareholders’ equity such as
retained income and fresh injections, which are more permanent than revaluation reserves. The
other portion of the capital base was made up of issued share capital and retained earnings.
Figure 2: Breakdown of the Total Capital Base
In a bid to strengthen the insurance industry the Commission will be announcing the revised
minimum capital requirements and insurers are being implored to start making preparations to
comply with the new minimum capital requirements. More so, given that the business volumes
are on the upward trend, and from a risk based capital point of view, risk carried by the insurer
should be linked to the insurer’s capital base.
23.38%
28.03%28.30%
20.26% Issued Share Capital
Share Premium
Revaluation & Other Reserves
Retained Income

I P E C / 2 0 1 2 / 0 2 |12
Table 3: Levels of Capitalization
Name of Insurance Company Capital Position as at 30 June 2012
Alliance Insurance Company (Pvt) Ltd $2,700,520
Allied Insurance Company (Pvt) Ltd $725,825
Altfin Insurance Company Ltd $1,939,000
C.B.ZInsurance Company $1,101,235
Cell Insurance (Zimbabwe) Limited $4,573,653
Champions Insurance Company (Pvt) Ltd $664,942
Clarion Insurance Company $525,340
Credit Insurance Zimbabwe Ltd $2,763,108
Eagle Insurance Company Ltd $1,908,061
Evolution Insurance Company $876,114
Excellence Insurance Company $552,692
Global Insurance Company (Pvt) Ltd $507,120
Hamilton Insurance Company $915,479
Heritage Insurance Company of Zimbabwe (Pvt) Ltd $1,244,257
KMFS Insurance Company $1,143,986
Nicoz Diamond Insurance Company Ltd $8,016,000
Quality Insurance Company (Pvt) Ltd $546,000
Regal Insurance Company Limited $797,542
RM Insurance Company Limited $4,727,631
Sanctuary Insurance Company $855,435
SFG Insurance Company (Pvt) Ltd ($1,130,244)
Tetrad Hail Insurance Company (Pvt) Limited $1,761,400
Tristar Insurance Company Limited $1,260,146
Zimnat Lion Insurance Company Ltd $2,942,275
As at 30 June 2012 all operational direct short term insurers, except for SFG Insurance Company
reported solvency ratios which were above the minimum regulatory requirement of 25%. The

I P E C / 2 0 1 2 / 0 2 |13
short term insurance sector reported an average solvency ratio of 83.57% as at 30 June 2012,
compared with 123.21%reported as at 31 March 2012.Figure 2 below shows the solvency ratios
for all the direct short term insurers as at 30 June 2012. Sanctuary Insurance Company reported
a solvency ratio of 1,057.29% which implies that the same insurer may be underutilizing its
capital.
Figure 3: Solvency Ratios
34.48%
299.77%
51.03%
82.70%
100.40%
42.53%
39.68%
233.59%56.91%
79.29%
124.98%
75.33%
275.92%
46.60%
337.45%
111.50%
100%
171.33%
59.54%
1,057.29%
-97.96%
42.02%
50.68%
83.57%
Alliance
Allied
Altfin
C.B.Z
Cell
Champions
Clarion
Credsure
Eagle
Evolution
Excellence
Global
Hamilton
Heritage
KMFS
Nicoz
Quality
Regal
RM
Sanctuary
SFG
Tetrad Hail
Tristar
Zimnat Lion
25%

I P E C / 2 0 1 2 / 0 2 |14
3.6. Asset Quality
Total assets for operational short term insurers amounted to $140.22 million as at 30 June 2012,
reflecting a 3.2% increase from $135.87 million reported as at 31 March 2012. The increase in
the total assets was mainly attributable to growth in technical assets, in particular reinsurers’
share of outstanding claims which increased from $7.84 million as at 31 March 2011 to$417.21
million as at 30 June 2012.
The asset base continued to be skewed towards current assets which amounted to $64.84
million, contributing 46.24% of total asset base. The skewness of the direct short insurers’ asset
base towards current assets is in tandem with the short term insurance business. The
Commission has, however, noted with concern that 63.75% of the sector’s current assets is
attributable to premium receivables whose liquidity may not be in line with the short term
nature of the non-life insurers’ business. The marginal decrease in cash and cash equivalents
from $14.21 million as at 31 March 2012 to $14.03 million as at 30 June 2012 increases the
Commission’s concerns. Figure 3 below shows the composition of the total assets for direct
short-term insurers as at 30 June 2012 and 31 March 2012.
Figure 4: Assets Composition of Short-Term Insurers ($ 000)
24,292 15,452
64,83866,798
51,093 53,620
0
20,000
40,000
60,000
80,000
100,000
120,000
140,000
As at 30 June 2012 As at 31 March 2012
Technical Assets Current Assets Non Current Assets
135,870140,223

I P E C / 2 0 1 2 / 0 2 |15
3.7. Market Share for Short-Term Insurers
The direct short term insurers’ sector remained unconcentrated during the period under review
as indicated by the Herfindahl Indices2 of 0.08 in terms of both gross premium written and net
premium written. The situation whereby the market is unconcentrated is healthy for
competition in the sector since there are no clear-cut insurers who control the market. This may
translate into improved service to policyholders.
Notwithstanding the structure of the market highlighted above, Cell Insurance Company,
Alliance Insurance Company, and Nicoz Diamond Insurance Company remained the top three
insurers in terms of gross premium written with market shares of 13.36%, 12.23% and 11.64%
respectively. In terms of net premium written the market leaders were RM Insurance Company,
Alliance Insurance Company, and Nicoz Diamond Insurance Company with market shares of
13.61%, 13.43% and 12.33% respectively.
The market shares highlighted above imply that Cell Insurance Company is retaining a smaller
percentage of its gross premium written compared to the other market leaders. On the other
hand RM Insurance Company is retaining a larger proportion of its gross premium written
compared to the other market leaders. Given that RM Insurance Company is ranked fourth in
terms of total assets it is sweating its capital more than the other market leaders.
Nicoz Diamond Insurance Company, Alliance Insurance Company and Zimnat Lion Insurance
Company recorded the highest market shares of 12.81%, 10.57% and 10.14% respectively in
terms of total assets. Figure 4 and 5 below show the market shares in terms of GPW and NPW
for the period under review and total assets as at 30 June 2012 respectively.
2 The Herfindahl Index is the sum of squared market shares of firms in an industry. An index below 0.1 indicates an unconcentrated industry, an index of 0.1 to 0.18 indicates moderate concentration and an index above 0.18 indicates high concentration.

I P E C / 2 0 1 2 / 0 2 |16
Figure 5: Market share using GPW and NPW
Figure 6: Market Share In Terms of Asset Base
0%
5%
10%
15%
20%
25%13
.36%
12.2
3%
11.6
4%
10.8
8%
7.88
%
5.59
%
5.08
%
5.05
%
4.65
%
4.27
%
19.3
7%
7.81
%
13.4
3%
12.3
3%
13.6
1%
6.04
%
6.52
%
5.75
%
4.58
%
4.26
%
2.28
%
23.3
9%
GPW NPW
12.81%
10.57%10.14%
9.01% 8.40%7.55%
5.79%4.58% 4.44% 4.26%
22.45%
0%
5%
10%
15%
20%
25%
Nicoz Alliance Zimnat RM Cell Altfin C.B.Z Heritage Credsure Tetrad Hail
others

I P E C / 2 0 1 2 / 0 2 |17
3.8. Reinsurance
The short term insurers’ average premium retention ratio decreased by 3.27 percentage points
from 50.03% reported for half year ended 30 June 2011 to 46.76% for the period under review.
The decrease in the average retention ratio reflects a decrease in the risk appetite and hence a
lower exposure to inherent underwriting risk. Tetrad Hail Insurance Company, Clarion Insurance
Company and Quality Insurance Company retained the highest proportion of the business they
wrote with retention ratios of 97.22%, 93.92%, and 81.37% respectively as shown in Figure 7
below. Relative to other insurers these insurers maybe be overstretching their statements of
financial position. This is evidenced in the case of Tetrad Hail Insurance Company and Clarion
Insurance Company which reported comparatively low solvency ratios of 42% and 40%
respectively as shown in Figure 3 in section 3.5 above.
Figure 7: Reinsurance/Retention for Short Term Companies
Hail insurance, higher purchase and motor insurance recorded the highest retention ratios of
99.86%, 82.68% and 75.23% as shown in Figure 8 below. However, hail and hire purchase
insurance contributed a relatively negligible proportion of business written, totaling 4.61% as
shown in section 3.3 of this report. Although the proportion attributable to the above
41.5
2%
74.1
2%
37.9
6%
71.5
5%
68.8
6%
29.5
7%
6.08
%
57.5
9%
39.7
5% 45.3
1%
25.0
0%
73.1
0%
35.5
4%
51.7
3%
27.8
9%
43.6
2%
18.6
3%
18.6
8%
33.3
5%
48.1
8%
43.8
0%
2.78
%
51.2
0% 59.2
2%
58.4
8%
25.8
8%
62.0
4%
28.4
5%
31.1
4%
70.4
3%
93.9
2%
42.4
1%
60.2
5%
54.6
9%
75.0
0%
26.9
0%
64.4
6%
48.2
7%
72.1
1% 56.3
8%
81.3
7%
81.3
2%
66.6
5%
51.8
2%
56.2
0%
97.2
2%
48.8
0%
40.7
8%
0%
10%
20%
30%
40%
50%
60%
70%
80%
90%
100%
Reinsurance Ratio Retention Ratio

I P E C / 2 0 1 2 / 0 2 |18
mentioned business classes is low, the Commission has noted instances where some insurers’
viability has been significantly threatened by losses from hail, hence the need to put in place
adequate reinsurance arrangements in all business classes.
In view of the fact that motor insurance is one of the major sources of business as shown in
section 3.3 above, high retention ratio in the same business class may increase exposure to
inherent underwriting risk. This is also in light of the high frequency of claims in the motor
insurance class of business. In view of the high retention levels and high frequency of claims in
the motor insurance business alluded to above, the Commission continues to implore insurers to
desist from undercutting and charge economic rates to build sufficient pools of premium which
will enable insurers to meet claims as they fall due.
In a related matter, the Commission has noted with concern poor underwriting standards in the
credit guarantees insurance, wherein insurers are not registering any bonds in respect of the
assets from their policyholders. This is further worsened by low or, in some cases, no
reinsurance at all on the guarantees. Claims emanating from these credit guarantees have
threatened the survival of some insurers. Against this background, we encourage insurers to
adopt sound underwriting standards especially in credit guarantees.
The Commission has also witnessed an increase in the number of complaints with respect to
tobacco insurance. This could be a red flag signaling the prevalence of poor underwriting
standards or inadequate consumer education in tobacco insurance. In light of the above, IPEC
urges all players involved in tobacco insurance to have a review their conduct of business in that
business class so as to achieve customer satisfaction, and hence confidence in the insurance
industry at large.
Health and aviation insurance recorded the lowest retention ratios of 0.23% and 0.53%
respectively. The low risk retention ratio reported in aviation insurance maybe explained by the
local insurers’ limited capacity to meet claims emanating from the business class given the high
values of sum insured involved. Low levels of retention in health insurance maybe explained by
limited expertise in that class of business since much of the business in that class is underwritten
by medical aid societies. The low retention levels in health insurance can also be explained by
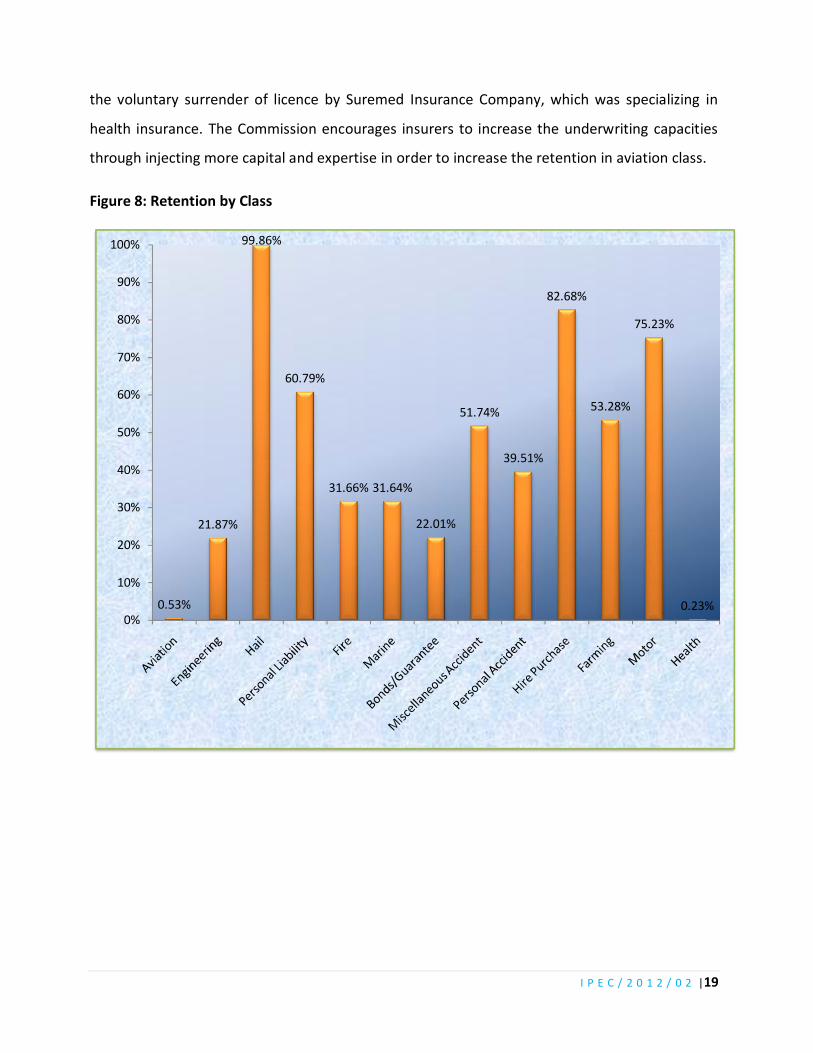
I P E C / 2 0 1 2 / 0 2 |19
the voluntary surrender of licence by Suremed Insurance Company, which was specializing in
health insurance. The Commission encourages insurers to increase the underwriting capacities
through injecting more capital and expertise in order to increase the retention in aviation class.
Figure 8: Retention by Class
0.53%
21.87%
99.86%
60.79%
31.66% 31.64%
22.01%
51.74%
39.51%
82.68%
53.28%
75.23%
0.23%0%
10%
20%
30%
40%
50%
60%
70%
80%
90%
100%

SECTION B
4. Reinsurance Companies

I P E C / 2 0 1 2 / 0 2 |21
4.1. Update on Number of Operational Institutions
The number of registered short term reinsurers as at 30 June 2012 was ten (10), the same number
reported as at 31 March 2012. Out of these registered reinsurers nine (9) were operational. Horizon
Reinsurance Company is yet to commence operations.
4.2. Business Written
Gross premium written amounted to $52.37 million for the six months ended 30 June 2012,
reflecting a 38.75% increase from $37.75 million that was reported for the six months ended 30
June 2011 (See table 4 below). The growth in the total gross premium was largely driven by
increases in business generated from fire and farming insurance. Gross premium written from fire
and farming insurance increased by $3.96 million and 3.79 million from $16.84 million and $6.38
million respectively recorded for the six months ended 30 June 2011.
Table 4: Key Performance Indicators ($ 000)
Indicator Half Year Ended 30 June 2012
Half Year Ended 30 June 2011
Percentage Change
Gross Premium Written 52,374 37,746 38.75%
Net Premium Written 38,864 24,993 55.50%
Net Earned Premium 32,342 20,369 58.78%
Net Claims Incurred 14,082 5,998 134.78%
Net Commission Incurred 10,458 5,774 81.12%
Management Expenses 10,911 6,177 76.64%
Underwriting Profit (2,208) 3,053 -172.33%
Investment Income 897 743 20.78%
Profit Before Tax (1,632) 5,296 -130.82%
Profit After Tax (1,716) 4,626 -137.09%
Hail and farming insurance recorded the highest GPW growth rates of 2,082.42% and 145.96%
respectively from the GPW figures recorded for the half year ended 30 June 2011 as shown in table
5 below. Since the Zimbabwean economy is mainly based on the agricultural sector, the increased
use of the insurance services by the same sector is commendable since it complements the
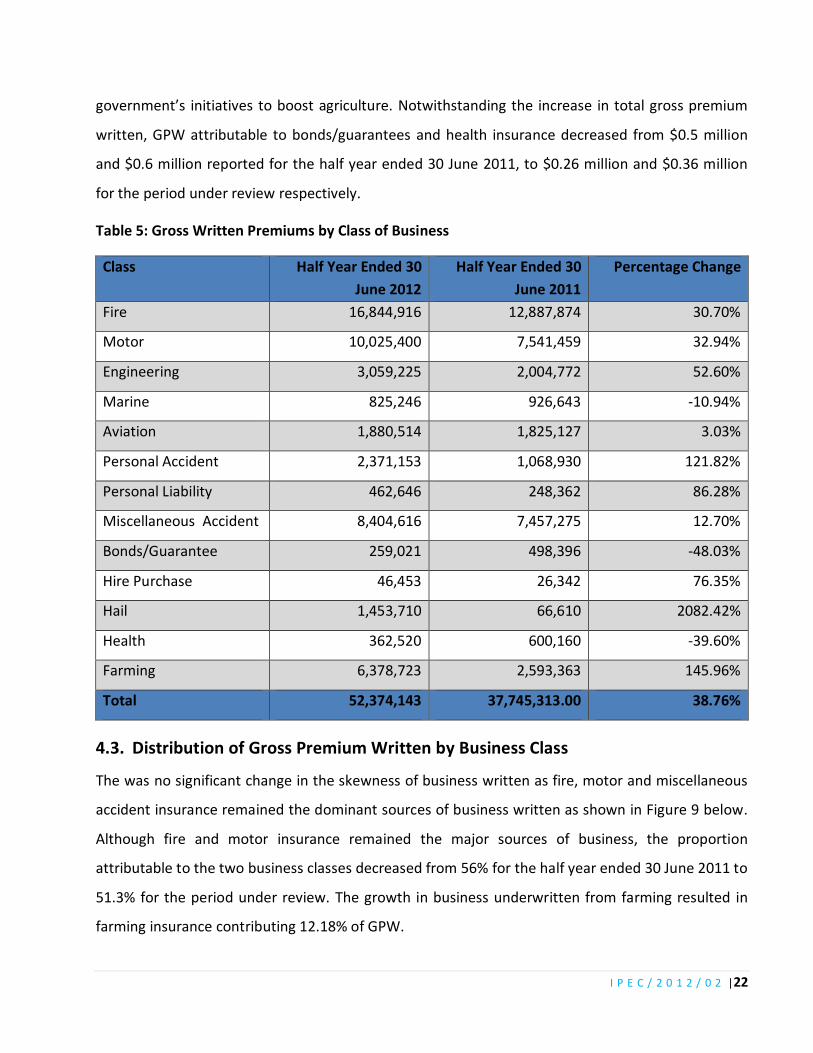
I P E C / 2 0 1 2 / 0 2 |22
government’s initiatives to boost agriculture. Notwithstanding the increase in total gross premium
written, GPW attributable to bonds/guarantees and health insurance decreased from $0.5 million
and $0.6 million reported for the half year ended 30 June 2011, to $0.26 million and $0.36 million
for the period under review respectively.
Table 5: Gross Written Premiums by Class of Business
Class Half Year Ended 30 June 2012
Half Year Ended 30 June 2011
Percentage Change
Fire 16,844,916 12,887,874 30.70%
Motor 10,025,400 7,541,459 32.94%
Engineering 3,059,225 2,004,772 52.60%
Marine 825,246 926,643 -10.94%
Aviation 1,880,514 1,825,127 3.03%
Personal Accident 2,371,153 1,068,930 121.82%
Personal Liability 462,646 248,362 86.28%
Miscellaneous Accident 8,404,616 7,457,275 12.70%
Bonds/Guarantee 259,021 498,396 -48.03%
Hire Purchase 46,453 26,342 76.35%
Hail 1,453,710 66,610 2082.42%
Health 362,520 600,160 -39.60%
Farming 6,378,723 2,593,363 145.96%
Total 52,374,143 37,745,313.00 38.76%
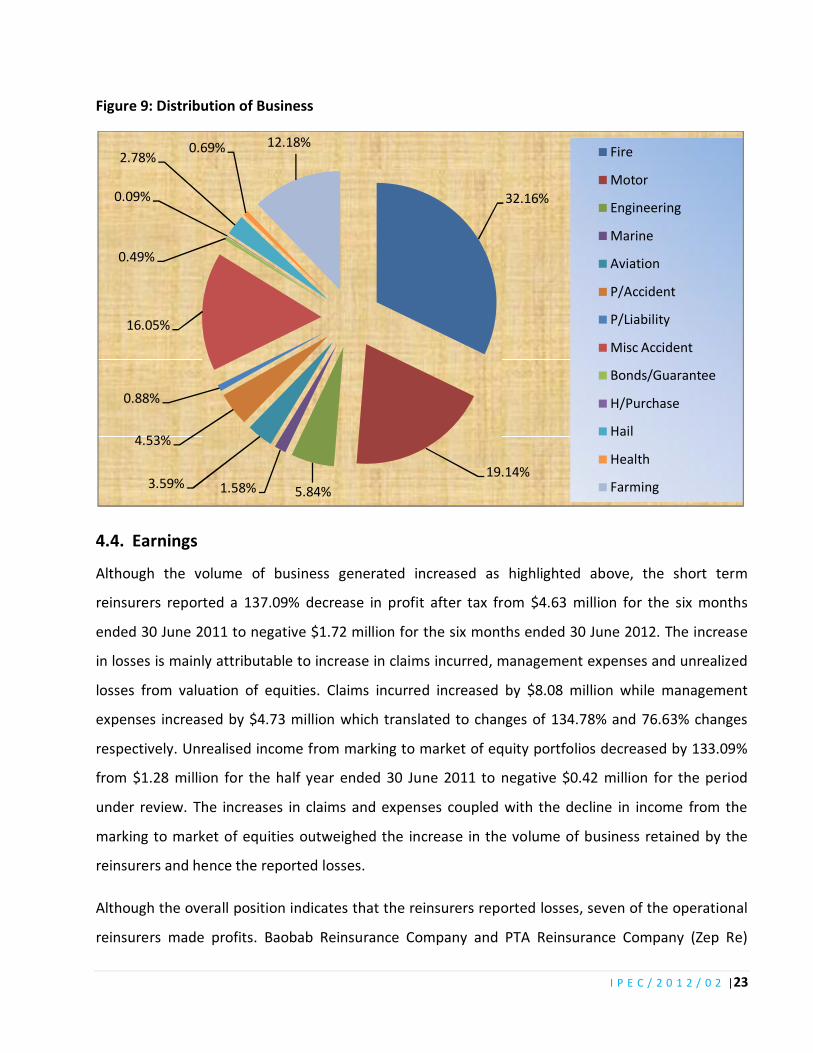
4.3. Distribution of Gross Premium Written by Business Class
The was no significant change in the skewness of business written as fire, motor and miscellaneous
accident insurance remained the dominant sources of business written as shown in Figure 9 below.
Although fire and motor insurance remained the major sources of business, the proportion
attributable to the two business classes decreased from 56% for the half year ended 30 June 2011 to
51.3% for the period under review. The growth in business underwritten from farming resulted in
farming insurance contributing 12.18% of GPW.
I P E C / 2 0 1 2 / 0 2 |23
Figure 9: Distribution of Business
4.4. Earnings
Although the volume of business generated increased as highlighted above, the short term
reinsurers reported a 137.09% decrease in profit after tax from $4.63 million for the six months
ended 30 June 2011 to negative $1.72 million for the six months ended 30 June 2012. The increase
in losses is mainly attributable to increase in claims incurred, management expenses and unrealized
losses from valuation of equities. Claims incurred increased by $8.08 million while management
expenses increased by $4.73 million which translated to changes of 134.78% and 76.63% changes
respectively. Unrealised income from marking to market of equity portfolios decreased by 133.09%
from $1.28 million for the half year ended 30 June 2011 to negative $0.42 million for the period
under review. The increases in claims and expenses coupled with the decline in income from the
marking to market of equities outweighed the increase in the volume of business retained by the
reinsurers and hence the reported losses.
Although the overall position indicates that the reinsurers reported losses, seven of the operational
reinsurers made profits. Baobab Reinsurance Company and PTA Reinsurance Company (Zep Re)
32.16%
19.14%5.84%1.58%3.59%
4.53%
0.88%
16.05%
0.49%
0.09%
2.78%0.69% 12.18%
Fire
Motor
Engineering
Marine
Aviation
P/Accident
P/Liability
Misc Accident
Bonds/Guarantee
H/Purchase
Hail
Health
Farming

I P E C / 2 0 1 2 / 0 2 |24
incurred losses amounting to $3.10 million and $0.73 million respectively for the half year ended 30
June 2012.
The short term reinsurers recorded an average combined ratio of 109.6% for the six months ended
30 June 2012, compared with 89.7% recorded in the comparative period in 2011, reflecting
deterioration in profitability. The loss ratio increased from 29.96% percent for the half year ended
30 June 2011 to 43.54% for the period under review which is below the international benchmark of
60%. In line with the deteriorating loss ratio, the total underwriting profits for the reinsures
decreased from $2.70 million for the half year ended 30 June 2011 to negative $2.21 million for the
half year under review. This may imply the decline in the quality of business written. The average
underwriting margin for the reinsurers decreased from 10.33% for the half year period ended 30
June 2011 to negative 9.61% for the period under review further confirming the deterioration in
profitability from core business.
4.5. Capitalization
As at 30 June 2012, all short term reinsurers, were compliant with the minimum capital requirement
of $400 000 stipulated in Statutory Instrument 183 of 2009 as shown in Figure 10 below.
The median capital level was $3.47 million reflecting that the bulk of the short term reinsurers had
capital levels significantly above the regulatory minimum, and therefore well placed to comply with
revised capital requirements which the Commission will be implementing in the near future. As is
the case with some direct short term insurers, the Commission has noted with concern that there
are some reinsurers who did not provide for technical reserves, such as unearned premium reserve
(UPR) and incurred but not reported claims (IBNR), thereby understating their liabilities (see
Appendix D for more details). This results in the same reinsurers overstating their capital positions.
All reinsurers reported solvency ratios which were compliant with the prudential minimum of 25%
as shown in figure 11 below. The average solvency ratio for the short term reinsurers was 142.43%
which is significantly above the internationally accepted threshold of 40%.

I P E C / 2 0 1 2 / 0 2 |25
Figure 10: Shareholders Equity ($ million)
Note: The local operations of ZEP Re are also supported by the institution’s overall statement of
financial position which had an asset base of $130 million as at 30 June 2012.
Figure 11: Solvency Ratios
28.84
0.60
6.21 4.21
9.61
0.51 1.88
3.47
0.75 -
5.00
10.00
15.00
20.00
25.00
30.00
296.12%
78.39%
100.20%
93.69%
251.45%
132.56%
46.32%
46.05%
40.49%
Baobab Re
Colonade Re
FBC Re
FMRE
Grand Re
New Re
Tropical Re
ZB Re
Zep Re

I P E C / 2 0 1 2 / 0 2 |26
4.6. Asset Quality
The asset base for reinsurers amounted to $104.37 million as at 30 June 2012, reflecting a 2.45%
growth from, $101.87 million reported as at 31 March 2012. The increase in assets was mainly
driven by an increase in investments from $52.54 million as at 31 March 2012 to $54.81 million as at
30 June 2012. The table below shows the breakdown total assets.
Table 6: Breakdown of Total Assets (000)
Component 30 June 2012 31 March 2012
Technical Assets 9,542 8,411
Current Assets 36,441 37,900
Non-Current Assets 58,384 55,560
Total Assets 104,368 101,871
As shown in the diagram below there was a marginal shift in the skewness of total assets towards
non-current assets with the proportion attributable to current assets decreasing from 37.20% as at
31 March 2012 to 34.92% as at 30 June 2012. The shift towards non-current assets, though not
significant, is not in tandem with the short term nature of non-life reinsurers’ business.
Figure 12: Composition of Total Assets for Reinsurers
9.14%
34.92%55.94%
As at 30-Jun-12
8.26%
37.20%54.54%
As at 31-Mar-12
Technical Assets
Current Assets
Non Current Assets

I P E C / 2 0 1 2 / 0 2 |27
4.7. Market Share for Reinsurers
The short term reinsurers’ market was considered moderately concentrated during the period
under review with Herfindahl indices of 0.16 in terms of both GPW and NPW. However, in terms of
the balance sheet sizes the industry was considered highly concentrated with a Herfindahl index of
0.25. As shown in figure 13 below, Baobab Reinsurance Company, FMRE Property and Casualty
Reinsurance Company, and ZB Reinsurance Company remained the top three short term reinsurers
with market shares of 21.15%, 19.8% and 17.6% in terms of gross premium written. The market
share in terms of gross premium written controlled by the top three reinsurers, declined from 66.8%
for the half year ended 30 June 2011, to 58.5% during the period under review. In terms of net
premium written Baobab Reinsurance Company was the market leader with a market share of
25.06% followed by ZB Reinsurance Company and FBC Reinsurance Company with market shares of
19.4% and 15.96% respectively.
Baobab Reinsurance Company, FBC Reinsurance Company and Grand Reinsurance Company were
the market leaders in terms of total assets with a combined market share of 72.46%. Figure 13 and
14 below shows the market shares of each reinsurer.
Figure 13: Market Share by GPW/NPW
21.1
5%
19.8
0%
17.6
0%
13.5
8%
10.9
0%
8.88
%
4.37
%
2.67
%
1.06
%
25.06%
11.5
6%
19.4
0%
15.9
6%
10.4
7%
9.84
%
4.74
%
1.98
%
1.00
%
0.0%
5.0%
10.0%
15.0%
20.0%
25.0%
Baobab FMRE ZB Re FBC Re Tropical Grand Re Zep Re Colonade New Re
GPW NPW

I P E C / 2 0 1 2 / 0 2 |28
Figure 14: Market Share by Asset Distribution
4.8. Retrocession
The average retention ratio for short term reinsurers was 70.11% for the period under review, up
from 64.04% reported in the comparative period in 2011, reflecting an increase in the risk appetite.
In line with their relatively stronger balance sheets as indicated in the market share of assets in
figure 14 above, Baobab Reinsurance Company and FBC Reinsurance Company reported the highest
retention levels of 87.95% and 87.20% respectively. The risk retention ratios for each reinsurer are
as shown in the Figure 14 below.
The highest levels of risk retention were reported in hire purchase and hail insurance as shown in
Figure 16 below. The volume of business, in terms of gross premium written, generated from these
two classes of business contributed a negligible proportion of 3%. As a result reinsurers are less
likely to rely on retrocessionaires’ balance sheets to meet claims emanating from these business
classes. Aviation recorded the lowest retention ratio of 6.85% due to the high values of sum insured
in the business class which may also imply large claims in the event of losses. The reinsurers’
balance sheets are not large enough to meet such claims and hence the low retention ratio.
43.31%
16.40%
12.75%
8.19% 8.10% 6.75%
1.85% 1.58% 1.06%0%
5%
10%
15%
20%
25%
30%
35%
40%
45%
Baobab FBC Re Grand Re ZB Re FMRE Tropical Zep Re Colonade New Re

I P E C / 2 0 1 2 / 0 2 |29
Figure 15: Retention/Retrocession
Figure 16: Retention by Class of Business
87.95%
55.17%
87.20%
43.34%
82.18%69.98% 71.27%
81.76%71.27%
12.05%
44.83%
12.80%
56.66%
17.82%30.02% 28.73%
18.24%28.73%
0%
10%
20%
30%
40%
50%
60%
70%
80%
90%
100%
Baobab ReColonade Re FBC Re FMRE Grand Re New Re Tropical Re ZB Re Zep Re
Retention ratio Reinsurance ratio
85.86%
100% 99.97%
69.05% 68.95%
94.71%
86.41%
95.60% 99.39%
55.17%
63.91% 65.56%
6.85%
0%
10%
20%
30%
40%
50%
60%
70%
80%
90%
100%

I P E C / 2 0 1 2 / 0 2 |30
SECTION C
5. INSURANCE BROKERS
The commission held a workshop with insurance brokers, on 31 July 2012 wherein the brokers
were taken through the return so that all brokers can have a common understanding on the
same return in a bid to enable comparability of the figures that brokers will provide. This follows
inconsistencies of the data that insurance brokers were providing on the return. Against that
background, all Insurance Brokers are required to start submitting the completed brokers’ return
with effect from the quarter ending 30 September 2012.

I P E C / 2 0 1 2 / 0 2 |31
SECTIOND
6. APPENDICES

I P E C / 2 0 1 2 / 0 2 |33


