4
2012 key IP5 statistical data
| Date post: | 13-May-2018 |
| Category: |
Documents |
| Upload: | truongdien |
| View: | 220 times |
| Download: | 2 times |

2012 key IP5 statistical data
0
200.000
400.000
600.000
800.000
1.000.000
1.200.000
1.400.000
1.600.000
1.800.000
2.000.000
2003 2004 2005 2006 2007 2008 2009 2010 2011 2012
EPO
JPO
KIPO
SIPO
USPTO
Introduction
International cooperation between the fi ve largest IP offi ces in the world (IP5) has taken place more actively since 2007, in an effort to address the growing backlogs in patent applications. The participating IP offi ces (EPO, JPO, KIPO, SIPO and the USPTO) estimated that some 250 000 patent applications are fi led in parallel with two or more of the IP5 Offi ces on an annual basis, which shows the need for continued worksharing efforts.
The IP5 Offi ces collate and publish their statistics, with the fi rst ever IP5 Statistics Report appearing at the end of 2012, covering data up to 2011. The next full IP5 Statistics Report will be the 2012 edition in late 2013. However in order to make key data at IP5 level available earlier in the year, the Offi ces have agreed to publish the following key preliminary data.
A. Patent fi lings
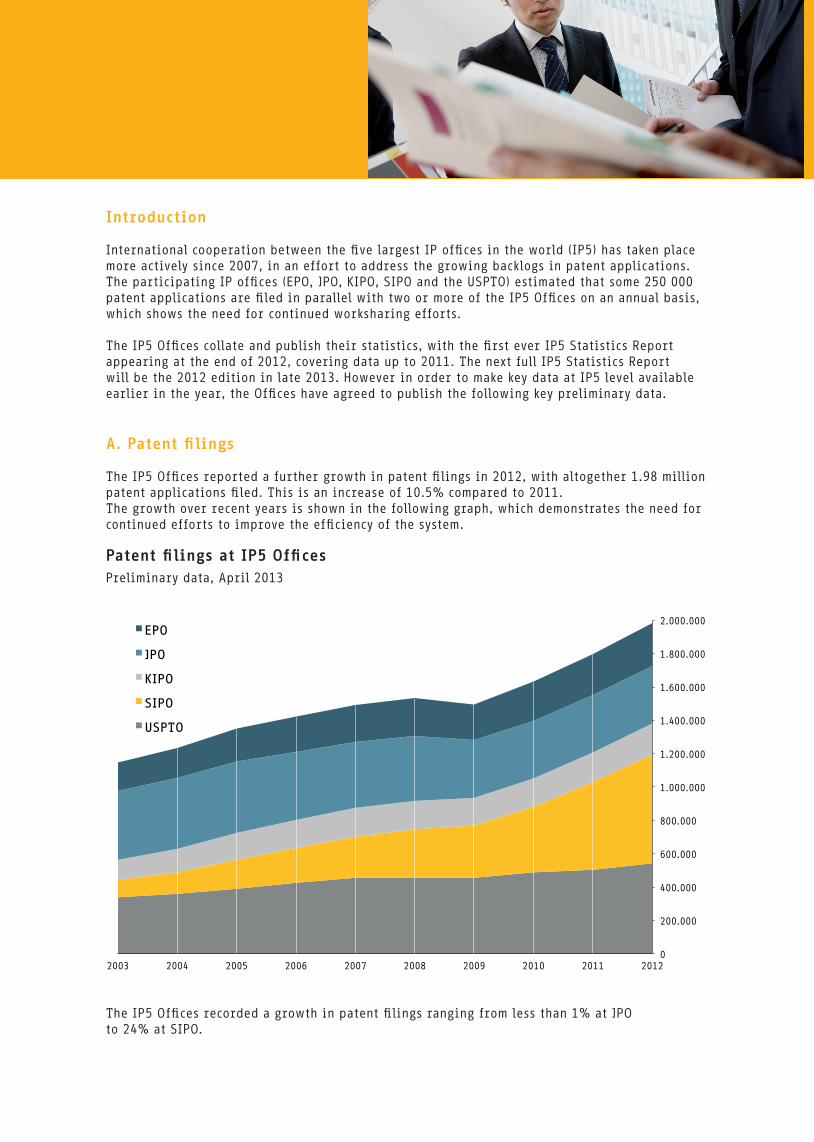
The IP5 Offi ces reported a further growth in patent fi lings in 2012, with altogether 1.98 million patent applications fi led. This is an increase of 10.5% compared to 2011.The growth over recent years is shown in the following graph, which demonstrates the need for continued efforts to improve the effi ciency of the system.
Patent fi lings at IP5 Offi ces
The IP5 Offi ces recorded a growth in patent fi lings ranging from less than 1% at JPO to 24% at SIPO.
Preliminary data, April 2013

Origin
Offi ce EPC states P.R. China Japan R. Korea United States Other Total
EPO 94.060 18.812 51.693 14.491 63.504 15.185 257.744
+ 2,3% + 11,1% + 9,1% + 9,3% + 5,6% - 0,4% + 5,2%
SIPO 31.780 535.315 42.278 8.985 29.510 4.909 652.777
+ 5,2% + 28,7% + 7,8% + 10,5% + 3,7% + 7,5% + 24,0%
JPO 20.899 2.022 287.013 5.708 22.922 4.232 342.796
- 0,6% + 44,3% - 0,2% + 14% - 2,1% + 1,1% + 0,1%
KIPO 10.052 948 15.593 148.124 11.239 2.246 188.562
- 4,9% + 30,1% + 4,5% + 7,3% - 7,4% + 2,2% + 5,4%
USPTO 83.483 12.874 88.126 29.096 273.798 55.438 542.815
+ 3,9% + 22,1% + 3,5% + 6,6% + 10,5% + 5,6% + 7,8%
EPO JPO KIPO SIPO USPTO
25%
7% 6% 5%
50% 7%
1% 1%
82%
2%
6%
2%
79%
1%
5%
20% 84%
8% 6%
16% 36%
6% 5% 5% 15%
EPC states Japan R.Korea P.R. China U.S. Others
The following table gives a preliminary breakdown of the fi lings in 2012 at each IP5 Offi ce (Offi ce) according to residence (Origin) of the applicants.
In 2012, 96% of the patent fi lings at the IP5 Offi ces were fi led by residents of the IP5 regions.
The shares of fi lings at the IP5 Offi ces that came from applicants in the areas of each Offi ce are shown in the following graph.
Patent fi lings at IP5 Offi ces in 2012 – by bloc of originPreliminary data, April 2013
Preliminary 2012 data (April 2013) and % change over 2011
0
100.000
200.000
300.000
400.000
500.000
600.000
700.000
800.000
900.000
1.000.000
2003 2004 2005 2006 2007 2008 2009 2010 2011 2012
EPO JPO KIPO SIPO USPTO
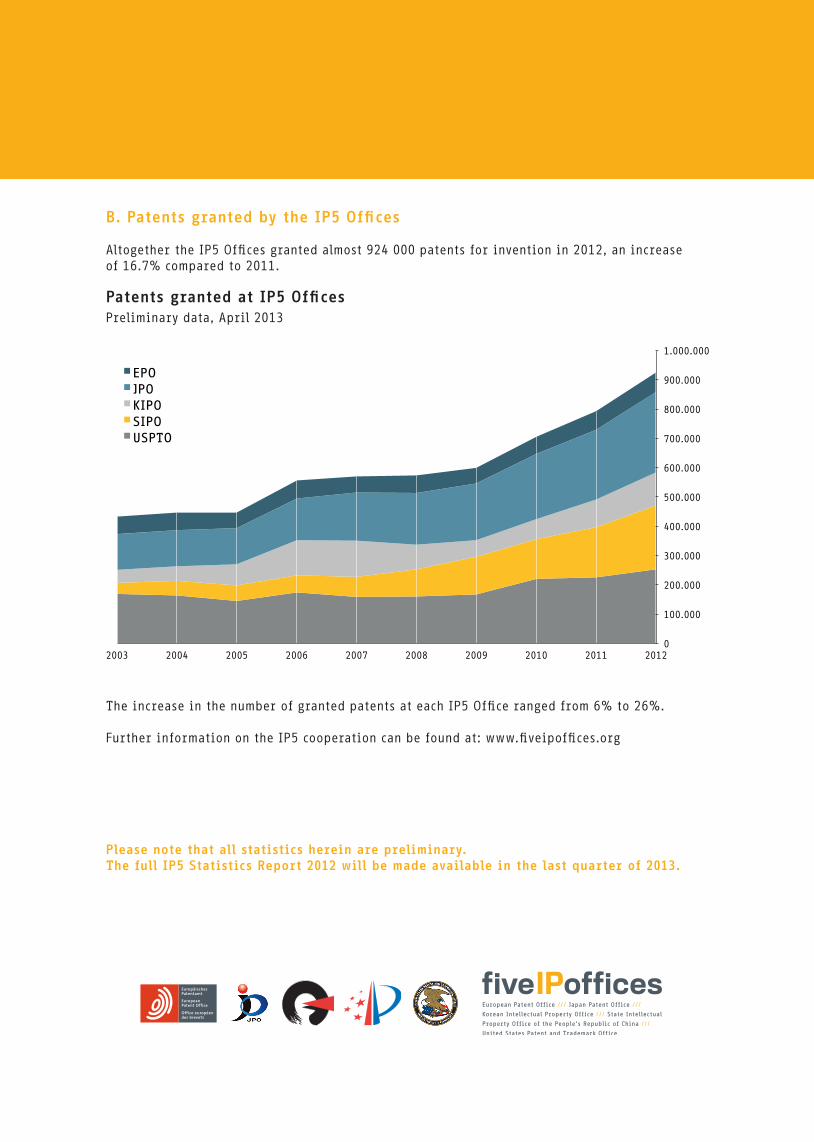
B. Patents granted by the IP5 Offi ces
Altogether the IP5 Offi ces granted almost 924 000 patents for invention in 2012, an increase of 16.7% compared to 2011.
Patents granted at IP5 Offi ces
The increase in the number of granted patents at each IP5 Offi ce ranged from 6% to 26%.
Further information on the IP5 cooperation can be found at: www.fi veipoffi ces.org
Please note that all statistics herein are preliminary. The full IP5 Statistics Report 2012 will be made available in the last quarter of 2013.
Preliminary data, April 2013


