وم الهندسيتلعلت البصرة ل مجل/ 2011 Basrah Journal for Engineering Science /2011 4 STUDY OF THE EFFECT OF FERRIC CHLORIDE CONCENTRATIONS AND pH ON ORGANIC MATTAR REMOVAL PERCENTAGE IN AL-DEWANYIA WATER TREATMENT PLANT Dr. Ali H. Ghawi Department of Civil Engineering, Al-Qadisiyia University, E-mail: [email protected]ABSTRACT Supplying drinking water in Al-Dewanyia city to meet Iraqi Drinking Water Guidelines is a challenge as source waters contain high concentrations of Natural Organic Matter (NOM) that often exceed 12 mg/L Dissolved Organic Carbon (DOC). The US EPA indicates that enhanced coagulation is the best available technology to control DOC in drinking water treatment plants. A water director of Al-Qadissiya has used enhanced coagulation at Al-Dewanyia Water Treatment Plants (WTP’s) in Iraq since 2004 to improve water quality in the distribution system. NOM reduction has led to treated water with a lower chlorine demand allowing a greater residual penetration enabling improved bacteriological compliance. Since the cost of DOC (and Disinfection by-product DBPs) determination was high, it was decided to study the traditional analysis of COD as a surrogate measure to detect the organic constituents in raw water and the extent to which optimized coagulation with ferric chloride can increase COD removal. The water samples studied belonged to Al-Dewanyia River. For samples the observed values of COD removal by coagulation at lower pH (about 1-1.5 pH values less than the regular pH (5.8 ~ 8.5)) were about 85-95 percent without making water turbidity unacceptable. In order to determine the effects of organic content on coagulation, The results indicated that a modified coagulation process without need to much increasing the amount of coagulant can be developed for these water samples. Keyword: Water Quality, WTP, DOC, COD, NOM. د. هادي غاوي علي مدرسلقادسيةمعة ا جاية الهندسة كل
Transcript
Basrah Journal for Engineering Science /2011 2011/مجلت البصرة للعلوم الهندسيت
144
STUDY OF THE EFFECT OF FERRIC CHLORIDE
CONCENTRATIONS AND pH ON ORGANIC MATTAR
REMOVAL PERCENTAGE IN AL-DEWANYIA WATER
TREATMENT PLANT
Dr. Ali H. Ghawi
Department of Civil Engineering, Al-Qadisiyia University, E-mail: [email protected]
ABSTRACT
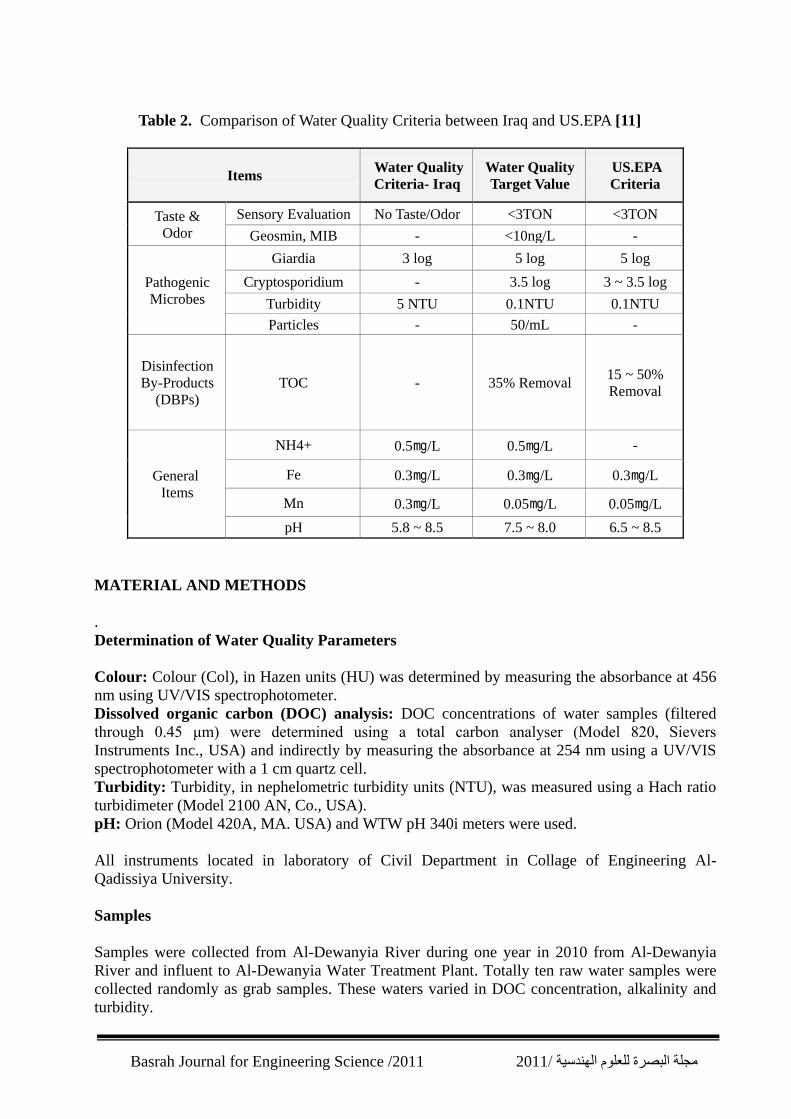
Supplying drinking water in Al-Dewanyia city to meet Iraqi Drinking Water Guidelines is a
challenge as source waters contain high concentrations of Natural Organic Matter (NOM) that
often exceed 12 mg/L Dissolved Organic Carbon (DOC). The US EPA indicates that enhanced
coagulation is the best available technology to control DOC in drinking water treatment plants. A
water director of Al-Qadissiya has used enhanced coagulation at Al-Dewanyia Water Treatment
Plants (WTP’s) in Iraq since 2004 to improve water quality in the distribution system. NOM
reduction has led to treated water with a lower chlorine demand allowing a greater residual
penetration enabling improved bacteriological compliance. Since the cost of DOC (and
Disinfection by-product DBPs) determination was high, it was decided to study the traditional
analysis of COD as a surrogate measure to detect the organic constituents in raw water and the
extent to which optimized coagulation with ferric chloride can increase COD removal. The water
samples studied belonged to Al-Dewanyia River. For samples the observed values of COD
removal by coagulation at lower pH (about 1-1.5 pH values less than the regular pH (5.8 ~ 8.5))
were about 85-95 percent without making water turbidity unacceptable. In order to determine the
effects of organic content on coagulation, The results indicated that a modified coagulation
process without need to much increasing the amount of coagulant can be developed for these
water samples.
Keyword: Water Quality, WTP, DOC, COD, NOM.
علي هادي غاوي .د
مدرس
جامعة القادسية
كلية الهندسة
Basrah Journal for Engineering Science /2011 2011/مجلت البصرة للعلوم الهندسيت
145
12
2004
859511.5
5.88.5
INTRODUCTION
Al- Dewanyia Water Treatment Plant in Iraq (DWTP) was built in 1983. The untreated
water is pumped from the Al-Dewanyia River to the DWTP by five large pumps and is then
dispatched into flash mixer. The water then flows through a four calriflaculaters (flocculation,
and sedimentation tank) and filtered through a sand bed (20 units) as shown in Fig. 1. After
chlorination, the water is stored in two underground reservoirs (clear well). Five booster pumps,
connected to the last reservoir, ensure the water supply in the Al- Dewanyia city network.
Providing cleaner water to the consumers also reduced maintenance demands as less
routine flushing is required of the mains reticulation system. The higher turbidity levels
previously resulted in sludge build up in the mains which reduced the quality of the water that
reached the consumers and also affected the chlorine residual levels throughout the reticulation
system. In Al-Dewanyia in Iraq, the DWTP, meeting seasonal water demands, provides water to
the city, and some villages around, supplying around 96 000 m3/day serving about 300 000
consumers. The water to the Al-Dewanyia city comes from the Al-Dewanyia River (Fig. 2)
source and treatment in the Water treatment plant. As it is typical of the rivers of the Iraq, the
flow is very irregular, having a high flow place in the months of December to April and a Low
flow in the remain months.
The surface water from Al-Dewanyia River very often contains suspended clay, sand and
lime particles, various organic dissolved solids, heavy metal and other materials, which manifest
themselves as turbidity, dissolved solids and other chemical parameters. This water has to be
treated properly to make it suitable for drinking and domestic use. Raw surface and ground
waters used for drinking purposes can vary markedly in their chemical organic content (natural
organic matter and anthropogenic compounds, including pollutants) and micro-organisms
present in raw water are key drivers for treatment processes that provide for safe and
aesthetically acceptable drinking water. Conventional treatment at large scale water treatment
plants (WTP) involves the use of inorganic coagulants to remove turbidity and colour, and more
recently to maximize removal of organic compounds. The basis for the latter is to minimize the
concentration of organics in treated water that leads to lower levels of disinfection by-products
(post chlorination) and substrates for microbial growth in the water distribution system.
Maximizing removal of organic matter using inorganic coagulants is impacted by the character
and concentration of the organics, the turbidity and alkalinity of the raw water. Removal of
organics is also influenced by the type of coagulant used, its dose rate and the pH at which
coagulation occurs. To date, few attempts have been made to study the relationships between
Basrah Journal for Engineering Science /2011 2011/مجلت البصرة للعلوم الهندسيت
146
raw water quality parameters and the use of coagulants and pH control reagents for removal of
organics, colour and turbidity. Study of water treatment processes have been described by Bazer-
Bachi et al. [1], Ellis et al. [2], Girou et al. [3], Ratnaweera and Blom [4] and van Leeuwen
et al. [5]. These studies are mostly based on empirical relationships between raw and treated
water quality and treatment conditions required to achieve a target water quality. The emphasis
for removal of organics is recent and models developed for and relating to this include Edwards
[6], Urfer et al. [7], Baxter et al. [8], Ghaly,. [9] and Guida et al. [10].
Fig. 1. Al-Dewanyia WTP layout
Al-Dewanyia River, with high density of residence located on both sides the use its water for
drinking. Fig. 3 and Table 1 show seasonal characteristics of water quality in Al-Dewanyia
River in 2010. Target compounds in Al-Dewanyia River are algae, taste & odor matter, Natural