ARTICLE Received 21 May 2012 | Accepted 5 Nov 2012 | Published 4 Dec 2012 Geometrically locked vortex lattices in semiconductor quantum fluids G. Tosi 1,2 , G. Christmann 1 , N.G. Berloff 3 , P. Tsotsis 4,5 , T. Gao 4,5 , Z. Hatzopoulos 5,6 , P.G. Savvidis 4,5 & J.J. Baumberg 1 Macroscopic quantum states can be easily created and manipulated within semiconductor microcavity chips using exciton-photon quasiparticles called polaritons. Besides being a new platform for technology, polaritons have proven to be ideal systems to study out-of-equili- brium condensates. Here we harness the photonic component of such a semiconductor quantum fluid to measure its coherent wavefunction on macroscopic scales. Polaritons originating from separated and independent incoherently pumped spots are shown to phase-lock only in high-quality microcavities, producing up to 100 vortices and antivortices that extend over tens of microns across the sample and remain locked for many minutes. The resultant regular vortex lattices are highly sensitive to the optically imposed geometry, with modulational instabilities present only in square and not triangular lattices. Such systems describe the optical equivalents to one- and two-dimensional spin systems with (anti)- ferromagnetic interactions controlled by their symmetry, which can be reconfigured on the fly, paving the way to widespread applications in the control of quantum fluidic circuits. DOI: 10.1038/ncomms2255 1 NanoPhotonics Centre, Cavendish Laboratory, Department of Physics, JJ Thompson Avenue, University of Cambridge, Cambridge CB3 0HE, UK. 2 Departamento de Fı ´sica de Materiales, Universidad Autono ´ma, Madrid E28049, Spain. 3 Department of Applied Mathematics and Theoretical Physics, University of Cambridge, Cambridge CB3 0WA, UK. 4 Department of Materials Science & Technology, University of Crete, PO Box 2208, Heraklion 71003, Greece. 5 Foundation for Research and Technology-Hellas, Institute of Electronic Structure & Laser, PO Box 1527, Heraklion 71110, Greece. 6 Department of Physics, University of Crete, PO Box 2208, Heraklion 71003, Greece. Correspondence and requests for materials should be addressed to J.J.B. (email: [email protected]). NATURE COMMUNICATIONS | 3:1243 | DOI: 10.1038/ncomms2255 | www.nature.com/naturecommunications 1 & 2012 Macmillan Publishers Limited. All rights reserved.
Transcript
ARTICLE
Received 21 May 2012 | Accepted 5 Nov 2012 | Published 4 Dec 2012
Geometrically locked vortex latticesin semiconductor quantum fluidsG. Tosi1,2, G. Christmann1, N.G. Berloff3, P. Tsotsis4,5, T. Gao4,5, Z. Hatzopoulos5,6, P.G. Savvidis4,5
& J.J. Baumberg1
Macroscopic quantum states can be easily created and manipulated within semiconductor
microcavity chips using exciton-photon quasiparticles called polaritons. Besides being a new
platform for technology, polaritons have proven to be ideal systems to study out-of-equili-
brium condensates. Here we harness the photonic component of such a semiconductor
quantum fluid to measure its coherent wavefunction on macroscopic scales. Polaritons
originating from separated and independent incoherently pumped spots are shown to
phase-lock only in high-quality microcavities, producing up to 100 vortices and antivortices
that extend over tens of microns across the sample and remain locked for many minutes. The
resultant regular vortex lattices are highly sensitive to the optically imposed geometry, with
modulational instabilities present only in square and not triangular lattices. Such systems
describe the optical equivalents to one- and two-dimensional spin systems with (anti)-
ferromagnetic interactions controlled by their symmetry, which can be reconfigured on the
fly, paving the way to widespread applications in the control of quantum fluidic circuits.
DOI: 10.1038/ncomms2255
1 NanoPhotonics Centre, Cavendish Laboratory, Department of Physics, JJ Thompson Avenue, University of Cambridge, Cambridge CB3 0HE, UK.2 Departamento de Fısica de Materiales, Universidad Autonoma, Madrid E28049, Spain. 3 Department of Applied Mathematics and Theoretical Physics,University of Cambridge, Cambridge CB3 0WA, UK. 4 Department of Materials Science & Technology, University of Crete, PO Box 2208, Heraklion 71003,Greece. 5 Foundation for Research and Technology-Hellas, Institute of Electronic Structure & Laser, PO Box 1527, Heraklion 71110, Greece. 6 Department ofPhysics, University of Crete, PO Box 2208, Heraklion 71003, Greece. Correspondence and requests for materials should be addressed to J.J.B.(email: [email protected]).
In systems described by the laws of quantum mechanics,continuity of the wavefunction implies that circulating flowsassume quantized values called vortices. Vortex lattices were
first predicted1 and later observed2 in type-II superconductors, inresponse to an externally applied magnetic field. In neutralquantum fluids, external rotation was used to generate vortexlattices in superfluids of helium3 and later in atomic Bose–Einstein condensates (BECs)4. Recent proposals include thegeneration of honeycomb vortex-antivortex lattices throughlinear interference of three expanding BECs5. Such lattices havenever been observed experimentally, although related techniqueshave been used to nucleate vortices in BECs6 or vortex solitons innon-linear media that have been used as waveguides7 andphotonic crystals8.
Recently a new type of macroscopic coherent state wasobserved in semiconductor microcavities9, where excitons in aquantum well strongly couple with photons confined between twomirrors producing quasiparticles called polaritons10. Polaritoncondensates have a finite lifetime and need to be constantlypumped, prompting extensive studies of the rich phenomena inout-of-equilibrium condensates9. This also makes it simple toshape the condensate flow11–13 and sculpt the confinementpotential12–14 using the pump fields.
Vortices were first observed in polariton condensates in highlyinhomogeneous samples as a result of pump and decay processeswhich pin them to defects15,16. Recently it has also provedpossible to generate vortices by coherent resonant injection17,18
together with flow against defects19,20. However, no observationof the predicted21 spontaneous regular distribution of vortices ina lattice has yet been reported. Being neutral systems, polaritoncondensates cannot produce vortex lattices in response to amagnetic field, but theoretical proposals suggest generating suchlattices using harmonic traps15 or resonant laser injection22,23.
Here we show that it is possible to generate a stable lattice ofvortices, containing vortex sub-lattices of opposite windingnumbers, by appropriately engineering the condensate wavefunc-tion through shaping the pumping configuration. These aresustained inside next-generation high-quality samples, where theextremely low disorder permits polaritons to propagate laterallywithout being scattered, and allows them to respond to imposedrotational and translational symmetries which phase-lock differ-ent condensates through a new geometrical process. The vorticesobserved are stable for many minutes, independent of preciseposition on the microcavity, and the continuously replenishedlattices are directly seen in continuous-wave experiments. Adifferent regime observed at higher polariton densities reveals thenon-linear dynamics of topological defects that move insideguides defined by the geometry.
ResultsHoneycomb stable vortex lattice. First, we incoherently andcontinuously pump the microcavity sample with three 1 mmdiameter laser beams equidistant from each other. Each pumpspot generates an electron-hole plasma that rapidly cools andscatters into polaritonic modes, whose Coulomb repulsion locallyblueshifts their energies by D at each pump spot position. Theslow escape from the cavity of their photonic components allowsthe polariton wavefunctions to be measured. With equal powersin each pump, above a threshold (typically 5 mW per spot) aphase transition occurs, where the polariton energy distributionsuddenly collapses from thermal to a single mode, followed by anon-linear increase of the emission intensity (SupplementaryFig. S1).
Under suitable pumping conditions (Supplementary Fig. S2),interference patterns appear in the region where the condensates
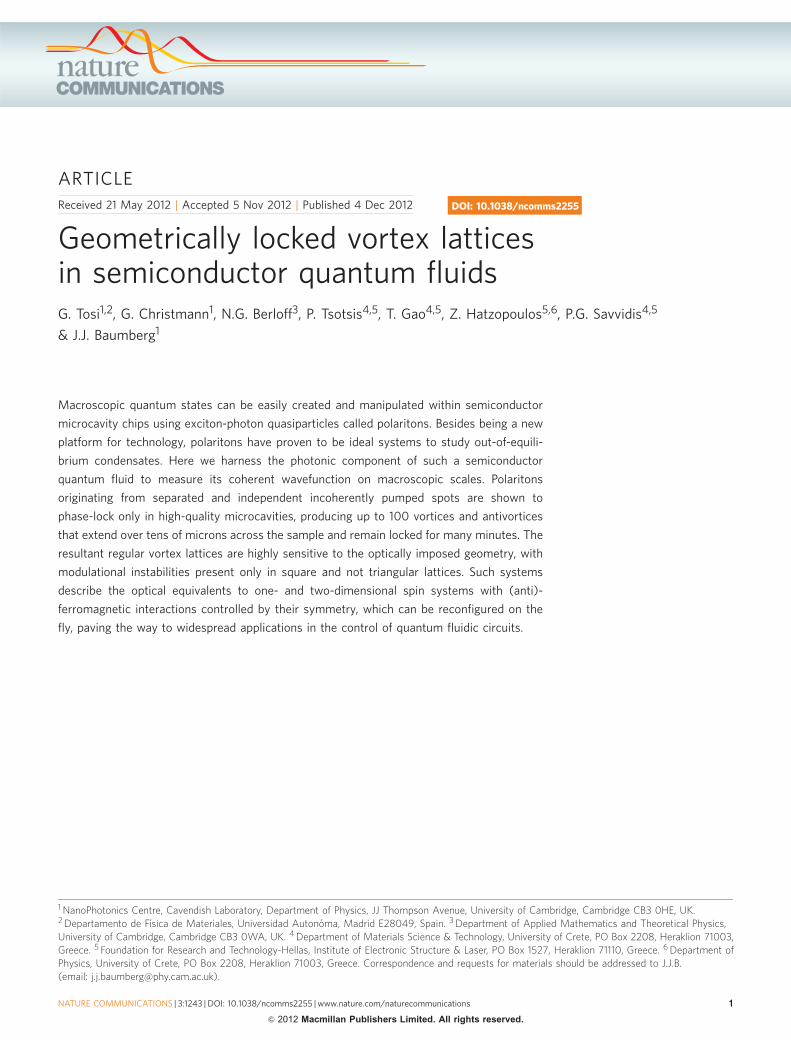
overlap between the three pump spots (Fig. 1a), with a char-acteristic honeycomb structure. Such a honeycomb density pat-tern is predicted to support a stable vortex lattice21. To confirmthis, we extract the condensate phase using Fourier transformfiltering applied to interference images (Fig. 1c) generated in aMach–Zehnder interferometer (see Methods). The resultantphase image (Fig. 1b) shows up to 50 vortices and antivorticeslocated at the vertices of the honeycomb. Each vortex issurrounded by three vortices of opposite winding number, andso the hexagonal lattice can be seen as two Abrikosov-liketriangular lattices1 of opposite sign (Fig. 1e). The lattice is highlycoherent over tens of microns (Fig. 1d) with interferencevisibilities over 50%, whereas the non-emissive vortex cores areseen as points of zero coherence with undefined phase.
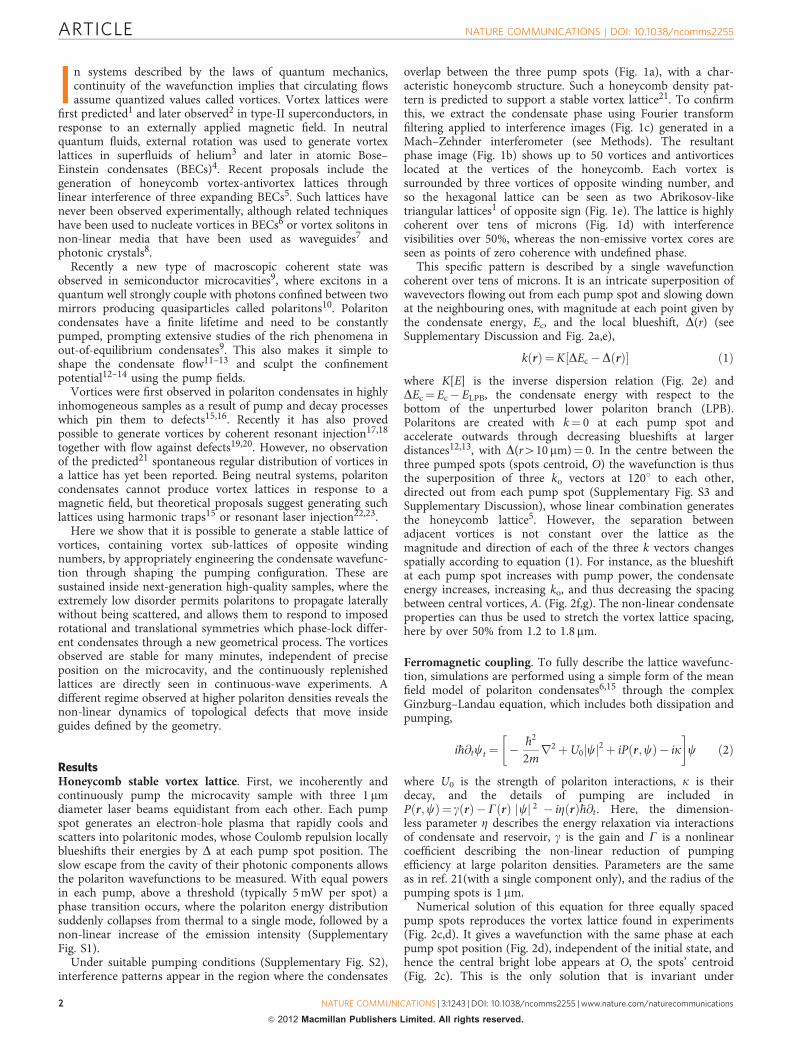
This specific pattern is described by a single wavefunctioncoherent over tens of microns. It is an intricate superposition ofwavevectors flowing out from each pump spot and slowing downat the neighbouring ones, with magnitude at each point given bythe condensate energy, Ec, and the local blueshift, D(r) (seeSupplementary Discussion and Fig. 2a,e),
kðrÞ¼K½DEc�DðrÞ� ð1Þ
where K[E] is the inverse dispersion relation (Fig. 2e) andDEc¼Ec� ELPB, the condensate energy with respect to thebottom of the unperturbed lower polariton branch (LPB).Polaritons are created with k¼ 0 at each pump spot andaccelerate outwards through decreasing blueshifts at largerdistances12,13, with D(r410 mm)¼ 0. In the centre between thethree pumped spots (spots centroid, O) the wavefunction is thusthe superposition of three ko vectors at 1201 to each other,directed out from each pump spot (Supplementary Fig. S3 andSupplementary Discussion), whose linear combination generatesthe honeycomb lattice5. However, the separation betweenadjacent vortices is not constant over the lattice as themagnitude and direction of each of the three k vectors changesspatially according to equation (1). For instance, as the blueshiftat each pump spot increases with pump power, the condensateenergy increases, increasing ko, and thus decreasing the spacingbetween central vortices, A. (Fig. 2f,g). The non-linear condensateproperties can thus be used to stretch the vortex lattice spacing,here by over 50% from 1.2 to 1.8 mm.
Ferromagnetic coupling. To fully describe the lattice wavefunc-tion, simulations are performed using a simple form of the meanfield model of polariton condensates6,15 through the complexGinzburg–Landau equation, which includes both dissipation andpumping,
i�h@tct ¼ � �h2
2mr2þU0 cj j2þ iPðr;cÞ� ik
� �c ð2Þ
where U0 is the strength of polariton interactions, k is theirdecay, and the details of pumping are included inPðr;cÞ¼ gðrÞ�GðrÞ jcj 2 � iZðrÞ�h@t . Here, the dimension-less parameter Z describes the energy relaxation via interactionsof condensate and reservoir, g is the gain and G is a nonlinearcoefficient describing the non-linear reduction of pumpingefficiency at large polariton densities. Parameters are the sameas in ref. 21(with a single component only), and the radius of thepumping spots is 1mm.
Numerical solution of this equation for three equally spacedpump spots reproduces the vortex lattice found in experiments(Fig. 2c,d). It gives a wavefunction with the same phase at eachpump spot position (Fig. 2d), independent of the initial state, andhence the central bright lobe appears at O, the spots’ centroid(Fig. 2c). This is the only solution that is invariant under
Figure 2 | Lattice control and geometric locking. (a) Schematic landscape of the blueshift-induced potential D(r) underlying the geometrically phase-
locked vortex lattice. (b) Measured polariton emission for 25 mW excitation power per spot, with green lines crossing at the spots centroid. Simulated
wavefunction (c) density and (d) phase, showing vortices and the equal phases at each pump spot position (represented by blue zeros inside circles). Scale
bars, 10mm. (e) Energy dispersion of the region inside the dashed green circle in Fig. 1a, showing the fitted LPB (purple line). Blueshift of the condensate
energy (DEc, black circles) is set by the blueshift at the excitation spots, with condensate momentum at the spots centroid (ko, purple triangles) given by
k(r)¼ K[DEc] (equation 1). (f) Normalized circulation calculated from Fig. 1e, showing the separation (A) between adjacent vortices, with lattice centroid
(L) and spots centroid (O). Scale bar, 1mm. (g) Power dependence of the lattice energy (DEc, in meV, black circles) with logarithmic fit (black line),
measured lattice maximum momentum (ko, in mm� 1, purple triangles) with prediction based on the dispersion (purple line), measured lattice separation
(A, mm, orange circles) with prediction (orange line) from A¼ 4p/ð3koffiffiffi3pÞ, and ferro offset (F¼ |L�O|/[2p/k0], in %, green circles). Dashed line at
condensation threshold.
x
x
x
x xx
xx
xxx
xx
xxx
x x
xxx
xx
xxx
x
x
x
xxx
xx
xx
x
xx
xx
x
xx
xx
π
–π
0
0.0
0.2
0.4
0.6
Figure 1 | Honeycomb vortex-antivortex lattice. (a) Intensity and (b) phase image of the polariton emission showing the honeycomb density pattern
between the three excitation spots (black circles) with vortices (red crosses) and antivortices (orange crosses) marked. Scale bars, 5 mm. (c) Interference
image of the region inside the dashed blue rectangle in a, showing vortices (red anticlockwise circles) and antivortices (orange clockwise circles) at the
vertices of the triangular sub-lattices. (d) First-order coherence function, g(1), extracted from c. (e) Expanded phase map of the dashed blue rectangle in b
again showing vortices and antivortices. Each spot is pumped with 14 mW for all the images. Scale bars, 1 mm (in c–e).
interchange of the spot positions, and so is geometrically imposedby the pumping configuration. However, it is spontaneously chosenby the condensate system because the phase carried by the pumpinglaser is completely lost during the relaxation processes. The pumpedspots acquire the same spontaneous phase (or equivalently, pseudo-spin) and our triangular configuration avoids pseudo-spin frustra-tion by insisting on ferromagnetic nearest neighbour interactions.Thus, the vortex lattice is controlled by the pseudo-spin symmetry ofthe optically induced condensates, analogous to ferromagnetism intwo-dimensional (2D) spin systems.
The precise vortex positions are extracted by calculating thecirculation, G¼
Hn:dl from the phase map, where n¼ �h
mrj is themeasured local fluid velocity. For any contour around a vortex thequantum of circulation is G¼±h/m. Using Stokes theorem, we thusgenerate a normalized circulation for each pixel of area dS (Fig.2f)given by
~G¼x:dS/ðh/mÞ, where the local vorticity, x¼=� v. The
separation (as a fraction of the periodicity 2p/ko) between thecentroids of this vortex lattice (L) and the pumped spots (O)quantifies the deviation from perfect ferromagnetic coupling (that is,the state where the phase at each pump spot is identical). For threedifferent powers, this ‘F offset’ is found to be always below 3%(Fig. 2g) for periods of time of many minutes much longer than�h=U0, showing that ferromagnetic coupling is always dominant inthe triangular geometry. The stability of the lattice persists then dueto the non-linear geometric phase locking of the free condensatephase of each pumped spot. This implies that rich spin phenomenasuch as ladder magnets24 may be directly investigated in thepolariton system.
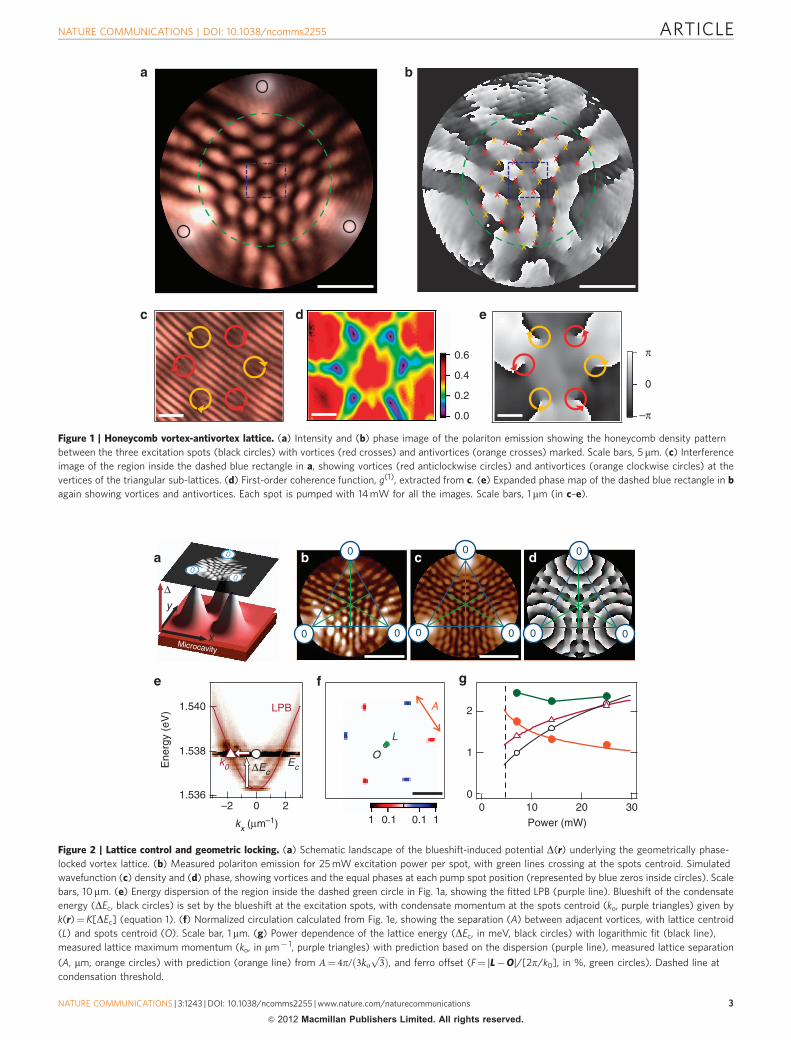
Square bistable lattices. Lattices with different geometry can besimply engineered by changing the number and position of pumpspots. Square lattices are created when pumping the sample withfour spots placed at the vertices of a square (Fig. 3). However,unlike the three-spot geometry in which the condensates lock
with the same phase, numerical solutions of equation (2) showtwo different possible relative phases between nearest neighbourcondensates depending on initial conditions: either 0 (Fig. 3a,b)or p (Fig. 3c,d). These are analogous to ferromagnetism (F) andanti-ferromagnetism (AF), respectively, in 2D spin systems(Fig. 3h), and can again be distinguished in experiments bylooking at the polariton density at the centroid between the spots:as seen in experiments, F-coupled condensates have an antinodeat the centre (Fig. 3e) whereas AF-coupled have a node (Fig. 3g).This bistable pseudo-spin configuration, which can then corre-spond to a qubit or an interferometer, can potentially bemanipulated through direct laser excitation, as well as in litho-graphically patterned samples25.
We find effects unique to polariton liquids. If non-linear effectsare not taken into account, stationary lattices form and novortices are expected to appear at the spots centroid (Fig. 3b,dand Supplementary Fig. S4a,b). In this case each intensity lobewould have a constant phase with abrupt p shifts localized in thezero density regions. However, under high excitation powers, anAF-coupled lattice is accompanied with weaker energy sidebands(Fig. 3f) that indicate non-linear temporal dynamics. This isconfirmed by extracting the spatio-temporal behaviour fromexperiments (see Supplementary Discussion), which shows thatdark soliton instabilities generate vortex-antivortex pairs.Although the precise trajectory of each topological defect isstochastic, these vortices are completely constrained to the squaregrid defined by density minima. Such instabilities are observed inboth experiments and simulations (Supplementary Figs S5–S7).Modulational instabilities that nucleate vortex pairs also resembleeffects in non-linear optical media26.
This pump geometry thus provides a way to generate periodic2D structures in polariton condensates, with no need of a built-inperiodic potential27. The interacting topological defects movearound on the dark lines in this square matrix, while quantizedvalues of vortex charge can also be restricted to specific positions
Inte
nsity
(a.
u.)
1.53951.5375
Energy (meV) ΔE (meV)
Inte
nsity
(a.u
.)
543210
00
00
00
00 0
0
0
0
F
AF
AF
0 0
0 0
π 0
0 π
F AF
00
00
π 0
0
π
π
π
π
π
F AF
Figure 3 | Square lattice and pseudo-spin symmetry. (a–d) Numerical solutions of equation (2) under different initial noise, giving F (a,b) or AF (c,d)
lattices. Scale bars, 10mm. (e,g) Observed polariton density at main energy peak, 1.5374 eV and 1.5386 eV, respectively, for 12 mW and 40 mW excitation
power per spot, respectively, with the intersection between the two green lines marking the spots centroid. Scale bars, 2 mm. (f) Lattice spectra for
two different powers, 12 mW (blue line) and 40 mW (red line), with main peaks classified according to the polariton density at the spots centroid.
(h) Schematic ferromagnetic (F) and antiferromagnetic (AF) stable pseudo-spin configurations (numbers inside circles represent the condensate phase
at each pump spot). (i) Spectra of simulated square lattice.
in this lattice (see Supplementary Fig. S4c–f). Controlling furthersuch vortices will pave the way towards manipulation of quantumfluidic circuits25.
DiscussionThe vortex lattices presented here are created with no need ofglobal stirring or external rotation, and the vortex/antivortexpairs yield no global angular momentum. They are thus markedlydistinct from lattices due to global phase symmetries described inref. 4, and present a close analogy to the formation of vortexsolitons in Kerr non-linear self-defocusing media7. The phaselocking between separately pumped condensates is a keyingredient for the lattice generation and stability, but here thelocking mechanism has no relation with previously reportedJosephson tunnelling in disorder-induced trappedcondensates28,29. Instead, each of the pumped spots isresonantly pumped by the outflow from the neighbouringcondensates inducing mode-locking to the same energy. As thephase of the polariton fluids has no relation to that of ourpumping lasers, the lattice is a purely non-linear polaritonic effectspontaneously emerging from the optically induced potential.
MethodsSample. The sample, held at 10 K in a cold finger cryostat, consists of a 5l/2Al0.3Ga0.7As distributed Bragg reflector microcavity with 32 (35) pairs ofAl0.15Ga0.85As/AlAs layers of 57.2 nm/65.4 nm in the top (bottom) mirrors. It hasfour sets of quantum well regions, each containing three 10 nm thick GaAsquantum wells separated by 10 nm thick Al0.3Ga0.7As layers, placed at the anti-nodes of the cavity electric field. The high cavity quality factor (Q416,000 mea-sured, and simulated photon lifetime of 9 ps) yields a characteristic Rabi splitting of9 meV. We choose the detuning between photonic and excitonic modes to be� 3 meV by scanning the cavity wedge.
Experiment setup. A Ti:sapphire single-mode continuous-wave laser pumps thesample at 750 nm (at the first spectral dip above the stop band) with 1 mm diameterspots through a 0.7 numerical aperture lens, which also collects light emitted by thesample. Magnified real-space and momentum-space images are recorded on a SiCCD or analysed spectrally with a 0.55-m monochromator and liquid nitrogen-cooled CCD.
Interferometry. To generate a reference wave for interferometry that is sensitiveonly to the relative condensate phases (as their absolute phase is freely diffusing),we use condensate emission from 40 mm outside the lattice, behind one of thepump spots. In this technique, introduced in refs 17,18, a small portion of thisconstant phase reference wave is magnified, and interfered with the sampleemission in a Mach–Zehnder interferometer (giving for instance Fig. 1c). As acontrol, this reference wave is confirmed to give parallel fringes with no artefactswhen interfering it with corresponding regions behind the other pumped spots.Phase and coherence images are then obtained when taking the first-order dif-fraction components from the Fourier-transformed interference images. Theargument of the back-transformed inverse Fourier transforms gives an image of thecondensate phase, whereas the intensity image gives the fringe visibility and hencethe first-order coherence. The latter is normalized to the product of the intensityfrom each interferometer arm.
References1. Abrikosov, A. A. On the magnetic properties of superconductors of the second
group. Soviet Phys. JETP 5, 1174–1182 (1957).2. Essmann, U. & Trauble, H. The direct observation of individual flux lines in
type II superconductors. Phys. Lett. A 24, 526–527 (1967).3. Yarmchuk, E. J., Gordon, M. J. V. & Packard, R. E. Observation of stationary
vortex arrays in rotating superfluid helium. Phys. Rev. Lett. 43, 214–217 (1979).4. Fetter, A. L. Rotating trapped Bose-Einstein condensates. Rev. Mod. Phys. 81,
647–691 (2009).5. Ruben, G., Morgan, M. J. & Paganin, D. M. Texture control in a pseudospin
Bose-Einstein condensate. Phys. Rev. Lett. 105, 220402 (2010).6. Scherer, D. R., Weiler, C. N., Neely, T. W. & Anderson, B. P. Vortex formation
by merging of multiple trapped Bose-Einstein condensates. Phys. Rev. Lett. 98,110402 (2007).
7. Swartzlander, Jr G. A. & Law, C. T. Optical vortex solitons observed in Kerrnonlinear media. Phys. Rev. Lett. 69, 2503–2506 (1992).
8. Fleischer, J. W., Segev, M., Efremidis, N. K. & Christodoulides, D. N.Observation of two-dimensional discrete solitons in optically inducednonlinear photonic lattices. Nature 422, 147–150 (2003).
9. Kasprzak, J. et al. Bose-Einstein condensation of exciton polaritons. Nature443, 409–414 (2006).
10. Weisbuch, C., Nishioka, M., Ishikawa, A. & Arakawa, Y. Observation of thecoupled exciton-photon mode splitting in a semiconductor quantummicrocavity. Phys. Rev. Lett. 69, 3314–3317 (1992).
11. Amo, A. et al. Collective fluid dynamics of a polariton condensate in asemiconductor microcavity. Nature 457, 291–295 (2009).
12. Wertz, E. et al. Spontaneous formation and optical manipulation of extendedpolariton condensates. Nat. Phys. 6, 860–864 (2010).
13. Christmann, G. et al. Polariton ring condensates and sunflower ripples in anexpanding quantum liquid. Phys. Rev. B 85, 235303 (2012).
14. Tosi, G. et al. Sculpting oscillators with light within a nonlinear quantum fluid.Nat. Phys. 8, 190–194 (2012).
15. Keeling, J. & Berloff, N. G. Spontaneous rotating vortex lattices in a pumpeddecaying condensate. Phys. Rev. Lett. 100, 250401 (2008).
16. Lagoudakis, K. G. et al. Quantized vortices in an exciton-polariton condensate.Nat. Phys. 4, 706–710 (2008).
17. Sanvitto, D. et al. Persistent currents and quantized vortices in a polaritonsuperfluid. Nat. Phys. 6, 527–533 (2010).
18. Tosi, G. et al. Onset and dynamics of vortex-antivortex pairs in polaritonoptical parametric oscillator superfluids. Phys. Rev. Lett. 107, 036401 (2011).
19. Sanvitto, D. et al. All-optical control of the quantum flow of a polaritoncondensate. Nat. Photon. 5, 610–614 (2011).
20. Nardin, G. et al. Hydrodynamic nucleation of quantized vortex pairs in apolariton quantum fluid. Nat. Phys. 7, 635–641 (2011).
21. Keeling, J. & Berloff, N. G. Controllable Half-Vortex Lattices in an IncoherentlyPumped Polariton Condensate. Preprint at http://arxiv.org/abs/1102.5302(2011).
22. Liew, T. C. H., Rubo, Y. G. & Kavokin, A. V. Generation and dynamics ofvortex lattices in coherent exciton-polariton fields. Phys. Rev. Lett. 101, 187401(2008).
23. Gorbach, A. V., Hartley, R. & Skryabin, D. V. Vortex lattices in coherentlypumped polariton microcavities. Phys. Rev. Lett. 104, 213903 (2010).
24. Elbio, D. Experiments on ladders reveal a complex interplay between a spin-gapped normal state and superconductivity. Rep. Prog. Phys. 62, 1525–1571(1999).
25. Liew, T. C. H., Shelykh, I. A. & Malpuech, G. Polaritonic devices. Physica E:Low-dimensional Syst. Nanostruct. 43, 1543–1568 (2011).
26. Tikhonenko, V., Christou, J., Luther-Davies, B. & Kivshar, Y. S. Observation ofvortex solitons created by the instability of dark soliton stripes. Opt. Lett. 21,1129–1131 (1996).
27. Kim, N. Y. et al. Dynamical d-wave condensation of exciton-polaritons in atwo-dimensional square-lattice potential. Nat. Phys. 7, 681–686 (2011).
28. Baas, A. et al. Synchronized and desynchronized phases of exciton-polaritoncondensates in the presence of disorder. Phys. Rev. Lett. 100, 170401 (2008).
29. Wouters, M. Synchronized and desynchronized phases of couplednonequilibrium exciton-polariton condensates. Phys. Rev. B 77, 121302 (2008).
AcknowledgementsWe thank C. Anton and L. Vina for comments, and grants EPSRC EP/G060649/1, EUCLERMONT4 235114, EU INDEX 289968, Spanish MEC (MAT2008-01555) and GreekGSRT programs ARISTEIA and Irakleitos II. G.T. acknowledges financial support froman FPI scholarship of the Spanish MICINN.
Author contributionsG.T. and G.C. performed the spectroscopy experiments, and together with N.G.B. andJ.J.B. devised the experiments, analysed the data and wrote the manuscript. P.G.S.contributed to preparation of the manuscript and together with P.T., T.G., Z.H. designedand grew the microcavity samples, providing characterization spectroscopy to sustainhigh-quality performance. N.G.B. devised, coded and carried out the modellingsimulations.
Additional informationSupplementary Information accompanies this paper at http://www.nature.com/naturecommunications
Competing financial interests: The authors declare no competing financial interests.
Reprints and permission information is available online at http://npg.nature.com/reprintsandpermissions/
How to cite this article: Tosi, G. et al. Geometrically locked vortex lattices in semi-conductor quantum fluids. Nat. Commun. 3:1243 doi: 10.1038/ncomms2255 (2012).
Geometrically-‐locked vortex lattices in semiconductor quantum fluids Supplementary Information
G. Tosi, G. Christmann, N.G. Berloff, P. Tsotsis, T. Gao, Z. Hatzopoulos, P.G. Savvidis, J.J. Baumberg 1
Supplementary Figures
Supplementary Figure S1| Condensation phase-‐transition. When incoherently pumping the sample with a single spot, a phase transition occurs above 10mW. In this Figure, as a function of the excitation power, red squares show the polariton luminescence intensity integrated over the sample, with a non-‐linear increase at 10𝑚𝑊, whereas blue circles account for the emission energy linewidth, showing a sudden collapse from thermal (with broad linewidth) to a single mode at 10𝑚𝑊. Red and blue lines are guides to the eye.
3.0
2.5
2.0
1.5
1.0
0.5
0.0
Linewidth (m
eV)In
tegr
ated
inte
nsity
(arb
. uni
ts)
1 10 100Power (mW)
Geometrically-‐locked vortex lattices in semiconductor quantum fluids Supplementary Information
G. Tosi, G. Christmann, N.G. Berloff, P. Tsotsis, T. Gao, Z. Hatzopoulos, P.G. Savvidis, J.J. Baumberg 2
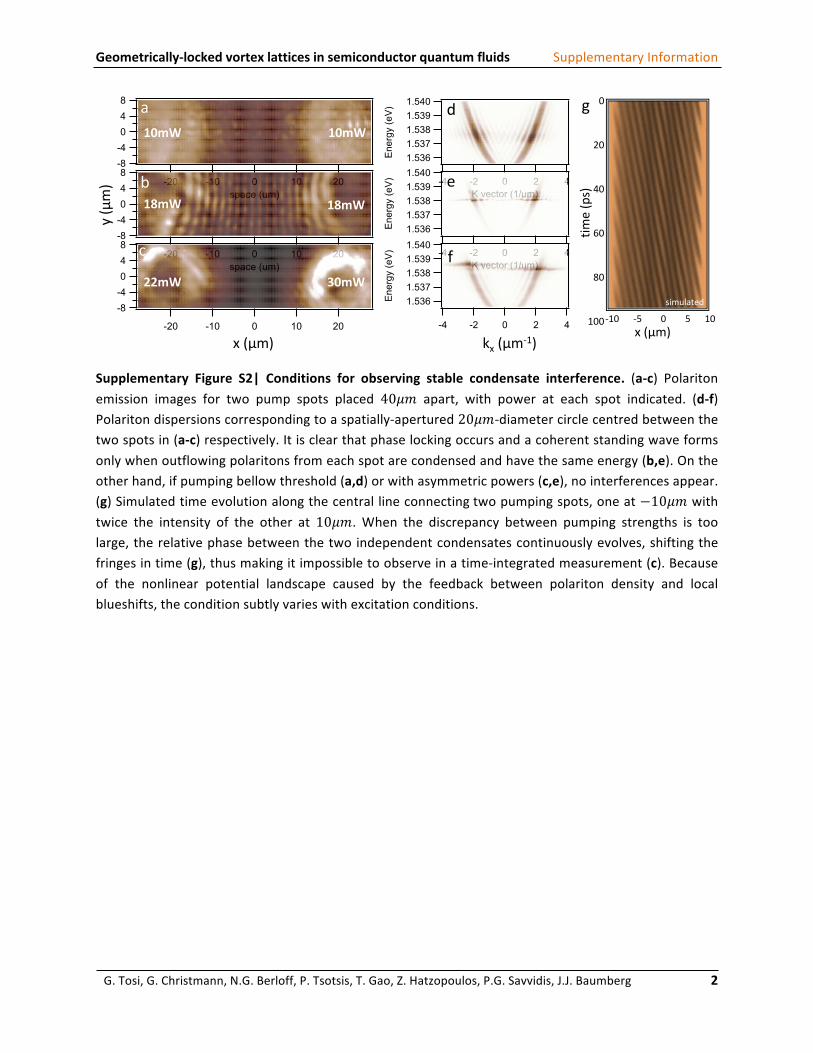
Supplementary Figure S2| Conditions for observing stable condensate interference. (a-‐c) Polariton emission images for two pump spots placed 40𝜇𝑚 apart, with power at each spot indicated. (d-‐f) Polariton dispersions corresponding to a spatially-‐apertured 20𝜇𝑚-‐diameter circle centred between the two spots in (a-‐c) respectively. It is clear that phase locking occurs and a coherent standing wave forms only when outflowing polaritons from each spot are condensed and have the same energy (b,e). On the other hand, if pumping bellow threshold (a,d) or with asymmetric powers (c,e), no interferences appear. (g) Simulated time evolution along the central line connecting two pumping spots, one at −10𝜇𝑚 with twice the intensity of the other at 10𝜇𝑚. When the discrepancy between pumping strengths is too large, the relative phase between the two independent condensates continuously evolves, shifting the fringes in time (g), thus making it impossible to observe in a time-‐integrated measurement (c). Because of the nonlinear potential landscape caused by the feedback between polariton density and local blueshifts, the condition subtly varies with excitation conditions.
-4 -2 0 2 4K vector (1/um)
1.5401.5391.5381.5371.536En
ergy
(eV)
-4 -2 0 2 4K vector (1/um)
1.5401.5391.5381.5371.536En
ergy
(eV)
-4 -2 0 2 4K vector (1/um)
1.5401.5391.5381.5371.536En
ergy
(eV)
-20 -10 0 10 20space (um)
-8-4048
spac
e (u
m)
-20 -10 0 10 20space (um)
-8-4048
spac
e (u
m)
-20 -10 0 10 20space (um)
-8-4048
spac
e (u
m)
10mW 10mW
18mW 18mW
22mW 30mW
a
b
c
d
e
f
x (μm)
y (μm)
kx (μm-‐1)
-‐10 -‐5 0 5 10x (μm)
0
20
40
60
80
100
time (ps)
g
simulated
Geometrically-‐locked vortex lattices in semiconductor quantum fluids Supplementary Information
G. Tosi, G. Christmann, N.G. Berloff, P. Tsotsis, T. Gao, Z. Hatzopoulos, P.G. Savvidis, J.J. Baumberg 3
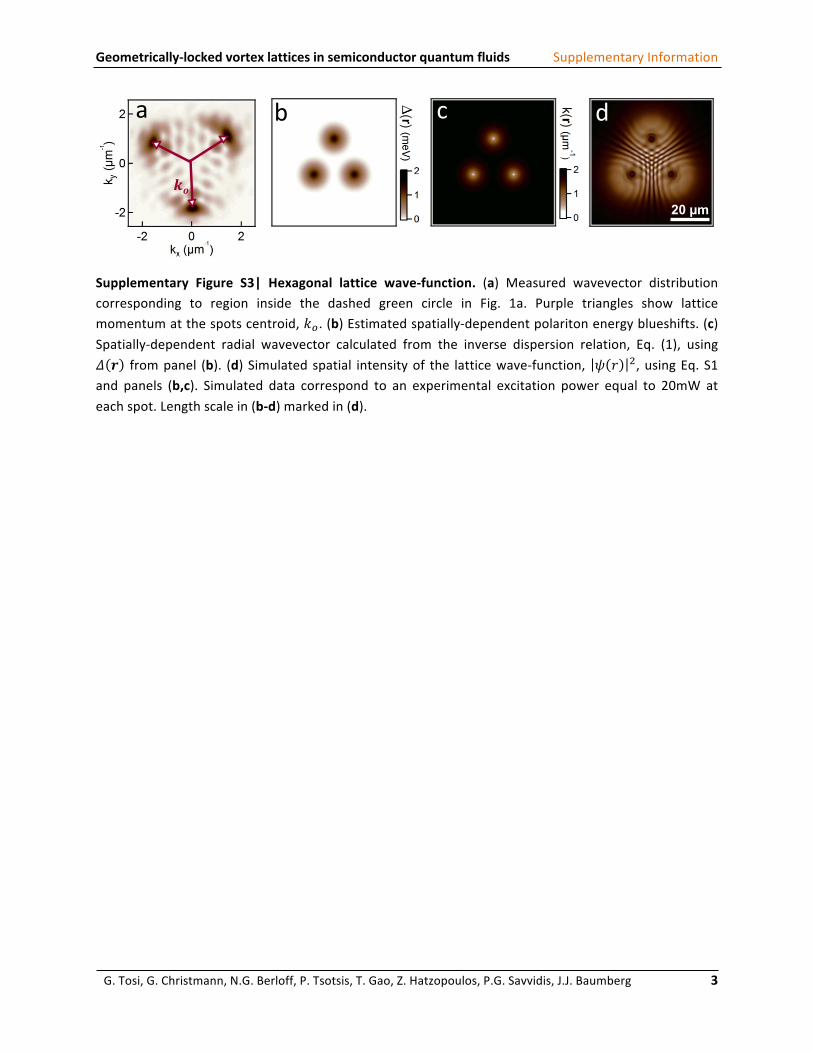
Supplementary Figure S3| Hexagonal lattice wave-‐function. (a) Measured wavevector distribution corresponding to region inside the dashed green circle in Fig. 1a. Purple triangles show lattice momentum at the spots centroid, 𝑘!. (b) Estimated spatially-‐dependent polariton energy blueshifts. (c) Spatially-‐dependent radial wavevector calculated from the inverse dispersion relation, Eq. (1), using 𝛥 𝒓 from panel (b). (d) Simulated spatial intensity of the lattice wave-‐function, 𝜓 𝑟 !, using Eq. S1 and panels (b,c). Simulated data correspond to an experimental excitation power equal to 20mW at each spot. Length scale in (b-‐d) marked in (d).
20 µm
𝒌𝒐
a b c d
Geometrically-‐locked vortex lattices in semiconductor quantum fluids Supplementary Information
G. Tosi, G. Christmann, N.G. Berloff, P. Tsotsis, T. Gao, Z. Hatzopoulos, P.G. Savvidis, J.J. Baumberg 4
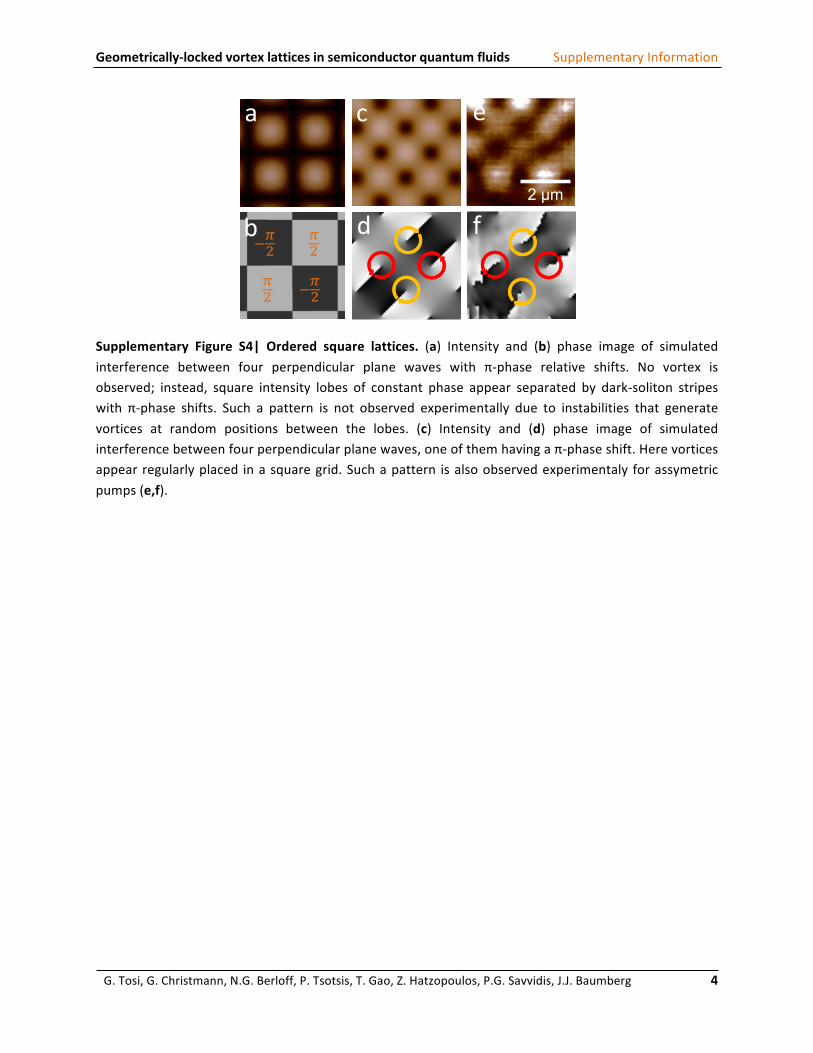
Supplementary Figure S4| Ordered square lattices. (a) Intensity and (b) phase image of simulated interference between four perpendicular plane waves with π-‐phase relative shifts. No vortex is observed; instead, square intensity lobes of constant phase appear separated by dark-‐soliton stripes with π-‐phase shifts. Such a pattern is not observed experimentally due to instabilities that generate vortices at random positions between the lobes. (c) Intensity and (d) phase image of simulated interference between four perpendicular plane waves, one of them having a π-‐phase shift. Here vortices appear regularly placed in a square grid. Such a pattern is also observed experimentaly for assymetric pumps (e,f).
!"
#!"!"
#!"
130
120
110
100
9080
9080706050403020
2 µm
130
120
110
100
9080
90807060504030
240
230
220
210
200
190
180
170
160
240230220210200190180170160
240
230
220
210
200
190
180
170
160
240230220210200190180170160
c
db
e
f
a
Geometrically-‐locked vortex lattices in semiconductor quantum fluids Supplementary Information
G. Tosi, G. Christmann, N.G. Berloff, P. Tsotsis, T. Gao, Z. Hatzopoulos, P.G. Savvidis, J.J. Baumberg 5
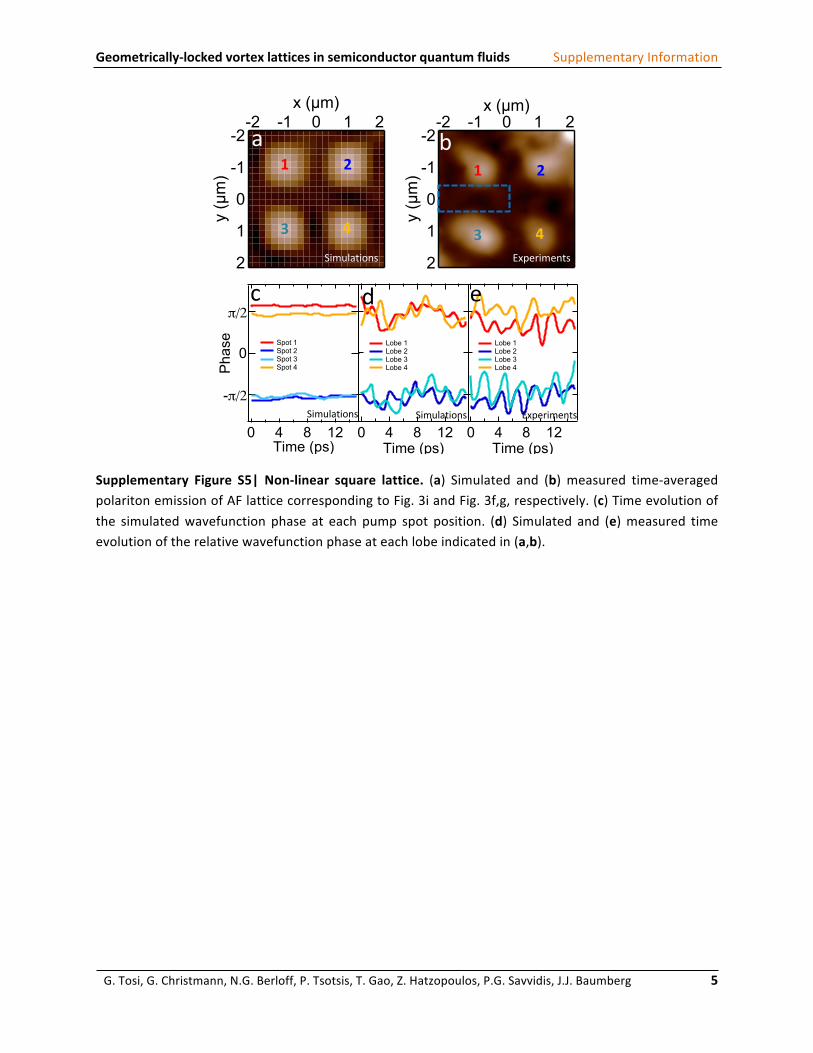
Supplementary Figure S5| Non-‐linear square lattice. (a) Simulated and (b) measured time-‐averaged polariton emission of AF lattice corresponding to Fig. 3i and Fig. 3f,g, respectively. (c) Time evolution of the simulated wavefunction phase at each pump spot position. (d) Simulated and (e) measured time evolution of the relative wavefunction phase at each lobe indicated in (a,b).
12840Time (ps)
Lobe 1 Lobe 2 Lobe 3 Lobe 4
12840Time (ps)
Lobe 1 Lobe 2 Lobe 3 Lobe 4
Simulations Simulations Experiments
2
1
0
-1
-2
y (µ
m)
-2 -1 0 1 2x (µm)
2
1
0
-1
-2
y (µ
m)
-2 -1 0 1 2x (µm)
0
1
Intensity1 2
3 4
Simulations Experiments
1 2
3 4
-π/2
0
π/2
Pha
se
12840Time (ps)
Spot 1 Spot 2 Spot 3 Spot 4
a
c d e
b
Geometrically-‐locked vortex lattices in semiconductor quantum fluids Supplementary Information
G. Tosi, G. Christmann, N.G. Berloff, P. Tsotsis, T. Gao, Z. Hatzopoulos, P.G. Savvidis, J.J. Baumberg 6
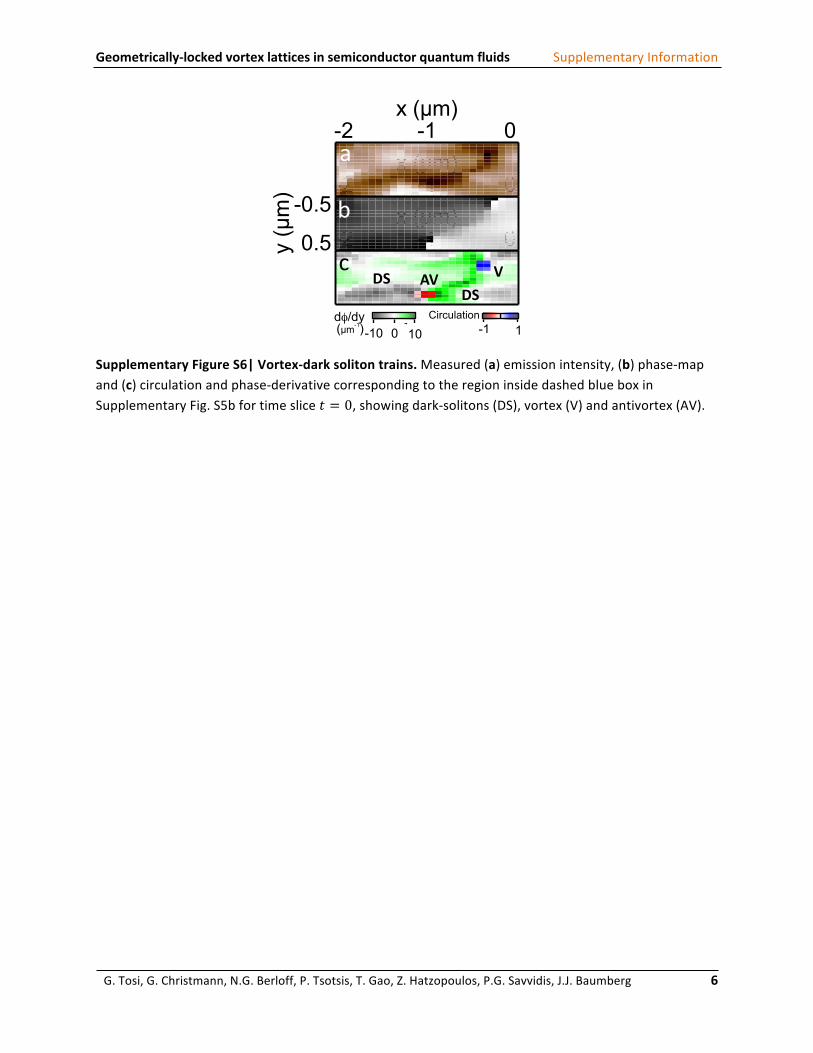
Supplementary Figure S6| Vortex-‐dark soliton trains. Measured (a) emission intensity, (b) phase-‐map and (c) circulation and phase-‐derivative corresponding to the region inside dashed blue box in Supplementary Fig. S5b for time slice 𝑡 = 0, showing dark-‐solitons (DS), vortex (V) and antivortex (AV).
0.5
-0.5y
(µm
) -2 -1 0x (µm)
0.5
-0.5
y (µ
m) -2 -1 0
x (µm)-0.5
0.5y (µ
m) -2 -1 0
x (µm)
Intensity01
VDS
AVDS
1086420 Time (ps)
-2 -2
-1 -1
0 0x
(µm
)
-10010dφ/dy
(µm-1)
1 -1
Vorticity
10 8 6 4 2 0Time (ps)
-2-2
-1-1
00x (µ
m)
-10
0 10
dφ/dy(µm
-1)
1-1
Vorticity
10
8
6
4
2
0
Tim
e (p
s)
-2
-2
-1
-1
0
0x (µm)
-10
0
10
dφ/dy(µm
-1)
1
-1
Vorticity
10
8
6
4
2
0
Tim
e (p
s)
-2
-2
-1
-1
0
0x (µm)
-10
0
10
dφ/dy(µm
-1)
1
-1
Vorticity
10
8
6
4
2
0
Tim
e (p
s)
-2
-2
-1
-1
0
0x (µm)
-10
0
10
dφ/dy(µm
-1)
1
-1
Vorticity
10 8 6 4 2 0
Time (ps)
-2-2
-1-1
00x (µ
m)
-10
0 10
dφ/dy(µm
-1)
1-1
VorticityCirculation
10
8
6
4
2
0
Tim
e (p
s)
-2
-2
-1
-1
0
0x (µm)
-10
0
10
dφ/dy(µm
-1)
1
-1V
orticity
10
8
6
4
2
0
Tim
e (p
s)
-2
-2
-1
-1
0
0x (µm)
-10
0
10
dφ/dy(µm
-1)
1
-1
Vorticity
a
b
c
Geometrically-‐locked vortex lattices in semiconductor quantum fluids Supplementary Information
G. Tosi, G. Christmann, N.G. Berloff, P. Tsotsis, T. Gao, Z. Hatzopoulos, P.G. Savvidis, J.J. Baumberg 7
Supplementary Figure S7| Vortex and dark-‐soliton nonlinear dynamics in square ‘waveguides’. (a) Simulated and (b) measured time-‐averaged circulation strength, Γ(𝒓) . (c) Simulated and (d) measured time evolution of the vorticity and phase-‐gradient of the region inside the dashed red box in (a,b) integrated along the 𝑦-‐axis (see Supplementary Fig. S6).
10
8
6
4
2
0
Tim
e (p
s)
-2
-2
-1
-1
0
0x (µm)
-10
0
10
dφ/dy(µm
-1)
1
-1
Vorticity
2
1
0
-1
-2
y (µ
m)
-2 -1 0 1 2x (µm)
2
1
0
-1
-2
y (µ
m)
-2 -1 0 1 2x (µm)
110
vortexprobability (%
)
10
8
6
4
2
0
Tim
e (p
s)-2
-2
-1
-1
0
0x (µm)
Simulations Experimentsa b
c dC
irculationΓ "(𝒓)
p(vortex),2
1
0
-1
-2
y (µ
m)
-2 -1 0 1 2x (µm)
110
vortexprobability (%
)
%
%
Geometrically-‐locked vortex lattices in semiconductor quantum fluids Supplementary Information
G. Tosi, G. Christmann, N.G. Berloff, P. Tsotsis, T. Gao, Z. Hatzopoulos, P.G. Savvidis, J.J. Baumberg 8
Supplementary Discussion
Lattice wave-‐function. Under low pump power, when non-‐linearities do not play a significant role, each pump spot contributes to the global wave-‐function with a superposition of different 𝑘-‐states at different radial positions5:
The blueshift 𝛥(𝒓) is maximum at the spot positions and decays parabolically going to zero after 10𝜇𝑚 (Supplementary Fig. S3b). The radial 𝐾 wavevector is given by the inverse lower polariton branch dispersion relation (Fig. 2e, Supplementary Fig. S3a) and depends on the blueshift (Supplementary Fig. S3b). The expanding density decays exponentially according to the polariton lifetime 𝜏! and the local velocity from Eq. (S2). The term 𝑔! 𝒓 describes local amplification13. Hexagonal lattices appear in this model in the wavefunction central region, reproducing well the measured pattern (Supplementary Fig. S3d).
The individual condensate phases 𝜑!, merely spatially shift the lattice for the 3 spot case. For all the measured data, the relative phases between the three condensates are close to zero (F offset < 3°) and are well described by the linear superposition of plane waves. Nonlinearities and relative phases play a much more important role for the 4 spot excitations and higher powers, but we also found square lattices that can be well reproduced by linear interferences (Supplementary Fig. S4c-‐f).
Geometrically-‐locked vortex lattices in semiconductor quantum fluids Supplementary Information
G. Tosi, G. Christmann, N.G. Berloff, P. Tsotsis, T. Gao, Z. Hatzopoulos, P.G. Savvidis, J.J. Baumberg 9
Non-‐linear vortex dynamics in the square lattice. To better understand the nonlinear dynamics, the time-‐evolution of the lattice wavefunction is tracked in simulations and experiments, in the latter case after back Fourier transforming the complete energy-‐resolved tomography in density and phase. Tomographic reconstruction is taken by sequentially translating the spatial images across the entrance slit of the spectrometer, thus recording spectra for each line scan of the image. The phase of each energy mode is then retrieved from interferences of each tomographically reconstructed spatial mode, and so the condensate wave-‐function is fully characterized in terms of energy, density and phase. A simple Fourier transform allows the condensate phase and density to be tracked in time: 𝜓 𝒓, 𝑡 =
𝜓 𝒓,𝐸 𝑒!"#/ℏ!!(!)! , with 𝜑(𝐸) being their relative phase . This relative phase is constrained by the direct images of polariton density. We checked also that 𝜑(𝐸) does not substantially change the reconstruction of the dynamics. The 2meV spectral bandwidth leads to dynamical observations on the 𝑝𝑠-‐timescale.
Even though the AF-‐coupled lattice is stable (Supplementary Fig. S5a-‐c), the regions between the bright spots which are expected to contain dark-‐soliton stripes are destabilised by the strong nonlinear interactions. Under high pump powers non-‐linear dynamics is observed, although AF-‐phase-‐coupling between spots is preserved and the time-‐averaged wave-‐function of the central region shows the characteristic four lobes with 𝜋 phase relation between them.
Under high polariton densities, dark-‐solitons breaks up into vortex-‐antivortex pairs, which are connected by dark solitons (Supplementary Fig. S6). The probability of finding a vortex at a specific spatial point is given by the normalised time-‐averaged circulation, Γ(𝒓) = 𝛤(𝒓, 𝑡) 𝑑𝑡 /∆𝑡, mapped in Supplementary Fig. S7a,b. We note that the experimental spatial resolution for the accuracy of locating the vorticity centre of the larger topological vortex (∼ 0.7 𝜆/2𝑁𝐴) is almost the pixel size here.
To easily visualize such vortex-‐dark soliton trains, we extract from the phase-‐map (Supplementary Fig. S6b) and plot in compatible images the circulation and the phase-‐derivative (Supplementary Fig. S6c), along with the polariton density (Supplementary Fig. S6a). Averaging over this small section of y between two bright lobes, allows the dynamics of these vortices and the phase-‐gradient to be observed.
An intricate time dynamics results (Supplementary Fig. S7c,d), with moving vortices (red) and anti-‐vortices (blue) linking dark solitons of oppositely directed phase-‐gradient, producing phase fluctuations between the bright lobes of the lattice (Supplementary Fig. S5d,e). Despite their non-‐linear time-‐dynamics, the topological defects remain constrained in the gaps between the density lobes, which form vortex ‘waveguides’ (e.g. Supplementary Fig. S7b).
Geometrically-‐locked vortex lattices in semiconductor quantum fluids Supplementary Information
G. Tosi, G. Christmann, N.G. Berloff, P. Tsotsis, T. Gao, Z. Hatzopoulos, P.G. Savvidis, J.J. Baumberg 10
Influence of disorder on the geometric coupling. The effect of disorder on the geometric coupling robustness is studied by adding a random potential to equation (2):
𝑖ℏ !"!"= − ℏ!
!!∇! + 𝑈! 𝜓 ! + 𝑉!"# 𝒓 + 𝑖𝑃 𝒓,𝜓 − 𝑖𝜅 𝜓 (S3)
The external potential 𝑉!"# contains disorder and is modelled by a random distribution of Fourier modes of varying amplitude and broadband spatial frequencies.
The numerical solution of this equation for three equally spaced pump spots and no disorder (𝑉!"# = 0) always gives a wavefunction with the same phase from each spot position, and so the central bright hexagon appears at the spots centroid, 𝑂.
When pumping with four equally-‐spaced spots and no disorder, two stable solutions appear depending on the initial noise: one with equal phases at each pump spot, leading to a maximum intensity in the centre, and the other with a π phase difference between neighbouring spots, leading to a minimum intensity in the centre. We have checked that this effect is not due to the square geometry of the computational grid by moving the positions of the pumping spots around the centre.
Strong disorder introduces phase-‐shifts during propagation out from each spot, and so the lattice is displaced and the geometric coupling is lost. However, for the low disorder values of our sample13, geometric coupling is preserved.