12
FM WORLD | 2011 | 3 SALARY SURVEY THE 2012 FM WORLD SALARY SURVEY FM W orld
| Date post: | 13-Mar-2016 |
| Category: |
Documents |
| Upload: | redactive-media-group |
| View: | 218 times |
| Download: | 0 times |
FM WORLD | 2011 | 3
SALARY SURVEY
The 2012 FM WorldSAlAry Survey
FMWorld
FM research 2012 SALARY SURVEY
2 | 2012 | FM WORLD
elcome to this, the eighth FM World Salary Survey. First things first – we’ve decided to call it the 2012 survey, and not the 2011, but don’t worry, you haven’t missed one.
Previously, these surveys have been published in the first month of the new year but titled for the year preceding. That’s understandable in that they’ve been based on survey data from the previous year, but having (for example) a 2010 product appear in 2011 could be confusing. So this year we’ve put the survey into the magazine as a bound-in supplement and used survey data from the polling period of January to March 2012. Yes, there’s a 15-month gap between this survey and its 2010 predecessor, but this will not have materially affected the trend lines established.
Beyond the change of title, the format of the survey remains largely the same. It’s designed to identify trends in salaries, benefits, training and qualifications in the facilities management sector,
while giving an insight into how FM professionals feel about their industry.
In the fifteen months since our last survey, the downturn of the last few years has continued to exert a major influence on facilities managers, despite the fact that we are technically not in a recession (at time of writing).
In these pages, you’ll gain some insight into what effect these recessionary pressures are having on the choices individual facilities managers are making. Where intriguing comparisons can be made between client side and supply side respondents, we’ve picked them out. Similarly, where there’s been a significant variation in the responses in terms of gender, we’ve highlighted what they are. As we progress through
the second decade of the 21st century and the role of the facilities manager becomes gradually more important to businesses, we’ve highlighted examples of responses which confirm this trend.
Thank you to everybody who took part. The range of responses was diverse indeed, giving the data more validity. I’m keen to hear your ideas on what you’d like covered in future editions. From hereon, we’ll be surveying in January to March. Any suggestions we receive before the end of this calendar year will be considered.
Finally, congratulations to Rosemary Clarkson of Brendoncare who was drawn from the hat to win the £250 prize for taking part.
Enjoy the survey,
Martin Read EditorFM World
CommentW
“the survey is designed to identify trends in salaries, benefits, training and qualifications in the fM sector”
This research was published by
17 Britton Street, London EC1M 5TPTel: 020 7880 6200Website: www.redactive.co.uk
2012 SALARY SURVEY
FM WORLD | 2012 | 3
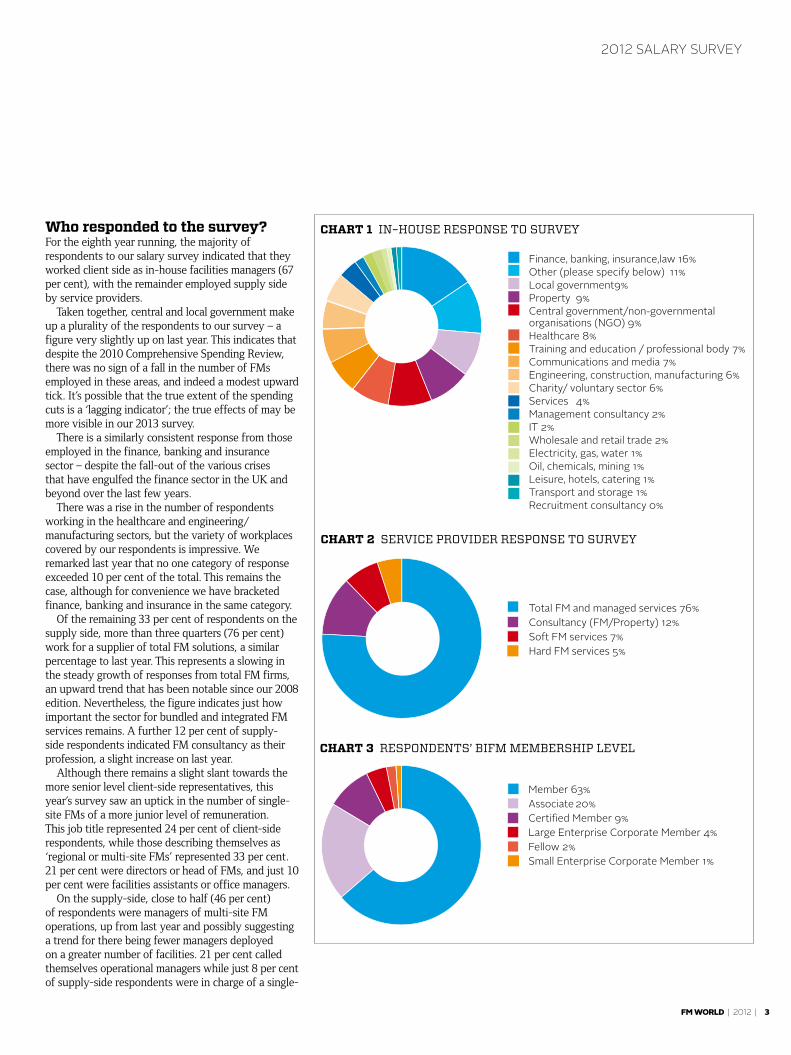
Who responded to the survey?For the eighth year running, the majority of respondents to our salary survey indicated that they worked client side as in-house facilities managers (67 per cent), with the remainder employed supply side by service providers.
Taken together, central and local government make up a plurality of the respondents to our survey – a figure very slightly up on last year. This indicates that despite the 2010 Comprehensive Spending Review, there was no sign of a fall in the number of FMs employed in these areas, and indeed a modest upward tick. It’s possible that the true extent of the spending cuts is a ‘lagging indicator’; the true effects of may be more visible in our 2013 survey.
There is a similarly consistent response from those employed in the finance, banking and insurance sector – despite the fall-out of the various crises that have engulfed the finance sector in the UK and beyond over the last few years.
There was a rise in the number of respondents working in the healthcare and engineering/manufacturing sectors, but the variety of workplaces covered by our respondents is impressive. We remarked last year that no one category of response exceeded 10 per cent of the total. This remains the case, although for convenience we have bracketed finance, banking and insurance in the same category.
Of the remaining 33 per cent of respondents on the supply side, more than three quarters (76 per cent) work for a supplier of total FM solutions, a similar percentage to last year. This represents a slowing in the steady growth of responses from total FM firms, an upward trend that has been notable since our 2008 edition. Nevertheless, the figure indicates just how important the sector for bundled and integrated FM services remains. A further 12 per cent of supply-side respondents indicated FM consultancy as their profession, a slight increase on last year.
Although there remains a slight slant towards the more senior level client-side representatives, this year’s survey saw an uptick in the number of single-site FMs of a more junior level of remuneration. This job title represented 24 per cent of client-side respondents, while those describing themselves as ‘regional or multi-site FMs’ represented 33 per cent. 21 per cent were directors or head of FMs, and just 10 per cent were facilities assistants or office managers.
On the supply-side, close to half (46 per cent) of respondents were managers of multi-site FM operations, up from last year and possibly suggesting a trend for there being fewer managers deployed on a greater number of facilities. 21 per cent called themselves operational managers while just 8 per cent of supply-side respondents were in charge of a single-
Finance, banking, insurance,law 16%Other (please specify below) 11%Local government9%Property 9%Central government/non-governmental organisations (NGO) 9%Healthcare 8%Training and education / professional body 7%Communications and media 7%Engineering, construction, manufacturing 6%Charity/ voluntary sector 6%Services 4%Management consultancy 2%IT 2%Wholesale and retail trade 2%Electricity, gas, water 1%Oil, chemicals, mining 1%Leisure, hotels, catering 1%Transport and storage 1%Recruitment consultancy 0%
CHART 1 IN–HOUSE RESPONSE TO SURVEY
Total FM and managed services 76%Consultancy (FM/Property) 12%Soft FM services 7%Hard FM services 5%
CHART 2 SERVICE PROVIDER RESPONSE TO SURVEY
Member 63%Associate 20%Certi�ed Member 9%Large Enterprise Corporate Member 4%Fellow 2%Small Enterprise Corporate Member 1%
CHART 3 RESPONDENTS’ BIFM MEMBERSHIP LEVEL
FM research SALARY SURVEY
4 | 2012 | FM WORLD
site operation.The proportion of respondents describing their
role as falling within PFI or PPP-type operations has fallen significantly this year, from 31 per cent to 24 per cent. With so many public programmes being cut significantly, this is perhaps no surprise.
There was a slight drop in the number of respondents describing themselves as having BIFM member grade status (see chart 3). In their place was a significant increase in the number of people with certified member status (9 per cent). This level of BIFM membership requires three years or more of management and FM experience (see the BIFM website for further details), so the increase in their numbers here is a sign of the emphasis BIFM members appear to be placing on their continuing professional development. Certified member status was only recently introduced, and the number represented in our survey has trebled compared to our 2010 survey. It will be interesting to see if this trend continues in our 2013 poll.
As with last year, 40 per cent of respondents were also members of other professional bodies. IOSH continues to be the most popular, with 36 per cent of respondents being a member. Based on our responses, you are more likely to be an IOSH member if you work in-house.
Next up in terms of popularity is the Royal Institution of Chartered Surveyors, with 18 per cent of respondents also belonging to RICS. 11 per cent belong to the Chartered Institute of Building Services Engineering, 14 per cent the Chartered Management Institute (up from 11 per cent last year), 5 per cent the Chartered Institute of Building and just over 3 per cent the Chartered Institute of Purchasing and Supply (down from 6 per cent last year). 6 per cent of respondents also identified themselves as members of the Facilities Management Association.
This year there has been a marked change in the number of women respondents who are also members of other professional organisations. While there are still more men indicating their allegiance to other such organisations, there is much less of a gap than was remarked upon in our 2010 survey – and all this before the appointment of the BIFM’s new chairman and deputy chairman, both women. The success of initiatives such as the BIFM’s Women in FM special interest group has clearly helped in this regard. We also remarked last year on the impact of the many female role models in the sector; this change in respondent profile is perhaps an indication of that. It’s also worth noting that women seem to look beyond the established professional organisations when considering their networking options; nearly twice as many women as men indicated that they were members of organisations
Scotland
Northern Ireland
North-west
North-east
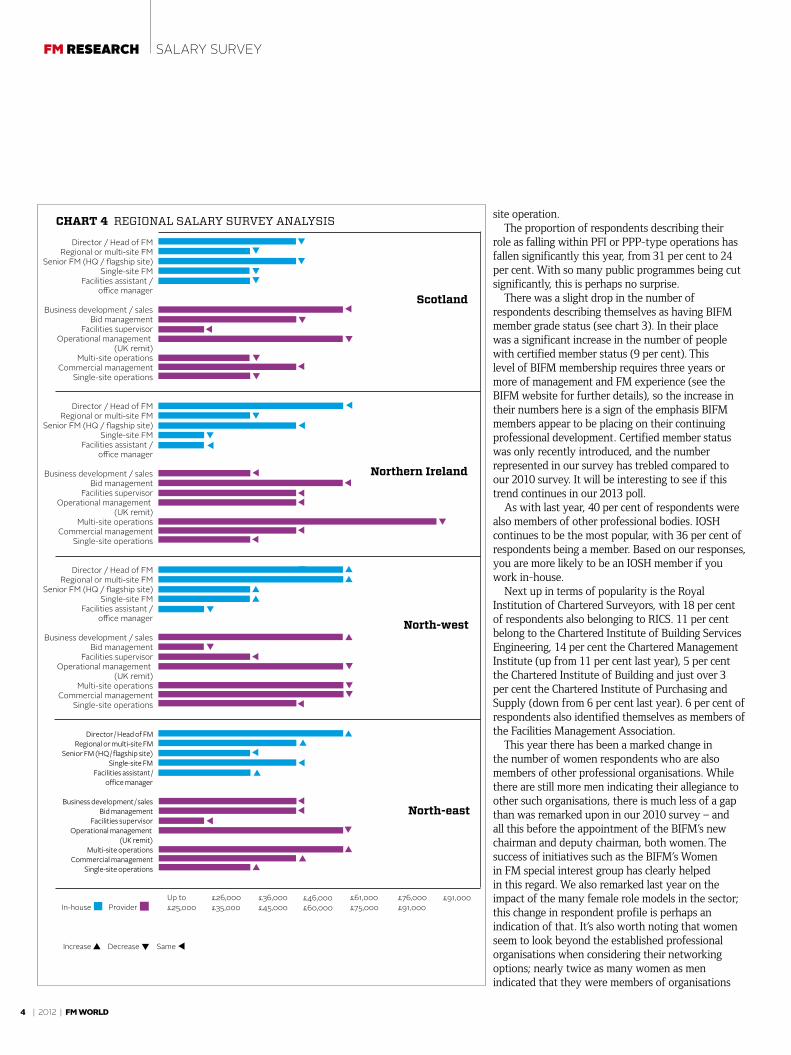
CHART 4 REGIONAL SALARY SURVEY ANALYSIS
Director / Head of FMRegional or multi-site FM
Senior FM (HQ / flagship site)Single-site FM
Facilities assistant / office manager
Business development / salesBid management
Facilities supervisorOperational management
(UK remit)Multi-site operations
Commercial managementSingle-site operations
Director / Head of FMRegional or multi-site FM
Senior FM (HQ / flagship site)Single-site FM
Facilities assistant / office manager
Business development / salesBid management
Facilities supervisorOperational management
(UK remit)Multi-site operations
Commercial managementSingle-site operations
Director / Head of FMRegional or multi-site FM
Senior FM (HQ / flagship site)Single-site FM
Facilities assistant / office manager
Business development / salesBid management
Facilities supervisorOperational management
(UK remit)Multi-site operations
Commercial managementSingle-site operations
Director / Head of FMRegional or multi-site FM
Senior FM (HQ / flagship site)Single-site FM
Facilities assistant / office manager
Business development / salesBid management
Facilities supervisorOperational management
(UK remit)Multi-site operations
Commercial managementSingle-site operations
Midlands
Wales and South-west
South-east
Up to £25,000
£26,000 £35,000
£36,000 £45,000
£46,000 £60,000
£61,000 £75,000
£76,000 £91,000
£91,000+
East of England
No indicatorsas new region
London
In-house Provider
Up to £25,000
£26,000 £35,000
£36,000 £45,000
£46,000 £60,000
£61,000 £75,000
£76,000 £91,000
£91,000In-house
Increase
Provider
Director / Head of FMRegional or multi-site FM
Senior FM (HQ / flagship site)Single-site FM
Facilities assistant / office manager
Business development / salesBid management
Facilities supervisorOperational management
(UK remit)Multi-site operations
Commercial managementSingle-site operations
Director / Head of FMRegional or multi-site FM
Senior FM (HQ / flagship site)Single-site FM
Facilities assistant / office manager
Business development / salesBid management
Facilities supervisorOperational management
(UK remit)Multi-site operations
Commercial managementSingle-site operations
Director / Head of FMRegional or multi-site FM
Senior FM (HQ / flagship site)Single-site FM
Facilities assistant / office manager
Business development / salesBid management
Facilities supervisorOperational management
(UK remit)Multi-site operations
Commercial managementSingle-site operations
Director / Head of FMRegional or multi-site FM
Senior FM (HQ / flagship site)Single-site FM
Facilities assistant / office manager
Business development / salesBid management
Facilities supervisorOperational management
(UK remit)Multi-site operations
Commercial managementSingle-site operations
Director / Head of FMRegional or multi-site FM
Senior FM (HQ / flagship site)Single-site FM
Facilities assistant / office manager
Business development / salesBid management
Facilities supervisorOperational management
(UK remit)Multi-site operations
Commercial managementSingle-site operations
Decrease Same
SALARY SURVEY
FM WORLD | 2012 | 5
2012 SALARY SURVEY
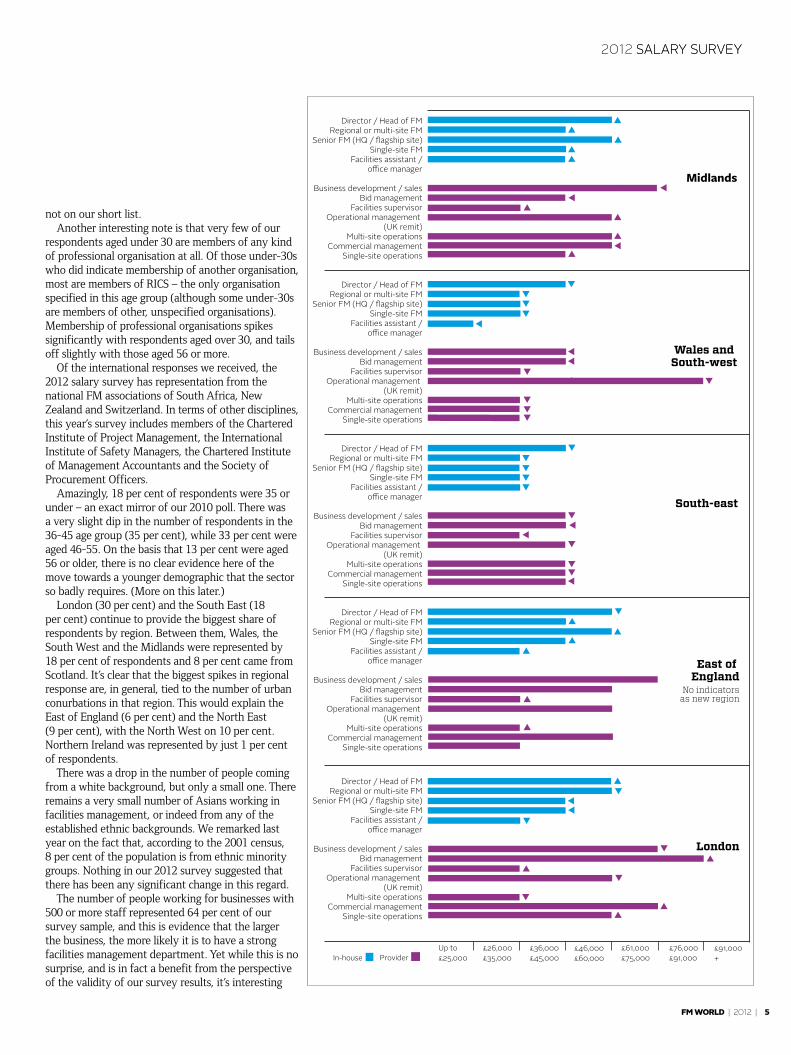
not on our short list.Another interesting note is that very few of our
respondents aged under 30 are members of any kind of professional organisation at all. Of those under-30s who did indicate membership of another organisation, most are members of RICS – the only organisation specified in this age group (although some under-30s are members of other, unspecified organisations). Membership of professional organisations spikes significantly with respondents aged over 30, and tails off slightly with those aged 56 or more.
Of the international responses we received, the 2012 salary survey has representation from the national FM associations of South Africa, New Zealand and Switzerland. In terms of other disciplines, this year’s survey includes members of the Chartered Institute of Project Management, the International Institute of Safety Managers, the Chartered Institute of Management Accountants and the Society of Procurement Officers.
Amazingly, 18 per cent of respondents were 35 or under – an exact mirror of our 2010 poll. There was a very slight dip in the number of respondents in the 36-45 age group (35 per cent), while 33 per cent were aged 46-55. On the basis that 13 per cent were aged 56 or older, there is no clear evidence here of the move towards a younger demographic that the sector so badly requires. (More on this later.)
London (30 per cent) and the South East (18 per cent) continue to provide the biggest share of respondents by region. Between them, Wales, the South West and the Midlands were represented by 18 per cent of respondents and 8 per cent came from Scotland. It’s clear that the biggest spikes in regional response are, in general, tied to the number of urban conurbations in that region. This would explain the East of England (6 per cent) and the North East (9 per cent), with the North West on 10 per cent. Northern Ireland was represented by just 1 per cent of respondents.
There was a drop in the number of people coming from a white background, but only a small one. There remains a very small number of Asians working in facilities management, or indeed from any of the established ethnic backgrounds. We remarked last year on the fact that, according to the 2001 census, 8 per cent of the population is from ethnic minority groups. Nothing in our 2012 survey suggested that there has been any significant change in this regard.
The number of people working for businesses with 500 or more staff represented 64 per cent of our survey sample, and this is evidence that the larger the business, the more likely it is to have a strong facilities management department. Yet while this is no surprise, and is in fact a benefit from the perspective of the validity of our survey results, it’s interesting
Scotland
Northern Ireland
North-west
North-east
CHART 4 REGIONAL SALARY SURVEY ANALYSIS
Director / Head of FMRegional or multi-site FM
Senior FM (HQ / flagship site)Single-site FM
Facilities assistant / office manager
Business development / salesBid management
Facilities supervisorOperational management
(UK remit)Multi-site operations
Commercial managementSingle-site operations
Director / Head of FMRegional or multi-site FM
Senior FM (HQ / flagship site)Single-site FM
Facilities assistant / office manager
Business development / salesBid management
Facilities supervisorOperational management
(UK remit)Multi-site operations
Commercial managementSingle-site operations
Director / Head of FMRegional or multi-site FM
Senior FM (HQ / flagship site)Single-site FM
Facilities assistant / office manager
Business development / salesBid management
Facilities supervisorOperational management
(UK remit)Multi-site operations
Commercial managementSingle-site operations
Director / Head of FMRegional or multi-site FM
Senior FM (HQ / flagship site)Single-site FM
Facilities assistant / office manager
Business development / salesBid management
Facilities supervisorOperational management
(UK remit)Multi-site operations
Commercial managementSingle-site operations
Midlands
Wales and South-west
South-east
Up to £25,000
£26,000 £35,000
£36,000 £45,000
£46,000 £60,000
£61,000 £75,000
£76,000 £91,000
£91,000+
East of England
No indicatorsas new region
London
In-house Provider
Up to £25,000
£26,000 £35,000
£36,000 £45,000
£46,000 £60,000
£61,000 £75,000
£76,000 £91,000
£91,000In-house
Increase
Provider
Director / Head of FMRegional or multi-site FM
Senior FM (HQ / flagship site)Single-site FM
Facilities assistant / office manager
Business development / salesBid management
Facilities supervisorOperational management
(UK remit)Multi-site operations
Commercial managementSingle-site operations
Director / Head of FMRegional or multi-site FM
Senior FM (HQ / flagship site)Single-site FM
Facilities assistant / office manager
Business development / salesBid management
Facilities supervisorOperational management
(UK remit)Multi-site operations
Commercial managementSingle-site operations
Director / Head of FMRegional or multi-site FM
Senior FM (HQ / flagship site)Single-site FM
Facilities assistant / office manager
Business development / salesBid management
Facilities supervisorOperational management
(UK remit)Multi-site operations
Commercial managementSingle-site operations
Director / Head of FMRegional or multi-site FM
Senior FM (HQ / flagship site)Single-site FM
Facilities assistant / office manager
Business development / salesBid management
Facilities supervisorOperational management
(UK remit)Multi-site operations
Commercial managementSingle-site operations
Director / Head of FMRegional or multi-site FM
Senior FM (HQ / flagship site)Single-site FM
Facilities assistant / office manager
Business development / salesBid management
Facilities supervisorOperational management
(UK remit)Multi-site operations
Commercial managementSingle-site operations
Decrease Same
6 | 2012 | FM WORLD
FM research 2012 SALARY SURVEY
to note that nearly 20 per cent of our sample comprises facilities managers at companies with fewer than 200 employees – those organisations termed ‘small to medium-sized enterprise’ by government. Nevertheless, facilities management clearly remains a ‘big business’ phenomenon. 51 per cent of our respondents are employed/work with businesses with more than a thousand employees.
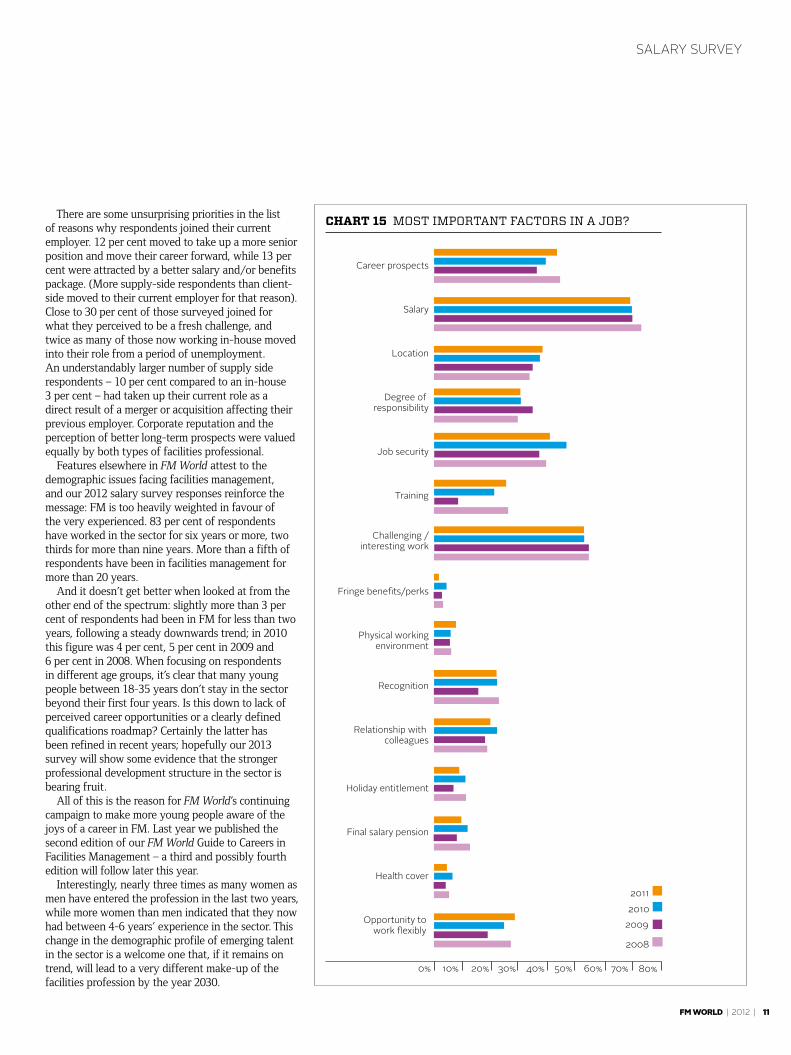
How has the recession hit salaries, bonuses and expectations? It won’t come as a shock to hear that the last twelve months have hardly been helpful to the salaries and conditions of facilities managers. Salary remains the most important reason for FMs turning up each morning, with 74 per cent of supply-side and 63 per cent of client-side FMs citing their basic pay packet as the most important reason for going to work. It is perhaps not a surprise that career prospects are more important to those employed by service providers than those in-house; the opportunity for promotion in a multi-operation service provider is likely to come around more frequently. Both supply and client-side FMs are keen on the opportunity to work flexibly, while the prospect of interesting and challenging work was a major factor for both FM types. In-house FMs take more interest in the training their employers provide, while there are slightly more supply-side FMs than their client-side colleagues who cite ‘recognition’ as an important aspect of their employer. In-house FMs are more likely to value the relationships they have with colleagues.
There are some interesting variations by gender. Among our respondents, men are more likely than women to want to work for an employer offering them good career prospects and pay. Location of the workplace is more important to women, as is
training, while women are also more interested in the relationship they have with their colleagues.
Across both genders, the importance of salary decreases the older our respondents get, as does the location of the workplace and job security. Job security is an increasingly important consideration, as we pointed out last year. However, the importance of job security does not seem to have increased significantly in this year’s poll. What stays constant whatever the age group is the need for challenging and interesting work.
It is perhaps an encouraging sign that fewer respondents indicated their organisations had high turnover of staff than had been the case in our last survey. Equal opportunities and diversity in the workplace was a strong issue for many respondents, while a high degree of staff morale was something both client-side and supply-side respondents looked for. It’s also clear that flexible working is of increasing importance to FMs of both types.
One significant point is that respondents are becoming more interested in developing their career within their current organisation, particularly those working for service providers. It’s possibly an indication of FMs becoming increasingly aware of the portable nature of job roles in the supply-side sector and looking for more commitment in this area from their employers. Last year, just 31 per cent felt that their current employer offered excellent succession planing and career opportunities, which compared unfavourably to the 35 per cent figure from our 2009 survey. This year the figure has risen to 39 per cent.
In terms of salary levels, this year’s survey provides a mixed bag of news. There’s been a drop in the number of respondents whose salary has remained the same (down from 36 per cent to 27 per cent) and there’s been an increase in the number of people
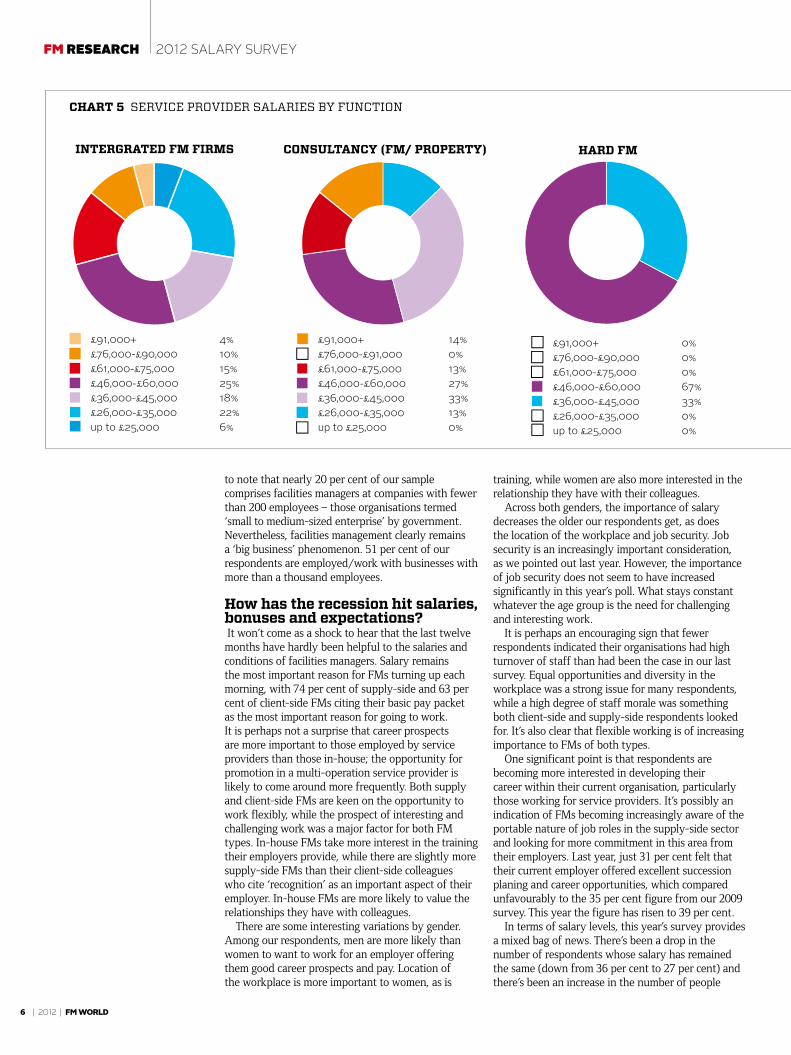
£91,000+ 4%£76,000-£90,000 10%£61,000-£75,000 15%£46,000-£60,000 25%£36,000-£45,000 18%£26,000-£35,000 22%up to £25,000 6%
CHART 5 SERVICE PROVIDER SALARIES BY FUNCTION
INTERGRATED FM FIRMS
£91,000+ 14%£76,000-£91,000 0%£61,000-£75,000 13%£46,000-£60,000 27%£36,000-£45,000 33%£26,000-£35,000 13%up to £25,000 0%
CONSULTANCY (FM/ PROPERTY)
£91,000+ 4%£76,000-£90,000 10%£61,000-£75,000 15%£46,000-£60,000 25%£36,000-£45,000 18%£26,000-£35,000 22%up to £25,000 6%
CHART 5 SERVICE PROVIDER SALARIES BY FUNCTION
INTERGRATED FM FIRMS
£91,000+ 14%£76,000-£91,000 0%£61,000-£75,000 13%£46,000-£60,000 27%£36,000-£45,000 33%£26,000-£35,000 13%up to £25,000 0%
CONSULTANCY (FM/ PROPERTY) HARD FM SOFT FM
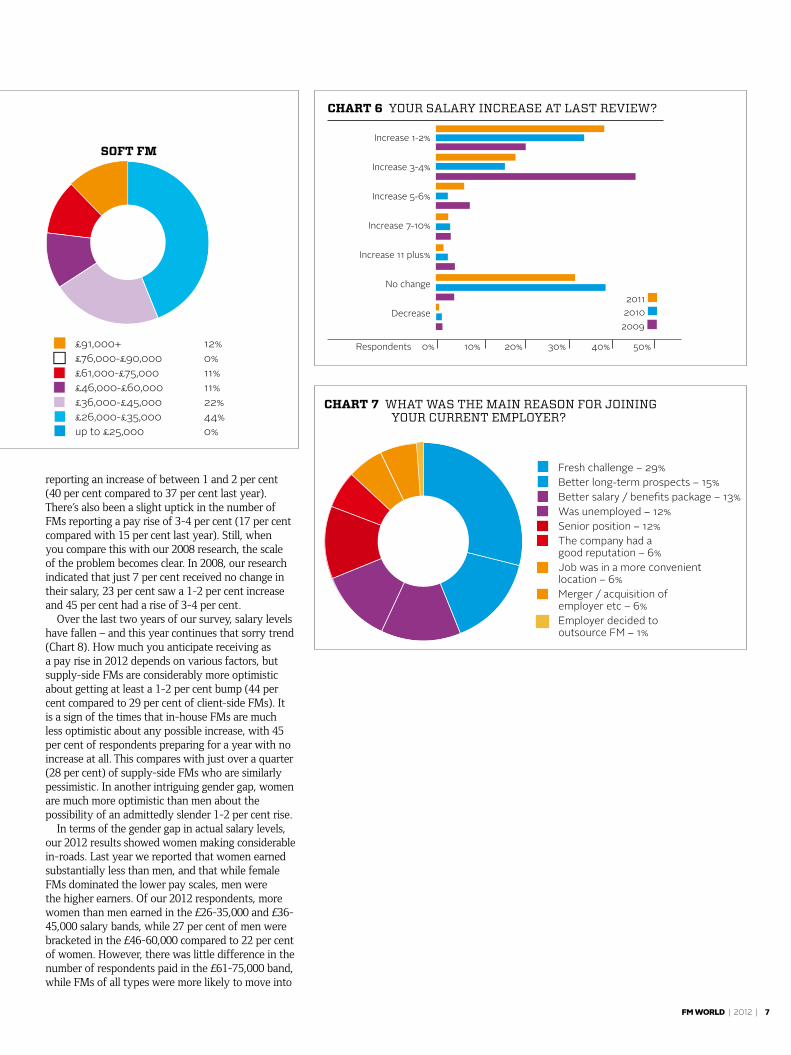
£91,000+ 12%£76,000-£90,000 0%£61,000-£75,000 11%£46,000-£60,000 11%£36,000-£45,000 22%£26,000-£35,000 44%up to £25,000 0%
£91,000+ 0%£76,000-£90,000 0%£61,000-£75,000 0%£46,000-£60,000 67%£36,000-£45,000 33%£26,000-£35,000 0%up to £25,000 0%
FM WORLD | 2012 | 7
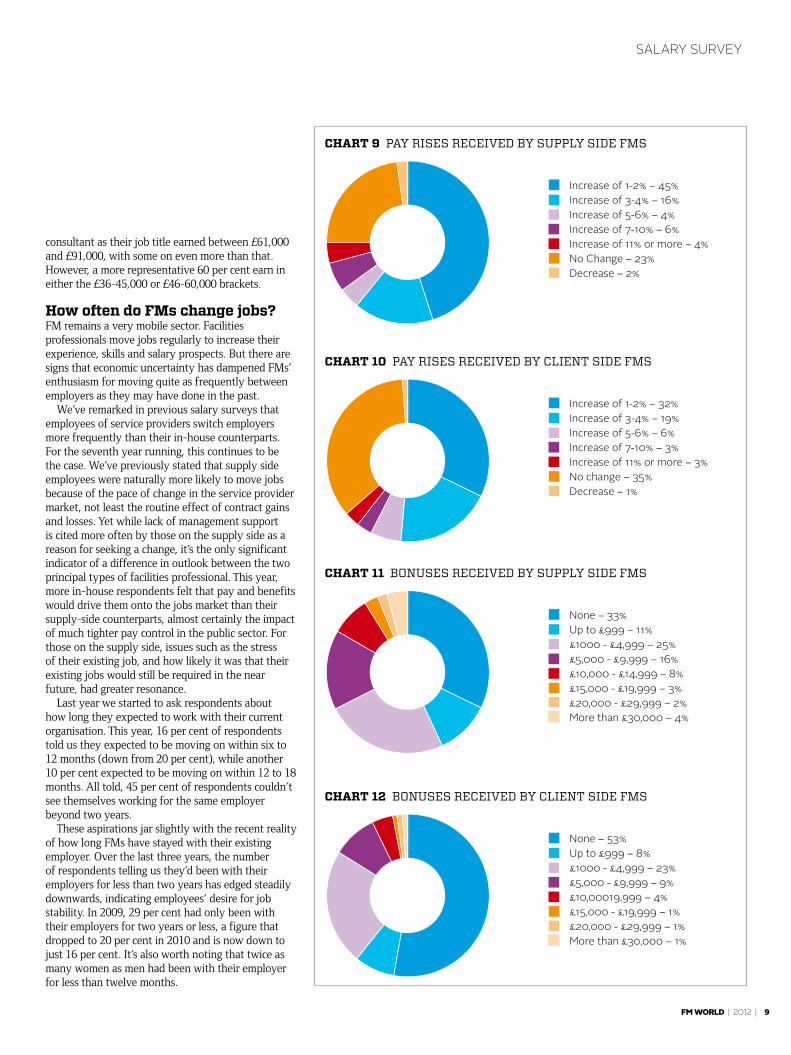
reporting an increase of between 1 and 2 per cent (40 per cent compared to 37 per cent last year). There’s also been a slight uptick in the number of FMs reporting a pay rise of 3-4 per cent (17 per cent compared with 15 per cent last year). Still, when you compare this with our 2008 research, the scale of the problem becomes clear. In 2008, our research indicated that just 7 per cent received no change in their salary, 23 per cent saw a 1-2 per cent increase and 45 per cent had a rise of 3-4 per cent.
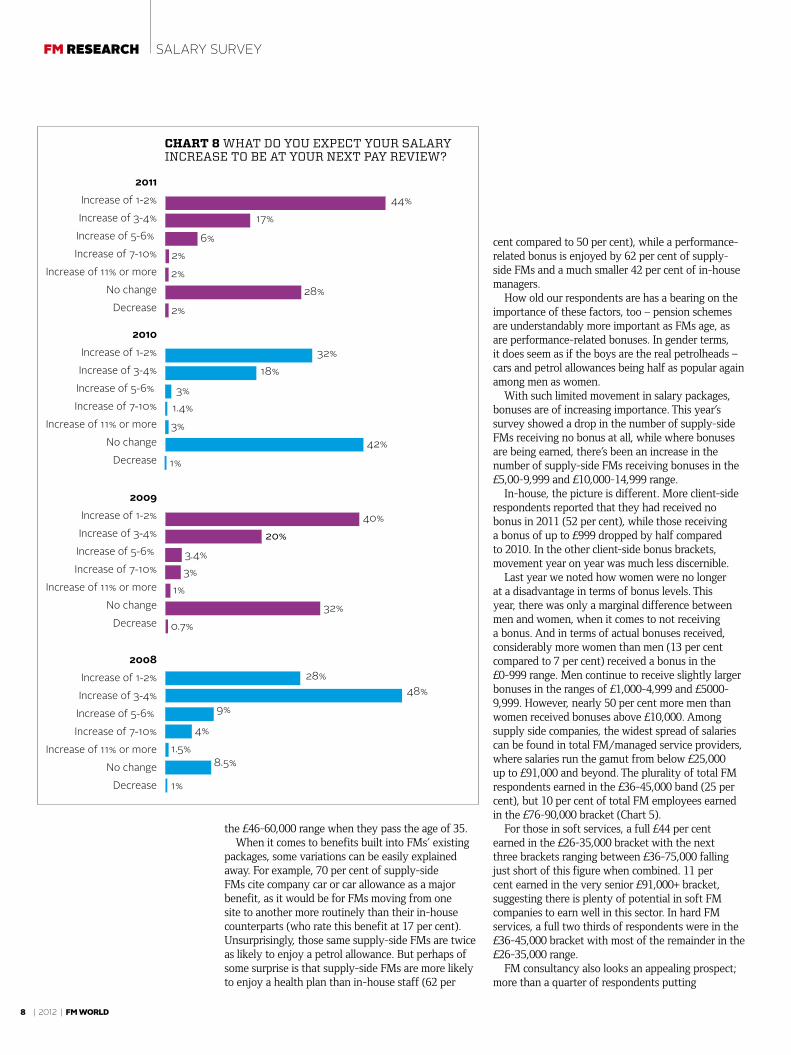
Over the last two years of our survey, salary levels have fallen – and this year continues that sorry trend (Chart 8). How much you anticipate receiving as a pay rise in 2012 depends on various factors, but supply-side FMs are considerably more optimistic about getting at least a 1-2 per cent bump (44 per cent compared to 29 per cent of client-side FMs). It is a sign of the times that in-house FMs are much less optimistic about any possible increase, with 45 per cent of respondents preparing for a year with no increase at all. This compares with just over a quarter (28 per cent) of supply-side FMs who are similarly pessimistic. In another intriguing gender gap, women are much more optimistic than men about the possibility of an admittedly slender 1-2 per cent rise.
In terms of the gender gap in actual salary levels, our 2012 results showed women making considerable in-roads. Last year we reported that women earned substantially less than men, and that while female FMs dominated the lower pay scales, men were the higher earners. Of our 2012 respondents, more women than men earned in the £26-35,000 and £36-45,000 salary bands, while 27 per cent of men were bracketed in the £46-60,000 compared to 22 per cent of women. However, there was little difference in the number of respondents paid in the £61-75,000 band, while FMs of all types were more likely to move into
HARD FM SOFT FM
£91,000+ 12%£76,000-£90,000 0%£61,000-£75,000 11%£46,000-£60,000 11%£36,000-£45,000 22%£26,000-£35,000 44%up to £25,000 0%
£91,000+ 0%£76,000-£90,000 0%£61,000-£75,000 0%£46,000-£60,000 67%£36,000-£45,000 33%£26,000-£35,000 0%up to £25,000 0%
20% 30%10%0%Respondents 40% 50%
CHART 6 YOUR SALARY INCREASE AT LAST REVIEW?
Increase 1-2%
Increase 3-4%
Increase 5-6%
Increase 7-10%
Increase 11 plus%
No change
Decrease 20102011
2009
CHART 7 WHAT WAS THE MAIN REASON FOR JOINING YOUR CURRENT EMPLOYER?
Fresh challenge – 29%Better long-term prospects – 15%Better salary / benefits package – 13%Was unemployed – 12%Senior position – 12%The company had a good reputation – 6%Job was in a more convenient location – 6%Merger / acquisition of employer etc – 6%Employer decided to outsource FM – 1%
FM research SALARY SURVEY
8 | 2012 | FM WORLD
the £46-60,000 range when they pass the age of 35.When it comes to benefits built into FMs’ existing
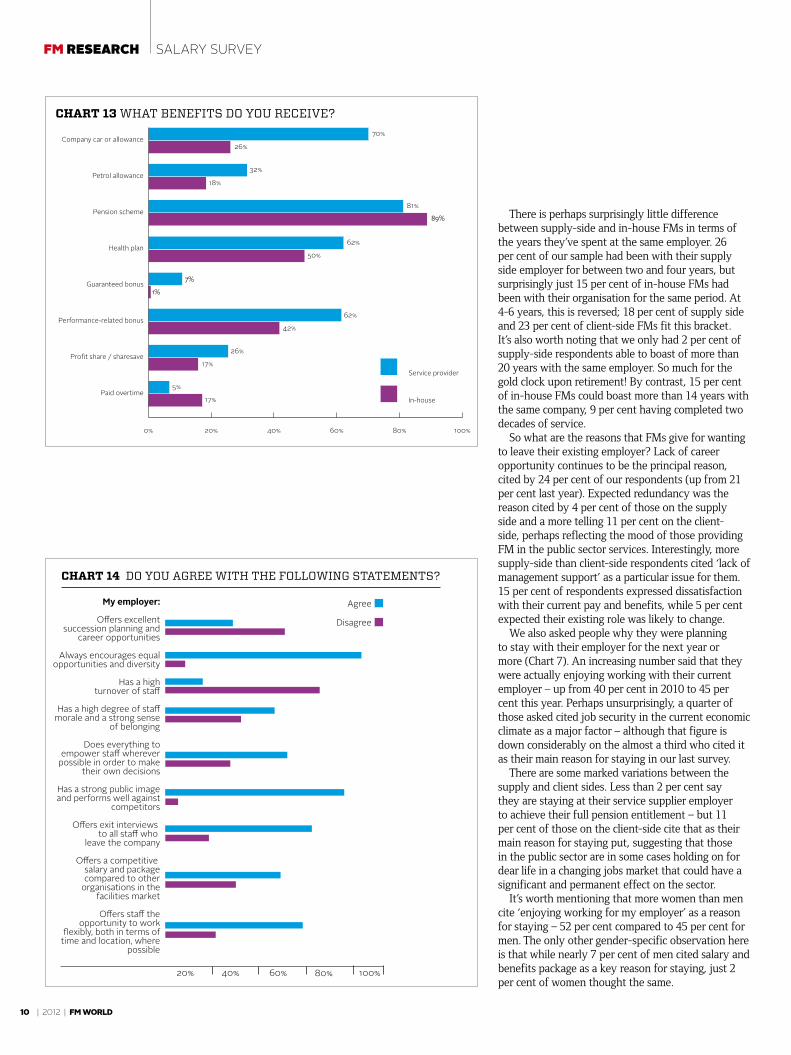
packages, some variations can be easily explained away. For example, 70 per cent of supply-side FMs cite company car or car allowance as a major benefit, as it would be for FMs moving from one site to another more routinely than their in-house counterparts (who rate this benefit at 17 per cent). Unsurprisingly, those same supply-side FMs are twice as likely to enjoy a petrol allowance. But perhaps of some surprise is that supply-side FMs are more likely to enjoy a health plan than in-house staff (62 per
cent compared to 50 per cent), while a performance-related bonus is enjoyed by 62 per cent of supply-side FMs and a much smaller 42 per cent of in-house managers.
How old our respondents are has a bearing on the importance of these factors, too – pension schemes are understandably more important as FMs age, as are performance-related bonuses. In gender terms, it does seem as if the boys are the real petrolheads – cars and petrol allowances being half as popular again among men as women.
With such limited movement in salary packages, bonuses are of increasing importance. This year’s survey showed a drop in the number of supply-side FMs receiving no bonus at all, while where bonuses are being earned, there’s been an increase in the number of supply-side FMs receiving bonuses in the £5,00-9,999 and £10,000-14,999 range.
In-house, the picture is different. More client-side respondents reported that they had received no bonus in 2011 (52 per cent), while those receiving a bonus of up to £999 dropped by half compared to 2010. In the other client-side bonus brackets, movement year on year was much less discernible.
Last year we noted how women were no longer at a disadvantage in terms of bonus levels. This year, there was only a marginal difference between men and women, when it comes to not receiving a bonus. And in terms of actual bonuses received, considerably more women than men (13 per cent compared to 7 per cent) received a bonus in the £0-999 range. Men continue to receive slightly larger bonuses in the ranges of £1,000-4,999 and £5000-9,999. However, nearly 50 per cent more men than women received bonuses above £10,000. Among supply side companies, the widest spread of salaries can be found in total FM/managed service providers, where salaries run the gamut from below £25,000 up to £91,000 and beyond. The plurality of total FM respondents earned in the £36-45,000 band (25 per cent), but 10 per cent of total FM employees earned in the £76-90,000 bracket (Chart 5).
For those in soft services, a full £44 per cent earned in the £26-35,000 bracket with the next three brackets ranging between £36-75,000 falling just short of this figure when combined. 11 per cent earned in the very senior £91,000+ bracket, suggesting there is plenty of potential in soft FM companies to earn well in this sector. In hard FM services, a full two thirds of respondents were in the £36-45,000 bracket with most of the remainder in the £26-35,000 range.
FM consultancy also looks an appealing prospect; more than a quarter of respondents putting
2009 Increase of 1-2%Increase of 3-4%Increase of 5-6% Increase of 7-10%
Increase of 11% or moreNo change
Decrease
2008 Increase of 1-2%Increase of 3-4%Increase of 5-6% Increase of 7-10%
Increase of 11% or moreNo change
Decrease
2007Increase of 1-2%Increase of 3-4%Increase of 5-6%
Increase of 7-10%Increase of 11% or more
No changeDecrease
2010 Increase of 1-2%Increase of 3-4%Increase of 5-6% Increase of 7-10%
Increase of 11% or moreNo change
Decrease
0% 20% 40% 60% 80% 100%
CHART 8 WHAT DO YOU EXPECT YOUR SALARY INCREASE TO BE AT YOUR NEXT PAY REVIEW?
28%48%
9%
4%1.5%
1%
8.5%
21%
14%
4%2%
6%0.6%
53%
40%
3.4%3%
1%32%
0.7%
20%
32%18%
3%1.4%3%
1%
42%
2011 Increase of 1-2%Increase of 3-4%Increase of 5-6% Increase of 7-10%
Increase of 11% or moreNo change
Decrease
44%17%
6%2%2%
2%
28%
SALARY SURVEY
FM WORLD | 2012 | 9
consultant as their job title earned between £61,000 and £91,000, with some on even more than that. However, a more representative 60 per cent earn in either the £36-45,000 or £46-60,000 brackets.
How often do FMs change jobs? FM remains a very mobile sector. Facilities professionals move jobs regularly to increase their experience, skills and salary prospects. But there are signs that economic uncertainty has dampened FMs’ enthusiasm for moving quite as frequently between employers as they may have done in the past.
We’ve remarked in previous salary surveys that employees of service providers switch employers more frequently than their in-house counterparts. For the seventh year running, this continues to be the case. We’ve previously stated that supply side employees were naturally more likely to move jobs because of the pace of change in the service provider market, not least the routine effect of contract gains and losses. Yet while lack of management support is cited more often by those on the supply side as a reason for seeking a change, it’s the only significant indicator of a difference in outlook between the two principal types of facilities professional. This year, more in-house respondents felt that pay and benefits would drive them onto the jobs market than their supply-side counterparts, almost certainly the impact of much tighter pay control in the public sector. For those on the supply side, issues such as the stress of their existing job, and how likely it was that their existing jobs would still be required in the near future, had greater resonance.
Last year we started to ask respondents about how long they expected to work with their current organisation. This year, 16 per cent of respondents told us they expected to be moving on within six to 12 months (down from 20 per cent), while another 10 per cent expected to be moving on within 12 to 18 months. All told, 45 per cent of respondents couldn’t see themselves working for the same employer beyond two years.
These aspirations jar slightly with the recent reality of how long FMs have stayed with their existing employer. Over the last three years, the number of respondents telling us they’d been with their employers for less than two years has edged steadily downwards, indicating employees’ desire for job stability. In 2009, 29 per cent had only been with their employers for two years or less, a figure that dropped to 20 per cent in 2010 and is now down to just 16 per cent. It’s also worth noting that twice as many women as men had been with their employer for less than twelve months.
Increase of 1-2% – 45%Increase of 3-4% – 16%Increase of 5-6% – 4%Increase of 7-10% – 6%Increase of 11% or more – 4%No Change – 23%Decrease – 2%
CHART 9 PAY RISES RECEIVED BY SUPPLY SIDE FMS
Increase of 1-2% – 32%Increase of 3-4% – 19% Increase of 5-6% – 6% Increase of 7-10% – 3% Increase of 11% or more – 3%No change – 35% Decrease – 1%
CHART 10 PAY RISES RECEIVED BY CLIENT SIDE FMS
None – 33%Up to £999 – 11%£1000 - £4,999 – 25% £5,000 - £9,999 – 16% £10,000 - £14,999 – 8% £15,000 - £19,999 – 3%£20,000 - £29,999 – 2% More than £30,000 – 4%
CHART 11 BONUSES RECEIVED BY SUPPLY SIDE FMS
None – 53%Up to £999 – 8%£1000 - £4,999 – 23% £5,000 - £9,999 – 9% £10,00019,999 – 4%£15,000 - £19,999 – 1% £20,000 - £29,999 – 1% More than £30,000 – 1%
CHART 12 BONUSES RECEIVED BY CLIENT SIDE FMS
Bonuses received by supply side FMs
None 33Up to £999 11£1,000 - £4,999 25£5,000 - £9,999 16£10,000 - £14,999 8£15,000 - £19,999 3£20,000 - £29,999 2£30,000+ 4
Bonuses received by client side FMs
None 53Up to £999 8£1,000 - £4,999 23£5,000 - £9,999 9£10,000 - £14,999 4£15,000 - £19,999 1£20,000 - £29,999 1£30,000+ 1
FM research SALARY SURVEY
10 | 2012 | FM WORLD
There is perhaps surprisingly little difference between supply-side and in-house FMs in terms of the years they’ve spent at the same employer. 26 per cent of our sample had been with their supply side employer for between two and four years, but surprisingly just 15 per cent of in-house FMs had been with their organisation for the same period. At 4-6 years, this is reversed; 18 per cent of supply side and 23 per cent of client-side FMs fit this bracket. It’s also worth noting that we only had 2 per cent of supply-side respondents able to boast of more than 20 years with the same employer. So much for the gold clock upon retirement! By contrast, 15 per cent of in-house FMs could boast more than 14 years with the same company, 9 per cent having completed two decades of service.
So what are the reasons that FMs give for wanting to leave their existing employer? Lack of career opportunity continues to be the principal reason, cited by 24 per cent of our respondents (up from 21 per cent last year). Expected redundancy was the reason cited by 4 per cent of those on the supply side and a more telling 11 per cent on the client-side, perhaps reflecting the mood of those providing FM in the public sector services. Interestingly, more supply-side than client-side respondents cited ‘lack of management support’ as a particular issue for them. 15 per cent of respondents expressed dissatisfaction with their current pay and benefits, while 5 per cent expected their existing role was likely to change.
We also asked people why they were planning to stay with their employer for the next year or more (Chart 7). An increasing number said that they were actually enjoying working with their current employer – up from 40 per cent in 2010 to 45 per cent this year. Perhaps unsurprisingly, a quarter of those asked cited job security in the current economic climate as a major factor – although that figure is down considerably on the almost a third who cited it as their main reason for staying in our last survey.
There are some marked variations between the supply and client sides. Less than 2 per cent say they are staying at their service supplier employer to achieve their full pension entitlement – but 11 per cent of those on the client-side cite that as their main reason for staying put, suggesting that those in the public sector are in some cases holding on for dear life in a changing jobs market that could have a significant and permanent effect on the sector.
It’s worth mentioning that more women than men cite ‘enjoying working for my employer’ as a reason for staying – 52 per cent compared to 45 per cent for men. The only other gender-specific observation here is that while nearly 7 per cent of men cited salary and benefits package as a key reason for staying, just 2 per cent of women thought the same.
0% 20% 40% 60% 80% 100%
Service provider
In-housePaid overtime
Pro�t share / sharesave
Performance-related bonus
Guaranteed bonus
Health plan
Pension scheme
Petrol allowance
Company car or allowance
CHART 13 WHAT BENEFITS DO YOU RECEIVE?
70%
26%
32%
18%
81%
89%
62%
50%
7%
1%
62%
42%
26%
17%
5%
17%
0% 20% 40% 60% 80% 100%
Service provider
In-housePaid overtime
Pro�t share / sharesave
Performance-related bonus
Guaranteed bonus
Health plan
Pension scheme
Petrol allowance
Company car or allowance
CHART 13 WHAT BENEFITS DO YOU RECEIVE?
70%
26%
32%
18%
81%
89%
62%
50%
7%
1%
62%
42%
26%
17%
5%
17%
20% 40% 60% 80% 100%
Agree
Disagree
CHART 14 DO YOU AGREE WITH THE FOLLOWING STATEMENTS?
My employer:
O�ers excellent succession planning and
career opportunities
Always encourages equal opportunities and diversity
Has a highturnover of sta�
Has a high degree of sta� morale and a strong sense
of belonging
Does everything to empower sta� wherever
possible in order to make their own decisions
Has a strong public image and performs well against
competitors
O�ers exit interviews to all sta� who
leave the company
O�ers a competitive salary and package compared to other
organisations in the facilities market
O�ers sta� the opportunity to work
�exibly, both in terms of time and location, where
possible
SALARY SURVEY
FM WORLD | 2012 | 11
There are some unsurprising priorities in the list of reasons why respondents joined their current employer. 12 per cent moved to take up a more senior position and move their career forward, while 13 per cent were attracted by a better salary and/or benefits package. (More supply-side respondents than client-side moved to their current employer for that reason). Close to 30 per cent of those surveyed joined for what they perceived to be a fresh challenge, and twice as many of those now working in-house moved into their role from a period of unemployment. An understandably larger number of supply side respondents – 10 per cent compared to an in-house 3 per cent – had taken up their current role as a direct result of a merger or acquisition affecting their previous employer. Corporate reputation and the perception of better long-term prospects were valued equally by both types of facilities professional.
Features elsewhere in FM World attest to the demographic issues facing facilities management, and our 2012 salary survey responses reinforce the message: FM is too heavily weighted in favour of the very experienced. 83 per cent of respondents have worked in the sector for six years or more, two thirds for more than nine years. More than a fifth of respondents have been in facilities management for more than 20 years.
And it doesn’t get better when looked at from the other end of the spectrum: slightly more than 3 per cent of respondents had been in FM for less than two years, following a steady downwards trend; in 2010 this figure was 4 per cent, 5 per cent in 2009 and 6 per cent in 2008. When focusing on respondents in different age groups, it’s clear that many young people between 18-35 years don’t stay in the sector beyond their first four years. Is this down to lack of perceived career opportunities or a clearly defined qualifications roadmap? Certainly the latter has been refined in recent years; hopefully our 2013 survey will show some evidence that the stronger professional development structure in the sector is bearing fruit.
All of this is the reason for FM World’s continuing campaign to make more young people aware of the joys of a career in FM. Last year we published the second edition of our FM World Guide to Careers in Facilities Management – a third and possibly fourth edition will follow later this year.
Interestingly, nearly three times as many women as men have entered the profession in the last two years, while more women than men indicated that they now had between 4-6 years’ experience in the sector. This change in the demographic profile of emerging talent in the sector is a welcome one that, if it remains on trend, will lead to a very different make-up of the facilities profession by the year 2030.
20%10% 30% 50%0% 40% 60% 70% 80%
CHART 15 MOST IMPORTANT FACTORS IN A JOB?
Career prospects
Salary
Location
Degree of responsibility
Job security
Training
Challenging / interesting work
Fringe bene�ts/perks
Physical workingenvironment
Recognition
Relationship with colleagues
Holiday entitlement
Final salary pension
Health cover
Opportunity to work �exibly
20102011
2009
2008
FM research SALARY SURVEY
12 | 2012 | FM WORLD
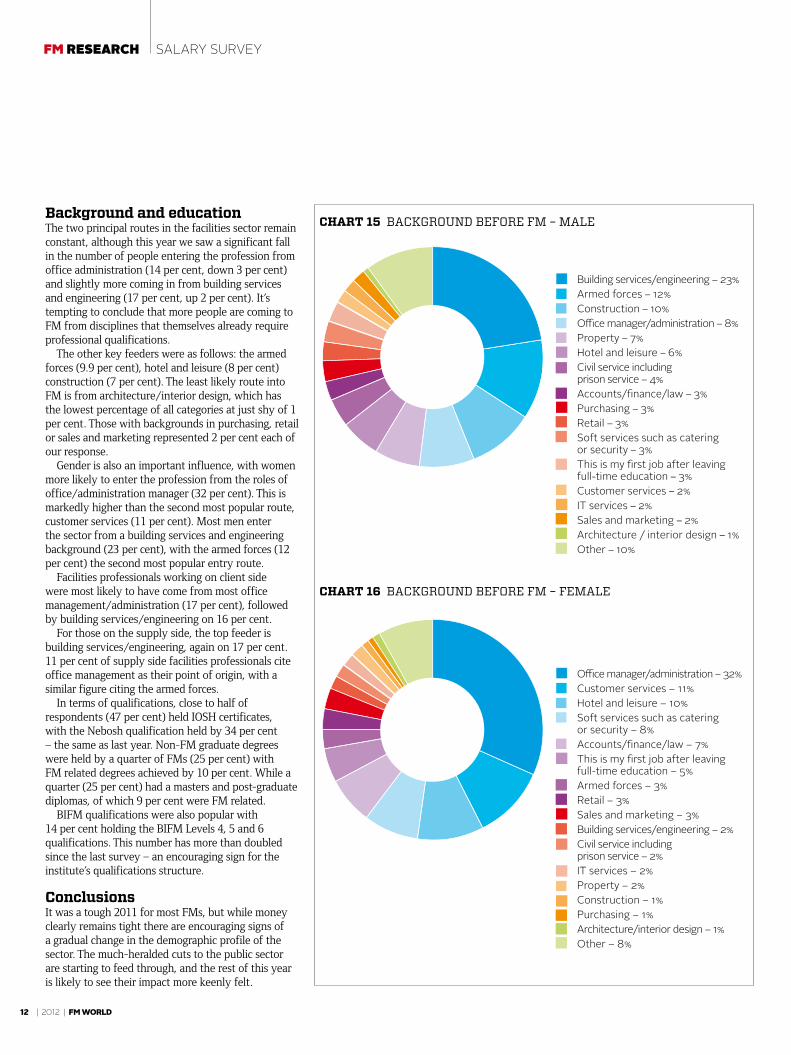
CHART 15 BACKGROUND BEFORE FM – MALE
Building services/engineering – 23%Armed forces – 12%Construction – 10%Office manager/administration – 8%Property – 7%Hotel and leisure – 6%Civil service including prison service – 4%Accounts/finance/law – 3%Purchasing – 3%Retail – 3%Soft services such as catering or security – 3%This is my first job after leaving full-time education – 3%Customer services – 2%IT services – 2%Sales and marketing – 2%Architecture / interior design – 1%Other – 10%
Office manager/administration – 32%Customer services – 11%Hotel and leisure – 10%Soft services such as catering or security – 8%Accounts/finance/law – 7%This is my first job after leaving full-time education – 5%Armed forces – 3%Retail – 3%Sales and marketing – 3%Building services/engineering – 2%Civil service including prison service – 2%IT services – 2%Property – 2%Construction – 1%Purchasing – 1%Architecture/interior design – 1%Other – 8%
CHART 16 BACKGROUND BEFORE FM – FEMALE
Background and educationThe two principal routes in the facilities sector remain constant, although this year we saw a significant fall in the number of people entering the profession from office administration (14 per cent, down 3 per cent) and slightly more coming in from building services and engineering (17 per cent, up 2 per cent). It’s tempting to conclude that more people are coming to FM from disciplines that themselves already require professional qualifications.
The other key feeders were as follows: the armed forces (9.9 per cent), hotel and leisure (8 per cent) construction (7 per cent). The least likely route into FM is from architecture/interior design, which has the lowest percentage of all categories at just shy of 1 per cent. Those with backgrounds in purchasing, retail or sales and marketing represented 2 per cent each of our response.
Gender is also an important influence, with women more likely to enter the profession from the roles of office/administration manager (32 per cent). This is markedly higher than the second most popular route, customer services (11 per cent). Most men enter the sector from a building services and engineering background (23 per cent), with the armed forces (12 per cent) the second most popular entry route.
Facilities professionals working on client side were most likely to have come from most office management/administration (17 per cent), followed by building services/engineering on 16 per cent.
For those on the supply side, the top feeder is building services/engineering, again on 17 per cent. 11 per cent of supply side facilities professionals cite office management as their point of origin, with a similar figure citing the armed forces.
In terms of qualifications, close to half of respondents (47 per cent) held IOSH certificates, with the Nebosh qualification held by 34 per cent – the same as last year. Non-FM graduate degrees were held by a quarter of FMs (25 per cent) with FM related degrees achieved by 10 per cent. While a quarter (25 per cent) had a masters and post-graduate diplomas, of which 9 per cent were FM related.
BIFM qualifications were also popular with 14 per cent holding the BIFM Levels 4, 5 and 6 qualifications. This number has more than doubled since the last survey – an encouraging sign for the institute’s qualifications structure.
ConclusionsIt was a tough 2011 for most FMs, but while money clearly remains tight there are encouraging signs of a gradual change in the demographic profile of the sector. The much-heralded cuts to the public sector are starting to feed through, and the rest of this year is likely to see their impact more keenly felt.


