140
Water Year 2012 Seawater Intrusion Analysis Report Seaside Basin, Monterey County California Prepared for: Seaside Basin Watermaster November 2012 Prepared by:

Water Year 2012
Seawater Intrusion Analysis Report
Seaside Basin, Monterey County
California
Prepared for:
Seaside Basin Watermaster
November 2012
Prepared by:


WY 2012 Seawater Intrusion Analysis Report
November 30, 2012 - i -
TABLE OF CONTENTS
Table of Figures .......................................................................................iii
Tables ........................................................................................................ iv
Abbreviations ........................................................................................... v
Conversions .............................................................................................. v
Executive Summary ................................................................................. 1
SECTION 1 Background and Introduction ............................................ 5
SECTION 2 Overview of Seawater Intrusion ......................................... 7
Groundwater Pumping and Seawater Intrusion ................................................... 9
Indicators of Seawater Intrusion ........................................................................... 10
Cation/Anion Ratios ........................................................................................... 11
Increasing Chloride Concentrations.................................................................. 16
Sodium/Chloride Molar Ratios .......................................................................... 16
Chloride-Bicarbonate Ratios .............................................................................. 19
Electric Induction Logs ....................................................................................... 19
Other Indicators .................................................................................................. 20
SECTION 3 Seawater Intrusion in the Seaside Groundwater Basin ..21
Analysis Approach ................................................................................................. 21
Cation/Anion Ratios ............................................................................................... 21
Second Quarter Water Year 2012 (January-March 2012) ................................. 22
Fourth Quarter Water Year 2012 (July-August 2012) ...................................... 23
Chloride Concentrations ........................................................................................ 25
Trends .................................................................................................................. 25
Chloride Concentration Maps ........................................................................... 38
Sodium/Chloride Molar Ratios ............................................................................. 39
Electric Induction Logs .......................................................................................... 42
Groundwater Levels ............................................................................................... 45
Trends .................................................................................................................. 45
Groundwater Elevation Maps ........................................................................... 46
Pumping .................................................................................................................. 53
Protective Groundwater Elevations ...................................................................... 56
WY 2012 Seawater Intrusion Analysis Report
November 30, 2012 - ii -
SECTION 4 Conclusions ..........................................................................62
SECTION 5 Recommendations ................................................................66
Analyze Data from PCA-West Deep Quarterly ............................................... 66
Initiate Quarterly Water Quality Sampling and Analysis for Sentinel Well
SBWM-4 ............................................................................................................... 66
Watermaster to Request Complete Sample Analysis for Production Wells .. 67
Continue to Analyze and Report on Water Quality Annually ....................... 67
Refine Preliminary Shallow Protective Groundwater Elevations .................. 67
SECTION 6 References .............................................................................68
Appendix A: Piper Diagrams for Individual Wells
Appendix B: Chloride and Sodium/Chloride Ratio Graphs

WY 2012 Seawater Intrusion Analysis Report
November 30, 2012 - iii -
TABLE OF FIGURES
Figure 1: Seawater Wedge in a Simple Coastal Aquifer (from Barlow, 2003) ......... 7
Figure 2: Seawater Wedge in a Layered Coastal Aquifer (from Barlow, 2003) ...... 8
Figure 3: Interface Migration in Response to Groundwater Pumping (from
Barlow, 2003) ................................................................................................... 10
Figure 4: Piper Diagram for Groundwater in Pajaro Valley (Data source:
PVWMA) ......................................................................................................... 13
Figure 5: Piper Diagram for Groundwater in Salinas Valley (Source:
MCWRA) ......................................................................................................... 14
Figure 6: Stiff Diagrams from Salinas Valley Wells without Seawater
Intrusion (Source: MWCRA) ......................................................................... 15
Figure 7: Stiff Diagrams from Salinas Valley Wells with Seawater Intrusion
(Source: MWCRA) .......................................................................................... 15
Figure 8: Historical Chloride Concentrations and Sodium/Chloride Ratios for
a Well in Salinas Valley Showing Incipient Intrusion (Source:
MCWRA) ......................................................................................................... 17
Figure 9: Historical Chloride Concentrations and Sodium/Chloride Ratios for
a Well in Pajaro Valley Showing Incipient Intrusion (Data source:
PVWMA) ......................................................................................................... 18
Figure 10: Wells Used for Current Seawater Intrusion Analyses ........................... 26
Figure 11: Piper Diagram for Seaside Groundwater Basin Monitoring Wells,
2nd Quarter Water Year 2012 (January-March 2012)..................................... 27
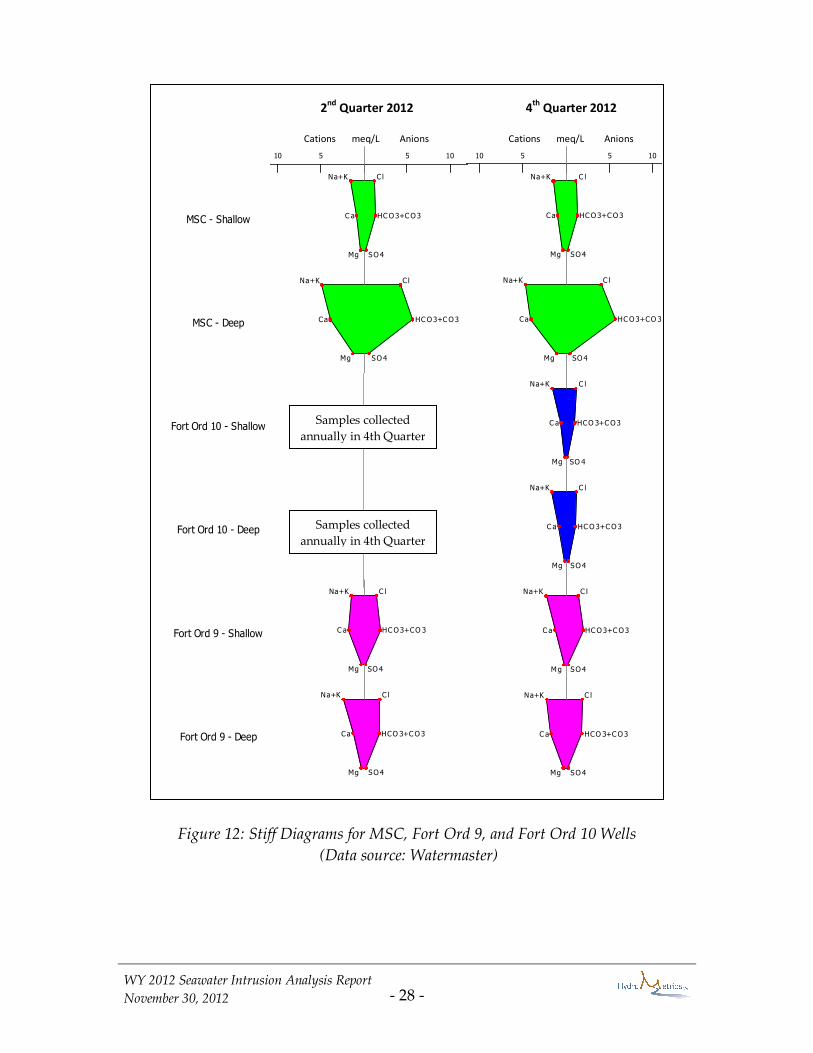
Figure 12: Stiff Diagrams for MSC, Fort Ord 9, and Fort Ord 10 Wells (Data
source: Watermaster) ...................................................................................... 28
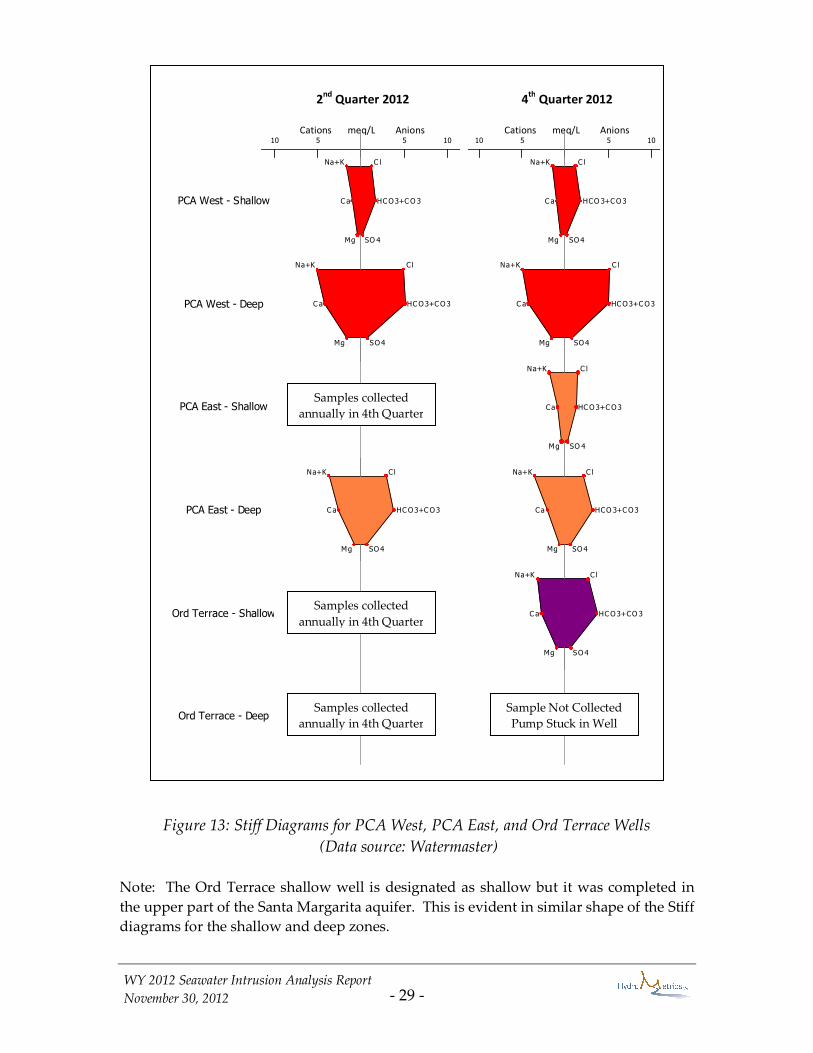
Figure 13: Stiff Diagrams for PCA West, PCA East, and Ord Terrace Wells
(Data source: Watermaster)............................................................................ 29
Figure 14: Stiff Diagrams for Watermaster Monitoring Wells 1 - 3 (Data
source: Watermaster) ...................................................................................... 30
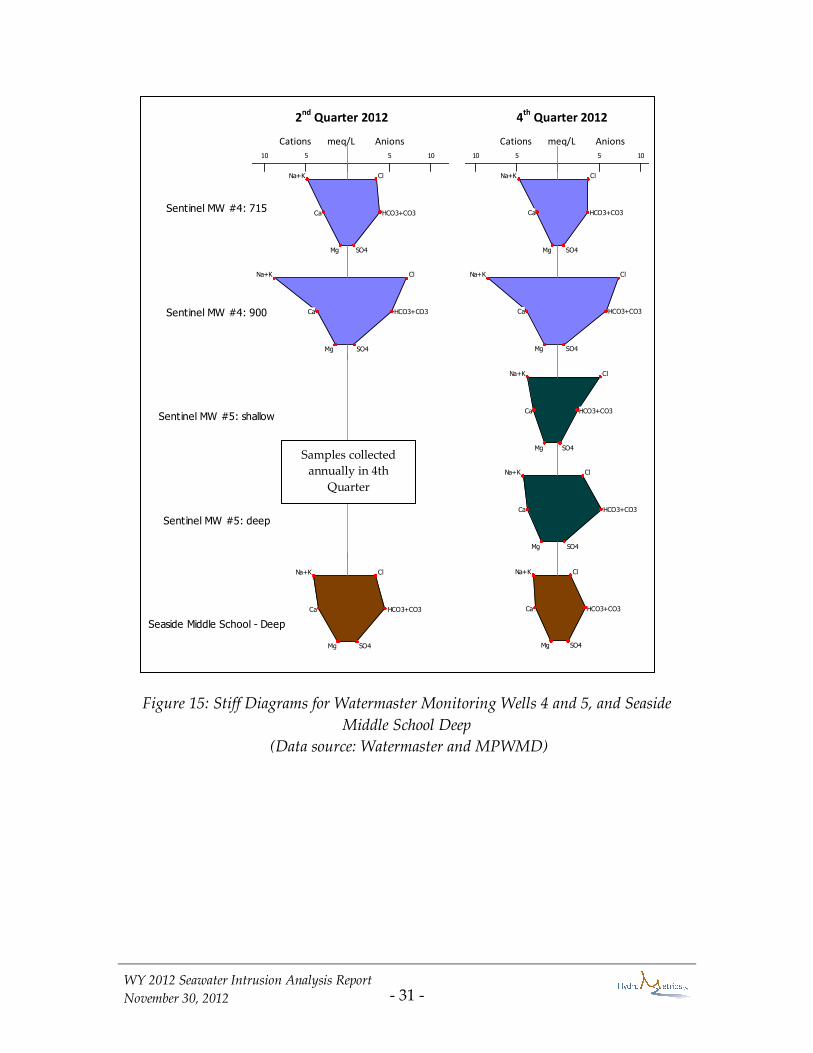
Figure 15: Stiff Diagrams for Watermaster Monitoring Wells 4 and 5, and
Seaside Middle School Deep .......................................................................... 31
Figure 16: Piper Diagram for Seaside Groundwater Basin Monitoring Wells,
4th Quarter Water Year 2012 (July-August 2012) ......................................... 32
Figure 17: Piper Diagram for Seaside Groundwater Basin Production Wells,
4th Quarter Water Year 2012 (July-August 2012) (Data source:
Watermaster) ................................................................................................... 33
Figure 18: Stiff Diagrams for Southern Coastal and Inland Subarea
Production Wells ............................................................................................. 34
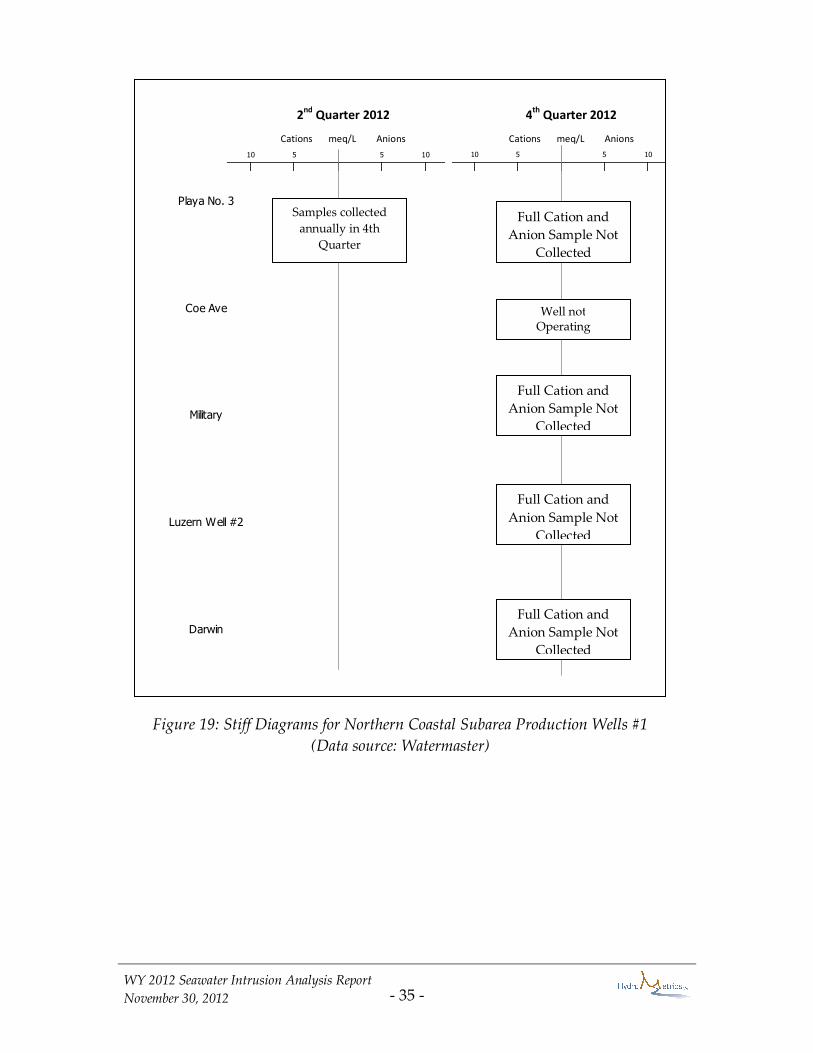
Figure 19: Stiff Diagrams for Northern Coastal Subarea Production Wells #1 ..... 35
WY 2012 Seawater Intrusion Analysis Report
November 30, 2012 - iv -
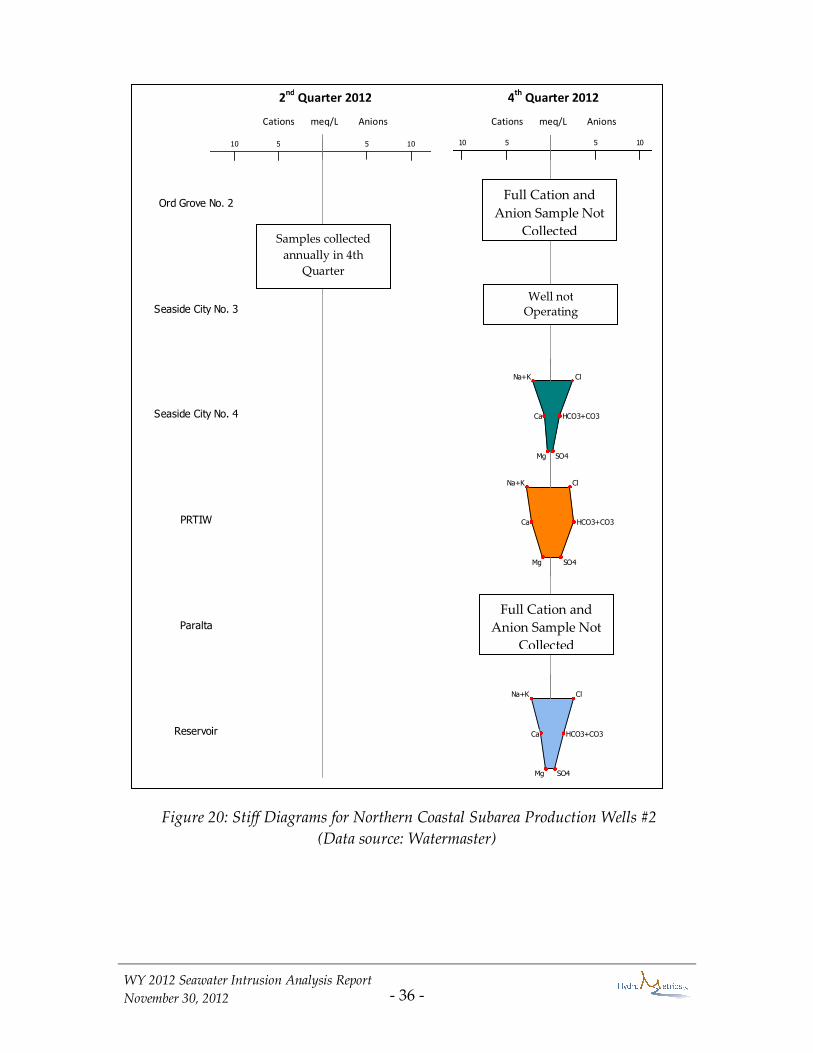
Figure 20: Stiff Diagrams for Northern Coastal Subarea Production Wells #2 ..... 36
Figure 21: Historical Chloride and Sodium/Chloride Molar Ratios, Shallow
PCA West Well ................................................................................................ 37
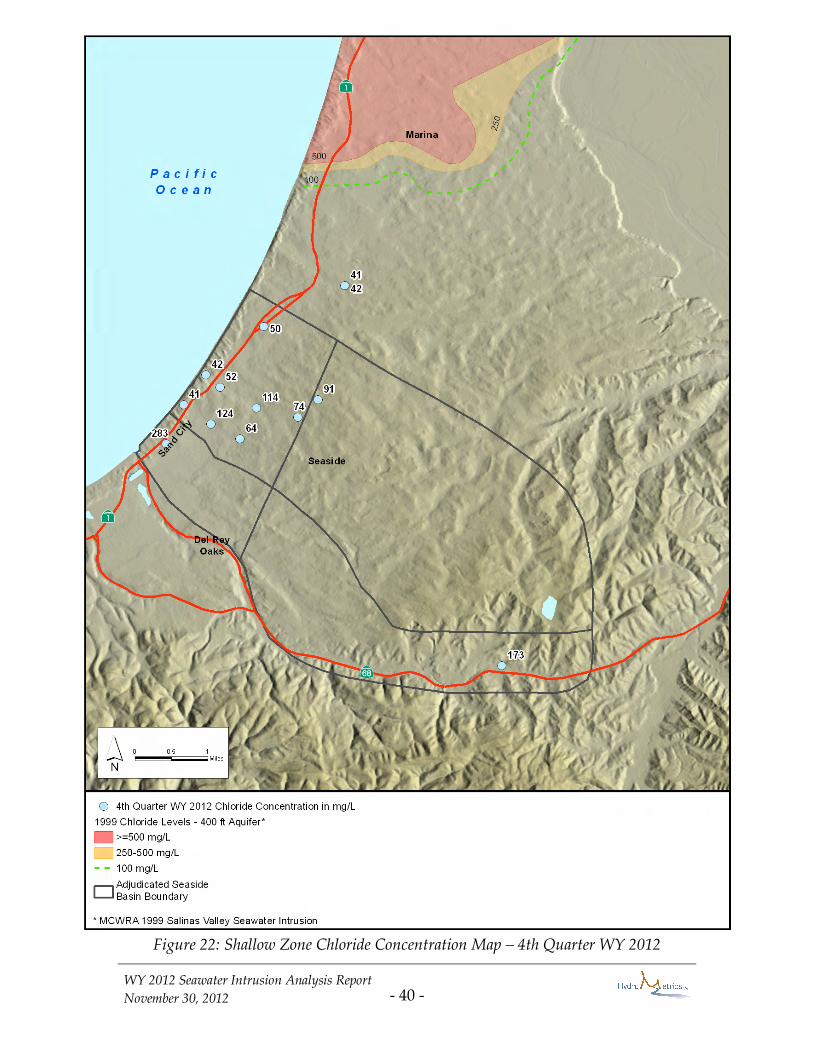
Figure 22: Shallow Zone Chloride Concentration Map – 4th Quarter WY 2012 ... 40
Figure 23: Deep Zone Chloride Concentration Map – 4th Quarter WY 2012 ......... 41
Figure 24: Sentinel Well Induction Log .................................................................... 44
Figure 25: Example Hydrographs (Source: Watermaster) ...................................... 48
Figure 26: Shallow Zone Water Elevation Map – 2nd Quarter WY 2012
(January-March 2012) ..................................................................................... 49
Figure 27: Deep Zone Water Elevation Map – 2nd Quarter WY 2012 (January-
March 2012) ..................................................................................................... 50
Figure 28: Shallow Zone Water Elevation Map – 4th Quarter WY 2012
(July/August 2012) .......................................................................................... 51
Figure 29: Deep Zone Water Elevation Map – 4th Quarter WY 2012
(July/August 2012) .......................................................................................... 52
Figure 30: Watermaster Producers’ Pumping Distribution for Water Years
2011 and 2012 .................................................................................................. 54
Figure 31: Annual Reported Groundwater Production and Operating Yield
for Watermaster Producers ............................................................................ 55
Figure 32: MSC Deep and Shallow Groundwater and Preliminary Protective
Elevations ........................................................................................................ 58
Figure 33: PCA West Deep and Shallow Groundwater and Preliminary
Protective Elevations ...................................................................................... 59
Figure 34: CDM-MW4 Groundwater and Preliminary Protective Elevations ...... 60
Figure 35: Sentinel Well 3 Groundwater and Preliminary Protective
Elevations ........................................................................................................ 60
Figure 36: Possible Processes Limiting Seawater Intrusion .................................... 65
Figure 37: Piper Diagram of SBMW-5 Shallow Well ............................................... 21
Figure 38: Piper Diagram of SBMW-5 Deep Well .................................................... 22
TABLES
Table 1: Summary of Preliminary Protective Elevation Monitoring Locations .... 56
WY 2012 Seawater Intrusion Analysis Report
November 30, 2012 - v -
ABBREVIATIONS
ASR ......................................aquifer storage and recovery
bgs ........................................below ground surface
Ca .........................................calcium
CAW ....................................California American Water
Cl ..........................................chloride
CO3 .......................................carbonate
FO.........................................Fort Ord
HCO3 ....................................bicarbonate
K ...........................................potassium
MCWRA ..............................Monterey County Water Resources Agency
meq/L ...................................milliequivalent per liter
Mg ........................................magnesium
mg/L .....................................milligrams per liter
MPWMD .............................Monterey Peninsula Water Management District
MSC .....................................Monterey Sand Company
Na.........................................sodium
PCA ......................................Pacific Cement Aggregates
PVWMA ..............................Pajaro Valley Water Management Agency
SBMMP ................................Seaside Groundwater Basin Monitoring and
Management Program
SO4........................................sulfate
TAC ......................................Technical Advisory Committee
WY .......................................Water Year
CONVERSIONS
1 acre-foot = 325,851 gallons
1 mg/L ≈ 1 part per million

WY 2012 Seawater Intrusion Analysis Report
November 30, 2012 - vi -
This page left
intentionally blank
- 1 - WY 2012 Seawater Intrusion Analysis Report
November 30, 2012
EXECUTIVE SUMMARY
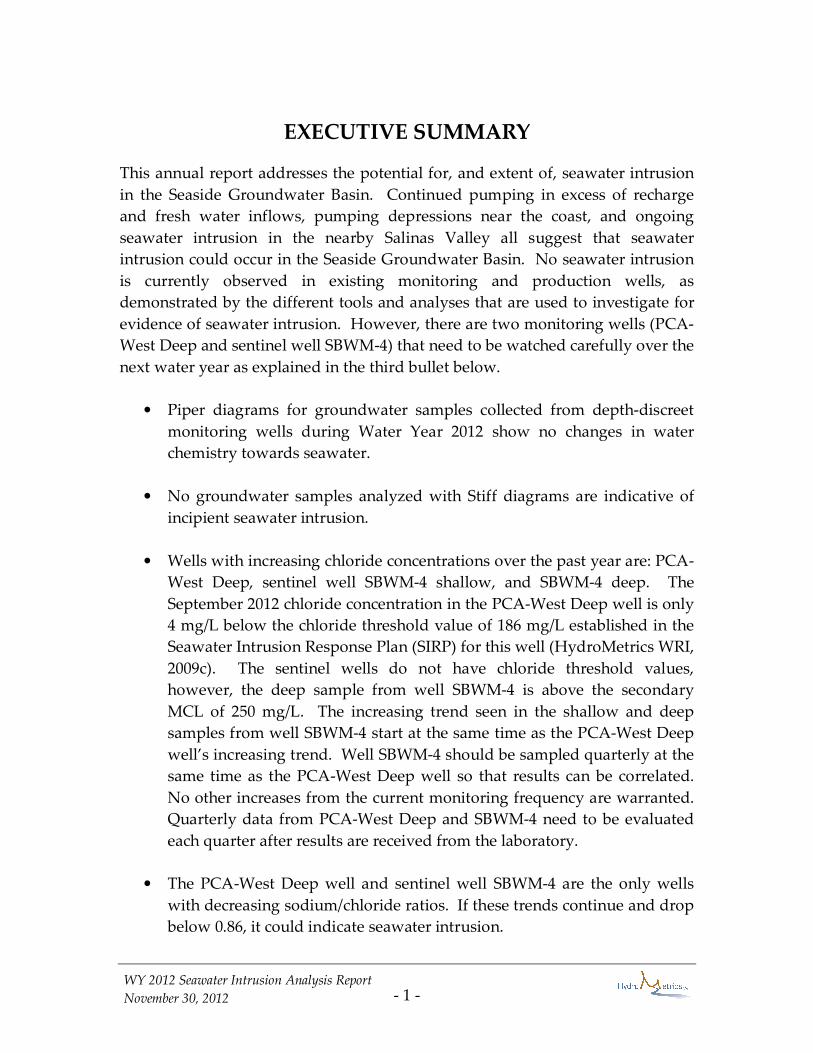
This annual report addresses the potential for, and extent of, seawater intrusion
in the Seaside Groundwater Basin. Continued pumping in excess of recharge
and fresh water inflows, pumping depressions near the coast, and ongoing
seawater intrusion in the nearby Salinas Valley all suggest that seawater
intrusion could occur in the Seaside Groundwater Basin. No seawater intrusion
is currently observed in existing monitoring and production wells, as
demonstrated by the different tools and analyses that are used to investigate for
evidence of seawater intrusion. However, there are two monitoring wells (PCA-
West Deep and sentinel well SBWM-4) that need to be watched carefully over the
next water year as explained in the third bullet below.
• Piper diagrams for groundwater samples collected from depth-discreet
monitoring wells during Water Year 2012 show no changes in water
chemistry towards seawater.
• No groundwater samples analyzed with Stiff diagrams are indicative of
incipient seawater intrusion.
• Wells with increasing chloride concentrations over the past year are: PCA-
West Deep, sentinel well SBWM-4 shallow, and SBWM-4 deep. The
September 2012 chloride concentration in the PCA-West Deep well is only
4 mg/L below the chloride threshold value of 186 mg/L established in the
Seawater Intrusion Response Plan (SIRP) for this well (HydroMetrics WRI,
2009c). The sentinel wells do not have chloride threshold values,
however, the deep sample from well SBWM-4 is above the secondary
MCL of 250 mg/L. The increasing trend seen in the shallow and deep
samples from well SBWM-4 start at the same time as the PCA-West Deep
well’s increasing trend. Well SBWM-4 should be sampled quarterly at the
same time as the PCA-West Deep well so that results can be correlated.
No other increases from the current monitoring frequency are warranted.
Quarterly data from PCA-West Deep and SBWM-4 need to be evaluated
each quarter after results are received from the laboratory.
• The PCA-West Deep well and sentinel well SBWM-4 are the only wells
with decreasing sodium/chloride ratios. If these trends continue and drop
below 0.86, it could indicate seawater intrusion.

- 2 - WY 2012 Seawater Intrusion Analysis Report
November 30, 2012
• Maps of chloride concentrations for the shallow aquifer do not show
chlorides increasing towards the coast. The deep aquifer maps show that
higher chloride concentrations are limited to coastal monitoring wells
PCA-West Deep and sentinel well SBWM-4.
• Although production wells have a different water quality than the
monitoring wells, this is probably as a result of them being screened
across both shallow and deep zones. The production well water qualities
are not indicative of seawater intrusion.
• Induction logging data at the coastal Sentinel wells do not indicate
changes indicative of seawater intrusion.
• Groundwater levels continue to be below preliminary protective
elevations in the deep coastal target monitoring wells for which
protective elevations were developed (MSC deep, PCA-West, and Sentinel
Well 3). Two of the three shallow wells’ groundwater levels are above
protective elevations: PCA-W shallow and CDM-MW4. MSC shallow
remains below preliminary protective elevations.
Based on the findings of this report, the following recommendations should be
implemented to continue to monitor and track potential seawater intrusion.
1. Analyze Data from PCA-West Deep Quarterly
Increasing chloride concentrations, decreasing sodium/chloride molar
ratio, and chloride concentrations approaching the chloride threshold
justify increasing how often data from well PCA-West Deep is evaluated.
In the past, access issues due windblown sands from the nearby dunes
have prevented sampling in the first quarter of the water year. However,
every effort must be made to collect a sample in the first quarter of WY
2013 to confirm the observed trends. Additionally, due to a change in
sampling method from airlifting to micropurging in 2009, it would be
prudent to collect samples using both methods to verify whether the
change in water quality is an artifact of the sampling method. After each
quarterly sampling event at this well, the data must be analyzed and
documented.
2. Initiate Quarterly Water Quality Sampling and Analysis for Sentinel
Well SBWM-4

- 3 - WY 2012 Seawater Intrusion Analysis Report
November 30, 2012
Because nearby monitoring well PCA-West Deep has an increasing
chloride trend with decreasing sodium/chloride molar ratio which
matches the trends observed in SBWM-4, sampling at SBWM-4 needs to
increase its sampling frequency from semi-annual to quarterly so that a
direct comparison can be made with the quarterly samples collected at
PCA-West Deep.
3. Evaluate Water Quality at Sand City Public Works Corp Yard Well
Due to the evolving water type being observed in the Piper diagram, the
source of the irregular water quality at this well needs to be evaluated.
The Piper and Stiff diagrams, and sodium/chloride molar ratio suggest
that the source of high chloride is not seawater, however, this needs to be
confirmed with further investigation into historical water quality of the
area around the well.
4. Watermaster to Request Complete Sample Analysis for Production
Wells
When Watermater makes its annual request to producers for water quality
data, the request will state that full results from one sample are to be
reported. This ensures that the anions and cations balance and that
anion/cation analyses can be carried out for this report.
5. Continue to Analyze and Report on Water Quality Annually
Seawater intrusion is a threat, and data must be analyzed regularly to
identify incipient intrusion. Maps, graphs, and analyses similar to what
are found in this report should continue to be developed every year.
6. Refine Preliminary Protective Groundwater Elevations
Once the water supply parameters of the Coastal Water Project are better
defined, we recommend that the preliminary protective groundwater
elevations be refined using final calibrated aquifer properties from the
Seaside Basin groundwater flow model. It is expected that the protective
elevations will decrease by a few feet, which will make them more
practical to meet.

- 4 - WY 2012 Seawater Intrusion Analysis Report
November 30, 2012
This page left
intentionally blank
- 5 - WY 2012 Seawater Intrusion Analysis Report
November 30, 2012
SECTION 1
BACKGROUND AND INTRODUCTION
Historical and persistent low groundwater elevations caused by pumping in the
Seaside Groundwater Basin have led to concerns that seawater intrusion may
threaten the Basin’s groundwater resources. This report addresses the potential
for, and extent of, seawater intrusion in the Seaside Groundwater Basin. The
report first reviews seawater intrusion mechanisms, analyzes historical water
quality data for indications of seawater intrusion in the Seaside Groundwater
Basin, and finally reaches conclusions on the extent of seawater intrusion and
proposes recommendations for continued monitoring.
This report fulfills part of the annual reporting requirements contained in the
Seaside Groundwater Basin Adjudication (California American Water v. City of
Seaside, Monterey County Superior Court, Case Number M66343). The analyses
in this report were developed by HydroMetrics Water Resources Inc. of Oakland,
CA, in cooperation with members of the Watermaster Technical Advisory
Committee (TAC). Staff from the Monterey County Water Resources Agency
(MWCRA) and Monterey Peninsula Water Management District (MPWMD)
provided invaluable assistance, data, and review during the preparation of this
report.
This report is the fifth in a series of Seawater Intrusion Analysis Reports (SIAR)
which are produced annually by the Watermaster. It builds on the work
performed in the preceding SIARs.

- 6 - WY 2012 Seawater Intrusion Analysis Report
November 30, 2012
This page left
intentionally blank

- 7 - WY 2012 Seawater Intrusion Analysis Report
November 30, 2012
SECTION 2
OVERVIEW OF SEAWATER INTRUSION
Seawater intrusion is a threat to many coastal groundwater basins along the
California Coast. It has been observed and documented in a number of
groundwater basins in both southern and central California.
In general, groundwater in coastal basins flows from recharge areas in local
highlands towards discharge areas along the coast. In most undeveloped coastal
groundwater basins there is a net outflow of fresh water into the ocean.
Seawater intrusion occurs when the outflow of freshwater ceases and seawater
flows into the groundwater basin from the ocean.
In the simplest condition, seawater intrudes as a wedge beneath the fresh
groundwater (Figure 1). This wedge shape is a result of seawater being denser
than freshwater.
Figure 1: Seawater Wedge in a Simple Coastal Aquifer (from Barlow, 2003)
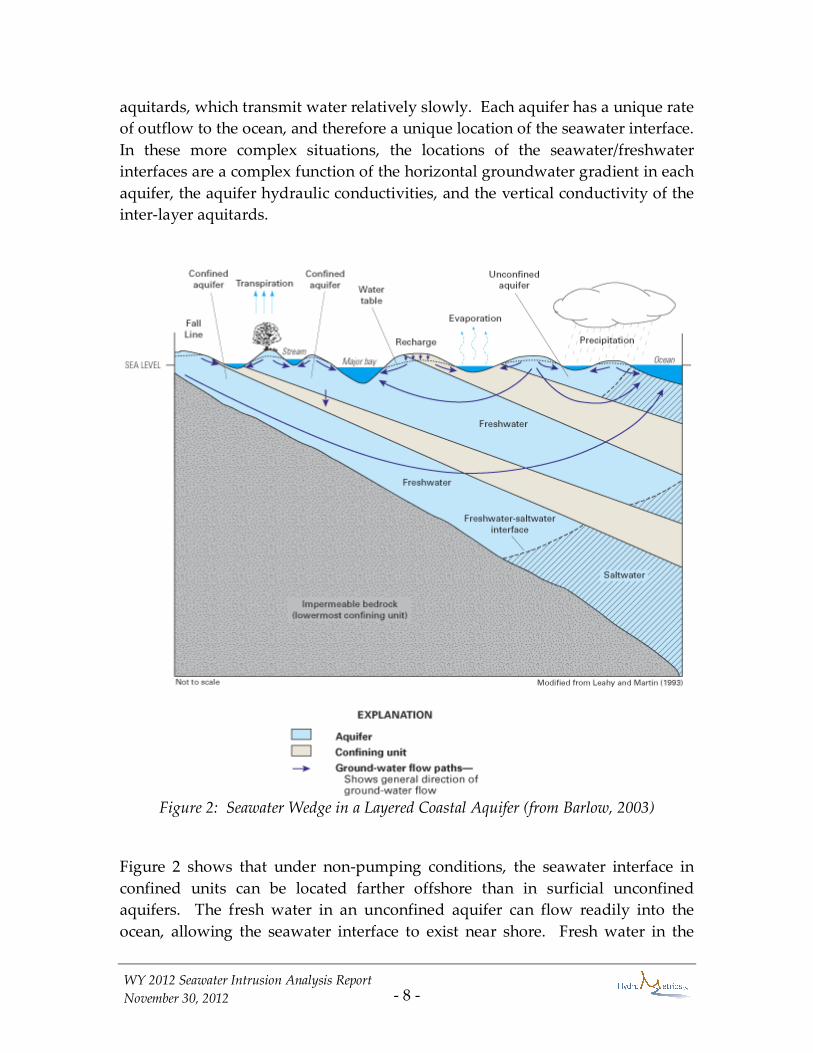
In more complex, layered groundwater systems, the location of the
seawater/freshwater interface may vary among the different aquifers. Such a
situation is illustrated in Figure 2. Figure 2 shows a series of aquifers in blue,
which transmit water easily. The aquifers are separated by a series of tan
- 8 - WY 2012 Seawater Intrusion Analysis Report
November 30, 2012
aquitards, which transmit water relatively slowly. Each aquifer has a unique rate
of outflow to the ocean, and therefore a unique location of the seawater interface.
In these more complex situations, the locations of the seawater/freshwater
interfaces are a complex function of the horizontal groundwater gradient in each
aquifer, the aquifer hydraulic conductivities, and the vertical conductivity of the
inter-layer aquitards.
Figure 2: Seawater Wedge in a Layered Coastal Aquifer (from Barlow, 2003)
Figure 2 shows that under non-pumping conditions, the seawater interface in
confined units can be located farther offshore than in surficial unconfined
aquifers. The fresh water in an unconfined aquifer can flow readily into the
ocean, allowing the seawater interface to exist near shore. Fresh water in the

- 9 - WY 2012 Seawater Intrusion Analysis Report
November 30, 2012
lower confined aquifers must seep out slowly through the overlying confining
units. The slow seepage rates allow the fresh water to maintain pressure beneath
the sea floor, pushing the seawater interface away from the coastline.
GROUNDWATER PUMPING AND SEAWATER INTRUSION
Pumping groundwater in a coastal aquifer reduces the amount of water
discharging to the ocean. Sufficient pumping can eliminate ocean discharges,
either locally or basin-wide, triggering seawater intrusion. The response of the
seawater interface to groundwater pumping is manifested in two related ways:
upconing and interface migration. Upconing refers to the ability of a pumping
well to draw seawater up from below. Upconing only occurs if seawater exists
directly below a pumping well. Because no seawater intrusion has been
observed in the Seaside Groundwater Basin, upconing cannot occur, and only
seawater interface migration will be further addressed in this report.
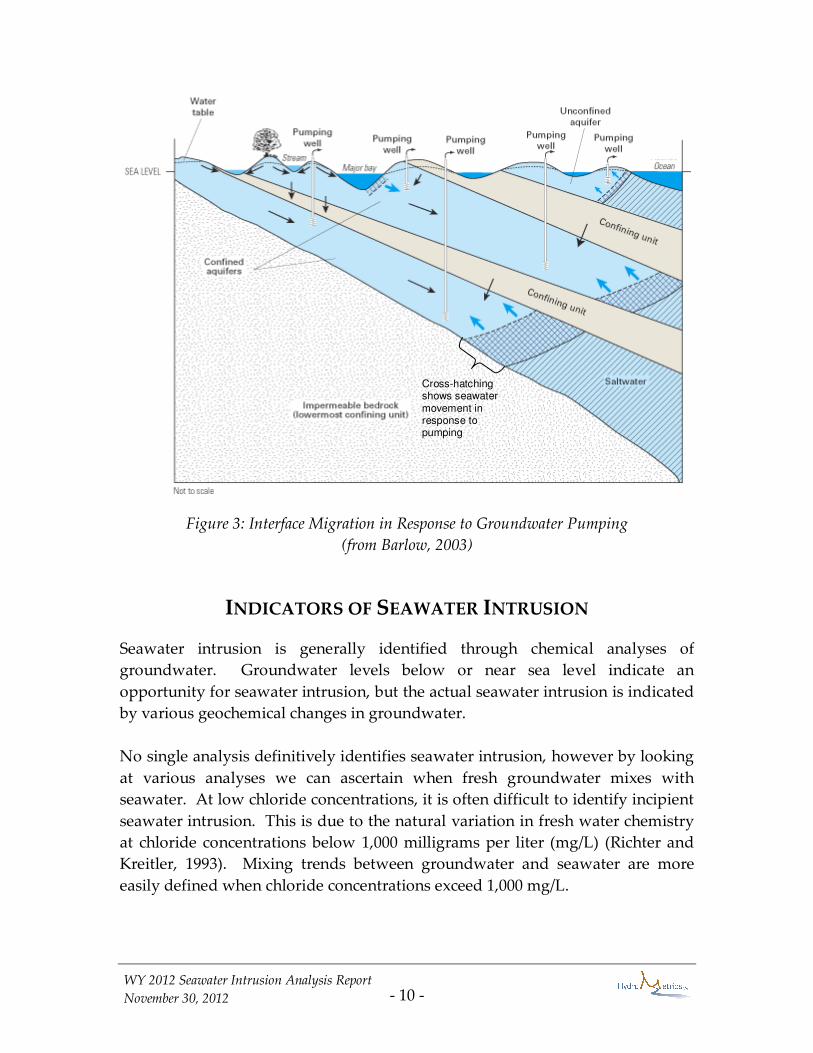
As mentioned earlier, groundwater pumping reduces the amount of fresh water
outflow to the ocean. This allows the interface to migrate shoreward.
Substantial pumping can allow the interface to move onshore, potentially
impacting municipal wells, private wells, or agricultural wells. Figure 3 shows a
two-dimensional cross section of how the fresh water/seawater interface may
migrate in response to pumping.
As can be inferred from Figure 3, the degree of interface migration depends on
the amount of water pumped from a particular aquifer, as well as the amount of
leakage from overlying or underlying aquifers. Groundwater extracted from the
lowest aquifer might be replaced by rainfall recharge, by seawater migrating
shoreward, or by groundwater leaking from the overlying aquifer.
An additional issue that must be considered with seawater interface migration is
the initial location of the seawater interface. An interface that starts far from the
shore may take a considerable amount of time, often on the order of decades, to
reach any production or monitoring well. Furthermore, the farther the interface
is from the pumping well, the more area is available for fresh water to leak from
overlying aquifers into the producing aquifer. This slows, or may completely
stop, seawater intrusion in the pumped aquifer. Downward leakage, however,
removes fresh water from overlying aquifers. This leakage may therefore
exacerbate seawater intrusion in the overlying aquifer.
- 10 - WY 2012 Seawater Intrusion Analysis Report
November 30, 2012
Figure 3: Interface Migration in Response to Groundwater Pumping
(from Barlow, 2003)
INDICATORS OF SEAWATER INTRUSION
Seawater intrusion is generally identified through chemical analyses of
groundwater. Groundwater levels below or near sea level indicate an
opportunity for seawater intrusion, but the actual seawater intrusion is indicated
by various geochemical changes in groundwater.
No single analysis definitively identifies seawater intrusion, however by looking
at various analyses we can ascertain when fresh groundwater mixes with
seawater. At low chloride concentrations, it is often difficult to identify incipient
seawater intrusion. This is due to the natural variation in fresh water chemistry
at chloride concentrations below 1,000 milligrams per liter (mg/L) (Richter and
Kreitler, 1993). Mixing trends between groundwater and seawater are more
easily defined when chloride concentrations exceed 1,000 mg/L.
Cross-hatching shows seawater movement in response to pumping
- 11 - WY 2012 Seawater Intrusion Analysis Report
November 30, 2012
Common geochemical indicators of seawater intrusion are discussed, and
example analyses are presented, in the following sections.
CATION/ANION RATIOS
Molar ratios of cations and anions can prove distinctive for various groundwater
systems. Seawater intrusion is often indicated by graphically analyzing shifts in
these molar ratios. Two common graphical techniques for these analyses are
Piper diagrams and Stiff diagrams.
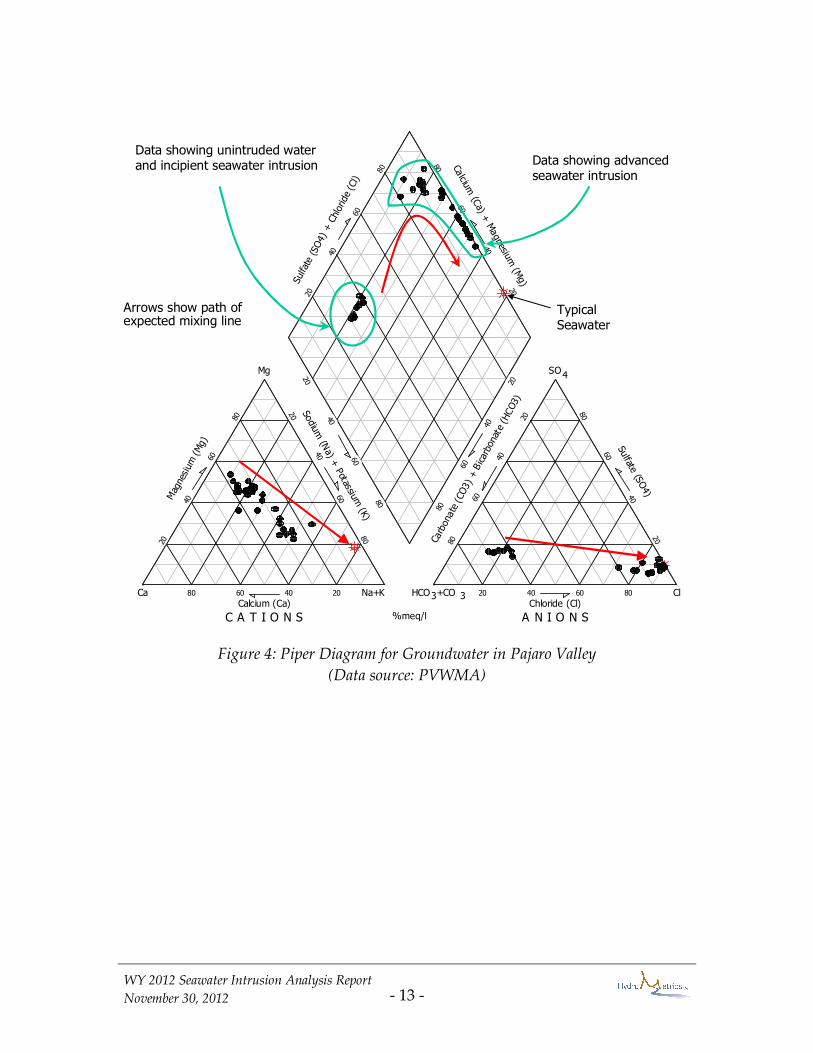
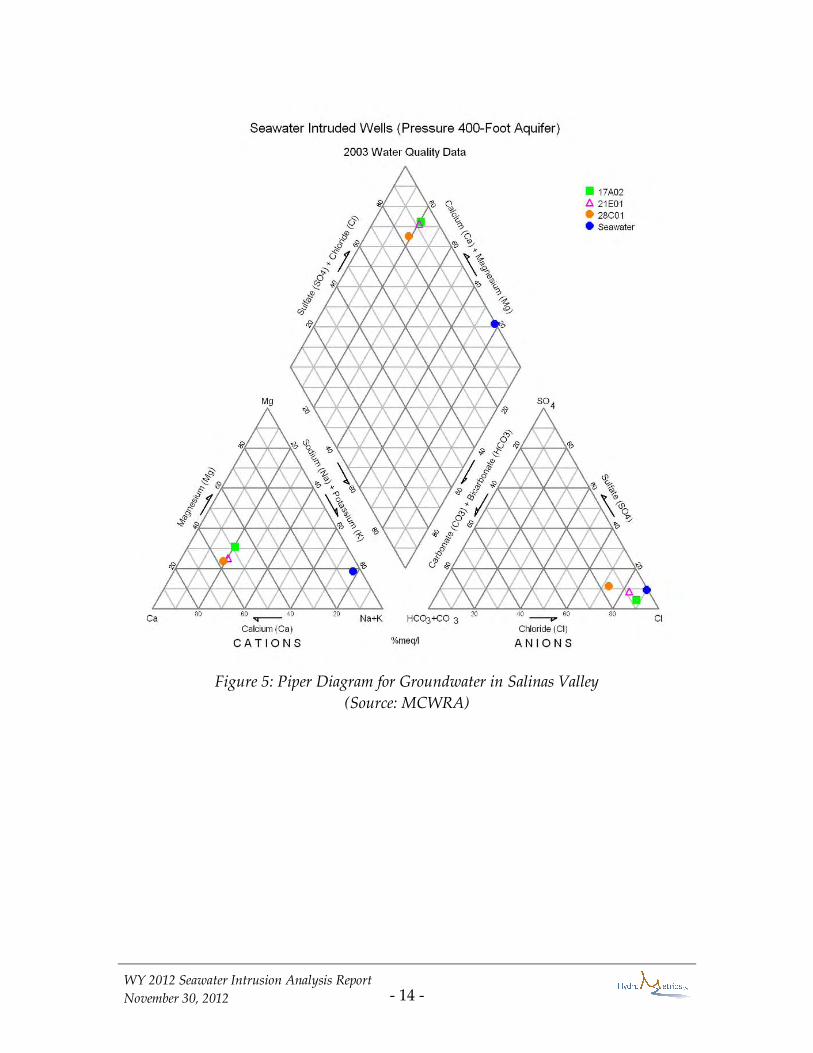
PIPER DIAGRAMS
Example Piper diagrams are shown for data from the Pajaro Valley and Salinas
Valley in Figure 4 and Figure 5, respectively. These figures are included to
demonstrate the utility of Piper diagrams, and show how they have been used in
nearby basins. These figures are not provided for directly comparing data
between basins; groundwater quality trends in one basin will not necessarily
correlate with trends in other basins.
On these Piper diagrams, the relative abundances of individual cations and
anions are plotted in the left and right triangles, respectively, and their combined
distribution is plotted in the central diamond. Waters from similar or related
sources will generally plot together. The mixture of two waters will generally
plot along a straight line between the two end-member types within the central
diamond. The trend towards seawater intrusion, however, often plots along a
curved path as shown in Figure 4. The red arrows track the evolution of water
chemistry from freshwater to seawater. Often only the first, upward leg of this
curve is observed, because wells become too saline to use before reaching the
downward leg, and sampling is usually discontinued.
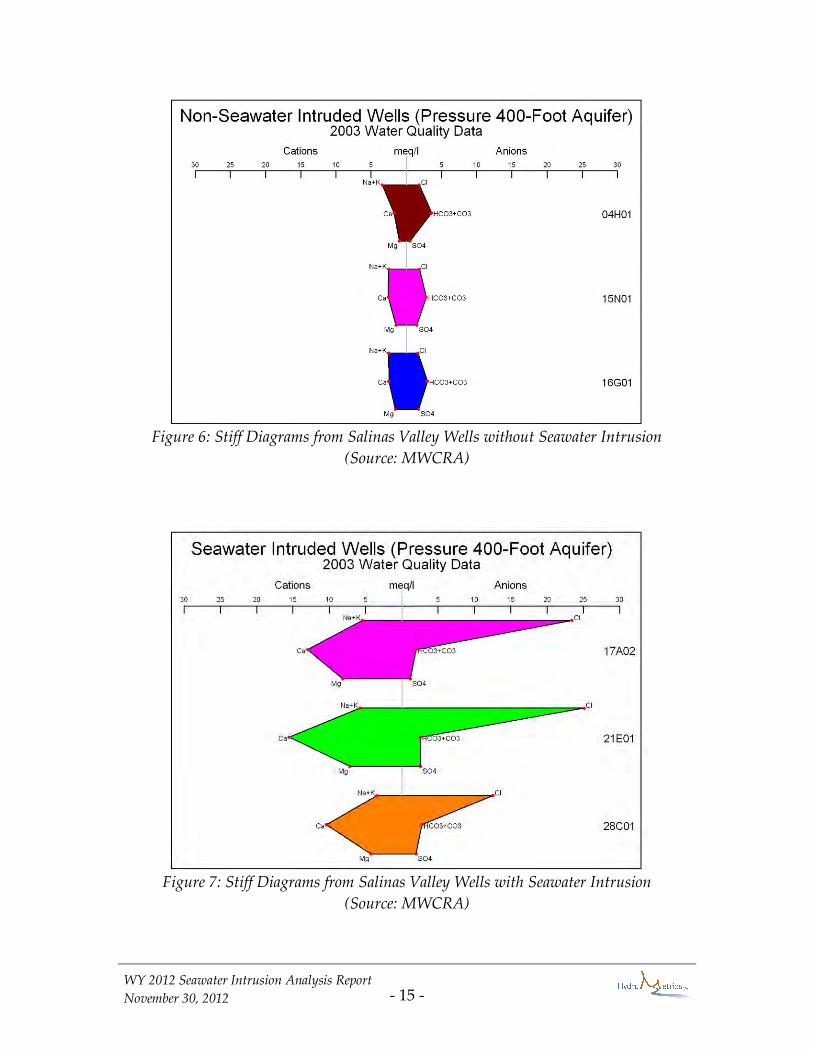
STIFF DIAGRAMS
Example Stiff diagrams from the Salinas Valley are shown in Figure 6 and Figure
7. These figures are included to demonstrate the utility of Stiff diagrams, and
show how they have been used in nearby basins. On Stiff diagrams, the relative
abundances of individual cations are plotted on the left side of the graph, and the
relative abundances of anions are plotted on the right side of the graph. Waters
with similar chemistries will have similarly shaped Stiff diagrams.

- 12 - WY 2012 Seawater Intrusion Analysis Report
November 30, 2012
Figure 6 shows Stiff diagrams characteristic of the unintruded portions of the
Salinas Valley Pressure 400-Foot Aquifer. By contrast, Figure 7 shows Stiff
diagrams from the intruded portion of the Salinas Valley Pressure 400-Foot
Aquifer. The significantly higher chloride levels in the intruded aquifer result in
the noticeable spike at the upper right hand side of the Stiff diagrams in Figure 7.
This spike is indicative of incipient seawater intrusion.
The Stiff diagrams shown on Figure 7 are from wells that have acknowledged
seawater intrusion, based on multiple lines of evidence. The Stiff diagrams alone
are often not sufficient to identify seawater intrusion because there is no
standard for Stiff diagram shapes; the diagrams are most useful as a comparative
tool, showing the evolution of water chemistry over time and space. The shape
of these Stiff diagrams is considered indicative of seawater intrusion in Salinas
Valley only because considerable data analyses have shown that locally, Stiff
diagrams adopt this shape as seawater encroaches.
The Stiff diagrams of seawater intruded wells shown on Figure 7 show calcium
concentrations greater than sodium concentrations, in spite of the fact that
sodium in the dominant cation in seawater. Incipient seawater intrusion is often
characterized by increasing calcium and decreasing sodium, due to cation
exchange between sodium and calcium on the aquifer material. This concept is
discussed further on page 16.
- 13 - WY 2012 Seawater Intrusion Analysis Report
November 30, 2012
Figure 4: Piper Diagram for Groundwater in Pajaro Valley
(Data source: PVWMA)
C A T I O N S A N I O N S%meq/l
Na+K HCO +CO3 3 Cl
Mg SO4
CaCalcium (Ca) Chloride (Cl)
Sul
fate
(SO4) + C
hloride
(Cl)
Calciu
m (C
a) + M
agn
esium
(Mg)
Carb
ona
te (CO3) + B
icar
bon
ate
(HCO3)
Sodium
(Na) +
Potassium
(K)
Sulfate (S
O4)
Mag
nesium
(Mg)
80 60 40 20 20 40 60 80
80
60
40
20
20
40
60
80
20
40
60
80
80
60
40
20
20
40
60
80
20
40
60
80
80
60
40
20
80
60
40
20
Arrows show path of expected mixing line
TypicalSeawater
Data showing unintruded water and incipient seawater intrusion Data showing advanced
seawater intrusion
- 14 - WY 2012 Seawater Intrusion Analysis Report
November 30, 2012
Figure 5: Piper Diagram for Groundwater in Salinas Valley
(Source: MCWRA)
- 15 - WY 2012 Seawater Intrusion Analysis Report
November 30, 2012
Figure 6: Stiff Diagrams from Salinas Valley Wells without Seawater Intrusion
(Source: MWCRA)
Figure 7: Stiff Diagrams from Salinas Valley Wells with Seawater Intrusion
(Source: MWCRA)

- 16 - WY 2012 Seawater Intrusion Analysis Report
November 30, 2012
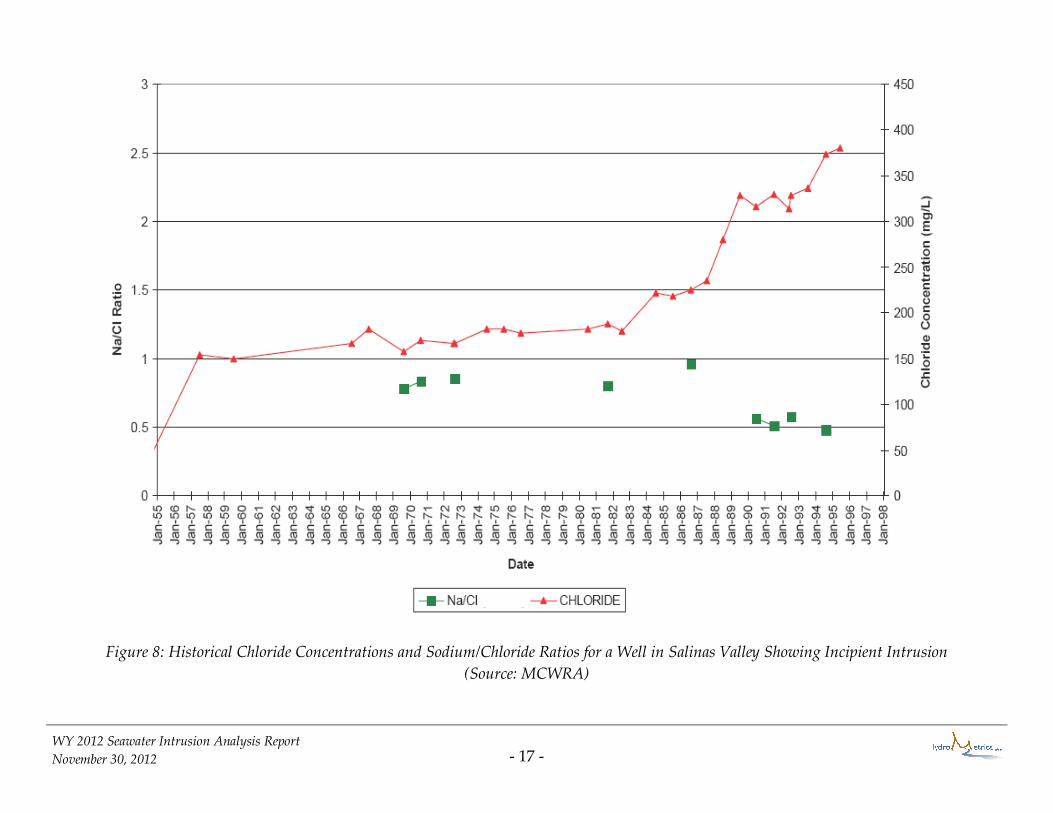
INCREASING CHLORIDE CONCENTRATIONS
Seawater is chloride rich, whereas bicarbonate or sulfate are the dominant anions
in many groundwater systems. Steadily increasing chloride concentrations over
time is the one of the most commonly used indicators of seawater intrusion. At
low chloride concentrations, trends are often as important as absolute
concentrations because of natural variations in groundwater chemistry. As an
example, in 2004 the coastal shallow Pacific Cement Aggregates (PCA) West well
had a chloride concentration of 46 mg/L, whereas the much more inland well
2701882-016, located in the Laguna Seca subarea, had a chloride concentration of
225 mg/L. The higher chloride concentration in well 2701882-016 is fairly
consistent, showing no increasing trend, and is clearly not an indicator of
seawater intrusion.
Example graphs showing historical chloride concentration increases indicative of
seawater intrusion are shown in Figure 8 and Figure 9. Figure 8 graphs steadily
increasing chloride concentrations in a shallow well in the Salinas Valley. Figure
9 graphs increasing chloride concentrations in a well in the Pajaro Valley. Both
of these graphs show that the rise in chlorides is a lengthy and persistent process;
chloride concentrations began to increase in the representative Salinas Valley
well in 1982, and took six years before exceeding the Safe Drinking Water Act
secondary drinking water standard of 250 mg/L. This long-term and relatively
slow increase in chlorides suggests that while chloride concentrations are
strongly indicative of seawater intrusion, it often takes time for the increasing
chloride trend to be recognizable.
SODIUM/CHLORIDE MOLAR RATIOS
As mentioned earlier in this report, sodium often replaces calcium on the aquifer
matrix through ion exchange in advance of the seawater front. This effectively
removes sodium from the water, and sodium/chloride ratios drop in advance of
the seawater front. This can sometimes be used as an early indicator of seawater
intrusion. Sodium/Chloride ratios can also be used to differentiate between
seawater intrusion and other sources of saltwater. Jones et al. (1999) suggest that
sodium/chloride ratios in advance of a seawater intrusion front will be below
0.86 (molar ratio). This distinguishes seawater intrusion from domestic waste
water, which typically has sodium/chloride ratios above 1.
- 17 - WY 2012 Seawater Intrusion Analysis Report
November 30, 2012
Figure 8: Historical Chloride Concentrations and Sodium/Chloride Ratios for a Well in Salinas Valley Showing Incipient Intrusion
(Source: MCWRA)
- 18 - WY 2012 Seawater Intrusion Analysis Report
November 30, 2012
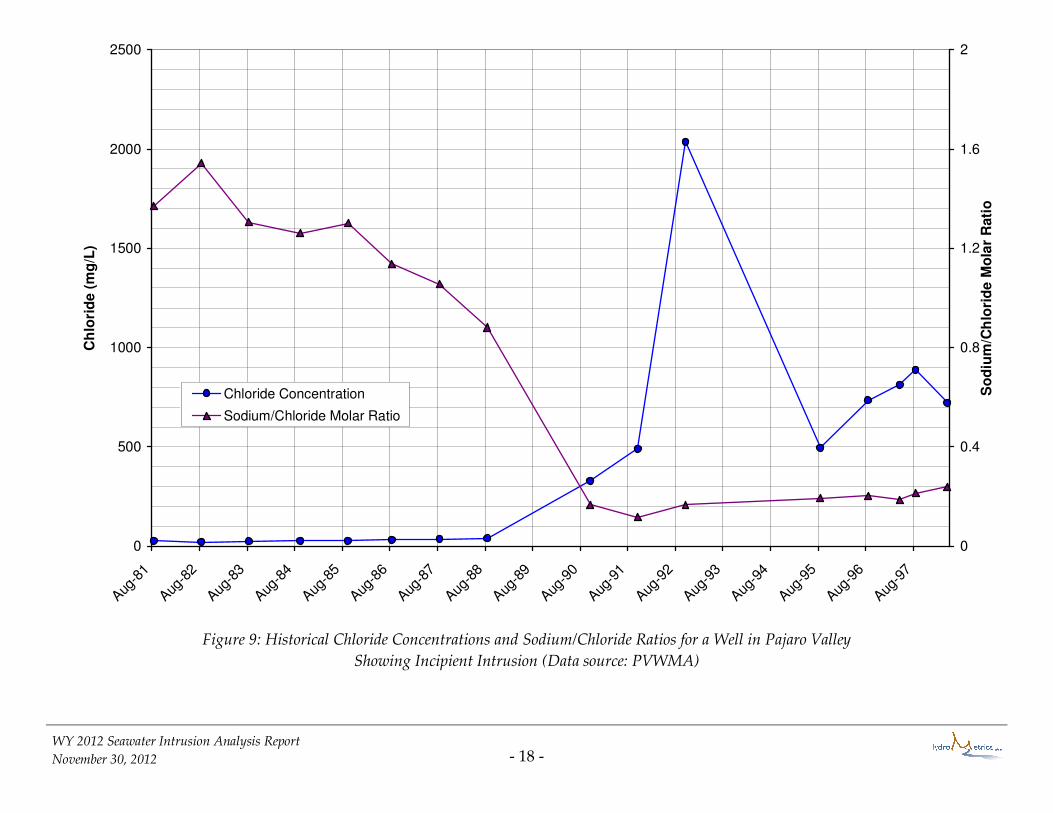
Figure 9: Historical Chloride Concentrations and Sodium/Chloride Ratios for a Well in Pajaro Valley
Showing Incipient Intrusion (Data source: PVWMA)
0
500
1000
1500
2000
2500
Aug-8
1
Aug-8
2
Aug-8
3
Aug-8
4
Aug-8
5
Aug-8
6
Aug-8
7
Aug-8
8
Aug-8
9
Aug-9
0
Aug-9
1
Aug-9
2
Aug-9
3
Aug-9
4
Aug-9
5
Aug-9
6
Aug-9
7
Ch
lori
de
(m
g/L
)
0
0.4
0.8
1.2
1.6
2
So
diu
m/C
hlo
rid
e M
ola
r R
ati
o
Chloride Concentration
Sodium/Chloride Molar Ratio
- 19 - WY 2012 Seawater Intrusion Analysis Report
November 30, 2012
In addition to plotting increasing chloride concentrations, decreasing
sodium/chloride ratios are plotted on Figure 8 and Figure 9. The strong
correlation between the two indicators of seawater intrusion can be observed on
these two figures. The potential utility of sodium/chloride ratios as an early
indicator of seawater intrusion is shown on Figure 9. This figure shows that by
August 1988, chloride concentrations in the Pajaro Valley well had remained
relatively constant, yet sodium/chloride ratios were beginning to drop,
suggesting incipient seawater intrusion. By September 1990, the rising chloride
levels can be clearly correlated to dropping sodium/chloride ratios; definitively
associating the high chlorides with seawater intrusion.
CHLORIDE-BICARBONATE RATIOS
The ratio of chloride to bicarbonate-plus-carbonate contrasts the relative
abundance of the dominant seawater and freshwater anions. As a ratio of
concentrations expressed in mg/L, the ratio for seawater exceeds 100 and values
for groundwater unaffected by seawater are generally less than 0.3. For
groundwater with relatively low total dissolved solids, this ratio provides little
benefit over evaluating chloride concentrations alone; and therefore is not used
in the current analyses.
ELECTRIC INDUCTION LOGS
Changes in formation salinity can be measured from within a well using electric
induction logging. Induction logging within the well measures the fluid
conductivity within the adjacent formation up to a distance of three feet from the
well casing. This technique can be used in wells that are completed with PVC
casings and screens.
This method can be used as a cost-effective method of detecting seawater
intrusion by measuring the electrical conductivity of the formation throughout
the depth of the well. If over time, the conductivity increases relative to the
baseline value, it could indicate seawater intrusion. One limitation of this
method is that it does not provide concentrations of chloride or other ions that
contribute to salinity. Therefore, the use of electric induction logs can only be
used qualitatively.
Induction logging has been performed on the Watermater’s coastal sentinel wells
since their completion in 2007.
- 20 - WY 2012 Seawater Intrusion Analysis Report
November 30, 2012
OTHER INDICATORS
Hem (1989) suggested several other indicators for seawater intrusion, including
the concentration ratio of calcium to magnesium (approximately 0.3 in seawater
and greater in fresh water); the percentage of sulfate among all ions
(approximately 8 percent in seawater and larger in fresh water); and the
concentrations of minor constituents such as iodide, bromide, boron, and barium.
These other indicators are not used in the current analyses for two reasons:
1. The analyses presented in the following sections overwhelmingly suggest
that seawater intrusion has not advanced onshore in the Seaside
Groundwater Basin.
2. No historical data exist for the minor constituents such as iodide and
barium; and only limited historical data exist for bromide and boron. It
should be noted that in 2012, the Watermaster analyzed samples from
selected coastal monitor wells for iodide and barium; these analyses can
be used as a baseline for comparison with future sample results.
Using the other indicators mentioned above is not necessary in light of there
being other methods available for indicating seawater intrusion, as discussed in
the preceding sections. Should the other methods start showing seawater
intrusion, the minor constituents of iodide, bromide, boron, and/or barium may
be included in future water quality analyses so that they can be used as
supplemental indicators.
- 21 - WY 2012 Seawater Intrusion Analysis Report
November 30, 2012
SECTION 3
SEAWATER INTRUSION IN THE SEASIDE
GROUNDWATER BASIN
The geochemical criteria discussed above, along with various maps, can be used
to estimate the presence or lack of seawater intrusion in the Seaside
Groundwater Basin. While no single analysis is a definitive indicator of seawater
intrusion, the combined weight of all analyses may be instrumental in detecting
seawater intrusion.
ANALYSIS APPROACH
As was used in previous Seawater Intrusion Analysis Reports (RBF, 2007;
HydroMetrics LLC, 2008; HydroMetrics LLC, 2009a; HydroMetrics WRI, 2010;
HydroMetrics WRI, 2011), this report includes a number of approaches to
evaluate seawater intrusion. Data for the 2nd quarter of Water Year 2012
(sampled and measured January-March 2012) and 4th quarter of Water Year 2012
(sampled and measured July-August 2012) were analyzed and mapped to show
the spatial distribution of groundwater quality and groundwater elevations. In
addition to spatial mapping, historical data were graphed to assess geochemical
trends. Data from the 2nd quarter represents conditions during the wet time of
the year; data from the 4th quarter represents conditions during the dry time of
the year.
Where possible, analyses are separated by depth zone. Two depth zones have
been chosen, following the system of Yates et al. (2005). Wells assigned to the
shallow depth zone generally correlate to the Paso Robles Formation where it
exists. This shallow zone is roughly at the same depth as the Salinas Valley
Pressure 400-Foot Aquifer. Wells assigned to the deep zone correlate with the
Santa Margarita Sandstone where it exists in the Seaside Groundwater Basin.
The deep zone is roughly at the same depth as the Salinas Valley Deep Aquifer.
CATION/ANION RATIOS
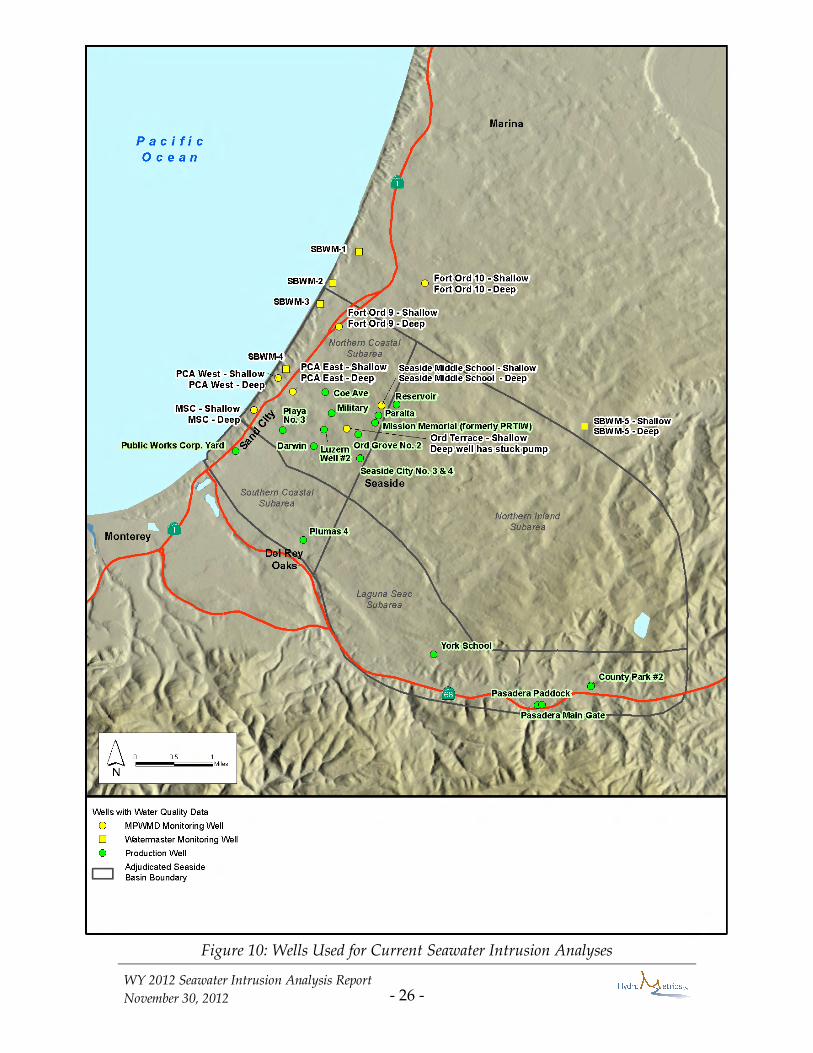
Eighteen monitoring wells and only 7 production wells were used for the
geochemical trend analyses (Figure 10). Of the 18 monitoring wells, four are the
deep sentinel wells installed by the Watermaster in 2007, and two are the
SBMW-5 shallow and SBMW-5 deep well pair located on the east side of the
Bureau of Land Management’s Camp Huffman complex. Eleven monitoring

- 22 - WY 2012 Seawater Intrusion Analysis Report
November 30, 2012
wells used in this analysis represent one or both well pairs from the MPWMD
monitoring well network (Figure 10). A new well pair at Seaside Middle School
has been added to the analysis this year. MPWMD uses the deep monitoring
well for ASR reporting purposes to the Regional Water Quality Control Board. A
well pair comprises two wells drilled in close proximity to one another – one
perforated in the shallow zone and the other perforated in the deep zone. Each
well pair is represented with a unique color and symbol on Piper and Stiff
diagrams. The shallow well of each pair is represented by a filled square on the
Piper diagrams; the deep well of each pair is represented by a filled circle on the
Piper diagrams.
The production wells included in the analysis are water purveyor wells that are
sampled annually for general inorganic minerals per the Seaside Basin
Monitoring and Management Program. The current schedule includes sampling
selected coastal monitoring wells quarterly. All other monitoring and
production wells are sampled annually during the 4th quarter. Where samples
are not available for analysis, the text and figures indicate as such.
Water quality data reported by CAW for its production wells in the fourth
quarter cannot be used for this analysis because the results provided spanned
two or three sample dates for each sample. This means there was not one
complete set of results for each well where all constituents were analyzed from
the same sample. As a result, the anions and cations do not balance, and Piper
and Stiff diagrams cannot be prepared. Future notices the Watermaster sends
out requesting water quality results must specify that a complete set of results
from the same sample for each well need to be submitted per the Decision.
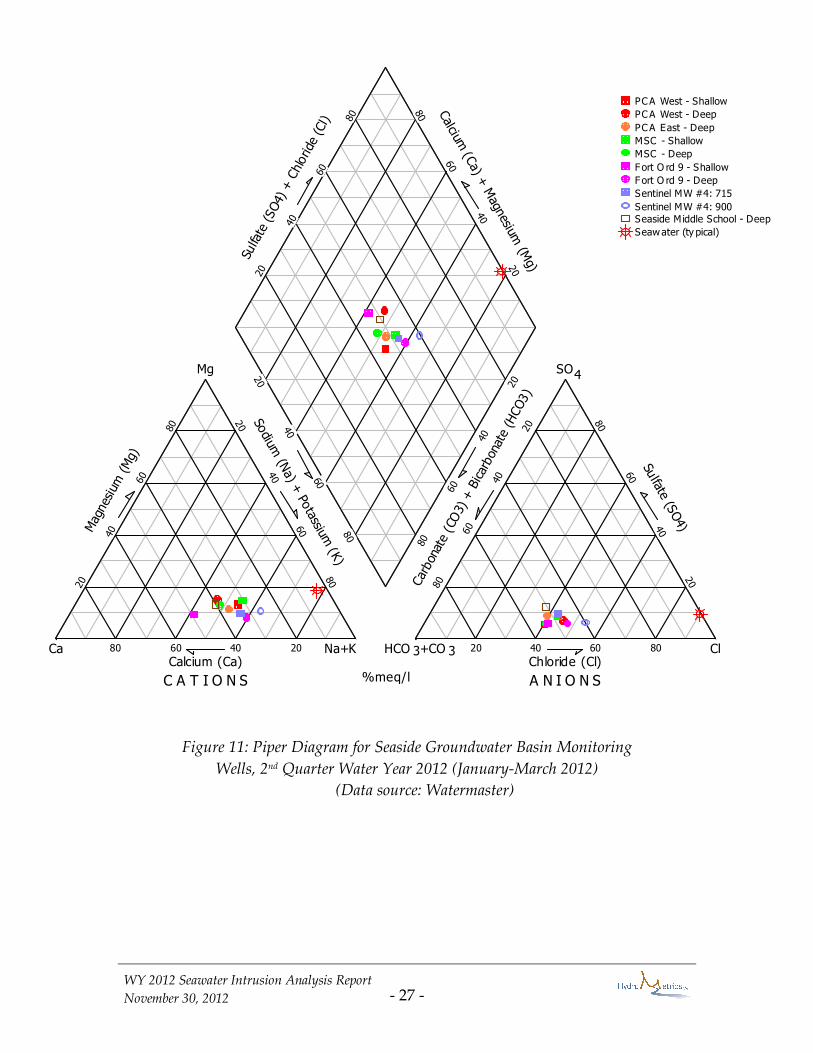
SECOND QUARTER WATER YEAR 2012 (JANUARY-MARCH 2012)
A Piper diagram displaying analyses from ten monitoring wells in the Seaside
Groundwater Basin for the 2nd quarter Water Year 2012 (January-March 2012) is
shown in Figure 11. Analyses from only ten wells are shown because most of the
monitoring well pairs, and all of the production wells, are not sampled during
this quarter; they are only sampled annually in the 4th quarter. Appendix A
includes individual Piper diagrams for each well to show trends over time.
The monitoring wells generally cluster in a single area on the Piper diagram that
is consistent with previous data. The location on the Piper diagram indicates
that the water from both the deep and shallow well pairs straddle the sodium-
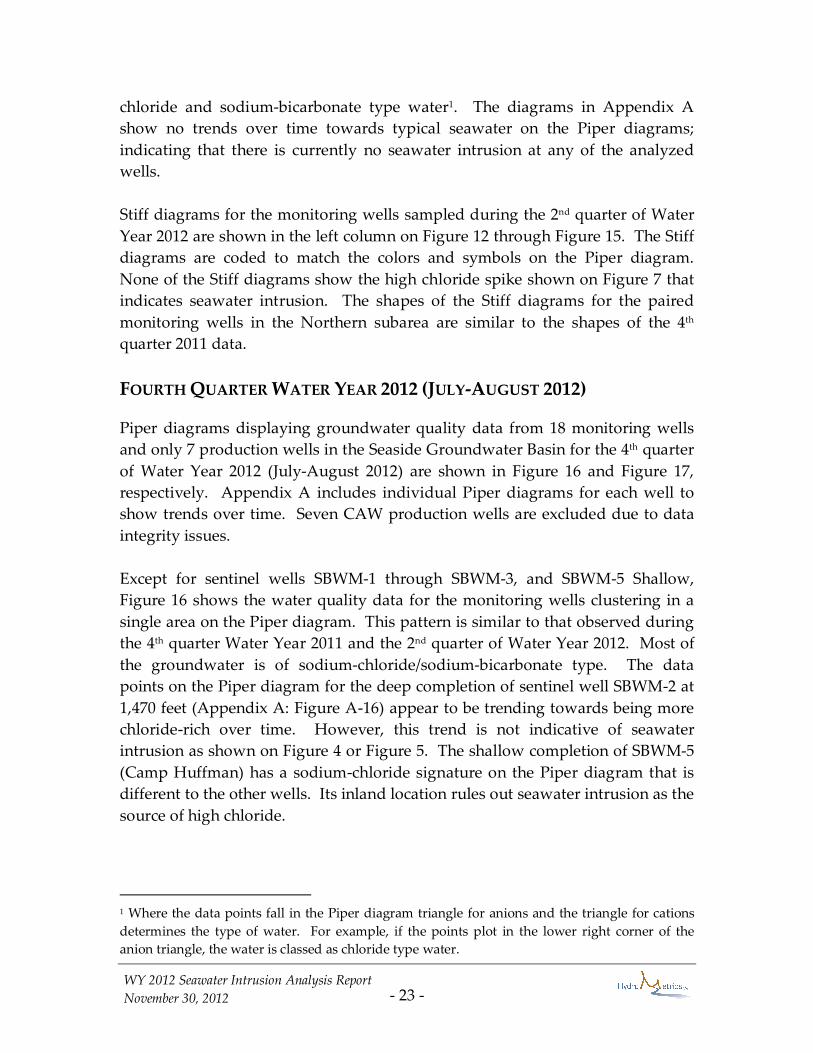
- 23 - WY 2012 Seawater Intrusion Analysis Report
November 30, 2012
chloride and sodium-bicarbonate type water1. The diagrams in Appendix A
show no trends over time towards typical seawater on the Piper diagrams;
indicating that there is currently no seawater intrusion at any of the analyzed
wells.
Stiff diagrams for the monitoring wells sampled during the 2nd quarter of Water
Year 2012 are shown in the left column on Figure 12 through Figure 15. The Stiff
diagrams are coded to match the colors and symbols on the Piper diagram.
None of the Stiff diagrams show the high chloride spike shown on Figure 7 that
indicates seawater intrusion. The shapes of the Stiff diagrams for the paired
monitoring wells in the Northern subarea are similar to the shapes of the 4th
quarter 2011 data.
FOURTH QUARTER WATER YEAR 2012 (JULY-AUGUST 2012)
Piper diagrams displaying groundwater quality data from 18 monitoring wells
and only 7 production wells in the Seaside Groundwater Basin for the 4th quarter
of Water Year 2012 (July-August 2012) are shown in Figure 16 and Figure 17,
respectively. Appendix A includes individual Piper diagrams for each well to
show trends over time. Seven CAW production wells are excluded due to data
integrity issues.
Except for sentinel wells SBWM-1 through SBWM-3, and SBWM-5 Shallow,
Figure 16 shows the water quality data for the monitoring wells clustering in a
single area on the Piper diagram. This pattern is similar to that observed during
the 4th quarter Water Year 2011 and the 2nd quarter of Water Year 2012. Most of
the groundwater is of sodium-chloride/sodium-bicarbonate type. The data
points on the Piper diagram for the deep completion of sentinel well SBWM-2 at
1,470 feet (Appendix A: Figure A-16) appear to be trending towards being more
chloride-rich over time. However, this trend is not indicative of seawater
intrusion as shown on Figure 4 or Figure 5. The shallow completion of SBWM-5
(Camp Huffman) has a sodium-chloride signature on the Piper diagram that is
different to the other wells. Its inland location rules out seawater intrusion as the
source of high chloride.
1 Where the data points fall in the Piper diagram triangle for anions and the triangle for cations
determines the type of water. For example, if the points plot in the lower right corner of the
anion triangle, the water is classed as chloride type water.

- 24 - WY 2012 Seawater Intrusion Analysis Report
November 30, 2012
Figure 17 shows some production wells plotting within the same area as the
monitoring wells. The variation of the plot location on the Piper diagram for
production wells is due to higher sulfate and chloride anions than in the
monitoring wells. These wells can be characterized as sodium-sulfate-chloride
type waters. The York School well plots closest to typical seawater on this
diagram, however its inland location precludes seawater intrusion as the cause
for the observed water chemistry at this well. Overall, the Piper diagrams show
no indication of seawater intrusion at any of the analyzed wells.
The Sand City’s Public Works Corp Yard production well Piper diagram shows
that its water chemistry is evolving steadily over time (Appendix A, Figure A-
21). As the source of this evolution is probably not seawater because it does not
follow the pattern depicted on Figure 4 and Figure 5, the irregular water quality
at this well needs to be further evaluated by investigating the historical water
quality of the area around the well.
Stiff diagrams for the 18 monitoring wells sampled during the 4th quarter of
Water Year 2012 are shown in the right column on Figure 12 through Figure 15.
The shapes of the Stiff diagrams for the paired monitoring wells are similar to the
shapes of the Stiff diagrams from previous years. Stiff diagrams for the seven
production wells sampled correctly during the 4th quarter of Water Year 2012 are
shown in the right column on Figure 18 through Figure 20. These production
well Stiff diagrams show the same shapes as were observed in the 4th quarter of
Water Year 2011. None of the Stiff diagrams show the high chloride spike shown
on Figure 7 that indicates seawater intrusion.
The York School production well, in the Laguna Seca subarea, and Sand City’s
Public Works Corp Yard production well, in the Southern Coastal subarea both
have Stiff diagrams different from most other wells’ water quality (Figure 18).
Although the shapes are different, they do not display the large chloride spike
associated with seawater intrusion as shown on Figure 7. None of the
production wells analyzed using Stiff and Piper diagrams show an indication of
seawater intrusion.
- 25 - WY 2012 Seawater Intrusion Analysis Report
November 30, 2012
CHLORIDE CONCENTRATIONS
TRENDS
Chemographs showing chloride concentrations over time are plotted for each of
the MPWMD and Watermaster monitoring wells plotted on the Piper and Stiff
diagrams. An example plot displaying chloride concentrations for the shallow
PCA West well is shown on Figure 21. The complete set of chemographs is
included in Appendix B.
Overall, chloride concentration trends have been stable for most monitoring
wells, with four wells having slight decreasing trends. Three coastal monitoring
wells, however, continued their increasing trends. These are: PCA-West Deep,
sentinel well SBWM-4 shallow and SBWM-4 deep. The September 2012 chloride
concentration in PCA-West Deep is 4 mg/L from the chloride threshold value of
186 mg/L established in the Seawater Intrusion Response Plan (SIRP) for this well
(HydroMetrics WRI, 2009c). The chemograph for PCA-West Deep can be found
in Appendix B on Figure B-2. The sentinel wells do not have chloride threshold
values, however, the deep sample from SBWM-4 is above the secondary MCL of
250 mg/L and is being sampled semi-annually. The increasing trend seen in the
shallow and deep samples from SBWM-4 start at the same time as PCA-West
Deep’s increasing trend.
Seawater intrusion will be identified by a sustained chloride concentration
increase over time along with other positive indicators. As seen in previous
years, Stiff and Piper diagrams for wells with increasing chloride concentrations
did not indicate seawater intrusion. However, because of the chloride
concentration approaching the chloride threshold value, and associated
decreasing sodium/chloride molar ratio for PCA-West Deep, this well needs
particular attention. A water quality sample needs to be collected from this well
in December, if access to the site is possible, and continue quarterly as scheduled.
Historically, access to this well is hindered in winter months due to windblown
dune sand covering the road to the well.
Chloride concentration trend graphs at this time do not indicate any seawater
intrusion in the Seaside Groundwater Basin, based on the existing monitoring
data. However, water quality from SBWM-4 and PCA-West Deep needs to be
followed more closely.
- 26 - WY 2012 Seawater Intrusion Analysis Report
November 30, 2012
Figure 10: Wells Used for Current Seawater Intrusion Analyses
- 27 - WY 2012 Seawater Intrusion Analysis Report
November 30, 2012
Figure 11: Piper Diagram for Seaside Groundwater Basin Monitoring
Wells, 2nd Quarter Water Year 2012 (January-March 2012)
(Data source: Watermaster)
C A T I O N S A N I O N S%meq/l
Na+K HCO +CO3 3 Cl
Mg SO4
CaCalcium (Ca) Chloride (Cl)
Sulfa
te (SO4)
+ C
hlo
ride
(Cl)
Calcium
(Ca) +
Magn
esium (M
g)
Car
bon
ate
(CO
3) +
Bicar
bon
ate
(HCO3)
Sodium
(Na) +
Potassium
(K)
Sulfate (S
O4)Mag
nes
ium
(M
g)
80 60 40 20 20 40 60 80
80
60
40
20
20
40
60
80
20
40
60
80
80
60
40
20
20
40
60
80
20
40
60
80
80
60
40
20
80
60
40
20
PC A West - Shallow
PC A West - Deep
PC A East - Deep
MSC - Shallow
MSC - Deep
Fort O rd 9 - Shallow
Fort O rd 9 - Deep
Sentinel MW #4: 715
Sentinel MW #4: 900Seaside Middle School - Deep
Seawater (ty pical)
- 28 - WY 2012 Seawater Intrusion Analysis Report
November 30, 2012
Figure 12: Stiff Diagrams for MSC, Fort Ord 9, and Fort Ord 10 Wells
(Data source: Watermaster)
Cations meq/L Anions Cations meq/L Anions
4th
Quarter 2012 2nd
Quarter 2012
MSC - Shallow
MSC - Deep
Fort Ord 10 - Shallow
Fort Ord 10 - Deep
Fort Ord 9 - Shallow
Fort Ord 9 - Deep
10 5 5 10
C l
HC O 3+C O 3
SO 4Mg
C a
Na+K
C l
HC O 3+C O 3
SO 4Mg
Ca
Na+K
C l
HCO 3+C O 3
SO 4Mg
C a
Na+K
C l
HCO 3+C O 3
SO 4Mg
C a
Na+K
C l
HC O 3+CO 3
SO 4Mg
C a
Na+K
C l
HCO 3+C O 3
SO 4Mg
Ca
Na+K
10 5 5 10
C l
HC O3+C O3
SO4Mg
Ca
Na+K
C l
HC O3+CO 3
SO4Mg
Ca
Na+K
C l
HCO 3+C O3
SO 4Mg
C a
Na+K
C l
HC O3+C O3
SO4Mg
C a
Na+K
C l
HC O3+C O3
SO4Mg
C a
Na+K
C l
HCO 3+C O3
SO4Mg
C a
Na+K
Samples collected
annually in 4th Quarter
Samples collected
annually in 4th Quarter
- 29 - WY 2012 Seawater Intrusion Analysis Report
November 30, 2012
Figure 13: Stiff Diagrams for PCA West, PCA East, and Ord Terrace Wells
(Data source: Watermaster)
Note: The Ord Terrace shallow well is designated as shallow but it was completed in
the upper part of the Santa Margarita aquifer. This is evident in similar shape of the Stiff
diagrams for the shallow and deep zones.
4th
Quarter 2012 2nd
Quarter 2012
Cations meq/L Anions Cations meq/L Anions
PCA West - Shallow
PCA West - Deep
PCA East - Shallow
PCA East - Deep
Ord Terrace - Shallow
Ord Terrace - Deep
10 5 5 10
C l
HC O 3+C O 3
SO 4Mg
C a
Na+K
C l
HC O 3+C O 3
SO 4Mg
C a
Na+K
C l
HC O 3+C O 3C a
Na+K
Sample Not Collected
Pump Stuck in Well
Samples collected
annually in 4th Quarter
Samples collected
annually in 4th Quarter
Samples collected
annually in 4th Quarter
C l
HC O 3+C O 3
SO 4Mg
C a
Na+K
10 5 5 10
C l
HCO 3+C O 3
SO 4Mg
C a
Na+K
C l
HC O 3+C O 3
SO 4Mg
C a
Na+K
C l
HC O 3+C O 3
SO 4Mg
Ca
Na+K
C l
HCO 3+C O 3
SO 4Mg
Ca
Na+K
C l
HC O 3+CO 3
SO 4Mg
C a
Na+K

- 30 - WY 2012 Seawater Intrusion Analysis Report
November 30, 2012
Figure 14: Stiff Diagrams for Watermaster Monitoring Wells 1 - 3
(Data source: Watermaster)
Cations meq/L Anions Cations meq/L Anions
4th
Quarter 2012 2nd
Quarter 2012
Samples collected
annually in 4th Quarter
10 5 5 10
C lNa+K
Sentinel MW #1: 1140
Sentinel MW #1: 1390
Sentinel MW #2: 1000
Sentinel MW #2: 1470
Sentinel MW #3: 870
Sentinel MW #3: 1275
10 5 5 10
C l
HC O 3+C O 3
SO 4Mg
C a
Na+K
C l
HC O 3+C O 3
SO 4Mg
C a
Na+K
C l
HCO 3+C O 3
SO 4Mg
C a
Na+K
C l
HCO 3+C O 3
SO 4Mg
C a
Na+K
C l
HCO 3+C O 3
SO 4Mg
C a
Na+K
C l
HCO 3+C O 3
SO 4Mg
C a
Na+K
- 31 - WY 2012 Seawater Intrusion Analysis Report
November 30, 2012
Figure 15: Stiff Diagrams for Watermaster Monitoring Wells 4 and 5, and Seaside
Middle School Deep
(Data source: Watermaster and MPWMD)
Cations meq/L Anions Cations meq/L Anions
2nd
Quarter 2012 4th
Quarter 2012
Sentinel MW #4: 715
Sentinel MW #4: 900
Sentinel MW #5: shallow
Sentinel MW #5: deep
Seaside Middle School - Deep
10 5 5 10
Cl
HCO3+CO3
SO4Mg
Ca
Na+K
Cl
HCO3+CO3
SO4Mg
Ca
Na+K
Cl
HCO3+CO3
SO4Mg
Ca
Na+K
Cl
HCO3+CO3
SO4Mg
Ca
Na+K
Cl
HCO3+CO3
SO4Mg
Ca
Na+K
Samples collected
annually in 4th
Quarter
10 5 5 10
Cl
HCO3+CO3
SO4Mg
Ca
Na+K
Cl
HCO3+CO3
SO4Mg
Ca
Na+K
Cl
HCO3+CO3
SO4Mg
Ca
Na+K
Cl
HCO3+CO3
SO4Mg
Ca
Na+K
Cl
HCO3+CO3
SO4Mg
Ca
Na+K

- 32 - WY 2012 Seawater Intrusion Analysis Report
November 30, 2012
Figure 16: Piper Diagram for Seaside Groundwater Basin Monitoring Wells, 4th
Quarter Water Year 2012 (July-August 2012)
(Data source: Watermaster)
C A T I O N S A N I O N S%meq/l
Na+K HCO +CO3 3 Cl
Mg SO4
CaCalcium (Ca) Chloride (Cl)
Sulfa
te (SO4)
+ C
hloride
(Cl)
Calciu
m (C
a) + M
agn
esium (M
g)
Car
bona
te (CO3)
+ B
icarb
onat
e (H
CO3)
Sodium
(Na) +
Potassiu
m (K
)
Sulfate (S
O4)M
agnes
ium
(Mg)
80 60 40 20 20 40 60 80
80
60
40
20
20
40
60
80
20
40
60
80
80
60
40
20
20
40
60
80
20
40
60
80
80
60
40
20
80
60
40
20
PCA West - Shallow
PCA West - Deep
PCA East - Shallow
PCA East - Deep
Ord Terrace - Shallow
MSC - Shallow
MSC - Deep
Fort Ord 10 - Shallow
Fort Ord 10 - Deep
Fort Ord 9 - Shallow
Fort Ord 9 - Deep
Sentinel MW #1: 1140
Sentinel MW #1: 1390
Sentinel MW #2: 1000
Sentinel MW #2: 1470
Sentinel MW #3: 870
Sentinel MW #3: 1275
Sentinel MW #4: 715
Sentinel MW #4: 900
Sentinel MW #5: shallow
Sentinel MW #5: deep
Seaside Middle School - Deep
Seawater (typical)

- 33 - WY 2012 Seawater Intrusion Analysis Report
November 30, 2012
Figure 17: Piper Diagram for Seaside Groundwater Basin
Production Wells, 4th Quarter Water Year 2012 (July-August 2012)
(Data source: Watermaster)
C A T I O N S A N I O N S%meq/l
Na+K HCO +CO3 3 Cl
Mg SO4
CaCalcium (Ca) Chloride (Cl)
Sulfate
(SO
4) +
Chlo
ride
(Cl)
Calciu
m (C
a) + M
agnesium
(Mg)
Carb
onat
e (CO3) + B
icar
bonat
e (H
CO
3)
Sod
ium
(Na) +
Potassiu
m (K
)
Sulfa
te (S
O4)
Mag
nesium
(M
g)
80 60 40 20 20 40 60 80
80
60
40
20
20
40
60
80
20
40
60
80
80
60
40
20
20
40
60
80
20
40
60
80
80
60
40
20
80
60
40
20
Public Works Corp. Yard
York School
Pasadera Paddock
LS CNTY Park #1
Seaside City No. 4
Mission Memorial (formerly PRTIW)
Reservoir
Seawater (typical)

- 34 - WY 2012 Seawater Intrusion Analysis Report
November 30, 2012
Figure 18: Stiff Diagrams for Southern Coastal and Inland Subarea Production Wells
(Data source: Watermaster)
10 5 5 10
C lNa+K
Cations meq/L Anions Cations meq/L Anions
2nd
Quarter 2012 4th
Quarter 2012
Public Works Corp. Yard
Plumas 4
York School
Pasadera Main Gate
LS CNTY Park #2
Samples collected
annually in 4th
Quarter
15 10 5 5 10
C l
HC O 3+C O 3
SO 4Mg
C a
Na+K
C l
HC O 3+CO 3
SO 4Mg
Ca
Na+K
C l
HCO 3+CO 3
SO 4Mg
C a
Na+K
C l
HC O 3+C O 3
SO 4Mg
Ca
Na+K
C l
HC O 3+C O 3
SO 4Mg
C a
Na+K
Full Cation and
Anion Sample Not
Collected
- 35 - WY 2012 Seawater Intrusion Analysis Report
November 30, 2012
Playa No. 3
Coe Ave
Military
Luzern Well #2
Darwin
10 5 5 10
Figure 19: Stiff Diagrams for Northern Coastal Subarea Production Wells #1
(Data source: Watermaster)
Cations meq/L Anions Cations meq/L Anions
2nd
Quarter 2012 4th
Quarter 2012
Samples collected
annually in 4th
Quarter
10 5 5 10
Well not Operating
Full Cation and
Anion Sample Not
Collected
Full Cation and
Anion Sample Not
Collected
Full Cation and
Anion Sample Not
Collected
Full Cation and
Anion Sample Not
Collected
- 36 - WY 2012 Seawater Intrusion Analysis Report
November 30, 2012
Figure 20: Stiff Diagrams for Northern Coastal Subarea Production Wells #2
(Data source: Watermaster)
10 5 5 10
Ord Grove No. 2
Seaside City No. 3
Seaside City No. 4
PRTIW
Paralta
Reservoir
10 5 5 10
Cl
HCO3+CO3
SO4Mg
Ca
Na+K
Cl
HCO3+CO3
SO4Mg
Ca
Na+K
Cl
HCO3+CO3
SO4Mg
Ca
Na+K
Cl
HCO3+CO3
SO4Mg
Ca
Na+K
Cl
HCO3+CO3
SO4Mg
Ca
Na+K
Cl
HCO3+CO3
SO4Mg
Ca
Na+K
Cations meq/L Anions Cations meq/L Anions
2nd
Quarter 2012 4th
Quarter 2012
Samples collected
annually in 4th
Quarter
Well not Operating
Full Cation and
Anion Sample Not
Collected
Full Cation and
Anion Sample Not
Collected

- 37 - WY 2012 Seawater Intrusion Analysis Report
November 30, 2012
Figure 21: Historical Chloride and Sodium/Chloride Molar Ratios, Shallow PCA West Well
0.0
0.3
0.6
0.9
1.2
1.5
0
50
100
150
200
250
So
diu
m/C
hlo
ride M
ola
r R
ati
o
Ch
lori
de (m
g/L
)
Chloride Concentration
Sodium/Chloride Molar Ratio
- 38 - WY 2012 Seawater Intrusion Analysis Report
November 30, 2012
CHLORIDE CONCENTRATION MAPS
FOURTH QUARTER WATER YEAR 2012 (JULY-AUGUST 2012)
Fourth quarter Water Year 2012 chloride concentrations were mapped using data
from July to October 2012. The maps for the shallow and deep zones are
included on Figure 22 and Figure 23 respectively.
The shallow zone 4th quarter Water Year 2012 chloride concentration map is
shown on Figure 22. Chloride data from shallow wells are posted on this map,
but do not show a spatial distribution that can be readily contoured because of
large differences in concentrations in close proximity to each other. For the data
available in the shallow zone, chloride concentrations near the coast average
around 46 mg/L in the Northern Coastal subarea. More inland wells have
consistently shown higher chloride concentrations than coastal wells. Based on
existing data, there is no discernible spatial trend of higher coastal chloride
concentrations, and therefore no indication of seawater intrusion. Sand City’s
Public Works Corp Yard well is the only coastal well in the Southern Coastal
subarea with available chloride data and has the highest concentration of all
shallow wells (283 mg/L). Due to the changing water type observed on the Piper
diagram for this well, the source of its irregular water quality needs to be
evaluated. The Piper and Stiff diagrams, and sodium/chloride molar ratio
suggest that the source of high chloride is not seawater, however, this needs
confirmation by further investigation into historical water quality of the area
around the well.
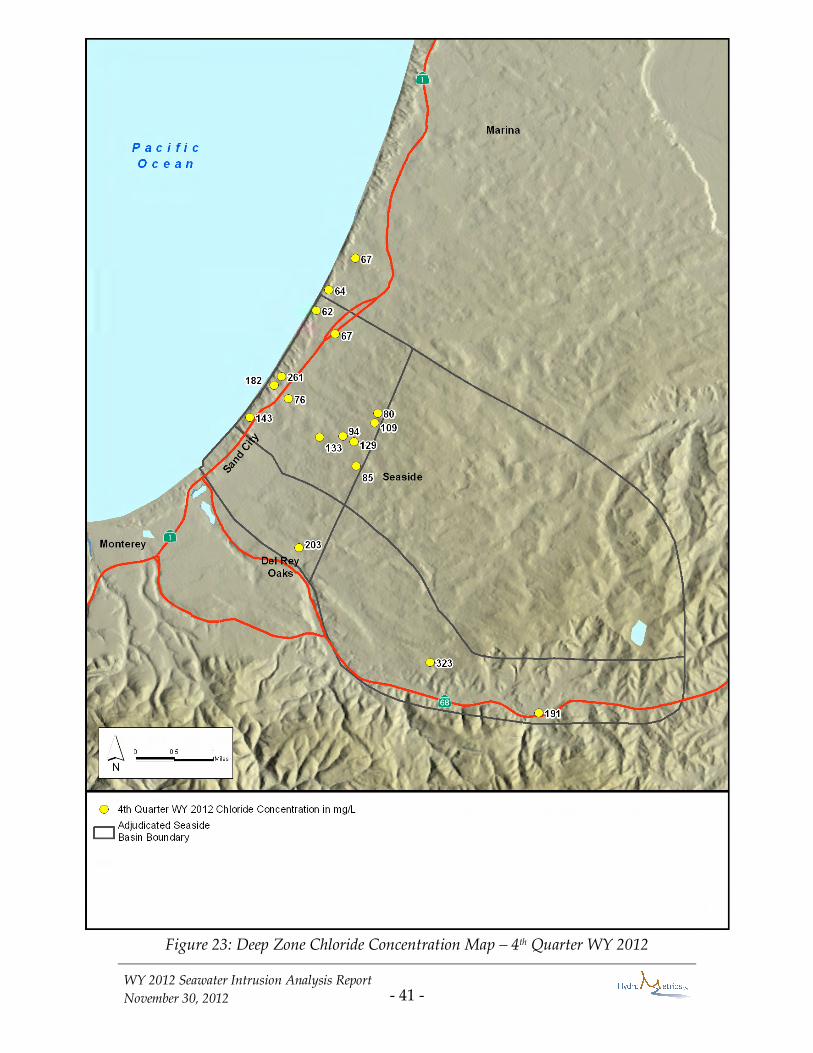
The deep zone 4th quarter Water Year 2012 chloride concentration map is shown
on Figure 23. Because the chloride data shows no discernible spatial distribution,
with high concentrations in close proximity to low concentrations, the data
cannot be readily contoured. Deep zone chloride concentrations near the coast
range between 62 and 261 mg/L. Water quality data from PCA-West Deep and
sentinel well SBWM-4, where the highest concentrations are observed, need to be
reviewed each quarter to determine if chloride continues to increase.
- 39 - WY 2012 Seawater Intrusion Analysis Report
November 30, 2012
SODIUM/CHLORIDE MOLAR RATIOS
Chemographs showing sodium/chloride molar ratios over time are plotted for
each of the 18 monitoring wells plotted on the Piper and Stiff diagrams.
Historical chemographs for monitoring wells that are not on the Water Year 2012
Piper and Stiff diagrams because data were not available are also included for
completeness. An example plot displaying ratios for the shallow PCA West well
is shown on Figure 21. The complete set of chemographs is included in
Appendix B.
Although sodium/chloride molar ratios dropped in some wells during 2012; only
two wells had enough of a trend to identify a downward trend. These wells are:
PCA-West Deep, sentinel well SBWM-4 (shallow and deep samples). Of these
wells, PCA-West Deep has a ratio of 0.94 which is the closest it has been to the
0.86 ratio used to identify advancing seawater intrusion. Sodium/chloride molar
ratios of quarterly samples collected from this well need to be analyzed as soon
as the results are received to verify the downward trend. All other monitoring
wells have ratios consistently above 0.9, which indicates that there is no incipient
or ongoing seawater intrusion in those wells.
- 40 - WY 2012 Seawater Intrusion Analysis Report
November 30, 2012
Figure 22: Shallow Zone Chloride Concentration Map – 4th Quarter WY 2012
- 41 - WY 2012 Seawater Intrusion Analysis Report
November 30, 2012
Figure 23: Deep Zone Chloride Concentration Map – 4th Quarter WY 2012

- 42 - WY 2012 Seawater Intrusion Analysis Report
November 30, 2012
ELECTRIC INDUCTION LOGS
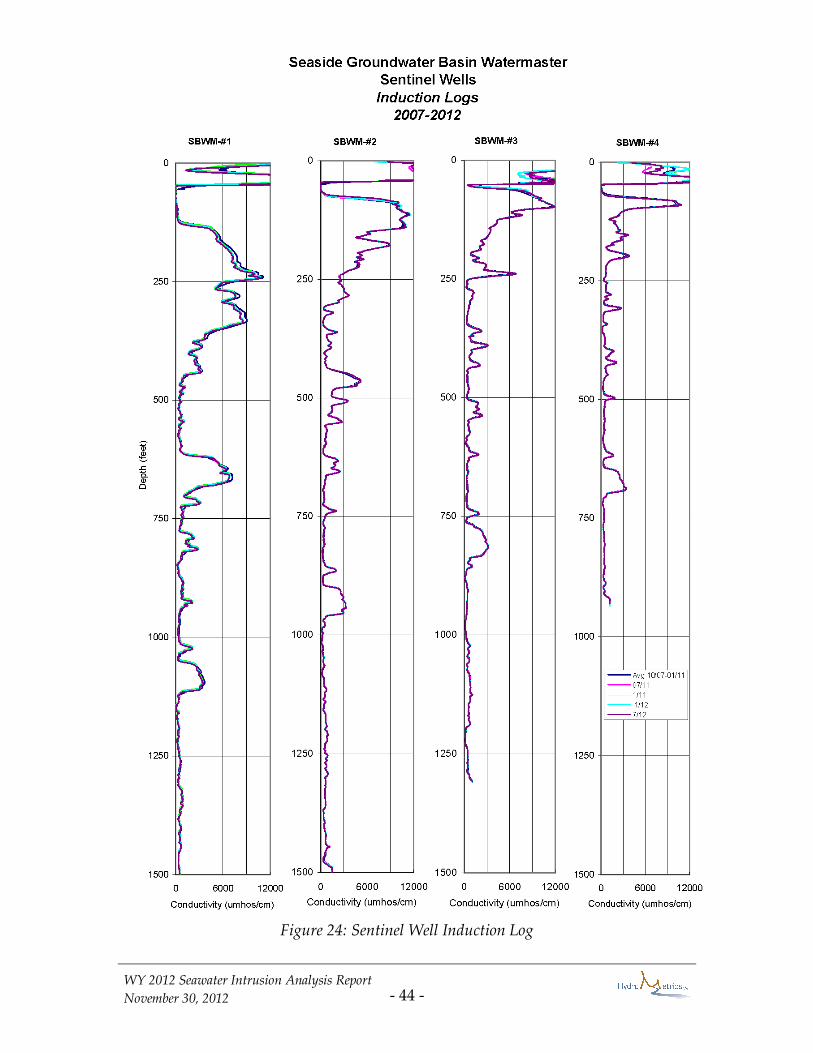
Two induction logging events took place in the sentinel wells during Water Year
2012. As occurred last water year, the first logging event was conducted in
January, and the second in July. The logs from these events are included in
Figure 24, along with the average readings from 2007 through 2011.
Feeney (2007) described the baseline induction logs for each of the wells as
follows:
“SBWM-1 — The upper 50 feet of this well shows very high
conductivities. This signature is present in all of the wells and is the
result of the 50-foot steel conductor casing. However, because the water
table is below the conductor casing at all locations, the steel casing does
not interfere with data collection within the saturated sediments below.
Below the conductor casing in SBWM-1, the sediment materials are dry to
a depth of approximately 115 feet. Below this depth, there is
approximately 10 feet of sand containing fresh water. Below 125 feet and
extending to approximately 350 – 400 feet is sand containing saline water
with conductivities measuring as high as 10,000 µmhos/cm. This saline
water is contained within the Dune /Beach Sand Deposits and the Aromas
Sand. Below this depth, conductivities are relatively low with the
exception of the thick marine clay between approximately 600 -700 feet.
The other conductive zones also correlate with clay zones.
SBWM-2 — As in SBWM-1 there is a thin layer of fresh water overlying
a zone of saline water to approximately 130 feet within the Beach/Dune
Sands and Aromas Sand. Below this depth, the materials become
increasingly clayey, complicating the interpretation. Below this depth,
there are no obvious zones of anomalous conductivity; that is, the zones
that are more conductive correlate with clay zones.
SBWM-3 — In SBWM-3 saline water extends to a depth of
approximately 100 feet within the Dune/Beach Sand and Aromas
Deposits. Below 100 feet, the materials become clay and conductivities
rapidly decline. Again, below the shallow saline water in the sand
deposits, all zones of increased conductivity correlate with clay zones.

- 43 - WY 2012 Seawater Intrusion Analysis Report
November 30, 2012
SBWM-4 — As with the other wells, the induction log reveals a thin layer
of fresh water overlying saline water with the Dune Sands/Beach Deposits
to a depth of approximately 100 feet. Below this depth the materials
become clay and there are no additional zones of increased conductivity
uncorrelated with clay zones.”
The salinity changes shown on Figure 24 are only relative, and do not allow
direct measurement of TDS or chloride concentrations in the aquifer. They do,
however, provide a means to determine changes in salinity over time. In
previous years, the Dune Sands and Aromas Formation have shown slight
increases in salinity. This trend has continued for sentinel well SBWM-2,
SBMW-3, and SBMW-4 in Water Year 2012. SBMW-1, shows slightly decreasing
salinity compared to previous results. As has been the case historically, none of
the wells show detectable changes to the deeper aquifers where production wells
extract groundwater. This indicates that there is currently no seawater intrusion
into these deeper aquifers.
- 44 - WY 2012 Seawater Intrusion Analysis Report
November 30, 2012
Figure 24: Sentinel Well Induction Log

- 45 - WY 2012 Seawater Intrusion Analysis Report
November 30, 2012
GROUNDWATER LEVELS
Groundwater levels are not direct indicators of seawater intrusion, but indirectly
suggest opportunities for seawater intrusion. Coastal groundwater levels at or
near sea level are not sufficient to repel seawater intrusion, and will likely allow
some level of seawater intrusion unless groundwater levels increase.
TRENDS
Groundwater level hydrographs representative of well pairs in the Northern
Coastal subarea and a shallow well in the Southern Coastal subarea are shown
on Figure 25.
NORTHERN COASTAL SUBAREA
Groundwater level data from the PCA-East well are representative of
groundwater levels in the Northern Coastal subarea, downgradient of nearby
production wells. This hydrograph shows the effect of production from the
nearby CAW production wells on groundwater levels in the deep zone. In the
deep zone, groundwater levels are well below sea level and September 2012
groundwater elevations are the lowest on record. The hydrograph peaks and
lows are strongly influenced by pumping and/or injection occurring in the area
upgradient of the monitoring well when the groundwater level measurements
were taken. Other influences such as tides which can cause up to a one foot
fluctuation in the deep completion of PCA-East also need to be recognized.
Because of all the possible influences on groundwater levels, it is difficult to
compare the present year to the previous year directly. What is more important
is to look at the long-term trends. PCA-East deep on Figure 25 shows an overall
decline in groundwater levels until 2009, levels more or less stabilize the next
two years, and over the last two years have shown a decline to the current low
elevation of -27 feet amsl. The decline in groundwater levels in the deep
completion of PCA-East corresponds with the shift in CAW’s production from
their shallow Paso Robles wells to deeper Santa Margarita wells.
It is important to note that the Santa Margarita Sandstone has limited connection
to the ocean and is highly confined by the layers above it. This means that the
amount of recharge entering the Santa Margarita Sandstone is limited and is
therefore always susceptible to depletion if more water is pumped than is being
recharged.
- 46 - WY 2012 Seawater Intrusion Analysis Report
November 30, 2012
The amount of water injected into the deep Santa Margarita aquifer was
essentially the same amount that was extracted as part of the aquifer storage and
recovery program.
In the shallow zone, recent groundwater levels have stabilized over the past
several years (Figure 25). Seasonal level increases seen in the data are usually
related to reduced wintertime production in the shallow aquifer, and increased
pumping during summer. Although the shallow seasonal fluctuations
correspond with deep zone fluctuations, it is because seasonal pumping occurs
in both aquifers, and not because the aquifers are closely connected.
SOUTHERN COASTAL SUBAREA
In the Southern Coastal subarea, the KMART monitoring well is representative
of groundwater levels near the coast (Figure 25). The hydrograph shows that
groundwater elevations have always been above sea level and have continued to
remain stable over time.
GROUNDWATER ELEVATION MAPS
SECOND QUARTER WATER YEAR 2012 (JANUARY-MARCH 2012)
Groundwater level maps for the shallow and deep aquifer zones for the
2nd quarter of Water Year 2012 are shown on Figure 26 and Figure 27
respectively.
The shallow aquifer does not show seasonal fluctuations to the same extent as
the deep aquifer. The groundwater level contours for Water Year 2012 remains
essentially the same along the coast and in the Laguna Seca subarea. The
Northern Coastal subarea pumping depression is slightly larger and deeper than
the previous year due to lowered groundwater levels, as discussed under the
groundwater level trends section above. In the eastern part of the Northern
Inland subarea, an area of the shallow aquifer has been indicated to be
potentially dry due to geologic structural control (Figure 26).
Second quarter groundwater levels in the deep aquifer, particularly along the
coast, are generally higher than 4th quarter groundwater levels by up to 10 feet
due to the seasonal variations seen on Figure 25. Overall, groundwater
elevations in the coastal subareas have declined approximately five feet over the
- 47 - WY 2012 Seawater Intrusion Analysis Report
November 30, 2012
past water year. Groundwater elevations in the Laguna Seca subarea have
dropped between 1 - 3 feet from the previous water year, and its pumping
depression has increased slightly.
FOURTH QUARTER WATER YEAR 2012 (JULY-AUGUST 2012)
Groundwater elevation maps for the shallow and deep aquifer zones for the
4th quarter of Water Year 2012 are shown on Figure 28 and Figure 29 respectively.
The contours for the shallow aquifer show that levels are stable since last water
year in the Northern Coastal subarea (Figure 28). The 4th quarter deep zone
groundwater elevations (Figure 29) show the largest changes over last water
year, with a decrease of 2 – 4 feet at the coast, over 20 feet deepening of the
Northern Coastal subarea pumping depression, and a decrease of between 2 – 4
feet in the Laguna Seca subarea.
The pumping depression around CAW’s main production wells in the Northern
Coastal subarea has increased to deeper than 40 feet below sea level contour.
This is due to the addition of the MPWMD Santa Margarita well pumping by
CAW to assist in recovery of injected water and the change in CAW pumping
operations from shallow wells to deep wells. The impact of increased pumping
from the area has increased the instantaneous pumping depression caused when
all wells are operating at the same time.
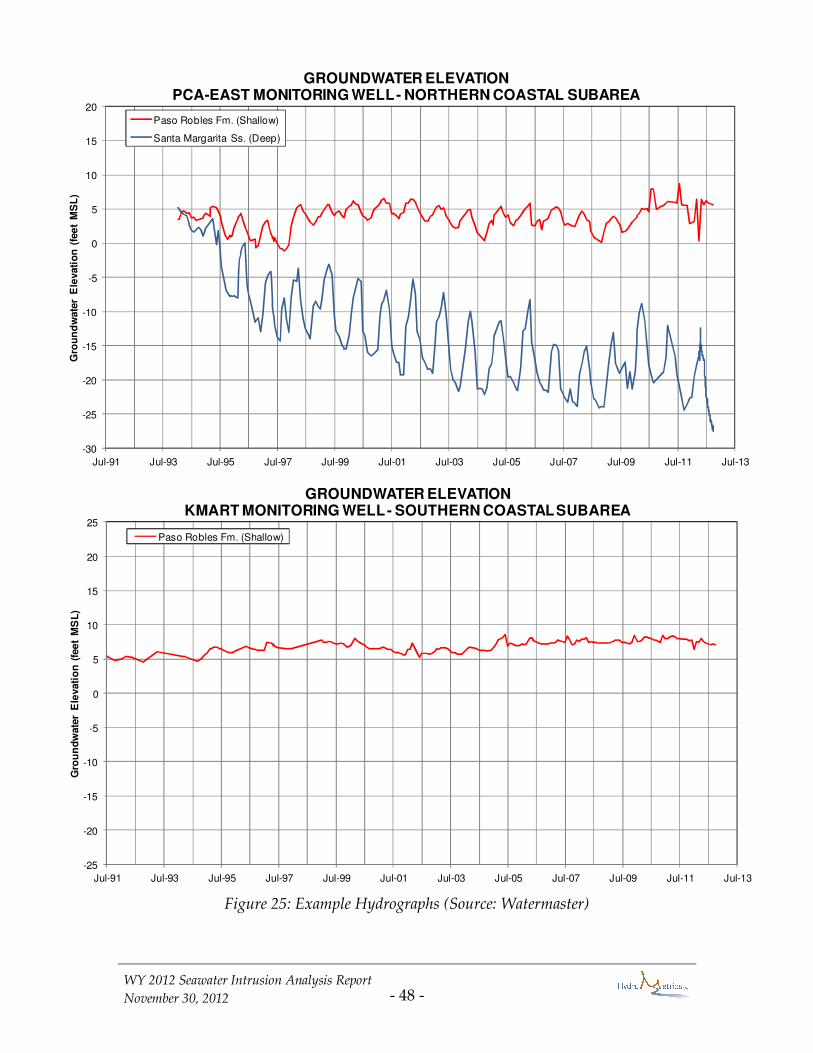
- 48 - WY 2012 Seawater Intrusion Analysis Report
November 30, 2012
Figure 25: Example Hydrographs (Source: Watermaster)
-25
-20
-15
-10
-5
0
5
10
15
20
25
Jul-91 Jul-93 Jul-95 Jul-97 Jul-99 Jul-01 Jul-03 Jul-05 Jul-07 Jul-09 Jul-11 Jul-13
Gro
un
dw
ate
r E
levati
on
(fe
et
MS
L)
GROUNDWATER ELEVATIONKMART MONITORING WELL - SOUTHERN COASTAL SUBAREA
Paso Robles Fm. (Shallow)
-30
-25
-20
-15
-10
-5
0
5
10
15
20
Jul-91 Jul-93 Jul-95 Jul-97 Jul-99 Jul-01 Jul-03 Jul-05 Jul-07 Jul-09 Jul-11 Jul-13
Gro
un
dw
ate
r E
levati
on
(fe
et
MS
L)
GROUNDWATER ELEVATIONPCA-EAST MONITORING WELL - NORTHERN COASTAL SUBAREA
Paso Robles Fm. (Shallow)
Santa Margarita Ss. (Deep)
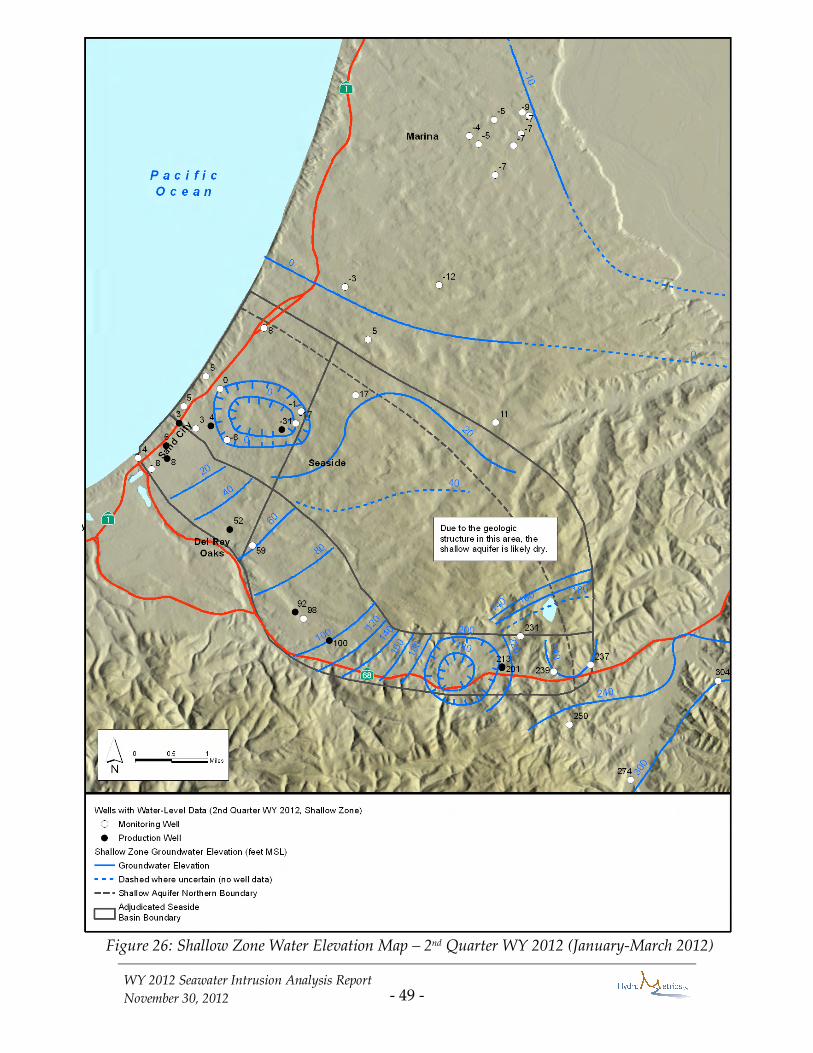
- 49 - WY 2012 Seawater Intrusion Analysis Report
November 30, 2012
Figure 26: Shallow Zone Water Elevation Map – 2nd Quarter WY 2012 (January-March 2012)
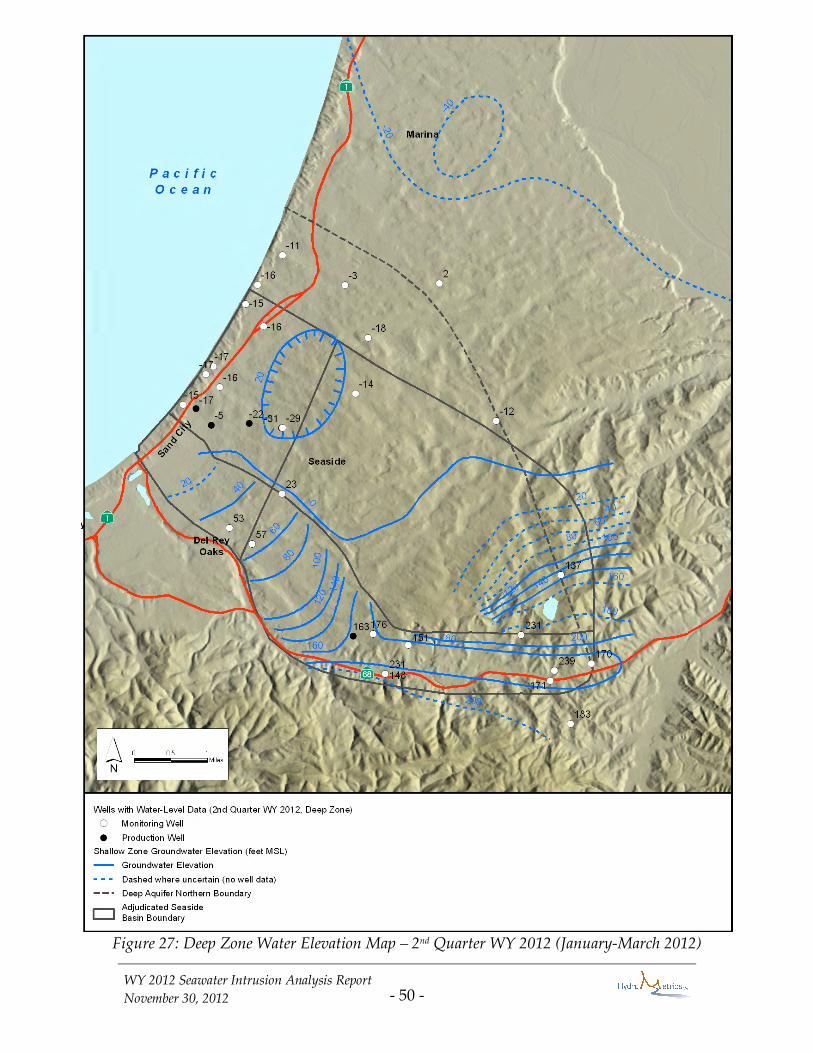
- 50 - WY 2012 Seawater Intrusion Analysis Report
November 30, 2012
Figure 27: Deep Zone Water Elevation Map – 2nd Quarter WY 2012 (January-March 2012)

- 51 - WY 2012 Seawater Intrusion Analysis Report
November 30, 2012
Figure 28: Shallow Zone Water Elevation Map – 4th Quarter WY 2012 (July/August 2012)
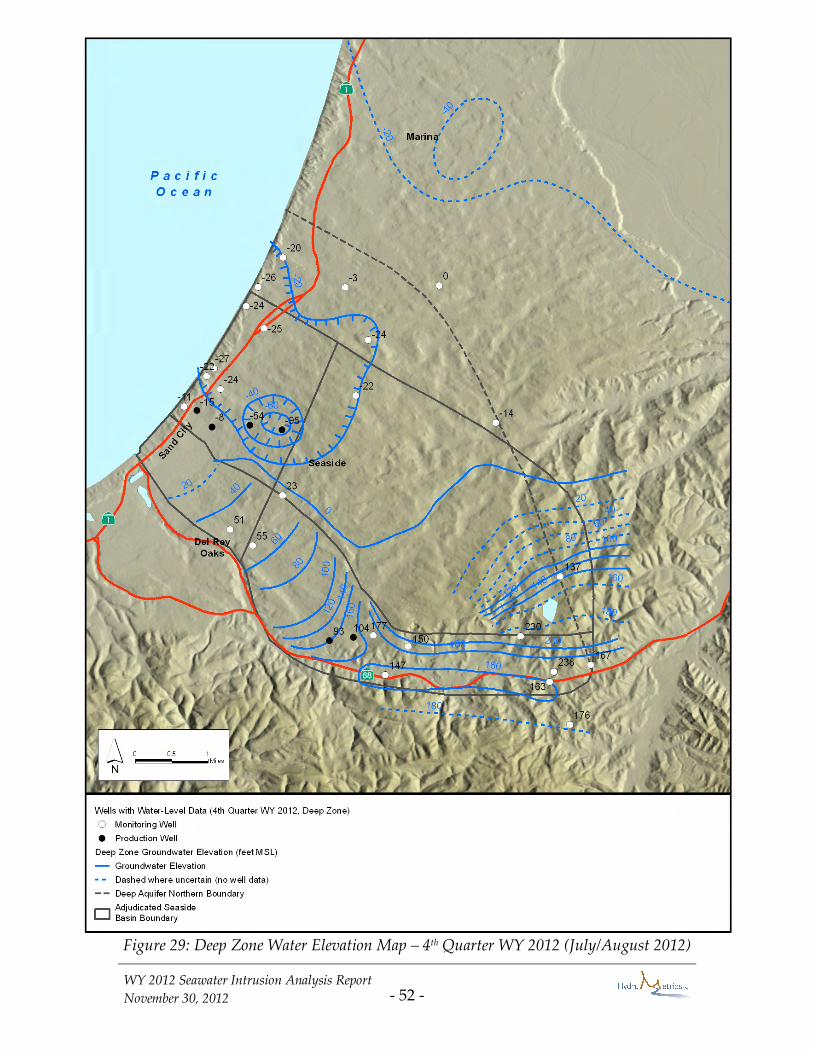
- 52 - WY 2012 Seawater Intrusion Analysis Report
November 30, 2012
Figure 29: Deep Zone Water Elevation Map – 4th Quarter WY 2012 (July/August 2012)

- 53 - WY 2012 Seawater Intrusion Analysis Report
November 30, 2012
PUMPING
Groundwater pumping in excess of freshwater recharge and subsurface inflow
from adjacent areas is the primary cause of seawater intrusion. Mapping
pumping volumes gives an indirect indication of the threat of seawater intrusion.
Ideally, pumping should be equally distributed throughout a basin, and occur
relatively far inland.
Net or reported pumping by Watermaster producers in Water Year 2012 was
3,832.9 acre-feet, which is 318.6 acre-feet less than Water Year 2011. Annual
reported production for Water Year 2012 was less than the Court-ordered
operating yield of 4,480 acre-feet (Figure 31). Net pumping is the amount
pumped after the aquifer storage and recovery program is taken into account.
This means that more water is actually pumped from CAW’s wells to recover
water injected the previous operational year.
The blue charts on Figure 30 reflect the actual or gross amounts pumped from
each well, and the green chart reflects the amount of water injected during Water
Year 2012. As with previous years, the majority of pumping occurs at CAW’s
Ord Grove 2 and Paralta wells. These wells, together with the MPWMD’s Santa
Margarita well were also used for recovery of injected water. CAW continued to
move production from older shallow wells to those wells completed in the
deeper Santa Margarita aquifer. The influence of this operational change is
evident from the increased pumping depression in the deep aquifer on Figure 29.

- 54 - WY 2012 Seawater Intrusion Analysis Report
November 30, 2012
Figure 30: Watermaster Producers’ Pumping Distribution for Water Years 2011 and 2012
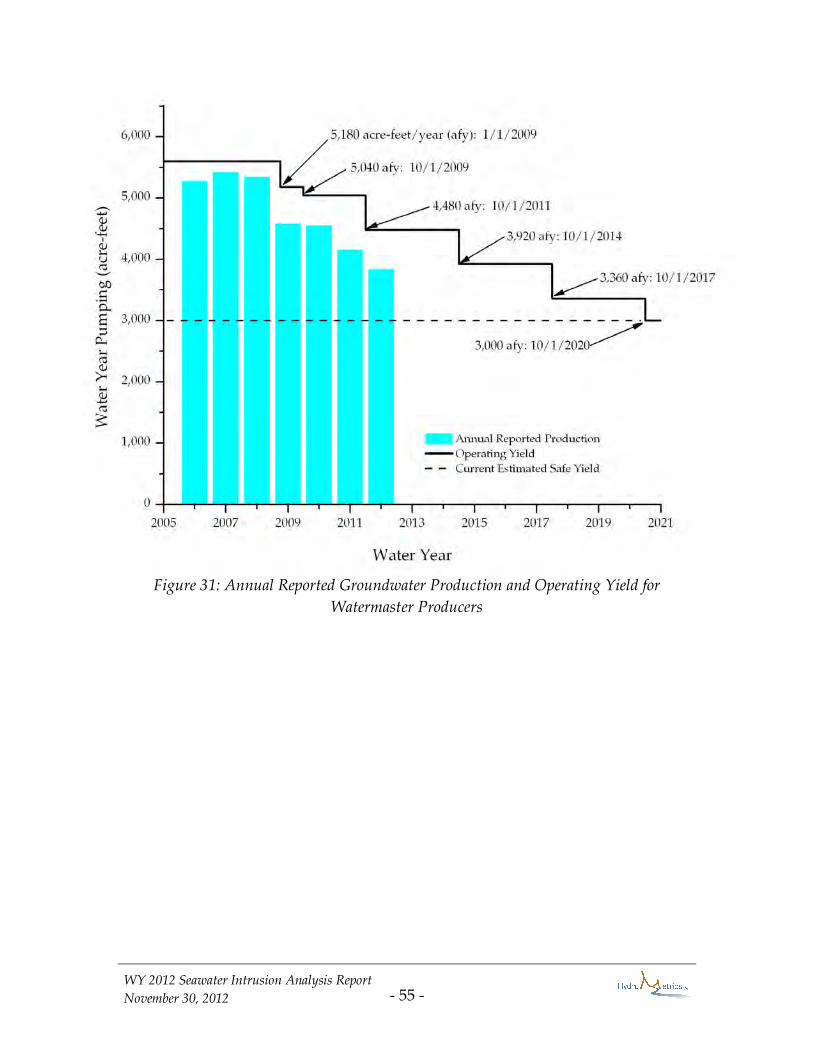
- 55 - WY 2012 Seawater Intrusion Analysis Report
November 30, 2012
Figure 31: Annual Reported Groundwater Production and Operating Yield for
Watermaster Producers

- 56 - WY 2012 Seawater Intrusion Analysis Report
November 30, 2012
PROTECTIVE GROUNDWATER ELEVATIONS
Preliminary protective groundwater elevations were determined in 2009 using
the Seaside Groundwater Basin groundwater flow model and cross-sectional
modeling (HydroMetrics LLC, 2009b). Preliminary protective elevations for both
the deep and shallow aquifers were established for monitoring well pairs with
both a shallow and deep completion. Preliminary protective elevations are
shown in Table 1.
Table 1: Summary of Preliminary Protective Elevation Monitoring Locations
Subarea Well Completion Protective Elevation,
Feet above sea level
Northern Coastal
MSC Deep 17
Shallow 11
PCA-W Deep 17
Shallow 2
Sentinel Well 3 Deep 4
Southern Coastal CDM-MW4 Shallow 2
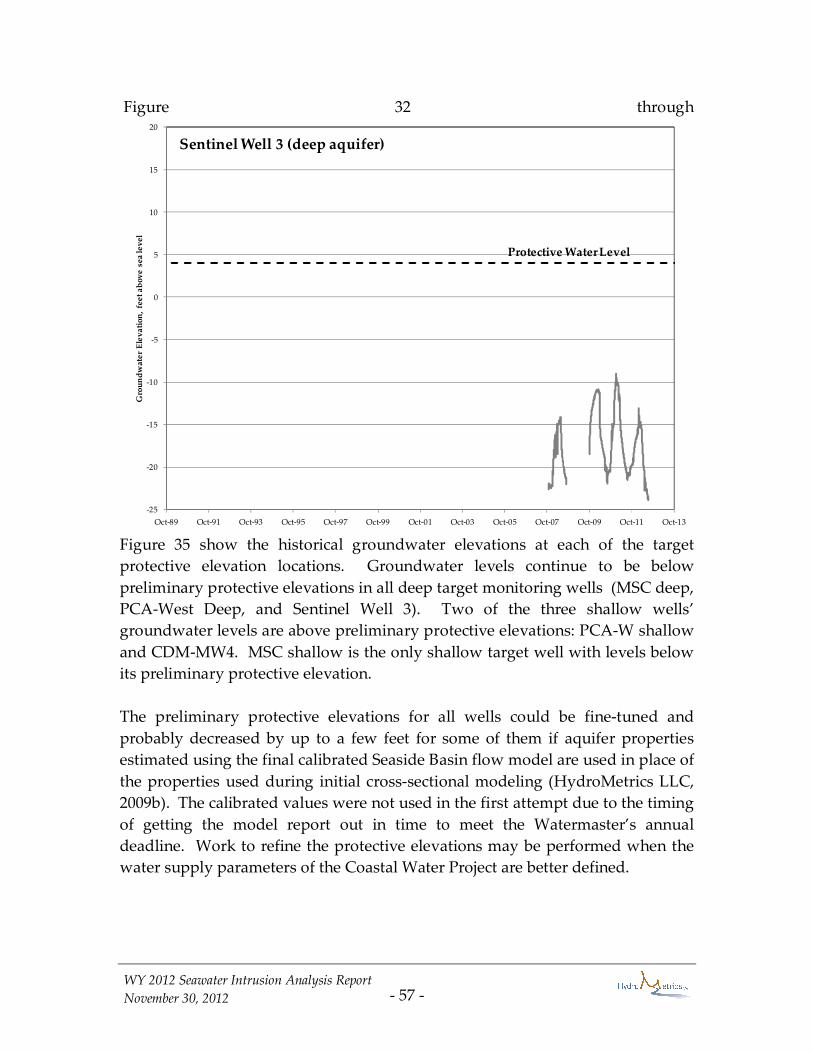
- 57 - WY 2012 Seawater Intrusion Analysis Report
November 30, 2012
Figure 32 through
Figure 35 show the historical groundwater elevations at each of the target
protective elevation locations. Groundwater levels continue to be below
preliminary protective elevations in all deep target monitoring wells (MSC deep,
PCA-West Deep, and Sentinel Well 3). Two of the three shallow wells’
groundwater levels are above preliminary protective elevations: PCA-W shallow
and CDM-MW4. MSC shallow is the only shallow target well with levels below
its preliminary protective elevation.
The preliminary protective elevations for all wells could be fine-tuned and
probably decreased by up to a few feet for some of them if aquifer properties
estimated using the final calibrated Seaside Basin flow model are used in place of
the properties used during initial cross-sectional modeling (HydroMetrics LLC,
2009b). The calibrated values were not used in the first attempt due to the timing
of getting the model report out in time to meet the Watermaster’s annual
deadline. Work to refine the protective elevations may be performed when the
water supply parameters of the Coastal Water Project are better defined.
-25
-20
-15
-10
-5
0
5
10
15
20
Oct-89 Oct-91 Oct-93 Oct-95 Oct-97 Oct-99 Oct-01 Oct-03 Oct-05 Oct-07 Oct-09 Oct-11 Oct-13
Gro
un
dw
ate
r E
lev
ati
on
, fe
et
ab
ov
e s
ea
lev
el
Sentinel Well 3 (deep aquifer)
Protective Water Level

- 58 - WY 2012 Seawater Intrusion Analysis Report
November 30, 2012
Figure 32: MSC Deep and Shallow Groundwater and Preliminary Protective Elevations
-25
-20
-15
-10
-5
0
5
10
15
20
Oct-89 Oct-91 Oct-93 Oct-95 Oct-97 Oct-99 Oct-01 Oct-03 Oct-05 Oct-07 Oct-09 Oct-11 Oct-13
Gro
un
dw
ate
r E
lev
ati
on
, fe
et
ab
ov
e s
ea
lev
el
MSC Deep Protective Water Level
-25
-20
-15
-10
-5
0
5
10
15
20
Oct-89 Oct-91 Oct-93 Oct-95 Oct-97 Oct-99 Oct-01 Oct-03 Oct-05 Oct-07 Oct-09 Oct-11 Oct-13
Gro
un
dw
ate
r E
lev
ati
on
, fe
et
ab
ov
e s
ea
lev
el
MSC Shallow
Protective Water Level

- 59 - WY 2012 Seawater Intrusion Analysis Report
November 30, 2012
Figure 33: PCA West Deep and Shallow Groundwater and Preliminary Protective Elevations
-25
-20
-15
-10
-5
0
5
10
15
20
Oct-89 Oct-91 Oct-93 Oct-95 Oct-97 Oct-99 Oct-01 Oct-03 Oct-05 Oct-07 Oct-09 Oct-11 Oct-13
Gro
un
dw
ate
r E
lev
ati
on
, fe
et
ab
ov
e s
ea
lev
el
PCA West Deep Protective Water Level
-25
-20
-15
-10
-5
0
5
10
15
20
Oct-89 Oct-91 Oct-93 Oct-95 Oct-97 Oct-99 Oct-01 Oct-03 Oct-05 Oct-07 Oct-09 Oct-11 Oct-13
Gro
un
dw
ate
r E
lev
ati
on
, fe
et
ab
ov
e s
ea
lev
el
PCA West Shallow
Protective Water Level
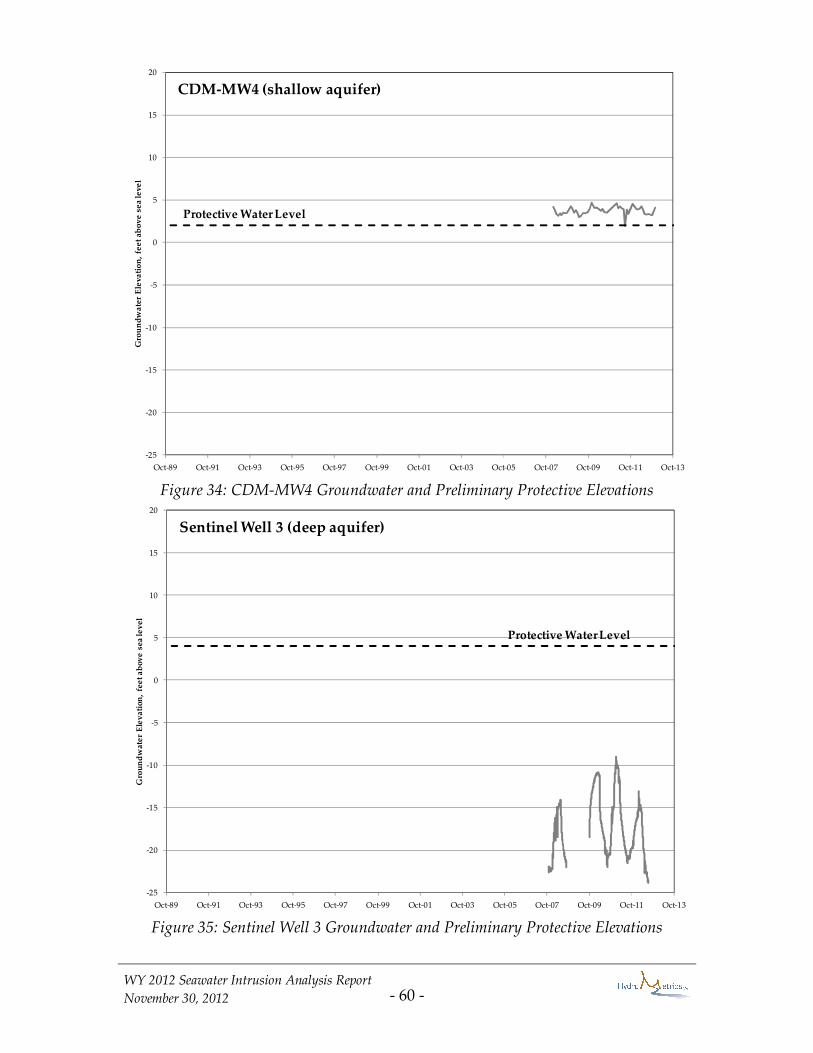
- 60 - WY 2012 Seawater Intrusion Analysis Report
November 30, 2012
Figure 34: CDM-MW4 Groundwater and Preliminary Protective Elevations
Figure 35: Sentinel Well 3 Groundwater and Preliminary Protective Elevations
-25
-20
-15
-10
-5
0
5
10
15
20
Oct-89 Oct-91 Oct-93 Oct-95 Oct-97 Oct-99 Oct-01 Oct-03 Oct-05 Oct-07 Oct-09 Oct-11 Oct-13
Gro
un
dw
ate
r E
lev
ati
on
, fe
et
ab
ov
e s
ea
lev
el
Sentinel Well 3 (deep aquifer)
Protective Water Level
-25
-20
-15
-10
-5
0
5
10
15
20
Oct-89 Oct-91 Oct-93 Oct-95 Oct-97 Oct-99 Oct-01 Oct-03 Oct-05 Oct-07 Oct-09 Oct-11 Oct-13
Gro
un
dw
ate
r E
lev
ati
on
, fe
et
ab
ov
e s
ea
lev
el
CDM-MW4 (shallow aquifer)
Protective Water Level

- 61 - WY 2012 Seawater Intrusion Analysis Report
November 30, 2012
This page left
intentionally blank

- 62 - WY 2012 Seawater Intrusion Analysis Report
November 30, 2012
SECTION 4
CONCLUSIONS
Depressed groundwater levels below sea level, continued pumping in excess of
recharge and fresh water inflows, and ongoing seawater intrusion in the nearby
Salinas Valley all suggest that seawater intrusion could occur in the Seaside
Groundwater Basin. In spite of these factors, no seawater intrusion is currently
observed in existing monitoring or production wells. Analyses which indicate
that seawater intrusion is not occurring include:
• All water samples for Water Year 2012 from depth-discreet monitoring
wells plot generally in a single cluster on Piper diagrams, with no water
chemistry changes towards seawater.
• Water quality in some of the production wells is different than the water
quality in the monitoring wells. This may be a result of mixed water
quality from both shallow and deep zones in which these wells are
perforated. The production wells’ water qualities are not indicative of
seawater intrusion.
• Stiff diagrams of production wells were not indicative of incipient
seawater intrusion.
• Wells with increasing chloride concentrations over the past year are: PCA-
West Deep, sentinel well SBWM-4 shallow, and SBWM-4 deep. The
September 2012 chloride concentration in the PCA-West Deep well is only
4 mg/L below the chloride threshold value of 186 mg/L established in the
Seawater Intrusion Response Plan (SIRP) for this well (HydroMetrics WRI,
2009c). The sentinel wells do not have chloride threshold values,
however, the deep sample from well SBWM-4 is above the secondary
MCL of 250 mg/L. The increasing trend seen in the shallow and deep
samples from well SBWM-4 start at the same time as the PCA-West Deep
well’s increasing trend. Well SBWM-4 should be sampled quarterly at the
same time as the PCA-West Deep well so that results can be correlated.
No other increases from the current monitoring frequency are warranted.
Quarterly data from PCA-West Deep and SBWM-4 need to be evaluated
each quarter after results are received from the laboratory.
- 63 - WY 2012 Seawater Intrusion Analysis Report
November 30, 2012
• The PCA-West Deep well and sentinel well SBWM-4 are the only wells
with decreasing sodium/chloride ratios. If these trends continue and drop
below 0.86, it could indicate seawater intrusion.
• Maps of chloride concentrations for the shallow aquifer do not show
chlorides increasing towards the coast. The deep aquifer maps show that
higher chloride concentrations are limited to coastal monitoring wells
PCA-West Deep and sentinel well SBWM-4.
• Induction logging data at the coastal Sentinel wells do not indicate
changes indicative of seawater intrusion.
• Groundwater production in the Seaside Groundwater Basin for Water
Year 2012 was 3,832.9 acre-feet, which is 318.6 acre-feet less than Water
Year 2011. This amount is less than the Court-mandated operating yield
of 4,480 acre-feet per year that is required between October 1, 2011 and
October 1, 2014.
• Groundwater levels remain below preliminary protective elevations in all
deep target monitoring wells (MSC deep, PCA-W, and Sentinel Well 3).
Two of the three shallow wells’ groundwater levels are above protective
elevations: PCA-W shallow and CDM-MW4. MSC shallow remains below
preliminary protective elevations.
In spite of the definitive geochemical data, groundwater level and pumping data
suggest that a potential for seawater intrusion exists. Northern Coastal subarea
groundwater levels in the deep zone remain below sea level (Figure 27 and
Figure 29). Two potential processes may explain why no seawater intrusion has
not yet been observed in the deep coastal wells:
• The location of seawater/fresh water interface is currently unknown. It is,
however, sufficiently far offshore in the deep zone that it has not reached
the coastal monitoring wells. A seawater interface may be moving
towards the coast, but may take some years to arrive. Before the interface
arrives, pumping will mine much of the fresh water stored beneath the
ocean in the lower aquifer.
• Overlying aquifers and aquitards limit or prevent seawater from
percolating into the lower aquifer. Groundwater level data and results
from groundwater modeling suggest that this condition is occurring.
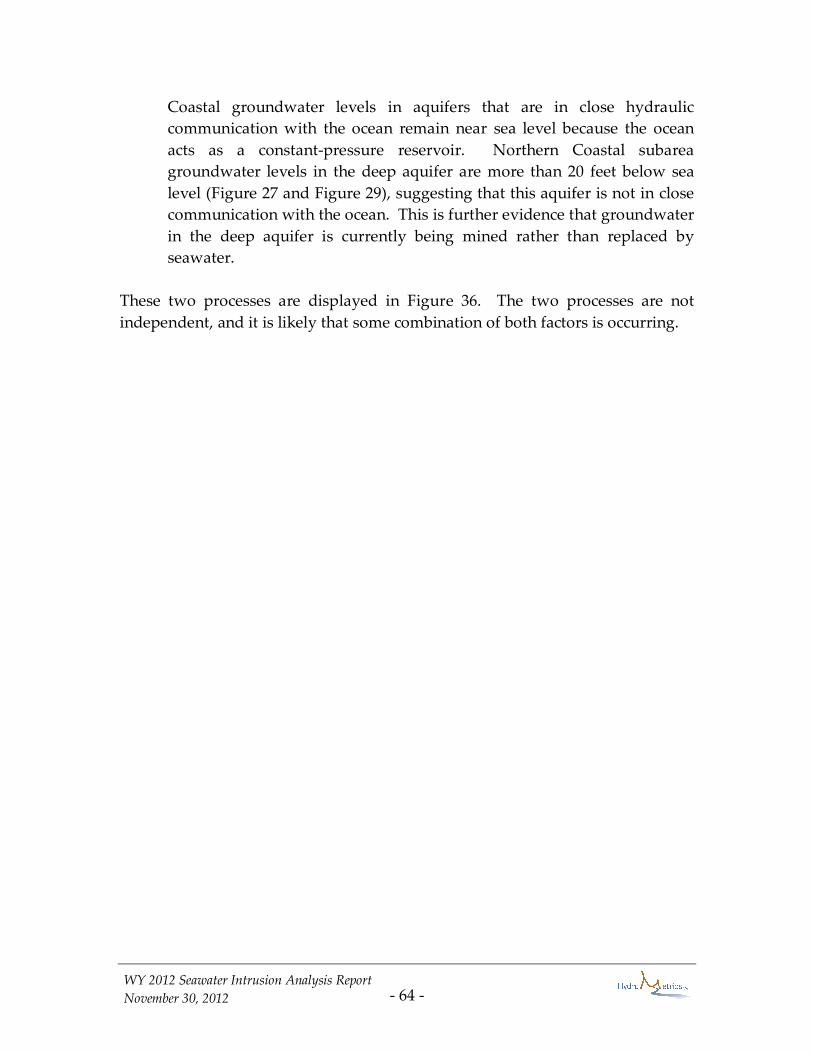
- 64 - WY 2012 Seawater Intrusion Analysis Report
November 30, 2012
Coastal groundwater levels in aquifers that are in close hydraulic
communication with the ocean remain near sea level because the ocean
acts as a constant-pressure reservoir. Northern Coastal subarea
groundwater levels in the deep aquifer are more than 20 feet below sea
level (Figure 27 and Figure 29), suggesting that this aquifer is not in close
communication with the ocean. This is further evidence that groundwater
in the deep aquifer is currently being mined rather than replaced by
seawater.
These two processes are displayed in Figure 36. The two processes are not
independent, and it is likely that some combination of both factors is occurring.
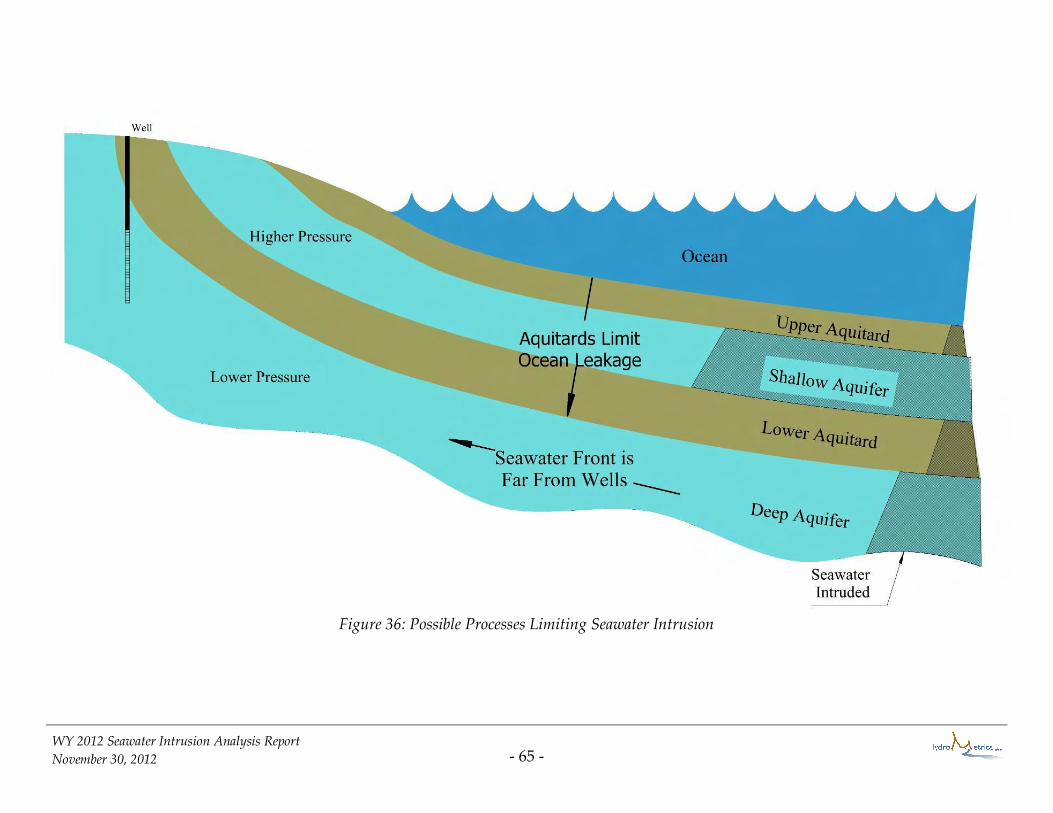
- 65 - WY 2012 Seawater Intrusion Analysis Report
November 30, 2012
Figure 36: Possible Processes Limiting Seawater Intrusion
- 66 - WY 2012 Seawater Intrusion Analysis Report
November 30, 2012
SECTION 5
RECOMMENDATIONS
The analyses presented previously in this report are based on existing data.
While informative, the data are spatially incomplete and temporally sporadic.
The following recommendations should be implemented to monitor and track
seawater intrusion. They are the same recommendations as were made last year.
ANALYZE DATA FROM PCA-WEST DEEP QUARTERLY
Increasing chloride concentrations, decreasing sodium/chloride molar ratio, and
chloride concentrations approaching the chloride threshold justify increasing
how often data from well PCA-West Deep is evaluated. In the past, access issues
have prevented sampling in the first quarter of the water year. However, every
effort must be made to collect a sample in the first quarter of WY 2013 to confirm
the observed trends. Additionally, due to a change in sampling method from
airlifting to micropurging in 2009, it would be prudent to collect samples using
both methods to verify whether the change in water quality is an artifact of the
sampling method. After each quarterly sampling event at this well, the data
must be analyzed and documented.
INITIATE QUARTERLY WATER QUALITY SAMPLING AND ANALYSIS FOR
SENTINEL WELL SBWM-4
Because nearby monitoring well PCA-West Deep has an increasing chloride
trend with decreasing sodium/chloride molar ratio, sampling at SBWM-4 needs
to increase its sampling frequency from semi-annual to quarterly so that a direct
comparison can be made with the quarterly samples collected at PCA-West
Deep.
EVALUATE WATER QUALITY AT SAND CITY PUBLIC WORKS CORP YARD
WELL
Due to the evolving water type observed in its Piper diagram, the source of the
irregular water quality at this well needs to be evaluated. The Piper and Stiff
diagrams, and sodium/chloride molar ratio suggest that the source of high
chloride is not seawater, however, this needs to be confirmed by further
investigation into historical water quality of the area around the well.

- 67 - WY 2012 Seawater Intrusion Analysis Report
November 30, 2012
WATERMASTER TO REQUEST COMPLETE SAMPLE ANALYSIS FOR
PRODUCTION WELLS
When Watermaster makes its annual request to producers for water quality data,
the request will state that full results from one sample are to be reported. This
ensures that the anions and cations balance and that anion/cation analyses can be
carried out for this report.
CONTINUE TO ANALYZE AND REPORT ON WATER QUALITY ANNUALLY
Seawater intrusion is a threat, and data must be analyzed regularly to identify
incipient intrusion. Maps, graphs, and analyses similar to what are found in this
report should continue to be developed every year.
REFINE PRELIMINARY SHALLOW PROTECTIVE GROUNDWATER
ELEVATIONS
Once the water supply parameters of the Coastal Water Project are better
defined, we recommend that the preliminary protective groundwater elevations
be refined using final calibrated aquifer properties from the Seaside Basin
groundwater flow model. We expect that the protective elevations will decrease
by a few feet, which will make them more practical to meet.

- 68 - WY 2012 Seawater Intrusion Analysis Report
November 30, 2012
SECTION 6
REFERENCES
Barlow, P. M., 2003. Ground Water in freshwater-saltwater environments of the
Atlantic coast, U.S. Geological Survey Circular 1262, 113 p.
Feeney, M.B., 2007. Seaside Groundwater Basin Watermaster seawater sentinel wells
project - summary of operations, prepared for Seaside Groundwater Basin
Watermaster.
Hem, J.D., 1989. Study and interpretation of the chemical characteristics of natural
water, USGS water supply paper 2254, 3rd edition.
HydroMetrics LLC, 2008. Seawater intrusion analysis report, prepared for the
Seaside Groundwater Basin Watermaster, October 2008.
, 2009a. Water year 2009 seawater intrusion analysis report, prepared for the
Seaside Groundwater Basin Watermaster, October 2009.
, 2009b. Seaside groundwater basin modeling and protective groundwater
elevations, prepared for the Seaside Groundwater Basin Watermaster, October
2009.
, 2009c. Seawater intrusion response plan, Seaside basin, Monterey County,
California, prepared for the Seaside Groundwater Basin Watermaster,
February 2009.
, 2010. Water year 2010 seawater intrusion analysis report, prepared for the
Seaside Groundwater Basin Watermaster, October 2010.
, 2011. Water year 2011 seawater intrusion analysis report, prepared for the
Seaside Groundwater Basin Watermaster, November 2011.
RBF, 2007. Seawater intrusion analysis report, Seaside Groundwater Basin, Monterey
County, California, prepared for Seaside Groundwater Basin Watermaster by
RBF and HydroMetrics, LLC.
Jones, B.F., A. Vengosh, E. Rosenthal, and Y. Yechieli, 1999. Geochemical
investigations, in Bear, Jacob, and others, eds., Seawater intrusion in coastal
aquifers—Concepts, methods and practices, Dordrecht, The Netherlands, Kluwer
Academic Publishers, p. 51–71.
Paillet, F.L., 2001. Integrating surface and borehole geophysics in the characterization
of salinity in a coastal aquifer. Proceedings of The First International
Conference on Saltwater Intrusion and Coastal Aquifers -- Monitoring,

- 69 - WY 2012 Seawater Intrusion Analysis Report
November 30, 2012
Modeling, and Management, Essaouira, Morocco, Workshops -- April 18-21,
2001, Conference -- April 23-25, 2001.
Richter, B.C., and C.W. Kreitler, 1993. Geochemical techniques for identifying sources
of ground-water salinization, Boca Raton, Fla., C.K. Smoley (CRC Press, Inc.),
258 p.
Seaside Groundwater Basin Watermaster, 2006. Seaside Basin Monitoring and
Management Program, May 17, 24 pp.
Yates, E.B., M.B. Feeney, and L.I. Rosenberg, 2005. Seaside groundwater basin:
update on water resources conditions, prepared for Monterey Peninsula Water
Management District.
APPENDIX A: PIPER DIAGRAMS
FOR INDIVIDUAL WELLS

A-1
Figure A-1: Piper Diagram of PCA West Shallow
C A T I O N S A N I O N S%meq/l
Na+K HCO +CO3 3 Cl
Mg SO4
CaCalcium (Ca) Chloride (Cl)
Sul
fate
(SO4)
+ C
hlorid
e (C
l)
Calciu
m (C
a) + M
agnesium
(Mg)
Carb
onat
e (C
O3)
+ B
icar
bona
te (
HCO3)
Sodiu
m (N
a) + Potassiu
m (K)
Sulfate
(SO4)M
agnes
ium
(Mg)
80 60 40 20 20 40 60 80
80
60
40
20
20
40
60
80
20
40
60
80
80
60
40
20
20
40
60
80
20
40
60
80
80
60
40
20
80
60
40
20
10/24/2006
10/30/2007
3/27/2008
8/18/2008
1/28/2009
7/28/2009
1/11/2011
4/28/2011
7/25/2011
3/29/2012
6/18/2012
9/26/2012
Seawater (typical)
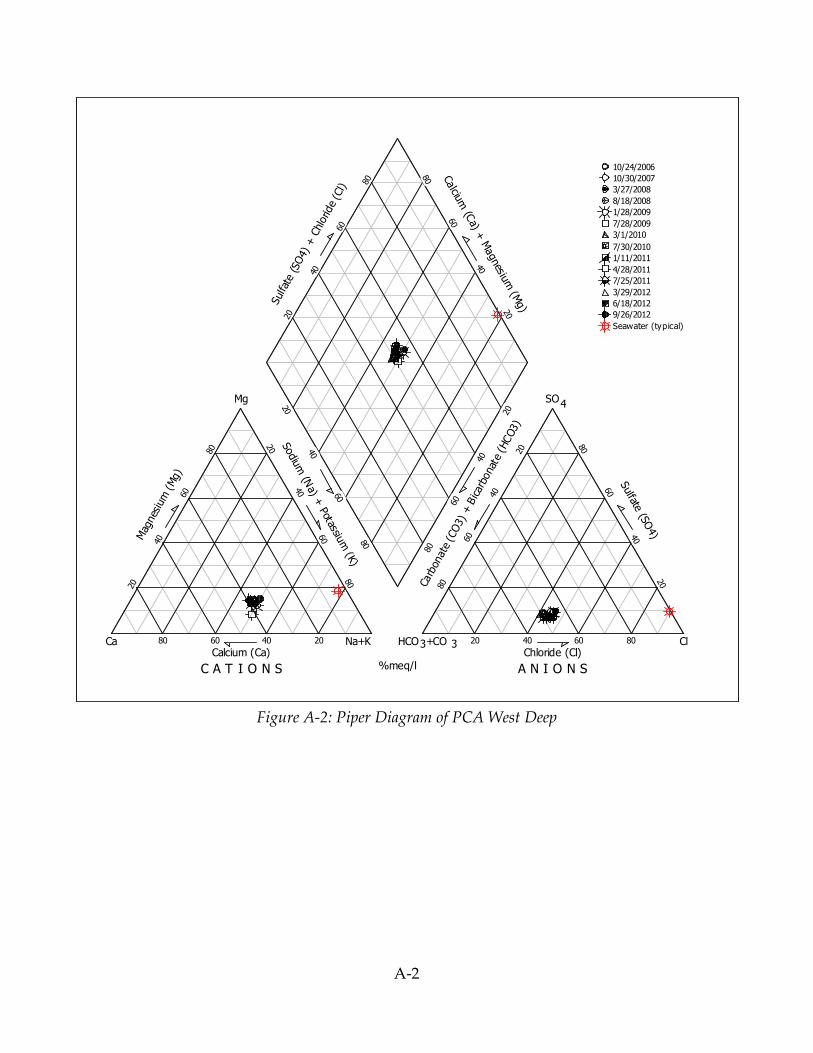
A-2
Figure A-2: Piper Diagram of PCA West Deep
C A T I O N S A N I O N S%meq/l
Na+K HCO +CO3 3 Cl
Mg SO4
CaCalcium (Ca) Chloride (Cl)
Sul
fate
(SO4)
+ C
hlorid
e (C
l)
Calciu
m (C
a) + M
agnesium
(Mg)
Carb
onat
e (C
O3)
+ B
icar
bona
te (
HCO3)
Sodiu
m (N
a) + Potassiu
m (K)
Sulfate
(SO4)M
agnes
ium
(Mg)
80 60 40 20 20 40 60 80
80
60
40
20
20
40
60
80
20
40
60
80
80
60
40
20
20
40
60
80
20
40
60
80
80
60
40
20
80
60
40
20
10/24/2006
10/30/2007
3/27/2008
8/18/2008
1/28/2009
7/28/2009
3/1/2010
7/30/2010
1/11/2011
4/28/2011
7/25/2011
3/29/2012
6/18/2012
9/26/2012
Seawater (typical)

A-3
Figure A-3: Piper Diagram of PCA East Shallow
C A T I O N S A N I O N S%meq/l
Na+K HCO +CO3 3 Cl
Mg SO4
CaCalcium (Ca) Chloride (Cl)
Sul
fate
(SO4)
+ C
hlorid
e (C
l)
Calciu
m (C
a) + M
agnesium
(Mg)
Carb
onat
e (C
O3)
+ B
icar
bona
te (
HCO3)
Sodiu
m (N
a) + Potassiu
m (K)
Sulfate
(SO4)M
agnes
ium
(Mg)
80 60 40 20 20 40 60 80
80
60
40
20
20
40
60
80
20
40
60
80
80
60
40
20
20
40
60
80
20
40
60
80
80
60
40
20
80
60
40
20
10/24/2006
10/30/2007
8/19/2008
7/27/2009
7/28/2010
7/27/2011
7/17/2012
Seawater (typical)

A-4
Figure A-4: Piper Diagram of PCA East Deep
C A T I O N S A N I O N S%meq/l
Na+K HCO +CO3 3 Cl
Mg SO4
CaCalcium (Ca) Chloride (Cl)
Sul
fate
(SO4)
+ C
hlorid
e (C
l)
Calciu
m (C
a) + M
agnesium
(Mg)
Carb
onat
e (C
O3)
+ B
icar
bona
te (
HCO3)
Sodiu
m (N
a) + Potassiu
m (K)
Sulfate
(SO4)M
agnes
ium
(Mg)
80 60 40 20 20 40 60 80
80
60
40
20
20
40
60
80
20
40
60
80
80
60
40
20
20
40
60
80
20
40
60
80
80
60
40
20
80
60
40
20
10/24/2006
10/30/2007
8/19/2008
7/27/2009
7/28/2010
7/27/2011
3/26/2012
6/19/2012
Seawater (typical)

A-5
Figure A-5: Piper Diagram of Ord Terrace Shallow
C A T I O N S A N I O N S%meq/l
Na+K HCO +CO3 3 Cl
Mg SO4
CaCalcium (Ca) Chloride (Cl)
Sul
fate
(SO4)
+ C
hlorid
e (C
l)
Calciu
m (C
a) + M
agnesium
(Mg)
Carb
onat
e (C
O3)
+ B
icar
bona
te (
HCO3)
Sodiu
m (N
a) + Potassiu
m (K)
Sulfate
(SO4)M
agnes
ium
(Mg)
80 60 40 20 20 40 60 80
80
60
40
20
20
40
60
80
20
40
60
80
80
60
40
20
20
40
60
80
20
40
60
80
80
60
40
20
80
60
40
20
10/24/2006
10/31/2007
8/19/2008
7/31/2009
8/25/2010
8/1/2011
7/16/2012
Seawater (typical)
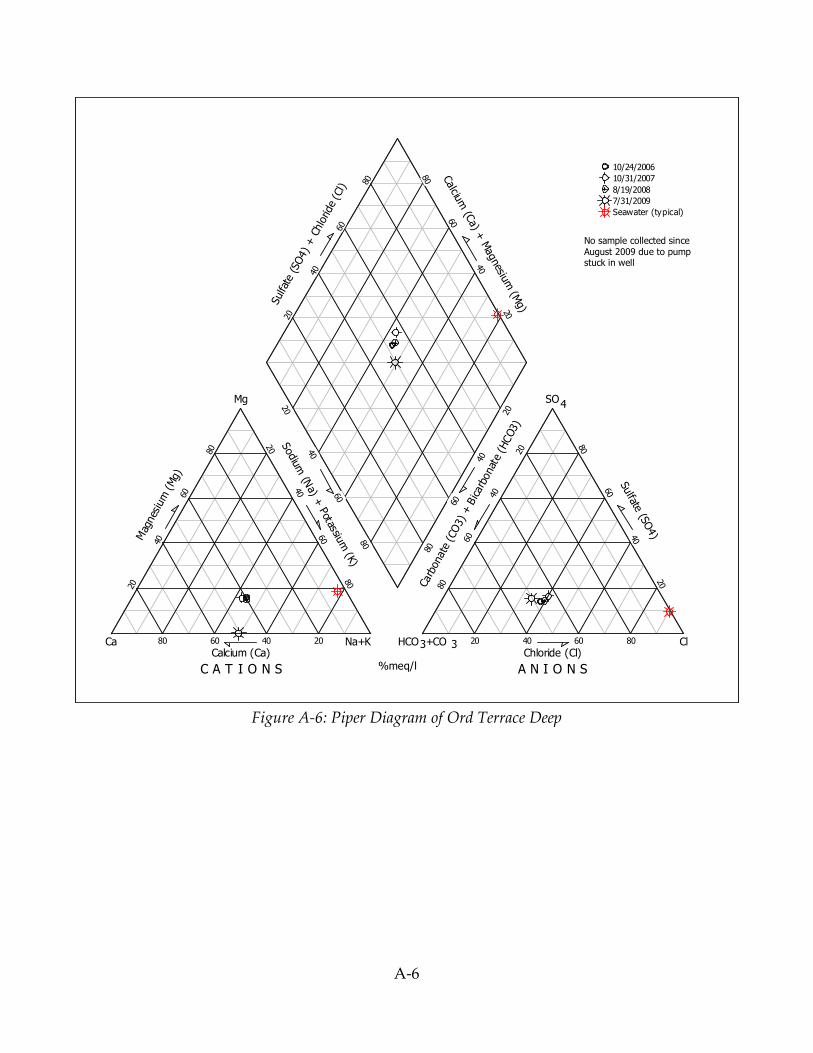
A-6
Figure A-6: Piper Diagram of Ord Terrace Deep
C A T I O N S A N I O N S%meq/l
Na+K HCO +CO3 3 Cl
Mg SO4
CaCalcium (Ca) Chloride (Cl)
Sul
fate
(SO
4) +
Chlo
ride
(Cl)
Calciu
m (C
a) + M
agnesium
(Mg)
Carb
onat
e (C
O3) + B
icarb
onat
e (H
CO3)
Sod
ium (N
a) + P
otassium
(K)
Sulfate
(SO4)M
agnes
ium
(Mg)
80 60 40 20 20 40 60 80
80
60
40
20
20
40
60
80
20
40
60
80
80
60
40
20
20
40
60
80
20
40
60
80
80
60
40
20
80
60
40
20
10/24/2006
10/31/2007
8/19/2008
7/31/2009
Seawater (typical)
No sample collected since August 2009 due to pump stuck in well

A-7
Figure A-7: Piper Diagram of MSC Shallow
C A T I O N S A N I O N S%meq/l
Na+K HCO +CO3 3 Cl
Mg SO4
CaCalcium (Ca) Chloride (Cl)
Sul
fate
(SO4)
+ C
hlorid
e (C
l)
Calciu
m (C
a) + M
agnesium
(Mg)
Carb
onat
e (C
O3)
+ B
icar
bona
te (
HCO3)
Sodiu
m (N
a) + Potassiu
m (K)
Sulfate
(SO4)M
agnes
ium
(Mg)
80 60 40 20 20 40 60 80
80
60
40
20
20
40
60
80
20
40
60
80
80
60
40
20
20
40
60
80
20
40
60
80
80
60
40
20
80
60
40
20
1/29/2008
8/19/2008
1/28/2009
7/23/2009
2/23/2010
7/27/2010
1/11/2011
4/28/2011
7/26/2011
3/29/2012
6/18/2012
9/26/2012
Seawater (typical)
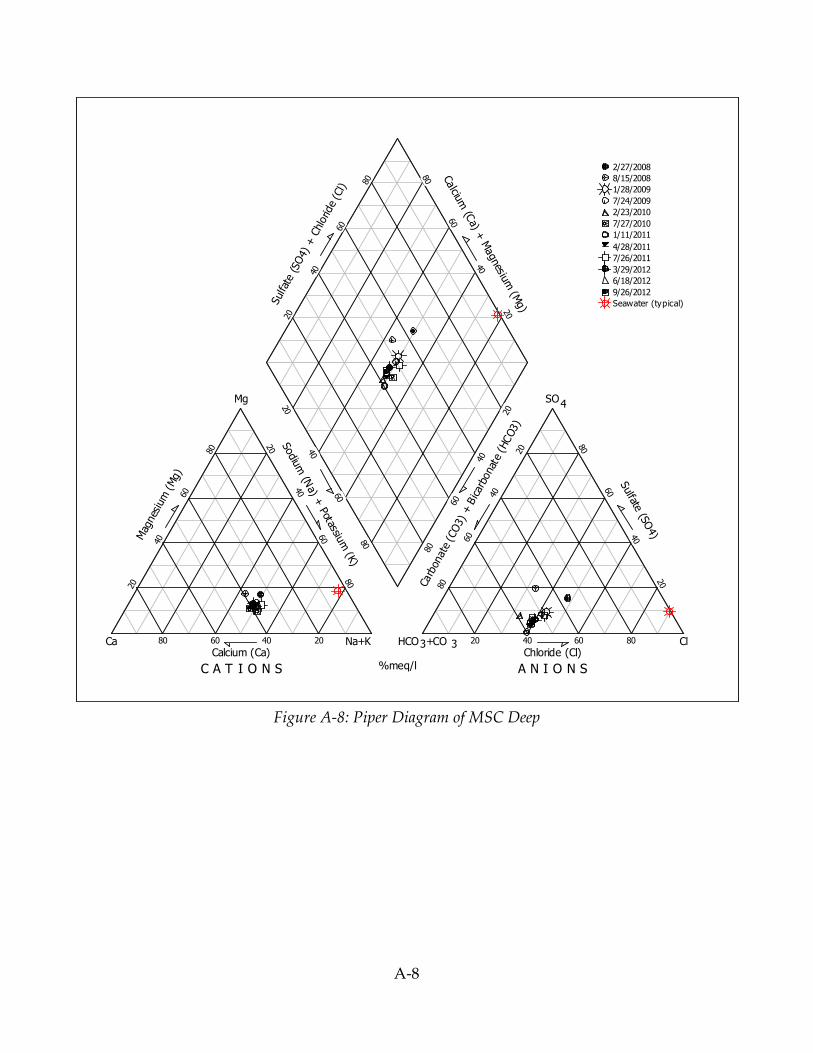
A-8
Figure A-8: Piper Diagram of MSC Deep
C A T I O N S A N I O N S%meq/l
Na+K HCO +CO3 3 Cl
Mg SO4
CaCalcium (Ca) Chloride (Cl)
Sul
fate
(SO4)
+ C
hlorid
e (C
l)
Calciu
m (C
a) + M
agnesium
(Mg)
Carb
onat
e (C
O3)
+ B
icar
bona
te (
HCO3)
Sodiu
m (N
a) + Potassiu
m (K)
Sulfate
(SO4)M
agnes
ium
(Mg)
80 60 40 20 20 40 60 80
80
60
40
20
20
40
60
80
20
40
60
80
80
60
40
20
20
40
60
80
20
40
60
80
80
60
40
20
80
60
40
20
2/27/2008
8/15/2008
1/28/2009
7/24/2009
2/23/2010
7/27/2010
1/11/2011
4/28/2011
7/26/2011
3/29/2012
6/18/2012
9/26/2012
Seawater (typical)

A-9
Figure A-9: Piper Diagram of Fort Ord 9 Shallow
C A T I O N S A N I O N S%meq/l
Na+K HCO +CO3 3 Cl
Mg SO4
CaCalcium (Ca) Chloride (Cl)
Sul
fate
(SO4)
+ C
hlorid
e (C
l)
Calciu
m (C
a) + M
agnesium
(Mg)
Carb
onat
e (C
O3)
+ B
icar
bona
te (
HCO3)
Sodiu
m (N
a) + Potassiu
m (K)
Sulfate
(SO4)M
agnes
ium
(Mg)
80 60 40 20 20 40 60 80
80
60
40
20
20
40
60
80
20
40
60
80
80
60
40
20
20
40
60
80
20
40
60
80
80
60
40
20
80
60
40
20
10/25/2006
10/31/2007
8/18/2008
8/5/2009
11/17/2009
2/22/2010
7/28/2010
1/11/2011
7/25/2011
3/29/2012
6/18/2012
9/26/2012
Seawater (typical)
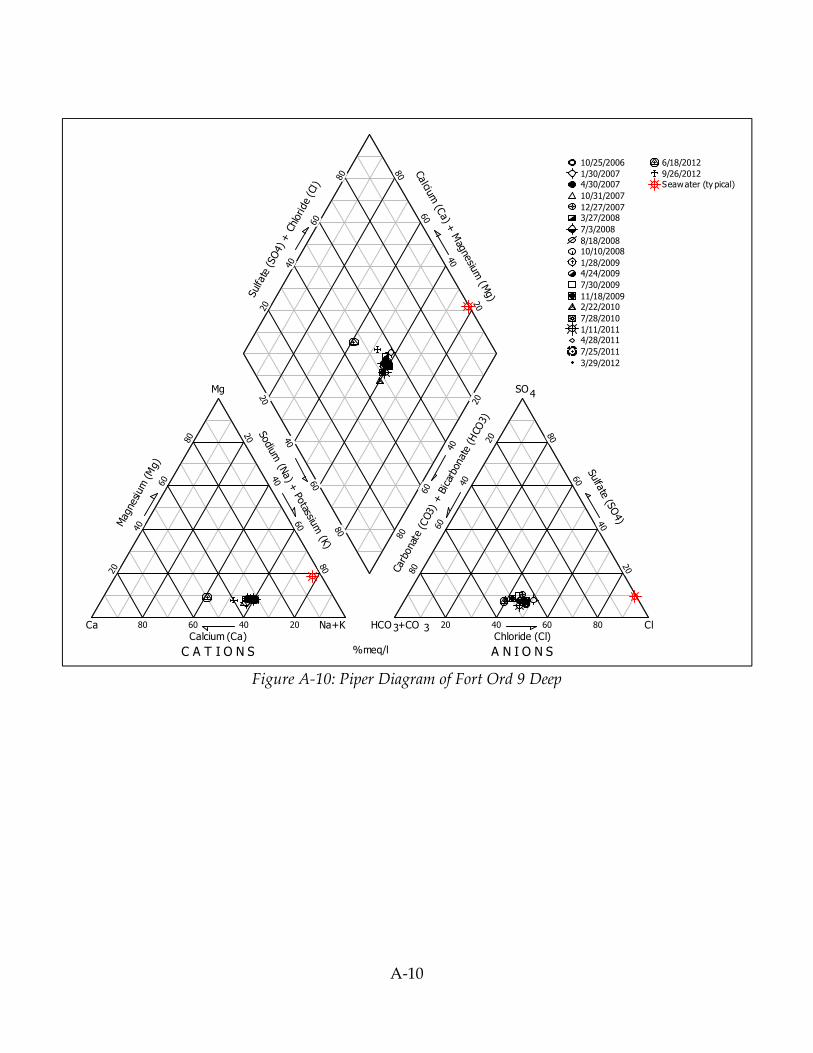
A-10
Figure A-10: Piper Diagram of Fort Ord 9 Deep
C A T I O N S A N I O N S%meq/l
Na+K HCO +CO3 3 Cl
Mg SO4
CaCalcium (Ca) Chloride (Cl)
Sul
fate
(SO4) +
Chloride
(Cl)
Calcium
(Ca) +
Mag
nesiu
m (M
g)
Car
bona
te (CO3)
+ B
icar
bon
ate (H
CO3)
Sodium
(Na) +
Potassiu
m (K)
Sulfa
te (SO
4)
Mag
nesium
(M
g)
80 60 40 20 20 40 60 80
80
60
40
20
20
40
60
80
20
40
60
80
80
60
40
20
20
40
60
8020
40
60
80
80
60
40
20
80
60
40
20
10/25/2006
1/30/20074/30/2007
10/31/2007
12/27/20073/27/2008
7/3/2008
8/18/200810/10/2008
1/28/20094/24/2009
7/30/2009
11/18/20092/22/2010
7/28/2010
1/11/20114/28/2011
7/25/2011
3/29/2012
6/18/2012
9/26/2012Seawater (ty pical)

A-11
Figure A-11: Piper Diagram of Fort Ord 10 Shallow
C A T I O N S A N I O N S%meq/l
Na+K HCO +CO3 3 Cl
Mg SO4
CaCalcium (Ca) Chloride (Cl)
Sul
fate
(SO4)
+ C
hlorid
e (C
l)
Calciu
m (C
a) + M
agnesium
(Mg)
Carb
onat
e (C
O3)
+ B
icar
bona
te (
HCO3)
Sodiu
m (N
a) + Potassiu
m (K)
Sulfate
(SO4)M
agnes
ium
(Mg)
80 60 40 20 20 40 60 80
80
60
40
20
20
40
60
80
20
40
60
80
80
60
40
20
20
40
60
80
20
40
60
80
80
60
40
20
80
60
40
20
10/25/2006
10/31/2007
8/18/2008
8/5/2009
8/5/2010
8/1/2011
7/16/2012
Seawater (typical)
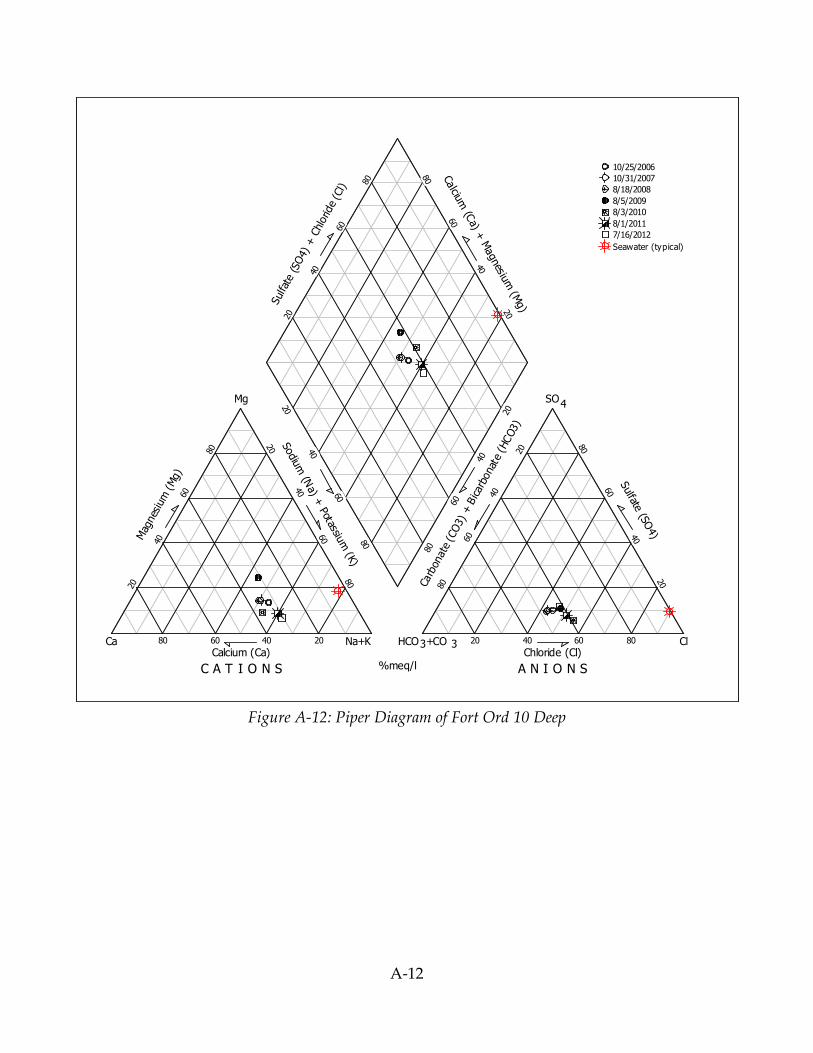
A-12
Figure A-12: Piper Diagram of Fort Ord 10 Deep
C A T I O N S A N I O N S%meq/l
Na+K HCO +CO3 3 Cl
Mg SO4
CaCalcium (Ca) Chloride (Cl)
Sul
fate
(SO4)
+ C
hlorid
e (C
l)
Calciu
m (C
a) + M
agnesium
(Mg)
Carb
onat
e (C
O3)
+ B
icar
bona
te (
HCO3)
Sodiu
m (N
a) + Potassiu
m (K)
Sulfate
(SO4)M
agnes
ium
(Mg)
80 60 40 20 20 40 60 80
80
60
40
20
20
40
60
80
20
40
60
80
80
60
40
20
20
40
60
80
20
40
60
80
80
60
40
20
80
60
40
20
10/25/2006
10/31/2007
8/18/2008
8/5/2009
8/3/2010
8/1/2011
7/16/2012
Seawater (typical)
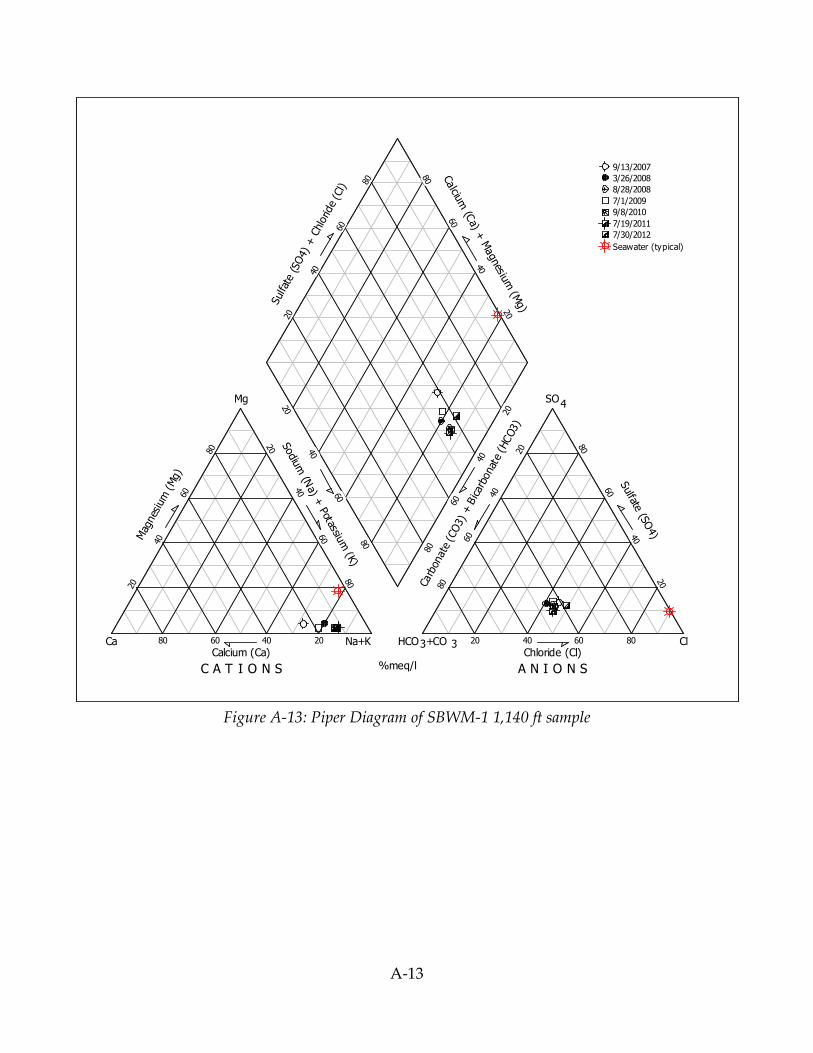
A-13
Figure A-13: Piper Diagram of SBWM-1 1,140 ft sample
C A T I O N S A N I O N S%meq/l
Na+K HCO +CO3 3 Cl
Mg SO4
CaCalcium (Ca) Chloride (Cl)
Sul
fate
(SO4)
+ C
hlorid
e (C
l)
Calciu
m (C
a) + M
agnesium
(Mg)
Carb
onat
e (C
O3)
+ B
icar
bona
te (
HCO3)
Sodiu
m (N
a) + Potassiu
m (K)
Sulfate
(SO4)M
agnes
ium
(Mg)
80 60 40 20 20 40 60 80
80
60
40
20
20
40
60
80
20
40
60
80
80
60
40
20
20
40
60
80
20
40
60
80
80
60
40
20
80
60
40
20
9/13/2007
3/26/2008
8/28/2008
7/1/2009
9/8/2010
7/19/2011
7/30/2012
Seawater (typical)

A-14
Figure A-14: Piper Diagram of SBWM-1 1,390 ft sample
C A T I O N S A N I O N S%meq/l
Na+K HCO +CO3 3 Cl
Mg SO4
CaCalcium (Ca) Chloride (Cl)
Sul
fate
(SO4)
+ C
hlorid
e (C
l)
Calciu
m (C
a) + M
agnesium
(Mg)
Carb
onat
e (C
O3)
+ B
icar
bona
te (
HCO3)
Sodiu
m (N
a) + Potassiu
m (K)
Sulfate
(SO4)M
agnes
ium
(Mg)
80 60 40 20 20 40 60 80
80
60
40
20
20
40
60
80
20
40
60
80
80
60
40
20
20
40
60
80
20
40
60
80
80
60
40
20
80
60
40
20
9/13/2007
3/26/2008
8/28/2008
7/1/2009
9/8/2010
7/19/2011
7/30/2012
Seawater (typical)

A-15
Figure A-15: Piper Diagram of SBWM-2 1,000 ft sample
C A T I O N S A N I O N S%meq/l
Na+K HCO +CO3 3 Cl
Mg SO4
CaCalcium (Ca) Chloride (Cl)
Sul
fate
(SO4)
+ C
hlorid
e (C
l)
Calciu
m (C
a) + M
agnesium
(Mg)
Carb
onat
e (C
O3)
+ B
icar
bona
te (
HCO3)
Sodiu
m (N
a) + Potassiu
m (K)
Sulfate
(SO4)M
agnes
ium
(Mg)
80 60 40 20 20 40 60 80
80
60
40
20
20
40
60
80
20
40
60
80
80
60
40
20
20
40
60
80
20
40
60
80
80
60
40
20
80
60
40
20
9/24/2007
3/26/2008
8/28/2008
7/1/2009
9/8/2010
7/19/2011
7/30/2012
Seawater (typical)
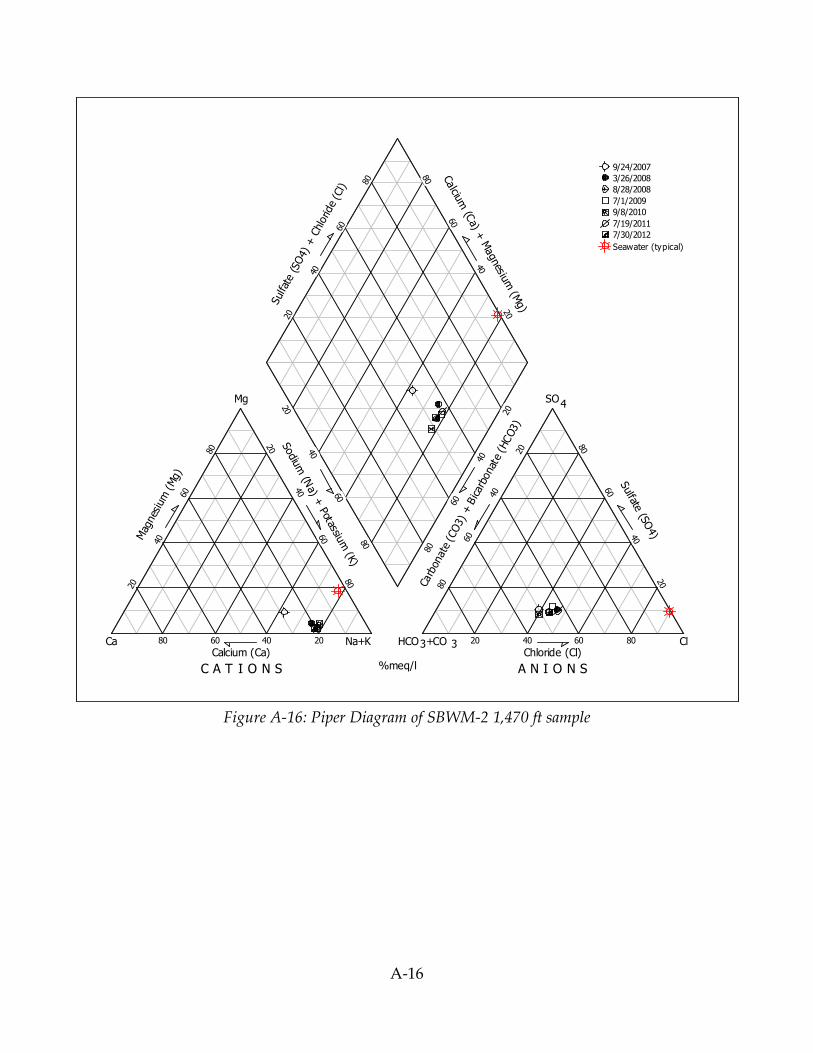
A-16
Figure A-16: Piper Diagram of SBWM-2 1,470 ft sample
C A T I O N S A N I O N S%meq/l
Na+K HCO +CO3 3 Cl
Mg SO4
CaCalcium (Ca) Chloride (Cl)
Sul
fate
(SO4)
+ C
hlorid
e (C
l)
Calciu
m (C
a) + M
agnesium
(Mg)
Carb
onat
e (C
O3)
+ B
icar
bona
te (
HCO3)
Sodiu
m (N
a) + Potassiu
m (K)
Sulfate
(SO4)M
agnes
ium
(Mg)
80 60 40 20 20 40 60 80
80
60
40
20
20
40
60
80
20
40
60
80
80
60
40
20
20
40
60
80
20
40
60
80
80
60
40
20
80
60
40
20
9/24/2007
3/26/2008
8/28/2008
7/1/2009
9/8/2010
7/19/2011
7/30/2012
Seawater (typical)

A-17
Figure A-17: Piper Diagram of SBWM-3 870 ft sample
C A T I O N S A N I O N S%meq/l
Na+K HCO +CO3 3 Cl
Mg SO4
CaCalcium (Ca) Chloride (Cl)
Sul
fate
(SO4)
+ C
hlorid
e (C
l)
Calciu
m (C
a) + M
agnesium
(Mg)
Carb
onat
e (C
O3)
+ B
icar
bona
te (
HCO3)
Sodiu
m (N
a) + Potassiu
m (K)
Sulfate
(SO4)M
agnes
ium
(Mg)
80 60 40 20 20 40 60 80
80
60
40
20
20
40
60
80
20
40
60
80
80
60
40
20
20
40
60
80
20
40
60
80
80
60
40
20
80
60
40
20
9/13/2007
3/26/2008
8/28/2008
7/1/2009
9/8/2010
7/19/2011
7/30/2012
Seawater (typical)

A-18
Figure A-18: Piper Diagram of SBWM-3 1,275 ft sample
C A T I O N S A N I O N S%meq/l
Na+K HCO +CO3 3 Cl
Mg SO4
CaCalcium (Ca) Chloride (Cl)
Sul
fate
(SO4)
+ C
hlorid
e (C
l)
Calciu
m (C
a) + M
agnesium
(Mg)
Carb
onat
e (C
O3)
+ B
icar
bona
te (
HCO3)
Sodiu
m (N
a) + Potassiu
m (K)
Sulfate
(SO4)M
agnes
ium
(Mg)
80 60 40 20 20 40 60 80
80
60
40
20
20
40
60
80
20
40
60
80
80
60
40
20
20
40
60
80
20
40
60
80
80
60
40
20
80
60
40
20
9/13/2007
3/26/2008
8/28/2008
7/1/2009
9/8/2010
7/19/2011
7/30/2012
Seawater (typical)
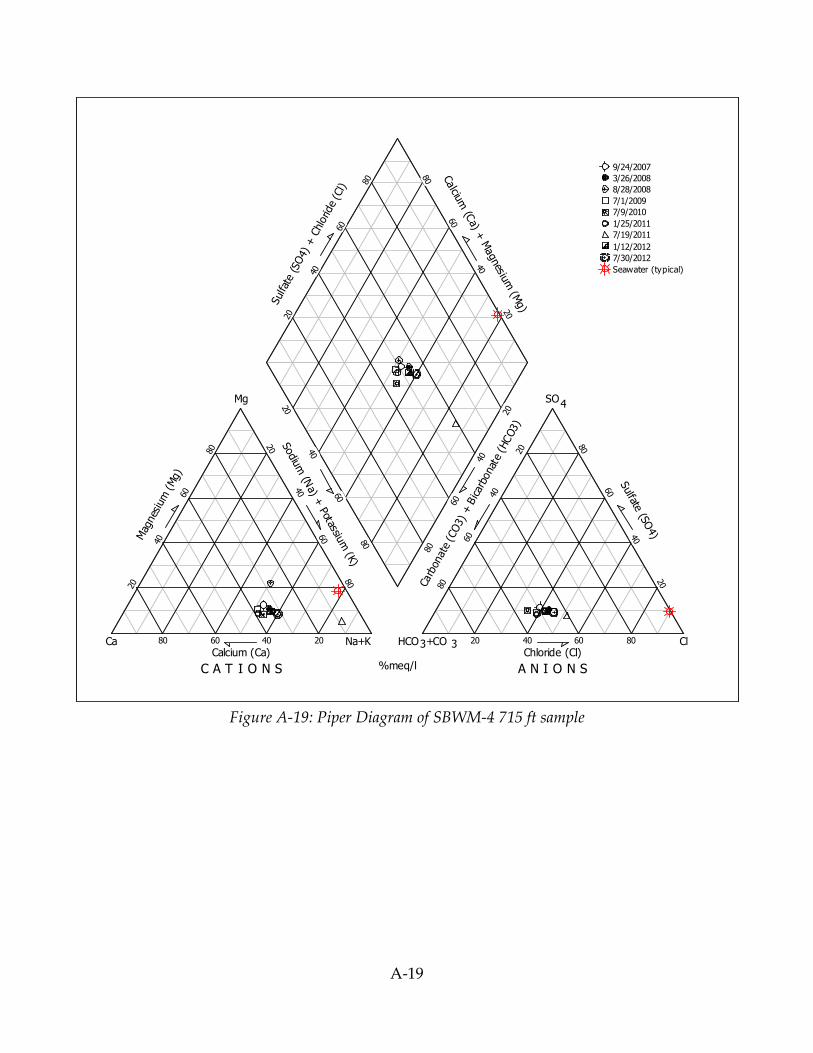
A-19
Figure A-19: Piper Diagram of SBWM-4 715 ft sample
C A T I O N S A N I O N S%meq/l
Na+K HCO +CO3 3 Cl
Mg SO4
CaCalcium (Ca) Chloride (Cl)
Sul
fate
(SO4)
+ C
hlorid
e (C
l)
Calciu
m (C
a) + M
agnesium
(Mg)
Carb
onat
e (C
O3)
+ B
icar
bona
te (
HCO3)
Sodiu
m (N
a) + Potassiu
m (K)
Sulfate
(SO4)M
agnes
ium
(Mg)
80 60 40 20 20 40 60 80
80
60
40
20
20
40
60
80
20
40
60
80
80
60
40
20
20
40
60
80
20
40
60
80
80
60
40
20
80
60
40
20
9/24/2007
3/26/2008
8/28/2008
7/1/2009
7/9/2010
1/25/2011
7/19/2011
1/12/2012
7/30/2012
Seawater (typical)
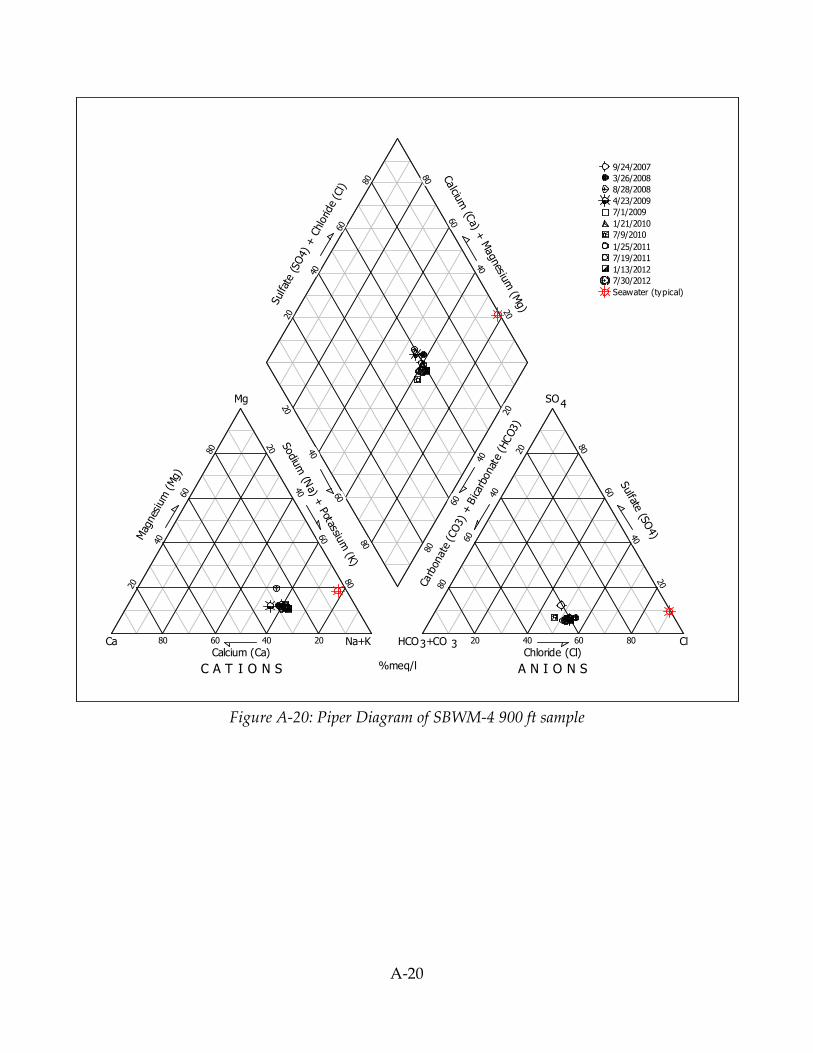
A-20
Figure A-20: Piper Diagram of SBWM-4 900 ft sample
C A T I O N S A N I O N S%meq/l
Na+K HCO +CO3 3 Cl
Mg SO4
CaCalcium (Ca) Chloride (Cl)
Sul
fate
(SO4)
+ C
hlorid
e (C
l)
Calciu
m (C
a) + M
agnesium
(Mg)
Carb
onat
e (C
O3)
+ B
icar
bona
te (
HCO3)
Sodiu
m (N
a) + Potassiu
m (K)
Sulfate
(SO4)M
agnes
ium
(Mg)
80 60 40 20 20 40 60 80
80
60
40
20
20
40
60
80
20
40
60
80
80
60
40
20
20
40
60
80
20
40
60
80
80
60
40
20
80
60
40
20
9/24/2007
3/26/2008
8/28/2008
4/23/2009
7/1/2009
1/21/2010
7/9/2010
1/25/2011
7/19/2011
1/13/2012
7/30/2012
Seawater (typical)

A-21
Figure 37: Piper Diagram of SBMW-5 Shallow Well
C A T I O N S A N I O N S%meq/l
Na+K HCO +CO3 3 Cl
Mg SO4
CaCalcium (Ca) Chloride (Cl)
Sul
fate
(SO4)
+ C
hlor
ide
(Cl)
Calcium
(Ca) +
Magn
esium
(Mg)
Car
bona
te (CO
3) +
Bicar
bona
te (
HCO3)
Sodium
(Na) +
Potassium (K)
Sulfate
(SO4)M
agne
sium
(M
g)
80 60 40 20 20 40 60 80
80
60
40
20
20
40
60
80
20
40
60
80
80
60
40
20
20
40
60
80
20
40
60
80
80
60
40
20
80
60
40
20
8/26/2010
8/2/2011
7/19/2012
Seawater (typical)

A-22
Figure 38: Piper Diagram of SBMW-5 Deep Well
C A T I O N S A N I O N S%meq/l
Na+K HCO +CO3 3 Cl
Mg SO4
CaCalcium (Ca) Chloride (Cl)
Sul
fate
(SO4)
+ C
hlor
ide
(Cl)
Calcium
(Ca) +
Magn
esium
(Mg)
Car
bona
te (CO
3) +
Bicar
bona
te (
HCO3)
Sodium
(Na) +
Potassium (K)
Sulfate
(SO4)M
agne
sium
(M
g)
80 60 40 20 20 40 60 80
80
60
40
20
20
40
60
80
20
40
60
80
80
60
40
20
20
40
60
80
20
40
60
80
80
60
40
20
80
60
40
20
8/26/2010
8/2/2011
7/19/2012
Seawater (typical)

A-23
Figure A-21: Piper Diagram of Public Works Corp. Yard Production Well
C A T I O N S A N I O N S%meq/l
Na+K HCO +CO3 3 Cl
Mg SO4
CaCalcium (Ca) Chloride (Cl)
Sul
fate
(SO4)
+ C
hlorid
e (C
l)
Calciu
m (C
a) + M
agnesium
(Mg)
Carb
onat
e (C
O3)
+ B
icar
bona
te (
HCO3)
Sodiu
m (N
a) + Potassiu
m (K)
Sulfate
(SO4)M
agnes
ium
(Mg)
80 60 40 20 20 40 60 80
80
60
40
20
20
40
60
80
20
40
60
80
80
60
40
20
20
40
60
80
20
40
60
80
80
60
40
20
80
60
40
20
2/26/2008
8/15/2008
7/6/2009
7/30/2010
7/26/2011
4/3/2012
7/11/2012
Seawater (typical)

A-24
Figure A-22: Piper Diagram of Plumas 4 Production Well
C A T I O N S A N I O N S%meq/l
Na+K HCO +CO3 3 Cl
Mg SO4
CaCalcium (Ca) Chloride (Cl)
Sulfa
te (SO4) + C
hlo
ride
(Cl)
Calciu
m (C
a) + M
agn
esium
(Mg)
Carb
ona
te (
CO3)
+ B
icar
bona
te (
HCO3)
Sod
ium (N
a) + Potassium
(K)
Sulfate
(SO4)M
agne
sium
(M
g)
80 60 40 20 20 40 60 80
80
60
40
20
20
40
60
80
20
40
60
80
80
60
40
20
20
40
60
80
20
40
60
80
80
60
40
20
80
60
40
20
1/31/2008
7/6/2009
7/6/2010
7/7/2011
Seawater (typical)
Complete anion and
cation analysis not
available for WY 2012
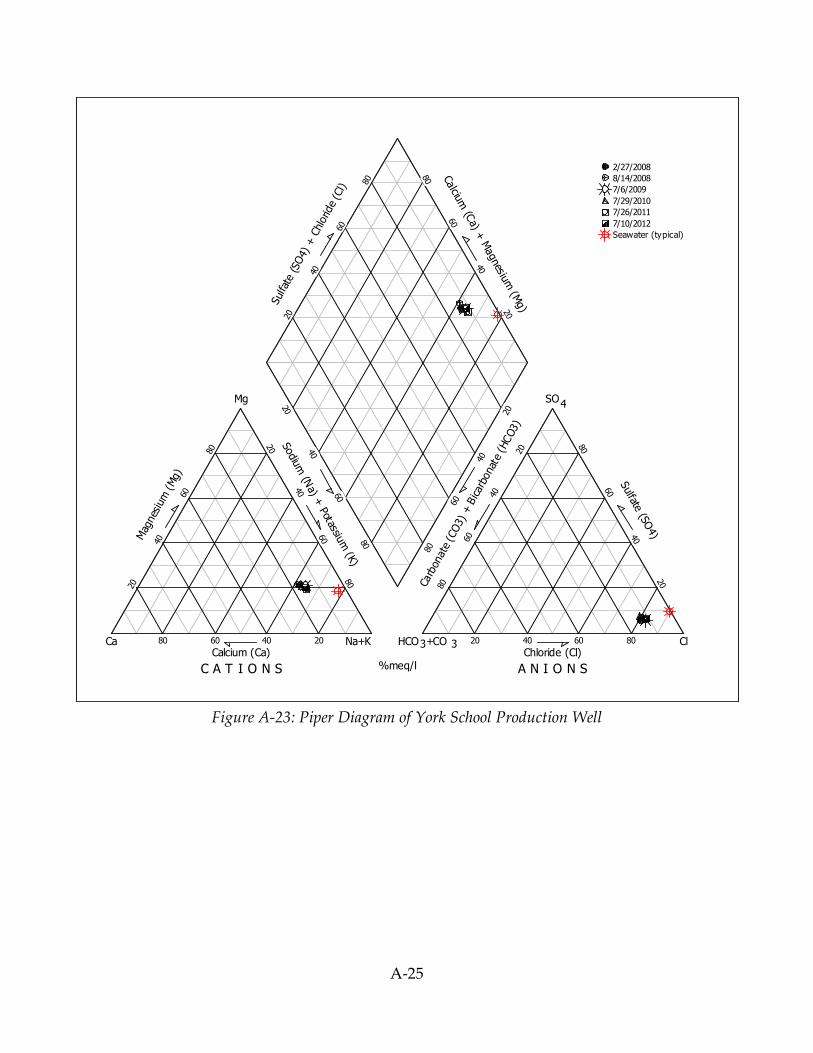
A-25
Figure A-23: Piper Diagram of York School Production Well
C A T I O N S A N I O N S%meq/l
Na+K HCO +CO3 3 Cl
Mg SO4
CaCalcium (Ca) Chloride (Cl)
Sul
fate
(SO4)
+ C
hlorid
e (C
l)
Calciu
m (C
a) + M
agnesium
(Mg)
Carb
onat
e (C
O3)
+ B
icar
bona
te (
HCO3)
Sodiu
m (N
a) + Potassiu
m (K)
Sulfate
(SO4)M
agnes
ium
(Mg)
80 60 40 20 20 40 60 80
80
60
40
20
20
40
60
80
20
40
60
80
80
60
40
20
20
40
60
80
20
40
60
80
80
60
40
20
80
60
40
20
2/27/2008
8/14/2008
7/6/2009
7/29/2010
7/26/2011
7/10/2012
Seawater (typical)
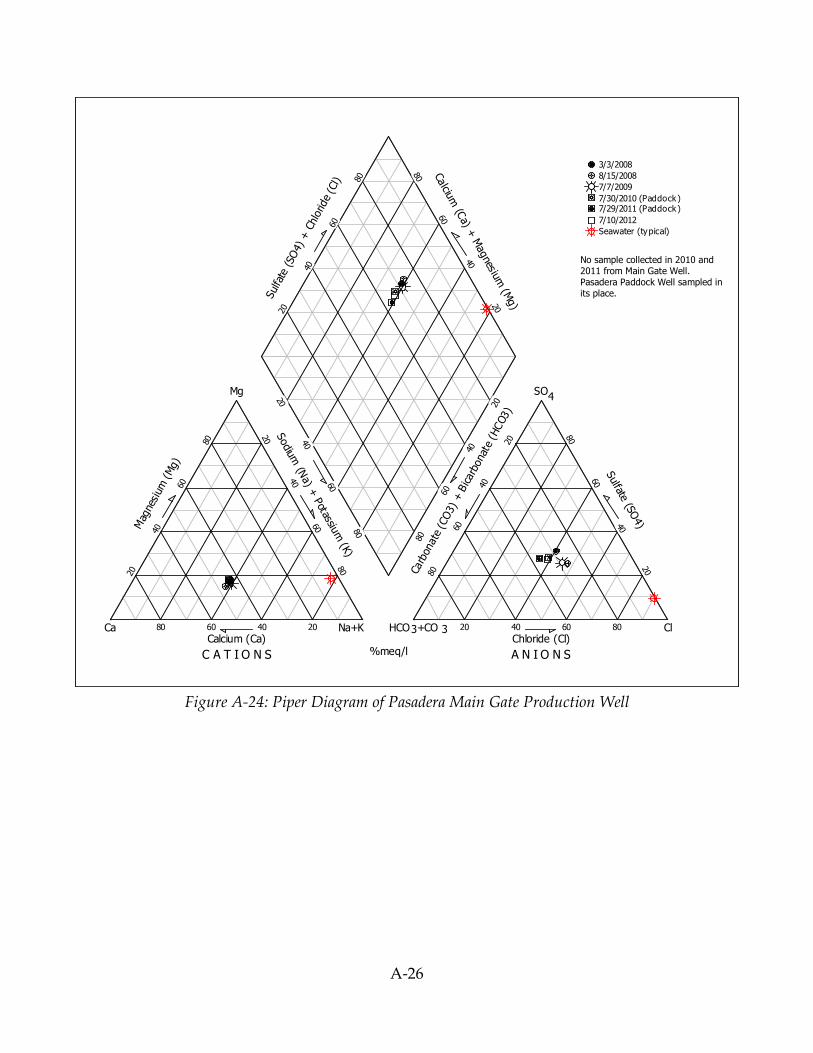
A-26
Figure A-24: Piper Diagram of Pasadera Main Gate Production Well
C A T I O N S A N I O N S%meq/l
Na+K HCO +CO3 3 Cl
Mg SO4
CaCalcium (Ca) Chloride (Cl)
Sul
fate
(SO
4) +
Chlo
ride
(Cl)
Calciu
m (C
a) + M
agnesium
(Mg)
Carb
onat
e (C
O3)
+ B
icar
bona
te (
HCO3)
Sodium
(Na) +
Potassiu
m (K)
Sulfate
(SO4)M
agne
sium
(Mg)
80 60 40 20 20 40 60 80
80
60
40
20
20
40
60
80
20
40
60
80
80
60
40
20
20
40
60
80
20
40
60
80
80
60
40
20
80
60
40
20
3/3/2008
8/15/2008
7/7/2009
7/30/2010 (Paddock)7/29/2011 (Paddock)
7/10/2012
Seawater (typical)
No sample collected in 2010 and 2011 from Main Gate Well. Pasadera Paddock Well sampled in its place.
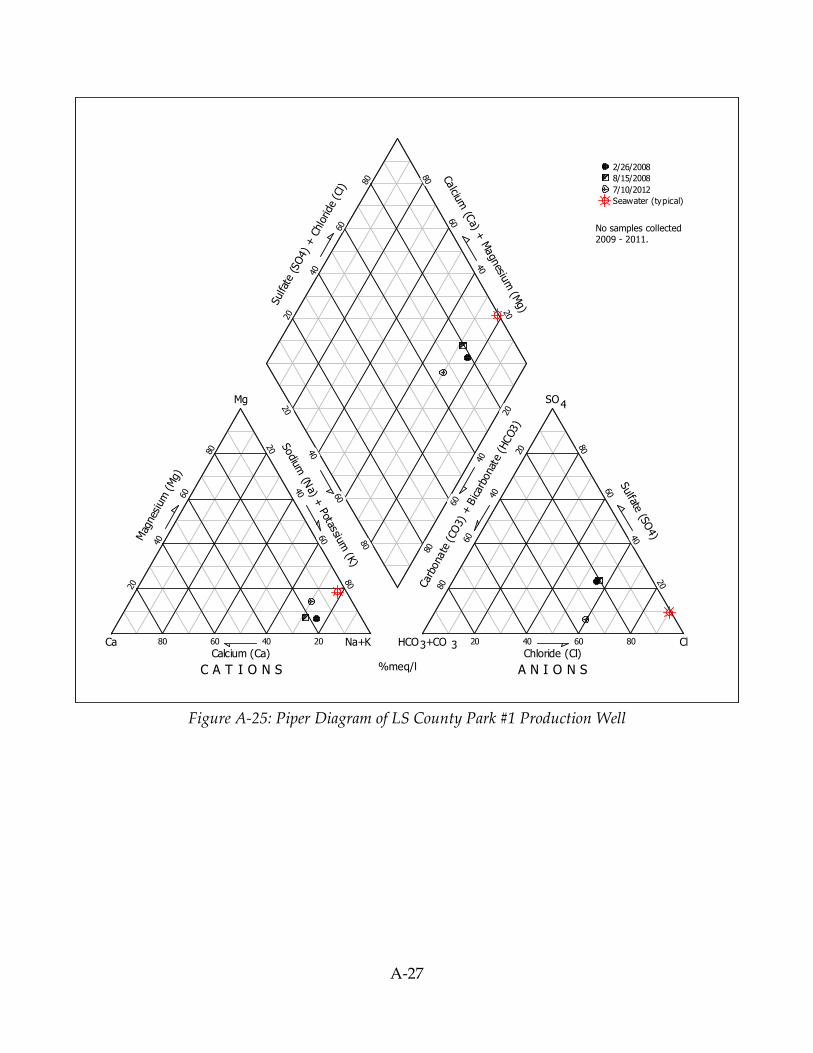
A-27
Figure A-25: Piper Diagram of LS County Park #1 Production Well
C A T I O N S A N I O N S%meq/l
Na+K HCO +CO3 3 Cl
Mg SO4
CaCalcium (Ca) Chloride (Cl)
Sul
fate
(SO4)
+ C
hlor
ide
(Cl)
Calcium
(Ca) +
Magn
esium
(Mg)
Car
bona
te (CO
3) +
Bicar
bona
te (
HCO3)
Sodium
(Na) +
Potassium (K)
Sulfate
(SO4)M
agne
sium
(M
g)
80 60 40 20 20 40 60 80
80
60
40
20
20
40
60
80
20
40
60
80
80
60
40
20
20
40
60
80
20
40
60
80
80
60
40
20
80
60
40
20
2/26/2008
8/15/2008
7/10/2012
Seawater (typical)
No samples collected 2009 - 2011.

A-28
Figure A-26: Piper Diagram of LS County Park #2 Production Well
No samples collected 2011.
C A T I O N S A N I O N S%meq/l
Na+K HCO +CO3 3 Cl
Mg SO4
CaCalcium (Ca) Chloride (Cl)
Sulfa
te (SO4) + C
hlo
ride
(Cl)
Calcium
(Ca) +
Mag
nesium (M
g)
Carb
onat
e (C
O3) + B
icarb
onat
e (H
CO3)
Sodiu
m (N
a) + P
otassium (K
)
Sulfate (S
O4)M
agnes
ium
(Mg)
80 60 40 20 20 40 60 80
80
60
40
20
20
40
60
80
20
40
60
80
80
60
40
20
20
40
60
80
20
40
60
80
80
60
40
20
80
60
40
20
7/8/2009
7/29/2010
9/13/2012
Seawater (typical)
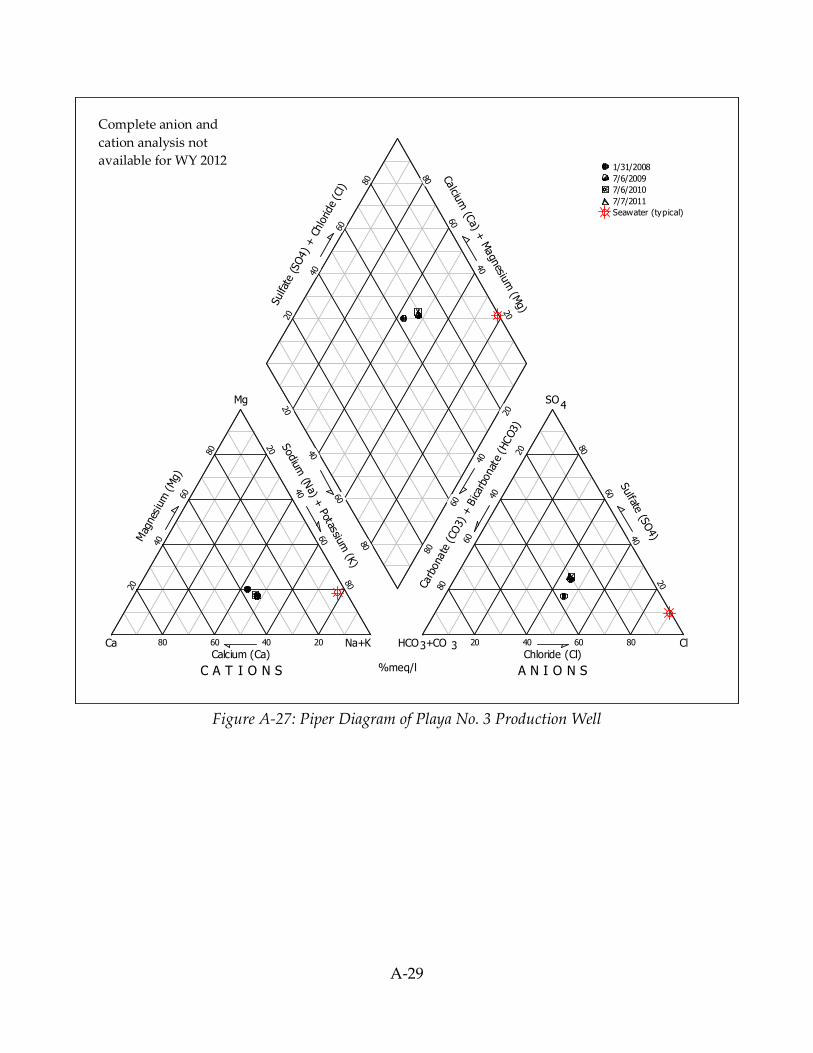
A-29
Figure A-27: Piper Diagram of Playa No. 3 Production Well
C A T I O N S A N I O N S%meq/l
Na+K HCO +CO3 3 Cl
Mg SO4
CaCalcium (Ca) Chloride (Cl)
Sulfa
te (SO4) + C
hlo
ride
(Cl)
Calciu
m (C
a) + M
agn
esium
(Mg)
Carb
ona
te (
CO3)
+ B
icar
bona
te (
HCO3)
Sod
ium (N
a) + Potassium
(K)
Sulfate
(SO4)M
agne
sium
(M
g)
80 60 40 20 20 40 60 80
80
60
40
20
20
40
60
80
20
40
60
80
80
60
40
20
20
40
60
80
20
40
60
80
80
60
40
20
80
60
40
20
1/31/2008
7/6/2009
7/6/2010
7/7/2011
Seawater (typical)
Complete anion and
cation analysis not
available for WY 2012
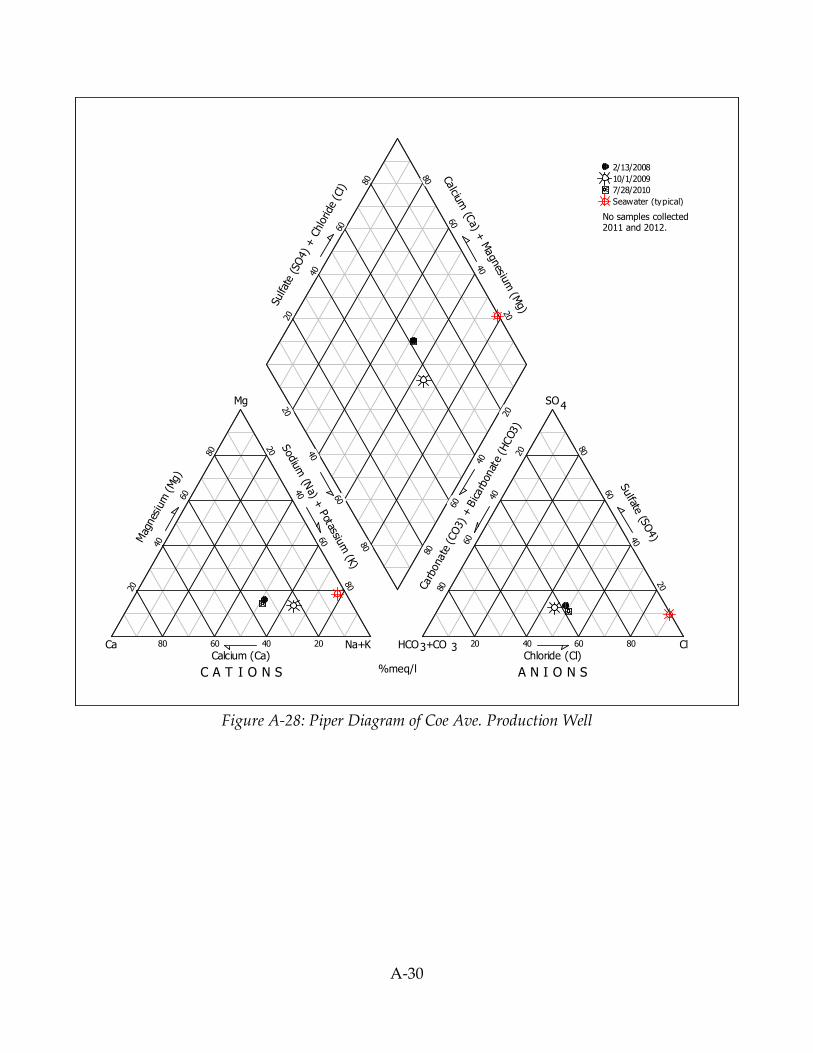
A-30
Figure A-28: Piper Diagram of Coe Ave. Production Well
C A T I O N S A N I O N S%meq/l
Na+K HCO +CO3 3 Cl
Mg SO4
CaCalcium (Ca) Chloride (Cl)
Sulfa
te (SO
4) +
Chlo
ride
(Cl)
Calcium
(Ca) +
Magn
esium
(Mg)
Carb
ona
te (CO3)
+ B
icarb
onat
e (H
CO3)
Sod
ium (N
a) + P
otassium
(K)
Sulfate (S
O4)M
agnes
ium
(Mg)
80 60 40 20 20 40 60 80
80
60
40
20
20
40
60
80
20
40
60
80
80
60
40
20
20
40
60
80
20
40
60
80
80
60
40
20
80
60
40
20
2/13/2008
10/1/2009
7/28/2010
Seawater (typical)
No samples collected 2011 and 2012.
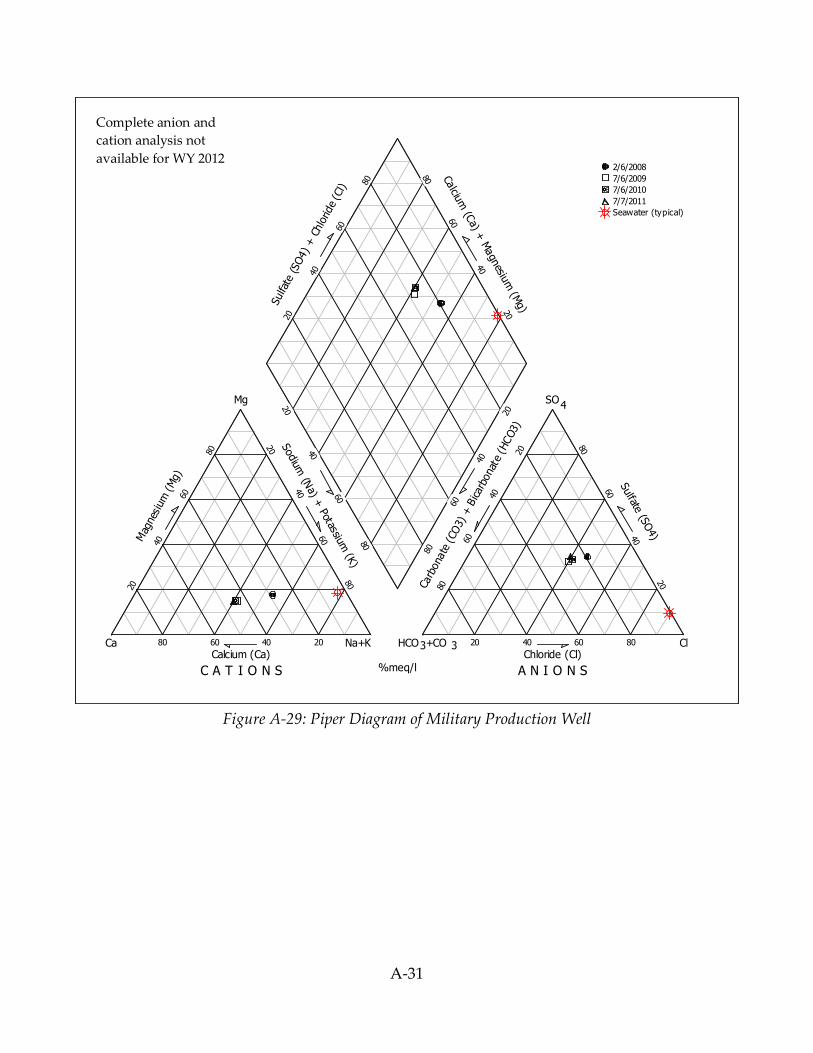
A-31
Figure A-29: Piper Diagram of Military Production Well
C A T I O N S A N I O N S%meq/l
Na+K HCO +CO3 3 Cl
Mg SO4
CaCalcium (Ca) Chloride (Cl)
Sulfa
te (SO4) + C
hlo
ride
(Cl)
Calciu
m (C
a) + M
agn
esium
(Mg)
Carb
ona
te (
CO3)
+ B
icar
bona
te (
HCO3)
Sod
ium (N
a) + Potassium
(K)
Sulfate
(SO4)M
agne
sium
(M
g)
80 60 40 20 20 40 60 80
80
60
40
20
20
40
60
80
20
40
60
80
80
60
40
20
20
40
60
80
20
40
60
80
80
60
40
20
80
60
40
20
2/6/2008
7/6/2009
7/6/2010
7/7/2011
Seawater (typical)
Complete anion and
cation analysis not
available for WY 2012
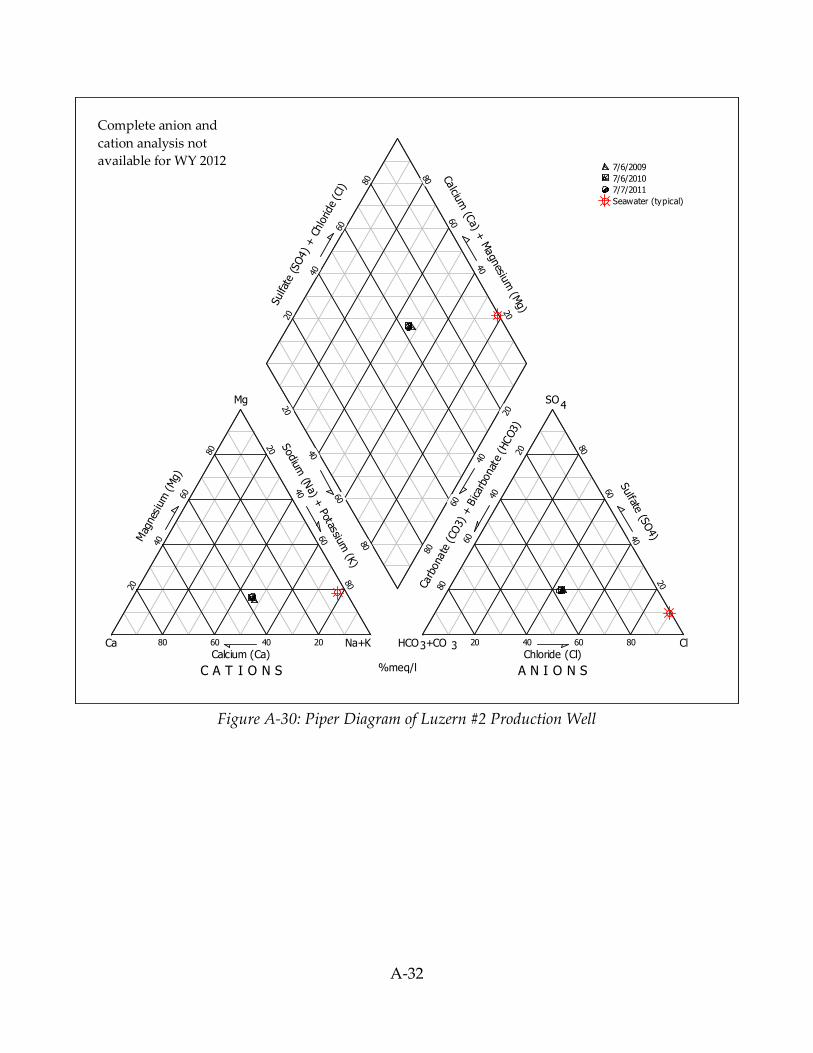
A-32
Figure A-30: Piper Diagram of Luzern #2 Production Well
C A T I O N S A N I O N S%meq/l
Na+K HCO +CO3 3 Cl
Mg SO4
CaCalcium (Ca) Chloride (Cl)
Sulfa
te (SO4) + C
hlo
ride
(Cl)
Calciu
m (C
a) + M
agn
esium
(Mg)
Carb
ona
te (
CO3)
+ B
icar
bona
te (
HCO3)
Sod
ium (N
a) + Potassium
(K)
Sulfate
(SO4)M
agne
sium
(M
g)
80 60 40 20 20 40 60 80
80
60
40
20
20
40
60
80
20
40
60
80
80
60
40
20
20
40
60
80
20
40
60
80
80
60
40
20
80
60
40
20
7/6/2009
7/6/2010
7/7/2011
Seawater (typical)
Complete anion and
cation analysis not
available for WY 2012
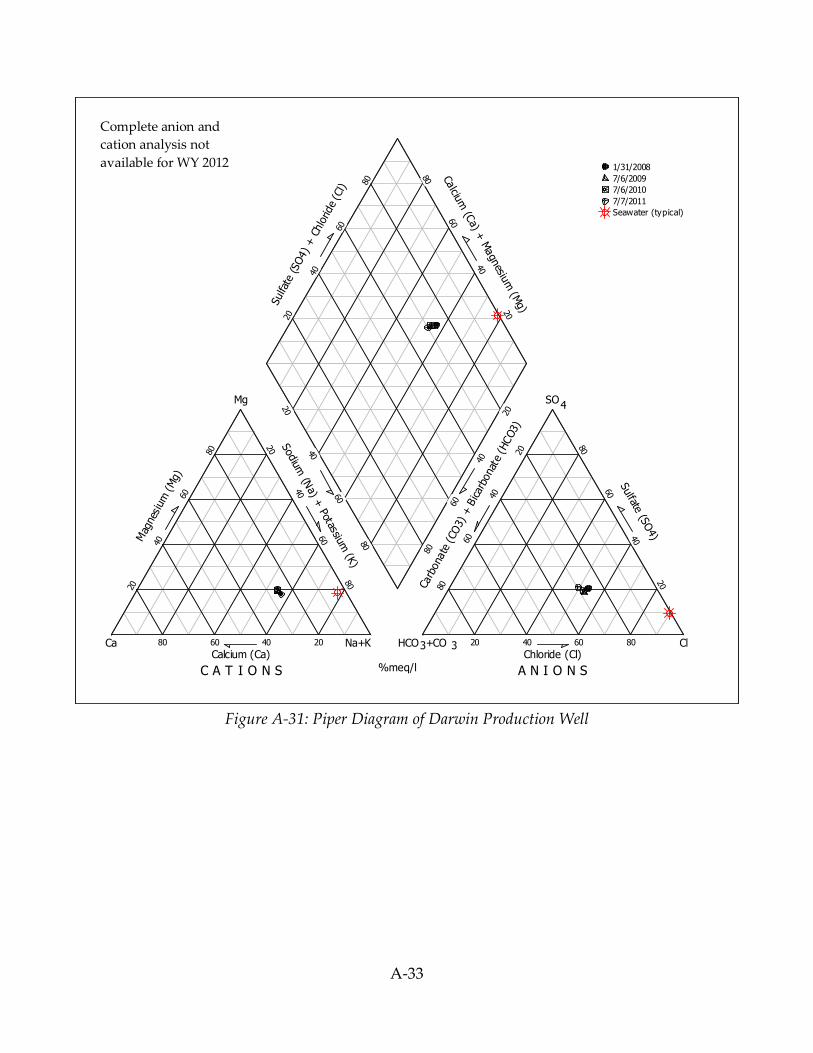
A-33
Figure A-31: Piper Diagram of Darwin Production Well
C A T I O N S A N I O N S%meq/l
Na+K HCO +CO3 3 Cl
Mg SO4
CaCalcium (Ca) Chloride (Cl)
Sulfa
te (SO4) + C
hlo
ride
(Cl)
Calciu
m (C
a) + M
agn
esium
(Mg)
Carb
ona
te (
CO3)
+ B
icar
bona
te (
HCO3)
Sod
ium (N
a) + Potassium
(K)
Sulfate
(SO4)M
agne
sium
(M
g)
80 60 40 20 20 40 60 80
80
60
40
20
20
40
60
80
20
40
60
80
80
60
40
20
20
40
60
80
20
40
60
80
80
60
40
20
80
60
40
20
1/31/2008
7/6/2009
7/6/2010
7/7/2011
Seawater (typical)
Complete anion and
cation analysis not
available for WY 2012

A-34
Figure A-32: Piper Diagram of Ord Grove No. 2 Production Well
C A T I O N S A N I O N S%meq/l
Na+K HCO +CO3 3 Cl
Mg SO4
CaCalcium (Ca) Chloride (Cl)
Sulfa
te (SO4) + C
hlo
ride
(Cl)
Calciu
m (C
a) + M
agn
esium
(Mg)
Carb
ona
te (
CO3)
+ B
icar
bona
te (
HCO3)
Sod
ium (N
a) + Potassium
(K)
Sulfate
(SO4)M
agne
sium
(M
g)
80 60 40 20 20 40 60 80
80
60
40
20
20
40
60
80
20
40
60
80
80
60
40
20
20
40
60
80
20
40
60
80
80
60
40
20
80
60
40
20
1/29/2008
7/6/2009
7/6/2010
7/7/2011
Seawater (typical)
Complete anion and
cation analysis not
available for WY 2012
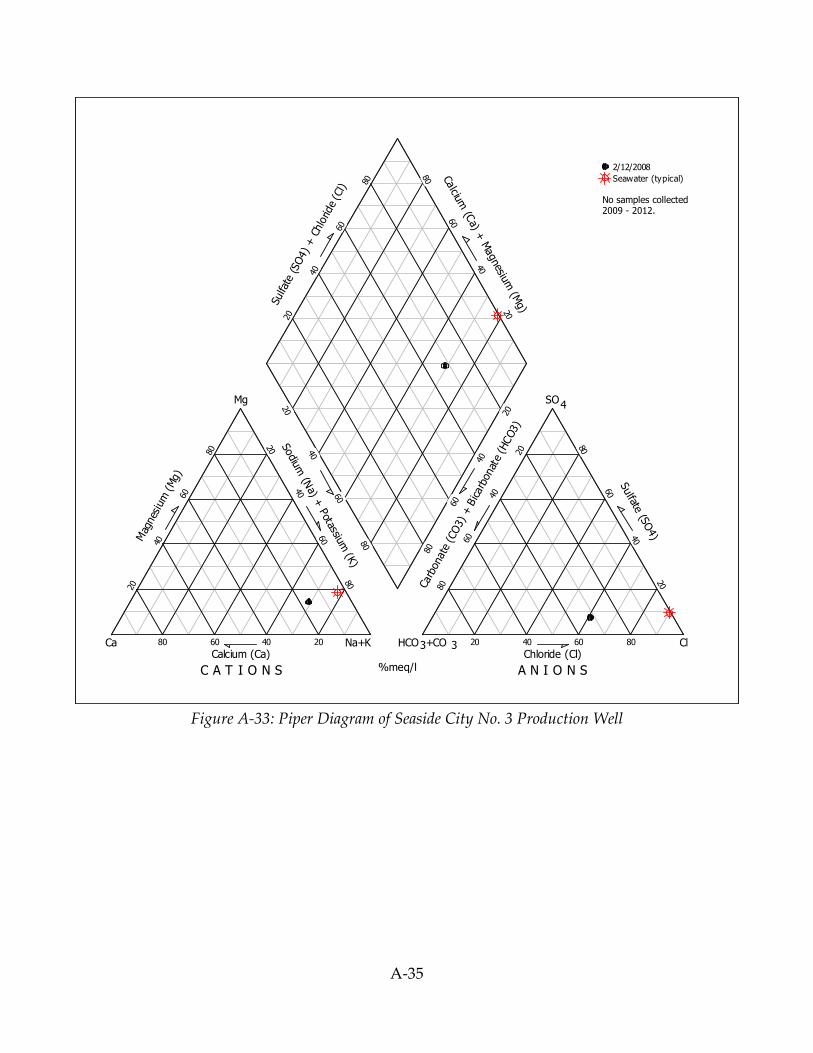
A-35
Figure A-33: Piper Diagram of Seaside City No. 3 Production Well
C A T I O N S A N I O N S%meq/l
Na+K HCO +CO3 3 Cl
Mg SO4
CaCalcium (Ca) Chloride (Cl)
Sulfa
te (SO4) + C
hlo
ride
(Cl)
Calcium
(Ca) +
Mag
nesium (M
g)
Carb
onat
e (C
O3) + B
icarb
onat
e (H
CO3)
Sodiu
m (N
a) + P
otassium (K
)
Sulfate (S
O4)M
agnes
ium
(Mg)
80 60 40 20 20 40 60 80
80
60
40
20
20
40
60
80
20
40
60
80
80
60
40
20
20
40
60
80
20
40
60
80
80
60
40
20
80
60
40
20
2/12/2008
Seawater (typical)
No samples collected 2009 - 2012.
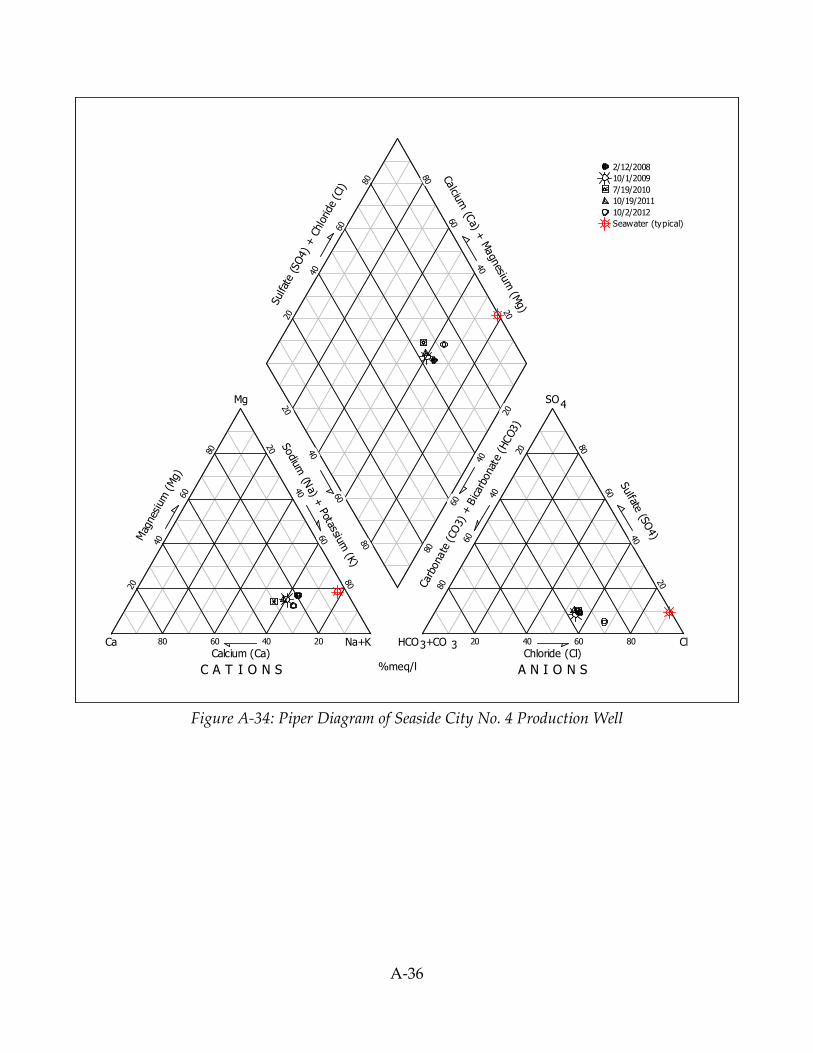
A-36
Figure A-34: Piper Diagram of Seaside City No. 4 Production Well
C A T I O N S A N I O N S%meq/l
Na+K HCO +CO3 3 Cl
Mg SO4
CaCalcium (Ca) Chloride (Cl)
Sul
fate
(SO4)
+ C
hlor
ide
(Cl)
Calcium
(Ca) +
Magn
esium
(Mg)
Car
bona
te (CO
3) +
Bicar
bona
te (
HCO3)
Sodium
(Na) +
Potassium (K)
Sulfate
(SO4)M
agne
sium
(M
g)
80 60 40 20 20 40 60 80
80
60
40
20
20
40
60
80
20
40
60
80
80
60
40
20
20
40
60
80
20
40
60
80
80
60
40
20
80
60
40
20
2/12/2008
10/1/2009
7/19/2010
10/19/2011
10/2/2012
Seawater (typical)

A-37
Figure A-35: Piper Diagram of Mission Memorial (formerly PRTIW)
C A T I O N S A N I O N S%meq/l
Na+K HCO +CO3 3 Cl
Mg SO4
CaCalcium (Ca) Chloride (Cl)
Sul
fate
(SO4)
+ C
hlor
ide
(Cl)
Calcium
(Ca) +
Magn
esium
(Mg)
Car
bona
te (CO
3) +
Bicar
bona
te (
HCO3)
Sodium
(Na) +
Potassium (K)
Sulfate
(SO4)M
agne
sium
(M
g)
80 60 40 20 20 40 60 80
80
60
40
20
20
40
60
80
20
40
60
80
80
60
40
20
20
40
60
80
20
40
60
80
80
60
40
20
80
60
40
20
2/27/2008
8/15/2008
7/6/2009
8/2/2010
7/26/2011
7/11/2012
Seawater (typical)

A-38
Figure A-36: Piper Diagram of Paralta Production Well
C A T I O N S A N I O N S%meq/l
Na+K HCO +CO3 3 Cl
Mg SO4
CaCalcium (Ca) Chloride (Cl)
Sulfa
te (SO4) + C
hlo
ride
(Cl)
Calciu
m (C
a) + M
agn
esium
(Mg)
Carb
ona
te (
CO3)
+ B
icar
bona
te (
HCO3)
Sod
ium (N
a) + Potassium
(K)
Sulfate
(SO4)M
agne
sium
(M
g)
80 60 40 20 20 40 60 80
80
60
40
20
20
40
60
80
20
40
60
80
80
60
40
20
20
40
60
80
20
40
60
80
80
60
40
20
80
60
40
20
1/31/2008
7/6/2009
7/6/2010
7/7/2011
Seawater (typical)
Complete anion and
cation analysis not
available for WY 2012
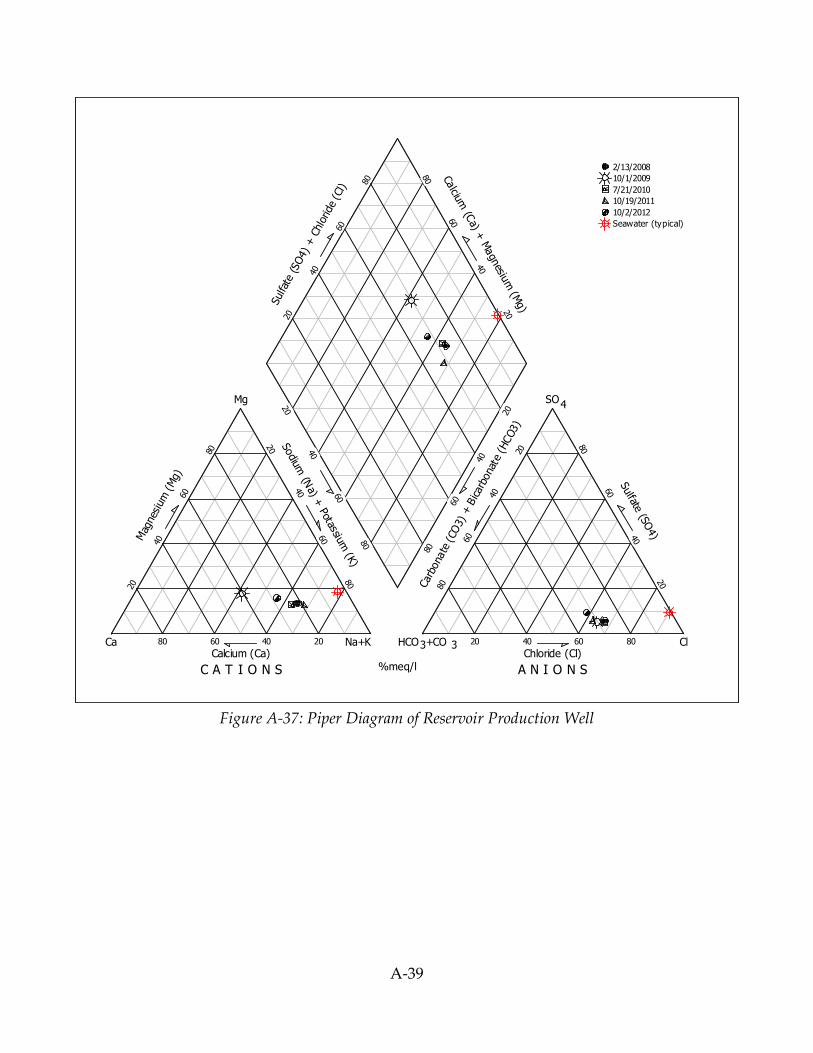
A-39
Figure A-37: Piper Diagram of Reservoir Production Well
C A T I O N S A N I O N S%meq/l
Na+K HCO +CO3 3 Cl
Mg SO4
CaCalcium (Ca) Chloride (Cl)
Sul
fate
(SO4)
+ C
hlor
ide
(Cl)
Calcium
(Ca) +
Magn
esium
(Mg)
Car
bona
te (CO
3) +
Bicar
bona
te (
HCO3)
Sodium
(Na) +
Potassium (K)
Sulfate
(SO4)M
agne
sium
(M
g)
80 60 40 20 20 40 60 80
80
60
40
20
20
40
60
80
20
40
60
80
80
60
40
20
20
40
60
80
20
40
60
80
80
60
40
20
80
60
40
20
2/13/2008
10/1/2009
7/21/2010
10/19/2011
10/2/2012
Seawater (typical)
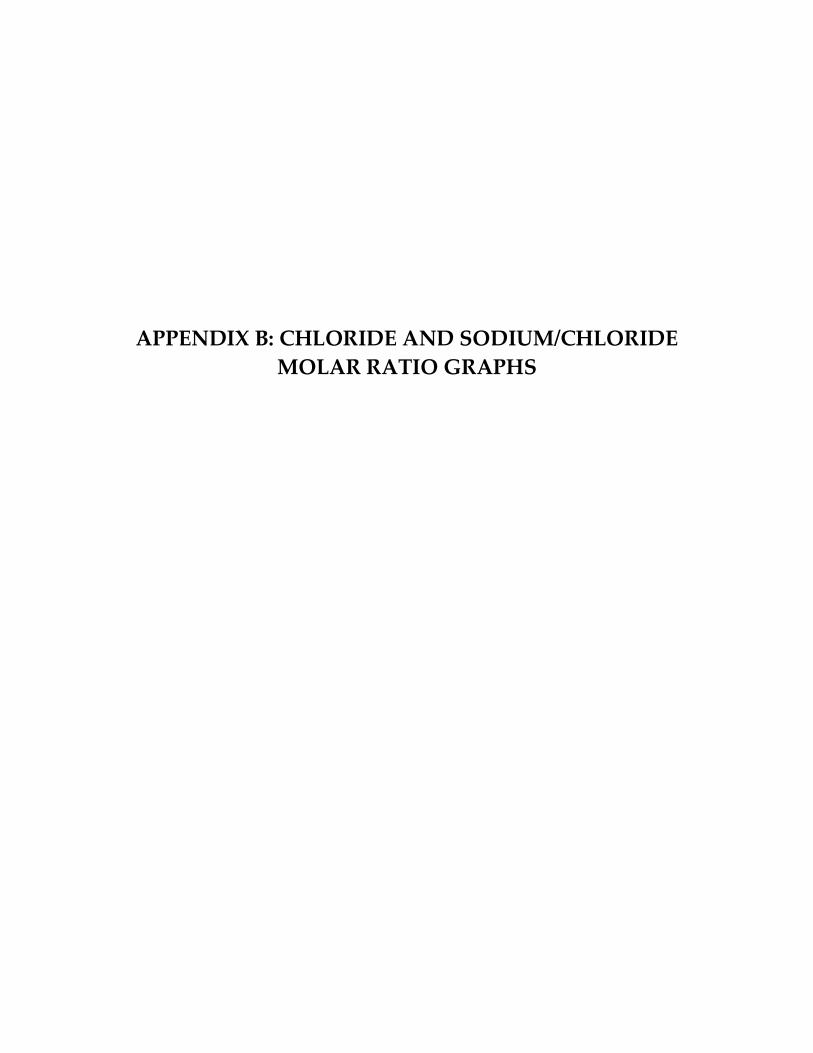
APPENDIX B: CHLORIDE AND SODIUM/CHLORIDE
MOLAR RATIO GRAPHS
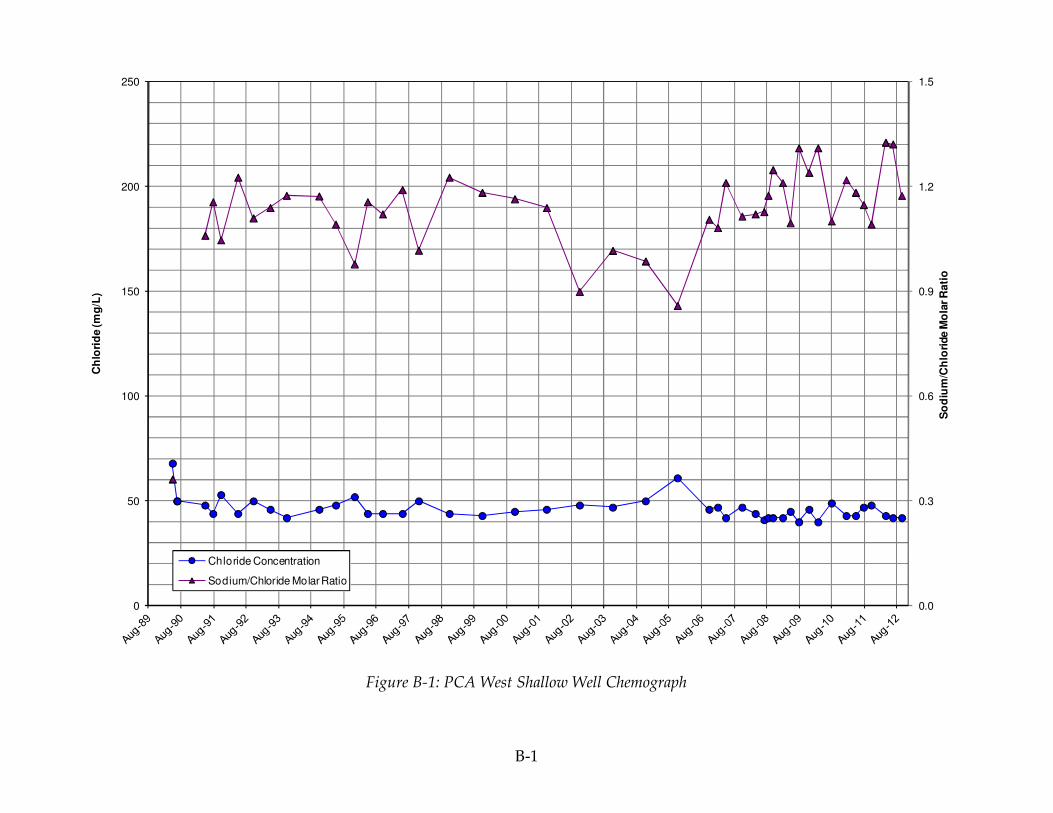
B-1
Figure B-1: PCA West Shallow Well Chemograph
0.0
0.3
0.6
0.9
1.2
1.5
0
50
100
150
200
250
So
diu
m/C
hlo
ride M
ola
r R
ati
o
Ch
lori
de (m
g/L
)
Chloride Concentration
Sodium/Chloride Molar Ratio

B-2
Figure B-2: PCA West Deep Well Chemograph
0.0
0.3
0.6
0.9
1.2
1.5
0
50
100
150
200
250
So
diu
m/C
hlo
ride M
ola
r R
ati
o
Ch
lori
de (m
g/L
)
Chloride Concentration
Sodium/Chloride Molar Ratio
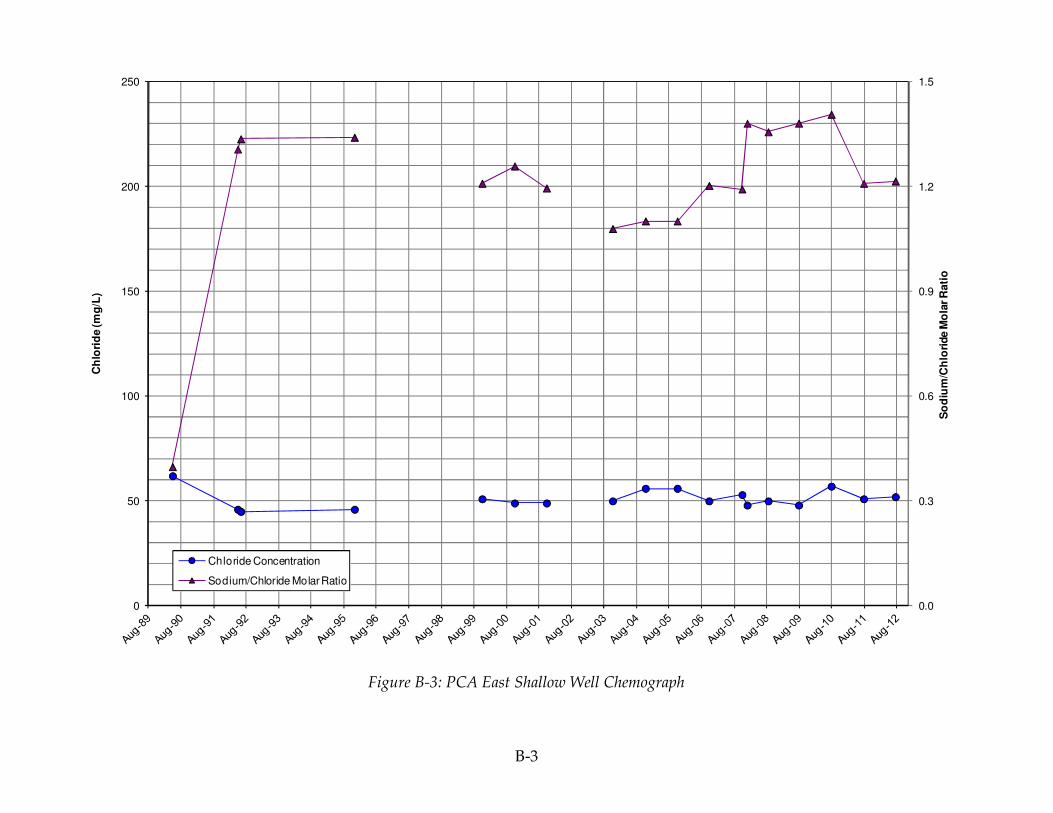
B-3
Figure B-3: PCA East Shallow Well Chemograph
0.0
0.3
0.6
0.9
1.2
1.5
0
50
100
150
200
250
So
diu
m/C
hlo
ride M
ola
r R
ati
o
Ch
lori
de (m
g/L
)
Chloride Concentration
Sodium/Chloride Molar Ratio
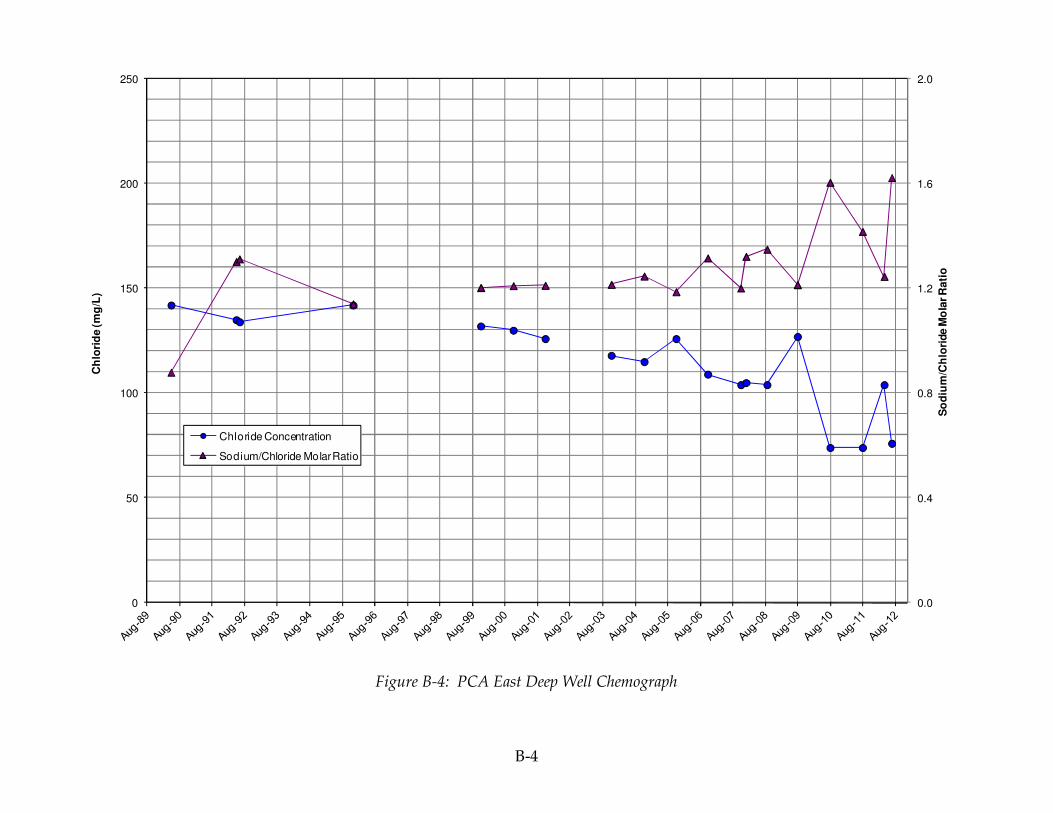
B-4
Figure B-4: PCA East Deep Well Chemograph
0.0
0.4
0.8
1.2
1.6
2.0
0
50
100
150
200
250
So
diu
m/C
hlo
ride M
ola
r R
ati
o
Ch
lori
de (m
g/L
)
Chloride Concentration
Sodium/Chloride Molar Ratio

B-5
Figure B-5: Ord Terrace Shallow Well Chemograph
0.0
0.3
0.6
0.9
1.2
1.5
0
50
100
150
200
250
So
diu
m/C
hlo
ride M
ola
r R
ati
o
Ch
lori
de(m
g/L
)
Chloride Concentration
Sodium/Chloride Molar Ratio
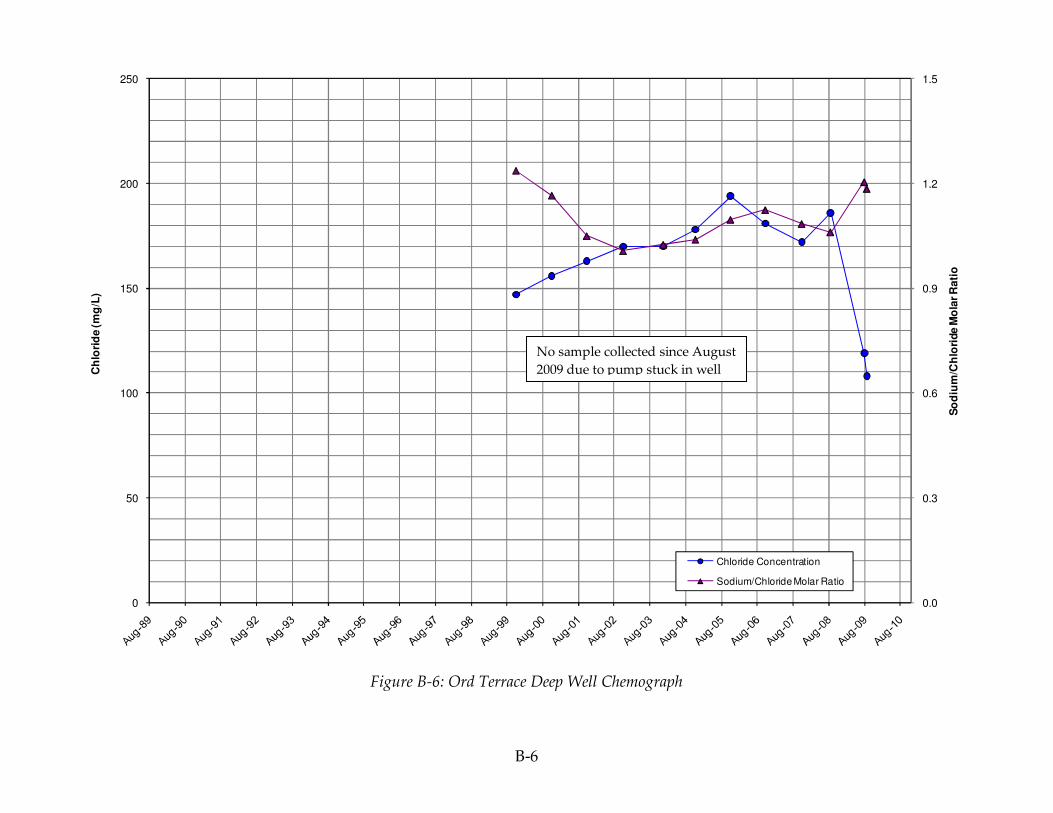
B-6
Figure B-6: Ord Terrace Deep Well Chemograph
0.0
0.3
0.6
0.9
1.2
1.5
0
50
100
150
200
250
So
diu
m/C
hlo
ride M
ola
r R
ati
o
Ch
lori
de (m
g/L
)
Chloride Concentration
Sodium/Chloride Molar Ratio
No sample collected since August
2009 due to pump stuck in well
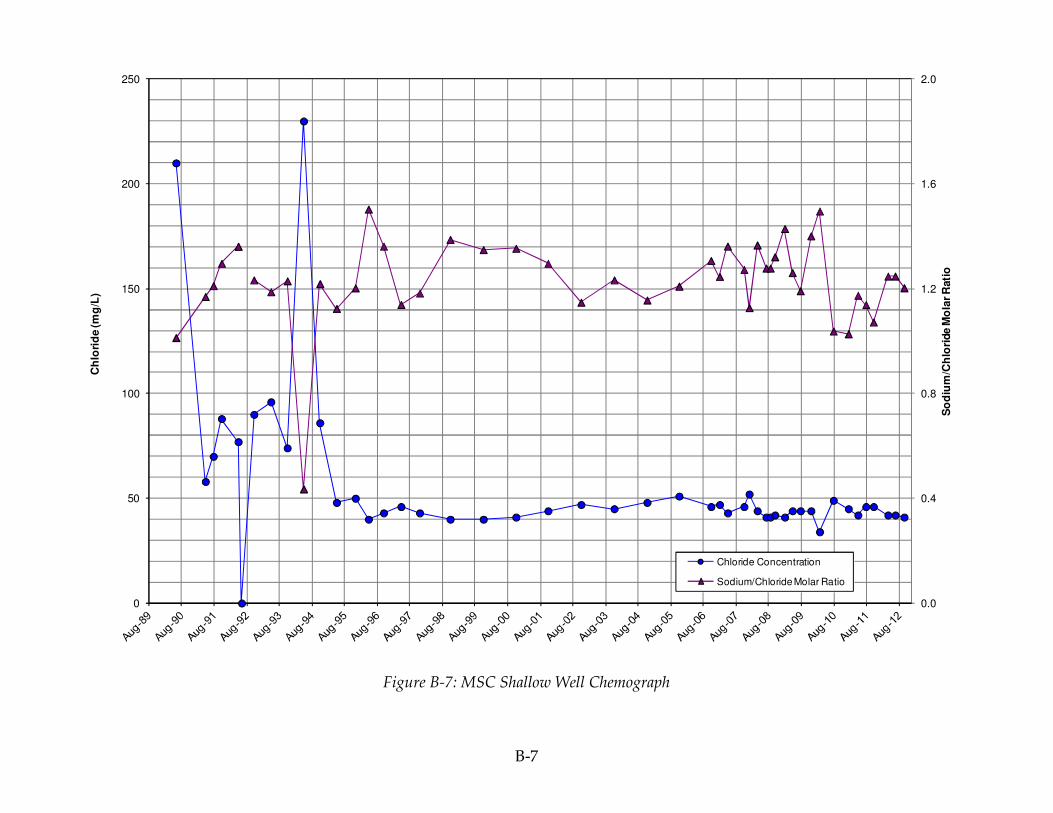
B-7
Figure B-7: MSC Shallow Well Chemograph
0.0
0.4
0.8
1.2
1.6
2.0
0
50
100
150
200
250
So
diu
m/C
hlo
ride M
ola
r R
ati
o
Ch
lori
de (m
g/L
)
Chloride Concentration
Sodium/Chloride Molar Ratio
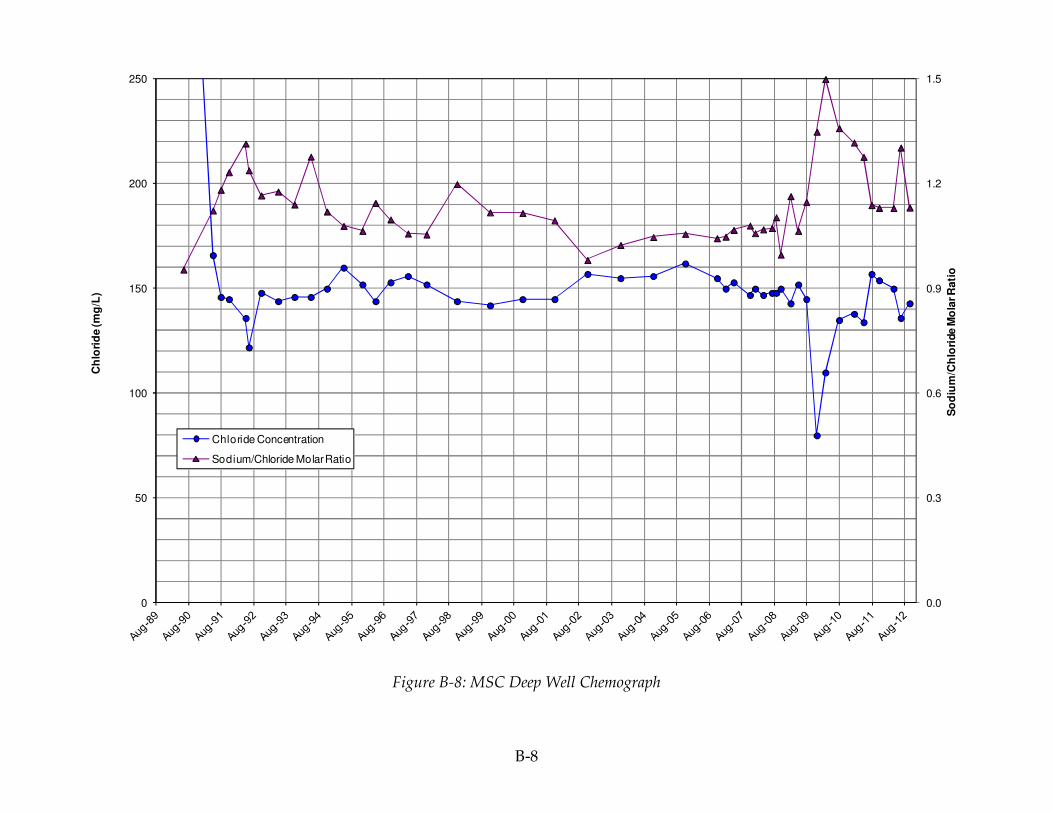
B-8
Figure B-8: MSC Deep Well Chemograph
0.0
0.3
0.6
0.9
1.2
1.5
0
50
100
150
200
250
So
diu
m/C
hlo
ride M
ola
r R
ati
o
Ch
lori
de (m
g/L
)
Chloride Concentration
Sodium/Chloride Molar Ratio
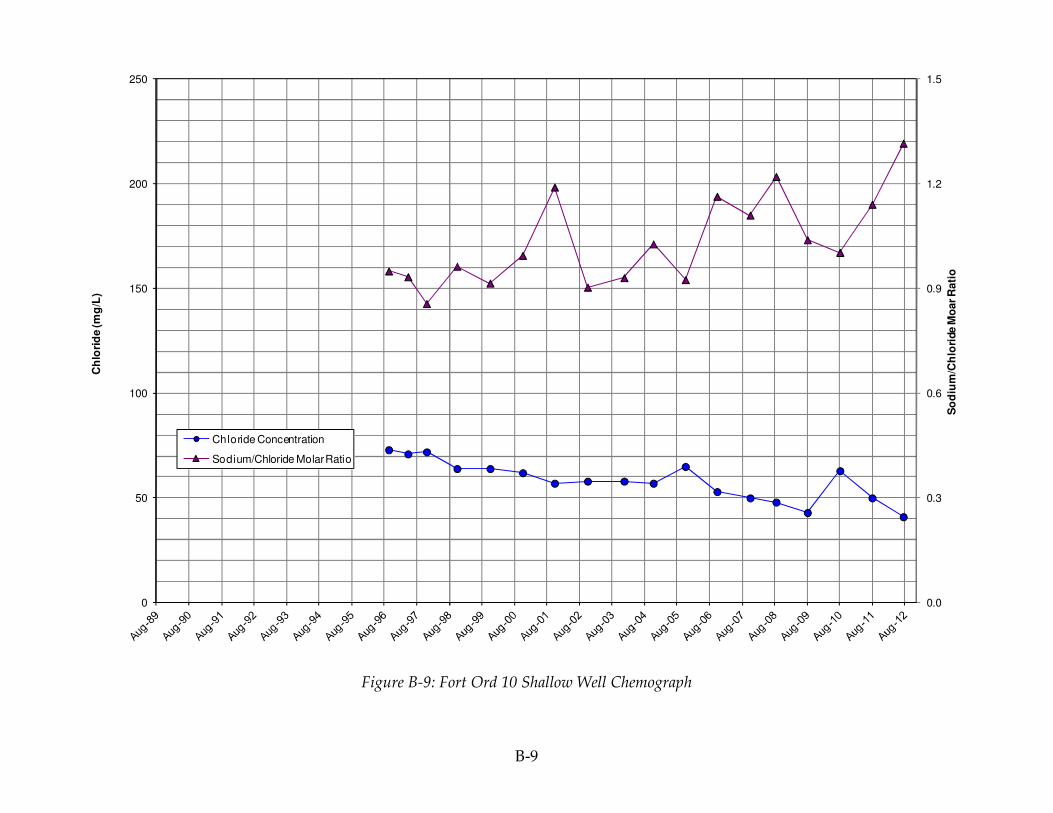
B-9
Figure B-9: Fort Ord 10 Shallow Well Chemograph
0.0
0.3
0.6
0.9
1.2
1.5
0
50
100
150
200
250
So
diu
m/C
hlo
ride M
oar R
ati
o
Ch
lori
de (m
g/L
)
Chloride Concentration
Sodium/Chloride Molar Ratio
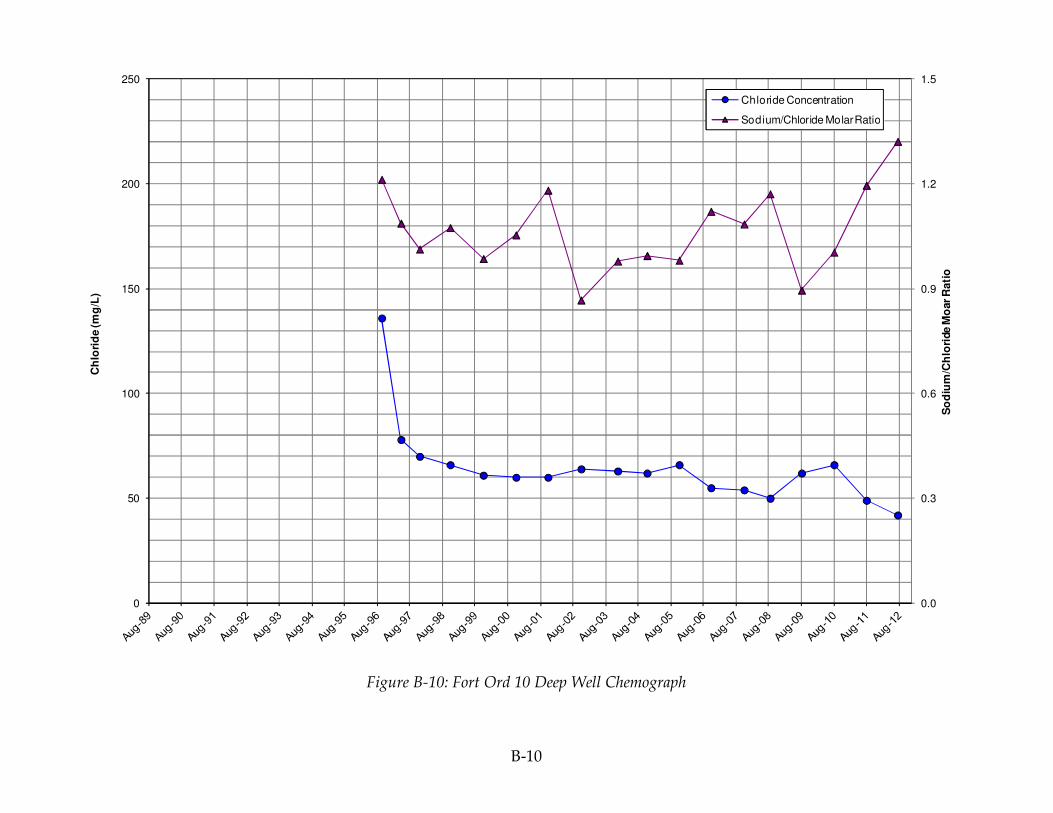
B-10
Figure B-10: Fort Ord 10 Deep Well Chemograph
0.0
0.3
0.6
0.9
1.2
1.5
0
50
100
150
200
250
So
diu
m/C
hlo
ride M
oar R
ati
o
Ch
lori
de (m
g/L
)Chloride Concentration
Sodium/Chloride Molar Ratio
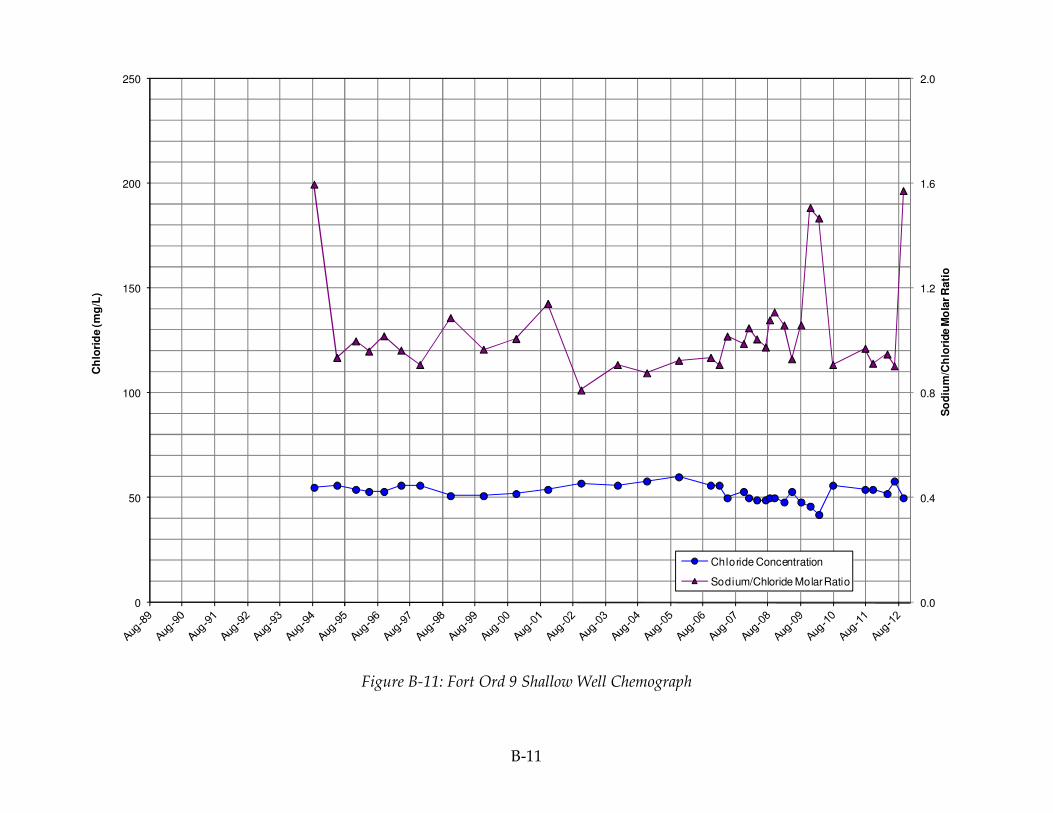
B-11
Figure B-11: Fort Ord 9 Shallow Well Chemograph
0.0
0.4
0.8
1.2
1.6
2.0
0
50
100
150
200
250
So
diu
m/C
hlo
ride M
ola
r R
ati
o
Ch
lori
de (m
g/L
)
Chloride Concentration
Sodium/Chloride Molar Ratio

B-12
Figure B-12: Fort Ord 9 Deep Well Chemograph
0.0
0.3
0.6
0.9
1.2
1.5
0
50
100
150
200
250
So
diu
m/C
hlo
ride M
oar R
ati
o
Ch
lori
de (m
g/L
)
Chloride Concentration
Sodium/Chloride Molar Ratio
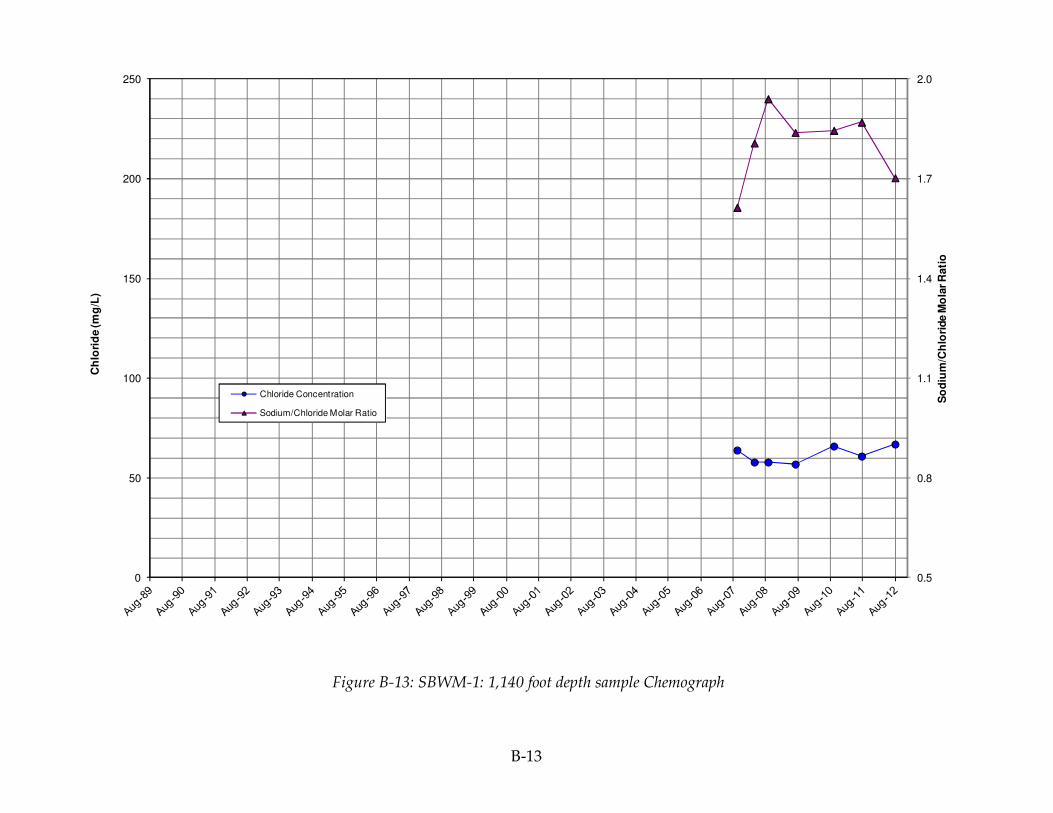
B-13
Figure B-13: SBWM-1: 1,140 foot depth sample Chemograph
0.5
0.8
1.1
1.4
1.7
2.0
0
50
100
150
200
250
So
diu
m/C
hlo
ride M
ola
r R
ati
o
Ch
lori
de (m
g/L
)
Chloride Concentration
Sodium/Chloride Molar Ratio
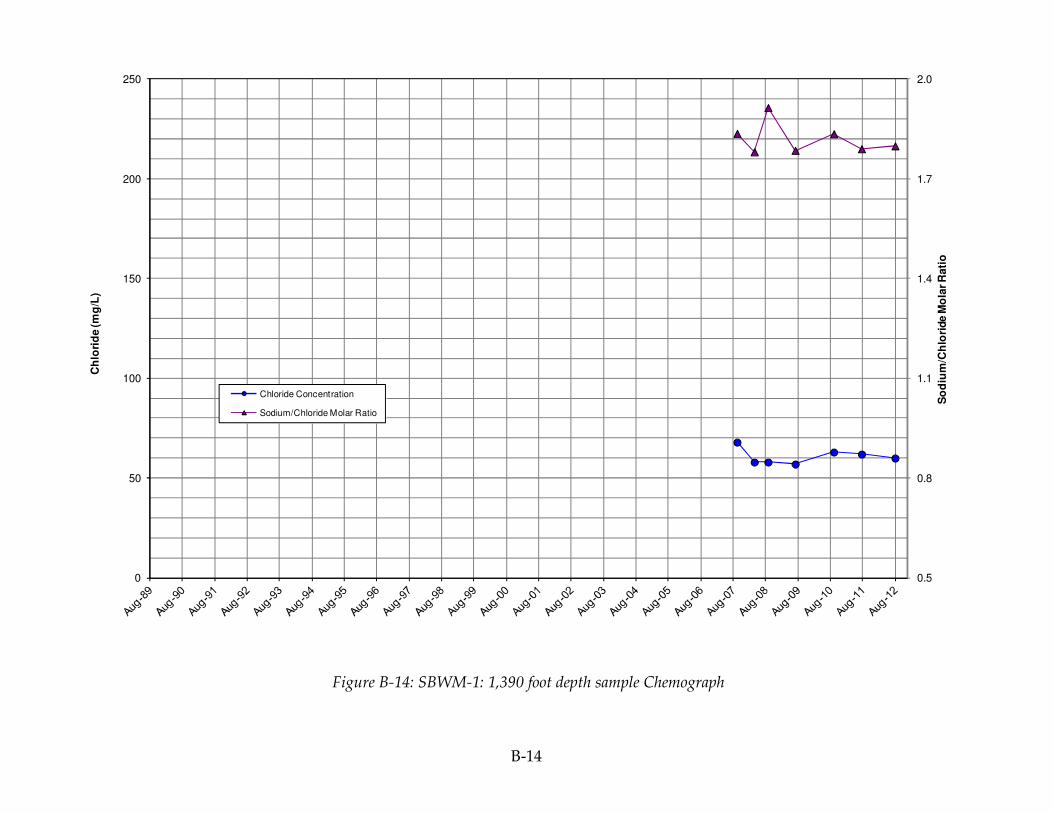
B-14
Figure B-14: SBWM-1: 1,390 foot depth sample Chemograph
0.5
0.8
1.1
1.4
1.7
2.0
0
50
100
150
200
250
So
diu
m/C
hlo
ride M
ola
r R
ati
o
Ch
lori
de (m
g/L
)
Chloride Concentration
Sodium/Chloride Molar Ratio
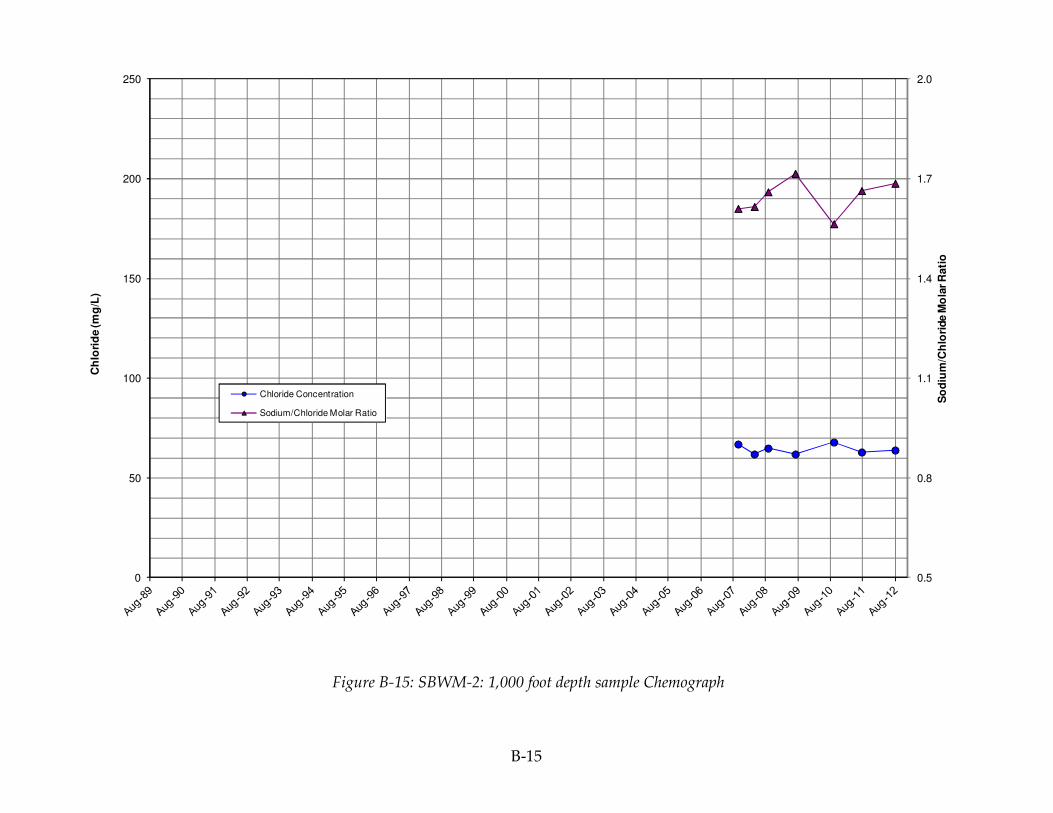
B-15
Figure B-15: SBWM-2: 1,000 foot depth sample Chemograph
0.5
0.8
1.1
1.4
1.7
2.0
0
50
100
150
200
250
So
diu
m/C
hlo
ride M
ola
r R
ati
o
Ch
lori
de (m
g/L
)
Chloride Concentration
Sodium/Chloride Molar Ratio

B-16
Figure B-16: SBWM-2: 1,470 foot depth sample Chemograph
0.5
0.8
1.1
1.4
1.7
2.0
0
50
100
150
200
250
So
diu
m/C
hlo
ride M
ola
r R
ati
o
Ch
lori
de (m
g/L
)
Chloride Concentration
Sodium/Chloride Molar Ratio

B-17
Figure B-17: SBWM-3: 870 foot depth sample Chemograph
0.5
0.8
1.1
1.4
1.7
2.0
0
50
100
150
200
250
So
diu
m/C
hlo
ride M
ola
r R
ati
o
Ch
lori
de (m
g/L
)
Chloride Concentration
Sodium/Chloride Molar Ratio
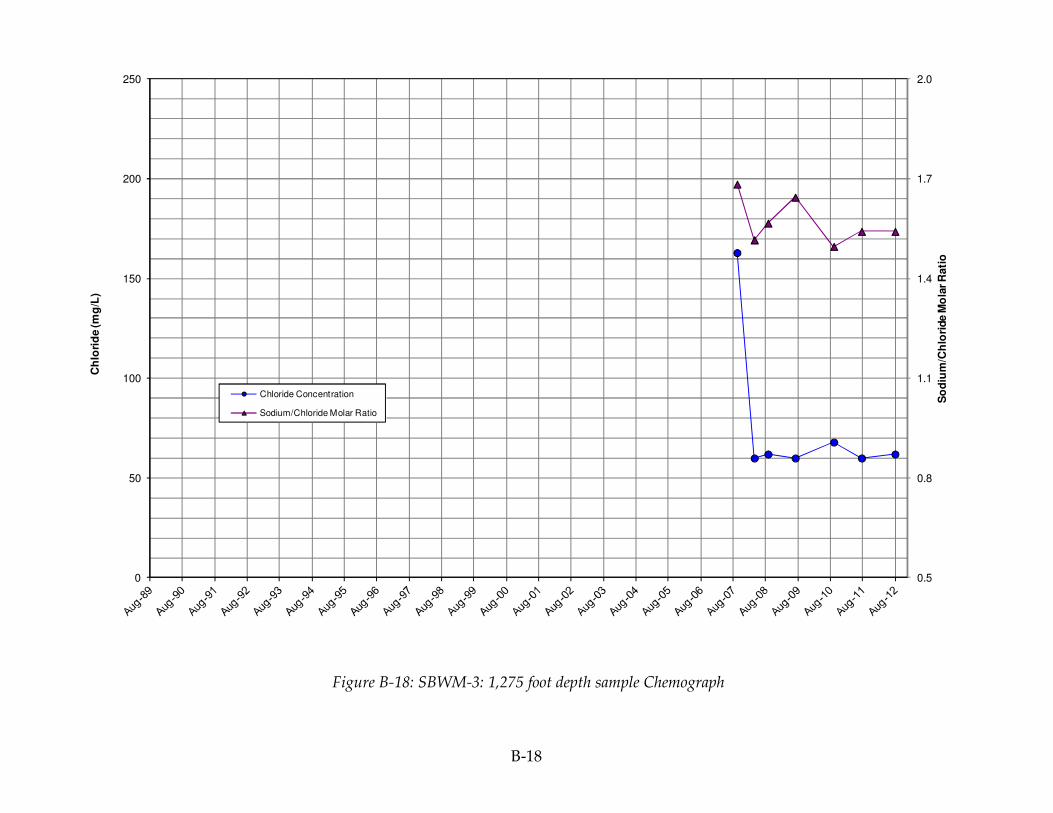
B-18
Figure B-18: SBWM-3: 1,275 foot depth sample Chemograph
0.5
0.8
1.1
1.4
1.7
2.0
0
50
100
150
200
250
So
diu
m/C
hlo
ride M
ola
r R
ati
o
Ch
lori
de (m
g/L
)
Chloride Concentration
Sodium/Chloride Molar Ratio
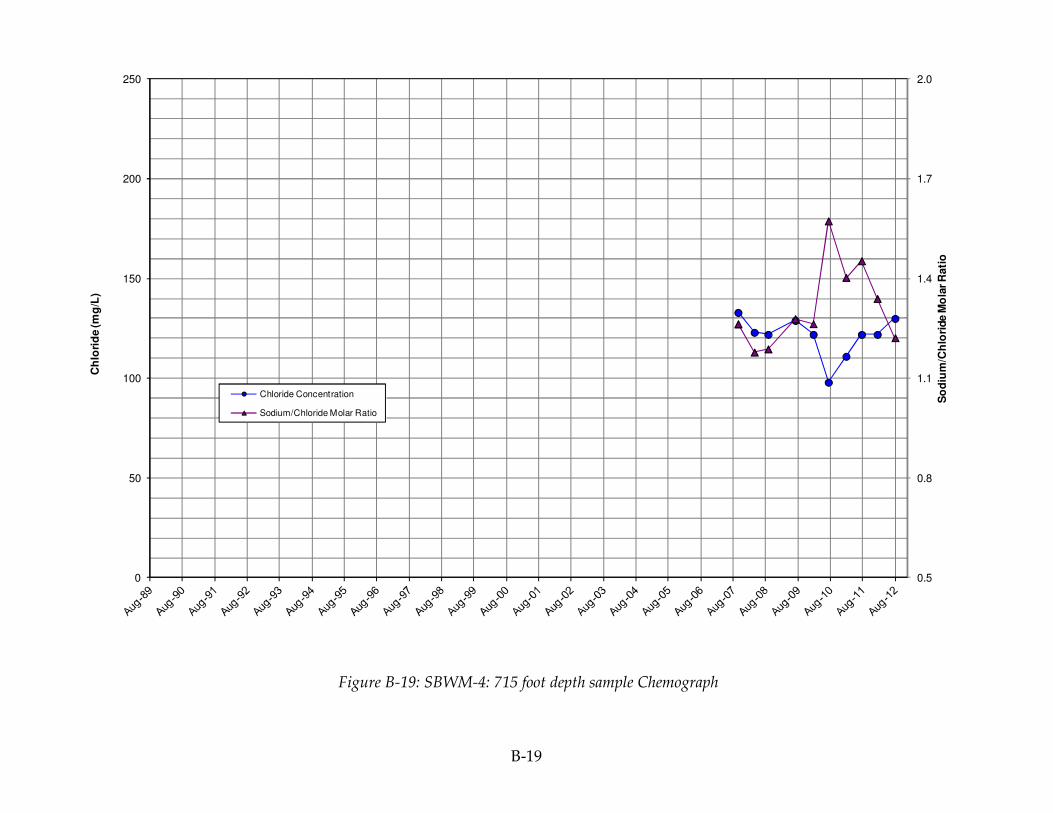
B-19
Figure B-19: SBWM-4: 715 foot depth sample Chemograph
0.5
0.8
1.1
1.4
1.7
2.0
0
50
100
150
200
250
So
diu
m/C
hlo
ride M
ola
r R
ati
o
Ch
lori
de (m
g/L
)
Chloride Concentration
Sodium/Chloride Molar Ratio

B-20
Figure B-20: SBWM-4: 900 foot depth sample Chemograph
0.5
0.8
1.1
1.4
1.7
2.0
50
100
150
200
250
300
So
diu
m/C
hlo
ride M
ola
r R
ati
o
Ch
lori
de (m
g/L
)
Chloride Concentration
Sodium/Chloride Molar Ratio

B-21
Figure B-21: SBWM-5: Shallow Well Chemograph
0.5
0.8
1.1
1.4
1.7
2.0
50
100
150
200
250
300
So
diu
m/C
hlo
ride M
ola
r R
ati
o
Ch
lori
de (m
g/L
)
Chloride Concentration
Sodium/Chloride Molar Ratio
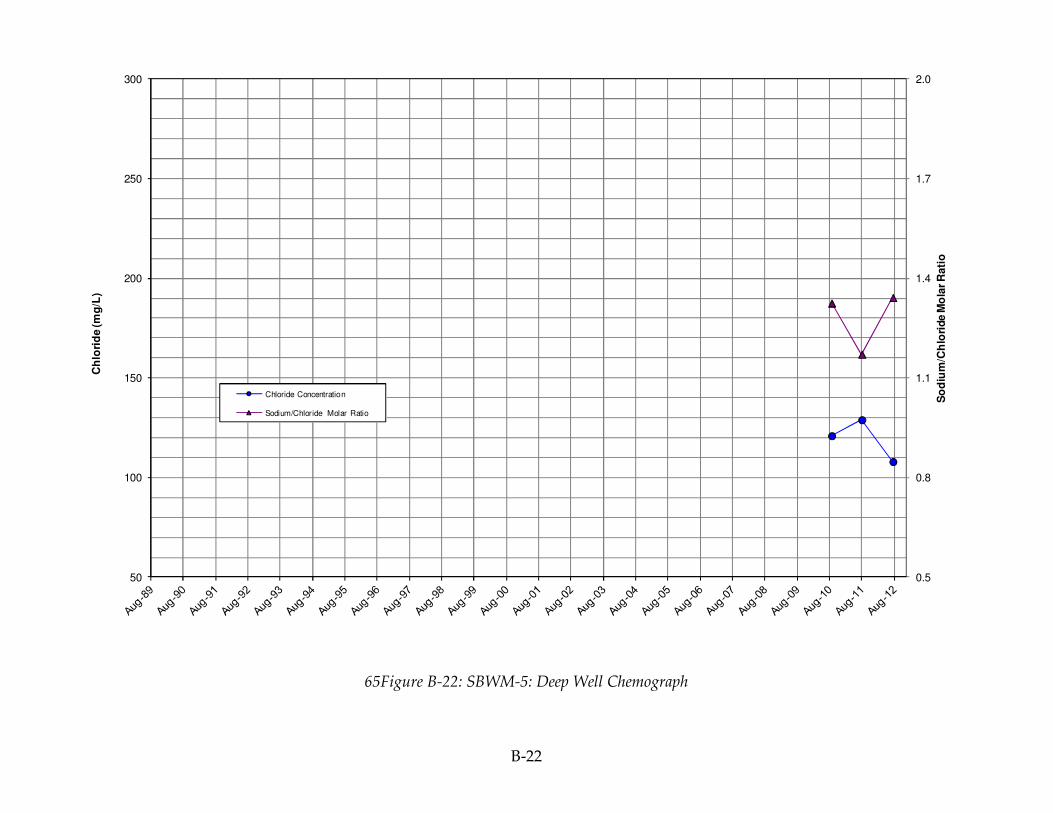
B-22
65Figure B-22: SBWM-5: Deep Well Chemograph
0.5
0.8
1.1
1.4
1.7
2.0
50
100
150
200
250
300
So
diu
m/C
hlo
ride M
ola
r R
ati
o
Ch
lori
de (m
g/L
)
Chloride Concentration
Sodium/Chloride Molar Ratio


