Ben Foster, Anna Chittum, Sara Hayes, Max Neubauer, Seth Nowak, Shruti Vaidyanathan, Kate Farley, Kaye Schultz, and Terry Sullivan
Contributing Authors: Colin Sheppard, Arne Jacobson, and Charles Chamberlin (Schatz Energy Research Center, Humboldt State University); and Yerina Mugica (Natural Resources Defense Council)
529 14th Street NW, Suite 600, Washington, DC 20045
Phone: (202) 507-4000 Twitter: @ACEEEDC
Facebook.com/myACEEE www.aceee.org
i
Contents Acknowledgments ............................................................................................................................................. iv
Executive Summary ............................................................................................................................................. v
Key Findings .................................................................................................................................................... v
Methodology.................................................................................................................................................. vi
Results........................................................................................................................................................... viii
States on the Move ........................................................................................................................................ xi
Strategies for Improving Energy Efficiency ............................................................................................... xi
Conclusions and Looking Ahead ............................................................................................................... xii
State Data Collection and Review .................................................................................................................5
Data Limitations .............................................................................................................................................6
2012 State Energy Efficiency Scorecard Results ..........................................................................................7
Strategies for Improving Energy Efficiency .............................................................................................. 14
Chapter 2: Utility and Public Benefits Programs and Policies ................................................................... 16
Further Research ........................................................................................................................................ 100
Appendix D: State Transit Funding ............................................................................................................. 129
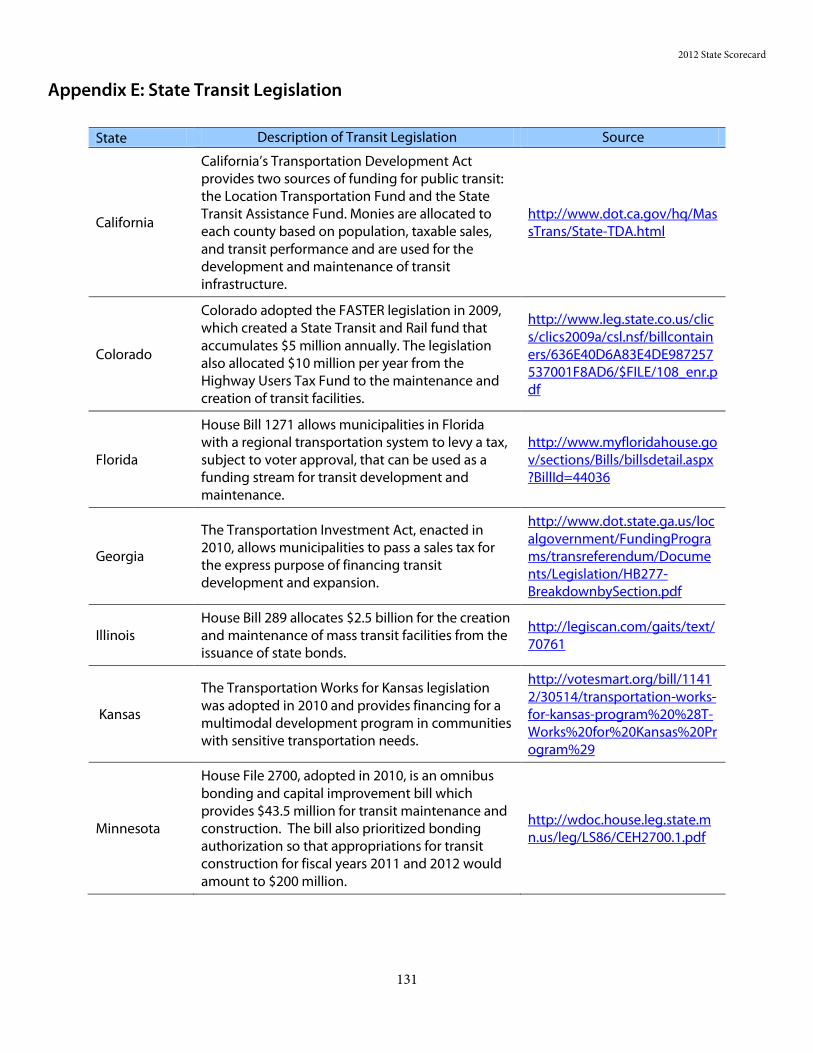
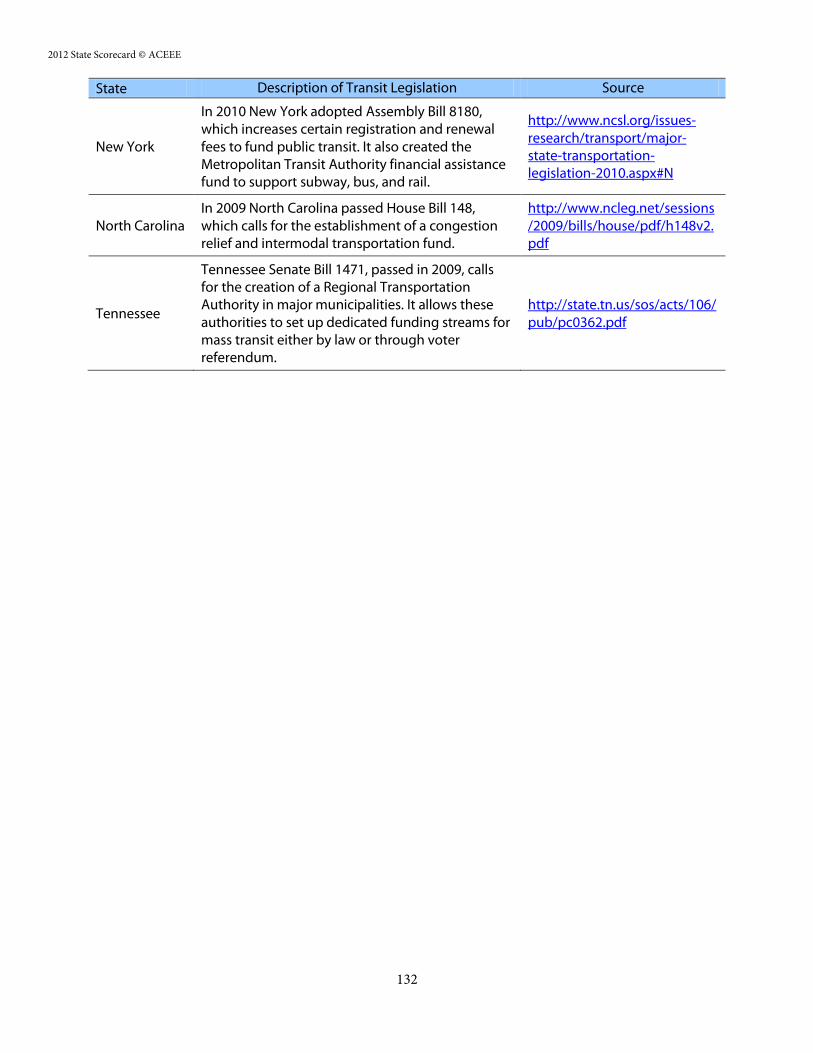
Appendix E: State Transit Legislation .......................................................................................................... 131
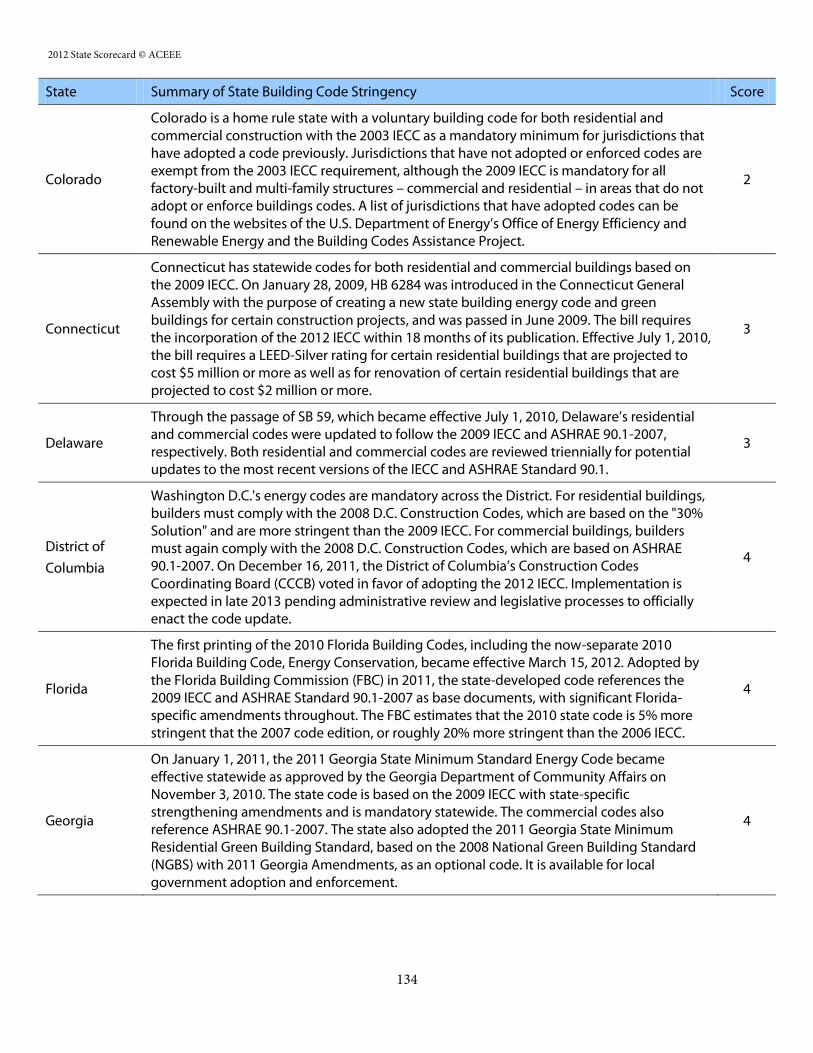
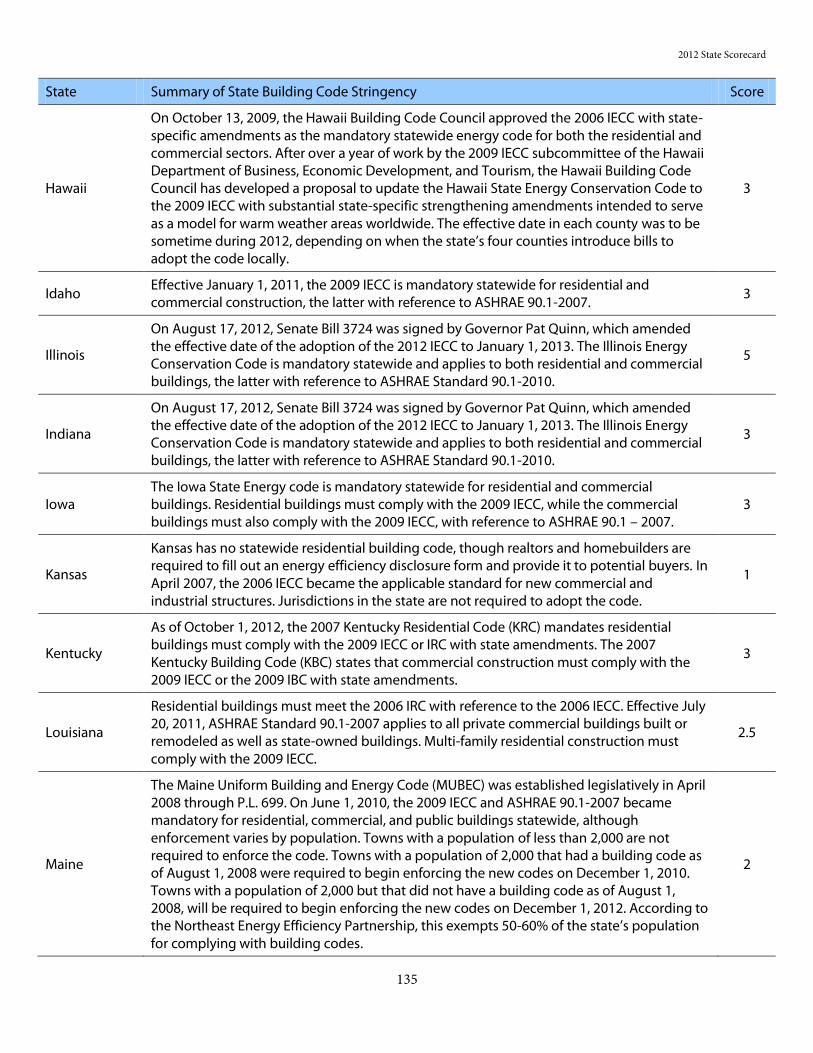
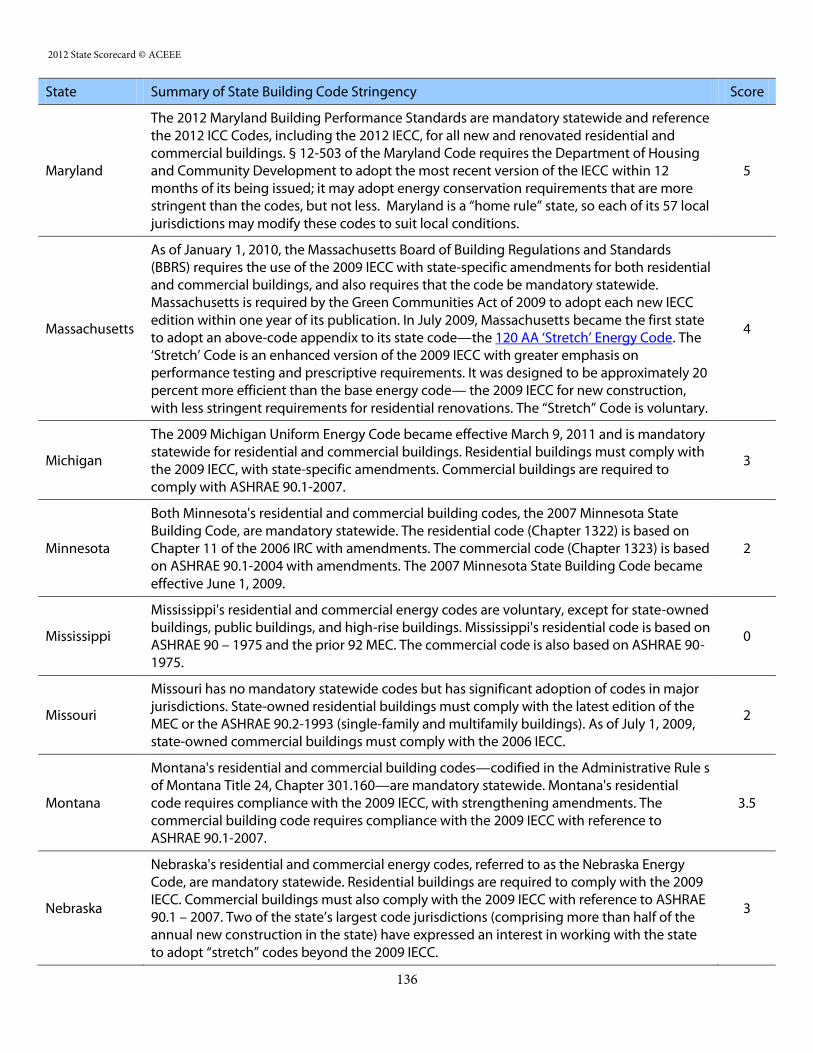
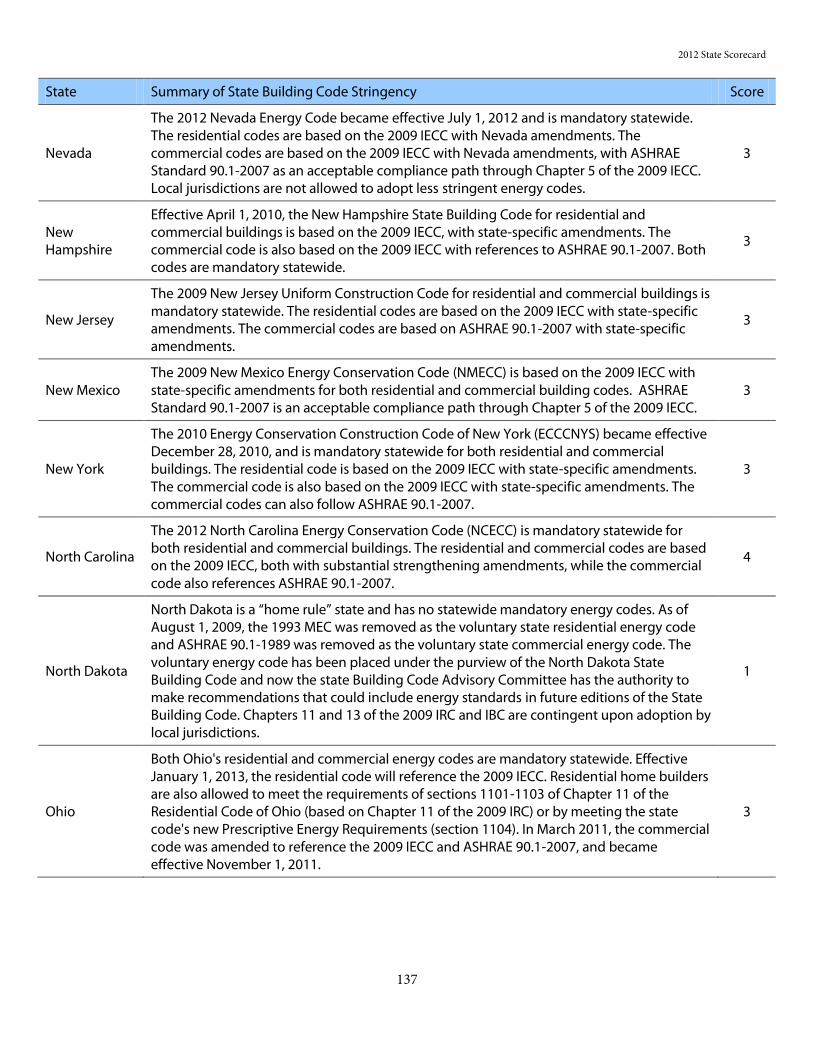
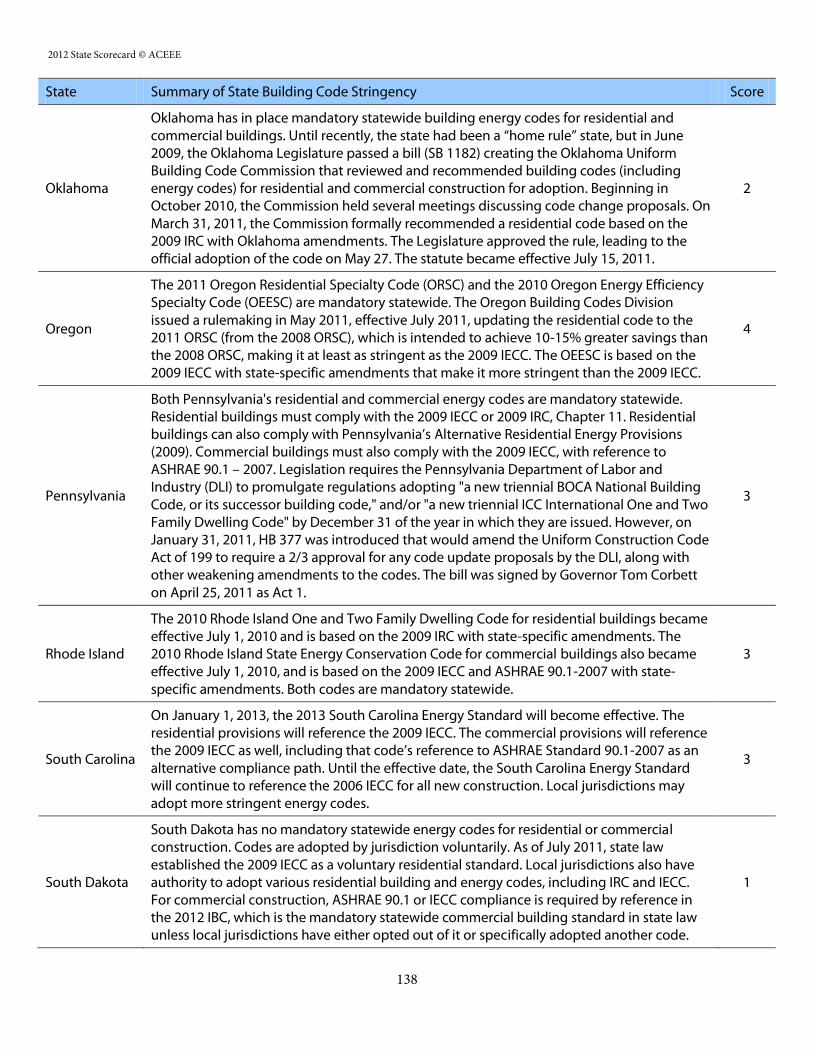
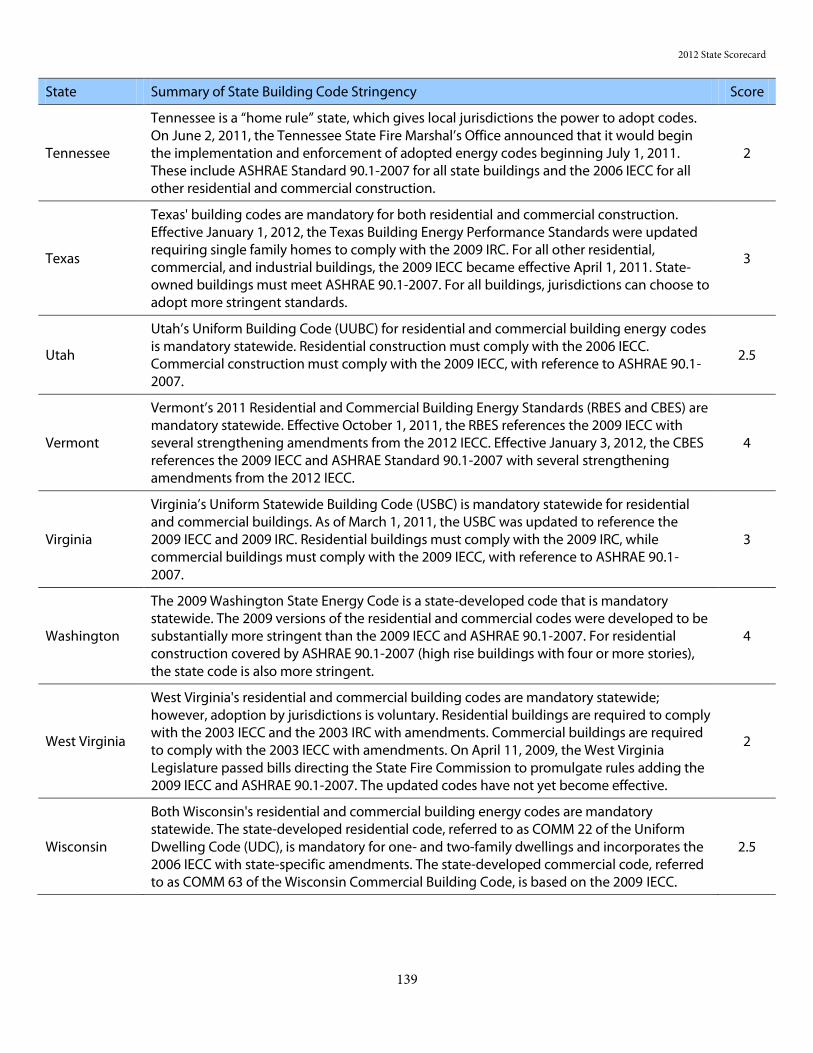
Appendix F: Summary of State Building Code Stringency ....................................................................... 133
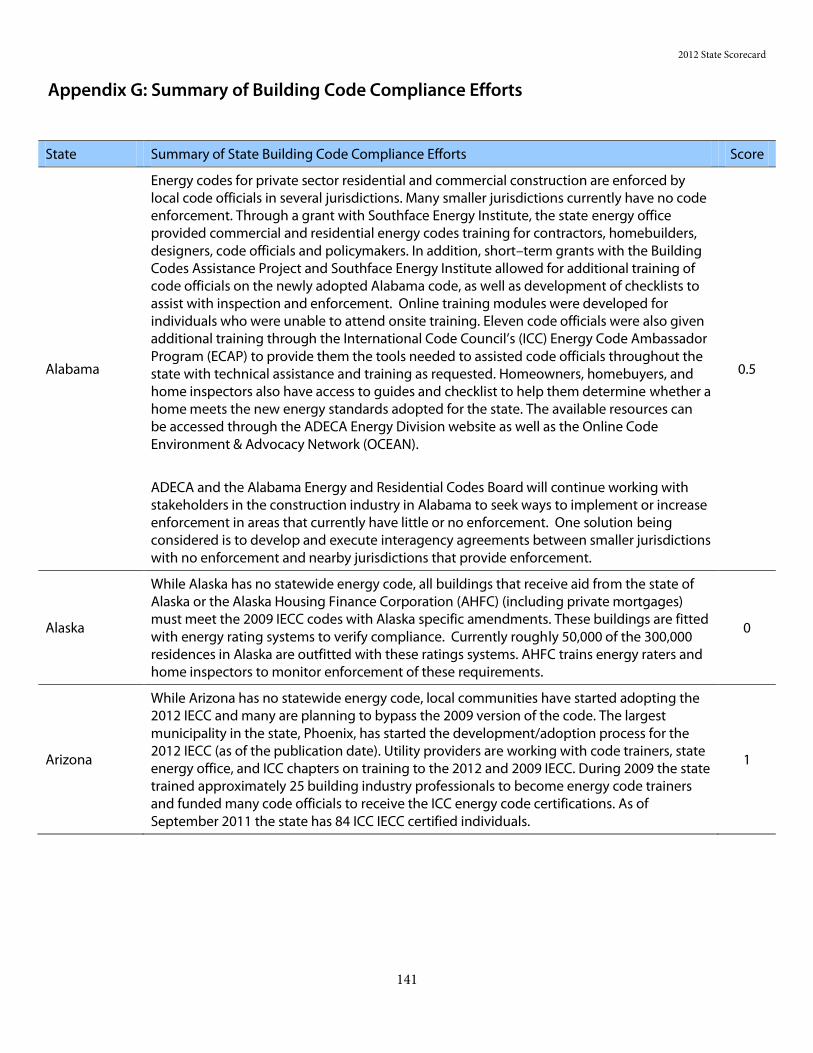
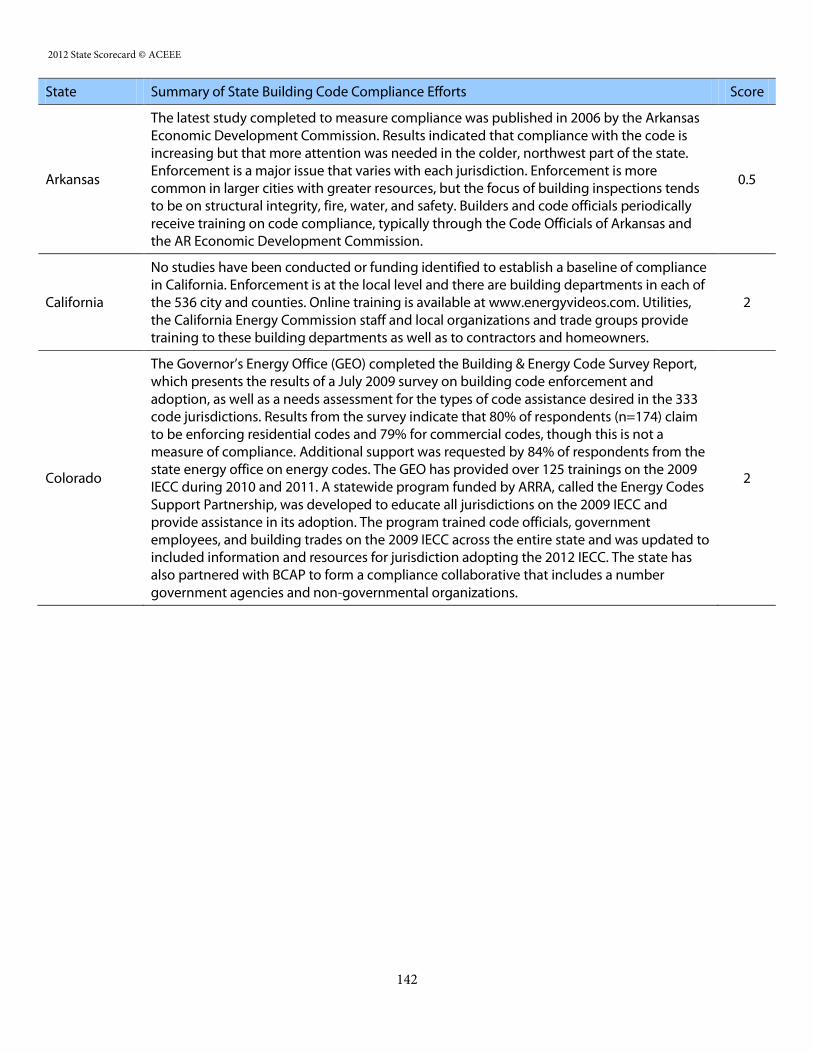
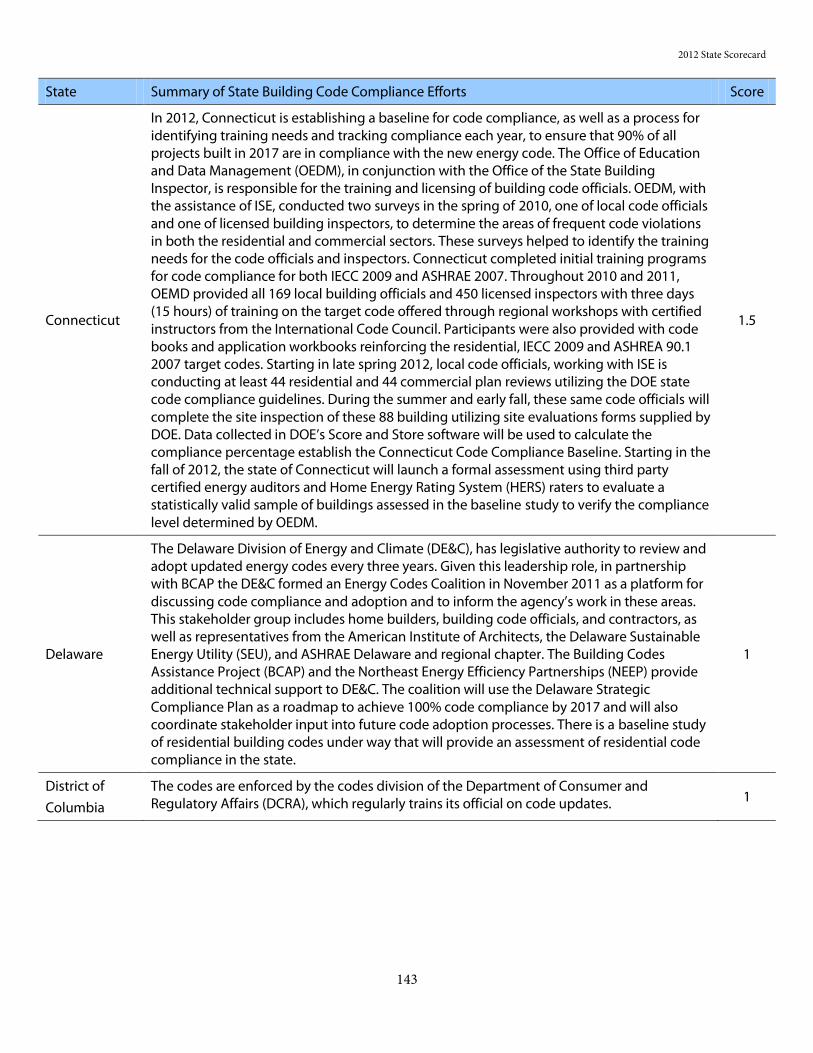
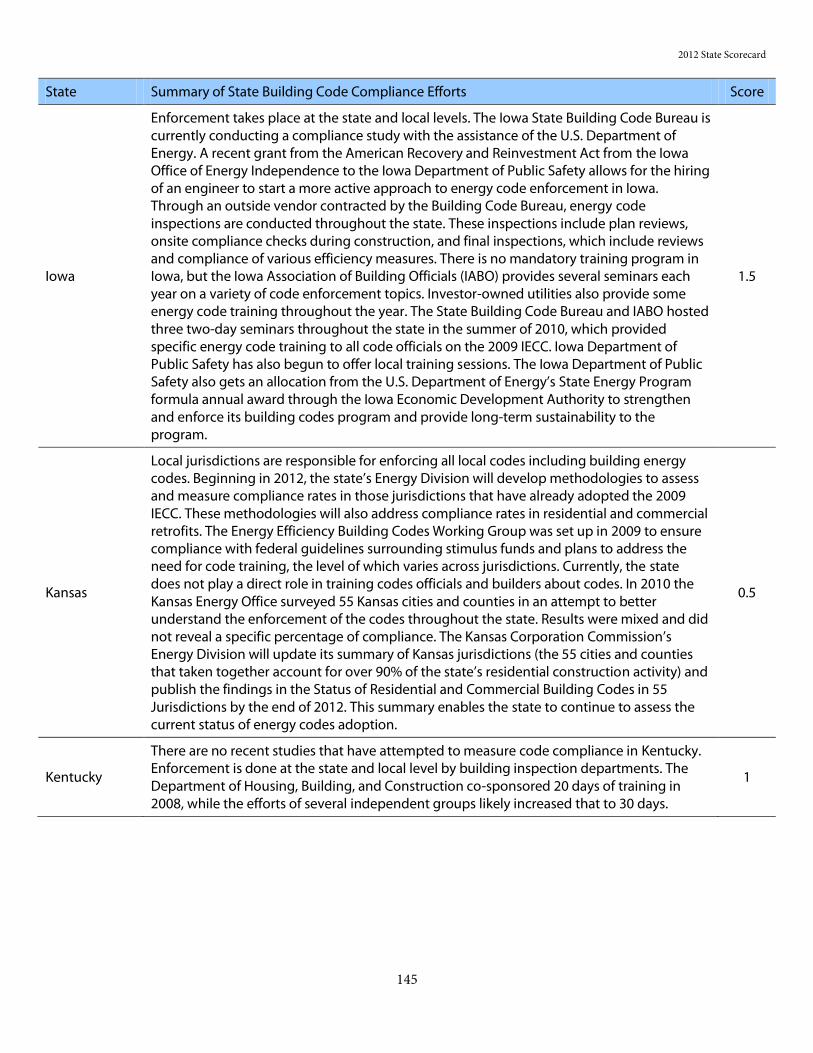
Appendix G: Summary of Building Code Compliance Efforts ................................................................ 141
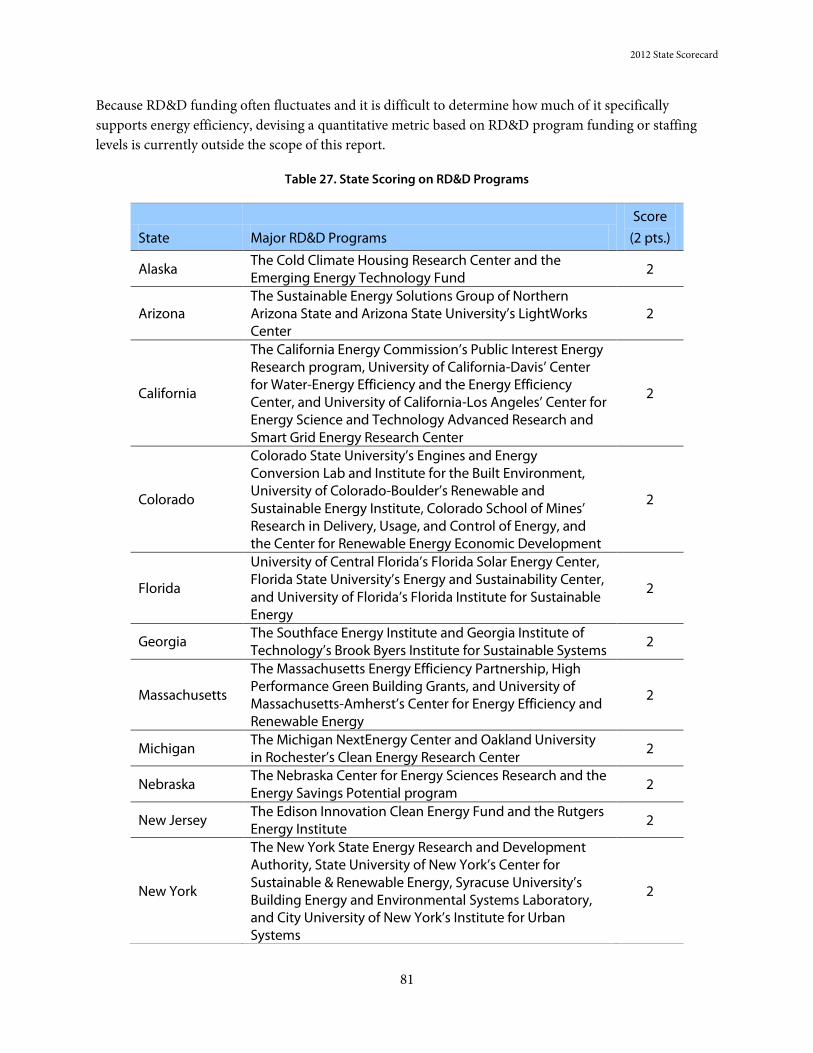
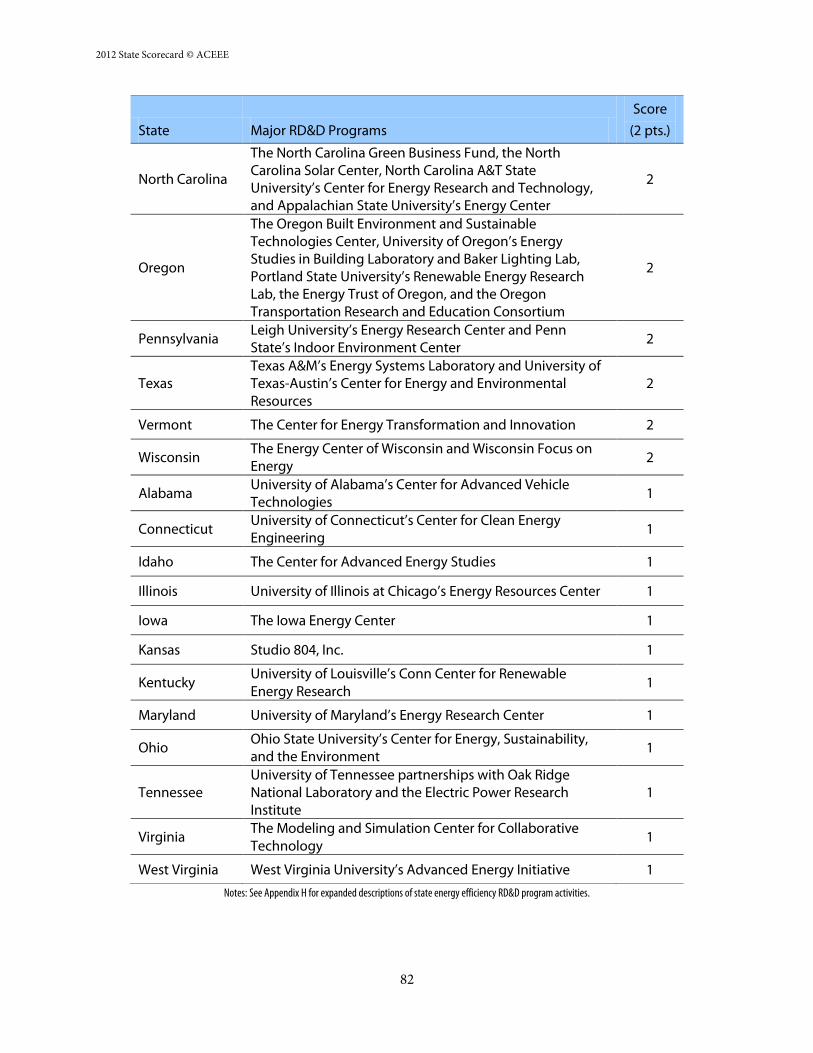
Appendix H: Expanded Table of State RD&D Programs ......................................................................... 155
iv
Acknowledgments We extend our thanks to the U.S. Department of Energy and the U.S. Environmental Protection
Agency for funding this project. The State Energy Efficiency Scorecard is a group effort, and would
not be possible without the significant time and expertise of more than 100 individuals. First and
foremost, we would like to thank our many contacts at state energy offices and public utility
commissions, too numerous to list here, who provided valuable utility data and information on
energy efficiency policies and programs. The State Scorecard is also greatly enhanced by the
comments received from our peers at national and regional organizations, in no particular order:
Niko Dietsch and Maureen McNamara (U.S. Environmental Protection Agency); Eleni Pelican (U.S.
Department of Energy); Howard Geller, Jim Myers, Mike Salisbury, and Ellen Zuckerman (Southwest
Energy Efficiency Project); Josh Craft (Northeast Energy Efficiency Partnerships); Kevin Cullather
and Isaac Elnecave (Midwest Energy Efficiency Alliance); Natalie Mims and John Wilson (Southern
Alliance for Clean Energy); Steve Weil (Collaborative Labeling & Appliance Standards Program);
Jamie Howland and Abigail Anthony (Environment Northeast); Deron Lovaas (Natural Resources
Defense Council); Bill Pentland (Clearedge Power Corporation); Doug Lewin (South-central
Partnership for Energy Efficiency as a Resource); Chuck Collins (Cascade Power Group); Jim
Flanagan (Jim Flanagan Associates); Patrick Wallace (Consortium for Energy Efficiency); Montelle
Clark (Oklahoma Sustainability Network); and David Terry (National Association of State Energy
Officials).
The authors would also like to thank the following staff members of ACEEE and the Appliance
Standards Awareness Project for time spent reviewing drafts and providing comments on the 2012
State Energy Efficiency Scorecard: Maggie Molina, Steven Nadel, Neal Elliott, Naomi Baum, Dan York,
Marty Kushler, Harry Misuriello, Eric Mackres, and Joanna Mauer. Special thanks go to Suzanne
Watson for securing speakers for the press event.
Finally, we thank our communications and operations staff for their work publicizing, designing and
editing the report. We are particularly grateful for the expertise of Glee Murray, Patrick Kiker, Renee
Nida, and Eric Schwass at ACEEE; Karin Matchett at K.E. Mattchett, LLC; and Scott Stapf, Patrick
Mitchell, Ailis Wolf and other staff at The Hastings Group.
v
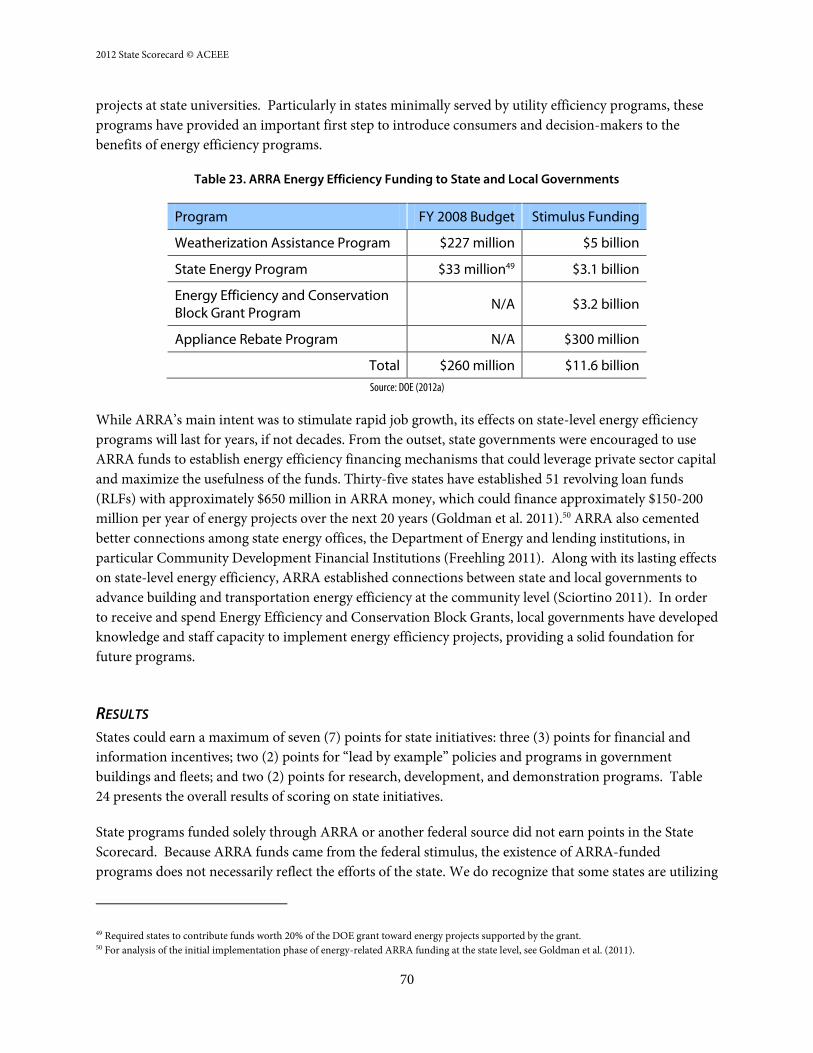
Executive Summary Conversations about energy use in the United States often revolve around the need to expand the
supply of energy to support the growth of our national economy. There is, however, a resource that is
cheaper and quicker to deploy, and cleaner, than building new supply—energy efficiency. Energy
efficiency improvements help businesses, governments, and consumers meet their needs by using less
energy, saving them money, driving investment across all sectors of the economy, creating much-
needed jobs, and reducing environmental impacts.
Governors, legislators, regulators, and citizens are increasingly recognizing that energy efficiency is a
critical state resource. In fact, a great deal of the innovation in policies and programs that promote
energy efficiency originates in states across the country. The 2012 State Energy Efficiency Scorecard
captures this activity through a comprehensive analysis of state efforts to advance energy efficiency.
In this sixth edition of ACEEE’s State Energy Efficiency Scorecard, we rank states on their policy and
program efforts, document best practices, and provide recommendations for ways in which states can
improve their energy efficiency performance. The State Scorecard serves as a benchmark for state
efforts on energy efficiency policies and programs each year, encouraging them to continue
strengthening efficiency commitments as a pragmatic and effective strategy for securing
environmental benefits and promoting economic growth.
KEY FINDINGS
Massachusetts retained the top spot in the State Energy Efficiency Scorecard rankings for the
second year in a row, having overtaken California last year, based on its continued
commitment to energy efficiency under its Green Communities Act of 2008. Among other
things, the Act spurred greater investments in energy efficiency programs by requiring
utilities to save a large and growing percentage of energy every year through efficiency
measures.
Joining Massachusetts in the top five are California, New York, Oregon, and Vermont,
which together comprise a group of truly leading states that have made broad, long-term
commitments to developing energy efficiency as a state resource.
Rounding out the top ten states are Connecticut, Washington, Rhode Island, Maryland, and
Minnesota. Connecticut appears poised to break back into a top five spot, which it has held
in the past.
This year’s most improved states are Oklahoma, Montana, and South Carolina. All three
states significantly increased their budgets for electric efficiency programs in 2011 over
previous years, and saved more energy from such programs in 2010 than in 2009. Oklahoma
put in place natural gas efficiency programs for the first time in 2011, and Montana
dramatically increased its budgets for these programs. These funding increases will likely
yield further savings in coming years.
vi
Other states making significant progress include Arizona, Michigan, North Carolina, and
Pennsylvania, whose implementation of Energy Efficiency Resource Standards led to large
increases in efficiency program spending from 2010 to 2011.
Annual savings from customer-funded energy efficiency programs topped 18 million MWh
in 2010, a 40% increase over a year earlier. This is roughly equivalent to the amount of
electricity the state of Wyoming uses each year.
Utility budgets for electric and natural gas efficiency programs rose to almost $7 billion in
2011, a 27% increase over a year earlier. Of this, $5.9 billion went to electric efficiency
programs, with the remaining $1.1 billion for natural gas programs. These represent 29% and
18% increases, respectively, over 2010 budgets.
Twenty-four states have adopted and adequately funded an Energy Efficiency Resource
Standard, which sets long-term energy savings targets and drives investments in utility-sector
energy efficiency programs. The states with the most aggressive savings targets include
Arizona, Hawaii, Maryland, Massachusetts, Minnesota, New York, Rhode Island, and
Vermont.
Ten states have adopted energy efficiency codes for new building construction that exceed the IECC
2009 or ASHRAE 90.1-2007 codes for residential and commercial building construction. Two
additional states, Maryland and Illinois, have advanced even further by adopting the most recent and
most stringent code for residential construction, the 2012 IECC.
METHODOLOGY
The 2012 State Energy Efficiency Scorecard provides a broad assessment of policy and programs that
improve energy efficiency in our homes, businesses, industry, and transportation. This report
examines six of the primary policy areas in which states typically pursue energy efficiency: utility and
“public benefits” programs and policies; transportation policies; building energy codes; combined
heat and power policies; state government-led initiatives around energy efficiency; and appliance and
equipment standards. Figure ES-1 provides a percentage breakdown of the points assigned to each
policy area.
The baseline year against which we assessed policy and program changes varies by policy category.
Most scores are based on policies in place as of September 2012. In Chapter 2 on utility and public
benefits programs, however, we scored states based on data from 2011 and 2010, the latest years in
which data were available for our metrics.
vii
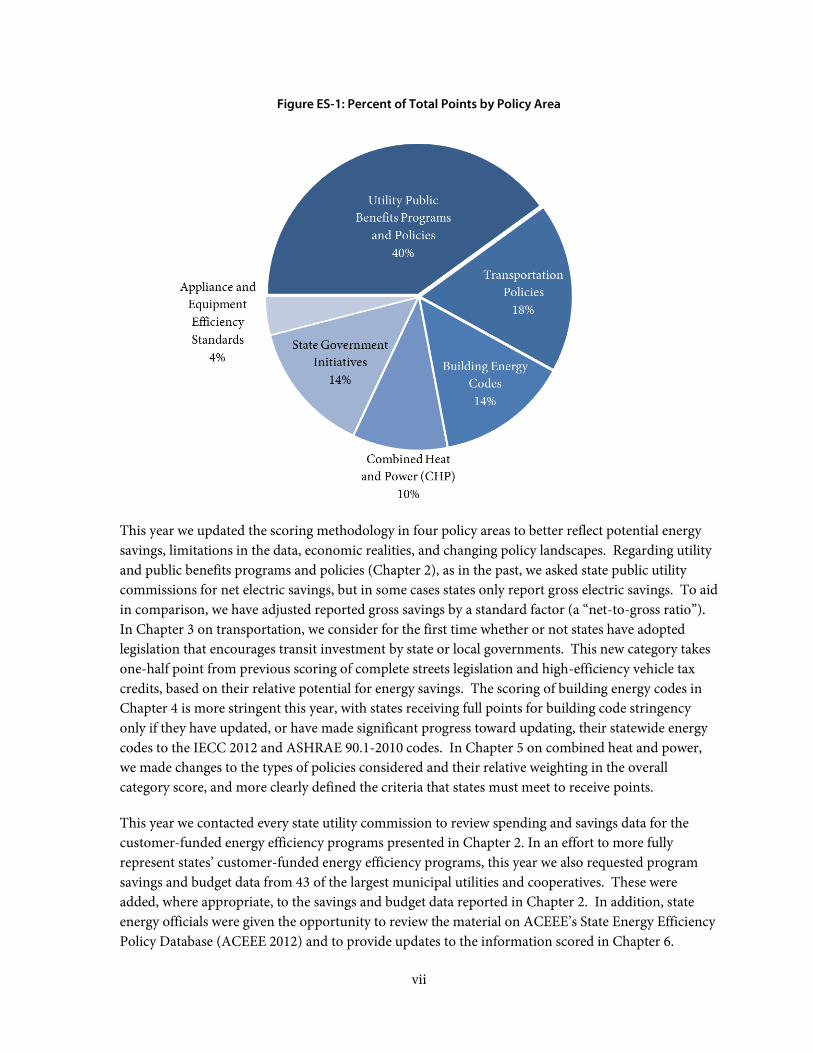
Figure ES-1: Percent of Total Points by Policy Area
This year we updated the scoring methodology in four policy areas to better reflect potential energy
savings, limitations in the data, economic realities, and changing policy landscapes. Regarding utility
and public benefits programs and policies (Chapter 2), as in the past, we asked state public utility
commissions for net electric savings, but in some cases states only report gross electric savings. To aid
in comparison, we have adjusted reported gross savings by a standard factor (a “net-to-gross ratio”).
In Chapter 3 on transportation, we consider for the first time whether or not states have adopted
legislation that encourages transit investment by state or local governments. This new category takes
one-half point from previous scoring of complete streets legislation and high-efficiency vehicle tax
credits, based on their relative potential for energy savings. The scoring of building energy codes in
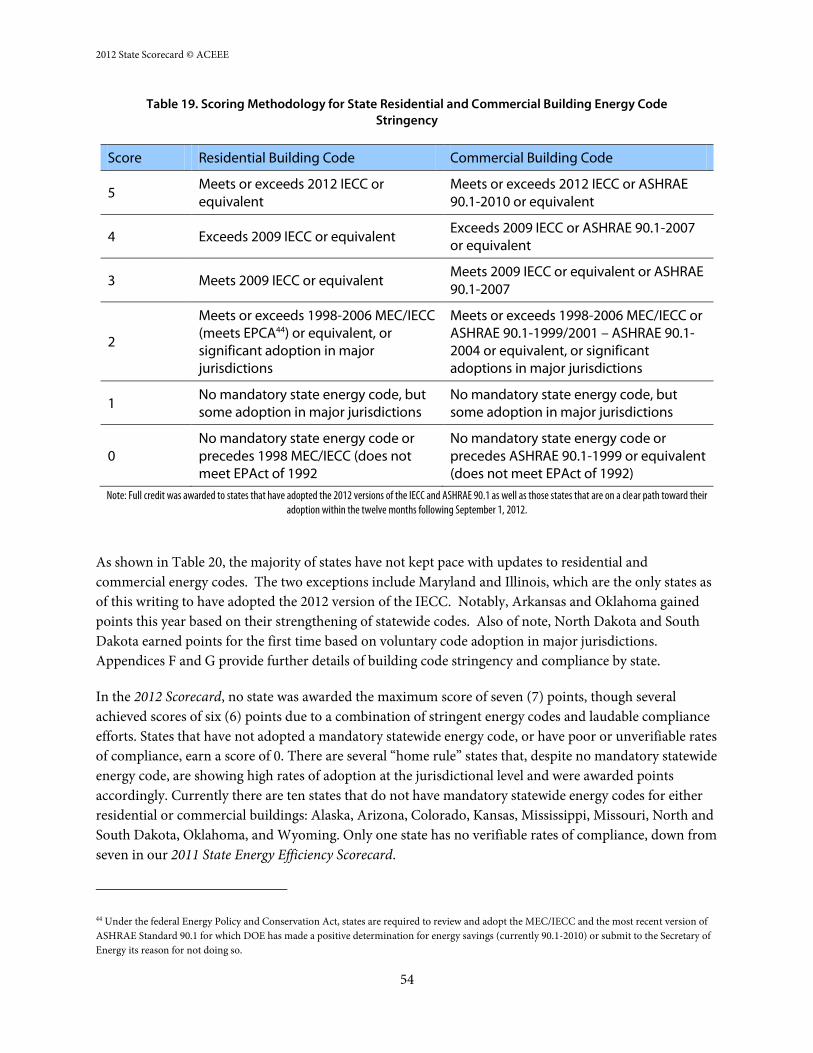
Chapter 4 is more stringent this year, with states receiving full points for building code stringency
only if they have updated, or have made significant progress toward updating, their statewide energy
codes to the IECC 2012 and ASHRAE 90.1-2010 codes. In Chapter 5 on combined heat and power,
we made changes to the types of policies considered and their relative weighting in the overall
category score, and more clearly defined the criteria that states must meet to receive points.
This year we contacted every state utility commission to review spending and savings data for the
customer-funded energy efficiency programs presented in Chapter 2. In an effort to more fully
represent states’ customer-funded energy efficiency programs, this year we also requested program
savings and budget data from 43 of the largest municipal utilities and cooperatives. These were
added, where appropriate, to the savings and budget data reported in Chapter 2. In addition, state
energy officials were given the opportunity to review the material on ACEEE’s State Energy Efficiency
Policy Database (ACEEE 2012) and to provide updates to the information scored in Chapter 6.
viii
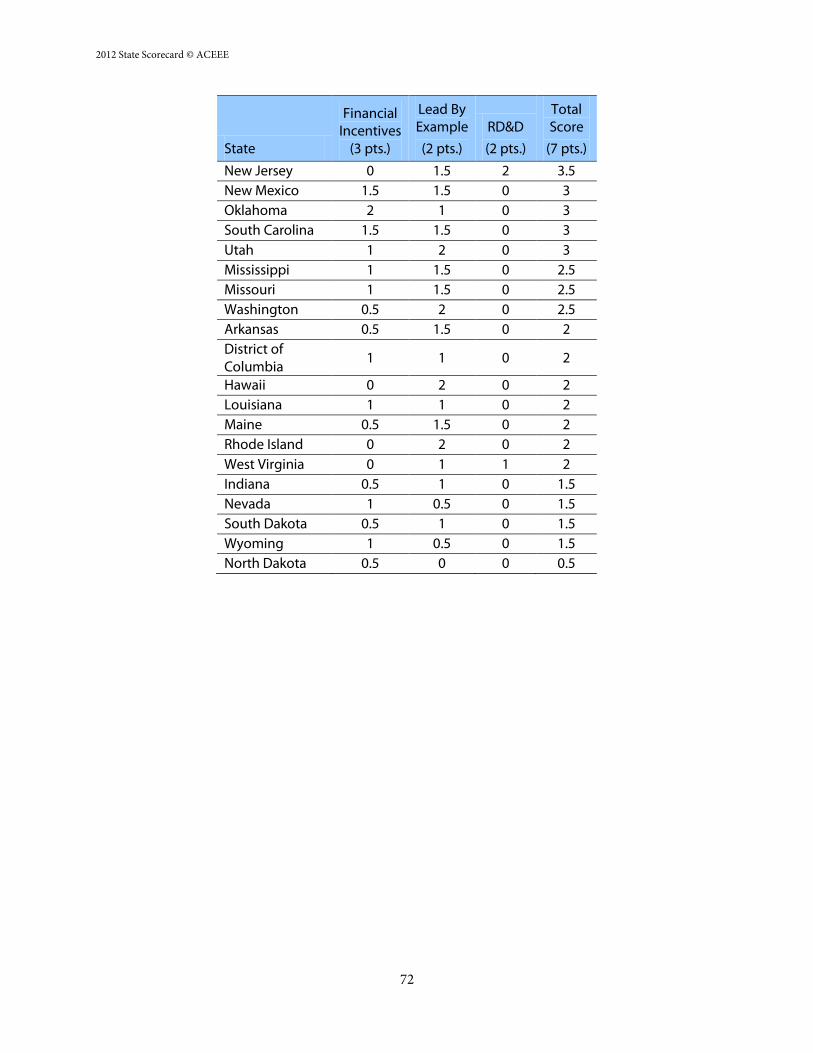
RESULTS
Figure ES-2 shows states’ rankings in the 2012 State Energy Efficiency Scorecard, dividing them into
five tiers for ease of comparison. The scores upon which these rankings are based are detailed in Table
ES-1 on the next page. States could score a maximum of 50 possible points allocated across the six
policy areas considered. Although we provide individual state scores and rankings, the difference
between states is both easiest to understand and most instructive in tiers of ten. This is because the
group of states that compose each of the five tiers have tended to be fairly consistent over time,
although states can and do move into new tiers from year to year. Therefore, differences between
individual states are generally less important than differences between the tiers of states. An identical
ranking for two or more states indicates a tie (e.g., Arizona and Michigan both rank 12th).
Figure ES-2: 2012 State Scorecard Rankings Map
ix
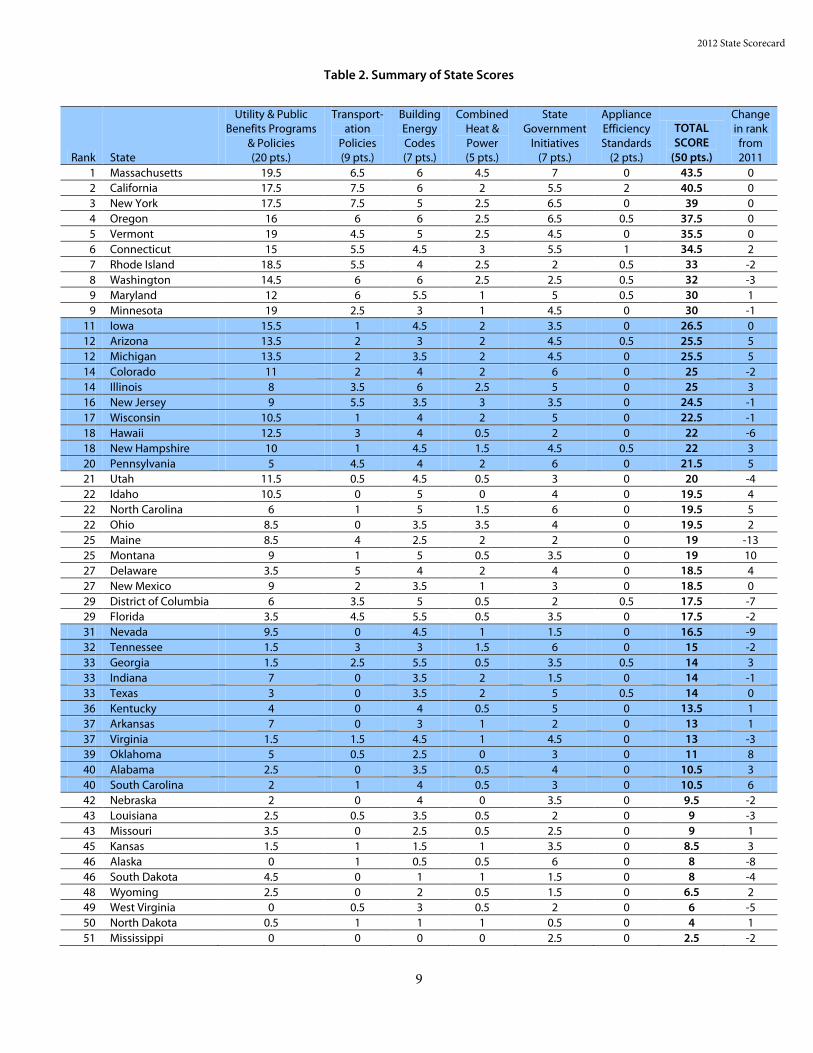
Table ES-1: Summary of State Scores
Rank State
Utility & Public Benefits Programs
& Policies (20 pts.)
Transport-ation
Policies (9 pts.)
Building Energy Codes (7 pts.)
Combined Heat & Power (5 pts.)
State Government
Initiatives (7 pts.)
Appliance Efficiency Standards
(2 pts.)
TOTAL SCORE
(50 pts.)
Change in rank from 2011
1 Massachusetts 19.5 6.5 6 4.5 7 0 43.5 0
2 California 17.5 7.5 6 2 5.5 2 40.5 0
3 New York 17.5 7.5 5 2.5 6.5 0 39 0
4 Oregon 16 6 6 2.5 6.5 0.5 37.5 0
5 Vermont 19 4.5 5 2.5 4.5 0 35.5 0
6 Connecticut 15 5.5 4.5 3 5.5 1 34.5 2
7 Rhode Island 18.5 5.5 4 2.5 2 0.5 33 -2
8 Washington 14.5 6 6 2.5 2.5 0.5 32 -3
9 Maryland 12 6 5.5 1 5 0.5 30 1
9 Minnesota 19 2.5 3 1 4.5 0 30 -1
11 Iowa 15.5 1 4.5 2 3.5 0 26.5 0
12 Arizona 13.5 2 3 2 4.5 0.5 25.5 5
12 Michigan 13.5 2 3.5 2 4.5 0 25.5 5
14 Colorado 11 2 4 2 6 0 25 -2
14 Illinois 8 3.5 6 2.5 5 0 25 3
16 New Jersey 9 5.5 3.5 3 3.5 0 24.5 -1
17 Wisconsin 10.5 1 4 2 5 0 22.5 -1
18 Hawaii 12.5 3 4 0.5 2 0 22 -6
18 New Hampshire 10 1 4.5 1.5 4.5 0.5 22 3
20 Pennsylvania 5 4.5 4 2 6 0 21.5 5
21 Utah 11.5 0.5 4.5 0.5 3 0 20 -4
22 Idaho 10.5 0 5 0 4 0 19.5 4
22 North Carolina 6 1 5 1.5 6 0 19.5 5
22 Ohio 8.5 0 3.5 3.5 4 0 19.5 2
25 Maine 8.5 4 2.5 2 2 0 19 -13
25 Montana 9 1 5 0.5 3.5 0 19 10
27 Delaware 3.5 5 4 2 4 0 18.5 4
27 New Mexico 9 2 3.5 1 3 0 18.5 0
29 District of Columbia 6 3.5 5 0.5 2 0.5 17.5 -7
29 Florida 3.5 4.5 5.5 0.5 3.5 0 17.5 -2
31 Nevada 9.5 0 4.5 1 1.5 0 16.5 -9
32 Tennessee 1.5 3 3 1.5 6 0 15 -2
33 Georgia 1.5 2.5 5.5 0.5 3.5 0.5 14 3
33 Indiana 7 0 3.5 2 1.5 0 14 -1
33 Texas 3 0 3.5 2 5 0.5 14 0
36 Kentucky 4 0 4 0.5 5 0 13.5 1
37 Arkansas 7 0 3 1 2 0 13 1
37 Virginia 1.5 1.5 4.5 1 4.5 0 13 -3
39 Oklahoma 5 0.5 2.5 0 3 0 11 8
40 Alabama 2.5 0 3.5 0.5 4 0 10.5 3
40 South Carolina 2 1 4 0.5 3 0 10.5 6
42 Nebraska 2 0 4 0 3.5 0 9.5 -2
43 Louisiana 2.5 0.5 3.5 0.5 2 0 9 -3
43 Missouri 3.5 0 2.5 0.5 2.5 0 9 1
45 Kansas 1.5 1 1.5 1 3.5 0 8.5 3
46 Alaska 0 1 0.5 0.5 6 0 8 -8
46 South Dakota 4.5 0 1 1 1.5 0 8 -4
48 Wyoming 2.5 0 2 0.5 1.5 0 6.5 2
49 West Virginia 0 0.5 3 0.5 2 0 6 -5
50 North Dakota 0.5 1 1 1 0.5 0 4 1
51 Mississippi 0 0 0 0 2.5 0 2.5 -2
x
Massachusetts scored a total of 43.5 points, retaining the top spot in the State Energy Efficiency
Scorecard rankings for the second year in a row, based in large part on its continued commitment to
energy efficiency under its Green Communities Act of 2008. It continues to lead California, which
remained in second place.
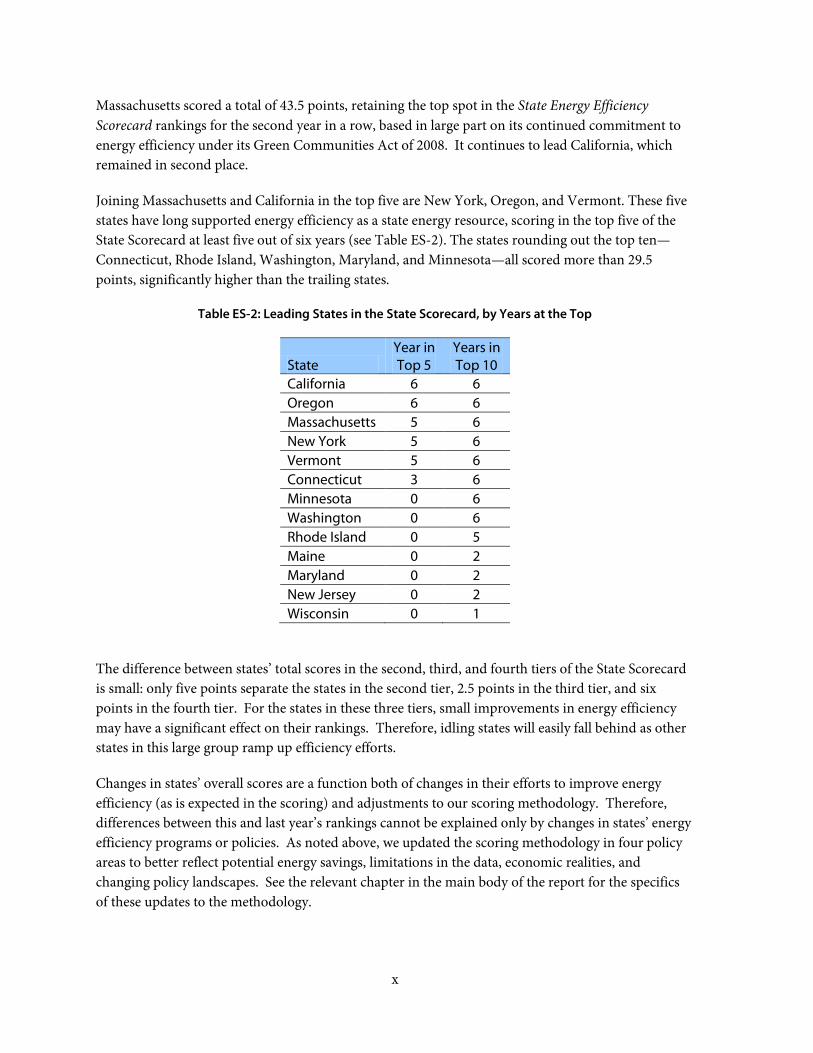
Joining Massachusetts and California in the top five are New York, Oregon, and Vermont. These five
states have long supported energy efficiency as a state energy resource, scoring in the top five of the
State Scorecard at least five out of six years (see Table ES-2). The states rounding out the top ten—
Connecticut, Rhode Island, Washington, Maryland, and Minnesota—all scored more than 29.5
points, significantly higher than the trailing states.
Table ES-2: Leading States in the State Scorecard, by Years at the Top
State Year in Top 5
Years in Top 10
California 6 6
Oregon 6 6
Massachusetts 5 6
New York 5 6
Vermont 5 6
Connecticut 3 6
Minnesota 0 6
Washington 0 6
Rhode Island 0 5
Maine 0 2
Maryland 0 2
New Jersey 0 2
Wisconsin 0 1
The difference between states’ total scores in the second, third, and fourth tiers of the State Scorecard
is small: only five points separate the states in the second tier, 2.5 points in the third tier, and six
points in the fourth tier. For the states in these three tiers, small improvements in energy efficiency
may have a significant effect on their rankings. Therefore, idling states will easily fall behind as other
states in this large group ramp up efficiency efforts.
Changes in states’ overall scores are a function both of changes in their efforts to improve energy
efficiency (as is expected in the scoring) and adjustments to our scoring methodology. Therefore,
differences between this and last year’s rankings cannot be explained only by changes in states’ energy
efficiency programs or policies. As noted above, we updated the scoring methodology in four policy
areas to better reflect potential energy savings, limitations in the data, economic realities, and
changing policy landscapes. See the relevant chapter in the main body of the report for the specifics
of these updates to the methodology.
xi
STATES ON THE MOVE
Twenty-two states rose in the rankings this year, with several states moving up more significantly than
others. “Most improved” status was granted to states based on their change in rank compared to the
2011 State Energy Efficiency Scorecard (reflecting their efforts relative to those of other states) and
percentage change in score over last year (reflecting their efforts relative to themselves).
This year’s most improved states are Oklahoma, Montana, and South Carolina. All three states had
significantly higher budgets for electric efficiency programs in 2011 than in previous years, and saved
more energy from such programs in 2010 than in 2009. Oklahoma put in place natural gas efficiency
programs for the first time in 2011, and Montana dramatically increased its budgets for these
programs. Each of these states also earned more points this year for their state-led efficiency
initiatives, while South Carolina and Montana also earned credit for transportation efficiency
measures. Oklahoma and South Carolina earned credit for, respectively, adopting and pursuing
greater compliance with more efficient statewide building energy codes.
The continued implementation of energy efficiency resource standards by Arizona, Michigan, North
Carolina, and Pennsylvania led to large increases in efficiency program spending from 2010 to 2011
by these states. While not most improved, Kansas, Wyoming, and North Dakota all improved their
scores significantly on a percentage basis.
STRATEGIES FOR IMPROVING ENERGY EFFICIENCY
No state received a full 50 points in the 2012 State Energy Efficiency Scorecard, reflecting the fact that
there remain a wide range of opportunities in all states—including the leading states—to further
improve energy efficiency. We offer the following recommendations to highlight key ways states may
improve their energy efficiency:
Put in place, and adequately fund, an Energy Efficiency Resource Standard or similar
energy savings target. Many of the leading states have an Energy Efficiency Resource
Standard in place, which can have a catalytic effect on increasing energy efficiency and its
associated economic and environmental benefits. The long-term goals associated with an
EERS send a clear signal to market actors about the importance of energy efficiency in utility
program planning, creating a level of certainty to encourage large-scale, productive
investment in energy efficiency technology and services. Long-term energy savings targets
require leadership, sustainable funding sources, and institutional support to deliver on their
goals. See Chapter 2 for further details.
Adopt updated building energy codes and enable the involvement of utility program
administrators in building energy code compliance. Buildings consume more than 40% of
total energy in the United States, making them an essential target for energy savings. Utilities
can also support code compliance financially by purchasing equipment that code officials can
use to measure compliance, as well as generally through new construction programs. See
Chapter 4 for further details.
xii
Adopt stringent tailpipe emissions standards for cars and trucks, and set quantitative
targets for reducing vehicle miles traveled. States that have adopted California’s stringent
tailpipe emissions standards (a proxy for energy use) will realize energy savings and pollution
reductions greater than those resulting from new federal fuel economy standards. Codified
targets for reducing vehicle miles traveled are an important step towards states’ achieving
substantial reductions in energy use and certain pollutants. See Chapter 3 for further details.
Treat combined heat and power as an energy efficiency resource equivalent to other forms
of energy efficiency in an Energy Efficiency Resource Standard. See Chapter 5 for further
details.
Put in place sustainable funding for state government-led energy efficiency incentive
programs; enact policies that require benchmarking of state building energy use and that
drive the market for energy service contracting; and invest in energy efficiency-related
research, development and demonstration centers. State government-led initiatives
complement the existing landscape of utility programs, leveraging resources from the state’s
public and private sectors to generate energy and cost savings that benefit taxpayers and
consumers. See Chapter 6 for further details.
CONCLUSIONS AND LOOKING AHEAD
Energy efficiency policies and programs have continued to advance at the state level over the past
year. A group of leading states remains committed to pursuing more efficient use of energy in
transportation, buildings, and industry; fostering economic development in the energy efficiency
services and technology industry; and saving money for consumers to spur growth in all sectors of the
economy.
A growing number of states have progressed, some rapidly, over the past few years in the pursuit of
their energy efficiency goals. There has been a lot of movement within and outside of the top tier of
states, with Connecticut poised to break into the top five again, and with several states potentially able
to move into the top tier. This dynamism at the policy and program levels is reflected in growing
utility program budgets and savings, as well as in the wide range of other efforts states are taking to
improve their energy efficiency.
We see signs that many states will continue to raise the bar on their commitments to energy efficiency
in 2013 and beyond. For example:
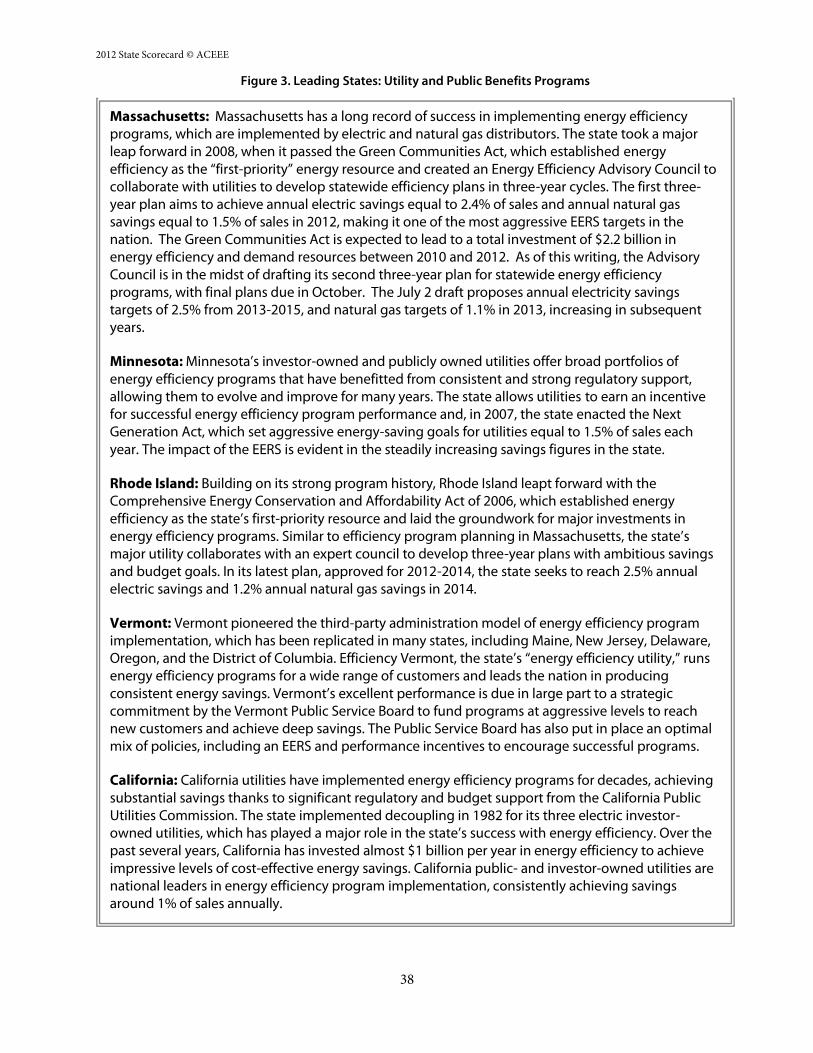
A July 2012 draft of Massachusetts’ second Three-Year Energy Efficiency Plan (State of
Massachusetts 2012), required by the Green Communities Act, proposes annual savings goals
of 2.5% of electricity retail sales from 2013-2015, and 1.1% of natural gas retail sales starting
in 2013 (and increasing in subsequent years), supported by funding for energy efficiency
programs of $2 billion over the three years.
xiii
Oregon’s Governor Kitzhaber recently released a draft of his 10-Year Energy Action Plan
(State of Oregon 2012), which calls for energy efficiency and conservation to meet 100% of
future growth in the electricity load. He called for improving the energy performance of
every occupied state-owned building over the next ten years as a first step towards meeting
this goal.
Connecticut’s Governor Malloy has made a commitment to pursue the top spot in the State
Scorecard in future years, calling for an increase in spending for utility energy efficiency
programs, a strengthening of the bonding authority of the state’s clean energy investment
authority, and reductions in state building energy use starting in 2013 (State of Connecticut
2012).
In October 2011, the New York Public Service Commission extended the state’s Energy
Efficiency Portfolio Standard for an additional 4 years, through 2015, and increased funding
for energy efficiency programs operated by the New York State Energy Research and
Development Authority and the state’s investor-owned utilities by more than $2 billion. The
Commission also approved a new Technology & Market Development program providing an
additional $410 million in public benefit funding over the next 5 years.
The State of Vermont released its Final Comprehensive Energy Plan 2011, its first since the
late 1990s, which promotes increased use of efficiency as one of its first priorities. The plan
recommends: the use of innovative energy efficiency program designs to capture all cost-
effective efficiency; changes to building efficiency program design; goals for increasing the
stringency of and compliance with building energy codes in new construction (including in
public buildings); and a review of state land use provisions and infrastructure needs for
electric vehicles. The Climate Cabinet, established through Executive Order No. 05-11, is
responsible for implementation of the plan (State of Vermont 2011).
Oklahoma, one of the most improved states this year, is poised to make further improvements
in energy efficiency with the recent enactment of Bill 1096, which calls for a 20% reduction in
the energy use of state buildings and educational institutions. Governor Fallin, in her 2012
State of the State address, specifically called for Oklahoma to pursue further strategies for
improving the state’s energy efficiency (State of Oklahoma 2012).
In addition, numerous states that only recently began implementing utility-sector energy efficiency
programs such as Michigan, Ohio, Indiana, Arkansas, and Arizona will likely continue to ramp up
efficiency program activity over the next few years to meet those rising goals.1 As noted in Chapter 2,
combined utility investments in electric and natural gas efficiency programs are estimated to more
than double from 2010 levels to $10.8 billion by 2025, if current savings targets are met, and more
than triple to $16.8 billion if many states give energy efficiency a prominent role as a resource
(Goldman et al. 2012).
1 See (Nowak et al. 2011) for a full discussion of how states are preparing to meet higher energy savings targets.
xiv
These projections of an increasing role for energy efficiency will not, however, occur in a vacuum.
Both state support for energy efficiency and external factors beyond states’ control will likely influence
the impact of energy efficiency programs and policies in 2013 and beyond. Continued uncertainty
around the economic recovery could dampen consumer demand for energy efficiency upgrades in the
residential and commercial sectors, which would impact savings from efficiency programs. More
concerning is the impact on budgets for efficiency. Some policymakers have responded to continued
strain on state budgets by redirecting funds from utility customers or other sources originally meant
for efficiency programs to shore up state finances in other areas,2 or have not allocated energy
efficiency budgets at a level necessary to meet mandated savings goals.3
Energy efficiency can save consumers money, drive investment across sectors of the economy, and
create jobs. While several states are consistently leading the way on energy efficiency and many more
are dramatically increasing their efforts, significant opportunities remain to both sustain current
efforts and continue to scale up. Energy efficiency is a resource abundant in every state and reaping
its full economic, energy security, and environmental benefits will require continued leadership from
a wide range of stakeholders, including legislators, regulators, and the utility industry.
2 New Jersey Governor Christie redirected $42.5 million from the state’s Clean Energy Fund in fiscal year 2011 to cover state energy bills,
and will do the same in FY 2013 (which started July 1, 2012), with a reallocation of $210 million (NJ Spotlight 2012; State of New Jersey
2012). At the beginning of this year, New Jersey also withdrew from the Regional Greenhouse Gas Initiative, which had been providing the
state with substantial funding for energy efficiency projects (State of New Jersey 2011). 3 Maine legislators have not sufficiently allocated FY 2013 funds to efficiency programs in the state. This point is discussed more fully in
Chapter 2.
2012 State Scorecard
1
Introduction Conversations about energy use in the United States often revolve around the need to expand the
supply of energy to support the growth of our national economy. There is, however, a resource that is
cheaper and quicker to deploy, and cleaner, than building new supply—energy efficiency. Energy
efficiency improvements help businesses, governments, and consumers meet their needs by using less
energy, saving them money, driving investment across all sectors of the economy, creating much-
needed jobs, and reducing environmental impacts.
Governors, legislators, regulators and citizens are increasingly recognizing that energy efficiency is a
critical state resource. In fact, a great deal of the innovation in policies and programs that promote
energy efficiency originates in states and localities across the country. The 2012 State Energy
Efficiency Scorecard captures this activity through a comprehensive analysis of state efforts to support
energy efficiency.
The State Energy Efficiency Scorecard ranks states on their policy and program efforts, and allows us to
document best practices, recognize leadership, and provide examples for other states to follow. It
serves as a benchmark for state efforts on energy efficiency policies and programs each year,
encouraging states to continue strengthening efficiency commitments as a pragmatic and effective
strategy for promoting economic growth and environmental benefits.
The State Scorecard builds on previous ACEEE research that focused on each state’s spending on
energy efficiency programs by utilities and the resulting energy savings. In 2007, ACEEE brought
together this state-focused research and release The State Energy Efficiency Scorecard for 2006
(Eldridge et al. 2007), which provided a comprehensive approach to scoring and ranking states on
energy efficiency policies. Due to the broad interest in the 2007 report and the continued demand for
a state-by-state comparison on energy efficiency, we have continued to update the report on an
annual basis and present the 2012 State Energy Efficiency Scorecard as its sixth edition.
This year’s report has nine chapters. In Chapter 1, we discuss our methodology for scoring states
(including changes made this year), present the overall results of our analysis, and provide several
strategies states can use to improve their energy efficiency. Chapter 1 also highlights the leading states,
most improved states, and other trends in state-level energy efficiency that were revealed by the
rankings.
Following this, we present the detailed results for each policy area that we review. Chapter 2 covers
utility and “public benefits” programs and policies. Chapter 3 discusses transportation policies, and
adds a new metric for state transit legislation this year. Chapter 4 deals with building energy codes,
and has updated its scoring of stringency. Chapter 5 scores states on their friendliness towards
combined heat and power projects, based on a significantly updated methodology. Chapter 6 deals
with state government initiatives, including financial incentives, “lead-by-example” policies, and
research, development and demonstration. Chapter 7 covers appliance and equipment efficiency
experts in the field. To the best of our knowledge, policy information for the State Energy Efficiency
Scorecard is accurate as of the end of August 2012.
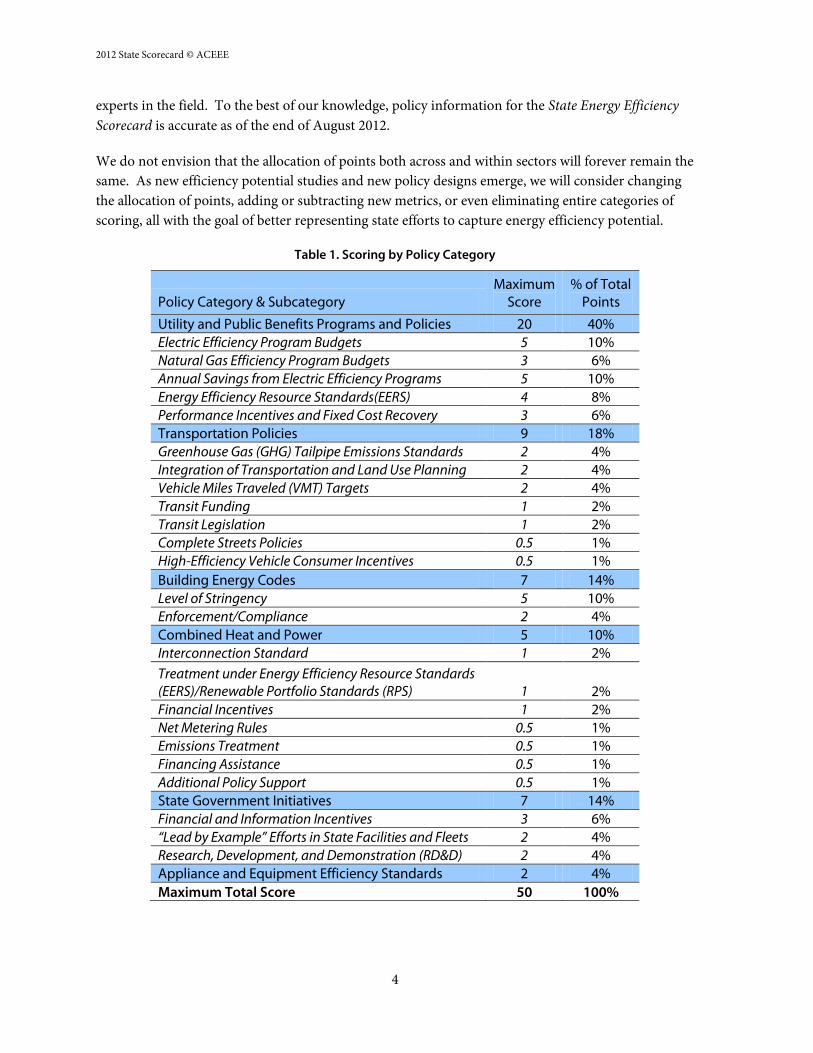
We do not envision that the allocation of points both across and within sectors will forever remain the
same. As new efficiency potential studies and new policy designs emerge, we will consider changing
the allocation of points, adding or subtracting new metrics, or even eliminating entire categories of
scoring, all with the goal of better representing state efforts to capture energy efficiency potential.
Table 1. Scoring by Policy Category
Policy Category & Subcategory Maximum
Score % of Total
Points
Utility and Public Benefits Programs and Policies 20 40% Electric Efficiency Program Budgets 5 10% Natural Gas Efficiency Program Budgets 3 6% Annual Savings from Electric Efficiency Programs 5 10% Energy Efficiency Resource Standards(EERS) 4 8% Performance Incentives and Fixed Cost Recovery 3 6% Transportation Policies 9 18% Greenhouse Gas (GHG) Tailpipe Emissions Standards 2 4% Integration of Transportation and Land Use Planning 2 4% Vehicle Miles Traveled (VMT) Targets 2 4% Transit Funding 1 2% Transit Legislation 1 2% Complete Streets Policies 0.5 1% High-Efficiency Vehicle Consumer Incentives 0.5 1%
Building Energy Codes 7 14% Level of Stringency 5 10% Enforcement/Compliance 2 4% Combined Heat and Power 5 10% Interconnection Standard 1 2%
Treatment under Energy Efficiency Resource Standards (EERS)/Renewable Portfolio Standards (RPS) 1 2% Financial Incentives 1 2% Net Metering Rules 0.5 1% Emissions Treatment 0.5 1% Financing Assistance 0.5 1%
Additional Policy Support 0.5 1% State Government Initiatives 7 14% Financial and Information Incentives 3 6% “Lead by Example” Efforts in State Facilities and Fleets 2 4% Research, Development, and Demonstration (RD&D) 2 4% Appliance and Equipment Efficiency Standards 2 4%
Maximum Total Score 50 100%
2012 State Scorecard
5
Changes in Scoring from 2011
This year we updated the scoring methodology in four policy areas to better reflect potential energy
savings, economic realities and changing policy landscapes. In Chapter 2 on utility and public
benefits programs and policies, as in the past, we asked state public utility commissions for net electric
savings, but in some cases states only report gross electric savings. Therefore, to aid in comparison,
we adjusted reported gross savings by a standard factor (a “net-to-gross ratio”).
In Chapter 3 on transportation, we considered for the first time whether or not states have adopted
legislation that encourages transit investment by state or local governments. This new sub-category
takes one-half point from the points possible in last year’s State Energy Efficiency Scorecard for
“complete streets” legislation and high-efficiency vehicle tax credits, based on consideration of their
relative energy savings potentials.
The scoring of building codes in Chapter 4 is more stringent this year than in the 2011 State Energy
Efficiency Scorecard. States received full points for building code stringency only if they have updated
their statewide energy codes to the most recent residential and commercial codes (IECC 2012 and
ASHRAE 90.1-2010 or equivalent, respectively). States that show significant progress towards the
adoption of these codes (e.g., Massachusetts) also received full credit.
In Chapter 5 on combined heat and power (CHP), we made significant changes to the methodology
to better reflect the multiple factors that influence the development of CHP facilities, and their relative
importance. We made changes to the types of policies considered, their relative weighting in the
overall chapter score, and better defined the criteria that must be met to receive points. As was the
case in the 2011 State Energy Efficiency Scorecard, this year we scored states on interconnection
policies, CHP eligibility under a Renewable Portfolio Standard (RPS) or Energy Efficiency Resources
Standard (EERS), financial incentives for CHP development, net metering standards, and emissions
treatment. We added scoring of additional supportive policies and financing assistance for CHP, and
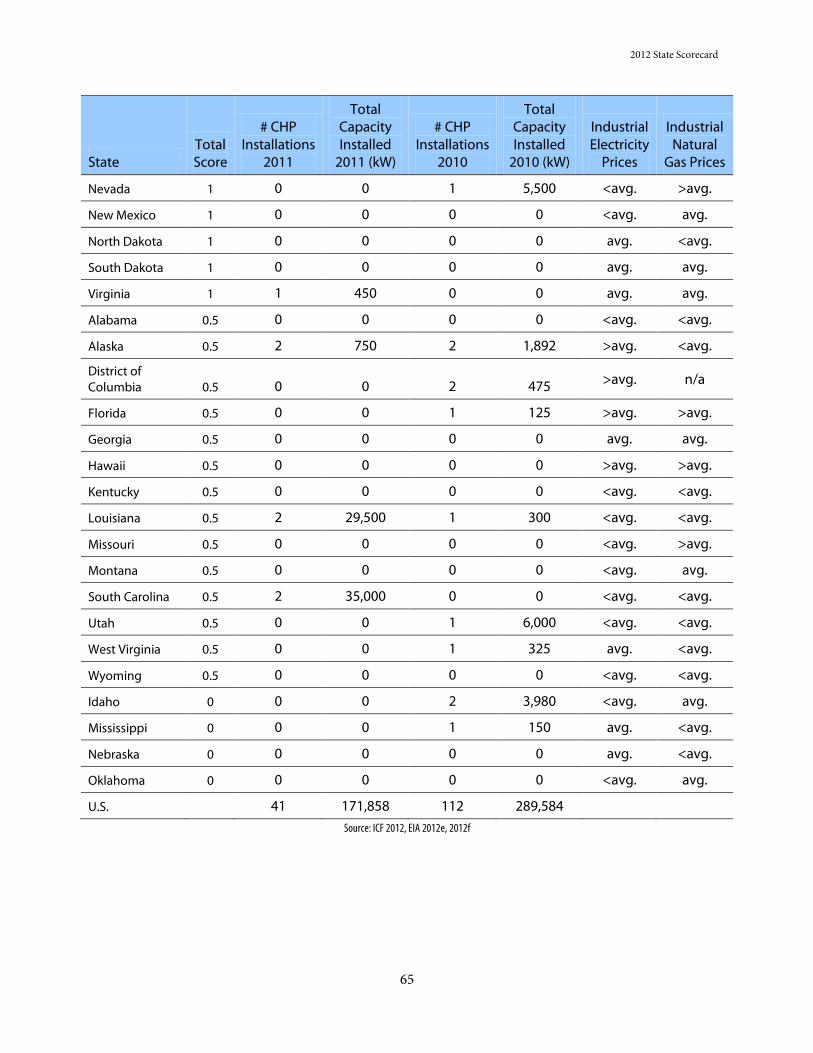
eliminated scoring of standby rates. Local electricity prices, natural gas prices, and state-installed
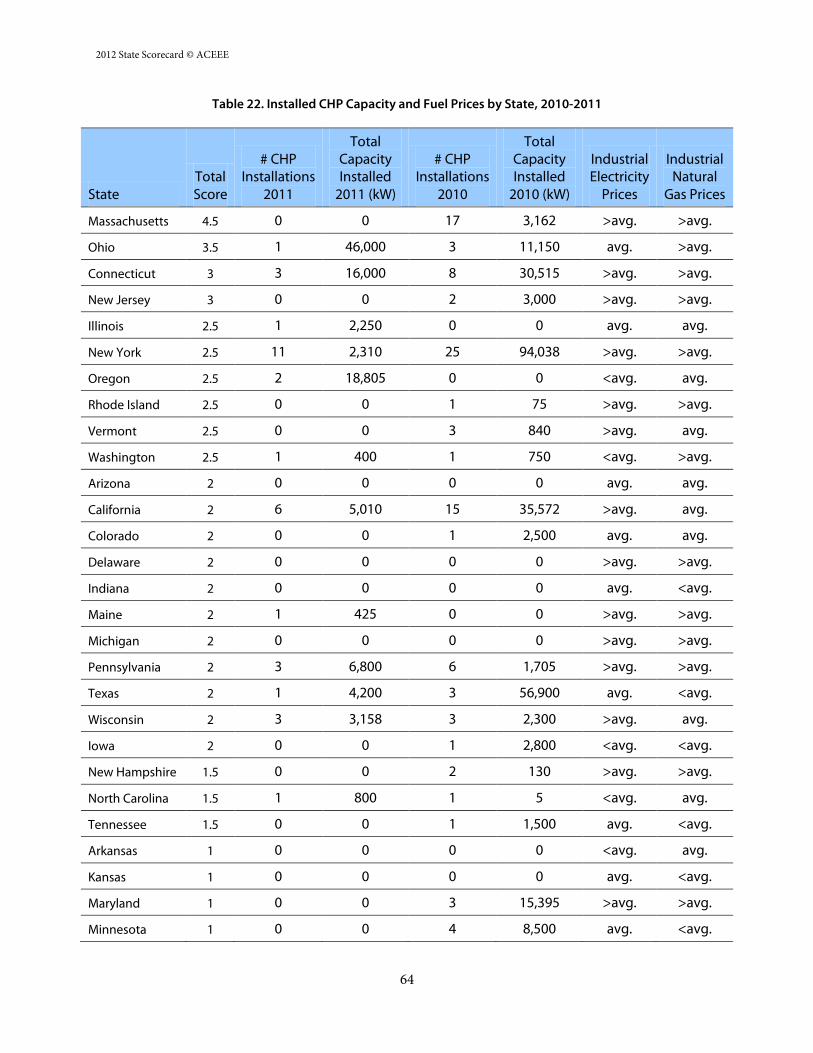
CHP capacity are presented for the first time, but do not factor into states’ scores. For an in-depth
discussion of changes to combined heat and power scoring in the 2012 State Energy Efficiency
Scorecard, refer to Chittum (2012).
All these changes appear to have affected states’ scores in the State Energy Efficiency Scorecard,
although the effect on relative ranking is less clear. Refer to the appropriate chapter for a complete
discussion of these methodological changes, and see below for further discussion on the resulting
impact on scoring.
STATE DATA COLLECTION AND REVIEW
We continue to improve our outreach to state-level stakeholders to verify the accuracy and
comprehensiveness of the policy information on which we score the states. This year we asked every
state utility commission to review spending and savings data for customer-funded programs
presented in Chapter 2, and 36 states responded. In addition, state energy officials were given the
opportunity to review the material on ACEEE’s State Energy Efficiency Policy Database (ACEEE
2012) and to provide updates to the information scored in Chapter 6 on state-led energy efficiency
Chapter 2: Utility and Public Benefits Programs and Policies Authors: Ben Foster, Seth Nowak, Sara Hayes and Kaye Schultz
INTRODUCTION
The utility sector is critical to the implementation of energy efficiency, as electric and natural gas
utilities and independent statewide program administrators deliver a substantial share of U.S. electric
and natural gas efficiency programs.6 Utility customers fund these programs, either through cost
recovery mechanisms or statewide “public benefits funds.” Utilities and independent statewide
program administrators in some states have been delivering energy efficiency programs for decades,
driven by regulation from state utility commissions, and have been offering various efficiency services
for residential, commercial, industrial, and low-income customers. Today, almost every state
implements utility-sector energy efficiency programs, which have come to include a variety of
financial incentives such as rebates and loans, technical services such as audits and retrofits, and
educational campaigns about the benefits of energy efficiency improvements.
We reviewed and ranked the states based on their performance in implementing utility-sector
efficiency programs and enabling policies that are evidence of states’ commitment to energy
efficiency. The five subsets of scoring in this chapter include:
Program budgets: Electricity program budgets as a percentage of statewide utility revenues,
and natural gas program budgets per residential natural gas customer
Energy savings: Incremental7 electric program savings as a percentage of retail sales
Enabling policy: Energy Efficiency Resource Standards (EERS)
Financial incentives for utilities: Performance incentives and fixed cost recovery
Electric and Natural Gas Efficiency Program Budgets
The structure and delivery of customer-funded electric energy efficiency programs8 have changed
dramatically over the past two decades, mostly in conjunction with restructuring efforts. In the 1980s
and 1990s, such programs were almost exclusively the domain of utilities; they administered and
implemented programs under regulatory oversight.
Efforts in the mid-1990s to restructure and deregulate the electric utility markets led numerous states
to put in place “public benefits charges” as a new source of funding for efficiency programs. These
“public benefits” programs established new structures and, in some cases,9 tasked organizations other
6 The other major programs are run by state governments, which are discussed in chapter 6. 7 Incremental annual savings represent new savings from programs in each program cycle, while cumulative savings represent all savings
accrued over the life of a particular program. 8 By “customer-funded energy efficiency” programs—also known as “ratepayer-funded energy efficiency” programs—we mean energy
efficiency programs funded through charges wrapped into customer rates or as some type of charge on customer utility bills. This includes
both utility-administered programs and public benefits programs administered by other entities. We do not include data on separately
funded low-income programs, load management programs, or energy efficiency research and development. 9 States that have established non-utility administration of efficiency programs include Vermont, New York, Oregon, Wisconsin, Delaware,
New Jersey, and the District of Columbia.
2012 State Scorecard
17
than public utilities with the responsibility of administering and delivering energy efficiency and
related energy programs (including low-income energy programs and renewable energy programs).
Not all public benefits programs are administered or delivered by non-utility organizations, however.
In quite a few cases funds from a public benefits program go to the utilities to administer and
implement the programs. Thus, while there have been changes in funding and administrative
structures for customer programs over the past 20-30 years, utilities are still the primary
administrator of such programs on a national basis.
Despite the enactment of public benefits programs in many states, restructuring resulted in a
precipitous decrease in funding for customer-funded electric energy efficiency programs, from almost
$1.8 billion in 1993 to about $900 million in 1998 (nominal dollars). The principal reasons for this
decline included utility uncertainty about newly restructured markets and the expected loss of “cost
recovery mechanisms” for their energy efficiency programs.10 Generally, utilities did not see
customer-funded energy efficiency programs as being compatible with competitive retail markets.
After restructuring efforts declined in some states over the past decade utility commissions have
placed renewed focus and importance on energy efficiency programs. From its low point in 1998,
spending for electricity programs increased five-fold by 2010, from approximately $900 million to
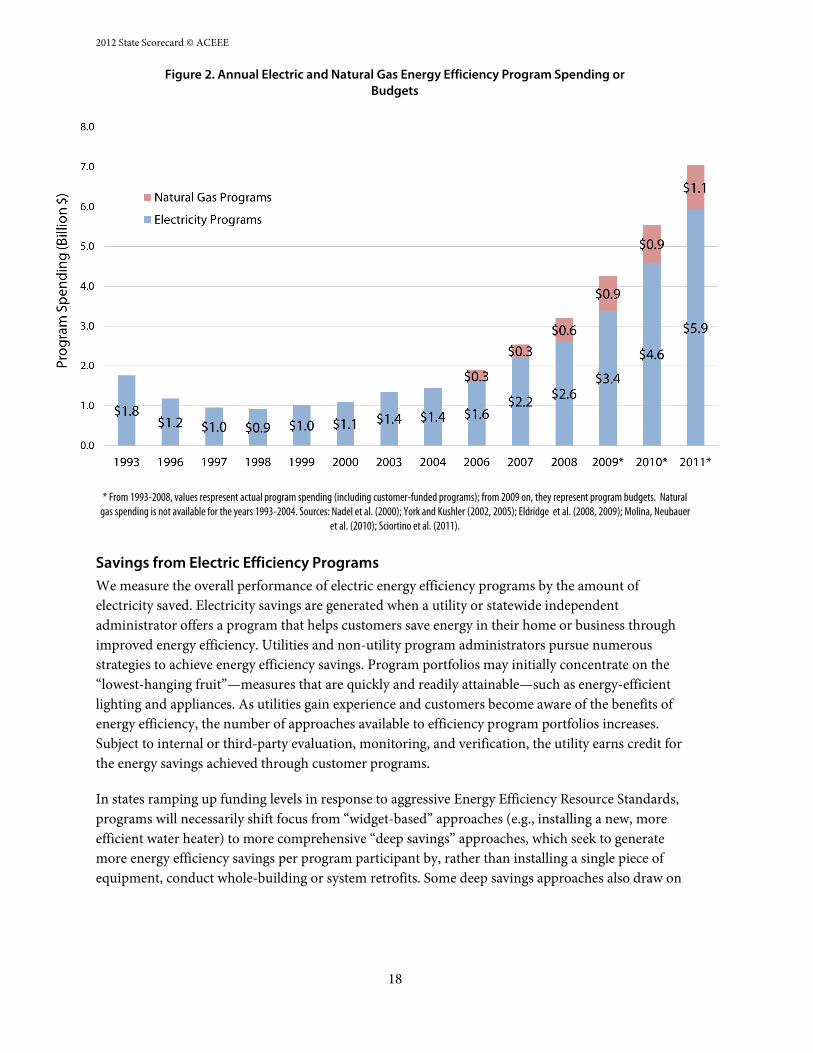
$4.6 billion. And in 2011, total budgets for electricity efficiency programs reached approximately $5.9
billion. Adding this to natural gas program budgets of $1.1 billion, we estimate total efficiency
program budgets of $7 billion in 2011 (see Figure 2).
Given the increasing commitments to energy efficiency on the part of state regulatory commissions,
this growth will likely continue over the next decade. In one analysis of customer-funded energy
efficiency program budgets, funding for electric and natural gas programs is estimated to more than
double from 2010 levels to $10.8 billion by 2025, if current savings targets are met, and more than
triple to $16.8 billion if states give energy efficiency a prominent role as an energy resource (Goldman
et al. 2012). This analysis also suggests a significant broadening of the U.S. energy efficiency market,
with a large portion of the projected increases in spending coming from states in the Midwest and
South that have historically had relatively low levels of funding for energy efficiency.
10 Under traditional regulatory structures, utilities do not have an economic incentive to help their customers become more energy efficient
because their revenues and profits fall in line with falling energy sales from energy efficiency programs. To address this disincentive, state
regulators allow utilities to recover, at a minimum, the costs of running energy efficiency programs through charges on customer bills.
Figure 2. Annual Electric and Natural Gas Energy Efficiency Program Spending or Budgets
* From 1993-2008, values respresent actual program spending (including customer-funded programs); from 2009 on, they represent program budgets. Natural gas spending is not available for the years 1993-2004. Sources: Nadel et al. (2000); York and Kushler (2002, 2005); Eldridge et al. (2008, 2009); Molina, Neubauer
et al. (2010); Sciortino et al. (2011).
Savings from Electric Efficiency Programs
We measure the overall performance of electric energy efficiency programs by the amount of
electricity saved. Electricity savings are generated when a utility or statewide independent
administrator offers a program that helps customers save energy in their home or business through
improved energy efficiency. Utilities and non-utility program administrators pursue numerous
strategies to achieve energy efficiency savings. Program portfolios may initially concentrate on the
“lowest-hanging fruit”—measures that are quickly and readily attainable—such as energy-efficient
lighting and appliances. As utilities gain experience and customers become aware of the benefits of
energy efficiency, the number of approaches available to efficiency program portfolios increases.
Subject to internal or third-party evaluation, monitoring, and verification, the utility earns credit for
the energy savings achieved through customer programs.
In states ramping up funding levels in response to aggressive Energy Efficiency Resource Standards,
programs will necessarily shift focus from “widget-based” approaches (e.g., installing a new, more
efficient water heater) to more comprehensive “deep savings” approaches, which seek to generate
more energy efficiency savings per program participant by, rather than installing a single piece of
equipment, conduct whole-building or system retrofits. Some deep savings approaches also draw on
2012 State Scorecard
19
savings from complementary efficiency efforts, such as the enforcement of building energy codes.11
Deep savings approaches may also add to the emphasis on whole-building retrofits and
comprehensive changes in systems and operations by including behavioral elements that empower
customers with contextual information on energy use.
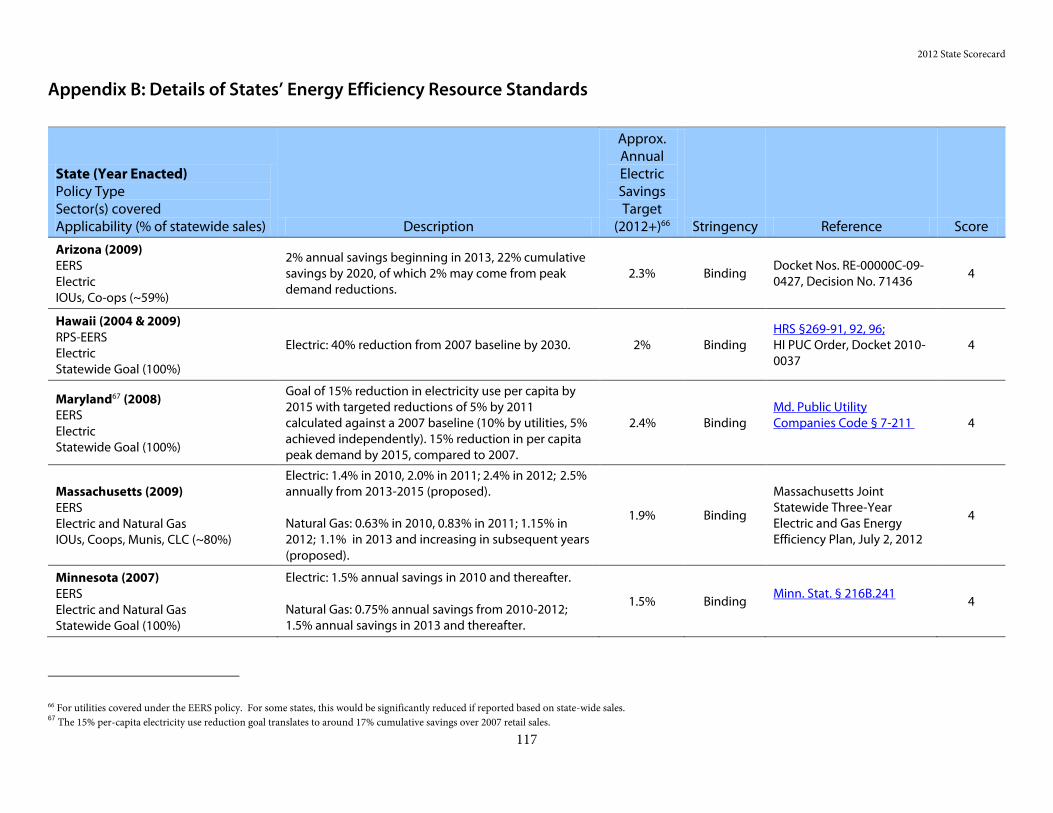
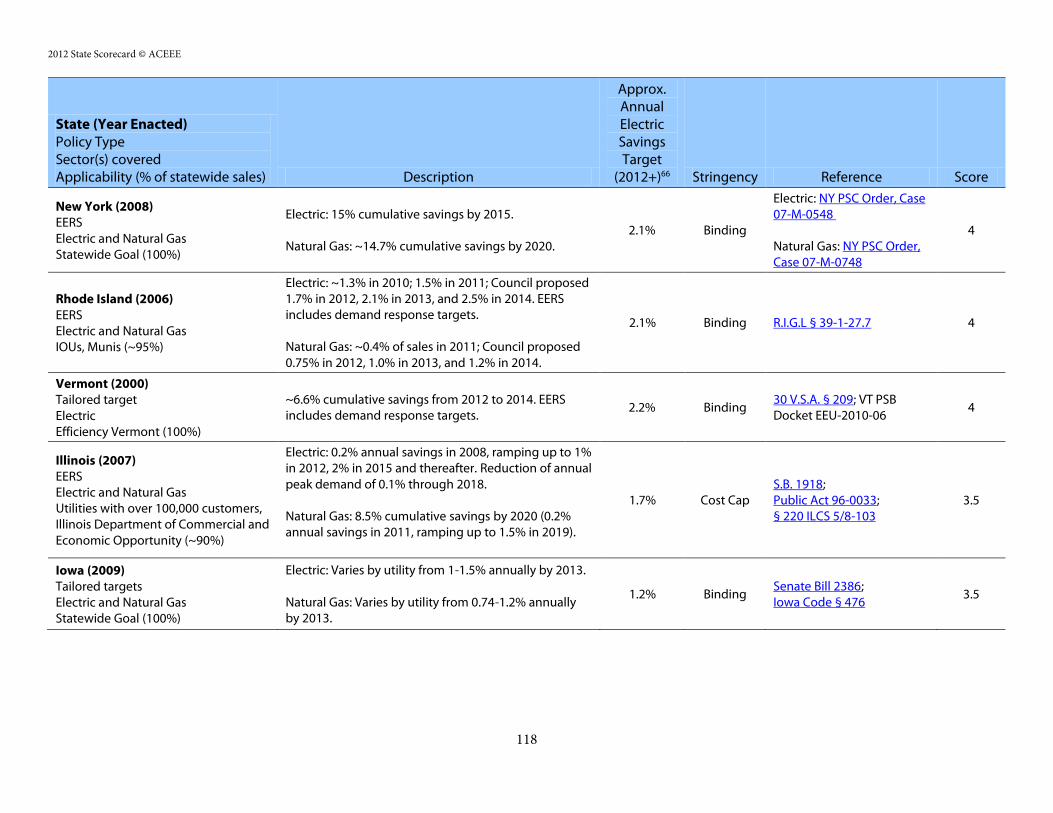
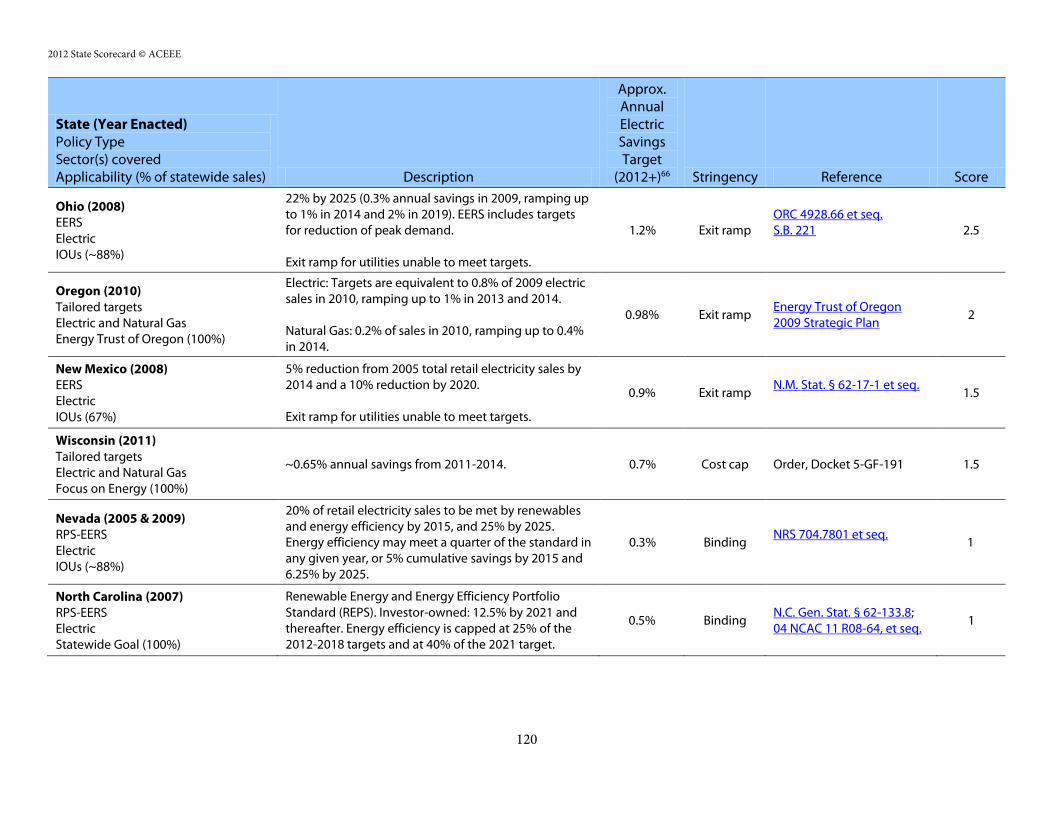
Energy Efficiency Resource Standards
Enabling policies such as “Energy Efficiency Resource Standards” (EERS) and financial incentives for
utilities (see next section) are critical to leveraging energy efficiency funding and encouraging savings
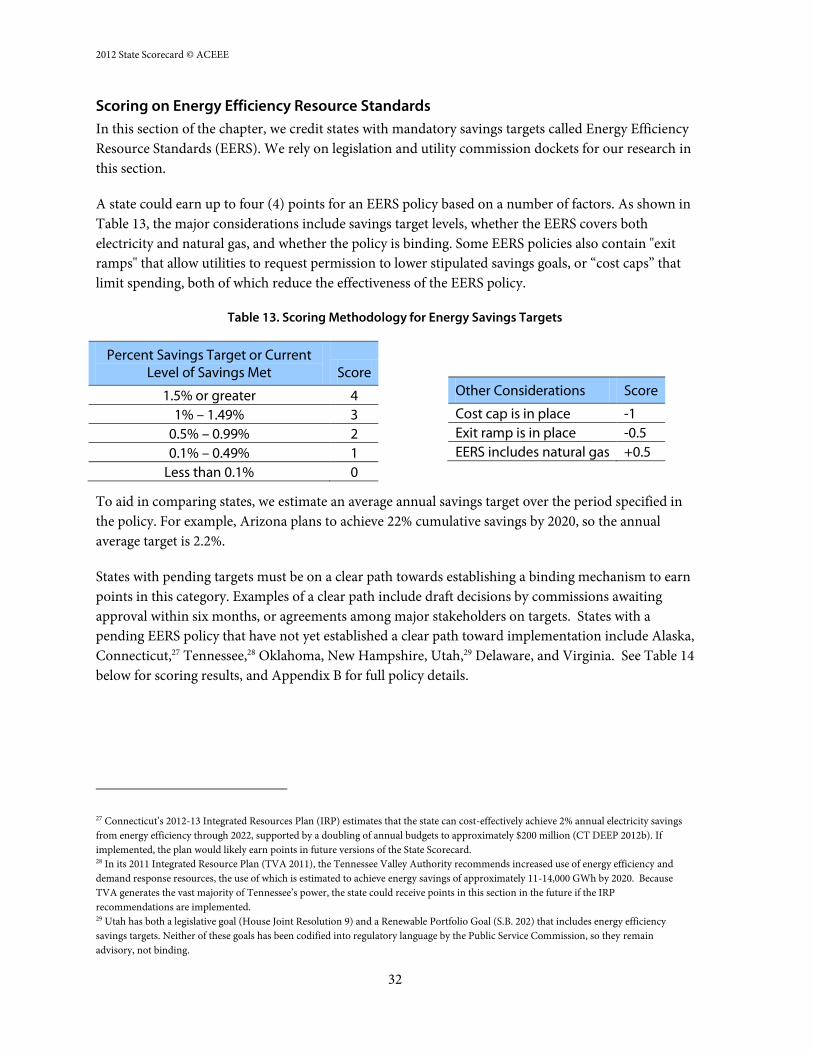
over the near and long terms. Twenty-four states now have fully-funded policies in place that establish
specific energy savings targets that utilities or independent statewide program administrators must
meet through customer energy efficiency programs. These policies—called “Energy Efficiency
Resource Standards”—set multi-year targets for electric or natural gas efficiency, such as 2%
incremental savings per year or 20% cumulative savings by 2020.12
Energy Efficiency Resource Standards aim explicitly for quantifiable energy savings, reinforcing the
idea that energy efficiency is a utility system resource on par with supply-side resources. These
standards also help utility system planners more clearly anticipate and project the impact of energy
efficiency programs on utility system loads and resource needs. Energy savings targets are generally
set at levels that push efficiency programs to achieve higher savings than they otherwise would have.
EERS policies maintain strict requirements for cost-effectiveness so that efficiency programs are
guaranteed to provide overall benefits to customers. And Energy Efficiency Resource Standards help
to ensure a long-term commitment to energy efficiency as a resource, building essential customer
engagement as well as the workforce and market infrastructure necessary to sustain the high levels of
savings.13
EERS policies encompass three distinct approaches to achieving a single outcome—binding, long-
term targets for energy efficiency savings from utility programs (Sciortino et al. 2011). The three
approaches are a statewide an explicit Energy Efficiency Resource Standard, long-term energy savings
targets set by utility commissions and tailored to individual utilities or statewide independent
administrators, and the incorporation of energy efficiency as an eligible resource in a Renewable
Portfolio Standard (RPS). While the latter two options may not technically be a “standard” in the
traditional sense, ACEEE has defined all three approaches as an EERS to avoid confusion and to
highlight the key similarity of all these policies—establishing binding, long-term energy savings
targets. Table 5 describes key distinctions among these three policies and identifies the states that
utilize them.
11 See ACEEE’s recent research report, Energy Efficiency Resource Standards: Strategies for Higher Savings (Nowak et al. 2011) for a full
discussion on this topic. 12 “Multi-year” is defined as three or more years. EERS policies may set specific targets as a percentage of sales, as specific gigawatt-hour
(GWh) energy savings targets without reference to sales in previous years, or as a percentage of load growth. 13 ACEEE’s 2011 report, Energy Efficiency Resource Standards: A Progress Report on State Experience, analyzes current trends in EERS
implementation and finds that most states are meeting or are on track to meet energy savings targets (Sciortino et al. 2011).
Table 5. Key Distinctions of Energy Efficiency Resource Standards
Policy Type Description Applicable States
Statewide Energy Efficiency Resource Standard
Typically set by state legislatures and codified by utility commissions, the statewide EERS requires utilities to achieve a prescribed level of savings. In some states, legislatures require utilities to invest in all cost-effective efficiency, with specific targets set by stakeholder councils and public utilities commissions.
Arizona, Arkansas, California, Illinois, Indiana, Maryland, Massachusetts, Michigan, Minnesota, New Mexico, New York, Ohio, Pennsylvania, Rhode Island, Texas
Tailored Target
Initiated in a variety of ways, long-term energy efficiency targets in these states are tailored to each specific utility or third-party program administrator. In each case, law or regulation calls for the establishment of multi-year (3-year+), specific energy savings targets.
Combined Energy Efficiency Resource Standard and Renewable Portfolio Standard
Energy efficiency may be classified as an eligible resource in state Renewable Portfolio Standards. In these cases, energy efficiency is measured on a cumulative, rather than annual, incremental basis.
Hawaii, Nevada, North Carolina
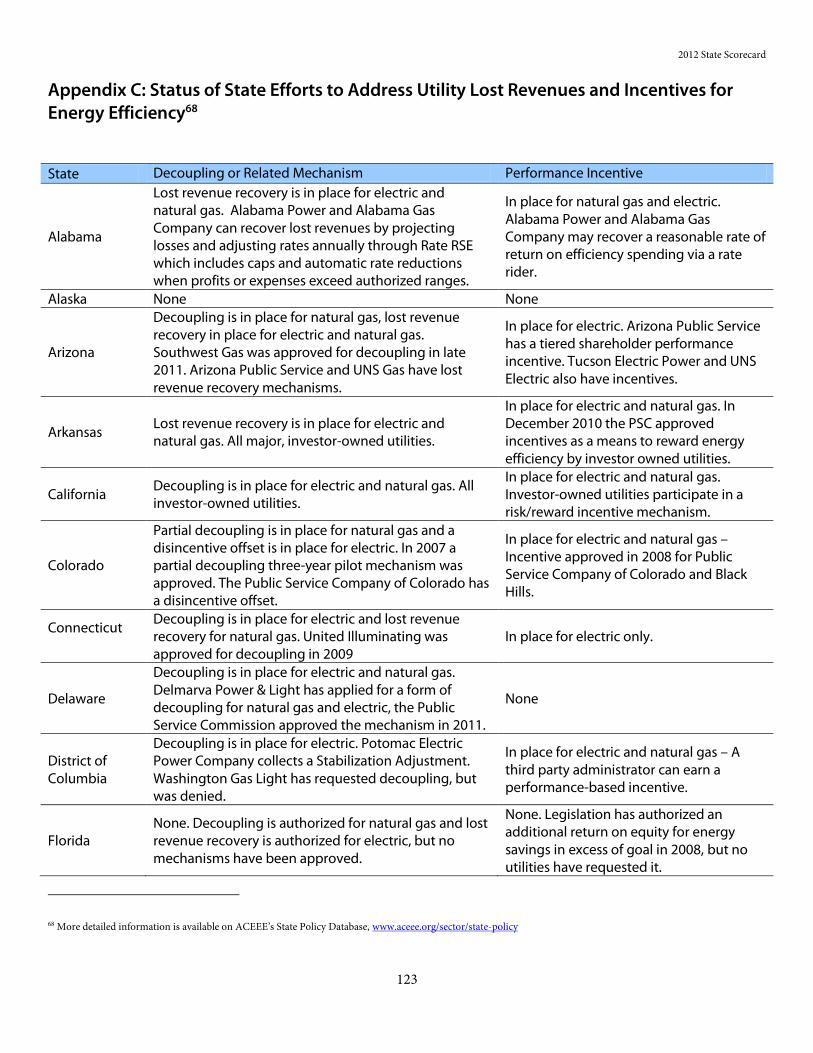
Financial Incentives Affecting Utility Investment in Efficiency: Earning a Return and Addressing Lost Revenues
Under traditional regulatory structures, utilities do not have an economic incentive to help their
customers become more energy-efficient. In fact, they typically have a disincentive because falling
energy sales from energy efficiency programs reduce utilities' revenues and profits, an effect referred
to as "lost revenues" or "lost sales." Since utilities' earnings are usually based on the total amount of
capital invested in certain asset categories (such as transmission lines and power plants) and the
amount of electricity sold, the financial incentives are very much tilted in favor of increased electricity
sales and expanding supply-side systems.
Understanding this dynamic has led industry experts to devise ways of addressing possible loss of
earnings and profit that can result from customer energy efficiency programs while removing utilities’
financial disincentive to promote energy efficiency. There are three key policy approaches to properly
align utility incentives and remove barriers to energy efficiency (York & Kushler 2011). The first is to
ensure recovery of the direct costs associated with energy efficiency programs. This is a minimum
threshold requirement for utilities and related organizations to fund and offer energy efficiency
programs and virtually every state allows this in some form. Given the wide acceptance of program
cost recovery, we do not address it in the State Scorecard.
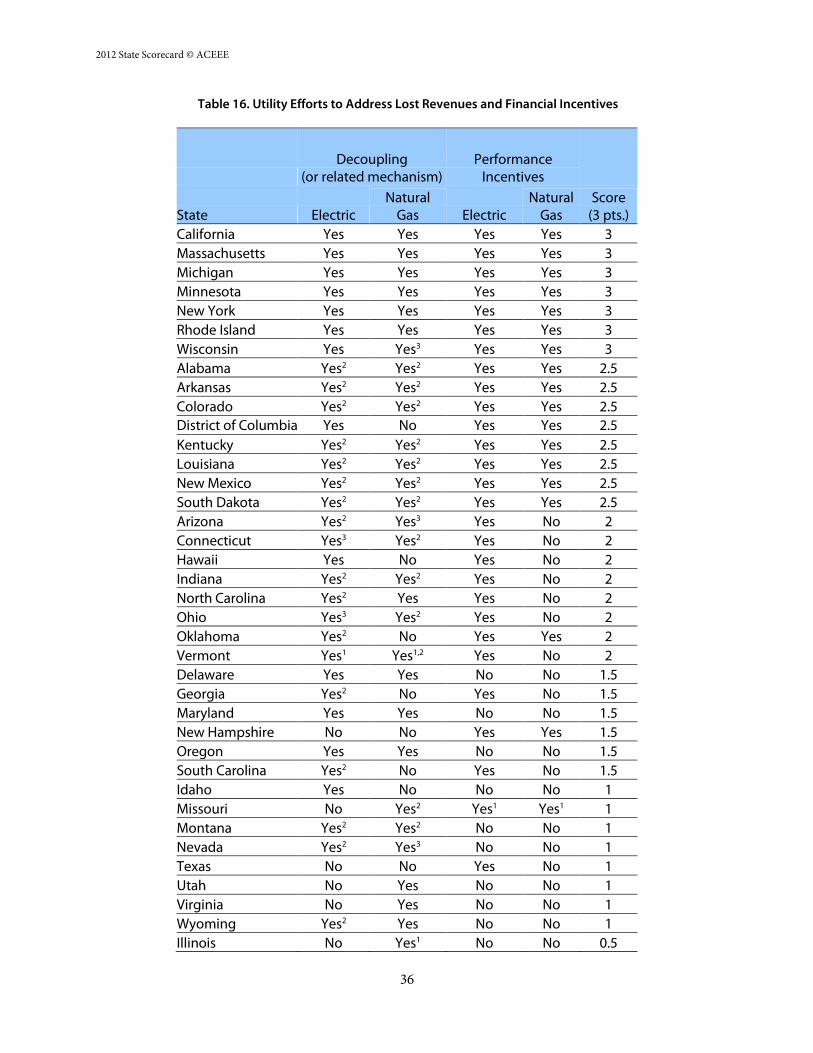
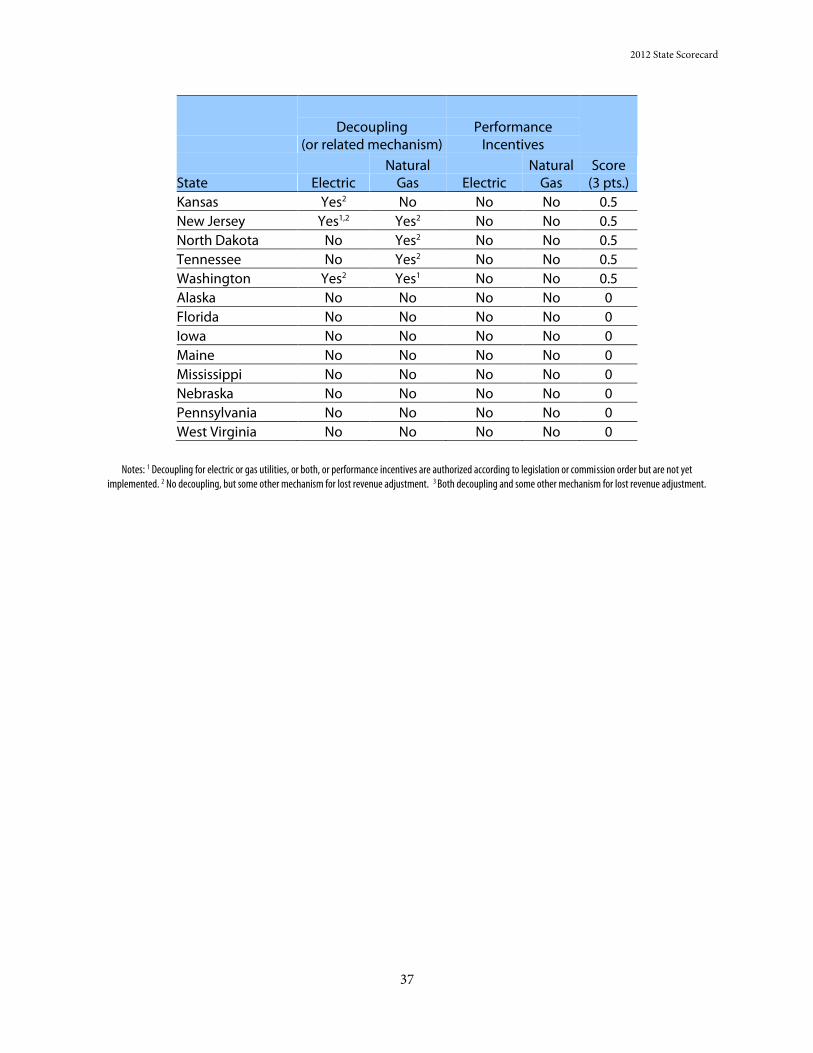
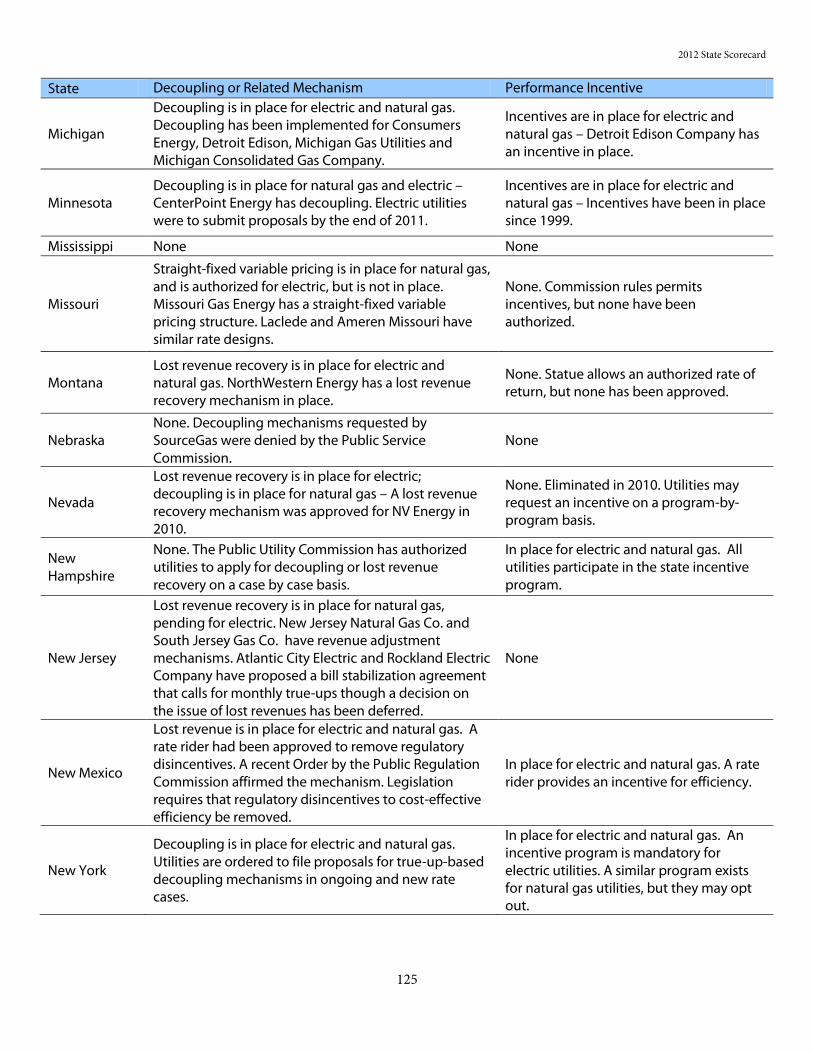
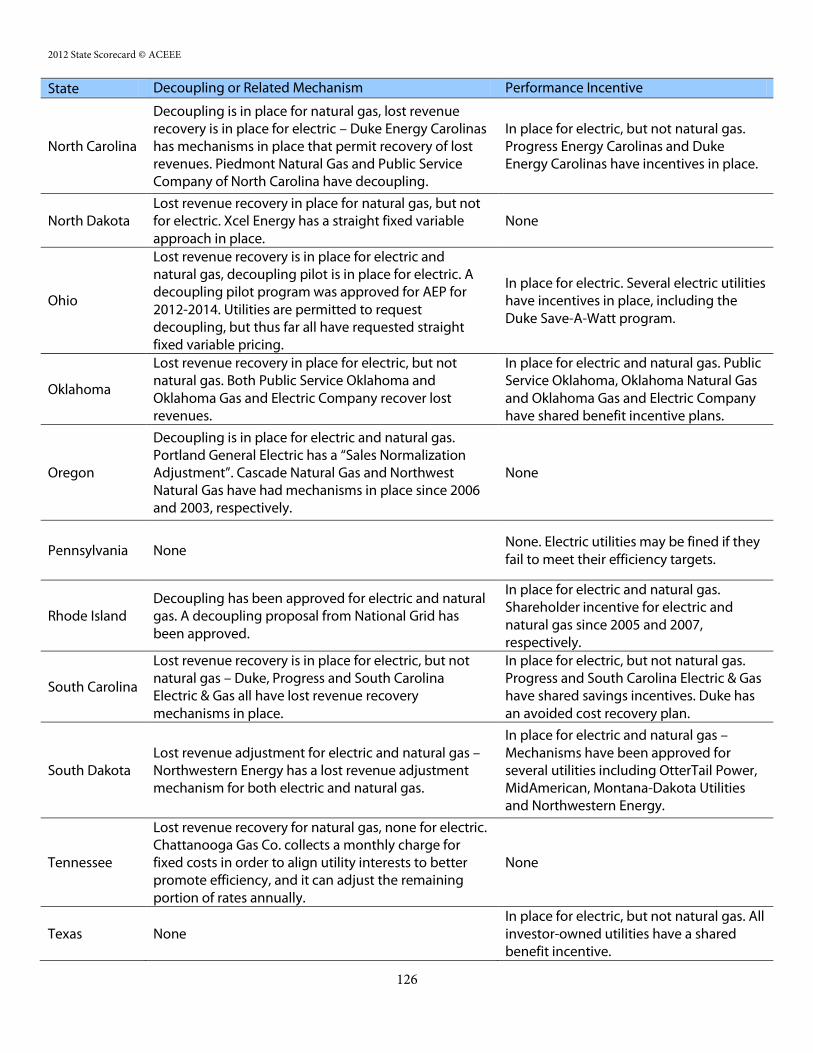
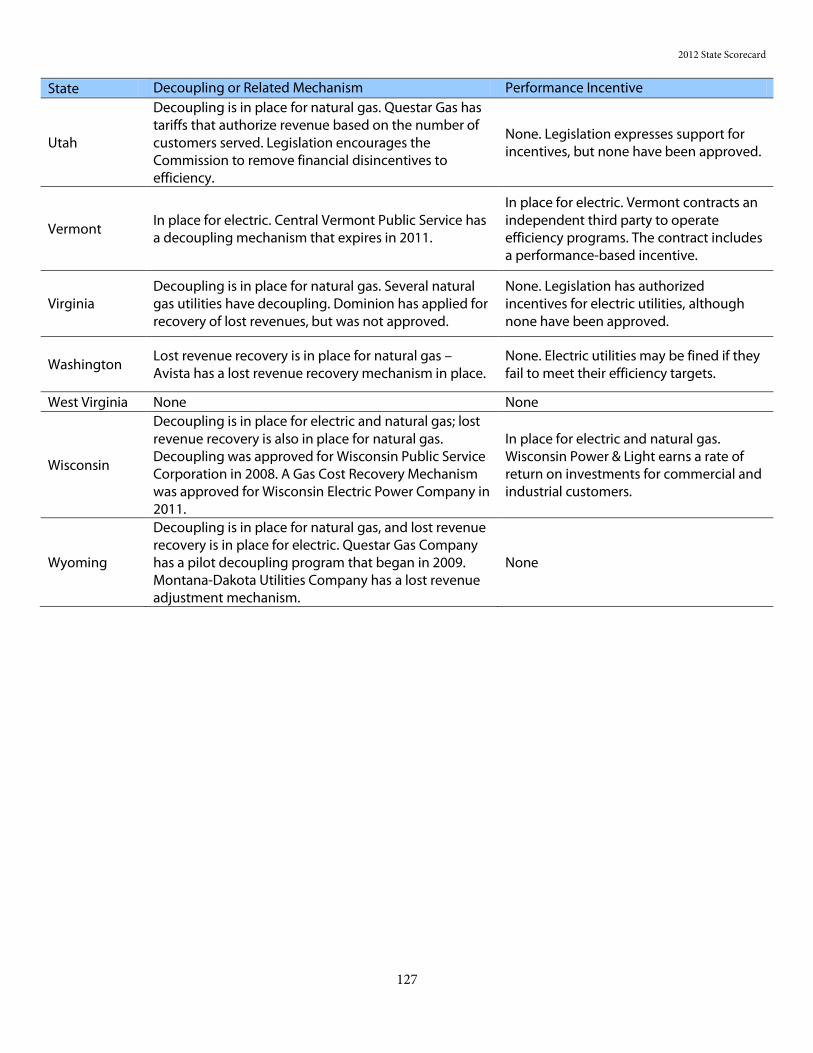
The other two mechanisms are fixed cost recovery (decoupling and other lost revenue adjustment
mechanisms) and performance incentives. Decoupling—the disassociation of a utility's revenues
from its sales—makes the utility indifferent to decreases or increases in sales, removing what is known
2012 State Scorecard
21
as the “throughput incentive”. Although decoupling does not necessarily make the utility more likely
to promote efficiency programs, it removes the disincentive for it to do so. Additional mechanisms for
addressing lost revenues include modifications to customers’ rates that permit utilities to collect the
revenues “lost” either through a lost revenue adjustment mechanism (LRAM) or other ratemaking
approach. ACEEE views decoupling as the preferred approach to addressing the “throughput
incentive”, and lost revenue adjustment mechanism as a second-best approach. Performance
incentives are financial incentives that reward utilities (and in some cases, non-utility organizations)
for reaching or exceeding specified program goals. These can include a shareholder incentive that is
awarded based on achievement of energy savings targets, and incentives based on spending goals. Of
the two, ACEEE recommends the latter, shareholder incentives. A number of states have enacted
mechanisms to such as these that align utility incentives with energy efficiency, as seen in Table 16.
RESULTS
A state could earn up to 20 points in this category, or 40% of the total possible 50 points in the State
Scorecard. Among efficiency programs, studies suggest that electric programs typically achieve at least
three times more primary energy savings than natural gas programs (Eldridge et al. 2009; SWEEP
2007). Therefore, we allocate 10 points in this category to performance metrics for electric programs
(annual budgets and savings data) and three points to performance metrics for natural gas programs
(annual budgets).14 Table 6 lists states’ overall scoring in this category.
We gathered statewide data on:
Budgets for electric and natural gas energy efficiency programs in 2011
Utility revenues from sales to end users in 2011
Number of residential natural gas customers in 2010
Incremental savings from electric energy efficiency programs in 2010
Actual spending from electric energy efficiency programs in 2010
Utility sales to end users in 2010
14 Energy savings data for natural gas programs are not tracked through a national clearinghouse and are not readily reported by states;
therefore, these data do not appear in the scoring. This year we did attempt to collect such data, but the response did not warrant inclusion
in our scoring. Similarly, programs that save home heating fuel or propane do not systematically report energy savings.
Our data sources include the Consortium for Energy Efficiency (CEE 2012),15 the U.S. Energy
Information Administration (EIA 2011, 2012a, 2012e), regional efficiency groups, and information
requests sent to state utility commissions. Energy efficiency program data is subject to a certain degree
of revision and updating depending on the timing of reporting and completeness of the reporting
entities. For these reasons, we sent the utility data we gathered to state utility commissions and
independent statewide administrators for review. We also asked commissions and program
administrators for data on gas program savings, and whether program savings are reported as gross or
net.16 Tables 8, 10, and 12 provide this data on electric and natural gas efficiency budgets and on
electricity savings.
We also requested, for the first time, efficiency program savings data from rural cooperative and
municipal utilities not encompassed by the EIA dataset. Using the Database of State Incentives for
Renewables and Efficiency (DSIRE 2012), we identified the largest electric cooperative and municipal
utilities in each state that offer energy efficiency programs, and contacted 43 rural cooperative and
municipal utilities in 31 states. Fourteen utilities responded and 12 provided data. Of those that
provided data, six provided relevant savings data. These were incorporated into our totals and thus
factor in states rankings in this category (see citations in Table 12).
Our methodology for this category, while comprehensive, does lead to some unintended impacts on
state rankings. For example, our methodology here disadvantages several states because of the types
of energy used or fuels offered to consumers. Hawaii, for example, has the lowest natural gas
consumption among all the states, the bulk of which is accounted for by the commercial sector (EIA
2012b); therefore, energy efficiency efforts in that state are aimed at reducing electricity consumption
only. Thus, Hawaii does not earn up to four points (up to three for natural gas energy efficiency
budgets, up to one for gas decoupling and performance incentives) that other states may earn.
Hawaii’s position in the State Scorecard likely underestimates its actual energy efficiency performance
relative to other states. Elsewhere, particularly in the Northeast, energy efficiency efforts often aim to
15 CEE surveys administrators of public benefits programs annually to capture trends in aggregated budgets and expenditures. CEE has
granted ACEEE permission to reference survey results as of a point in time for the purpose of capturing updates to the non-load
management portion of the results. The full report is viewable at http://www.cee1.org/ee-pe/2011AIR.php3. 16 “Gross” savings refer to savings that are expected from energy efficiency programs, according to planning assumptions. In contrast, “net”
savings are those actually attributable to the program, and are typically calculated by removing “freeriders,” or program participants who
would have participated in the program even without any incentive, or with a reduced incentive. However, states differ in how they define,
measure and account for freeridership and other components of the net savings calculation (Haeri & Khawaja 2012).
reduce fuel oil consumption. In some cases, we captured these efforts in budgets for electricity
programs, but we have not specifically accounted for fuel oil savings from non-electricity programs.
Finally, the choice to report incremental annual savings—new savings from programs in each
program cycle—from efficiency programs, as opposed to cumulative energy savings—all savings
accrued over the life of a particular program—could be seen as disadvantaging states with long-
standing energy efficiency efforts. We choose to report incremental savings in the State Scorecard for
two reasons. First, to base our scoring on cumulative energy savings would invite several new levels of
complexity which are beyond the scope of the State Scorecard, including identifying the start year for
the cumulative series, accurately accounting for the life of energy efficiency measures, and measuring
the persistence of savings (York et al. 2012). Second, the report aims to provide a snapshot of states’
continuing energy efficiency programs, so incremental savings give a clearer picture of recent efforts.
Scoring on Electric Program Budgets
In this category, we score states on reported annual electric energy efficiency program budgets for
2011. The data presented in this section are for customer-funded energy efficiency programs, that is,
energy efficiency programs funded through charges included in customer utility rates or directly on
customer bills. This includes budgets for utility-administered programs—which may include investor-
owned utilities, municipal utilities, cooperative utilities, other public power companies or
authorities—and for customer-funded “public benefits” programs administered by independent
statewide program administrators. We did not collect data on the federal Weatherization Assistance
Program, which gives money to states on a formula basis. We did include revenues from the Regional
Greenhouse Gas Initiative that contribute to customer-funded energy efficiency program portfolios of
member states. (When Regional Greenhouse Gas Initiative funds are channeled to energy efficiency
initiatives implemented by state governments, we have included them in Chapter 6.)
In the 2010 State Energy Efficiency Scorecard, we began reporting energy efficiency program budgets
rather than actual spending figures. This was done to make our reporting more timely and to better
represent the rapid increases in energy efficiency funding being made in states.17 As in previous years,
we gathered energy efficiency program budget data from several sources: the Consortium for Energy
Efficiency’s 2011 Annual Industry Report, Efficiency Program Industry by State and Region Appendices
(CEE 2012),18 state utility commission filings, regional efficiency groups, and other state sources.
As mentioned earlier, program data are subject to a certain degree of revision and updating by states
depending on the timing of reporting and differences in reporting requirements of utilities and other
program administrators. As in past years, we sent budget data gathered from the sources above to
state utility commissions for review. Tables 8 and 10 report electric and natural gas efficiency
program budgets, respectively.
It is important to clarify that budget data capture intention rather than the execution of actual energy
efficiency spending, and that the difference between spending and budgets varies from state to state.
17 Prior to 2010, we depended on actual spending data from the U.S. EIA, which has a two-year time lag. 18 CEE surveys administrators of public benefits programs annually to capture trends in aggregated budgets and expenditures. CEE has
granted ACEEE permission to reference survey results as of a point in time for the purpose of capturing updates to the non-load
management portion of the results. The full report is viewable at http://www.cee1.org/ee-pe/2011AIR.php3.
2012 State Scorecard
25
From year to year, however, the ratio of spending to budgets has remained fairly constant. For 2009,
the first year for which we tracked both spending and budgets, we found that actual spending
nationwide on electric efficiency programs was 89% of the reported budget figures, with a total
spending gap of $301 million. In 2010, the spending gap rose to $505 million but actual spending
remained at 89% of reported electric program budgets nationwide.
The difference between 2010 electric program spending and budgets also varies by U.S. Census
region. Actual program spending by states in the South represented 125% of program budgets, while
actual spending in Western states totaled 81% of budgets. In the Northeast, spending totaled 84% of
budgets, and in the Midwest 91%. Although a handful of states spent far less (or far more) than they
had budgeted, the close relationship nationwide between budgets and actual spending over the past
few years signals that using budgets as our scoring metric not only captures current state efficiency
efforts but also fairly accurately tracks actual program implementation.
States were scored on a scale of 0 to 5 based on of the percentage
of electric utility revenues represented by energy efficiency
budgets.19 Budgets representing at least 2.5% of revenues earned
the maximum of 5 points. For every 0.25% less than 2.5%, a
state’s score decreased by 0.5 points. Table 7 lists the scoring
bins for each level of spending and Table 8 shows state-by-state
results and scores for this category.
19 Statewide revenues are from EIA (2012a). We measure budgets as a percentage of
revenues to normalize the level of energy efficiency spending. Blending utility revenues
from all customer classes gives a more accurate measure of utilities’ overall spending on
energy efficiency than expressing budgets per capita, which might skew the data for
utilities that have a few very large customers. An alternative metric, statewide electric
energy efficiency budgets per-capita, is presented in Appendix A.
Table 7. Scoring of Electric Efficiency Program Budgets
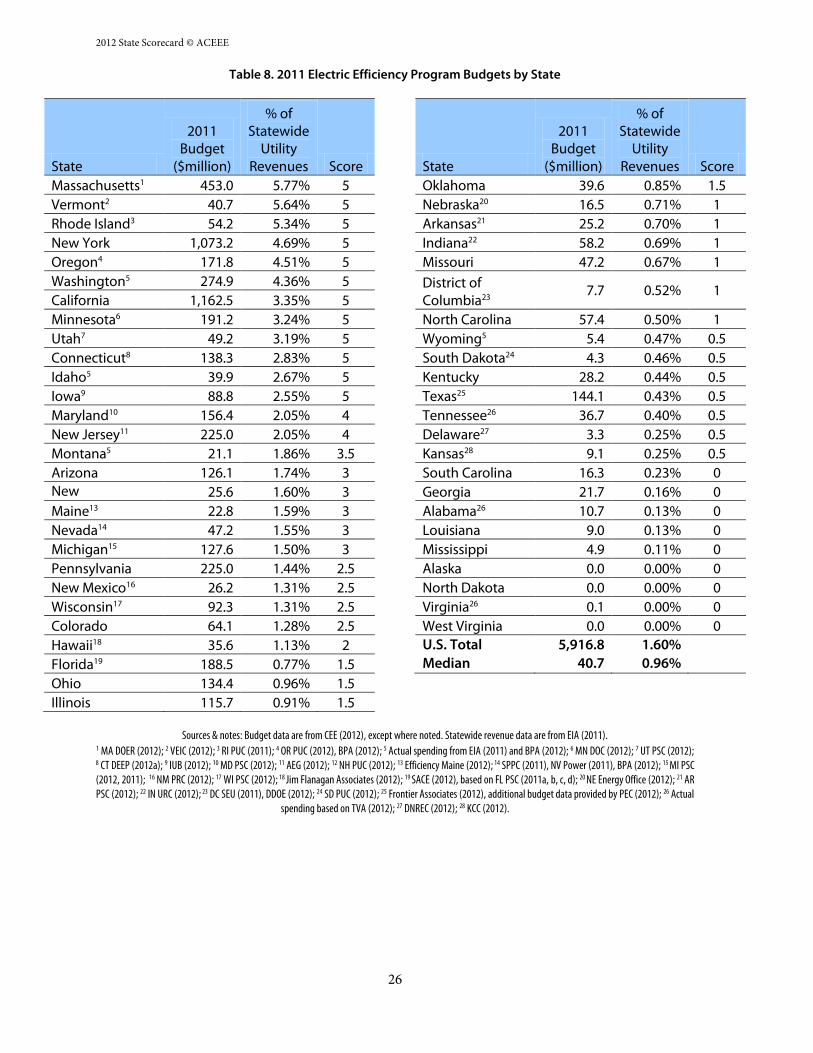
Table 8. 2011 Electric Efficiency Program Budgets by State
State
2011 Budget
($million)
% of Statewide
Utility Revenues Score
Massachusetts1 453.0 5.77% 5
Vermont2 40.7 5.64% 5
Rhode Island3 54.2 5.34% 5
New York 1,073.2 4.69% 5
Oregon4 171.8 4.51% 5
Washington5 274.9 4.36% 5
California 1,162.5 3.35% 5
Minnesota6 191.2 3.24% 5
Utah7 49.2 3.19% 5
Connecticut8 138.3 2.83% 5
Idaho5 39.9 2.67% 5
Iowa9 88.8 2.55% 5
Maryland10 156.4 2.05% 4
New Jersey11 225.0 2.05% 4
Montana5 21.1 1.86% 3.5
Arizona 126.1 1.74% 3 New Hampshire12
25.6 1.60% 3
Maine13 22.8 1.59% 3
Nevada14 47.2 1.55% 3
Michigan15 127.6 1.50% 3
Pennsylvania 225.0 1.44% 2.5
New Mexico16 26.2 1.31% 2.5
Wisconsin17 92.3 1.31% 2.5
Colorado 64.1 1.28% 2.5
Hawaii18 35.6 1.13% 2
Florida19 188.5 0.77% 1.5
Ohio 134.4 0.96% 1.5
Illinois 115.7 0.91% 1.5
State
2011 Budget
($million)
% of Statewide
Utility Revenues Score
Oklahoma 39.6 0.85% 1.5
Nebraska20 16.5 0.71% 1
Arkansas21 25.2 0.70% 1
Indiana22 58.2 0.69% 1
Missouri 47.2 0.67% 1
District of Columbia23
7.7 0.52% 1
North Carolina 57.4 0.50% 1
Wyoming5 5.4 0.47% 0.5
South Dakota24 4.3 0.46% 0.5
Kentucky 28.2 0.44% 0.5
Texas25 144.1 0.43% 0.5
Tennessee26 36.7 0.40% 0.5
Delaware27 3.3 0.25% 0.5
Kansas28 9.1 0.25% 0.5
South Carolina 16.3 0.23% 0
Georgia 21.7 0.16% 0
Alabama26 10.7 0.13% 0
Louisiana 9.0 0.13% 0
Mississippi 4.9 0.11% 0
Alaska 0.0 0.00% 0
North Dakota 0.0 0.00% 0
Virginia26 0.1 0.00% 0
West Virginia 0.0 0.00% 0
U.S. Total 5,916.8 1.60%
Median 40.7 0.96%
Sources & notes: Budget data are from CEE (2012), except where noted. Statewide revenue data are from EIA (2011). 1 MA DOER (2012); 2 VEIC (2012); 3 RI PUC (2011); 4 OR PUC (2012), BPA (2012); 5 Actual spending from EIA (2011) and BPA (2012); 6 MN DOC (2012); 7 UT PSC (2012); 8 CT DEEP (2012a); 9 IUB (2012); 10 MD PSC (2012); 11 AEG (2012); 12 NH PUC (2012); 13 Efficiency Maine (2012); 14 SPPC (2011), NV Power (2011), BPA (2012); 15 MI PSC (2012, 2011); 16 NM PRC (2012); 17 WI PSC (2012); 18 Jim Flanagan Associates (2012); 19 SACE (2012), based on FL PSC (2011a, b, c, d); 20 NE Energy Office (2012); 21 AR PSC (2012); 22 IN URC (2012); 23 DC SEU (2011), DDOE (2012); 24 SD PUC (2012); 25 Frontier Associates (2012), additional budget data provided by PEC (2012); 26 Actual
spending based on TVA (2012); 27 DNREC (2012); 28 KCC (2012).
2012 State Scorecard
27
Scoring on Natural Gas Program Budgets
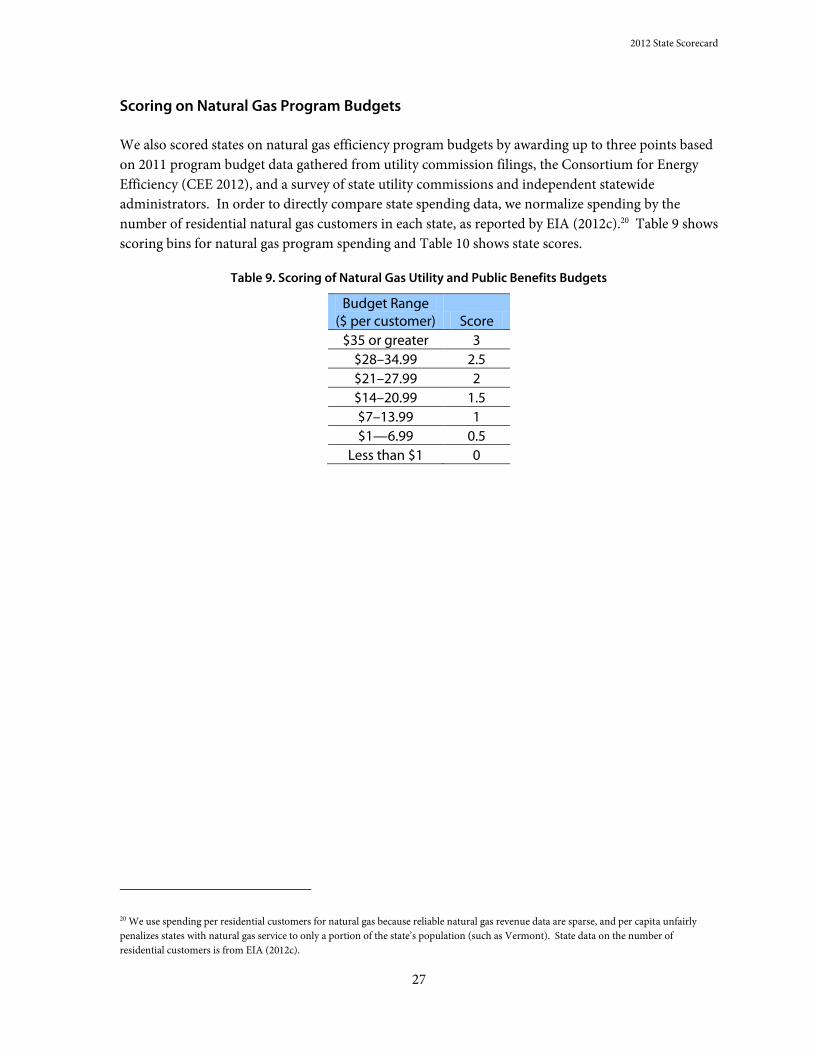
We also scored states on natural gas efficiency program budgets by awarding up to three points based
on 2011 program budget data gathered from utility commission filings, the Consortium for Energy
Efficiency (CEE 2012), and a survey of state utility commissions and independent statewide
administrators. In order to directly compare state spending data, we normalize spending by the
number of residential natural gas customers in each state, as reported by EIA (2012c).20 Table 9 shows
scoring bins for natural gas program spending and Table 10 shows state scores.
Table 9. Scoring of Natural Gas Utility and Public Benefits Budgets
Budget Range ($ per customer) Score
$35 or greater 3
$28–34.99 2.5
$21–27.99 2
$14–20.99 1.5
$7–13.99 1
$1—6.99 0.5
Less than $1 0
20 We use spending per residential customers for natural gas because reliable natural gas revenue data are sparse, and per capita unfairly
penalizes states with natural gas service to only a portion of the state’s population (such as Vermont). State data on the number of
Table 10. 2011 Natural Gas Efficiency Program Budgets by State
State
2011 Budgets
($million)
$ Per Residential Customer Score
Massachusetts1 118.0 84.92 3
New Hampshire2 7.8 82.11 3
Vermont3 2.1 54.93 3
Iowa4 44.0 50.06 3
Connecticut5 20.0 40.77 3
New Jersey6 106.0 40.03 3
Utah7 32.2 39.24 3
Oregon8 24.5 35.86 3
Maine9 0.7 34.06 2.5
Rhode Island10 6.6 29.51 2.5
Minnesota11 40.9 28.61 2.5
Washington 29.7 27.76 2
New York 119.4 27.55 2
California 268.0 25.43 2
Michigan12 80.5 25.22 2
Florida 13.6 20.13 1.5
District of Columbia13
2.2 15.23 1.5
Arkansas14 7.6 13.73 1
Illinois 51.6 13.44 1
Ohio 42.6 13.14 1
Oklahoma15 11.8 12.85 1
Colorado 19.0 11.61 1
Montana16 2.9 9.91 1
Pennsylvania 21.6 8.18 1
Indiana 13.3 7.99 1
New Mexico17 3.4 7.36 1
State
2011 Budgets
($million)
$ Per Residential Customer Score
Delaware 1.1 7.31 1
South Dakota18 1.2 7.11 1
Idaho 2.2 6.42 0.5
Wyoming 0.9 6.06 0.5
Missouri19 7.2 5.80 0.5
Virginia 6.2 5.51 0.5
Nevada 4.1 5.35 0.5
Wisconsin 8.7 5.22 0.5
Maryland20 4.6 4.29 0.5
Arizona 4.8 4.22 0.5
Kentucky 2.1 2.79 0.5
North Carolina 1.3 1.14 0.5
Kansas21 0.9 1.02 0.5
Texas 2.7 0.64 0
Alabama 0.0 0.00 0
Alaska 0.0 0.00 0
Georgia 0.0 0.00 0
Hawaii 0.0 0.00 0
Louisiana 0.0 0.00 0
Mississippi 0.0 0.00 0
Nebraska 0.0 0.00 0
North Dakota 0.0 0.00 0
South Carolina 0.0 0.00 0
Tennessee 0.0 0.00 0
West Virginia 0.0 0.00 0
U.S. Total 1,138.2 17.40
Median 4.6 7.36
Sources & notes: Budget data is from CEE (2012) unless otherwise noted. 1MA DOER (2012); 2 NH PUC (2012); 3 Vermont Gas (2012); 4 IUB (2012); 5 CT DEEP (2012a, 2011); 6 AEG (2012); 7 UT PSC (2012); 8 OR PUC (2012); 9 Efficiency Maine (2012); 10 RI PUC (2011); 11 MN DOC (2012); 12 MI PSC (2011, 2012); 13 DDOE (2012); 14 AR PSC (2012); 15 CenterPoint (2012), ONG (2012); 16 MT PSC (2012); 14 NM PRC (2012); 17 DNREC (2012); 18 SD PUC (2012); 19 MO PSC (2012); 20 MD PSC (2012); 21 KCC
(2012).
2012 State Scorecard
29
Scoring on Annual Savings in 2010 from Electric Efficiency Programs
We scored states on net annual incremental electricity savings21 that resulted from energy efficiency
programs offered in 2010.22 Data for electricity sales and savings are based on EIA’s Annual Electric
Power Industry Report (2012a), which we supplemented with data from a survey of state utility
commissions and independent statewide utility program administrators. This year, for the first time,
we also reached out to the largest municipal and rural cooperative utilities in each state that are
running programs but whose program data are not captured in the EIA dataset.
States use different methodologies for determining energy savings from efficiency programs,
differences that can produce inequities making comparisons are made.23 A state’s evaluation,
measurement and verification (EM&V) process plays a key role in determining how savings are
measured. This is particularly true of a state’s treatment of “freeriders” (savings attributed to a
program that would have occurred anyway in the absence of the program) and “free-drivers” (savings
not attributed to a program that would not have occurred without it). Energy savings are reported as
either “net” or “gross,” with “net” savings accounting for free-riders and free-drivers, and gross
savings not accounting for these and thus potentially overstating program performance. Our research
specifically focuses on “net” savings figures.
In a national survey of evaluation practices for state energy efficiency programs, Kushler et al. (2012)
found that of the 45 jurisdictions with formally approved customer-funded energy efficiency
programs, 21 jurisdictions said they report net savings, 12 indicated gross savings, and 9 indicated
both (for different purposes).24
These findings point to several important caveats to the electric program savings data. First, a number
of states do not estimate or report net savings. In these cases, we have applied a standard factor of 0.9
to convert gross savings to net savings (a “net-to-gross ratio”).25 Doing so allows easier comparison
with other states that report net electricity savings. Savings (or some portion of which) reported as
gross26 are marked by an asterisk (*) in Table 12.
A second caveat is that gross savings are calculated differently by some states: Many states that report
only gross savings apply “deemed savings” methodologies that do take into account free-ridership, so
these states’ gross savings figures may be closer to net figures than those of states that do not calculate
21 Net incremental electricity savings are new savings achieved from measures implemented in the reporting year. 22 While 2011 savings data are available in some states, it is not feasible to compare 2011 data for all 50 states due to significant differences in
the timing of reporting across and within the states. Readers should also note that programs that have been running for several years at a
high level of funding are achieving the highest levels of cumulative electricity savings (total energy savings achieved to date from efficiency
measures). Incremental savings data, which measure new savings achieved in the current program year, are the best way to directly compare
state efforts due to the difficulty in tracking the duration of programs and their savings. 23 See Sciortino (2011). 24 This includes 44 states and the District of Columbia. 25 A net-to-gross ratio of 0.9 falls within the range of factors used by several states in calculating net efficiency program savings, including
Massachusetts (MAGEEPA 2010), Maryland (Itron 2011), New York (NY DPS 2010), Vermont (Efficiency Vermont 2012), and Michigan
(ACEEE survey). 26 Savings were determined to be gross based on Kushler et al. (2012) and on responses to our survey of public utility commissions.
gross savings in this way. Absent a more consistent EM&V methodology across states, we must rely
upon the states’ own reporting of energy savings that result from efficiency programs.
Energy efficiency savings is a critical metric for the robust analysis of state energy efficiency
performance. We have reported statewide energy efficiency savings from EIA (2012a) as a percentage
of retail electricity sales in 2010 and scored the states on a scale of 0 to 5. States that achieved savings
equivalent to at least 1.2% of electricity sales earned five points, with scores dropping 0.5 point for
every 0.12%-decrease.
Table 11 lists the scoring bins for each level of savings and Table 12 shows state-by-state results and
scores. Across the nation, reported savings from utility and public benefits electricity program in
2010 totaled 18 million MWh, equivalent to 0.49% of sales. By way of comparison, savings from 2009
totaled just over 13 million MWh (0.37% of sales). Savings in 2010 therefore represent an increase of
40% over the previous year, and an increase of savings as a percentage of sales of more than one-tenth
of a percentage point.
Table 11. Scoring Methodology for Utility and Public Benefits Electricity Savings
Savings as % of Sales Score
1.2% or greater 5
1.08% – 1.19% 4.5
0.96% – 1.07% 4
0.84% – 0.95% 3.5
0.72% – 0.83% 3
0.60% – 0.71% 2.5
0.48% – 0.59% 2
0.36% – 0.47% 1.5
0.24% – 0.35% 1
0.12% – 0.23% 0.5
Less than 0.12% 0
2012 State Scorecard
31
Table 12. 2010 Net Incremental Electricity Savings by State
State
2010 Net Incremental
Savings (MWh)
% of Retail Sales Score
Vermont1 117,233 2.32% 5
California2 4,617,000* 1.79% 5
Connecticut3 422,097 1.39% 5
Minnesota4 809,598* 1.19% 4.5
Hawaii5 114,974 1.15% 4.5
Oregon6 510,889* 1.11% 4.5
Massachusetts7 628,709 1.10% 4.5
Nevada7 355,106* 1.05% 4
Rhode Island8 81,275 1.04% 4
Idaho9 232,702* 0.98% 4
Arizona10 710,564* 0.98% 4
Iowa11 443,799* 0.98% 4
Montana9 113,558* 0.85% 3.5
New York12 1,215,844 0.84% 3.5
Washington9 763,099* 0.84% 3.5
Wisconsin13 527,404 0.77% 3
Maine14 83,710* 0.73% 3
Michigan15 714,110* 0.72% 3
Utah 182,045* 0.65% 2.5
New Hampshire16 67,389* 0.62% 2.5
Colorado17 310,218 0.59% 2
Maryland18 330,678 0.48% 2
Ohio 722,929* 0.47% 1.5
Illinois19 659,532 0.46% 1.5
New Jersey20 313,116* 0.40% 1.5
New Mexico21 85,752 0.38% 1.5
North Carolina22 521,219 0.38% 1.5
State
2010 Net Incremental
Savings (MWh)
% of Retail Sales Score
District of Columbia
41,685 0.35% 1
Missouri23 289,362 0.34% 1
Nebraska 80,029 0.27% 1
Oklahoma 133,973 0.23% 0.5
Pennsylvania24 344,256* 0.23% 0.5
South Dakota25 25,486 0.22% 0.5
South Carolina 173,385 0.21% 0.5
Texas26 688,103* 0.19% 0.5
Florida27 402,100 0.18% 0.5
Delaware28 16,995* 0.15% 0.5
Kentucky 139,368* 0.15% 0.5
Tennessee 142,860 0.14% 0.5
Wyoming9 23,727* 0.14% 0.5
Arkansas29 55,184* 0.11% 0
Indiana 79,366 0.07% 0
Kansas30 29,323* 0.07% 0
Alabama 43,543 0.05% 0
Mississippi 25,907 0.05% 0
Georgia 51,904 0.04% 0
Alaska 1,086 0.02% 0
North Dakota 1,593 0.01% 0
Louisiana 0 0.00% 0
Virginia 677 0.00% 0
West Virginia 908 0.00% 0
U.S. Total 18,436,366 0.49%
Median 142,860 0.38%
* At least a portion of savings reported as gross. The gross portion has been adjusted by a net-to-gross factor of 0.9 to make it more comparable to net savings figures reported by other states.
Sources and Notes: All savings data are as reported in EIA (2012a), unless noted. 1 VT DPS (2012); 2 CEC (2011); 3 CT DEEP (2012a); 4 MN DOC (2012); 5 Jim Flanagan Associates (2012); 6 OR PUC (2012), includes gross savings from BPA (2012) public utilities and Central Electric (2012) that have been adjusted; 7 MA DOER (2012),
MMWEC (2012), Reading (2012); 8 RI PUC (2011); 9 Includes gross savings from BPA (2012) public utilities that have been adjusted; 10 AZCC (2012); 11 IUB (2012); 12 Includes savings from NYSERDA (2012); 13 WI PSC (2012); 14 Efficiency Maine (2010a); 15 MI PSC (2012); 16 NH PUC (2012); 17 Includes savings provided by SWEEP
(2012); 18 MD PSC (2012); 19 Navigant (2010, 2011) and Ameren (2010); 20 AEG (2012); 21 NM PRC (2012); 22 Includes savings from Union Power (2012); 23 Includes savings from Springfield (2012); 24 PA PUC (2012); 25 SD PUC (2012); 26 Frontier Associates (2012), includes gross savings from PEC (2012) that have been adjusted; 27
In this section of the chapter, we credit states with mandatory savings targets called Energy Efficiency
Resource Standards (EERS). We rely on legislation and utility commission dockets for our research in
this section.
A state could earn up to four (4) points for an EERS policy based on a number of factors. As shown in
Table 13, the major considerations include savings target levels, whether the EERS covers both
electricity and natural gas, and whether the policy is binding. Some EERS policies also contain "exit
ramps" that allow utilities to request permission to lower stipulated savings goals, or “cost caps” that
limit spending, both of which reduce the effectiveness of the EERS policy.
Table 13. Scoring Methodology for Energy Savings Targets
Percent Savings Target or Current Level of Savings Met Score
1.5% or greater 4
1% – 1.49% 3
0.5% – 0.99% 2
0.1% – 0.49% 1
Less than 0.1% 0
Other Considerations Score
Cost cap is in place -1
Exit ramp is in place -0.5
EERS includes natural gas +0.5
To aid in comparing states, we estimate an average annual savings target over the period specified in
the policy. For example, Arizona plans to achieve 22% cumulative savings by 2020, so the annual
average target is 2.2%.
States with pending targets must be on a clear path towards establishing a binding mechanism to earn
points in this category. Examples of a clear path include draft decisions by commissions awaiting
approval within six months, or agreements among major stakeholders on targets. States with a
pending EERS policy that have not yet established a clear path toward implementation include Alaska,
Connecticut,27 Tennessee,28 Oklahoma, New Hampshire, Utah,29 Delaware, and Virginia. See Table 14
below for scoring results, and Appendix B for full policy details.
27 Connecticut’s 2012-13 Integrated Resources Plan (IRP) estimates that the state can cost-effectively achieve 2% annual electricity savings
from energy efficiency through 2022, supported by a doubling of annual budgets to approximately $200 million (CT DEEP 2012b). If
implemented, the plan would likely earn points in future versions of the State Scorecard. 28 In its 2011 Integrated Resource Plan (TVA 2011), the Tennessee Valley Authority recommends increased use of energy efficiency and
demand response resources, the use of which is estimated to achieve energy savings of approximately 11-14,000 GWh by 2020. Because
TVA generates the vast majority of Tennessee’s power, the state could receive points in this section in the future if the IRP
recommendations are implemented. 29 Utah has both a legislative goal (House Joint Resolution 9) and a Renewable Portfolio Goal (S.B. 202) that includes energy efficiency
savings targets. Neither of these goals has been codified into regulatory language by the Public Service Commission, so they remain
advisory, not binding.
2012 State Scorecard
33
Table 14. State Scores for Energy Efficiency Resource Standards
State
Annual Electric Savings Target
(2012+)30 Stringency Score
(4 pts.)
Arizona 2.31% Binding 4
Hawaii 2% Binding 4
Maryland31 2.44% Binding 4
Massachusetts 1.91% Binding 4
Minnesota 1.50% Binding 4
New York 2.14% Binding 4
Rhode Island 2.10% Binding 4
Vermont 2.20% Binding 4
Illinois 1.67% Cost cap 3.5
Iowa 1.24% Binding 3.5
Colorado 1.40% Binding 3
Indiana 1.46% Binding 3
Washington 1.34% Binding 3
Arkansas 0.63% Binding 2.5
California 0.86% Binding 2.5
Michigan 1.00% Cost cap 2.5
Ohio 1.19% Exit ramp 2.5
Oregon 0.98% Exit ramp 2
New Mexico 0.88% Exit ramp 1.5
Wisconsin 0.65% Cost cap 1.5
Nevada 0.3% Binding 1
North Carolina 0.46% Binding 1
Pennsylvania 0.87% Cost cap 1
Texas 0.14% Binding 1
Sources: See Appendix B
30 This target applies to utilities covered under the EERS policy. For some states, this would be significantly lower if based on statewide sales
rather than only on the sales of covered utilities. 31 The goal of reducing per-capita electricity use by 15% translates to around 17% cumulative savings over 2007 retail sales.
Since the publication of the 2011 State Energy Efficiency Scorecard, there have been changes in the use of
EERS policies in two states. Wisconsin has recommitted to its energy savings goals, and thus receives
credit in the 2012 State Energy Efficiency Scorecard for its EERS efforts. By contrast, in Maine regulators
have rendered their energy savings targets ineffective; although there is an EERS in place, FY2013 state
budget allocations fall approximately $30 million short of what Efficiency Maine, the independent
statewide program administrator, projects that it needs to meet savings targets established by state statute
(State of Maine 2009, 2011; Efficiency Maine 2010b). Therefore, Maine fails to get three points in this
section of the State Scorecard.
Long-term energy savings targets require leadership, sustainable funding sources and institutional
support to deliver on their goals. In addition to Wisconsin and Maine, several other states currently have
or have had in the past EERS-like structures in place, but have lacked one or more of these enabling
elements, so have undercut the achievement of their savings goals. States in this situation have included
Florida,32 New Jersey, Delaware and Utah, none of which has earned points in this year’s State Scorecard.
On the whole, however, most states with EERS policies or other energy savings targets in place are
currently meeting their goals and on are track to meet future goals.
Scoring on Financial Incentives Affecting Utility Investment in Efficiency: Earning a Return and Addressing Lost Revenues
Like an EERS, regulatory mechanisms that provide incentives and remove disincentives for utilities to
pursue energy efficiency (i.e., performance incentives and decoupling/lost revenue adjustment
mechanisms) are critical to leveraging energy efficiency funding and encouraging savings over the near
and long terms. A state could earn up to three (3) points for having adopted financial incentive
mechanisms for utilities’ efficiency program for electric and natural gas and for having implemented
decoupling to address lost revenues for its electric and natural gas utilities. States with a policy in place
for at least one major utility were given credit. Information about individual state decoupling policies and
financial incentive mechanisms is available on ACEEE’s State Energy Efficiency Policy Database (ACEEE
2012) and in Appendix C. Details describing the scoring methodology are provided in Table 15.
32 In Florida, cumulative energy savings targets of ~3.3% by 2019 remain in place for seven utilities (5 IOUs), but the Florida Public Service
Commission approved program plans in 2011 for Progress Energy and Florida Power & Light, which represent three-quarters of electric load in
the state, that will fall short of the targets. The five other utilities subject to targets are slated to meet their tailored utility targets.
2012 State Scorecard
35
Table 15. Scoring Methodology for Utility Financial Incentives
Scoring Criteria for Addressing Fixed Cost Recovery Score
Decoupling has been established for at least one major utility, for both electric and natural gas.
1.5
Decoupling has been established for at least one major utility, either electric or natural gas. LRAM or ratemaking approach for recovery of lost revenues established for at least one major utility, for both electric and natural gas.
1
The legislature or commission has authorized or recommended decoupling within the last three years, but it has not yet been implemented. A lost revenue adjustment mechanism (LRAM) or ratemaking approach for recovery of lost revenues has been established for a major utility, for either electric or natural gas.
0.5
Scoring Criteria for “Performance Incentives” Score
Performance incentives have been established for a major utility (or statewide independent administrator), for both electric and natural gas.
1.5
Performance incentives have been established for a major utility (or statewide independent administrator), for either electric or natural gas.
1
The legislature or commission has authorized or recommended a performance incentive within the last three years, but the use of a given mechanism has not yet been implemented.
0.5
This year’s scores have decreased for a number of states. Between 2006 and 2008 there was great interest
in states to implement performance incentives, and many states made great strides. But, recent efforts in a
number of states have stagnated. Last year 37 states had a performance incentive in place or pending for
electric utilities, while this year only 27 states are credited with a performance incentive in place or
pending. The pattern for gas utilities is similar, dropping from 26 states last year to 18 this year. It is
important to note that this trend is not because states have eliminated performance incentives; rather,
many states that considered them in a docket or via legislation have failed to take action to implement
them in a reasonable time frame, and therefore they have ceased to be “pending.”.
The number of states with decoupling pending or in place for electric utilities has remained almost the
same, while the number of states with natural gas decoupled (or pending) has dropped from 24 to 20. This
change is not because states have dropped their plans for decoupling; rather (again), states where
decoupling has been pending have not taken any further action.
Table 16. Utility Efforts to Address Lost Revenues and Financial Incentives
Decoupling
(or related mechanism) Performance
Incentives
State Electric Natural
Gas Electric Natural
Gas Score
(3 pts.)
California Yes Yes Yes Yes 3
Massachusetts Yes Yes Yes Yes 3
Michigan Yes Yes Yes Yes 3
Minnesota Yes Yes Yes Yes 3
New York Yes Yes Yes Yes 3
Rhode Island Yes Yes Yes Yes 3
Wisconsin Yes Yes3 Yes Yes 3
Alabama Yes2 Yes2 Yes Yes 2.5
Arkansas Yes2 Yes2 Yes Yes 2.5
Colorado Yes2 Yes2 Yes Yes 2.5
District of Columbia Yes No Yes Yes 2.5
Kentucky Yes2 Yes2 Yes Yes 2.5
Louisiana Yes2 Yes2 Yes Yes 2.5
New Mexico Yes2 Yes2 Yes Yes 2.5
South Dakota Yes2 Yes2 Yes Yes 2.5
Arizona Yes2 Yes3 Yes No 2
Connecticut Yes3 Yes2 Yes No 2
Hawaii Yes No Yes No 2
Indiana Yes2 Yes2 Yes No 2
North Carolina Yes2 Yes Yes No 2
Ohio Yes3 Yes2 Yes No 2
Oklahoma Yes2 No Yes Yes 2
Vermont Yes1 Yes1,2 Yes No 2
Delaware Yes Yes No No 1.5
Georgia Yes2 No Yes No 1.5
Maryland Yes Yes No No 1.5
New Hampshire No No Yes Yes 1.5
Oregon Yes Yes No No 1.5
South Carolina Yes2 No Yes No 1.5
Idaho Yes No No No 1
Missouri No Yes2 Yes1 Yes1 1
Montana Yes2 Yes2 No No 1
Nevada Yes2 Yes3 No No 1
Texas No No Yes No 1
Utah No Yes No No 1
Virginia No Yes No No 1
Wyoming Yes2 Yes No No 1
Illinois No Yes1 No No 0.5
2012 State Scorecard
37
Decoupling
(or related mechanism) Performance
Incentives
State Electric Natural
Gas Electric Natural
Gas Score
(3 pts.)
Kansas Yes2 No No No 0.5
New Jersey Yes1,2 Yes2 No No 0.5
North Dakota No Yes2 No No 0.5
Tennessee No Yes2 No No 0.5
Washington Yes2 Yes1 No No 0.5
Alaska No No No No 0
Florida No No No No 0
Iowa No No No No 0
Maine No No No No 0
Mississippi No No No No 0
Nebraska No No No No 0
Pennsylvania No No No No 0
West Virginia No No No No 0
Notes: 1 Decoupling for electric or gas utilities, or both, or performance incentives are authorized according to legislation or commission order but are not yet
implemented. 2 No decoupling, but some other mechanism for lost revenue adjustment. 3 Both decoupling and some other mechanism for lost revenue adjustment.
Massachusetts: Massachusetts has a long record of success in implementing energy efficiency programs, which are implemented by electric and natural gas distributors. The state took a major leap forward in 2008, when it passed the Green Communities Act, which established energy efficiency as the “first-priority” energy resource and created an Energy Efficiency Advisory Council to collaborate with utilities to develop statewide efficiency plans in three-year cycles. The first three-year plan aims to achieve annual electric savings equal to 2.4% of sales and annual natural gas savings equal to 1.5% of sales in 2012, making it one of the most aggressive EERS targets in the nation. The Green Communities Act is expected to lead to a total investment of $2.2 billion in energy efficiency and demand resources between 2010 and 2012. As of this writing, the Advisory Council is in the midst of drafting its second three-year plan for statewide energy efficiency programs, with final plans due in October. The July 2 draft proposes annual electricity savings targets of 2.5% from 2013-2015, and natural gas targets of 1.1% in 2013, increasing in subsequent years.
Minnesota: Minnesota’s investor-owned and publicly owned utilities offer broad portfolios of energy efficiency programs that have benefitted from consistent and strong regulatory support, allowing them to evolve and improve for many years. The state allows utilities to earn an incentive for successful energy efficiency program performance and, in 2007, the state enacted the Next Generation Act, which set aggressive energy-saving goals for utilities equal to 1.5% of sales each year. The impact of the EERS is evident in the steadily increasing savings figures in the state.
Rhode Island: Building on its strong program history, Rhode Island leapt forward with the Comprehensive Energy Conservation and Affordability Act of 2006, which established energy efficiency as the state’s first-priority resource and laid the groundwork for major investments in energy efficiency programs. Similar to efficiency program planning in Massachusetts, the state’s major utility collaborates with an expert council to develop three-year plans with ambitious savings and budget goals. In its latest plan, approved for 2012-2014, the state seeks to reach 2.5% annual electric savings and 1.2% annual natural gas savings in 2014.
Vermont: Vermont pioneered the third-party administration model of energy efficiency program implementation, which has been replicated in many states, including Maine, New Jersey, Delaware, Oregon, and the District of Columbia. Efficiency Vermont, the state’s “energy efficiency utility,” runs energy efficiency programs for a wide range of customers and leads the nation in producing consistent energy savings. Vermont’s excellent performance is due in large part to a strategic commitment by the Vermont Public Service Board to fund programs at aggressive levels to reach new customers and achieve deep savings. The Public Service Board has also put in place an optimal mix of policies, including an EERS and performance incentives to encourage successful programs.
California: California utilities have implemented energy efficiency programs for decades, achieving substantial savings thanks to significant regulatory and budget support from the California Public Utilities Commission. The state implemented decoupling in 1982 for its three electric investor-owned utilities, which has played a major role in the state’s success with energy efficiency. Over the past several years, California has invested almost $1 billion per year in energy efficiency to achieve impressive levels of cost-effective energy savings. California public- and investor-owned utilities are national leaders in energy efficiency program implementation, consistently achieving savings around 1% of sales annually.
Figure 3. Leading States: Utility and Public Benefits Programs
Table 17. State Scoring on Transportation Policies
State
GHG Tailpipe
Emissions Standards
(2 pts.)1
Integration of Transportation and Land Use
Planning (2 pts.)2
VMT Targets (2 pts.)3
Transit Funding (1 pt.)4
Transit Legislation
(1 pt.)5
Complete Streets
Legislation (0.5 pt.)6
High-Efficiency Consumer Incentives (0.5 pt.)7
Total Score
(9 pts.)
California 2 1 2 0.5 1 0.5 0.5 7.5
New York 2 1 2 1 1 0.5 0 7.5
Massachusetts 2 1 2 1 0 0.5 0 6.5
Maryland 2 2 0 1 0 0.5 0.5 6
Oregon 2 2 1 0.5 0 0.5 0 6
Washington 2 1 2 0 0 0.5 0.5 6
Connecticut 2 2 0 1 0 0.5 0 5.5
New Jersey 2 2 0 1 0 0 0.5 5.5
Rhode Island 2 2 0 1 0 0.5 0 5.5
Delaware 2 2 0 1 0 0 0 5
Florida 2 1 0 0 1 0.5 0 4.5
Pennsylvania 2 1 0 1 0 0 0.5 4.5
Vermont 2 2 0 0 0 0.5 0 4.5
Maine 2 2 0 0 0 0 0 4
District of Columbia 2 0 0 1 0 0 0.5 3.5
Illinois 0 1 0 0.5 1 0.5 0.5 3.5
Hawaii 0 2 0 0 0 0.5 0.5 3
Tennessee 0 1 0 0 1 0.5 0.5 3
Georgia 0 1 0 0 1 0 0.5 2.5
Minnesota 0 0 0 1 1 0.5 0 2.5
Arizona 0 2 0 0 0 0 0 2
Colorado 0 0 0 0 1 0.5 0.5 2
Michigan 0 1 0 0.5 0 0.5 0 2
New Mexico 2 0 0 0 0 0 0 2
Virginia 0 1 0 0.5 0 0 0 1.5
Alaska 0 0 0 1 0 0 0 1
Iowa 0 1 0 0 0 0 0 1
Kansas 0 0 0 0 1 0 0 1
Montana 0 1 0 0 0 0 0 1
New Hampshire 0 1 0 0 0 0 0 1
North Carolina 0 0 0 0 1 0 0 1
North Dakota 0 1 0 0 0 0 0 1
South Carolina 0 0 0 0 0 0.5 0.5 1
2012 State Scorecard
45
State
GHG Tailpipe
Emissions Standards
(2 pts.)1
Integration of Transportation and Land Use
Planning (2 pts.)2
VMT Targets (2 pts.)3
Transit Funding (1 pt.)4
Transit Legislation
(1 pt.)5
Complete Streets
Legislation (0.5 pt.)6
High-Efficiency Consumer Incentives (0.5 pt.)7
Total Score
(9 pts.)
Wisconsin 0 0 0 0.5 0 0.5 0 1
Louisiana 0 0 0 0 0 0 0.5 0.5
Oklahoma 0 0 0 0 0 0 0.5 0.5
Utah 0 0 0 0 0 0 0.5 0.5
West Virginia 0 0 0 0 0 0 0.5 0.5
Alabama 0 0 0 0 0 0 0 0
Arkansas 0 0 0 0 0 0 0 0
Idaho 0 0 0 0 0 0 0 0
Indiana 0 0 0 0 0 0 0 0
Kentucky 0 0 0 0 0 0 0 0
Mississippi 0 0 0 0 0 0 0 0
Missouri 0 0 0 0 0 0 0 0
Nebraska 0 0 0 0 0 0 0 0
Nevada 0 0 0 0 0 0 0 0
Ohio 0 0 0 0 0 0 0 0
South Dakota 0 0 0 0 0 0 0 0
Texas 0 0 0 0 0 0 0 0
Wyoming 0 0 0 0 0 0 0 0 Sources and Notes: 1 Clean Cars Campaign (2012); 2 State legislation; 3 State legislation and Center for Climate and Energy Solutions (2012); 4 AASHTO (2012), see Appendix
D for a complete ranking of state transit funding; 5 State legislation; 6 NCSC (2012a); 7 DOE (2012b).
Table 18 outlines the consumer incentives available by state.
Table 18. State Purchase Incentives for High-Efficiency Vehicles
State Tax Incentive
California
AB 118 funds a voucher program, targeted at medium- and heavy-duty trucks, whose goal is to reduce the upfront incremental cost of purchasing a hybrid vehicle. Vouchers range from $20,000 to $40,000, depending on vehicle specifications, and will be paid directly to fleets that purchase hybrid trucks for use within the state. California also offers tax rebates of up to $5,000 for light-duty zero emission electric vehicles and plug-in hybrid electric vehicles on a first come, first serve basis from March 15th, 2010 onwards.
Colorado
In 2009, Colorado extended financial incentives available for purchasers of high-efficiency vehicles out to 2015. Consumers can claim up to $6,000 for the purchase of a plug-in or hybrid vehicle. Individuals that convert a personal vehicle to plug-in hybrid technology can claim up to $7,500.
District of Columbia
The Department of Motor Vehicles Reform Amendment Act of 2004 exempts owners of hybrid electric and electric vehicles from vehicle excise tax and reduces the vehicle registration charge.
Georgia Purchasers of electric vehicles may qualify for a tax credit equivalent to 10% of the cost of a new vehicle, up to $2,500.
Illinois Residents of Illinois may claim a rebate for 80% of the incremental cost of purchasing an electric vehicle (up to $4,000) as part of the Illinois Alternative Fuels Rebate Program.
Louisiana
Louisiana offers an income tax credit equivalent to 50% of the incremental cost of purchasing an electric vehicle under the state’s alternative fuel vehicle tax credit program. Alternatively, taxpayers may claim the lesser of 10% of the total cost of the vehicle, or $3,000.
Maryland
Purchasers of qualifying all electric and plug-in hybrid electric light-duty vehicles may claim up to $2,000 against the vehicle excise tax in the state of Maryland. Vehicles must meet certain speed, weight and motor requirements to qualify.
New Jersey All zero emission vehicles in the state of New Jersey are exempt from state sales and use taxes.
2012 State Scorecard
47
State Tax Incentive
Oklahoma
A one-time tax credit for 50% of the incremental cost of purchasing an electric vehicle is available to residents in Oklahoma. If the incremental cost of the vehicle cannot be determined, the state will provide a tax credit equivalent to 10% of the total purchase price of an electric vehicle (up to $1,500). The program expires January 1, 2015.
Oregon
Oregon residents and business owners can claim in tax credits for the purchase of a high-efficiency vehicles and electric vehicles. The tax credit for residents is up to $1,500, and for business owners is 35% of the incremental cost of the system or equipment and is taken over five years.
Pennsylvania The Alternative Fuels Incentive Grant Program provides rebates of up to $3,500 for qualifying electric and plug-in hybrid vehicles.
South Carolina
South Carolina offers up to $2,000 in tax credits for the purchase of a plug-in hybrid electric vehicle. The credit is equal to $667, plus $111 if the vehicle has at least 5 kWh of battery capacity, and an additional $111 for each additional kWh above 5 kWh.
Tennessee The first 1,000 electric vehicles purchased in the state of Tennessee qualify for a $2,500 rebate from the Tennessee Department of Revenue.
Utah Until December 31st, 2013, electric vehicles qualify for up to $605 worth of tax credits.
Washington Electric vehicles are exempt from state motor vehicle sales and use taxes under the Alternative Fuel Vehicle Tax Exemption program.
West Virginia
Since July 1, 2011, residents of West Virginia have been eligible for a tax credit equivalent to 35% of the purchase price of an electric vehicle. Up to $7,500 is available for vehicles that have a gross vehicle weight rating of up to 26,000 lbs., and as much as $25,000 is available for vehicles having gross vehicle weight rating greater than 26,000 lb.
California: As part of its plans to implement AB 32, which requires a 25% reduction from 1990 levels in greenhouse gas emissions by 2020, California has identified several strategies for smart growth and reduction of vehicle miles traveled. In 2008, the state passed SB 375, which requires the California Air Resources Board to develop regional transportation-specific greenhouse gas reduction goals, in collaboration with metropolitan planning organizations. These goals must subsequently be reflected by regional transportation plans that create compact, sustainable development across the state and thus reduce the growth of vehicle miles traveled. The California Air Resources Board released draft targets in June 2010 that recommended a 5–10% reduction in vehicle greenhouse gas emissions by 2020 for the four largest metropolitan planning organizations in the state (CARB 2010).
California also passed AB 118 in 2009, a clean transportation program that includes funding for a hybrid vehicle rebate program targeted at medium- and heavy-duty vehicles. The goal of the Hybrid Truck and Bus Voucher Incentive Project is to reduce the high upfront costs associated with the purchase of high-efficiency vehicles. The third year of the program began in July 2012. Rebates range from $20,000 to $40,000 per vehicle depending on vehicle specification. California also offers tax rebates of up to $5,000 for light-duty zero emission electric vehicles and plug-in hybrid electric vehicles.
New York: New York has steadily moved up the ranks in recent years with its strong efforts toward transportation efficiency. Ranked second this year, the state has made a number of changes in recent years targeted at reducing fuel consumption in the transportation sector. Last year, New York adopted a new “complete streets” policy, aimed at providing accessibility for multiple modes of transport.
Additionally, the state passed Assembly Bill 8180 in 2010 directing a portion of vehicle registration and license renewal fees to public transportation. The bill also created the Metropolitan Transit Authority Financial Assistance Fund to support subway, bus and rail service and capital improvements. New York is also one of the few states in the nation to have a concrete vehicle miles traveled reduction target. A 2008 goal calls for a 10% reduction in 10 years.
Maryland: Maryland has long been a leader in forward-looking transportation policies. In 1992, the state passed the Economic Growth, Resource Protection and Planning Act as a means to coordinate planning priorities amongst state, regional and municipal government. The act requires that conservation practices and transportation be considered as part of comprehensive plans.
Maryland’s Smart Growth program, initiated in 1997, aims to promote development near transit hubs and other centers of activity. Policies to encourage this development include focusing state spending on existing centers and areas designated for growth, limiting road expansion in favor of public transit and promoting urban redevelopment. In 2001, Maryland state general assembly dedicated $500 million to the upgrade of mass transit service and infrastructure.
Additional transportation policies include the adoption of a tax credit to encourage the deployment of plug-in hybrid and electric vehicles, as well as codification of a complete streets policy to ensure equal access to transportation facilities by all vehicular modes.
Figure 4. Leading States: Transportation Policies
2012 State Scorecard
49
Chapter 4: Building Energy Codes Author: Max Neubauer
INTRODUCTION
Buildings consume 74% of electricity use and 41% of total energy use in the United States. They account
for 40% of carbon dioxide emissions (DOE 2011a). Buildings are clearly an essential target for energy
savings; however, because they have long lifetimes and are often not easily retrofitted, it is crucial that
efficiency measures in buildings be considered prior to completing construction. Mandatory building
energy codes are one way to improve buildings’ energy efficiency, requiring a minimum level of energy
efficiency for new residential and commercial buildings.
In 1978, California enacted the first statewide building energy code in its Title 24 Building Standard.
Several states (including Florida, New York, Minnesota, Oregon, and Washington) followed with state-
developed codes in the 1980s. During the 1980s and 1990s, the International Code Council (ICC) and its
predecessor developed its Model Energy Code (MEC), which was later renamed the International Energy
Conservation Code (IECC). Today, most states use a version of the MEC or IECC for their residential
building codes, which require a minimum level of energy efficiency in new residential construction. Most
commercial building codes are based on ASHRAE 90.1, jointly developed by the American Society of
Heating, Refrigerating and Air Conditioning (ASHRAE) and the Illuminating Engineering Society (IES).
The IECC commercial building provisions also include prescriptive and performance requirements based
primarily on ASHRAE requirements.
The most recent versions of the IECC and ASHRAE are the 2012 IECC and the ASHRAE 90.1-2010
standards. Only Maryland has officially adopted the 2012 IECC (for both residential and commercial
buildings), although several states are in the process of adopting or updating their standards to the most
recent versions.
Historically, the provisions for commercial buildings in the IECC have consistently differed from those in
ASHRAE 90.1, so that the ASHRAE 90.1 standard has generally been considered more stringent.
According to a study by the U.S. Department of Energy comparing the 2012 IECC and ASHRAE 90.1-
2010, both exceed the energy savings of ASHRAE 90.1-2007 and the 2009 IECC, so that their adoption
would meet or exceed the standards referenced in the American Recovery and Reinvestment Act (see
ARRA section below). Therefore, states can adopt either commercial provisions and still meet the
requirements stipulated in the Recovery Act (DOE 2011b).
The Department of Energy’s Building Code Determinations
With the publication of each new edition of the IECC and ASHRAE standards, the Department of Energy
(DOE) issues determinations on the codes to ascertain their relative impact when compared to older
versions and, if justified, establish the latest iteration as the base code with which all states must comply.
While no enforcement mechanism is in place to address non-compliance, states are nonetheless required
within two years of the final determination either to certify their compliance, to request an extension for
compliance, or to explain their decision not to comply.
On May 17, 2012, the Department of Energy issued its final determination on the 2012 IECC, reporting
that the 2012 IECC achieves greater energy efficiency than its predecessor editions (DOE 2012c). DOE
estimates that the 2012 IECC achieves about 20% greater site energy savings than the 2009 IECC (DOE
2011c). States must file certification statements with DOE by July 19, 2013.
On October 19, 2011, the DOE issued its final determination on ASHRAE Standard 90.1-2010, reporting
that ASHRAE 90.1-2010 achieves greater energy efficiency than its predecessor editions, generating 18.2%
more energy savings at site than ASHRAE 90.1-2007. States must file certification statements with DOE
by July 20, 2013.
Building Codes and the American Recovery and Reinvestment Act
The impact of the American Recovery and Reinvestment Act of 2009 (ARRA) on the adoption of building
codes has shown that federal policy can catalyze tremendous progress at the state level. The appropriation
of stimulus funding through DOE's State Energy Program has spurred the majority of states to adopt the
2009 IECC and ANSI/ASHRAE/IESNA Standard 90.1-2007 (hereafter referred to as the “ARRA codes”).36
In this year’s State Scorecard, 36 states and the District of Columbia have either adopted or are on a clear
path towards the adoption of the ARRA codes for either residential or commercial buildings, or both.
Undoubtedly, ARRA has served as a major catalyst in the adoption of building codes across the country,
although its influence was more apparent in 2009 and 2010; the rate of adoption of the ARRA codes has
ebbed considerably in 2011. Although a dozen states have not complied with the ARRA requirements,
several have adopted more stringent codes relative to what had been in place previously. Yet another
handful has not shown any movement whatsoever.
Still, several states have acknowledged the value of regularly adopting the latest iterations of the IECC and
ASHRAE 90.1 code standards and have already moved beyond the ARRA codes, having either adopted
the 2012 iterations or having begun the process towards their adoption. Some states have also adopted
mandatory codes where there were previously none in place. While these efforts to adopt stringent
building energy codes are certainly laudable, the key to ensuring that states will reap the benefits of their
proactivity lies in the enforcement of compliance. DOE is collaborating with the five regional energy
efficiency organizations (REEOs)37 to support states in their adoption and compliance efforts.
ARRA and Building Code Compliance
The American Recovery and Reinvestment Act called for states to achieve 90% compliance with the
ARRA minimum standard building energy code (2009 IECC for residential; ASHRAE 90.1-2007 for
commercial) by 2017. While some states have made laudable progress in funding and training code
officials to ensure enforcement, attaining the 90% compliance goal will require a much more concerted
effort on the part of states, utilities, and other stakeholders that incorporates other efforts beyond training.
36 In the building energy code community the latest official versions of these codes are referred to as the ARRA codes because of the technical
requirement in ARRA to adopt these codes as a prerequisite to disbursal of stimulus funds. 37 The five regional energy efficiency organizations are the Northeast Energy Efficiency Partnerships (NEEP), Midwest Energy Efficiency Alliance
(MEEA), Northwest Energy Efficiency Alliance (NEEA), Southwest Energy Efficiency Project (SWEEP), and the Southeast Energy Efficiency
Alliance (SEEA).
2012 State Scorecard
51
For instance, the Pacific Northwest National Laboratory, which leads the DOE’s Building Energy Codes
Program, released a request for proposals in August 2010 for states and territories for activities that will
facilitate the adoption of and compliance with the most recent building energy codes. In addition, a
separate source of funding was provided to nine of those states to conduct pilot studies on methods for
measuring compliance,38 determining patterns of compliance, creating comprehensive protocols for
measuring compliance, and producing best practices for state building departments to follow when
designing training programs.
The Building Codes Assistance Project is another national resource for states as they formulate a plan to
meet the 90% compliance goal. The Building Codes Assistance Project began a Compliance Planning
Assistance (CPA)39 program that works with states to achieve full compliance with the model energy
codes. The CPA program is divided into two phases:
Helping states conduct a Gap Analysis Report, which documents a state’s existing energy code
infrastructure to assess the current gaps, identify best practices, and offer initial recommendations
for improvement.
Working with states to develop a Strategic Compliance Plan, a targeted, state-specific plan with
practical near- and long-term action items to move a state towards full energy code compliance.
Along with the CPA program, the Building Codes Assistance Project has also been working with the
National Association of State Energy Officials and the Northwest Energy Efficiency Alliance on
promoting Energy Codes Compliance Collaboratives,40 which are groups of stakeholders that explore
their common interests around energy code adoption and compliance. The idea of establishing state
collaboratives was borne out of the Compliance Planning Assistance program, where research found that
establishing a collaborative was pivotal in several states not only in the success of adoption of building
codes, but also in supporting education and training, developing key messaging, and advocacy.41
Utility Involvement in Building Codes
Finally, another means of achieving code compliance and maximizing savings is to engage the support of
utilities. In several states that have passed Energy Efficiency Resource Standards,42 programs have been
established that allow utilities to claim savings for code enhancement activities, both adoption and
compliance.43 Utilities are in a unique position to assist with state compliance goals, as they offer energy
efficiency programs that target energy efficiency in buildings and also collect important data on buildings’
energy consumption through their customers’ utility bills. Many utilities across the country offer
programs that specifically target the improvement of energy efficiency in new construction, programs
38 For more information on the compliance pilot studies, please see:
http://www1.eere.energy.gov/wip/solutioncenter/pdfs/Policies%20and%20Procedures%20for%20Enhancing%20Code%20Compliance.pdf 39 Visit http://energycodesocean.org/compliance-planning-assistance-program for more information. 40 NASEO sponsored a webinar on April 17, 2012, titled Energy Codes Collaborative. To view a slide summary of the webinar, along with an
audio recording, visit http://www.naseo.org/codes/events/2012-04-17/ 41 For more information on existing state collaboratives, see Wagner and Lin, 2012, Leveraging State-Utility Partnerships to Advance Building
Energy Codes. 42 See Chapter 2 on Utility and Public Benefits Programs and Policies. 43 See Footnote 41 – Wagner and Lin (2012) also provides case studies on utility involvement with building energy codes.
Table 19. Scoring Methodology for State Residential and Commercial Building Energy Code Stringency
Score Residential Building Code Commercial Building Code
5 Meets or exceeds 2012 IECC or equivalent
Meets or exceeds 2012 IECC or ASHRAE 90.1-2010 or equivalent
4 Exceeds 2009 IECC or equivalent Exceeds 2009 IECC or ASHRAE 90.1-2007 or equivalent
3 Meets 2009 IECC or equivalent Meets 2009 IECC or equivalent or ASHRAE 90.1-2007
2
Meets or exceeds 1998-2006 MEC/IECC (meets EPCA44) or equivalent, or significant adoption in major jurisdictions
Meets or exceeds 1998-2006 MEC/IECC or ASHRAE 90.1-1999/2001 – ASHRAE 90.1-2004 or equivalent, or significant adoptions in major jurisdictions
1 No mandatory state energy code, but some adoption in major jurisdictions
No mandatory state energy code, but some adoption in major jurisdictions
0 No mandatory state energy code or precedes 1998 MEC/IECC (does not meet EPAct of 1992
No mandatory state energy code or precedes ASHRAE 90.1-1999 or equivalent (does not meet EPAct of 1992)
Note: Full credit was awarded to states that have adopted the 2012 versions of the IECC and ASHRAE 90.1 as well as those states that are on a clear path toward their adoption within the twelve months following September 1, 2012.
As shown in Table 20, the majority of states have not kept pace with updates to residential and
commercial energy codes. The two exceptions include Maryland and Illinois, which are the only states as
of this writing to have adopted the 2012 version of the IECC. Notably, Arkansas and Oklahoma gained
points this year based on their strengthening of statewide codes. Also of note, North Dakota and South
Dakota earned points for the first time based on voluntary code adoption in major jurisdictions.
Appendices F and G provide further details of building code stringency and compliance by state.
In the 2012 Scorecard, no state was awarded the maximum score of seven (7) points, though several
achieved scores of six (6) points due to a combination of stringent energy codes and laudable compliance
efforts. States that have not adopted a mandatory statewide energy code, or have poor or unverifiable rates
of compliance, earn a score of 0. There are several “home rule” states that, despite no mandatory statewide
energy code, are showing high rates of adoption at the jurisdictional level and were awarded points
accordingly. Currently there are ten states that do not have mandatory statewide energy codes for either
residential or commercial buildings: Alaska, Arizona, Colorado, Kansas, Mississippi, Missouri, North and
South Dakota, Oklahoma, and Wyoming. Only one state has no verifiable rates of compliance, down from
seven in our 2011 State Energy Efficiency Scorecard.
44 Under the federal Energy Policy and Conservation Act, states are required to review and adopt the MEC/IECC and the most recent version of
ASHRAE Standard 90.1 for which DOE has made a positive determination for energy savings (currently 90.1-2010) or submit to the Secretary of
Energy its reason for not doing so.
2012 State Scorecard
55
Table 20. State Residential and Commercial Building Energy Codes: Scoring on Stringency and Compliance Efforts
Sources & Notes: Stringency scores derived from BCAP (2012) as of July 2012. Compliance and enforcement scores based on information gathered through surveys of state building energy code contacts.
* These states have signed or passed legislation mandating compliance with a new iteration of codes, effective at a later date, or their rulemaking processes are far enough along that mandatory compliance is imminent. These states are awarded full credit commensurate with the degree of code stringency as noted in Table 19.
+ These states have signed or passed legislation mandating compliance with a new iteration of codes, but have not demonstrated a clear path forward toward their adoption, so that the effective date remains uncertain. These states are not awarded full credit commensurate with the degree of code stringency of that next iteration.
Figure 5. Leading States: Building Energy Codes
Alabama: Effective October 1, 2012, the Alabama Energy and Residential Code (AERC) will become mandatory statewide, for the first time in the state’s history. The residential provisions of the AERC reference Chapter 11 of the 2009 IRC with Alabama amendments. The commercial provisions of the AERC reference the 2009 IECC with Alabama amendments while referencing ASHRAE Standard 90.1-2007 as an alternative compliance path. Local jurisdictions may adopt more stringent codes.
Maryland: The 2012 Maryland Building Performance Standards are mandatory statewide and reference the 2012 ICC Codes, including the 2012 IECC, for all new and renovated residential and commercial buildings. Maryland is the first state to adopt the 2012 iterations of the IECC. § 12-503 of the Maryland Code requires the Department of Housing and Community Development to adopt the most recent version of the IECC 12 months after it is issued, and allows adoption of energy efficiency requirements that are more stringent than the codes.
2012 State Scorecard
57
Chapter 5: Combined Heat and Power Authors: Anna Chittum, Kate Farley, and Terry Sullivan
INTRODUCTION
Combined heat and power (CHP) systems generate electricity and thermal energy in a single, integrated
system. Combined heat and power is more energy efficient than separate generation of electricity and
thermal energy because heat that is normally wasted in conventional power generation is recovered as
useful energy. Energy recovered in this way is used to satisfy an existing thermal demand, such as the
heating and cooling of a building or industrial process. CHP systems can save customers money and
reduce overall net emissions.
A state could earn up to five (5) points based upon its adoption of regulations and policies that encourage
the deployment of CHP systems. There are multiple ways in which states can actively encourage or
discourage the deployment of CHP. Financial, technical, policy, and regulatory factors all impact the
extent to which CHP is deployed. The seven factors considered when scoring CHP for the 2012 State
Energy Efficiency Scorecard are:
Standard interconnection rules
Combined heat and power /waste heat recovery in a state Renewable Portfolio Standard,
Energy Efficiency Resource Standard, or other standard
Applicable financial incentive programs
Favorable net metering regulations
Output-based emissions regulations
Loan and loan guarantee programs
Additional supportive policies
We have also included, but did not score, an assessment of two additional factors in the 2012 State Energy
Efficiency Scorecard:
The number of CHP installations in each state, and the total CHP capacity installed in
each state
State retail industrial electricity and natural gas prices
Interconnection Standard
CHP deployment is encouraged when multiple levels (or tiers) of interconnection exist because smaller
systems can be offered a faster—and often cheaper—path toward interconnection. Scaling these
transaction costs to project size makes economic sense, because customers with larger projects—and thus
larger potential economic gains—often have more incentive to spend time and money to interconnect
their more complex systems than do customers with smaller projects facing smaller economic returns.
Figure 6. Leading State Policies: Combined Heat & Power
Texas: In 2011 Texas House Bill 3268 became law, directing the state’s environmental quality commission to develop a streamlined permitting mechanism for some CHP systems. The permit is to use output-based emission calculations and will be adopted by the commission in late 2012. While previous permitting processes for CHP were often long (over one year) and financially burdensome, this new permitting is expected to take 4-6 weeks and offer additional clarity within the permitting process.
Ohio: Ohio maintained its rank at the top this year by improving its existing Energy Efficiency Resource Standard and offering additional technical assistance and support to industrial facilities concerned about impending federal emissions regulations. In 2012, the state legislature passed Senate Bill 315, which stipulated that major forms of CHP can qualify for the state’s EERS. In 2012, the state also began partnering with the U.S. Department of Energy to offer guidance, technical assistance, and sharing of best practices among industrial facilities with older boilers that will be affected by new and updated U.S. Environmental Protection Agency rules. Such customers are being encouraged to consider CHP in their facilities as a long-term cost-saving response to the regulatory changes.
California: In late 2011, a significant change to California’s long-standing Self-Generation Incentive Program (SGIP) allowed non-renewable-fueled CHP systems to participate in the program. Additionally, the SGIP now offers an incentive for waste heat recovery projects equal to the incentive offered to wind-powered projects.
2012 State Scorecard
67
Chapter 6: State Government-Led Initiatives Authors: Ben Foster and Kaye Schultz
INTRODUCTION
State legislatures and governors can advance policies and programs that impact many of the sectors
discussed in previous chapters, including utility-sector energy efficiency, transportation efficiency,
building codes, and combined heat and power. This chapter, however, is dedicated to the energy efficiency
initiatives that are designed, funded, and implemented by a broad array of state-level administrators such
as state energy offices, universities, and economic development and general services agencies (Sciortino
and Eldridge 2010). We focus on three initiatives commonly undertaken by state governments: financial
incentive programs for consumers, businesses, and industry; “lead by example” policies and programs put
in place by states to improve the energy efficiency of their facilities and fleets; and research, development,
and demonstration activities for energy efficiency technologies and practices.
In light of the wave of energy efficiency funding to states from the American Recovery and Reinvestment
Act (see section below) and the groundwork it laid for continuing energy efficiency programs, it is critical
to recognize state government-led initiatives, which play a unique role in fostering an energy-efficient
economy. State government-led initiatives complement the existing landscape of utility programs,
leveraging resources from the state’s public and private sectors to generate energy and cost savings that
benefit taxpayers and consumers (Sciortino & Eldridge 2010).
Financial and Information Incentives
Financial incentives are an important instrument to spur the adoption of technologies and practices in
homes and businesses. They can take many forms: rebates, loans, grants, or bonds for energy efficiency
improvements; income tax credits and income tax deductions for individuals or businesses; and sales tax
exemptions or reductions for eligible products. Financial incentives can lower the upfront cost and
shorten the payback period of energy efficiency upgrades, two critical barriers to consumers’ and
businesses’ making cost-effective efficiency investments. Incentives also raise consumer awareness of
eligible products, encouraging manufacturers and retailers to market these products more actively and to
continue to innovate. As economies of scale improve, prices of energy-efficient products fall, and the
products eventually compete well in the market without the incentives. Information-related incentives
such as building energy disclosure laws improve consumers’ purchasing power by raising awareness of the
energy use of homes and commercial buildings being offered for sale, which can have a significant impact
on the economic value of a home or building. A requirement to disclose a building’s energy use also
provides owners with an incentive to improve the energy efficiency of their buildings.
“Lead by Example”
State governments can advance energy-efficient technologies and practices in the marketplace by adopting
policies and programs to save energy in public sector buildings and fleets, a practice commonly referred to
as “lead by example” (LBE). In the current environment of fiscal austerity, lead by example policies and
programs are a proven strategy to improve the operational efficiency and economic performance of states’
assets. Furthermore, lead by example initiatives reduce negative environmental and health impacts of high
energy use, and promote energy efficiency to the broader public.
States commonly adopt policies and comprehensive programs that aim to reduce energy use in state
buildings. State governments operate numerous facilities, including office buildings, public schools,
colleges, and universities, the energy costs of which can account for as much as 10% of a typical
government’s annual operating budget (EPA 2009). Only a handful of states have yet to implement a
significant energy efficiency policy for public facilities. The most widely adopted measure at the state level
is a mandatory energy savings target for new and existing state government facilities. The building
requirements encourage states to invest in efficient new building construction and retrofit projects,
lowering energy bills and promoting economic development in the energy services and construction
sectors.
Two critical elements of successful energy efficiency initiatives in the public sector are proper building
energy management and institutional support for “energy savings performance contracting” (ESPC), such
as housing state support for ESPCs within a specific state agency that serves as the lead contact for
implementing them. Both of these initiatives can help projects overcome information and cost barriers to
implementation. Benchmarking energy use in public-sector buildings through tailored or widely available
tools such as the Environmental Protection Agency’s ENERGY STAR Portfolio Manager ensures a
comprehensive set of energy-use data46 that drives cost-effective energy efficiency investments. If the
necessary encouragement, leadership, and resources are in place, states can finance energy improvements
through energy savings performance contracts, which allow the state to enter into a performance-based
agreement with an energy service company (ESCO). The contract allows the state to pay the ESCO for its
services with money saved by installing energy efficiency measures.47
In addition to lead-by-example initiatives in state government buildings, states have also put in place
policies encouraging/requiring efficient vehicle fleets to reduce fleet fuel costs and hedge against rising
fuel prices. Collectively, state governments own approximately 500,000 vehicles, with fleet sizes ranging
from 1,000 to more than 50,000 per state. Operation and maintenance costs for these fleets run to more
than $2.5 billion nationwide, ranging from $7 million to $250 million (NCFSA 2007). In response to this
significant cost, states have often adopted a definitive efficiency standard for state vehicle fleets—a tool
that ensures a reduction in fuel consumption and greenhouse gas emissions. Other policies include
binding goals to reduce petroleum use by a certain amount over a given time frame, meaningful
greenhouse gas reduction targets for fleets, and procurement requirements for hybrid-electric or plug-in
electric vehicles. In order to receive credit in the 2012 State Energy Efficiency Scorecard, fleet policies had
to specify fuel economy improvements that exceed existing Corporate Average Fuel Economy (CAFE)
standards.
46 Some states have in place their own databases of public building energy use that integrate with EPA’s Portfolio Manager. For example,
Maryland’s EnergyCAP database (http://www.dgs.maryland.gov/energy/EnergyDatabasePublic.html) compiles the energy use (based on utility
bills) of all public buildings in the state and provides a means of comparing buildings owned by different state agencies. The database is available
to the public and to all state agencies. 47 For a full discussion of ESPCs, the ESCO market, and actual implementation trends see (Satchwell et al. 2010) and the Energy Services Coalition
projects at state universities. Particularly in states minimally served by utility efficiency programs, these
programs have provided an important first step to introduce consumers and decision-makers to the
benefits of energy efficiency programs.
Table 23. ARRA Energy Efficiency Funding to State and Local Governments
Program FY 2008 Budget Stimulus Funding
Weatherization Assistance Program $227 million $5 billion
State Energy Program $33 million49 $3.1 billion
Energy Efficiency and Conservation Block Grant Program
N/A $3.2 billion
Appliance Rebate Program N/A $300 million
Total $260 million $11.6 billion
Source: DOE (2012a)
While ARRA’s main intent was to stimulate rapid job growth, its effects on state-level energy efficiency
programs will last for years, if not decades. From the outset, state governments were encouraged to use
ARRA funds to establish energy efficiency financing mechanisms that could leverage private sector capital
and maximize the usefulness of the funds. Thirty-five states have established 51 revolving loan funds
(RLFs) with approximately $650 million in ARRA money, which could finance approximately $150-200
million per year of energy projects over the next 20 years (Goldman et al. 2011).50 ARRA also cemented
better connections among state energy offices, the Department of Energy and lending institutions, in
particular Community Development Financial Institutions (Freehling 2011). Along with its lasting effects
on state-level energy efficiency, ARRA established connections between state and local governments to
advance building and transportation energy efficiency at the community level (Sciortino 2011). In order
to receive and spend Energy Efficiency and Conservation Block Grants, local governments have developed
knowledge and staff capacity to implement energy efficiency projects, providing a solid foundation for
future programs.
RESULTS
States could earn a maximum of seven (7) points for state initiatives: three (3) points for financial and
information incentives; two (2) points for “lead by example” policies and programs in government
buildings and fleets; and two (2) points for research, development, and demonstration programs. Table
24 presents the overall results of scoring on state initiatives.
State programs funded solely through ARRA or another federal source did not earn points in the State
Scorecard. Because ARRA funds came from the federal stimulus, the existence of ARRA-funded
programs does not necessarily reflect the efforts of the state. We do recognize that some states are utilizing
49 Required states to contribute funds worth 20% of the DOE grant toward energy projects supported by the grant. 50 For analysis of the initial implementation phase of energy-related ARRA funding at the state level, see Goldman et al. (2011).
2012 State Scorecard
71
these federal funds in an exemplary fashion by creating innovative and effective energy efficiency
programs. Completing an assessment of a state’s handling of stimulus funds, however, would rely on
fluctuating spending data and rests outside the scope of this report. Examples of exemplary ARRA-funded
programs are presented in Sciortino & Eldridge (2010), on DOE’s Weatherization & Intergovernmental
Program website (http://www1.eere.energy.gov/wip/recovery_act.html), and in publications of the
National Association of State Energy Officials (NASEO 2011).
Table 24. Summary of Scoring on State Government Initiatives
Table 25. State Scoring on Major Financial and Information Incentives Programs
State Major State Financial Incentives for Energy Efficiency
Score
(3 pts.)
Alaska Major rebate program (Home Energy Rebate Program); multiple loan programs; grant program; residential energy disclosure policy
3
Massachusetts Alternative Energy and Energy Conservation Patent Exemption (personal & corporate); grant, rebate and bond programs; residential energy disclosure policy
3
New York Green Jobs/Green New York loan program; multiple rebate programs; Energy Conservation Improvements Property Tax Exemption; residential energy disclosure policy
3
Oregon Residential and business energy tax credits; several grant, loan and report programs
3
Pennsylvania State-led Alternative Energy Investment Fund; six grant and five loan programs
3
Tennessee Energy Efficient Schools Initiative (loans and grants); one grant and two loan programs; sales tax credit for emerging energy industry
3
Connecticut One rebate, one loan and one grant program; commercial energy disclosure policy; sales tax exemption for energy-efficient products
2.5
Illinois Large Customer Energy Analysis rebate program; two grant, one loan and one bond program
2.5
Kentucky
KY Home Performance rebate program; Green Bank of Kentucky loan program; personal and corporate energy efficiency tax credits; on-farm energy efficiency grant program; subsidized hybrid school bus purchase program.
2.5
Maryland Clean Energies Community Grant Program; three loan and one rebate programs
2.5
Minnesota Five loan programs 2.5
New Hampshire 2 major loan programs (Business Energy Conservation Revolving Loan Fund and Municipal Energy Reduction Fund); rebate program
2.5
Virginia Energy Leasing Program for state-owned facilities; Clean Energy Manufacturing Grant Program; two loan programs; personal and property tax incentives
2.5
Colorado Green Colorado Credit Reserve and two other loan programs; one rebate program
2
2012 State Scorecard
75
State Major State Financial Incentives for Energy Efficiency
Score
(3 pts.)
Delaware Major bond-financed public buildings program; one grant and one loan program
2
Idaho Income tax deduction for insulation projects; one grant program and one major low-interest energy loan program
2
Montana Energy conservation installation tax credit; tax deduction for energy-conserving investment; bond and loan programs
2
North Carolina One grant, two loan, and two rebate programs 2
Oklahoma Energy Efficient Residential Construction Tax Credit; three loan programs
2
California One grant program; sales tax exemption for alternative energy manufacturing equipment (includes combined heat and power); commercial energy disclosure policy
1.5
Iowa Major loan program (Iowa Energy Bank); grant program 1.5
Kansas Major loan program (Efficiency Kansas); residential energy disclosure policy
1.5
Michigan Major loan program (Michigan Saves Home Energy Loan); tax credit for home energy efficiency improvements
1.5
New Mexico Sustainable Building Tax Credit (personal & corporate); bond program
1.5
Ohio Energy Loan Fund and one other loan program; property tax incentive
1.5
South Carolina Tax credit for purchase of new energy-efficient manufactured homes; sales tax cap on energy-efficient manufactured homes; one loan program
1.5
Texas Major loan program (Texas LoanSTAR); energy use disclosure policy
1.5
Wisconsin Major loan program (Clean Energy Manufacturing Loan Program); one grant program
1.5
Alabama State-funded local government loan program; WISE Home Energy rebate program
1
Arizona Property tax exemption for energy-efficient building components 1
District of Columbia Commercial energy disclosure policy; one rebate program 1
Louisiana Home Energy Loan Program; one rebate program 1
Mississippi One loan program; one public sector lease program for energy-efficient equipment
State Major State Financial Incentives for Energy Efficiency
Score
(3 pts.)
Missouri Loan program for public buildings; tax deduction for home energy efficiency improvements
1
Nebraska Major loan program (Dollar and Energy Savings Loans) 1
Nevada Wide-reaching property tax abatement for green buildings 1
Utah Two loan funds for state-owned buildings and schools 1
Vermont Two loan programs 1
Wyoming One grant and one loan program 1
Arkansas Loan fund for small businesses 0.5
Georgia Corporate Clean Energy Tax Credit 0.5
Indiana Community Conservation Challenge grant program 0.5
Maine Residential energy disclosure policy 0.5
North Dakota One grant program for public facilities 0.5
South Dakota Residential energy disclosure policy 0.5
Washington Commercial energy disclosure policy 0.5
Florida None 0
Hawaii None 0
New Jersey None 0
Rhode Island None 0
West Virginia None 0
2012 State Scorecard
77
Figure 7. State Financial and Information Incentives: Leading and Trending States
“Lead by Example”
Our review of state lead by example initiatives is based on information from the Database of State
Incentives for Renewables and Efficiency (DSIRE 2012), a survey of states energy officials, and
independent research. States could earn a maximum of two (2) points in the LBE category: 0.5 points for
energy savings targets in new and existing state buildings; 0.5 point for a benchmarking requirement for
public facilities; 0.5 point for energy performance savings contracting activities; and 0.5 point for fleet
efficiency mandates.
Energy savings targets must commit state government facilities to a specific energy reduction goal over a
distinct time period. A benchmarking policy refers to a requirement that all buildings undergo an energy
audit or have their energy performance tracked using a recognized tool such as the EPA ENERGY STAR
Portfolio Manager. Public-sector energy benchmarking programs may also qualify for the half-point.
Scoring on activities related to energy savings performance contracting (ESPC) is based on three metrics:
encouragement, leadership, and resources. The ESPC encouragement metric requires that the state
explicitly promotes the usage of ESPCs to improve the energy efficiency of public buildings. We
recognized the following methods of encouragement: statutory requirements for using energy savings
performance contracting, statutory recommendation of ESPCs as a method of achieving efficiency
improvements, explicit preference for ESPCs through statutes, executive orders that explicitly promote or
require ESPCs, and/or financial incentives for agencies seeking to use energy savings performance
contracts. States earning recognition for ESPC leadership were those that have either set up a distinct
program that directly coordinates ESPC efforts (and, on occasion, other energy efficiency projects, as well)
or housed the state support for ESPCs within a specific state agency that serves as the lead contact for
Alaska: Alaska uses a substantial amount of state appropriations to fund energy efficiency incentive programs. The Home Energy Rebate Program utilizes $160 million in state funding appropriated in 2008, a major investment relative to the population of Alaska. The program allows rebates of up to $10,000 based on improved efficiency and eligible receipts. Energy ratings are required before and after the home improvements to provide expert advice and to track savings.
Tennessee: Tennessee has partnered with Pathway Lending to provide low-interest energy efficiency loans to commercial customers. The state also offers energy efficiency grants to state government agencies, businesses and utility districts for projects that promote energy efficiency, clean energy technologies and improvements in air quality. Tax credits are also available for the manufacture of energy-efficient technologies.
Oklahoma: As of July 2012, the state has resumed its Energy Efficient Residential Construction Tax Credit, which was suspended for two years in June 2010. The tax credit applies to the installation of energy-efficient upgrades in homes less than 2000 sq. ft., and ranges from $2000-$4000 depending on the home’s performance in an energy audit. The state also has several loan programs that encourage energy efficiency in schools and local government buildings.
Figure 8. Lead by Example Initiatives: Leading and Trending States
Research, Development and Demonstration
Our RD&D review was based on a state institution’s participation in the Association of State Energy
Research Technology and Transfer Institutions (ASERTTI) and the size of the effort relative to state
population. Information about state energy efficiency RD&D institutions was based on the National
Guide to State Energy Research Centers (PES Group 2011), a survey of state energy officials and other
secondary research. In general, one (1) point was awarded for each major RD&D program dedicated to
energy efficiency that is funded by the state government, including programs administered by state
government agencies, public-private partnerships, and university programs.52 In a few cases, a program’s
funding per capita was large enough to earn two (2) points, the maximum available in this category.
52 Institutions that are primarily focused on renewable energy technology or alternative fuel RD&D do not receive credit in the Scorecard. In
addition, programs that serve primarily an educational or policy development purpose also do not receive points.
Hawaii: Hawaii’s Lead by Example program offers a comprehensive set of services to state agencies. Aggressive policies underpin the program and include a benchmarking requirement that all state agencies evaluate the energy efficiency in existing buildings of qualifying size and energy characteristics. Each agency must identify opportunities for increased energy efficiency by setting benchmarks for these buildings using ENERGY STAR Portfolio Manager or similar tool, and buildings must be retro-commissioned every five years. In addition, new state buildings must meet LEED Silver standards. As a result of Hawaii’s Lead By Example program, in 2011 total state agency electricity consumption was 4.6% below that in the baseline year of 2005 (State of Hawai’i 2012).
Minnesota: Over the past decade, the state of Minnesota has shown its commitment to sustainable buildings by providing leadership, setting high performance standards, and putting forward an integrated framework of programs that provide a comprehensive system for designing, managing, and improving building energy performance. Beginning with aggressive standards for state buildings based on the long-term goal of having a zero-carbon building fleet by 2030, the state offers a complementary benchmarking program for tracking energy use, and the Public Building Enhanced Energy Efficiency Program that aids in implementing retrofits. Minnesota also requires on-road vehicles owned by state departments to reduce gasoline consumption by 50% by 2015. Also, new on-road vehicles must have a fuel efficiency rating that exceeds 30 mpg for city usage and 35 mpg for highway usage.
Kansas: Kansas has a long-standing performance contracting program, the Facility Conservation Improvement Program (FCIP), which is administered by the Kansas Corporation Commission. FCIP provides a list of preapproved energy service company partners and walks users through a series of well-laid-out steps toward forming an energy savings performance contact. Kansas is ranked #2 in the nation (after Hawaii) by the Energy Services Coalition for performance contracting spending per capita. In addition, Kansas requires all state-owned buildings to undergo an energy audit at least every 5 years to identify excessive energy usage; for leased buildings, an energy audit is required before State agencies may approve new leases or renew existing leases.
2012 State Scorecard
81
Because RD&D funding often fluctuates and it is difficult to determine how much of it specifically
supports energy efficiency, devising a quantitative metric based on RD&D program funding or staffing
levels is currently outside the scope of this report.
Table 27. State Scoring on RD&D Programs
State Major RD&D Programs
Score
(2 pts.)
Alaska The Cold Climate Housing Research Center and the Emerging Energy Technology Fund
2
Arizona The Sustainable Energy Solutions Group of Northern Arizona State and Arizona State University’s LightWorks Center
2
California
The California Energy Commission’s Public Interest Energy Research program, University of California-Davis’ Center for Water-Energy Efficiency and the Energy Efficiency Center, and University of California-Los Angeles’ Center for Energy Science and Technology Advanced Research and Smart Grid Energy Research Center
2
Colorado
Colorado State University’s Engines and Energy Conversion Lab and Institute for the Built Environment, University of Colorado-Boulder’s Renewable and Sustainable Energy Institute, Colorado School of Mines’ Research in Delivery, Usage, and Control of Energy, and the Center for Renewable Energy Economic Development
2
Florida
University of Central Florida’s Florida Solar Energy Center, Florida State University’s Energy and Sustainability Center, and University of Florida’s Florida Institute for Sustainable Energy
2
Georgia The Southface Energy Institute and Georgia Institute of Technology’s Brook Byers Institute for Sustainable Systems
2
Massachusetts
The Massachusetts Energy Efficiency Partnership, High Performance Green Building Grants, and University of Massachusetts-Amherst’s Center for Energy Efficiency and Renewable Energy
2
Michigan The Michigan NextEnergy Center and Oakland University in Rochester’s Clean Energy Research Center
2
Nebraska The Nebraska Center for Energy Sciences Research and the Energy Savings Potential program
2
New Jersey The Edison Innovation Clean Energy Fund and the Rutgers Energy Institute
2
New York
The New York State Energy Research and Development Authority, State University of New York’s Center for Sustainable & Renewable Energy, Syracuse University’s Building Energy and Environmental Systems Laboratory, and City University of New York’s Institute for Urban Systems
The North Carolina Green Business Fund, the North Carolina Solar Center, North Carolina A&T State University’s Center for Energy Research and Technology, and Appalachian State University’s Energy Center
2
Oregon
The Oregon Built Environment and Sustainable Technologies Center, University of Oregon’s Energy Studies in Building Laboratory and Baker Lighting Lab, Portland State University’s Renewable Energy Research Lab, the Energy Trust of Oregon, and the Oregon Transportation Research and Education Consortium
2
Pennsylvania Leigh University’s Energy Research Center and Penn State’s Indoor Environment Center
2
Texas Texas A&M’s Energy Systems Laboratory and University of Texas-Austin’s Center for Energy and Environmental Resources
2
Vermont The Center for Energy Transformation and Innovation 2
Wisconsin The Energy Center of Wisconsin and Wisconsin Focus on Energy
2
Alabama University of Alabama’s Center for Advanced Vehicle Technologies
1
Connecticut University of Connecticut’s Center for Clean Energy Engineering
1
Idaho The Center for Advanced Energy Studies 1
Illinois University of Illinois at Chicago’s Energy Resources Center 1
Iowa The Iowa Energy Center 1
Kansas Studio 804, Inc. 1
Kentucky University of Louisville’s Conn Center for Renewable Energy Research
1
Maryland University of Maryland’s Energy Research Center 1
Ohio Ohio State University’s Center for Energy, Sustainability, and the Environment
1
Tennessee University of Tennessee partnerships with Oak Ridge National Laboratory and the Electric Power Research Institute
1
Virginia The Modeling and Simulation Center for Collaborative Technology
1
West Virginia West Virginia University’s Advanced Energy Initiative 1
Notes: See Appendix H for expanded descriptions of state energy efficiency RD&D program activities.
2012 State Scorecard
83
Figure 9. Leading States: State Research, Development, and Demonstration Initiatives
Colorado: The state of Colorado is demonstrating leadership in many energy efficiency areas. State universities including Colorado State University, the University of Colorado, and the Colorado School of Mines have displayed a commitment to energy efficiency by dedicating research centers and facilities to the development of energy efficiency and clean energy technologies. The Center for Renewable Energy Economic Development also plays a major role in the state’s energy efficiency activities by promoting and supporting new cleantech companies throughout the state.
New York: The New York State Energy Research and Development Authority (NYSERDA) is an outstanding model of an effective and influential research and development institution. Its RD&D activities include a wide range of energy efficiency and renewable energy programs organized into seven program areas: energy resources; transportation and power systems; energy and environmental markets; industry; buildings; transmission and distribution; and environmental research. NYSERDA’s 2009/10 RD&D budget was approximately $165 million.
Oregon: The state of Oregon boasts an impressive array of organizations committed to energy efficiency. The Oregon Built Environment and Sustainable Technologies Center promotes cutting-edge technology related to energy efficiency and green buildings, the Energy Trust of Oregon provides funding for the testing of emerging technologies specifically related to utilities, and the Oregon Transportation Research and Education Consortium supports innovation specifically geared towards energy efficiency in the areas of land use and transportation.
Vermont: The state of Vermont is taking a giant step towards increased energy efficiency with the announcement of a new Center for Energy Transformation and Innovation at the University of Vermont. This collaborative project involves the University of Vermont, the State of Vermont, Sandia National Laboratories, and other Vermont institutions, such as Vermont Tech, Vermont State Colleges, Norwich University, and Vermont Law School. In addition to energy efficiency, the Center will focus on bringing sustainable energy and smart-grid technology to Vermont. The Center will receive $15 million in start-up funds from state, federal, and private sources.
Table 29. State Scoring for Appliance Efficiency Standards
States
Energy Savings per Customer through 2030
(BBtu/customer)
Date Most Recent
Standards Adopted
Score (2 pts.)
California** 144 2011 2
Connecticut 29 2011 1
Arizona 7.7 2009 0.5
Oregon 3.1 2007 0.5
Washington 1.2 2009 0.5
District of Columbia
0.6 2009 0.5
Maryland 0.5 2007 0.5
Rhode Island 0.5 2006 0.5
New Hampshire 0.4 2008 0.5
Georgia** N/A 2010 0.5
Texas** N/A 2010 0.5
Vermont 0 2006 0
New Jersey 0 2005 0
Nevada* 76 2007 0
Massachusetts 0 2007 0
New York 0 2010 0
Sources: Neubauer et al. (2009a); ASAP (2012)
* Nevada earned one-half point for advancing standards for general service incandescent lamps that are more stringent than the federal standards. California would earn an additional half point as well, but it has already been awarded the maximum number of points possible.
** Georgia and Texas adopted standards on plumbing products in 2010, as did California in 2007, which include toilets, urinals, faucet aerators, showerheads, and commercial pre-rinse spray valves. Since no analysis has yet been completed that estimates the savings, we awarded Georgia and Texas one-half point since the savings
would at least be greater than zero. California was already awarded the maximum number of points.
California, scoring the maximum two points, continues to take the lead on appliance efficiency standards,
most recently adopting the first-ever standards for televisions as well as standards for battery chargers.
Not only has California adopted the greatest number of appliance and equipment standards, many other
states’ standards are based on California’s, such as the television standards passed in Connecticut in 2011.
Many of the current state standards have been adopted at the federal level or have been included in
pending federal legislation; thus, without future state action to develop and implement standards for
additional products, the percentage of state standards preempted by federal standards will increase.
Of the four states that received no credit for their standards in Table 29, Massachusetts, New Jersey, and
Vermont have had their state standards preempted by federal standards. New York has passed legislation
2012 State Scorecard
87
to create several state standards for which federal standards do not exist;53 however, the standards levels
have yet to be officially developed. In our two previous State Scorecards we awarded New York credit for
these standards assuming the levels would be set over the course of the following years and the standards
would therefore begin to generate savings. Since the levels of New York’s standards have not been set and,
as a result, no savings have been generated, in the 2012 State Energy Efficiency Scorecard we have adjusted
the score accordingly. In our 2011 State Energy Efficiency Scorecard, Nevada earned credit for adopting
standards for general service incandescent lamps that are more stringent than the existing federal
standards. However, those standards are not yet being enforced and it is uncertain when they will begin to
be enforced, so we have deducted these points indefinitely.
It is worth noting that the standards adopted for plumbing products by California, Georgia, and Texas,
which include standards for toilets, urinals, faucet aerators, showerheads, and commercial pre-rinse spray
valves, will generate a significant volume of water savings. The energy savings come from the reduced
need for hot water as well as the reduced energy required to pump and treat both water and wastewater.
These standards are particularly important in these three states, which have been experiencing frequent
and persistent droughts in their regions at an increasing rate over the last decade or so.
Figure 10. Leading States: Appliance and Equipment Efficiency Standards
53 Televisions, pool pumps, hot tubs, portable light fixtures, water dispensers, commercial hot-food holding cabinets, audio/video equipment, and
digital TV adapters
Connecticut: In January 2011, the Connecticut General Assembly passed Bill 1243, which added standards for compact audio players, televisions, and DVD players and recorders. The standards are based on standards from Title 20 of the California Code of Regulations, making Connecticut only the second state to pass statewide standards on televisions. The standards are set to become effective in January 2014.
California: California was the first state in the country to adopt appliance and equipment efficiency standards. The authority to adopt appliance and equipment efficiency standards was bestowed upon the California Energy Commission as stipulated under the Warren-Alquist Act, enacted in 1974. Over the years, California has adopted standards on more than 50 products, many of which have subsequently become federal standards. California’s 2006 Appliance Efficiency Regulations became effective on December 30, 2005, replacing all previous versions of the regulations. The Appliance Efficiency Regulations create standards for 21 categories of appliances, including standards for both federally-regulated and non-federally-regulated appliances. Currently, California has standards in place for ten products that are not covered by federal standards.
Chapter 8: State Energy Efficiency in the Residential Sector: Measuring Performance Authors: Colin Sheppard, Arne Jacobson and Charles Chamberlin (Schatz Energy Research Center, Humboldt State University), Yerina Mugica (Natural Resources Defense Council).
Note: Findings from this chapter are not scored and do not affect rankings in the State Energy Efficiency
Scorecard. The chapter is included here to explore one way of measuring energy consumption trends as a
means of understanding energy efficiency in the residential sector. The performance-based approach of this
chapter complements the largely policy-based approach in other chapters of the State Scorecard.
SUMMARY
In this chapter, we present the latest installment in an ongoing series that began with the 2009 State
Energy Efficiency Scorecard. For each of the 50 states (the District of Columbia is excluded), we estimate
an aggregate, state-level metric of energy consumption intensity (i.e., per capita energy consumption) for
the residential sector. The metric identifies changes in state energy consumption intensity after adjusting
for changes due to year-to-year variations in weather.
This research indicates that it is possible to track trends in state energy consumption intensity, even with
the imperfect data sets that are currently available. With improvements in the data collection process, the
approach could be further strengthened into a powerful tool for evaluating states’ progress in reducing
energy consumption.
ACKNOWLEDGEMENTS
This chapter is the result of an analysis completed by the authors and commissioned by the Center for
Market Innovation at the Natural Resources Defense Council and supported by the American Council for
an Energy-Efficient Economy. On our website (the Performance based State Efficiency Program [PSEP])
can be found a detailed report about a performance-based state energy efficiency metric that could be
used to increase transparency and accountability of energy efficiency performance among states and
potentially to reward states for improved performance: http://www.schatzlab.org/projects/psep.
INTRODUCTION
In this chapter, we present the latest installment in an ongoing series that began with the 2009 State
Energy Efficiency Scorecard. For each of the 50 states (the District of Columbia is excluded), we estimate
an aggregate, state-level metric of energy consumption intensity (i.e., per capita energy consumption) for
the residential sector.
Our approach for tracking energy consumption intensity (ECI) is based upon per capita energy
consumption data for the residential sector in each state over a period of 10 years. For every given year we
have adjusted the energy consumption intensity for changes in residential heating and cooling energy use
due to annual variations in states’ weather. We call this corrected value the adjusted energy consumption
intensity (aECI), which is the data point for each state that we utilize in the scores and rankings in this
chapter. We use the results of a regression analysis to adjust ECI in a given year for changes in residential
heating and cooling energy use due to annual variations in state weather. In order to evaluate a state’s
performance in reducing aECI, we estimate the slope of a linear trend through the ten years including the
test year and the nine preceding years. States with a downward (negative) slope are considered to have
achieved progress, while those with a flat or increasing slope are not. The following section,
“Methodological Approach”, describes this methodology in further detail.
The performance-based metric for evaluating states’ progress that is described in this chapter differs from
the State Scorecard in some important ways. First, there are differences in the sectors that are currently
covered by the respective approaches. For instance, the State Scorecard includes an evaluation of
residential, commercial, and transportation sector policies, while the performance based metric presented
here focuses exclusively on the residential sector. In addition, whereas the State Scorecard tends to give
credit to states immediately for enacting efficiency-oriented policies, a performance-based approach gives
credit only after states show reductions in energy consumption intensity over time. As a result, there is an
inherent time lag between the two approaches. Importantly, with a performance-based approach states
will not receive credit for enacting efficiency-oriented policies unless those policies result in measurable
reductions in weather adjusted energy consumption intensity. Finally, as described in more detail in the
“Key Conclusions” section below, the data currently reported for energy consumption by state are not
perfect and differ from the data on which the State Scorecard’s rankings are based. Therefore, not
surprisingly, states’ rankings under the performance metric presented here sometimes do not match those
in the State Scorecard. The two approaches complement one another quite well, however, as one is
primarily a measure of state energy efficiency policy while the other is a measure of progress in achieving
reductions in energy consumption intensity.
The approach that we employed for tracking energy consumption intensity begins with data for aggregate
energy consumption for the residential sector in each state over a period of ten years.54 These data were
adjusted according to state population, yielding figures for annual per capita residential energy
consumption intensity (mmBtu/capita/year). The data were also corrected for an unrealistic assumption
made by the U.S. Energy Information Administration that primary energy associated with electricity
consumption should be estimated using a nationally averaged fossil-fueled heat rate. Our adjustment lets
us estimate a state-specific heat rate based on the composition of electricity production in that state and
which assumes no conversion losses from renewable electricity55, hydropower, and nuclear power.56
While there are many causes for variation in energy consumption intensity, weather is most clearly
beyond the influence of policymakers. (Other factors typically used in this kind of analysis include
economic indicators and the price of energy. See the section below titled “PSEP vs. Other Econometric
Approaches” for further discussion of our decision not to adjust for these factors.) Adjusting for weather
is an important step in the evaluation of consumption trends that result from policy changes. Therefore,
54 The energy data are from the Energy Information Agency of the U.S. Department of Energy’s State Energy Data System (SEDS). Population
data are from census and annual intercensal estimates from the U.S. Department of Commerce, Bureau of the Census. 55 We treat the following as renewable sources of electricity: wind, solar, wood, geothermal, and municipal waste. 56 Because the grid mix in each state changes from year to year, the heat rate estimate also changes. However, we seek to separate the impact on
consumption of energy efficiency measures from the impact of changes in grid mix or conversion efficiency. To address this issue, we use a
constant state-specific heat rate for any given evaluation period. For example, if our metric is concerned with ECI trends in California for the
period 2000-2009, then we use the average heat rate over that period to make the adjustment to primary energy associated with electricity
we determined the response of ECI to heating and cooling degree days, both of which are strong
indicators of the impact of climate on building energy consumption.57 The estimated weather coefficients
were used to adjust energy consumption intensity in a given year to a normal weather year based on the
state’s 30-year average number of heating and cooling degree days.58
The result is an adjusted residential sector ECI (hereafter called “aECI”) time series for each state that
includes corrections for changes in residential heating and cooling energy use due to annual variations in
state weather. In order to evaluate a state’s performance in reducing its adjusted energy consumption
intensity, we estimated the slope of a linear trend line through the ten years including the test year and the
nine preceding years. The PSEP score for the year equals this slope. States with a downward (negative)
slope, which indicates a decrease in adjusted energy consumption intensity, are considered to have
achieved progress, while those with a flat or increasing slope are experiencing increased energy
consumption per capita.59
DIFFERENCES FROM PREVIOUS STATE ENERGY EFFICIENCY SCORECARDS
This is the fourth consecutive year that the Performance based State Efficiency Program (PSEP) scores
have been presented in the State Scorecard. If one were to compare the results presented in Table 30 to
the corresponding results from previous years, some subtle differences would be apparent in the historical
PSEP scores for most states. These differences are the result of two changes in the Energy Information
Administration’s State Energy Data System (SEDS) data set that serve as the foundation of the metric.
First, the data from EIA include adjustments made to the methodology for estimating losses in the electric
power sector of states.60 In addition, the 2010 SEDS data set uses population data from the 2010 U.S.
Census. Therefore, estimates of state population for the years 2001-2009 were corrected by the Census
Bureau to reflect the latest results. For many states, these changes had a noticeable impact on their
adjusted energy consumption intensity and therefore the PSEP metric. Utah was affected the most by this
adjustment. There were four historical years where Utah’s PSEP metric was previously negative but are
now positive.
Table 30 below presents a ranking of states based on the slope of aECI for the four most recent periods for
which data are available (1998-2007, 1999-2008, 2000-2009, and 2001-2010). When the ten-year slope of
aECI is recalculated on an annual basis, there is considerable overlap from period to period in the data
used to create the metric. The four periods shown in Table 30 illustrate the variability and evolution of
states’ performance year over year.
57 We perform a fixed effect multiple linear regression to determine the response of ECI to heating and cooling degree days (HDD and CDD).
The regression includes dummy coefficients to model the fixed differences in ECI from state to state as well as differences from year to year across
all states. 58 State level, population weighted heating degree days (HDD) and cooling degree days (CDD) values are not currently published for Alaska and
Hawaii by the National Climatic Data Center. Our methodology for estimating these values from 1975-2010 is described in Appendix D of our
broader report: http://www.schatzlab.org/projects/psep. 59 It is also possible to add the condition that the slope estimate for a given test period be negative with some level of confidence. This can
decrease the occurrence of false positives, that is, it would exclude states that actually made no improvement in adjusted energy consumption
intensity from our definition of progress. In our broader report, we apply such a hypothesis test at the 20% significance level. 60 See http://www.eia.gov/state/seds/seds-data-changes.cfm#2010.
2012 State Scorecard
91
Table 30. Ten-Year Slopes of aECI from 1998-2007, 1999-2008, 2000-2009, and 2001-2010
2007 2008 2009 2010
Rank State Slope State Slope State Slope State Slope 1 WA -0.37 WA -0.52 MA -0.67 ME -0.90 2 MA -0.22 MA -0.44 AK -0.61 AK -0.89 3 CA -0.20 TX -0.36 TX -0.58 MI -0.80 4 TX -0.18 AK -0.25 WA -0.56 CT -0.70 5 OR -0.10 OR -0.24 MI -0.52 DE -0.66 6 KS -0.07 RI -0.17 CT -0.48 WA -0.65 7 RI 0.00 CA -0.15 DE -0.46 TX -0.61 8 NE 0.01 MI -0.12 RI -0.43 MA -0.53 9 IL 0.03 NE -0.11 ME -0.39 RI -0.46
10 NH 0.06 MD -0.10 NY -0.37 PA -0.46 11 NY 0.09 NY -0.09 PA -0.35 NE -0.44 12 NV 0.10 DE -0.09 MD -0.35 OR -0.42 13 MD 0.10 KS -0.08 OR -0.30 MD -0.41 14 HI 0.11 CT -0.07 NE -0.28 NY -0.41 15 UT 0.12 NV -0.06 IL -0.21 MN -0.40 16 NJ 0.17 IL -0.03 MN -0.20 IL -0.39 17 LA 0.19 PA 0.01 AL -0.20 NH -0.33 18 IA 0.19 NJ 0.01 NV -0.20 NJ -0.33 19 MI 0.21 UT 0.02 NJ -0.16 WI -0.28 20 SD 0.23 NH 0.06 GA -0.15 SC -0.25 21 MS 0.24 AL 0.08 NH -0.15 NC -0.25 22 NC 0.24 MS 0.08 MS -0.15 OH -0.24 23 OK 0.25 MN 0.09 NC -0.14 NV -0.24 24 SC 0.26 NC 0.09 SC -0.10 AL -0.22 25 DE 0.28 SC 0.11 WI -0.08 IN -0.20 26 AL 0.29 IA 0.12 FL -0.08 FL -0.16 27 PA 0.31 HI 0.13 CA -0.06 GA -0.15 28 AR 0.35 ME 0.15 KS -0.04 TN -0.12 29 OH 0.35 LA 0.16 OH -0.03 MS -0.11 30 TN 0.37 FL 0.18 UT 0.00 CA -0.04 31 FL 0.38 OH 0.18 TN 0.01 CO -0.03 32 IN 0.39 AR 0.20 IN 0.03 UT 0.01 33 MN 0.39 WI 0.21 OK 0.06 VA 0.03 34 AK 0.41 GA 0.23 CO 0.07 KS 0.04 35 WI 0.43 SD 0.23 AR 0.10 OK 0.04 36 CT 0.43 TN 0.25 IA 0.14 IA 0.07 37 GA 0.44 OK 0.25 LA 0.14 AR 0.09 38 ME 0.47 IN 0.26 VA 0.18 KY 0.14 39 KY 0.58 CO 0.37 HI 0.21 MO 0.15 40 VA 0.61 KY 0.42 KY 0.23 SD 0.17 41 AZ 0.61 VA 0.44 SD 0.28 ND 0.19 42 CO 0.64 AZ 0.56 MO 0.37 HI 0.23 43 MO 0.65 MO 0.59 VT 0.41 VT 0.28 44 NM 0.65 NM 0.59 AZ 0.44 AZ 0.31 45 ID 0.66 ID 0.60 ND 0.51 LA 0.36 46 VT 0.70 VT 0.62 ID 0.56 NM 0.52 47 ND 1.07 ND 0.78 NM 0.58 ID 0.61 48 WY 1.17 WY 1.18 WV 1.08 WV 0.87 49 WV 1.43 WV 1.33 WY 1.09 WY 0.90 50 MT 1.55 MT 1.56 MT 1.53 MT 1.25
Figure 11 is a graphical display of the results from 2001-2010, ranking states according to their own
baseline (i.e., based upon reductions in their aECI). This approach gives every state the opportunity to rise
Conclusions Energy efficiency policies and programs have continued to advance at the state level over the past year. A
group of leading states remains committed to pursuing more efficient use of energy in transportation,
buildings, and industry, fostering economic development in the energy efficiency services and technology
industries and saving money for consumers to spur growth in all sectors of the economy.
A growing number of states have progressed—some rapidly—over the past few years in the pursuit of
their energy efficiency goals. There has been a lot of movement within and outside of the top tier of
states, with Connecticut poised to break into the top five again and several states potentially able to move
into the top tier as well. This dynamism at the policy and program levels is reflected in growing utility
program budgets and savings, as well as in the range of other actions states are taking to improve their
energy efficiency.
A wide gap remains, however, between states near the top and those at the bottom of the State Scorecard
rankings. Because of market barriers and the regulated nature of the energy sector, a regulatory
environment that levels the playing field for energy efficiency—the fastest, cheapest, cleanest energy
resource—is critical to capturing its full range of benefits for states and for consumers.
LOOKING AHEAD
We see signs that many states will continue to raise the bar on their energy efficiency program and policy
commitments in 2013 and beyond. For example:
A July 2012 draft of Massachusetts’ second Three-Year Energy Efficiency Plan (State of
Massachusetts 2012), required by the Green Communities Act, proposes annual savings goals of
2.5% of electricity retail sales from 2013-2015, and 1.1% of natural gas retail sales starting in 2013
(and increasing in subsequent years), supported by funding for energy efficiency programs of $2
billion over the three years.
Oregon’s Governor Kitzhaber recently released a draft of his 10-Year Energy Action Plan (State of
Oregon 2012), which calls for energy efficiency and conservation to meet 100% of future growth
in the electricity load. He called for improving the energy performance of every occupied state-
owned building over the next ten years as a first step towards meeting this goal.
Connecticut’s Governor Malloy has made a commitment to pursue the top spot in the State
Scorecard in future years, calling for an increase in spending for utility energy efficiency
programs, a strengthening of the bonding authority of the state’s clean energy investment
authority, and reductions in state building energy use starting in 2013 (State of Connecticut
2012).
In October 2011, the New York Public Service Commission extended the state’s Energy Efficiency
Portfolio Standard for an additional 4 years, through 2015, and increased funding for energy
efficiency programs operated by NYSERDA and the state’s investor-owned utilities by more than
$2 billion. The Commission also approved a new Technology & Market Development program
providing an additional $410 million in public benefit funding over the next 5 years.
2012 State Scorecard
99
The State of Vermont released its Final Comprehensive Energy Plan 2011, its first since the late
1990s, which promotes increased use of efficiency as one of its first priorities. The plan
recommends: the use of innovative energy efficiency program designs to capture all cost-effective
efficiency; changes to building efficiency program design; goals for increasing the stringency of
and compliance with building energy codes in new construction (including public buildings); and
a review of state land use provisions and infrastructure needs for electric vehicles. The Climate
Cabinet, established through Executive Order No. 05-11, is responsible for implementation of the
plan (State of Vermont 2011).
Oklahoma, one of the most improved states this year, is poised to make further improvements in
energy efficiency with the recent enactment of Bill 1096, which calls for a 20% reduction in the
energy use of state buildings and educational institutions. Governor Fallin, in her 2012 State of
the State address, specifically called for Oklahoma to pursue further strategies for improving the
state’s energy efficiency (State of Oklahoma 2012).
In addition, numerous states that only recently began implementing utility-sector energy efficiency
programs such as Michigan, Ohio, Indiana, Arkansas, and Arizona will likely continue to ramp up
efficiency program activity over the next few years to meet those rising goals.62 As noted in Chapter 2 on
utility programs, combined utility spending on electric and natural gas efficiency programs is estimated to
more than double from 2010 levels to $10.8 billion by 2025, if current savings targets are met, and to more
than triple to $16.8 billion if many states give energy efficiency a prominent role as a resource (Goldman
et al. 2012).
These projections of an increasing role for energy efficiency will not, however, occur in a vacuum. The
impact and expansion of energy efficiency programs and policies in 2013 and beyond will be influenced
by both state support for energy efficiency and external factors beyond states’ control. Continued
uncertainty around the economic recovery could dampen consumer demand for energy efficiency
upgrades in the residential and commercial sectors, which would impact savings from efficiency
programs. More concerning is the impact on budgets for efficiency. Some policymakers have responded
to continued strain on state budgets by redirecting funds from utility customers or other sources
originally meant for efficiency programs to shore up state finances in other areas,63 or have not allocated
energy efficiency budgets at a level high enough to meet mandated savings goals.64
Energy efficiency can save consumers money, drive investment across many sectors of the economy, and
create jobs. While several states are consistently leading the way on energy efficiency and many more are
dramatically increasing their efforts, significant opportunities remain to both sustain current efforts and
62 See (Nowak et al. 2011) for a full discussion of how states are preparing to meet higher energy savings targets. 63 New Jersey Governor Christie redirected $42.5 million from the state’s Clean Energy Fund in fiscal year 2011 to cover state energy bills and will
do the same in FY 2013 (which started July 1, 2012), with a reallocation of $210 million (NJ Spotlight 2012; State of New Jersey 2012). At the
beginning of this year, New Jersey also withdrew from the Regional Greenhouse Gas Initiative, which had been providing the state with
substantial funding for energy efficiency projects (State of New Jersey 2011). 64 Maine legislators have not sufficiently allocated FY 2013 funds to efficiency programs in the state. This point is discussed more fully in Chapter
Hawaii (2004 & 2009) RPS-EERS Electric Statewide Goal (100%)
Electric: 40% reduction from 2007 baseline by 2030. 2% Binding HRS §269-91, 92, 96; HI PUC Order, Docket 2010-0037
4
Maryland67 (2008) EERS Electric Statewide Goal (100%)
Goal of 15% reduction in electricity use per capita by 2015 with targeted reductions of 5% by 2011 calculated against a 2007 baseline (10% by utilities, 5% achieved independently). 15% reduction in per capita peak demand by 2015, compared to 2007.
2.4% Binding Md. Public Utility Companies Code § 7-211
4
Massachusetts (2009) EERS Electric and Natural Gas IOUs, Coops, Munis, CLC (~80%)
Electric: 1.4% in 2010, 2.0% in 2011; 2.4% in 2012; 2.5% annually from 2013-2015 (proposed). Natural Gas: 0.63% in 2010, 0.83% in 2011; 1.15% in 2012; 1.1% in 2013 and increasing in subsequent years (proposed).
1.9% Binding
Massachusetts Joint Statewide Three-Year Electric and Gas Energy Efficiency Plan, July 2, 2012
4
Minnesota (2007) EERS Electric and Natural Gas Statewide Goal (100%)
Electric: 1.5% annual savings in 2010 and thereafter. Natural Gas: 0.75% annual savings from 2010-2012; 1.5% annual savings in 2013 and thereafter.
1.5% Binding Minn. Stat. § 216B.241
4
66 For utilities covered under the EERS policy. For some states, this would be significantly reduced if reported based on state-wide sales. 67 The 15% per-capita electricity use reduction goal translates to around 17% cumulative savings over 2007 retail sales.
State (Year Enacted) Policy Type Sector(s) covered Applicability (% of statewide sales) Description
Approx. Annual Electric Savings Target
(2012+)66 Stringency Reference Score
New York (2008) EERS Electric and Natural Gas Statewide Goal (100%)
Electric: 15% cumulative savings by 2015. Natural Gas: ~14.7% cumulative savings by 2020.
2.1% Binding
Electric: NY PSC Order, Case 07-M-0548 Natural Gas: NY PSC Order, Case 07-M-0748
4
Rhode Island (2006) EERS Electric and Natural Gas IOUs, Munis (~95%)
Electric: ~1.3% in 2010; 1.5% in 2011; Council proposed 1.7% in 2012, 2.1% in 2013, and 2.5% in 2014. EERS includes demand response targets. Natural Gas: ~0.4% of sales in 2011; Council proposed 0.75% in 2012, 1.0% in 2013, and 1.2% in 2014.
2.1% Binding R.I.G.L § 39-1-27.7 4
Vermont (2000) Tailored target Electric Efficiency Vermont (100%)
~6.6% cumulative savings from 2012 to 2014. EERS includes demand response targets.
Illinois (2007) EERS Electric and Natural Gas Utilities with over 100,000 customers, Illinois Department of Commercial and Economic Opportunity (~90%)
Electric: 0.2% annual savings in 2008, ramping up to 1% in 2012, 2% in 2015 and thereafter. Reduction of annual peak demand of 0.1% through 2018. Natural Gas: 8.5% cumulative savings by 2020 (0.2% annual savings in 2011, ramping up to 1.5% in 2019).
1.7% Cost Cap S.B. 1918; Public Act 96-0033; § 220 ILCS 5/8-103
3.5
Iowa (2009) Tailored targets Electric and Natural Gas Statewide Goal (100%)
Electric: Varies by utility from 1-1.5% annually by 2013. Natural Gas: Varies by utility from 0.74-1.2% annually by 2013.
State (Year Enacted) Policy Type Sector(s) covered Applicability (% of statewide sales) Description
Approx. Annual Electric Savings Target
(2012+)66 Stringency Reference Score
Colorado (2007) Tailored targets Electric and Natural Gas IOUs (~57%)
Electric: PSCo and Black Hills Energy (BHE) both aim for 0.9% of sales in 2011, which increase to 1.35% (1.0% for BHE) of sales in 2015 and then 1.66% (1.2%) of sales in 2019. Natural Gas: Savings targets commensurate with spending targets (at least 0.5% of prior year’s revenue).
Indiana (2009) EERS Electric Jurisdictional utilities (includes IOUs, Co-ops and Munis) (85%)
0.3% annual savings in 2010, increasing to 1.1% in 2014, and leveling at 2% in 2019.
1.46% Binding Cause No. 42693, Phase II Order
3
Washington (2006) Electric IOUs, Co-ops, Munis (~84%)
Biennial and Ten-Year Goals vary by utility. Law requires savings targets to be based on the Northwest Power Plan, which estimates potential savings of about 1.5% savings annually through 2030 for Washington utilities.
Arkansas (2010) EERS Electric and Natural Gas IOUs (~61%)
Electric: Annual reduction of 0.25% of total kilowatt hour (kWh) sales in 2011, ramping up to 0.75% in 2013. Natural gas: A slightly lower percentage than for electric.
0.6% Binding Order No. 17, Docket No. 08-144-U; Order No. 15, Docket No. 08-137-U
2.5
California (2004 & 2009) EERS Electric and Natural Gas IOUs (~75%)
Electric: 0.86% average annual savings through 2020. Demand reduction of 4,541 MW through 2020. Natural Gas: 619 gross MMTh between 2012 and 2020.
Michigan (2008) EERS Electric and Natural Gas Statewide Goal (100%)
Electric: 0.3% annual savings in 2009, ramping up to 1% in 2012 and thereafter. Natural Gas: 0.10% annual savings in 2009, ramping up to 0.75% in 2012 and thereafter.
State (Year Enacted) Policy Type Sector(s) covered Applicability (% of statewide sales) Description
Approx. Annual Electric Savings Target
(2012+)66 Stringency Reference Score
Ohio (2008) EERS Electric IOUs (~88%)
22% by 2025 (0.3% annual savings in 2009, ramping up to 1% in 2014 and 2% in 2019). EERS includes targets for reduction of peak demand. Exit ramp for utilities unable to meet targets.
1.2% Exit ramp ORC 4928.66 et seq. S.B. 221
2.5
Oregon (2010) Tailored targets Electric and Natural Gas Energy Trust of Oregon (100%)
Electric: Targets are equivalent to 0.8% of 2009 electric sales in 2010, ramping up to 1% in 2013 and 2014. Natural Gas: 0.2% of sales in 2010, ramping up to 0.4% in 2014.
0.98% Exit ramp Energy Trust of Oregon 2009 Strategic Plan
2
New Mexico (2008) EERS Electric IOUs (67%)
5% reduction from 2005 total retail electricity sales by 2014 and a 10% reduction by 2020. Exit ramp for utilities unable to meet targets.
0.9% Exit ramp N.M. Stat. § 62-17-1 et seq.
1.5
Wisconsin (2011) Tailored targets Electric and Natural Gas Focus on Energy (100%)
~0.65% annual savings from 2011-2014. 0.7% Cost cap Order, Docket 5-GF-191 1.5
Nevada (2005 & 2009) RPS-EERS Electric IOUs (~88%)
20% of retail electricity sales to be met by renewables and energy efficiency by 2015, and 25% by 2025. Energy efficiency may meet a quarter of the standard in any given year, or 5% cumulative savings by 2015 and 6.25% by 2025.
0.3% Binding NRS 704.7801 et seq.
1
North Carolina (2007) RPS-EERS Electric Statewide Goal (100%)
Renewable Energy and Energy Efficiency Portfolio Standard (REPS). Investor-owned: 12.5% by 2021 and thereafter. Energy efficiency is capped at 25% of the 2012-2018 targets and at 40% of the 2021 target.
0.5% Binding N.C. Gen. Stat. § 62-133.8; 04 NCAC 11 R08-64, et seq.
Appendix C: Status of State Efforts to Address Utility Lost Revenues and Incentives for Energy Efficiency68
State Decoupling or Related Mechanism Performance Incentive
Alabama
Lost revenue recovery is in place for electric and natural gas. Alabama Power and Alabama Gas Company can recover lost revenues by projecting losses and adjusting rates annually through Rate RSE which includes caps and automatic rate reductions when profits or expenses exceed authorized ranges.
In place for natural gas and electric. Alabama Power and Alabama Gas Company may recover a reasonable rate of return on efficiency spending via a rate rider.
Alaska None None
Arizona
Decoupling is in place for natural gas, lost revenue recovery in place for electric and natural gas. Southwest Gas was approved for decoupling in late 2011. Arizona Public Service and UNS Gas have lost revenue recovery mechanisms.
In place for electric. Arizona Public Service has a tiered shareholder performance incentive. Tucson Electric Power and UNS Electric also have incentives.
Arkansas Lost revenue recovery is in place for electric and natural gas. All major, investor-owned utilities.
In place for electric and natural gas. In December 2010 the PSC approved incentives as a means to reward energy efficiency by investor owned utilities.
California Decoupling is in place for electric and natural gas. All investor-owned utilities.
In place for electric and natural gas. Investor-owned utilities participate in a risk/reward incentive mechanism.
Colorado
Partial decoupling is in place for natural gas and a disincentive offset is in place for electric. In 2007 a partial decoupling three-year pilot mechanism was approved. The Public Service Company of Colorado has a disincentive offset.
In place for electric and natural gas – Incentive approved in 2008 for Public Service Company of Colorado and Black Hills.
Connecticut
Decoupling is in place for electric and lost revenue recovery for natural gas. United Illuminating was approved for decoupling in 2009
In place for electric only.
Delaware
Decoupling is in place for electric and natural gas. Delmarva Power & Light has applied for a form of decoupling for natural gas and electric, the Public Service Commission approved the mechanism in 2011.
None
District of Columbia
Decoupling is in place for electric. Potomac Electric Power Company collects a Stabilization Adjustment. Washington Gas Light has requested decoupling, but was denied.
In place for electric and natural gas – A third party administrator can earn a performance-based incentive.
Florida None. Decoupling is authorized for natural gas and lost revenue recovery is authorized for electric, but no mechanisms have been approved.
None. Legislation has authorized an additional return on equity for energy savings in excess of goal in 2008, but no utilities have requested it.
68 More detailed information is available on ACEEE’s State Policy Database, www.aceee.org/sector/state-policy
State Decoupling or Related Mechanism Performance Incentive
Georgia Lost revenue recovery for electric – Georgia Power may recover lost revenues from implementing efficiency programs via an “additional sum”.
In place for electric. Georgia Power may use a percentage of net benefits from electricity savings from the implementation of efficiency programs via an “additional sum”.
Hawaii Decoupling is in place for electric. Decoupling was approved in 2010 for Hawaiian Electric Company.
Performance incentive for third party administrator – Hawaii transferred administration of efficiency programs to a third-party administrator in 2009.
Idaho Decoupling is in place for electric. A fixed-cost adjustment was approved for Idaho Power Company in 2007 and was made permanent in March 2012.
None. A pilot program for Idaho Power Company was cancelled in 2009.
Illinois Decoupling for natural gas is pending. North Shore Gas and Peoples Gas and Coke were approved for revenue-per-customer decoupling pilots through 2011.
None
Indiana
Decoupling is in place for natural gas and electric, and there is lost revenue recovery for electric. Indiana Gas Company, Inc. (Vectren North) and Southern Indiana Gas & Electric Company have decoupling. Vectren has a reliability cost mechanism and revenue adjustment mechanisms. Duke Energy Indiana has lost revenue recovery.
In place for electric and natural gas. Indianapolis Power & Light and Southern Indiana Gas & Electric Company have a tiered shareholder performance incentive and Indiana Michigan Power Company has a shared benefits approach.
Iowa None. Utilities may request recovery of lost revenues on a case by case basis, though none currently have a mechanism in place.
None
Kansas Lost revenue recovery in place for electric. Utilities may request decoupling on a case by case basis. Westar Energy collects lost revenues through a tariff.
None. Utilities can request shared savings performance incentives on a case by case basis, however no plans have been approved for any utilities.
Kentucky Lost revenue recovery is in place for electric and natural gas.
In place for electric and natural gas. Duke Energy, Louisville Gas & Electric and Kentucky Power (AEP) have shared savings mechanisms in place.
Louisiana
In place for electric and natural gas utility. In New Orleans there is a rate rider that provides for recovery of lost contribution to fixed costs for the electric and natural gas utility Entergy.
In place for electric and natural gas. In New Orleans there is a rate rider that provides an incentive to the electric and natural gas utility Entergy.
Maine None. Decoupling is authorized under statute, but efficiency programs are implemented by a government agency.
None. Incentives are authorized under statute, but efficiency programs are implemented by a government agency.
Maryland Decoupling is in place for electric and natural gas. The three investor-owned utilities in Maryland have decoupling in place.
None. Legislation authorizes incentives, but none have been approved.
Massachusetts Decoupling has been implemented for all major natural gas and electric utilities.
Incentives are in place for electric and natural gas. Performance incentives can be earned based on achievement of performance targets.
2012 State Scorecard
125
State Decoupling or Related Mechanism Performance Incentive
Michigan
Decoupling is in place for electric and natural gas. Decoupling has been implemented for Consumers Energy, Detroit Edison, Michigan Gas Utilities and Michigan Consolidated Gas Company.
Incentives are in place for electric and natural gas – Detroit Edison Company has an incentive in place.
Minnesota Decoupling is in place for natural gas and electric – CenterPoint Energy has decoupling. Electric utilities were to submit proposals by the end of 2011.
Incentives are in place for electric and natural gas – Incentives have been in place since 1999.
Mississippi None None
Missouri
Straight-fixed variable pricing is in place for natural gas, and is authorized for electric, but is not in place. Missouri Gas Energy has a straight-fixed variable pricing structure. Laclede and Ameren Missouri have similar rate designs.
None. Commission rules permits incentives, but none have been authorized.
Montana Lost revenue recovery is in place for electric and natural gas. NorthWestern Energy has a lost revenue recovery mechanism in place.
None. Statue allows an authorized rate of return, but none has been approved.
Nebraska None. Decoupling mechanisms requested by SourceGas were denied by the Public Service Commission.
None
Nevada
Lost revenue recovery is in place for electric; decoupling is in place for natural gas – A lost revenue recovery mechanism was approved for NV Energy in 2010.
None. Eliminated in 2010. Utilities may request an incentive on a program-by-program basis.
New Hampshire
None. The Public Utility Commission has authorized utilities to apply for decoupling or lost revenue recovery on a case by case basis.
In place for electric and natural gas. All utilities participate in the state incentive program.
New Jersey
Lost revenue recovery is in place for natural gas, pending for electric. New Jersey Natural Gas Co. and South Jersey Gas Co. have revenue adjustment mechanisms. Atlantic City Electric and Rockland Electric Company have proposed a bill stabilization agreement that calls for monthly true-ups though a decision on the issue of lost revenues has been deferred.
None
New Mexico
Lost revenue is in place for electric and natural gas. A rate rider had been approved to remove regulatory disincentives. A recent Order by the Public Regulation Commission affirmed the mechanism. Legislation requires that regulatory disincentives to cost-effective efficiency be removed.
In place for electric and natural gas. A rate rider provides an incentive for efficiency.
New York
Decoupling is in place for electric and natural gas. Utilities are ordered to file proposals for true-up-based decoupling mechanisms in ongoing and new rate cases.
In place for electric and natural gas. An incentive program is mandatory for electric utilities. A similar program exists for natural gas utilities, but they may opt out.
State Decoupling or Related Mechanism Performance Incentive
North Carolina
Decoupling is in place for natural gas, lost revenue recovery is in place for electric – Duke Energy Carolinas has mechanisms in place that permit recovery of lost revenues. Piedmont Natural Gas and Public Service Company of North Carolina have decoupling.
In place for electric, but not natural gas. Progress Energy Carolinas and Duke Energy Carolinas have incentives in place.
North Dakota Lost revenue recovery in place for natural gas, but not for electric. Xcel Energy has a straight fixed variable approach in place.
None
Ohio
Lost revenue recovery is in place for electric and natural gas, decoupling pilot is in place for electric. A decoupling pilot program was approved for AEP for 2012-2014. Utilities are permitted to request decoupling, but thus far all have requested straight fixed variable pricing.
In place for electric. Several electric utilities have incentives in place, including the Duke Save-A-Watt program.
Oklahoma
Lost revenue recovery in place for electric, but not natural gas. Both Public Service Oklahoma and Oklahoma Gas and Electric Company recover lost revenues.
In place for electric and natural gas. Public Service Oklahoma, Oklahoma Natural Gas and Oklahoma Gas and Electric Company have shared benefit incentive plans.
Oregon
Decoupling is in place for electric and natural gas. Portland General Electric has a “Sales Normalization Adjustment”. Cascade Natural Gas and Northwest Natural Gas have had mechanisms in place since 2006 and 2003, respectively.
None
Pennsylvania None None. Electric utilities may be fined if they fail to meet their efficiency targets.
Rhode Island Decoupling has been approved for electric and natural gas. A decoupling proposal from National Grid has been approved.
In place for electric and natural gas. Shareholder incentive for electric and natural gas since 2005 and 2007, respectively.
South Carolina
Lost revenue recovery is in place for electric, but not natural gas – Duke, Progress and South Carolina Electric & Gas all have lost revenue recovery mechanisms in place.
In place for electric, but not natural gas. Progress and South Carolina Electric & Gas have shared savings incentives. Duke has an avoided cost recovery plan.
South Dakota Lost revenue adjustment for electric and natural gas – Northwestern Energy has a lost revenue adjustment mechanism for both electric and natural gas.
In place for electric and natural gas – Mechanisms have been approved for several utilities including OtterTail Power, MidAmerican, Montana-Dakota Utilities and Northwestern Energy.
Tennessee
Lost revenue recovery for natural gas, none for electric. Chattanooga Gas Co. collects a monthly charge for fixed costs in order to align utility interests to better promote efficiency, and it can adjust the remaining portion of rates annually.
None
Texas None In place for electric, but not natural gas. All investor-owned utilities have a shared benefit incentive.
2012 State Scorecard
127
State Decoupling or Related Mechanism Performance Incentive
Utah
Decoupling is in place for natural gas. Questar Gas has tariffs that authorize revenue based on the number of customers served. Legislation encourages the Commission to remove financial disincentives to efficiency.
None. Legislation expresses support for incentives, but none have been approved.
Vermont In place for electric. Central Vermont Public Service has a decoupling mechanism that expires in 2011.
In place for electric. Vermont contracts an independent third party to operate efficiency programs. The contract includes a performance-based incentive.
Virginia Decoupling is in place for natural gas. Several natural gas utilities have decoupling. Dominion has applied for recovery of lost revenues, but was not approved.
None. Legislation has authorized incentives for electric utilities, although none have been approved.
Washington Lost revenue recovery is in place for natural gas – Avista has a lost revenue recovery mechanism in place.
None. Electric utilities may be fined if they fail to meet their efficiency targets.
West Virginia None None
Wisconsin
Decoupling is in place for electric and natural gas; lost revenue recovery is also in place for natural gas. Decoupling was approved for Wisconsin Public Service Corporation in 2008. A Gas Cost Recovery Mechanism was approved for Wisconsin Electric Power Company in 2011.
In place for electric and natural gas. Wisconsin Power & Light earns a rate of return on investments for commercial and industrial customers.
Wyoming
Decoupling is in place for natural gas, and lost revenue recovery is in place for electric. Questar Gas Company has a pilot decoupling program that began in 2009. Montana-Dakota Utilities Company has a lost revenue adjustment mechanism.
California’s Transportation Development Act provides two sources of funding for public transit: the Location Transportation Fund and the State Transit Assistance Fund. Monies are allocated to each county based on population, taxable sales, and transit performance and are used for the development and maintenance of transit infrastructure.
http://www.dot.ca.gov/hq/MassTrans/State-TDA.html
Colorado
Colorado adopted the FASTER legislation in 2009, which created a State Transit and Rail fund that accumulates $5 million annually. The legislation also allocated $10 million per year from the Highway Users Tax Fund to the maintenance and creation of transit facilities.
House Bill 1271 allows municipalities in Florida with a regional transportation system to levy a tax, subject to voter approval, that can be used as a funding stream for transit development and maintenance.
The Transportation Investment Act, enacted in 2010, allows municipalities to pass a sales tax for the express purpose of financing transit development and expansion.
Illinois House Bill 289 allocates $2.5 billion for the creation and maintenance of mass transit facilities from the issuance of state bonds.
http://legiscan.com/gaits/text/70761
Kansas
The Transportation Works for Kansas legislation was adopted in 2010 and provides financing for a multimodal development program in communities with sensitive transportation needs.
House File 2700, adopted in 2010, is an omnibus bonding and capital improvement bill which provides $43.5 million for transit maintenance and construction. The bill also prioritized bonding authorization so that appropriations for transit construction for fiscal years 2011 and 2012 would amount to $200 million.
In 2010 New York adopted Assembly Bill 8180, which increases certain registration and renewal fees to fund public transit. It also created the Metropolitan Transit Authority financial assistance fund to support subway, bus, and rail.
North Carolina In 2009 North Carolina passed House Bill 148, which calls for the establishment of a congestion relief and intermodal transportation fund.
Tennessee Senate Bill 1471, passed in 2009, calls for the creation of a Regional Transportation Authority in major municipalities. It allows these authorities to set up dedicated funding streams for mass transit either by law or through voter referendum.
Appendix F: Summary of State Building Code Stringency
State Summary of State Building Code Stringency Score
Alabama
Effective October 1, 2012, the Alabama Energy and Residential Code (AERC) will become mandatory statewide, for the first time in the state’s history. The residential provisions of the AERC reference Chapter 11 of the 2009 IRC with Alabama amendments. The commercial provisions of the AERC reference the 2009 IECC with Alabama amendments while referencing ASHRAE Standard 90.1-2007 as an alternative compliance path. Local jurisdictions may adopt more stringent codes.
3
Alaska
Alaska’s residential code is the state-developed Building Energy Efficiency Standard (BEES), which is based on the 2009 IECC and ASHRAE Standard 62.2-2010 Ventilation and Acceptable Indoor Air Quality in Low-Rise Residential Buildings, with Alaska-specific amendments. BEES is mandatory for state-financed residential construction projects, a requirement that covers roughly 25% of housing starts in the state (those that qualify for state financial assistance). Alaska has no statewide commercial building code, but all public facilities must comply with the thermal and lighting energy standards adopted by the Alaska Department of Transportation and Public Facilities mandated by AS44.42020(a)(14).
0.5
Arizona
There is no statewide mandatory residential or commercial energy code in Arizona. For commercial structures, all state-funded buildings constructed after February 11, 2005 must achieve LEED Silver certification and meet the energy standards of ASHRAE 90.1-2004 as mandated by Executive Order 2005-05. Arizona is a “home rule” state, meaning that codes are adopted and enforced on a local rather than state level. According to analysis by the Southwest Energy Efficiency Project, jurisdictional adoption of codes has led to 73% of the population being covered by either the 2006 IECC (58%) or the 2009 IECC (15%), for both residential and commercial buildings.
2
Arkansas
The Arkansas Energy Code for New Building Construction is mandatory statewide for both residential and commercial buildings. The residential energy code is based on the 2003 IECC and includes state-specific amendments. As of January 1, 2013, Arkansas' commercial energy code will reference ASHRAE Standard 90.1-2007 with Chapter 5 of the 2009 IECC as an alternative compliance path. Newly constructed or remodeled public buildings must comply with ASHRAE 90.1-2007.
2.5
California
California’s energy code is considered to be the most aggressive and best enforced energy code in the United States, and has been a powerful vehicle for advancing energy efficiency standards for building equipment. Many specifications are performance-based, offering flexibility for designers. The code also stands out because it includes field verification requirements for certain measures and reports high compliance rates overall. The most recent code, effective January 1, 2010, is mandatory statewide and exceeds 2009 IECC standards for residential buildings and meets or exceeds ASHRAE/IESNA 90.1-2007 for commercial buildings.
State Summary of State Building Code Stringency Score
Colorado
Colorado is a home rule state with a voluntary building code for both residential and commercial construction with the 2003 IECC as a mandatory minimum for jurisdictions that have adopted a code previously. Jurisdictions that have not adopted or enforced codes are exempt from the 2003 IECC requirement, although the 2009 IECC is mandatory for all factory-built and multi-family structures – commercial and residential – in areas that do not adopt or enforce buildings codes. A list of jurisdictions that have adopted codes can be found on the websites of the U.S. Department of Energy’s Office of Energy Efficiency and Renewable Energy and the Building Codes Assistance Project.
2
Connecticut
Connecticut has statewide codes for both residential and commercial buildings based on the 2009 IECC. On January 28, 2009, HB 6284 was introduced in the Connecticut General Assembly with the purpose of creating a new state building energy code and green buildings for certain construction projects, and was passed in June 2009. The bill requires the incorporation of the 2012 IECC within 18 months of its publication. Effective July 1, 2010, the bill requires a LEED-Silver rating for certain residential buildings that are projected to cost $5 million or more as well as for renovation of certain residential buildings that are projected to cost $2 million or more.
3
Delaware
Through the passage of SB 59, which became effective July 1, 2010, Delaware’s residential and commercial codes were updated to follow the 2009 IECC and ASHRAE 90.1-2007, respectively. Both residential and commercial codes are reviewed triennially for potential updates to the most recent versions of the IECC and ASHRAE Standard 90.1.
3
District of
Columbia
Washington D.C.'s energy codes are mandatory across the District. For residential buildings, builders must comply with the 2008 D.C. Construction Codes, which are based on the "30% Solution" and are more stringent than the 2009 IECC. For commercial buildings, builders must again comply with the 2008 D.C. Construction Codes, which are based on ASHRAE 90.1-2007. On December 16, 2011, the District of Columbia’s Construction Codes Coordinating Board (CCCB) voted in favor of adopting the 2012 IECC. Implementation is expected in late 2013 pending administrative review and legislative processes to officially enact the code update.
4
Florida
The first printing of the 2010 Florida Building Codes, including the now-separate 2010 Florida Building Code, Energy Conservation, became effective March 15, 2012. Adopted by the Florida Building Commission (FBC) in 2011, the state-developed code references the 2009 IECC and ASHRAE Standard 90.1-2007 as base documents, with significant Florida-specific amendments throughout. The FBC estimates that the 2010 state code is 5% more stringent that the 2007 code edition, or roughly 20% more stringent than the 2006 IECC.
4
Georgia
On January 1, 2011, the 2011 Georgia State Minimum Standard Energy Code became effective statewide as approved by the Georgia Department of Community Affairs on November 3, 2010. The state code is based on the 2009 IECC with state-specific strengthening amendments and is mandatory statewide. The commercial codes also reference ASHRAE 90.1-2007. The state also adopted the 2011 Georgia State Minimum Residential Green Building Standard, based on the 2008 National Green Building Standard (NGBS) with 2011 Georgia Amendments, as an optional code. It is available for local government adoption and enforcement.
4
2012 State Scorecard
135
State Summary of State Building Code Stringency Score
Hawaii
On October 13, 2009, the Hawaii Building Code Council approved the 2006 IECC with state-specific amendments as the mandatory statewide energy code for both the residential and commercial sectors. After over a year of work by the 2009 IECC subcommittee of the Hawaii Department of Business, Economic Development, and Tourism, the Hawaii Building Code Council has developed a proposal to update the Hawaii State Energy Conservation Code to the 2009 IECC with substantial state-specific strengthening amendments intended to serve as a model for warm weather areas worldwide. The effective date in each county was to be sometime during 2012, depending on when the state’s four counties introduce bills to adopt the code locally.
3
Idaho Effective January 1, 2011, the 2009 IECC is mandatory statewide for residential and commercial construction, the latter with reference to ASHRAE 90.1-2007.
3
Illinois
On August 17, 2012, Senate Bill 3724 was signed by Governor Pat Quinn, which amended the effective date of the adoption of the 2012 IECC to January 1, 2013. The Illinois Energy Conservation Code is mandatory statewide and applies to both residential and commercial buildings, the latter with reference to ASHRAE Standard 90.1-2010.
5
Indiana
On August 17, 2012, Senate Bill 3724 was signed by Governor Pat Quinn, which amended the effective date of the adoption of the 2012 IECC to January 1, 2013. The Illinois Energy Conservation Code is mandatory statewide and applies to both residential and commercial buildings, the latter with reference to ASHRAE Standard 90.1-2010.
3
Iowa The Iowa State Energy code is mandatory statewide for residential and commercial buildings. Residential buildings must comply with the 2009 IECC, while the commercial buildings must also comply with the 2009 IECC, with reference to ASHRAE 90.1 – 2007.
3
Kansas
Kansas has no statewide residential building code, though realtors and homebuilders are required to fill out an energy efficiency disclosure form and provide it to potential buyers. In April 2007, the 2006 IECC became the applicable standard for new commercial and industrial structures. Jurisdictions in the state are not required to adopt the code.
1
Kentucky
As of October 1, 2012, the 2007 Kentucky Residential Code (KRC) mandates residential buildings must comply with the 2009 IECC or IRC with state amendments. The 2007 Kentucky Building Code (KBC) states that commercial construction must comply with the 2009 IECC or the 2009 IBC with state amendments.
3
Louisiana
Residential buildings must meet the 2006 IRC with reference to the 2006 IECC. Effective July 20, 2011, ASHRAE Standard 90.1-2007 applies to all private commercial buildings built or remodeled as well as state-owned buildings. Multi-family residential construction must comply with the 2009 IECC.
2.5
Maine
The Maine Uniform Building and Energy Code (MUBEC) was established legislatively in April 2008 through P.L. 699. On June 1, 2010, the 2009 IECC and ASHRAE 90.1-2007 became mandatory for residential, commercial, and public buildings statewide, although enforcement varies by population. Towns with a population of less than 2,000 are not required to enforce the code. Towns with a population of 2,000 that had a building code as of August 1, 2008 were required to begin enforcing the new codes on December 1, 2010. Towns with a population of 2,000 but that did not have a building code as of August 1, 2008, will be required to begin enforcing the new codes on December 1, 2012. According to the Northeast Energy Efficiency Partnership, this exempts 50-60% of the state’s population for complying with building codes.
State Summary of State Building Code Stringency Score
Maryland
The 2012 Maryland Building Performance Standards are mandatory statewide and reference the 2012 ICC Codes, including the 2012 IECC, for all new and renovated residential and commercial buildings. § 12-503 of the Maryland Code requires the Department of Housing and Community Development to adopt the most recent version of the IECC within 12 months of its being issued; it may adopt energy conservation requirements that are more stringent than the codes, but not less. Maryland is a “home rule” state, so each of its 57 local jurisdictions may modify these codes to suit local conditions.
5
Massachusetts
As of January 1, 2010, the Massachusetts Board of Building Regulations and Standards (BBRS) requires the use of the 2009 IECC with state-specific amendments for both residential and commercial buildings, and also requires that the code be mandatory statewide. Massachusetts is required by the Green Communities Act of 2009 to adopt each new IECC edition within one year of its publication. In July 2009, Massachusetts became the first state to adopt an above-code appendix to its state code—the 120 AA ‘Stretch’ Energy Code. The ‘Stretch’ Code is an enhanced version of the 2009 IECC with greater emphasis on performance testing and prescriptive requirements. It was designed to be approximately 20 percent more efficient than the base energy code— the 2009 IECC for new construction, with less stringent requirements for residential renovations. The “Stretch” Code is voluntary.
4
Michigan
The 2009 Michigan Uniform Energy Code became effective March 9, 2011 and is mandatory statewide for residential and commercial buildings. Residential buildings must comply with the 2009 IECC, with state-specific amendments. Commercial buildings are required to comply with ASHRAE 90.1-2007.
3
Minnesota
Both Minnesota's residential and commercial building codes, the 2007 Minnesota State Building Code, are mandatory statewide. The residential code (Chapter 1322) is based on Chapter 11 of the 2006 IRC with amendments. The commercial code (Chapter 1323) is based on ASHRAE 90.1-2004 with amendments. The 2007 Minnesota State Building Code became effective June 1, 2009.
2
Mississippi
Mississippi's residential and commercial energy codes are voluntary, except for state-owned buildings, public buildings, and high-rise buildings. Mississippi's residential code is based on ASHRAE 90 – 1975 and the prior 92 MEC. The commercial code is also based on ASHRAE 90-1975.
0
Missouri
Missouri has no mandatory statewide codes but has significant adoption of codes in major jurisdictions. State-owned residential buildings must comply with the latest edition of the MEC or the ASHRAE 90.2-1993 (single-family and multifamily buildings). As of July 1, 2009, state-owned commercial buildings must comply with the 2006 IECC.
2
Montana
Montana's residential and commercial building codes—codified in the Administrative Rule s of Montana Title 24, Chapter 301.160—are mandatory statewide. Montana's residential code requires compliance with the 2009 IECC, with strengthening amendments. The commercial building code requires compliance with the 2009 IECC with reference to ASHRAE 90.1-2007.
3.5
Nebraska
Nebraska's residential and commercial energy codes, referred to as the Nebraska Energy Code, are mandatory statewide. Residential buildings are required to comply with the 2009 IECC. Commercial buildings must also comply with the 2009 IECC with reference to ASHRAE 90.1 – 2007. Two of the state’s largest code jurisdictions (comprising more than half of the annual new construction in the state) have expressed an interest in working with the state to adopt “stretch” codes beyond the 2009 IECC.
State Summary of State Building Code Stringency Score
Nevada
The 2012 Nevada Energy Code became effective July 1, 2012 and is mandatory statewide. The residential codes are based on the 2009 IECC with Nevada amendments. The commercial codes are based on the 2009 IECC with Nevada amendments, with ASHRAE Standard 90.1-2007 as an acceptable compliance path through Chapter 5 of the 2009 IECC. Local jurisdictions are not allowed to adopt less stringent energy codes.
3
New Hampshire
Effective April 1, 2010, the New Hampshire State Building Code for residential and commercial buildings is based on the 2009 IECC, with state-specific amendments. The commercial code is also based on the 2009 IECC with references to ASHRAE 90.1-2007. Both codes are mandatory statewide.
3
New Jersey
The 2009 New Jersey Uniform Construction Code for residential and commercial buildings is mandatory statewide. The residential codes are based on the 2009 IECC with state-specific amendments. The commercial codes are based on ASHRAE 90.1-2007 with state-specific amendments.
3
New Mexico The 2009 New Mexico Energy Conservation Code (NMECC) is based on the 2009 IECC with state-specific amendments for both residential and commercial building codes. ASHRAE Standard 90.1-2007 is an acceptable compliance path through Chapter 5 of the 2009 IECC.
3
New York
The 2010 Energy Conservation Construction Code of New York (ECCCNYS) became effective December 28, 2010, and is mandatory statewide for both residential and commercial buildings. The residential code is based on the 2009 IECC with state-specific amendments. The commercial code is also based on the 2009 IECC with state-specific amendments. The commercial codes can also follow ASHRAE 90.1-2007.
3
North Carolina
The 2012 North Carolina Energy Conservation Code (NCECC) is mandatory statewide for both residential and commercial buildings. The residential and commercial codes are based on the 2009 IECC, both with substantial strengthening amendments, while the commercial code also references ASHRAE 90.1-2007.
4
North Dakota
North Dakota is a “home rule” state and has no statewide mandatory energy codes. As of August 1, 2009, the 1993 MEC was removed as the voluntary state residential energy code and ASHRAE 90.1-1989 was removed as the voluntary state commercial energy code. The voluntary energy code has been placed under the purview of the North Dakota State Building Code and now the state Building Code Advisory Committee has the authority to make recommendations that could include energy standards in future editions of the State Building Code. Chapters 11 and 13 of the 2009 IRC and IBC are contingent upon adoption by local jurisdictions.
1
Ohio
Both Ohio's residential and commercial energy codes are mandatory statewide. Effective January 1, 2013, the residential code will reference the 2009 IECC. Residential home builders are also allowed to meet the requirements of sections 1101-1103 of Chapter 11 of the Residential Code of Ohio (based on Chapter 11 of the 2009 IRC) or by meeting the state code's new Prescriptive Energy Requirements (section 1104). In March 2011, the commercial code was amended to reference the 2009 IECC and ASHRAE 90.1-2007, and became effective November 1, 2011.
State Summary of State Building Code Stringency Score
Oklahoma
Oklahoma has in place mandatory statewide building energy codes for residential and commercial buildings. Until recently, the state had been a “home rule” state, but in June 2009, the Oklahoma Legislature passed a bill (SB 1182) creating the Oklahoma Uniform Building Code Commission that reviewed and recommended building codes (including energy codes) for residential and commercial construction for adoption. Beginning in October 2010, the Commission held several meetings discussing code change proposals. On March 31, 2011, the Commission formally recommended a residential code based on the 2009 IRC with Oklahoma amendments. The Legislature approved the rule, leading to the official adoption of the code on May 27. The statute became effective July 15, 2011.
2
Oregon
The 2011 Oregon Residential Specialty Code (ORSC) and the 2010 Oregon Energy Efficiency Specialty Code (OEESC) are mandatory statewide. The Oregon Building Codes Division issued a rulemaking in May 2011, effective July 2011, updating the residential code to the 2011 ORSC (from the 2008 ORSC), which is intended to achieve 10-15% greater savings than the 2008 ORSC, making it at least as stringent as the 2009 IECC. The OEESC is based on the 2009 IECC with state-specific amendments that make it more stringent than the 2009 IECC.
4
Pennsylvania
Both Pennsylvania's residential and commercial energy codes are mandatory statewide. Residential buildings must comply with the 2009 IECC or 2009 IRC, Chapter 11. Residential buildings can also comply with Pennsylvania’s Alternative Residential Energy Provisions (2009). Commercial buildings must also comply with the 2009 IECC, with reference to ASHRAE 90.1 – 2007. Legislation requires the Pennsylvania Department of Labor and Industry (DLI) to promulgate regulations adopting "a new triennial BOCA National Building Code, or its successor building code," and/or "a new triennial ICC International One and Two Family Dwelling Code" by December 31 of the year in which they are issued. However, on January 31, 2011, HB 377 was introduced that would amend the Uniform Construction Code Act of 199 to require a 2/3 approval for any code update proposals by the DLI, along with other weakening amendments to the codes. The bill was signed by Governor Tom Corbett on April 25, 2011 as Act 1.
3
Rhode Island
The 2010 Rhode Island One and Two Family Dwelling Code for residential buildings became effective July 1, 2010 and is based on the 2009 IRC with state-specific amendments. The 2010 Rhode Island State Energy Conservation Code for commercial buildings also became effective July 1, 2010, and is based on the 2009 IECC and ASHRAE 90.1-2007 with state-specific amendments. Both codes are mandatory statewide.
3
South Carolina
On January 1, 2013, the 2013 South Carolina Energy Standard will become effective. The residential provisions will reference the 2009 IECC. The commercial provisions will reference the 2009 IECC as well, including that code’s reference to ASHRAE Standard 90.1-2007 as an alternative compliance path. Until the effective date, the South Carolina Energy Standard will continue to reference the 2006 IECC for all new construction. Local jurisdictions may adopt more stringent energy codes.
3
South Dakota
South Dakota has no mandatory statewide energy codes for residential or commercial construction. Codes are adopted by jurisdiction voluntarily. As of July 2011, state law established the 2009 IECC as a voluntary residential standard. Local jurisdictions also have authority to adopt various residential building and energy codes, including IRC and IECC. For commercial construction, ASHRAE 90.1 or IECC compliance is required by reference in the 2012 IBC, which is the mandatory statewide commercial building standard in state law unless local jurisdictions have either opted out of it or specifically adopted another code.
1
2012 State Scorecard
139
State Summary of State Building Code Stringency Score
Tennessee
Tennessee is a “home rule” state, which gives local jurisdictions the power to adopt codes. On June 2, 2011, the Tennessee State Fire Marshal’s Office announced that it would begin the implementation and enforcement of adopted energy codes beginning July 1, 2011. These include ASHRAE Standard 90.1-2007 for all state buildings and the 2006 IECC for all other residential and commercial construction.
2
Texas
Texas' building codes are mandatory for both residential and commercial construction. Effective January 1, 2012, the Texas Building Energy Performance Standards were updated requiring single family homes to comply with the 2009 IRC. For all other residential, commercial, and industrial buildings, the 2009 IECC became effective April 1, 2011. State-owned buildings must meet ASHRAE 90.1-2007. For all buildings, jurisdictions can choose to adopt more stringent standards.
3
Utah
Utah’s Uniform Building Code (UUBC) for residential and commercial building energy codes is mandatory statewide. Residential construction must comply with the 2006 IECC. Commercial construction must comply with the 2009 IECC, with reference to ASHRAE 90.1-2007.
2.5
Vermont
Vermont’s 2011 Residential and Commercial Building Energy Standards (RBES and CBES) are mandatory statewide. Effective October 1, 2011, the RBES references the 2009 IECC with several strengthening amendments from the 2012 IECC. Effective January 3, 2012, the CBES references the 2009 IECC and ASHRAE Standard 90.1-2007 with several strengthening amendments from the 2012 IECC.
4
Virginia
Virginia’s Uniform Statewide Building Code (USBC) is mandatory statewide for residential and commercial buildings. As of March 1, 2011, the USBC was updated to reference the 2009 IECC and 2009 IRC. Residential buildings must comply with the 2009 IRC, while commercial buildings must comply with the 2009 IECC, with reference to ASHRAE 90.1-2007.
3
Washington
The 2009 Washington State Energy Code is a state-developed code that is mandatory statewide. The 2009 versions of the residential and commercial codes were developed to be substantially more stringent than the 2009 IECC and ASHRAE 90.1-2007. For residential construction covered by ASHRAE 90.1-2007 (high rise buildings with four or more stories), the state code is also more stringent.
4
West Virginia
West Virginia's residential and commercial building codes are mandatory statewide; however, adoption by jurisdictions is voluntary. Residential buildings are required to comply with the 2003 IECC and the 2003 IRC with amendments. Commercial buildings are required to comply with the 2003 IECC with amendments. On April 11, 2009, the West Virginia Legislature passed bills directing the State Fire Commission to promulgate rules adding the 2009 IECC and ASHRAE 90.1-2007. The updated codes have not yet become effective.
2
Wisconsin
Both Wisconsin's residential and commercial building energy codes are mandatory statewide. The state-developed residential code, referred to as COMM 22 of the Uniform Dwelling Code (UDC), is mandatory for one- and two-family dwellings and incorporates the 2006 IECC with state-specific amendments. The state-developed commercial code, referred to as COMM 63 of the Wisconsin Commercial Building Code, is based on the 2009 IECC.
State Summary of State Building Code Stringency Score
Wyoming
Wyoming's residential and commercial building codes are voluntary. Known as the ICBO Uniform Building Code, they are based on the 1989 MEC and may be adopted and enforced by local jurisdictions. Some jurisdictions have adopted more stringent codes than the voluntary standard: the 8 most populated cities and counties in Wyoming have an energy code that meets or exceeds the IECC 2006 or equivalent. Teton County and Jackson are moving to the IECC 2012 within the next month or two; Cheyenne adopted the IECC 2009; Casper, Rock Springs, and Gillette adopted a modified IECC 2006.
1
2012 State Scorecard
141
Appendix G: Summary of Building Code Compliance Efforts
State Summary of State Building Code Compliance Efforts Score
Alabama
Energy codes for private sector residential and commercial construction are enforced by local code officials in several jurisdictions. Many smaller jurisdictions currently have no code enforcement. Through a grant with Southface Energy Institute, the state energy office provided commercial and residential energy codes training for contractors, homebuilders, designers, code officials and policymakers. In addition, short–term grants with the Building Codes Assistance Project and Southface Energy Institute allowed for additional training of code officials on the newly adopted Alabama code, as well as development of checklists to assist with inspection and enforcement. Online training modules were developed for individuals who were unable to attend onsite training. Eleven code officials were also given additional training through the International Code Council’s (ICC) Energy Code Ambassador Program (ECAP) to provide them the tools needed to assisted code officials throughout the state with technical assistance and training as requested. Homeowners, homebuyers, and home inspectors also have access to guides and checklist to help them determine whether a home meets the new energy standards adopted for the state. The available resources can be accessed through the ADECA Energy Division website as well as the Online Code Environment & Advocacy Network (OCEAN).
ADECA and the Alabama Energy and Residential Codes Board will continue working with stakeholders in the construction industry in Alabama to seek ways to implement or increase enforcement in areas that currently have little or no enforcement. One solution being considered is to develop and execute interagency agreements between smaller jurisdictions with no enforcement and nearby jurisdictions that provide enforcement.
0.5
Alaska
While Alaska has no statewide energy code, all buildings that receive aid from the state of Alaska or the Alaska Housing Finance Corporation (AHFC) (including private mortgages) must meet the 2009 IECC codes with Alaska specific amendments. These buildings are fitted with energy rating systems to verify compliance. Currently roughly 50,000 of the 300,000 residences in Alaska are outfitted with these ratings systems. AHFC trains energy raters and home inspectors to monitor enforcement of these requirements.
0
Arizona
While Arizona has no statewide energy code, local communities have started adopting the 2012 IECC and many are planning to bypass the 2009 version of the code. The largest municipality in the state, Phoenix, has started the development/adoption process for the 2012 IECC (as of the publication date). Utility providers are working with code trainers, state energy office, and ICC chapters on training to the 2012 and 2009 IECC. During 2009 the state trained approximately 25 building industry professionals to become energy code trainers and funded many code officials to receive the ICC energy code certifications. As of September 2011 the state has 84 ICC IECC certified individuals.
State Summary of State Building Code Compliance Efforts Score
Arkansas
The latest study completed to measure compliance was published in 2006 by the Arkansas Economic Development Commission. Results indicated that compliance with the code is increasing but that more attention was needed in the colder, northwest part of the state. Enforcement is a major issue that varies with each jurisdiction. Enforcement is more common in larger cities with greater resources, but the focus of building inspections tends to be on structural integrity, fire, water, and safety. Builders and code officials periodically receive training on code compliance, typically through the Code Officials of Arkansas and the AR Economic Development Commission.
0.5
California
No studies have been conducted or funding identified to establish a baseline of compliance in California. Enforcement is at the local level and there are building departments in each of the 536 city and counties. Online training is available at www.energyvideos.com. Utilities, the California Energy Commission staff and local organizations and trade groups provide training to these building departments as well as to contractors and homeowners.
2
Colorado
The Governor’s Energy Office (GEO) completed the Building & Energy Code Survey Report, which presents the results of a July 2009 survey on building code enforcement and adoption, as well as a needs assessment for the types of code assistance desired in the 333 code jurisdictions. Results from the survey indicate that 80% of respondents (n=174) claim to be enforcing residential codes and 79% for commercial codes, though this is not a measure of compliance. Additional support was requested by 84% of respondents from the state energy office on energy codes. The GEO has provided over 125 trainings on the 2009 IECC during 2010 and 2011. A statewide program funded by ARRA, called the Energy Codes Support Partnership, was developed to educate all jurisdictions on the 2009 IECC and provide assistance in its adoption. The program trained code officials, government employees, and building trades on the 2009 IECC across the entire state and was updated to included information and resources for jurisdiction adopting the 2012 IECC. The state has also partnered with BCAP to form a compliance collaborative that includes a number government agencies and non-governmental organizations.
2
2012 State Scorecard
143
State Summary of State Building Code Compliance Efforts Score
Connecticut
In 2012, Connecticut is establishing a baseline for code compliance, as well as a process for identifying training needs and tracking compliance each year, to ensure that 90% of all projects built in 2017 are in compliance with the new energy code. The Office of Education and Data Management (OEDM), in conjunction with the Office of the State Building Inspector, is responsible for the training and licensing of building code officials. OEDM, with the assistance of ISE, conducted two surveys in the spring of 2010, one of local code officials and one of licensed building inspectors, to determine the areas of frequent code violations in both the residential and commercial sectors. These surveys helped to identify the training needs for the code officials and inspectors. Connecticut completed initial training programs for code compliance for both IECC 2009 and ASHRAE 2007. Throughout 2010 and 2011, OEMD provided all 169 local building officials and 450 licensed inspectors with three days (15 hours) of training on the target code offered through regional workshops with certified instructors from the International Code Council. Participants were also provided with code books and application workbooks reinforcing the residential, IECC 2009 and ASHREA 90.1 2007 target codes. Starting in late spring 2012, local code officials, working with ISE is conducting at least 44 residential and 44 commercial plan reviews utilizing the DOE state code compliance guidelines. During the summer and early fall, these same code officials will complete the site inspection of these 88 building utilizing site evaluations forms supplied by DOE. Data collected in DOE’s Score and Store software will be used to calculate the compliance percentage establish the Connecticut Code Compliance Baseline. Starting in the fall of 2012, the state of Connecticut will launch a formal assessment using third party certified energy auditors and Home Energy Rating System (HERS) raters to evaluate a statistically valid sample of buildings assessed in the baseline study to verify the compliance level determined by OEDM.
1.5
Delaware
The Delaware Division of Energy and Climate (DE&C), has legislative authority to review and adopt updated energy codes every three years. Given this leadership role, in partnership with BCAP the DE&C formed an Energy Codes Coalition in November 2011 as a platform for discussing code compliance and adoption and to inform the agency’s work in these areas. This stakeholder group includes home builders, building code officials, and contractors, as well as representatives from the American Institute of Architects, the Delaware Sustainable Energy Utility (SEU), and ASHRAE Delaware and regional chapter. The Building Codes Assistance Project (BCAP) and the Northeast Energy Efficiency Partnerships (NEEP) provide additional technical support to DE&C. The coalition will use the Delaware Strategic Compliance Plan as a roadmap to achieve 100% code compliance by 2017 and will also coordinate stakeholder input into future code adoption processes. There is a baseline study of residential building codes under way that will provide an assessment of residential code compliance in the state.
1
District of
Columbia
The codes are enforced by the codes division of the Department of Consumer and Regulatory Affairs (DCRA), which regularly trains its official on code updates. 1
State Summary of State Building Code Compliance Efforts Score
Florida
No studies have been conducted that attempt to measure compliance rates in the state, although the state plans to perform a study measuring the relative building performance between the implementation of the 2007 Florida Building Code and the 2009 Supplement. Enforcement is done at the local level by building departments with code clarifications issued by the Building Officials Association of Florida (BOAF), while Declaratory Statements are issued by the Florida Building Commission. Building departments receive training at the annual BOAF conference. Code officials and those in the construction industry are also required to take continuing education courses. The Florida Solar Energy Center has a contract to develop a Train-the-Trainer program and online web training to radically expand the number of persons qualified on Florida’s energy code.
1.5
Georgia
The most recent survey on compliance was conducted by the Department of Community Affairs in 2004, which showed that about 50% of counties were enforcing the Georgia State Energy Code, though the study did not actually measure compliance. Currently there is no organized training program, though a comprehensive statewide training program is expected to begin in late 2010. Local jurisdictions may request training from the Department of Community Affairs’ Construction Codes program.
1.5
Hawaii
The last study completed that measured compliance was done in 1999 and determined a compliance rate of 89%. Each of the four counties in Hawaii has a Building Division within the Public Works departments. State government buildings and military housing may voluntarily comply with the county codes. Code training was provided to approximately 130 government employees and 130 private sector design professionals in all four counties in March, 2012 in light of the code updates.
1
Idaho
The last study measuring compliance in Idaho was conducted in 2008 and was based on the 2001 Idaho energy code, which at the time followed the 1997 Uniform Building Code. At the time, compliance was measured at 88%. Training is scheduled each year through the Idaho Building Official Association (IDBAO). The IDABO also holds a two-day course on IECC training every January while the Idaho Energy and Green Building Conference every October also has a two-day training course. In 2010 there will be six educational seminars for builders, designers, and code officials that will provide continuing education credits for members of the American Institute of Architects and IDBAO. Idaho partnered with BCAP to from the Idaho Energy Code Collaborative, comprised of state, county, and city representatives, as well as energy code advocates and other interested stakeholders.
2
Illinois
Illinois recently completed a compliance study using a grant from the Department of Energy and contracting through the Midwestern Energy Efficiency Alliance; results were due in August 2011. Enforcement of codes is mandatory under state law and is carried out by local authorities. Training is provided by the Illinois Department of Commerce and Economic Opportunity through funding from the International Code Council.
1
Indiana
There are no recent studies that have attempted to measure compliance rates with the Indiana Energy Conservation Code. Codes are enforced at the state and local level for all buildings except single and dual-family dwellings, which are enforced only at the local level. Code officials receive training through the Division of Fire and Building Safety of the Indiana Department of Homeland Security. The Indiana Builders Association also provides training, and the Indiana Office of Energy and Defense Development has offered training sessions to several groups as well.
0.5
2012 State Scorecard
145
State Summary of State Building Code Compliance Efforts Score
Iowa
Enforcement takes place at the state and local levels. The Iowa State Building Code Bureau is currently conducting a compliance study with the assistance of the U.S. Department of Energy. A recent grant from the American Recovery and Reinvestment Act from the Iowa Office of Energy Independence to the Iowa Department of Public Safety allows for the hiring of an engineer to start a more active approach to energy code enforcement in Iowa. Through an outside vendor contracted by the Building Code Bureau, energy code inspections are conducted throughout the state. These inspections include plan reviews, onsite compliance checks during construction, and final inspections, which include reviews and compliance of various efficiency measures. There is no mandatory training program in Iowa, but the Iowa Association of Building Officials (IABO) provides several seminars each year on a variety of code enforcement topics. Investor-owned utilities also provide some energy code training throughout the year. The State Building Code Bureau and IABO hosted three two-day seminars throughout the state in the summer of 2010, which provided specific energy code training to all code officials on the 2009 IECC. Iowa Department of Public Safety has also begun to offer local training sessions. The Iowa Department of Public Safety also gets an allocation from the U.S. Department of Energy’s State Energy Program formula annual award through the Iowa Economic Development Authority to strengthen and enforce its building codes program and provide long-term sustainability to the program.
1.5
Kansas
Local jurisdictions are responsible for enforcing all local codes including building energy codes. Beginning in 2012, the state’s Energy Division will develop methodologies to assess and measure compliance rates in those jurisdictions that have already adopted the 2009 IECC. These methodologies will also address compliance rates in residential and commercial retrofits. The Energy Efficiency Building Codes Working Group was set up in 2009 to ensure compliance with federal guidelines surrounding stimulus funds and plans to address the need for code training, the level of which varies across jurisdictions. Currently, the state does not play a direct role in training codes officials and builders about codes. In 2010 the Kansas Energy Office surveyed 55 Kansas cities and counties in an attempt to better understand the enforcement of the codes throughout the state. Results were mixed and did not reveal a specific percentage of compliance. The Kansas Corporation Commission’s Energy Division will update its summary of Kansas jurisdictions (the 55 cities and counties that taken together account for over 90% of the state’s residential construction activity) and publish the findings in the Status of Residential and Commercial Building Codes in 55 Jurisdictions by the end of 2012. This summary enables the state to continue to assess the current status of energy codes adoption.
0.5
Kentucky
There are no recent studies that have attempted to measure code compliance in Kentucky. Enforcement is done at the state and local level by building inspection departments. The Department of Housing, Building, and Construction co-sponsored 20 days of training in 2008, while the efforts of several independent groups likely increased that to 30 days.
State Summary of State Building Code Compliance Efforts Score
Louisiana
There are no recent studies that have attempted to measure code compliance in Louisiana. Enforcement of the residential code is done by the Certified Building Official in each of the 64 parishes. Commercial codes are enforced by the Office of the State Fire Marshal. Code officials receive training through the International Code Council seminars and online courses. The Technology Assessment Division (TAD) travels statewide offering instruction on code software targeted towards designers, builders, code officials, architects, engineers and building owners, courses that qualify for continuing education credit. In 2009, 412 individuals attended TAD training programs. Building inspectors are trained through the Department of Natural Resources.
1
Maine
A study on compliance was conducted by the Maine Public Utilities Commission in 2008, though a copy of the study cannot be found on their website. Only towns with more than 2,000 residents are required to enforce the 2009 IECC. A training and certification program was launched simultaneously with the building energy code changes. All code officers are required to be certified and training is provided free of charge. Builders, architects and others are not required to be certified, but are encouraged to attend the training on a fee basis.
0.5
Maryland
In February 2012 the Maryland Energy Administration funded a study of local building codes and inspection offices as part of the state’s plan to reach 90% energy code compliance. The study found that several code officials believe that 100% of the permitted construction in their jurisdiction is compliant with the 2009 IECC and almost one-third feel that 90% complies. Maryland is now embarking on an ambitious plan to drive energy code compliance statewide. A large component of this plan is aimed at training code officials, builders and design professionals. Codes are enforced by each local jurisdiction through its Department of Codes Enforcement and Permits and Inspections. Approximately 900 building inspectors from every jurisdiction, along with 400 architects and 300 building contractors are trained every year through the Department of Housing and Community Development.
0.5
Massachusetts
A study in 2011-2012 of commercial building energy code compliance is nearing completion. This complements a two-part study on residential building energy code compliance that sampled 40 homes built to the 2006 IECC, 40 homes built to ENERGY STAR (over a third of new construction), and another 40 built to the newer 2009 IECC. Results will be published the latter half of 2012. The Board of Building Regulations and Standards (BBRS), Department of Energy Resources (DOER) and other partners are planning a pilot evaluation of residential energy performance and code compliance that will inform how states determine code compliance rates. Enforcement is performed by local building code officials. In the 107 towns and cities that have elected to adopt the state’s “stretch” energy code, enforcement of the building energy code is greatly assisted by the integrated role of HERS raters in the statewide New Homes with ENERGY STAR program. The BBRS has technical staff that provides advice and training to local code officials and works with regional organizations of local code officials to discuss enforcement issues. The state requires that all code officials fulfill a set of certification requirements in all aspects of construction and code enforcement, which includes continuing education through certified courses. The Green Communities Act requires the BBRS and the DOER to develop specific energy efficiency training and certification for all local code officials. Consequently, the DOER sponsored over 40 trainings in 2011 on three related themes: “Smart Building” training for residential contractors and code officials, trainings on best practices for deep energy retrofits, lessons learned from the statewide pilot, and on HVAC best practices.
2
2012 State Scorecard
147
State Summary of State Building Code Compliance Efforts Score
Michigan
There are no recent studies that have attempted to measure code compliance in Michigan. Enforcement is under the auspices of the state government as established by the Stille-DeRossett-Hale Single State Construction Code Act, but governmental subdivisions may exempt themselves from state enforcement by setting up an enforcement agency themselves. Code officials are required to receive continuing education under the Building Officials and Inspectors Registration Act. A number of code official organizations provide regular training throughout the state. The Bureau of Construction Codes also provides code training.
0.5
Minnesota There are no recent studies that have attempted to measure code compliance in Minnesota. Enforcement takes place at the local level. Training is provided in the spring and fall by the Department of Labor and Industry.
1
Mississippi Because Mississippi has no statewide building energy codes, all residential and commercial codes are enforced at the local jurisdictional level. However, the Mississippi Development Authority’s Energy Division has recently held workshops on building energy codes.
0
Missouri We currently have no information on compliance rates in Missouri. 0.5
Montana
The Building Codes Bureau in the Department of Labor and Industry (L&I) is responsible for compliance checks within the commercial sector. The last study measuring compliance in Montana was conducted in 2008 by the Northwest Energy Efficiency Alliance and was based on the code enforced in 2001, which was ASHRAE 90.1-1989. At the time, compliance was measured at 47%. A residential code compliance study is currently underway; results were to be available by November 2011. A residential code compliance study is currently underway with results due in the Fall of 2011. The Montana Department of Labor and Industry (L&I) coordinates code adoption and enforcement, although the residential energy code is enforced by the 46 local jurisdictions and most major cities enforce the energy code within their city limits. Builders are required to meet code requirements and show compliance through a builder self-certification process. Residential projects built outside of building code jurisdictional areas are not inspected, but the state provides information to builders on how to comply with code standards. L&I enforces compliance for commercial buildings and residences of more than five units that are located outside of jurisdictional areas. L&I provides some training, but the Department of Environmental Quality (DEQ) provides more training support in the form of workshops and onsite training sessions to code officials and builders. DEQ also participates with the state Building Codes Bureau in an annual code training conference on all ICC codes.
State Summary of State Building Code Compliance Efforts Score
Nebraska
Nebraska completed a baseline compliance study of 100 homes across the state comparing actual construction to requirements of the building energy code, modeled on the study performed by Pacific Northwest National Laboratory. Local jurisdictions that adopt and enforce an energy or thermal efficiency code are required by statute to adopt a code that meets or exceeds the minimum requirements of the Nebraska Energy Code. Otherwise, enforcement of the code falls to the Nebraska Energy Office. Since 2004, the Nebraska Energy Office has provided energy code compliance and education opportunities across the state. More than 1,100 members of the state’s construction industry have been trained on the code requirements. In 2011, eleven trainings were provided by ICC, ASHRAE and other members of the building science community. Three ResCHECK and three ComCHECK workshops were held in 2012 for over 120 attendees. The agency has provided free copies of the 2009 IECC code books, 2009 IECC/ASHRAE combo code books, 2009 Inspector Guides and other enforcement tools to all code jurisdictions. The Nebraska Energy Office is hosting a regional energy codes conference in Omaha October 16-18, 2012. The conference will present practical how-to content, best practices and thought-provoking ideas, all with a focus on how states and local code jurisdictions can achieve compliance with the 2009 and 2012 International Energy Conservation Codes.
1
Nevada
A Gap Analysis study was completed in 2011 which looks into the current state of code implementation and offers suggestions to increase compliance. New Hampshire provided support to local jurisdictions under ARRA funding to pilot the BECP developed compliance tools to learn how local jurisdictions will/can use the tools and what time and expense it will cost the local jurisdictions. The NV State Office of Energy also partnered with BCAP to develop an energy codes collaborative for the state, which first met in April 2012, and has also named seven Code Ambassadors.
1
New Hampshire
A Gap Analysis study was completed in 2011, which looks into the current state of code implementation and offers suggestions to increase compliance. The state is also in the process of conducting a statewide compliance study. Building codes are enforced at the local level by the municipality with the Public Utilities Commission (PUC) reviewing applications for many cities and towns. In 55 of New Hampshire’s municipalities, the fire department handles building code enforcement, focusing mainly on life-safety issues. The PUC, in coordination with the state’s regulated electric utilities, GDS Associates, and the state Office of Energy and Planning, conduct energy code trainings in the fall and spring that are designed to teach builders, designers, engineers, and building officials how to build to code and beyond. New Hampshire has also increased outreach and training to “nontraditional” audiences, such as realtors, appraisers, lenders, and insurers. The Office of Energy and Planning (OEP) has developed a program on Building Code Compliance using stimulus funds to develop and implement training programs for code officials to achieve 90% verifiable compliance by 2017, titled the New Hampshire Building Energy Code Compliance Roadmap. The OEP has also partnered with BCAP to develop the NH Building Energy Code Compliance Collaborative, which will advance compliance in the state guided by recommendations from the compliance roadmap.
1.5
New Jersey
There are no recent studies that have attempted to measure code compliance in New Jersey. Enforcement is done at the local level through permits and inspections. Code officials are required to take continuing education courses, and license renewal through the Department of Community Affairs is required every three years.
State Summary of State Building Code Compliance Efforts Score
New Mexico
There are no current studies that have attempted to measure code compliance in New Mexico. Codes are enforced by the New Mexico Regulations and Licensing Department and by local governments. Code officials receive training through the Construction Industries Division on a regular basis. Stimulus funds were used to ramp-up these training programs.
0.5
New York
The New York State Research and Development Authority (NYSERDA) completed a compliance assessment in 2011 that tested U.S. Department of Energy protocols to determine whether New York State’s new and renovated residential and commercial buildings exceed the 90% compliance threshold that states will be required to meet by 2017 as part of the ARRA legislation. While the report found that the compliance rate for buildings built under the ECCCNYS-2007 is below 90%, it is anticipated that compliance in future years will increase as result of training currently being provided as described below. Building energy codes are enforced at the local level by municipalities through the process of building permitting and inspection. Code officials are required to complete annual code update training, which includes a training component specific to the energy code. Additional training is being offered through NYSERDA, in conjunction with the New York State Department of State, to code officials and other participants in the building construction community.
2
North Carolina
There are no recent studies that have attempted to measure code compliance in North Carolina. Enforcement is the obligation of local jurisdictions through the permit/inspection process for new construction and additions. The North Carolina Department of Insurance is responsible for the general supervision statewide. Appalachian State University and Mathis Consulting have coordinated to put together over 30 workshops over the past three years, targeting training for specific jurisdictions. ARRA recovery grants were given to the Building Fire and Code Academy (BFCA) to conduct approximately 40 trainings on the updated NC energy code with code officials across the state. These trainings took place from 2011 to the beginning of 2012. The Department of Insurance also provides training as a part of its annual workshops for building inspectors and mechanical inspectors.
1
North Dakota We currently have no information on compliance rates in North Dakota. 0
Ohio
The Ohio Energy Office conducted a study measuring enforcement in 2005, although there are no recent studies that have attempted to measure code compliance. The Ohio Board of Buildings Standards (BBS) adopts statewide energy codes and certifies the building departments and the personnel working for the departments throughout the state who enforce the codes. Code officials are required to take 30 hours of continuing education every three years to maintain their certification. There are other optional energy code courses that have been approved by the BBS so that the code officials can receive continuing education credits to be used to fulfill their 30-hour requirement, which includes an online energy code course.
0.5
Oklahoma
There are no recent studies that have attempted to measure compliance rates in Oklahoma. Because Oklahoma is a “home rule” state, the onus for enforcement falls on the municipality that has adopted an energy code. Code officials are trained by the Oklahoma Construction Industry Board (CIB). The Inspectors Examiners Committee has the authority to assist the CIB in establishing licensing, performance, continuing educations and other requirements for inspectors. Because Oklahoma has not yet adopted statewide energy codes, training is coordinated by municipalities.
State Summary of State Building Code Compliance Efforts Score
Oregon
In 2011, the Building Codes Division (BCD) conducted a preliminary “90% compliance study” through the Northwest Energy Efficiency Alliance to review compliance and quality of energy codes in the state. Results have not yet been put into a final report format. A study on compliance in Oregon was conducted in 2008 by the Northwest Energy Efficiency Alliance (NEEA) and was based on the code enforced in 2001. At the time, compliance was measured at 93%. The Oregon Building Codes Division Enforcement Program works with local jurisdictions to emphasize proper compliance. All jurisdictions are required to perform plan review, inspections and enforcement – without the ability to amend the state promulgated codes. BCD provides guidance and statewide interpretations to ensure consistent enforcement of the code throughout the state. All building officials are required to be certified by the state and must complete 16 hours of continuing education every three years. A variety of training formats and venues are made available directly through BCD and others through partners such as the Oregon Building Officials Association (OBOA) and Oregon Homebuilders Association (OHBA). In addition, NEEA has developed and is presenting a modified version of the BCD energy code training.
2
Pennsylvania
There are no recent studies that have attempted to measure compliance rates in Pennsylvania. Enforcement is done by certified individuals who are either state employees, municipal employees or who work for certified third-party agencies that have been retained by municipalities. Code officials receive training in anticipation of passing the exams required to obtain initial certification and must engage in continuing education.
1
Rhode Island
Rhode Island is in the process of doing a baseline compliance study for the state with the investor-owned utility National Grid. Enforcement is done by the code officials in local jurisdictions, while the State Building Commissioner enforces the code for all state buildings. The Rhode Island Department of Administration has recently set up a schedule for mandatory training for building officials.
1
South Carolina
South Carolina recently completed a gap analysis, analyzing the current code implementation efforts in the state and making recommendations for achieving 90% compliance with the model energy code. The state also participates in BCAP’s Compliance Planning Assistance Program and completed a compliance plan in November 2011, providing a five-year roadmap for energy code implementation in the state. Extensive compliance training was conducted in SC during 2011. Under a grant from Pacific Northwest National Laboratory, approximately 500 code officials and others received training on the 2006 (with elements of 2009 and 2012) Code. Additionally, joint training for building code officials and homebuilders will be held at 8 locations around the state beginning in September 2012.
1
South Dakota
I In pursuance of ARRA requirements, the state completed a report that lists recommendations for maximum compliance. In addition, in partnership with BCAP’s Compliance Planning Assistance program, a gap analysis was completed in January 2011 to analyze code adoption and recommend actions to achieve higher compliance. However, no studies measure compliance rates in the state. Enforcement is done at the local level. The Office of the State Engineer does contractually require building energy code compliance for state owned building projects. State government is not involved in training of local code officials or builders.
0
2012 State Scorecard
151
State Summary of State Building Code Compliance Efforts Score
Tennessee
No studies have been completed to measure compliance rates in the state. The Tennessee Department of Commerce and Insurance has the authority to enforce residential energy codes and has conducted training for staff and local governments. Energy Codes Training and Enforcement programs are underway at the Tennessee Codes Enforcement Academy and the Department of Commerce and Insurance is in the process of establishing a website for online code training, which will include energy code compliance. The Department has provided over 1,400 hours of IECC training for 235 code officials and has also initiated a web-based “Codes College” to provide computer-based codes training, particularly energy codes training, to officials and homebuilders. The University of Tennessee Municipal Technical Advisory Service (MTAS) also provides additional free energy codes training on campuses across the state as well as online webinar training on energy codes to local governments and enforcement officials at no cost to participants.
1
Texas
In 2011, Texas BCAP released a study on compliance in the state that found uneven performance and presented a range of ideas to improve compliance. Texas is a home rule state, so enforcement is done by local jurisdictions. Local jurisdictions also decide the code compliance training requirements for their code officials. The State Energy Conservation Office (SECO) is in charge of code compliance for state-owned buildings. Builders are not required to take training since the Texas Residential Commission was dismantled. City building officials have to keep their certifications by continuing education credits, but it is not mandated by the state. SECO has also partnered with BCAP to establish a building energy code collaborative, which includes a number of governmental agencies and non-governmental organizations.
0.5
Utah
Utah participated in a compliance pilot study in 2011 using Pacific Northwest National Lab methodology that showed, with limited numbers), compliance above 85% for residential buildings. Local jurisdictions are obligated to enforce the adopted state codes.
The Utah State Energy Program has been conducting energy code education since 2007. The free trainings have been made available across the state in more than 40 half- or full-day sessions. The free trainings were scheduled to continue in 2010 with an additional 8 full-day sessions, 7 hour-long webinars, and up to 4 special presentations for industry association meetings. The Office of Energy Development continues to provide training through Utah utility DSM funding. Additionally, grant funds from DOE/PNNL have allowed for increased training and personnel in 2011. As a result, the state has increased the number of ICC Certified individuals from 15 to 83, has trained 14 Energy Code Ambassadors, and has three energy code trainers trained through the Southwest Energy Efficiency Project’s coordinated energy code trainer curriculum by Pacific Northwest Laboratory. The governor’s 2011 energy plan includes increased energy code education as a way to raise public awareness and to treat energy efficiency as a resource. Lastly, the Utah Building Energy Efficiency Strategies Partnership (UBEES), an ARRA funded program, established a monthly “Code Compliance Capitol Morningsides Trainings”. These two hour trainings are available as a webcast or in person and have received numerous ENERGY STAR awards.
State Summary of State Building Code Compliance Efforts Score
Vermont
There are no current studies that have attempted to measure compliance rates in Vermont, but the Vermont Department of Public Service (DPS) is including measurements of compliance with the Residential Building Energy Standards (RBES) and Commercial Building Energy Standards (CBES) in their current Market Assessments to be completed in 2012. Both residential and commercial certifications are required to be filed with the DPS. Residential certifications must also be filed with the municipal government. The DPS also provides training to builders in conjunction with the Department of Public Safety. Efficiency Vermont, the state sustainable energy utility, also holds trainings. There are no code officials in the state.
1
Virginia
A statewide building compliance study was scheduled to be completed by June 2012. Enforcement is done by local building departments. The Department of Housing and Community Development conducts three days of code training every three years for the new codes and any changes. Local seminars occur more frequently. Each technical assistant goes through three days of training for each certification held, and all must take 16 hours of continuing education every two years.
1.5
Washington
The last study measuring compliance in Washington was conducted in 2008 by the Northwest Energy Efficiency Alliance and was based on the code enforced in 2001, which was based on ASHRAE 90.1-1999. At the time, compliance was measured at 94%. Enforcement is done through local jurisdictions. Training is up to local jurisdictions, where local trade associations and code chapters provide training for their members. Typically energy code trainings are contracted to Washington State University and the Northwest Energy Efficiency Council for instructors, and the Washington Association of Building Officials (WABO) offers some training sessions each year.
2
West Virginia
There are no current studies that have attempted to measure compliance rates in West Virginia. Enforcement is done by local planning offices throughout the state. The West Virginia Division of Energy has historically provided the only energy code training in the state. However, WVDOE has recently contracted with West Virginia Northern Community College to provide training on the state’s current energy codes, the 2003 IECC, as well as on the planned update to the 2009 IECC to home builders across West Virginia. These training sessions began in May 2012.
1
Wisconsin
There are currently no studies that have attempted to measure compliance rates in Wisconsin due mostly to statewide requirements for inspection of all new buildings. However, the state did receive funding from the Department of Energy to implement a pilot study of compliance in commercial buildings. The study found that new commercial buildings were typically over 90% in compliance with the current commercial building code (at that time the 2006 IECC with Wisconsin amendments as addressed under SPS 363). All licensed UDC and Wisconsin Commercial Building Inspectors are required to obtain continuing education credits in order to renew their license. Each late winter/early spring, the four inspector associations put on training, but it is not mandatory. The Department of Safety and Professional Services offers various training courses throughout the year, which are also not mandatory. Some courses are available online, others are addressed by organizations such as Wisconsin Focus on Energy, Energy Center of Wisconsin, Wisconsin Builders Association and others.
1.5
2012 State Scorecard
153
State Summary of State Building Code Compliance Efforts Score
Wyoming
There are no current studies that have attempted to measure compliance rates in Wyoming. Local jurisdictions that are established as local enforcement may, but are not required to, enforce energy codes at the local level. The State Energy Office (SEO) has funded numerous trainings for code officials, industry, and elected officials since 2010, as well as an energy code train-the-trainer in Cheyenne with six Wyoming code officials in attendance. As a result of a partnership between the SEO and the Wyoming Conference of Building Officials, a 2009 Energy Codes Fundamentals course was held around the state. The SEO contracted with ICC to conduct those trainings. As a follow-up the SEO requested that ICC customize two one-day courses focused toward the designer and contractor communities that were held in June of 2011. The Wyoming Conference of Building Officials has formed an energy code subcommittee and is working across the state on energy code education. Additionally, two Wyomingites attended the sequel train-the-train for plan review and inspection. Three code officials are designated as ICC/BCAP Energy Code Ambassadors who are trained to train others on the energy code throughout 2012 and 2013. The state has agreed to partner with Rocky Mountain Power who has been asked to provide additional funding for adoption and compliance assistance.
The Cold Climate Housing Research Center (CCHRC), which represents 1,200 building industry organizations in Alaska and has a staff of 26, conducts applied research, development, and demonstration on sustainable, energy-efficient and healthy buildings. The Center’s Research and Testing Facility first opened in 2006 after receiving $5.2 million in public and private funding. The Alaska Energy Authority (AEA) oversees the Emerging Energy Technology Fund (EETF), which concentrates heavily on energy efficiency technologies. The Fund, which received $2.4 million in state appropriations in 2011 in addition to private contributions, provides grants to entities that perform research to develop or improve energy-efficient technologies.
2
Alabama
The University of Alabama’s Center for Advanced Vehicle Technologies (CAVT) assists in the research and development of numerous transportation systems and vehicles, and has a faculty and staff of 30. Their efficiency research is primarily focused on improving powertrains as well as energy storage and fuel cells.
1
Arizona
The Sustainable Energy Solutions (SES) Group of Northern Arizona State provides research, development, and demonstration of new as well as improved energy technologies and systems, including those focused on efficiency. The Group is funded by the Arizona Technology Research and Initiative Fund as well as an average of $400,000 per year in external funding. Arizona State University’s LightWorks Center is focused in part on energy efficiency, including research into solid state lighting as a way to reduce energy costs as well as the interaction of human behavior and energy-efficient technologies.
2
California
The California Energy Commission's Public Interest Energy Research (PIER) program supports research and development in several key areas including energy efficiency for buildings, industry, agriculture, and water systems. PIER is funded from a surcharge on electricity and natural gas use in the state that totals about $80 million per year. UC Davis houses the Center for Water-Energy Efficiency (CWEE) and the Energy Efficiency Center (EEC). CWEE focuses on the research and development of efficient technologies that will lead to the conservation of water and energy resources. CWEE has a permanent staff of three and receives funding from the EEC, the California Lighting Technology Center, and the Western Cooling Efficiency Center. The EEC’s mission is to accelerate the development and commercialization of energy efficiency technologies. It has a faculty and staff of 25 and received initial funding from the California Clean Energy Fund. The Center for Energy Science and Technology Advanced Research (CESTAR) at UCLA, with a faculty and staff of 42, includes energy efficiency as one of its four major research areas. The Smart Grid Energy Research Center (SMERC) also performs research into the development of the next generation of the electric utility grid, with one of their criteria being improving its efficiency. SMERC has a faculty and staff of 13 and is funded by a $10 million grant from US DOE.
The Engines and Energy Conversion Lab (EECL) at Colorado State University contributes to energy efficiency in their research on smart grid technology and engine efficiency, primarily in advanced ignition systems and after-treatment systems. EECL has a staff of 22 and is funded through numerous corporate sponsors. The Institute for the Built Environment (IBE) at Colorado State University engages faculty and industry partners in healthy and sustainable building issues including energy-efficient construction, integration of clean energy technologies and sustainable built environments. The Renewable and Sustainable Energy Institute (RASEI) at the University of Colorado, Boulder is a joint institute with the National Renewable Energy Laboratory (NREL) to research and develop ways to produce energy at a lower cost, with higher efficiency, and with reduced emissions. RASEI has 16 staff and 30 fellows. The Research in Delivery, Usage, and Control of Energy (ReDUCE) research group at the Colorado School of Mines includes energy efficiency projects such as the Cyber-Enabled Efficiency Energy Management of Structure, sponsored by the National Science Foundation, which concerns the sensing and control of energy flow in buildings, as enabled by cyber infrastructure. The Center for Renewable Energy Economic Development (CREED) is a catalyst for economic development in Colorado through clean energy and energy efficiency innovation and entrepreneurship. CREED is a product of the National Renewable Energy Lab and partners with state government agencies such as the Governor’s Energy Office and the Office of Economic Development and International Trade and industry groups such as the Colorado Cleantech Industry Association.
2
Connecticut
The University of Connecticut’s Center for Clean Energy Engineering (C2E2) focuses on advanced energy conversion technologies, fuels and fuel processing, energy storage, power management and smart grid and conservation of natural resources with a focus on water. The Center was founded in 2009 and received over $20 million in funding by March 2011. It has a staff of 21 that includes 17 researchers.
1
Florida
The University of Central Florida’s Florida Solar Energy Center's (FSEC) building science program includes energy efficiency research relating to buildings, schools, and green standards. The Center has a staff of 150 and receives $3 million in operating funds annually from the University and $8-$12 million in external grants. The Energy and Sustainability Center (ESC) at Florida State University focuses on energy efficiency projects including the Center’s Off-Grid Zero Emission Building project, which created an energy-efficient mold for alternative energy technologies in both residential and commercial buildings, and research focused on both PEM fuel cells and water electrolysis. The center has a staff of seven and receives funding from the University. The University of Florida’s Florida Institute for Sustainable Energy (FISE) performs efficiency research that focuses on fuel cells, building construction, and lighting. The Institute has a faculty of over 150 spread among 22 energy research centers and its funding over the past several years has totaled $70 million.
2
2012 State Scorecard
157
State Major RD&D Programs Score
Georgia
Funded in part by the Georgia Environmental Finance Authority, the Southface Energy Institute, with a staff of almost 50, conducts research and training on energy-efficient housing and communities. The Georgia Environmental Finance Authority collaborates with the Institute on its weatherization training and technical assistance. At the Georgia Institute of Technology, the Brook Byers Institute for Sustainable Systems (BBISS) focuses on engineering water and power infrastructures, and the Institute’s current efficiency-based research is focused around its Sustainable Infrastructure for Energy and Water Systems (SINEWS) Project funded by the National Science Foundation. This project has secondary teams from Arizona State University and the University of Georgia and has a total staff of 11.
2
Idaho
The Center for Advanced Energy Studies (CAES) is a partnership between Idaho National Laboratory and the State of Idaho through its three public research universities: Boise State University, Idaho State University, and the University of Idaho. The Center performs research on energy efficiency as well as a variety of other issues, and receives funding from the State of Idaho, U.S. DOE, and a variety of private and public customers. Most recently it received $5 million in three research grants from U.S. DOE to focus on solar energy, geothermal energy, and energy efficiency.
1
Illinois
The University of Illinois at Chicago’s Energy Resources Center (ERC) focuses on energy conservation and production technologies and assists both private and public institutions at the local and state levels by identifying opportunities for improved efficiency and reduced utility bills. The Engineering Solutions Group has a dedicated staff of four of the Center’s 16 personnel. The Center receives funding from the University, a variety of public and private clients, and sponsorships from Amoco Foundation, Commonwealth Edison, the Electric Power Research Institute, People’s Energy Corp., and Nicor Inc.
1
Iowa
The Iowa Energy Center strives to advance efficiency and renewable energy within the state through research and development while providing a model for the state to decrease its dependence on imported fuels. The Iowa Energy Center has a staff of 12 and receives its funding from an annual assessment on the gross intrastate revenues of all natural gas and electric utilities in Iowa.
1
Kansas
Studio 804, Inc. is a nonprofit 501(c)(3) corporation that works in partnership with the University of Kansas’ School of Architecture, Design, and Planning, and is committed to the continued research and development of sustainable, affordable, and inventive building solutions. For the last 16 years, Studio 804 has pioneered new technologies and advanced construction techniques including four LEED Platinum projects, including the Sustainable Prototype in Greensburg, Kansas.
1
Kentucky
The Conn Center for Renewable Energy Research (CCRER) at the University of Louisville leads research that increases homegrown energy sources to meet the national need while reducing energy consumption and dependence on foreign oil. The Center has nine full-time staff and partners with over 60 faculty members at universities across the state, and has steadily been increasing its annual research expenditures from $900,000 in 2007 to $2.1 million in 2011 with the goal of reaching $5 million by 2016.
The University of Maryland Energy Research Center (UMERC) is dedicated to the development of energy-efficient and environmentally sustainable technologies and practices and leads one of the U.S. DOE Energy Frontier Research Centers focused on energy storage. UMERC also educates the public on matters of energy efficiency and sustainability, and focuses specifically on heating, ventilation and air condition (HVAC), combined heat and power, lighting and building efficiency, and waste heat recovery. UMERC and its affiliated faculty receive funding from the University of Maryland, U.S. DOE, and a variety of other sources based on research topic.
1
Massachusetts
Massachusetts Energy Efficiency Partnership (MAEEP) supports demonstration of energy efficiency technology and tools to the industrial, commercial, and institutional sectors. The MAEEP program leverages resources from U.S. DOE, the University of Massachusetts and Massachusetts Electric Utilities, NSTAR, MECO and WMECO, in partnership. Massachusetts is also offering High Performance Green Building Grants administered by the Massachusetts Department of Energy Resources to demonstrate innovative ways to improve energy performance in various types of buildings. The grants will use $16.25 million of American Recovery and Reinvestment Act (ARRA) funds to leverage an additional $42.5 million from grant recipients. The state’s program administrators also have a number of deep energy retrofits and behavioral pilot programs. The Center for Energy Efficiency and Renewable Energy (CEERE) at the University of Massachusetts, Amherst focuses on renewable energy resources, energy efficiency in buildings, industrial energy efficiency, and environmental technologies with unique abilities to service energy and environmental problems. The Center has 43 faculty and staff and is funded in part through U.S. DOE grants.
2
Michigan
The Michigan NextEnergy Center is a 501(c)(3) nonprofit organization focused on energy efficiency and battery storage that leases laboratory facilities, business incubator space, and other facilities to members of the state's alternative energy industry. As part of a “renaissance Zone,” businesses within the NextEnergy Center may be eligible for tax benefits in addition to the numerous tax credits the state offers alternative energy businesses. The Clean Energy Research Center (CERC) at Oakland University in Rochester, Michigan conducts research to help deliver energy efficiency solutions, create new clean energy jobs, and develop natural resource, environmental, and economic technologies. The Center was created in March 2011, funded by an initial grant from the Michigan Department of Energy, Labor and Economic Growth, and the Energy Systems Group.
2
2012 State Scorecard
159
State Major RD&D Programs Score
Nebraska
The Nebraska Center for Energy Sciences Research (NCESR) is a collaboration between the University of Nebraska-Lincoln and the Nebraska Public Power District, established in 2006 to conduct research on renewable energy sources, energy efficiency and energy conservation, and to expand economic opportunities in Nebraska. The Center receives $70k annually from the University as well as additional funding from the Nebraska Public Power District, including $450,000 for energy research grants. The Energy Savings Potential (ESP) program is a collaboration between the University of Nebraska at Omaha and Omaha Public Power District. Since 2006, the District has allocated $500,000 per year for research on consumer behavior and ways to reduce energy consumption.
2
New Jersey
The New Jersey Commission on Science and Technology administers the Edison Innovation Clean Energy Fund through a Memorandum of Understanding with the New Jersey Board of Public Utilities. The Clean Energy Fund provides grants of $100,000 to $500,000 to New Jersey companies for demonstration projects and developmental and ancillary activities necessary to commercialize renewable energy and energy efficiency technologies. In 2011 the Fund had $4 million to disburse. The Rutgers Energy Institute (REI) was formed in 2006 to integrate basic research with real-world applications to advance energy technologies in a variety of areas. Its efficiency research focuses on energy-saving techniques and equipment, healthier indoor air-quality systems, building material reuse, and solid waste reduction. REI has 51 faculty and staff and is currently receiving $2 million in external research grants in addition to University funding.
The New York State Energy Research and Development Authority (NYSERDA) supports a broad range of technology research, development and commercialization activities. NYSERDA makes strategic investments in scientific research and market analysis and develops and tests new products and technologies that have the potential to improve energy efficiency and expand energy options in New York’s buildings, industrial, transportation, power, and environmental sectors. NYSERDA’s 2011-2012 budget for RD&D activities was approximately $64 million. The Center for Sustainable & Renewable Energy (CSRE) at the State University of New York is a clearinghouse for all 64 SUNY campuses’ research and development in the areas of energy efficiency and sustainability, including the New York “Green Campus” Energy Efficiency Initiative. The Building Energy and Environmental Systems Laboratory (BEESL) at Syracuse University is a research lab associated with the Syracuse Center of Excellence in Environmental and Energy Systems, the New York Strategically Targeted Academic Research Center for Environmental Quality Systems, and the New York Indoor Environmental Quality Center. The Laboratory advances technologies related to a number of environmental issues, including energy efficiency in buildings. It was established in November 1999 with funds from U.S. EPA, New York State Assembly, investor-owned utility National Grid, Syracuse University, and a $2 million gift from Frances and Fritz Traugott, and has a staff of nearly 40. The Institute for Urban Systems at City University of New York (CIUS) identifies innovative solutions to the problems of aging capital stock, advances environmental sustainability, and works to increase urban economic competitiveness in the management of transportation, energy, water, buildings, and other infrastructure systems.
2
2012 State Scorecard
161
State Major RD&D Programs Score
North Carolina
The North Carolina Green Business Fund provides grants of up to $100,000 to small and mid-size businesses, nonprofit organizations, state agencies, and local governments with in the state to encourage the development and commercialization of promising renewable energy and energy-efficient building technologies. The total awarded amount in 2011 was $3.6 million. The North Carolina Solar Center has a focus on energy efficiency to assist commercial and industrial clients in saving energy. This team operates multiple programs focusing on combined heat and power technology in the Southeast, and the Center also operates the Database of State Incentives for Renewables & Efficiency. The Center received $500,000 in research grants from the American Recovery and Reinvestment Act in 2011, in addition to other funding sources. The Center for Energy Research and Technology (CERT) at North Carolina A&T State University conducts research on reducing energy and water consumption and promoting sustainable energy design practices. The Center promotes and develops strategies for the reduction of carbon dioxide emissions, energy independence, and net-zero energy and sustainable design practices. The Center was founded in 1984, has a staff of five, and received $300,000 in research grants in 2011 from the city of Greensboro and the North Carolina Department of Commerce. The Appalachian State University Energy Center is an applied research and public service program through which the university makes its resources, faculty, and professional staff available to address economic, business, government and social issues and problems related to renewable energy policy, technology and development.
2
Ohio
The Center for Energy, Sustainability, and the Environment (CESE) at Ohio State University (OSU) conducts research in efficient energy infrastructure systems (e.g., power grid, and transportation networks), as well as "systems of energy systems" (e.g., smart micro grids, and markets). As of 2009, the Center was receiving $1.8 million in funding from the University.
The Oregon Built Environment and Sustainable Technologies Center (BEST) is an independent, nonprofit organization established by the Oregon legislature to help Oregon businesses compete globally by transforming and commercializing university research into new technologies, services, products, and companies. BEST shares research facilities for the study of energy-efficient and green buildings as well as providing energy efficiency research grants. The University of Oregon Energy Studies in Building Laboratory conducts research on buildings and transportation to develop strategies for maximum energy efficiency in new materials, components, assemblies, and whole buildings. It has a staff of six and has received funding from numerous private and public sources totaling $16 million over the past 20 years. The Baker Lighting Lab at the University of Oregon provides support and opportunities for the exploration of lighting design, including studying daylighting and the control of these systems. Portland State University’s Renewable Energy Research Lab conducts research on sustainable urban development, which covers smart grid development and net-zero energy use. The Lab is a joint project of the University and Portland General Electric, established in 2010 with $50,000 in funding from the utility. The Energy Trust of Oregon is an independent nonprofit organization dedicated to helping utility customers benefit from saving energy and generating renewable energy. In the area of energy efficiency, the Trust runs programs to field test emerging technologies. The Oregon Transportation Research and Education Consortium (OTREC) is a national University Transportation Center and a partnership between Portland State University, the University of Oregon, Oregon State University and the Oregon Institute of Technology. The group supports innovation through advanced technology, integration of land use and transportation, and healthy communities, and has also teamed up with Portland-based Green Lite Motors to bring a 100 mile-per-gallon vehicle closer to market.
2
Pennsylvania
The Energy Research Center (ERC) at Lehigh University emphasizes research dealing with energy conversion, power generation and environmental control. The Center’s research is supported by contracts and grants from government and industry and has approximately 36 full-time staff. The Center also operates the Energy Liaison Program, which provides consultation and problem-solving assistance to participating companies for up to $20,000 a year. The Indoor Environment Center (IEC) at the Penn State Institutes of Energy and the Environment (PSIEE) conducts research, knowledge transfer, and outreach activities to support the development of indoor environments that are safer and more thermally, visually and acoustically comfortable, and that minimize the use of energy and other resources. IEC has a full-time staff of 22.
2
Tennessee
The University of Tennessee has a strong partnership with Oak Ridge National Laboratory, which collaborates with other state stakeholders and industry members, including the Electric Power Research Institute. The University of Tennessee Research Foundation (UTRF) also promotes the commercialization and deployment of advanced technologies, some of which are related to energy efficiency.
The Texas A&M’s Energy Systems Laboratory (ESL) focuses on energy-related research, energy efficiency, and emissions reduction. ESL directs its efforts toward innovative energy technologies and systems and commercializing affordable results for industry, and also plays an important role in the implementation of state energy standards. The Lab has an annual external research and testing income of $10 million and a staff of 46. The University of Texas at Austin’s Center for Energy and Environmental Resources (CEER) focuses on the efficient and economical use of energy and on ensuring a cleaner environment by developing, in cooperation with industry, processes and technologies that minimize waste and conserve natural resources. CEER has a staff of 107 and is funded from numerous state, federal, and private sources.
2
Vermont
The Center for Energy Transformation and Innovation at the University of Vermont is a recently announced, not yet established research center that will be a partnership between the state, Sandia National Laboratories of New Mexico, the University of Vermont, and other academic institutions. The Center will focus on sustainable energy, energy efficiency, and smart-grid technology, and is initially designed to be a three-year project. The Center is receiving starting funds of $15 million, $9 million from Sandia, $3 million from the state, and $3 million from U.S. DOE.
2
Virginia
The new Modeling and Simulation Center for Collaborative Technology in Halifax County will be undertaking research and development work in energy-efficient advanced manufacturing. The Center received $1.2 million in start-up funds and expects to attract numerous research contracts from private engineering firms as well as federal agencies. The Center will start with a staff of eight.
1
West Virginia
The Advanced Energy Initiative (AEI) at West Virginia University focuses on high-efficiency engines and vehicle technologies and the sustainable use of water in energy production, as well as other research areas. AEI currently has 15 staff in their Sustainable Energy program, which houses the Initiative’s energy efficiency research. The program received 32.2% of the $30.9 million, or $9.94 million, in research grants that AEI obtained in 2011.
1
Wisconsin
The Energy Center of Wisconsin conducts technology and field research, energy efficiency program evaluation and market research, offers education programs, and develops and implements programs. The Center features an award-winning program on building energy use in new commercial construction. The Center has a staff of 44 and has an annual budget of approximately $2 million from state, customer, private, and other sources. Wisconsin Focus on Energy operates an Emerging Technology program that promotes emerging, industrial, energy efficiency technologies. The program deploys and commercializes technologies that have the potential for large, cost-effective energy savings and that have multiple installations in Wisconsin, and it can provide technology evaluations, development plans, and funding for businesses that have developed new technologies. The annual budget for Wisconsin Focus on Energy was $100 million in 2012.