20
THE AUSTRALIAN PAPER-TO-DIGITAL HOSPITAL SCANNING SURVEY //2012-13 Published OcT 2014
| Date post: | 24-Jul-2015 |
| Category: |
Data & Analytics |
| Upload: | squareearth |
| View: | 58 times |
| Download: | 3 times |

The AusTrAliAn PAPer-To-DigiTAlhosPiTAl sCAnning survey //2012-13 Published ocT 2014

Paper-to-Digitalhospital survey//2012-13October 2014© Square Earth Pty Ltd
About Us: Square Earth is an independent, healthcare consultancy organisation operating in Australia.
Our people have proven experience in:> New Hospital Project Implementation - De-sign, Infrastructure, Asset Management, Pro-gram Delivery, Business Case Development, Transition> Restructuring, Efficiency & Optimisation Pro-jects> Clinical Redesign> Funding loss minimisation, ABF, Clinical Cod-ing> Patient Flow and Enterprise Patient Schedul-ing> Digital Medical Records, Scanning and Legis-liation> Medical Devices > Clinical Applications and Technology, Procure-ment/Tenders and Business Process > Project implementation> Business Intelligence & Reporting
Our clients include Government and Tertiary Hospitals, Private Sector Healthcare and Health-care Vendors.
Contact Paul Tsang for further information: [email protected]

Hospital VolumetricsHospital volumetrics that drive pa-per volumes
StaffingA detailed breakdown of staffing in-volved in the paper to digital scan-ning process
PerformanceKey performance indicators are a core component of the paper to scanning process
Technology A review of the hardware and soft-ware utilised in the processes
#01
#02
#03
#04
CONTENTS
squareearthpartners with you

The reportSquareEarth is pleased to present this first survey into the paper-to-digital transformation that is occuring in the
health system in Australia.
This survey, undertaken in conjunction with the Health Information Manage-ment Association of Australia (HIMAA) Scanning Special Interest Group, rep-resents a range of hospitals across Australia. A total of 12 sites were in-
volved in this survey.
The purpose of this research is to pri-marily support further dialogue in be-tween hospitals involved in the paper-
to-digital transformation.
The paper-to-digital revolution may not be new in other sectors, but it still is a new concept to many hospi-tals and jurisdictions.
The complexity lies in the various factors including its safety in clini-cal use, the change in work prac-tices and clinical flow - and the legal frameworks and decisions.
Overview

At SquareEarth we devise and im-plement strategy by using real pro-ject experience - connected - to an intrinsic understanding of health-care, and the environment we work within.
We do this because we are pas-sionate about improving the op-eration and efficiency of the health system, and ultimately improving patient outcomes.
The 2013-14 survey is now open!
For more information or to participate in the next scanning survey, please contact Lizzie Cann at lizzie.cann@
squareearth.com.au
v1.0, October 2014
The online survey was conducted during the first half of 2014, with 12 respondent organisations taking part.
Survey respondents were asked to respond using their known information about their site(s), and the types of scanning equip-ment, as well as basic de-mographic data.
Some data cleansing has been undertaken from survey results to allow more uniform and cons-sitent reporting.
APProACh
identifcationInformation in this report has been anonymised to the level of a site ID. The site ID’s are only known to the in-dividual sites.

PAper // To //Digital

The Digital Transfor-mation. The well-known HIMSS Ana-lytics EMR Adoption Model (EMRAM) has been widely used as the measure for assess-ing hospitals and their
progressive ambitions towards a fully digital environment. With a number of organisa-tions world-wide look-ing to achieve Levels 6 and 7 (the highest maturity according to
their scale), and even to achieve higher than Level 2, the capability to ongoing transition and start the digital native journey, paper-to-digital scanning is a must.
Three key reasons - 1. Access to information - for multiple clinicians. Being able to have mul-tiple clinicians - in ED, wards, as well as bed-side cannot be underes-timated in the changes
to workflow and, as a re-sult, improving patient outcomes and reducing preventable errors.
2. Reduce physical movement and storage costs
3. Transformation to ful-ly digital environment
Why scanning?

In many cases where this is being first insti-tuted, the actual delays and establishment are less around the technol-ogy, or even the clini-cal processes. Often the most challenging
aspects reside in the le-gal constructs and the ‘stickiness’ of the paper solution as a backup. Legal ramifications of the record, the estab-lishment of appropri-ate quality metrics and
standards, and the align-ment of often cross-gov-ernment department on standards for retention, disposal and destruc-tion need addressing and as much attention as the process and tech.

This following graph shows the various hospital sites, and their relative volumes of Inpatient Separations, Outpatient Appointments and Emergency Department Presentations.
ID / Activity Type13 14 15 16 17 18 19 20 21 22 23 24
Inpa
tient
Sep
arat
ions
Out
patie
nt A
ppts
ED P
rese
ntat
ions
Inpa
tient
Sep
arat
ions
Out
patie
nt A
ppts
ED P
rese
ntat
ions
Inpa
tient
Sep
arat
ions
Out
patie
nt A
ppts
ED P
rese
ntat
ions
Inpa
tient
Sep
arat
ions
Out
patie
nt A
ppts
ED P
rese
ntat
ions
Inpa
tient
Sep
arat
ions
Out
patie
nt A
ppts
ED P
rese
ntat
ions
Inpa
tient
Sep
arat
ions
Out
patie
nt A
ppts
ED P
rese
ntat
ions
Inpa
tient
Sep
arat
ions
Out
patie
nt A
ppts
ED P
rese
ntat
ions
Inpa
tient
Sep
arat
ions
Out
patie
nt A
ppts
ED P
rese
ntat
ions
Inpa
tient
Sep
arat
ions
Out
patie
nt A
ppts
ED P
rese
ntat
ions
Inpa
tient
Sep
arat
ions
Out
patie
nt A
ppts
ED P
rese
ntat
ions
Inpa
tient
Sep
arat
ions
Out
patie
nt A
ppts
ED P
rese
ntat
ions
Inpa
tient
Sep
arat
ions
Out
patie
nt A
ppts
ED P
rese
ntat
ions
0K
50K
100K
150K
200K
250K
300K
350K
400K
450K
500K
Cou
nt p
er A
nnum
386,
953
92,1
97
96,3
72
13,1
27
62,7
37
65,5
92
195,
000
77,0
00
69,0
00
449,
383
56,1
06
41,1
96
379,
000
52,0
00
57,0
00
245,
750
73,4
46
91,6
72
388,
000
75,0
00
71,0
00
188,
009
68,2
49
51,9
03
210,
000
51,0
50
65,2
11
35,6
29
53,4
53
95,7
81 128,
285
189,
737
142,
381
241,
822
77,6
95
36,2
31
Episodees of Care across various hospital sites
ID131415161718192021222324
This graph shows the various hospital sites, and their relative volumes.Due to the nature of the sites, and clinical operations at hospitals, there are often different performance parameters for the turnaround for scanning. For example, in almost all cases, the expected turnaround time to scan paper records in the Emergency Department was much faster than for outpatient appointments.
hospital volumetrics

sTAFFing BreAKDoWn
Highest total or-ganisation staffing
numbers
83Lowest total or-
ganisation staffing numbers
21As many scan op-
erators to auditors for organisations that responded
12x
ID
23 16 13 19 18 24 22 21 14 20 15 170
10
20
30
40
50
60
70
80
Val
ue
17.00
16.00 10.10
15.20
17.20
10.00
12.00
16.50
18.50
11.00
15.00
10.00
11.54
15.72
12.51
9.48
2.53
6.17
5.86
2.90
3.50
4.80
2.20
9.50
7.10
7.40
2.50
6.00
6.00
9.00
4.00
4.00
8.80
7.10
6.00
5.50
8.003.00
3.009.00
3.30
3.005.00
2.00
3.00
6.00
3.00
6.20 8.00
6.00
4.00
3.00
8.007.10
6.003.00
3.84
R oleAuditor (S canning quality) F T E
C linical C oder F T E
C linical C oding Auditor F T E
C linical C oding Trainer F T E
C o-ordinator or S upervisor F T E
E -F orm developer F T E
Health Information Manager F T E
Other F T E
P repper F T E
Quality Assurance F T E
R eception F T E
R elease of Information F T E
S canner Operator F T E
S ystem Administrator F T E
episodes of Care vs staffing ratios
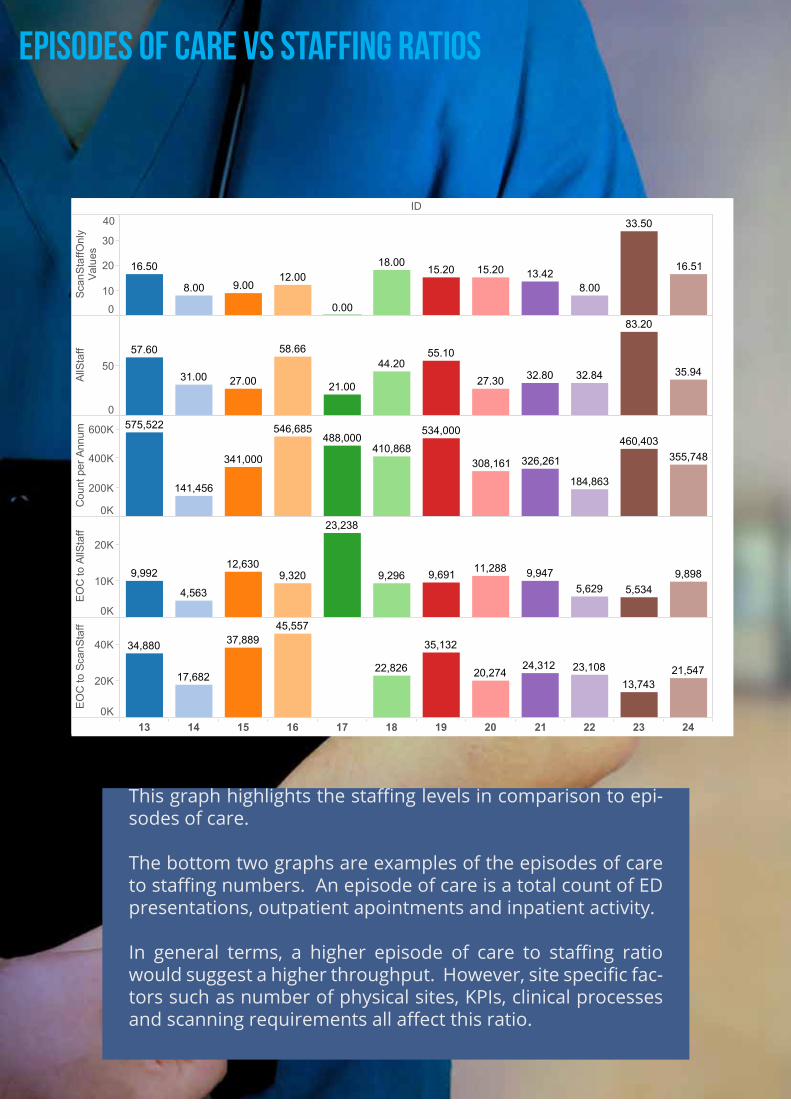
This graph highlights the staffing levels in comparison to epi-sodes of care.
The bottom two graphs are examples of the episodes of care to staffing numbers. An episode of care is a total count of ED presentations, outpatient apointments and inpatient activity.
In general terms, a higher episode of care to staffing ratio would suggest a higher throughput. However, site specific fac-tors such as number of physical sites, KPIs, clinical processes and scanning requirements all affect this ratio.
ID
13 14 15 16 17 18 19 20 21 22 23 24
010
20
30
40
Scan
Staf
fOnl
yVa
lues
0
50
AllS
taff
0K
200K
400K
600K
Cou
nt p
er A
nnum
0K
10K
20K
EOC
to A
llSta
ff
0K
20K
40K
EOC
to S
canS
taff
16.5012.00
18.0015.20 15.20
33.50
13.4216.51
8.00 9.00
0.00
8.00
58.6657.60
31.00 27.00 21.00
44.2055.10
27.30 32.80
83.20
32.84 35.94
546,685
410,868355,748
184,863
460,403
141,456
341,000
488,000534,000575,522
308,161 326,261
23,238
11,28812,630
5,6299,898
4,563
9,9479,2969,3205,534
9,992 9,691
37,889
23,108
45,557
13,74321,54722,826
34,880
20,27417,682
35,132
24,312
Episodes of Care v Staffing: Ratios
ID131415161718192021222324
Summary of All Staff involved in the Scanning Process vs A Count of Episodes of Care (Inpatient, Outpatient, ED).The bottom two graphs represent two ratios - one of Episodes of Care to All Staff, and one of Episodes of Care toScanning Staff Only (Auditors, Scanners, Preppers). A higher ratio indicates more episodes of care scanned per FTE.A lower ratio indicates less episodes of care scanned per FTE.

0 10 20 30 40 50 60 70 80AllStaff
0K
50K
100K
150K
200K
250K
300K
350K
400K
450K
500K
550K
600K
Cou
nt p
er A
nnum
17
15
20
13
21
24
1916
18
22
23
14
Episodes of Care vs All Staff Linear Regression Model
EOC to AllStaff4,563
10,00015,00020,00023,238
This is a graph of the Episodes of Care vs All Staff FTE numbers.A linear regression model has been utilised to There are three main clusters identifiable. This is most likely due to the variations in distributed scanningcentres/models, the KPI targets for scanning turnaround, and due to the nature of the specific process-es involved at each site.
This is a graph of the Episodes of Care vs All Staff FTE numbers.A linear regression model has been utilised, represented by the black line. Confidence bands are also shown.
There are three main clusters identifiable. This is most likely due to the variations in distributed scanning centres/models, the KPI targets for scanning turnaround, and due to the nature of the specific processes involved at each site.
R-Squared:R0.3183722Standard error:S1204611p-value (significance):p0.05599677
Median number of years records are kept before
destruction
Largest number of official
forms at one organisation
Organisations with lowest estimated
percentage of barcoded forms
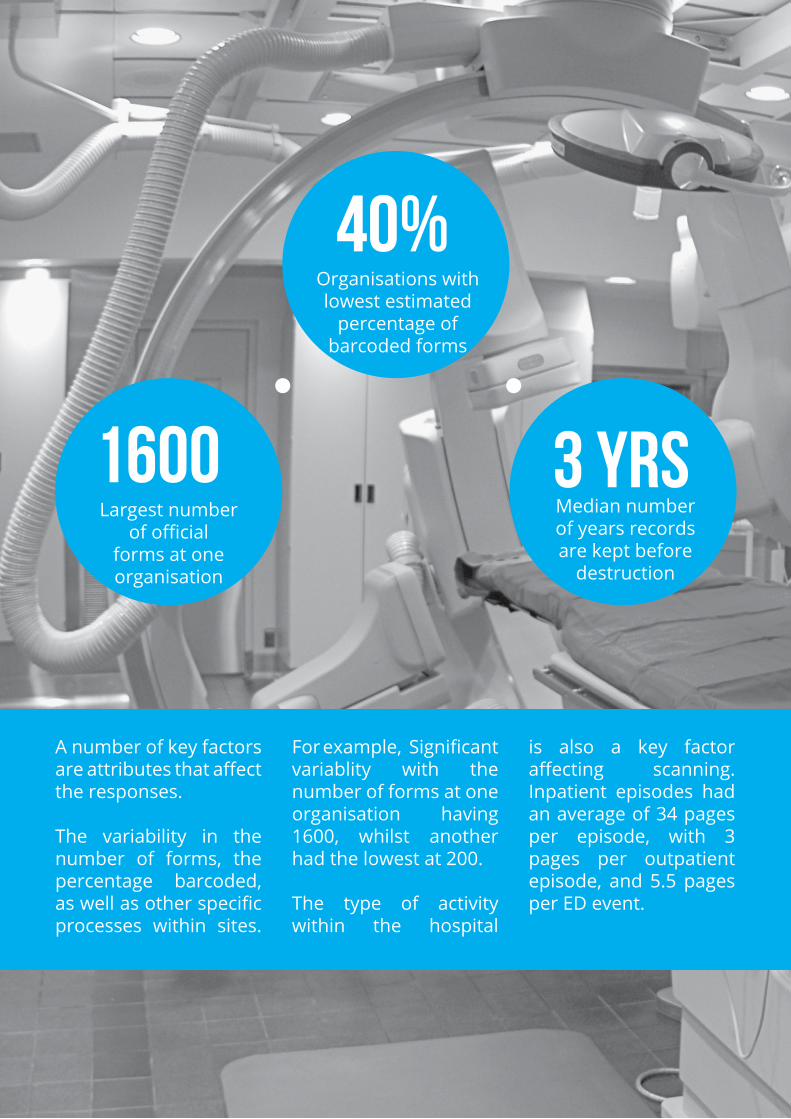
1600
40%
3 yrs
A number of key factors are attributes that affect the responses.
The variability in the number of forms, the percentage barcoded, as well as other specific processes within sites.
For example, Significant variablity with the number of forms at one organisation having 1600, whilst another had the lowest at 200.
The type of activity within the hospital
is also a key factor affecting scanning. Inpatient episodes had an average of 34 pages per episode, with 3 pages per outpatient episode, and 5.5 pages per ED event.

of sites are destroying
records
Avg number of pages per inpatient
episode
Organisations with decentralised
scanning
Half the organisations surveyed had decentralised scanning, with one organisation having up to 6 separate scanning sites. The size of the organisation meant that it also had multiple campuses.
What was also interesting in the survey was that a significant number already were destroying records, with 45% of organisations already down this path. The legal and structural frameworks
are environments that are required to enable this is important.
50% 34 Pgs
45%

KPis
The following graph represents the expected KPI and turnaround time for scanning to take place.
In all cases, Emergency had equal or faster turnaround times than the other parts of a hospital operation.
The graph y axis represents the number of hours in expected turnaround time.
ID
13 14 15 16 17 18 19 20 21 22 23 24
ED
Sca
n T
urna
roun
d
Inpa
tient
Sca
n T
urna
roun
d
Out
patie
nt S
can
Tur
naro
und
ED
Sca
n T
urna
roun
d
Inpa
tient
Sca
n T
urna
roun
d
Out
patie
nt S
can
Tur
naro
und
ED
Sca
n T
urna
roun
d
Inpa
tient
Sca
n T
urna
roun
d
Out
patie
nt S
can
Tur
naro
und
ED
Sca
n T
urna
roun
d
Inpa
tient
Sca
n T
urna
roun
d
Out
patie
nt S
can
Tur
naro
und
ED
Sca
n T
urna
roun
d
Inpa
tient
Sca
n T
urna
roun
d
Out
patie
nt S
can
Tur
naro
und
ED
Sca
n T
urna
roun
d
Inpa
tient
Sca
n T
urna
roun
d
Out
patie
nt S
can
Tur
naro
und
ED
Sca
n T
urna
roun
d
Inpa
tient
Sca
n T
urna
roun
d
Out
patie
nt S
can
Tur
naro
und
ED
Sca
n T
urna
roun
d
Inpa
tient
Sca
n T
urna
roun
d
Out
patie
nt S
can
Tur
naro
und
ED
Sca
n T
urna
roun
d
Inpa
tient
Sca
n T
urna
roun
d
Out
patie
nt S
can
Tur
naro
und
ED
Sca
n T
urna
roun
d
Inpa
tient
Sca
n T
urna
roun
d
Out
patie
nt S
can
Tur
naro
und
ED
Sca
n T
urna
roun
d
Inpa
tient
Sca
n T
urna
roun
d
Out
patie
nt S
can
Tur
naro
und
ED
Sca
n T
urna
roun
d
Inpa
tient
Sca
n T
urna
roun
d
Out
patie
nt S
can
Tur
naro
und
0
50
100
150
200
250
300
350
Val
ue

ID13 14 15 16 17 18 19 20 21 22 23 24
E..
Inp..
Out..
E..
Inp..
Out..
E..
Inp..
Out..
E..
Inp..
Out..
E..
Inp..
Out..
E..
Inp..
Out..
E..
Inp..
Out..
E..
Inp..
Out..
E..
Inp..
Out..
E..
Inp..
Out..
E..
Inp..
Out..
E..
Inp..
Out..
0
50
100
150
200
250
300
350
Valu
e
Key Performance Indicators for Scanning Turnaround Time
Measure NamesED Scan TurnaroundInpatient Scan TurnaroundOutpatient Scan Turnaround
This graph shows the scanning turnaround time expected at each site. The Emergency Department turnaround time is typically equal to or shorter than the scanning times at other sties.
ID
13 14 15 16 17 18 19 20 21 22 23 24
ED
Sca
n T
urna
roun
d
Inpa
tient
Sca
n T
urna
roun
d
Out
patie
nt S
can
Tur
naro
und
ED
Sca
n T
urna
roun
d
Inpa
tient
Sca
n T
urna
roun
d
Out
patie
nt S
can
Tur
naro
und
ED
Sca
n T
urna
roun
d
Inpa
tient
Sca
n T
urna
roun
d
Out
patie
nt S
can
Tur
naro
und
ED
Sca
n T
urna
roun
d
Inpa
tient
Sca
n T
urna
roun
d
Out
patie
nt S
can
Tur
naro
und
ED
Sca
n T
urna
roun
d
Inpa
tient
Sca
n T
urna
roun
d
Out
patie
nt S
can
Tur
naro
und
ED
Sca
n T
urna
roun
d
Inpa
tient
Sca
n T
urna
roun
d
Out
patie
nt S
can
Tur
naro
und
ED
Sca
n T
urna
roun
d
Inpa
tient
Sca
n T
urna
roun
d
Out
patie
nt S
can
Tur
naro
und
ED
Sca
n T
urna
roun
d
Inpa
tient
Sca
n T
urna
roun
d
Out
patie
nt S
can
Tur
naro
und
ED
Sca
n T
urna
roun
d
Inpa
tient
Sca
n T
urna
roun
d
Out
patie
nt S
can
Tur
naro
und
ED
Sca
n T
urna
roun
d
Inpa
tient
Sca
n T
urna
roun
d
Out
patie
nt S
can
Tur
naro
und
ED
Sca
n T
urna
roun
d
Inpa
tient
Sca
n T
urna
roun
d
Out
patie
nt S
can
Tur
naro
und
ED
Sca
n T
urna
roun
d
Inpa
tient
Sca
n T
urna
roun
d
Out
patie
nt S
can
Tur
naro
und
0
50
100
150
200
250
300
350
Val
ue

TeChnology
The following two graphs highlight the breakdown of the type of scanning hardware, and the scanning software that is utilised at the survey sites.
Kodak has a significant proportion hardware with over 85% of scanners at surveyed sites, but has just under 60% of the software scanning.
Although not directly surveyed, a number of these scanning software applications integrated with or are part of a Digital Medical Record, EMR, and EHR solution.
F UJ IT S UF I - 5950
1.92%
F UJ IT S UF i5900C
3.85%
K odaki46000.96%
B ell and HowellS pectrum XF
8.65%
K odaki730
20.19%
K odaki620
22.12%
K odaki440
23.08%
K odaki14405.77% K odak
i2804.81%
K odaki160
8.65%

8.33%K odak S canner S oftware
41.67%K odak C apture P ro
8.33%B OS S net
25.00%K ofax
8.33%V IC
8.33%K odak

AusTrAliAn hosPiTAl Paper-to-Digital sCAnning survey // 2012-13
For further information on this report please contact Lizzie Cann: [email protected].
For further information on SquareEarth and our specialist consulting and project services in Healthcare, contact Paul Tsang: [email protected]
© 2014 Square Earth Pty Ltd


