+ All Categories
Home > Documents > 2012 Total Rewards Survey - Aon · Health benefits satisfaction is declining ... Why Conduct a...

2012 Total Rewards Survey - Aon · Health benefits satisfaction is declining ... Why Conduct a...

Date post: 25-Apr-2018
Category:
Upload: dangngoc
View: 219 times
Download: 1 times
Share this document with a friend
23
2012 Total Rewards Survey The Path Forward: Transforming Potential Into Value Aon Hewitt Webinar Copyright © 2012 Aon Corporation To protect the confidential and proprietary information included in this material, it may not be disclosed or provided to any third parties without the approval of Aon Hewitt
Transcript

2012 Total Rewards Survey

The Path Forward: Transforming Potential Into Value

Aon Hewitt Webinar

Copyright © 2012 Aon Corporation

To protect the confidential and proprietary information included in this material, it may not be disclosed or

provided to any third parties without the approval of Aon Hewitt

2

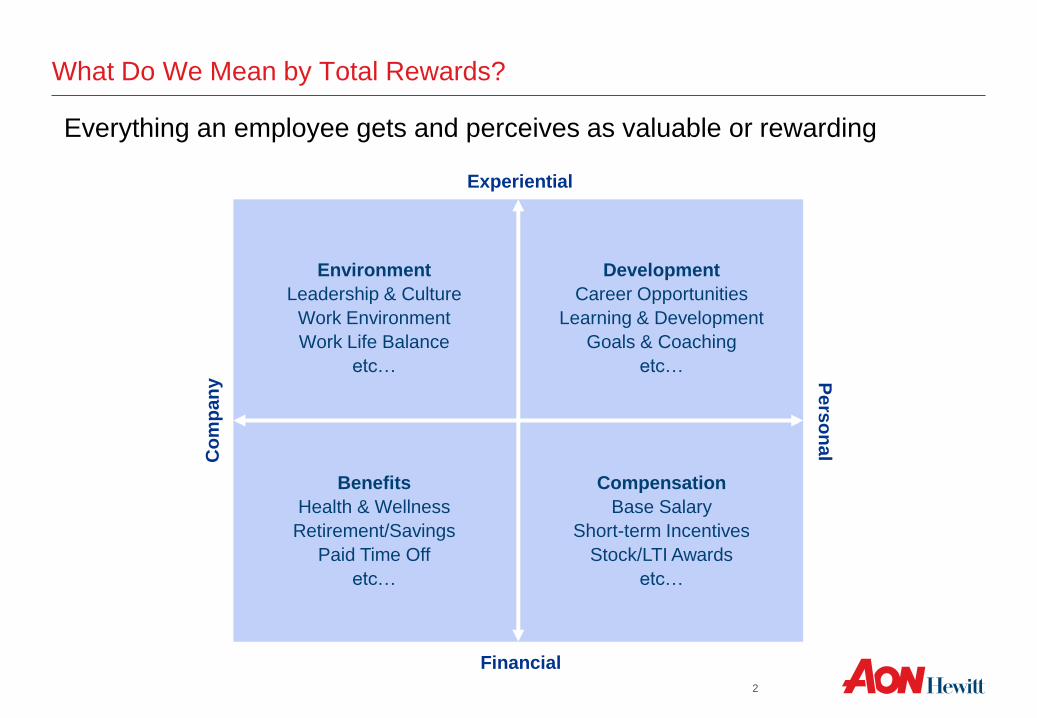
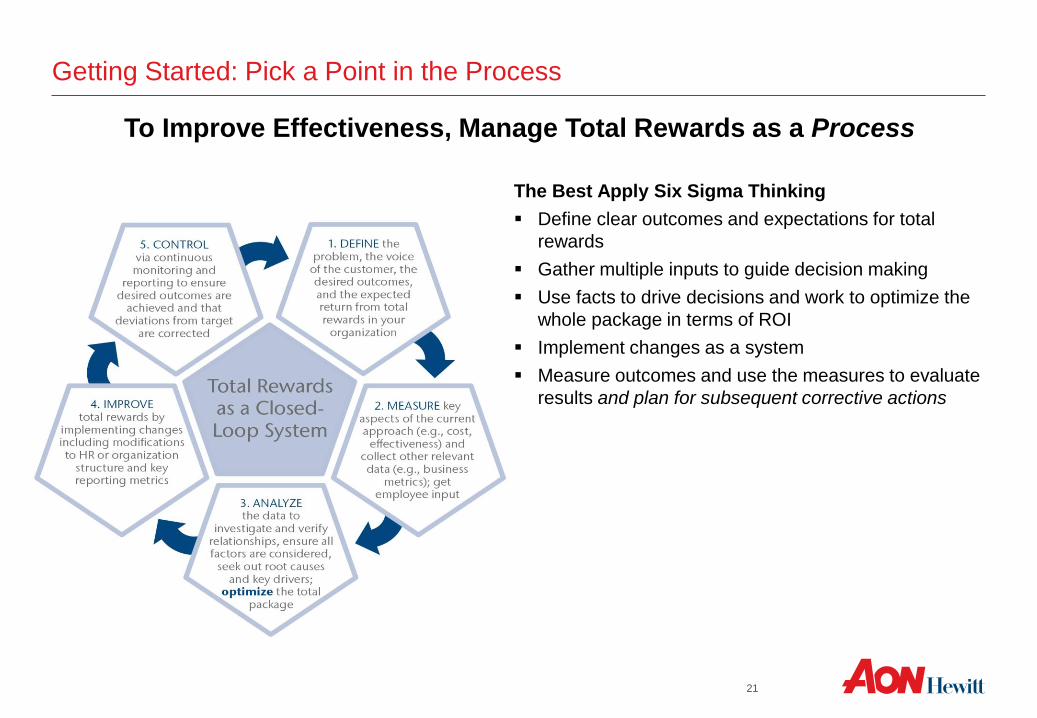
What Do We Mean by Total Rewards?

Everything an employee gets and perceives as valuable or rewarding

Environment

Leadership & Culture

Work Environment

Work Life Balance

etc…

Benefits

Health & Wellness

Retirement/Savings

Paid Time Off

etc…

Development

Career Opportunities

Learning & Development

Goals & Coaching

etc…

Compensation

Base Salary

Short-term Incentives

Stock/LTI Awards

etc…

Experiential

Financial

Co

mp

an

y P

ers

on

al

3

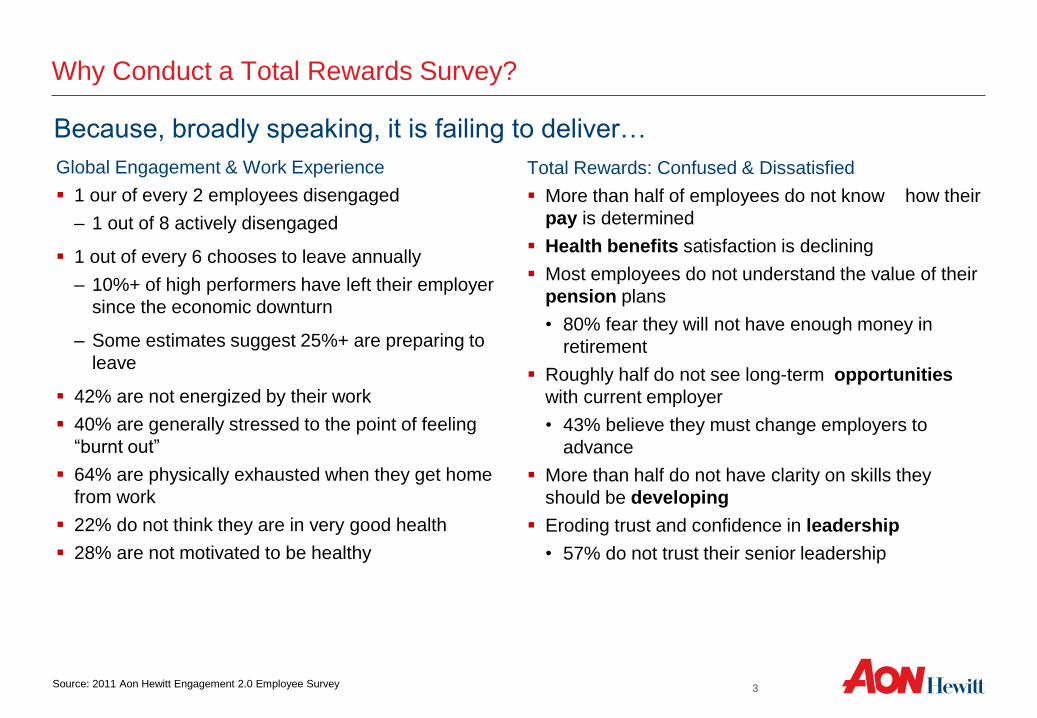
Total Rewards: Confused & Dissatisfied

More than half of employees do not know how their

pay is determined

Health benefits satisfaction is declining

Most employees do not understand the value of their

pension plans

• 80% fear they will not have enough money in

retirement

Roughly half do not see long-term opportunities

with current employer

• 43% believe they must change employers to

advance

More than half do not have clarity on skills they

should be developing

Eroding trust and confidence in leadership

• 57% do not trust their senior leadership

Global Engagement & Work Experience

1 our of every 2 employees disengaged

– 1 out of 8 actively disengaged

1 out of every 6 chooses to leave annually

– 10%+ of high performers have left their employer

since the economic downturn

– Some estimates suggest 25%+ are preparing to

leave

42% are not energized by their work

40% are generally stressed to the point of feeling

“burnt out”

64% are physically exhausted when they get home

from work

22% do not think they are in very good health

28% are not motivated to be healthy

Source: 2011 Aon Hewitt Engagement 2.0 Employee Survey

Why Conduct a Total Rewards Survey?

Because, broadly speaking, it is failing to deliver…

4

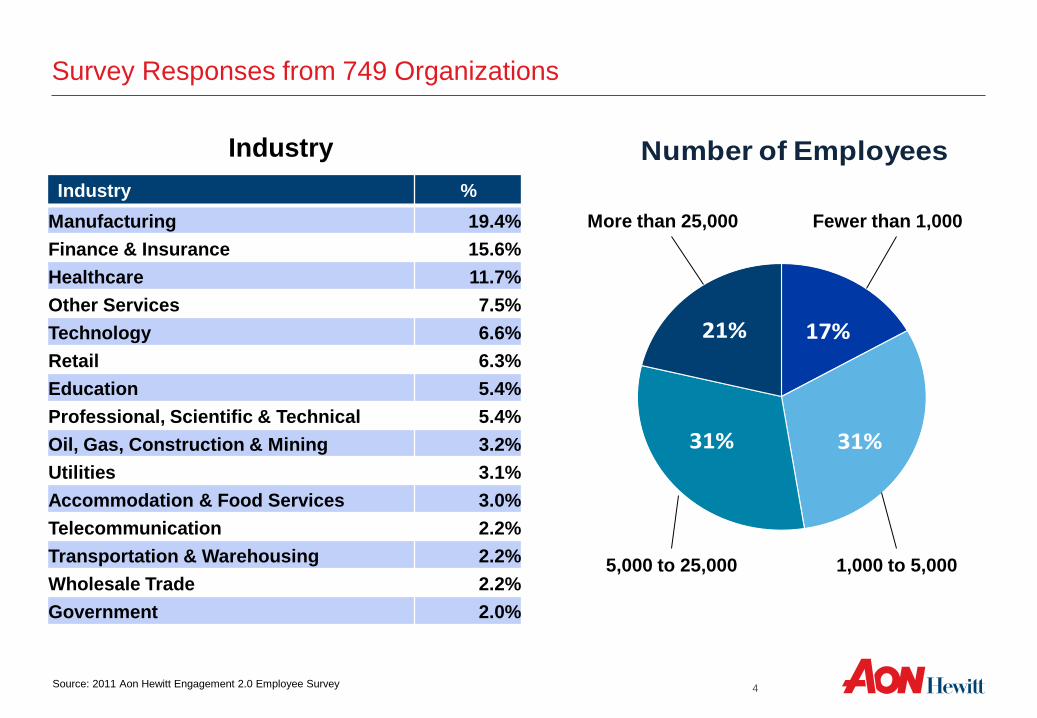
Survey Responses from 749 Organizations

17%

31%31%

21%

Number of Employees

Industry %

Manufacturing 19.4%

Finance & Insurance 15.6%

Healthcare 11.7%

Other Services 7.5%

Technology 6.6%

Retail 6.3%

Education 5.4%

Professional, Scientific & Technical 5.4%

Oil, Gas, Construction & Mining 3.2%

Utilities 3.1%

Accommodation & Food Services 3.0%

Telecommunication 2.2%

Transportation & Warehousing 2.2%

Wholesale Trade 2.2%

Government 2.0%

Industry

Fewer than 1,000

1,000 to 5,000 5,000 to 25,000

More than 25,000

Source: 2011 Aon Hewitt Engagement 2.0 Employee Survey

5

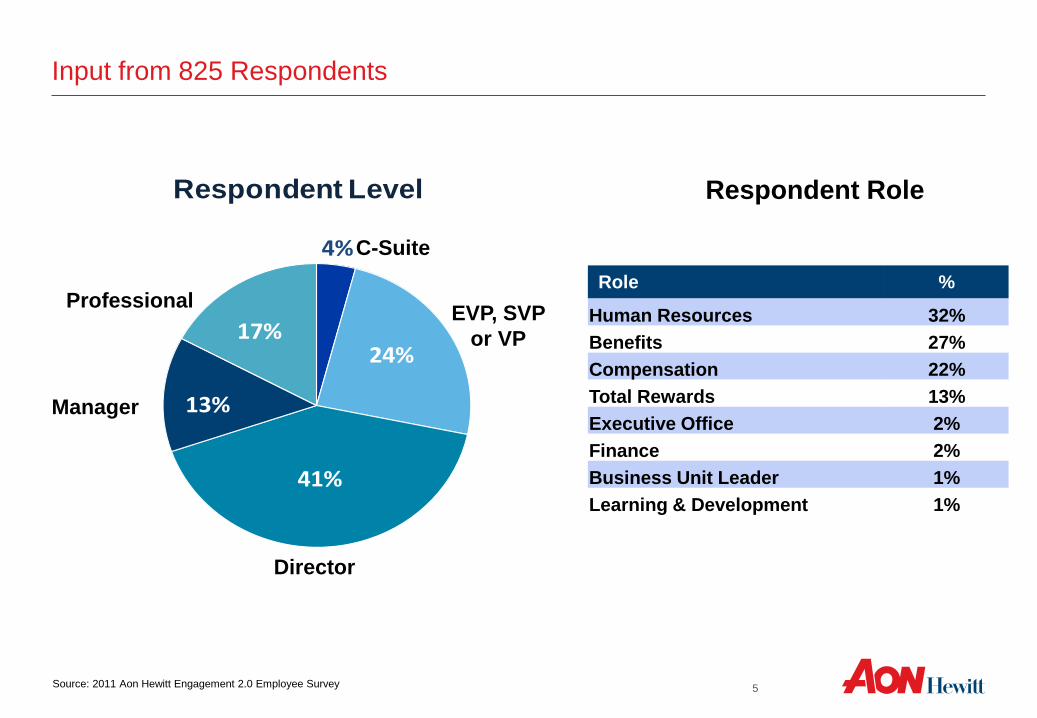
Input from 825 Respondents

Role %

Human Resources 32%

Benefits 27%

Compensation 22%

Total Rewards 13%

Executive Office 2%

Finance 2%

Business Unit Leader 1%

Learning & Development 1%

Respondent Role

4%

24%

41%

13%

17%

Respondent Level

C-Suite

EVP, SVP

or VP

Director

Manager

Professional

Source: 2011 Aon Hewitt Engagement 2.0 Employee Survey

6

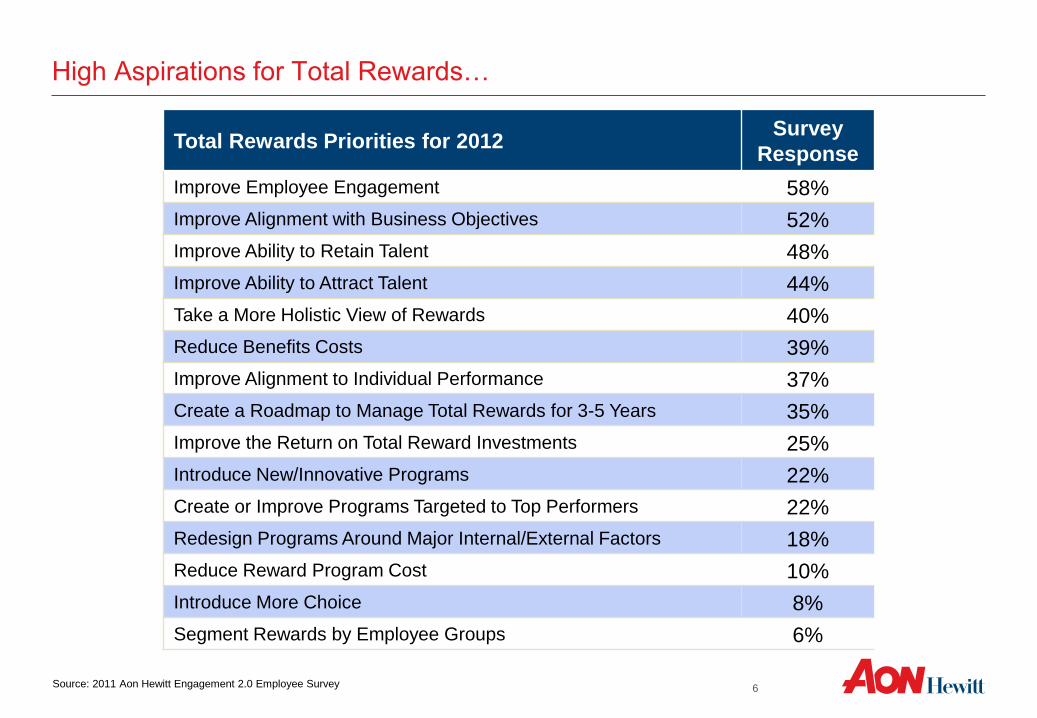
High Aspirations for Total Rewards…

Total Rewards Priorities for 2012 Survey

Response

Improve Employee Engagement 58%

Improve Alignment with Business Objectives 52%

Improve Ability to Retain Talent 48%

Improve Ability to Attract Talent 44%

Take a More Holistic View of Rewards 40%

Reduce Benefits Costs 39%

Improve Alignment to Individual Performance 37%

Create a Roadmap to Manage Total Rewards for 3-5 Years 35%

Improve the Return on Total Reward Investments 25%

Introduce New/Innovative Programs 22%

Create or Improve Programs Targeted to Top Performers 22%

Redesign Programs Around Major Internal/External Factors 18%

Reduce Reward Program Cost 10%

Introduce More Choice 8%

Segment Rewards by Employee Groups 6%

Source: 2011 Aon Hewitt Engagement 2.0 Employee Survey

7

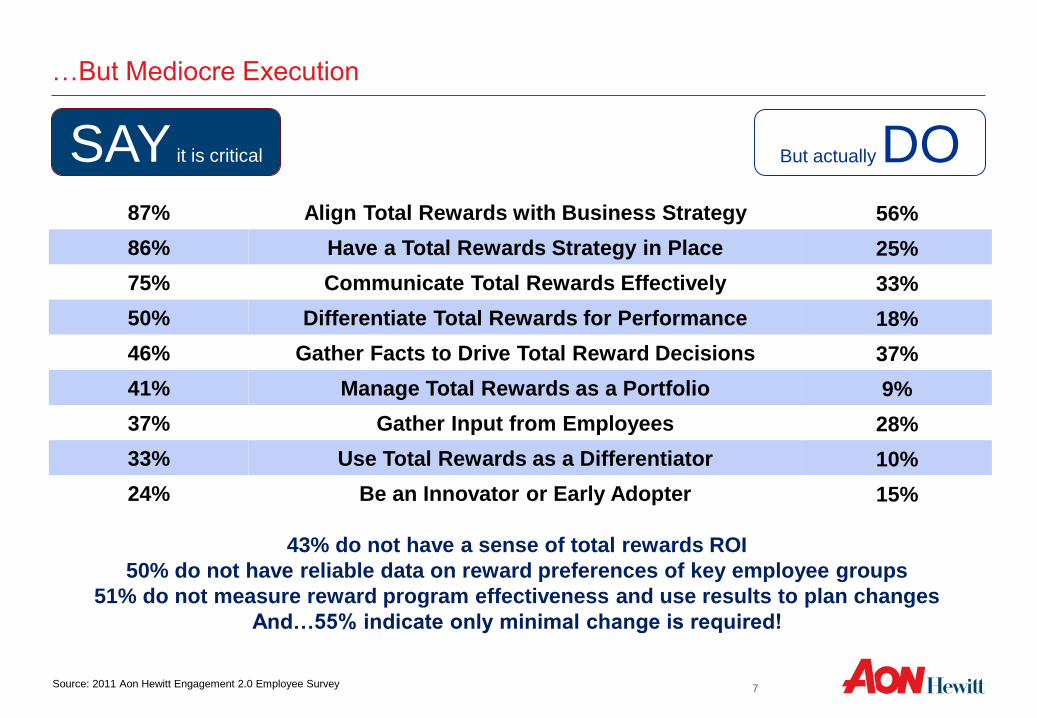
…But Mediocre Execution

SAY it is critical But actually DO 87% Align Total Rewards with Business Strategy 56%

86% Have a Total Rewards Strategy in Place 25%

75% Communicate Total Rewards Effectively 33%

50% Differentiate Total Rewards for Performance 18%

46% Gather Facts to Drive Total Reward Decisions 37%

41% Manage Total Rewards as a Portfolio 9%

37% Gather Input from Employees 28%

33% Use Total Rewards as a Differentiator 10%

24% Be an Innovator or Early Adopter 15%

43% do not have a sense of total rewards ROI

50% do not have reliable data on reward preferences of key employee groups

51% do not measure reward program effectiveness and use results to plan changes

And…55% indicate only minimal change is required!

Source: 2011 Aon Hewitt Engagement 2.0 Employee Survey

8

Different Approach at High Performing Companies?

Who are the High Performers?

For this study, “high performing” or “The Best” organizations are defined as those that achieve the highest levels

of:

Revenue against objectives

Innovation

High employee engagement

Using this definition, we found 150 organizations in our study sample, representing approximately 20% of the

total number of participating organizations.

Those that did not meet all three criteria are defined as “The Rest.”

9

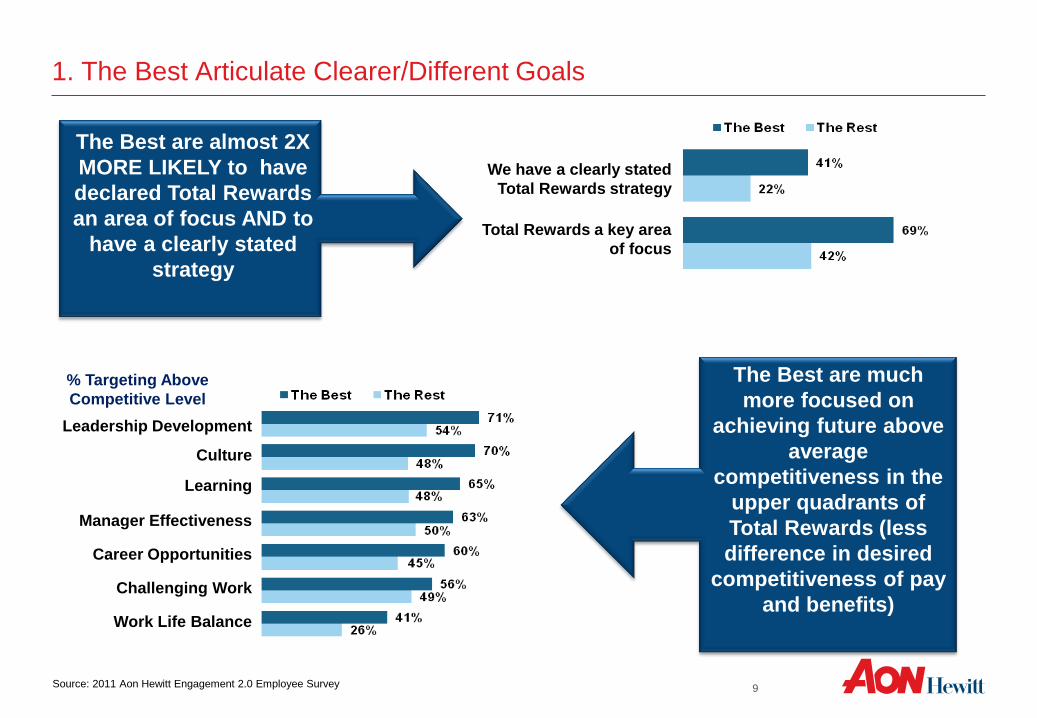
1. The Best Articulate Clearer/Different Goals

The Best are almost 2X

MORE LIKELY to have

declared Total Rewards

an area of focus AND to

have a clearly stated

strategy

The Best are much

more focused on

achieving future above

average

competitiveness in the

upper quadrants of

Total Rewards (less

difference in desired

competitiveness of pay

and benefits)

% Targeting Above

Competitive Level

Leadership Development

Culture

Learning

Manager Effectiveness

Career Opportunities

Challenging Work

Work Life Balance

We have a clearly stated

Total Rewards strategy

Total Rewards a key area

of focus

Source: 2011 Aon Hewitt Engagement 2.0 Employee Survey

10

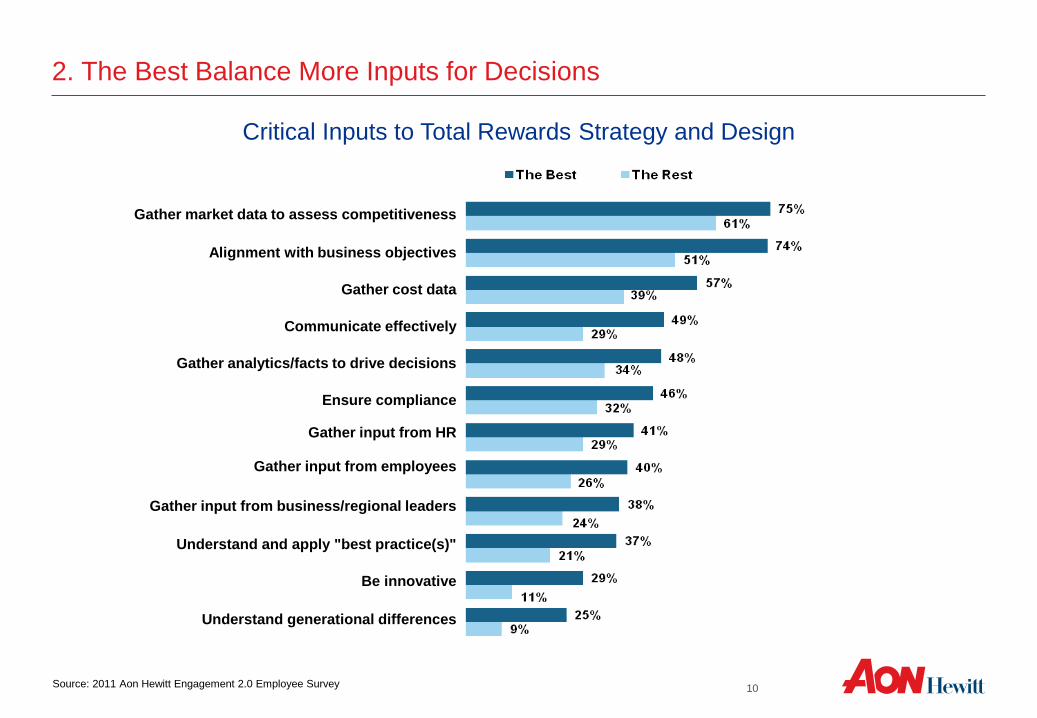
2. The Best Balance More Inputs for Decisions

Critical Inputs to Total Rewards Strategy and Design

Gather market data to assess competitiveness

Alignment with business objectives

Gather cost data

Communicate effectively

Gather analytics/facts to drive decisions

Ensure compliance

Gather input from HR

Gather input from employees

Gather input from business/regional leaders

Understand and apply "best practice(s)"

Be innovative

Understand generational differences

Source: 2011 Aon Hewitt Engagement 2.0 Employee Survey

11

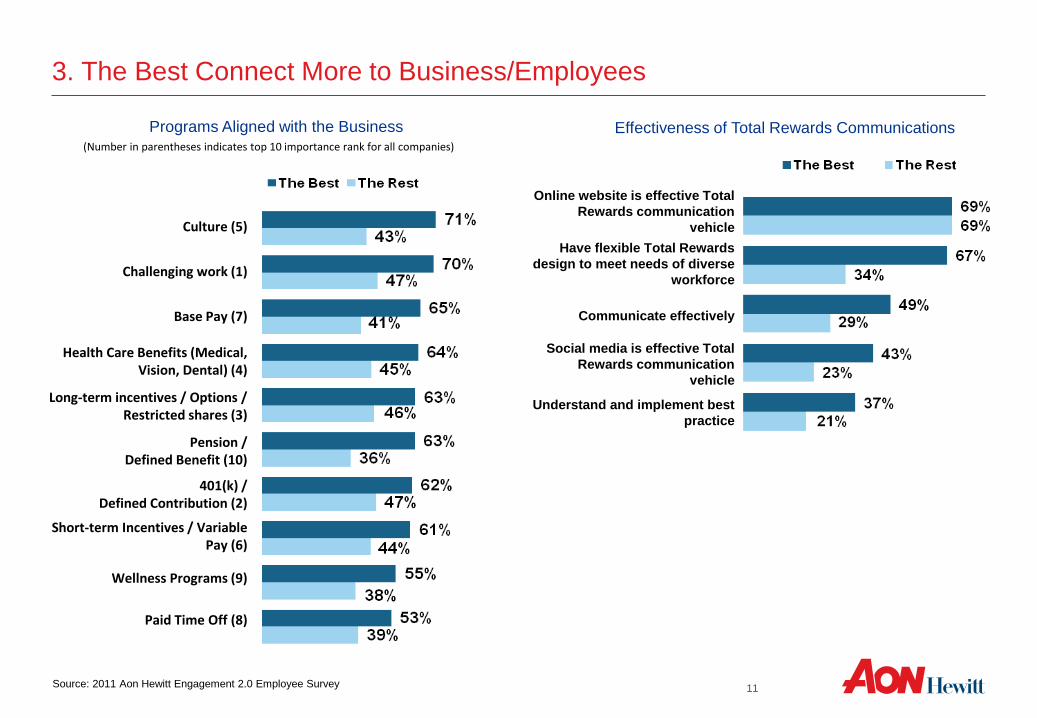
3. The Best Connect More to Business/Employees

Programs Aligned with the Business Effectiveness of Total Rewards Communications (Number in parentheses indicates top 10 importance rank for all companies)

Culture (5)

Challenging work (1)

Base Pay (7)

Health Care Benefits (Medical, Vision, Dental) (4)

Long-term incentives / Options / Restricted shares (3)

Pension / Defined Benefit (10)

401(k) / Defined Contribution (2)

Short-term Incentives / Variable Pay (6)

Wellness Programs (9)

Paid Time Off (8)

Online website is effective Total

Rewards communication

vehicle

Have flexible Total Rewards

design to meet needs of diverse

workforce

Communicate effectively

Social media is effective Total

Rewards communication

vehicle

Understand and implement best

practice

Source: 2011 Aon Hewitt Engagement 2.0 Employee Survey

12

4. The Best Define Effectiveness Differently

Use of Total Rewards Success Metrics

Employee engagement

Cost vs. budget

Employee turnover

Higher employee satisfaction with programs

Modeling of Total Rewards spend against key

business objectives

Source: 2011 Aon Hewitt Engagement 2.0 Employee Survey

13

5 .The Best Experience Better Results

Better Human

Resource

Outcomes

Better

Business

Outcomes

Employees understand the value of

the Total Rewards Package

Engagement trending UP

in past 18 months

Engagement trending DOWN

in past 18 months

Operational Efficiency

M&A Objectives

Customer Service Aims

Quality Goals

Currently Effective in Achieving:

Source: 2011 Aon Hewitt Engagement 2.0 Employee Survey

14

Consequences Are Costly

The survey results identified three major consequences for companies that do not manage total rewards

effectively:

1. Missing valuable input from employees, which may lead to lower engagement and higher turnover

2. Missing opportunities to manage total rewards as a portfolio, which may lead to higher costs and lower

effectiveness

3. Introducing unnecessary risk into their total rewards approach

15

Consequence 1: Not Hearing Employee Voice

Three of the top four total reward priorities for 2012

are

– Improve engagement (58%),

– Improve retention (48%)

– Improve attraction (44%)

These are all about improving the perception of total

rewards in the eyes of employees and prospective

employees.

Still, the survey results tell us that only 37% of

companies say it is critical to gather data from

employees, and only 28% are actually doing so.

Source: 2011 Aon Hewitt Engagement 2.0 Employee Survey

16

Current Investment

Current Effectiveness

Point of

Diminishing returns

No Investment Change &

Increased Effectiveness

Decreased Investment & No

Effectiveness Change

1

2

Risk

Zone

“Win/Win”

Zone

ROI

Zone

Risk

Zone

Increase Reward

Effectiveness

Decrease Reward

Effectiveness

Decrease

Rewards

Investment

Increase

Rewards

Investment

Efficient Frontier

3

Consequence 2: Sub-Optimizing the Portfolio

17

Consequence 3: Taking Unnecessary Risks

We do not

consider

this risk

as we

manage

rewards

We have

clearly

identified

this risk

We have a

process and

measures

in place to

assess this

risk

We regularly

monitor and

report

on this risk

(e.g., to

leadership)

We have

mitigation

strategies in

place to

manage this

risk.

FINANCIAL RISK The Best 5% 9% 27% 47% 12%

EXECUTION RISK The Best 12% 15% 35% 26% 12%

ALIGNMENT RISK The Best 18% 15% 29% 31% 7%

REGULATORY RISK The Best 11% 7% 27% 30% 25%

Source: 2011 Aon Hewitt Engagement 2.0 Employee Survey

18

Change is Desired

Companies Operating in 1 of 3 Modes

Catching Up

– Creating a strategy

– Aligning leadership

– Addressing structure and culture

Moving Forward

– Centralizing responsibility for reward

strategy

– Pushing for more tailored approaches

– Increasing performance orientation

and differentiation

– Shifting cost and risk to employees

– Pushing for better communication

Pulling Ahead

– Innovating

– Using total rewards as a differentiator

Source: 2011 Aon Hewitt Engagement 2.0 Employee Survey

19

The Way Forward is Clear

Barrier to Change (Top 3 Responses) The Best The Rest

Little/No Awareness of Total Reward Objectives 32% 45%

Leaders not Aligned 23% 34%

Organization Structure 23% 27%

Cultural Barriers 29% 33%

Budget Constraints 71% 72%

HR Structure, Governance and Decision Rights 15% 13%

HR Resource Constraints 41% 34%

Global Framework and Local Application 26% 18%

Moving forward involves addressing the barriers to change.

Here’s what’s clear:

1. HR owns most of the barriers (or at least has a strong say)

2. Setting direction and aligning leaders is a good place to start.

3. Implementation challenges should not be underestimated

Source: 2011 Aon Hewitt Engagement 2.0 Employee Survey

20

Time for Breakthrough Thinking

High aspirations and mediocre

execution are producing a lot of

pressure for change.

This is a time for breakthrough

thinking that may require bold new

ideas, including new ways of

looking at the issues.

To help our clients meet some of

the challenges highlighted in this

material, we have been presenting

a new framework for total rewards.

This new model complements the

four-quadrant model presented

earlier. It is intended to stimulate

new thinking around where to focus

energy, effort, and expense in total

rewards

21

Getting Started: Pick a Point in the Process

The Best Apply Six Sigma Thinking

Define clear outcomes and expectations for total

rewards

Gather multiple inputs to guide decision making

Use facts to drive decisions and work to optimize the

whole package in terms of ROI

Implement changes as a system

Measure outcomes and use the measures to evaluate

results and plan for subsequent corrective actions

To Improve Effectiveness, Manage Total Rewards as a Process

22

Your Questions

Thank you.

For additional information, please contact [email protected].


Recommended