56
2012 US & Canadian Labor-Energy Input Survey

2012 US & Canadian
Labor-Energy Input Survey


U.S. AND CANADIANLABOR-ENERGY INPUT SURVEY
2012
The following analysis is prepared by the Portland Cement Association’s Market Intelligence Group based on data sources believed to be reliable; however, accuracy cannot be guaranteed.
This report is not intended to represent the viewpoint of Portland Cement Association member companies. The Portland Cement Association assumes no legal responsibility
for the outcome of decisions or commitments made on the basis of this information.
The U.S. and Canadian Labor-Energy Input Survey may not be electronically redistributed or reproduced, in whole or in part, without authorization of the Portland Cement Association.
© 2013 Portland Cement Association
5420 Old Orchard RoadSkokie, Illinois 60077-1083MAIN 847.966.6200 FAX 847.966.0862www.cement.org
Edward J. Sullivan, Group Vice President & Chief Economist 847.972.9006Richard P. Bohan, Director of Manufacturing Technology 847.972.9038Brian Schmidt, Market Intelligence Analyst 847.972.9042Karen A. Arneson, Market Intelligence Specialist 847.972.9048


U.S. AND CANADIANLABOR-ENERGY INPUT SURVEY
2012 Page
Executive Summary ............................................................................................... i Survey Overview .................................................................................................... ii U.S. and Canadian Cement Industry Labor Statistics Historic Summary .............................................................. 1 Labor Efficiency Chart ................................................................................. 2 U.S. Output Per Employee-Hour Chart ....................................................... 2 U.S. Portland Cement Industry Tables Labor Productivity ....................................................................................... 5 Energy Consumption ................................................................................... 5 Energy Distribution ...................................................................................... 6 Alternative Fuel Summary ........................................................................... 6 Energy Distribution Chart ............................................................................ 7 Labor Productivity and Energy Efficiency ................................................... 8 Labor Productivity and Energy Efficiency Charts ........................................ 9 Summary Reports ....................................................................................... 10 Plant Ranking Report (Members Only) ............................................................ 26 Canadian Portland Cement Industry Tables Labour Productivity ..................................................................................... 31 Energy Consumption ................................................................................... 31 Energy Distribution ...................................................................................... 32 Alternative Fuel Summary ........................................................................... 32 Energy Distribution Chart ............................................................................ 33 Labour Productivity and Energy Efficiency ................................................. 34 Labour Productivity and Energy Efficiency Charts ...................................... 35 Summary Reports ....................................................................................... 36 Plant Ranking Report (Members Only) ............................................................ 45 Appendix ................................................................................................................ 46


United States
Labor Efficiency
U.S. labor productivity increased in 2012 with an industry average of 3.04 metric tons of cement being produced per employee hour (mtph). Productivity ranged from 7.21 mtph to 1.01 mtph. Productivity in wet process plants jumped 16.1%, while dry process plants reported a 5.5% increase in labor efficiency.
Energy Efficiency
The amount of energy, measured in BTU’s per metric ton, required to produce one ton of cement averaged 4.386 million BTU/ton in 2012, an industry decrease of 2.1% from 2011 levels – signaling higher energy efficiency. Individual plant energy efficiencies ranged from 2.41 million BTU/ton to 9.15 million BTU/ton. On average, wet process plants required 6.484 million BTU to produce one ton of cement in comparison to dry process plant energy requirements of 4.269 million BTU.
The cement production process in the U.S. is fueled by a combination of coal and petroleum coke which represents 63.3% of the fuel consumption mix. Natural gas’ contribution to the fuel profile surged from 3.9% in 2011 to 11.1% in 2012, likely due to favorable natural gas prices. Electricity consumption slightly increased to 11.6% of the fuel matrix. The use of petroleum products remained stable relative to overall energy consumption at 1.0% Alternative fuel consumption’s share of the fuel matrix decreased to 13.0% in 2012. More plants are, however, employing multiple alternative fuels as part of their energy profile. Three-quarters of all U.S. cement plants now incorporate alternative fuels in their energy consumption strategy. Alternative fuel usage included tire derived fuel, waste oil, solvents, other solids, and renewable energy such as wood and biomass.
CanadaLabour Efficiency
Canadian labour efficiency was flat in 2012 as it requires, on average, 3.05 employee hours to produce one tonne of cement. Labour productivity in the Canadian cement industry ranged from 7.01 mtph to 1.69 mtph.
Energy Efficiency
In 2012, an industry average of 4.449 gigajoules (GJ) were required to produce one tonne of cement. This represents a requirement of 5.1% more energy to produce one tonne of cement from the previous year’s survey. Canadian cement industry energy efficiency ranged from 3.62 GJ/tonne to 5.44 GJ/tonne.
Coal and coke usage decreased its percentage as the primary fuel of choice in 2012, now accounting for 61.5% of the Canadian cement industry’s fuel consumption mix. Natural gas usage jumped from 1.5% of the fuel mix in 2011 to 14.6% in 2012. On an energy consumption basis, alternative fuel usage increased to 9.9% of the energy profile. Half of all Canadian cement plants now incorporate alternative material in their fuel consumption strategy.
Executive Summary
December 31, 2012 Page i

Survey Overview
December 31, 2012 Page ii
The U.S. and Canadian Labor-Energy Input Survey presents information compiled by the Portland Cement Association on labor and energy usage in the U.S. and Canadian cement industries. Results in the accompanying tables report average measures of labor and energy efficiency in addition to comparisons over time. However, direct comparisons over time should be made with the understanding that differences in the reporting base and reporting accuracy can affect changes in operating efficiencies from year to year. It is for this reason that the overall trends in labor productivity and energy efficiency are viewed to be of more significance.
Survey results are reported in metric units for both the U.S. and Canada. However, U.S. and Canadian cement industry energy efficiency statistics cannot be compared directly since Canadian energy efficiency statistics are reported in Joules (J) and U.S. energy efficiency statistics are reported in British Thermal Units (BTU).
Only clinker-producing cement plants are eligible to participate in this program. Individual plant confidentiality is strictly maintained and only responding member companies are eligible to receive their individual plant and company summaries. White cement plants and “Grinding Only” operations are not included in this program.
Equivalent Labor and Energy Tons (Tonnes)
Because a plant’s clinker production may be disproportionate to its finished cement production, unit energy usage in this report is expressed in terms of equivalent tons (tonnes) of production to assure that comparable averages are being analyzed.
Energy consumed in the quarry, drying, raw grinding, and kiln stages of the manufacturing process corresponds directly to the production of clinker. Historical survey data indicates that production of clinker, on average, accounts for 92% of a plant’s total energy consumption. The remaining 8% is used in the production of finished cement and generally reflects electrical energy usage. Similarly for labor consumption, 85% of labor consumed is allocated to clinker production with the remaining 15% allocated to finished cement production.
In this report, the weights for an equivalent labor (labour) ton (tonne) are 85% clinker and 15% finished cement production. The weights for an equivalent energy ton (tonne) are 92% clinker and 8% finished cement production.
High and Low Heat Value
In Canada, and most other parts of the world, energy consumption is based on “low heat value.” In the U.S., by contrast, energy consumption is based on “high heat value.” Low heat value discounts the heat losses incurred by evaporation of fuel moisture as well as the water generated from the combustion of hydrogen. The difference in high and low heat values ranges from 3% to 7%. Canadian energy efficiency statistics are not directly comparable to similar U.S. data because of these differences in heat value measures.

United States
Cement Industry

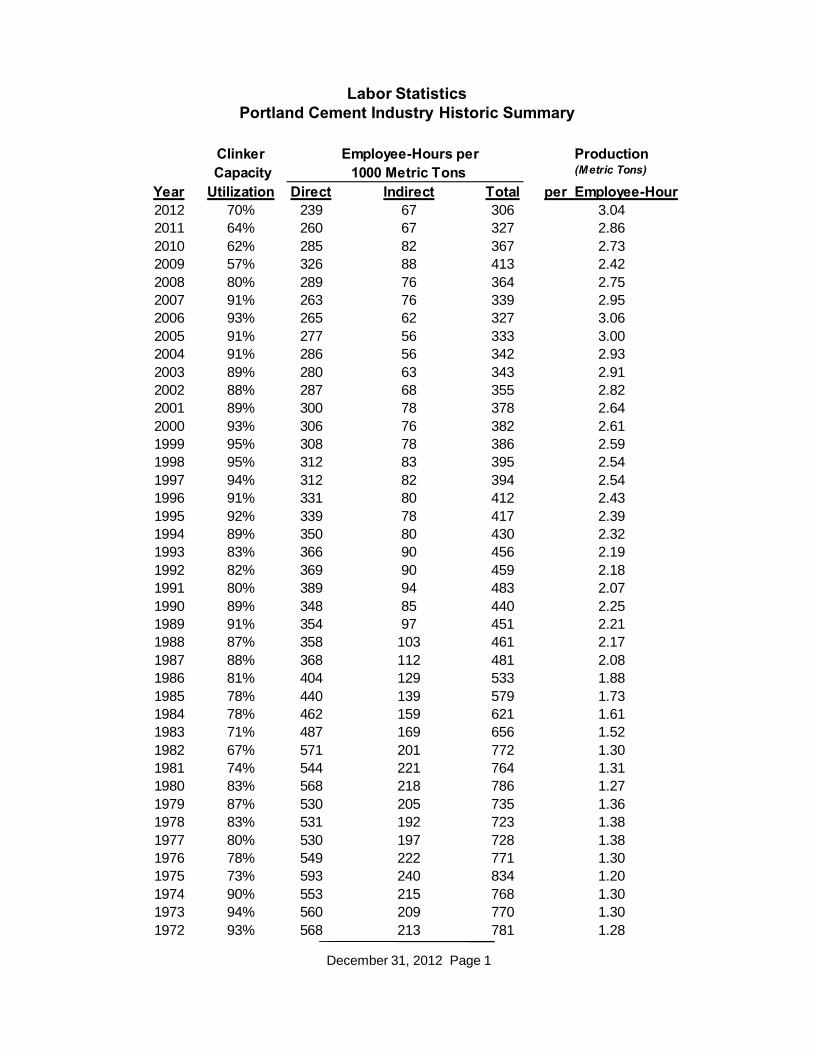
Labor StatisticsPortland Cement Industry Historic Summary
December 31, 2012 Page 1
Clinker Employee-Hours per Production Capacity 1000 Metric Tons (Metric Tons)
Year Utilization Direct Indirect Total per Employee-Hour2012 70% 239 67 306 3.042011 64% 260 67 327 2.862010 62% 285 82 367 2.732009 57% 326 88 413 2.422008 80% 289 76 364 2.752007 91% 263 76 339 2.952006 93% 265 62 327 3.062005 91% 277 56 333 3.002004 91% 286 56 342 2.932003 89% 280 63 343 2.912002 88% 287 68 355 2.822001 89% 300 78 378 2.642000 93% 306 76 382 2.611999 95% 308 78 386 2.591998 95% 312 83 395 2.541997 94% 312 82 394 2.541996 91% 331 80 412 2.431995 92% 339 78 417 2.391994 89% 350 80 430 2.321993 83% 366 90 456 2.191992 82% 369 90 459 2.181991 80% 389 94 483 2.071990 89% 348 85 440 2.251989 91% 354 97 451 2.211988 87% 358 103 461 2.171987 88% 368 112 481 2.081986 81% 404 129 533 1.881985 78% 440 139 579 1.731984 78% 462 159 621 1.611983 71% 487 169 656 1.521982 67% 571 201 772 1.301981 74% 544 221 764 1.311980 83% 568 218 786 1.271979 87% 530 205 735 1.361978 83% 531 192 723 1.381977 80% 530 197 728 1.381976 78% 549 222 771 1.301975 73% 593 240 834 1.201974 90% 553 215 768 1.301973 94% 560 209 770 1.301972 93% 568 213 781 1.28

December 31, 2012 Page 2
Labor Efficiency
1
1.5
2
2.5
3
3.5
73 75 77 79 81 83 85 87 89 91 93 95 97 99 01 03 05 07 09 11
U.S. & Canadian Cement Industry
-15
-10
-5
0
5
10
15
00 01 02 03 04 05 06 07 08 09 10 11 12
Manufacturing Non-Farm Business Cement
Output Per Employee Hour
Metric Tons per Employee Hour
Year-YearPercent Change
United States
Portland Cement Industry Tables


U.S. Labor Productivity(Equivalent Tons (1) per Employee Hour)
December 31, 2012 Page 5
Energy Consumption by Type of U.S. Cement Plant(Million BTU per Equivalent Tons (1))
Energy Consumption by Type of U.S. Cement Plant(Gigajoules per Equivalent Tons (1))
% Change % Change1972 2006 2007 2008 2009 2010 2011 2012 2012/72 2012/2011
All Plants* 1.17 2.97 2.91 2.71 2.38 2.66 2.86 3.04 159.8% 6.3%
Wet Process 1.15 2.15 2.09 1.97 1.74 1.85 2.18 2.53 120.0% 16.1%
Dry Process 1.21 3.15 3.09 2.86 2.45 2.74 2.91 3.07 153.7% 5.5%
(1) Metric tons used to measure labor efficiency are an equivalent ton measure composed of 85% clinker production plus 15% finished cement production
* Grinding only and white cement plants not included
% Change % Change1972 2006 2007 2008 2009 2010 2011 2012 2012/72 2012/2011
All Plants* 7.436 4.640 4.703 4.641 4.535 4.453 4.479 4.385 -41.0% -2.1%
Wet Process 7.978 6.464 6.485 6.448 6.359 6.714 7.043 6.484 -18.7% -7.9%
Dry Process 6.669 4.367 4.434 4.384 4.383 4.303 4.332 4.269 -36.0% -1.5%No Preheater 5.738 5.717 5.575 5.541 6.065 5.967 5.886 -1.4%Preheater 4.410 4.646 4.556 4.774 4.714 5.050 4.676 -7.4%Precalciner 4.095 4.151 4.165 4.193 4.101 4.110 4.094 -0.4%Preheater/Precalciner** 4.152 4.235 4.227 4.275 4.180 4.224 4.162 -1.5%
% Change % Change1972 2006 2007 2008 2009 2010 2011 2012 2011/72 2012/2011
All Plants* 7.845 4.895 4.962 4.897 4.785 4.698 4.726 4.626 -41.0% -2.1%
Wet Process 8.417 6.820 6.842 6.803 6.709 7.084 7.431 6.841 -18.7% -7.9%
Dry Process 7.036 4.607 4.678 4.625 4.624 4.540 4.571 4.504 -36.0% -1.5%
(1) Metric tons used to measure energy efficiency are an equivalent ton measure composed of 92% clinker production plus 8% finished cement production
* Grinding only and white cement plants not included** Includes plants that are Preheater only

Distribution of Energy Consumption*(U.S. Cement Plants)
Alternative Fuel Summary(U.S. Cement Plants)
December 31, 2012 Page 6
1972 2005 2006 2007 2008 2009 2010 2011 2012
Coal and Coke 36.1% 75.4% 75.8% 75.6% 74.3% 69.9% 70.8% 69.7% 63.3%
Natural Gas 45.1% 3.6% 3.2% 3.0% 2.6% 3.8% 2.9% 3.9% 11.1%
Petroleum Products 12.2% 0.8% 0.9% 0.9% 1.1% 1.3% 1.2% 1.0% 1.0%
Electricity 6.6% 11.0% 11.2% 11.1% 11.3% 12.8% 12.1% 11.4% 11.6%
Alternative Fuels 0.0% 9.2% 8.9% 9.4% 10.7% 12.2% 13.0% 14.0% 13.0%
Total Fuel 100.0% 100.0% 100.0% 100.0% 100.0% 100.0% 100.0% 100.0% 100.0%
* Based on Btu's consumed
2003 2004 2005 2006 2007 2008 2009 2010 2011 2012
Total Plants Reporting 97 96 96 98 98 97 90 88 84 84Plants using Alternative Fuels 56 62 64 65 64 66 63 64 62 63
Percent 58% 65% 67% 66% 65% 68% 70% 73% 74% 75%
Types of Alternative Fuels Utilized*Tire Derived 35 44 52 47 41 43 40 39 37 36Waste Oil 13 16 17 16 15 18 18 16 11 11Solvents 13 12 11 10 10 11 11 11 9 9Other 22 28 36 40 39 42 43 45 49 67
Renewables 13
Other Solid 35
Other 19
*Plants may use more than one type of alternative fuel; Renewable fuels included as 'Other'

U.S. Energy ConsumptionPercent Distribution
(Based on BTU’s consumed)
December 31, 2012 Page 7
Natural Gas, 45.1%
Coal & Coke, 36.1%
Electricity,6.6%
Petroleum Products,
12.2%
1972
Natural Gas, 11.1%
Coal & Coke, 63.3%
Electricity, 11.6%
Petroleum Products,
1.0%
Alternative Fuels, 13.0%
2012
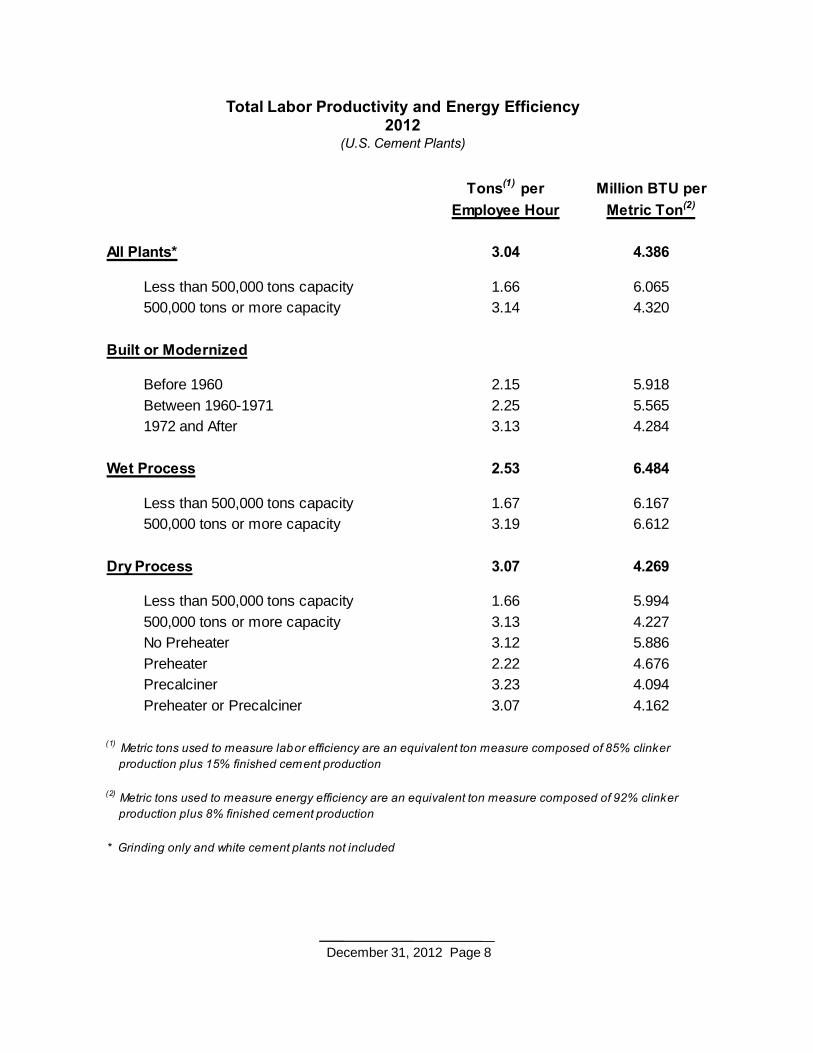
Total Labor Productivity and Energy Efficiency2012
(U.S. Cement Plants)
December 31, 2012 Page 8
Tons(1) per Million BTU perEmployee Hour Metric Ton(2)
All Plants* 3.04 4.386
Less than 500,000 tons capacity 1.66 6.065500,000 tons or more capacity 3.14 4.320
Built or Modernized
Before 1960 2.15 5.918Between 1960-1971 2.25 5.5651972 and After 3.13 4.284
Wet Process 2.53 6.484
Less than 500,000 tons capacity 1.67 6.167500,000 tons or more capacity 3.19 6.612
Dry Process 3.07 4.269
Less than 500,000 tons capacity 1.66 5.994500,000 tons or more capacity 3.13 4.227No Preheater 3.12 5.886Preheater 2.22 4.676Precalciner 3.23 4.094Preheater or Precalciner 3.07 4.162
(1) Metric tons used to measure labor efficiency are an equivalent ton measure composed of 85% clinker production plus 15% finished cement production
(2) Metric tons used to measure energy efficiency are an equivalent ton measure composed of 92% clinker production plus 8% finished cement production
* Grinding only and white cement plants not included

U.S. Labor Productivity2012
December 31, 2012 Page 9
U.S. Energy Efficiency2012
0.0
2.0
4.0
6.0
8.0
10.0
(1) Equivalent Labor Ton per definition
(2) Equivalent Energy Ton per definition
Metric Tons (1)
Per Employee Hour
Million BTU PerMetric Ton (2)
0.0
0.5
1.0
1.5
2.0
2.5
3.0
3.5

U.S. LABOR AND ENERGY SURVEY - SUMMARY REPORT
All Plants
III. ENERGY INFORMATION
I. INDUSTRY INFORMATION
II. LABOR INFORMATION
Clinker Production 64,122,786Finish Cement Production 69,784,206Annual Practical Clinker Capacity 91,793,978Capacity Utilization Rate (%) 69.9
Metric Tons
Number of EmployeeEmployees Hours Employee Hour
Tons per
8,122 16,701,695
2,491 4,696,590
10,613 21,398,285
6,873 13,979,3682,721 5,376,1661,019 2,042,751
3.89
13.83
3.04
4.6512.0931.81
Direct Labor
Indirect Labor
Total Labor
Hourly LaborSalaried LaborContract Labor
Fuel Type Quantity (Billions)BTUs BTUs
per Ton
Electricity (1000 kWh) 32,895.78
6,054,9001,394,758
30,731
1,086,875266,978
9,641,201
2,141,895.76635,068.12486,235.27
2,093.96354.38
9,895.44167,807.15172,065.39119,692.7346,979.93
509,414.17
Total Fuel: 250,320.52
Total: 283,216.30
3,876,388.77
4,385,802.94
Coal (tons)Petroleum Coke (tons)Natural Gas (millions cu. ft.)
Gasoline (gallons)LPG (gallons)
Alternative Fuel - OilAlternative Fuel - SolventsAlternative Fuel - Tire DerivedAlternative Fuel - Other SolidAlternative Fuel - Misc.
138,314.4241,009.9731,398.98
135.2222.88
639.0110,836.2611,111.247,729.243,033.76
17,257,1353,521,191
34,607.437,611.84
Middle Distillates - Diesel Middle Distillates - Fuel Oil
2,234.80491.54
225,139 52,081.38Renewable (tons) 3,363.19
December 31, 2012 Page 10

U.S. LABOR AND ENERGY SURVEY - SUMMARY REPORT
Less Than 500,000 Clinker Capacity
III. ENERGY INFORMATION
I. INDUSTRY INFORMATION
II. LABOR INFORMATION
Clinker Production 2,405,495Finish Cement Production 2,584,854Annual Practical Clinker Capacity 3,279,204Capacity Utilization Rate (%) 73.4
Metric Tons
Number of EmployeeEmployees Hours Employee Hour
Tons per
593 1,201,496
131 259,779
724 1,461,275
468 954,431188 365,92768 140,917
2.02
9.36
1.66
2.556.65
17.26
Direct Labor
Indirect Labor
Total Labor
Hourly LaborSalaried LaborContract Labor
Fuel Type Quantity (Billions)BTUs BTUs
per Ton
Electricity (1000 kWh) 1,444.94
261,54642,0553,935
37,759
423,489
2,393,176.85520,500.77
1,647,579.65
1,951.596,327.81
708,737.7255,113.0568,572.46
597,122.92
Total Fuel: 13,230.84
Total: 14,675.78
5,467,641.26
6,064,764.18
Coal (tons)Petroleum Coke (tons)Natural Gas (millions cu. ft.)
Gasoline (gallons)Alternative Fuel - OilAlternative Fuel - SolventsAlternative Fuel - Tire DerivedAlternative Fuel - Other Solid
5,791.121,259.533,986.89
4.7215.31
1,715.03133.37165.93
1,167,40855,947
62,474.823,206.52
Middle Distillates - Diesel Middle Distillates - Fuel Oil
151.187.76
December 31, 2012 Page 11

U.S. LABOR AND ENERGY SURVEY - SUMMARY REPORT
500,000 and Greater Clinker Capacity
III. ENERGY INFORMATION
I. INDUSTRY INFORMATION
II. LABOR INFORMATION
Clinker Production 61,717,291Finish Cement Production 67,199,352Annual Practical Clinker Capacity 88,514,774Capacity Utilization Rate (%) 69.7
Metric Tons
Number of EmployeeEmployees Hours Employee Hour
Tons per
7,529 15,500,199
2,360 4,436,811
9,889 19,937,010
6,405 13,024,9372,533 5,010,239
951 1,901,834
4.03
14.10
3.14
4.8012.4832.88
Direct Labor
Indirect Labor
Total Labor
Hourly LaborSalaried LaborContract Labor
Fuel Type Quantity (Billions)BTUs BTUs
per Ton
Electricity (1000 kWh) 31,450.83
5,793,3541,352,703
26,796
1,049,116266,978
9,217,712
2,132,112.92639,528.44441,021.95
2,099.50368.17
10,034.34146,747.70176,618.56121,682.9448,808.95
505,999.51
Total Fuel: 237,089.68
Total: 268,540.52
3,814,438.32
4,320,437.83
Coal (tons)Petroleum Coke (tons)Natural Gas (millions cu. ft.)
Gasoline (gallons)LPG (gallons)
Alternative Fuel - OilAlternative Fuel - SolventsAlternative Fuel - Tire DerivedAlternative Fuel - Other SolidAlternative Fuel - Misc.
132,523.3139,750.4427,412.10
130.5022.88
623.699,121.23
10,977.887,563.313,033.76
16,089,7273,465,244
33,522.507,783.35
Middle Distillates - Diesel Middle Distillates - Fuel Oil
2,083.62483.78
225,139 54,109.00Renewable (tons) 3,363.19
December 31, 2012 Page 12

U.S. LABOR AND ENERGY SURVEY - SUMMARY REPORT
Built or Modernized Before 1960
III. ENERGY INFORMATION
I. INDUSTRY INFORMATION
II. LABOR INFORMATION
Clinker Production 791,025Finish Cement Production 822,471Annual Practical Clinker Capacity 949,709Capacity Utilization Rate (%) 83.3
Metric Tons
Number of EmployeeEmployees Hours Employee Hour
Tons per
139 285,683
44 83,611
183 369,294
133 275,63748 89,5612 4,096
2.79
9.52
2.15
2.898.88
194.27
Direct Labor
Indirect Labor
Total Labor
Hourly LaborSalaried LaborContract Labor
Fuel Type Quantity (Billions)BTUs BTUs
per Ton
Electricity (1000 kWh) 424.22
27,66539,4431,168
2,912
124,333
853,753.911,497,117.501,515,687.01
458.96296.30
571,143.14904,277.11
534,596.88
Total Fuel: 4,271.71
Total: 4,695.94
5,383,108.63
5,917,705.50
Coal (tons)Petroleum Coke (tons)Natural Gas (millions cu. ft.)
Gasoline (gallons)Alternative Fuel - OilAlternative Fuel - SolventsAlternative Fuel - Tire Derived
677.491,188.021,202.76
0.360.24
453.23717.58
247,405 40,374.69Middle Distillates - Diesel 32.04
December 31, 2012 Page 13

U.S. LABOR AND ENERGY SURVEY - SUMMARY REPORT
Built or Modernized Between 1960-1971
III. ENERGY INFORMATION
I. INDUSTRY INFORMATION
II. LABOR INFORMATION
Clinker Production 4,057,037Finish Cement Production 4,776,631Annual Practical Clinker Capacity 6,345,580Capacity Utilization Rate (%) 63.9
Metric Tons
Number of EmployeeEmployees Hours Employee Hour
Tons per
641 1,251,701
303 602,379
944 1,854,080
627 1,236,423256 501,57061 116,087
3.33
6.91
2.25
3.378.30
35.88
Direct Labor
Indirect Labor
Total Labor
Hourly LaborSalaried LaborContract Labor
Fuel Type Quantity (Billions)BTUs BTUs
per Ton
Electricity (1000 kWh) 2,277.45
623,91348,7101,118
49,274
667,481
3,367,923.14354,828.58279,434.56
1,497.773,721.46
663,044.38210,207.4687,550.681,602.71
553,502.77
Total Fuel: 20,618.97
Total: 22,896.42
5,011,166.52
5,564,669.29
Coal (tons)Petroleum Coke (tons)Natural Gas (millions cu. ft.)
Gasoline (gallons)Alternative Fuel - OilAlternative Fuel - SolventsAlternative Fuel - Tire DerivedAlternative Fuel - Other SolidAlternative Fuel - Misc.
13,857.671,459.981,149.76
6.1615.31
2,728.17864.92360.24
6.59
799,449480,453
25,161.2616,194.51
Middle Distillates - Diesel Middle Distillates - Fuel Oil
103.5366.63
December 31, 2012 Page 14

U.S. LABOR AND ENERGY SURVEY - SUMMARY REPORT
Built or Modernized 1972 and After
III. ENERGY INFORMATION
I. INDUSTRY INFORMATION
II. LABOR INFORMATION
Clinker Production 59,274,724Finish Cement Production 64,185,104Annual Practical Clinker Capacity 84,498,689Capacity Utilization Rate (%) 70.1
Metric Tons
Number of EmployeeEmployees Hours Employee Hour
Tons per
7,342 15,164,311
2,144 4,010,600
9,486 19,174,911
6,113 12,467,3082,417 4,785,035
956 1,922,568
3.96
14.96
3.13
4.8112.5431.21
Direct Labor
Indirect Labor
Total Labor
Hourly LaborSalaried LaborContract Labor
Fuel Type Quantity (Billions)BTUs BTUs
per Ton
Electricity (1000 kWh) 30,194.11
5,403,3221,306,605
28,445
1,034,689266,978
8,849,387
2,074,481.81642,928.40486,804.95
2,156.81383.53
10,448.86128,292.05159,697.21123,501.0550,733.89
506,038.96
Total Fuel: 225,429.84
Total: 255,623.95
3,778,097.41
4,284,136.37
Coal (tons)Petroleum Coke (tons)Natural Gas (millions cu. ft.)
Gasoline (gallons)LPG (gallons)
Alternative Fuel - OilAlternative Fuel - SolventsAlternative Fuel - Tire DerivedAlternative Fuel - Other SolidAlternative Fuel - Misc.
123,779.2638,361.9729,046.46
128.6922.88
623.467,654.879,528.747,369.013,027.17
16,210,2813,040,738
35,182.127,121.23
Middle Distillates - Diesel Middle Distillates - Fuel Oil
2,099.23424.91
225,139 56,365.50Renewable (tons) 3,363.19
December 31, 2012 Page 15

U.S. LABOR AND ENERGY SURVEY - SUMMARY REPORT
Wet Process
III. ENERGY INFORMATION
I. INDUSTRY INFORMATION
II. LABOR INFORMATION
Clinker Production 3,394,329Finish Cement Production 3,689,157Annual Practical Clinker Capacity 4,152,597Capacity Utilization Rate (%) 81.7
Metric Tons
Number of EmployeeEmployees Hours Employee Hour
Tons per
501 987,739
194 371,830
695 1,359,569
463 931,882193 366,95539 60,732
3.48
9.25
2.53
3.699.37
56.62
Direct Labor
Indirect Labor
Total Labor
Hourly LaborSalaried LaborContract Labor
Fuel Type Quantity (Billions)BTUs BTUs
per Ton
Electricity (1000 kWh) 1,580.40
499,021107,909
1,779
18,799
463,188
3,307,520.23950,877.67536,168.12
687.914,548.81
501,778.11622,433.7865,616.75
462,386.42
Total Fuel: 20,579.71
Total: 22,160.10
6,021,129.15
6,483,515.57
Coal (tons)Petroleum Coke (tons)Natural Gas (millions cu. ft.)
Gasoline (gallons)Alternative Fuel - OilAlternative Fuel - SolventsAlternative Fuel - Tire DerivedAlternative Fuel - Other Solid
11,304.823,250.021,832.58
2.3515.55
1,715.032,127.43
224.27
771,40955,947
29,227.602,270.18
Middle Distillates - Diesel Middle Distillates - Fuel Oil
99.907.76
December 31, 2012 Page 16
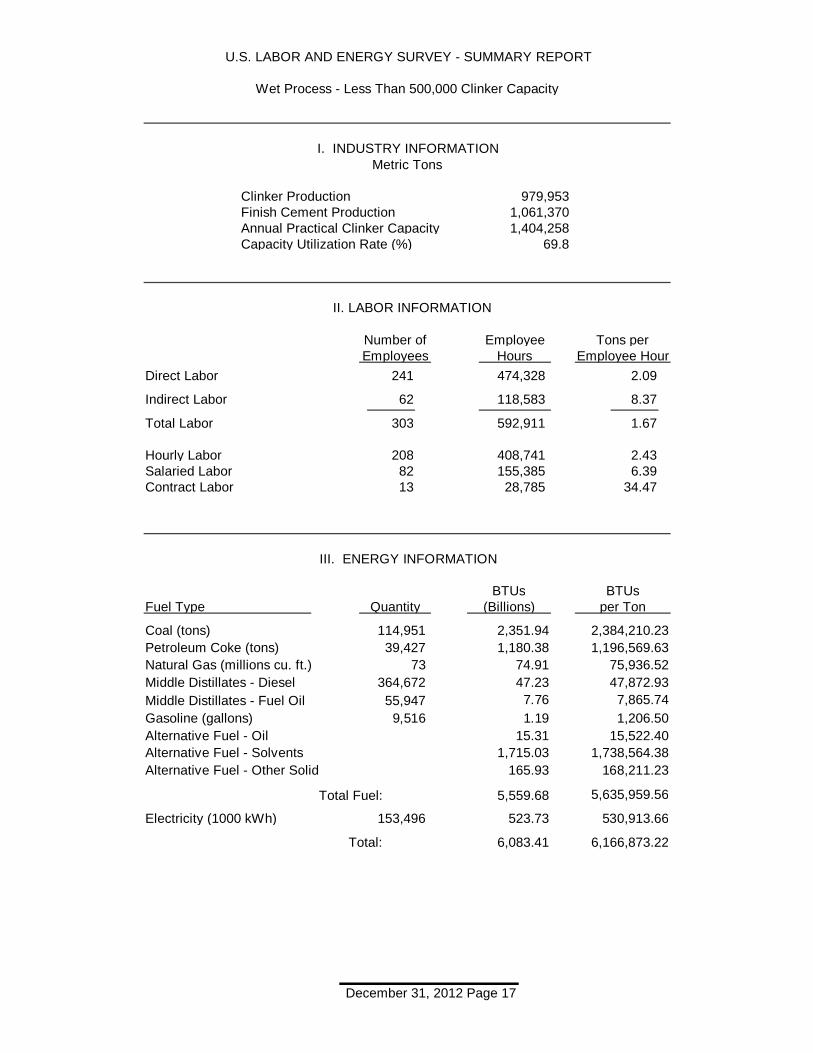
U.S. LABOR AND ENERGY SURVEY - SUMMARY REPORT
Wet Process - Less Than 500,000 Clinker Capacity
III. ENERGY INFORMATION
I. INDUSTRY INFORMATION
II. LABOR INFORMATION
Clinker Production 979,953Finish Cement Production 1,061,370Annual Practical Clinker Capacity 1,404,258Capacity Utilization Rate (%) 69.8
Metric Tons
Number of EmployeeEmployees Hours Employee Hour
Tons per
241 474,328
62 118,583
303 592,911
208 408,74182 155,38513 28,785
2.09
8.37
1.67
2.436.39
34.47
Direct Labor
Indirect Labor
Total Labor
Hourly LaborSalaried LaborContract Labor
Fuel Type Quantity (Billions)BTUs BTUs
per Ton
Electricity (1000 kWh) 523.73
114,95139,427
73
9,516
153,496
2,384,210.231,196,569.63
75,936.52
1,206.5015,522.40
1,738,564.38168,211.23
530,913.66
Total Fuel: 5,559.68
Total: 6,083.41
5,635,959.56
6,166,873.22
Coal (tons)Petroleum Coke (tons)Natural Gas (millions cu. ft.)
Gasoline (gallons)Alternative Fuel - OilAlternative Fuel - SolventsAlternative Fuel - Other Solid
2,351.941,180.38
74.91
1.1915.31
1,715.03165.93
364,67255,947
47,872.937,865.74
Middle Distillates - Diesel Middle Distillates - Fuel Oil
47.237.76
December 31, 2012 Page 17

U.S. LABOR AND ENERGY SURVEY - SUMMARY REPORT
Wet Process - 500,000 and Greater Clinker Capacity
III. ENERGY INFORMATION
I. INDUSTRY INFORMATION
II. LABOR INFORMATION
Clinker Production 2,414,376Finish Cement Production 2,627,787Annual Practical Clinker Capacity 2,748,339Capacity Utilization Rate (%) 87.8
Metric Tons
Number of EmployeeEmployees Hours Employee Hour
Tons per
260 513,411
132 253,247
392 766,658
255 523,141111 211,57026 31,947
4.76
9.66
3.19
4.6811.5676.58
Direct Labor
Indirect Labor
Total Labor
Hourly LaborSalaried LaborContract Labor
Fuel Type Quantity (Billions)BTUs BTUs
per Ton
Electricity (1000 kWh) 1,056.67
384,07068,482
1,706
9,283
309,692
3,682,117.49851,197.67722,889.25
477.5196.70
874,962.1723,993.01
434,584.15
Total Fuel: 15,020.02
Total: 16,076.69
6,177,396.79
6,611,980.94
Coal (tons)Petroleum Coke (tons)Natural Gas (millions cu. ft.)
Gasoline (gallons)Alternative Fuel - OilAlternative Fuel - Tire DerivedAlternative Fuel - Other Solid
8,952.882,069.641,757.67
1.160.24
2,127.4358.34
406,737 21,662.99Middle Distillates - Diesel 52.67
December 31, 2012 Page 18

U.S. LABOR AND ENERGY SURVEY - SUMMARY REPORT
Dry Process
III. ENERGY INFORMATION
I. INDUSTRY INFORMATION
II. LABOR INFORMATION
Clinker Production 60,728,457Finish Cement Production 66,095,049Annual Practical Clinker Capacity 87,641,381Capacity Utilization Rate (%) 69.3
Metric Tons
Number of EmployeeEmployees Hours Employee Hour
Tons per
7,621 15,713,956
2,297 4,324,760
9,918 20,038,716
6,410 13,047,4862,528 5,009,211
980 1,982,019
3.92
14.23
3.07
4.7212.2831.05
Direct Labor
Indirect Labor
Total Labor
Hourly LaborSalaried LaborContract Labor
Fuel Type Quantity (Billions)BTUs BTUs
per Ton
Electricity (1000 kWh) 31,315.38
5,555,8791,286,849
28,952
1,068,076266,978
9,178,013
2,076,752.70617,418.52483,444.68
2,172.54374.18
10,194.25149,142.57146,895.72122,714.8749,605.49
512,042.41
Total Fuel: 229,740.82
Total: 261,056.20
3,756,526.02
4,268,568.43
Coal (tons)Petroleum Coke (tons)Natural Gas (millions cu. ft.)
Gasoline (gallons)LPG (gallons)
Alternative Fuel - OilAlternative Fuel - SolventsAlternative Fuel - Tire DerivedAlternative Fuel - Other SolidAlternative Fuel - Misc.
127,009.6037,759.9529,566.41
132.8722.88
623.469,121.238,983.827,504.973,033.76
16,485,7263,465,244
34,908.097,910.37
Middle Distillates - Diesel Middle Distillates - Fuel Oil
2,134.90483.78
225,139 54,992.04Renewable (tons) 3,363.19
December 31, 2012 Page 19

U.S. LABOR AND ENERGY SURVEY - SUMMARY REPORT
Dry Process - Less Than 500,000 Clinker Capacity
III. ENERGY INFORMATION
I. INDUSTRY INFORMATION
II. LABOR INFORMATION
Clinker Production 1,425,542Finish Cement Production 1,523,484Annual Practical Clinker Capacity 1,874,946Capacity Utilization Rate (%) 76.0
Metric Tons
Number of EmployeeEmployees Hours Employee Hour
Tons per
352 727,168
69 141,196
421 868,364
260 545,690106 210,54255 112,132
1.98
10.20
1.66
2.646.84
12.84
Direct Labor
Indirect Labor
Total Labor
Hourly LaborSalaried LaborContract Labor
Fuel Type Quantity (Billions)BTUs BTUs
per Ton
Electricity (1000 kWh) 921.22
146,5952,6283,863
28,243
269,993
2,399,347.7755,222.94
2,729,201.27
2,464.3793,042.44
642,688.84
Total Fuel: 7,671.16
Total: 8,592.37
5,351,802.80
5,994,491.64
Coal (tons)Petroleum Coke (tons)Natural Gas (millions cu. ft.)
Gasoline (gallons)Alternative Fuel - Tire Derived
3,439.1779.16
3,911.98
3.53133.37
802,736 72,524.00Middle Distillates - Diesel 103.95
December 31, 2012 Page 20

U.S. LABOR AND ENERGY SURVEY - SUMMARY REPORT
Dry Process - 500,000 and Greater Clinker Capacity
III. ENERGY INFORMATION
I. INDUSTRY INFORMATION
II. LABOR INFORMATION
Clinker Production 59,302,915Finish Cement Production 64,571,565Annual Practical Clinker Capacity 85,766,435Capacity Utilization Rate (%) 69.1
Metric Tons
Number of EmployeeEmployees Hours Employee Hour
Tons per
7,269 14,986,788
2,228 4,183,564
9,497 19,170,352
6,150 12,501,7962,422 4,798,669
925 1,869,887
4.01
14.36
3.13
4.8112.5232.14
Direct Labor
Indirect Labor
Total Labor
Hourly LaborSalaried LaborContract Labor
Fuel Type Quantity (Billions)BTUs BTUs
per Ton
Electricity (1000 kWh) 30,394.16
5,409,2841,284,221
25,090
1,039,833266,978
8,908,020
2,069,010.46630,911.14429,546.81
2,165.53383.16
10,438.91152,721.97148,188.20125,660.0150,796.01
508,906.91
Total Fuel: 222,069.66
Total: 252,463.82
3,718,239.58
4,227,146.49
Coal (tons)Petroleum Coke (tons)Natural Gas (millions cu. ft.)
Gasoline (gallons)LPG (gallons)
Alternative Fuel - OilAlternative Fuel - SolventsAlternative Fuel - Tire DerivedAlternative Fuel - Other SolidAlternative Fuel - Misc.
123,570.4337,680.7925,654.43
129.3422.88
623.469,121.238,850.457,504.973,033.76
15,682,9903,465,244
34,005.318,100.22
Middle Distillates - Diesel Middle Distillates - Fuel Oil
2,030.95483.78
225,139 56,311.84Renewable (tons) 3,363.19
December 31, 2012 Page 21

U.S. LABOR AND ENERGY SURVEY - SUMMARY REPORT
Dry Process - No Preheater
III. ENERGY INFORMATION
I. INDUSTRY INFORMATION
II. LABOR INFORMATION
Clinker Production 3,741,144Finish Cement Production 4,191,339Annual Practical Clinker Capacity 5,042,375Capacity Utilization Rate (%) 74.2
Metric Tons
Number of EmployeeEmployees Hours Employee Hour
Tons per
417 902,626
153 318,768
570 1,221,394
185 370,969374 827,54511 22,880
4.22
11.95
3.12
10.274.60
166.46
Direct Labor
Indirect Labor
Total Labor
Hourly LaborSalaried LaborContract Labor
Fuel Type Quantity (Billions)BTUs BTUs
per Ton
Electricity (1000 kWh) 2,019.98
442,293277,838
1,013
33,263
592,023
2,651,980.802,200,004.38
275,591.46
1,101.42134,260.0744,360.351,745.89
534,788.79
Total Fuel: 20,211.92
Total: 22,231.90
5,351,090.57
5,885,879.35
Coal (tons)Petroleum Coke (tons)Natural Gas (millions cu. ft.)
Gasoline (gallons)Alternative Fuel - Tire DerivedAlternative Fuel - Other SolidAlternative Fuel - Misc.
10,016.958,309.771,040.95
4.16507.12167.56
6.59
771,741424,506
26,459.1615,587.04
Middle Distillates - Diesel Middle Distillates - Fuel Oil
99.9458.87
December 31, 2012 Page 22

U.S. LABOR AND ENERGY SURVEY - SUMMARY REPORT
Dry Process - Preheater
III. ENERGY INFORMATION
I. INDUSTRY INFORMATION
II. LABOR INFORMATION
Clinker Production 6,649,536Finish Cement Production 7,202,818Annual Practical Clinker Capacity 9,650,926Capacity Utilization Rate (%) 68.9
Metric Tons
Number of EmployeeEmployees Hours Employee Hour
Tons per
1,181 2,495,641
266 539,540
1,447 3,035,181
998 2,138,772359 714,43690 181,973
2.70
12.48
2.22
3.159.42
37.00
Direct Labor
Indirect Labor
Total Labor
Hourly LaborSalaried LaborContract Labor
Fuel Type Quantity (Billions)BTUs BTUs
per Ton
Electricity (1000 kWh) 3,907.78
748,9526,5736,108
105,342
1,145,304
2,567,340.9029,565.15
933,564.79
1,968.27
29,764.94242,339.79138,083.56
5,978.58
583,790.73
Total Fuel: 27,393.24
Total: 31,301.01
4,092,330.97
4,676,121.70
Coal (tons)Petroleum Coke (tons)Natural Gas (millions cu. ft.)
Gasoline (gallons)
Alternative Fuel - OilAlternative Fuel - Tire DerivedAlternative Fuel - Other SolidAlternative Fuel - Misc.
17,185.26197.90
6,249.09
13.18
199.241,622.17
924.3040.02
2,067,247469,801
39,993.519,733.89
Middle Distillates - Diesel Middle Distillates - Fuel Oil
267.7165.16
39,267 93,997.58Renewable (tons) 629.20
December 31, 2012 Page 23
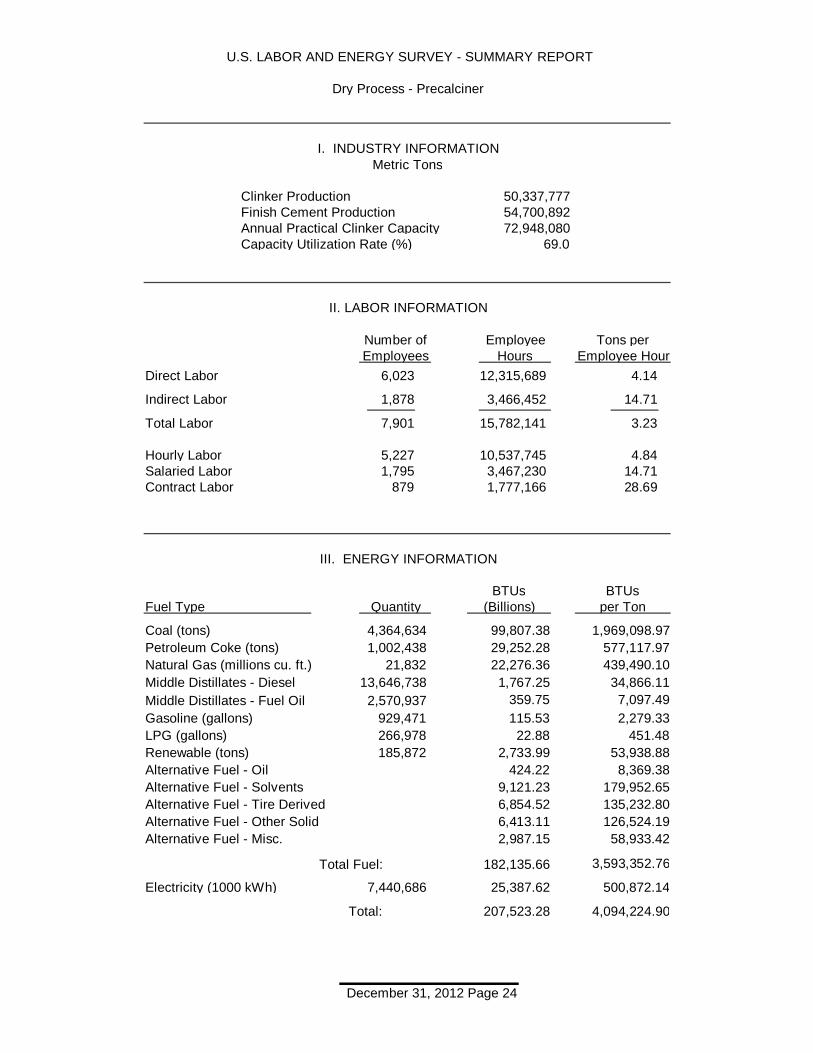
U.S. LABOR AND ENERGY SURVEY - SUMMARY REPORT
Dry Process - Precalciner
III. ENERGY INFORMATION
I. INDUSTRY INFORMATION
II. LABOR INFORMATION
Clinker Production 50,337,777Finish Cement Production 54,700,892Annual Practical Clinker Capacity 72,948,080Capacity Utilization Rate (%) 69.0
Metric Tons
Number of EmployeeEmployees Hours Employee Hour
Tons per
6,023 12,315,689
1,878 3,466,452
7,901 15,782,141
5,227 10,537,7451,795 3,467,230
879 1,777,166
4.14
14.71
3.23
4.8414.7128.69
Direct Labor
Indirect Labor
Total Labor
Hourly LaborSalaried LaborContract Labor
Fuel Type Quantity (Billions)BTUs BTUs
per Ton
Electricity (1000 kWh) 25,387.62
4,364,6341,002,438
21,832
929,471266,978
7,440,686
1,969,098.97577,117.97439,490.10
2,279.33451.48
8,369.38179,952.65135,232.80126,524.1958,933.42
500,872.14
Total Fuel: 182,135.66
Total: 207,523.28
3,593,352.76
4,094,224.90
Coal (tons)Petroleum Coke (tons)Natural Gas (millions cu. ft.)
Gasoline (gallons)LPG (gallons)
Alternative Fuel - OilAlternative Fuel - SolventsAlternative Fuel - Tire DerivedAlternative Fuel - Other SolidAlternative Fuel - Misc.
99,807.3829,252.2822,276.36
115.5322.88
424.229,121.236,854.526,413.112,987.15
13,646,7382,570,937
34,866.117,097.49
Middle Distillates - Diesel Middle Distillates - Fuel Oil
1,767.25359.75
185,872 53,938.88Renewable (tons) 2,733.99
December 31, 2012 Page 24

U.S. LABOR AND ENERGY SURVEY - SUMMARY REPORT
Dry Process - Preheater or Precalciner
III. ENERGY INFORMATION
I. INDUSTRY INFORMATION
II. LABOR INFORMATION
Clinker Production 56,987,313Finish Cement Production 61,903,710Annual Practical Clinker Capacity 82,599,006Capacity Utilization Rate (%) 69.0
Metric Tons
Number of EmployeeEmployees Hours Employee Hour
Tons per
7,204 14,811,330
2,144 4,005,992
9,348 18,817,322
6,225 12,676,5172,154 4,181,666
969 1,959,139
3.90
14.41
3.07
4.5513.8029.46
Direct Labor
Indirect Labor
Total Labor
Hourly LaborSalaried LaborContract Labor
Fuel Type Quantity (Billions)BTUs BTUs
per Ton
Electricity (1000 kWh) 29,295.40
5,113,5861,009,011
27,940
1,034,813266,978
8,585,990
2,038,887.51513,242.61497,126.90
2,243.05398.81
10,865.30158,960.08147,727.48127,872.6652,755.91
510,545.09
Total Fuel: 209,528.90
Total: 238,824.29
3,651,561.60
4,162,106.69
Coal (tons)Petroleum Coke (tons)Natural Gas (millions cu. ft.)
Gasoline (gallons)LPG (gallons)
Alternative Fuel - OilAlternative Fuel - SolventsAlternative Fuel - Tire DerivedAlternative Fuel - Other SolidAlternative Fuel - Misc.
116,992.6429,450.1828,525.45
128.7122.88
623.469,121.238,476.707,337.413,027.17
15,713,9853,040,738
35,464.257,405.05
Middle Distillates - Diesel Middle Distillates - Fuel Oil
2,034.96424.91
225,139 58,611.97Renewable (tons) 3,363.19
December 31, 2012 Page 25

This page intentionally left blank.
December 31, 2012 Page 26

This page intentionally left blank.
December 31, 2012 Page 27


Canadian
Portland Cement Industry Tables


Canadian Labour Productivity(Equivalent Tonnes (1) per Employee Hour)
Energy Consumption by Type of Canadian Cement Plant(Gigajoules per Equivalent Tonnes (1))
December 31, 2011 Page 31
% Change % Change1980 2006 2007 2008 2009 2010 2011 2012 2012/1980 2012/2011
All Plants* 5.326 4.461 4.425 4.504 4.541 4.264 4.234 4.449 -16.5% 5.1%
Wet Process 6.645 NA** NA** NA** NA** NA** NA** NA**
Dry Process 4.711 4.424 4.388 4.484 4.541 4.264 4.234 4.449 -5.6% 5.1%No Preheater 4.913 4.916 5.001 5.347 5.001 4.124 4.902 18.9%Preheater 4.328 4.426 4.625 4.467 3.643 4.297 4.015 -6.6%Precalciner 4.325 4.205 4.248 4.279 4.329 4.231 4.502 6.4%Preheater/Precalciner 4.326 4.283 4.378 4.344 4.093 4.253 4.345 2.2%
(1) Metric tonnes used to measure energy efficiency are an equivalent tonne measure composed of 92% clinker production plus 8% finished cement production
* Grinding only and white cement plants not included** Data withheld due to disclosure restrictions
% Change % Change1980 2006 2007 2008 2009 2010 2011 2012 2012/1980 2012/2011
All Plants* 1.61 3.49 3.18 2.94 2.70 3.13 3.06 3.05 89.4% -0.3%
Wet Process 1.50 NA** NA** NA** NA** NA** NA** NA**
Dry Process 1.70 3.50 3.19 2.99 2.70 3.13 3.06 3.05 79.4`% -0.3%
(1) Metric tonnes used to measure labour efficiency are an equivalent tonne measure composed of 85% clinker production plus 15% finished cement production
* Grinding only and white cement plants not included** Data withheld due to disclosure restrictions

Distribution of Energy Consumption*(Canadian Cement Plants)
Alternative Fuel Summary(Canadian Cement Plants)
December 31, 2011 Page 32
1980 2005 2006 2007 2008 2009 2010 2011 2012
Coal and Coke 25.6% 76.7% 77.8% 76.0% 74.6% 73.7% 73.9% 75.6% 61.5%
Natural Gas 37.4% 3.0% 1.9% 2.0% 2.2% 2.1% 2.1% 1.5% 14.6%
Petroleum Products 26.9% 2.9% 2.0% 1.5% 1.3% 1.5% 1.2% 0.5% 0.9%
Electricity 9.9% 11.7% 12.3% 12.4% 12.9% 13.2% 13.6% 12.8% 13.1%
Alternative Fuels 0.2% 5.7% 6.0% 8.1% 9.0% 9.6% 9.2% 9.6% 9.9%
Total Fuel 100.0% 100.0% 100.0% 100.0% 100.0% 100.0% 100.0% 100.0% 100.0%
* Based on kJoules consumed
2003 2004 2005 2006 2007 2008 2009 2010 2011 2012
Total Plants Reporting 15 15 15 15 15 15 14 14 12 14Plants using Alternative Fuel 7 8 8 8 8 8 8 9 6 7
(Percent) 47% 53% 53% 53% 53% 53% 57% 64% 50% 50%
Types of Alternative Fuels Utilized*Tire Derived 3 4 5 6 5 5 5 5 5 5Waste Oil 5 5 5 5 5 5 5 5 4 5Solvents 2 2 1 1 1 2 2 3 1 3Other Solid 4 5 4 5 4 6 5 5 5 5Other 0 0 1 3 1 2 3 3 1 4
* Plants may use more than one type of waste fuel

Canadian Energy ConsumptionPercent Distribution
(Based on kJoules consumed)
December 31, 2011 Page 33
Natural Gas, 37.4%
Coal & Coke, 25.6%
Electricity, 9.9%
Petroleum, 26.9%
1980
Natural Gas, 14.6%
Coal & Coke, 61.5%
Electricity, 13.1%
Petroleum, 0.9%
Alternative Fuels, 9.6%
2012

Total Labour Productivity and Energy Efficiency
2012
(Canadian Cement Plants)
December 31, 2011 Page 34
Tonnes(1) per Gigajoules perEmployee Hour Metric Tonne(2)
All Plants* 3.05 4.449
Dry Process 3.05 4.449
No Preheater 2.52 4.902Preheater 2.64 4.015Precalciner 3.57 4.502Preheater/Precalciner 3.20 4.345
(1) Metric tonnes used to measure labour efficiency are an equivalent tonne measure composed of 85% clinker production plus 15% finished cement production
(2) Metric tonnes used to measure energy efficiency are an equivalent tonne measure composed of 92% clinker production plus 8% finished cement production
* Grinding only and white cement plants not included

Canadian Labour Productivity2012
December 31, 2011 Page 35
Canadian Energy Efficiency2012
2.0
2.5
3.0
3.5
4.0
4.5
5.0
0.0
0.5
1.0
1.5
2.0
2.5
3.0
3.5
4.0
Metric Tonnes (1) Per Employee Hour
Gigajoules Per Metric Tonne (2)
(1) Equivalent Labour Tonne per definition
(2) Equivalent EnergyTonne per definition

CANADIAN LABOUR AND ENERGY SURVEY - SUMMARY REPORT
All Plants
III. ENERGY INFORMATION
I. INDUSTRY INFORMATION
II. LABOUR INFORMATION
Clinker Production 11,413,658Finish Cement Production 11,584,624Annual Practical Clinker Capacity 14,220,686Capacity Utilization Rate (%) 80.3
Metric Tonnes
Number of EmployeeEmployees Hours Employee Hour
Tonnes per
1,530 3,085,247
332 669,705
1,862 3,754,952
1,303 2,616,514380 765,925179 372,513
3.71
17.08
3.05
4.3714.9430.71
Direct Labour
Indirect Labour
Total Labour
Hourly LabourSalaried LabourContract Labour
Fuel Type Quantity (Billions)kJoules kJoules
per Tonne
Electricity (1000 kWh) 6,643.34
607,618480,261214,995
295,802361,008
1,846,399
1,385,361.871,350,481.70
652,377.25
1,299.11721.90
46,059.3773,455.99
107,018.46181,784.64
6,504.28
581,355.45
Total Fuel: 44,198.19
Total: 50,841.54
3,867,760.12
4,449,115.56
Coal (tonnes)Petroleum Coke (tonnes)Natural Gas (1000 cu. meters)
Gasoline (liters)LPG (liters)
Alternative Fuel - OilAlternative Fuel - SolventsAlternative Fuel - Tire DerivedAlternative Fuel - Other SolidAlternative Fuel - Misc.
15,830.9915,432.417,454.93
14.858.25
526.34839.41
1,222.942,077.31
74.33
5,432,6091,014,989
22,417.5313,832.91
Middle Distillates - Diesel Middle Distillates - Fuel Oil
256.17158.07
23,054 26,445.10Renewable (tonnes) 302.20
December 31, 2012 Page 36

CANADIAN LABOUR AND ENERGY SURVEY - SUMMARY REPORT
Dry Process
III. ENERGY INFORMATION
I. INDUSTRY INFORMATION
II. LABOUR INFORMATION
Clinker Production 11,413,658Finish Cement Production 11,584,624Annual Practical Clinker Capacity 14,220,686Capacity Utilization Rate (%) 80.3
Metric Tonnes
Number of EmployeeEmployees Hours Employee Hour
Tonnes per
1,530 3,085,247
332 669,705
1,862 3,754,952
1,303 2,616,514380 765,925179 372,513
3.71
17.08
3.05
4.3714.9430.71
Direct Labour
Indirect Labour
Total Labour
Hourly LabourSalaried LabourContract Labour
Fuel Type Quantity (Billions)kJoules kJoules
per Tonne
Electricity (1000 kWh) 6,643.34
607,618480,261214,995
295,802361,008
1,846,399
1,385,361.871,350,481.70
652,377.25
1,299.11721.90
46,059.3773,455.99
107,018.46181,784.64
6,504.28
581,355.45
Total Fuel: 44,198.19
Total: 50,841.54
3,867,760.12
4,449,115.56
Coal (tonnes)Petroleum Coke (tonnes)Natural Gas (1000 cu. meters)
Gasoline (liters)LPG (liters)
Alternative Fuel - OilAlternative Fuel - SolventsAlternative Fuel - Tire DerivedAlternative Fuel - Other SolidAlternative Fuel - Misc.
15,830.9915,432.417,454.93
14.858.25
526.34839.41
1,222.942,077.31
74.33
5,432,6091,014,989
22,417.5313,832.91
Middle Distillates - Diesel (liters)Middle Distillates - Fuel Oil
256.17158.07
23,054 26,445.10Renewable (tonnes) 302.20
December 31, 2012 Page 37

CANADIAN LABOUR AND ENERGY SURVEY - SUMMARY REPORT
Dry Process - No Preheater
III. ENERGY INFORMATION
I. INDUSTRY INFORMATION
II. LABOUR INFORMATION
Clinker Production 2,125,455Finish Cement Production 2,314,812Annual Practical Clinker Capacity 2,326,432Capacity Utilization Rate (%) 91.4
Metric Tonnes
Number of EmployeeEmployees Hours Employee Hour
Tonnes per
385 712,966
71 143,134
456 856,100
351 647,29687 170,96218 37,842
3.02
15.05
2.52
3.3312.6056.92
Direct Labour
Indirect Labour
Total Labour
Hourly LabourSalaried LabourContract Labour
Fuel Type Quantity (Billions)kJoules kJoules
per Tonne
Electricity (1000 kWh) 1,369.71
128,394110,42216,153
23,571
380,686
1,399,329.941,534,209.90
275,490.81
1,692.2413,583.96
254,855.90708,472.6634,722.25
639,870.11
Total Fuel: 9,123.36
Total: 10,493.07
4,262,049.03
4,901,919.14
Coal (tonnes)Petroleum Coke (tonnes)Natural Gas (1000 cu. meters)
Gasoline (liters)Alternative Fuel - OilAlternative Fuel - Tire DerivedAlternative Fuel - Other SolidAlternative Fuel - Misc.
2,995.413,284.14
589.72
3.6229.08
545.551,516.56
74.33
39,812781,374
16,300.0623,391.32
Middle Distillates - Diesel (liters)Middle Distillates - Fuel Oil
34.8950.07
December 31, 2012 Page 38

CANADIAN LABOUR AND ENERGY SURVEY - SUMMARY REPORT
Dry Process - Preheater
III. ENERGY INFORMATION
I. INDUSTRY INFORMATION
II. LABOUR INFORMATION
Clinker Production 2,989,088Finish Cement Production 3,152,297Annual Practical Clinker Capacity 4,246,839Capacity Utilization Rate (%) 70.4
Metric Tonnes
Number of EmployeeEmployees Hours Employee Hour
Tonnes per
453 969,312
86 172,341
539 1,141,653
325 703,697113 226,295101 211,661
3.11
17.49
2.64
4.2813.3214.24
Direct Labour
Indirect Labour
Total Labour
Hourly LabourSalaried LabourContract Labour
Fuel Type Quantity (Billions)kJoules kJoules
per Tonne
Electricity (1000 kWh) 1,696.47
74,189192,57952,849
120,226
471,504
649,038.902,090,330.69
604,037.42
1,346.53
71,078.99
565,086.48
Total Fuel: 10,357.66
Total: 12,054.13
3,450,085.65
4,015,172.13
Coal (tonnes)Petroleum Coke (tonnes)Natural Gas (1000 cu. meters)
Gasoline (liters)
Alternative Fuel - Tire Derived
1,948.516,275.481,813.41
4.04
213.39
1,702,14445,105
19,636.65552.94
Middle Distillates - Diesel (liters)Middle Distillates - Fuel Oil
58.951.66
2,932 14,063.55Renewable (tonnes) 42.22
December 31, 2012 Page 39

CANADIAN LABOUR AND ENERGY SURVEY - SUMMARY REPORT
Dry Process - Precalciner
III. ENERGY INFORMATION
I. INDUSTRY INFORMATION
II. LABOUR INFORMATION
Clinker Production 6,299,115Finish Cement Production 6,117,515Annual Practical Clinker Capacity 7,647,415Capacity Utilization Rate (%) 82.4
Metric Tonnes
Number of EmployeeEmployees Hours Employee Hour
Tonnes per
692 1,402,969
175 354,230
867 1,757,199
627 1,265,521180 368,66860 123,010
4.47
17.71
3.57
4.9617.0150.99
Direct Labour
Indirect Labour
Total Labour
Hourly LabourSalaried LabourContract Labour
Fuel Type Quantity (Billions)kJoules kJoules
per Tonne
Electricity (1000 kWh) 3,577.16
405,035177,260145,993
152,005361,008
994,209
1,732,345.38934,476.16803,841.08
1,142.561,312.64
79,123.42133,565.8673,831.5989,227.02
569,196.35
Total Fuel: 24,717.18
Total: 28,294.34
3,932,983.65
4,502,180.00
Coal (tonnes)Petroleum Coke (tonnes)Natural Gas (1000 cu. meters)
Gasoline (liters)LPG (liters)
Alternative Fuel - OilAlternative Fuel - SolventsAlternative Fuel - Tire DerivedAlternative Fuel - Other Solid
10,887.085,872.805,051.81
7.188.25
497.26839.41464.00560.75
3,690,653188,510
25,829.6316,921.04
Middle Distillates - Diesel (liters)Middle Distillates - Fuel Oil
162.33106.34
20,122 41,367.28Renewable (tonnes) 259.98
December 31, 2012 Page 40

CANADIAN LABOUR AND ENERGY SURVEY - SUMMARY REPORT
Dry Process - Preheater or Precalciner
III. ENERGY INFORMATION
I. INDUSTRY INFORMATION
II. LABOUR INFORMATION
Clinker Production 9,288,203Finish Cement Production 9,269,812Annual Practical Clinker Capacity 11,894,254Capacity Utilization Rate (%) 78.1
Metric Tonnes
Number of EmployeeEmployees Hours Employee Hour
Tonnes per
1,145 2,372,281
261 526,571
1,406 2,898,852
952 1,969,218293 594,963161 334,671
3.91
17.63
3.20
4.7215.6127.74
Direct Labour
Indirect Labour
Total Labour
Hourly LabourSalaried LabourContract Labour
Fuel Type Quantity (Billions)kJoules kJoules
per Tonne
Electricity (1000 kWh) 5,273.64
479,224369,839198,842
272,231361,008
1,465,713
1,382,142.221,308,132.11
739,250.05
1,208.50888.30
53,544.9990,387.6972,941.7560,382.38
567,867.74
Total Fuel: 35,074.83
Total: 40,348.47
3,776,876.02
4,344,743.76
Coal (tonnes)Petroleum Coke (tonnes)Natural Gas (1000 cu. meters)
Gasoline (liters)LPG (liters)
Alternative Fuel - OilAlternative Fuel - SolventsAlternative Fuel - Tire DerivedAlternative Fuel - Other Solid
12,835.5812,148.276,865.22
11.228.25
497.26839.41677.39560.75
5,392,797233,615
23,827.6111,629.68
Middle Distillates - Diesel (liters)Middle Distillates - Fuel Oil
221.28108.00
23,054 32,540.73Renewable (tonnes) 302.20
December 31, 2012 Page 41

This page intentionally left blank.
December 31, 2012 Page 45

December 31, 2012 Page 43
Contract Employee Count If contract employee count was not provided, but contract employee hours were indicated, the prior year's industry average for hours/contract employee was applied and the total employee count adjusted accordingly.
Annual Clinker ProductionIf annual clinker production was not provided, the value calculated from daily clinker capacity and reported down days provided in the annual Plant Information Survey was recorded.
Heat Content ValuesChanges to default values based on updated information from the Energy Information Administrationare indicated in the accompanying table.
U.S. Conversion Factor (1)
(Btu per Unit - High Heat Value)
Gasoline 125,071/gallonMiddle Distillates - Diesel 129,500/gallonMiddle Distillates - Fuel Oil 138,690/gallonCoal 22,565,000/tonNatural Gas 1,030,000,000/mmft3
Petroleum Coke 30,120,000/tonLPG 85,857/gallonElectricity 3,412,000/000kWhRenewables Specified by respondentAlternative Fuel-Oil Specified by respondent - Range: 95-150,000/gallonAlternative Fuel-Solvents Specified by respondent - Range: 85-100,000/gallonAlternative Fuel-Tire Derived Specified by respondent - Range: 22-35,000,000/tonAlternative Fuel-Other Solid Specified by respondentAlternative Fuel-Other Specified by respondent
Canada Conversion Factor(kJoules per Unit - Low Heat Value)
Gasoline 33,624/litreMiddle Distillates - Diesel 34,634/litreMiddle Distillates - Fuel Oil 36,803/litreCoal 28,066,000/tonneNatural Gas 34,313,000/000m3
Petroleum Coke 32,701,500/tonneLPG 22,851/litreElectricity 3,598,000/000kWhRenewables Specified by respondentAlternative Fuel-Oil Specified by respondent - Range: 33-35,000/litreAlternative Fuel-Solvents Specified by respondent - Range: 25-27,000,000/tonneAlternative Fuel-Tire Derived Specified by respondent - Range: 24-30,000,000/tonneAlternative Fuel-Other Solid Specified by respondentAlternative Fuel-Other Specified by respondent(1) Energy Information Administration, Manufacturing Consumption of Energy - 1994
APPENDIX
U.S. and Canadian Labor-Energy SurveyDefault Heat Content Values


PORTLAND CEMENT ASSOCIATION
MEMBER COMPANIES
© 2013 Portland Cement AssociationAll rights reserved
Alamo Cement CompanyAmerican Cement Company, LLC
Ash Grove Cement CompanyBuzzi Unicem USA Inc.
CalPortlandCapitol Aggregates, Ltd.
CEMEXContinental CementDrake Cement LLC
Essroc Cement Corp.Federal White Cement Ltd.
GCC of America, Inc.Lafarge North America Inc.
Lehigh Hanson, Inc.Mitsubishi Cement CorporationThe Monarch Cement CompanyNational Cement Company, Inc.
Phoenix Cement Company (Salt River Materials Group)St. Marys Cement Inc. (Canada)/VCNA
St. Marys Cement Inc. (U.S)/VCNASuwannee American Cement/VCNA
Texas Industries Inc.Titan America LLC


