67
©2012 Waters Corporation 1

©2012 Waters Corporation 1
©2012 Waters Corporation 2
©2012 Waters Corporation 3
©2012 Waters Corporation 4
©2012 Waters Corporation 5

Waters UPC² Workshop Series
Applications
©2012 Waters Corporation 6

Lipids
©2012 Waters Corporation 7
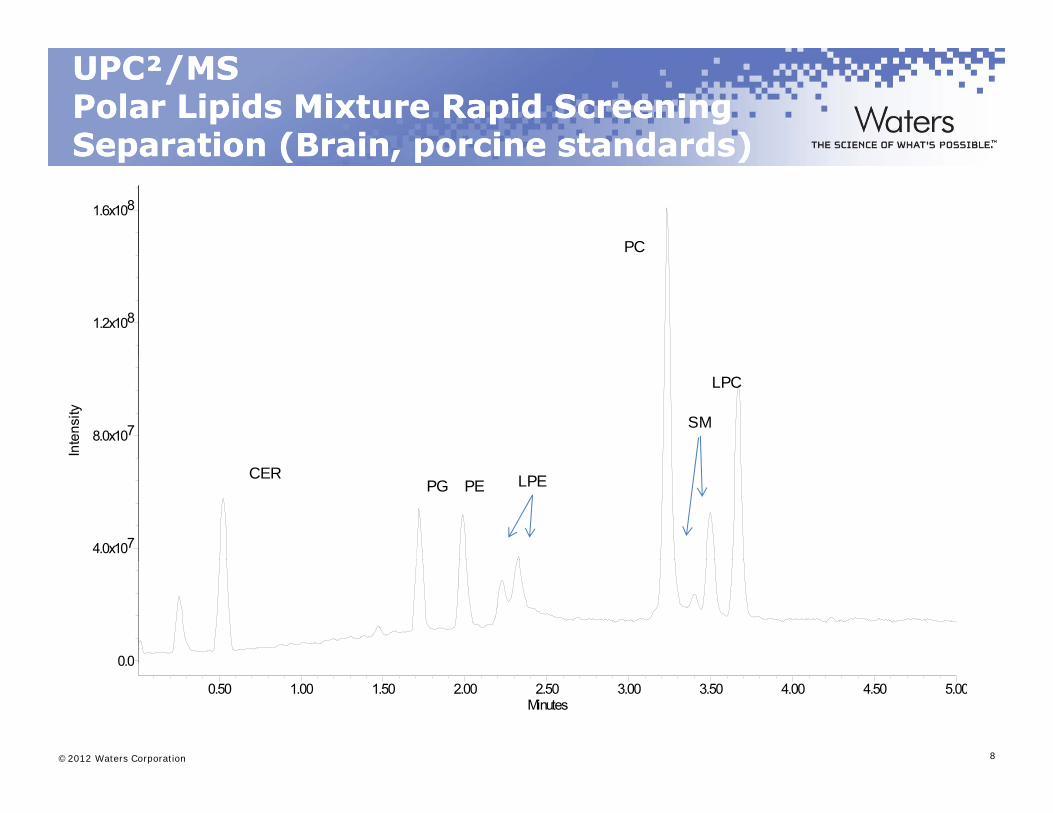
UPC²/MSUPC²/MSPolar Lipids Mixture Rapid Screening Polar Lipids Mixture Rapid Screening Separation (Brain, porcine standards)Separation (Brain, porcine standards)Separation (Brain, porcine standards)Separation (Brain, porcine standards)
1.6x10⁸
PC
1.2x10⁸
Inte
nsity
8.0x10⁷
LPC
SM
4.0x10⁷
CERPG PE LPE
00
©2012 Waters Corporation 8
0.0
Minutes0.50 1.00 1.50 2.00 2.50 3.00 3.50 4.00 4.50 5.00
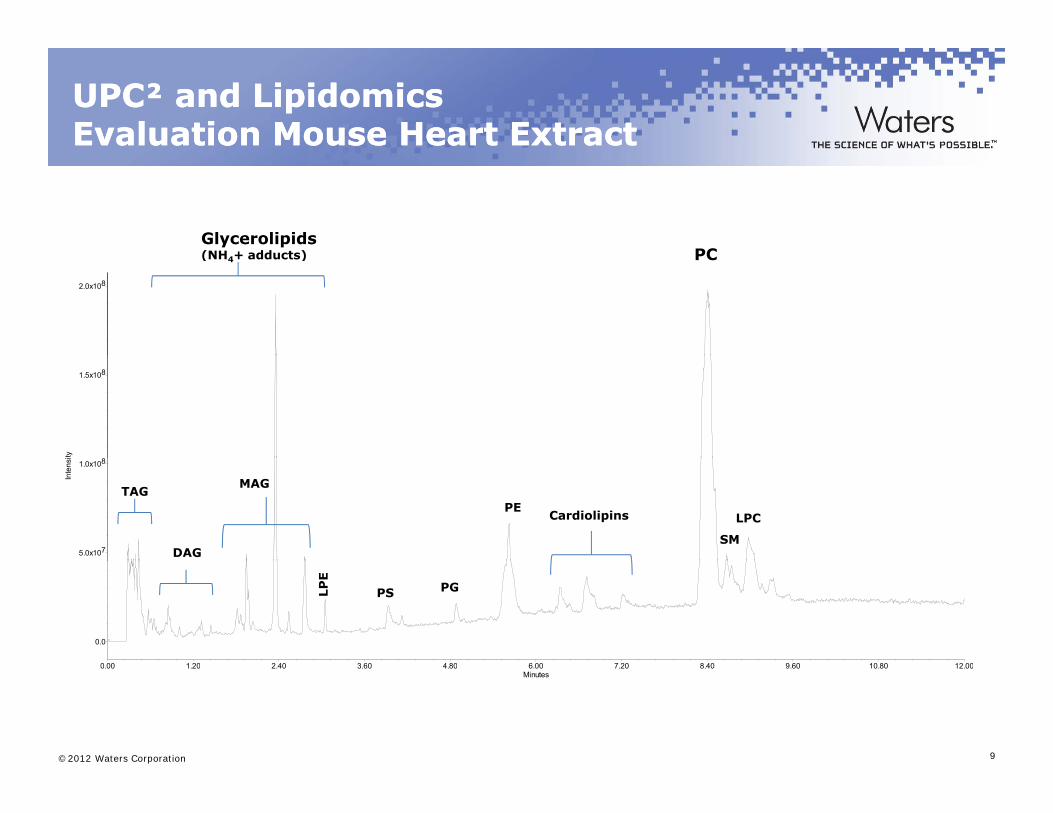
UPC² and LipidomicsUPC² and LipidomicsEvaluation Mouse Heart ExtractEvaluation Mouse Heart Extract
Glycerolipids(NH + adducts) PC
2.0x10⁸
(NH4+ adducts) PC
ty
1.5x10⁸
Inte
nsi
5.0x10⁷
1.0x10⁸
PE
SM
Cardiolipins
TAG
DAG
MAG
LPC
0.0
0 00 1 20 2 40 3 60 4 80 6 00 7 20 8 40 9 60 10 80 12 00
LP
E
PGPS
©2012 Waters Corporation 9
Minutes0.00 1.20 2.40 3.60 4.80 6.00 7.20 8.40 9.60 10.80 12.00
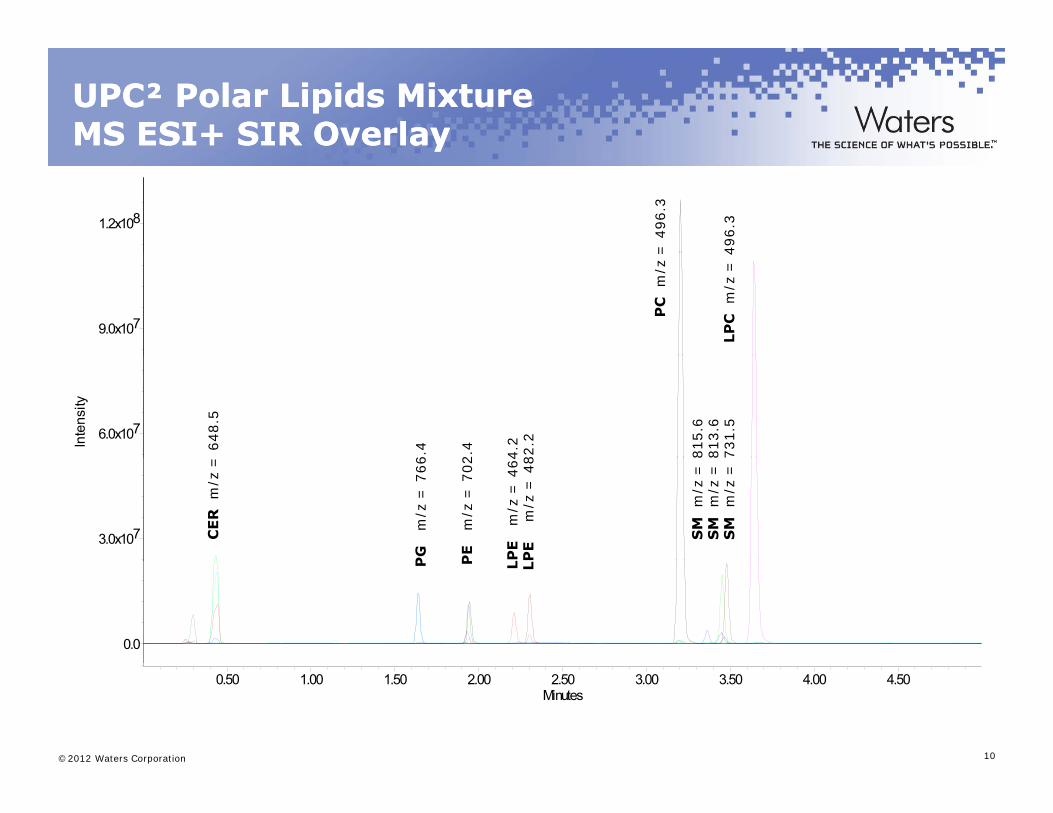
UPC² Polar Lipids Mixture UPC² Polar Lipids Mixture MS ESI+ SIR OverlayMS ESI+ SIR Overlayyy
1.2x10⁸
496.3
= 4
96.3
9.0x10⁷
LP
Cm
/z =
4
PC
m/z
=
Inte
nsity
6.0x10⁷
4.2
82.2
= 6
48.5
2.4 731.5
813.6
6.4 815.6
3.0x10⁷P
Em
/z =
464
PE
m/z
= 4
8
CE
Rm
/z =
PE
m/z
= 7
02
SM
m
/z =
S
M m
/z =
PG
m/z
= 7
66
SM
m
/z =
0.0
L LPP
©2012 Waters Corporation 10
Minutes0.50 1.00 1.50 2.00 2.50 3.00 3.50 4.00 4.50

Vitamins
©2012 Waters Corporation 11
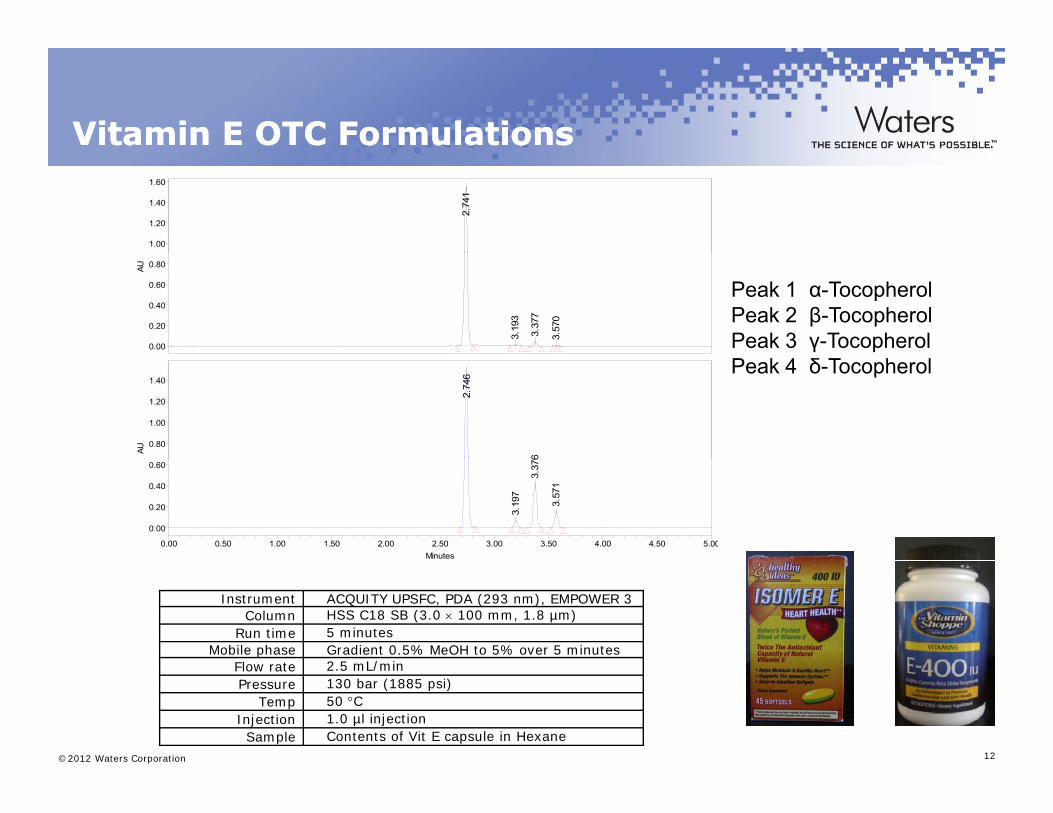
Vitamin E OTC FormulationsVitamin E OTC Formulations
2.74
1
1.00
1.20
1.40
1.60
3.19
3
3.37
7
3.57
0
AU
0.00
0.20
0.40
0.60
0.80
Peak 1 α-TocopherolPeak 2 β-TocopherolPeak 3 γ-Tocopherol
2.74
6
6AU
0.80
1.00
1.20
1.40Peak 4 δ-Tocopherol
3.19
7
3.37
6
3.57
1
0.00
0.20
0.40
0.60
Minutes0.00 0.50 1.00 1.50 2.00 2.50 3.00 3.50 4.00 4.50 5.00
Instrument ACQUITY UPSFC, PDA (293 nm), EMPOWER 3Column HSS C18 SB (3.0 100 mm, 1.8 µm)
Run time 5 minutesMobile phase Gradient 0.5% MeOH to 5% over 5 minutes
Fl t 2 5 L/ i
©2012 Waters Corporation 12
Flow rate 2.5 mL/minPressure 130 bar (1885 psi)
Temp 50 CInjection 1.0 µl injectionSample Contents of Vit E capsule in Hexane
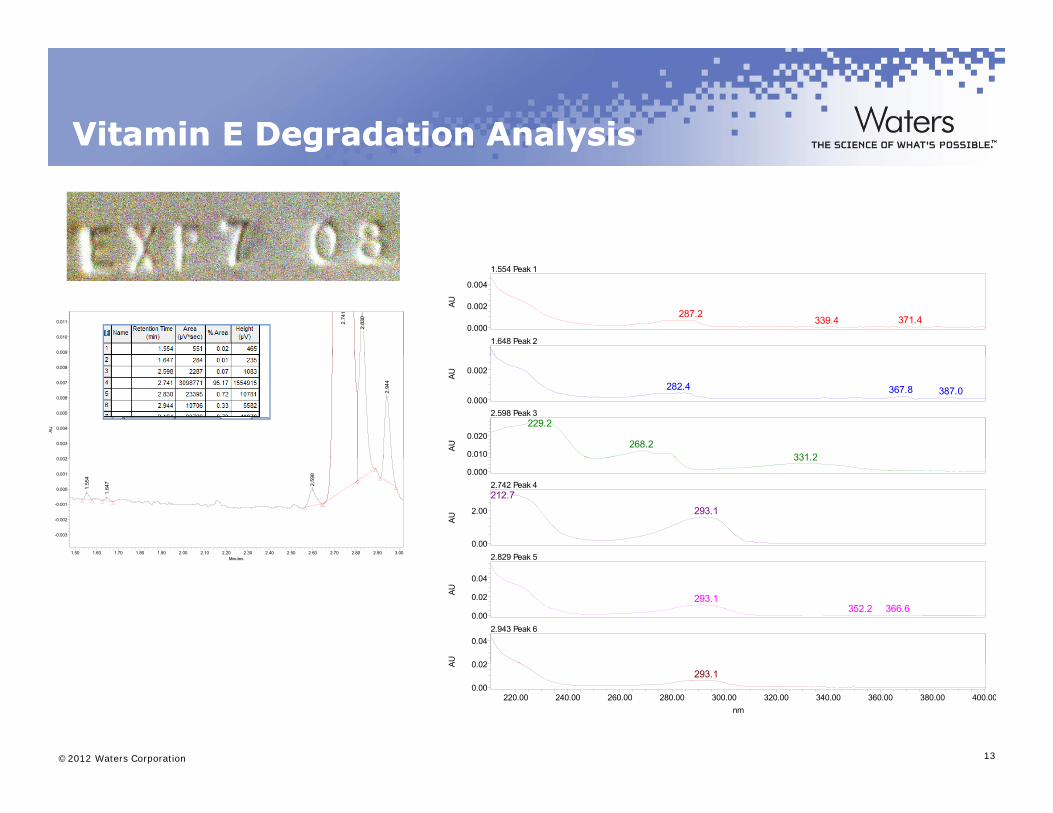
Vitamin Vitamin E E Degradation Analysis Degradation Analysis g yg y
2.74
1
2.83
0
0.009
0.010
0.011
1.554 Peak 1
287.2339.4 371.4
AU
0.000
0.002
0.004
1.648 Peak 2
2.94
4
AU
0 002
0.003
0.004
0.005
0.006
0.007
0.008
282.4 367.8 387.0
AU
0.000
0.002
2.598 Peak 3229.2
268.2331 2
AU0.010
0.020
1.55
4
1.64
7 2.59
8
-0.003
-0.002
-0.001
0.000
0.001
0.002
Minutes1.50 1.60 1.70 1.80 1.90 2.00 2.10 2.20 2.30 2.40 2.50 2.60 2.70 2.80 2.90 3.00
331.20.000
2.742 Peak 4212.7
293.1
AU
0.00
2.00
2.829 Peak 5
293.1352.2 366.6
AU
0.00
0.02
0.04
2.943 Peak 6
AU 0 02
0.04
©2012 Waters Corporation 13
293.1
A
0.00
0.02
nm220.00 240.00 260.00 280.00 300.00 320.00 340.00 360.00 380.00 400.00
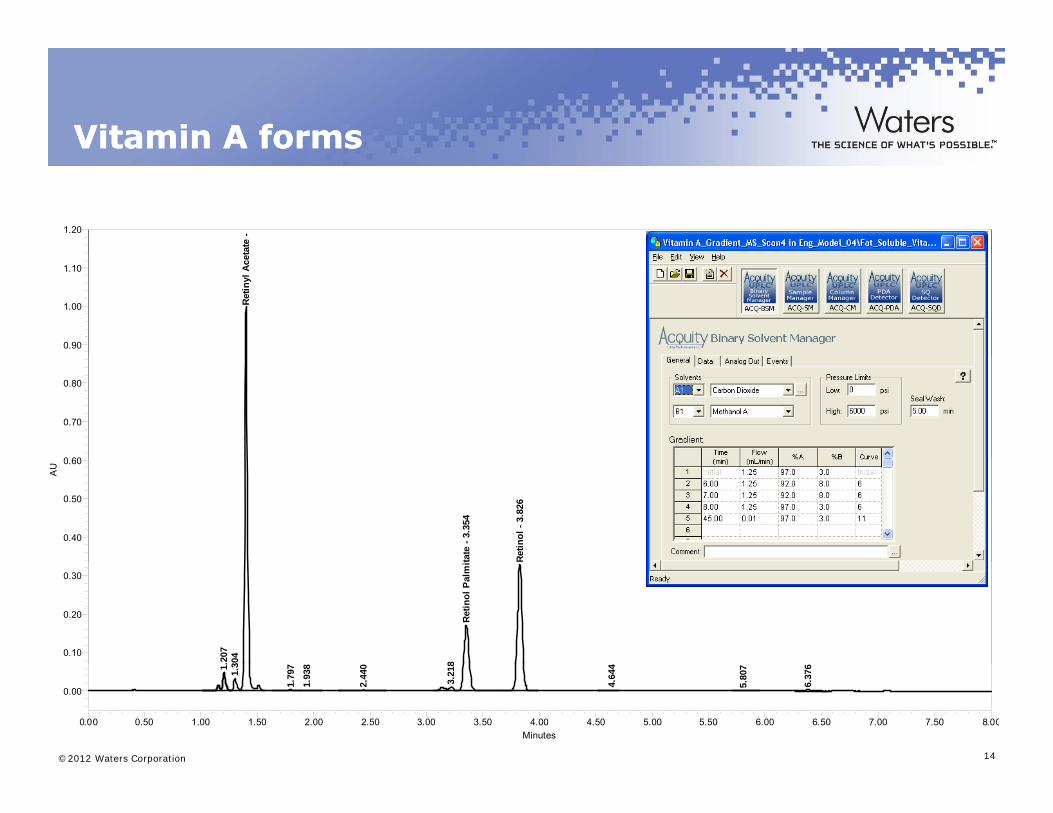
Vitamin A formsVitamin A forms
tate
- 1.20
Ret
inyl
Ace
t
0.90
1.00
1.10
0 60
0.70
0.80
tate
- 3.
354
Retin
ol -
3.82
6
AU
0.40
0.50
0.60
207
04 8Re
tinol
Pal
mit R
0.10
0.20
0.30
©2012 Waters Corporation 14
1. 1.3
1.79
71.
938
2.44
0
3.21
8
4.64
4
5.80
7
6.37
6
0.00
Minutes0.00 0.50 1.00 1.50 2.00 2.50 3.00 3.50 4.00 4.50 5.00 5.50 6.00 6.50 7.00 7.50 8.00
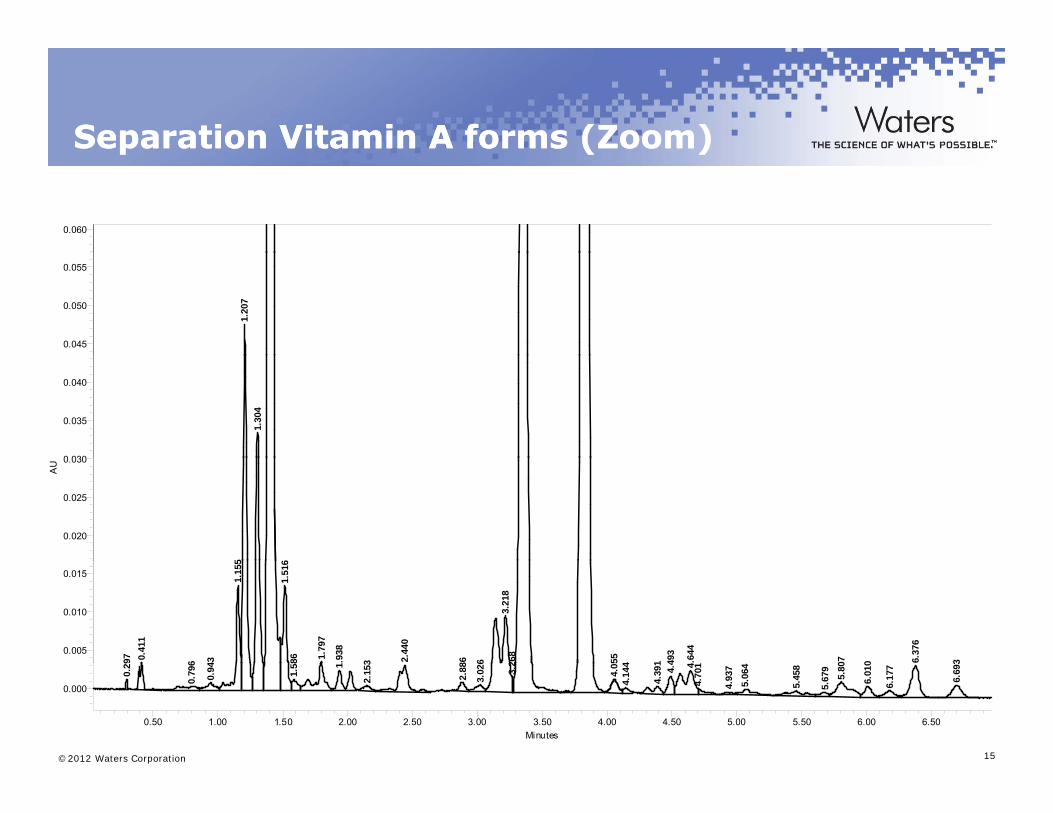
Separation Vitamin A forms (Zoom)Separation Vitamin A forms (Zoom)
0.060
p ( )p ( )
1.20
7
0.045
0.050
0.0551.
304
0 030
0.035
0.040
5 6
AU
0.020
0.025
0.030
97 0.41
1
6 43
1.15
5
1.51
686 1.
797
.938
3 2.44
0
86 6
3.21
826
8
55 4 1 493
.644
07 0 6.37
6
3
0.005
0.010
0.015
©2012 Waters Corporation 15
0.29
0.79
6
0.94 1.58 1
2.15
3
2.88
3.02
6
3.2
4.05
4.14
4
4.39
14.
4 44.
701
4.93
75.
064
5.45
8
5.67
95.
80
6.01
0
6.17
7
6.69
3
0.000
Minutes0.50 1.00 1.50 2.00 2.50 3.00 3.50 4.00 4.50 5.00 5.50 6.00 6.50
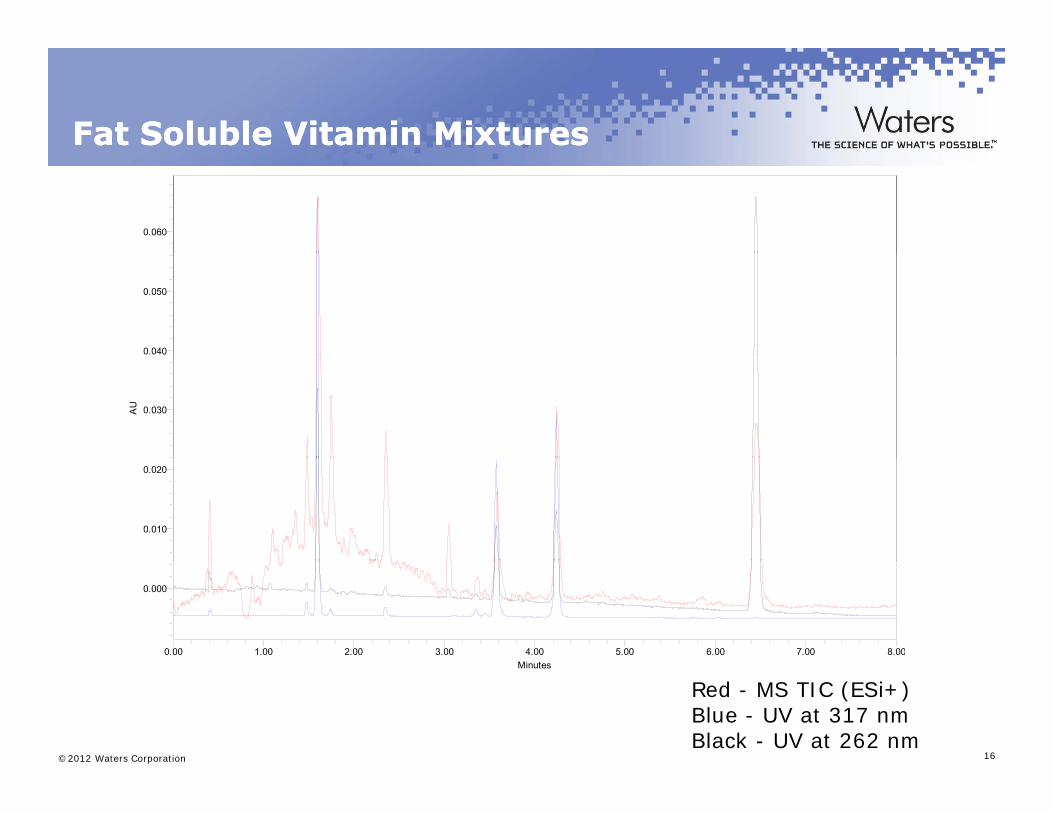
Fat Soluble Vitamin MixturesFat Soluble Vitamin Mixtures
0.060
0.040
0.050
AU 0.030
0.010
0.020
0.000
Mi t0.00 1.00 2.00 3.00 4.00 5.00 6.00 7.00 8.00
©2012 Waters Corporation 16
Minutes
Red - MS TIC (ESi+)Blue - UV at 317 nmBlack - UV at 262 nm

OLEDs
©2012 Waters Corporation 17
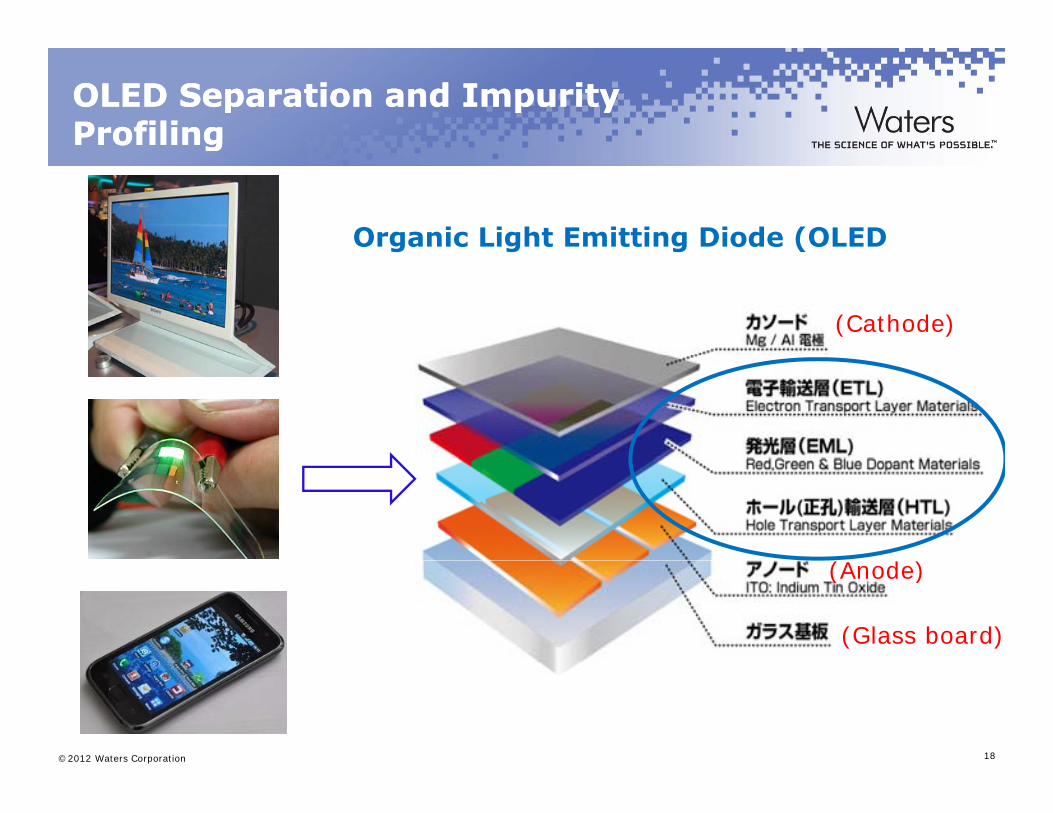
OLED Separation and Impurity OLED Separation and Impurity ProfilingProfiling
Organic Light Emitting Diode (OLED)
gg
(Cathode)
( d )(Anode)
(Glass board)
©2012 Waters Corporation 18
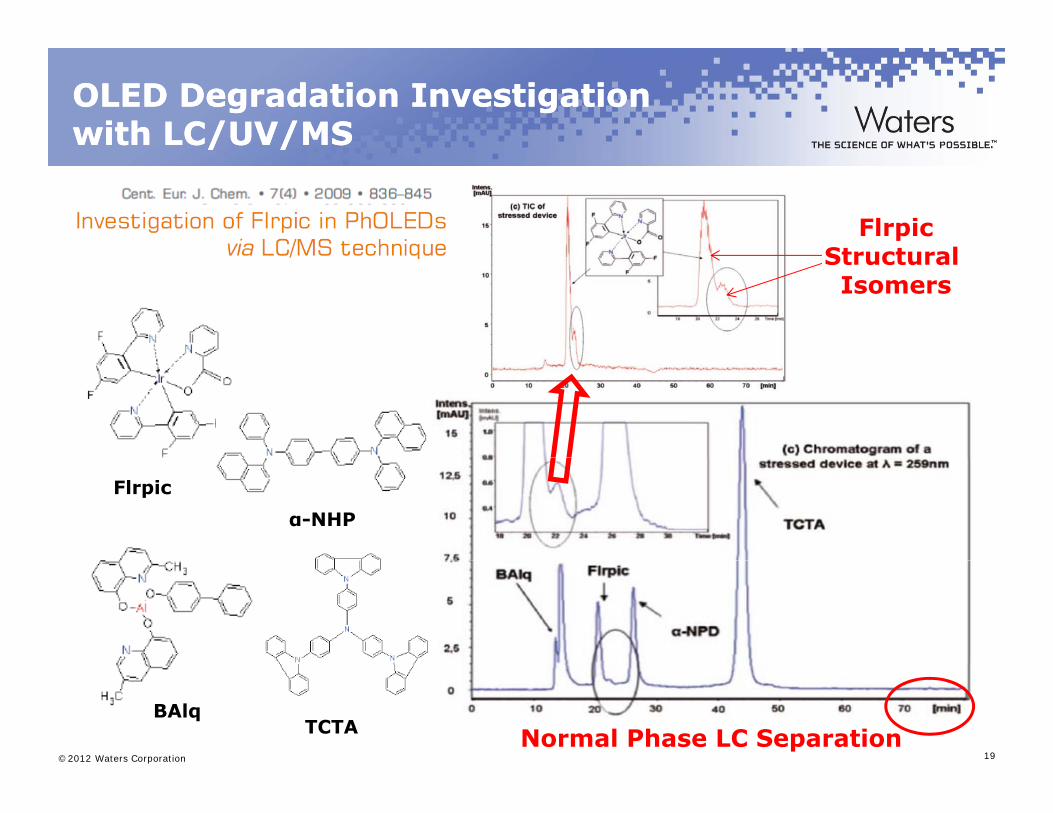
OLED Degradation Investigation OLED Degradation Investigation with LC/UV/MS with LC/UV/MS
FlrpicStructural Structural Isomers
Flrpic
α-NHP
©2012 Waters Corporation 19
TCTABAlq
Normal Phase LC Separation
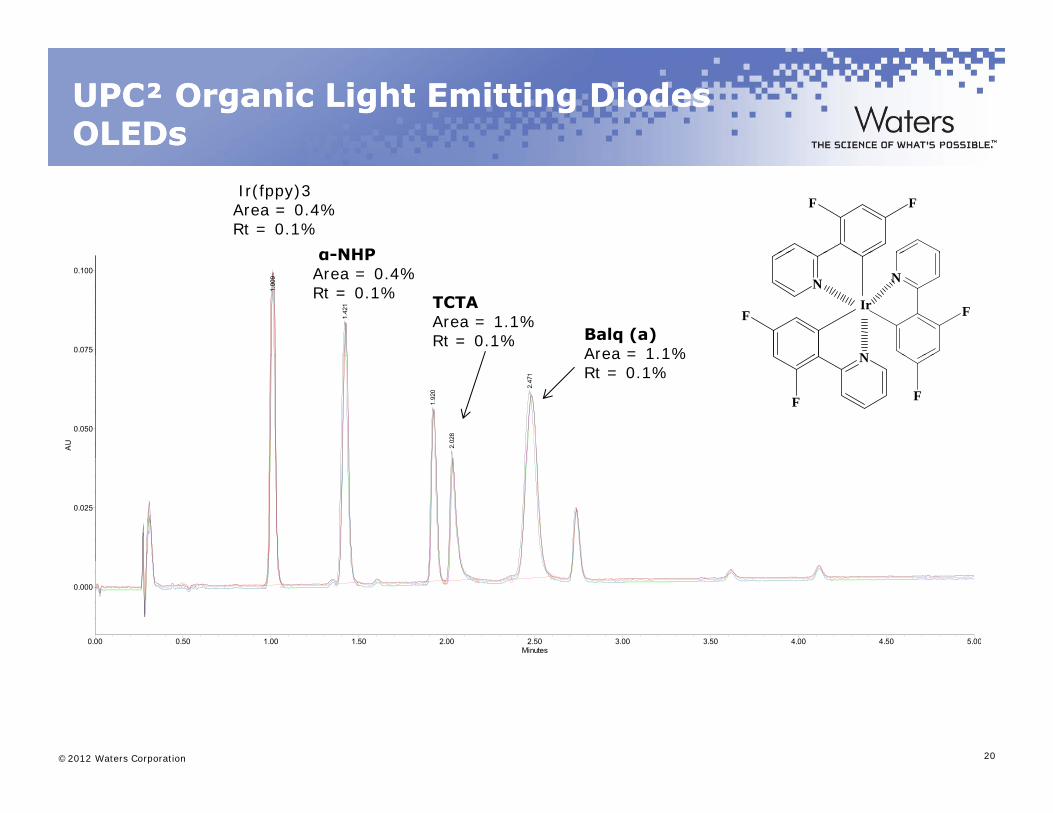
UPC² Organic Light Emitting Diodes UPC² Organic Light Emitting Diodes OLEDsOLEDs
Ir(fppy)3Area = 0.4%Rt = 0.1%
α NHP
FF
1.00
9
1.42
10.075
0.100
TCTAArea = 1.1%Rt = 0.1% Balq (a)
Area = 1 1%
α-NHPArea = 0.4%Rt = 0.1%
N
N
FIr
N
F
1.92
0
2.02
8
2.47
1
AU
0.050
Area = 1.1%Rt = 0.1%
N
F F
0.025
0.000
Minutes0.00 0.50 1.00 1.50 2.00 2.50 3.00 3.50 4.00 4.50 5.00
©2012 Waters Corporation 20
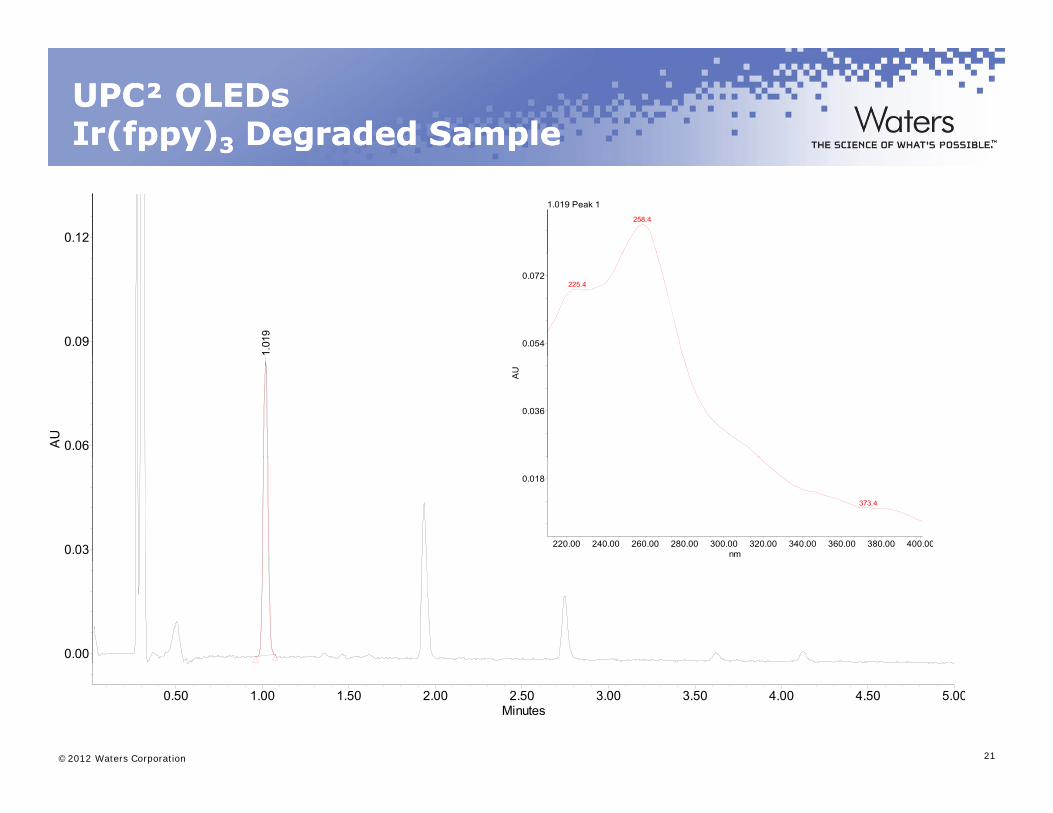
UPC² OLEDsUPC² OLEDsIrIr((fppyfppy))33 Degraded SampleDegraded Sample(( ppyppy))33 g pg p
0.12
1.019 Peak 1
258.4
1.01
9
0.09
225.4
0.054
0.072
AU
0.06
AU
0.036
0.03
373.4
0.018
nm220.00 240.00 260.00 280.00 300.00 320.00 340.00 360.00 380.00 400.00
0.00
©2012 Waters Corporation 21
Minutes0.50 1.00 1.50 2.00 2.50 3.00 3.50 4.00 4.50 5.00
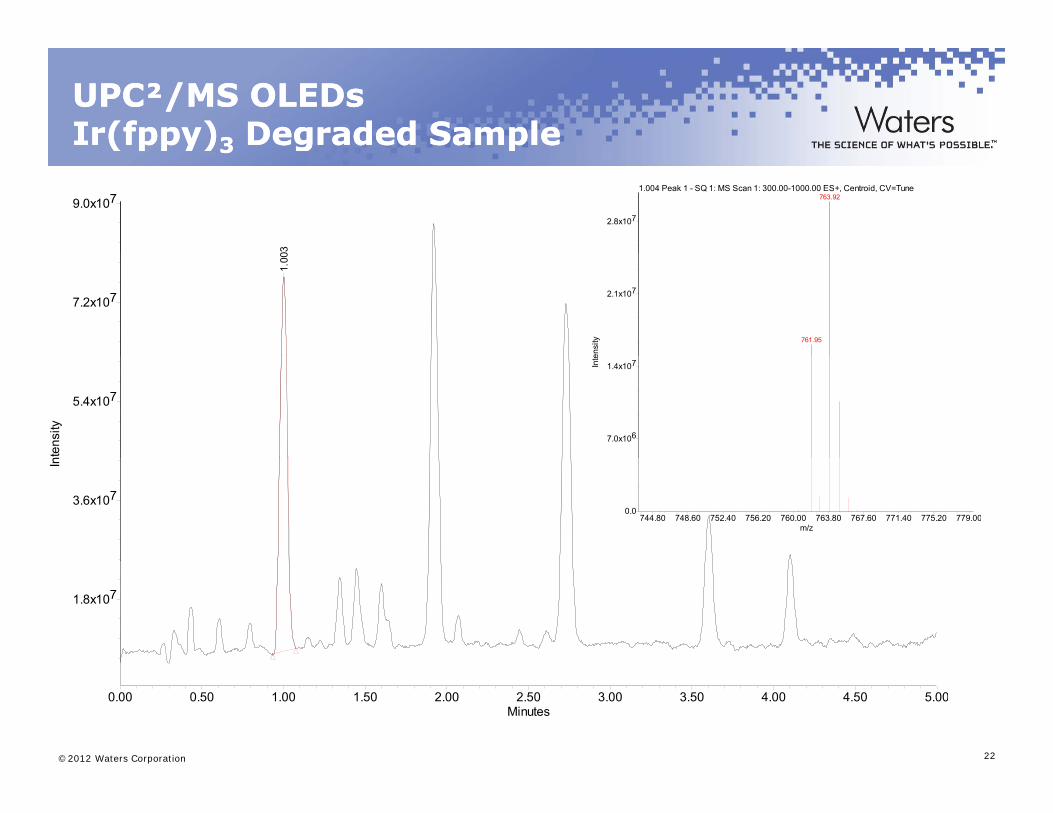
UPC²/MS OLEDsUPC²/MS OLEDsIrIr((fppyfppy))33 Degraded SampleDegraded Sample(( ppyppy))33 g pg p
03
9.0x1071.004 Peak 1 - SQ 1: MS Scan 1: 300.00-1000.00 ES+, Centroid, CV=Tune
763.92
2.8x10⁷
1.00
7.2x10⁷
761.95
ensi
ty
2.1x10⁷
nten
sity
5.4x10⁷
Inte
7.0x10⁶
1.4x10⁷
In
3.6x1070.0
m/z744.80 748.60 752.40 756.20 760.00 763.80 767.60 771.40 775.20 779.00
1.8x10⁷
©2012 Waters Corporation 22
Minutes0.00 0.50 1.00 1.50 2.00 2.50 3.00 3.50 4.00 4.50 5.00
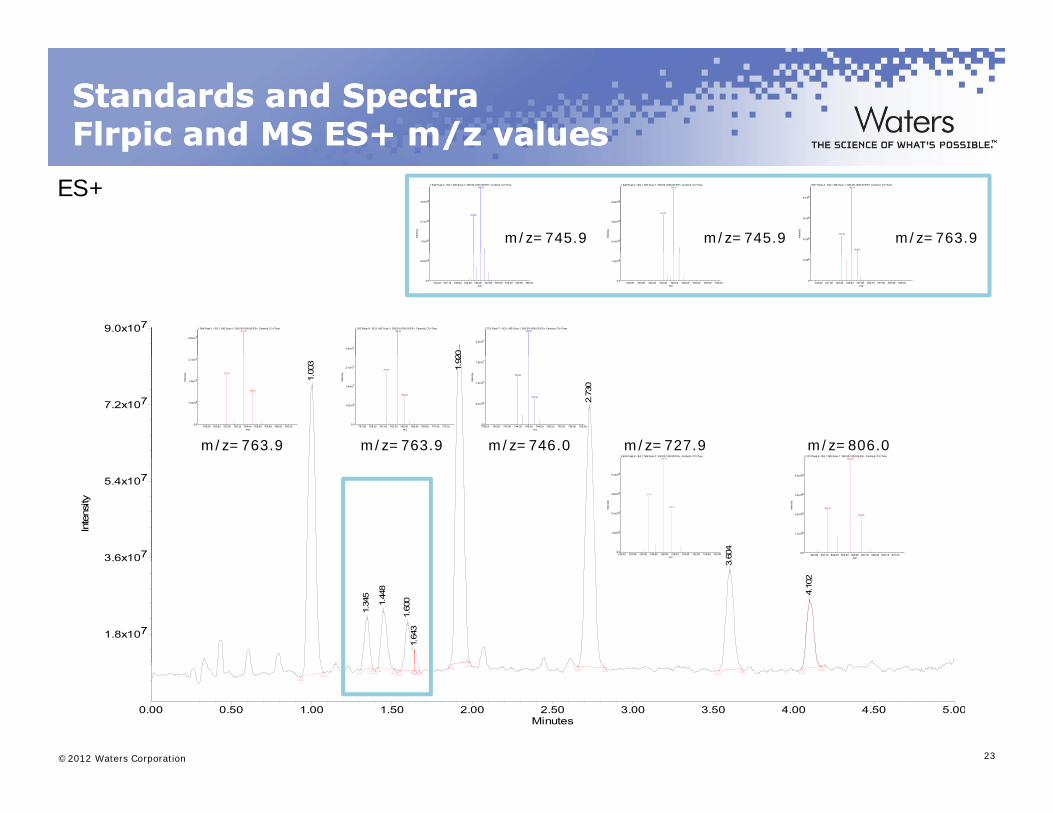
Standards and SpectraStandards and SpectraFlrpicFlrpic and MS ES+ m/z valuesand MS ES+ m/z valuespp
1.345 Peak 2 - SQ 1: MS Scan 1: 300.00-1000.00 ES+, Centroid, CV=Tune
743.93
745.90
Inte
nsity
1.8x10⁶
2.7x10⁶
3.6x10⁶
1.446 Peak 3 - SQ 1: MS Scan 1: 300.00-1000.00 ES+, Centroid, CV=Tune
743.97
745.91
Inte
nsity
2.4x10⁶
3.6x10⁶
4.8x10⁶
1.601 Peak 4 - SQ 1: MS Scan 1: 300.00-1000.00 ES+, Centroid, CV=Tune
743.90
745.90
746.97
Inte
nsity
2x10⁶
3x10⁶
4x10⁶
m/z=745.9 m/z=745.9 m/z=763.9
ES+
20
9.0x10⁷
0.0
9.0x10⁵
m/z734.40 737.10 739.80 742.50 745.20 747.90 750.60 753.30 756.00 758.70
0.0
1.2x10⁶
m/z738.00 740.00 742.00 744.00 746.00 748.00 750.00 752.00 754.00
0
1x10⁶
m/z739.20 741.30 743.40 745.50 747.60 749.70 751.80 753.90 756.00
1.922 Peak 6 - SQ 1: MS Scan 1: 300.00-1000.00 ES+, Centroid, CV=Tune763.93
2.8x10⁷
2.731 Peak 7 - SQ 1: MS Scan 1: 300.00-1000.00 ES+, Centroid, CV=Tune745.95
2.4x10⁷
1.004 Peak 1 - SQ 1: MS Scan 1: 300.00-1000.00 ES+, Centroid, CV=Tune763.92
2.8x10⁷
1.00
3 1.92
2.73
0
7.2x10⁷
761.97
765.08
Inte
nsity
0.0
7.0x10⁶
1.4x10⁷
2.1x10⁷
m/z757.80 759.60 761.40 763.20 765.00 766.80 768.60 770.40 772.20
743.96
747.05
Inte
nsity
0.0
6.0x10⁶
1.2x10⁷
1.8x10⁷
m/z738.00 740.00 742.00 744.00 746.00 748.00 750.00 752.00 754.00 756.00
3.605 Peak 8 - SQ 1: MS Scan 1: 300.00-1000.00 ES+, Centroid, CV=Tune2 94
4.101 Peak 9 - SQ 1: MS Scan 1: 300.00-1000.00 ES+, Centroid, CV=Tune
761.95
765.01
Inte
nsity
0.0
7.0x10⁶
1.4x10⁷
2.1x10⁷
m/z759.60 760.80 762.00 763.20 764.40 765.60 766.80 768.00 769.20
m/z=763.9 m/z=763.9 m/z=746.0 m/z=727.9 m/z=806.0
.604
Inte
nsity
3.6x10⁷
5.4x107725.97
727.94
729.01
Inte
nsity
0.0
1.6x10⁶
3.2x10⁶
4.8x10⁶
6.4x10⁶
m/z722.40 723.80 725.20 726.60 728.00 729.40 730.80 732.20 733.60 735.00
804.01
805.99
806.96
Inte
nsity
0.0
1.2x10⁶
2.4x10⁶
3.6x10⁶
4.8x10⁶
m/z802.80 803.70 804.60 805.50 806.40 807.30 808.20 809.10 810.00
1.34
5
1.44
8
1.60
01.
643
3.
4.10
2
1.8x10⁷
3.6x10
©2012 Waters Corporation 23
Minutes0.00 0.50 1.00 1.50 2.00 2.50 3.00 3.50 4.00 4.50 5.00
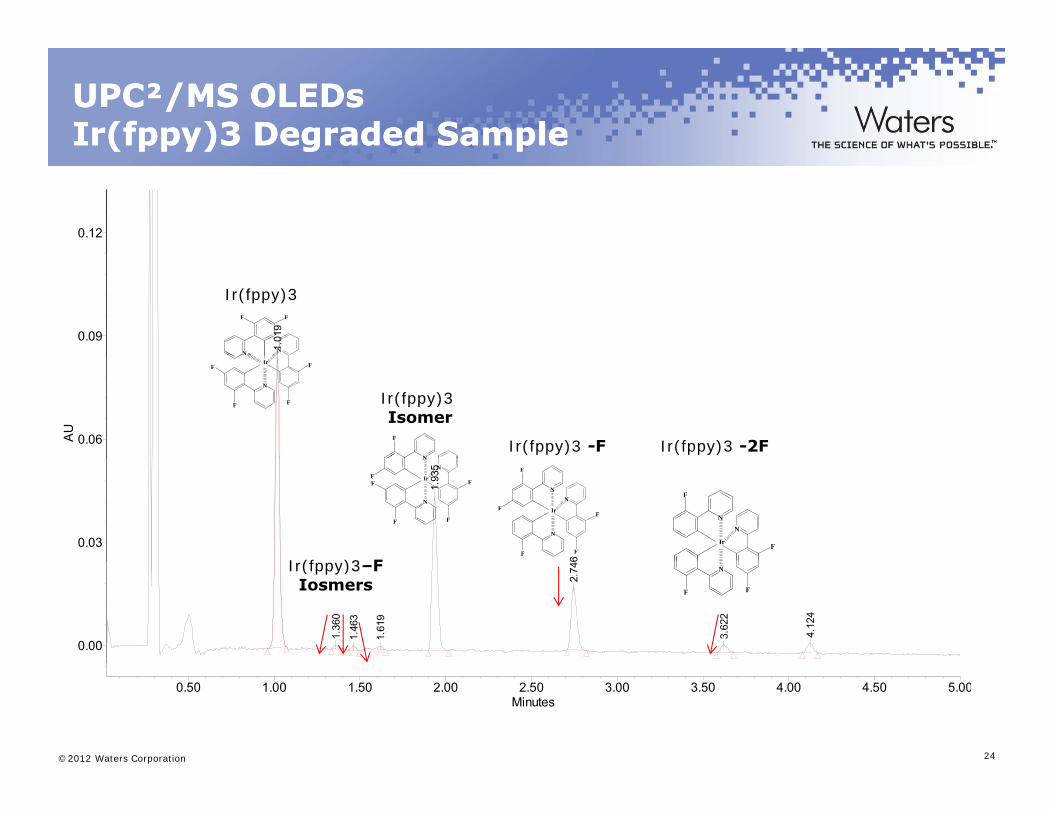
UPC²/MS OLEDsUPC²/MS OLEDsIrIr((fppyfppy)3 Degraded Sample)3 Degraded Sample(( ppyppy) g p) g p
0.12
1.01
9
0.09
Ir(fppy)3
N
FF
N
AU
0.06
N
F
F
Ir
F
F
N
F
Ir(fppy)3Isomer
Ir(fppy)3 -2FIr(fppy)3 -F1.
935
6
0.03
N
F
F
Ir
N
FN
F
F
N
F
Ir
N
F
F
N
F
F
I (f )3 F
Ir
N
F
N
F
1.36
0
1.46
3
1.61
9
2.74
6
3.62
2
4.12
4
0.00
Ir(fppy)3–FIosmers
N
F F
©2012 Waters Corporation 24
Minutes0.50 1.00 1.50 2.00 2.50 3.00 3.50 4.00 4.50 5.00
UPC²/MS OLEDsUPC²/MS OLEDsIrIr((fppyfppy))33 Degraded SampleDegraded Sample(( ppyppy))33 g pg p
10 X Reduction in runtime over traditional NPLC method
4 major constituents separated
Seven impurities identified
NP was 70-minute run with co-elutions NP was 70-minute run with co-elutions
©2012 Waters Corporation 25
USP Method Conversions
©2012 Waters Corporation 26
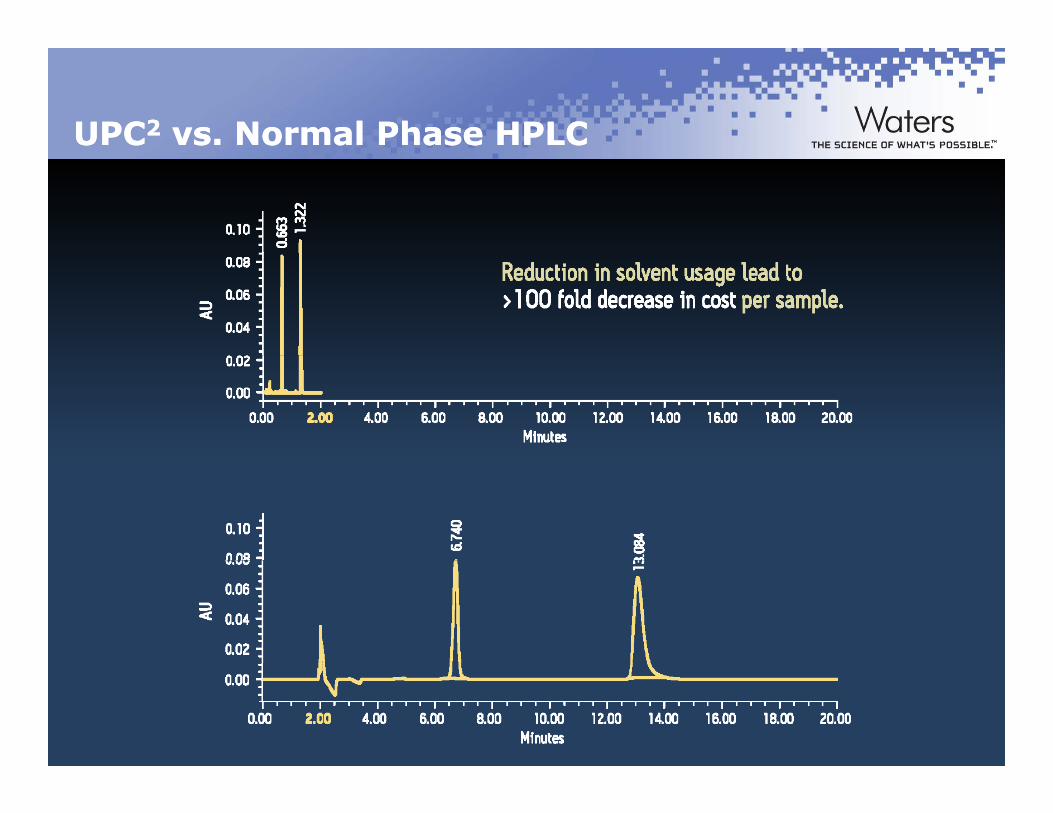
UPCUPC22 vs. Normal Phase vs. Normal Phase HPLCHPLC
©2012 Waters Corporation 27
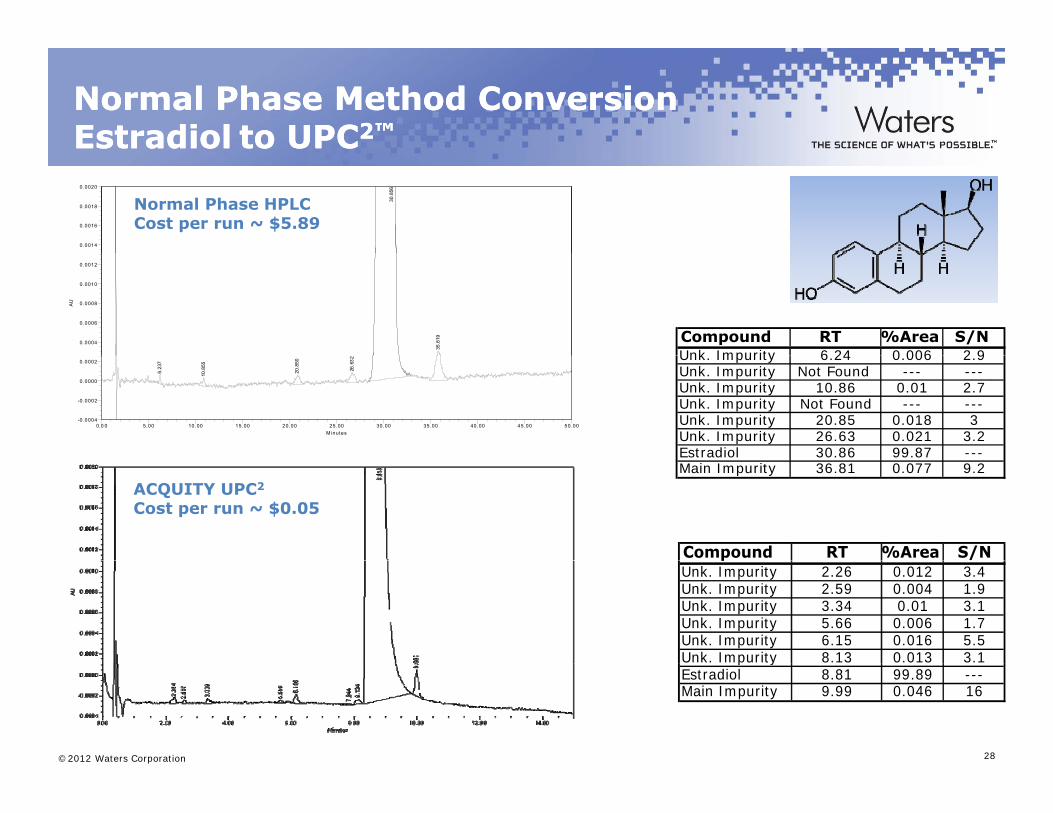
Normal Phase Method Conversion Normal Phase Method Conversion EstradiolEstradiol to UPCto UPC2™2™
30.8
56
0 .0014
0.0016
0.0018
0.0020
Normal Phase HPLCCost per run ~ $5.89
Compound RT %Area S/N Unk Impurity 6 24 0 006 2 9
35.8
19
AU
0 .0004
0.0006
0.0008
0.0010
0.0012
Unk. Impurity 6.24 0.006 2.9Unk. Impurity Not Found --- --- Unk. Impurity 10.86 0.01 2.7Unk. Impurity Not Found --- --- Unk. Impurity 20.85 0.018 3Unk. Impurity 26.63 0.021 3.2Estradiol 30.86 99.87 ---
6.23
7
10.8
55
20.8
50
26.6
32
-0.0004
-0.0002
0.0000
0.0002
M inutes0.0 0 5.00 10.00 15.00 20.00 25.00 30.00 35.00 40.00 45.00 50.00
Main Impurity 36.81 0.077 9.2
Compound RT %Area S/N
ACQUITY UPC2
Cost per run ~ $0.05
pUnk. Impurity 2.26 0.012 3.4Unk. Impurity 2.59 0.004 1.9Unk. Impurity 3.34 0.01 3.1Unk. Impurity 5.66 0.006 1.7Unk. Impurity 6.15 0.016 5.5Unk. Impurity 8.13 0.013 3.1
©2012 Waters Corporation 28
p yEstradiol 8.81 99.89 ---Main Impurity 9.99 0.046 16
Chiral Separations
©2012 Waters Corporation 29
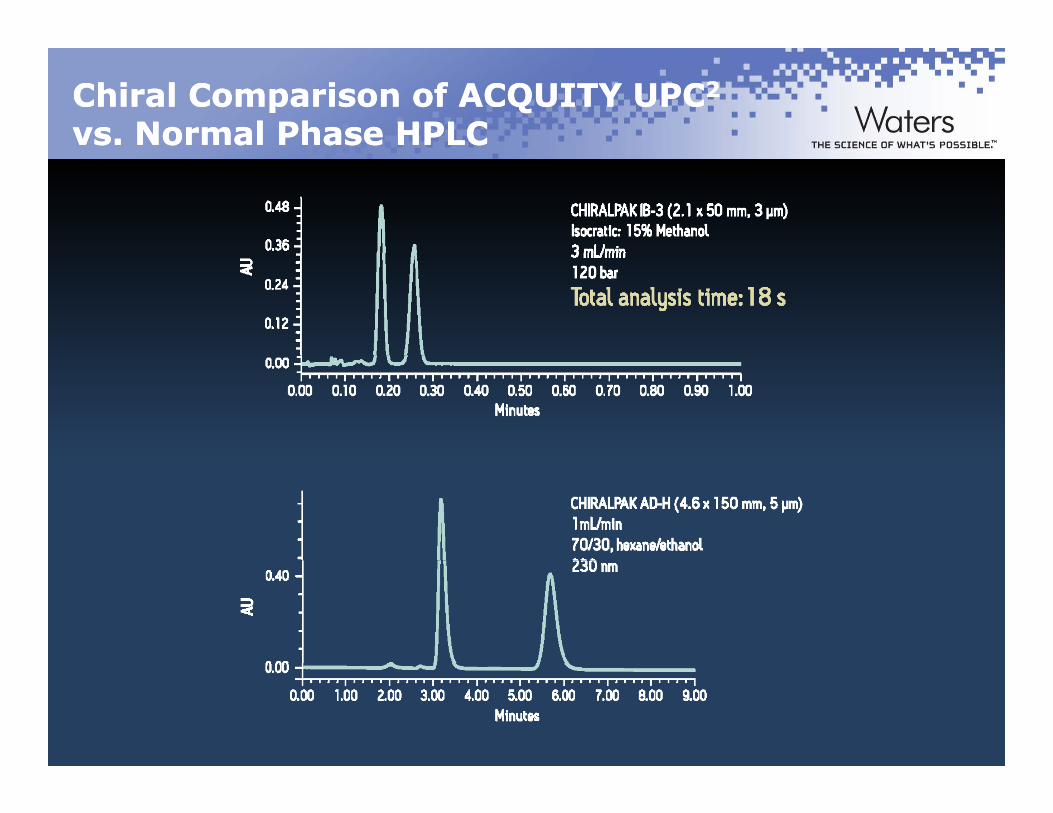
Chiral Comparison of Chiral Comparison of ACQUITYACQUITY UPCUPC22
vs. Normal Phase vs. Normal Phase HPLCHPLC
©2012 Waters Corporation 30
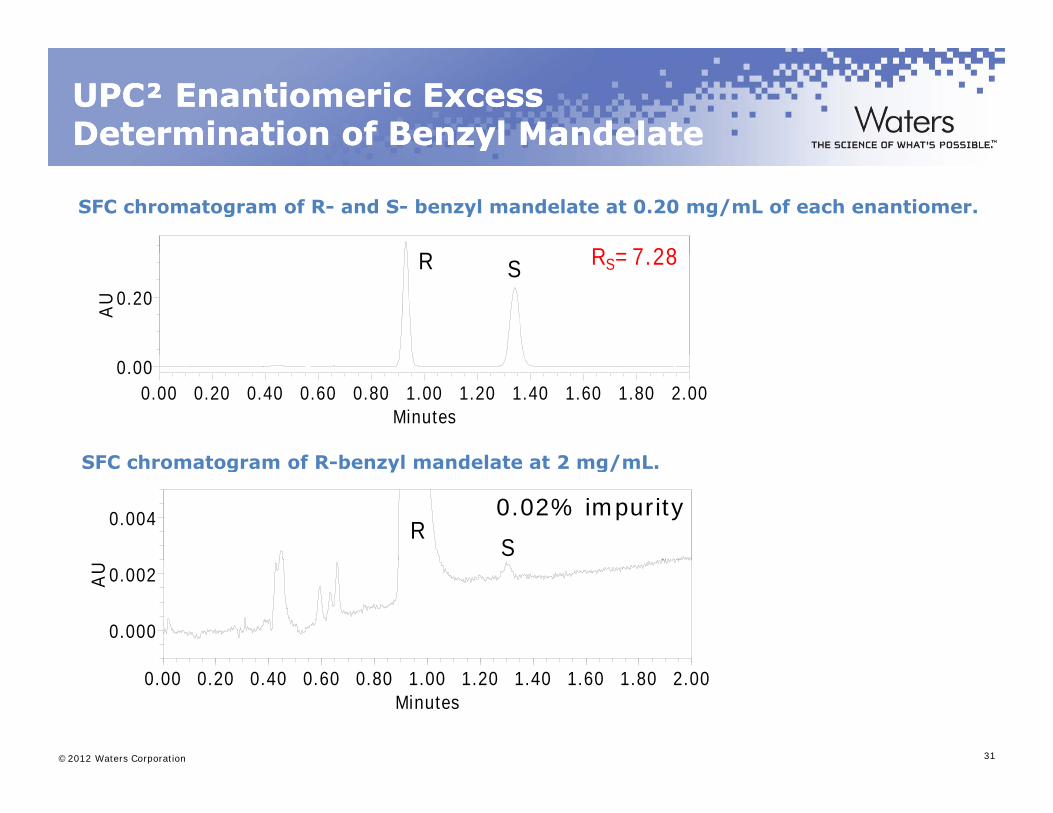
UPC² Enantiomeric Excess UPC² Enantiomeric Excess Determination of Benzyl Mandelate Determination of Benzyl Mandelate yy
R R 7 28
SFC chromatogram of R- and S- benzyl mandelate at 0.20 mg/mL of each enantiomer.
AU 0.20
R S RS=7.28
0.00
Minutes0.00 0.20 0.40 0.60 0.80 1.00 1.20 1.40 1.60 1.80 2.00
SFC h t f R b l d l t t 2 / L
0.004 RS
SFC chromatogram of R-benzyl mandelate at 2 mg/mL.
0.02% impurity
AU
0.000
0.002
©2012 Waters Corporation 31
Minutes0.00 0.20 0.40 0.60 0.80 1.00 1.20 1.40 1.60 1.80 2.00
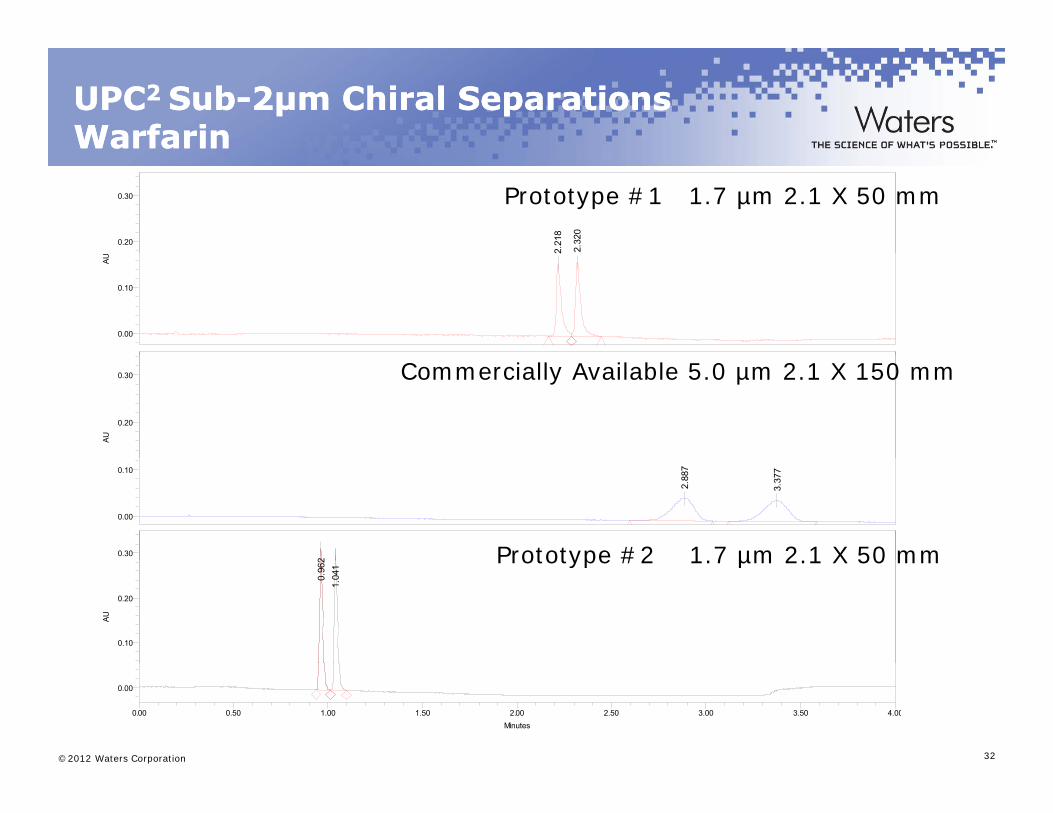
UPCUPC2 2 SubSub--2µm 2µm ChiralChiral SeparationsSeparationsWarfarinWarfarin
2.21
8
2.32
0
0.20
0.30 Prototype #1 1.7 µm 2.1 X 50 mm
2
AU
0.00
0.10
AU
0.20
0.30 Commercially Available 5.0 µm 2.1 X 150 mm
2.88
7
3.37
7
0.00
0.10
2
0.30 Prototype #2 1.7 µm 2.1 X 50 mm
0.96
21.
041
AU
0.10
0.20
Prototype #2 1.7 µm 2.1 X 50 mm
©2012 Waters Corporation 32
0.00
Minutes0.00 0.50 1.00 1.50 2.00 2.50 3.00 3.50 4.00

Methamphetamine
©2012 Waters Corporation 33
MethamphetamineMethamphetamine
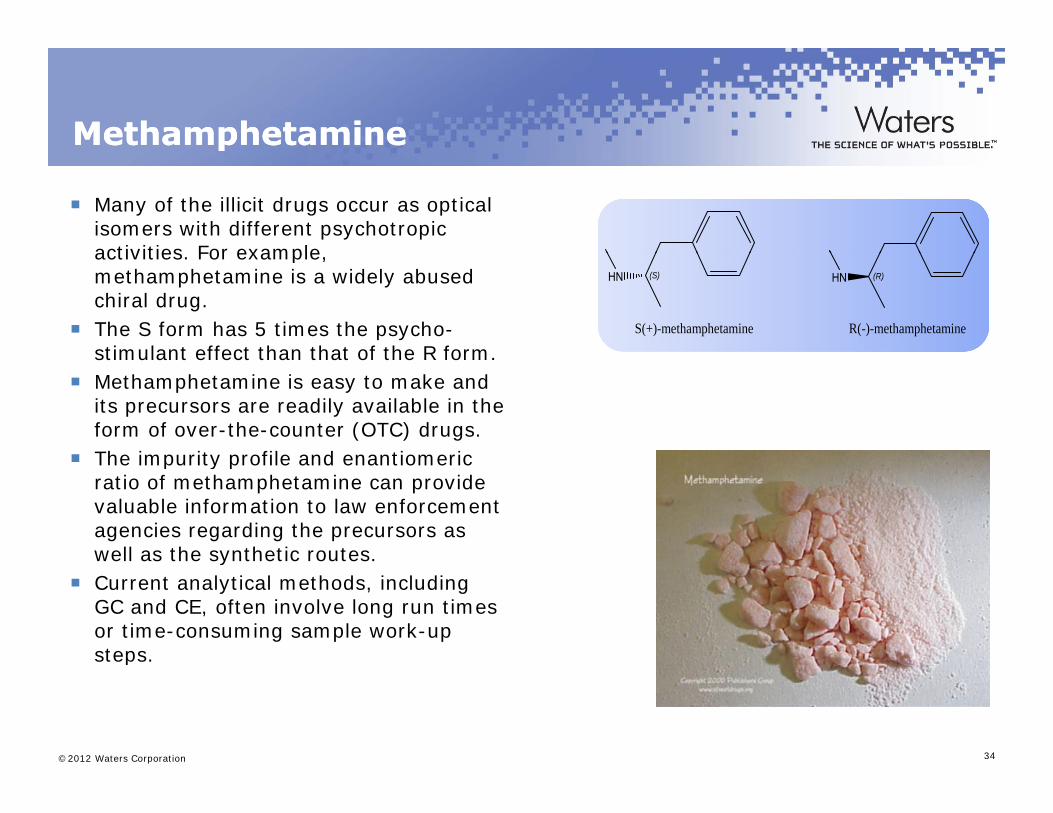
Many of the illicit drugs occur as optical isomers with different psychotropic activities For example
pp
activities. For example, methamphetamine is a widely abused chiral drug.
The S form has 5 times the psycho-stimulant effect than that of the R form
(S)HN (R)HN
S(+)-methamphetamine R(-)-methamphetamine
stimulant effect than that of the R form. Methamphetamine is easy to make and
its precursors are readily available in the form of over-the-counter (OTC) drugs.
The impurity profile and enantiomeric The impurity profile and enantiomeric ratio of methamphetamine can provide valuable information to law enforcement agencies regarding the precursors as well as the synthetic routes. well as the synthetic routes.
Current analytical methods, including GC and CE, often involve long run times or time-consuming sample work-up steps.
©2012 Waters Corporation 34
p
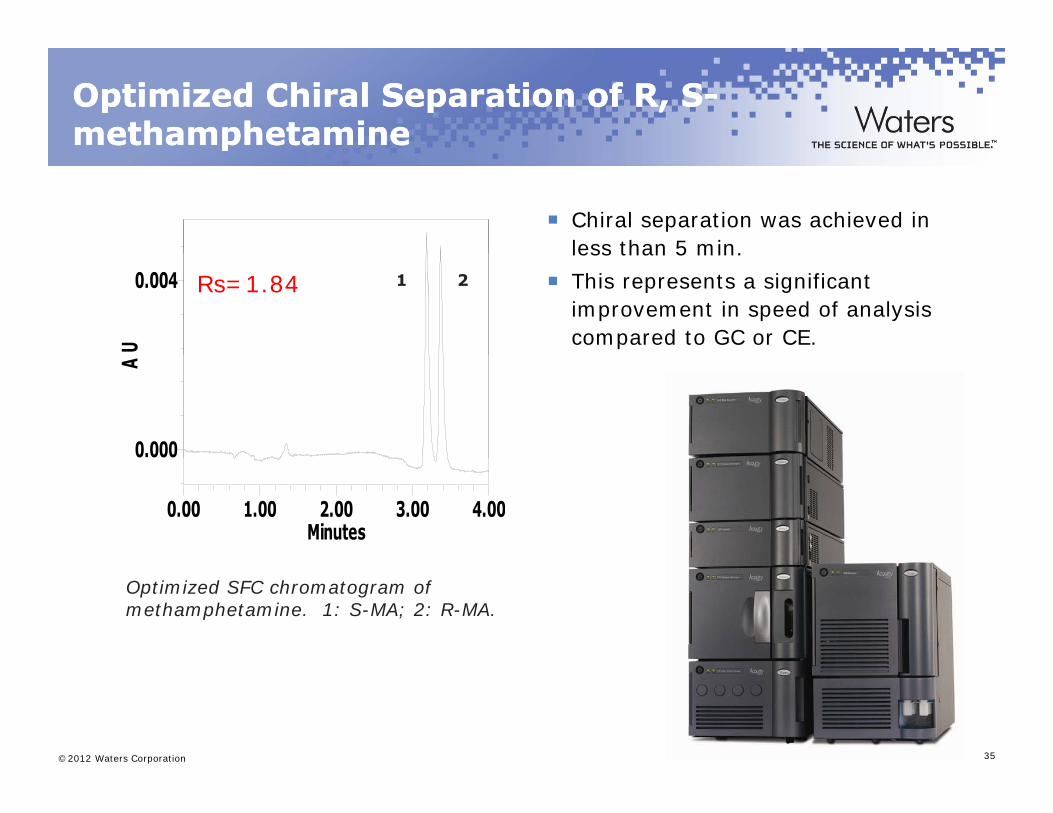
Optimized Chiral Separation of R, SOptimized Chiral Separation of R, S--methamphetaminemethamphetaminepp
Chiral separation was achieved in less than 5 min.less than 5 min.
This represents a significant improvement in speed of analysis compared to GC or CE.U
0.004 1 2Rs=1.84
A
0.000
Minutes0.00 1.00 2.00 3.00 4.00
Optimized SFC chromatogram of methamphetamine. 1: S-MA; 2: R-MA.
©2012 Waters Corporation 35
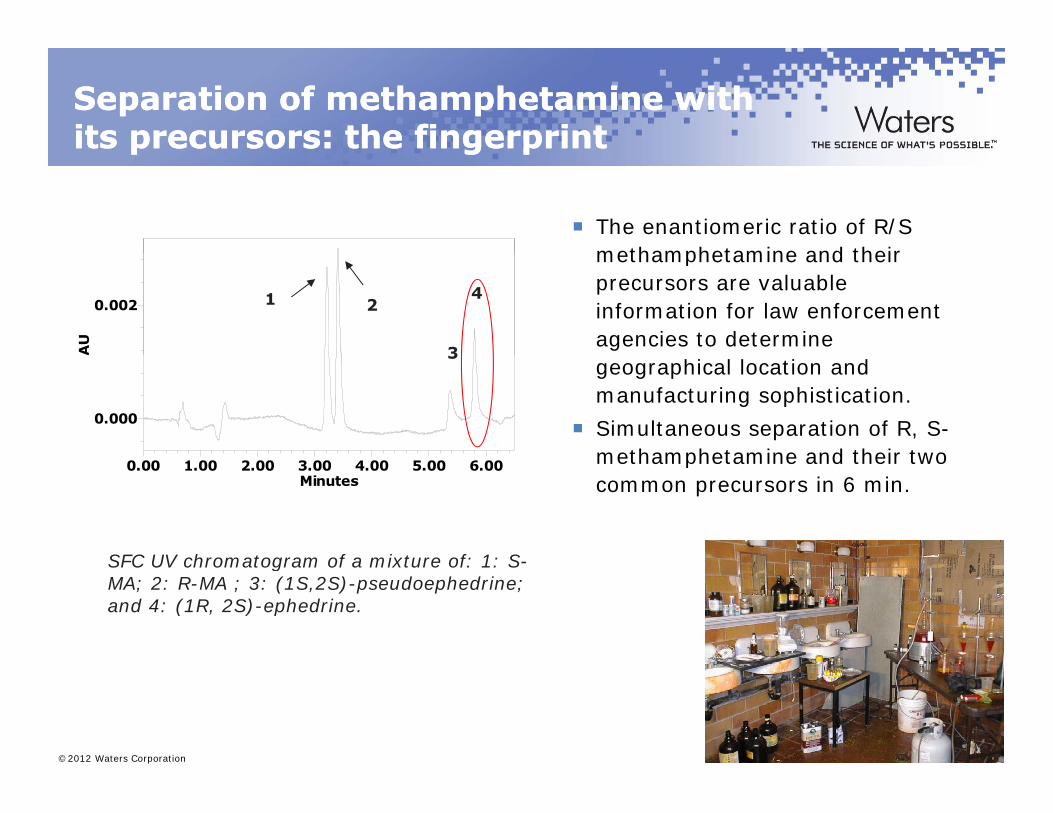
Separation of methamphetamine with Separation of methamphetamine with its precursors: the fingerprintits precursors: the fingerprintp g pp g p
The enantiomeric ratio of R/S methamphetamine and their methamphetamine and their precursors are valuable information for law enforcement agencies to determine
AU
0.002 1 2
3
4
geographical location and manufacturing sophistication.
Simultaneous separation of R, S-methamphetamine and their two
0.000
3
methamphetamine and their two common precursors in 6 min.
SFC UV chromatogram of a mixture of: 1: S
Minutes0.00 1.00 2.00 3.00 4.00 5.00 6.00
SFC UV chromatogram of a mixture of: 1: S-MA; 2: R-MA ; 3: (1S,2S)-pseudoephedrine; and 4: (1R, 2S)-ephedrine.
©2012 Waters Corporation 36
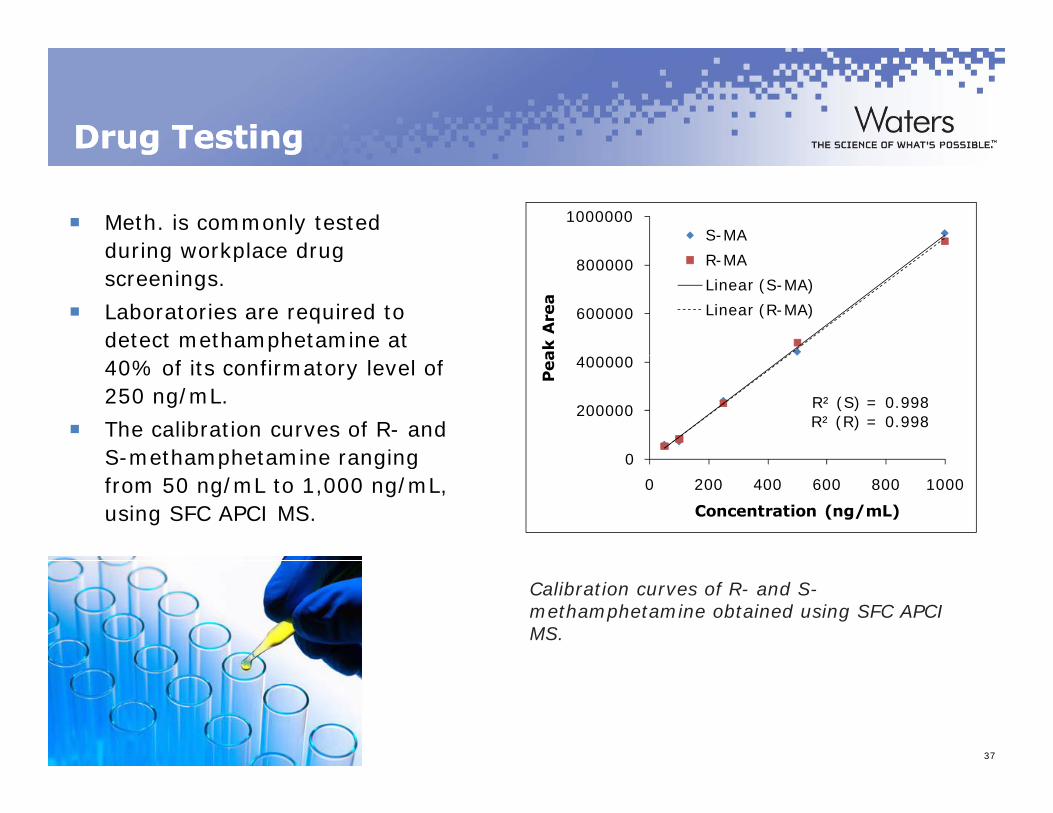
Drug TestingDrug Testingg gg g
1000000S-MA
Meth. is commonly tested during workplace drug
600000
800000
ak A
rea
R-MA
Linear (S-MA)
Linear (R-MA)
during workplace drug screenings.
Laboratories are required to detect methamphetamine at
R² (S) = 0.998R² (R) = 0.998
0
200000
400000
Pea
40% of its confirmatory level of 250 ng/mL.
The calibration curves of R- and S-methamphetamine ranging 0
0 200 400 600 800 1000
Concentration (ng/mL)
S-methamphetamine ranging from 50 ng/mL to 1,000 ng/mL, using SFC APCI MS.
Calibration curves of R- and S-methamphetamine obtained using SFC APCI MS.
©2012 Waters Corporation 37
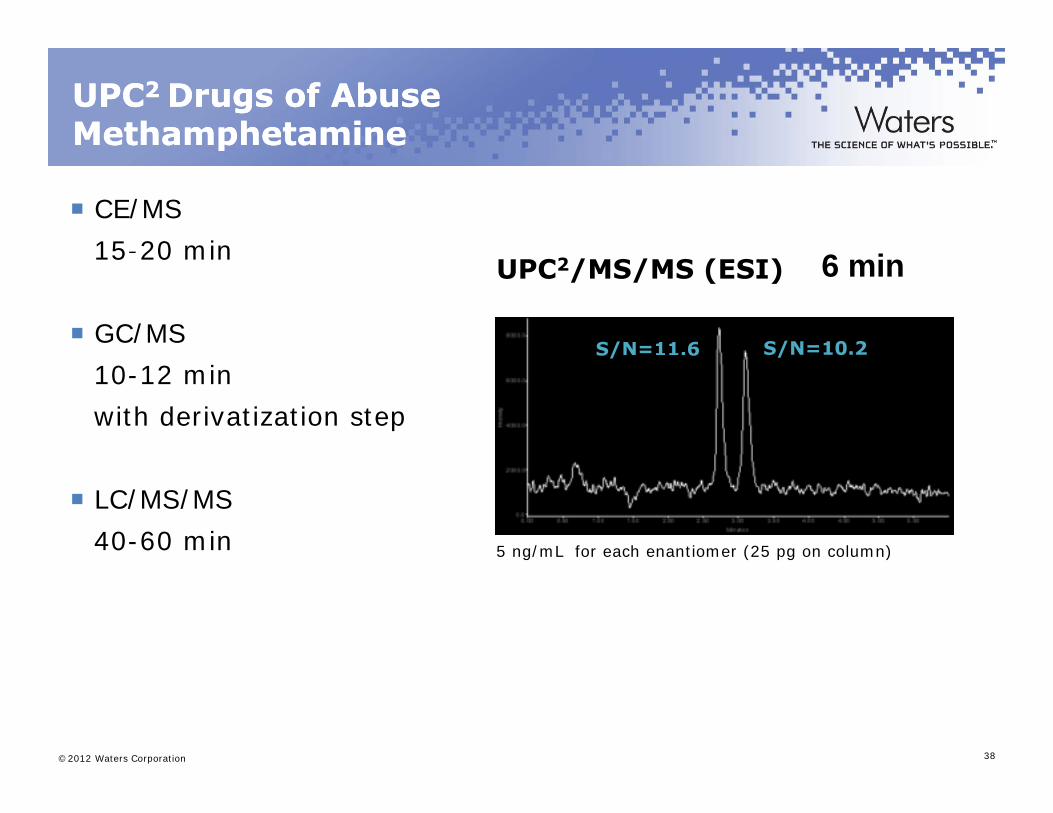
UPCUPC2 2 Drugs of Abuse Drugs of Abuse MethamphetamineMethamphetamine
CE/MS
15-20 min
pp
15 20 min
GC/MSS/N=11.6 S/N=10.2
UPC2/MS/MS (ESI) 6 min
10-12 min
with derivatization step
S/ 6 /
LC/MS/MS
40-60 min 5 ng/mL for each enantiomer (25 pg on column)
©2012 Waters Corporation 38
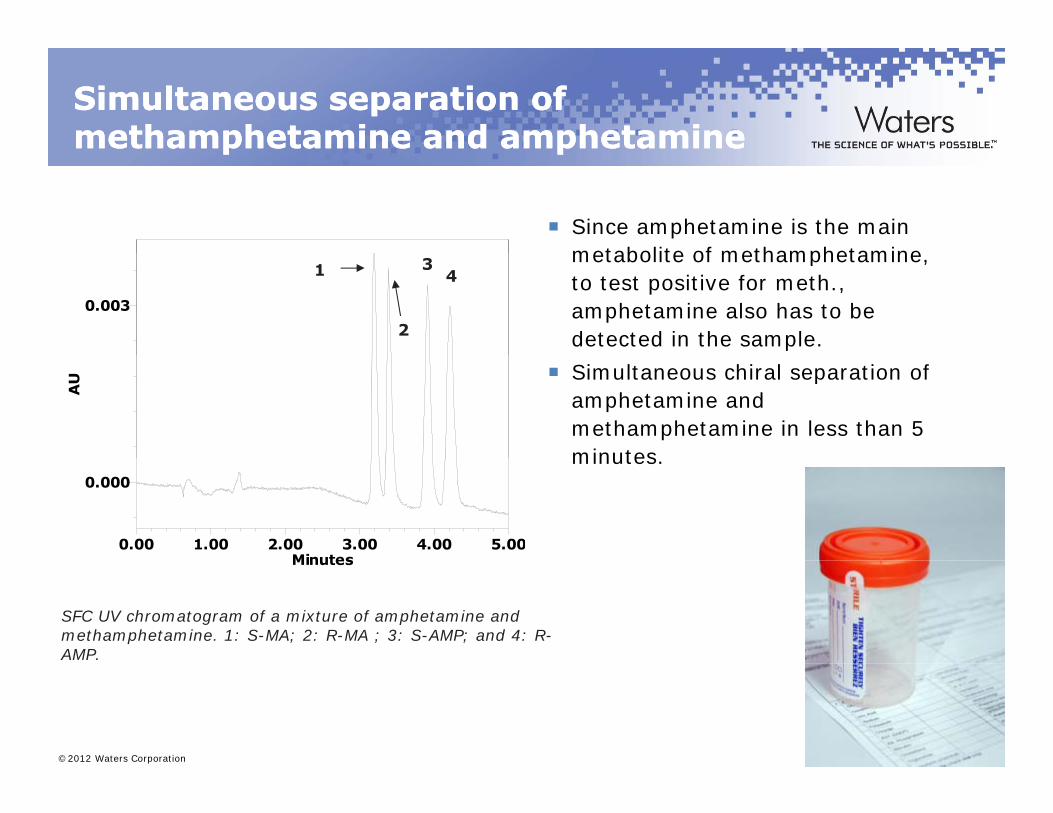
Simultaneous separation of Simultaneous separation of methamphetamine and amphetaminemethamphetamine and amphetaminep pp p
Since amphetamine is the main metabolite of methamphetamine metabolite of methamphetamine, to test positive for meth., amphetamine also has to be detected in the sample.
0.003
1
2
34
Simultaneous chiral separation of amphetamine and methamphetamine in less than 5 minutes
AU
minutes. 0.000
Minutes0.00 1.00 2.00 3.00 4.00 5.00
SFC UV chromatogram of a mixture of amphetamine and methamphetamine. 1: S-MA; 2: R-MA ; 3: S-AMP; and 4: R-AMP.
Minutes
©2012 Waters Corporation 39

Paracetamol
©2012 Waters Corporation 40
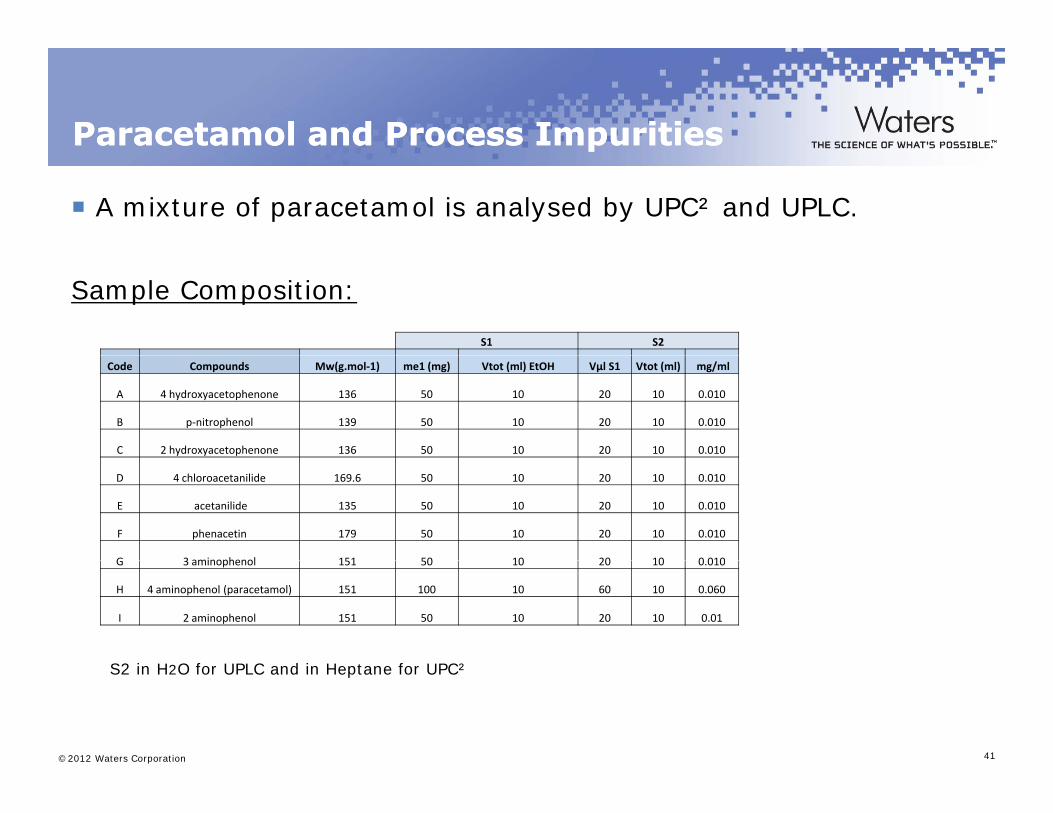
ParacetamolParacetamol and Process Impuritiesand Process Impuritiespp
A mixture of paracetamol is analysed by UPC² and UPLC.
Sample Composition:
S1 S2
Code Compounds Mw(g.mol‐1) me1 (mg) Vtot (ml) EtOH Vµl S1 Vtot (ml) mg/ml
A 4 hydroxyacetophenone 136 50 10 20 10 0.010
B p‐nitrophenol 139 50 10 20 10 0.010
C 2 hydroxyacetophenone 136 50 10 20 10 0.010
D 4 chloroacetanilide 169.6 50 10 20 10 0.010
E acetanilide 135 50 10 20 10 0.010
F phenacetin 179 50 10 20 10 0.010
G 3 aminophenol 151 50 10 20 10 0 010G 3 aminophenol 151 50 10 20 10 0.010
H 4 aminophenol (paracetamol) 151 100 10 60 10 0.060
I 2 aminophenol 151 50 10 20 10 0.01
S2 i H O f UPLC d i H f UPC²
©2012 Waters Corporation 41
S2 in H2O for UPLC and in Heptane for UPC²
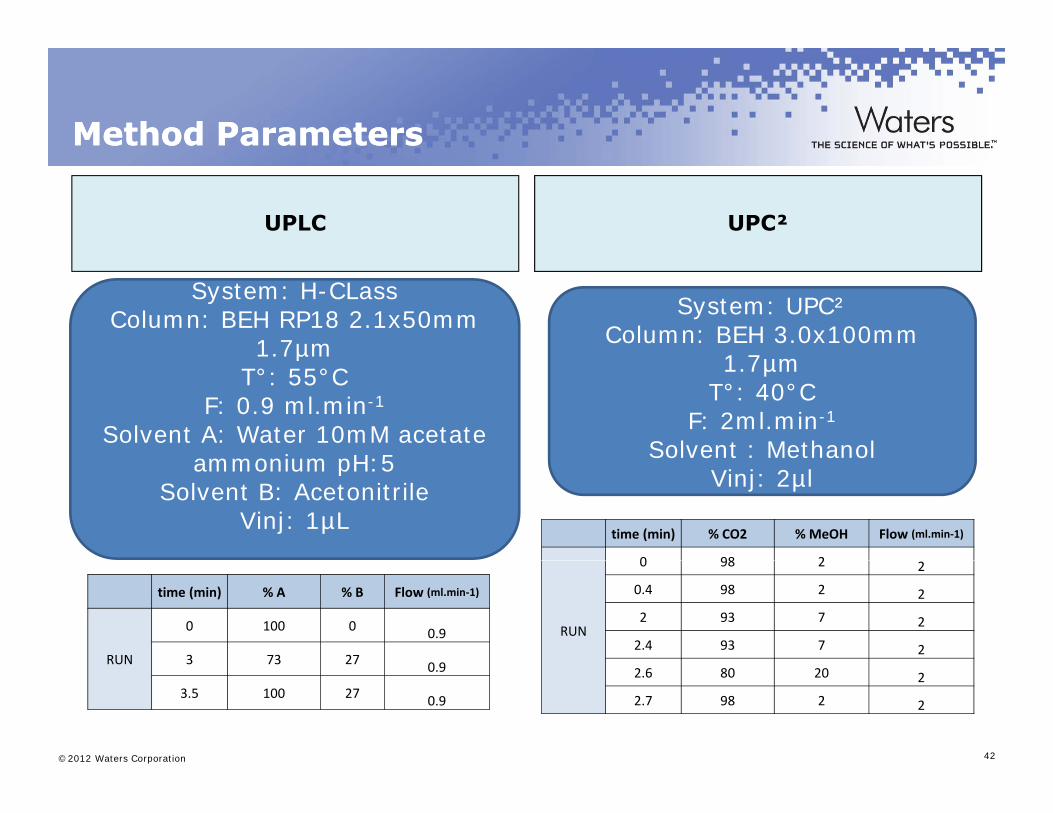
Method ParametersMethod Parameters
SFC UPLC UPC²
System: H-CLassColumn: BEH RP18 2.1x50mm
1.7µm
System: UPC²Column: BEH 3.0x100mm
1 7 1.7µm
T°: 55°CF: 0.9 ml.min-1
Solvent A: Water 10mM acetate mmoni m pH 5
1.7µm T°: 40°C
F: 2ml.min-1
Solvent : Methanolammonium pH:5Solvent B: Acetonitrile
Vinj: 1µL
So e t et a oVinj: 2µl
time (min) % CO2 % MeOH Flow (ml.min‐1)
0 98 2
time (min) % A % B Flow (ml.min‐1)
RUN
0 100 0 0.9
3 73 27 0 9
RUN
0 98 2 2
0.4 98 2 2
2 93 7 2
2.4 93 7 2
©2012 Waters Corporation 42
RUN 3 73 27 0.9
3.5 100 27 0.9
2.6 80 20 2
2.7 98 2 2
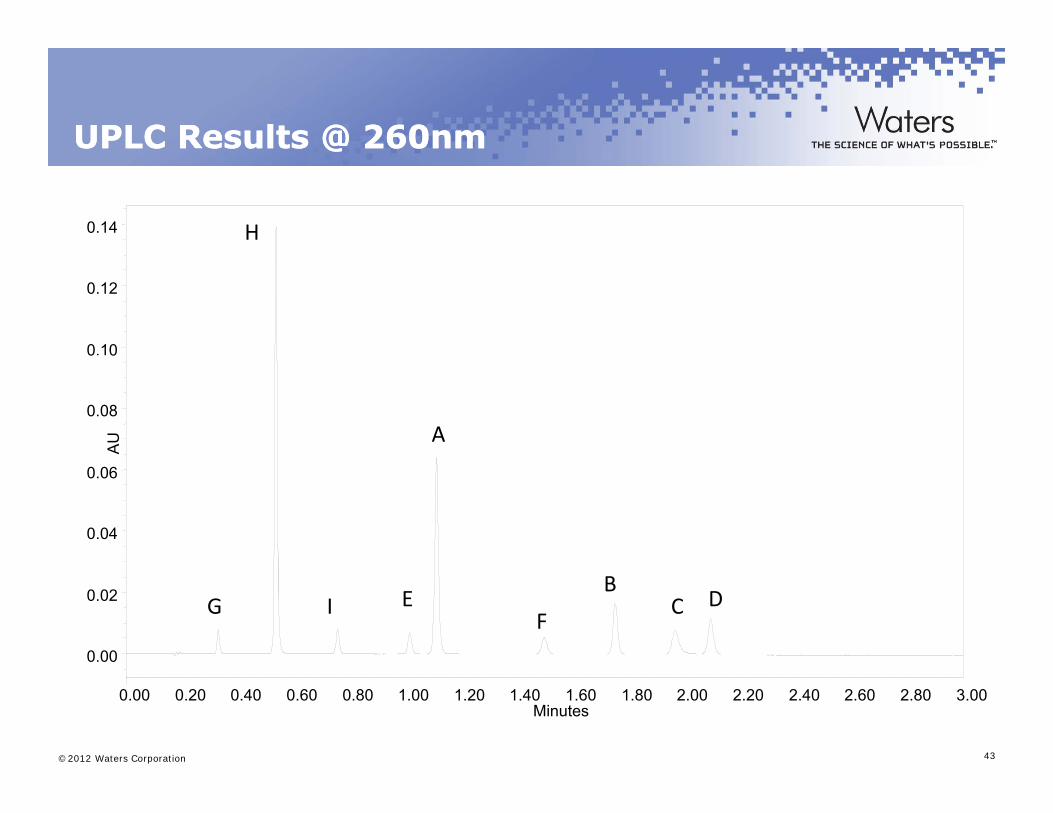
UPLC Results @ 260nm UPLC Results @ 260nm @@
0.14 H
0.10
0.12
AU
0.08
0 0
A
0.04
0.06
0.00
0.02 G DCB
FEI
©2012 Waters Corporation 43
Minutes0.00 0.20 0.40 0.60 0.80 1.00 1.20 1.40 1.60 1.80 2.00 2.20 2.40 2.60 2.80 3.00
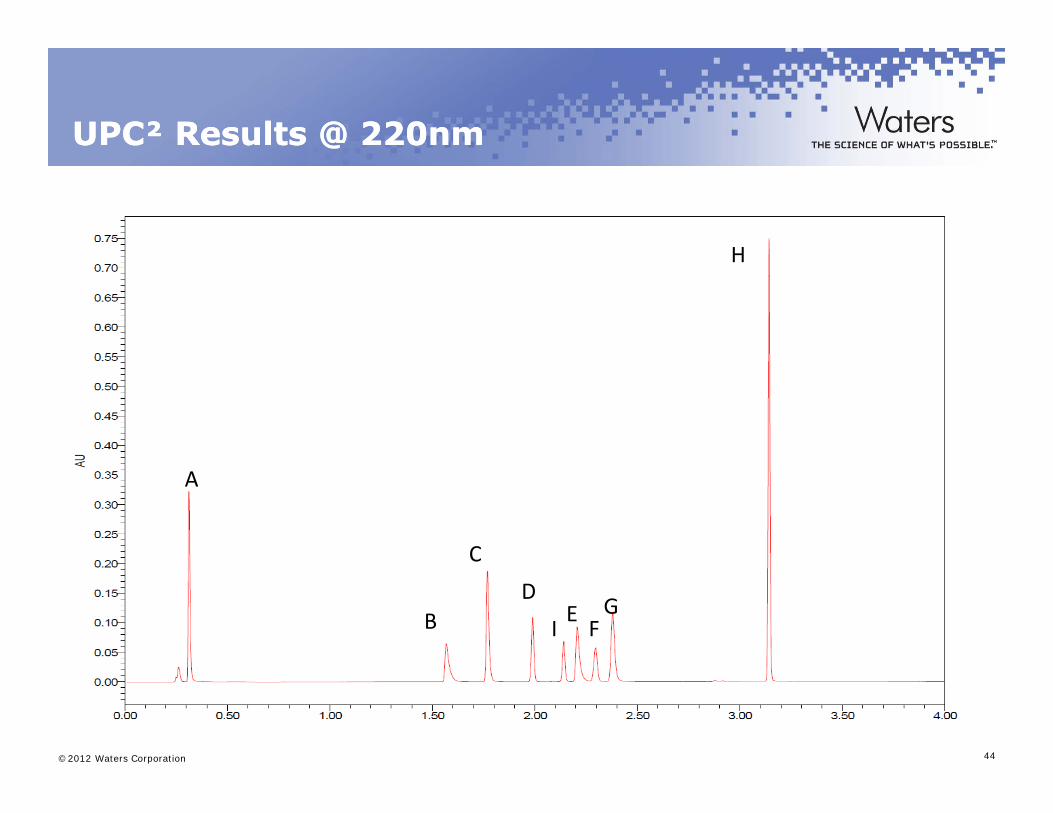
UPC² Results @ 220nm UPC² Results @ 220nm
HH
A
C
B
C
DEFG
I
©2012 Waters Corporation 44
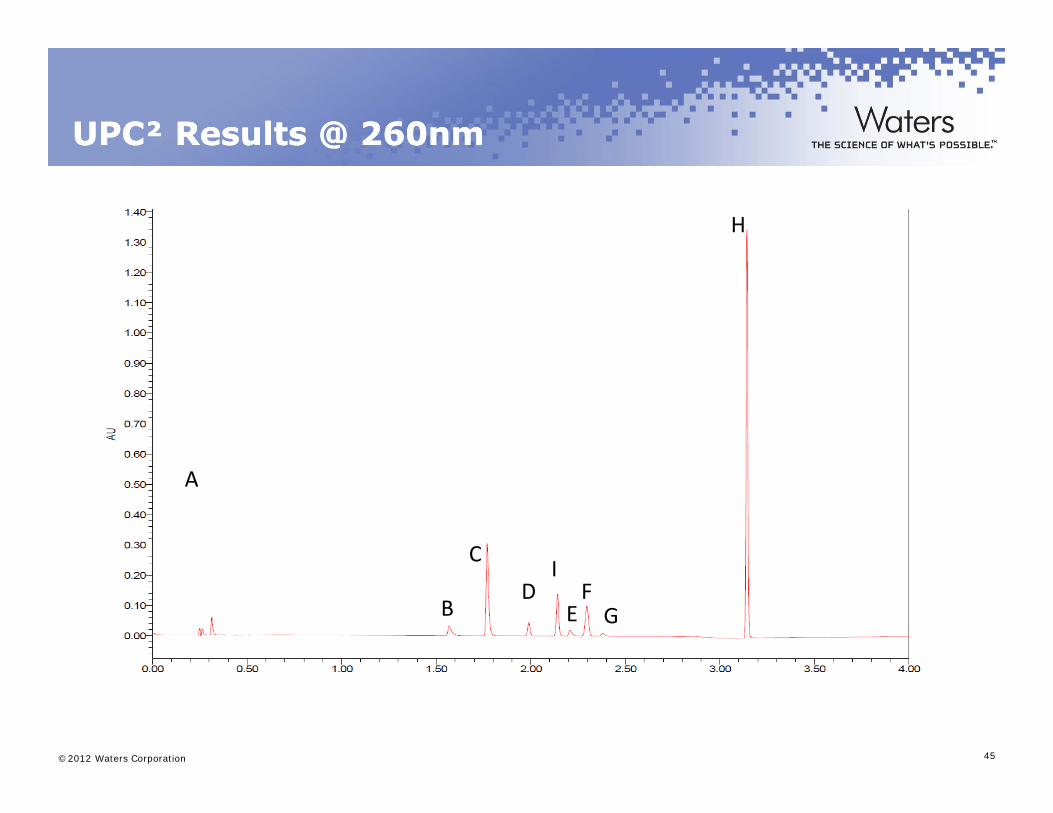
UPC² Results @ 260nm UPC² Results @ 260nm
H
A
C
B
C
DEFG
I
©2012 Waters Corporation 45
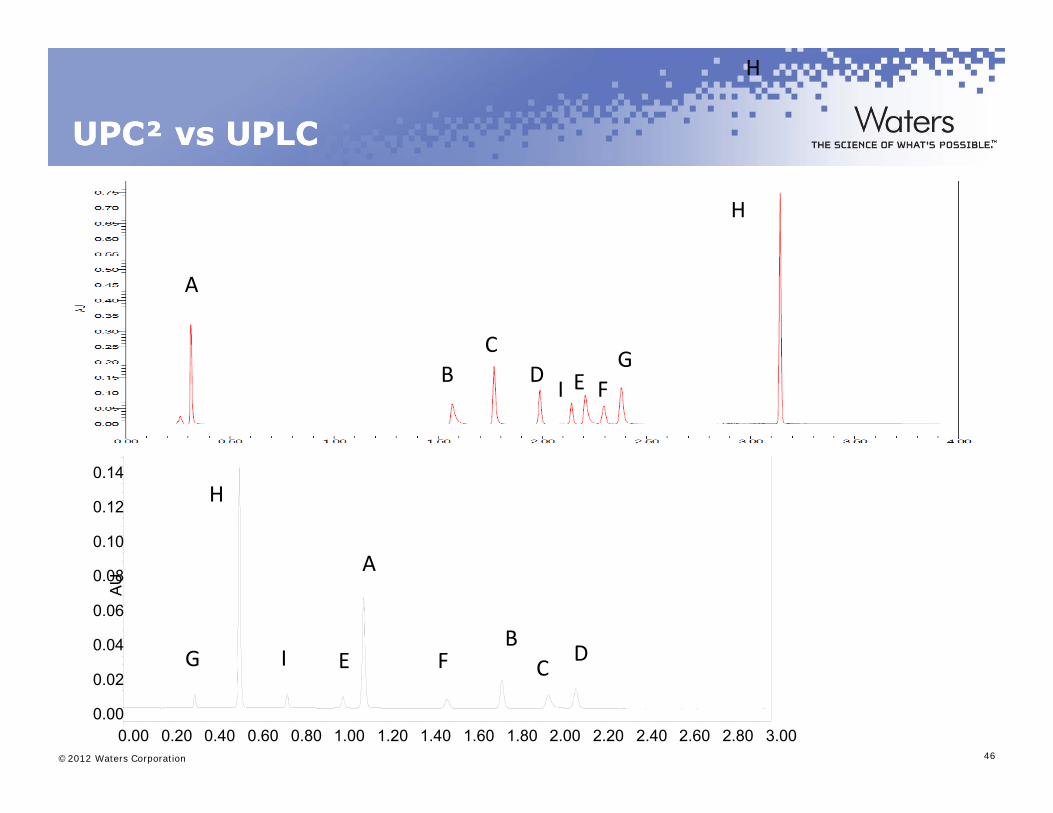
UPC² UPC² vsvs UPLCUPLC
H
H
A
CG
B D E FG
I
0.10
0.12
0.14H
A
AU
0.04
0.06
0.08
G DC
BF
A
EI
©2012 Waters Corporation 46
0.00
0.02
0.00 0.20 0.40 0.60 0.80 1.00 1.20 1.40 1.60 1.80 2.00 2.20 2.40 2.60 2.80 3.00
G CFEI

Analgeasics
©2012 Waters Corporation 47
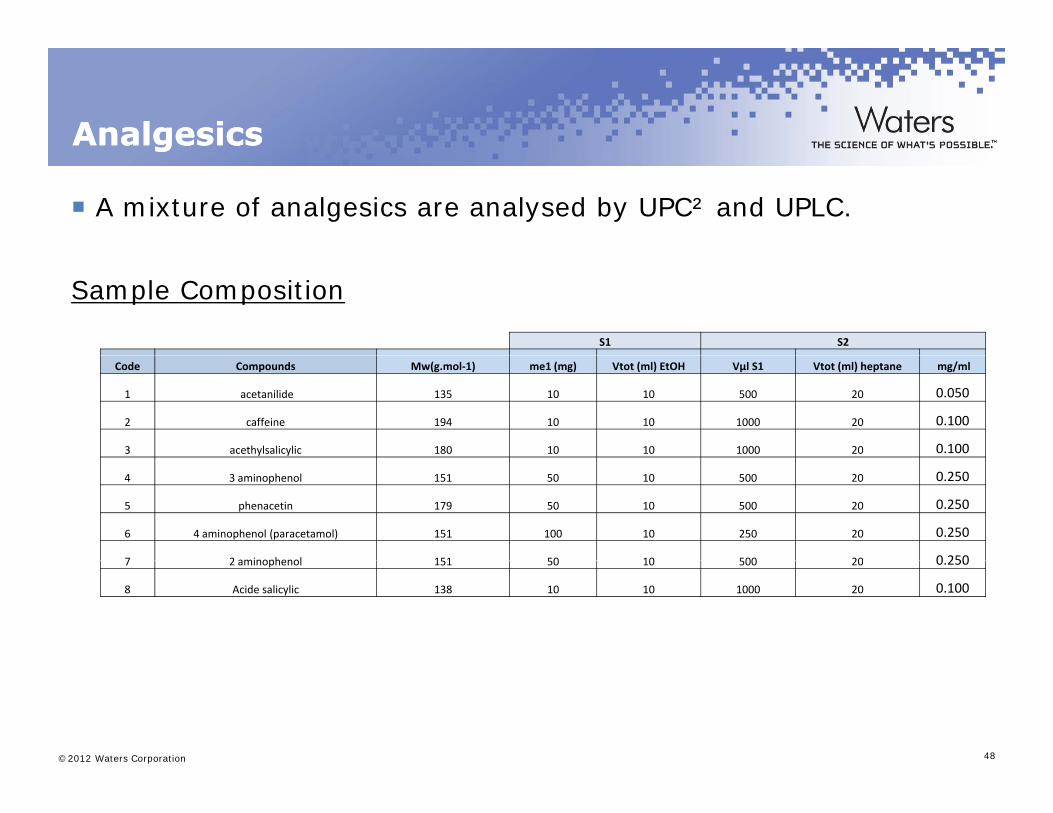
AnalgesicsAnalgesicsgg
A mixture of analgesics are analysed by UPC² and UPLC.
Sample Composition
S1 S2
Code Compounds Mw(g.mol‐1) me1 (mg) Vtot (ml) EtOH Vµl S1 Vtot (ml) heptane mg/ml
1 acetanilide 135 10 10 500 20 0.050
2 caffeine 194 10 10 1000 20 0.100
3 acethylsalicylic 180 10 10 1000 20 0.100
4 3 aminophenol 151 50 10 500 20 0.250
5 phenacetin 179 50 10 500 20 0.250
6 4 aminophenol (paracetamol) 151 100 10 250 20 0.250
7 2 aminophenol 151 50 10 500 20 0 2507 2 aminophenol 151 50 10 500 20 0.250
8 Acide salicylic 138 10 10 1000 20 0.100
©2012 Waters Corporation 48
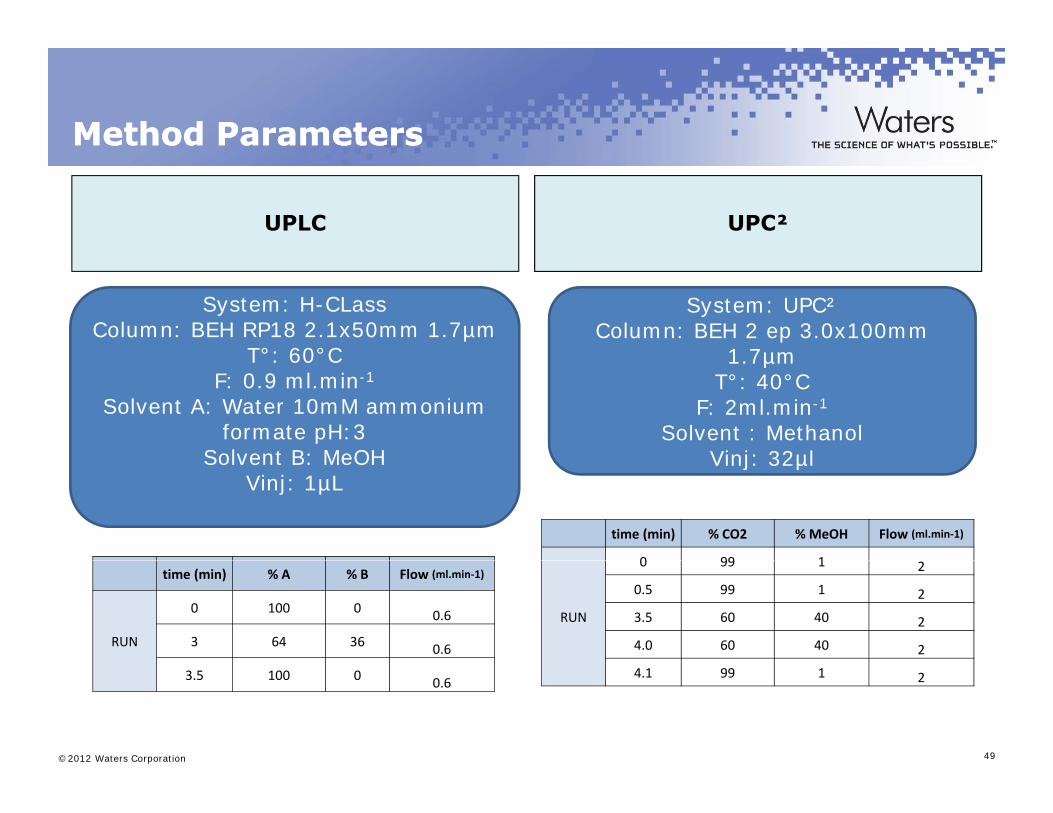
Method ParametersMethod Parameters
SFC UPLC UPC²
System: H-CLassColumn: BEH RP18 2.1x50mm 1.7µm
T°: 60°C
System: UPC²Column: BEH 2 ep 3.0x100mm
1 7µm T : 60 CF: 0.9 ml.min-1
Solvent A: Water 10mM ammonium formate pH:3
Solvent B: MeOH
1.7µm T°: 40°C
F: 2ml.min-1
Solvent : MethanolVinj: 32µlSolvent B: MeOH
Vinj: 1µLVinj: 32µl
time (min) % CO2 % MeOH Flow (ml.min‐1)
0 99 1time (min) % A % B Flow (ml.min‐1)
RUN
0 100 0 0.6
3 64 36 0.6
RUN
0 99 1 2
0.5 99 1 2
3.5 60 40 2
4.0 60 40 2
©2012 Waters Corporation 49
3.5 100 0 0.64.1 99 1 2
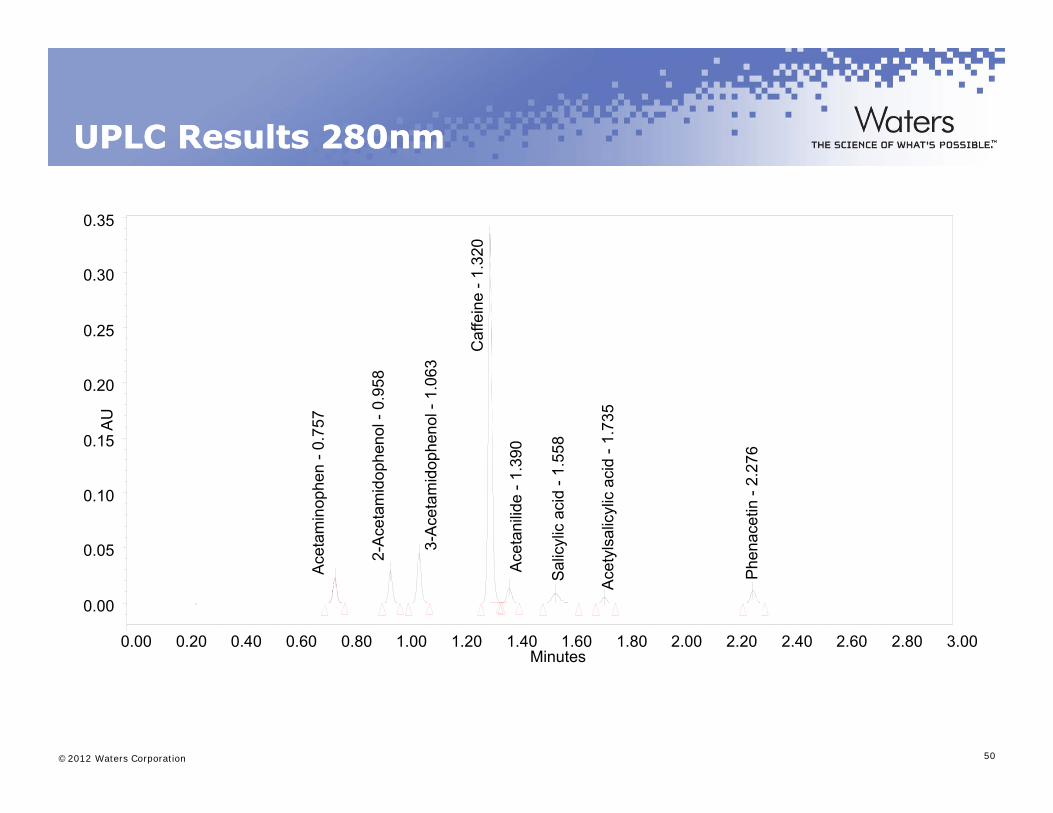
UPLC Results 280nmUPLC Results 280nm
20
0.35
Caf
fein
e -1
.32
0.25
0.30
-0.7
57
heno
l -0.
958
phen
ol -
1.06
3
90 558 -1
.735
76
AU
0.15
0.20
ceta
min
ophe
n -
2-A
ceta
mid
oph
3-A
ceta
mid
op
ceta
nilid
e -1
.3
licyl
ic a
cid
-1.5
tyls
alic
ylic
aci
d
enac
etin
-2.
27
0.05
0.10
Ac Ac Sal
Ace
t
Ph
0.00
Minutes0.00 0.20 0.40 0.60 0.80 1.00 1.20 1.40 1.60 1.80 2.00 2.20 2.40 2.60 2.80 3.00
©2012 Waters Corporation 50
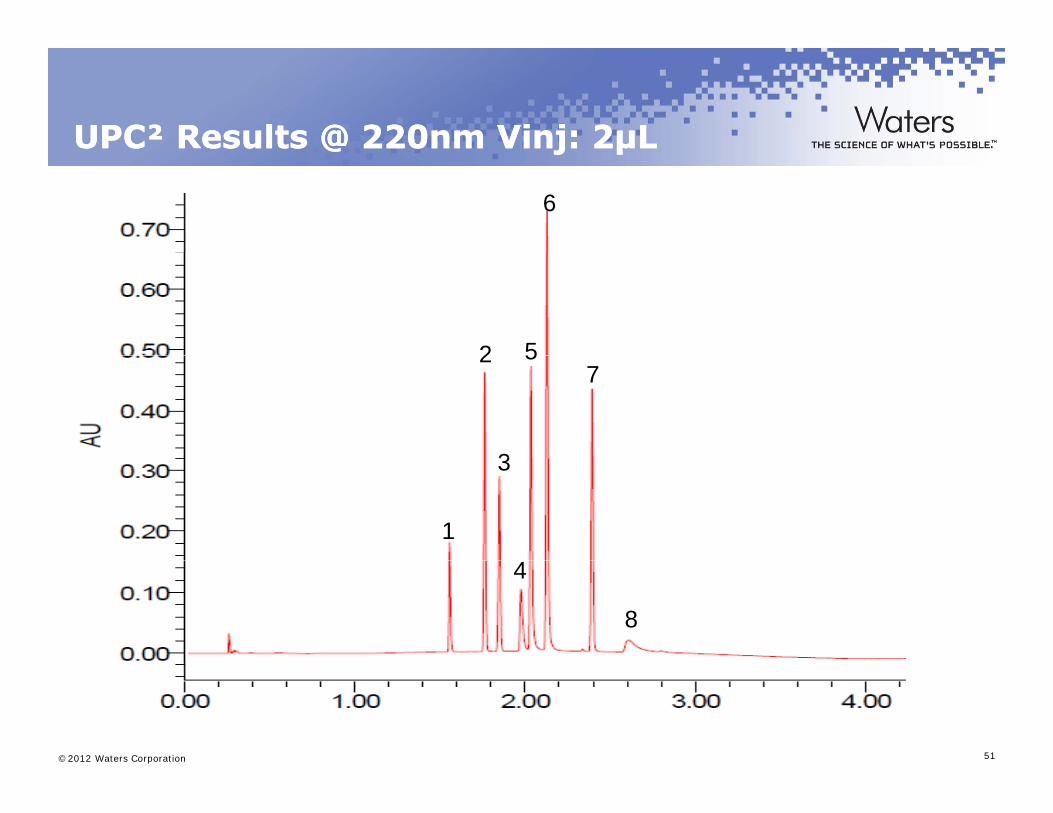
UPC² UPC² ResultsResults @ 220nm Vinj: 2µL@ 220nm Vinj: 2µL@ j µ@ j µ
6
52
3
57
2
1
3
4
8
©2012 Waters Corporation 51
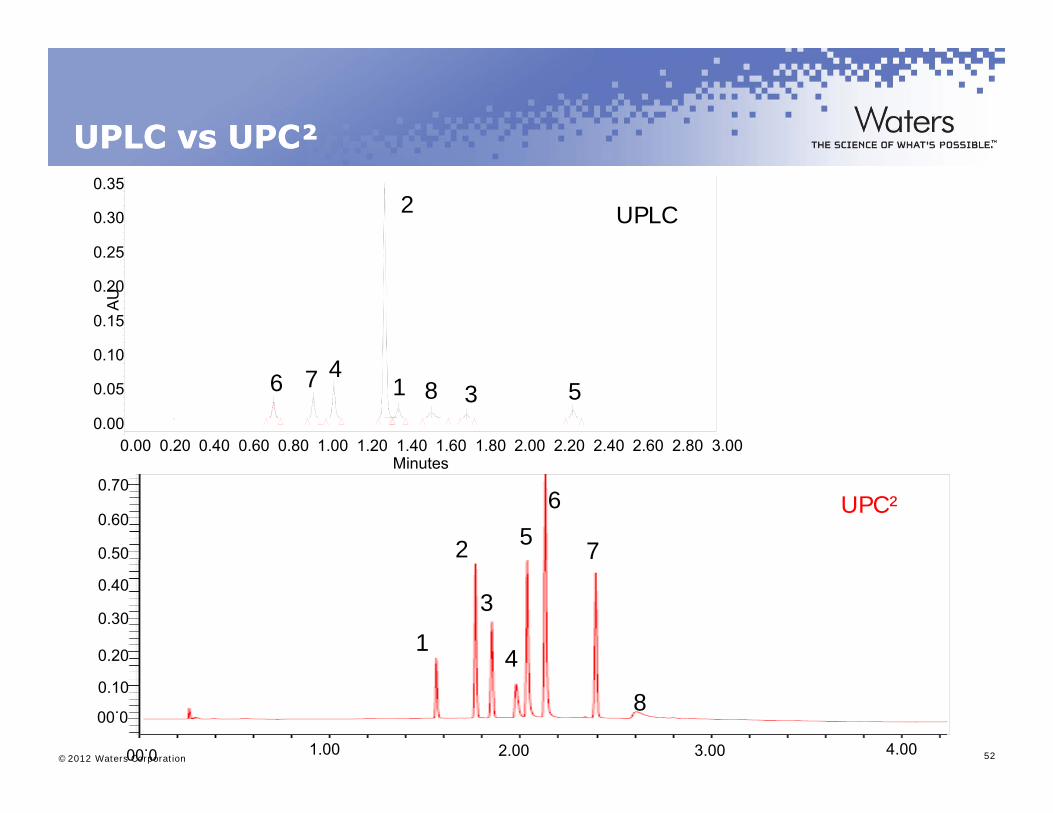
UPLC vs UPC²UPLC vs UPC²
0 25
0.30
0.352 UPLC
AU
0 10
0.15
0.20
0.25
0.00
0.05
0.10
Mi t0.00 0.20 0.40 0.60 0.80 1.00 1.20 1.40 1.60 1.80 2.00 2.20 2.40 2.60 2.80 3.00
6 7 41 8 3 5
Minutes
5
6
7
0.70
20.60
0.50
UPC²
1
3
4
0.40
0.30
0.20
©2012 Waters Corporation 52
4
8
0.00 1.00 2.00 3.00 4.00
0.00
0.10

Polymer Additives
©2012 Waters Corporation 53
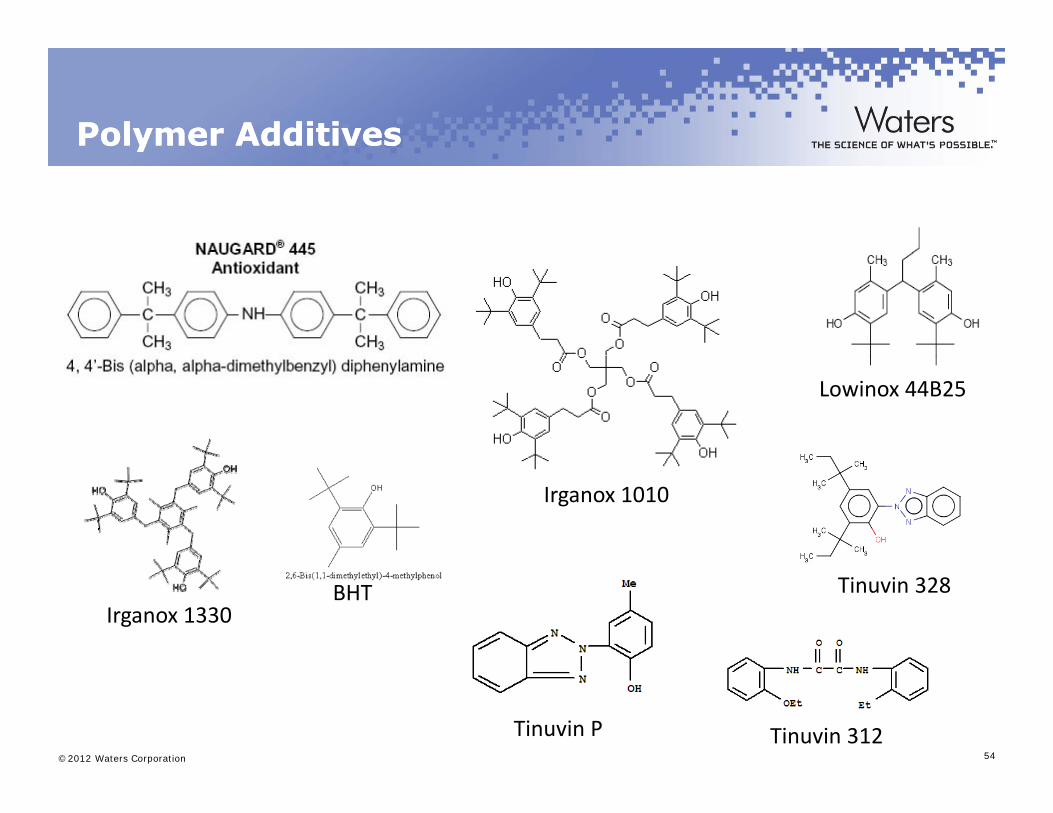
Polymer AdditivesPolymer Additivesyy
Lowinox 44B25
Irganox 1010
Tinuvin 328BHTIrganox 1330
©2012 Waters Corporation 54
Tinuvin P Tinuvin 312
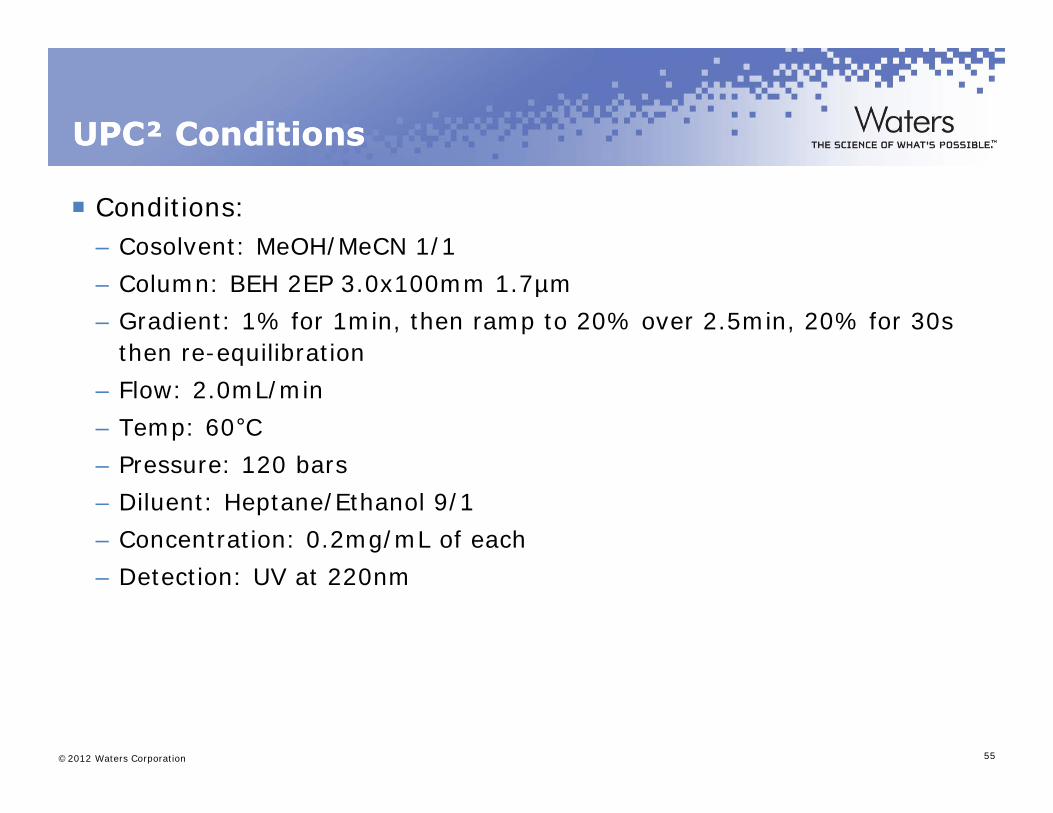
UPC² ConditionsUPC² Conditions
Conditions:– Cosolvent: MeOH/MeCN 1/1Cosolvent: MeOH/MeCN 1/1
– Column: BEH 2EP 3.0x100mm 1.7µm
– Gradient: 1% for 1min, then ramp to 20% over 2.5min, 20% for 30s then re-equilibrationthen re equilibration
– Flow: 2.0mL/min
– Temp: 60°CP 120 b– Pressure: 120 bars
– Diluent: Heptane/Ethanol 9/1
– Concentration: 0.2mg/mL of each
– Detection: UV at 220nm
©2012 Waters Corporation 55
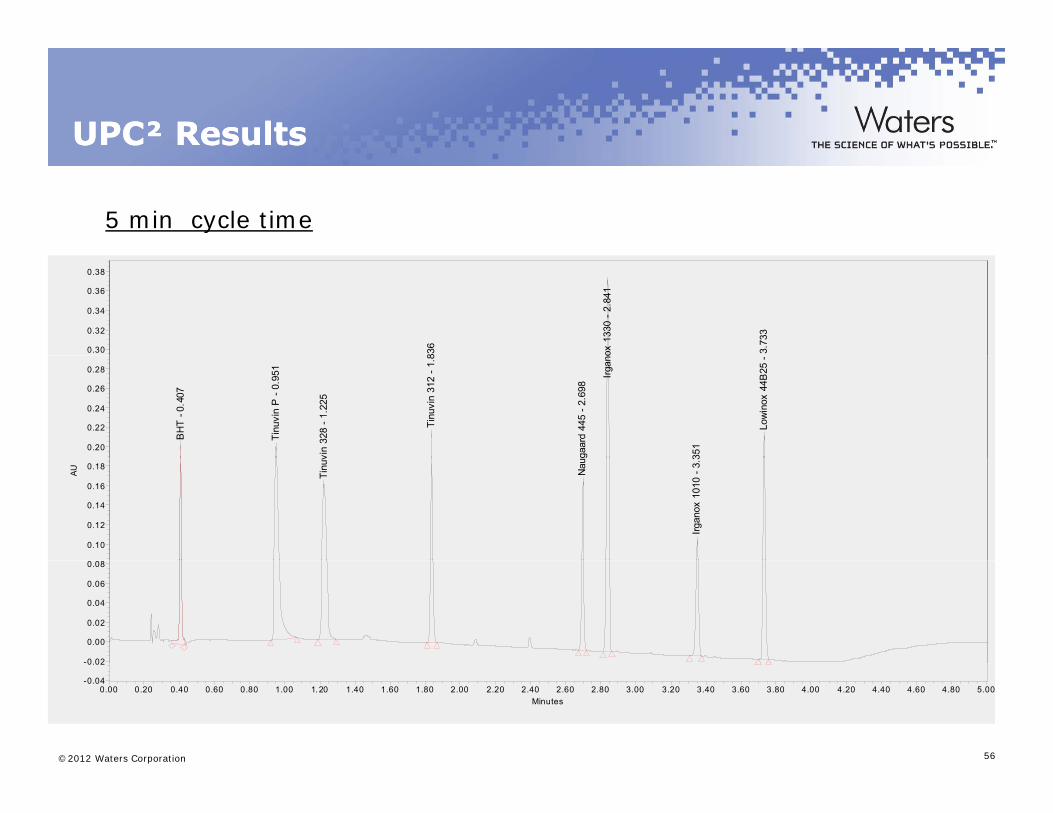
UPC² ResultsUPC² Results
5 min cycle time
836
ox 1
330
- 2.8
41
3.73
3
0.30
0.32
0.34
0.36
0.38
BH
T - 0
.407
Tinu
vin
P -
0.95
1
vin
328
- 1.2
25
Tinu
vin
312
- 1.8
gaar
d 44
5 - 2
.698
Irgan
o
351
Low
inox
44B
25 -
0.20
0.22
0.24
0.26
0.28
Tinu
v
Nau
Irgan
ox 1
010
- 3.3
AU
0.10
0.12
0.14
0.16
0.18
-0 02
0.00
0.02
0.04
0.06
0.08
©2012 Waters Corporation 56
-0.04
0.02
Minutes0.00 0.20 0.40 0.60 0.80 1.00 1.20 1.40 1.60 1.80 2.00 2.20 2.40 2.60 2.80 3.00 3.20 3.40 3.60 3.80 4.00 4.20 4.40 4.60 4.80 5.00
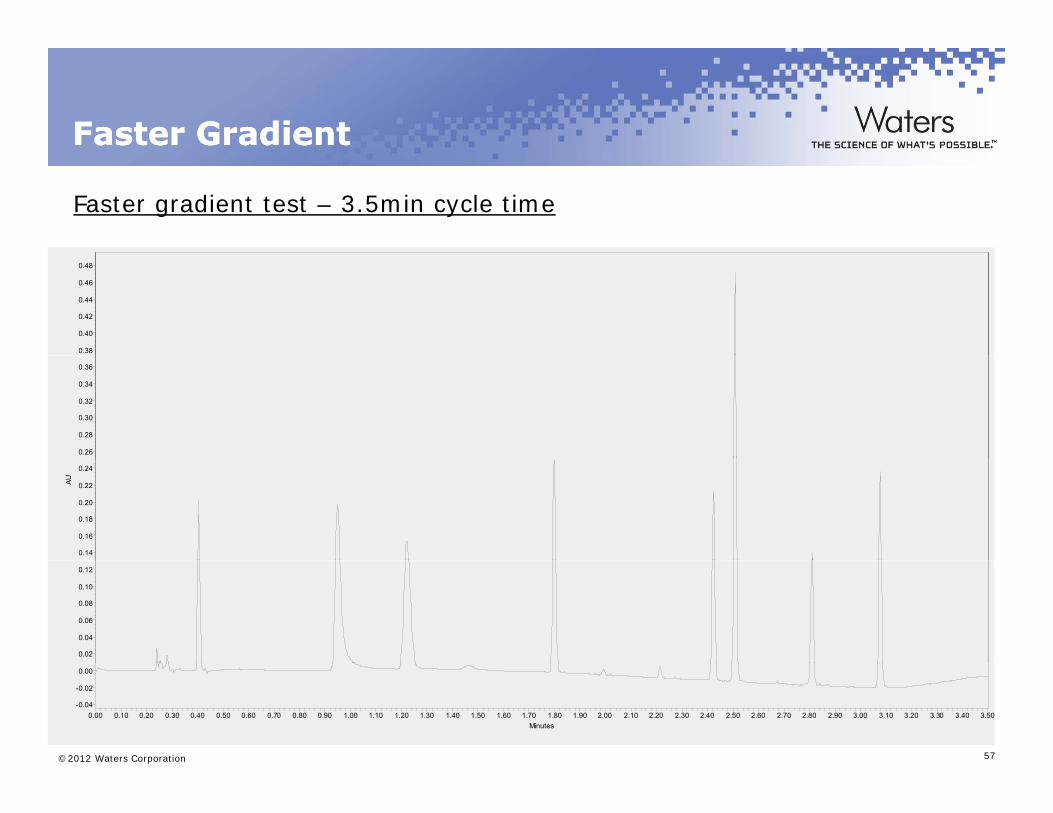
FasterFaster GradientGradient
Faster gradient test – 3.5min cycle time
0.38
0.40
0.42
0.44
0.46
0.48
0.26
0.28
0.30
0.32
0.34
0.36
AU
0.14
0.16
0.18
0.20
0.22
0.24
0.02
0.04
0.06
0.08
0.10
0.12
©2012 Waters Corporation 57
-0.04
-0.02
0.00
Minutes0.00 0.10 0.20 0.30 0.40 0.50 0.60 0.70 0.80 0.90 1.00 1.10 1.20 1.30 1.40 1.50 1.60 1.70 1.80 1.90 2.00 2.10 2.20 2.30 2.40 2.50 2.60 2.70 2.80 2.90 3.00 3.10 3.20 3.30 3.40 3.50
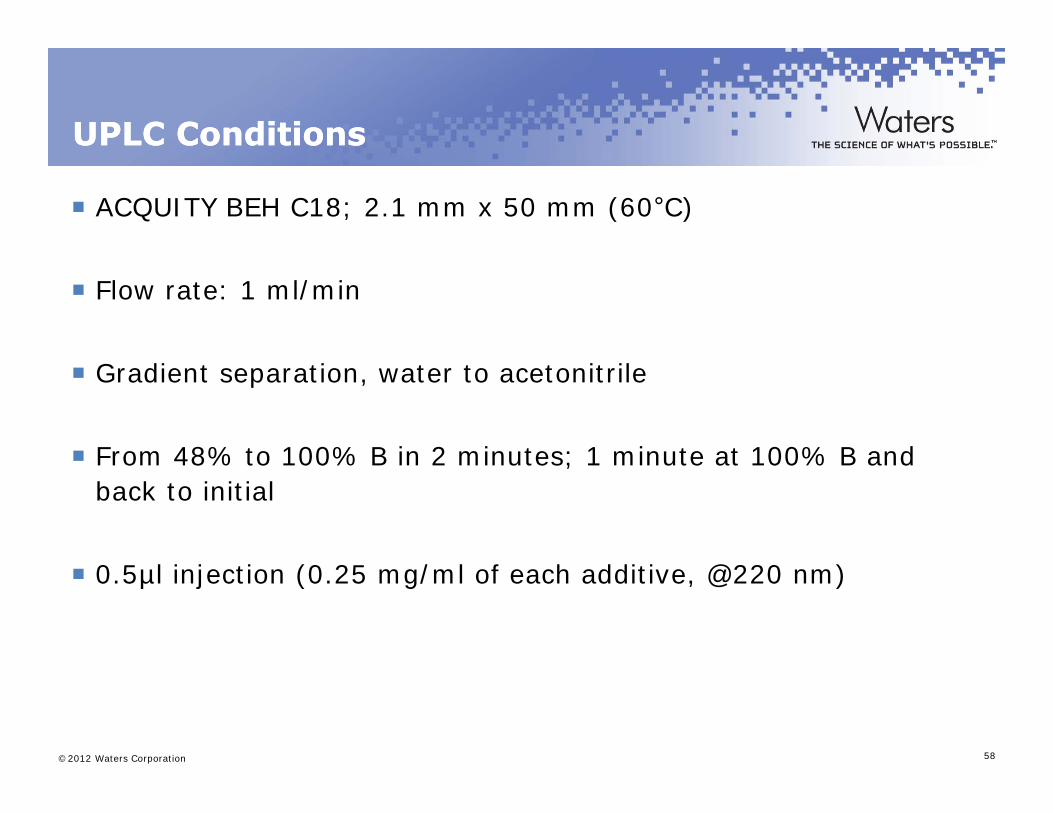
UPLC Conditions UPLC Conditions
ACQUITY BEH C18; 2.1 mm x 50 mm (60°C)
Flow rate: 1 ml/min
Gradient separation, water to acetonitrile
From 48% to 100% B in 2 minutes; 1 minute at 100% B and From 48% to 100% B in 2 minutes; 1 minute at 100% B and back to initial
0.5µl injection (0.25 mg/ml of each additive, @220 nm)
©2012 Waters Corporation 58
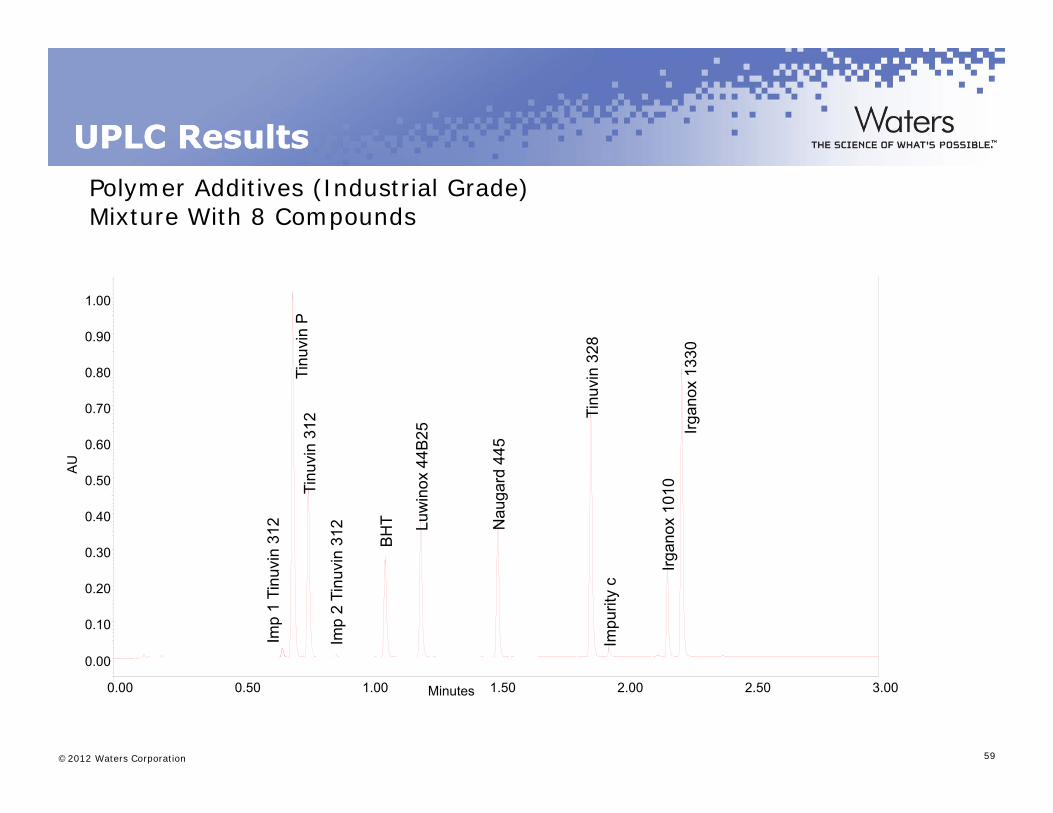
UPLC Results UPLC Results Polymer Additives (Industrial Grade)Mixture With 8 Compounds
uvin
P
328
30
0.90
1.00Ti
nuvi
n31
2
4B25
445
Tinu
vin
3
Irgan
ox13
3
U
0.60
0.70
0.80
in31
2
Tinu
v
in31
2
BHT Lu
win
ox44
Nau
gard
4
gano
x10
10
AU
0.30
0.40
0.50
Imp
1 Ti
nuv
Imp
2 Ti
nuvi
Impu
rity
c
Irg0 00
0.10
0.20
©2012 Waters Corporation 59
0.00
Minutes0.00 0.50 1.00 1.50 2.00 2.50 3.00
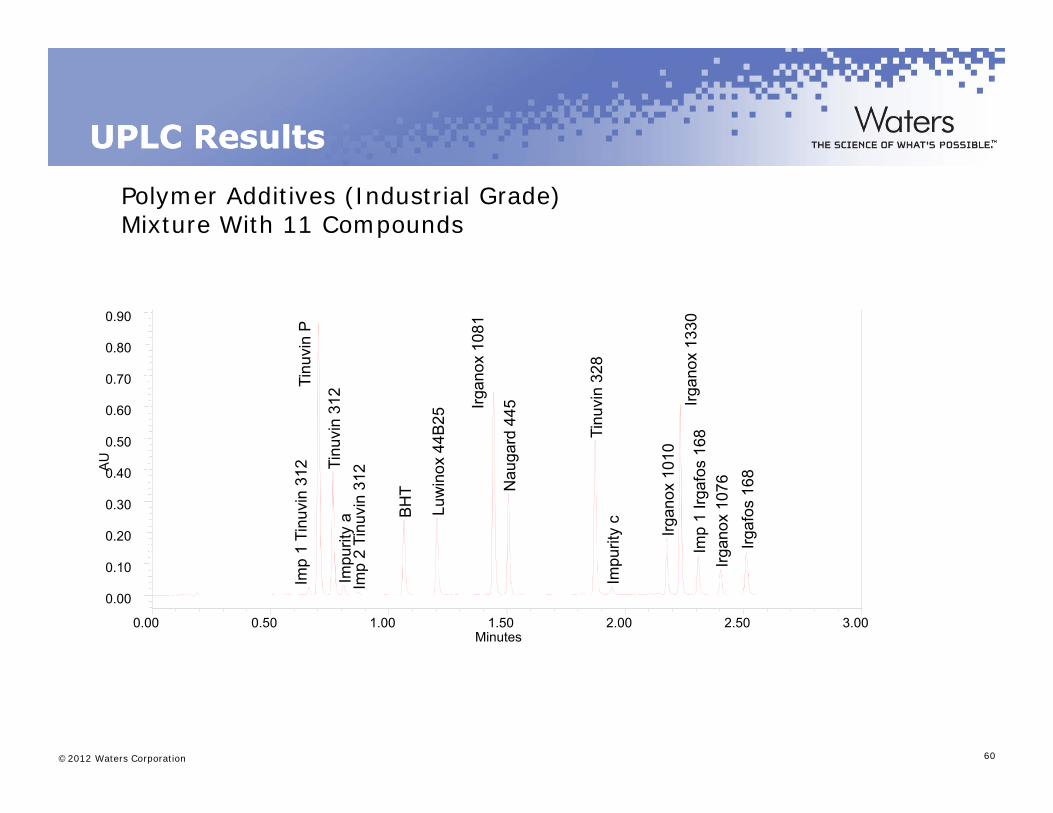
UPLC Results UPLC Results
Polymer Additives (Industrial Grade)Mixture With 11 Compounds
vin
P
1081
x13
30
0.80
0.90Ti
nuv
inuv
in 3
12
x 44
B25
Irgan
ox
gard
445
Tinu
vin
328
10Irg
anox
168
U
0.50
0.60
0.70
p 1
Tinu
vin
312 Ti
purit
y a
2 Ti
nuvi
n 31
2
BHT
Luw
inox
Nau
g
purit
y c
Irgan
ox 1
01
Imp
1 Irg
afos
rg
anox
107
6Irg
afos
168
AU
0.20
0.30
0.40
Imp
Imp
Imp
Imp Ir
0.00
0.10
Minutes0.00 0.50 1.00 1.50 2.00 2.50 3.00
©2012 Waters Corporation 60
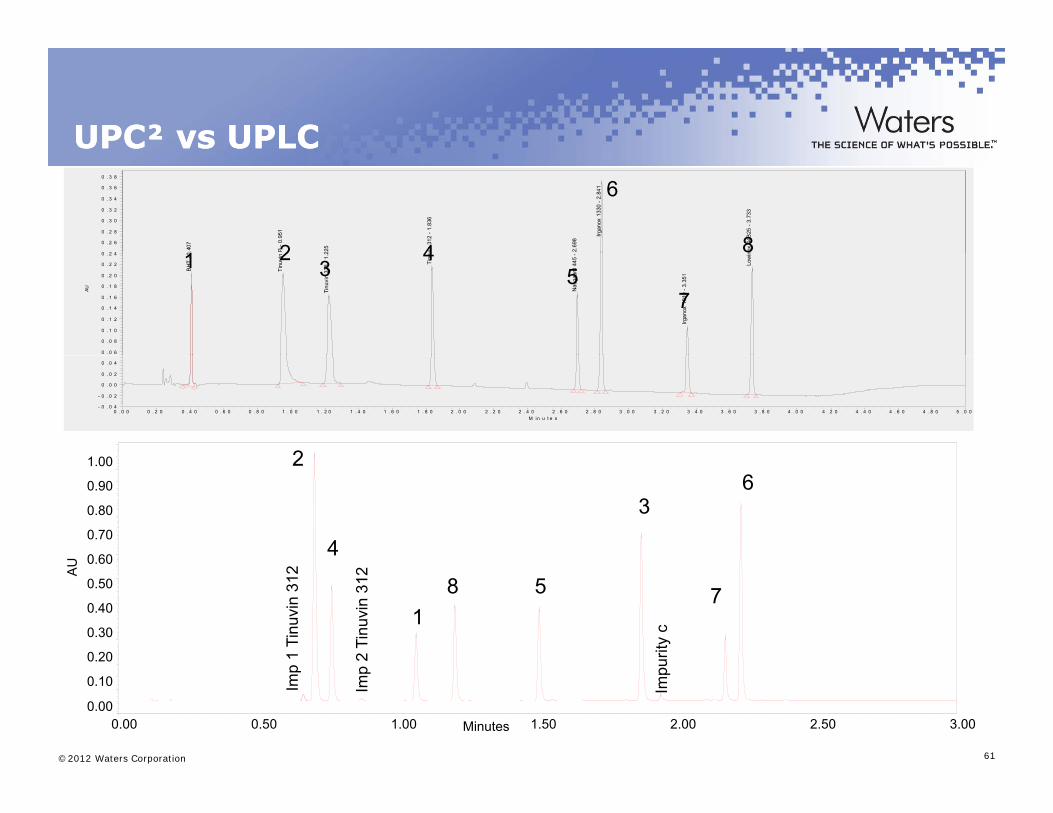
UPC² vs UPLC UPC² vs UPLC 0.
407
P -
0.95
1
225
vin
312
- 1.8
36
2.69
8
Irgan
ox 1
330
- 2.8
41
nox
44B
25 -
3.73
3
0 2 4
0 . 2 6
0 . 2 8
0 . 3 0
0 . 3 2
0 . 3 4
0 . 3 6
0 . 3 8
2 4
6
81B
HT
- 0
Tinu
vin
Tinu
vin
328
- 1.2
Tinu
v
Nau
gaar
d 44
5 -
Irgan
ox 1
010
- 3.3
51
Low
in
AU
0 . 0 6
0 . 0 8
0 . 1 0
0 . 1 2
0 . 1 4
0 . 1 6
0 . 1 8
0 . 2 0
0 . 2 2
0 . 2 4 23
45
7
1
- 0 . 0 4
- 0 . 0 2
0 . 0 0
0 . 0 2
0 . 0 4
M in u t e s0 . 0 0 0 . 2 0 0 . 4 0 0 . 6 0 0 . 8 0 1 . 0 0 1 . 2 0 1 . 4 0 1 . 6 0 1 . 8 0 2 . 0 0 2 . 2 0 2 . 4 0 2 . 6 0 2 . 8 0 3 . 0 0 3 . 2 0 3 . 4 0 3 . 6 0 3 . 8 0 4 . 0 0 4 . 2 0 4 . 4 0 4 . 6 0 4 . 8 0 5 . 0 0
1 00 2
U 0 60
0.70
0.80
0.90
1.00 2
3
4
6
1 Ti
nuvi
n31
2
2 Ti
nuvi
n31
2
1
urity
c
AU
0.20
0.30
0.40
0.50
0.60
5 78
©2012 Waters Corporation 61
Imp
Imp
Impu
0.00
0.10
Minutes0.00 0.50 1.00 1.50 2.00 2.50 3.00
HAP
©2012 Waters Corporation 62
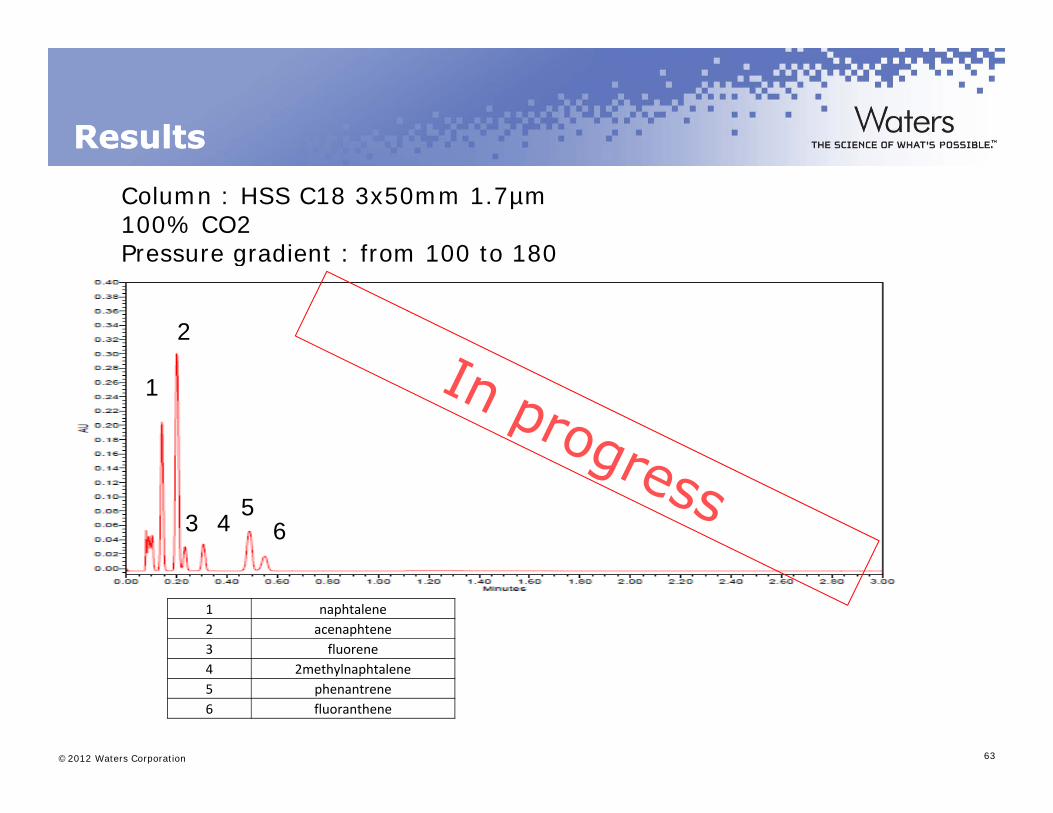
ResultsResults
Column : HSS C18 3x50mm 1.7µm100% CO2Pressure gradient : from 100 to 180
2
Pressure gradient : from 100 to 180
1
35
4 6
1 naphtalene2 acenaphtene3 fluorene
©2012 Waters Corporation 63
4 2methylnaphtalene5 phenantrene6 fluoranthene
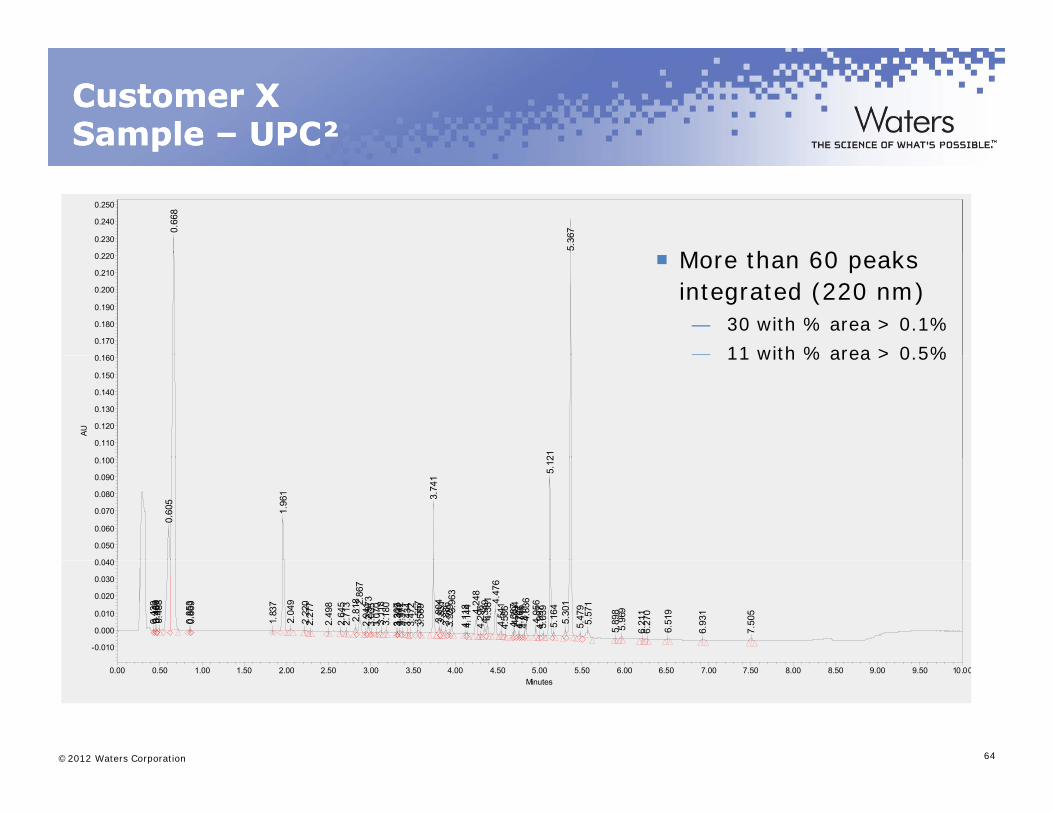
Customer XCustomer XSample Sample –– UPC²UPC²
0.66
8
5.36
7
0.230
0.240
0.250
pp
M th 60 k
0 160
0.170
0.180
0.190
0.200
0.210
0.220 More than 60 peaks integrated (220 nm)— 30 with % area > 0.1%
— 11 with % area > 0 5%
21
AU
0 100
0.110
0.120
0.130
0.140
0.150
0.160 11 with % area > 0.5%
0.60
5
1.96
1 3.74
1
5.12
0 040
0.050
0.060
0.070
0.080
0.090
0.100
0.43
00.
450
0.46
10.
488
0.85
30.
869
1.83
7
2.04
92.
220
2.27
7
2.49
82.
645
2.71
32.
818 2.
867
2.94
12.
973
3.00
53.
070
3.11
83.
180
3.30
73.
319
3.34
23.
371
3.43
43.
472
3.55
73.
589
3.80
43.
831
3.88
63.
929 3.96
34.
118
4.14
4 4.24
84.
296
4.34
94.
381 4.
476
4.54
14.
586
4.68
74.
704
4.74
74.
766
4.81
14.
836
4.95
64.
997
5.03
95.
164
5.30
15.
479
5.57
1
5.89
85.
969
6.21
16.
270
6.51
9
6.93
1
7.50
5
-0.010
0.000
0.010
0.020
0.030
0.040
©2012 Waters Corporation 64
Minutes0.00 0.50 1.00 1.50 2.00 2.50 3.00 3.50 4.00 4.50 5.00 5.50 6.00 6.50 7.00 7.50 8.00 8.50 9.00 9.50 10.00
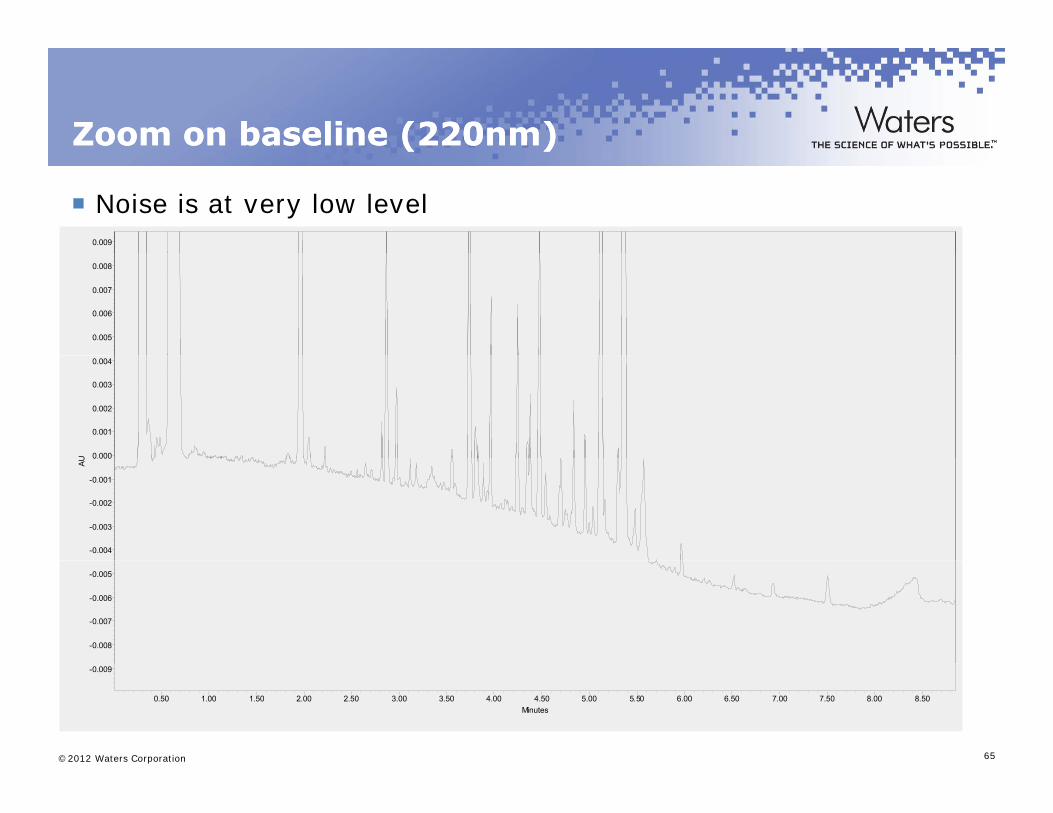
Zoom on Zoom on baselinebaseline (220nm)(220nm)
0.009
( )( )
Noise is at very low level
0.005
0.006
0.007
0.008
U 0.000
0.001
0.002
0.003
0.004
AU
-0.004
-0.003
-0.002
-0.001
0.000
-0.008
-0.007
-0.006
-0.005
©2012 Waters Corporation 65
-0.009
Minutes0.50 1.00 1.50 2.00 2.50 3.00 3.50 4.00 4.50 5.00 5.50 6.00 6.50 7.00 7.50 8.00 8.50
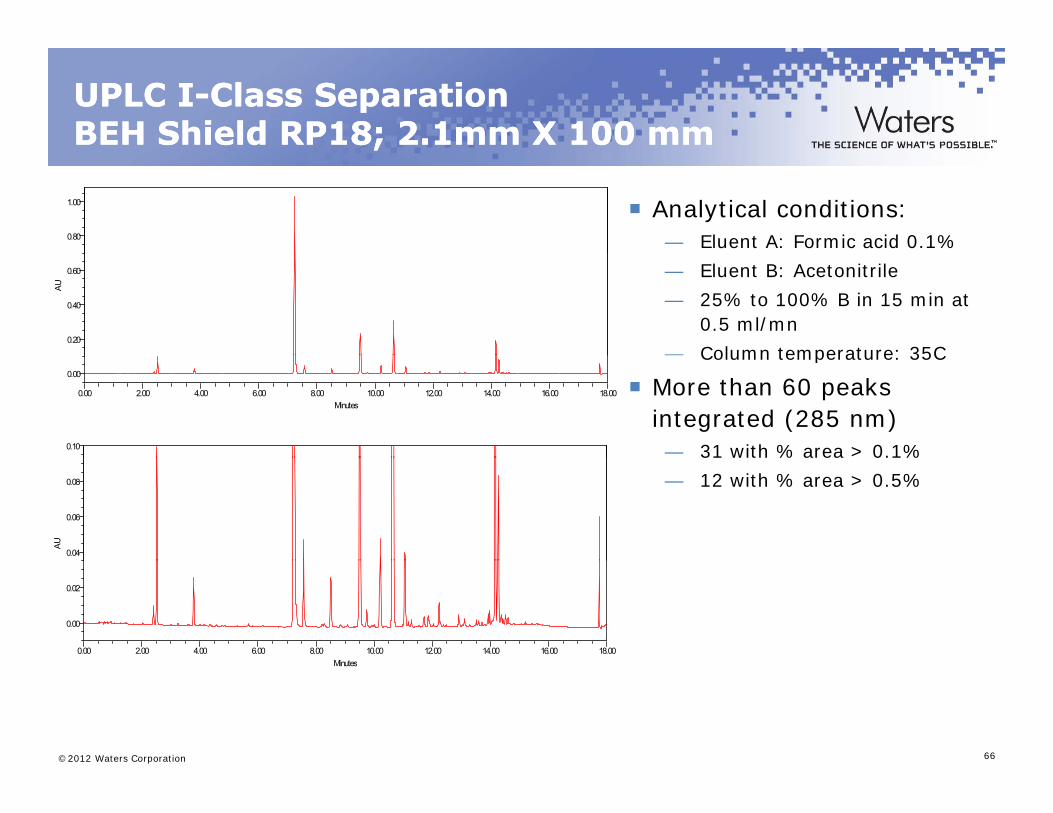
UPLC IUPLC I--Class SeparationClass SeparationBEH Shield RP18; 2.1mm X 100 mmBEH Shield RP18; 2.1mm X 100 mm;;
0.80
1.00 Analytical conditions:— Eluent A: Formic acid 0.1%
AU
0.20
0.40
0.60 — Eluent B: Acetonitrile
— 25% to 100% B in 15 min at 0.5 ml/mn
— Column temperature: 35C0.00
Minutes0.00 2.00 4.00 6.00 8.00 10.00 12.00 14.00 16.00 18.00
0.10
Column temperature: 35C
More than 60 peaks integrated (285 nm)— 31 with % area > 0.1%
AU
0.04
0.06
0.08 — 12 with % area > 0.5%
0.00
0.02
Minutes0.00 2.00 4.00 6.00 8.00 10.00 12.00 14.00 16.00 18.00
©2012 Waters Corporation 66
Minutes
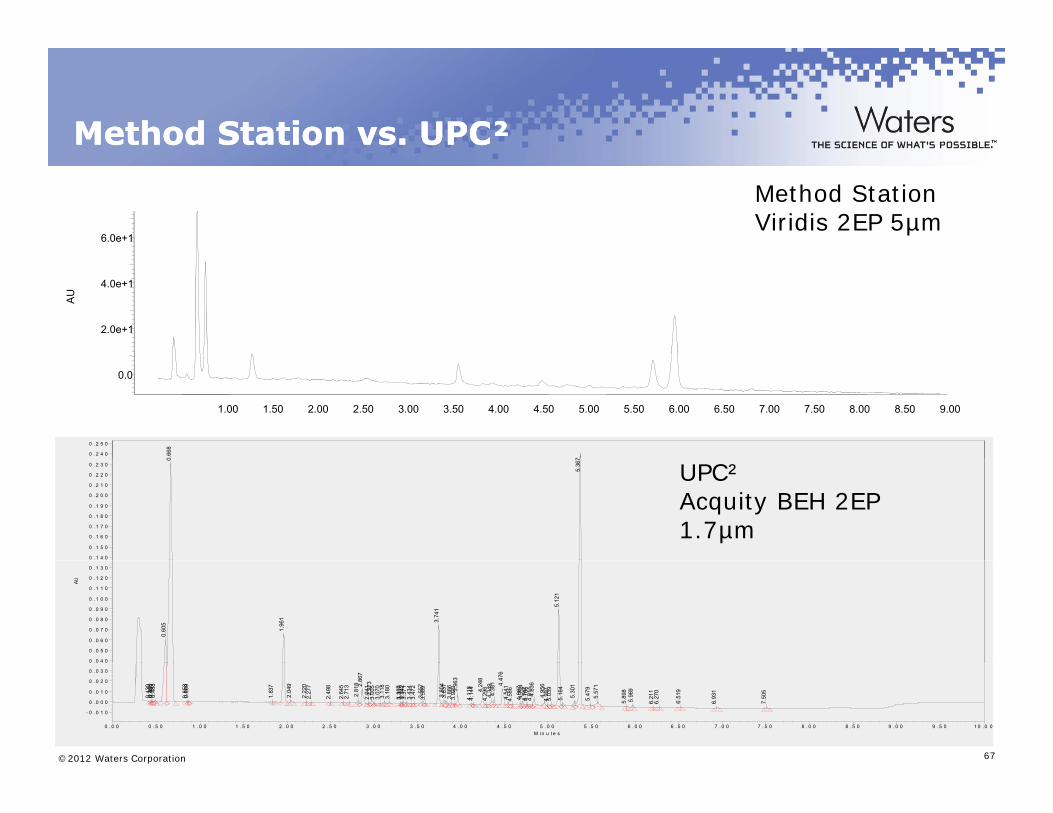
MethodMethod Station vs. UPC²Station vs. UPC²
6.0e+1
Method Station Viridis 2EP 5µm
AU
2.0e+1
4.0e+1
0.66
8
7
0 . 2 4 0
0 . 2 5 0
1.00 1.50 2.00 2.50 3.00 3.50 4.00 4.50 5.00 5.50 6.00 6.50 7.00 7.50 8.00 8.50 9.00
0.0
0
5.36
7
0 . 1 4 0
0 . 1 5 0
0 . 1 6 0
0 . 1 7 0
0 . 1 8 0
0 . 1 9 0
0 . 2 0 0
0 . 2 1 0
0 . 2 2 0
0 . 2 3 0 UPC²Acquity BEH 2EP 1.7µm
0.60
5
1.96
1 3.74
1
5.12
1
AU
0 . 0 4 0
0 . 0 5 0
0 . 0 6 0
0 . 0 7 0
0 . 0 8 0
0 . 0 9 0
0 . 1 0 0
0 . 1 1 0
0 . 1 2 0
0 . 1 3 0
©2012 Waters Corporation 67
0.43
00.
450
0.46
10.
488
0.85
30.
869
1.83
7
2.04
9
2.22
02.
277
2.49
8
2.64
52.
713
2.81
8 2.86
72.
941
2.97
33.
005
3.07
03.
118
3.18
0
3.30
73.
319
3.34
23.
371
3.43
43.
472
3.55
73.
589
3.80
43.
831
3.88
63.
929 3.96
3
4.11
84.
144 4.24
84.
296
4.34
94.
381 4.
476
4.54
14.
586
4.68
74.
704
4.74
74.
766
4.81
14.
836
4.95
64.
997
5.03
9
5.16
4
5.30
1
5.47
95.
571
5.89
85.
969
6.21
16.
270
6.51
9
6.93
1
7.50
5
- 0 . 0 1 0
0 . 0 0 0
0 . 0 1 0
0 . 0 2 0
0 . 0 3 0
M in u t e s0 . 0 0 0 . 5 0 1 . 0 0 1 . 5 0 2 . 0 0 2 . 5 0 3 . 0 0 3 . 5 0 4 . 0 0 4 . 5 0 5 . 0 0 5 . 5 0 6 . 0 0 6 . 5 0 7 . 0 0 7 . 5 0 8 . 0 0 8 . 5 0 9 . 0 0 9 . 5 0 1 0 .0 0


