36
2012 WITTENBERG UNIVERSITY FACT BOOK 10/09/2012

2012WITTENBERG UNIVERSITY
FACT BOOK
10/09/2012

2012WITTENBERG UNIVERSITY
FACT BOOK
APPLICANT INFORMATION
2012 FACT BOOK
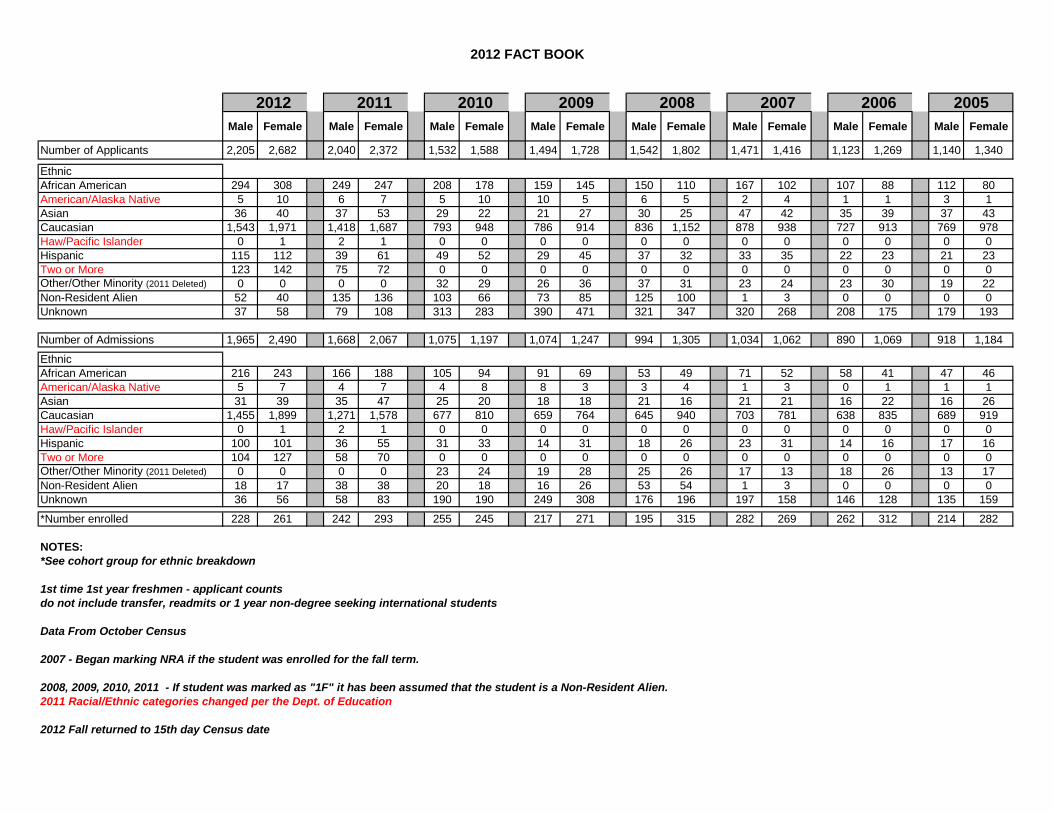
2012 2011 2010 2009 2008 2007 2006 2005Male Female Male Female Male Female Male Female Male Female Male Female Male Female Male Female
Number of Applicants 2,205 2,682 2,040 2,372 1,532 1,588 1,494 1,728 1,542 1,802 1,471 1,416 1,123 1,269 1,140 1,340
EthnicAfrican American 294 308 249 247 208 178 159 145 150 110 167 102 107 88 112 80American/Alaska Native 5 10 6 7 5 10 10 5 6 5 2 4 1 1 3 1Asian 36 40 37 53 29 22 21 27 30 25 47 42 35 39 37 43Caucasian 1,543 1,971 1,418 1,687 793 948 786 914 836 1,152 878 938 727 913 769 978Haw/Pacific Islander 0 1 2 1 0 0 0 0 0 0 0 0 0 0 0 0Hispanic 115 112 39 61 49 52 29 45 37 32 33 35 22 23 21 23Two or More 123 142 75 72 0 0 0 0 0 0 0 0 0 0 0 0Other/Other Minority (2011 Deleted) 0 0 0 0 32 29 26 36 37 31 23 24 23 30 19 22Non-Resident Alien 52 40 135 136 103 66 73 85 125 100 1 3 0 0 0 0Unknown 37 58 79 108 313 283 390 471 321 347 320 268 208 175 179 193
Number of Admissions 1,965 2,490 1,668 2,067 1,075 1,197 1,074 1,247 994 1,305 1,034 1,062 890 1,069 918 1,184
EthnicAfrican American 216 243 166 188 105 94 91 69 53 49 71 52 58 41 47 46American/Alaska Native 5 7 4 7 4 8 8 3 3 4 1 3 0 1 1 1Asian 31 39 35 47 25 20 18 18 21 16 21 21 16 22 16 26Caucasian 1,455 1,899 1,271 1,578 677 810 659 764 645 940 703 781 638 835 689 919Haw/Pacific Islander 0 1 2 1 0 0 0 0 0 0 0 0 0 0 0 0Hispanic 100 101 36 55 31 33 14 31 18 26 23 31 14 16 17 16Two or More 104 127 58 70 0 0 0 0 0 0 0 0 0 0 0 0Other/Other Minority (2011 Deleted) 0 0 0 0 23 24 19 28 25 26 17 13 18 26 13 17Non-Resident Alien 18 17 38 38 20 18 16 26 53 54 1 3 0 0 0 0Unknown 36 56 58 83 190 190 249 308 176 196 197 158 146 128 135 159
*Number enrolled 228 261 242 293 255 245 217 271 195 315 282 269 262 312 214 282
NOTES:*See cohort group for ethnic breakdown
1st time 1st year freshmen - applicant countsdo not include transfer, readmits or 1 year non-degree seeking international students
Data From October Census
2007 - Began marking NRA if the student was enrolled for the fall term.
2008, 2009, 2010, 2011 - If student was marked as "1F" it has been assumed that the student is a Non-Resident Alien.2011 Racial/Ethnic categories changed per the Dept. of Education
2012 Fall returned to 15th day Census date

2012WITTENBERG UNIVERSITY
FACT BOOK
TRADITIONAL STUDENTS
2012 FACT BOOK
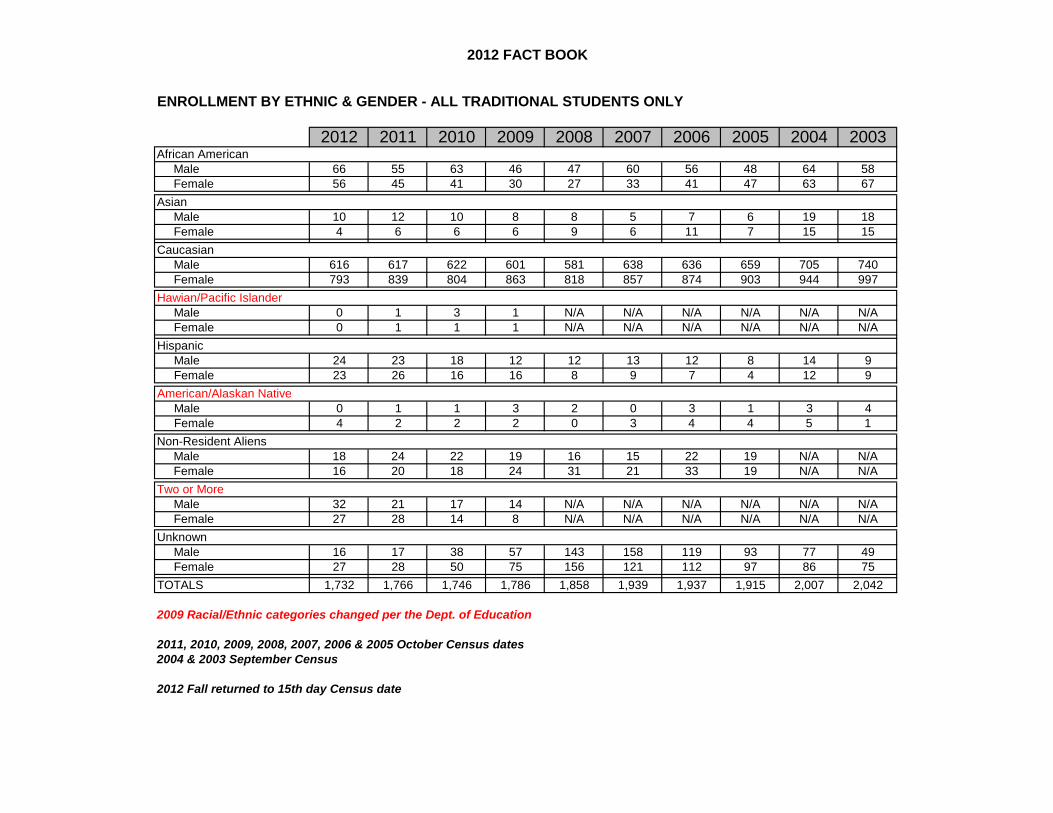
ENROLLMENT BY ETHNIC & GENDER - ALL TRADITIONAL STUDENTS ONLY
2012 2011 2010 2009 2008 2007 2006 2005 2004 2003African American Male 66 55 63 46 47 60 56 48 64 58 Female 56 45 41 30 27 33 41 47 63 67Asian Male 10 12 10 8 8 5 7 6 19 18 Female 4 6 6 6 9 6 11 7 15 15Caucasian Male 616 617 622 601 581 638 636 659 705 740 Female 793 839 804 863 818 857 874 903 944 997Hawian/Pacific Islander Male 0 1 3 1 N/A N/A N/A N/A N/A N/A Female 0 1 1 1 N/A N/A N/A N/A N/A N/AHispanic Male 24 23 18 12 12 13 12 8 14 9 Female 23 26 16 16 8 9 7 4 12 9American/Alaskan Native Male 0 1 1 3 2 0 3 1 3 4 Female 4 2 2 2 0 3 4 4 5 1Non-Resident Aliens Male 18 24 22 19 16 15 22 19 N/A N/A Female 16 20 18 24 31 21 33 19 N/A N/ATwo or More Male 32 21 17 14 N/A N/A N/A N/A N/A N/A Female 27 28 14 8 N/A N/A N/A N/A N/A N/AUnknown Male 16 17 38 57 143 158 119 93 77 49 Female 27 28 50 75 156 121 112 97 86 75TOTALS 1,732 1,766 1,746 1,786 1,858 1,939 1,937 1,915 2,007 2,042
2009 Racial/Ethnic categories changed per the Dept. of Education
2011, 2010, 2009, 2008, 2007, 2006 & 2005 October Census dates2004 & 2003 September Census
2012 Fall returned to 15th day Census date
2012 FACT BOOK
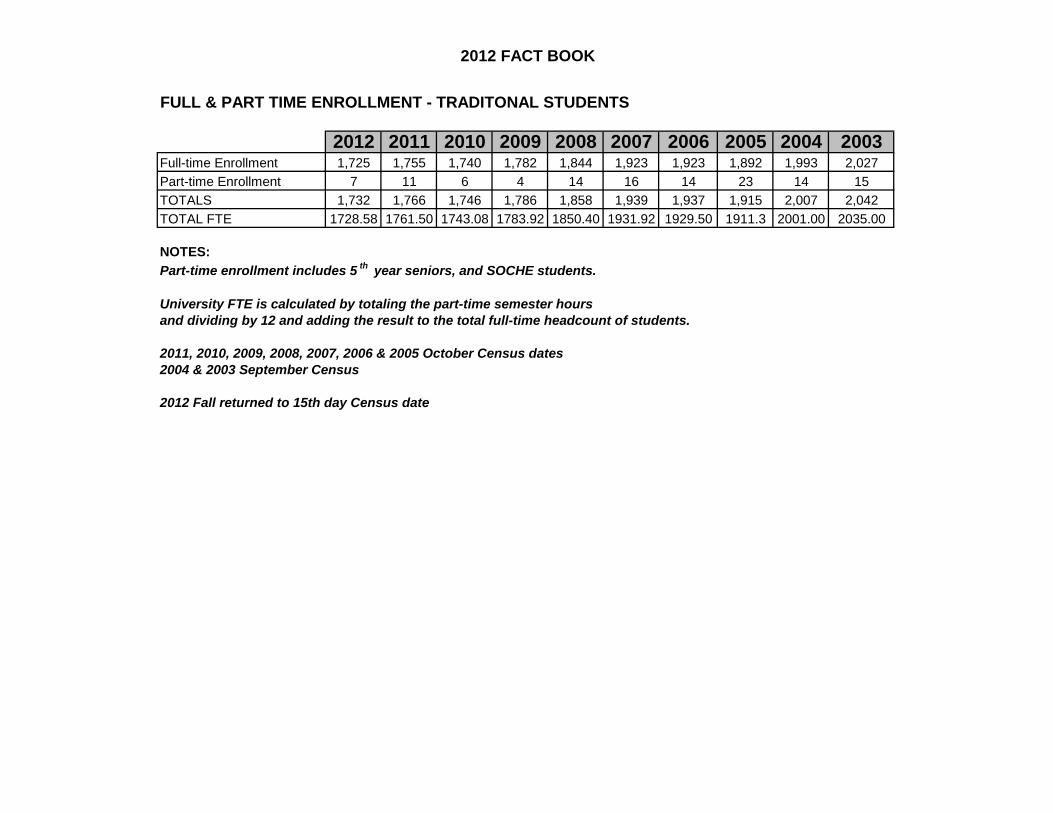
FULL & PART TIME ENROLLMENT - TRADITONAL STUDENTS
2012 2011 2010 2009 2008 2007 2006 2005 2004 2003Full-time Enrollment 1,725 1,755 1,740 1,782 1,844 1,923 1,923 1,892 1,993 2,027Part-time Enrollment 7 11 6 4 14 16 14 23 14 15TOTALS 1,732 1,766 1,746 1,786 1,858 1,939 1,937 1,915 2,007 2,042TOTAL FTE 1728.58 1761.50 1743.08 1783.92 1850.40 1931.92 1929.50 1911.3 2001.00 2035.00
NOTES:Part-time enrollment includes 5 th year seniors, and SOCHE students.
University FTE is calculated by totaling the part-time semester hours and dividing by 12 and adding the result to the total full-time headcount of students.
2011, 2010, 2009, 2008, 2007, 2006 & 2005 October Census dates2004 & 2003 September Census
2012 Fall returned to 15th day Census date
2012 FACT BOOK
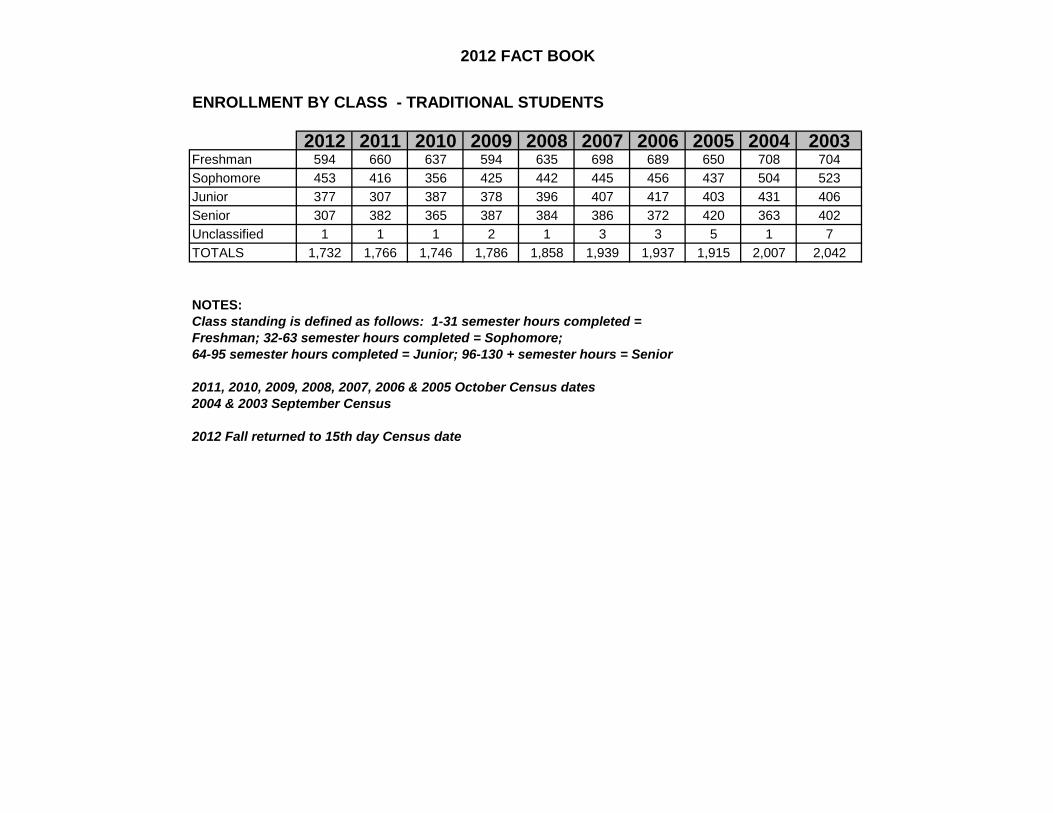
ENROLLMENT BY CLASS - TRADITIONAL STUDENTS
2012 2011 2010 2009 2008 2007 2006 2005 2004 2003Freshman 594 660 637 594 635 698 689 650 708 704Sophomore 453 416 356 425 442 445 456 437 504 523Junior 377 307 387 378 396 407 417 403 431 406Senior 307 382 365 387 384 386 372 420 363 402Unclassified 1 1 1 2 1 3 3 5 1 7TOTALS 1,732 1,766 1,746 1,786 1,858 1,939 1,937 1,915 2,007 2,042
NOTES:Class standing is defined as follows: 1-31 semester hours completed = Freshman; 32-63 semester hours completed = Sophomore; 64-95 semester hours completed = Junior; 96-130 + semester hours = Senior
2011, 2010, 2009, 2008, 2007, 2006 & 2005 October Census dates2004 & 2003 September Census
2012 Fall returned to 15th day Census date

2012 FACT BOOK
ENROLLMENT BY ADMIT STATUS - TRADITONAL STUDENTS
2012 2011 2010 2009 2008 2007 2006 2005 2004 2003Degree SeekingDegree Foreign 30 34 30 32 38 31 40 36 48 47Degree Original 1,571 1,601 1,594 1,618 1,675 1,757 1,739 1,739 1,826 1,852Degree Readmit 34 29 24 30 36 41 47 46 40 38Degree Transfer 95 94 87 96 98 102 91 85 87 95Non-Degree SeekingForeign 1 8 10 8 10 5 17 4 5 5Unclassified 1 0 1 2 1 3 3 5 1 5
TOTALS 1,732 1,766 1,746 1,786 1,858 1,939 1,937 1,915 2,007 2,042
NOTES:2011, 2010, 2009, 2008, 2007, 2006 & 2005 October Census dates2004 & 2003 September Census
2012 Fall returned to 15th day Census date

2012 FACT BOOK
ENROLLMENT BY DECLARED MAJOR
MAJOR 2012 2011 2010 2009 2008 2007 2006 2005 2004 2003Accounting 5 0 0 0 0 0 0 0 0 0American Studies 0 0 0 0 0 1 1 2 1 2Art 32 28 34 35 35 31 26 25 33 34Biology 136 127 130 123 131 122 125 132 111 91Biochem/Molecular Biology 16 14 18 18 16 20 16 14 16 21Business (formerly Management ) 108 85 131 0 0 0 0 0 0 0Chemistry 17 21 14 22 24 29 21 27 23 26Communication 65 79 70 75 63 69 73 74 75 76Computer Science 22 13 10 5 6 8 5 11 11 11Dance 3 2 0 0 0 0 0 0 0 0East Asian Studies 14 16 16 31 37 42 47 45 30 25Economics 12 19 29 30 26 25 22 19 15 29Education 108 121 124 96 113 123 134 156 155 154English 74 71 81 83 110 98 96 100 89 112Earth Science 1 1 0 0 0 2 1 0 0 0Financial Economics 19 21 12 2 0 0 0 0 0 0French 12 9 9 14 6 8 8 13 8 8Geography 18 11 6 12 14 19 22 15 3 5Geology 11 7 10 11 11 6 7 6 6 4German 5 9 3 2 4 11 12 10 7 9History 56 57 52 53 43 49 52 59 57 47Interdepartmental 15 18 22 2 8 10 10 10 1 1International Studies 24 27 24 13 0 0 0 0 0 0Math 36 28 23 21 34 29 27 32 31 38Management 0 0 0 148 141 160 148 137 146 170Music 21 22 20 21 29 24 33 35 32 25Philosophy 15 12 12 11 5 8 9 11 14 17Physics 18 16 22 20 21 17 12 14 11 11Political Science 51 70 73 78 80 71 83 93 79 80Psychology 106 90 83 89 97 91 88 94 90 106Russian 0 0 0 0 0 0 0 1 0 0Russian Area Studies 0 0 0 3 3 7 8 11 6 8Russian & Central Eurasian Studies 6 7 10 8 10 0 0 0 0 0
Religion 13 11 9 7 6 9 11 13 12 16Sociology 37 38 35 20 29 41 40 36 37 38Spanish 30 30 28 22 16 16 28 22 22 17Theatre & Dance 19 16 15 11 13 18 20 19 15 19Transient 0 0 0 1 0 0 0 0 0 0Undeclared 748 800 736 787 826 858 851 794 964 941
TOTALS 1,873 1,896 1,861 1,874 1,957 2,022 2,036 2,030 2,100 2,141
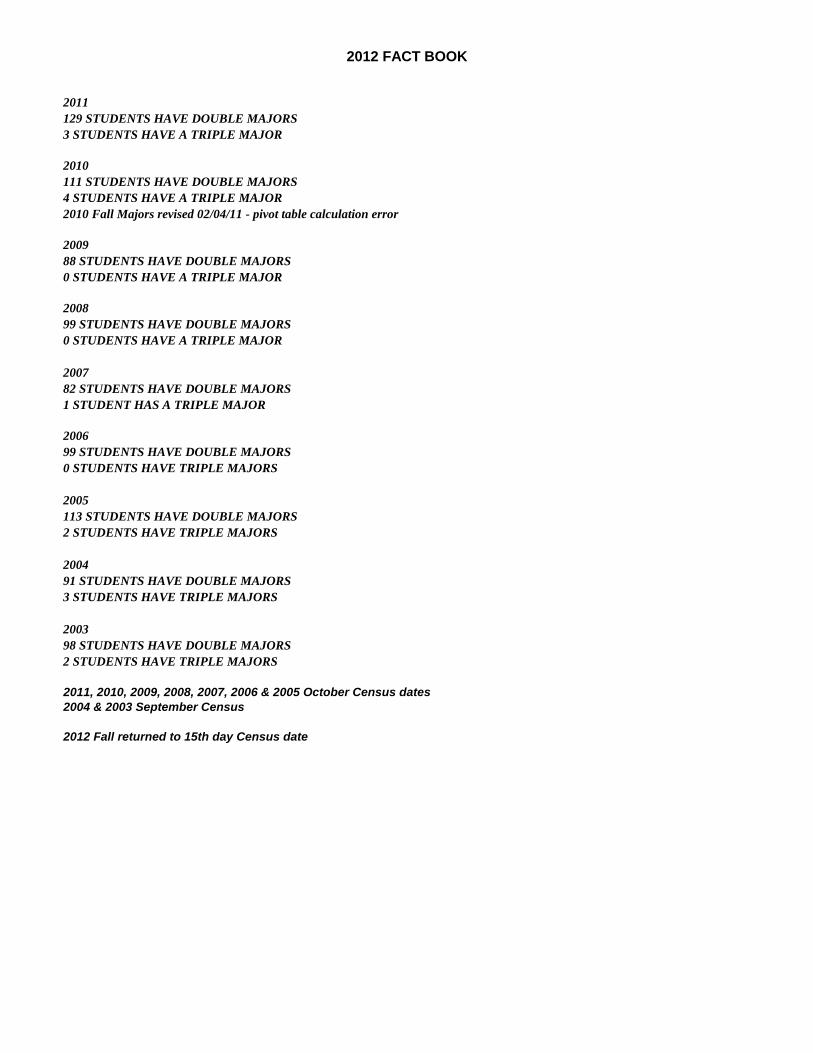
NOTES:2012139 STUDENTS HAVE DOUBLE MAJORS2 STUDENTS HAVE A TRIPLE MAJOR
2012 FACT BOOK
2011129 STUDENTS HAVE DOUBLE MAJORS3 STUDENTS HAVE A TRIPLE MAJOR
2010111 STUDENTS HAVE DOUBLE MAJORS4 STUDENTS HAVE A TRIPLE MAJOR2010 Fall Majors revised 02/04/11 - pivot table calculation error
200988 STUDENTS HAVE DOUBLE MAJORS0 STUDENTS HAVE A TRIPLE MAJOR
200899 STUDENTS HAVE DOUBLE MAJORS0 STUDENTS HAVE A TRIPLE MAJOR
200782 STUDENTS HAVE DOUBLE MAJORS1 STUDENT HAS A TRIPLE MAJOR
200699 STUDENTS HAVE DOUBLE MAJORS0 STUDENTS HAVE TRIPLE MAJORS
2005113 STUDENTS HAVE DOUBLE MAJORS2 STUDENTS HAVE TRIPLE MAJORS
200491 STUDENTS HAVE DOUBLE MAJORS3 STUDENTS HAVE TRIPLE MAJORS
200398 STUDENTS HAVE DOUBLE MAJORS2 STUDENTS HAVE TRIPLE MAJORS
2011, 2010, 2009, 2008, 2007, 2006 & 2005 October Census dates2004 & 2003 September Census
2012 Fall returned to 15th day Census date

2012 FACT BOOK
UNDECLARED MAJORS BY CLASSIFICATION - TRADITIONAL STUDENTS
CLASSIFICATION 2012 2011 2010 2009 2008 2007 2006 2005 2004 2003Freshman 559 620 592 563 599 653 641 596 687 667Sophomore 181 173 140 215 223 196 195 187 262 255Junior 7 6 3 7 3 6 12 5 13 12Senior 0 0 0 1 0 0 0 0 1 0Unclassified 1 1 1 2 1 3 2 5 1 5TOTALS 748 800 736 788 826 858 850 793 964 939
NOTES:2011, 2010, 2009, 2008, 2007, 2006 & 2005 October Census dates2004 & 2003 September Census
2012 Fall returned to 15th day Census date

2012 FACT BOOK
ENROLLMENT BY RELIGIOUS DENOMINATION - TRADITIONAL STUDENTS
DENOMINATION 2012 2011 2010 2009 2008 2007 2006 2005 2004 2003Agnostic 30 33 24 23 26 25 23 16 10 7Apostolic Faith 1 0 0 0 0 0 0 0 0 0Assembly of God 1 3 4 4 2 1 1 2 2 1Atheist 5 0 0 0 0 0 0 0 0 0Baptist 82 80 71 67 61 70 76 75 77 85Brethren 5 5 2 2 2 4 7 11 11 10Buddhist 2 0 0 0 0 0 0 0 0 0Byzantine Catholic 1 2 1 1 0 0 0 2 1 0Christian 85 0 0 0 0 0 0 0 0 0Christian Disciples 17 26 20 15 11 16 13 9 10 8Christian Scientist 1 0 0 0 0 0 0 0 0 0Church of Christ 3 0 0 0 0 0 0 0 0 0Church of England 0 0 0 0 0 0 0 0 1 1Church of God 13 13 9 12 11 25 21 14 13 8Church of Nazarene 1 0 0 0 0 0 0 0 0 0Episcopal 29 33 36 31 32 37 30 24 28 41Greek Orthodox 6 8 7 9 7 7 6 5 3 3Hindu 1 2 3 3 2 2 2 0 0 0Jewish 18 21 19 17 21 19 17 17 17 12Lutheran-ELCA 214 205 193 221 240 257 299 305 312 331Mennonite 2 1 1 3 4 6 6 7 4 3Methodist 119 119 130 135 138 144 120 123 130 153Missouri Synod Lutheran 20 32 34 38 37 32 23 19 16 20Latter Day-Saints (Mormon) 2 1 1 1 1 2 0 0 1 1Muslim (Islam) 4 6 5 3 3 0 0 1 1 0Non Denominational 11 0 0 0 0 0 0 0 0 0None Given 524 553 599 626 654 692 706 705 776 653Other Lutheran 28 35 50 40 32 28 22 17 9 6Other Denomination 52 67 50 59 69 55 52 47 59 56
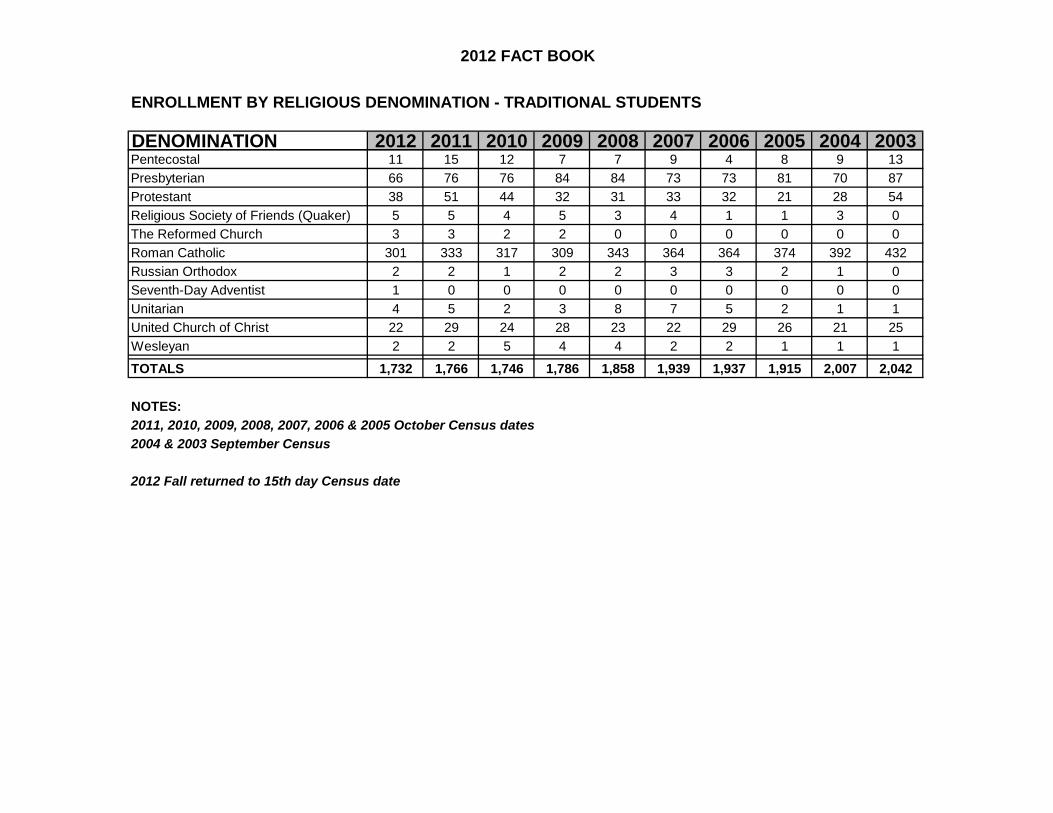
2012 FACT BOOK
ENROLLMENT BY RELIGIOUS DENOMINATION - TRADITIONAL STUDENTS
DENOMINATION 2012 2011 2010 2009 2008 2007 2006 2005 2004 2003Pentecostal 11 15 12 7 7 9 4 8 9 13Presbyterian 66 76 76 84 84 73 73 81 70 87Protestant 38 51 44 32 31 33 32 21 28 54Religious Society of Friends (Quaker) 5 5 4 5 3 4 1 1 3 0The Reformed Church 3 3 2 2 0 0 0 0 0 0Roman Catholic 301 333 317 309 343 364 364 374 392 432Russian Orthodox 2 2 1 2 2 3 3 2 1 0Seventh-Day Adventist 1 0 0 0 0 0 0 0 0 0Unitarian 4 5 2 3 8 7 5 2 1 1United Church of Christ 22 29 24 28 23 22 29 26 21 25Wesleyan 2 2 5 4 4 2 2 1 1 1
TOTALS 1,732 1,766 1,746 1,786 1,858 1,939 1,937 1,915 2,007 2,042
NOTES:2011, 2010, 2009, 2008, 2007, 2006 & 2005 October Census dates2004 & 2003 September Census
2012 Fall returned to 15th day Census date
2012 FACT BOOK
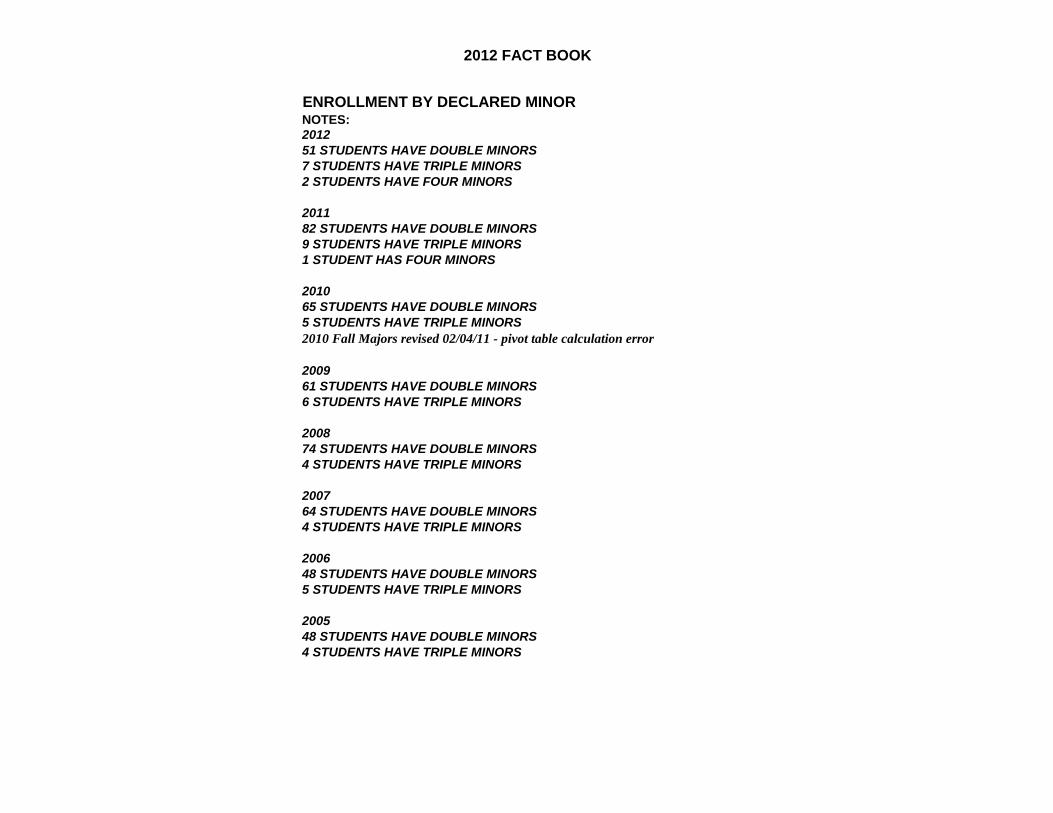
ENROLLMENT BY DECLARED MINOR NOTES:201251 STUDENTS HAVE DOUBLE MINORS7 STUDENTS HAVE TRIPLE MINORS2 STUDENTS HAVE FOUR MINORS
201182 STUDENTS HAVE DOUBLE MINORS9 STUDENTS HAVE TRIPLE MINORS1 STUDENT HAS FOUR MINORS
201065 STUDENTS HAVE DOUBLE MINORS5 STUDENTS HAVE TRIPLE MINORS2010 Fall Majors revised 02/04/11 - pivot table calculation error
200961 STUDENTS HAVE DOUBLE MINORS6 STUDENTS HAVE TRIPLE MINORS
200874 STUDENTS HAVE DOUBLE MINORS4 STUDENTS HAVE TRIPLE MINORS
200764 STUDENTS HAVE DOUBLE MINORS4 STUDENTS HAVE TRIPLE MINORS
200648 STUDENTS HAVE DOUBLE MINORS5 STUDENTS HAVE TRIPLE MINORS
200548 STUDENTS HAVE DOUBLE MINORS4 STUDENTS HAVE TRIPLE MINORS
2012 FACT BOOK
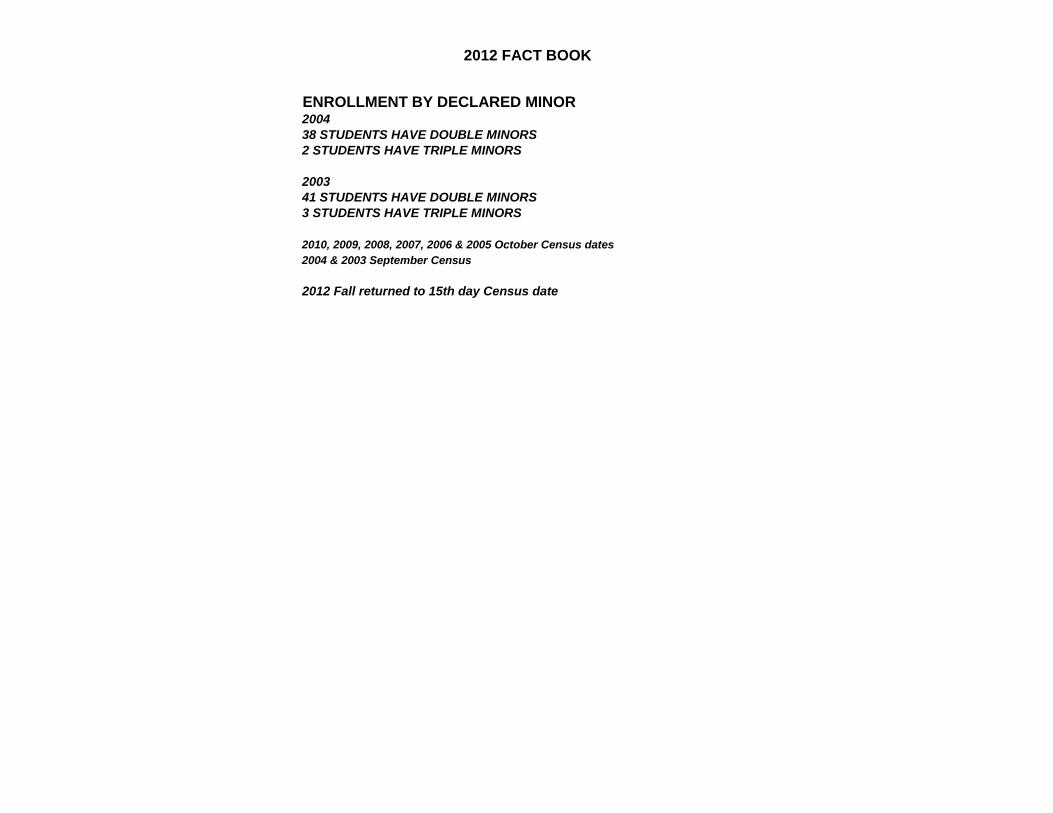
ENROLLMENT BY DECLARED MINOR 200438 STUDENTS HAVE DOUBLE MINORS2 STUDENTS HAVE TRIPLE MINORS
200341 STUDENTS HAVE DOUBLE MINORS3 STUDENTS HAVE TRIPLE MINORS
2010, 2009, 2008, 2007, 2006 & 2005 October Census dates2004 & 2003 September Census
2012 Fall returned to 15th day Census date
2012 FACT BOOK
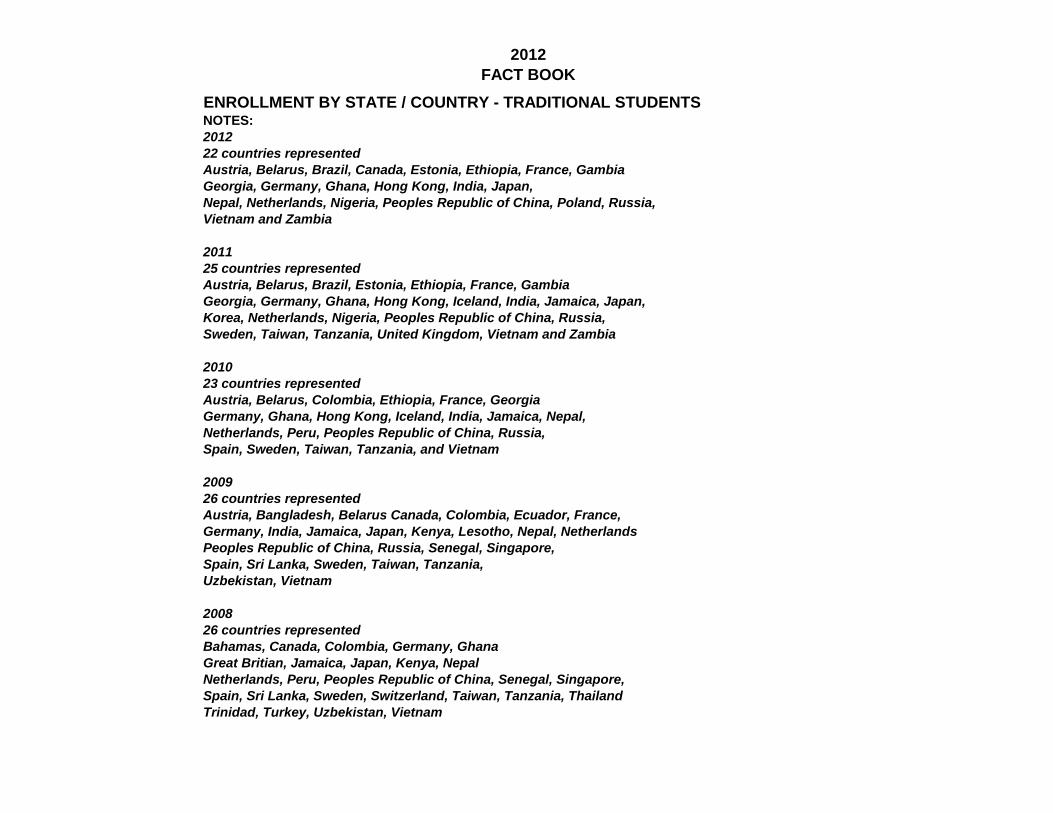
ENROLLMENT BY STATE / COUNTRY - TRADITIONAL STUDENTSNOTES:201222 countries representedAustria, Belarus, Brazil, Canada, Estonia, Ethiopia, France, GambiaGeorgia, Germany, Ghana, Hong Kong, India, Japan,Nepal, Netherlands, Nigeria, Peoples Republic of China, Poland, Russia, Vietnam and Zambia
201125 countries representedAustria, Belarus, Brazil, Estonia, Ethiopia, France, GambiaGeorgia, Germany, Ghana, Hong Kong, Iceland, India, Jamaica, Japan,Korea, Netherlands, Nigeria, Peoples Republic of China, Russia, Sweden, Taiwan, Tanzania, United Kingdom, Vietnam and Zambia
201023 countries representedAustria, Belarus, Colombia, Ethiopia, France, GeorgiaGermany, Ghana, Hong Kong, Iceland, India, Jamaica, Nepal,Netherlands, Peru, Peoples Republic of China, Russia, Spain, Sweden, Taiwan, Tanzania, and Vietnam
200926 countries representedAustria, Bangladesh, Belarus Canada, Colombia, Ecuador, France, Germany, India, Jamaica, Japan, Kenya, Lesotho, Nepal, NetherlandsPeoples Republic of China, Russia, Senegal, Singapore, Spain, Sri Lanka, Sweden, Taiwan, Tanzania, Uzbekistan, Vietnam
200826 countries representedBahamas, Canada, Colombia, Germany, GhanaGreat Britian, Jamaica, Japan, Kenya, NepalNetherlands, Peru, Peoples Republic of China, Senegal, Singapore, Spain, Sri Lanka, Sweden, Switzerland, Taiwan, Tanzania, ThailandTrinidad, Turkey, Uzbekistan, Vietnam

2012 FACT BOOK
ENROLLMENT BY STATE / COUNTRY - TRADITIONAL STUDENTS

2012 FACT BOOK
ENROLLMENT BY STATE / COUNTRY - TRADITIONAL STUDENTS200716 COUNTRIES REPRESENTEDCanada, Colombia, France,India, Jamaica, Japan, Kazakhston, Myanmar, Netherlands, Peoples Republic of China, Singapore, Sweden, Trinidad, Turkey, Vietnam, and West Indies
200623 COUNTRIES REPRESENTEDArgentina, Bahamas, Canada, Croatia, Ecuador, France, Ghana, Holland, India, JamaciaJapan, Kenya, Korea, Myamar, Netherlands, Peoples Republic of China, Russia, Sweden,Tanzania, Trinidad, Turkey, Uzbekistan, and Vietnam
200516 COUNTRIES REPRESENTEDBahamas, Croatia, Ecuador, Ghana, India, Jamaica, Japan, Kenya, Myanmar, Sri LankaSweden, Syria, Thailand, Trinidad, Turkey, Vietnam
200414 COUNTRIES REPRESENTEDArgentina, Cameroon, Columbia, Croatia, Ecuador, Ghana, India, Japan, Jamaica, Kenya Peru, Sri Lanka, Sweden, and Thailand
200320 COUNTRIES REPRESENTEDArgentina, Bulgaria, Colombia, Costa Rica, Croatia, Ecuador, Fiji, Germany, Ghana, India, Jamaica, Japan, Korea, Italy, Kenya The Netherlands, Peru, Sri Lanka, Sweden, Thailand, and West Africa
2011, 2010, 2009, 2008, 2007, 2006 & 2005 October Census dates2004 & 2003 September Census
2012 Fall returned to 15th day Census date
2012WITTENBERG UNIVERSITY
FACT BOOK
COHORT

2012 FACT BOOK
ENROLLMENT BY ETHNIC & GENDER - COHORT
2012 2011 2010 2009 2008 2007 2006 2005 2004 2003African American Male 26 17 31 20 11 17 20 9 16 14 Female 21 17 20 16 8 6 7 13 15 22
Asian Male 1 2 6 1 5 1 4 0 8 3 Female 1 2 2 1 4 1 4 3 2 6
Hawian/Pacific Islander Male 0 0 1 0 0 0 0 0 0 0 Female 0 0 0 0 0 0 0 0 0 0
Caucasian Male 173 197 182 167 128 198 185 164 203 203 Female 215 237 195 228 236 218 251 231 246 241
Hispanic Male 7 8 8 5 4 4 3 2 7 5 Female 7 12 3 6 2 4 3 0 4 0
American/Alaskan Native Male 0 0 0 1 1 0 0 1 0 1 Female 2 1 1 1 0 0 1 0 4 0
Non-Resident Aliens Male 2 6 6 4 8 1 4 1 N/A N/A Female 2 6 3 1 6 3 9 3Two or More Male 15 9 8 9 0 0 0 0 0 0 Female 8 14 7 2 0 0 0 0 0 0Unknown Male 4 3 13 10 38 61 46 37 40 20 Female 5 4 14 16 59 37 37 32 33 34
TOTALS 489 535 500 488 510 551 574 496 578 549
NOTES:2011, 2010, 2009, 2008, 2007, 2006 & 2005 October Census dates2004 & 2003 September Census
2012 Fall returned to 15th day Census date
2012 FACT BOOK
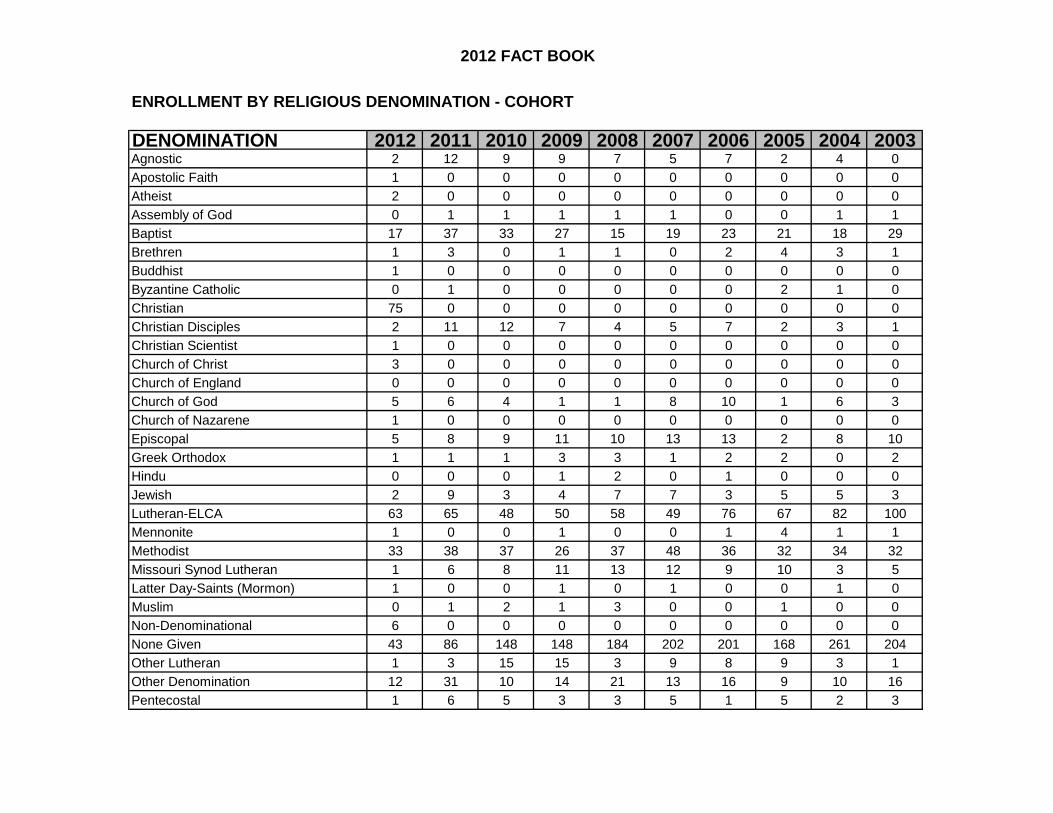
ENROLLMENT BY RELIGIOUS DENOMINATION - COHORT
DENOMINATION 2012 2011 2010 2009 2008 2007 2006 2005 2004 2003Agnostic 2 12 9 9 7 5 7 2 4 0Apostolic Faith 1 0 0 0 0 0 0 0 0 0Atheist 2 0 0 0 0 0 0 0 0 0Assembly of God 0 1 1 1 1 1 0 0 1 1Baptist 17 37 33 27 15 19 23 21 18 29Brethren 1 3 0 1 1 0 2 4 3 1Buddhist 1 0 0 0 0 0 0 0 0 0Byzantine Catholic 0 1 0 0 0 0 0 2 1 0Christian 75 0 0 0 0 0 0 0 0 0Christian Disciples 2 11 12 7 4 5 7 2 3 1Christian Scientist 1 0 0 0 0 0 0 0 0 0Church of Christ 3 0 0 0 0 0 0 0 0 0Church of England 0 0 0 0 0 0 0 0 0 0Church of God 5 6 4 1 1 8 10 1 6 3Church of Nazarene 1 0 0 0 0 0 0 0 0 0Episcopal 5 8 9 11 10 13 13 2 8 10Greek Orthodox 1 1 1 3 3 1 2 2 0 2Hindu 0 0 0 1 2 0 1 0 0 0Jewish 2 9 3 4 7 7 3 5 5 3Lutheran-ELCA 63 65 48 50 58 49 76 67 82 100Mennonite 1 0 0 1 0 0 1 4 1 1Methodist 33 38 37 26 37 48 36 32 34 32Missouri Synod Lutheran 1 6 8 11 13 12 9 10 3 5Latter Day-Saints (Mormon) 1 0 0 1 0 1 0 0 1 0Muslim 0 1 2 1 3 0 0 1 0 0Non-Denominational 6 0 0 0 0 0 0 0 0 0None Given 43 86 148 148 184 202 201 168 261 204Other Lutheran 1 3 15 15 3 9 8 9 3 1Other Denomination 12 31 10 14 21 13 16 9 10 16Pentecostal 1 6 5 3 3 5 1 5 2 3
2012 FACT BOOK
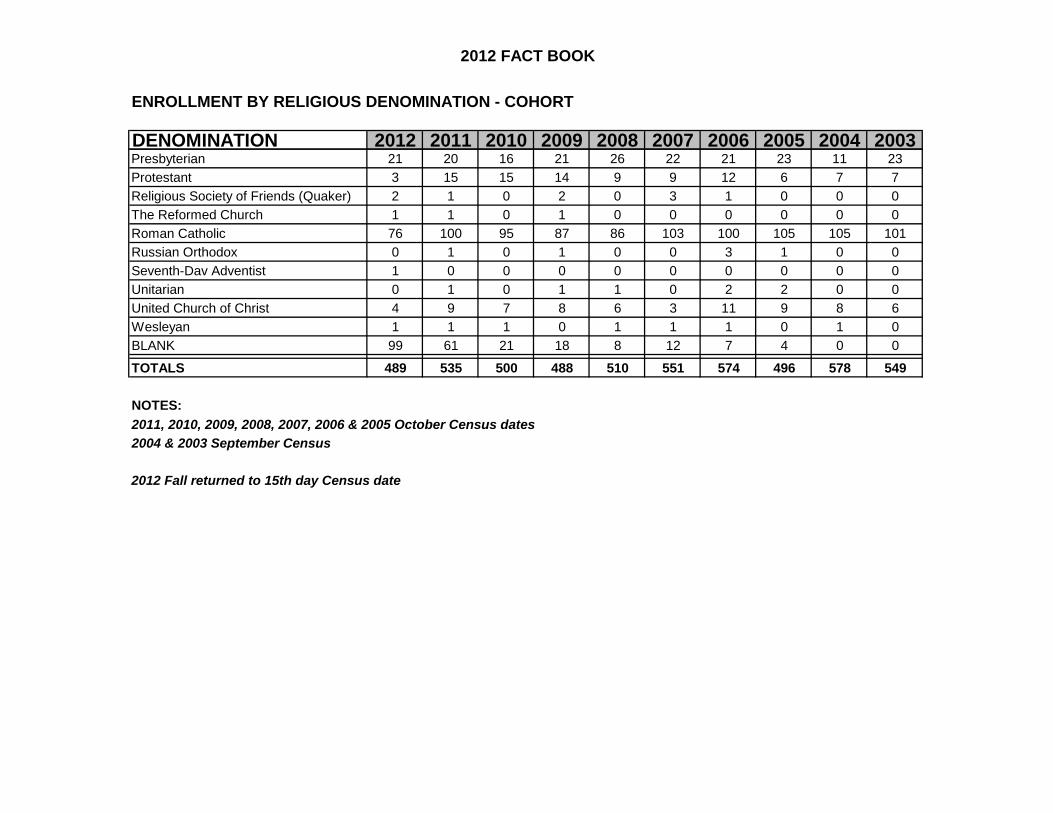
ENROLLMENT BY RELIGIOUS DENOMINATION - COHORT
DENOMINATION 2012 2011 2010 2009 2008 2007 2006 2005 2004 2003Presbyterian 21 20 16 21 26 22 21 23 11 23Protestant 3 15 15 14 9 9 12 6 7 7Religious Society of Friends (Quaker) 2 1 0 2 0 3 1 0 0 0The Reformed Church 1 1 0 1 0 0 0 0 0 0Roman Catholic 76 100 95 87 86 103 100 105 105 101Russian Orthodox 0 1 0 1 0 0 3 1 0 0Seventh-Dav Adventist 1 0 0 0 0 0 0 0 0 0Unitarian 0 1 0 1 1 0 2 2 0 0United Church of Christ 4 9 7 8 6 3 11 9 8 6Wesleyan 1 1 1 0 1 1 1 0 1 0BLANK 99 61 21 18 8 12 7 4 0 0
TOTALS 489 535 500 488 510 551 574 496 578 549
NOTES:2011, 2010, 2009, 2008, 2007, 2006 & 2005 October Census dates2004 & 2003 September Census
2012 Fall returned to 15th day Census date

2012 FACT BOOK
ENROLLMENT BY STATE / COUNTRY - COHORTNOTES:2012 Notes3 countries representedCanada, PR China, Vietnam
2011 Notes5 countries representedBrazil, Ethiopia, Gambia, Goergia, Nigeria
2010 Notes8 countries representedEthiopia, France, Georgia, Ghana, Hong Kong, India, PR China, Vietnam
2009 Notes6 countries representedAustria, Belarus, Japan, Russia, India & Germany
2008 Notes10 countries representedBahamas, Great Britian, Jamaica, Nepal, Peru, PR China, Senegal, Taiwan, Tanzania, Vietnam
20074 COUNTRIES REPRESENTEDColombia, France, Peoples Republic of China, & Vietnam
20066 COUNTRIES REPRESENTEDCanada, Jamacia, Peoples Republic of China, Sweden,Tanzania, Uzbekistan, and Vietnam
20054 COUNTRIES REPRESENTEDMyanmar, Trinidad, Turkey, Vietnam
20047 COUNTRIES REPRESENTEDEcuador, India, Japan, Kenya, Korea, Switzerland, and Syria

2012 FACT BOOK
ENROLLMENT BY STATE / COUNTRY - COHORT20038 COUNTRIES REPRESENTEDArgentina, Croatia, Ecuador, India, Japan, Kenya, the Netherlands, and Sweden
2011, 2010, 2009, 2008, 2007, 2006 & 2005 October Census dates2004 & 2003 September Census
2012 Fall returned to 15th day Census date
2012 FACT BOOK
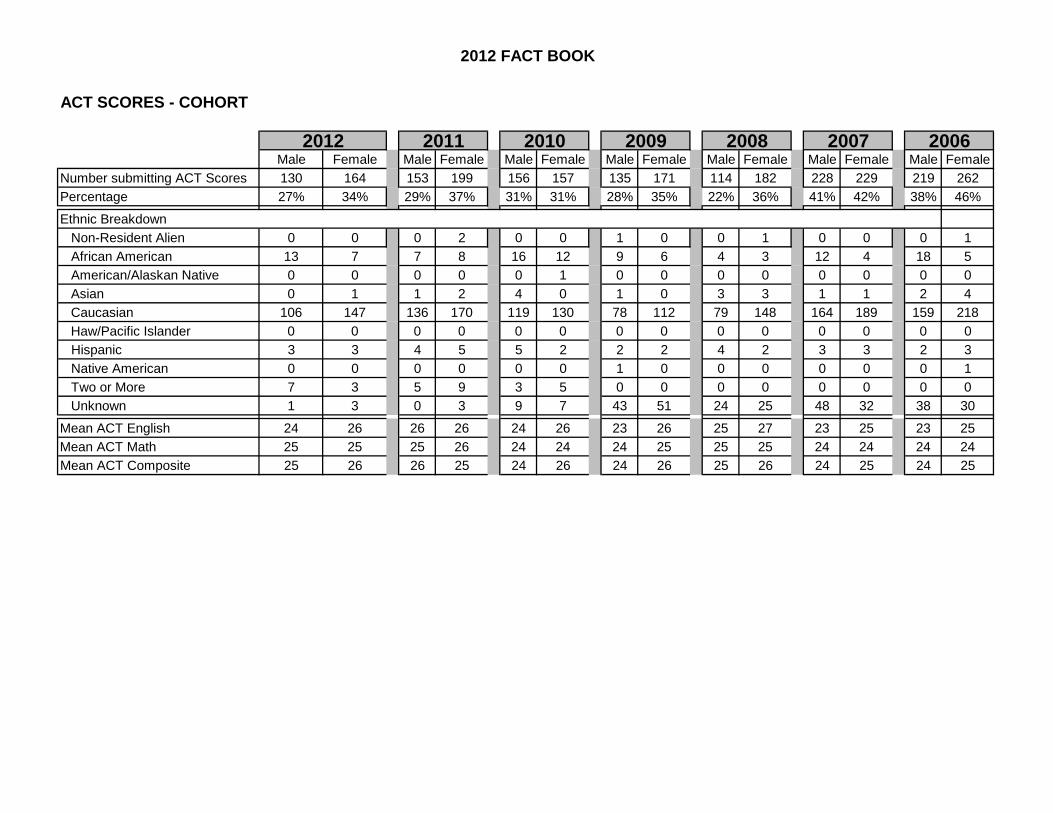
ACT SCORES - COHORT
2012 2011 2010 2009 2008 2007 2006Male Female Male Female Male Female Male Female Male Female Male Female Male Female
Number submitting ACT Scores 130 164 153 199 156 157 135 171 114 182 228 229 219 262Percentage 27% 34% 29% 37% 31% 31% 28% 35% 22% 36% 41% 42% 38% 46%
Ethnic Breakdown Non-Resident Alien 0 0 0 2 0 0 1 0 0 1 0 0 0 1
African American 13 7 7 8 16 12 9 6 4 3 12 4 18 5American/Alaskan Native 0 0 0 0 0 1 0 0 0 0 0 0 0 0Asian 0 1 1 2 4 0 1 0 3 3 1 1 2 4Caucasian 106 147 136 170 119 130 78 112 79 148 164 189 159 218Haw/Pacific Islander 0 0 0 0 0 0 0 0 0 0 0 0 0 0Hispanic 3 3 4 5 5 2 2 2 4 2 3 3 2 3Native American 0 0 0 0 0 0 1 0 0 0 0 0 0 1Two or More 7 3 5 9 3 5 0 0 0 0 0 0 0 0Unknown 1 3 0 3 9 7 43 51 24 25 48 32 38 30
Mean ACT English 24 26 26 26 24 26 23 26 25 27 23 25 23 25Mean ACT Math 25 25 25 26 24 24 24 25 25 25 24 24 24 24Mean ACT Composite 25 26 26 25 24 26 24 26 25 26 24 25 24 25

2012 FACT BOOK
ACT SCORES - COHORT
Number submitting ACT ScoresPercentage
Ethnic Breakdown Non-Resident Alien
African AmericanAmerican/Alaskan NativeAsianCaucasianHaw/Pacific IslanderHispanicNative AmericanTwo or MoreUnknown
Mean ACT English Mean ACT Math Mean ACT Composite
2005 2004 2003Male Female Male Female Male Female167 230 212 249 0 034% 46% 37% 43% 0% 0%
0 0 0 0 0 08 9 12 10 0 00 0 0 0 0 00 3 2 1 0 0
130 197 165 209 0 00 0 0 0 0 02 0 4 4 0 01 0 0 4 0 00 0 0 0 0 0
26 21 29 21 0 0
23 25 23 25 0 024 23 24 23 0 024 24 24 25 0 0

2012 FACT BOOK
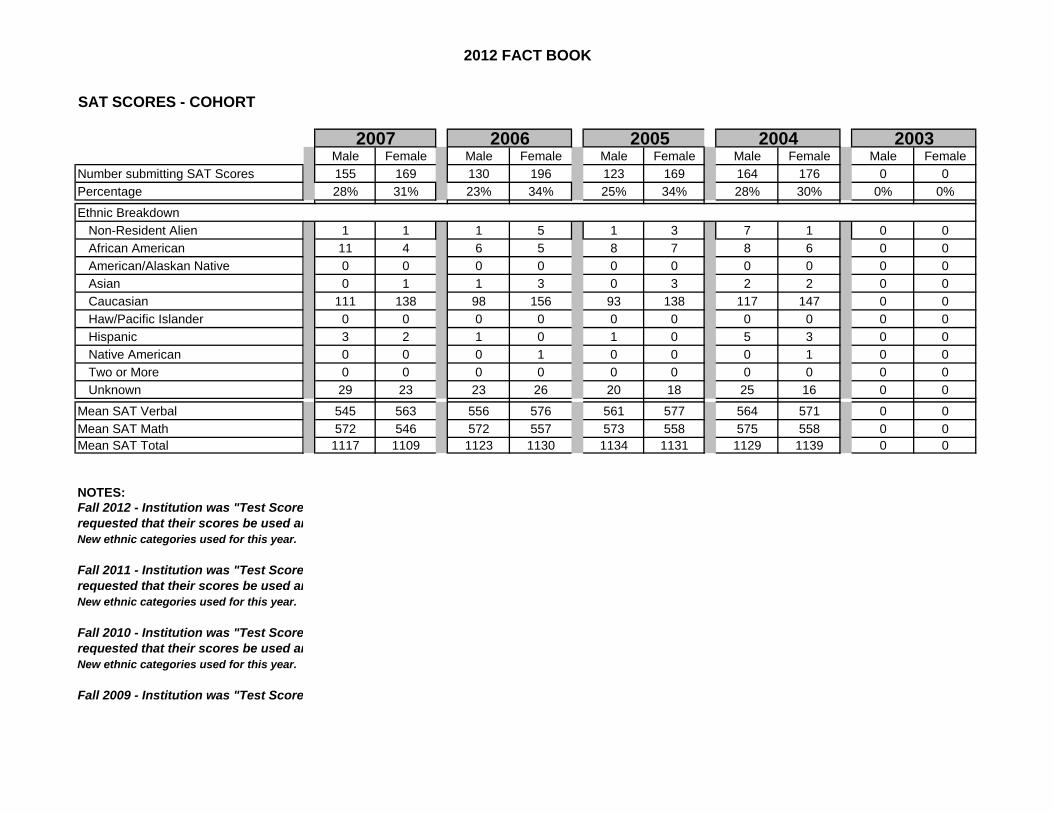
SAT SCORES - COHORT
2012 2011 2010 2009 2008Male Female Male Female Male Female Male Female Male Female
Number submitting SAT Scores 65 67 85 87 91 79 81 103 83 123Percentage 13% 14% 16% 16% 18% 16% 17% 21% 16% 24%
Ethnic BreakdownNon-Resident Alien 0 0 4 4 2 3 3 0 5 5African American 4 2 6 3 11 7 7 4 4 3American/Alaskan Native 0 0 0 0 0 0 0 0 0 0Asian 1 0 1 1 0 0 1 1 3 1Caucasian 53 59 68 70 68 64 56 76 63 91Haw/Pacific Islander 0 0 0 0 1 0 0 0 0 0Hispanic 2 3 5 3 2 1 1 1 1 1Native American 0 0 0 0 0 0 2 0 0 0Two or More 5 3 1 5 5 2 0 0 0 0Unknown 0 0 0 1 2 2 11 21 7 22
Mean SAT Verbal 558 566 572 561 548 584 543 569 574 588Mean SAT Math 575 557 558 569 552 567 558 567 586 586Mean SAT Total 1133 1123 1130 1130 1100 1151 1101 1136 1160 1174
NOTES:Fall 2012 - Institution was "Test Score Optional". Only those students whorequested that their scores be used are included.New ethnic categories used for this year.
Fall 2011 - Institution was "Test Score Optional". Only those students whorequested that their scores be used are included.New ethnic categories used for this year.
Fall 2010 - Institution was "Test Score Optional". Only those students whorequested that their scores be used are included.New ethnic categories used for this year.
Fall 2009 - Institution was "Test Score Optional". Only those students who

2012 FACT BOOK
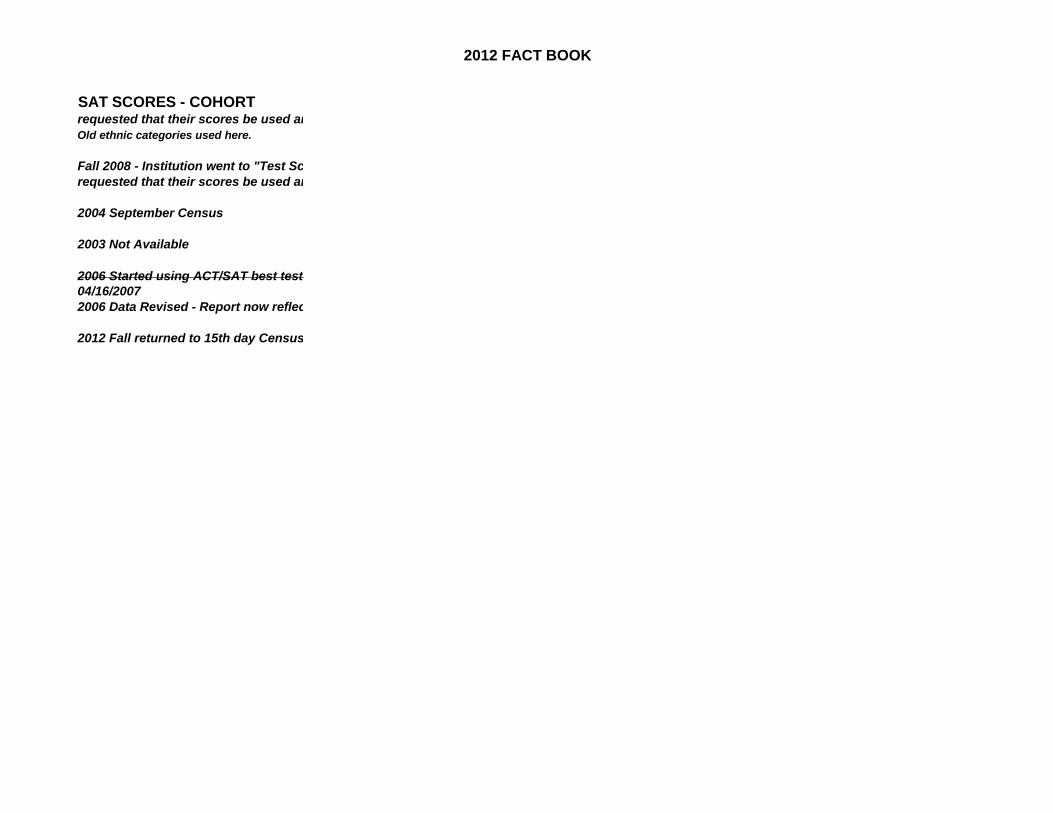
SAT SCORES - COHORTrequested that their scores be used are included.Old ethnic categories used here.
Fall 2008 - Institution went to "Test Score Optional". Only those students whorequested that their scores be used are included.
2004 September Census
2003 Not Available
2006 Started using ACT/SAT best test scores04/16/20072006 Data Revised - Report now reflects raw data NOT Best Test
2012 Fall returned to 15th day Census date
2012 FACT BOOK
SAT SCORES - COHORT
Number submitting SAT ScoresPercentage
Ethnic BreakdownNon-Resident AlienAfrican AmericanAmerican/Alaskan NativeAsianCaucasianHaw/Pacific IslanderHispanicNative AmericanTwo or MoreUnknown
Mean SAT VerbalMean SAT Math Mean SAT Total
NOTES:Fall 2012 - Institution was "Test Score requested that their scores be used ar New ethnic categories used for this year.
Fall 2011 - Institution was "Test Score requested that their scores be used ar New ethnic categories used for this year.
Fall 2010 - Institution was "Test Score requested that their scores be used ar New ethnic categories used for this year.
Fall 2009 - Institution was "Test Score
2007 2006 2005 2004 2003Male Female Male Female Male Female Male Female Male Female155 169 130 196 123 169 164 176 0 028% 31% 23% 34% 25% 34% 28% 30% 0% 0%
1 1 1 5 1 3 7 1 0 011 4 6 5 8 7 8 6 0 00 0 0 0 0 0 0 0 0 00 1 1 3 0 3 2 2 0 0
111 138 98 156 93 138 117 147 0 00 0 0 0 0 0 0 0 0 03 2 1 0 1 0 5 3 0 00 0 0 1 0 0 0 1 0 00 0 0 0 0 0 0 0 0 0
29 23 23 26 20 18 25 16 0 0
545 563 556 576 561 577 564 571 0 0572 546 572 557 573 558 575 558 0 01117 1109 1123 1130 1134 1131 1129 1139 0 0
2012 FACT BOOK
SAT SCORES - COHORTrequested that their scores be used ar Old ethnic categories used here.
Fall 2008 - Institution went to "Test Sc requested that their scores be used ar
2004 September Census
2003 Not Available
2006 Started using ACT/SAT best test 04/16/20072006 Data Revised - Report now reflec
2012 Fall returned to 15th day Census

2012WITTENBERG UNIVERSITY
FACT BOOK
GRADUATES
2012 FACT BOOK
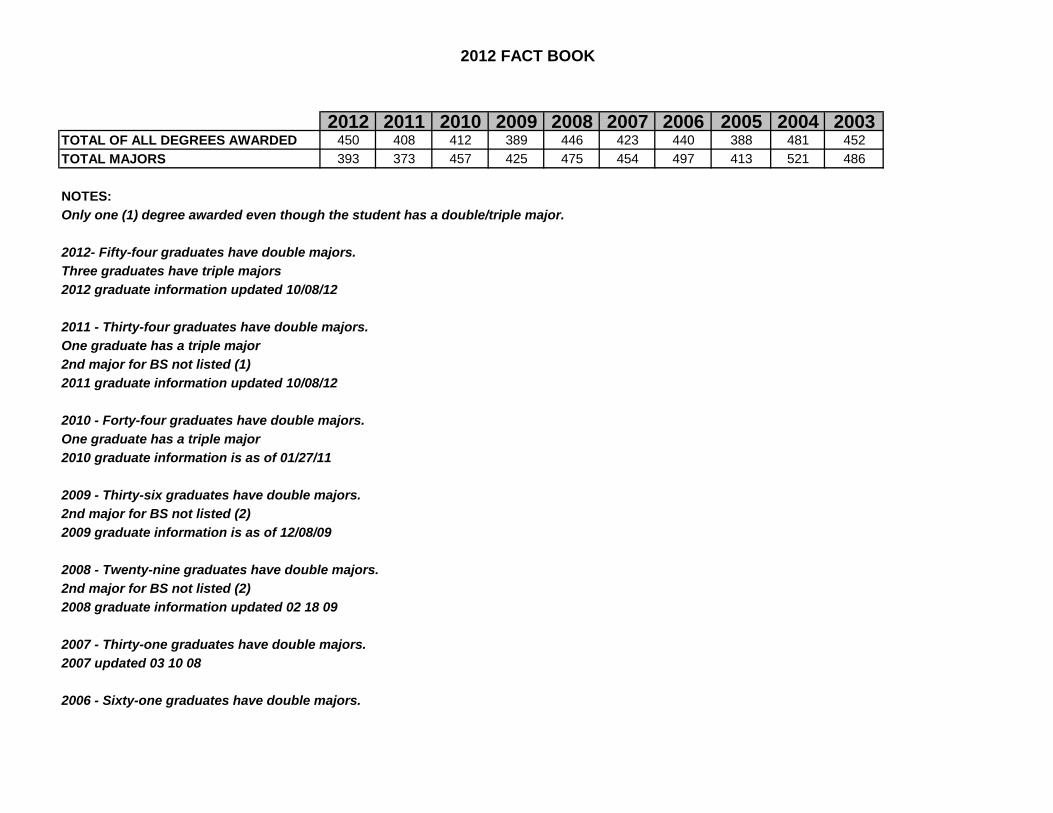
2012 2011 2010 2009 2008 2007 2006 2005 2004 2003TOTAL OF ALL DEGREES AWARDED 450 408 412 389 446 423 440 388 481 452TOTAL MAJORS 393 373 457 425 475 454 497 413 521 486
NOTES: Only one (1) degree awarded even though the student has a double/triple major.
2012- Fifty-four graduates have double majors.Three graduates have triple majors2012 graduate information updated 10/08/12
2011 - Thirty-four graduates have double majors.One graduate has a triple major2nd major for BS not listed (1)2011 graduate information updated 10/08/12
2010 - Forty-four graduates have double majors.One graduate has a triple major2010 graduate information is as of 01/27/11
2009 - Thirty-six graduates have double majors.2nd major for BS not listed (2)2009 graduate information is as of 12/08/09
2008 - Twenty-nine graduates have double majors.2nd major for BS not listed (2)2008 graduate information updated 02 18 09
2007 - Thirty-one graduates have double majors.2007 updated 03 10 08
2006 - Sixty-one graduates have double majors.

2012 FACT BOOK
One has a a triple major2nd major for BS not listed (4)2nd major for BFA not listed (1)2006 is as of 12/13/062006 updated 10/26/07
2005 - Twenty-five graduates have double majors.
2004 - Forty graduates have double majors.2nd major for BS not listed (1)
2003 - Thirty-four graduates have double majors.2nd major for BFA & BME degree not listed (2)

2012WITTENBERG UNIVERSITY
FACT BOOK
ATHLETES

2012 FACT BOOK
ATHLETIC PATRICIPATION BY ETHNIC & GENDER (UNDUPLICATED)
2012 2011 2010 2009 2008 2007 2006 2005 2004 2003African American
Male 36 31 41 28 21 21 17 24 22
Female 5 7 9 5 0 0 0 0 0
Asian
Male 5 4 3 3 0 0 0 0 2
Female 1 1 1 1 0 1 0 0 0
Hawian/Pacific Islander
Male 0 1 3 1 0 0 0 0 0
Female 0 0 0 0 0 0 0 0 0
Caucasian
Male 266 278 348 317 107 105 110 109 115
Female 147 190 244 252 70 71 64 62 63
Hispanic
Male 8 8 8 6 1 1 2 4 3
Female 6 7 8 6 0 1 1 1 1
American/Alaskan Native
Male 0 0 0 2 0 0 0 1 1
Female 0 0 0 1 0 0 0 0 0
Non-Resident Alien
Male 5 4 2 1 0 0 2 1 0
Female 1 2 4 2 1 0 0 0 0
Two or more
Male 14 5 9 8 0 0 0 0 0
Female 7 8 2 3 0 0 0 0 0
Unknown
Male 8 8 24 31 27 22 18 14 8
Female 6 6 15 22 14 7 8 9 4
TOTALS 515 560 721 689 241 229 222 225 219

2012 FACT BOOK
NOTES:2012 Fall returned to 15th day Census date
2011, 2010, 2009Counts are based on certification as of the official census date of October 15th.
2003-2007
Counts represent fall athletes only. This includes any student
on the verified grade roster at the end of each fall term.
2003 - Non-resident aliens not marked.
American/Alaskan Native formerly American Indian


