19
DWS | GLOBAL FINANCIAL INSTITUTE World Real Interest Rates: A Tale of Two Regimes February 2012 Prof. Jagjit S. Chadha
| Date post: | 20-Jul-2016 |
| Category: |
Documents |
| Upload: | panos-tsapatoris |
| View: | 219 times |
| Download: | 2 times |
DWS | GLOBAL FINANCIAL INSTITUTE
World Real Interest Rates: A Tale of Two Regimes
February 2012 Prof. Jagjit S. Chadha

AUTHOR DWS | GLOBAL FINANCIAL INSTITUTE
PROF. JAGJIT S. CHADHA
Professor of Economics
University of Kent
Centre for International
Macroeconomics and Finance
University of Cambridge
Email:
Web Page:
Click here
2
TABLE OF CONTENTS DWS | GLOBAL FINANCIAL INSTITUTE3
TABLE OF CONTENTS
INTRODUCTION TO DWS GLOBAL FINANCIAL INSTITUTE
DWS Global Financial Institute (DGFI) was launched
in November 2011. It is a new-concept think tank that
seeks to foster a unique category of thought leader-
ship for professional and individual investors by effect-
ively and tastefully combining the perspectives of two
worlds: the world of investing and the world of aca-
demia. While primarily targeting an audience within
the international fund investor community, DGFI’s
publications are nonetheless highly relevant to anyone
who is interested in independent, educated, long-term
views on the economic, political, financial, and social
issues facing the world.
To accomplish this mission, DGFI’s publications com-
bine the views of DWS’ investment experts with those
of leading academic institutions in Europe, the United
States, and Asia. Many of these academic institutions
are hundreds of years old, the perfect place to go to
for long-term insight into the global economy. Further-
more, in order to present a well-balanced perspective,
the publications span a wide variety of academic fields
from macroeconomics and finance to sociology.
DWS Investments invites you to check the DGFI web-
site regularly for white papers, interviews, videos, pod-
casts, and more from DWS Investments’ Chief Invest-
ment Officer Dr. Asoka Wöhrmann, Chief Economist
Johannes Müller, and distinguished professors from
institutions like the University of Cambridge, the Uni-
versity of Tokyo, the University of Zurich and many
more, all made relevant and reader-friendly for invest-
ment professionals like you.
Abstract .......................................................... 04
1 Introduction .................................................... 04
2 Some Basic Concepts .................................... 06
3 A Long View on Real Rates ............................ 09
3.1 The Density Function ........................................ 09
3.2 Long-Run Advanced Economy Real Rates ....... 10
3.3 Index-Linked Real Rates ................................... 10
3.4 A Recent G7 and G20 View .............................. 11
3.5 Ex Ante and Ex Post Rates................................ 12
4 Structural Issues ............................................. 13
4.1 Globalisation ..................................................... 13
4.2 Elevated Bond Prices ........................................ 14
4.3 Public Debt Underpinning ................................ 15
4.4 Regulatory Reform and Constrained Real Rates 15
4.5 Implications ..................................................... 15
5 Concluding Remarks ...................................... 17
References ................................................................ 18

WORLD REAL INTEREST RATES DWS | GLOBAL FINANCIAL INSTITUTE
1 INTRODUCTION
Long-term real interest rates move to equilibriate the
desired stock of savings with the planned level of
investment. In a closed economy, the real rate is deter-
mined by domestic factors driving these schedules
and, in an increasingly globalised economy, it is world
real rates that adjust to ensure that the world pool of
savings equals investment plans. In this White Paper,
we examine secular and recent trends in world real
rates and examine the observation that long-term
rates have trended downwards, perhaps puzzlingly, in
the past decade or so since the millennium.
Figure 1: Long-term ex post real rates, 1727–2010
US long-term ex post real rates
UK long-term ex post real rates
4
* This paper draws upon earlier work with Nicholas Dimsdale and Francis Breedon. I am grateful for research assistance from Alex Waters and for very helpful comments from Henning Stein and Jun Shiomitsu. It has been prepared as a White Paper for DWS Global Financial Institute. © Jagjit S. Chadha 2011.
** Professor of Economics, Chair in Banking and Finance, School of Economics, Keynes College, University of Kent, Canterbury, CT2 7NP, UK. Email: [email protected]. Centre for International Macroeconomics and Finance, University of Cambridge.
ABSTRACT
Global real interest rates were driven up in the 1980s,
partly to encourage disinflation, while subsequently
structural and conjunctural factors have driven rates
to lower levels. The increase in the global pool of
savings and the fiscal correction associated with the
long economic expansion from 1992 to 2007 had put
downward pressure on real rates and the extraor-
dinary monetary policy responses since 2008 have
sustained that trend into negative territory. The ini-
tial consequences of low real rates in the early part
of this century had been to elevate asset prices, pro-
mote leverage in financial institutions and, as a coun-
terparty, increase private sector indebtedness. The
management of delever aging by policymakers implies
setting a low path for real rates along the yield curve
by using a combination of traditional and non-tradi-
tional monetary and fiscal pol icies for as long as the
economic dislocation persists. Facing a public and
private debt overhang, low real rates help the adjust-
ment of global balance sheets but cannot be driven
low permanently by policymakers. My analysis sug-
gests that there are two regimes for real rates; those
for normal times are positive and vary with the global
economic cycle, while those that deal with economic
dislocation are negative. Once growth is secured, real
rates will rise quickly to more normal levels, not least
because, in order to limit any increase in funding costs
that may result from capital inadequacy (apparent or
real), banks themselves have a considerable appetite
for capital, and that will also start to crank up real rates
given a fixed pool of savings. It therefore seems likely
that, over the medium term, real yields are likely to be
in the range of 2–4%, rather than their current levels.
World Real Interest Rates:A Tale of Two Regimes*Prof. Jagjit S. Chadha**February 2012

DWS | GLOBAL FINANCIAL INSTITUTE
Figure 1 shows, by way of introduction, a long time
series of real rates from 1727 onwards. We deflate the
long-term interest rates on UK Consols and US long-
term bonds by a 10-year average of actual future infla-
tion in order to estimate real holding period returns.
There is considerable coherence in the real rates
derived in this manner across the two nations, which
were in turn the world’s leading industrialised nations.
The UK real rates suggest remarkable stability over the
eighteenth and nineteenth centuries, save for a period
of volatility associated with the French Revolutionary
and Napoleonic Wars and their aftermath. There has
been considerably more volatility subsequently, with
sustained negative rates during WW1 and WW2, and
in the 1970s, but also, as a result of the surprise dis-
inflation, there was a sharp upward movement in real
rates in the early 1980s.
At first blush this observation presents something
of a puzzle, as we would expect the long economic
expansion from the early 1990s through to the late
2000s to be accompanied by stable real interest rates
that reflect the return on savings and the marginal
efficiency of capital. That the expansion was accom-
panied by increasingly low real rates is likely to be
connected to the increasing globalisation of capital
flows, the considerable growth in and strategic impor-
tance of developing countries, aggressively low short
real policy rates and the creation of highly leveraged
financial institutions that then faced cheap refinancing
costs over an extended period.
From the examination of real rates in this paper, it is also
clear that, although there is a common trend in long-term
real rates across industrialised economies, there is far
from complete convergence. Differences in real rates are
likely to persist, as various risks are embedded in both
nominal and inflation-proofed government securities:
default, liquidity and term premia. When comparing real
rates across countries, it also seems likely that expected
changes in the real exchange rate from differential rates
of growth in productivity may drive wedges into dif-
ferent countries’ real rates, even across long horizons.
Preferences from domestic financial and non-financial
institutions may also have an impact on the real rates
paid by various sovereign states.
This White Paper proceeds in three leaps. First, with
reference to the Metzler diagram of real rates, global
investment and savings schedules, I outline the basic
implications of globalisation for global real rates, at
least in the first stage – lower real rates and escalating
claims of saver countries on debtor countries. Second, I
outline recent movements in the raw data from a num-
ber of advanced economies and also the G20. We can
also examine the expected real rates from index-linked
bond markets and, in all cases, the overall drift down in
real rates is clear. The historical evidence suggests that
downward movements in real rates and persistently
negative real rates seem broadly associated with eco-
nomic dislocations. In the final section, I outline some
of the broad trends that will affect global real rates and
conclude that low real rates are likely to persist for some
time as they will ease adjustment of highly indebted
public and private sectors in advanced economies.
Over the medium term, these rates will trend back up
as demand for global capital will emerge from saver
nations and financial intermediaries will be required to
hold more capital against assets created.
This process of regularisation of real rates is both uncer-
tain and critically dependent on the return of sustained
growth in the leading economies. But if we put the eco-
nomic dislocation to one side, the overriding solution to
the downward cycle in real rates is the creation of more
assets that provide both a store of value and liquidity for
financial intermediaries. If there is an inadequate devel-
opment of savings vehicles in the saver economies then
these savings will tend to drive up the prices of exist-
ing assets, for example US Treasury notes, which will
be in short supply. It is, rather, a global excess demand
for assets that both drives down real interest rates and
raises other asset prices in turn, for example hous-
ing, equity or real commodities. Part of the problem is
simply that, with a shortage of assets, a given shock
to demand will then have a much larger impact on the
price (real rates) than otherwise. We return to this point
in the conclusion.
5 WORLD REAL INTEREST RATES
DWS | GLOBAL FINANCIAL INSTITUTE
In this section, I explain why globalisation leads initially
to lower rates when the newly globalising countries
entering the world economy have a higher propensity
to hold excess savings at any given interest rate and
when their own domestic investment opportunities
are limited. I use, and explain the process with, the
famous Metzler diagram. Over the medium-term, we
can expect real rates to rise again when the countries
start to reduce savings propensity and also develop
more domestic investment opportunities. In the short
run, however, downward pressure on real rates can
stoke a boom in the price of fixed investment goods
and assets and lead to extensive accumulation of pri-
vate sector debts. This is because higher asset prices
provide the credit-constrained private sector with
higher quantities of collateral, thus relaxing such con-
straints and promoting higher levels of borrowing.
In the long run, real rates can be expected to adjust to
equilibrate the pool of savings and planned investment.
In a global economy, capital outflows tend to go from
saver countries that are wealthy to poorer countries
that have limited savings but abundant investment
opportunities. One of the root causes of the financial
crisis has been the unnatural sight of capital flowing
uphill, that is from poor to rich countries. In a famous
calculation, Robert Lucas (1990, American Economic
Review) showed that if a rich country and a poor one
have equivalent production technologies and differ
only in income per head, then because the amount of
capital employed in the poorer country will be less than
in the richer country, the marginal efficiency of capital
must be higher in the poorer country and so attract
capital. For example, latest EIU data suggests that
Chinese PPP per capita income is around $5,000 and
the same figure in the US is $45,000, which implies
that the rate of return on capital in the US should be a
small fraction, at around 3–4%,1 of that in China and
should in turn mean that China runs a current account
deficit financed by a US capital surplus. The reality has,
of course, been the obverse, with the US recycling
China’s capital flows. Or more generally, poorer grow-
ing economies funding the external payments pos-
itions of richer but more slowly growing economies.
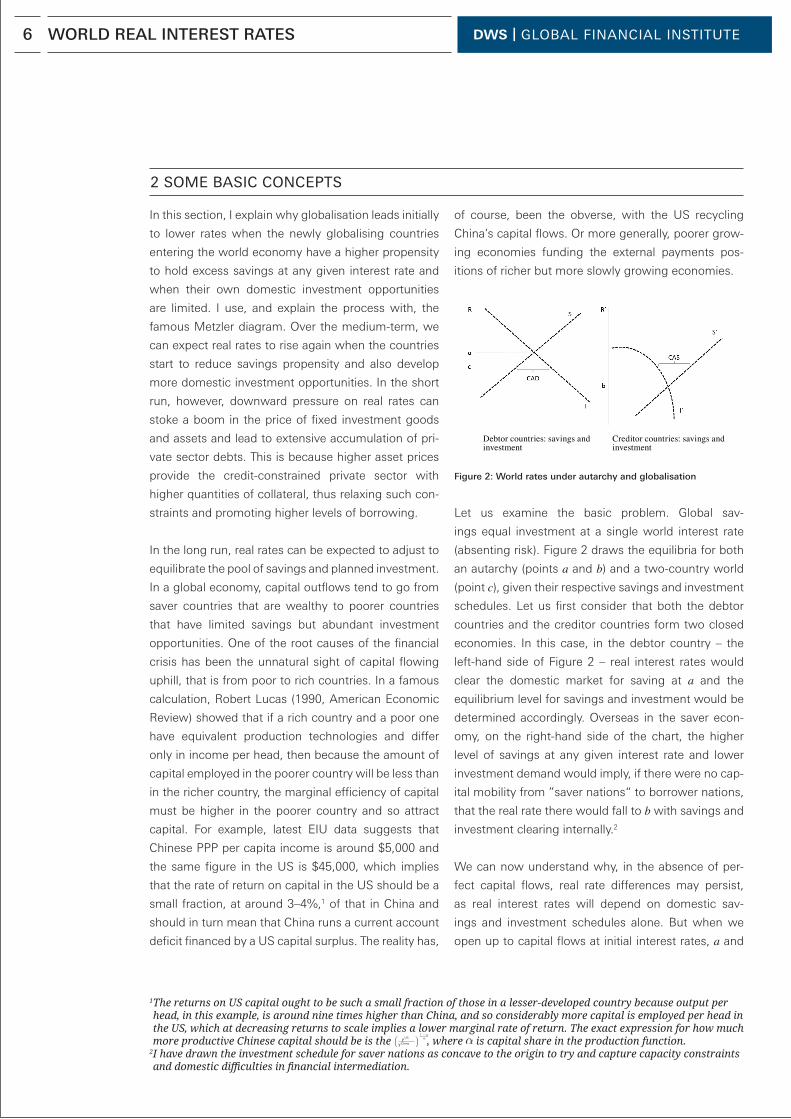
Figure 2: World rates under autarchy and globalisation
Let us examine the basic problem. Global sav-
ings equal investment at a single world interest rate
(absenting risk). Figure 2 draws the equilibria for both
an autarchy (points a and b) and a two-country world
(point c), given their respective savings and investment
schedules. Let us first consider that both the debtor
countries and the creditor countries form two closed
economies. In this case, in the debtor country – the
left-hand side of Figure 2 – real interest rates would
clear the domestic market for saving at a and the
equilibrium level for savings and investment would be
determined accordingly. Overseas in the saver econ-
omy, on the right-hand side of the chart, the higher
level of savings at any given interest rate and lower
investment demand would imply, if there were no cap-
ital mobility from ”saver nations“ to borrower nations,
that the real rate there would fall to b with savings and
investment clearing internally.2
We can now understand why, in the absence of per-
fect capital flows, real rate differences may persist,
as real interest rates will depend on domestic sav-
ings and investment schedules alone. But when we
open up to capital flows at initial interest rates, a and
Debtor countries: savings and investment
Creditor countries: savings and investment
2 SOME BASIC CONCEPTS
1 The returns on US capital ought to be such a small fraction of those in a lesserdeveloped country because output per head, in this example, is around nine times higher than China, and so considerably more capital is employed per head in the US, which at decreasing returns to scale implies a lower marginal rate of return. The exact expression for how much more productive Chinese capital should be is the , where is capital share in the production function.
2 I have drawn the investment schedule for saver nations as concave to the origin to try and capture capacity constraints and domestic difficulties in financial intermediation.
6 WORLD REAL INTEREST RATES
DWS | GLOBAL FINANCIAL INSTITUTE
b, the debtors will expand investment demand relative
to savings and run a current account deficit (CAD) at
some inter mediate interest rate between a and b, let us
say c, and the creditor nations will generate a current
account surplus (CAS) to meet the debtors’ demands.
The surplus (deficit) in each year adds to (reduces)
net foreign assets in each year in the creditor (debtor)
country and leads to an increasing stock of claims by
the surplus nations on the debtor nations.
The counterpart of “excess” savings in creditor nations
is “excessive” investment in the US – recall that this
comprises both public and private investment. So
might small reductions in debtor country demand
(investment) provide the answer? And even though
that seems part of the current adjustment, it may not
necessarily be enough. Even if demand falls suffi-
ciently with an inward shift in the investment demand
function, I, to eliminate the debtor’s current account
deficit at stable world rates, c, then creditors would
still have excess savings. This excess would drive rates
down from c and lead to the “re-emergence” of a cur-
rent account deficit, albeit with lower world rates and a
lower level of global imbalances. Obviously, with large
enough falls in US demand, we can achieve zero cur-
rent account balances in both countries at very low
R and low market clearing levels of debtor country
savings and investment. Perhaps this is the interim
solution, as we stare at the prolonged global recession
into which we are heading?
We can also consider a number of alternative solutions.
For example, an upward shift in creditor investment
demand, Iʹ, to clear the surplus at c, at the original
equilibrium, will mean excess demand in the debtors
continues and thus world rates, c ↑, will go higher and
there will still be a creditor surplus and a debtor deficit.
Obviously again, if creditor demand shifts up even fur-
ther, we can have no capital flows but at significantly
higher world interest rates and high world demand.
This may not be the solution we are heading towards
immediately, but seems likely to be the sort of long-run
equilibrium solution to the problem in which real rates
and both global savings and investment are at higher
levels.
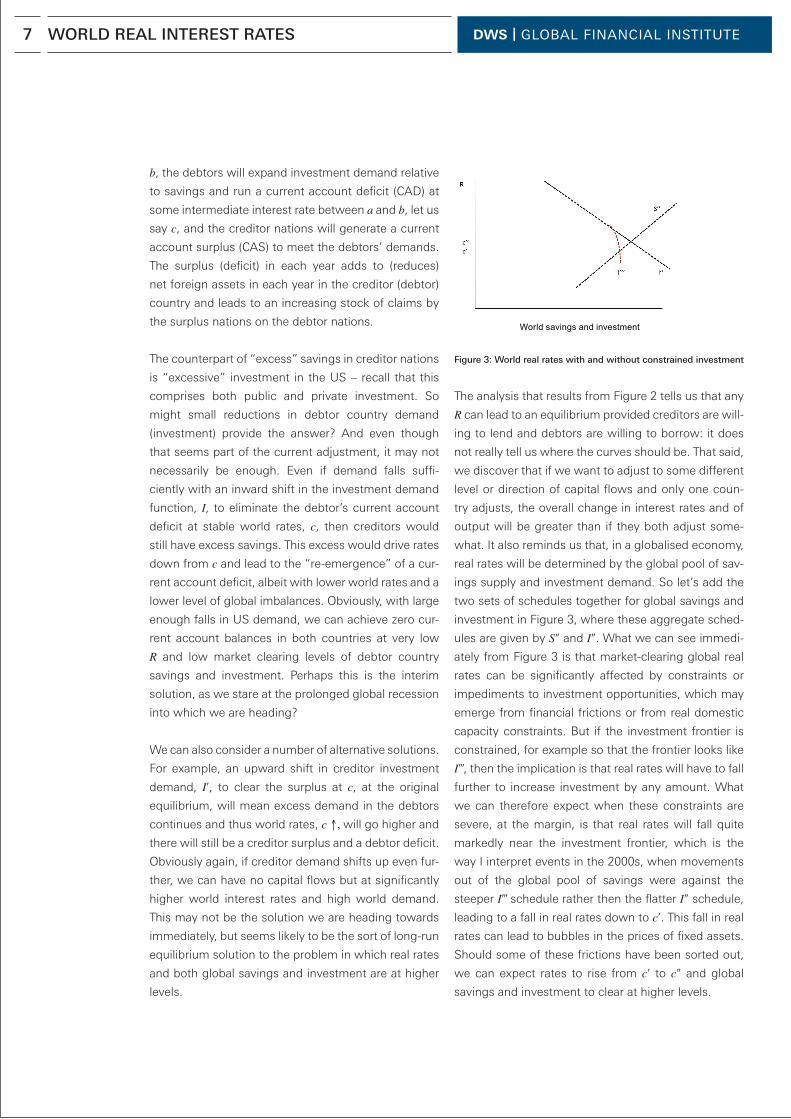
Figure 3: World real rates with and without constrained investment
The analysis that results from Figure 2 tells us that any
R can lead to an equilibrium provided creditors are will-
ing to lend and debtors are willing to borrow: it does
not really tell us where the curves should be. That said,
we discover that if we want to adjust to some different
level or direction of capital flows and only one coun-
try adjusts, the overall change in interest rates and of
output will be greater than if they both adjust some-
what. It also reminds us that, in a globalised economy,
real rates will be determined by the global pool of sav-
ings supply and investment demand. So let’s add the
two sets of schedules together for global savings and
investment in Figure 3, where these aggregate sched-
ules are given by Sʺ and Iʺ. What we can see immedi-
ately from Figure 3 is that market-clearing global real
rates can be significantly affected by constraints or
impediments to investment opportunities, which may
emerge from financial frictions or from real domestic
capacity constraints. But if the investment frontier is
constrained, for example so that the frontier looks like
Iʹ́ ,́ then the implication is that real rates will have to fall
further to increase investment by any amount. What
we can therefore expect when these constraints are
severe, at the margin, is that real rates will fall quite
markedly near the investment frontier, which is the
way I interpret events in the 2000s, when movements
out of the global pool of savings were against the
steeper Iʹ́ ́schedule rather then the flatter Iʺ schedule,
leading to a fall in real rates down to cʹ. This fall in real
rates can lead to bubbles in the prices of fixed assets.
Should some of these frictions have been sorted out,
we can expect rates to rise from cʹ to cʺ and global
savings and investment to clear at higher levels.
World savings and investment
7 WORLD REAL INTEREST RATES
DWS | GLOBAL FINANCIAL INSTITUTE
So what is the overall constraint or target? It is closely
linked to the equilibrium level of net foreign assets to
GDP, which is the accumulation of surpluses or defi-
cits, where flows from one country to another are
simply net additions or subtractions depending on
whether a CAS or CAD occurs. The equilibrium level
of net foreign assets for any one country is hard to
model but again, under the world’s adding-up con-
straint, these claims must net out across economies.
The US is a debtor nation (at around 6–7% of global
GDP), implying that its current demand will be met
by saving from higher future income. In this scenario,
Asia will be the creditor and, according to the IMF’s
World Economic Outlook emerging Asia is in credit
by around 5% of global GDP. But for the reasons
given earlier, Asia should probably be the net debtor
and borrow from its higher future income. And so, if
we are to get to a situation in which countries such
as China become debtors and capital flows downhill
(from rich to poor), this will imply the need for sur-
pluses in countries such as the US and a deficit in
China, which implies lower US demand, greater US
propensity to save, higher Chinese demand and lower
Chinese propensity to save. But whether capital flows
from rich to poor or vice versa, in normal times real
rates are stable and positive. The current conjuncture
has rates that are often negative and must be viewed
as a temporary response engineered by policymakers
to try and rebalance global balance sheets. The way
this works is explained in the next section.
8 WORLD REAL INTEREST RATES
DWS | GLOBAL FINANCIAL INSTITUTE
In this section, I outline long-term trends in real rates
from deflated nominal long-term rates and from the
index-linked market.
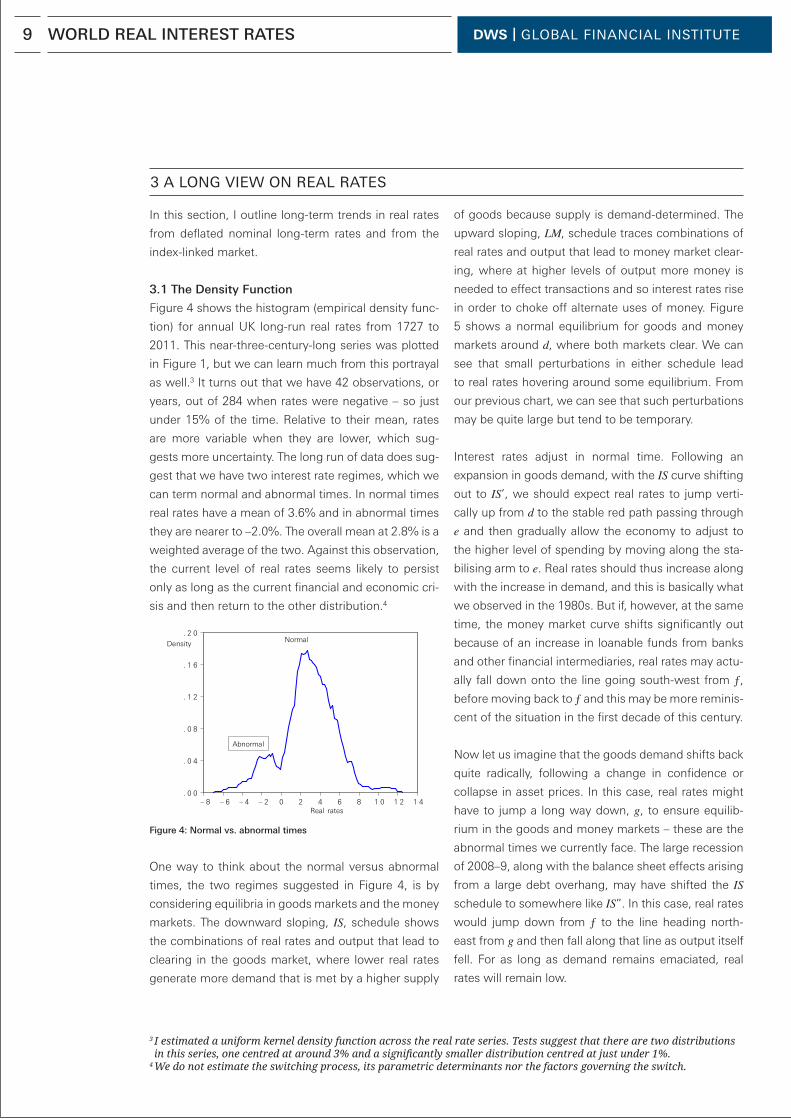
3.1 The Density Function
Figure 4 shows the histogram (empirical density func-
tion) for annual UK long-run real rates from 1727 to
2011. This near-three-century-long series was plotted
in Figure 1, but we can learn much from this portrayal
as well.3 It turns out that we have 42 observations, or
years, out of 284 when rates were negative – so just
under 15% of the time. Relative to their mean, rates
are more variable when they are lower, which sug-
gests more uncertainty. The long run of data does sug-
gest that we have two interest rate regimes, which we
can term normal and abnormal times. In normal times
real rates have a mean of 3.6% and in abnormal times
they are nearer to –2.0%. The overall mean at 2.8% is a
weighted average of the two. Against this observation,
the current level of real rates seems likely to persist
only as long as the current financial and economic cri-
sis and then return to the other distribution.4
Figure 4: Normal vs. abnormal times
One way to think about the normal versus abnormal
times, the two regimes suggested in Figure 4, is by
considering equilibria in goods markets and the money
markets. The downward sloping, IS, schedule shows
the combinations of real rates and output that lead to
clearing in the goods market, where lower real rates
generate more demand that is met by a higher supply
. 0 0
. 0 4
. 0 8
. 1 2
. 1 6
. 2 0
– 8 – 6 – 4 – 2 0 2 4 6 8 1 0 1 2 1 4
Density
Abnormal
Normal
Real rates
of goods because supply is demand-determined. The
upward sloping, LM, schedule traces combinations of
real rates and output that lead to money market clear-
ing, where at higher levels of output more money is
needed to effect transactions and so interest rates rise
in order to choke off alternate uses of money. Figure
5 shows a normal equilibrium for goods and money
markets around d, where both markets clear. We can
see that small perturbations in either schedule lead
to real rates hovering around some equilibrium. From
our previous chart, we can see that such perturbations
may be quite large but tend to be temporary.
Interest rates adjust in normal time. Following an
expansion in goods demand, with the IS curve shifting
out to IS’, we should expect real rates to jump verti-
cally up from d to the stable red path passing through
e and then gradually allow the economy to adjust to
the higher level of spending by moving along the sta-
bilising arm to e. Real rates should thus increase along
with the increase in demand, and this is basically what
we observed in the 1980s. But if, however, at the same
time, the money market curve shifts significantly out
because of an increase in loanable funds from banks
and other financial intermediaries, real rates may actu-
ally fall down onto the line going south-west from ƒ,
before moving back to ƒ and this may be more reminis-
cent of the situation in the first decade of this century.
Now let us imagine that the goods demand shifts back
quite radically, following a change in confidence or
collapse in asset prices. In this case, real rates might
have to jump a long way down, g, to ensure equilib-
rium in the goods and money markets – these are the
abnormal times we currently face. The large recession
of 2008–9, along with the balance sheet effects arising
from a large debt overhang, may have shifted the IS schedule to somewhere like IS”. In this case, real rates
would jump down from ƒ to the line heading north-
east from g and then fall along that line as output itself
fell. For as long as demand remains emaciated, real
rates will remain low.
3 A LONG VIEW ON REAL RATES
3 I estimated a uniform kernel density function across the real rate series. Tests suggest that there are two distributions in this series, one centred at around 3% and a significantly smaller distribution centred at just under 1%.
4 We do not estimate the switching process, its parametric determinants nor the factors governing the switch.
9 WORLD REAL INTEREST RATES
DWS | GLOBAL FINANCIAL INSTITUTE
Figure 5: High and low real rates – normal and abnormal regimes
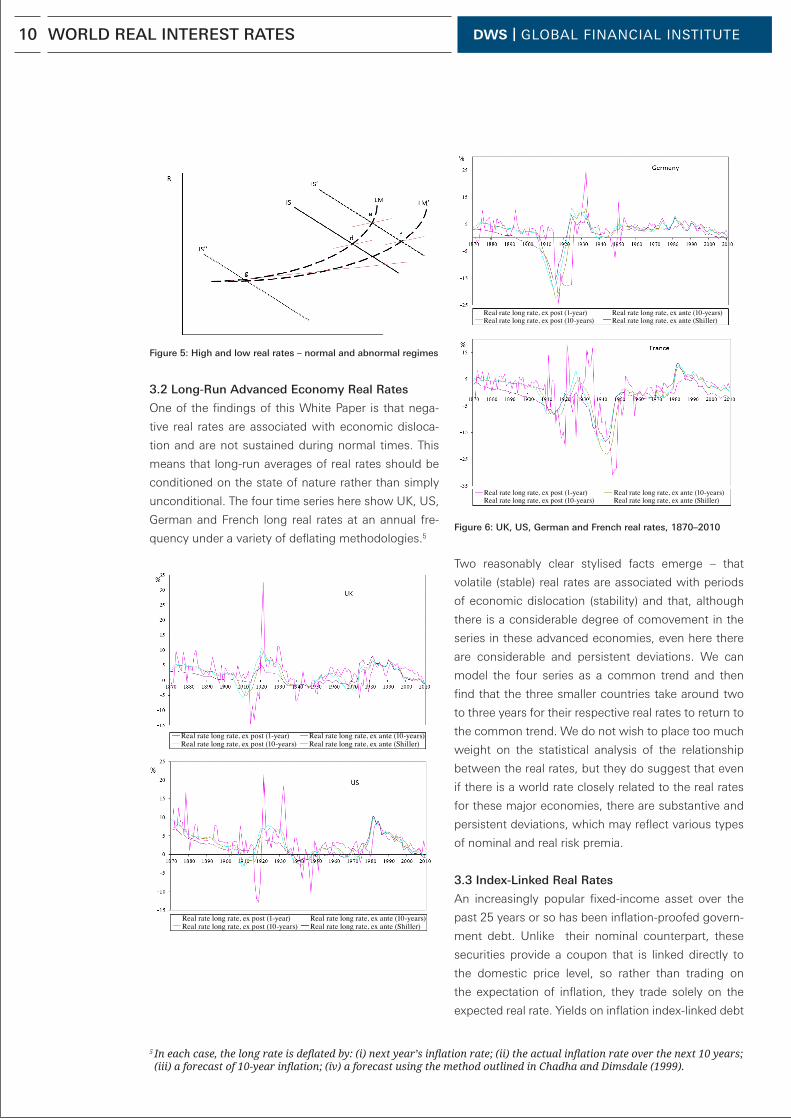
3.2 Long-Run Advanced Economy Real Rates
One of the findings of this White Paper is that nega-
tive real rates are associated with economic disloca-
tion and are not sustained during normal times. This
means that long-run averages of real rates should be
conditioned on the state of nature rather than simply
unconditional. The four time series here show UK, US,
German and French long real rates at an annual fre-
quency under a variety of deflating methodologies.5
Real rate long rate, ex post (1-year)Real rate long rate, ex post (10-years)
Real rate long rate, ex ante (10-years)Real rate long rate, ex ante (Shiller)
Real rate long rate, ex post (1-year)Real rate long rate, ex post (10-years)
Real rate long rate, ex ante (10-years)Real rate long rate, ex ante (Shiller)
Figure 6: UK, US, German and French real rates, 1870–2010
Two reasonably clear stylised facts emerge – that
volatile (stable) real rates are associated with periods
of economic dislocation (stability) and that, although
there is a considerable degree of comovement in the
series in these advanced economies, even here there
are considerable and persistent deviations. We can
model the four series as a common trend and then
find that the three smaller countries take around two
to three years for their respective real rates to return to
the common trend. We do not wish to place too much
weight on the statistical analysis of the relationship
between the real rates, but they do suggest that even
if there is a world rate closely related to the real rates
for these major economies, there are substantive and
persistent deviations, which may reflect various types
of nominal and real risk premia.
3.3 Index-Linked Real Rates
An increasingly popular fixed-income asset over the
past 25 years or so has been inflation-proofed govern-
ment debt. Unlike their nominal counterpart, these
securities provide a coupon that is linked directly to
the domestic price level, so rather than trading on
the expectation of inflation, they trade solely on the
expected real rate. Yields on inflation index-linked debt
Real rate long rate, ex post (1-year)Real rate long rate, ex post (10-years)
Real rate long rate, ex ante (10-years)Real rate long rate, ex ante (Shiller)
Real rate long rate, ex post (1-year)Real rate long rate, ex post (10-years)
Real rate long rate, ex ante (10-years)Real rate long rate, ex ante (Shiller)
5 In each case, the long rate is deflated by: (i) next year’s inflation rate; (ii) the actual inflation rate over the next 10 years; (iii) a forecast of 10year inflation; (iv) a forecast using the method outlined in Chadha and Dimsdale (1999).
10 WORLD REAL INTEREST RATES

DWS | GLOBAL FINANCIAL INSTITUTE
yields are thus real rates, and from the 1980s onwards
show both a secular downward trend and also a clear
fall from 2008 onwards for Canada, the US, France
and the UK. Japanese index-linked debt has fallen
sharply since 2009. The early periods of index-linked
debt issuance suggest the existence of liquidity pre-
mia in each country: in the 1980s for Japan and the
UK, in the early part of the 21st century for France and
in 2006–7 for Canada. This suggests that some frac-
tion of the observed fall in real rates from this mar-
ket reflects some reduction in liquidity as issuance
increased. It seems likely, though, that medium-term
real yields are likely to be in the range of 2–4%, rather
than their current level.
Figure 7: Medium-term benchmark yields of inflation-proofed
sovereign debt
3.4 A Recent G7 and G20 View
Figures 8a and 8b deflate nominal 10-year benchmark
rates for the G7 and G20 countries by the past two
years’ average inflation rate.6 We interpret this as a
proxy for medium-term inflation expectations. A now
familiar story emerges: real rates declining from an
early 90s peak and the period of stability from 2000
onwards being rudely interrupted by the financial cri-
sis. Although the median long-term rate is near zero,
the spread in real rate across the G7 remains quite
wide – again telling us that there is less-than-perfect
substitutability across medium-term G7 bonds.
USJapan
Canada UK
France
Figure 8a: G7 long-term real rates – median and range
Figure 8b: G20 long-term real rates – interquartile range
A similar exercise for the G20 yields very similar obser-
vations. In this case, rather than the range, we could
also point out the interquartile range. And the median
observation looks rather similar, which is suggestive
again of a common trend in real rates. The interquartile
range, though, of the G20 is somewhat narrower, as
we might expect. But it is far from insignificant. The
seeming downward trend in real rates again seems
clear. The decline in real rates from the early 1990s
seems associated with a loosening of monetary policy
following the 1990–2 recession but also the increasing
globalisation of capital, which allowed cross-border
capital flows to meet domestic capital demands and
so tended to put downward pressure on real rates.
The extension of the long expansion into the 2000s
6 The G7 group of nations used to dominate macroeconomic planning, but increasingly it has been usurped by the G20 group of finance ministers and central bank governors, which was established in 1999 after the Asian financial crisis and has, of course, considerably wider global membership.
11 WORLD REAL INTEREST RATES
DWS | GLOBAL FINANCIAL INSTITUTE
by accommodative monetary policy further sustained
the low-rate environment. The build-up of large gross
claims from creditor to debtor countries was facilitated
by the low-rate environment. In the early stages of the
financial crisis, which can be thought of as a distribu-
tive shock from debtors to creditors, it is interesting
to note that median real rates grew in the G20 and fell
in the G7. As the crisis has lengthened and, arguably,
deepened from 2010, real rates across both groups of
nations have fallen.
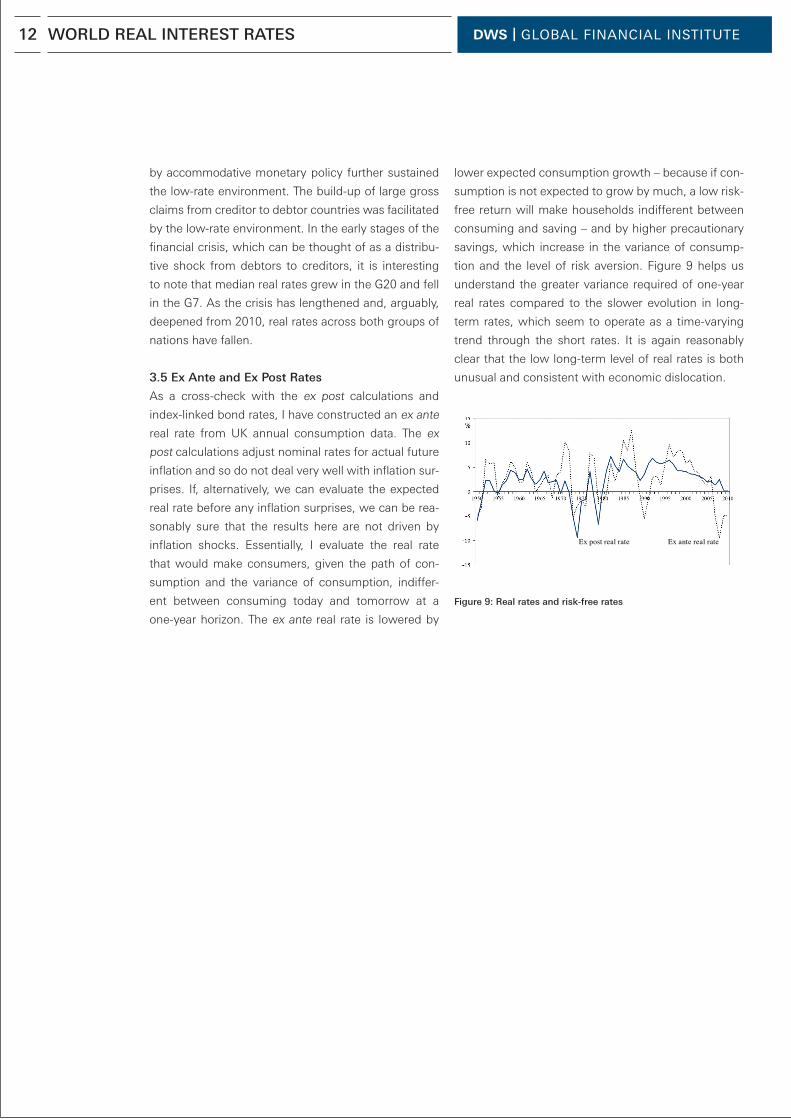
3.5 Ex Ante and Ex Post Rates
As a cross-check with the ex post calculations and
index-linked bond rates, I have constructed an ex ante
real rate from UK annual consumption data. The ex
post calculations adjust nominal rates for actual future
inflation and so do not deal very well with inflation sur-
prises. If, alternatively, we can evaluate the expected
real rate before any inflation surprises, we can be rea-
sonably sure that the results here are not driven by
inflation shocks. Essentially, I evaluate the real rate
that would make consumers, given the path of con-
sumption and the variance of consumption, indiffer-
ent between consuming today and tomorrow at a
one-year horizon. The ex ante real rate is lowered by
lower expected consumption growth – because if con-
sumption is not expected to grow by much, a low risk-
free return will make households indifferent between
consuming and saving – and by higher precautionary
savings, which increase in the variance of consump-
tion and the level of risk aversion. Figure 9 helps us
understand the greater variance required of one-year
real rates compared to the slower evolution in long-
term rates, which seem to operate as a time-varying
trend through the short rates. It is again reasonably
clear that the low long-term level of real rates is both
unusual and consistent with economic dislocation.
Figure 9: Real rates and risk-free rates
Ex post real rate Ex ante real rate
12 WORLD REAL INTEREST RATES
DWS | GLOBAL FINANCIAL INSTITUTE
At a number of points in this paper, I have pointed to
the extraordinarily low level of real rates. The release of
global savings, alongside the lack of domestic invest-
ment infrastructure in creditor countries, has driven
down rates at the margin. Deflationary pressure in
traded good markets led to lower-than-otherwise nom-
inal interest rates. Low short-term interest rates along-
side this pool of global liquidity encouraged financial
intermediaries to build up considerable levels of gear-
ing. This gearing involved claims on both the private
and public sectors, which were subject to consider-
able performance risk in the event of abrupt changes
in current and expected income or in refinanc ing costs.
The gradual realisation of this latent risk has led to the
adoption of very low interest rates by central banks to
smooth repayments and refinancing of debt and the
need for substantial recapitalisation of the financial
system. In time, central banks will regularise rates and
the demand for capital from both financial intermediar-
ies and developing countries will force real rates back
to historic positive levels.
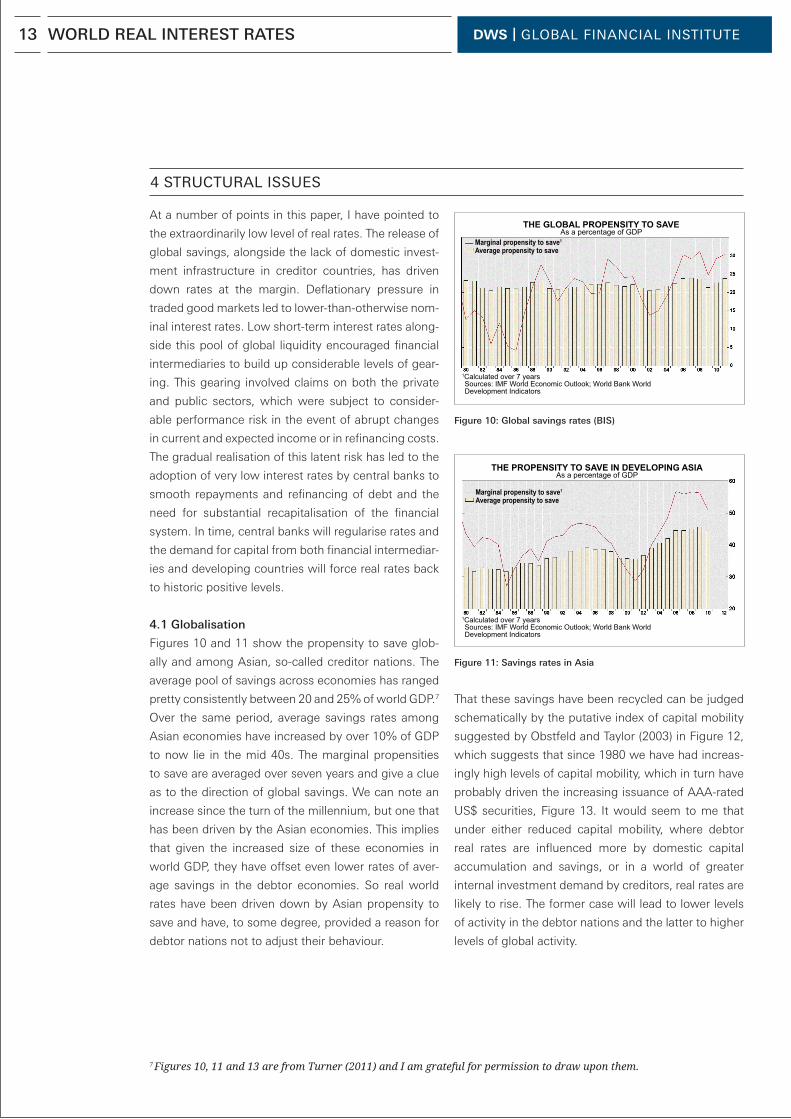
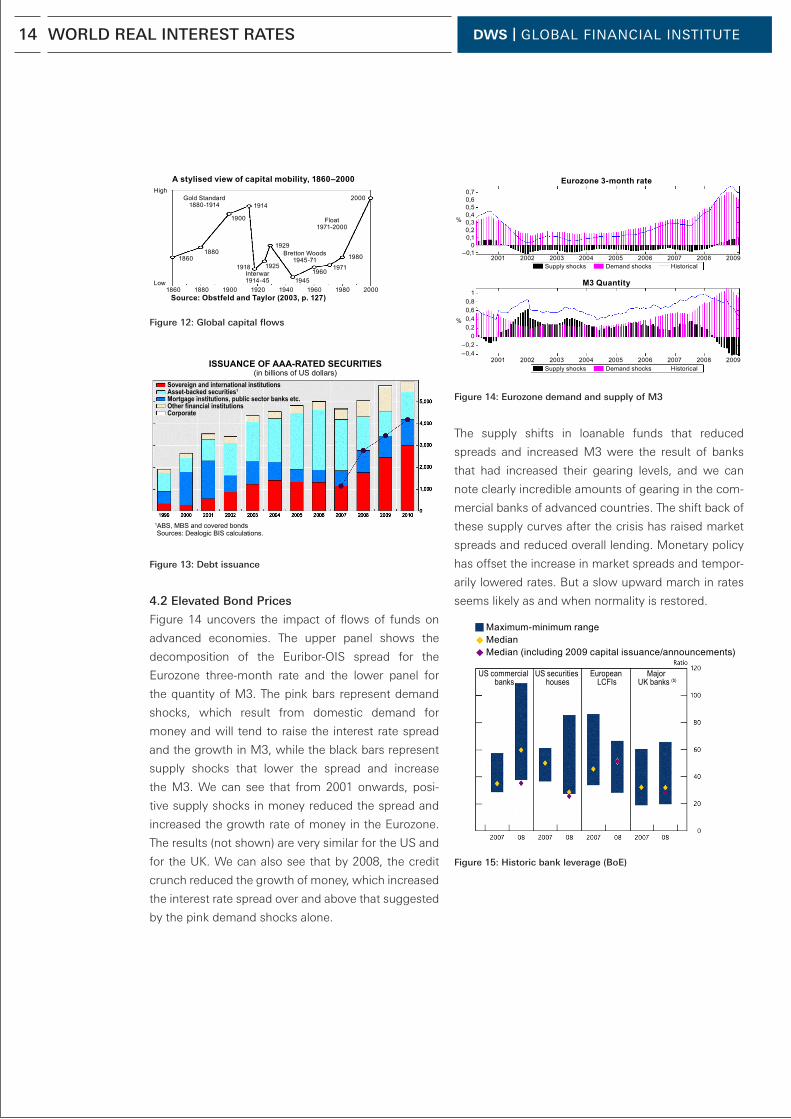
4.1 Globalisation
Figures 10 and 11 show the propensity to save glob-
ally and among Asian, so-called creditor nations. The
average pool of savings across economies has ranged
pretty consistently between 20 and 25% of world GDP.7
Over the same period, average savings rates among
Asian econ omies have increased by over 10% of GDP
to now lie in the mid 40s. The marginal propensities
to save are averaged over seven years and give a clue
as to the direction of global savings. We can note an
increase since the turn of the millennium, but one that
has been driven by the Asian economies. This implies
that given the increased size of these economies in
world GDP, they have offset even lower rates of aver-
age savings in the debtor economies. So real world
rates have been driven down by Asian propensity to
save and have, to some degree, provided a reason for
debtor nations not to adjust their behaviour.
Figure 10: Global savings rates (BIS)
Figure 11: Savings rates in Asia
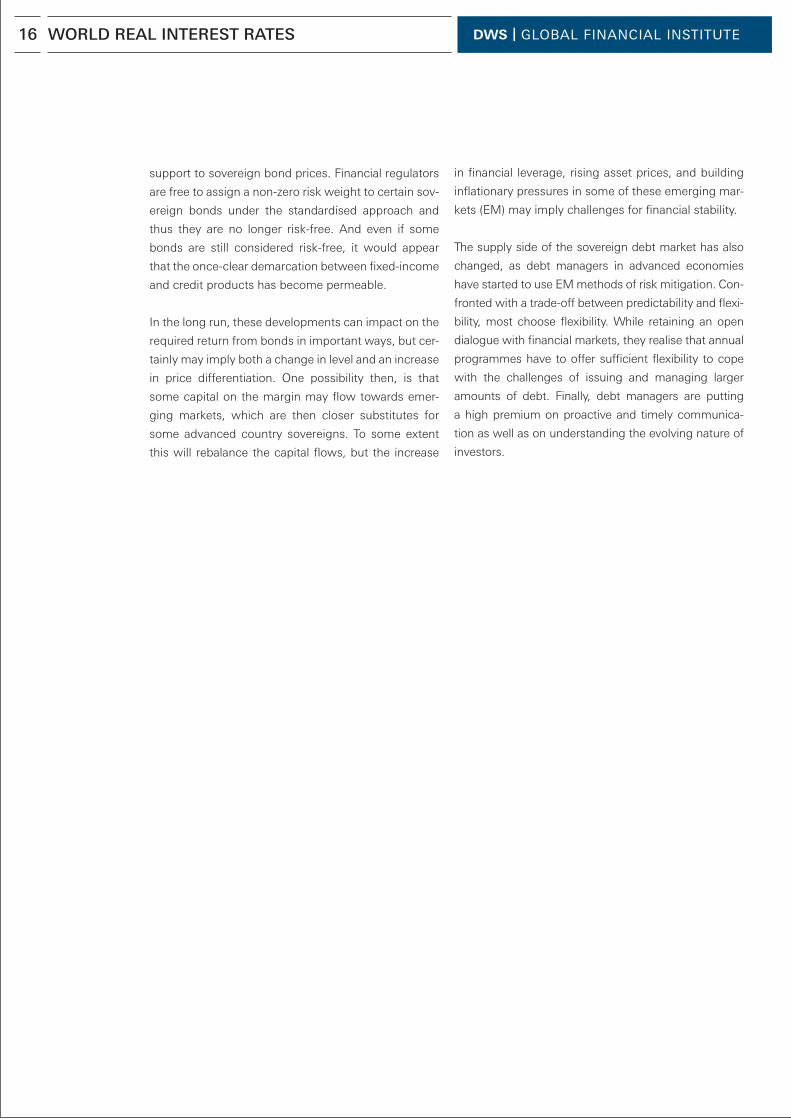
That these savings have been recycled can be judged
schematically by the putative index of capital mobility
suggested by Obstfeld and Taylor (2003) in Figure 12,
which suggests that since 1980 we have had increas-
ingly high levels of capital mobility, which in turn have
probably driven the increasing issuance of AAA-rated
US$ securities, Figure 13. It would seem to me that
under either reduced capital mobility, where debtor
real rates are influenced more by domestic capital
accumulation and savings, or in a world of greater
internal investment demand by creditors, real rates are
likely to rise. The former case will lead to lower levels
of activity in the debtor nations and the latter to higher
levels of global activity.
THE GLOBAL PROPENSITY TO SAVE
Marginal propensity to save1
Average propensity to save
As a percentage of GDP
Sources: IMF World Economic Outlook; World Bank WorldDevelopment Indicators
1Calculated over 7 years
THE PROPENSITY TO SAVE IN DEVELOPING ASIA
Marginal propensity to save1
Average propensity to save
As a percentage of GDP
Sources: IMF World Economic Outlook; World Bank WorldDevelopment Indicators
1Calculated over 7 years
7 Figures 10, 11 and 13 are from Turner (2011) and I am grateful for permission to draw upon them.
13
4 STRUCTURAL ISSUES
WORLD REAL INTEREST RATES
DWS | GLOBAL FINANCIAL INSTITUTE
Figure 12: Global capital flows
Figure 13: Debt issuance
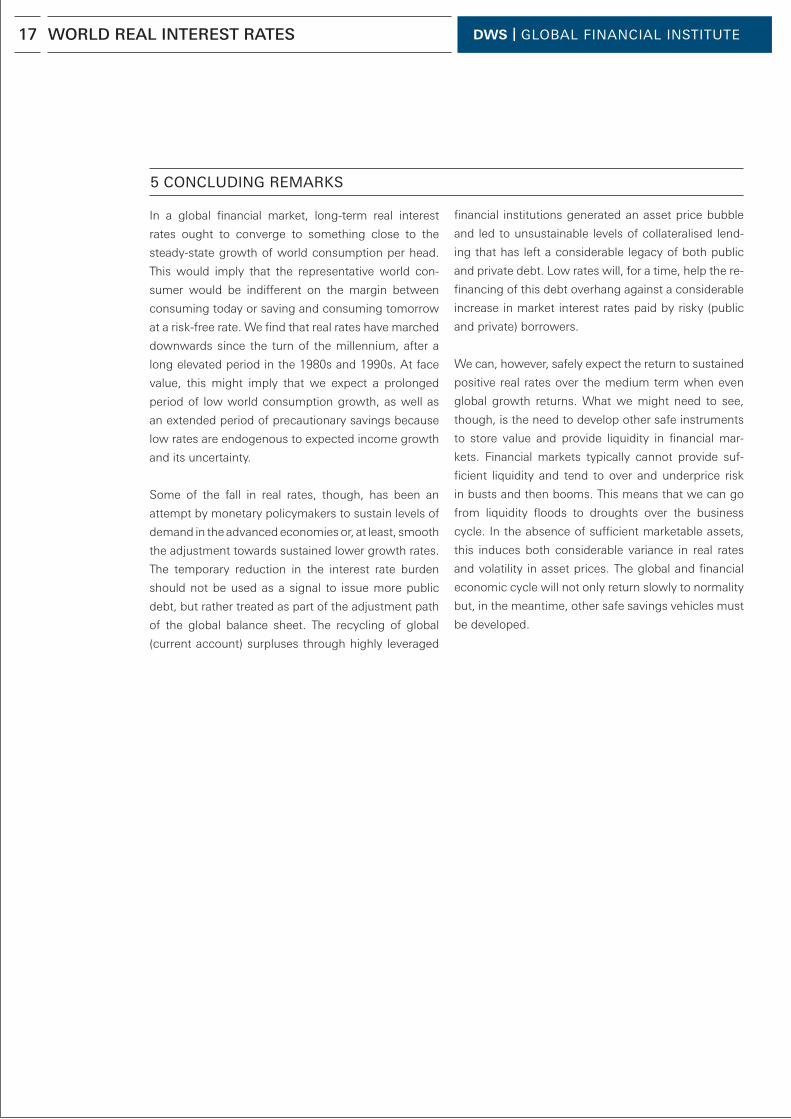
4.2 Elevated Bond Prices
Figure 14 uncovers the impact of flows of funds on
advanced economies. The upper panel shows the
decomposition of the Euribor-OIS spread for the
Eurozone three-month rate and the lower panel for
the quantity of M3. The pink bars represent demand
shocks, which result from domestic demand for
money and will tend to raise the interest rate spread
and the growth in M3, while the black bars represent
supply shocks that lower the spread and increase
the M3. We can see that from 2001 onwards, posi-
tive supply shocks in money reduced the spread and
increased the growth rate of money in the Eurozone.
The results (not shown) are very similar for the US and
for the UK. We can also see that by 2008, the credit
crunch reduced the growth of money, which increased
the interest rate spread over and above that suggested
by the pink demand shocks alone.
A stylised view of capital mobility, 1860–2000High
1860
1860
1880
1880
1900
1900 1920 1940 1960 1980 20001945
1914
1929
1918 19251960
1971
1980
2000Gold Standard1880-1914
Bretton Woods1945-71
Float1971-2000
Interwar1914-45Low
Source: Obstfeld and Taylor (2003, p. 127)
ISSUANCE OF AAA-RATED SECURITIES
Sovereign and international institutionsAsset-backed securities1
Mortgage institutions, public sector banks etc.Other financial institutionsCorporate
(in billions of US dollars)
Sources: Dealogic BIS calculations.1ABS, MBS and covered bonds
Figure 14: Eurozone demand and supply of M3
The supply shifts in loanable funds that reduced
spreads and increased M3 were the result of banks
that had increased their gearing levels, and we can
note clearly incredible amounts of gearing in the com-
mercial banks of advanced countries. The shift back of
these supply curves after the crisis has raised market
spreads and reduced overall lending. Monetary policy
has offset the increase in market spreads and tempor-
arily lowered rates. But a slow upward march in rates
seems likely as and when normality is restored.
Figure 15: Historic bank leverage (BoE)
Eurozone 3-month rate
M3 Quantity
%
2001 2002Supply shocks Demand shocks Historical
Supply shocks Demand shocks Historical
2003 2004 2005 2006 2007 2008 2009
2001 2002 2003 2004 2005 2006 2007 2008 2009
0,70,60,50,40,30,20,1
0–0,1
10,80,60,40,2
0–0,2–0,4
%
Maximum-minimum rangeMedianMedian (including 2009 capital issuance/announcements)
US commercial banks
US securities houses
European LCFIs
Major UK banks (b)
14 WORLD REAL INTEREST RATES

DWS | GLOBAL FINANCIAL INSTITUTE
4.3 Public Debt Underpinning
The financial crisis led to an increase in the public
indebtedness of advanced economies. Private sector
claims were nationalised in some cases and the short-
fall of private demand led to an increase in public con-
sumption. This is not sustainable because, as public
debt levels creep towards 100%, they quickly become
difficult to stabilise as interest payments comprise sev-
eral percentage points of GDP. Furthermore, it became
clear that public debt began, as it was clearly subject
to private risk, to resemble a private default-related
interest rate instrument. This is because private debt
seemed to morph into public debt but, more funda-
mentally, the repayment of public debt depends on the
health of the private sector. Naturally, the short-term
funding, or refinancing, of public debt was sufficiently
eased at low real rates. But this is purely a tempo-
rary response during a period of extreme dislocation.
Monetary and fiscal policy cannot keep real rates
below the equili briating level for global savings and
investment for long.
Figure 16: Public debt positions (EU)
Figure 17: Global debt positions
Gross public dept2007200820092010
60% Maastricht criteria
Source: European Commision
% o
f GD
P4.4 Regulatory Reform and Constrained Real Rates
The support provided by the public sector to both
aggregate demand and the financial sector has cre-
ated a wedge in the growth of public indebtedness:
advanced economies have found their public bal-
ance sheets stretched and emerging and developing
countries have been able to run surpluses. Advanced
country debt has thus become riskier and, because of
the need to supply liquidity to a financial sector fa cing
shortages, the duration of the debt has also shortened.
Facing a public and private debt overhang, low real
rates help the adjustment of global balance sheets but
cannot be driven low permanently by policy makers.
In order to limit any increase in funding costs that
may result from capital inadequacy (apparent or real),
banks themselves have a considerable appetite for
capital, and that will also start to crank up real rates
given a fixed pool of savings.
4.5 Implications
Long-term real rates are close to risk-free rates theor-
etically. But the heightened variance in ex ante and
ex post rates has altered the demand side of the mar-
ket for sovereign debt. On the demand side, investors
and market participants can no longer treat debt as
pure interest rate products, and so rates are variable
and also differentiated. Sovereign bonds have adopted
some characteristics of credit products, whose prices
reflect measures of borrowers’ default probabilities.
Many have lower liquidity than previously because
the investor base has become less diversified. During
phases of heightened risk aversion, many sovereign
bond rates do not benefit from any flight to quality.
Rather, they correlate with risky assets.
Credit rating agencies, by downgrading some sover-
eigns, have played a role in these dynamics. Although
central banks accept bonds as collateral in refinan cing
operations below certain thresholds, lower ratings
could trigger sizeable haircuts or, in other words, the
revaluation of bonds substantially below market values.
Of course, through expansionary monetary policy, cen-
tral banks have also generally provided considerable
15 WORLD REAL INTEREST RATES
DWS | GLOBAL FINANCIAL INSTITUTE
support to sovereign bond prices. Financial regulators
are free to assign a non-zero risk weight to certain sov-
ereign bonds under the standardised approach and
thus they are no longer risk-free. And even if some
bonds are still considered risk-free, it would appear
that the once-clear demarcation between fixed-income
and credit products has become permeable.
In the long run, these developments can impact on the
required return from bonds in important ways, but cer-
tainly may imply both a change in level and an increase
in price differentiation. One possibility then, is that
some capital on the margin may flow towards emer-
ging markets, which are then closer substitutes for
some advanced country sovereigns. To some extent
this will rebalance the capital flows, but the increase
in financial leverage, rising asset prices, and building
inflationary pressures in some of these emerging mar-
kets (EM) may imply challenges for financial stability.
The supply side of the sovereign debt market has also
changed, as debt managers in advanced economies
have started to use EM methods of risk mitigation. Con-
fronted with a trade-off between predictability and flexi-
bility, most choose flexibility. While retaining an open
dialogue with financial markets, they realise that annual
programmes have to offer sufficient flexibility to cope
with the challenges of issuing and managing larger
amounts of debt. Finally, debt managers are putting
a high premium on proactive and timely communica-
tion as well as on understanding the evolving nature of
investors.
16 WORLD REAL INTEREST RATES
DWS | GLOBAL FINANCIAL INSTITUTE
In a global financial market, long-term real interest
rates ought to converge to something close to the
steady-state growth of world consumption per head.
This would imply that the representative world con-
sumer would be indifferent on the margin between
consuming today or saving and consuming tomorrow
at a risk-free rate. We find that real rates have marched
downwards since the turn of the millennium, after a
long elevated period in the 1980s and 1990s. At face
value, this might imply that we expect a prolonged
period of low world consumption growth, as well as
an extended period of precautionary savings because
low rates are endogen ous to expected income growth
and its uncertainty.
Some of the fall in real rates, though, has been an
attempt by monetary policymakers to sustain levels of
demand in the advanced economies or, at least, smooth
the adjustment towards sustained lower growth rates.
The temporary reduction in the interest rate burden
should not be used as a signal to issue more public
debt, but rather treated as part of the adjustment path
of the global balance sheet. The recycling of global
(current account) surpluses through highly leveraged
financial institutions generated an asset price bubble
and led to unsustainable levels of collateralised lend-
ing that has left a considerable legacy of both public
and private debt. Low rates will, for a time, help the re-
financing of this debt overhang against a considerable
increase in market interest rates paid by risky (public
and private) borrowers.
We can, however, safely expect the return to sustained
positive real rates over the medium term when even
global growth returns. What we might need to see,
though, is the need to develop other safe instruments
to store value and provide liquidity in financial mar-
kets. Financial markets typically cannot provide suf-
ficient liquidity and tend to over and underprice risk
in busts and then booms. This means that we can go
from liquidity floods to droughts over the business
cycle. In the absence of sufficient marketable assets,
this induces both considerable variance in real rates
and volatility in asset prices. The global and financial
economic cycle will not only return slowly to normality
but, in the meantime, other safe savings vehicles must
be developed.
17
5 CONCLUDING REMARKS
WORLD REAL INTEREST RATES
DWS | GLOBAL FINANCIAL INSTITUTE18
References
[1] Breedon, Francis and Chadha, Jagjit S., 2003.
“Investigating Excess Returns from Nominal Bonds”,
Oxford Bulletin of Economics and Statistics, Depart-
ment of Economics, University of Oxford, vol. 65(1),
pages 73–90, February.
[2] Chadha, Jagjit S., Corrado, Luisa and Sun, Qi, 2010.
“Money and Liquidity Effects: Separating Demand from
Supply”, Journal of Economic Dynamics and Control,
Elsevier, vol. 34(9), pages 1732–1747, September.
[3] Chadha, Jagjit S. and Dimsdale, Nicholas H.,
1999. “A Long View of Real Rates”, Oxford Review of
Economic Policy, Oxford University Press, vol. 15(2),
pages 17–45, summer.
[4] European Commission Directorate-General for
Economic and Financial Affairs, 2009. Economic Crisis
in Europe: Causes, Consequences and Responses.
Special report.
[5] Turner, Philip, 2011. “Is the Long-Term Interest Rate
a Policy Variable, a Policy Victim or a Policy Lodestar”,
paper presented at CIMF conference at Clare College,
Cambridge.
[6] Obstfeld, Maurice and Taylor, Alan M., 2003. “Global-
ization and Capital Markets”, NBER chapters, in Bordo,
Michael D., Taylor, Alan M. and Williamson, Jeffrey G.,
eds., Globalization in Historical Perspective, pages 121–
188. National Bureau of Economic Research, Inc.
[7] International Monetary Fund. “Managing Sovereign
Debt and Debt Markets through a Crisis—Practical
Insights a Policy Lessons”, April 2011, Working Paper.
WORLD REAL INTEREST RATES

DISCLAIMER DWS | GLOBAL FINANCIAL INSTITUTE
DWS Investments is the global mutual fund business of the Asset Management division of Deutsche Bank Group, collectively
referred to as “Deutsche Bank”. In the US, DWS Investments is the brand name for the US retail asset management and
financial institutions group, a division of Deutsche Asset Management.
This material was prepared without regard to the specific objectives, financial situation or needs of any particular person who
may receive it. It is intended for informational purposes only and it is not intended that it be relied on to make any investment
decision. It does not constitute investment advice or a recommendation or an offer or solicitation and is not the basis for any
contract to purchase or sell any security or other instrument, or for Deutsche Bank AG and its affiliates to enter into or arrange
any type of transaction as a consequence of any information contained herein. Neither Deutsche Bank AG nor any of its
affiliates, gives any warranty as to the accuracy, reliability or completeness of information which is contained in this document.
Except insofar as liability under any statute cannot be excluded, no member of the Deutsche Bank Group, the Issuer or any
officer, employee or associate of them accepts any liability (whether arising in contract, in tort or negligence or otherwise) for
any error or omission in this document or for any resulting loss or damage whether direct, indirect, consequential or otherwise
suffered by the recipient of this document or any other person.
The opinions and views presented in this document are solely the views of the author and may differ from those of DWS
Investments and the other business units of Deutsche Bank. The views expressed in this document constitute Deutsche Bank AG
or its affiliates’ judgment at the time of issue and are subject to change. The value of shares/units and their derived income
may fall as well as rise. Past performance or any prediction or forecast is not indicative of future results.
Any forecasts provided herein are based upon our opinion of the market as at this date and are subject to change, dependent
on future changes in the market. Any prediction, projection or forecast on the economy, stock market, bond market or the
economic trends of the markets is not necessarily indicative of the future or likely performance. Investments are subject to
risks, including possible loss of principal amount invested.
Publication and distribution of this document may be subject to restrictions in certain jurisdictions.
© DWS Investments · February 2012
19
R-26147-1 (2/12)


