12
publication 7 / 2013 AUGUST 2013 residential Property MARKET OVERVIEW AND OUTLOOK
| Date post: | 07-Mar-2016 |
| Category: |
Documents |
| Upload: | future-estate |
| View: | 218 times |
| Download: | 2 times |
publication 7 / 2013
AUGUST 2013
residential Property MARKET OVERVIEW AND OUTLOOK
FUTURE ESTATE RESIDENTIAL PROPERTY MARKET UPDATE AUGUST 20132
Residential Market Update
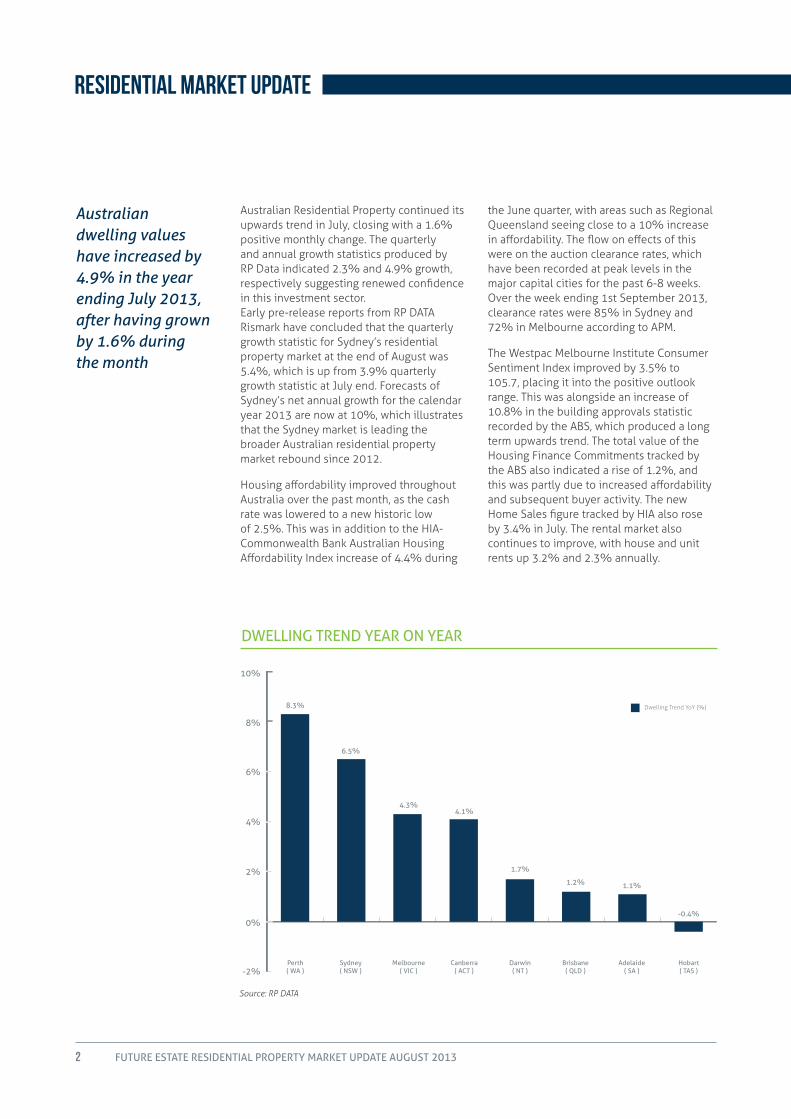
Australian Residential Property continued its upwards trend in July, closing with a 1.6% positive monthly change. The quarterly and annual growth statistics produced by RP Data indicated 2.3% and 4.9% growth, respectively suggesting renewed confidence in this investment sector. Early pre-release reports from RP DATA Rismark have concluded that the quarterly growth statistic for Sydney’s residential property market at the end of August was 5.4%, which is up from 3.9% quarterly growth statistic at July end. Forecasts of Sydney’s net annual growth for the calendar year 2013 are now at 10%, which illustrates that the Sydney market is leading the broader Australian residential property market rebound since 2012.
Housing affordability improved throughout Australia over the past month, as the cash rate was lowered to a new historic low of 2.5%. This was in addition to the HIA-Commonwealth Bank Australian Housing Affordability Index increase of 4.4% during
the June quarter, with areas such as Regional Queensland seeing close to a 10% increase in affordability. The flow on effects of this were on the auction clearance rates, which have been recorded at peak levels in the major capital cities for the past 6-8 weeks. Over the week ending 1st September 2013, clearance rates were 85% in Sydney and 72% in Melbourne according to APM.
The Westpac Melbourne Institute Consumer Sentiment Index improved by 3.5% to 105.7, placing it into the positive outlook range. This was alongside an increase of 10.8% in the building approvals statistic recorded by the ABS, which produced a long term upwards trend. The total value of the Housing Finance Commitments tracked by the ABS also indicated a rise of 1.2%, and this was partly due to increased affordability and subsequent buyer activity. The new Home Sales figure tracked by HIA also rose by 3.4% in July. The rental market also continues to improve, with house and unit rents up 3.2% and 2.3% annually.
Australian dwelling values have increased by 4.9% in the year ending July 2013, after having grown by 1.6% during the month
Source: RP DATA
8.3%
6.5%
4.3%4.1%
1.1%
-0.4%
1.2%
1.7%
Adelaide( SA )
Sydney( NSW )
Darwin( NT )
Perth( WA )
Canberra( ACT )
Melbourne( VIC )
Brisbane( QLD )
Hobart( TAS )
Dwelling Trend YoY (%)
-2%
0%
2%
4%
6%
8%
10%
Dwelling trenD year on year
FUTURE ESTATE RESIDENTIAL PROPERTY MARKET UPDATE AUGUST 2013 3
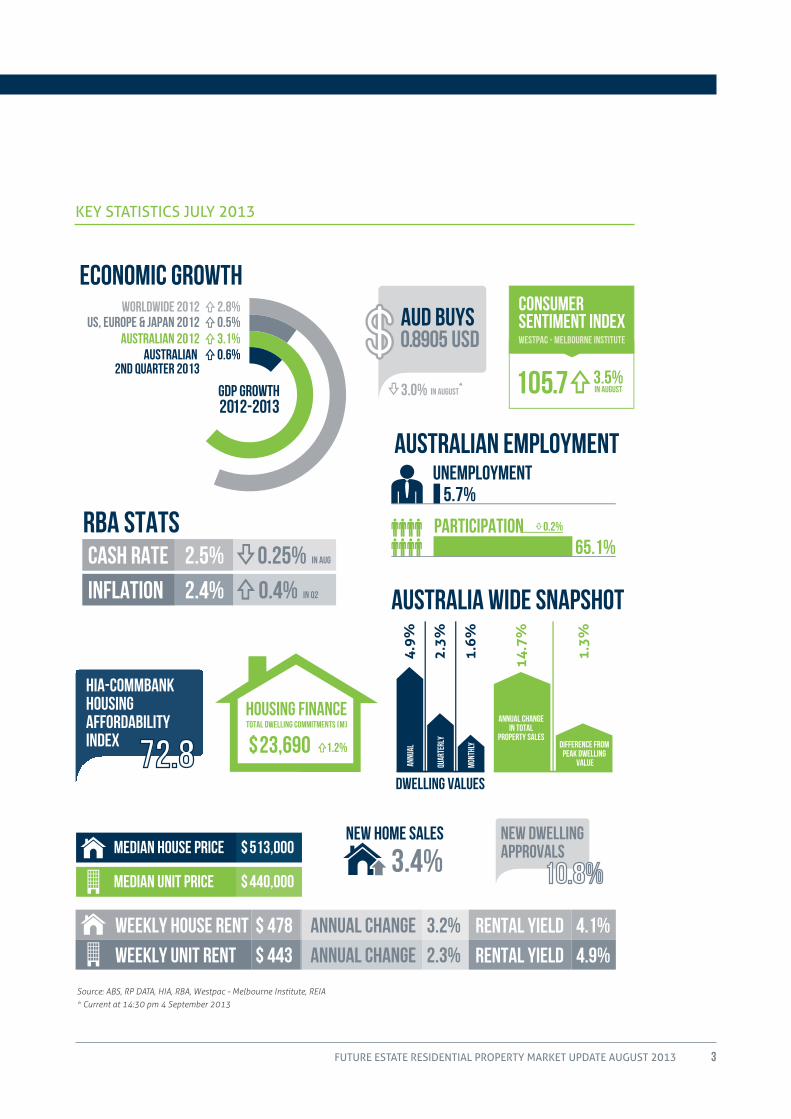
RBA STATS
ECONOMIC GROWTH
AUD BUYS0.8905 USD
3.0%
2.5% in Aug0.25%CASH RATE
in Q22.4% 0.4%INFLATION
105.7 3.5%in AUGust
Consumer Sentiment Index Westpac - Melbourne institute
WORLDWIDE 2012US, EUROPE & JAPAN 2012 0.5%
2.8%
3.1%0.6%
AUSTRALIAN 2012AUSTRALIAN
2ND quarter 2013
GDP growth2012-2013
Australian Employment
0.2%
UNEMPLOYMENT
PARTICIPATION
5.7%
65.1%
housing finance
$ 23,690total dwelling commitments (M)
1.2%
$ 513,000 Median House Price
$ 440,000 Median Unit Price
$ 478 Annual Change Weekly House Rent Rental Yield 4.1%3.2%
$ 443 2.3%Annual Change Weekly Unit Rent Rental Yield 4.9%
New Dwelling Approvals
10.8%
New Home Sales
3.4%
Australia wide snapshot1.
3%
14.7
%
annual CHANGEIN total
property salesDifference from
Peak Dwelling Value
Dwelling Values
4.9%
1.6%
2.3%
annu
al
mon
thly
quar
terl
y
in august
0.2%
HIA-COMMBANKHOUSINGAFFORDABILITYINDEX 72.8
*
Key statistics july 2013
Source: ABS, RP DATA, HIA, RBA, Westpac - Melbourne Institute, REIA* Current at 14:30 pm 4 September 2013
FUTURE ESTATE RESIDENTIAL PROPERTY MARKET UPDATE AUGUST 20134
Residential Market Update
STATE CAPITAL CITY
FUTURE ESTATE SCORE
OVERVIEW
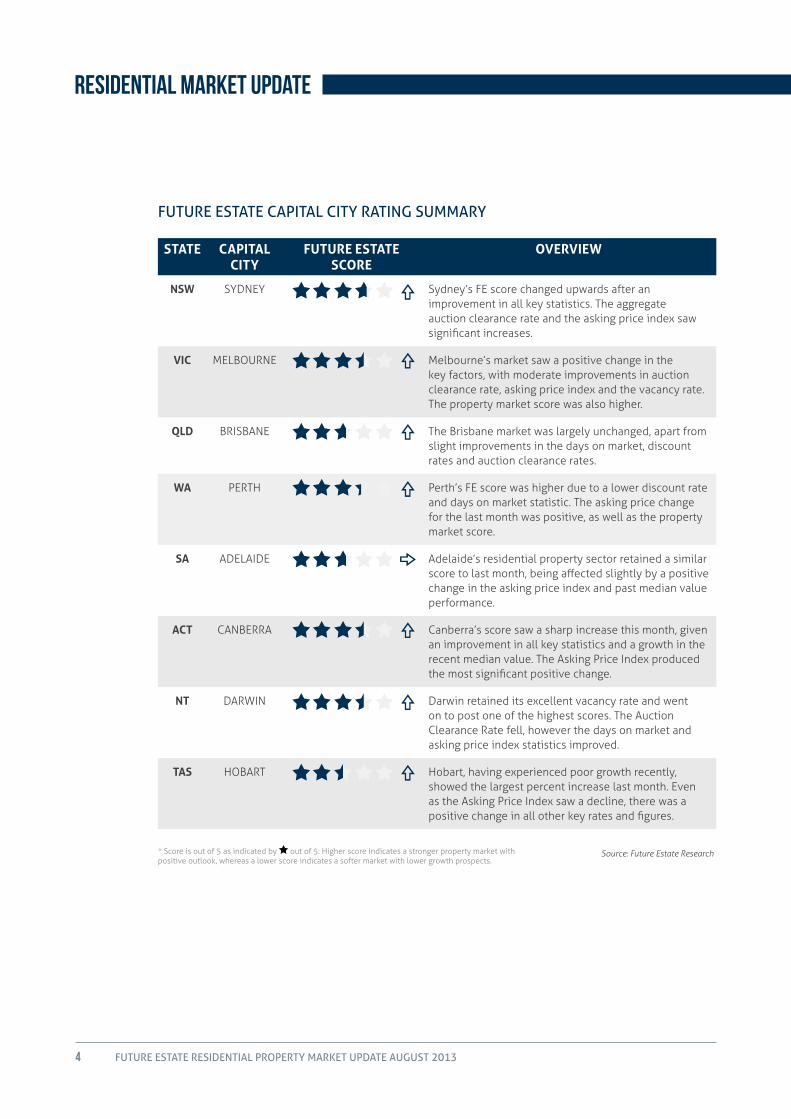
NSW SYDNEY Sydney’s FE score changed upwards after an improvement in all key statistics. The aggregate auction clearance rate and the asking price index saw significant increases.
VIC MELBOURNE Melbourne’s market saw a positive change in the key factors, with moderate improvements in auction clearance rate, asking price index and the vacancy rate. The property market score was also higher.
QLD BRISBANE The Brisbane market was largely unchanged, apart from slight improvements in the days on market, discount rates and auction clearance rates.
WA PERTH Perth’s FE score was higher due to a lower discount rate and days on market statistic. The asking price change for the last month was positive, as well as the property market score.
SA ADELAIDE Adelaide’s residential property sector retained a similar score to last month, being affected slightly by a positive change in the asking price index and past median value performance.
ACT CANBERRA Canberra’s score saw a sharp increase this month, given an improvement in all key statistics and a growth in the recent median value. The Asking Price Index produced the most significant positive change.
NT DARWIN Darwin retained its excellent vacancy rate and went on to post one of the highest scores. The Auction Clearance Rate fell, however the days on market and asking price index statistics improved.
TAS HOBART Hobart, having experienced poor growth recently, showed the largest percent increase last month. Even as the Asking Price Index saw a decline, there was a positive change in all other key rates and figures.
Future estate capital city rating summary
Source: Future Estate Research* Score is out of 5 as indicated by out of 5: Higher score indicates a stronger property market with positive outlook, whereas a lower score indicates a softer market with lower growth prospects.

FUTURE ESTATE RESIDENTIAL PROPERTY MARKET UPDATE AUGUST 2013 5
property marKet perFormance
Australian residential property prices continue to grow and the sector has seen continuing investor interest as of late, given the current standing of the Monetary Policy and positive consumer sentiment. Off the plan and established property sales have seen a sharp increase, with auction clearances also in excess of 80%, well above previous market benchmarks set in 2010. Anecdotally, some auctions have even closed with sale prices well in excess of reserves. There are several key reasons for such a market phenomenon.
The local residential property market, similar to other asset classes, is largely driven by both supply side and demand side effects as well as market sentiment. The supply side has especially been an area especially of concern in recent years, given the constraints on credit approval faced by property developers servicing the increasing demands of Australia’s population, which is growing at 1.8% p.a. The HIA-tracked Australian Performance of Construction Index, which measures building activity in Australia, has recorded that for the past 38 months consecutively, the construction sector has seen a consistent decline. ABS data further supports this news; its articles report the value of total construction work done fell 1.0% below trend in the June 2013 quarter. Therefore, an inherent undersupply exists in the market, which is having a significant impact in sustaining high dwelling median values of, for example, $645,000 in Sydney.
There are also demand side factors which have seen significant reasons to expand. With the cash rate currently set at an expansionary 2.5% by the RBA, housing affordability has greatly increased and subsequently led to increased demand for property. The HIA- Commbank Affordability index increased by 4.4% in the past quarter, and the Adelaide Bank/REIA Affordability report has stated that the proportion of household income now required to meet median mortgage repayments is at a decade low of just 28.7% nationwide (just 26% in Queensland, which subsequently had a 1.5% median
price growth in August). Moreover, with the Australian dollar falling in value, there has also been increased international demand. Overseas investors have more recently been interested in Australian luxury property: notable recent sales have been a $17m Hyde Park penthouse sold to a Chinese investor, and a $10.7m off the plan sale from the Barangaroo project released by Lend Lease.
All in all, the effect of this supply constraint and demand increase is a rise in median home values. The ABS has reported that between the 2012 and 2013 June quarters, Australian residential property prices increased by 5.1%, with Perth and Darwin having grown by 11% and 7.7% respectively. RP Data further reports that after an annual growth of 4.9%, the median house and unit prices in Australia are $513,000 and $440,000 respectively.
auction clearance rates
Auction clearance rates continued to be strong in July and August, with figures well above the levels seen during 2012. Sydney was recording a heightened level of buyer activity, with rapid off the plan sales off Tower Capitol in Bondi Junction and Barangaroo at Darling Harbour within hours of release. Luxury non-waterfront sales at record prices exceeding $30m were also recorded in the Eastern Suburbs. The national aggregate auction clearance rate, as recorded by APM, was 66%. RP Data recorded a monthly median value appreciation of 1.6%.
capital cities
Among the capital cities, the top increases were seen in Perth houses and Darwin units. Sydney and Canberra posted the highest aggregate monthly gains, rising by 2% and 2.5% respectively in the month of July. The year on year data showed Perth houses grew by 8.8%, closely followed by Sydney houses at 7.3% growth. This produced a net average return (including rent and capital gain) of 13.8% for Perth and 11.9% for Sydney. This was particularly interesting given reports of a decline in mining-related activity, which is the dominant industry in Western Australia.
The current property market is showing strength due to a combination of unique supply and demand factors.

FUTURE ESTATE RESIDENTIAL PROPERTY MARKET UPDATE AUGUST 20136
Residential Market Update
property auction clearance rates: july 2013
property auction clearance rates: weeK enDing 1st septemBer
72%70%
74%72%
Month Average Last July Weekend Total July Auctions
1303
1770
Sydney Melbourne
Source: Real Estate Institute of Victoria; Real Estate institute of NSW
July Property Auction Clearance Rates
0
10%
20%
30%
40%
50%
60%
70%
80%
0
500
1000
1500
2000
0
10
20
30
40
50
60
70
80
0
10
20
30
40
50
60
70
80
Auction Clearance Rates
Sydney Melbourne
75.2%69%
85%
72%
Australian Property Monitors RP Data REIV/REINSW*
79% 79%
0
10%
20%
30%
40%
50%
60%
70%
80%
Source: Real Estate Institute of Victoria; Real Estate Institute of NSW.
* REINSW’s latest auction clearance rates are for the week ending 28th July, 2013
APM recorded a weekly Auction Clearance Rate of 85% from 410 auctions in Sydney for the week ending 1st September 2013. This was one of the highest recorded clearance rates for this capital city.

FUTURE ESTATE RESIDENTIAL PROPERTY MARKET UPDATE AUGUST 2013 7
Source: RP DATA
4.6%
1.6%
2.8%
3.9%
3.0%
-1.8%
-6.2%
-2.8%
-7.0%
2.9%
1.2%
2.5%
-0.4%-0.3%-0.2%
1.5%
Melbourne( VIC )
Hobart( TAS )
Adelaide( SA )
Sydney( NSW )
Brisbane( QLD )
Canberra( ACT )
Darwin( NT )
Unit Price Trend Over Quarter (%)
House Price TrendOver Quarter (%)
-8%
-7%
-6%
-5%
-4%
-3%
3%
-2%
2%
1%
0
-1%
4%
5%
Perth( WA )
quarterly capital city house anD unit price trenD
Gross Rental Yields
1%
0
2%
3%
4%
5%
6%
7%
8%
Darwin( NT )
Hobart( TAS )
Brisbane( QLD )
Canberra( ACT )
Adelaide( SA )
Perth( WA )
Sydney( NSW )
Melbourne( VIC )
House GrossRental Yield (%)
Units GrossRental Yield (%)
6.2%
4.4% 4.1%
3.6%
5.2%5.4%
4.4% 4.4% 4.4%
4.9%
4.4%
5.0%4.8% 5.0%5.2%
6.0%
capital city house anD unit gross rental yielDs
Source: RP DATA

FUTURE ESTATE RESIDENTIAL PROPERTY MARKET UPDATE AUGUST 20138
Residential Market Update
KEY INVESTmENT ThEmES
Theme Summary Future Estate View Comments
Key growth opportunities
§ Sustainable above-market capital growth
§ Capital cities re-emerging § Darwin boom continues § Sydney offers resilient
performance in inner city and outer suburbs
§ Population growth and dwelling undersupply are long-term drivers
§ Affordability remains a key theme, subject to cash rate
§ Generally larger centres and capitals currently experiencing growth, with population inflow and slow dwelling completions
§ Housing affordability is currently high, with cash rate low and expected to drop further and unemployment higher than expectations
Key value opportunities
§ Significant discount to comparable properties, market analyst valuation
§ Distressed opportunities reducing due to market improvement
§ Adelaide and Hobart hardest hit of capitals in 2012, recovery emerging with high affordability
§ Value more at the suburb level, rather than city level and more particularly at the asset level
§ Distressed value without capital and income growth potential questionable – i.e. lifestyle / coastal
Defensive yield § Sustainable rental income, above market yield
§ Darwin, Brisbane and Perth have very high yields due to property undersupply
§ Regional centres (top 20 population) offer highest sustainable yield
§ Yield compression possible / likely in 2013 as housing recovery gains momentum, but subject only to growth in construction investment
§ Rental growth unlikely to exceed capital growth in the longer term
Source: RP DATA * Year to Date
CAPITAL CITY hOUSE AND UNIT mEDIAN PRICES
State Capital City median house Price ($)
median Unit Price ($)
Dwelling Trend YTD* (%)
New South Wales Sydney $ 645,000 $ 500,000 6.7%
Victoria Melbourne $ 530,000 $ 435,000 4.4%
Queensland Brisbane $ 460,000 $ 353,000 0.7%
South Australia Adelaide $ 395,000 $ 332,500 -0.8%
Western Australia Perth $ 510,000 $ 415,000 6.1%
Tasmania Hobart $ 315,300 $ 270,000 4.8%
Northern Territory Darwin $ 520,000 $ 457,500 1.6%
Australian Capital Territory Canberra $ 555,000 $ 409,975 4.7%

FUTURE ESTATE RESIDENTIAL PROPERTY MARKET UPDATE AUGUST 2013 9
KEY CYCLICAL ThEmES
Cyclical Outlook
Summary Future Estate View Comments
Global economy and policy
§ The global economic crises in the US and EU have eased off in 2013
§ Chinese growth is estimated to be 7.5% for 2013
§ US economy is growing at an estimated 2.5% p.a.
§ Indirect impact to residential property market via consumer confidence, access to credit and changes to price growth areas
§ No negative impacts currently, due to current RBA policies
§ Global negative impacts on local property markets are easing, given favourable exchange rate and local cash rate changes
§ Weaker AUD is leading to international investor interest
Domestic growth and policy
§ ABS recently released an above expectation GDP growth statistic for Q2 of the 2013 calendar year
§ Local economy being sustained by lower AUD; poised to grow if rates further decline, which is likely if US QE policy is relieved
§ Lowered cash rate and improved affordability is assisting in housing market growth
§ Unemployment, at 5.7% and a lower participation rate is having a mixed impact
§ Likely slight increase in unemployment, which combined with inflation rate on the lower end of the RBA- preferred range may lead to further interest rate cuts later into 2013 to another record low
Housing affordability
§ REIA reporting 28.5% (26% in QLD) of household income is spent on mortgage payments, lowest in decade
§ The median house price/income ratio is about 4.5, which is low compared to Asia & Europe
§ Lower interest rates have translated to strong auction clearance rates of over 80% in the major capital cities, areas with high employment
§ Affordable inner city suburbs are experiencing growth
§ Increasing house prices likely to be off-set by lower interest rates
§ Historic low interest rates and new home buyer grants stimulating owner occupier property demand; investors noticing high growth areas
Population growth
§ Population growth was recorded at 1.8% over the year in 2012
§ 394,200 persons annual increase in period ending December 2012
§ WA recorded highest growth: 3.5%
§ Population recently reached 23M
§ Population growth expected to rise in 2013, driven mainly by overseas skilled migration
§ Migration to Australia concentrated in capital cities of NSW, VIC and WA, which has resulted in home value growth
§ Impact on housing demand /supply imbalance substantial – housing shortage from reduced construction activity and investment
§ QLD and WA major interstate beneficiaries, while VIC grows through international migration
Dwelling construction
§ Below-trend dwelling development continues
§ 38th consecutive month of declining construction activity, as reported by HIA
§ House approvals have seen a decline as of late, with construction and completions remaining poor
§ New Home Sales are increasing
§ 25,000 fewer homes built in 2013 compared to a decade ago
§ Construction has fallen since 2010 given credit crunch – rental growth and yield has been high as a result
Consumer confidence
§ Consumer confidence emerging, with stronger market fundamentals
§ Investor confidence substantially improved from lows in 2012
§ Over 50% of investors expect house prices to rise in 2013 as compared to 8% who expect a fall
§ RP Data is reporting 250 suburbs around Australia tipped to double property values in 10 years
§ HIA reports hotspots are emerging
Household savings / demand for credit
§ Household savings ratio remains elevated at ~10% of income – back to 1908’s levels
§ Demand for housing credit still comparatively low
§ With confidence emerging, it is anticipated that demand for housing credit will emerge, especially given substantial buffer to mortgage repayments after recent savings
§ Demand for housing credit is still increasing, albeit it at very low levels
§ Investor credit demand is leading owner-occupier demand
FUTURE ESTATE RESIDENTIAL PROPERTY MARKET UPDATE AUGUST 201310
Residential Market Update
BRISBANE
DARWIN
Future Estate Capital City Rating
PERTH
3.56Future Estate Capital City Rating
3.15
State Auction Clearance RateState Days on Market (days) State Discount RateAsking Price Index ChangeCity Vacancy RateState Property Market Score*
State Auction Clearance RateState Days on Market (days) State Discount RateAsking Price Index ChangeCity Vacancy RateState Property Market Score*
State Auction Clearance RateState Days on Market (days) State Discount RateAsking Price Index ChangeCity Vacancy RateState Property Market Score*
State Auction Clearance RateState Days on Market (days) State Discount RateAsking Price Index ChangeCity Vacancy RateState Property Market Score*
33.5%1558.7%1.1%2.1%2.4
70%1425.1%0.4%0.8%2.85
33%1076.1%0.7%1.6%3.60
SYDNEY
State Auction Clearance RateState Days on Market (days) State Discount RateAsking Price Index ChangeCity Vacancy RateState Property Market Score*
CANBERRA
State Auction Clearance RateState Days on Market (days) State Discount RateAsking Price Index ChangeCity Vacancy RateState Property Market Score*
HOBART
State Auction Clearance RateState Days on Market (days) State Discount RateAsking Price Index ChangeCity Vacancy RateState Property Market Score*
MELBOURNE
State Auction Clearance RateState Days on Market (days) State Discount RateAsking Price Index ChangeCity Vacancy RateState Property Market Score*
ADELAIDE
62%1106.5%1.7%1.8%4.25
Future Estate Capital City Rating
3.76
44%875.1%1.7%1.9%3.0
Future Estate Capital City Rating
Future Estate Capital City RatingFuture Estate Capital City RatingFuture Estate Capital City Rating
3.45
61%1137.5%0.6%2.7%4.05
3.41
32%19110.5%-1.2%2.2%3.3
2.48
43%1607.8%0.5%1.6%1.95
2.74
DARWIN
BRISBANE
SYDNEY
CANBERRA
HOBART
MELBOURNE
ADELAIDE
PERTH
NSW
ACT
QLD
NT
SA
WA
VIC
TAS
Future Estate Capital City Rating
2.85
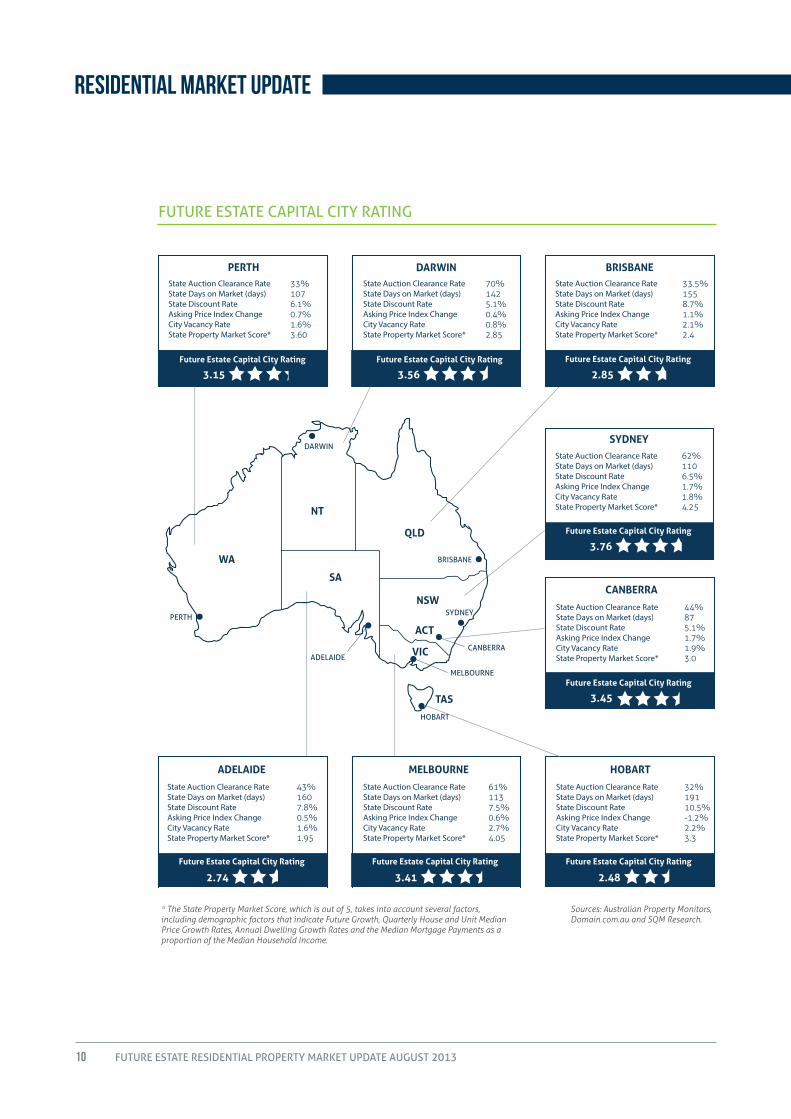
* The State Property Market Score, which is out of 5, takes into account several factors, including demographic factors that indicate Future Growth, Quarterly House and Unit Median Price Growth Rates, Annual Dwelling Growth Rates and the Median Mortgage Payments as a proportion of the Median Household Income.
Sources: Australian Property Monitors, Domain.com.au and SQM Research.
Future estate capital city rating


FUTURE ESTATE RESIDENTIAL PROPERTY MARKET UPDATE AUGUST 201312
This document contains general information and does not contain personal advice or financial product advice. This information has been prepared without taking account of your objectives, financial situation or needs. Accordingly, before acting on this information and making financial decisions, you should consider whether this information is appropriate for you and are recommended to seek independent financial, investment, tax and/or legal advice having regard to your own objectives, financial situation and needs. This information may contain material provided to Future Estate Group Pty Ltd by third parties. While such material is published with necessary permission, Future Estate Group Pty Ltd and its related entities accept no responsibility for the accuracy or completeness of this information, nor endorses it. To the maximum extent permitted by law, Future Estate Group Pty and its related entities disclaim all liability for any loss, costs or damage which arises in connection with the use or reliance on the information and material contained in this document. Any forward looking statements and estimates are provided as a general guide only and should not be relied upon as an indication or guarantee of future performance. Furthermore, past performance is not a true indicator of future performance. Any past performance information in this document has been given for illustrative purposes only and should not be relied upon as an indication of future performance.
1300 future (388 873)
www.futureestate.com.au
@futureestate
future.estate
future estate
Copyright © Future Estate Group Pty Ltd 2013
please contact our team at Future estate for more information on our methodology and/or our range of other property investment advisory services.
Future estate’s research team has developed an extensive quantitative modelling process to critically assess the australian residential property market. For the capital city rating, our team records, benchmarks, assigns weights to and scores various key property market lead indicators and descriptive statistics.
our services include:
§ Buyers’ agency
§ research – suburb reports and due-diligence markets
§ personalised advice and investment strategy
§ panel of “endorsed projects”- over $1bn portfolio of “investment grade” projects nationally
§ contact us to arrange a complimentary consultation to discuss your needs


![Ananda Vikadan 08-05-2013 [Www.freedomusertech.blogspot.com]](https://static.documents.pub/doc/80x56/577cc5361a28aba7119baf01/ananda-vikadan-08-05-2013-wwwfreedomusertechblogspotcom.jpg)


