Public Agency Risk Sharing Authority of California 13 ANNUAL REPORT 2013 PARSAC: JPA of Choice Fiscal Year: 2012-13 Included: Audited Financial Statements Common Purpose Unique Individuals Diverse Needs 25 years Statewide Municipal Risk Management
Transcript
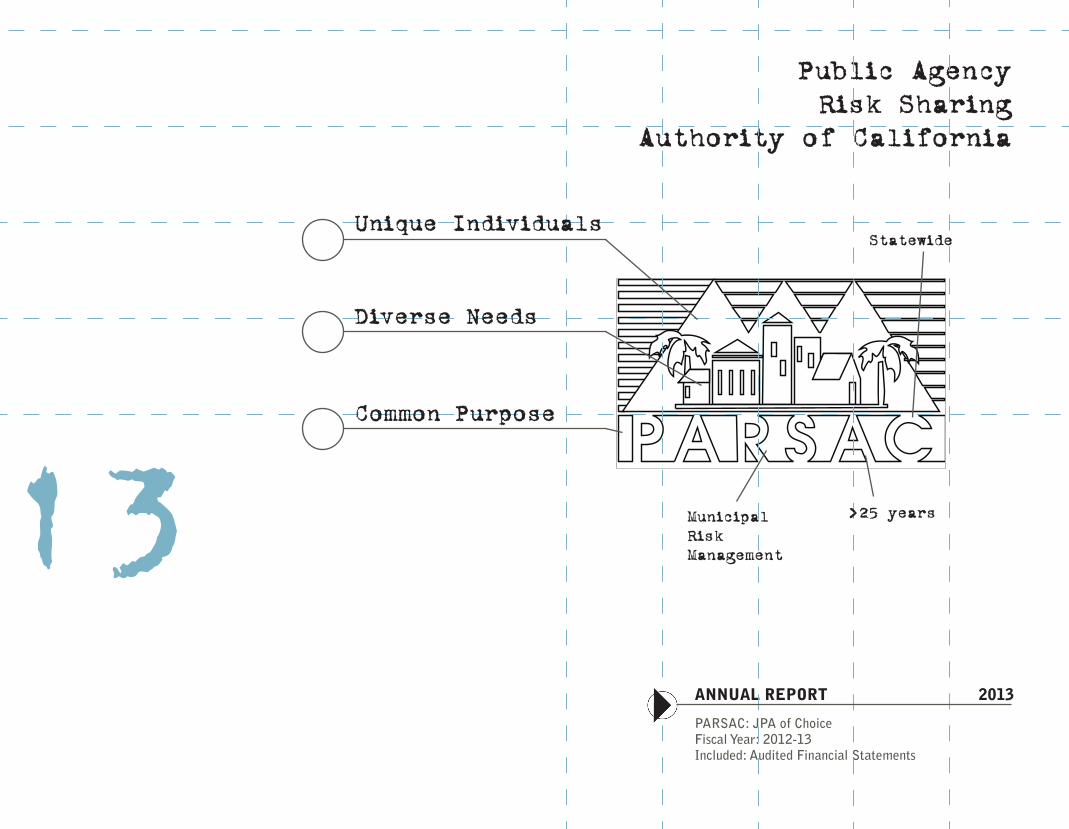
Public Agency Risk Sharing
Authority of California
Accredited with ExcellenceSince 1996
2013ANNUAL REPORT 2013
PARSAC: JPA of ChoiceFiscal Year: 2012-13Included: Audited Financial Statements
Common Purpose
Unique Individuals
Diverse Needs
25 years
Statewide
MunicipalRiskManagement
Please feel free to contact us for additional information.
Public Agency Risk Sharing Authority of California1525 Response Road, Suite 1Sacramento, California 95815(800) 400-2642 • www.parsac.org
Pub
lic A
genc
y R
isk
Sha
ring
A
utho
rity
of
Cal
iforn
ia
203
PUBLIC
AG
ENC
Y R
ISK
SHARING AUTHORITY O
F CA
LIFO
RNIA
MAY 211986
I am pleased to present the annual report for the Public Agency Risk Sharing Authority of California (PARSAC) for fiscal year 2012-2013. PARSAC has demonstrated its ongoing ability to weather the economic storm created by the recent recession and the pool remains fiscally healthy and committed to continuing our mission. That mission is to provide quality protection at a reasonable cost to members by maintaining a financially stable risk sharing pool. To meet the mission, not only do we work diligently to provide quality programs that protect members from unexpected loss and sustain the resources entrusted to us, but we also strive to provide innovative and creative solutions to manage risk for all of our members.
While President Kennedy was certainly unaware of his future, he was very well aware of the requirement to address the future by embracing change in the present. The ability to plan for the future and adapt, as necessary, is the sustainability element in the blueprint of public entities. You will note the blueprint theme in this report. Why a blueprint? A blueprint represents a document containing all the necessary information to create a product. For PARSAC, the blueprint includes the programs we provide, the strategies we implement, the incredible staff we employ and the agencies we serve. That blueprint results in a product that is unmatched and enables PARSAC to remain the JPA of choice.
The decisions we make today play a substantial role relative to the amenities our citizens will enjoy in the years to come. PARSAC doesn’t take these decisions lightly. That is why we continually evaluate our programs, funding formulae, and strategies to ensure the success of each. Sometimes a program is evaluated and determined not broken; other times a program is evaluated and it is determined that a change is necessary. The key is to remain committed to continual evaluation and improvement of our products, as appropriate.
We endeavor to provide members with resources to make their communities safer for work and play in the long-term. Our philosophy is to persevere to secure programs that best fit the needs of our members. We look forward to the challenges and opportunities of a post-recession environment. Some key areas of focus for the upcoming year will include new training programs delivered in a variety of methods, revised risk assessment programs, and alternative risk financing solutions. We will continue to assist members in managing their risks with funds available through the Safety & Loss Control Grant Program and will embark upon an assessment of PARSAC’s competitive position in the marketplace.
It continues to be my pleasure to serve as your Board President. I would like to thank my fellow Officers and the Board of Directors for their dedication and commitment to the organization and General Manager Joanne Rennie and her incredible staff for a job well done.
PR
ES
IDE
NT
'S M
ES
SA
GE
Gre
g Fr
ankl
in, P
resi
dent
City
of
Yuc
aipa
"Change is the law of
life and those who look only
to the past or present are certain
to miss the future." John F. Kennedy
2
A risk sharing pool performs many functions for its members. It provides financing, claims administration, loss control, training and consulting services. However, a pool’s primary purpose is to protect its members against adverse losses. As a PARSAC member, you want assurance that the organization has the financial capacity to pay claims and mitigate damages in the event of liability and provide a strong defense where no liability exists.
As an organization, PARSAC regards itself as a fiduciary of the taxpayer trust. We are a strong, stable, and responsive organization that has weathered the worst of the recession and emerged resilient, renewed, and building for an even better future. After several years of cautious optimism, we returned dividends in the both the liability and workers’ compensation programs while reducing the discount factor to more closely align with the interest income being earned. Rate stabilization was introduced in both self-funded programs to offset the impact of rate increases.
Our commitment to excellence and to delivering quality, customized services has yielded 26 best practice templates, transition to a new third party administrator for workers’ compensation claims, and an educational brochure designed to help injured workers’ navigate the comp system while recognizing their role in their recovery. Staff provided assistance to members, whose staff resources were limited, by reviewing contracts, assisting with specific projects, and working to develop service capacity through shared service arrangements.
Continuous improvement has been a hallmark of PARSAC for more than a quarter of a century; this year was no different. Active subcommittees reviewed allocation formulas, analyzed the impact of self-insured retentions on rates, and explored options to reduce costs for excess coverage. They also embraced the PARSAC Safety & Loss Control Grant Program, which has enabled many members to purchase equipment or provide training for which there would have been no other funding source.
No successful organization rests on its accomplishments. Over the next few months we will begin the process of dissecting the “Essential PARSAC” to ensure we deliver cost effective coverage in a manner that is most valued by our members. None of this could be accomplished without the leadership, dedication and support of our Board of Directors, Executive Committee, and subcommittees. We are grateful for your selfless commitment to ensuring PARSAC’s longevity and success.
3
Pub
lic A
genc
y R
isk
Sha
ring
A
utho
rity
of
Cal
iforn
ia
203
PARSAC provides members with a fiscally stable Liability Program funded at the 85% confidence level. The Program is self-funded for the first $1 million and an additional $34 million of excess coverage is provided through a combination of pooling, excess insurance, and reinsurance. Employment Practices Liability (EPL) coverage limit is $35 million through the liability program’s excess coverage with the first $1 million provided by the Employment Risk Management Association (ERMA).
The pool funding rate for 2012-13 increased from $1.11 to $1.18 due to unfavorable loss development. A portion of the Rate Stabilization Fund was distributed to members to offset some of this rate increase. The Program remains well funded above the 90% confidence level; surplus was nearly $8.5 million at expected.
PARSAC believes in proactive claims management. Members are encouraged to contact PARSAC for assistance with incidents before they become claims, which can reduce the cost of the claim. Cases are assigned to Defense Panel Counsel according to specialty to produce the best outcome while ensuring cost control.
PARSAC proactively m a n a g e s c l a i m s t h r o u g h t i m e l y investigation, early liability analysis, and prompt resolution when appropriate.
PARSAC’s Workers’ Compensation Program began in 1990. The Program delivers timely medical care and benefits to employees while providing members with affordable, financially stable coverage. PARSAC provides quality care through a dedicated claims unit, nurse advocate, expedited specialist referral, and access to selected Centers of Excellence facilities. Our proactive approach helps members to preserve positive relationships with their employees.
PARSAC self-funds the first $500,000 with statutory limits provided through a combination of pooling, reinsurance, and excess insurance. The philosophy of fiscal stability continues in this Program, which is funded at the 75% confidence level.
The pool loss funding rate for 2012-13 increased from $3.39 to $3.72 due to a combination of increasing claims and a reduction in the discount factor from 4% to 3% to better reflect investment earnings. The Board approved a one-time distribution of member equity to help minimize the impact of the increase. The Program remains well funded above the 90% confidence level; surplus of $10.9 million at expected.
Excess InsuranceNational Union Fire Insurance Co. (AIG)
ReinsuranceAce American Insurance Co.
LAWCXExcess Workers’ Compensation Pool
PARSACSelf-Funded Pool
MEMBERSelf-Insured Retention Options
$50M
$5M
$
$$50M$50M
$0$5k$10k$25k$50k
$100k$150k$250k$350k
TOTA
L CO
VERA
GE:
STA
TUTO
RY L
IMIT
S
Coverage limit defined by law
“First Dollar”
Coverage
Our guiding values include a committment to build and maintain positive relationships
through open communication, mutual respect, and trust.
Public Agency Risk Sharing Authority of California
Added Value Services
Consultation:
Litigation ManagementProactive Incident and Claim ResolutionRepresentation at Mediation and Settlement ConferencesPreserving Governmental ImmunitiesSpecialist and Resource ReferralsLegislative and Regulatory ComplianceContractual Risk Transfer
Risk Management:
Safety & Loss Control Grant ProgramOn-Site Risk AssessmentsPost-incident Assistance and MitigationOperational Best Practices Policy TemplatesLexipol Policies and Daily Training for Law Enforcement & Fire
Training:
Video and Print Resource LibrariesRegional and On-Site Training ProgramsPersonalized Risk Management TrainingWeb-based OSHA compliant Safety CoursesWeb-based Employment Practices Courses
Group Purchased Programs
PEPIP Property Coverage: All-risk, replacement cost coverage with limits up to $1 billion for all insurable property and autos. Additional benefits include boiler and machinery up to $100 million; new property acquisitions up to $25 million; and new autos up to $10 million. Optional coverages include course of construction, earthquake, and flood damage.
Special Events: Protects the member from liability by providing facility users with cost-effective insurance up to a $5 million limit per occurrence. Participating members receive up to a $1,000 credit toward their Liability premium.
Bond Program: Up to $1 million per occurrence with a $2,500 deductible for Public Employee Dishonesty; Forgery or Alteration; Theft, Disappearance and Destruction; and Computer Fraud.
Ancillary Benefits: Optional employee health benefits such as dental, vision, life, accidental death & dismemberment, and disability coverage at competitive prices.
Betty Jo Garcia
John Berchtold
Adrienne Nielsen
Tom Weil
Heather MacDonellKen Barnes
Joyce DavidsonAaron Brusatori
Kim SzczurekChrissy Earnhardt
Mercedes Garcia
Jay ParrishDeb Austrus
Mario MaldonadoNathalie Manning
Trish PaetzRoger Grimsley
Randy AnstineJames Hyatt
Terri WilloughbyRobert Johnson
Cathy KrysynaThomas Frutchey
Cleve MorrisDave Warren
Gloria StoddardJeff Gardner
Hunter Alexander
Troy ButzlaffSteve Pischel
Paul BoyerMark Taylor
Gabe Adams
Karen Suiker
MODOC
LAKE
NE
VAD
A
Janet EmmettMichelle Beckwith
Greg FranklinRay Casey
Bob CashmanGary Nordquist
Debra Breidenbach-SterlingMark Nuaimi
Donna VickersPaula Mohan
SANTACRUZ
SANBENITO
KERN SAN BERNARDINO
ORANGE
RIVERSIDE
L.A.
Sam RacadioChuck Dantuono
Ron PeckRichard Warne
John GillisonChris Paxton
Ronda RiveraAmy Van
Steve WrightRex Miller
Dan HollerRoberta Raper
Catrina OlsonDavid Brennan
N
Executive Committee Members
Carolyn Steffan
Betty Celano
Melissa SwansonJoan Phillipe
Richard SpitlerGloria Leon
Steve RogersKathleen Bradbury
Pub
lic A
genc
y R
isk
Sha
ring
A
utho
rity
of
Cal
iforn
ia
203
The Board’s conservative fiscal policy is borne out by the organization’s investment program. The State Code provides an expansive list of investment classes; however, the Board consciously limits PARSAC’s Investment Policy to a few select investment categories, including: U.S. Treasuries; Federal Agencies; Bankers Acceptance; Commercial Paper; Time Certificates of Deposits; Passbook Savings; Money Market Funds; and Local Agency Investment Fund (LAIF). The list remained relatively unchanged until 2011 when municipal securities were added to increase PARSAC’s investment options, providing prudent diversification and yield.
During the 2012-2013 year, our investment advisors at PFM Asset Management (PFM) informed the Finance Subcommittee that the Treasury had accelerated the plan to wind-down the Federal Home Loan Mortgage Corporation (FHLMC) and the Federal National Mortgage Association (FNMA) portfolios, which are the largest issuers of Federal Agency debt. The reduction of the Agencies’ retained portfolios would limit the supply of these Federal Agency notes in the near future. As an attractive option, PFM recommended PARSAC add high quality, Medium-Term Corporate Notes to its Investment Policy. The Board approved the additional investment category on a limited basis. For more information on Medium Term Corporate Notes and the policy limits, see the attached Management's Discussion and Analysis (page 15).
As illustrated in the chart, PARSAC’s portfolio currently consists of high credit quality instruments: Federal Agency (FHLB, FHLMC, FNMA) and U. S. Treasury Notes. Both are AA-rated and carry the explicit and implicit backing of the full faith and credit of the federal government. Also included are AAA-rated municipal securities and LAIF, which is an unrated investment pool managed by the California State Treasurer’s office. PARSAC’s portfolio is just under $31 million with average investment earnings declining to under 0.75% on a cost basis.
While returns continue to decline, we look for opportunities to prudently extend the portfolio’s duration and to increase the yield within Policy parameters. With the addition of high quality corporate notes, PARSAC continues its conservative investment tradition of safeguarding PARSAC’s assets while striving to enhance the future yield on the portfolio.
Ron
da R
iver
a, T
reas
urer
City
of
Citr
us H
eigh
ts
TR
EA
SU
RE
R'S
RE
PO
RT
USTN, 41%
FNMA, 26%
FHLMC, 15%
LAIF, 11%
FHLB, 4%
Muni Obligation, 4%
0%
10%
20%
30%
40%
50%
60%
70%
80%
90%
100%
PARSAC's Investment Portfolioas of June 30, 2013
Financial Statementswith Supplementary Information for the years ended
JUNE 30, 2013 AND 2012
including Independent Auditor's Report
0
Board of DirectorsPublic Agency Risk Sharing Authority of CaliforniaSacramento, California
We have audited the accompanying financial statements of the Public Agency Risk Sharing Authority of California (PARSAC) as of and for the years ended June 30, 2013 and 2012, and the related notes to the financial statements, which collectively comprise PARSAC’s basic financial statements as listed in the table of contents.
Management’s Responsibility for the Financial Statements
Management is responsible for the preparation and fair presentation of these financial statements in accordance with accounting principles generally accepted in the United States of America; this includes the design, implementation, and maintenance of internal control relevant to the preparation and fair presentation of financial statements that are free from material misstatement, whether due to fraud or error.
Auditor’s Responsibility
Our responsibility is to express an opinion on these financial statements based on our audit. We conducted our audit in accordance with auditing standards generally accepted in the United States of America, the standards applicable to financial audits contained in Government Auditing Standards, issued by the Comptroller General of the United States and the State Controller’s Minimum Audit Requirements for California Special Districts. Those standards require that we plan and perform the audit to obtain reasonable assurance about whether the financial statements are free from material misstatement.
An audit involves performing procedures to obtain audit evidence about the amounts and disclosures in the financial statements. The procedures selected depend on the auditor’s judgment, including the assessment of the risk of material misstatement of the financial statements, whether due to fraud or error. In making those risk assessments, the auditor considers internal control relevant to PARSAC’s preparation and fair presentation of the financial statements in order to design audit procedures that are appropriate in the circumstances, but not for the purpose of expressing an opinion on the effectiveness of PARSAC’s internal control. Accordingly, we express no such opinion. An audit
also includes evaluating the appropriateness of accounting policies used and the reasonableness of significant accounting estimates made by management, as well as evaluating the overall presentation of the financial statements.
We believe that the audit evidence we have obtained is sufficient and appropriate to provide a basis for our audit opinion.
Opinion
In our opinion, the financial statements referred to above present fairly, in all material respects, the respective financial position of PARSAC as of June 30, 2013 and 2012, and the respective changes in financial position and cash flows for the years then ended in accordance with accounting principles generally accepted in the United States of America, as well as accounting systems prescribed by the State Controller’s office and state regulations governing special districts.
Other Matters
Required Supplementary Information
Accounting principles generally accepted in the United States of America require that the management’s discussion and analysis and claims development information on pages 12 through 17 and 35 through 37 be presented to supplement the basic financial statements. Such information, although not a part of the basic financial statements, is required by the Governmental Accounting Standards Board, who considers it to be an essential part of financial reporting for placing the basic financial statements in an appropriate operational, economic, or historical context. We have applied certain limited procedures to the required supplementary information in accordance with auditing standards generally accepted in the United States of America, which consisted of inquiries of management about the methods of preparing the information and comparing the information for consistency with management’s response to our inquiries, the basic financial statements, and other knowledge we obtained during our audit of the basic financial statements. We do not express an opinion or provide any assurance on the information because the limited procedures do not provide us with sufficient evidence to express an opinion or provide any assurance.
Pub
lic A
genc
y R
isk
Sha
ring
A
utho
rity
of
Cal
iforn
ia
203
IND
EP
EN
DE
NT
AU
DIT
OR'S
RE
POR
T -
Oct
ober
29,
201
3
Other Information
Our audit was conducted for the purpose of forming an opinion on the financial statements that collectively comprise PARSAC’s basic financial statements. The combining statements are presented for purposes of additional analysis and are not a required part of the basic financial statements.
The combining statements are the responsibility of management and were derived from and relate directly to the underlying accounting and other records used to prepare the basic financial statements. Such information has been subjected to the auditing procedures applied in the audit of the basic financial statements and certain additional procedures, including comparing and reconciling such information directly to the underlying accounting and other records used to prepare the basic financial statements or to the basic financial statements themselves, and other additional procedures in accordance with auditing standards generally accepted in the United States of America. In our opinion, the combining statements are fairly stated in all material respects in relation to the basic financial statements as a whole.
Other Reporting Required by Government Auditing Standards
In accordance with Government Auditing Standards, we have also issued our report dated October 29, 2013 on our consideration of PARSAC’s internal control over financial reporting and on our tests of its compliance with certain provisions of laws, regulations and contracts and other matters. The purpose of that report is to describe the scope of our testing of internal control over financial reporting and compliance and the results of that testing, and not to provide an opinion on internal control over financial reporting or on compliance. That report is an integral part of an audit performed in accordance with Government Auditing Standards in considering PARSAC’s internal control over financial reporting and compliance.
2
The management of the Public Agency Risk Sharing Authority of California (PARSAC) is pleased to present the following discussion and analysis of the financial performance for the fiscal year ended June 30, 2013. It is provided in order to enhance the information included in the following financial report.
Formed in May 1986, the Public Agency Risk Sharing Authority of California, formerly the California Municipal Insurance Authority (CMIA), is a state-wide joint powers authority. It provides both self-insured and group purchase coverage to 35 municipalities throughout California. PARSAC operates self-insured programs for liability and workers’ compensation, and offers insured programs for property, boiler and machinery, fidelity bonds, special events and employee benefits. Additionally, PARSAC provides claims administration, loss control and training for members. PARSAC has invested in a building in Sacramento that houses its administrative office and a conference center that is available for meetings and training.
The Authority is governed by a Board of Directors comprised of representatives from each member agency. The Board of Directors elects its officers: President, Vice President, Treasurer, and Auditor/Controller.
The daily operations are administered by the General Manager who serves as the chief executive officer. The General Manager is responsible for the administration of the policies as set forth by the Authority’s organizational documents and the Board of Directors.
FINANCIAL HIGHLIGHTS• The Board approved funding at the 85% and 75% confidence levels, and
reduced the discount factors to 1.5% and 2.5% in the Liability and Workers’ Compensation Programs.
• Retrospective Premium Adjustments (RPA) were declared in both programs, $1,029,144 in the Liability Program for members participating in the 1999/00 to 2007/08 program years; $567,583 in the Workers’ Compensation Program for members participating in the 1990/91 to 2004/05 program years.
• The Grant Program continued for a second year, reimbursing members up to $8,151 for loss control services, equipment and training.
• A $612,305 dividend was received from the ERMA JPA, an excess employment practices liability pool, for participation in the 2002/03 to 2007/08 program years.
OVERVIEW OF THE FINANCIAL STATEMENTS
The Authority operates as an enterprise fund applying the accrual basis of accounting. Individual program accounting is maintained in-house and is provided as supplemental information to the financial statements. The Statement of Net Position provides information about the combined financial position of PARSAC as of June 30, 2013 and 2012. The Statement of Revenues, Expenses, and Changes in Net Position reports the results of operations. The Statement of Cash Flows is presented to reflect the operations of PARSAC based strictly on the inflow and outflow of cash. The Notes to the Financial Statements provide information on unique accounting policies of the Authority, such as development of claims liabilities, and retrospective premium adjustments.
General Administrative Expense 1,242,911 1,202,806 1,142,634
Total Operating Expenses 8,535,891 10,684,235 11,564,712
Operating Income (Loss) 1,459,257 (301,728) (1,167,725)
Non-Operating Income and (Expense):
Investment Income 47,272 409,857 456,055
Rental Expense (49,848) (51,695) (99,364)
Gain on Sale 0 0 10,500
Total Non-Operating Income (Expense) (2,576) 358,162 367,191
Income (Loss) Before Equity Distribution 1,456,681 56,434 (800,534)
Equity Distribution (177,342) (224,956) 0
Change in Net Position 1,279,339 (168,522) (800,534)
Net Position, Beginning of Year 20,730,305 20,898,827 21,699,361
Net Position, End of Year $22,009,644 $20,730,305 $20,898,827
CONDENSED FINANCIAL INFORMATION
Statement of Revenues, Expenses, and Changes in Net
Position
Pub
lic A
genc
y R
isk
Sha
ring
A
utho
rity
of
Cal
iforn
ia
203
ANALYSIS OF OVERALL FINANCIAL POSITIONPARSAC continues to be financially stable with total assets decreasing by 2% while net position (formerly net assets) increased by 6%. The net position of the Liability Program increased by $2.2 million due to a decrease in claims reserves, and the Workers’ Compensation Program net position decreased by $924,000 due to increasing excess insurance, claims reserves and the issuance of a Retrospective Premium Adjustment (RPA).
The Authority’s $31 million investment portfolio is overseen by an investment advisor, PFM Asset Management, LLC and securities are held in a custodial account with Union Bank. The actively managed portfolio consists of fixed income and municipal securities in accordance with the Authority’s investment policy and the California Government Code. In May 2013, the Board voted to add a new investment category, Medium-Term Corporate Notes, to the Investment Policy. The new category was limited to 15% of securities rated AA or better. Funds not immediately needed for the payment of claims and administrative expenses are maintained in the State of California Local Agency Investment Fund (LAIF), which is administered by the State Treasurer’s Office. At June 30, 2013, the LAIF balance was approximately $3.9 million.
Figure 2 illustrates the portfolio’s change in maturity distribution from the prior year. The portfolio duration continues to be extended into the four to five year range to maximize yield. The ability to earn investment income has a direct impact on program rates, as this income is used to discount funding and future liabilities. When investments fall short of projections, additional funding may be required to meet actuarial estimates. The Authority takes interest rate conditions into consideration when developing annual premium contributions.
Man
agem
ent'
s D
iscu
ssio
n &
Ana
lysi
sJu
ne 3
0, 2
013
Figure 2 – Portfolio Maturity Distribution at June 30, 2013 and June 30, 2012
0%
5%
10%
15%
20%
25%
30%
35%
40%
% o
f T
otal
Por
tfol
io
J une 30,2012 J une 30, 2013
Under6 Months
6 - 12Months
1 - 2Years
2 - 3Years
3 - 4Years
4 - 5Years
Figure 1 – Total Assets by Program
L iability P rogram43%
Workers' C ompensation P rogram
53%
P roperty/B ond P rogram1%
B uilding F und3%
ANALYSIS OF OVERALL RESULTS OF OPERATIONSAll members participate in the Liability Program, which generates the largest portion of revenue at $5.1 million or 41%. The Workers’ Compensation Program follows at $4.3 million, representing 38% of revenue. Investment income, including coupon earnings of $389,000 and gains on the sale of investments of $85,483, was offset by market value losses of $427,469 netting a total of $47,000 (Figure 3).
Overall, operating expenses decreased by $2.1 million. This was mainly due to a decrease in the expenses for claims paid and change in claims liabilities. Excess insurance increased by $239,000 and the remaining administrative expenses increased by $200,000. Half of the administrative expense increase was due to growth in the use of the Grant Program. Claims expense and excess insurance make up 76% of expenses as shown in Figure 4. Claims administration and loss control programs represent 9% of expenses and general administration is 13% of expenses.
Retrospective Premium Adjustments, Alternate Use of Equity and Rate Stabilization Fund
Retrospective Premium Adjustment (RPA) is the original term for equity distributions and assessments. The calculation of the RPA is based on policies requiring a minimum overall funding level as well as Target Equity equal to five times the pool self-insured retention before funds can be released. Both programs met the respective equity goals. The Board approved an RPA of $1,029,144 for Liability Program members participating in program years 1999/00 to 2007/08. In the Workers’ Compensation Program, the Board approved an RPA of $567,583 for members participating in program years 1990/91 to 2004/05.
This year, the Board established a Workers’ Compensation Program Rate Stabilization Fund totaling $500,000 from members’ equity. The Board approved use of $177,342 to offset premium increases in the 2013/14 year.
Figure 4 - Expense by Category
C laims E xpense32%
E xcess I nsurance44%
C laimsAdministration
5%
L oss C ontrol E xpense
4%
C onsultants2%
General Administration
13%
Figure 3 - Revenue by Program
L iability P rogram41%
Workers' C ompensation P rogram
38%
P roperty/B ond P rogram
15%
I nvestment I ncome0%
Other I ncome6%
Pub
lic A
genc
y R
isk
Sha
ring
A
utho
rity
of
Cal
iforn
ia
203
Claims Expense
The Authority contracts with Bickmore Risk Services for mid-year and year-end actuarial valuations of the self-insured Liability and Workers’ Compensation Programs. Figure 5 illustrates the Liability Program ultimate loss by program year as determined by the actuary. The ultimate loss represents the total cost of claims expected in a given program year. Components of ultimate loss are paid and reserved claims, and incurred but not reported (IBNR) reserves. The Liability Program claims history has been unpredictable, with claims costs ranging from a high of $5.4 million to a low of $50,000. The actuary set the ultimate cost of claims at an average of $1.7 million over the past five years, a reduction from $2.5 million reported last year.
Figure 6 illustrates the Workers’ Compensation Program Ultimate Loss by Program Year as determined by the actuary. The Program’s history indicates a more consistent pattern than the Liability Program with claims costs averaging $1 million until the most recent five years. For these years, the actuary’s average ultimate cost of claims is $2.7 million per year.
CAPITAL ASSETSThe majority of the Authority’s capital assets are invested in a building located in Sacramento. PARSAC’s administrative office occupies approximately 2,100 square feet of the building and the remaining 3,639 square feet, formerly tenant space, has been converted into a conference facility for meetings and training. The Authority will endeavor to lease the space when economic circumstances in the market improve. M
anag
emen
t's
Dis
cuss
ion
& A
naly
sis
June
30,
201
3
Figure 6 – Workers' Compensation Program Ultimate Loss by Program YearStated in Millions
-$0.5
$0.0
$0.5
$1.0
$1.5
$2.0
$2.5
$3.0
$3.5
90/9
1
91/9
2
92/9
3
93/9
4
94/9
5
95/9
6
96/9
7
97/9
8
98/9
9
99/0
0
00/0
1
01/0
2
02/0
3
03/0
4
04/0
5
05/0
6
06/0
7
07/0
8
08/0
9
09/1
0
10/1
1
11/1
2
12/1
3
P aid ( less recovery) R eserves for R eported Claims Discounted I B NR & R eserve
Figure 5 – Liability Program Ultimate Loss by Program YearStated in Millions
$-
$1
$2
$3
$4
$5
$6
86/8
7
87/8
8
88/8
9
89/9
0
90/9
1
91/9
2
92/9
3
93/9
4
94/9
5
95/9
6
96/9
7
97/9
8
98/9
9
99/0
0
00/0
1
01/0
2
02/0
3
03/0
4
04/0
5
05/0
6
06/0
7
07/0
8
08/0
9
09/1
0
10/1
1
11/1
2
12/1
3
P aid ( less recovery) R eserves for R eported Claims Discounted I B NR & R eserve
Net Cash Provided By Operating Activities $1,463,346 $149,500
Supplementary Non-Cash Flow Information
Investing Activities
Decrease in Fair Value of Investments $427,470 $300,544
STATEMENT OF CASH FLOWS, continued
See
Ind
epen
dent
Aud
itor
's R
epor
t -
Pag
e 11
& N
otes
to
Bas
ic F
inan
cial
Sta
tem
ents
- P
ages
22
- 33
Bas
ic F
inan
cial
Sta
tem
ents
22
1. ORGANIZATION
General
The Public Agency Risk Sharing Authority of California (PARSAC) is a governmental joint powers authority pursuant to the Government Code of the State of California, commencing with Section 6500. PARSAC is a statewide agency providing California municipalities with risk management services including loss control, risk sharing and joint purchase coverage programs.
PARSAC offers self-funded Liability and Workers’ Compensation programs. In addition, PARSAC offers members access to group purchase insurance programs covering Property, Fidelity Bonds, Special Events and Employee Benefits.
Liability Program – The Liability Program, implemented in 1986, provides comprehensive general and automobile liability coverage. PARSAC is self-insured to $1 million and purchases excess coverage through the California State Association of Counties Excess Insurance Authority (CSAC-EIA). PARSAC also offers members Employment Practices Liability coverage through the Employment Risk Management Authority (ERMA).
Workers’ Compensation Program – The Workers’ Compensation Program, implemented in 1990, provides coverage for employee injuries arising out of and in the course of employment. From 1990 to 2007, PARSAC was self-insured to $250,000. In 2008, PARSAC increased the self-insured retention from $250,000 to $500,000. Losses in excess of PARSAC’s limit are covered through the Local Agency Workers’ Compensation Excess Pool (LAWCX) up to statutory limits.
PARSAC is a California public entity as provided in Internal Revenue Section 115; thus, it is tax-exempt. The California Office of the Controller, Division of Local Governmental Fiscal Affairs, for the purpose of filing an Annual Report of Financial Transactions of Special Districts considers PARSAC to be a “Special District.”
Reporting Entity
The reporting entity includes all activities considered to be part of PARSAC. This includes financial activity relating to all of the membership years of PARSAC. In determining its reporting entity, PARSAC considered all governmental units that were members of PARSAC since inception. The criteria did not require the inclusion of these entities in their financial statements principally because PARSAC does not exercise oversight responsibility over any members.
Basis of Accounting
The accompanying financial statements are presented on the accrual basis of accounting in accordance with accounting principles generally accepted in the United States of America. Under the accrual basis, revenues and the related assets are recognized when earned, and expenses are recognized when the obligation is incurred. PARSAC applies all applicable FASB pronouncements in accounting and reporting for its proprietary operations, except where superseded by GASB pronouncements. Liabilities for reserves for open claims and claims incurred but not reported have been recorded in PARSAC’s financial statements.
PARSAC maintains separate program accounting for each program’s revenues, expenses and related reserves. The program funds are considered a Proprietary/Enterprise Fund type.
Fund Accounting
The accounts of PARSAC are organized on the basis of funds, each of which is considered to be a separate accounting entity. PARSAC’s funds have been combined for the presentation of the basic financial statements. The operations of each fund are accounted for by providing a separate set of self- balancing accounts which comprise its assets, liabilities, net position, revenues and expenses. The general and administrative expenses of PARSAC are allocated 55% to the Liability Program, 40% to the Workers’ Compensation Program and 5% to the Property Program.
Cash and Cash Equivalents
For purposes of the statement of cash flows, PARSAC considers all highly liquid assets with a maturity of three months or less, when purchased, to be cash and cash equivalents.
Receivables
All receivables are reported at their gross value, and where appropriate, are reduced by the estimated portion that is expected to be uncollectible. As of June 30, 2013 and 2012, the total accounts receivable portfolio was considered collectible. Interest on investments is recorded in the year the interest is earned.
23
Pub
lic A
genc
y R
isk
Sha
ring
A
utho
rity
of
Cal
iforn
ia
203
Not
es t
o B
asic
Fin
anci
al S
tate
men
ts
Investments and Investment Pools
PARSAC records its investment in Local Agency Investment Fund (LAIF) and its other investments at fair value. Changes in fair value are reported as non-operating revenue in the statement of revenues, expenses and changes in net position.
Fair value of investments and LAIF has been determined by the sponsoring government based on quoted market prices. PARSAC’s investment in LAIF has been valued based on the relative fair value of the entire external pool to the external pool’s respective amortized cost.
Capital Assets
Capital assets are carried at cost. Assets with an original purchase price over $1,000 are capitalized at cost. Depreciation and amortization is computed using the straight-line method. The estimated useful lives used for buildings and improvements is thirty years. The estimated useful life for furniture and equipment range from three to five years. Software is depreciated over five years.
Accrued Vacation
In accordance with PARSAC’s employee policies, compensated absences for vacation are accrued at various numbers of hours per month depending on each employee’s years of service. The liability for compensated absences at June 30, 2013 and 2012 was $84,045 and $86,461, respectively, and is included in accrued expenses on the statement of net position.
Provision for Unpaid Claims and Claims Adjustment Expenses
PARSAC’s policy is to establish claims liabilities based on estimates of the ultimate cost of claims that have been reported but not settled, and of claims that have been incurred but not reported. The length of time for which such costs must be estimated varies depending on the coverage involved. Estimated amounts of salvage, subrogation and insurance recoverable on unpaid claims are deducted from the liability for unpaid claims. PARSAC increases the liability for allocated and unallocated claims adjustment expenses. Because actual claims costs depend on such complex factors as inflation, changes in doctrine of legal liability and damage awards, the process used in computing claims liabilities does not necessarily result in an exact amount. Claims liabilities are recomputed periodically using a variety of actuarial and statistical techniques to produce current estimates that reflect recent settlements,
claim frequency and other economic and social factors. A provision for inflation in the calculation of estimated future claims costs is implicit in the calculation because reliance is placed both on actual historical data that reflect past inflation and on other factors that are considered to be appropriate modifiers of past experience. Adjustments to claims liabilities are charged or credited to expense in the period in which they are made. The portion of claims considered currently payable has been actuarially determined.
Net Position
PARSAC adopted a Target Equity policy to ensure adequate overall funding of the pooled programs. The policy designates that equity may be returned to members when (1) the overall confidence level exceeds 90%, (2) an additional amount equal to five times the self-insured retention has been set aside and (3) equity is available to return in eligible years. The three methods approved for returning equity to members are, (1) the Retrospective Premium Adjustment (RPA) process; (2) the Liability Program Rate Stabilization Fund, and (3) an alternate use of equity approach.
• The RPA process reconciles program year revenues and expenses. Claims in the Liability Program become eligible for an RPA in the fifth year; thus, allowing the claims sufficient time for development. Workers’ Compensation Program claims first become eligible for an RPA in the eighth year.
• The Liability Program Rate Stabilization Fund was established in 2009/10 from the savings realized when PARSAC changed excess programs. The policy limits the fund balance to $500,000 and allows these funds to be used to offset pool or excess premium rate increases. In May 2012, the Board approved use of $125,000 to reduce the premium contribution for the 2012/13 year.
• The Workers’ Compensation Program established a Rate Stabilization Fund this year. The policy limits the fund balance to $500,000 and allows funds to be used to offset pool or excess premium rate increases. The Board approved use of $177,342 to apply against the 2013/14 premium increase.
• The Board approved a one-time alternate use of equity allowing members to reduce their Workers’ Compensation Program premium contributions by $99,956 for the 2012/13 year.
2
Excess Insurance
PARSAC enters into agreements whereby it obtains excess coverage from other joint powers authorities or insurance companies. PARSAC does not report excess insured risk as a liability unless it is probable that a risk will not be covered by excess insurers. Settlements have not exceeded insurance coverage in each of the past three years.
Revenue Recognition
Premium contributions are recognized as revenue when earned based upon the coverage period of the related insurance. To the extent that allocated losses exceed premium contributions previously paid, interest and other income, PARSAC can assess its member's additional contributions. Supplemental assessments are recognized as income in the period assessed. Operating revenues and expenses include all activities necessary to achieve the objectives of PARSAC. Non-operating revenues and expenses include investment activities, rental income and other non-essential activity.
Use of Estimates
The preparation of financial statements in conformity with accounting principles generally accepted in the United States of America requires management to make estimates and assumptions. These estimates and assumptions affect the reported amounts of assets and liabilities at the date of the financial statements and the reported amounts of revenues and expenses during the reporting period. Actual results could differ from these estimates. Income Taxes
As a governmental agency PARSAC is exempt from both federal income and California state franchise taxes. Reclassifications
Certain reclassifications have been made to the prior year balances to conform with the current year presentation.
2. CASH AND CASH EQUIVALENTS
Cash and cash equivalents as of June 30, 2013 and 2012 consisted of the following:
2013 2012
Cash and Cash Equivalents:
Cash on Hand $ 99 $ 81
Cash in Bank 1,132,612 627,894
LAIF 3,930,766 3,210,431
Money Market Accounts 154,919 51,327
Total Cash and Cash Equivalents $ 5,218,396 $ 3,889,733
Custodial Credit Risk
Custodial credit risk for deposits is the risk that, in the event of the failure of a depository financial institution, a government will not be able to recover its deposits or will not be able to recover collateral securities that are in the possession of an outside party. The custodial credit risk for investments is the risk that, in the event of the failure of the counterparty (e.g., broker-dealer) to a transaction, a government will not be able to recover the value of its investment or collateral securities that are in the possession of another party. None of PARSAC’s investments were subject to custodial credit risk. Custodial credit risk does not apply to a local government’s indirect investment in securities through the use of mutual funds or government investment pools (such as LAIF). The California Government Code and PARSAC’s investment policy do not contain legal or policy requirements that would limit the exposure to custodial credit risk for deposits or investments, other than the following provision of deposits: The California Government Code requires that a financial institution secure deposits made by state or local governmental units by pledging securities in an undivided collateral pool held by a depository regulated under state law (unless so waived by the governmental unit). The market value of the pledged securities in the collateral pool must equal at least 110% of the total amount deposited by the public agencies. California law also allows financial institutions to secure public entity deposits by pledging first trust deed mortgage notes having a value of 150% of the secured public deposits.
As of June 30, 2013 and 2012, none of PARSAC’s deposits with financial institutions in excess of federal depository insurance limits were held in uncollateralized accounts.
Public Agency Risk Sharing Authority of California 2
Local Agency Investment Fund
PARSAC places certain funds with the State of California’s Local Agency Investment Fund (LAIF). PARSAC is a voluntary participant in LAIF, which is regulated by California Government Code Section 16429 under the oversight of the Treasurer of the State of California and the Pooled Money Investment Board. The State Treasurer’s Office pools these funds with those of other governmental agencies in the State and invests the cash. The fair value of PARSAC’s investment in this pool is reported in the accompanying financial statements based upon PARSAC’s pro-rata share of the fair value provided by LAIF for the entire LAIF portfolio (in relation to the amortized costs of that portfolio). The monies held in the pooled investment funds are not subject to categorization by risk category. The balance available for withdrawal is based on the accounting records maintained by LAIF, which are recorded on an amortized cost basis.
3. INVESTMENTS
At June 30, 2013 and 2012, investments are reported at fair value and consisted of the following:
2013 2012
Federal Agency Bonds and Notes $15,479,463 $17,313,259
U.S. Treasury Notes 14,117,812 12,996,327
Municipal Obligations 1,259,086 597,180
Total Investments 30,856,361 30,906,766
Investments maturing within one year 1,311,532
Long-term investments $29,544,829 $30,906,766
Disclosures Relating to Interest Risk Rate
Interest rate risk is the risk that changes in market interest rates will adversely affect the fair value of an investment. Generally, the longer the maturity of an investment, the greater the sensitivity of its fair value to changes in market interest rates. One of the ways that PARSAC manages its exposure to interest rate risk is by purchasing a combination of shorter term and longer term investments and by timing cash flows from maturities so that a portion of the portfolio is maturing or coming close to maturity evenly over time as necessary to provide the cash flow and liquidity needed for operations.
Information about the sensitivity of the fair values of PARSAC’s investments to market interest rate fluctuations is provided by the following table that shows the distribution of PARSAC’s investments by maturity at June 30, 2013 and 2012:
June 30, 2013 Remaining Maturity (in Months)
Investment Type Amount 12 Months Or Less
13 to 24 Months
25 to 60 Months
Federal Agency Bonds and Notes:
FHLMC $ 5,187,794 $ $ 1,453,989 $ 3,733,805
FNMA 8,980,137 746,214 8,233,923
FHLB 1,311,532 1,311,532
U.S. Treasury Notes 14,117,812 6,210,649 7,907,163
Municipal Obligations 1,259,086
1,259,086
Total $ 30,856,361 $ 1,311,532 $ 8,410,852 $ 21,133,977
June 30, 2012 Remaining Maturity (in Months)
Investment Type Amount 12 Months Or Less
13 to 24 Months
25 to 60 Months
Federal Agency Bonds and Notes:
FHLMC $ 6,628,109 $ $ 3,598,718 $ 3,029,391
FNMA 7,224,030 3,327,743 3,896,287
FHLB 3,461,120 3,461,120
U.S. Treasury Notes 12,996,327 12,996,327
Municipal Obligations 597,180 597,180
Total $ 30,906,766 $ $ 10,387,581 $ 20,519,185
2
Disclosures Relating to Credit Risk
Generally, credit risk is the risk that an issuer of an investment will not fulfill its obligation to the holder of the investment. This is measured by the assignment of a rating by a nationally recognized statistical rating organization. Presented below is the actual Standard and Poor’s rating as of June 30, 2013 and 2012 for each investment type.
June 30, 2013 Rating as of Year-End
Investment Type Amount AA AAA
Federal Agency Bonds and Notes:
FHLMC $ 5,187,794 5,187,794
FNMA 8,980,137 8,980,137
FHLB 1,311,532 1,311,532
U.S. Treasury Notes 14,117,812 14,117,812
Municipal Obligations 1,259,086 1,259,086
Total $ 30,856,361 $ 29,597,275 $ 1,259,086
June 30, 2012 Rating as of Year-End
Investment Type Amount AA AAA
Federal Agency Bonds and Notes:
FHLMC $ 6,628,109 $ 6,628,109 $
FNMA 7,224,030 7,224,030
FHLB 3,461,120 3,461,120
U.S. Treasury Notes 12,996,327 12,996,327
Municipal Obligations 597,180 597,180
Total $ 30,906,766 $ 30,309,586 $ 597,180
Concentration of Credit Risk
At June 30, 2013 and 2012, PARSAC had the following investments that represent more than five percent of PARSAC’s net investments:
2013 2012
U.S. Treasury Notes 46% 42%FHLMC 17% 21%FNMA 29% 23%FHLB 11%
Public Agency Risk Sharing Authority of California 2
4. CAPITAL ASSETS
PARSAC’s capital asset activity for the year ended June 30, 2013 is as follows:
Beginning Balance Additions
Retirements/Adjustments
EndingBalance
Capital Assets Not Being Depreciated
Land $ 515,861 $ $ 515,861
Total Capital Assets Not Being Depreciated 515,861 515,861
Capital Assets Being Depreciated
Building 805,562 1,480 807,042
Building Improvements
203,585 203,585
Equipment 128,409 7,003 135,412
Vehicles 40,500 40,500
Total Capital Assets Being Depreciated 1,178,056 8,483 1,186,539
Less Accumulated Depreciation For
Building 473,859 46,051 519,910
Building Improvements
185,612 2,268 187,880
Equipment 109,564 8,067 117,631
Vehicles 14,175 8,100 22,275
Total Accumulated Depreciation 783,210 64,486 847,696
Total Capital Assets Being Depreciated Net 394,846 (56,003) 338,843
Total Capital Assets, Net $ 910,707 $ (56,003) $ 854,704
Depreciation expense was charged to the various programs as follows:
Liability $ 22,179
Workers’ Compensation 16,131
Building 24,160
Property 2,016
$ 64,486
2
PARSAC’s capital asset activity for the year ended June 30, 2012 was as follows:
Beginning Balance
Additions Retirements/Adjustments
EndingBalance
Capital Assets Not Being Depreciated
Land $ 515,861 $ $ $ 515,861
Total Capital Assets Not Being Depreciated 515,861 515,861
Capital Assets Being Depreciated
Building 805,562 805,562
Building Improvements
203,585 203,585
Equipment 126,842 1,567 128,409
Vehicles 40,500 40,500
Total Capital Assets Being Depreciated
1,176,489 1,567 1,178,056
Less Accumulated Depreciation For:
Building 423,550 50,309 473,859
Building Improvements
183,343 2,269 185,612
Equipment 101,503 8,061 109,564
Vehicles 6,075 8,100 14,175
Total Accumulated Depreciation 714,471 68,739 783,210
Total Capital Assets Being Depreciated Net
462,018
(67,172) 394,846
Total Capital Assets, Net $ 977,879 $ (67,172) $ $ 910,707
Depreciation expense was charged to the various programs as follows:
Liability $ 23,347
Workers’ Compensation 16,980
Building 26,289
Property 2,123
$ 68,739
Public Agency Risk Sharing Authority of California 2
5. OPERATING LEASES
PARSAC purchased an 8,526 square foot building in Sacramento in 1995. Of the 7,215 useable square feet, PARSAC occupies approximately 2,100 square feet and historically leased out the balance. Due to the continued downward trend in the Sacramento commercial leasing market, 3,639 square feet of unoccupied tenant space was converted to a conference facility for training and committee meetings. PARSAC will endeavor to lease the space when economic circumstances improve. The tenant space was vacant during the fiscal years 2013 and 2012. For the periods ended June 30, 2013 and 2012, the facility expenses were $99,696 and $103,389, respectively. Beginning with the 2011/2012 year, 50% of the facility expenses have been allocated to the programs in the same proportion as general and administrative expenses.
6. RETROSPECTIVE PREMIUM ADJUSTMENTS
PARSAC’s Joint Powers Agreement requires periodic evaluation of each programs’ equity. The process is referred to as a Retrospective Premium Adjustment (RPA). For the year ended June 30, 2013, the Board approved RPA’s in the Liability and Workers’ Compensation programs of $1,029,144 and $567,583, respectively. PARSAC did not pay RPA’s for the year ended June 30, 2012.
7. NET POSITION
PARSAC’s net position as of June 30, 2013 and 2012 consists of the following:
2013 2012
Invested in Capital Assets $ 854,704 $ 910,707
Unrestricted, Designated for:
Errors and Omission 100,000 100,000
Capital Replacement 144,589 128,139
Grant Program 282,624
Rate Stabilization 873,225 368,000
Target Equity 7,500,000 7,200,000
Undesignated Balance 12,254,505 12,023,459
Unrestricted Total 21,154,943 19,819,598
Net Position $ 22,009,647 $ 20,730,305
8. UNPAID CLAIMS AND CLAIMS ADJUSTMENT EXPENSES
As discussed in Note 1, PARSAC establishes a liability for both reported and unreported insured events, which includes estimates of both future payments of losses and related claims adjustment expenses, both allocated and unallocated. The following represents changes in those aggregate liabilities during the years ended June 30, 2013 and 2012.
2013 2012
Unpaid claims and claims adjustment expenses, beginning of fiscal year $ 14,635,728 $ 13,712,906
Incurred claims and claims adjustment expenses:
Provision for covered events of the current fiscal year 3,900,101 3,939,761
Change in provision for covered events of prior fiscal years
(1,152,104) 1,399,428
Total incurred claims and claims adjustment expense 2,747,997
5,339,189
Payments:
Claims and claims adjustment expenses attributable to covered events of the current fiscal year 508,897 335,267
Claims and claims adjustment expenses attributable to covered events of prior fiscal years 3,183,387
4,081,100
Total Payments 3,692,284
4,416,367
Total unpaid claims and claims adjustment expenses, end of fiscal year $ 13,691,441 $ 14,635,728
The components of the unpaid claims and claims adjustment expenses as of June 30, 2013 and 2012 were as follows:
2013 2012
Claims Reserves $ 7,501,573 $ 8,312,117
Claims incurred but not reported (IBNR) 5,331,292 5,413,165
Unallocated loss adjustment expenses (ULAE) 858,576 910,446
$ 13,691,441 $ 14,635,728
30
The current and long-term portions were $4,518,175 and $9,173,265, respectively, as of June 30, 2013 and were $4,740,685 and $9,895,043, respectively, as of June 30, 2012. At June 30, 2013 and 2012, the liability was reported at the present value using an expected future investment yield assumption of 2.5% and 3%, respectively, for the Workers’ Compensation Program and 1.5% and 3%, respectively, for the Liability Program. The total undiscounted liability as of June 30, 2013 and 2012 was 15,115,603 and $16,345,397, respectively.
9. EMPLOYEE RETIREMENT SYSTEM
Qualified employees are covered under an agent multi-employer defined benefit pension plan maintained by an agency of the State of California. PARSAC’s employees are members of the California Public Employees’ Retirement System (CalPERS).
Plan Description
PARSAC’s defined benefit pension plan (the "Plan") provides retirement and disability benefits, annual cost-of-living adjustments, and death benefits to Plan members and beneficiaries. The Plan is part of the Public Agency portion of the California Public Employees Retirement System (CalPERS), an agent multiple-employer plan administered by CalPERS, which acts as a common investment and administrative agent for participating public employers within the State of California. A menu of benefit provisions as well as other requirements are established by state statutes within the Public Employees’ Retirement Law. The Plan selects optional benefit provisions from the benefit menu by contract with CalPERS and adopts those benefits through Board approval. CalPERS issues a separate comprehensive annual financial report. Copies of the CalPERS’ annual financial report may be obtained from the CalPERS Executive Office at 400 P Street; Sacramento, California 95814.
Funding Policy
PARSAC contributes 8% of the active plan members’ annual salary, representing the employees’ portion of contribution. PARSAC is required to contribute the actuarially determined remaining amounts necessary to fund the benefits for its members. The actuarial methods and assumptions used are those adopted by the CalPERS Board of Administration. The required employer contribution rate for the year ended June 30, 2013 was 16.072%. The contribution requirements of the plan are established by state statute and may be amended by CalPERS.
Annual Pension Costs
For the year ended June 30, 2013, PARSAC’s annual pension cost was $165,116 and PARSAC contributed $121,511. The required contribution was determined as part of the June 30, 2011 actuarial valuation. A summary of the principle assumptions and methods used to determine the annual required contribution is shown below:
Valuation Date June 30, 2011
Actual Cost Method Entry Age Normal Cost Method
Amortization Method Level Percent of Payroll
Average Remaining Period 21 Years as of the Valuation Date
Asset Valuation Method 15 Year Smoothed Market
Actuarial Assumptions:
Investment Rate of Return 7.50% (net of administrative expenses)
Projected Salary Increases 3.30% to 14.20% depending on Age, Service and Type of Employment
Inflations 2.75%
Payroll Growth 3.00%
Individual Salary Growth A merit scaled varying by duration of employment coupled with an assumed annual inflation growth of 2.75% and an annual production growth of 0.25%
PARSAC’s plan had less than 100 active members as of the June 30, 2011 actuarial valuation. As a result, PARSAC’s members are required to participate in a larger risk pool: Miscellaneous 2.5% at 55 Risk Pool.
The excess of the total actuarial accrued liability over the actuarial value of plan assets is called the unfunded actuarial accrued liability. Funding requirements are determined by adding the normal cost and an amortization of the unfunded liability as a level percentage of assumed future payrolls. All changes in the liability due to plan amendments, changes in actuarial assumptions, or changes in actuarial methodology are amortized separately over a 20-year period. All gains or losses are tracked and amortized over a rolling 30-year period with the exception of gains and losses in fiscal years 2008/09, 2009/10 and 2010/11 in which each year’s gains or losses will be isolated and amortized over fixed and declining 30 year periods (as opposed to the current rolling 30-year amortization). If a pool’s accrued liability exceeds the actuarial value of assets, the annual contribution with respect to the total unfunded liability may not be less than the amount produced by a 30-year amortization of the unfunded liability.
Public Agency Risk Sharing Authority of California 3
The CalPERS Miscellaneous 2.5% at 55 Risk Pool Plan has an unfunded liability of $411,149,619 as of June 30, 2011. This liability will be amortized through higher employer pension rates applied over a 30 year period as determined by CalPERS.
Trend Information for CalPERS Miscellaneous2.5% at 55 Pool
Fiscal Year Ending June 30
Annual Pension Cost
(APC)
Percentage of APC
Contributed
Net Pension Obligation
(Asset)
2011 $124,975 79% $(130,817)
2012 $160,777 73% $ (87,211)
2013 $165,116 74% $ (43,606)
In 2003, CalPERS established risk pools for small employers and placed PARSAC in a pool. A side fund was created to account for the difference between the funded status of the pool and the funded status of PARSAC’s individual plan. PARSAC’s remaining net pension asset of $43,606 will be fully amortized in 2013/14.
10. OTHER POST-EMPLOYMENT BENEFITS
PARSAC provides post-retirement health care benefits for employees who satisfy the requirements for retirement under CalPERS (attained age 50 with 5 years of service). PARSAC currently pays 100% of the medical premium and 80% of the dependent’s premium for active employees, and contributes an increasing percentage for retirees.
PARSAC will eventually be required to provide retiree medical benefits identical to that which it provides for active employees in the same plan at the same coverage levels. Between now and this eventual equal contribution date, the obligation increases annually by 10%. The exact dollar amount payable to any individual retiree will depend on the medical plan and level of coverage he or she selects.
PARSAC’s annual other post-employment benefit (OPEB) cost (expense) is calculated based on the annual required contribution of the employer (ARC), an amount actuarially determined in accordance with the parameters of GASB Cod. Sec. P50.108.109. The ARC represents a level of funding that, if paid on an ongoing basis, is projected to cover normal costs each year and amortize any unfunded actuarial liabilities (or funding excess) over a period not to exceed thirty years.
The following table shows the components of PARSAC’s annual OPEB cost for the year, the amount actually contributed to the plan, and changes in PARSAC’s net OPEB obligation:
Annual required contribution $ 59,716
Adjustment to annual required contribution -
Annual OPEB cost 59,716
Contributions made (59,716)
Change in net OPEB obligation 0
Net OPEB obligation – beginning of year 0
Net OPEB obligation – end of year $ 0
PARSAC’s annual OPEB cost, the percentage of annual OPEB cost contributed to the plan, and the net OPEB obligation for the three years ended June 30, 2013 was as follows:
Fiscal Year Ended
AnnualOPEB Cost
Percentage of Annual OPEB Cost
Contributed Net OPEB Asset
June 30, 2011 $56,170 100% $ -
June 30, 2012 $57,469 100% $ -
June 30, 2013 $59,716 100% $ -
32
As of July 1, 2011, the most recent actuarial valuation date, the actuarial accrued liability for benefits was $576,828, and the actuarial value of assets was $166,676, resulting in an unfunded actuarial accrued liability (UAAL) of $410,152. The covered payroll (annual payroll of active employees covered by the Plan) was $505,175, and the ratio of the UAAL to the covered payroll was 81.2%.
Actuarial valuations of an ongoing plan involve estimates of the value of reported amounts and assumptions about the probability of occurrence of events far into the future. Examples include assumptions about future employment, mortality, and the healthcare cost trend. Amounts determined regarding the funded status of the plan and the annual required contributions of the employer are subject to continual revision as actual results are compared with past expectations and new estimates are made about the future. The schedule of funding progress, shown above, presents multiyear trend information about whether the actuarial value of plan assets is increasing or decreasing over time relative to the actuarial accrued liabilities for benefits.
Projections of benefits for financial reporting purposes are based on the substantive plan (the plan as understood by the employer and the plan members) and include the types of benefits provided at the time of each valuation and the historical pattern of sharing the benefit costs between the employer and plan members to that point. The actuarial methods and assumptions used include techniques that are designed to reduce the effects of short-term volatility in actuarial accrued liabilities and the actuarial value of assets, consistent with the long-term perspective of the calculations.
In the July 1, 2011 actuarial valuation, the entry age normal cost method was used. The actuarial assumptions include a 7.50 percent investment rate (net of administrative expenses), which is a blended rate of the expected long-term investment returns on plan assets and on the employer’s own investments calculated based on the funded level of the plan on the valuation date, and an annual healthcare cost trend rate of 9 percent initially, reduced by decrements to an ultimate rate of 4.5 percent after 8 years. Both rates include a 3.25 percent inflation assumption. The actuarial value of assets was determined using techniques that spread the effects of short-term volatility in the market value of investments over a five-year period. The UAAL is being amortized as a level percentage of projected payroll on an open basis. The remaining amortization period at June 30, 2013, was 27 years.
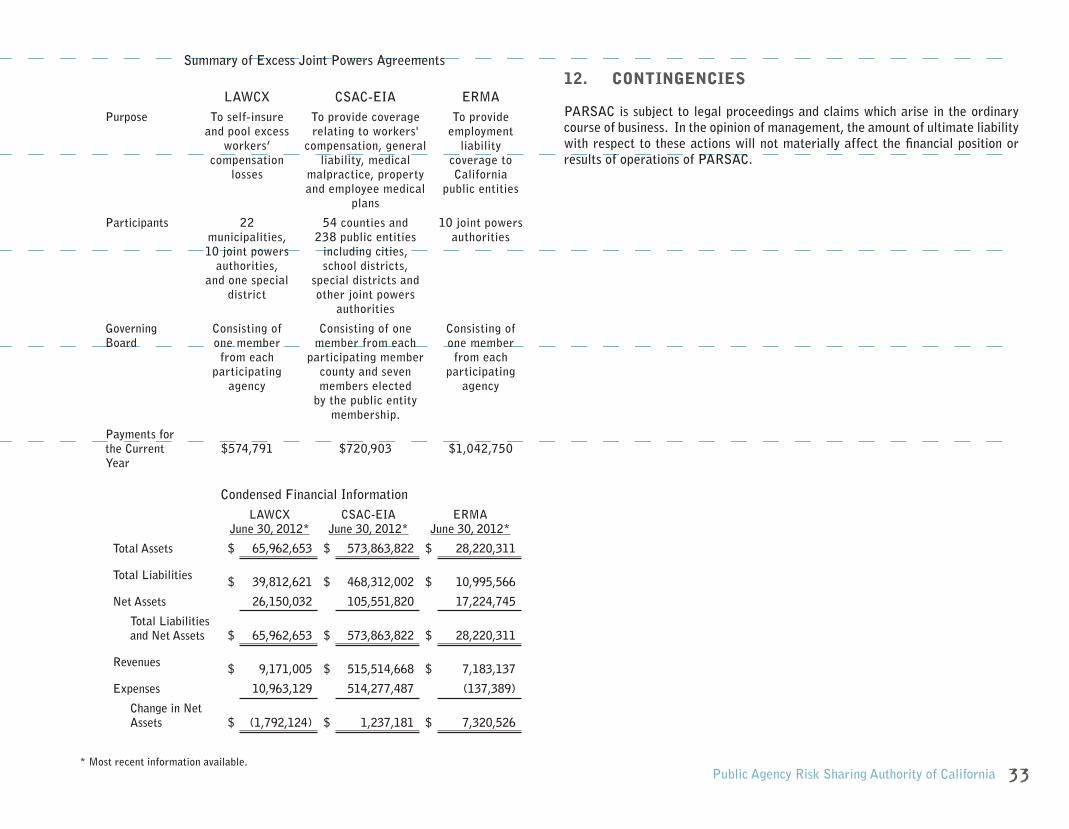
11. JOINT POWERS AGREEMENTS
PARSAC participates in joint ventures under the following Joint Powers Agreements: Local Agency Workers’ Compensation Excess JPA (LAWCX); Employment Risk Management Authority (ERMA); and California State Association of Counties Excess Insurance Authority (CSAC-EIA). The relationship is such that LAWCX, ERMA and CSAC-EIA are not component units of PARSAC for financial reporting purposes.
ERMA arranges for and provides up to $975,000 employment practices liability coverage in excess of the self-insured retention while CSAC-EIA provides $34 million excess liability insurance coverage (including employment practices) above PARSAC’s $1 million retention. LAWCX provides excess workers’ compensation insurance coverage for losses in excess of $500,000 up to statutory limits.
ERMA, CSAC-EIA and LAWCX are governed by Boards with member agency representation. Their respective Boards control the operations, including selection of management and approval of operating budgets, independent of any influence by the member agencies beyond their representation on the board. Each member agency pays a premium commensurate with the level of coverage requested and shares surpluses and deficits proportionate to their participation. Complete financial statements of ERMA, CSAC-EIA and LAWCX may be obtained from each agency, respectively.
Public Agency Risk Sharing Authority of California 33
Summary of Excess Joint Powers Agreements
LAWCX CSAC-EIA ERMAPurpose To self-insure
and pool excess workers’
compensation losses
To provide coverage relating to workers'
compensation, general liability, medical
malpractice, property and employee medical
plans
To provide employment
liability coverage to California
public entities
Participants 22 municipalities, 10 joint powers
authorities, and one special
district
54 counties and 238 public entities
including cities, school districts,
special districts and other joint powers
authorities
10 joint powers authorities
Governing Board
Consisting of one member from each
participating agency
Consisting of one member from each
participating member county and seven members elected
by the public entity membership.
Consisting of one member from each
participating agency
Payments for the Current Year
$574,791 $720,903 $1,042,750
Condensed Financial InformationLAWCX
June 30, 2012*CSAC-EIA
June 30, 2012*ERMA
June 30, 2012*
Total Assets $ 65,962,653 $ 573,863,822 $ 28,220,311
Total Liabilities $ 39,812,621 $ 468,312,002 $ 10,995,566
Net Assets 26,150,032 105,551,820 17,224,745
Total Liabilities and Net Assets $ 65,962,653 $ 573,863,822 $ 28,220,311
Revenues $ 9,171,005 $ 515,514,668 $ 7,183,137
Expenses 10,963,129 514,277,487 (137,389)
Change in Net Assets $ (1,792,124) $ 1,237,181 $ 7,320,526
* Most recent information available.
12. CONTINGENCIES
PARSAC is subject to legal proceedings and claims which arise in the ordinary course of business. In the opinion of management, the amount of ultimate liability with respect to these actions will not materially affect the financial position or results of operations of PARSAC.
3
PUBLIC EMPLOYEES RETIREMENT SYSTEMSCHEDULE OF FUNDING PROGRESS
The following tables illustrate how PARSAC’s earned revenue (net of reinsurance) and investment income compare to related costs of loss (net of loss assumed by reinsurers) and other expenses assumed by the Program for its most current ten year period. The claims development information is presented on an undiscounted basis; however, all claims liabilities reported in the basic financial statements are on a discounted basis.
The rows of the tables are defined as follows:
(1) This line shows the total of each fiscal year’s earned deposit premiums and cumulative investment income less ceded (excess insurance cost) to arrive at net earned contribution.
(2) This line shows each fiscal year’s other operating costs of the Program including overhead and loss adjustment expenses not allocable to individual claims.
(3) This line shows the cumulative Retrospective Premium Adjustment attributed to the program year.
(4) This line shows the Program’s gross incurred losses and allocated loss adjustment expense, losses assumed by reinsurers, and net incurred losses and loss adjustment expense (both paid and accrued) as originally reported at the end of the year in which the event that triggered coverage occurred (called program year).
(5) This section of rows shows the cumulative net amounts paid as of the end of successive years for each program year.
(6) This line shows the latest reestimated amount of losses assumed by reinsurers for each program year.
(7) This section of rows shows how each program year’s net amount of losses increased or decreased as of the end of successive years. (This annual reestimation results from new information received on known losses, reevaluation of existing information on known losses, and emergence of new losses not previously known.)
(8) This line compares the latest reestimated net incurred losses amount to the amount originally established (line 3) and shows whether this latest estimate of losses is greater or less than originally thought. As data for individual program years mature, the correlation between original estimates and reestimated amounts is commonly used to evaluate the accuracy of net incurred losses currently recognized in less mature program years. The columns of the table show data for successive program years.
Other General and Administrative Expenses 46,343 33,825 4,228 84,396
Total Operating Expenses 2,501,411 4,574,557 1,459,923 8,535,891
Operating Income (Loss) 2,227,323 (773,099) 5,033 1,459,257Non-Operating Revenues (Expenses):
Investment Income 21,273 25,999 47,272
Facility Expense, Net (49,848) (49,848)
Total Non-Operating Revenues (Expenses) 21,273 25,999 (49,848) (2,576)
Income (Loss) Before Equity Distribution 2,248,596 (747,100) 5,033 (49,848) 1,456,681
Equity Distribution (177,342) (177,342)
Change in Net Position 2,248,596 (924,442) 5,033 (49,848) 1,279,339
Net Position, Beginning of Year 8,284,332 11,328,775 34,951 1,082,247 20,730,305
Net Position, End of Year $ 10,532,928 $ 10,404,333 $ 39,984 $ 1,032,399 $ 22,009,644
COMBINING STATEMENT OF REVENUES, EXPENSES AND CHANGES IN NET POSITION
For The Year Ended June 30, 2013
Pub
lic A
genc
y R
isk
Sha
ring
A
utho
rity
of
Cal
iforn
ia
203
2
INDEPENDENT AUDITOR'S REPORT ON INTERNAL CONTROL OVER FINANCIAL REPORTING AND ON COMPLIANCE AND
OTHER MATTERS BASED ON AN AUDIT OF FINANCIAL STATEMENTS PERFORMED IN ACCORDANCE WITH
GOVERNMENT AUDITING STANDARDS
Board of DirectorsPublic Agency Risk Sharing Authority of CaliforniaSacramento, California
We have audited in accordance with the auditing standards generally accepted in the United States of America and the standards applicable to financial audits contained in Government Auditing Standards issued by the Comptroller General of the United States, the financial statements of Public Agency Risk Sharing Authority of California (PARSAC) as of and for the year ended June 30, 2013, and the related notes to the financial statements, which collectively comprise PARSAC’s basic financial statements, and have issued our report thereon dated October 29, 2013.
Internal Control Over Financial Reporting
In planning and performing our audit of the financial statements, we considered PARSAC’s internal control over financial reporting (internal control) to determine the audit procedures that are appropriate in the circumstances for the purpose of expressing our opinion on the financial statements, but not for the purpose of expressing an opinion on the effectiveness of PARSAC’s internal control. Accordingly, we do not express an opinion on the effectiveness of PARSAC’s internal control.
A deficiency in internal control exists when the design or operation of a control does not allow management or employees, in the normal course of performing their assigned functions, to prevent, or detect and correct misstatements on a timely basis. A material weakness is a deficiency, or a combination of deficiencies, in internal control such that there is a reasonable possibility that a material misstatement of PARSAC’s financial statements will not be prevented, or detected and corrected on a timely basis. A significant deficiency is a deficiency, or a combination of deficiencies, in internal control that is less severe than a material weakness, yet important enough to merit attention by those charged with governance.
RE
PO
RT
ON
INTE
RN
AL
CO
NTR
OL
& C
OM
PL
IAN
CE
- O
ct. 2
9, 2
013
Our consideration of internal control was for the limited purpose described in the first paragraph of this section and was not designed to identify all deficiencies in internal control that might be material weaknesses or, significant deficiencies. Given these limitations, during our audit, we did not identify any deficiencies in internal control that we consider to be material weaknesses. However, material weaknesses may exist that have not been identified.
Compliance and other Matters
As part of obtaining reasonable assurance about whether PARSAC’s financial statements are free of material misstatement, we performed tests of its compliance with certain provisions of laws, regulations and contracts, noncompliance with which could have a direct and material effect on the determination of financial statement amounts. However, providing an opinion on compliance with those provisions was not an objective of our audit and, accordingly we do not express such an opinion. The results of our tests disclosed no instances of noncompliance that are required to be reported under Government Auditing Standards.
Purpose of this Report
The purpose of this report is solely to describe the scope of our testing of internal control and compliance and the results of that testing, and not to provide an opinion on the effectiveness of PARSAC’s internal control or on compliance. This report is an integral part of an audit performed in accordance with Government Auditing Standards in considering PARSAC’s internal control and compliance. Accordingly, this communication is not suitable for any other purpose.
Public Agency Risk Sharing
Authority of California
Accredited with ExcellenceSince 1996
2013ANNUAL REPORT 2013
PARSAC: JPA of ChoiceFiscal Year: 2012-13Included: Audited Financial Statements
Common Purpose
Unique Individuals
Diverse Needs
25 years
Statewide
MunicipalRiskManagement
Please feel free to contact us for additional information.
Public Agency Risk Sharing Authority of California1525 Response Road, Suite 1Sacramento, California 95815(800) 400-2642 • www.parsac.org