SAGICOR FINANCIAL CORPORATION FINANCIAL STATEMENTS DECEMBER 31, 2013 Information in this document may not be copied, reproduced, distributed, transmitted or in any way disseminated without the prior written consent of Sagicor Financial Corporation. Any alteration, amendment, insertion or deletion is strictly prohibited. This information is intended only for persons to whom an electronic communication from authorised Sagicor personnel is addressed and is provided for lawful purposes only. Users should be aware that electronic communication could be forwarded, intercepted or altered by others.
Information in this document may not be copied, reproduced, distributed, transmitted or in any way disseminated without the prior written consent of Sagicor Financial Corporation. Any alteration, amendment, insertion or deletion is strictly prohibited. This information is intended only for persons to whom an electronic communication from authorised Sagicor personnel is addressed and is provided for lawful purposes only. Users should be aware that electronic communication could be forwarded, intercepted or altered by others.
INDEX TO THE CONSOLIDATED FINANCIAL STATEMENTS Sagicor Financial Corporation December 31, 2013
1 Sagicor Financial Corporation
Reports: Page
Independent Auditors’ Report
Appointed Actuary’s Report
Consolidated Financial Statements:
Statement of Financial Position 2
Statement of Income 3
Statement of Comprehensive Income 4
Statement of Changes in Equity 5
Statement of Cash Flows 6
Notes to the Financial Statements: Page
1 Incorporation and Principal Activities 7
2 Accounting Policies 7
3 Critical Accounting Estimates and Judgements 27
Notes to the Financial Statements: Page
4 Segments 30
5 Investment Property 40
6 Associates and Joint Venture 40
7 Property, Plant and Equipment 41
8 Intangible Assets 42
9 Financial Investments 45
10 Reinsurance Assets 47
11 Income Tax Assets 47
12 Miscellaneous Assets and Receivables 47
13 Actuarial Liabilities 48
14 Other Insurance Liabilities 51
15 Investment Contract Liabilities 52
16 Notes and Loans Payable 53
17 Deposit and Security Liabilities 53
18 Provisions 54
19 Income Tax Liabilities 54
20 Accounts Payable and Accrued Liabilities 54
21 Common and Preference Shares 54
22 Reserves 56
23 Participating Accounts 57
24 Premium Revenue 57
25 Net Investment Income 58
26 Fees and Other Revenue 59
Notes to the Financial Statements: Page
27 Policy Benefits & Change in Actuarial Liabilities 59
28 Interest Expense 59
29 Employee Costs 60
30 Equity Compensation Benefits 60
31 Employee Retirement Benefits 63
32 Income Taxes 67
33 Deferred Income Taxes 68
34 Earnings per Common Share 69
35 Other Comprehensive Income 70
36 Cash Flows 71
37 Subsidiary Acquisition and Ownership Changes 72
43 Insurance Risk - Life, Annuity & Health Contracts 101
44 Fiduciary Risk 106
45 Statutory Restrictions on Assets 106
46 Capital Management 106
47 Related Party Transactions 109
48 Change in Accounting Policy 110
49 Events after December 31, 2013 112
S A G I C O R F I N A N C I A L C O R P O R A T I O N
A P P O I N T E D A C T U A R Y ’ S
2 0 1 3 R E P O R T T O T H E S H A R E H O L D E R S A N D P O L I C Y H O L D E R S
I have performed or reviewed the valuation of the consolidated policy liabilities of Sagicor Financial Corporation (“Sagicor”) which includes the policy liabilities of its life insurance subsidiaries:
• Sagicor Life Inc. (Barbados),
• Sagicor Life Jamaica Limited (Jamaica) *,
• Sagicor Capital Life Insurance Company Limited (Barbados),
• Capital Life Insurance Company Bahamas Limited (Bahamas),
• Sagicor Life Aruba NV (Aruba),
• Sagicor Panamá SA (Panama),
• Nationwide Insurance Company Limited (Trinidad & Tobago),
• Sagicor Life of the Cayman Islands Limited (Cayman Islands) *, and
• Sagicor Life Insurance Company (USA) *,
for the balance sheet, at 31st December 2013, and their change in the consolidated statement of operations, for the year then ended, for each organization and on a consolidated basis in accordance with accepted actuarial practice, including selection of appropriate assumptions and methods.
The valuation of Sagicor and its Life Insurance Subsidiaries was conducted by myself or other actuaries (indicated by a “*” above), using either the Policy Premium Method (“PPM”) or the Canadian Asset Liability Method (“CALM”) where appropriate, assuming best-estimate assumptions together with margins for adverse deviations in accordance with the Standards of Practice (Life) of the Canadian Institute of Actuaries. For those where other actuaries completed the valuation, I have reviewed and accepted their valuation and have relied on their work in order to issue this certificate.
In my opinion, the amount of policy liabilities makes appropriate provision for all policyholder obligations and the financial statements fairly represent the results of the valuation.
Sylvain Goulet, FCIA, FSA, MAAAAffiliate Member of the Institute and Faculty of ActuariesMember of the Caribbean Actuarial AssociationAppointed Actuary for Sagicor Financial Corporation
Transfers and other movements -. (3,407) 3,532. 125. (248) 134. 11.
Balance, end of year 296,058. 16,411. 274,565. 587,034. (10,333) 226,433. 803,134.
CONSOLIDATED STATEMENT OF CASH FLOWS Sagicor Financial Corporation Year ended December 31, 2013 Amounts expressed in US$000
Sagicor Financial Corporation 6
Note 2013 2012
restated
OPERATING ACTIVITIES
Income before taxes 98,552 99,770
Adjustments for non-cash items, interest and dividends 36.1 (75,741) (46,747)
Interest and dividends received 258,552 256,676
Interest paid (73,683) (81,080)
Income taxes paid (28,063) (20,130)
Net increase in investments and operating assets 36.1 (351,404) (193,557)
Net increase in operating liabilities 36.1 183,379 13,984
Acquisition of insurance portfolio, net of cash and cash equivalents
13.2 30,699 -
Recapture of reinsurance contract held 13.2 - 3,826
Net cash flows - operating activities 42,291 32,742
INVESTING ACTIVITIES
Property, plant and equipment, net 36.2 (18,284) (19,843)
Associates and joint ventures, net 1,082 (5,275)
Intangible assets, net (1,015) (2,025)
Acquisition of subsidiary, net of cash and cash equivalents 37 - (9,461)
Sale of subsidiaries, net of disposal costs 38 86,697 -
Net cash flows - investing activities 68,480 (36,604)
Note 2013 2012
restated
FINANCING ACTIVITIES
Movement in treasury shares (622) (249)
Shares issued to minority interests (18) (38)
Change in ownership of subsidiaries 37 - 35,416
Other notes and loans payable, net 36.3 42,432 2,055
Dividends paid to common shareholders (11,849) (11,846)
Dividends paid to preference shareholders (7,810) (7,790)
Dividends paid to minority interests (9,007) (12,130)
Net cash flows - financing activities 13,126 5,418
Effects of exchange rate changes 21 (643)
NET CHANGE IN CASH AND CASH EQUIVALENTS -CONTINUING OPERATIONS
123,918 913
Net change in cash and cash equivalents - discontinued operation
38 (78,882) (52,008)
Cash and cash equivalents, beginning of year 213,564 264,659
CASH AND CASH EQUIVALENTS, END OF YEAR 36.4 258,600 213,564
Notes to the Financial Statements Sagicor Financial Corporation Year ended December 31, 2013 Amounts expressed in US$000
7 Sagicor Financial Corporation
1 INCORPORATION AND PRINCIPAL ACTIVITIES Sagicor Financial Corporation was incorporated on December 6, 2002 under the Companies Act of Barbados as a public limited liability holding company. On December 6, 2002, Sagicor Life Inc was formed following its conversion from The Barbados Mutual Life Assurance Society (The Society). On December 30, 2002, Sagicor Financial Corporation allotted common shares to the eligible policyholders of The Society and became the holding company of Sagicor Life Inc. Sagicor and its subsidiaries ‘the Group’ operate across the Caribbean, in the United States of America (USA) and in the United Kingdom (UK). Details of the Sagicor’s holdings and operations are set out in notes 4 and 38. The principal activities of the Sagicor Group are as follows:
Life and health insurance Annuities and pension administration services Property and casualty insurance Banking, investment management and other financial services
For ease of reference, when the term “insurer” is used in the following notes, it refers to either one or more Group subsidiaries that engages in insurance activities.
2 ACCOUNTING POLICIES The principal accounting policies adopted in the preparation of these consolidated financial statements are set out below. These policies have been consistently applied to the years presented, unless otherwise stated.
2.1 Basis of preparation
These consolidated financial statements are prepared in accordance with and comply with International Financial Reporting Standards (IFRS). The Group has adopted accounting policies for the computation of actuarial liabilities of life insurance and annuity contracts which comply with the Canadian accepted actuarial standards. As no specific guidance is provided by IFRS for computing actuarial liabilities, management has judged that Canadian accepted actuarial standards should continue to be applied. The adoption of IFRS 4 – Insurance Contracts, permits the Group to continue with this accounting policy, with the modification required by IFRS 4 that rights under reinsurance contracts are measured separately. The consolidated financial statements are prepared under the historical cost convention except as modified by the revaluation of investment property, owner-occupied property, available for sale investment securities, financial assets and liabilities held at fair value through income, actuarial liabilities and associated reinsurance assets. The preparation of financial statements in conformity with IFRS requires the use of certain critical accounting estimates. It also requires management to exercise its judgement in the process of applying the Company’s accounting policies. The areas involving a higher degree of judgement or complexity, or areas when assumptions and estimates are significant to the consolidated financial statements, are disclosed in note 3. All amounts in these financial statements are shown in thousands of United States dollars, unless otherwise stated.
Notes to the Financial Statements Sagicor Financial Corporation Year ended December 31, 2013 Amounts expressed in US$000
Sagicor Financial Corporation 8
2.1 Basis of preparation (continued) (a) Amendments to IFRS Several new or amended standards are effective for the current financial year, and where required those standards have been applied in preparing these financial statements with restatement of comparative disclosures. These standards are as follows: (i) IAS 19 - Employee Benefits The key amendments to this standard affect defined benefit retirement plans and are summarised as follows:
The 10% corridor method has been removed and all actuarial and experience gains and losses are required to be recognised in other comprehensive income.
Expected returns on plan assets are no longer recognised in income. Instead, interest is recognised on the net defined benefit liability or asset, calculated using the discount rate used to measure the defined benefit obligation.
Past service cost arising from plan amendments or curtailment are now recognised in income at the earlier of when the amendment occurs or when the related restructuring or termination cost are recognised. The option to amortise such cost over future years has been eliminated.
All items recorded in other comprehensive income are taken to retained earnings or minority interest.
These represent changes from the former standard where actuarial gains and losses within the 10% corridor were deferred and all other recognised changes were recorded in income.
2.1 Basis of preparation (continued) The revised standard has been adopted as a change in accounting policy and has been applied retrospectively with the restatement of the comparative 2012 amounts and of the cumulative impact at the beginning of 2012. The impact on the group's results has been:
A decrease in equity and an increase in the net defined benefit liability of $8,518 at the beginning of 2012;
For the year ended December 31, 2012, an increase in net income of $1,260 and a decrease in other comprehensive income of $7,967.
These restatements are summarised in note 48. (ii) IFRS 10 - Consolidated Financial Statements; IFRS 11 - Joint Arrangements; IFRS 12 -
Disclosure of Interests in Other Entities These new standards partially or wholly replace IAS 27, IAS 28 and IAS 31 and:
Refine the definition of control over entities and consequently define interests that require consolidation.
Introduce new accounting requirements for joint arrangements. Require enhanced disclosures about both consolidated and unconsolidated entities so that
users of financial statements may evaluate the basis of control, restrictions on assets and liabilities, risk exposures from involvements with unconsolidated entities and non-controlling interests’ involvement in consolidated entities.
The Group has re-assessed its subsidiary, associates and jointly-owned holdings and has concluded that IFRS 11 - Joint Arrangements requires a reclassification of a joint venture was formerly accounted for under the proportionate consolidation method. The joint venture is included in note 6.
Notes to the Financial Statements Sagicor Financial Corporation Year ended December 31, 2013 Amounts expressed in US$000
9 Sagicor Financial Corporation
2.2 Basis of consolidation (continued) All material intra-group balances, transactions and gains are eliminated on consolidation. Accounting policies of subsidiaries have been changed where necessary to ensure consistency with the accounting policies adopted by the Group. The Group uses the acquisition method of accounting when control over entities and insurance businesses is obtained by the Group. The cost of an acquisition is measured as the fair value of the identifiable assets given, the equity instruments issued and the liabilities incurred or assumed at the date of exchange. Identifiable assets acquired and liabilities and contingent liabilities assumed in a business combination are measured initially at their fair values at the acquisition date irrespective of the extent of any minority interest. Acquisition-related costs are expensed as incurred.
The excess of the cost of the acquisition, the minority interest recognised and the fair value of any previously held equity interest in the acquiree, over the fair value of the of the net identifiable assets acquired is recorded as goodwill. If there is no excess and there is a shortfall, the Group reassesses the net identifiable assets acquired. If after reassessment, a shortfall remains, the acquisition is deemed to be a bargain purchase and the shortfall is recognised in income as a gain on acquisition. Subsequent ownership changes in a subsidiary, without loss of control, are accounted for as transactions between owners in the statement of changes in equity. Minority interest balances represent the equity in a subsidiary not attributable to Sagicor’s interests. On an acquisition by acquisition basis, the Group recognises at the date of acquisition the components of any minority interest in the acquiree either at fair value or at the proportionate share of the acquiree’s net identifiable assets. The latter option is only available if the minority interest component is entitled to a proportionate share of net identifiable assets of the acquiree in the event of liquidation. For certain components of minority interests, other IFRS may override the fair value option. Minority interest balances are subsequently re-measured by the minority’s proportionate share of changes in equity after the date of acquisition.
2.1 Basis of preparation (continued) (iii) IFRS 13 - Fair Value Measurement The standard defines fair value, sets out a framework for measuring fair value and requires disclosures about fair value measurements. The standard applies to financial and non-financial assets and liabilities that are either measured at fair value or for which fair value is disclosed. The fair value hierarchy concept formerly defined in IFRS 7 has been transferred to and enhanced by this standard. The standard summarises the main valuation techniques which should be applied. The Group has adopted this standard from the current year. These statements include new disclosures of the fair value hierarchy as applied to investment and owner-occupied property (note 40) and to financial instruments carried at amortised cost (note 41.5(b)). Disclosures of the fair value hierarchy as applied to financial instruments carried at fair value continues from prior years in note 41.5(a). This standard has no significant impact on the Group's financial results. 2.2 Basis of consolidation (a) Subsidiaries Subsidiaries are entities over which the Group has control. The Group has control over an entity when the Group is exposed to the variable returns from its ownership interest in the entity and when the Group has the ability to affect those returns through its power over the entity. Subsidiaries are consolidated from the date on which control is transferred to the Group, and are de-consolidated from the date on which control ceases.
Notes to the Financial Statements Sagicor Financial Corporation Year ended December 31, 2013 Amounts expressed in US$000
Sagicor Financial Corporation 10
2.2 Basis of consolidation (continued) (b) Discontinued operation
In December 2012, the Group agreed to sell Sagicor Europe Limited, its subsidiary Sagicor at Lloyd's Limited and its interest in Lloyd's of London syndicate 1206. The decision to sell resulted in the closure of the Sagicor Europe operating segment and therefore met the criteria of a discontinued operation. The sale was concluded in December 2013. Consequently, the balances and results associated with the discontinued operation have been classified separately in the these financial statements. As of December 31, 2013, the future price adjustments relating to the discontinued operation are disclosed in the statement of financial position at their estimated undiscounted value. Prior to the sale (as of December 31, 2012 and during interim financial periods in 2013), the net assets of the discontinued operation were carried in the statement of financial position at their estimated fair value less costs to sell. As this amount was less than the previous carrying value, impairments were recorded and applied to the goodwill and intangible assets component of the discontinued operation's assets. (c) Sale of subsidiaries On the sale of or loss of control of a subsidiary, the Group de-recognises the related assets, liabilities, minority interest and associated goodwill of the subsidiary. The Group reclassifies its share of balances of the subsidiary previously recognised in other comprehensive income either to income or to retained earnings as appropriate. The gain (or loss) on sale recorded in income is the excess (or shortfall) of the fair value of the consideration received over the de-recognised and reclassified balances. (d) Associates and joint venture
The investments in associated companies, which are not majority-owned or controlled but where significant influence exists, are included in these consolidated financial statements under the equity method of accounting.
2.2 Basis of consolidation (continued) Investments in associate and joint venture companies are originally recorded at cost and include intangible assets identified on acquisition. Accounting policies have been changed where necessary to ensure consistency with the accounting policies adopted by the Group. The Group recognises in income its share of associates and joint venture companies’ post acquisition income and its share of the amortisation and impairment of intangible assets which were identified on acquisition. Unrealised gains or losses on transactions between the Group and its associates and joint ventures are eliminated to the extent of the Group’s interest. The Group recognises in other comprehensive income, its share of post acquisition other comprehensive income.
(e) Pension and investment funds Insurers have issued deposit administration and unit linked contracts in which the full return of the assets supporting these contracts accrue directly to the contract-holders. As these contracts are not operated under separate legal trusts, they have been consolidated in these financial statements. The Group manages a number of segregated pension funds, mutual funds and unit trusts. These funds are segregated and investment returns on these funds accrue directly to unit-holders. Consequently the assets, liabilities and activity of these funds are not included in these consolidated financial statements unless the Group has a significant holding in the fund. Where a significant holding exists, the Group consolidates the assets, liabilities and activity of the fund and accounts for any non-controlling interest as a financial liability. (f) Employees share ownership plan (ESOP) The Company has established an ESOP Trust which either acquires Company shares on the open market, or is allotted new shares by the Company. The Trust holds the shares on behalf of employees until the employees’ retirement or termination from the Group. Until distribution to employees, shares held by the Trust are accounted for as treasury shares. All dividends received by the Trust are applied towards the future purchase of Company shares.
Notes to the Financial Statements Sagicor Financial Corporation Year ended December 31, 2013 Amounts expressed in US$000
11 Sagicor Financial Corporation
2.3 Foreign currency translation (a) Functional and presentational currency Items included in the financial statements of each reporting unit of the Group are measured using the currency of the primary economic environment in which the entity operates (the functional currency). A reporting unit may be an individual subsidiary, a branch of a subsidiary or an intermediate holding company group of subsidiaries. The consolidated financial statements are presented in thousands of United States dollars, which is the Group’s presentational currency. (b) Reporting units The results and financial position of reporting units that have a functional currency other than the Group’s presentational currency are translated as follows: (i) Income, other comprehensive income, movements in equity and cash flows are translated at average exchange rates for the year. (ii) Assets and liabilities are translated at the exchange rates ruling on December 31. (iii) Resulting exchange differences are recognised in other comprehensive income. Currencies which are pegged to the United States dollar are converted at the pegged rates. Currencies which float are converted to the United States dollar by reference to the average of buying and selling rates quoted by the respective central banks or in the case of pounds sterling, according to prevailing market rates. Exchange rates of the other principal operating currencies to the United States dollar were as follows: 2013 closing 2013 average 2012 closing 2012 average
Barbados dollar 2.0000 2.0000 2.0000 2.0000
Eastern Caribbean dollar 2.7000 2.7000 2.7000 2.7000
Jamaica dollar 105.9952 99.7566 92.6766 88.4376
Trinidad & Tobago dollar 6.4386 6.4064 6.3814 6.4030
Pound sterling 0.60500 0.64036 0.61850 0.63056
2.3 Foreign currency translation (continued) On consolidation, exchange differences arising from the translation of the net investment in foreign entities are recorded in other comprehensive income. On the disposal or loss of control of a foreign entity, such exchange differences are transferred to income. Goodwill and other intangible assets recognised on the acquisition of a foreign entity are treated as assets and liabilities of the foreign entity, and are translated at the rate ruling on December 31. (c) Transactions and balances Foreign currency transactions are translated into the functional currency at the exchange rates prevailing at the dates of the transactions. Foreign exchange gains and losses, which result from the settlement of foreign currency transactions and from the re-translation of monetary assets and liabilities denominated in foreign currencies, are recognised in the income statement. Non-monetary assets and liabilities, primarily deferred policy acquisition costs and unearned premiums, are maintained at the transaction rates of exchange. The foregoing exchange gains and losses which are recognised in the income statement are included in other revenue.
Exchange differences on the re-translation of the fair value of non-monetary items such as equities held at fair value through income are reported as part of the fair value gain or loss. Exchange differences on the re-translation of the fair value of non-monetary items such as equities held as available for sale are reported as part of the fair value gain or loss in other comprehensive income.
2.4 Segments
Reportable operating segments have been defined on the basis of performance and resource allocation decisions of the Group’s Chief Executive Officer.
Notes to the Financial Statements Sagicor Financial Corporation Year ended December 31, 2013 Amounts expressed in US$000
Sagicor Financial Corporation 12
2.5 Investment property
Investment property consists of freehold lands and freehold properties which are held for rental income and / or capital appreciation. Investment property is recorded initially at cost. In subsequent financial years, investment property is recorded at fair values as determined by independent valuation, with the appreciation or depreciation in value being taken to investment income. Fair value represents the price (or estimates thereof) that would be agreed upon in an orderly transaction between market participants at valuation date. Investment property includes property partially owned by the Group and held under joint operations with third parties for which the Group recognises its share of the joint operation's assets, liabilities, revenues, expenses and cash flows.
Transfers to or from investment property are recorded when there is a change in use of the property. Transfers to owner-occupied property or to real estate developed for resale are recorded at the fair value at the date of change in use. Transfers from owner-occupied property are recorded at their fair value and any difference with carrying value at the date of change in use is dealt with in accordance with note 2.6. Investment property may include property of which a portion is held for rental to third parties and the other portion is occupied by the Group. In such circumstances, the property is accounted for as an investment property if the Group’s occupancy level is not significant in relation to the total available occupancy. Otherwise, it is accounted for as an owner-occupied. Rental income is recognised on an accruals basis.
2.6 Property, plant and equipment Property, plant and equipment are recorded initially at cost. Subsequent expenditure is capitalised when it will result in future economic benefits to the Group.
2.6 Property, plant and equipment (continued) Owner-occupied property is re-valued at least every three years to its fair value as determined by independent valuation. Fair value represents the price (or estimates thereof) that would be agreed upon in an orderly transaction between market participants at valuation date. Revaluation of a property may be conducted more frequently if circumstances indicate that a significant change in fair value has occurred. Movements in fair value are reported in other comprehensive income, unless there is a cumulative depreciation in respect of an individual property, which is then recorded in income. Accumulated depreciation at the date of revaluation is eliminated against the gross carrying amount of the asset.
Owner-occupied property includes property held under joint operations with third parties for which the Group recognises its share of the joint operation's assets, liabilities, revenues, expenses and cash flows. On the disposal of owner-occupied property, the amount included in the fair value reserve is transferred to retained earnings. The Group, as lessor, enters into operating leases with third parties to lease assets. Operating leases are leases in which the Group maintains substantially the risks of ownership and the associated assets are recorded as property, plant and equipment. Income from operating leases is recognised on the straight-line basis over the term of the lease. Depreciation is calculated on the straight-line method to write down the cost or fair value of property, plant and equipment to residual value over the estimated useful life. Estimated useful lives are reviewed annually and are as follows.
Asset Estimated useful life
Buildings 40 to 50 years
Furnishings and leasehold improvements 10 years or lease term
Computer and office equipment 3 to 10 years
Vehicles 4 to 5 years
Leased equipment and vehicles 5 to 6 years Lands are not depreciated.
Notes to the Financial Statements Sagicor Financial Corporation Year ended December 31, 2013 Amounts expressed in US$000
13 Sagicor Financial Corporation
2.6 Property, plant and equipment (continued) An impairment loss is recognised for the amount by which an asset’s carrying amount exceeds its recoverable amount. The recoverable amount is the higher of an asset’s fair value less costs to sell and its value in use. Gains or losses recognised in income on the disposal of property, plant and equipment are determined by comparing the net sale proceeds to the carrying value. 2.7 Intangible assets (a) Goodwill
Goodwill (defined in note 2.2(a)) arising from an acquisition of a subsidiary or insurance business is allocated to appropriate cash generating units which are defined by the Group’s operating segments. Goodwill arising in a reportable operating segment is allocated to that segment. Goodwill arising in a Group entity, which is not within a reportable operating segment, is allocated to that entity’s own operations, or, if that entity is managed in conjunction with another Group entity, to their combined operations. Goodwill arising from an investment in an associate is included in the carrying value of the investment. Goodwill is tested annually for impairment and whenever there is an indication of impairment. Goodwill is carried at cost less accumulated impairment. An impairment loss is recognised for the amount by which the carrying amount of goodwill exceeds its recoverable amount. The recoverable amount is the higher of an operating segment's (or operation's) fair value less costs to sell and its value in use. On the disposal of a subsidiary or insurance business, the associated goodwill is de-recognised and is included in the gain or loss on disposal. On the disposal of a subsidiary or insurance business forming part of a reportable operating segment, the proportion of goodwill disposed is the proportion of the fair value of the asset disposed to the total fair value of the operating segment. .
2.7 Intangible assets (continued) (b) Other intangible assets Other intangible assets identified on acquisition are recognised only if future economic benefits attributable to the asset will flow to the Group and if the fair value of the asset can be measured reliably. In addition, for the purposes of recognition, the intangible asset must be separable from the business being acquired or must arise from contractual or legal rights. Intangible assets acquired in a business combination are initially recognised at their fair value. Other intangible assets, which have been acquired directly, are recorded initially at cost. On acquisition, the useful life of the asset is estimated. If the estimated useful life is definite, then the cost of the asset is amortised over its life, and is tested for impairment when there is evidence of same. If the estimated useful life is indefinite, the asset is tested annually for impairment. An impairment loss is recognised for the amount by which the asset’s carrying amount exceeds its recoverable amount. The recoverable amount is the higher of an asset’s fair value less costs to sell and its value in use. The estimated useful lives of recognised intangible assets are as follows:
Class of intangible asset Asset Estimated useful life
Customer related Customer relationships 4 - 20 years Broker relationships 10 years
Contract based Syndicate capacity Indefinite Licences 15 years
Technology based Software 2 – 10 years
Notes to the Financial Statements Sagicor Financial Corporation Year ended December 31, 2013 Amounts expressed in US$000
Sagicor Financial Corporation 14
2.8 Financial assets a) Classification The Group classifies its financial assets into four categories:
held to maturity financial assets; available for sale financial assets; financial assets at fair value through income; loans and receivables.
Management determines the appropriate classification of these assets on initial recognition. Held to maturity financial assets are non-derivative financial instruments with fixed or determinable payments and fixed maturities that management has both the intent and ability to hold to maturity. Loans and receivables are non-derivative financial assets with fixed or determinable payments that are not quoted in an active market. Financial assets in the category at fair value through income comprise designated assets or held for trading assets. These are set out below. Assets designated by management on acquisition form part of managed portfolios whose
performance is evaluated on a fair value basis in accordance with documented investment strategies. They comprise investment portfolios backing deposit administration and unit linked policy contracts for which the full return on the portfolios accrue to the contract-holders.
Held for trading securities are acquired principally for the purpose of selling in the short-term or if
they form part of a portfolio of financial assets in which there is evidence of short-term profit taking. Derivatives are also classified as held for trading unless designated as hedges.
Available for sale financial assets are non-derivative financial instruments intended to be held for an indefinite period of time and which may be sold in response to liquidity needs or changes in interest rates, exchange rates and equity prices.
2.8 Financial assets (continued) (b) Recognition and measurement Purchases and sales of financial investments are recognised on the trade date. Interest income arising on investments is accrued using the effective yield method. Dividends are recorded in revenue when due. Held to maturity assets, loans and receivables are carried at amortised cost less provision for impairment. Financial assets in the category at fair value through income are measured initially at fair value and are subsequently re-measured at their fair value based on quoted prices or internal valuation techniques. Realised and unrealised gains and losses are recorded as net gains in investment income. Interest and dividend income are recorded under their respective heads in investment income.
Financial assets in the available for sale category are measured initially at fair value and are subsequently re-measured at their fair value based on quoted prices or internal valuation techniques. Unrealised gains and losses, net of deferred income taxes, are reported in other comprehensive income. Either on the disposal of the asset or if the asset is determined to be impaired, the previously recorded unrealised gain or loss is transferred to investment income. Discounts and premiums on available for sale securities are amortised using the effective yield method. (c) Fair value Fair value amounts represent the price (or estimates thereof) that would be agreed upon in an orderly transaction between market participants at valuation date.
Notes to the Financial Statements Sagicor Financial Corporation Year ended December 31, 2013 Amounts expressed in US$000
15 Sagicor Financial Corporation
2.8 Financial assets (continued) (d) Impaired financial assets A financial asset is considered impaired if its carrying amount exceeds its estimated recoverable amount. An impairment loss for assets carried at amortised cost is calculated as the difference between the carrying amount and the present value of expected future cash flows discounted at the original effective interest rate. The carrying value of impaired financial assets is reduced by impairment losses. The recoverable amount for an available for sale security is its fair value. For an available for sale equity security or investment in an associated company, an impairment loss is recognised in income if there has been a significant or prolonged decline in its fair value below its cost. Determination of what is significant or prolonged requires judgement which includes consideration of the volatility of the fair value, and the financial condition and financial viability of the investee. In this context, management considers a 40% decline in fair value below cost to be significant. Any subsequent increase in fair value occurring after the recognition of an impairment loss is reported in other comprehensive income. For an available for sale security other than an equity security, if the Group assesses that there is objective evidence that the security is impaired, an impairment loss is recognised for the amount by which the instrument’s amortised cost exceeds its fair value. If in a subsequent period the impairment loss decreases and the decrease can be related objectively to an event occurring after the impairment was recognised, the previously recognised impairment loss is reversed, and the amount of the reversal is recognised in revenue.
2.8 Financial assets (continued)
(e) Securities purchased for re-sale Securities purchased under agreements to resell are recognised initially at fair value and are subsequently stated at amortised cost. Securities purchased for re-sale are treated as collateralised financing transactions. The difference between the purchase and resale price is treated as interest and is accrued over the life of the agreements using the effective yield method. (f) Finance leases The Group, as lessor, enters into finance leases with third parties to lease assets. Finance leases are leases in which the Group has transferred substantially the risks of ownership to the lessee. The finance lease, net of unearned finance income, is recorded as a receivable and the finance income is recognised over the term of the lease using the effective yield method. (g) Embedded derivatives The Group holds certain bonds and preferred equity securities that contain options to convert into common shares of the issuer. These options are considered embedded derivatives. If the measurement of an embedded derivative can be separated from its host contract, the embedded derivative is carried at current market value and is presented with its related host contract. Unrealised gains and losses are recorded as investment income. If the measurement of an embedded derivative cannot be separated from its host contract, the full contract is accounted for as a financial asset at fair value through income.
Notes to the Financial Statements Sagicor Financial Corporation Year ended December 31, 2013 Amounts expressed in US$000
Sagicor Financial Corporation 16
2.9 Real estate developed or held for resale Lands being made ready for resale along with the cost of infrastructural works are classified as real estate held for resale and are stated at the lower of carrying value and fair value less costs to sell. Real estate acquired through foreclosure is classified as real estate held for resale and is stated at the lower of carrying value and fair value less costs to sell. Gains and losses realised on the sale of real estate are included in revenue at the time of sale. 2.10 Policy contracts (a) Classification The Group issues policy contracts that transfer insurance risk and / or financial risk from the policyholder. The Group defines insurance risk as an insured event that could cause an insurer to pay significant additional benefits in a scenario that has a discernible effect on the economics of the transaction. Insurance contracts transfer insurance risk and may also transfer financial risk. Once a contract has been classified as an insurance contract, it remains an insurance contract for its duration, even if the insurance risk reduces significantly over time. Investment contracts transfer financial risk and no significant insurance risk. Financial risk includes credit risk, liquidity risk and market risk. A reinsurance contract is an insurance contract in which an insurance entity cedes assumed risks to another insurance entity.
2.10 Policy contracts (continued) A number of insurance contracts contain a discretionary participation feature. A discretionary participation feature entitles the holder to receive, supplementary to the main benefit, additional benefits or bonuses:
that are likely to be a significant portion of the total contractual benefits;
whose amount or timing is contractually at the discretion of management; and
that are contractually based on o the performance of a specified pool of contracts; o investment returns on a specified pool of assets held by the insurer; or o the profit or loss of a fund or insurer issuing the contract.
Policy bonuses and policy dividends constitute discretionary participation features which the Group classifies as liabilities. Residual gains in the participating accounts constitute discretionary participation features which the Group classifies as equity (see also note 2.20).
(b) Recognition and measurement (i) Property and casualty insurance contracts Property and casualty insurance contracts are generally one year renewable contracts issued by the insurer covering insurance risks over property, motor, accident and liability. Property insurance contracts provide coverage for the risk of property damage or of loss of property. Commercial property, homeowners’ property, motor and certain marine property are common types of risks covered. For commercial policyholders insurance may include coverage for loss of earnings arising from the inability to use property which has been damaged or lost. Casualty insurance contracts provide coverage for the risk of causing physical harm or financial loss to third parties. Personal accident, employers’ liability, public liability, product liability and professional indemnity are common types of casualty insurance.
Notes to the Financial Statements Sagicor Financial Corporation Year ended December 31, 2013 Amounts expressed in US$000
17 Sagicor Financial Corporation
2.10 Policy contracts (continued) Premium revenue is recognised as earned on a pro-rated basis over the term of the respective policy coverage. If alternative insurance risk exposure patterns have been established over the term of the policy coverage, then premium revenue is recognised in accordance with the risk exposure. The provision for unearned premiums represents the portion of premiums written relating to the unexpired terms of coverage. Claims and loss adjustment expenses are recorded as incurred. Claim reserves are established for both reported and un-reported claims. Claim reserves represent estimates of future payments of claims and related expenses less anticipated recoveries with respect to insured events that have occurred up to the date of the financial statements. The claim reserve is discounted for separate reserving classes of insurance where the expected average interval between the dates of incurral and settlement is at least 4 years (defined as long-tail claims). The claim reserve is not discounted for other reserving classes of insurance. For each reserving class, claims data is aggregated separately to which particular statistical techniques and common estimation factors are applied. For example, direct motor is divided into sub-classes, injury and property damage. Injury claims are discounted because they satisfy the criteria of being long-tail claims, while property damage claims are not discounted. An insurer may obtain reinsurance coverage for its property and casualty insurance risks. The reinsurance ceded premium is expensed on a pro-rata basis over the term of the respective policy coverage or of the reinsurance contract as appropriate. Reinsurance claim recoveries are established at the time of the recording of the claim liability and are computed on a basis which is consistent with the computation of the claim liability. Profit sharing commission due to the Group is accrued as commission income when there is reasonable certainty of earned profit. Commissions and premium taxes payable are recognised on the same basis as premiums earned. At the date of the financial statements, commissions, premium taxes and acquisition-related administrative expenses attributable to unearned premiums are recorded as deferred policy acquisition costs. Profit sharing commission payable by the Group arises from contracts between an insurer and a broker; it is accrued on an aggregate basis and it is adjusted to actual in respect of each individual contract when due.
2.10 Policy contracts (continued) (ii) Health insurance contracts Health insurance contracts are generally one year renewable contracts issued by the insurer covering insurance risks for medical expenses of insured persons. Premium revenue is accrued when due for contracts where the premium is billed monthly. For contracts where the premium is billed annually or semi-annually, premium revenue is recognised as earned on a pro-rata basis over the term of the respective policy coverage. The provision for unearned premiums represents the portion of premiums written relating to the unexpired terms of coverage. Claims are recorded on settlement. Reserves are recorded as described in note 2.11. An insurer may obtain reinsurance coverage for its health insurance risks. The reinsurance ceded premium is expensed on a pro-rata basis over the term of the respective policy coverage or of the reinsurance contract as appropriate. Commissions and premium taxes payable are recognised on the same basis as premiums earned. (iii) Long-term traditional insurance contracts Long-term traditional insurance contracts are generally issued for fixed terms of five years or more, or for the remaining life of the insured. Benefits are typically a death, disability or critical illness benefit, a cash value on termination and/or a monthly annuity. Annuities are generally payable until the death of the beneficiaries with a proviso for a minimum number of payments. Some of these contracts have a discretionary participation feature in the form of regular bonuses or dividends. Other benefits such as disability and waiver of premium on disability may also be included in these contracts. Some contracts may allow for the advance of policy loans to the policyholder and may also allow for dividend withdrawals by the policyholder during the life of the contract. Premium revenue is recognised when due. Typically, premiums are fixed and are required to be paid within the due period for payment. If premiums are unpaid, either the contract may terminate, an automatic premium loan may settle the premium, or the contract may continue at a reduced value.
Notes to the Financial Statements Sagicor Financial Corporation Year ended December 31, 2013 Amounts expressed in US$000
Sagicor Financial Corporation 18
2.10 Policy contracts (continued) Policy benefits are recognised on the notification of death, disability or critical illness, on the termination or maturity date of the contract, on the declaration of a cash bonus or dividend or on the annuity payment date. Policy loans advanced are recorded as loans and receivables in the financial statements and are secured by the cash values of the respective policies. Policy bonuses may be “non-cash” and utilised to purchase additional amounts of insurance coverage. Accumulated cash bonuses and dividends are recorded as interest bearing policy balances. Reserves for future policy liabilities are recorded as described in note 2.11. An insurer may obtain reinsurance coverage for death benefit insurance risks. Typically, coverage is obtained for individual coverage exceeding prescribed limits. The reinsurance premium is expensed when due, which generally coincides with when the policy premium is due. Reinsurance claim recoveries are established at the time of claim notification. Commissions and premium taxes payable are recognised on the same basis as earned premiums. (iv) Long-term universal life and unit linked insurance contracts Universal life and unit linked insurance contracts are generally issued for fixed terms or for the remaining life of the insured. Benefits are typically a death, disability or critical illness benefit, a cash value on termination and/or a monthly annuity. Annuities are generally payable until the death of the beneficiaries with a proviso for a minimum number of payments. Benefits may include amounts for disability or waiver of premium on disability. Universal life and unit linked contracts have either an interest bearing investment account or unit linked investment accounts. Either gross premiums or gross premiums net of allowances are deposited to the investment accounts. Investment returns are credited to the investment accounts and expenses, not included in the aforementioned allowances, are debited to the investment accounts. Interest bearing investment accounts may include provisions for minimum guaranteed returns or returns based on specified investment indices. Allowances and expense charges are in respect of applicable commissions, cost of insurance, administrative expenses and premium taxes. Fund withdrawals may be permitted.
2.10 Policy contracts (continued) Premium revenue is recognised when received and consists of all monies received from the policyholders. Typically, premiums are fixed at the inception of the contract or periodically thereafter but additional non-recurring premiums may be paid. Policy benefits are recognised on the notification of death, disability or critical illness, on the receipt of a withdrawal request, on the termination or maturity date of the contract, or on the annuity payment date. Reserves for future policy liabilities are recorded as described in note 2.11. An insurer may obtain reinsurance coverage for death benefit insurance risks. Typically, coverage is obtained for individual coverage exceeding prescribed limits. The reinsurance premium is expensed when due, which generally coincides with when the policy premium is due. Reinsurance claims recoveries are established at the time of claim notification. Commissions and premium taxes payable are generally recognised only on settlement of premiums.
(v) Reinsurance contracts assumed
Reinsurance contracts assumed by an insurer are accounted for in a similar manner as if the insurer has assumed the risk direct from a policyholder. Reinsurance contracts assumed include blocks of life and annuity policies assumed from third party insurers. In some instances, the Group also administers these policies.
(vi) Reinsurance contracts held As noted in sections (i) to (iv) above, an insurer may obtain reinsurance coverage for insurance risks underwritten. The Group cedes insurance premiums and risk in the normal course of business in order to limit the potential for losses arising from its exposures. Reinsurance does not relieve the originating insurer of its liability.
Notes to the Financial Statements Sagicor Financial Corporation Year ended December 31, 2013 Amounts expressed in US$000
19 Sagicor Financial Corporation
2.10 Policy contracts (continued) Reinsurance contracts held by an insurer are recognised and measured in a similar manner to the originating insurance contracts and in accordance with the contract terms. Reinsurance premium ceded and reinsurance recoveries on claims are offset against premium revenue and policy benefits in the income statement. The benefits to which an insurer is entitled under its reinsurance contracts held are recognised as reinsurance assets or receivables. Reinsurance assets and receivables are assessed for impairment. If there is evidence that the asset or receivable is impaired, the impairment is recorded in the statement of income. The obligations of an insurer under reinsurance contracts held are included in accounts payable and accrued liabilities and in actuarial liabilities. Reinsurance balances are measured consistently with the insurance liabilities to which they relate.
(vii) Deposit administration and other investment contracts
Deposit administration contracts are issued by an insurer to registered pension schemes for the deposit of pension plan assets with the insurer. Deposit administration liabilities are recognised initially at fair value and are subsequently stated at: amortised cost where the insurer is obligated to provide investment returns to the pension
scheme in the form of interest;
fair value through income where the insurer is obligated to provide investment returns to the
pension scheme in direct proportion to the investment returns on specified blocks of assets. Deposit administration contributions are recorded directly as liabilities. Withdrawals are deducted directly from the liability. The interest or investment return provided is recorded as an interest expense. In addition, the Group may provide pension administration services to the pension schemes. The Group earns fee income for both pension administration and investment services.
2.10 Policy contracts (continued) Other investment contracts are recognised initially at fair value and are subsequently stated at amortised cost and are accounted for in the same manner as deposit administration contracts which are similarly classified. (c) Embedded derivatives Certain insurance contracts contain embedded derivatives which are options whose value may vary in response to changes in interest rates or other market variables. The Group does not separately measure embedded derivatives that are closely related to the host insurance contract or that meet the definition of an insurance contract. Options to surrender an insurance contract for a fixed amount are also not measured separately. In these cases, the entire contract liability is measured as set out in note 2.11. (d) Liability adequacy tests At the date of the financial statements, liability adequacy tests are performed by each insurer to ensure the adequacy of insurance contract liabilities, using current estimates of the related expected future cash flows. If a test indicates that the carrying value of insurance contract liabilities is inadequate, then the liabilities are adjusted to correct the deficiency. The deficiency is included in the income statement under benefits. 2.11 Actuarial liabilities (a) Life insurance and annuity contracts The determination of actuarial liabilities of long-term insurance contracts has been done using Canadian accepted actuarial standards (recognizing local conditions). These liabilities consist of the amounts that, together with future premiums and investment income, are required to provide for future policy benefits, expenses and taxes on insurance and annuity contracts. Canadian standards may change from time to time, but infrequently.
Notes to the Financial Statements Sagicor Financial Corporation Year ended December 31, 2013 Amounts expressed in US$000
Sagicor Financial Corporation 20
2.11 Actuarial liabilities (continued)
The process of calculating life insurance and annuity actuarial liabilities for future policy benefits necessarily involves the use of estimates concerning such factors as mortality and morbidity rates, future investment yields, future expense levels and persistency, including reasonable margins for adverse deviations. As experience unfolds, these resulting provisions for adverse deviations will be included in future income to the extent they are released when they are no longer required to cover adverse experience. Assumptions used to project benefits, expenses and taxes are based on insurer and industry experience and are updated annually. The Canadian accepted actuarial standards for the valuation of policy liabilities are based on an explicit projection of cash flows using best estimate assumptions for each material cash flow item and contingency. Investment returns are based on projected investment income using the current asset portfolios and projected re-investment strategies. Each assumption is adjusted by a margin for adverse deviation. Under this methodology, assets of each insurer are selected to back its actuarial liabilities. Changes in the carrying value of these assets may generate corresponding changes in the carrying amount of the associated actuarial liabilities. These assets include available for sale securities, whose unrealised gains or losses in fair value are recorded in other comprehensive income. The fair value reserve for actuarial liabilities has been established in the statement of equity for the accumulation of changes in actuarial liabilities which are recorded in other comprehensive income and which arise from recognised unrealised gains or losses in fair value of available for sale securities.
Certain life insurance policies issued by the insurer contain equity linked policy side funds. The investment returns on these unitised funds accrue directly to the policies with the insurer assuming no credit risk. Investments held in these side funds are accounted for as financial assets at fair value through income and unit values of each fund are determined by dividing the value of the assets in the fund at the date of the financial statements by the number of units in the fund. The resulting liability is included in actuarial liabilities. (b) Health insurance contracts The actuarial liabilities of health insurance policies are estimated in respect of claims that have been incurred but not yet reported or settled.
2.12 Financial liabilities During the ordinary course of business, the Group issues investment contracts or otherwise assumes financial liabilities that expose the Group to financial risk. The recognition and measurement of the Group’s principal types of financial liabilities are disclosed in note 2.10(b) (vii) and in the following paragraphs. (a) Securities sold for re-purchase Securities sold under agreements to repurchase are recognised initially at fair value and are subsequently stated at amortised cost. Securities sold for re-purchase are treated as collateralised financing transactions. The difference between the sale and re-purchase price is treated as interest and is accrued over the life of the agreements using the effective yield method. (b) Deposit liabilities Deposits are recognised initially at fair value and are subsequently stated at amortised cost using the effective yield method. (c) Loans and other debt obligations Loans and other debt obligations are recognised initially at fair value, being their issue proceeds, net of transaction costs incurred. Subsequently, obligations are stated at amortised cost and any difference between net proceeds and the redemption value is recognised in the income statement over the period of the loan obligations using the effective yield method. Obligations undertaken for the purposes of financing operations and capital support are classified as notes or loans payable and the associated cost is classified as finance costs. Loan obligations undertaken for the purposes of providing funds for on-lending, leasing or portfolio investments are classified as deposit and security liabilities and the associated cost is included in interest expense. (d) Fair value Fair value amounts represent the price (or estimates thereof) that would be agreed upon in an orderly transaction between market participants at valuation date.
Notes to the Financial Statements Sagicor Financial Corporation Year ended December 31, 2013 Amounts expressed in US$000
21 Sagicor Financial Corporation
2.13 Provisions Provisions are recognised when the Group has a legal or constructive obligation, as a result of past events, if it is probable that an outflow of resources will be required to settle the obligation, and a reliable estimate of the amount can be made. 2.14 Derivative financial instruments and hedging activities Derivatives are financial instruments that derive their value from the price of underlying items such as equities, bonds, interest rates, foreign exchange, credit spreads, commodities or other indices. Derivatives enable users to increase, reduce or alter exposure to credit or market risk. The Group transacts derivatives for three primary purposes: to create risk management solutions for customers, for proprietary trading purposes, and to manage its own exposure to credit and market risk. Derivative financial instruments are initially recognised at fair value on the date a derivative contract is entered into, and subsequently are re-measured at their fair value at each financial statement date. The method of recognising the resulting gain or loss depends on whether the derivative is designated as a hedging instrument, and if so, the nature of the item being hedged. Fair values are obtained from quoted market prices, discounted cash flow models and option pricing models as appropriate. The Group documents at the inception of the transaction the relationship between hedging instruments and hedged items, as well as risk management objectives and strategies for undertaking various hedging transactions. The Group also documents its assessments, both at hedge inception and on an ongoing basis, of whether the derivatives that are used in hedging transactions are highly effective in offsetting changes in fair values or cash flows of hedged items. For cash flow hedges, gains and losses relating to the effective portion of changes in the fair value of derivatives are initially recognised in other comprehensive income, and are transferred to the statement of income when the forecast cash flows affect income. The gain or loss relating to the ineffective portion is recognised immediately in the statement of income. Gains and losses from changes in the fair value of derivatives that do not qualify for hedge accounting are included in net investment income or interest expense.
2.15 Offsetting financial instruments Financial assets and liabilities are offset and the net amount is reported in the statement of financial position when there is a legally enforceable right to offset and there is an intention to settle on a net basis or to realise the asset and settle the liability simultaneously. 2.16 Presentation of current and non-current assets and liabilities In note 41.2, the maturity profiles of financial and insurance assets and liabilities are identified. For other assets and liabilities, balances presented in notes 5 to 8, 10 to 12, 14, 18, 19, 31 and 33 are non-current unless otherwise stated in those notes.
Notes to the Financial Statements Sagicor Financial Corporation Year ended December 31, 2013 Amounts expressed in US$000
Sagicor Financial Corporation 22
2.17 Employee benefits
(a) Pension benefits
Group companies have various pension schemes in place for their employees. Some schemes are defined benefit plans and others are defined contribution plans. The liability in respect of defined benefit plans is the present value of the defined benefit obligation at December 31 less the fair value of plan assets. The defined benefit obligation is computed using the projected unit credit method. The present value of the defined benefit obligation is determined by the estimated future cash outflows using appropriate interest rates on government bonds for the maturity dates and currency of the related liability. Actuarial gains and losses arising from experience adjustments and changes in actuarial assumptions are charged or credited to the other comprehensive income and retained earnings or minority interest in the period in which they arise. Past service costs are charged to income in the period in which they arise. For defined contribution plans, the Group pays contributions to the pension schemes on a mandatory or contractual basis. Once paid, the Group has no further payment obligations. Contributions are recognised in income in the period in which they are due.
(b) Other retirement benefits
Certain Group subsidiaries provide supplementary health and life insurance benefits to qualifying employees upon retirement. The entitlement to these benefits is usually based on the employee remaining in service up to retirement age and the completion of a minimum service period. The expected costs of these benefits are accrued over the period of employment, using an accounting methodology similar to that for defined benefit pension plans. Actuarial gains and losses arising from experience adjustments and changes in actuarial assumptions are charged or credited to the other comprehensive income and retained earnings or minority interest in the period in which they arise.
2.17 Employee benefits (continued) (c) Profit sharing and bonus plans The Group recognises a liability and an expense for bonuses and profit sharing, based on various profit and other objectives of the Group as a whole or of individual subsidiaries. An accrual is recognised where there are contractual obligations or where past practice has created a constructive obligation.
(d) Equity compensation benefits The Group has a number of share-based compensation plans in place for administrative, sales and managerial staff.
(i) Equity-settled share-based transactions with staff
The services received in an equity-settled transaction with staff are measured at the fair value of the equity instruments granted. The fair value of those equity instruments is measured at grant date. If the equity instruments granted vest immediately and the individual is not required to complete a further period of service before becoming entitled to those instruments, the services received are recognised in full on grant date in the income statement for the period, with a corresponding increase in equity. Where the equity instruments do not vest until the individual has completed a further period of service, the services received are expensed in the income statement during the vesting period, with a corresponding increase in the reserve for equity compensation benefits or in minority interest. Non-market vesting conditions are included in assumptions about the number of instruments that are expected to vest. At each reporting financial statement date, the Group revises its estimates of the number of instruments that are expected to vest based on the non-marketing vesting conditions and adjusts the expense accordingly. Amounts held in the reserve for equity compensation benefits are transferred to share capital or minority interest either on the distribution of share grants or on the exercise of share options.
Notes to the Financial Statements Sagicor Financial Corporation Year ended December 31, 2013 Amounts expressed in US$000
23 Sagicor Financial Corporation
2.17 Employee benefits (continued) The grant by the Company of its equity instruments to employees of Group subsidiaries is treated as a capital contribution in the financial statements of the subsidiary. The full expense relating to the grant is recorded in the subsidiary’s income statement. (ii) Cash-settled share-based transactions with staff The services received in a cash-settled transaction with staff and the liability to pay for those services, are recognised at fair value as the individual renders services. Until the liability is settled, the fair value of the liability is re-measured at the date of the financial statements and at the date of settlement, with any changes in fair value recognised in income during that period. (iii) Measurement of the fair value of equity instruments granted The equity instruments granted consist either of grants of, or options to purchase, common shares of listed entities within the Group. For common shares granted, the listed price prevailing on the grant date determines the fair value. For options granted, the fair value is determined by reference to the Black-Scholes valuation model, which incorporates factors and assumptions that knowledgeable, willing market participants would consider in setting the price of the equity instruments. (e) Termination benefits Termination benefits are payable whenever an employee’s employment is terminated before the normal retirement date or whenever an employee accepts voluntary redundancy in exchange for these benefits. The Group recognises termination benefits when it is demonstrably committed to either terminate the employment of current employees according to a detailed formal plan without the possibility of withdrawal or to provide termination benefits as a result of an offer made to encourage voluntary redundancy. Benefits falling due more than twelve months after the date of the financial statements are discounted to present value.
2.18 Taxes (a) Premium taxes
Insurers are subject to tax on premium revenues generated in certain jurisdictions. The principal rates of tax are summarised in the following table.
Premium tax rates Life insurance and
non-registered annuities
Health insurance
Property and casualty
insurance
Barbados 3% - 6% 4% 3% - 5%
Jamaica 3% Nil Nil
Trinidad and Tobago 15% 25% 25%
United States of America 0.75% - 3.5% Nil Nil
(b) Asset tax
During 2012, the Government of Jamaica introduced an asset tax. For insurance, securities dealers and deposit taking institutions, the tax is 0.14% of adjusted assets held at the end of the year.
(c) Income taxes
The Group is subject to taxes on income in the jurisdictions in which business operations are conducted. Rates of taxation in the principal jurisdictions for the current year are set out in the next table.
.
Notes to the Financial Statements Sagicor Financial Corporation Year ended December 31, 2013 Amounts expressed in US$000
Sagicor Financial Corporation 24
2.18 Taxes (continued)
Income tax rates Life insurance and
non-registered annuities
Registered annuities
Other lines of business
Barbados 5% of gross
investment income Nil
25% of net income
Jamaica 15% of
investment income Nil
15% - 33.33% of net income
Trinidad and Tobago 15% - 25% of
investment income Nil
25% of net income
United States of America 35%
of net income 35%
of net income 35%
of net income
(i) Current income taxes Current tax is the expected tax payable on the taxable income for the year, using the tax rates in effect for the year. Adjustments to tax payable from prior years are also included in current tax.
(ii) Deferred income taxes
Deferred income tax is recognised, using the liability method, on temporary differences arising between the tax bases of assets and liabilities and their carrying amounts in the financial statements. Deferred income taxes are computed at tax rates that are expected to apply to the period when the asset is realised or the liability settled. Deferred tax assets are only recognised when it is probable that taxable profits will be available against which the asset may be utilised. Deferred income tax assets and liabilities are offset when there is a legally enforceable right to do so. Deferred tax, related to fair value re-measurement of available for sale investments and cash flow hedges which are recorded in other comprehensive income, is recorded in other comprehensive income and is subsequently recognised in income together with the deferred gain or loss.
2.19 Common and preference shares (continued) (a) Common shares In exchange for consideration received, the Company has issued common shares that are classified as equity. Incremental costs directly attributable to the issue of common shares are recorded in share capital as a deduction from the share issue proceeds. Where a Group entity purchases the Company’s common shares, the consideration paid, including any directly attributable cost, is deducted from share capital and is recorded as treasury shares. Where such shares are subsequently sold to a third party, the deduction from share capital is reversed, and any difference with net consideration received is recorded in retained earnings. (b) Preference shares On July 18, 2011, the Company issued convertible redeemable preference shares that are accounted for as a compound financial instrument. The shares are contractually redeemable on July 18, 2016 if the shareholder has not opted to convert the shares prior to this date. Dividends may be declared semi-annually by the Company’s directors. The redemption value is recognised as a contractual liability, and is measured initially at its discounted fair value. The discount rate reflects as of July 18, 2011: (i) the rate of interest applicable to a similar liability with a contractual dividend rate, and (ii) the interest premium required by the shareholder for an instrument with a non-contractual dividend. The liability component is disclosed in note 16. The preference shareholders’ rights to receive dividends is recognised within shareholders’ equity, and is measured initially as the residual fair value of the preference shares in their totality after deducting the liability for the redemptive value. The equity component is initially recorded as a preference share reserve in note 22. Incremental costs directly attributable to the issue of the preference shares are allocated between the liability for the redemption value and the equity reserve in proportion to their initial carrying amounts. After initial recognition, the liability component is accreted to its ultimate redemption value using the effective interest yield method, with the accretion being recorded as a finance cost in the statement of income. After initial recognition, the preference share reserve is transferred to retained earnings pro-rata to the dividends declared over the period to redemption.
Notes to the Financial Statements Sagicor Financial Corporation Year ended December 31, 2013 Amounts expressed in US$000
25 Sagicor Financial Corporation
2.19 Common and preference shares (continued) On the initial recognition of the preference shares, the conversion feature of the instrument was deemed to have no value. Subsequently, when a number of preference shares are converted to common shares, the associated liability for redemption will be extinguished and consequently will be transferred to the share capital account for common shares. Additionally at conversion, the proportion of the preference share reserve attributable to the converted number of preference shares will also be transferred to the share capital account for common shares. In summary, the total transfer to the share capital account for common shares will approximate the original consideration for the converted number of preference shares less attributable issue costs.
(c) Dividends On the declaration by the Company’s directors of common or preference share dividends payable, the total value of the dividend is recorded as an appropriation of retained earnings. 2.20 Participating accounts (a) “Closed” participating account
For participating policies of Sagicor Life Inc in force at de-mutualisation, Sagicor Life Inc established a closed participating account in order to protect the guaranteed benefits and future policy dividends, bonuses and other non-guaranteed benefits of the afore-mentioned policies. The rules of this account require that premiums, benefits, actuarial reserve movements, investment returns, expenses and taxes, attributable to the said policies, are recorded in a closed participating fund. Policy dividends and bonuses of the said policies are paid from the participating fund on a basis substantially the same as prior to de-mutualisation.
Distributable profits of the closed participating account are distributed to the participating policies in the form of declared bonuses and dividends. Undistributed profits remain in the participating account for the benefit of participating policyholders.
2.20 Participating accounts (continued) The participating account also includes an ancillary fund comprising the required provisions for adverse deviations as determined in the computation of actuarial liabilities of the said policies. Changes in the ancillary fund are not recorded in the participating account, but are borne by the general operations of Sagicor Life Inc. (b) “Open” participating account Sagicor Life Inc also established an open participating account for participating policies it issues after de-mutualisation. The rules of this account require that premiums, benefits, actuarial reserve movements, investment returns, expenses and taxes, attributable to the said policies are recorded in an open participating account. The open participating account was established at de-mutualisation. On February 1, 2005, Sagicor Life Inc amalgamated with Life of Barbados Limited, and participating policies of the latter were transferred to the open participating account. Accordingly, the liabilities of these participating policies and matching assets were transferred to the open participating account. The liabilities transferred included an ancillary fund comprising the provisions for adverse deviations on the transferred policies. Changes in the ancillary fund are not recorded in the participating account, but are borne by the general operations of Sagicor Life Inc. Additional assets to support the profit distribution to shareholders (see below) were also transferred to the account. Distributable profits of the open participating account are shared between participating policies and shareholders in a ratio of 90:10. Profits are distributed to the participating policies in the form of declared bonuses and dividends. Profits which are distributed to shareholders are included in the allocation of Group net income to shareholders. Undistributed profits / (losses) remain in the participating account in equity.
Notes to the Financial Statements Sagicor Financial Corporation Year ended December 31, 2013 Amounts expressed in US$000
Sagicor Financial Corporation 26
2.20 Participating accounts (continued)
(c) Financial statement presentation The assets and liabilities of the participating accounts are included but not presented separately in the financial statements. The revenues, benefits and expenses of the participating accounts are also included but not presented separately in the financial statements. However, the overall surplus of assets held in the participating funds over the associated liabilities is presented in equity as the participating accounts. The overall net income and other comprehensive income that are attributable to the participating funds are disclosed as allocations. The initial allocation of additional assets to the participating funds is recognised in equity as a transfer from retained earnings to the participating accounts. Returns of additional assets from the participating funds are accounted for similarly. 2.21 Statutory reserves Statutory reserves are established when regulatory accounting requirements result in lower distributable profits or when an appropriation of retained earnings is required or permitted by law to protect policyholders, insurance beneficiaries or depositors. 2.22 Interest income and expenses Interest income and expenses are recognised in the income statement for all interest bearing instruments on an accrual basis using the effective yield method based on the initial transaction price. Interest includes coupon interest and accrued discount and premium on financial instruments.
2.23 Fees and other revenue
Fees and non-insurance commission income are recognised on an accrual basis when the service has been provided. Fees and commissions arising from negotiating or participating in the negotiation of a transaction for a third party are recognised on completion of the underlying transaction. Portfolio and other management advisory and service fees are recognised based on the applicable service contracts, usually on a time-apportionate basis. Asset management fees related to investment funds are recognised rateably over the period in which the service is provided. Performance linked fees or fee components are recognised when the performance criteria are fulfilled. Other revenue is recognised on an accrual basis when the related service has been provided. 2.24 Cash Flows The following classifications apply to the cash flow statement. Cash flows from operating activities consist of cash flows arising from revenues, benefits, expenses, taxes, operating assets and operating liabilities. Cash flows from investing activities consist of cash flows arising from long-term tangible and intangible assets to be utilised in the business and in respect of changes in subsidiary holdings, insurance businesses, and associated company and joint venture investments. Cash flows from financing activities consist of cash flows arising from the issue, redemption and exchange of equity instruments and notes and loans payable and from equity dividends payable to holders of such instruments. Cash and cash equivalents comprise: cash balances, call deposits, other liquid balances with maturities of three months or less from the acquisition date, less bank overdrafts which are repayable on demand, less other borrowings from financial institutions made for the purpose of meeting cash
commitments and which have maturities of three months or less from origination. Cash equivalents are subject to an insignificant risk of change in value.
Notes to the Financial Statements Sagicor Financial Corporation Year ended December 31, 2013 Amounts expressed in US$000
27 Sagicor Financial Corporation
3 CRITICAL ACCOUNTING ESTIMATES AND JUDGEMENTS The development of estimates and the exercise of judgment in applying accounting policies may have a material impact on the Group’s reported assets, liabilities, income and other comprehensive income. The items which may have the most effect on the Group’s financial statements are set out below. 3.1 Impairment of financial assets An available for sale debt security, a loan or a receivable is considered impaired when management determines that it is probable that all amounts due according to the original contract terms will not be collected. This determination is made after considering the payment history of the borrower, the discounted value of collateral and guarantees, and the financial condition and financial viability of the borrower. The determination of impairment may either be considered by individual asset or by a grouping of assets with similar relevant characteristics. 3.2 Recognition and measurement of intangible assets The recognition and measurement of intangible assets, other than goodwill, in a business combination involve the utilisation of valuation techniques which may be very sensitive to the underlying assumptions utilised. These intangibles may be marketing related, customer related, contract based or technology based. For significant amounts of intangibles arising from a business combination, the Group utilises independent professional advisors to assist management in determining the recognition and measurement of these assets.
2.25 Future accounting developments and reporting changes Certain new standards and amendments to existing standards have been issued but are not effective for the periods covered by these financial statements. The changes in standards and interpretations which may have a significant effect on future presentation, measurement or disclosure of the Group’s financial statements are summarised in the following tables.
Offsetting Financial Assets and Financial Liabilities These amendments clarify the presentation of certain offsetting requirements and amend the disclosure to include information on the effect of netting arrangements.
IFRS 9 – Financial Instruments (January 1, 2018)
Classification and measurement of financial instruments IFRS 9 uses a single approach to determine whether a financial asset is measured at amortised cost or fair value. The determination is based on how an entity manages its financial instruments and the contractual cash flow characteristics of the financial assets. IFRS 9 has amended the treatment, applicable to financial liabilities designated at fair value, of changes in own credit risk. Such changes are to be recorded in other comprehensive income unless part of a hedging relationship. Amendments have been made to hedge accounting with the most significant improvements applying to the hedging of non-financial risk. New requirements for the impairment of financial assets are to be finalised. In addition, limited amendments to the classification and measurement requirements are to be incorporated.
Notes to the Financial Statements Sagicor Financial Corporation Year ended December 31, 2013 Amounts expressed in US$000
Sagicor Financial Corporation 28
3.3 Impairment of intangible assets (a) Goodwill The assessment of goodwill impairment involves the determination of the fair value of the cash generating business units to which the goodwill has been allocated. Determination of fair value involves the estimation of future cash flows or of income after tax of these business units and the expected returns to providers of capital to the business units and / or to the Group as a whole. The Group updates its business unit financial projections annually and applies discounted cash flow or earnings multiple models to these projections to determine if there is any impairment of goodwill. The assessment of whether goodwill is impaired can be highly sensitive to the inputs of cash flows, income after tax, discount rate, growth rate or capital multiple, which are used in the computation. Further details of the inputs used are set out in note 8.2. (b) Other intangible assets The assessment of impairment of other intangible assets involves the determination of the intangible’s fair value or value in use. In the absence of an active market for an intangible, its fair value may need to be estimated. In determining an intangible’s value in use, estimates are required of future cash flows generated as a result of holding the asset. 3.4 Valuation of actuarial liabilities (a) Canadian Actuarial Standards (recognizing local conditions) The objective of the valuation of policy liabilities is to determine the amount of the insurer’s assets that, in the opinion of the Appointed Actuary (AA) and taking into account the other pertinent items in the financial statements, will be sufficient without being excessive to provide for the policy liabilities over their respective terms. The amounts set aside for future benefits are dependent on the timing of future asset and liability cash flows.
3.4 Valuation of actuarial liabilities (continued) The actuarial liabilities are determined as the present value of liability cash flows discounted at effective interest rates resulting in a value equivalent to the market value of assets supporting these policy liabilities under an adverse economic scenario. The AA identifies a conservative economic scenario forecast, and together with the existing investment portfolio as at the date of the actuarial valuation and assumed reinvestment of net asset and policy liability cash flows, calculates the actuarial liabilities required at the date of valuation to ensure that sufficient monies are available to meet the liabilities as they become due in future years. The methodology produces the total reserve requirement for each policy group fund. In general, the methodology is used to determine the net overall actuarial liabilities required by the insurer. Actuarial liabilities are computed by major group of policies and are used to determine the amount of reinsurance balances in the reserve, the distribution of the total reserve by country (for statutory reporting), and the distribution of the reserve by policy, and other individual components in the actuarial liabilities. (b) Best estimate reserve assumptions & provisions for adverse deviations Actuarial liabilities include two major components: a best estimate reserve and a provision for adverse deviations. The latter provision is established in recognition of the uncertainty in computing best estimate reserves, to allow for possible deterioration in experience and to provide greater comfort that reserves are adequate to pay future benefits. For the respective reserve assumptions for mortality and morbidity, lapse, future investment yields, operating expenses and taxes, best estimate reserve assumptions are determined where appropriate. The assumption for operating expenses and taxes is in some instances split by participating, non-participating and universal life / unit linked business. Provisions for adverse deviations are established in accordance with the risk profiles of the business, and are, as far as is practicable, standardised across geographical areas. Provisions are determined within a specific range established by the Canadian Standards of Practice.
Notes to the Financial Statements Sagicor Financial Corporation Year ended December 31, 2013 Amounts expressed in US$000
29 Sagicor Financial Corporation
3.4 Valuation of actuarial liabilities (continued) The principal assumptions and margins used in the determination of actuarial liabilities are summarised in note 13.3. However, the liability resulting from the application of these assumptions can never be definitive as to the ultimate timing or the amount of benefits payable and is therefore subject to future re-assessment. 3.5 Property and casualty insurance contracts The property and casualty insurance contracts issued by Sagicor at Lloyd's insurance syndicate 1206 (the principal business of the discontinued operation) up to and including the 2013 underwriting year of account contain material accounting judgements which may affect the Group's results until the close of the run-off period contracted with the purchaser of the discontinued operation. The significant judgements are summarised in the following sections. (a) Policy benefits payable The estimation of the ultimate liability arising from claims incurred under property and casualty insurance contracts is subject to several sources of uncertainty that need to be considered in determining the amount that the insurer will ultimately pay for such claims. Reserving for claims payable, involves the use of statistical techniques of estimation. These techniques generally involve projecting from past experience, the development of claims over time to form a view of the likely ultimate claims to be experienced, having regard to variations in business written and the underlying terms and conditions. Claim liabilities are based on estimates due to the fact that the ultimate disposition of claims incurred prior to the date of the financial statements, whether reported or not, is subject to the outcome of events that may not yet have occurred. Significant delays are experienced in the notification and settlement of certain types of claims, particularly in respect of casualty contracts. Events which may affect the ultimate outcome of claims include inter alia, jury decisions, court interpretations, legislative changes and changes in the medical condition of claimants.
3.5 Property and casualty contracts (continued) Any estimate of future losses is subject to the inherent uncertainties in predicting the course of future events. The two most critical assumptions made to determine claim liabilities are that the past is a reasonable predictor of the likely level of claims development and that the statistical estimation models used are fair reflections of the likely level of ultimate claims to be incurred. Consequently, the amounts recorded in respect of unpaid losses may change significantly in the short term. A variety of standard actuarial reserving methods are utilised to estimate claim liabilities , including claims development, expected claims ratio, Bornhuetter-Ferguson and frequency-severity methodologies. An independent actuary is engaged to confirm the claim liabilities recognised by the syndicate as of the date of the financial statements. The ultimate liability arising from claims incurred under property and casualty insurance contracts may be mitigated by recovery arising from reinsurance contracts held. (b) Premium income The syndicate writes a significant proportion of its premium by delegated authority to insurance intermediaries. Due to delays in the notification of complete and accurate premium income written, the premium income earned and the associated reinsurance, claims expense and commission balances may have to be estimated. Accordingly, premium income written has to be re-assessed for the underwriting years up to and including the 2013 underwriting year of account until the end of the run-off period and adjustments made to the ultimate results of this business. (c) Carrying value of the assets and liabilities of the discontinued operation As of December 31, 2013, the liability of the discontinued operation is the estimated residual liability due to the purchaser arising from the estimated results of the syndicate for the underwriting years of account up to and including 2013 until the end of the run-off period. The reported liability is also impacted by movements in various foreign exchange rates as the insured risks are denominated in a number different currencies. As of December 31, 2012, the assessment of fair value less costs to sell of the discontinued operation was determined on the basis of the terms of sale offered and from the outstanding bids received.
Notes to the Financial Statements Sagicor Financial Corporation Year ended December 31, 2013 Amounts expressed in US$000
Sagicor Financial Corporation 30
4 SEGMENTS The management structure of Sagicor consists of the parent company Board of Directors, the Group Chief Executive Officer (CEO), subsidiary company Boards of Directors and subsidiary company CEOs. For the parent company and principal subsidiaries, there are executive management committees made up of senior management who advise the respective CEOs. The principal subsidiaries have a full management governance structure, a consequence of their being regulated insurance and financial services entities and of the range and diversity of their products and services. The Group CEO serves as Board Chairman or as a Board Member of the principal subsidiaries and is the Group’s Chief Operating decision maker. Through subsidiary company reporting, the Group CEO obtains details of company performance and of resource allocation needs. Summarisation of planning and results and prioritisation of resource allocation is done at the parent company level where strategic decisions are taken. In accordance with the relevant financial reporting standard, the Group has determined that there are three principal subsidiary Groups within continuing operations which represent the reportable operating segments of Sagicor. These segments and other Group companies are set out in the following sections. Details of the discontinued operating segment are set out in note 38.
(a) Sagicor Life
These comprise Group subsidiaries conducting life, health and annuity insurance business, and pension administration services in (i) Barbados, Eastern Caribbean, Dutch Caribbean, Bahamas and Central America and (ii) Trinidad and Tobago. As these two segments are broadly similar in products, services, distribution, administrative and regulatory environment, they are presented on an aggregated basis in these financial statements. The companies are set out in the following two tables.
4 SEGMENTS (continued)
Sagicor Life Segment Companies
Principal Activities Country of Incorporation
Effective Shareholders’
Interest
Sagicor Life Inc Life and health insurance, annuities and pension administration services
Barbados 100%
Sagicor Capital Life Insurance Company Limited
Life and health insurance, annuities and pension administration services
Barbados 100%
Sagicor Life Aruba NV Life and health insurance, annuities and pension administration services
Aruba 100%
Capital Life Insurance Company Bahamas Limited
Life insurance The Bahamas 100%
Sagicor Panamá, SA Life and health insurance Panamá 100%
Nationwide Insurance Company Limited
Life insurance Trinidad &
Tobago 100%
Associates
RGM Limited Property ownership and management
Trinidad & Tobago
33%
FamGuard Corporation Limited Principal operating company: Family Guardian Insurance Company Limited
Investment holding company Bahamas 20%
Life and health insurance and annuities
Bahamas 20%
Primo Holding Limited Property investment Barbados 38%
Notes to the Financial Statements Sagicor Financial Corporation Year ended December 31, 2013 Amounts expressed in US$000
31 Sagicor Financial Corporation
4 SEGMENTS (continued) (b) Sagicor Jamaica This segment comprises Group subsidiaries conducting life, health, annuity, property and casualty insurance business, and pension administration services and financial services in Jamaica and Cayman Islands. In December 2013, the segment was reorganised under a newly incorporated publicly listed holding company, Sagicor Group Jamaica Limited. The reorganisation has no immediate effect on the effective shareholders' interest. The companies comprising this segment are as follows.
Sagicor Jamaica Segment Companies
Principal Activities Country of Incorporation
Effective Shareholders’
Interest Sagicor Group Jamaica Limited
Group holding company Jamaica 51%
Sagicor Life Jamaica Limited
Life and health insurance and annuities
Jamaica 51% (1)
Sagicor Life of the Cayman Islands Limited
Life insurance The Cayman
Islands 51% (1)
Sagicor Pooled Investment Funds Limited
Pension fund management Jamaica 51% (1)
Employee Benefits Administrator Limited
Pension administration services
Jamaica 51% (1)
Sagicor Re Insurance Limited
Property and casualty insurance
The Cayman Islands
51% (1)
Sagicor Insurance Brokers Limited
Insurance brokerage Jamaica 51% (1)
Sagicor International Administrators Limited
Group insurance administration
Jamaica 51% (1)
Sagicor Insurance Managers Limited
Captive insurance management services
The Cayman Islands
51% (1)
4 SEGMENTS (continued)
Sagicor Jamaica Segment Companies (continued)
Principal Activities Country of
Incorporation
Effective Shareholders’
Interest Sagicor Property Services Limited
Property management Jamaica 51% (1)
Sagicor Investments Jamaica Limited
Investment banking Jamaica 44% (2)
Sagicor Bank Jamaica Limited
Commercial banking Jamaica 44% (2)
Sagicor Costa Rica SCR, S.A.
Life insurance Costa Rica 25.5% (3)
LOJ Holdings Limited Insurance holding company Jamaica 100%
Sagicor St Lucia Limited Financial services holding company
St Lucia 51% (1)
(1) 59% prior to July 13, 2012. (2) 51% prior to July 13, 2012. Through majority
ownership of Sagicor Life Jamaica, the Group exercises control over these subsidiaries.
(3) Joint venture company which obtained regulatory approval to conduct insurance business in February 2013.
.
Notes to the Financial Statements Sagicor Financial Corporation Year ended December 31, 2013 Amounts expressed in US$000
Sagicor Financial Corporation 32
4 SEGMENTS (continued) (c) Sagicor Life USA This segment comprises Sagicor’s life insurance operations in the USA and comprises the following.
Sagicor Life USA Segment Companies
Principal Activities Country of
Incorporation
Effective Shareholders’
Interest
Sagicor Life Insurance Company
Life insurance and annuities USA - Texas 100%
Sagicor USA Inc Insurance holding company USA - Delaware 100%
4 SEGMENTS (continued) (d) Head office function and other operating companies
These comprise the following:
Other Group Companies Principal Activities Country of Incorporation
Effective Shareholders’
Interest Sagicor Financial Corporation
Group parent company Barbados 100%
Sagicor General Insurance Inc
Property and casualty insurance
Barbados 53%
Sagicor Finance Inc Loan and lease financing, and deposit taking
St. Lucia 70%
Sagicor Asset Management (T&T) Limited
Investment management Trinidad & Tobago 100%
Sagicor Asset Management Inc
Investment management Barbados 100%
Barbados Farms Limited Farming and real estate development
Barbados 77%
Sagicor Funds Incorporated
Mutual fund holding company Barbados 100%
Globe Finance Inc Loan and lease financing, and deposit taking
Barbados 51%
The Mutual Financial Services Inc
Financial services holding company
Barbados 73%
Sagicor Finance Limited Group financing vehicle The Cayman
Islands 100%
Notes to the Financial Statements Sagicor Financial Corporation Year ended December 31, 2013 Amounts expressed in US$000
33 Sagicor Financial Corporation
4.1 Statement of income by segment
2013 Sagicor Life Sagicor Jamaica Sagicor Life USA
Head office and other
Adjustments Total
Net premium revenue 257,892 292,959 87,650 18,527 - 657,028
Interest income 70,612 118,386 49,609 10,204 - 248,811
Other investment income 2,532 7,705 20,661 (187) (172) 30,539
Fees and other revenues 7,714 43,575 27,178 24,556 82 103,105
Gain arising on business combinations, acquisitions or divestitures 119 - - (119) - -
Segment income / (loss) before taxes 25,138 78,081 26,376 10,279 (40,104) 99,770
Income taxes (4,716) (9,670) (8,420) (1,644) - (24,450)
Net income / (loss) from continuing operations 20,422 68,411 17,956 8,635 (40,104) 75,320
Net income/(loss) attributable to shareholders from continuing operations
32,947 36,020 17,956 (11,876) (21,946) 53,101
Total comprehensive income/(loss) attributable to shareholders from continuing operations
33,178 26,723 16,489 (14,487) (22,001) 39,902
Notes to the Financial Statements Sagicor Financial Corporation Year ended December 31, 2013 Amounts expressed in US$000
35 Sagicor Financial Corporation
4.1 Statement of income by segment (continued) The principal minority interests in the Group are in respect of Sagicor Group Jamaica Limited (Sagicor Jamaica). Out of the total net income attributable to minority interests of $35,485 (2012 - $34,744), Sagicor Jamaica contributed $32,431 (2012 - $32,391). 4.2 Variations in segment income Variations in segment income may arise from non-recurring or other significant factors. The most common factors contributing to variations in segment income are as follows.
(i) Investment gains Fair value investment gains are recognised on:
- the revaluation of investment property; - the revaluation of debt and equity securities classified as at fair value through income; - the disposal of debt and equity securities classified as available for sale or loans and
receivables. Therefore, significant gains and losses may be triggered by changes in market prices and / or by decisions to dispose of investments. (ii) Allowances for impairment of financial investments Significant impairment losses may be triggered by changes in market prices and economic conditions. (iii) Gain on recapture of reinsurance contract held Insurers within the Group may cede certain insurance risks and supporting assets to reinsurers. On the recapture of the risks ceded under a reinsurance contract, the associated assets and liabilities recaptured are measured in accordance with the Group's accounting policies and any difference arising is recorded in income. The resulting gain or loss can be significant.
4.2 Variations in segment income (continued) (iv) Foreign exchange gains and losses Movements in foreign exchange rates may generate significant exchange gains or losses when the foreign currency denominated monetary assets and liabilities are re-translated at the date of the financial statements. (v) Movements in actuarial liabilities arising from changes in assumptions The change in actuarial liabilities for the year includes the effects arising from changes in assumptions. The principal assumptions in computing the actuarial liabilities on life and annuity contracts relate to mortality and morbidity, lapse, investment yields, asset default and operating expenses and taxes. Because the process of changes in assumptions is applied to all affected insurance contracts, changes in assumptions may have a significant effect in the period in which they are recorded.
Notes to the Financial Statements Sagicor Financial Corporation Year ended December 31, 2013 Amounts expressed in US$000
Sagicor Financial Corporation 36
4.2 Variations in segment income (continued)
The table below summarises by segment the individual line items within income from continuing operations which are impacted by the foregoing factors
2013 2012
Variations in income by segment Sagicor Life Sagicor
Notes to the Financial Statements Sagicor Financial Corporation Year ended December 31, 2013 Amounts expressed in US$000
37 Sagicor Financial Corporation
4.3 Other comprehensive income Variations in other comprehensive income may arise also from non-recurring or other significant factors. The most common are as follows. (i) Unrealised investment gains Fair value investment gains are recognised on the revaluation of debt and equity securities classified as available for sale. Therefore, significant gains and losses may be triggered by changes in market prices. (ii) Changes in actuarial liabilities Changes in unrealised investment gains identified in (i) above may also generate significant changes in actuarial liabilities as a result of the use of asset liability matching in the liability estimation process. (iii) Foreign exchange gains and losses Movements in foreign exchange rates may generate significant exchange gains or losses on the re-translation of the financial statements of foreign currency reporting units. The table below summarises by segment the individual line items within other comprehensive income from continuing operations which are impacted by the foregoing factors.
Variations in other comprehensive income by segment
Total liabilities 1,229,081 1,514,104 1,031,029 545,523 740,346 (314,160) 4,745,923
Net assets 380,631 378,250 187,911 (62,096) (81,562) - 803,134
Notes to the Financial Statements Sagicor Financial Corporation Year ended December 31, 2013 Amounts expressed in US$000
39 Sagicor Financial Corporation
4.4 Statement of financial position by segment (continued) The principal minority interests in the Group are in respect of Sagicor Group Jamaica Limited (Sagicor Jamaica). Out of the total minority interests in the statement of financial position of $218,751 (2012 - $226,433), Sagicor Jamaica contributed $178,920 (2012 - $189,109). 4.5 Additions to non-current assets by segment Segment operations include certain non-current assets comprising investment property, property, plant and equipment, investment in associated companies and intangible assets. Additions to these categories for the year are as follows:
2013 2012
Sagicor Life 5,986 9,153 Sagicor Jamaica 3,946 12,442 Sagicor Life USA 1,124 1,259 Head office and other 11,548 7,398 22,604 30,252
4.6 Products and services Total external revenues relating to the Group’s products and services are summarised as follows:
2013 2012
Life, health and annuity insurance contracts issued to individuals
591,698 653,497
Life, health and annuity insurance and pension administration contracts issued to groups
299,497 257,691
Property and casualty insurance 33,956 32,380
Banking, investment management and other financial services 94,530 101,368
Farming and unallocated revenues 19,802 19,346
1,039,483 1,064,282
4.7 Geographical areas The Group operates in certain geographical areas which are determined by the location of the subsidiary or branch initiating the business. Group operations in geographical areas include certain non-current assets comprising investment property, property, plant and equipment, investment in associated companies and intangible assets. Total external revenues and non-current assets by geographical area are summarised in the following table. External revenue Non-current assets
2013 2012 2013 2012
Barbados 148,901 138,593 195,204 190,765
Jamaica 426,141 406,988 59,672 87,589
Trinidad & Tobago 140,704 132,967 78,167 72,471
Other Caribbean 138,514 150,092 29,983 29,132
USA 185,223 235,642 2,977 3,130
1,039,483 1,064,282 366,003 383,087
Notes to the Financial Statements Sagicor Financial Corporation Year ended December 31, 2013 Amounts expressed in US$000
Sagicor Financial Corporation 40
5 INVESTMENT PROPERTY The movement in investment property for the year is as follows:
2013 2012
Balance, beginning of year 115,224 122,185
Additions at cost 1,424 356
Transfer from / (to) property, plant and equipment 884 (1,500)
Disposals (18,040) (1,630)
Change in fair values 982 (2,536)
Effects of exchange rate changes (2,105) (1,651)
Balance, end of year 98,369 115,224 Investment property includes $15,223 (2012 - $27,159) which represents the Group’s proportionate interest in joint operations summarised in the following table.
Country Description of property Percentage ownership
Trinidad & Tobago Freehold office building 60% Pension Funds managed by the Group own the remaining 50% interests of freehold lands in Barbados, and a 33% interest in a freehold office building in Barbados.
6 ASSOCIATES AND JOINT VENTURE The movements in the investment in associates and joint ventures during the year and the aggregate balances and results of associates and joint venture companies are summarised in the following table.
2013 2012 restated Movement during the year:
Investment, beginning of year as restated 42,433 33,686.
Additions 266 6,280.
Disposals and divestitures (28) -.
Dividends received (1,348) (1,005)
Share of:
Income before taxes 3,519. 3,686.
Amortisation of intangible assets identified on acquisition (181) (177)
Income taxes (364) (271)
Other comprehensive income 923. 412.
Effects of exchange rate changes (1,018) (178)
Investment, end of year 44,202. 42,433.
Aggregate balances and results:
Total assets 532,852 485,026
Total liabilities 374,794 335,540
Total revenue 139,858 135,126
Net income for the year 14,413 13,823
During the year the Group adopted retroactively the equity basis of accounting for its joint venture investment in Sagicor Costa Rica SCR, S.A. (note 48).
Notes to the Financial Statements Sagicor Financial Corporation Year ended December 31, 2013 Amounts expressed in US$000
Net book value, beginning of year 38,428 65,124 31,978 10,288 145,818 38,504 62,886 26,268 9,359 137,017 Additions at cost - 1,418 11,777 6,704 19,899 - 2,440 14,677 4,736 21,853 Transfer (to) / from investment property - (884) - - (884) - 1,500 - - 1,500 Transfer to intangible assets (note 8) - - (1,801) - (1,801) - - (504) - (504) Other transfers - 296 228 - 524 - - 19 - 19 Transfers to real estate developed or held for sale
Notes to the Financial Statements Sagicor Financial Corporation Year ended December 31, 2013 Amounts expressed in US$000
43 Sagicor Financial Corporation
8.2 Impairment of intangible assets Goodwill arises from past acquisitions and is allocated to cash generating units (CGUs). Goodwill is tested annually for impairment. The recoverable amount of a CGU is determined as the higher of its value in use or its fair value less costs to sell. Annually, the management of each operating segment or other operating company prepares financial projections for the next three years. For those CGU’s which the fair value less costs to sell methodology is used, the financial projections are used as inputs to determine maintainable earnings over time to which is applied an appropriate earnings multiple. For those CGU's which the value in use methodology is used, cash flows are extracted from the financial projections to which are applied appropriate discount factors and residual growth rates, or alternatively, the cash flows from the financial projections are extended to 50 years using an actuarial appraisal value technique which incorporates appropriate discount rates and solvency capital requirements. The Group obtains independent professional advice in order to select the relevant discount factors, residual growth rates and earnings multiples. The carrying values of goodwill and the impairment test factors used are considered in the following sections. (a) Sagicor Life operating segment 2013 2012 Carrying value of goodwill 27,031 27,120
8.2 Impairment of intangible assets (continued) (i) Year ended December 31, 2013 An actuarial appraisal value technique was adopted to test goodwill impairment. The principal assumptions included the following:
Discount rate of 9% for individual life and annuity inforce business, New individual life and annuity business was included for the ten year period 2014 to 2023, Annual growth rate for new individual life and annuity business varying between 7.5% and
10.0% from 2014 to 2018, and 2.0% from 2019 to 2023, Discount rate of 13% for new individual life and annuity business, Required Minimum Continuing Capital and Surplus Ratio (MCCSR) of 200%.
Sensitivity The excess of the appraisal value over carrying value of the operating segment was also tested by varying the discount rates and capital ratios. The results are set out in the following tables. Negative amounts illustrate the extent of possible impairment.
Barbados, Eastern Caribbean, Dutch Caribbean, Bahamas and Central America
MCCSR target ratio
Low Mid High
Discount rate Inforce New business 175% 200% 225%
Low 7% 11% 287,682 288,003 288,328
Mid 9% 13% 147,260 143,777 140,256
High 11% 15% 55,107 49,250 43,331
Notes to the Financial Statements Sagicor Financial Corporation Year ended December 31, 2013 Amounts expressed in US$000
Sagicor Financial Corporation 44
8.2 Impairment of intangible assets (continued)
Trinidad and Tobago MCCSR target ratio
Low Mid High
Discount rate Inforce New business 175% 200% 225%
Low 7% 11% 88,823. 85,931. 83,007.
Mid 9% 13% 25,633. 20,909. 16,134.
High 11% 15% (10,089) (10,089) (10,089) (ii) Year ended December 31, 2012 The fair value less cost to sell methodology was adopted to test goodwill impairment. The after tax multiple used for the segment comprising Barbados, Eastern Caribbean, Dutch Caribbean, Bahamas and Central America was 10.7 which was derived from a pre-tax factor of 8.91 using an iterative method. The after tax multiple used for the segment comprising Trinidad and Tobago was 17.3 which was derived from a pre-tax factor of 14.05 using an iterative method. (b) Sagicor Jamaica operating segment 2013 2012 Carrying value of goodwill 16,048 18,349 The fair value less cost to sell methodology was adopted to test goodwill impairment in both years. The after tax multiple used for the segment was 7.1 (2012 - 7.40) which was derived from a pre-tax factor of 6.36 (2012 - 6.28) using an iterative method.
8.2 Impairment of intangible assets (continued) Sensitivity The possible impairment of goodwill is sensitive to changes in earnings multiples and after tax earnings. This is illustrated in the following table.
2013 test
After tax earnings multiples 7.1 6.4 5.6.
Reduction in forecast earnings n/a 10% 10%.
Excess of recoverable amount (of 51% interest) 32,268 Nil n/a.
Impairment (of 51% interest) Nil Nil (16,048) (c) Other operating companies 2013 2012 Carrying value of goodwill 4,869 4,869 The Group recognised goodwill on the acquisition of its interests in Sagicor General Insurance Inc and Globe Finance Inc. The value in use methodology has been used to test goodwill impairment in both years. For 2013, the after tax discount factors were 14.0% and 13.1% respectively and the residual growth rates were 3.8% and 2.1% respectively. For 2012, the corresponding after tax discount factors were 13.5% and 11.3% respectively and the residual growth rates were 4.9% and 4.2% respectively.
Notes to the Financial Statements Sagicor Financial Corporation Year ended December 31, 2013 Amounts expressed in US$000
45 Sagicor Financial Corporation
9 FINANCIAL INVESTMENTS 9.1 Analysis of financial investments 2013 2012
Carrying
value Fair
value Carrying
value Fair
value Held to maturity securities: Debt securities 20,200 20,466 20,004 21,835
3,191,776 3,123,922 9.2 Pledged assets Debt and equity securities include $213,703 (2012 - $100,261) as collateral for loans payable and other funding instruments. Collateral for the obligation to the Federal Home Loan Bank of Dallas (FHLB) which is included in other funding instruments (note 17), consists of an equity holding in the FHLB with a market value of $7,143 (2012 - $6,353), and mortgages and mortgage backed securities having a total market value of $160,250 (2012 - $146,733). Debt securities are pledged as collateral under repurchase agreements with customers and other financial institutions and for security relating to overdraft and other facilities with other financial institutions. As of December 31, 2013, these pledged assets totalled $643,127 (2012 - $679,872). Of these assets pledged as security, $30,934 (2012 – $42,551) represents collateral for securities sold under agreements to repurchase in instances when the transferee has the right by contract or by custom to sell or re-pledge the collateral.
Notes to the Financial Statements Sagicor Financial Corporation Year ended December 31, 2013 Amounts expressed in US$000
9.3 Returns accruing to the benefit of contract-holders Financial investments include the following amounts for which the full income and capital returns accrue to the holders of unit linked policy and deposit administration contracts.
2013 2012
Debt securities 93,864 72,414
Equity securities 97,255 77,045
Mortgage loans 36,838 40,212
Securities purchased for re-sale 162 177
228,119 189,848 9.4 Reclassification of financial investments In 2008, the Group reclassified certain securities from the available for sale classification to the loans and receivables classification. The assets reclassified were primarily:
Government of Jamaica debt securities with a maturity date of 2018 and after, which are held to back long-term insurance liabilities; and
Non-agency collateralised mortgage obligations in the USA. The reclassifications were made because the markets for these securities were considered by management to have become inactive.
9.4 Reclassification of financial investments (continued) The following disclosures are in respect of these reclassified assets.
2013 2012
Carrying
value Fair
value Carrying
value Fair
value Government debt securities maturing after September 2018
51,342 49,344 53,033 53,642
Other debt securities 3,458 4,095 6,357 6,898
54,800 53,439 59,390 60,540
2013 2012 Cumulative net fair value loss, beginning of year (4,783) (11,449)
Net fair value (losses) / gains subsequent to restatement (2,716) 6,984
Disposals - (42)
Effect of exchange rate changes 177 (276)
Cumulative net fair value loss, end of year (7,322) (4,783) The net fair value gain or loss subsequent to restatement approximates the fair value gain or loss that would have been recorded in total comprehensive income had the reclassification not been made. The disposal amount represents the net loss that would have been reclassified from other comprehensive income to income on disposal.
Notes to the Financial Statements Sagicor Financial Corporation Year ended December 31, 2013 Amounts expressed in US$000
47 Sagicor Financial Corporation
10 REINSURANCE ASSETS
2013 2012
Reinsurers’ share of:
Actuarial liabilities (note 13.1) 285,250 56,683
Policy benefits payable (note 14.2) 28,325 25,080
Provision for unearned premiums (note 14.3) 20,153 20,323
Other items 2,699 600
336,427 102,686
The provision for unearned premiums and other items are expected to mature within one year of the financial statements date.
11 INCOME TAX ASSETS
2013 2012
Deferred income tax assets (note 33) 4,808 1,674
Income and withholding taxes recoverable 24,227 31,399
29,035 33,073
Income and withholding taxes recoverable are expected to be recovered within one year of the financial statements date.
12 MISCELLANEOUS ASSETS AND RECEIVABLES
2013 2012 restated Net defined benefit assets (note 31) 495 576
Real estate developed or held for resale 14,626 17,234
Prepaid and deferred expenses 15,688 14,568
Premiums receivable 36,318 35,712
Other assets and accounts receivable 81,024 31,067
148,151 99,157
Other accounts receivable includes: (i) $50,104 (2012 - nil) representing the liquidation of collateral for a banker's letter of credit facility (see note 38); and (ii) $4,636 (2012 - $9,315) due from managed funds.
Real estate developed for resale includes $6,699 (2012 - $8,418) which is expected to be realised within one year of the financial statements date.
Notes to the Financial Statements Sagicor Financial Corporation Year ended December 31, 2013 Amounts expressed in US$000
Sagicor Financial Corporation 48
13 ACTUARIAL LIABILITIES
13.1 Analysis of actuarial liabilities Gross liability Reinsurers’ share
2013 2012 2013 2012
Contracts issued to individuals:
Life insurance - participating policies 319,075 319,266 106 37
Life insurance and annuity - non-participating policies
1,424,285 1,182,192 260,031 30,237
Health insurance 7,115 2,345 517 626
Unit linked funds 133,882 132,798 - -
Reinsurance contracts held 23,037 20,365 - -
1,907,394 1,656,966 260,654 30,900
Contracts issued to groups:
Life insurance 38,575 42,524 1,448 1,518
Annuities 343,291 306,020 22,981 24,189
Health insurance 35,059 35,397 167 76
416,925 383,941 24,596 25,783
Total actuarial liabilities 2,324,319 2,040,907 285,250 56,683 The following notes are in respect of the foregoing table:
Life insurance includes coverage for disability and critical illness. Actuarial liabilities include $101,731(2012 - $109,344) in assumed reinsurance. The liability for reinsurance contracts held occurs because the reinsurance premium costs
exceed the mortality costs assumed in determining the gross liability of a policy contract.
13.2 Movement in actuarial liabilities Gross liability Reinsurers’ share
2013 2012 2013 2012
Balance, beginning of year 2,040,907 1,876,477 56,683 169,159
Amounts assumed on business and portfolio acquisitions (note 13.2(a))
33,910 (2,360) - -
Changes in actuarial liabilities:
Recorded in income 338,331 171,803 228,567 (9,984)
Recorded in other comprehensive income
(43,840) 33,313 1 -
Recapture of reinsurance contract held (note 13.2(b))
- - - (101,105)
Other movements (886) (9,907) - -
Effect of exchange rate changes (44,103) (21,023) (1) 59
Transfers to discontinued operation - (7,396) - (1,446)
Balance, end of year 2,324,319 2,040,907 285,250 56,683
Analysis of changes in actuarial liabilities
Arising from increments and decrements of inforce policies and from the issuance of new policies
403,700 197,670 228,609 (9,984)
Arising from changes in assumptions for mortality, lapse, expenses, investment yields and asset default
(68,454) 6,312 (41) -
Other changes:
Actuarial modelling, refinements, improvements and corrections
(5,928) 7,265 - -
Other items (34,827) (6,131) - -
Total 294,491 205,116 228,568 (9,984)
Notes to the Financial Statements Sagicor Financial Corporation Year ended December 31, 2013 Amounts expressed in US$000
49 Sagicor Financial Corporation
13.2 Movement in actuarial liabilities (continued)
(a) Acquisition of insurance portfolio
During the year, Sagicor Life Inc acquired the British American Insurance Company Limited (BAICO) Eastern Caribbean insurance portfolio. This was accounted for as a portfolio acquisition. The insurance portfolio acquired by Sagicor was made up of group pensions and traditional life policies issued by BAICO in the Eastern Caribbean. The obligation to pay certain unpaid amounts to policyholders under these policies (being claims, maturities, surrenders and bonuses) has been assumed by Sagicor with the transfer of the insurance portfolio, and the Eastern Caribbean Governments funded the payment of these in accordance with the terms of the policies. The payment of claims will be subject to the claimant meeting the requirements of the policy terms, and signing an appropriate release.
The effects of this transaction in the financial statements are set out below.
Fair Value
Net assets acquired:
Financial investments 5,598
Miscellaneous assets and receivables 594
Cash resources 36,299
Actuarial liabilities (33,910)
Other insurance liabilities (7,185)
Total net assets 1,396
Purchase consideration and related costs 5,600
Loss arising on net assets acquired 4,204
13.2 Movement in actuarial liabilities (continued)
(b) Recapture of reinsurance contract held
During 2012, Sagicor Life Insurance Company (SLIC) recaptured the 62.5% share of a block of life insurance and annuity contracts it had previously ceded to ScottishRe Life Corporation. In return for the recapture of insurance liabilities, SLIC received assets which included financial investments held in trust under the terms of the reinsurance contract. The effects of this transaction in the financial statements are set out below.
2012
Assets acquired on recapture of reinsurance contract:
Cash and cash equivalents 3,826
Financial investments 94,231
98,057
Adjustments to net insurance assets on recognition of the recapture:
Reinsurers' share of actuarial liabilities (101,105)
Amounts due to reinsurers 38,226
Other liabilities (3,023)
(65,902)
Gain on recapture of reinsurance contract (note 26) 32,155
Income tax expense (11,254)
Gain on recapture of reinsurance contract, net of income tax 20,901 The gain on recapture reflects the difference in the pricing of the reinsurance contract on a USA statutory insurance basis and the measurement of reinsured liabilities in accordance with note 2.11. As a result, the assets transferred on the recapture exceeded carrying value of the reinsured liabilities.
Notes to the Financial Statements Sagicor Financial Corporation Year ended December 31, 2013 Amounts expressed in US$000
Sagicor Financial Corporation 50
13.3 Assumptions – life insurance and annuity contracts (a) Process used to set actuarial assumptions and margins for adverse deviations At each date for valuation of actuarial liabilities, the Appointed Actuary (AA) of each insurer reviews the assumptions made at the last valuation date. The AA tests the validity of each assumption by reference to current data, and where appropriate, changes the assumptions for the current valuation. A similar process of review and assessment is conducted in the determination of margins for adverse deviations. Any recent changes in actuarial standards and practice are also incorporated in the current valuation. (b) Assumptions for mortality and morbidity Mortality rates are related to the incidence of death in the insured population. Morbidity rates are related to the incidence of sickness and disability in the insured population. Annually, insurers update studies of recent mortality experience. The resulting experience is compared to external mortality studies including the Canadian Institute of Actuaries (CIA) 1997 - 2004 tables. Appropriate modification factors are selected and applied to underwritten and non-underwritten business respectively. Annuitant mortality is determined by reference to CIA tables or to other established scales. Assumptions for morbidity are determined after taking into account insurer and industry experience and established guidelines from Actuarial Institutes. (c) Assumptions for lapse
Policyholders may allow their policies to lapse prior to the maturity date either by choosing not to pay premiums or by surrendering their policy for its cash value. Lapse studies are updated annually by insurers to determine the persistency of the most recent period. Assumptions for lapse experience are generally based on five-year averages.
13.3 Assumptions – life insurance and annuity contracts (d) Assumptions for investment yields
Returns on existing variable rate securities, shares, investment property and policy loans are linked to the current economic scenario. Yields on reinvested assets are also tied to the current economic scenario. Returns are however assumed to decrease and it is assumed that at the end of twenty years from the valuation date, all investments, except policy loans, are reinvested in long-term, default free government bonds. The ultimate rate of return is the assumed rate that will ultimately be earned on long-term government bonds. It is established for each geographic area and is summarised in the following table.
Ultimate rate of return 2013 2012
Barbados 6.0% 5.25%
Jamaica 5.0% 5.0%
Trinidad & Tobago 4.25% 5.0%
Other Caribbean 4.5% - 6.0% 4.5% - 5.5%
USA 1.75% - 3.96% 2.95% (e) Assumptions for operating expenses and taxes Policy acquisition and policy maintenance expense costs for the long-term business of each insurer are measured and monitored using internal expense studies. Policy maintenance expense costs are reflected in the actuarial valuation after adjusting for expected inflation. Costs are updated annually and are applied on a per policy basis. Taxes reflect assumptions for future premium taxes and income taxes levied directly on investment income (see note 32). For income taxes levied on net income, actuarial liabilities are adjusted for policy related recognised deferred tax assets and liabilities.
Notes to the Financial Statements Sagicor Financial Corporation Year ended December 31, 2013 Amounts expressed in US$000
51 Sagicor Financial Corporation
13.3 Assumptions – life insurance and annuity contracts (continued) (f) Asset defaults The AA of each insurer includes a provision for asset default in the modelling of the cash flows. The provision is based on industry and Group experience and includes specific margins, where appropriate, for assets backing the actuarial liabilities, e.g. for investment property, equity securities, debt securities, mortgage loans and deposits. (g) Margins for adverse deviations Margins for adverse deviations are determined for the assumptions in the actuarial valuations. The application of these margins resulted in provisions for adverse deviations being included in the actuarial liabilities as set out in the following table.
Provisions for adverse deviations 2013 2012 Mortality and morbidity 81,199 79,456
Lapse 64,469 55,994
Investment yields and asset default 45,851 76,613
Operating expenses and taxes 19,777 19,005
Other 2,846 3,472
214,142 234,540 13.4 Assumptions – health insurance contracts The outstanding liabilities for health insurance claims incurred but not yet reported and for claims reported but not yet paid are determined by statistical methods using expected loss ratios which have been derived from recent historical data. No material claim settlements are anticipated after one year from the date of the financial statements.
14 OTHER INSURANCE LIABILITIES 14.1 Analysis of other insurance liabilities
2013 2012 Dividends on deposit and other policy balances 70,036 70,032
Policy benefits payable 90,834 83,814
Provision for unearned premiums 33,564 33,353
194,434 187,199 14.2 Policy benefits payable
Gross liability Reinsurers’ share
2013 2012 2013 2012
Analysis of policy benefits payable:
Life insurance and annuity benefits 64,498 58,450 12,400 9,744
Health claims 2,687 2,632 2,759 3,257
Property and casualty claims 23,649 22,732 13,166 12,079
90,834 83,814 28,325 25,080
Notes to the Financial Statements Sagicor Financial Corporation Year ended December 31, 2013 Amounts expressed in US$000
Sagicor Financial Corporation 52
14.2 Policy benefits payable (continued)
Gross liability Reinsurers’ share
2013 2012 2013 2012
Movement for the year:
Balance, beginning of year 83,814 494,198 25,080 115,801
Policy benefits assumed on business and portfolio acquisitions
Other investment contracts 133,115 135,876 122,523 128,079
252,627 255,388 242,112 247,668
At fair value through income:
Unit linked deposit administration liabilities
114,374 114,374 104,084 104,084
367,001 369,762 346,196 351,752
Notes to the Financial Statements Sagicor Financial Corporation Year ended December 31, 2013 Amounts expressed in US$000
53 Sagicor Financial Corporation
16 NOTES AND LOANS PAYABLE
2013 2012
Carrying
value Fair
value Carrying
value Fair
value
7.5% senior notes due 2016 145,178 156,924 145,865 156,245
6.5% convertible redeemable preference shares due 2016
100,417 115,339 93,636 99,696
4.6% notes due 2015 43,174 43,174 - -
Finance lease payable 1,391 1,391 2,055 2,055
290,160 316,828 241,556 257,996 The Group issued ten year $150,000 senior notes which are repayable in 2016. The notes carry a 7.5% annual rate of interest fixed for the period and interest is payable semi-annually. The notes are traded and are listed on the Luxembourg Euro MTF Market. Financial covenants in respect of these notes are summarised in note 46.3(a). Details of the 6.5% convertible redeemable preference shares due 2016 are set out in note 21.2. The initial fair value of the subscription proceeds was determined by discounting the ultimate redemption value ($120,000), at a rate of 6.5% for 5 years. The subsequent finance cost recognised is the amortisation of the difference between the ultimate redemption value and the initial carrying value, calculated on an effective interest method for the 5 years to maturity. On December 18, 2013, the Company issued eighteen month $43,386 notes which are repayable in 2015. The notes carry a 4.6% annual rate of interest fixed for the period and interest is payable semi-annually. Issue costs amounted to $290. Financial covenants in respect of these notes are summarised in note 46.3(a).
17 DEPOSIT AND SECURITY LIABILITIES
2013 2012
Carrying
value Fair
value Carrying
value Fair
value At amortised cost: Other funding instruments 313,439 316,632 245,675 250,822 Customer deposits 219,192 235,393 198,008 210,228 Securities sold for re-purchase 524,232 525,267 591,064 591,654 Bank overdrafts 1,933 1,933 1,954 1,954 1,058,796 1,079,225 1,036,701 1,054,658 At fair value through income: Structured products 17,371 17,371 9,216 9,216 Derivative financial instruments (note 41.6)
Other funding instruments consist of loans from banks and other financial institutions and include balances of $157,608 (2012 - $131,009) due to the Federal Home Loan Bank of Dallas (FHLB). The Group participates in the FHLB program in which funds received from the Bank are invested in mortgages and mortgage backed securities. Structured products are offered by a banking subsidiary. A structured product is a pre-packaged investment strategy created to meet specific needs that cannot be met from the standardised financial instruments available in the market. Structured products can be used as an alternative to a direct investment, as part of the asset allocation process to reduce risk exposure of a portfolio, or to capitalize on current market trends.
Collateral for other funding instruments and securities sold under agreements to resell is set out in note 9.2.
Notes to the Financial Statements Sagicor Financial Corporation Year ended December 31, 2013 Amounts expressed in US$000
Sagicor Financial Corporation 54
18 PROVISIONS
2013 2012 Net defined benefit liabilities (note 31) 74,767 58,376
Other provisions 316 245
75,083 58,621
19 INCOME TAX LIABILITIES 2013 2012 Deferred income tax liabilities (note 33) 22,532 26,373 Income taxes payable 6,693 7,240
29,225 33,613
Income taxes payable are expected to be settled within a year of the financial statements’ date.
20 ACCOUNTS PAYABLE AND ACCRUED LIABILITIES
2013 2012
Amounts due to policyholders 16,830 16,191
Amounts due to reinsurers 22,929 15,995
Other accounts payable and accrued liabilities 91,478 82,239
131,237 114,425
21 COMMON AND PREFERENCE SHARES The Company is authorised to issue:
an unlimited number of common shares, an unlimited number of preference shares, and an unlimited number of convertible redeemable preference shares.
In each case the shares are without nominal or par value. 21.1 Common shares
2013 2012
Number in 000’s
Share capital
Number in 000’s
Share capital
Issued and fully paid:
Balance, beginning of year 303,917 301,600 303,917 301,600
Shares issued - - - -
Balance, end of year 303,917 301,600 303,917 301,600
Treasury shares:
Shares held for LTI and ESOP, end of year (note 30.1)
(3,583) (6,150) (3,028) (5,542)
Total 300,334 295,450 300,889 296,058
The common shares are listed on the Barbados, Trinidad & Tobago and London stock exchanges.
Notes to the Financial Statements Sagicor Financial Corporation Year ended December 31, 2013 Amounts expressed in US$000
55 Sagicor Financial Corporation
21.2 Convertible redeemable preference shares On July 18, 2011, the Company issued 120,000,000 convertible redeemable preference shares with the following features: Issue price of US $1.00 or Barbados $2.00 per share; Annual dividend rate of 6.5%, dividends to be declared by the Company’s directors’ and payable
half yearly on May 15 and November 15; Convertible into common shares at a ratio of 1.98 preference shares to 1.00 common shares,
conversion to be at the option of the shareholder and exercisable on May 16 or November 16 in any year prior to the redemption date;
Redeemable on July 18, 2016 at issue price, if not converted before. The preference shares are accounted for as a compound financial instrument and were initially recognised in the statement of financial position as a financial liability (note 16) and also as equity (note 22). The preference shares are listed on the Barbados and Trinidad & Tobago stock exchanges. Put option rights in respect of the preference shares are disclosed in note 46.3(b). 21.3 Dividends The dividends declared paid during the year in respect of the Company’s convertible redeemable preference shares and common shares are set out in the following table.
2013 2012
Per share Total Per share Total
Dividends declared and paid:
Preference shares 6.50 ¢ 7,800 6.50 ¢ 7,800
Common shares 4.0 ¢ 12,035 4.0 ¢ 12,035
19,835 19,835
21.3 Dividends (continued) The dividends declared after the date of the financial statements in respect of the Company’s convertible redeemable preference shares and common shares are set out in the following table.
Common shares - final for current year 2.0 ¢ 6,018 2.0 ¢ 6,018
9,918 9,918 21.4 Restrictions on common share dividends The Company’s Articles of Incorporation include the following limitations on the payment of common share dividends. (i) For any 6 month period that the convertible redeemable preference shares are not paid,
dividends on common shares shall be suspended for that period plus the next 6 month period, and the Company shall not repurchase any of its common shares, except when pursuant to the LTI pan and ESOP.
(ii) The Company shall not pay any dividends on its common shares, in respect of the 2011
financial year or thereafter, or repurchase any of its common shares, other than a repurchase pursuant to the LTI plan and ESOP, if the cumulative amount of such dividends and repurchases after July 31, 2011 would exceed 50% of the cumulative amount of Group net income from January 1, 2011.
Notes to the Financial Statements Sagicor Financial Corporation Year ended December 31, 2013 Amounts expressed in US$000
Sagicor Financial Corporation 56
22 RESERVES
<<<<<< Fair value reserves >>>>>> Currency
translation reserves
Preference share
reserve
Other reserves
Total reserves
Owner occupied property
Available for sale assets
Actuarial liabilities
2013
Balance, beginning of year 22,978 59,946 (47,224) (77,864) 23,005 35,570 16,411
Other comprehensive income from continuing operations allocated to reserves 3,109 (51,624) 30,445 (18,343) - - (36,413)
Other comprehensive income from discontinued operation - 476 - 18,796 - - 19,272
Transactions with holders of equity instruments:
Allocated to reserve for equity compensation benefits - - - - - 2,169 2,169
Eliminated from reserve for equity compensation benefits - - - - - (46) (46)
Transfers to retained earnings and other movements (654) - - - (6,262) 698 (6,218)
Balance, end of year 25,433 8,798 (16,779) (77,411) 16,743 38,391 (4,825)
2012
Balance, beginning of year 23,419 36,389 (26,197) (72,590) 29,267 30,577 20,865
Other comprehensive income from continuing operations allocated to reserves 163 23,832 (21,027) (9,681) - - (6,713)
Other comprehensive income from discontinued operation - (399) - 543 - - 144
Transactions with holders of equity instruments:
Allocated to reserve for equity compensation benefits - - - - - 5,369 5,369
Eliminated from reserve for equity compensation benefits - - - - - (875) (875)
Change in ownership of subsidiaries (note 37) (604) 124 - 3,864 - (2,356) 1,028
Transfers to retained earnings and other movements - - - - (6,262) 2,855 (3,407)
Balance, end of year 22,978 59,946 (47,224) (77,864) 23,005 35,570 16,411
Other reserves comprise reserves for equity compensation benefits of $16,533 (2012 - $14,410) and statutory reserves of $21,858 (2012 - $21,160).
Notes to the Financial Statements Sagicor Financial Corporation Year ended December 31, 2013 Amounts expressed in US$000
57 Sagicor Financial Corporation
23 PARTICIPATING ACCOUNTS
The movements in the participating accounts during the year and the amounts in the financial statements relating to participating accounts were as follows:
Closed participating account
Open participating account
2013 2012 2013 2012
Movement for the year:
Balance, beginning of year 2,273 4,147 (12,606) (1,946)
Total comprehensive income / (loss) (5,432) (1,874) 10,345 (10,412)
Return of transfer to support profit distribution to shareholders
- - (242) (248)
Balance, end of year (3,159) 2,273 (2,503) (12,606)
Financial statement amounts:
Assets 95,096 101,164 229,543 241,414
Liabilities 98,255 98,891 232,046 254,020
Revenues 8,110 13,263 23,441 31,343
Benefits 11,938 13,180 5,549 36,005
Expenses 1,447 1,766 6,873 5,288
Income taxes 159 258 580 634
The Group has the ability to reduce future policy bonuses and dividends in order to eliminate a deficit in a participating account.
24 PREMIUM REVENUE
Gross premium Ceded to reinsurers
2013 2012 2013 2012
Life insurance 358,876 362,563 34,627 38,910
Annuity 445,135 187,684 271,665 361
Health insurance 146,055 140,819 5,132 5,164
Property and casualty insurance 66,472 66,157 48,086 47,785
1,016,538 757,223 359,510 92,220
Notes to the Financial Statements Sagicor Financial Corporation Year ended December 31, 2013 Amounts expressed in US$000
Sagicor Financial Corporation 58
25 NET INVESTMENT INCOME
2013 2012
Investment income:
Interest income 248,811 254,578
Dividend income 2,235 2,297
Rental income from investment property 3,723 5,437
Net investment gains 36,544 34,506
Share of operating income of associates and joint venture 3,519 3,686
Other investment income 250 128
295,082 300,632
Investment expenses:
Allowances for impairment losses 12,562 2,064
Direct operating expenses of investment property 1,284 1,607
Other direct investment expenses 1,886 1,935
15,732 5,606
Net investment income 279,350 295,026
The Group operates across both active and inactive financial markets. The financial investments placed in both types of market support the insurance and operating financial liabilities of the Group. Because the type of financial market is incidental and not by choice, the Group manages its financial investments by the type of financial instrument (i.e. debt securities, equity securities, mortgage loans etc). Therefore, the income from financial instruments is presented consistently with management practice, rather than by accounting classification. The capital and income returns of most investments designated at fair value through income accrue to the holders of unit linked policy and deposit administration contracts which do not affect net income of the Group.
25 NET INVESTMENT INCOME (continued) Further details of interest income and investment gains are set out in the following table.
2013 2012
Interest income:
Debt securities 201,982 206,502
Mortgage loans 18,926 19,611
Policy loans 8,951 8,878
Finance loans and finance leases 15,270 15,145
Securities purchased for re-sale 1,094 781
Deposits 2,623 3,670
Other balances (35) (9)
248,811 254,578
Net investment gains / (losses):
Debt securities 7,685 29,471
Equity securities 16,741 5,871
Investment property 1,195 (2,489)
Other financial instruments 10,923 1,653
36,544 34,506
Notes to the Financial Statements Sagicor Financial Corporation Year ended December 31, 2013 Amounts expressed in US$000
59 Sagicor Financial Corporation
26 FEES AND OTHER REVENUE
2013 2012 Fee income – assets under administration 19,300 14,590
Fee income – deposit administration and policy funds 1,033 1,090
Commission income on insurance and reinsurance contracts 40,424 14,086
Gain on recapture of reinsurance contract held (note 13.2(b)) - 32,155
Other fees and commission income 15,150 15,813
Foreign exchange gains 11,382 6,678
Other operating and miscellaneous income 20,020 17,472
Loss arising on acquisition of insurance portfolio (note 13.2 (a)) (4,204) -
Gain arising on acquisition of insurance business (note 37) - 2,369
103,105 104,253
27 POLICY BENEFITS AND CHANGE IN ACTUARIAL LIABILITIES
Gross benefit Ceded to reinsurers
2013 2012 2013 2012
Life insurance benefits 199,420 180,560 12,298 17,717
Annuity benefits 126,698 124,207 8,997 9,363
Health insurance claims 117,480 109,740 3,937 3,076
Property and casualty claims 15,814 16,218 8,765 8,192
Total policy benefits 459,412 430,725 33,997 38,348
Change in actuarial liabilities 338,331 169,033 228,567 (9,508)
Total policy benefits and change in actuarial liabilities
797,743 599,758 262,564 28,840
28 INTEREST EXPENSE
2013 2012
Insurance contracts 2,912 2,810
Investment contracts 14,697 17,992
Other funding instruments 6,038 6,513
Customer deposits 7,310 7,297
Securities sold for re-purchase 26,218 31,774
Other items 436 2,079
57,611 68,465 The Group manages its interest-bearing obligations by the type of obligation (i.e. investment contracts, securities etc). Therefore, the interest expense is presented consistently with management practice, rather than by accounting classification. The capital and income returns of most financial liabilities designated at fair value through income accrue directly from the capital and income returns of financial assets designated at fair value through income. Therefore, the related interest expense does not affect the net income of the Group.
Notes to the Financial Statements Sagicor Financial Corporation Year ended December 31, 2013 Amounts expressed in US$000
Sagicor Financial Corporation 60
29 EMPLOYEE COSTS
Included in administrative expenses, commissions and related compensation are the following:
2013 2012
Administrative staff salaries, directors’ fees and short-term benefits 85,666 80,568
Social security and defined contribution retirement costs 6,635 6,653
Equity-settled compensation benefits (note 30.1 to 30.3) 3,499 5,783
Defined benefit expense (note 31 (b)) 12,493 9,047 108,293 102,051
30 EQUITY COMPENSATION BENEFITS 30.1 The Company Effective December 31, 2005, the Company introduced a Long Term Incentive (LTI) plan for designated executives of the Sagicor Group and an Employee Share Ownership Plan (ESOP) for permanent administrative employees and sales agents of the Group. A total of 26,555,274 common shares of the Company (or 10% of shares then in issue) have been set aside for the purposes of the LTI plan and the ESOP.
(a) LTI plan – restricted share grants
Restricted share grants have been granted to designated key management of the Group. Share grants may vest over a four year period beginning at the grant date. The vesting of share grants is conditional upon the relative profitability of the Group as compared to a number of peer companies. Relative profitability is measured with reference to the financial year preceding the vesting date.
30.1 The Company (continued) The movement in restricted share grants during the year is as follows:
2013 2012
Number of
grants ‘000
Weighted average
price
Number of grants
‘000
Weighted Average
price Balance, beginning of year 2,618 US$1.25 1,413 US$1.44
Grants issued 2,183 US$1.03 1,521 US$1.09
Grants vested (1,229) US$1.17 (316) US$1.27
Grants lapsed/forfeited (48) US$1.30 - -
Balance, end of year 3,524 US$1.14 2,618 US$1.25 Grants issued may be satisfied out of new shares issued by the Company or by shares acquired in the market. The shares acquired in the market and distributed during the year were as follows:
2013 2012
Number in 000’s
$000 Number in 000’s
$000
Balance, beginning of year 112 92 16 24
Shares acquired 561 622 300 249
Shares distributed - - (204) (181)
Balance, end of year 673 714 112 92
Notes to the Financial Statements Sagicor Financial Corporation Year ended December 31, 2013 Amounts expressed in US$000
61 Sagicor Financial Corporation
30.1 The Company (continued)
(b) LTI plan – share options
Share options have been granted to designated key management of the Group during the year. Up to 2008, options were granted at the fair market price of the Company shares at the time that the option is granted. From 2009, options are granted at the fair market price of the Company shares prevailing one year before the option is granted. Options vest over four years, 25% each on the first four anniversaries of the grant date. Options are exercisable up to 10 years from the grant date. The movement in share options for the year and details of the share options and assumptions used in determining their pricing are as follows:
2013 2012
Number of
options ‘000
Weighted average exercise
price
Number of options
‘000
Weighted average exercise
price Balance, beginning of year 11,255. US$1.86 9,899. US $1.92
Options granted 2,269. US$1.15 1,538. US $1.53
Options lapsed/forfeited (234) US$1.68 (182) US $1.94
Balance, end of year 13,290. US$1.75 11,255. US $1.86
Exercisable at the end of the year 8,228. US$1.99 6,419. US $2.06
Share price at grant date US $1.15 – 2.50 US $1.48 – 2.50
Fair value of options at grant date US$0.28 – 0.69 US $0.39 – 0.69
Expected volatility 19.3% – 35.8% 19.3% - 35.8%
Expected life 7.0 years 7.0 years
Expected dividend yield 2.6% - 3.5% 2.6% - 3.1%
Risk-free interest rate 4.8% - 6.8% 4.8% – 6.8%
30.1 The Company (continued) The expected volatility of options is based on statistical analysis of monthly share prices over the 7 years prior to grant date.
(c) ESOP
From 2006, the Company approved awards under the ESOP in respect of permanent administrative employees and sales agents of the Company and certain subsidiaries. The ESOP is administered by Trustees under a discretionary trust. The amount awarded is used by the Trustees to acquire company shares. Administrative employees and sales agents are required to serve a qualifying period of five years from the award date in order to qualify as a beneficiary. Shares are distributed to beneficiaries upon their retirement or termination of employment. During 2012, the rules were amended so that vesting will take place in four equal annual instalments commencing one year after the award. The change came into effect during 2013. The shares acquired by the Trustees during the year were as follows:
2013 2012
Number in 000’s
$000 Number in 000’s
$000
Balance, beginning of year 2,916 5,450 2,950 5,528
Shares acquired - - - -
Shares distributed (6) (14) (34) (78)
Balance, end of year 2,910 5,436 2,916 5,450 30.2 Sagicor Group Jamaica Limited
(a) Long-term incentive plan
Effective May 1, 2003, Sagicor Life Jamaica instituted a share based long-term incentive plan for senior executives. 150,000,000 ordinary shares (or 5% of the authorised share capital at that date) have been set aside for the plan.
Notes to the Financial Statements Sagicor Financial Corporation Year ended December 31, 2013 Amounts expressed in US$000
Sagicor Financial Corporation 62
30.2 Sagicor Group Jamaica Limited (continued) Sagicor Life Jamaica introduced a new Long Term Incentive (LTI) plan effective January 2007, which replaced the previous Stock Option plan. Under the LTI plan, stock options are granted each year following the measurement year. Stock options vest in 4 equal installments beginning the first December 31 following the grant date and for the next three December 31 dates thereafter (25% per year). Options are not exercisable after the expiration of 7 years from the date of grant. The number of stock options in each stock option award is calculated based on the LTI opportunity via stock options (percentage of applicable salary) divided by the Black-Scholes value of a stock option on Sagicor Life Jamaica stock on March 31 of the measurement year. The exercise price of the options is the closing bid price on March 31 of the measurement year. Under the previous Stock Option plan, options were granted on December 31 of each year. The strike price was the closing bid price on the grant date. The number of stock options in each stock option award was calculated based on a percentage of applicable salary divided by the strike price. Options were exercisable beginning one year from the date of grant and had a contractual term of six years from the date of grant.
Details of the share options outstanding are set out in the following table. J$ represents Jamaica $.
2013 2012
Number of
options ‘000
Weighted average exercise
price
Number of options
‘000
Weighted average exercise
price
Balance, beginning of year 44,590 J$6.39 48,122 J$6.18
Exercisable at the end of the year 55,885 J$7.92 25,821 J$6.49
30.2 Sagicor Group Jamaica Limited (continued) Further details of share options and the assumptions used in determining their pricing are as follows:
2013 2012 Fair value of options outstanding J$72,148,000 J$44,590,000
Share price at grant date J$5.97 – 11.14 J$4.20 – 7.92
Exercise price J$5.97 – 11.14 J$4.20 – 7.92
Standard deviation of expected share price returns 25.0% 25.0%
Remaining contractual term 0.25 - 7 years 1 - 6 years
Risk-free interest rate 8.04% 7.65%
The expected volatility is based on statistical analysis of daily share prices over three years. (b) Employee share purchase plan Sagicor Life Jamaica has in place a share purchase plan which enables its administrative and sales staff to purchase shares at a discount. The proceeds from shares issued under this plan totalled $285 (2012 – $748). 30.3 Sagicor Investments Jamaica Limited In December 2013, the Sagicor Group of companies in Jamaica decided to harmonize compensation plans across the group and; considering the pending delisting of the subsidiary Sagicor Investments Jamaica Limited (SIJL), all outstanding options in SIJL as at December 2013 were converted to corresponding Sagicor Group Jamaica Limited (SGJ) options with equivalent monetary value. From December 2013 all Executives of the Group participate in the SGJ LTI plan.
Notes to the Financial Statements Sagicor Financial Corporation Year ended December 31, 2013 Amounts expressed in US$000
63 Sagicor Financial Corporation
31 EMPLOYEE RETIREMENT BENEFITS (continued) (a) Amounts recognised in the statement of financial position
2013 2012 restated
Present value of funded pension obligations 162,772 148,194
Fair value of retirement plan assets (136,084) (131,476)
26,688 16,718
Present value of unfunded pension obligations 32,164 30,679
Present value of unfunded medical and life benefits 15,420 10,403
Net liability 74,272 57,800 Represented by: Amounts held on deposit by the Group as deposit administration contracts 42,143 39,972
Other recognised liabilities 32,624 18,404
Total recognised liabilities (note 18) 74,767 58,376
Recognised assets (note 12) (495) (576)
Net liability 74,272 57,800 Pension plans have purchased annuities from insurers in the Group to pay benefits to plan retirees. These obligations are included in actuarial liabilities in the statement of financial position and are excluded from the table above.
31 EMPLOYEE RETIREMENT BENEFITS The Group maintains a number of defined contribution and defined benefit retirement benefit plans for eligible sales agents and administrative employees. The plans for sales agents and some administrative employees provide defined contribution benefits. The plans for administrative employees in Barbados, Jamaica, Trinidad, Eastern Caribbean and certain other Caribbean countries provide defined benefits based on final salary and number of years active service Also, in these countries, retired employees may be eligible for medical and life insurance benefits which are partially or wholly funded by the Group. The principal defined benefit retirement plans are as follows:
Funded Plans Unfunded Plans
Sagicor Life Barbados & Eastern Caribbean Pension
Sagicor Life Trinidad Pension
Sagicor Life Jamaica Pension Sagicor Life (Heritage Life of Barbados - Barbados & Eastern Caribbean) Pension
Sagicor Investments Jamaica Pension Group medical and life plans
The above plans also incorporate employees of the Company and other subsidiaries, whose attributable obligations and attributable assets are separately identified for solvency, contribution rate and reporting purposes. The assets of the Sagicor Life Trinidad and Sagicor Life (Heritage Life of Barbados) pension plans are held under deposit administration contracts with Sagicor Life Inc and because these assets form part of the Group's assets, these plans are presented as unfunded in accordance with IAS 19 (revised). The above pension plans are registered with the relevant regulatory authorities in the Caribbean and are governed by Trust Deeds which conform with the relevant laws. The plans are managed by the Group under the direction of appointed Trustees. The group medical and life obligations arise from employee benefit insurance plans where benefits are extended to retirees. All disclosures in following sections of this note relate only to defined retirement benefit plans.
Notes to the Financial Statements Sagicor Financial Corporation Year ended December 31, 2013 Amounts expressed in US$000
Sagicor Financial Corporation 64
31 EMPLOYEE RETIREMENT BENEFITS (continued) (b) Movements in balances
2013 2012 restated
Retirement obligations
Retirement plan assets
Total Retirement
obligations Retirement plan
assets Total
Net liability / (asset), beginning of year 189,276. (131,476) 57,800. 174,977. (132,386) 42,591.
Current service cost 7,067. -. 7,067. 5,687. -. 5,687.
Other movements (12,614) 5,790. (6,824) (11,485) 9,680. (1,805)
Net liability / (asset), end of year 210,356. (136,084) 74,272. 189,276. (131,476) 57,800.
Notes to the Financial Statements Sagicor Financial Corporation Year ended December 31, 2013 Amounts expressed in US$000
65 Sagicor Financial Corporation
31 EMPLOYEE RETIREMENT BENEFITS (continued) (d) Significant actuarial assumptions The significant actuarial assumptions for the principal geographic areas as of December 31, 2013 were as follows:
Pension plans Barbados &
Eastern Caribbean
Jamaica Trinidad
Discount rate - local currency benefits 7.75% 9.50% 4.50%
Future increases in National Insurance Scheme Ceilings
3.50% n/a 0.00%
Mortality table UP94 with
projection scale AA
GAM1994 with 5 year improvement
UP94 with projection scale
AA
Termination of active members
3% up to age 30, reducing to 1% at age 50, 0% at age
51
10% up to age 30, reducing to 5% at age 50, 0% at age
51
3% up to age 30, reducing to 1% at age 50, 0% at age
51
Early retirement
100% at the earliest possible
age receive unreduced
benefits
n/a 100% at the earliest possible
age receive unreduced
benefits
31 EMPLOYEE RETIREMENT BENEFITS (continued) (c) Retirement plan assets
2013 2012
Equity unit linked pension funds under Group management:
Sagicor Equity Fund (Barbados) (27,921) (25,825)
Sagicor Bonds Fund (Barbados) (17,955) (17,261)
Sagicor Pooled Investment Funds (Jamaica):
Equity Funds (15,768) (18,044)
Mortgage & Real Estate Fund (12,730) (10,122)
Fixed Income Fund (12,894) (12,279)
Foreign Currency Funds (12,043) (11,135)
Money Market Fund (9,433) (14,031)
Other Funds (5,220) (3,627)
(113,964) (112,324)
Other assets (22,120) (19,152)
Total plan assets (136,084) (131,476) The equity unit linked pension funds are funds domiciled in Barbados and Jamaica. Annual reports of these funds are available to the public.
Notes to the Financial Statements Sagicor Financial Corporation Year ended December 31, 2013 Amounts expressed in US$000
Sagicor Financial Corporation 66
31 EMPLOYEE RETIREMENT BENEFITS (continued)
Group medical and life plans Jamaica Long term increase in health costs 8.00%
(e) Sensitivity of actuarial assumptions The sensitivity of the pension retirement benefit obligations to individual changes in actuarial assumptions is summarised below:
Barbados &
Eastern Caribbean
Jamaica Trinidad
Base pension obligation 69,621 89,184. 10,258.
Change in absolute assumption Increase / (decrease) in pension obligations
Decrease discount rate by 1.0% 10,885 12,226. 1,641.
Increase discount rate by 1.0% (8,320) (9,357) (1,194)
Decrease salary growth rate by 0.5% (2,253) (3,207) (374)
Increase salary growth rate by 0.5% 3,600 3,778. 442
Increase average life expectancy by 1 year 80 819. 12
31 EMPLOYEE RETIREMENT BENEFITS (continued) (f) Amount, timing and uncertainty of future cash flows In addition to the annual actuarial valuations prepared for the purpose of annual financial statement reporting, full actuarial valuations of pension plans are conducted every 3 years. These full valuations contain recommendations for Group and employee contribution levels which are implemented by the Group as the recommendations are made.
For the 2014 financial year, the total Group contributions to its defined benefit plans pension plans are estimated at $7,920.
Notes to the Financial Statements Sagicor Financial Corporation Year ended December 31, 2013 Amounts expressed in US$000
67 Sagicor Financial Corporation
32 INCOME TAXES
Group companies operating in Caribbean countries are largely taxed according to the taxation rules of the country where the operations are carried out. The principal rates of taxation are summarised in note 2.18(c). The income tax expense and the income subject to taxation in the statement of income are set out in the following table.
2013 2012 Income tax expense:
Current tax 16,315. 16,049.
Deferred tax 2,245. 8,130.
Share of tax of associates 364. 271.
18,924. 24,450.
Sources of income subject to tax:
Investment income subject to direct taxation 105,638. 106,764.
Net (loss) / income subject to direct taxation (109,296) 72,877.
Total (loss) / income subject to taxation (3,658) 179,641.
32 INCOME TAXES (continued) Income tax on the total income subject to taxation differs from the theoretical amount that would arise is as follows:
2013 2012
Total (loss) / income subject to taxation (3,658) 179,641
Taxation at the applicable rates on income subject to tax (7,346) 38,428
Adjustments to current tax for items not subject to / allowed for tax 11,228 (21,399)
Other current tax adjustments (21) (255)
Adjustments for current tax of prior periods 770 (275)
Movement in unrecognised deferred tax asset 11,792 5,464
Deferred tax relating to the origination of temporary differences (91) (16)
Deferred tax relating to changes in tax rates or new taxes 8 (15)
Deferred tax that arises from the write down / (reversal of a write down) of a tax asset
(524) (277)
Other taxes 3,108 2,795
18,924 24,450 In addition to the above, the income tax on items in other comprehensive income is set out in note 35.
Notes to the Financial Statements Sagicor Financial Corporation Year ended December 31, 2013 Amounts expressed in US$000
Sagicor Financial Corporation 68
33 DEFERRED INCOME TAXES 2013 2012
Analysis of deferred income tax assets:
Defined benefit liabilities 3,271 490
Unrealised losses on financial investments (1,525) -
Unused tax losses 1,586 1,453
Off-settable tax liabilities in respect of policy liability timing differences and other items
(953) (953)
Other items 2,429 684
Total deferred income tax assets (note 11) 4,808 1,674
Deferred income tax assets to be recovered within one year 2,083 1,473
Unrecognised tax balances:
Tax losses 204,404 169,366
Potential deferred income tax assets 51,050 43,174
Expiry period for unrecognised tax losses:
2013 - 2,601
2014 9,160 9,181
2015 14,337 14,370
2016 18,795 18,807
2017 21,063 21,078
2018 25,750 23,552
After 2018 115,299 70,772
No specified expiry date - 9,005
204,404 169,366
33 DEFERRED INCOME TAXES (continued)
Analysis of deferred income tax liabilities 2013 2012
Accelerated tax depreciation 1,773 2,370
Policy liabilities taxable in the future 40,577 28,923
Defined benefit assets 39 33
Accrued interest 902 1,293
Unrealised gains on financial investments 2,175 23,558
Off-settable tax assets in respect of unused tax losses and other items
(23,524) (31,130)
Other items 590 1,326
Total (note 19) 22,532 26,373
Deferred income tax liabilities to be settled within one year 7,124 9,978
Notes to the Financial Statements Sagicor Financial Corporation Year ended December 31, 2013 Amounts expressed in US$000
69 Sagicor Financial Corporation
34 EARNINGS PER COMMON SHARE The basic earnings per common share is computed by dividing earnings attributable to common shareholders by the weighted average number of shares in issue during the year, after deducting treasury shares. Earnings attributable to common shareholders recognise the impact on net income of the Company’s convertible redeemable preference shares (note 21.2). The table below derives the earnings attributable to common shareholders and the basic earnings per common share.
2013 2012 restated Net (loss) / income attributable to common shareholders (36,370) 11,067
Finance costs attributable to preference share subscription 6,483 6,483
Amortisation of issue expenses allocated to preference share reserve
(Loss) / earnings attributable to common shareholders (37,908) 9,529
Weighted average number of shares in issue in thousands 301,591 301,690
Basic (loss) / earnings per common share (12.6)¢ 3.2¢
Attributable to:
Continuing operations 12.5 ¢ 17.1 ¢
Discontinued operation (25.1)¢ (13.9) ¢ The computation of diluted earnings per common share recognises the dilutive impact of LTI share grants and share options (note 30.1), ESOP shares grants (note 30.1), and the convertible redeemable preference shares. In computing diluted earnings per share, the income attributable to common shareholders is adjusted by the dilutive impact of the convertible preference shares and the weighted average number of common shares is adjusted by the dilutive impacts of the aforementioned share grants, options and preference shares.
34 EARNINGS PER COMMON SHARE (continued) The table below derives the adjusted earnings attributable to common shareholders, the adjusted weighted average number of common shares, and the fully diluted earnings per common share.
2013 2012 restated Earnings attributable to common shareholders (37,908) 9,529
Weighted average number of shares in issue in thousands 301,591. 301,690
LTI restricted share grants 3,024. 1,625
ESOP shares 2,535. 2,328
Adjusted weighted average number of shares in issue 307,150. 305,643
Fully diluted (loss) / earnings per common share (12.6)¢ 3.1 ¢
Attributable to:
Continuing operations 12.2¢ 16.2 ¢
Discontinued operation (24.8) ¢ (13.1) ¢
Notes to the Financial Statements Sagicor Financial Corporation Year ended December 31, 2013 Amounts expressed in US$000
Sagicor Financial Corporation 70
35 OTHER COMPREHENSIVE INCOME (OCI)
Schedule to OCI from continuing operations
2013 2012 restated
OCI tax expense
After tax OCI is attributable to OCI tax expense
After tax OCI is attributable to
Shareholders Participating policyholders
Minority interests
Total Shareholders Participating policyholders
Minority interests
Total
Items that may be reclassified subsequently to income:
Notes to the Financial Statements Sagicor Financial Corporation Year ended December 31, 2013 Amounts expressed in US$000
71 Sagicor Financial Corporation
36 CASH FLOWS 36.1 Operating activities 2013 2012 Adjustments for non-cash items, interest and dividends:
Interest and dividend income (251,046) (256,875)
Net investment gains (36,544) (34,506)
Net increase in actuarial liabilities 109,764 178,541
Gain on recapture of insurance portfolio - (32,155)
Interest expense and finance costs 74,754 86,362
Depreciation and amortisation 15,230 15,901
Increase in provision for unearned premiums 390 212
Other items 11,711 (4,227)
(75,741) (46,747)
Net increase in investments and operating assets:
Investment property 16,616 1,274
Debt securities (270,725) (142,401)
Equity securities (23,156) (50,219)
Mortgage loans 2,785 6,995
Policy loans (3,332) (913)
Finance loans and finance leases (24,504) 2,893
Securities purchased for re-sale (24,547) (3,413)
Deposits (24,426) (5,513)
Other assets and receivables (115) (2,260)
(351,404) (193,557)
36.1 Operating activities (continued) The gross changes in investment property, debt securities and equity securities are as follows.
2013 2012 Investment property:
Disbursements (1,424) (356)
Disposal proceeds 18,040 1,630
16,616 1,274
Debt securities:
Disbursements (1,115,332) (915,967)
Disposal proceeds 844,607 773,566
(270,725) (142,401)
Equity securities:
Disbursements (90,976) (116,964)
Disposal proceeds 67,820 66,745
(23,156) (50,219)
Net increase in operating liabilities:
Insurance liabilities 2,007 4,251
Investment contract liabilities 38,667 37,631
Other funding instruments 57,330 (13,591)
Deposits 47,636 15,528
Securities sold for re-purchase (24,712) (27,019)
Other liabilities and payables 62,451 (2,816)
183,379 13,984
Notes to the Financial Statements Sagicor Financial Corporation Year ended December 31, 2013 Amounts expressed in US$000
Sagicor Financial Corporation 72
36.2 Investing activities
2013 2012
Property, plant and equipment:
Purchases (19,899) (21,591)
Disposal proceeds 1,615 1,748
(18,284) (19,843)
36.3 Financing activities
2013 2012
Other notes and loans payable:
Proceeds 43,096 2,055
Repayments (664) -
42,432 2,055
36.4 Cash and cash equivalents
2013 2012
Cash resources 226,370 183,996
Call deposits and other liquid balances 67,998 44,382
Bank overdrafts (1,933) (1,954)
Other short-term borrowings (33,835) (31,927)
Cash and cash equivalents of discontinued operation (note 38) - 19,067
258,600 213,564
37 SUBSIDIARY ACQUISITION AND OWNERSHIP CHANGES On July 13, 2012, the Group sold an interest in Sagicor Life Jamaica Limited totalling 8% to the major minority shareholder, 0.2% to the Sagicor Life Jamaica LTI plan and an insignificant amount of shares to the market of the Jamaica Stock Exchange. The net proceeds on sale totalled $35,416 representing cash consideration, and gave rise to a net gain to shareholders of $4,862 which was booked to retained earnings, and net movements in shareholders' equity reserves of $1,028. On September 28, 2012, Sagicor Life Insurance Company (SLIC) completed its acquisition of PEMCO Life Insurance Company (PEMCO Life), a life insurance company based in the State of Washington, USA. Details of the acquisition are set out below.
Fair Value Acquiree's
carrying value
Net assets acquired:
Financial investments 8,994 8,825
Miscellaneous assets and receivables 122 2,405
Cash resources 769 769
Policy liabilities 2,321 (5,724)
Income tax liabilities (1,868) -
Accounts payable and accrued liabilities (108) (114)
Total net assets 10,230 6,161
Share of net assets acquired 10,230
Purchase consideration and related costs (7,861)
Gain arising on acquisition (note 26) 2,369 The gain on acquisition reflects the pricing of the transaction which valued the insurance liabilities on a USA statutory insurance basis. The fair value of the insurance liabilities acquired, were determined consistently with the Company's accounting policies as set out in note 2.12. PEMCO Life was merged with SLIC effective December 31, 2012.
Notes to the Financial Statements Sagicor Financial Corporation Year ended December 31, 2013 Amounts expressed in US$000
73 Sagicor Financial Corporation
38 Discontinued operation (continued) The Group's effective shareholder's interest in these companies prior to divestment was 100% and the effective legal interest was 93%. The consideration for the sale was £56,178,000 ($91,913), representing the assumption by AmTrust of indebtedness of Sagicor Europe and its subsidiaries to Sagicor. The terms of the sale required the Company to take certain actions and provide certain commitments which included:
The purchase prior to the sale by Sagicor of the legal 7% shareholding interest held by the minority shareholders;
Future price adjustments to the consideration, representing adjusted profits or losses from January 1, 2013 in the run-off of the 2011, 2012 and 2013 underwriting years of account of syndicates 1206 and 44, the total price adjustments subject to a limit.
Immediately prior to the sale, Sagicor purchased the minority shareholdings for $1,157. The minority shareholders were participating employees who had subscribed in cash for shares of Sagicor Europe. Each participating employee had contracted with Sagicor Europe and the Company under a share subscription agreement. Under the provisions of these agreements, participating employees could exercise a put option to the Company to acquire their shares at the prevailing fair value. The first tranches of put options vested in 2012 and 2013 representing 7% of the total shareholding and were exercised for cash consideration of $1,305. The put options were accounted for as cash settled share based payment arrangements. As of December 31, 2013, the price adjustments have been estimated at £33,289,000 ($55,024) which has been recorded as a liability to AmTrust. The anticipated settlement dates are as follows:
The price adjustments have a limit of a further £41,223,000 ($68,137) which is the Group's maximum possible contingent liability for future price adjustments.
38 DISCONTINUED OPERATION On July 29, 2013, the Company entered into an agreement to sell Sagicor Europe and its subsidiaries to AmTrust Financial Services, Inc. (AmTrust), subject to regulatory approvals. Final regulatory approvals were obtained on December 23, 2013, on which date the sale was completed. The operations of the Sagicor Europe operating segment are presented as discontinued operations in these financial statements. This segment comprised the following companies.
Sagicor Europe Segment Companies
Principal Activities Country of
Incorporation
Sagicor Europe Limited Insurance holding company The Cayman
Islands
Sagicor at Lloyd’s Limited Managing agent of Lloyd’s of London insurance syndicates
UK – England & Wales
Sagicor Corporate Capital Limited (1) Property and casualty insurance UK– England
& Wales Sagicor Cayman Reinsurance Company Limited
Property and casualty reinsurance The Cayman
Islands Sagicor Corporate Capital Two Limited (2) Life insurance
UK– England & Wales
Sagicor Syndicate Services Limited Property and casualty insurance agency
UK– England & Wales
Sagicor Underwriting Limited Property and casualty insurance agency
UK– England & Wales
Sagicor Syndicate Holdings Limited Service company UK– England
& Wales Sagicor Claims Management Inc
Property and casualty insurance claims management
USA -California
(1) Lloyd’s of London corporate underwriting member participating in Syndicate 1206 (2) Lloyd’s of London corporate underwriting member participating in Syndicate 44
Notes to the Financial Statements Sagicor Financial Corporation Year ended December 31, 2013 Amounts expressed in US$000
Sagicor Financial Corporation 74
38 Discontinued operation (continued) The price adjustments are subject to insurance risk (as indicated in note 3.5) and to investment and foreign currency risk as the results of run-off of the underwriting years up to 2013 could vary if there are future deviations in projected underwriting returns, investment returns and foreign exchange rates. After accounting for its status as a discontinued operation and for the details of the sale, the net loss recognised in the statement of income and the statement of comprehensive income is as follows.
Statement of income Period to
December 23, 2013
2012
Loss from operations (33,247) (31,790)
Write-down of carrying value of investment in Sagicor Europe (21,123) (10,244)
Expenses incurred on sale (2,900) -
Available for sale asset fair value loss realised on sale (623) -
Currency translation loss realised on sale (17,615) -
Net loss (75,508) (42,034)
Other comprehensive income:
Items that may be reclassified subsequently to income:
Fair value reserve for available for sale assets:
Net fair value movements prior to sale (147) (399)
Cumulative loss transferred to income on sale 623 -.
Net currency translation movements prior to sale 1,181 543.
Currency translation loss transferred to income on sale 17,615 -.
Other comprehensive loss 19,272 144.
Total comprehensive loss (56,236) (41,890)
38 Discontinued operation (continued) Details of the loss from operations were as follows.
Period to
December 23, 2013
2012
Revenue
Premium revenue 313,537 372,382
Reinsurance premium expense (47,559) (60,959)
265,978 311,423
Net investment income 4,330 8,227
Fees and other revenue (4,139) 3,810
266,169 323,460
Benefits and expenses
Policy benefits and change in actuarial liabilities 212,648 230,353
Policy benefits and change in actuarial liabilities reinsured (31,216) (29,896)
181,432 200,457
Administrative expenses, depreciation and amortisation 41,951 39,105
Brokerage commissions 77,455 99,529
300,838 339,091
Loss before taxes and undernoted items (34,669) (15,631)
Income tax 10,366 (4,484)
Finance costs for Funds at Lloyd's (11,548) (9,717)
Foreign exchange and cash-settled compensation 2,604 (1,958)
Loss from operations (33,247) (31,790)
Notes to the Financial Statements Sagicor Financial Corporation Year ended December 31, 2013 Amounts expressed in US$000
75 Sagicor Financial Corporation
38 Discontinued operation (continued) Net cash flows from the discontinued operation were as follows:
Period to
December 23, 2013
Year ended December 31,
2012 Operating activities (20,653) (50,668)
Investing activities (167) (1,821)
Financing activities 1,150 -
Cash on disposal (61,069) -
Effects of exchange rate changes 1,857 481
(78,882) (52,008) The assets and liabilities held for sale of the discontinued operation as of December 31, 2012 are set out in the following tables.
2012
Assets
Property, plant and equipment 544
Intangible assets 24,727
Financial investments (1) 346,735
Reinsurance assets (2) 116,653
Income tax assets 12,037
Miscellaneous assets and receivables 186,319
Cash resources 18,717
705,732
38 Discontinued operation (continued) Included in premium revenue and reinsurance premium expense are property and casualty insurance lines as follows:
Gross premium Ceded to reinsurers
2013 2012 2013 2012
Direct property 134,072. 96,965 24,719 21,159
Direct motor (6,269) 51,483 (5) 4,853
Direct accident and liability 133,406. 141,321 15,813 20,379
Reinsurance assumed 29,762. 61,671 6,084 14,001
290,971. 351,440 46,611 60,392 Included in policy benefits and change in actuarial liabilities (reinsured) are property and casualty insurance claims as follows:
Gross benefit Ceded to reinsurers
2013 2012 2013 2012
Direct property 97,901. 46,938 30,908 13,526
Direct motor (2,799) 36,214 (5,146) (4,507)
Direct accident and liability 83,266. 112,495 2,066 16,230
Reinsurance assumed 29,206. 29,590 3,250 4,466
207,574. 225,237 31,078 29,715
Notes to the Financial Statements Sagicor Financial Corporation Year ended December 31, 2013 Amounts expressed in US$000
Sagicor Financial Corporation 76
38 Discontinued operation (continued)
2012
Liabilities
Insurance liabilities (2) 603,807
Provisions 3,271
Accounts payable and accrued liabilities 23,899
630,977 (1) Financial investments included $48,918 in deposits which were pledged as collateral for the letter
of credit facility (note 39). Financial investments included debt securities totalling $188,425 which were carried at fair value and classified as Level 1 financial instruments (see note 41.5).
(2) Included in insurance liabilities were property and casualty benefits payable of $440,952 and
provision for unearned property and casualty premium of $155,459. The corresponding reinsurers' share of property and casualty policy benefits payable totalling $96,175 and reinsurers' share of unearned property and casualty premium totalling $19,032 were both included in reinsurance assets.
Under the terms of sale, the banker's letter of credit facility and the reinsurance financing facility were cancelled. The banker's letter of credit was secured by $50,104 which was returned to Sagicor in January 2014. These funds are included in other receivables (note 12). As a result of the sale, Sagicor has no Funds at Lloyd's in respect of the 2013 and prior underwriting years of account. The banker's letter of credit facility had financial covenants with respect to tangible net worth, interest coverage ratio, financial strength and permitted liens. These covenants were satisfied except for the interest coverage ratio for the year ended December 31, 2012 and for the financial strength coverage from February 2013 until the cancellation of the letter of credit in December 2013. During this latter period, the Bank issued a waiver of the financial strength obligation.
39 CONTINGENT LIABILITIES Guarantee and financial facilities at the date of the financial statements for which no provision has been made in these financial statements include the following:
2013 2012 Customer guarantees and letters of credit (1) 12,372 8,993
Letter of credit facility (note 38) - 84,236
12,372 93,229
(1) There are equal and offsetting claims against customers in the event of a call on the above commitments for customer guarantees and letters of credit.
(a) Legal proceedings
During the normal course of business, the Group is subject to legal actions which may affect the reported amounts of liabilities, benefits and expenses. Management considers that any liability from these actions, for which provision has not been already made, will not be material. (b) Tax assessments
The Group is also subject to tax assessments during the normal course of business. Adequate provision has been made for all assessments received to date and for tax liabilities accruing in accordance with management’s understanding of tax regulations. Potential tax assessments may be received by the Group which are in addition to accrued tax liabilities. No provisions have been made in these financial statements for such potential tax assessments.
Notes to the Financial Statements Sagicor Financial Corporation Year ended December 31, 2013 Amounts expressed in US$000
77 Sagicor Financial Corporation
40 FAIR VALUE OF PROPERTY
Investment and owner-occupied property are carried at fair value as determined by independent valuations using internationally recognised valuation techniques. Direct sales comparisons, when such data is available, and income capitalisation methods, when appropriate, are included in the assessment of fair values. The highest and best use of a property may also be considered in determining its fair value. Some tracts of land are currently used for farming operations or are un-developed or are leased to third parties. In determining the fair value of all lands, their potential for development within a reasonable period is assessed, and if such potential exists, the fair value reflects that potential. These lands are mostly in Barbados and the Group has adopted a policy of orderly development and transformation to realise their full potential over time. The fair value hierarchy has been applied to the valuations of the Group's property. The different levels of the hierarchy are as follows:
Level 1 - fair value is determined by quoted un-adjusted prices in active markets for identical assets;
Level 2 - fair value is determined by inputs other than quoted prices in active markets that are observable for the asset either directly or indirectly;
Level 3 - fair value is determined from inputs that are not based on observable market data.
The results of applying the fair value hierarchy to the Group's property as of December 31, 2013 are as follows:
Level 1 Level 2 Level 3 Total
Investment property - - 98,369 98,369
Owner-occupied lands - - 38,428 38,428
Owner-occupied land and buildings - - 66,281 66,281
- - 203,078 203,078
40 Fair value of property (continued) For Level 3 investment property, reasonable changes in fair value would affect net income. For Level 3 owner occupied property, reasonable changes in fair value would affect other comprehensive income. The following table represents the movements in Level 3 property for the current year.
Investment
property
Owner-occupied property Total
Lands Land and buildings
Balance, beginning of year 115,224. 38,428 65,124. 218,776..
Additions 1,340. - 1,408. 2,748..
Transfers in / (out) 875. - (616) 259..
Fair value changes recorded in net investment income
980. - (91) 889.
Fair value changes recorded in other comprehensive income
-. - 3,388. 3,388.
Disposals and divestitures (16,978) - (1,581) (18,559)
Effect of exchange rate changes (3,072) - (1,351) (4,423)
Balance, end of year 98,369. 38,428 66,281. 203,078.
Notes to the Financial Statements Sagicor Financial Corporation Year ended December 31, 2013 Amounts expressed in US$000
Sagicor Financial Corporation 78
41 FINANCIAL RISK
The Group’s activities of issuing insurance contracts, of accepting funds from depositors, of investing insurance premium and deposit receipts in a variety of financial and other assets, banking and dealing in securities, exposes the Group to various insurance and financial risks. Financial risks include credit default, liquidity and market risks. Market risks arise from changes in interest rates, equity prices, currency exchange rates or other market factors. The principal insurance risks are identified in notes 42 and 43. The overriding objective of the Group’s risk management framework is to enhance its capital base through competitive earnings growth and to protect capital against inherent business risks. This means that the Group accepts certain levels of risk in order to generate returns, and the Group manages the levels of risk assumed through enterprise wide risk management policies and procedures. Identified risks are assessed as to their potential financial impact and as to their likelihood of occurrence. The amounts disclosed in this note and in notes 42 and 43, exclude amounts in the statement of financial position classified as assets of discontinued operation and as liabilities of discontinued operation.
41.1 Credit risk Credit risk is the exposure that the counterparty to a financial instrument is unable to meet an obligation, thereby causing a financial loss to the Group. Credit risks are primarily associated with financial investments and reinsurance contracts held. Credit risk from financial investments is minimised through holding a diversified portfolio of investments, purchasing securities and advancing loans only after careful assessment of the borrower, obtaining collateral before advancing loans, and placing deposits with financial institutions with a strong capital base. Limits may be placed on the amount of risk accepted in relation to one borrower. The Group has developed an internal credit rating standard. The internal rating is a 10 point scale which allows for distinctions in risk characteristics and is referenced to the rating scales of international credit rating agencies. The scale is set out in the following table.
Category Sagicor
Risk Rating
Classification S&P Moody’s Fitch AM Best
Non-
defau
lt
Investment grade
1 Minimal risk AAA, AA Aaa, Aa AAA, AA aaa, aa
2 Low risk A A A a
3 Moderate risk BBB Baa BBB bbb
Non- investment grade
4 Acceptable risk BB Ba BB bb
5 Average risk B B B b
Watch 6 Higher risk CCC, CC Caa, Ca CCC, CC ccc, cc
7 Special mention C C C c
Default
8 Substandard
D C
DDD
d 9 Doubtful DD
10 Loss D
Notes to the Financial Statements Sagicor Financial Corporation Year ended December 31, 2013 Amounts expressed in US$000
79 Sagicor Financial Corporation
41
41.1 Credit risk (continued) The Group applies this rating scale to three categories of exposures: Investment portfolios, comprising debt securities, deposits, securities purchased for re-sale, and
cash balances; Lending portfolios, comprising mortgage, policy and finance loans and finance leases; Reinsurance exposures, comprising reinsurance assets for life, annuity and health insurance (see
note 43.3) or realistic disaster scenarios for property and casualty insurance (see note 42.3). The 3 default grades are used for lending portfolios while investment portfolios and reinsurance exposures use one default grade: 8. The maximum exposures of the Group to credit risk without taking into account any collateral or any credit enhancements are set out in the following table.
Total financial statement exposures 4,656,192 98.6 4,208,910 99.2
Loan commitments 40,728 0.9 21,073 0.5
Customer guarantees and letters of credit 12,372 0.2 8,993 0.3
Other 13,626 0.3 - -
Total off financial statement exposures 66,726 1.4 30,066 0.8
Total 4,722,918 100.0% 4,238,976 100.0%
The amounts in respect of customer guarantees and letters of credit represent potential claims against customers in the event of a call on customer guarantees and letters of credit issued by the Group.
41.1 Credit risk (continued) The Group’s largest exposures to individual counterparty credit risks as of December 31, 2013 and 2012 are set out below. The individual ratings reflect the rating of the counterparty listed below, while the amounts include exposures with subsidiaries of the counterparty.
Sagicor
Risk Rating
2013 Sagicor
Risk Rating
2012
Investment portfolios:
Government of Jamaica 5 869,609 5 964,133
Government of Trinidad and Tobago 2 148,897 2 135,768
Government of Barbados 4 301,385 4 281,570
The Bank of Nova Scotia 1 74,886 1 67,213
Government of St Lucia 5 70,370 4 48,205
The Federal National Mortgage Association 1 88,020 1 86,054
The Federal Home Loan Mortgage Corporation
1 66,444 1 64,689
Lending portfolios:
Value Assets International S.A. and Egret Limited
4 59,452 4 52,546
Reinsurance assets:
Guggenheim Partners (1) 5 229,433 n/a n/a
(1) The reinsurance asset held in the name of Guggenheim Partners are secured by assets held in trust totalling $230,255 (2012 - $nil).
Notes to the Financial Statements Sagicor Financial Corporation Year ended December 31, 2013 Amounts expressed in US$000
The results of the risk rating of investment portfolios are as follows: Investment portfolios
Risk Rating
Classification 2013 2012
Exposure $000
Exposure %
Exposure $000
Exposure %
1 Minimal risk 484,677 13% 472,923 14%
2 Low risk 677,896 19% 640,588 18%
3 Moderate risk 792,690 22% 688,242 20%
4 Acceptable risk 432,679 12% 450,759 13%
5 Average risk 1,182,436 33% 1,136,269 33%
6 Higher risk 15,849 0% 39,772 1%
7 Special mention 6,461 0% 3,103 0%
8 Substandard 9,535 0% 4,247 0%
TOTAL RATED EXPOSURES 3,602,223 99% 3,435,903 99%
UN-RATED EXPOSURES 18,245 1% 27,427 1%
TOTAL 3,620,468 100% 3,463,330 100% Investment portfolio assets are mostly unsecured except for securities purchased under agreement to resell for which title to the securities is transferred to the Group for the duration of each agreement.
41.1 Credit risk (continued) (b) Lending portfolios The results of the risk rating of lending portfolios are as follows: Lending portfolios
Risk Rating
Classification 2013 2012
Exposure $000
Exposure %
Exposure $000
Exposure %
1 Minimal risk 134,565 24% 125,296 23%
2 Low risk 101,367 18% 127,126 23%
3 Moderate risk 122,481 22% 125,575 23%
4 Acceptable risk 37,076 7% 13,490 2%
5 Average risk 54,500 10% 51,103 9%
6 Higher risk 13,250 2% 10,459 2%
7 Special mention 904 0% 3,720 1%
8 Substandard 10,977 2% 13,474 2%
9 Doubtful 2,381 0% 3,325 1%
10 Loss 2,469 0% 4,271 1%
TOTAL RATED EXPOSURES 479,970 85% 477,839 87%
UN-RATED EXPOSURES 76,923 15% 66,518 13%
TOTAL 556,893 100% 544,357 100%
Notes to the Financial Statements Sagicor Financial Corporation Year ended December 31, 2013 Amounts expressed in US$000
81 Sagicor Financial Corporation
41.1 Credit risk (continued) Exposure to credit risk is also managed in part by obtaining collateral and guarantees for lending portfolios. For mortgage loans, the collateral is real estate property, and the approved loan limit is 75% to 100% of collateral value. For finance loans and finance leases, the collateral often comprises a vehicle or other form of security and the approved loan / lease limit is 80% to 90% of the collateral value. Unsecured finance loans and finance leases are only granted when the initial amount is less than $15. Policy loans are advanced on the security of the underlying insurance policy cash values. Cash loans are advanced to a maximum of 82% to 100% of the cash surrender value. Automatic premium loans may be advanced to the extent of available cash surrender value. Exposure to the lending portfolios by geographic area is as follows.
2013 2012
Barbados 206,762 200,061 Jamaica 123,276 122,865 Trinidad & Tobago 78,364 85,679 Other Caribbean 91,217 75,043 USA 57,274 60,709
556,893 544,357 (c) Past due and impaired financial assets A financial asset is past due when a counterparty has failed to make payment when contractually due. The Group is most exposed to the risk of past due assets with respect to its debt securities, mortgage loans, finance loans and finance leases. Debt securities are assessed for impairment when amounts are past due, when the borrower is experiencing cash flow difficulties, or when the borrower’s credit rating has been downgraded.
41.1 Credit risk (continued) Mortgage loans less than 90 to 180 days past due and finance loans and finance leases less than 90 days past due are not assessed for impairment unless other information is available to indicate the contrary. The assessment for impairment includes a review of the collateral. If the past due period is less than the trigger for impairment review, the collateral is not normally reviewed and re-assessed. Accumulated allowances for impairment reflect the Group’s assessment of total individually impaired assets at the date of the financial statements. The following tables set out the carrying values of debt securities, mortgage loans, finance loans and finance leases, analysed by past due or impairment status.
Debt
securities Mortgage
loans
Finance loans & leases
2013 Neither past due nor impaired 3,175,967 167,522 143,909
Past due up to 3 months, but not impaired 6,587 55,945 16,937
Past due up to 12 months, but not impaired 250 11,444 193
Past due up to 5 years, but not impaired - 4,034 -
Past due over 5 years, but not impaired - 6,881 -
Total past due but not impaired 6,837 78,304 17,130
Impaired assets 8,972 11,781 4,011
Total carrying value 3,191,776 257,607 165,050
Accumulated allowances on impaired assets 9,759 3,034 2,682
Accrued interest on impaired assets 4,096 319 132
Notes to the Financial Statements Sagicor Financial Corporation Year ended December 31, 2013 Amounts expressed in US$000
Sagicor Financial Corporation 82
41.1 Credit risk (continued)
Debt
securities Mortgage
loans
Finance loans & leases
2012 Neither past due nor impaired 3,107,172 173,060 116,082
Past due up to 3 months, but not impaired 11,927 56,458 33,820
Past due up to 12 months, but not impaired 250 9,516 104
Past due up to 5 years, but not impaired 174 5,763 -
Past due over 5 years, but not impaired 39 6,731 -
Total past due but not impaired 12,390 78,468 33,924
Impaired assets 4,360 12,824 4,702
Total carrying value 3,123,922 264,352 154,708
Accumulated allowances on impaired assets 2,492 2,704 3,143
Accrued interest on impaired assets 20 398 90 The Group is also exposed to impaired premiums receivable. Property and casualty insurers frequently provide settlement terms to customers and intermediaries which extend up to 3 months. However, under the terms of insurance contracts, insurers can usually lapse an insurance policy for non-payment of premium, or if there is a claim, recover any unpaid premiums from the claim proceeds. (d) Repossessed assets The Group may foreclose on overdue mortgage loans and finance loans and finance leases by repossessing the pledged asset. The pledged asset may consist of real estate, equipment or vehicles which the Group will seek to dispose of by sale. In some instances, the Group may provide re-financing to a new purchaser on customary terms.
41.1 Credit risk (continued) (e) Renegotiated assets The Group may renegotiate the terms of any financial investment to facilitate borrowers in financial difficulty. Arrangements to waive, adjust or postpone scheduled amounts due may be entered into. The Group classifies these amounts as past due, unless the original agreement is formally revised, modified or substituted. 41.2 Liquidity risk Liquidity risk is the exposure that the Group may encounter difficulty in meeting obligations associated with financial or insurance liabilities that are settled by cash or by another financial asset. Liquidity risk also arises when excess funds accumulate resulting in the loss of opportunity to increase investment returns. Asset liability matching is a tool used by the Group to mitigate liquidity risks particularly in operations with significant maturing short-term liabilities. For long-term insurance contracts, the Group has adopted a policy of investing in assets with cash flow characteristics that closely match the cash flow characteristics of its policy liabilities. The primary purpose of this matching is to ensure that cash flows from these assets are synchronised with the timing and the amounts of payments that must be paid to policyholders. Group companies monitor cash inflows and outflows in each operating currency. Through experience and monitoring, the Group is able to maintain sufficient liquid resources to meet current obligations. Investment property may be held to back insurance liabilities. As these assets are relatively illiquid, the insurers hold less than 5% of their total assets in investment property.
Notes to the Financial Statements Sagicor Financial Corporation Year ended December 31, 2013 Amounts expressed in US$000
83 Sagicor Financial Corporation
41.2 Liquidity risk (continued) (a) Insurance liabilities The Group’s monetary insurance liabilities mature in periods which are summarised in the following table. Amounts are stated at their carrying values recognised in the financial statements and are analysed by their expected due periods, which have been estimated by actuarial or other statistical methods. Expected discounted cash flows
Other insurance liabilities 85,276 13,177 55,393 153,846
Total 208,860 428,853 1,557,040 2,194,753
Notes to the Financial Statements Sagicor Financial Corporation Year ended December 31, 2013 Amounts expressed in US$000
Sagicor Financial Corporation 84
41.2 Liquidity risk (continued) (b) Financial liabilities and commitments Contractual cash flow obligations of the Group in respect of its financial liabilities and commitments are summarised in the following table. Amounts are analysed by their earliest contractual maturity dates and consist of the contractual un-discounted cash flows. Where the interest rate of an instrument for a future period has not been determined as of the date of the financial statements, it is assumed that the interest rate then prevailing continues until final maturity. 2013 - Contractual un-discounted cash flows 2012 - Contractual un-discounted cash flows
Non-cancellable operating lease and rental payments 7,001 16,581 5,908 29,490 5,895 12,678 6,511 25,084 Guarantees, acceptances and other financial facilities 10,321 1,917 134 12,372 4,133 4,506 355 8,994
Total off financial statements commitments 31,587 26,685 7,295 65,567 16,430 31,019 7,702 55,151
Total 1,462,192 561,000 27,908 2,051,100 1,427,299 483,449 53,911 1,964,659
Notes to the Financial Statements Sagicor Financial Corporation Year ended December 31, 2013 Amounts expressed in US$000
85 Sagicor Financial Corporation
41.2 Liquidity risk (continued) (c) Financial and insurance assets The contractual maturity periods of monetary financial assets and the expected maturity periods of monetary insurance assets are summarised in the following table. Amounts are stated at their carrying values recognised in the financial statements. For this disclosure, monetary insurance assets comprise policy loans and reinsurance assets.
2013 – Contractual or expected discounted cash flows 2012 – Contractual or expected discounted cash flows
Total 1,083,368 1,054,042 2,518,782 4,656,192 873,516 1,047,301 2,292,106 4,212,923
Notes to the Financial Statements Sagicor Financial Corporation Year ended December 31, 2013 Amounts expressed in US$000
Sagicor Financial Corporation 86
41.3 Interest rate risk The Group is exposed to interest rate risks. Cash flow interest rate risk is the risk that future cash flows of a financial instrument will fluctuate because of changes in market interest rates. Fair value interest rate risk is the risk that the fair value of a financial instrument will fluctuate because of changes in market interest rates. The occurrence of an adverse change in interest rates on invested assets may result in financial loss to the Group in fulfilling the contractual returns on insurance and financial liabilities. The return on investments may be variable, fixed for a term or fixed to maturity. On reinvestment of a matured investment, the returns available on the new investment may be significantly different from the returns formerly achieved. This is known as reinvestment risk. Guaranteed minimum returns exist within cash values of long term traditional insurance contracts, long term universal life insurance contracts, annuity options, deposit administration liabilities and policy funds on deposit. Where the returns credited exceed the guaranteed minima, the insurer usually has the option to adjust the return from period to period. For other financial liabilities, returns are usually contractual and may only be adjusted on contract renewal or contract re-pricing. The Group is therefore exposed to the effects of fluctuations in the prevailing levels of market interest rates on its financial position and cash flows. Interest margins may increase or decrease as a result of such changes. Interest rate changes may also result in losses if asset and liability cash flows are not closely matched with respect to timing and amount. The Group is exposed to risk under embedded derivatives contained in a host insurance contract. These risks include exposures to investment returns which may produce losses to the insurer arising from the following contract features:
minimum annuity rates which are guaranteed to be applied at some future date; minimum guaranteed death benefits which are applicable when the performance of an
interest bearing or unit linked fund falls below expectations; minimum guaranteed returns in respect of cash values and universal life investment
accounts.
41.3 Interest rate risk (continued)
The Group manages its interest rate risk by a number of measures, including where feasible the selection of assets which best match the maturity of liabilities, the offering of investment contracts which match the maturity profile of assets, the re-pricing of interest rates on loans receivable, policy contracts and financial liabilities in response to market changes. In certain Caribbean markets, where availability of suitable investments is often a challenge, the Group holds many of its fixed rate debt securities to maturity and therefore mitigates the transient interest rate changes in these markets.
Notes to the Financial Statements Sagicor Financial Corporation Year ended December 31, 2013 Amounts expressed in US$000
87 Sagicor Financial Corporation
41.3 Interest rate risk (continued) The table following summarises the exposures to interest rates on the Group’s monetary insurance and financial liabilities (excluding actuarial liabilities which are disclosed in note 43). It includes liabilities at carrying amounts, categorised by the earlier of contractual re-pricing or maturity dates. Insurance liabilities are categorised by their expected maturities.
Notes to the Financial Statements Sagicor Financial Corporation Year ended December 31, 2013 Amounts expressed in US$000
Sagicor Financial Corporation 88
41.3 Interest rate risk (continued) The table following summarises the exposures to interest rate and reinvestment risks of the Group’s monetary insurance and financial assets. Assets are stated at carrying amounts, categorised by the earlier of contractual re-pricing or maturity dates. Reinsurance assets and policy loans are categorised by their expected maturities.
Notes to the Financial Statements Sagicor Financial Corporation Year ended December 31, 2013 Amounts expressed in US$000
89 Sagicor Financial Corporation
41.3 Interest rate risk (continued)
The table below summarises the average interest yields on financial assets and liabilities held during the year in respect of continuing operations.
2013 2012
Financial assets: Debt securities 6.6% 7.1% Mortgage loans 7.5% 7.6% Policy loans 7.1% 8.1% Finance loans and finance leases 10.0% 10.2% Securities purchased for re-sale 3.7% 5.1% Deposits 1.8% 2.4% Financial liabilities Investment contract liabilities 5.3% 7.2% Notes and loans payable 7.2% 7.9% Other funding instruments 2.2% 2.6% Deposits 3.6% 3.8% Securities sold for re-purchase 4.8% 5.4%
a) Sensitivity Sensitivity to interest rate risk is considered by operating subsidiaries. The effects of changes in interest rates of assets backing actuarial liabilities are disclosed in note 43.4. The Group’s property and casualty operations are not exposed to a significant degree of interest rate risk, since the majority of its interest bearing instruments has short-term maturities. The sensitivity of the Group’s principal operating subsidiaries engaged in banking, investment management and other financial services are considered in the following paragraphs.
41.3 Interest rate risk (continued) Sagicor Investments Jamaica Limited and Sagicor Bank Jamaica Limited The following table indicates the sensitivity to a reasonable possible change in interest rates, with all other variables held constant, on net income and total comprehensive income (TCI) of the above companies which operate in Jamaica. The sensitivity of income is the effect of the assumed changes in interest rates on income based on floating rate debt securities and financial liabilities. The sensitivity of TCI is calculated by revaluing fixed rate available-for-sale financial assets for the effects of the assumed changes in interest rates. The correlation of a number of variables will have an impact on market risk. It should be noted that movements in these variables are non-linear and are assessed individually.
+2.5% + 2% 6,174 (27,580) + 4% +2.5% 12,400 (15,865) 41.4 Foreign exchange risk The Group is exposed to foreign exchange risk as a result of fluctuations in exchange rates since its financial assets and liabilities are denominated in a number of different currencies. In order to manage the risk associated with movements in currency exchange rates, the Group seeks to maintain investments and cash in each operating currency, which are sufficient to match liabilities denominated in the same currency. Exceptions are made to invest amounts in United States dollar assets which are held to back liabilities in Caribbean currencies. Management considers that these assets diversify the range of investments available in the Caribbean, and in the long-term are likely to either maintain capital value and/or provide satisfactory returns. Assets and liabilities by currency are summarised in the following tables.
Notes to the Financial Statements Sagicor Financial Corporation Year ended December 31, 2013 Amounts expressed in US$000
Sagicor Financial Corporation 90
41.4 Foreign exchange risk (continued)
2013 US$ 000 equivalents of balances denominated in
Total monetary liabilites 684,669 693,262 475,350 146,008 2,296,974 158,490 4,454,753
Other liabilities (2) 13,765 3,738 20,378 3,151 20,216 1,541 62,789
Total liabilities of continuing operations 698,434 697,000 495,728 149,159 2,317,190 160,031 4,517,542
Net position 41,605 98,292 (60,379) 23,767 513,604 163,321 780,210 (1) Monetary balances only (2) Non-monetary balances, income tax balances and retirement plan assets
Notes to the Financial Statements Sagicor Financial Corporation Year ended December 31, 2013 Amounts expressed in US$000
91 Sagicor Financial Corporation
41.4 Foreign exchange risk (continued)
2012 restated US$ 000 equivalents of balances denominated in
Total monetary liabilities 647,506 746,649 446,250 111,729 1,926,628 169,218 4,047,980
Other liabilities (2) 14,367 7,501 19,799 2,615 20,965 1,719 66,966
Total liabilities of continuing operations 661,873 754,150 466,049 114,344 1,947,593 170,937 4,114,946
Net position 31,186 147,589 (23,431) 36,297 431,319 105,419 728,379 (1) Monetary balances only (2) Non-monetary balances, income tax balances and retirement plan assets
Notes to the Financial Statements Sagicor Financial Corporation Year ended December 31, 2013 Amounts expressed in US$000
Sagicor Financial Corporation 92
41.4 Foreign exchange risk (continued)
(a) Sensitivity The Group is exposed to currency risk in its operating currencies whose values have noticeably fluctuated against the United States dollar (USD). The exposure to currency risk may result in three types of risk, namely: Currency risk relating to the future cash flows of monetary balances This occurs when a monetary balance is denominated in a currency other than the functional currency of the reporting unit to which it belongs. In this instance, a change in currency exchange rates results in the monetary balances being retranslated at the date of the financial statements and the exchange gain or loss is taken to income (note 26).
Currency risk of reported results of foreign operations This occurs when a reporting unit’s functional currency depreciates or appreciates in value when retranslated to the USD, which is the Group’s presentational currency. In this instance, the conversion of the reporting unit’s results at a different rate of exchange results in either less or more income being consolidated in the Group’s income statement. Currency risk of the Group’s investment in foreign operations This occurs when a reporting unit’s functional currency depreciates or appreciates in value when retranslated to the USD, which is the Group’s presentational currency. In this instance, the conversion of the reporting unit’s assets and liabilities at a different rate of exchange results in a currency loss or gain which is recorded in the currency translation reserve (note 22). If the reporting unit was disposed of, either wholly or in part, then the corresponding accumulated loss or gain in the currency translation reserve would be transferred to income or retained earnings. The operating currency whose value noticeably fluctuate against the USD is the Jamaica dollar (JMD). The theoretical impact of JMD currency risk on reported results and of the Group’s investment in foreign operations is considered in the following section.
41.4 Foreign exchange risk (continued) JMD currency risk The effect of a 10% depreciation in the JMD relative to the USD arising from JMD reporting units as of December 31, 2013 and for the year then ended are considered in the following table.
Amounts denominated in Total amounts
Effect of a 10% depreciation JMD USD
Financial position:
Assets 887,102 760,513 1,647,615 (88,710)
Liabilities 709,769 557,731 1,267,500 (70,977)
Net position 177,333 202,782 380,115 (17,733)
Represented by:
Currency risk of the Group’s investment in foreign operations (17,733)
Income statement:
Revenue 459,242 41,522 500,764 (24,378)
Benefits (193,623) (61,015) (254,638) 19,362
Expenses (110,897) (2,019) (112,916) 11,090
Income taxes (5,632) - (5,632) 563
Net income 149,090 (21,512) 127,578 6,637
Represented by:
Currency risk relating to the future cash flows of monetary balances 21,546
Currency risk of reported results of foreign operations (14,909)
6,637
A 10% appreciation in the JMD relative to the USD would have equal and opposite effects to those disclosed above.
Notes to the Financial Statements Sagicor Financial Corporation Year ended December 31, 2013 Amounts expressed in US$000
93 Sagicor Financial Corporation
41.5 Fair value of financial instruments (continued) In assessing the fair value of non-traded financial liabilities, the Group uses a variety of methods including obtaining dealer quotes for specific or similar instruments and the use of internally developed pricing models, such as the use of discounted cash flows. If the non-traded liability is backed by a pool of assets, then its value is equivalent to the value of the underlying assets. Certain of the Group’s policy liabilities are unit linked, i.e. derive their value from a pool of assets which are carried at fair value. The Group assigns a fair value hierarchy of Level 2 to the contract liability if the liability represents the unadjusted fair value of the underlying pool of assets. (iii) Level 3 – inputs for the instrument that are not based on observable market data.
A financial instrument is classified as Level 3 if: The fair value is derived from quoted prices of similar instruments that are observable and
which would be classified as Level 2; or The fair value is derived from inputs that are not based on observable market data.
Level 3 available for sale securities comprise primarily of corporate and government agency debt instruments issued in the Caribbean, with significant amounts in Jamaica and Trinidad. The fair values of these instruments have been derived from December 31 market yields of government instruments of similar durations in the country of issue of the instruments. Level 3 assets designated include mortgage loans and securities purchased for re-sale for which the full income return and capital returns accrue to holders of unit linked policy and deposit administration contracts. These assets are valued with inputs other than observable market data. The techniques and methods described in the preceding section (ii) for non traded financial assets and liabilities may also used in determining the fair value of Level 3 instruments.
41.5 Fair value of financial instruments
The fair value of financial instruments is measured according to a fair value hierarchy which reflects the significance of market inputs in the valuation. This hierarchy is described and discussed in sections (i) to (iii) below. (i) Level 1 – unadjusted quoted prices in active markets for identical instruments. A financial instrument is regarded as quoted in an active market if quoted prices are readily and regularly available from an exchange or other independent source, and those prices represent actual and regularly occurring market transactions on an arm’s length basis. The Group considers that market transactions should occur with sufficient frequency that is appropriate for the particular market, when measured over a continuous period preceding the date of the financial statements. If there is no data available to substantiate the frequency of market transactions of a financial instrument, then the instrument is not classified as Level 1.
(ii) Level 2 – inputs that are observable for the instrument, either directly or indirectly
A financial instrument is classified as Level 2 if: The fair value is derived from quoted prices of similar instruments which would be classified
as Level 1; or The fair value is determined from quoted prices that are observable but there is no data
available to substantiate frequent market trading of the instrument. In estimating the fair value of non-traded financial assets, the Group uses a variety of methods such as obtaining dealer quotes and using discounted cash flow techniques. Where discounted cash flow techniques are used, estimated future cash flows are discounted at market derived rates for government securities in the same country of issue as the security; for non-government securities, an interest spread is added to the derived rate for a similar government security rate according to the perceived additional risk of the non-government security.
Notes to the Financial Statements Sagicor Financial Corporation Year ended December 31, 2013 Amounts expressed in US$000
Sagicor Financial Corporation 94
41.5 Fair value of financial instruments (continued) (a) Financial instruments carried at fair value
2013 2 2012
Level 1 Level 2 Level 3 Total Level 1 Level 2 Level 3 Total
Total liabilities - 29,916 131,745 161,661 - 46,512 113,300 159,812
Total liabilities by percentage 0% 19% 81% 100% 0% 29% 71% 100%
Notes to the Financial Statements Sagicor Financial Corporation Year ended December 31, 2013 Amounts expressed in US$000
95 Sagicor Financial Corporation
41.5 Fair value of financial instruments (continued) Balances totalling $165 have been transferred from Level 1 to Level 2 in 2013 (2012 - $10,018). There have been no other material transfers between Level 1 and Level 2 instruments during 2013 and 2012. For Level 3 instruments, reasonable changes in inputs which could be applied to the valuation of available for sale securities would affect other comprehensive income. Reasonable changes in inputs which could be applied to the valuations of investments designated at fair value are largely offset in income, since the changes in fair value are borne by contract holders. Changes in the valuations of structured products reflect changes in the underlying securities and are borne by the contract holders. The following table presents the movements in Level 3 instruments for the year.
2013 2012 2013 2012
Available for sale
securities
Investments at fair value
through income
Derivative instruments
Total assets
Total assets
Policy liabilities
Structured products
Total liabilities
Total liabilities
Balance, beginning of year 44,170 94,106 6,189 144,465 136,758 104,084 9,216 113,300 96,184
Balance, end of year 21,624 111,322 16,727 149,673 144,465 114,374 17,371 131,745 113,300
Fair value changes recorded in investment income for instruments held at end of year
- 118 7,388 7,506 (230) - - - -
Fair value changes recorded in interest expense for instruments held at end of year
- - - - - 5,524 - 5,524 5,922
Notes to the Financial Statements Sagicor Financial Corporation Year ended December 31, 2013 Amounts expressed in US$000
Sagicor Financial Corporation 96
41.5 Fair value of financial instruments (continued)
(b) Financial instruments carried at amortised cost
The carrying values of the Group’s non-traded financial assets and financial liabilities carried at amortised cost approximate their fair value in notes 10, 12, and 20. The fair value hierarchy of other financial instruments carried at amortised cost as of December 31, 2013 is set out in the following tables.
Level 1 Level 2 Level 3 Total
Held to maturity securities:
Debt securities - 20,466 - 20,466
Loans and receivables:
Debt securities - 349,140 632,346 981,486
Mortgage loans - 22,302 199,125 221,427
Policy loans - - 141,464 141,464
Finance loans and finance leases - - 161,631 161,631
Securities purchased for resale - - 40,713 40,713
- 371,442 1,175,279 1,546,721
- 391,908 1,175,279 1,567,187
41.5 Fair value of financial instruments (continued)
Securities sold for repurchase - - 525,267 525,267
- 95,261 982,031 1,077,292
- 412,628 1,236,880 1,649,508
Notes to the Financial Statements Sagicor Financial Corporation Year ended December 31, 2013 Amounts expressed in US$000
97 Sagicor Financial Corporation
41.5 Fair value of financial instruments (continued) (c) Equity price risk The Group is exposed to equity price risk arising from changes in the market values of its equity securities. The Group mitigates this risk by establishing overall limits of equity holdings for each investment portfolio and by maintaining diversified holdings within each portfolio of equity securities. Sensitivity The sensitivity to fair value changes in equity securities arises from those instruments classified as available for sale. There is no significant sensitivity to those instruments classified at fair value through income, since fair value changes are borne by policy contract holders. The effects of an across the board 20% change in equity prices of the Group’s available for sale equity securities as of December 31, 2013 on total comprehensive income before tax (TCIBT) are as follows.
Available for sale equities Carrying value 20% change
on TCIBT Listed on Caribbean stock exchanges and markets 19,659 3,932
Listed on US stock exchanges and markets 65,081 13,016
Listed on other exchanges and markets 7,635 1,527
92,375 18,475
41.6 Derivative financial instruments and hedging activities The Group's derivative activities give rise to open positions in portfolios of derivatives. These positions are managed to ensure that they remain within acceptable risk levels, with matching deals being utilised to achieve this where necessary. When entering into derivative transactions, the Group employs its credit risk management procedures to assess and approve potential credit exposures.
41.6 Derivative financial instruments and hedging activities (continued) Derivatives are carried at fair value and presented in the financial statements as separate assets and liabilities. Asset values represent the cost to the Group of replacing all transactions with a fair value in the Group’s favour assuming that all relevant counterparties default at the same time, and that transactions can be replaced instantaneously. Liability values represent the cost to the Group counterparties of replacing all their transactions with the Group with a fair value in their favour if the Group were to default. Derivative assets and liabilities on different transactions are only set off if the transactions are with the same counterparty, a legal right of set-off exists and the cash flows are intended to be settled on a net basis. The contract or notional amounts of derivatives and their fair values are set out below.
Contract /
notional amount
Fair value
Assets Liabilities
2013
Derivatives held for trading:
Currency forwards 2,763 2,683 2,763
Cross currency swap 24,965 24,965 26,313
Equity indexed options 317,699 17,568 840
345,427 45,216 29,916
2012
Derivatives held for trading:
Currency forwards 2,644 2,775 2,644
Cross currency swap 42,643 42,643 43,394
Equity indexed options 120,040 6,663 474
165,327 52,081 46,512
Notes to the Financial Statements Sagicor Financial Corporation Year ended December 31, 2013 Amounts expressed in US$000
Sagicor Financial Corporation 98
41.6 Derivative financial instruments and hedging activities (continued) (i) Currency forwards and swaps Currency forwards represent commitments to buy and sell foreign currencies on a gross basis at future dates at specified prices. The credit risk is evaluated for each contract and is collateralised where deemed necessary. The currency forward contracts are settled on a gross basis. Inforce at December 31, 2013 and 2012 is a contract to buy US dollars and sell Euros which expires in November 2014. (ii) Cross currency swap A Group company entered into a currency swap with an initial notional principal amount of Euro 45 million maturing in February 2015. Under the terms of this swap, the Group company pays Euro at a rate of 5% and receives 4.26% in US dollars on the notional principal amount. The Group company obtains principal and interest in Euros on a promissory note included in debt securities classified as financial assets at fair value through income in note 9. (iii) Equity indexed options The Group has purchased equity indexed options in respect of structured products and in respect of life and annuity insurance contracts. For certain structured product contracts with customers (note 17), equity indexed options give the holder the ability to participate in the upward movement of an equity index while being protected from downward risk. The Group is exposed to credit risk on purchased options only, and only to the extent of the carrying amount, which is their fair value.
41.6 Derivative financial instruments and hedging activities (continued) For certain universal life and annuity insurance contracts, an insurer has purchased custom call options that are selected to materially replicate the policy benefits that are associated with the equity indexed components within the policy contract. These options are appropriate to reduce or minimise the risk of movements in specific equity markets. Credit risk that the insurer has regarding the options is mitigated by ensuring that the counterparty is sufficiently capitalized. Both the asset and the associated actuarial liability are valued at fair market value on a consistent basis, with the change in values being reflected in the income statement. The valuations combine external valuations with internal calculations.
42 INSURANCE RISK – PROPERTY & CASUALTY CONTRACTS Property and casualty insurers in the Group are exposed to insurance risks such as underwriting, claims and availability of reinsurance, and to credit risk in respect of reinsurance counterparties. Sagicor General Insurance is the principal insurer within the Group's continuing operations that issues property and casualty insurance contracts. It operates mainly in Barbados and Trinidad and Tobago. The principal insurance risks affecting property and casualty contracts are disclosed in the following sections.
42.1 Underwriting risk Risks are priced to achieve an adequate return on capital on the insurer’s business as a whole. This return is expressed as a premium target return. Budgeted expenses and reinsurance costs are included in the pricing process. Various pricing methodologies, including benchmark exposure rates and historic experience are used and are generally applied by class of insurance. All methods produce a technical price, which is compared against the market to establish a price margin.
Notes to the Financial Statements Sagicor Financial Corporation Year ended December 31, 2013 Amounts expressed in US$000
99 Sagicor Financial Corporation
42.1 Underwriting risk (continued) Annually, the overall risk appetite is reviewed and approved. The risk appetite is defined as the maximum loss the insurer is willing to incur from a single event or proximate cause. Risks are only underwritten if they fall within the risk appetite. Individual risks are assessed for their contribution to aggregate exposures by nature of risk, by geography, by correlation with other risks, before acceptance. Underwriting a risk may include specific tests and enquiries which determine the insurer’s assessment of the risk. Insurers may also establish deductibles, exclusions, and coverage limits which will limit the potential losses incurred. Inaccurate pricing or inappropriate underwriting of insurance contracts, which may arise from poor pricing or lack of underwriting control, can lead to either financial loss or reputational damage to the insurer. 42.2 Claims risk Incurred claims are triggered by an event and may be categorised as:
attritional losses, which are expected to be of reasonable frequency and are less than established threshold amounts;
large losses, which are expected to be relatively infrequent, are greater than established threshold amounts;
catastrophic losses, which are an aggregation of losses arising from one incident or proximate cause, affecting one or more classes of insurance. These losses are infrequent and are generally very substantial.
The insurer records claims based on submissions made by claimants. The insurer may also obtain additional information from loss adjustors, medical reports and other specialist sources. The initial claim recorded may only be an estimate, which has to be refined over time until final settlement occurs. In addition, from the pricing methodology used for risks, it is assumed that at any particular date, there are claims incurred but not reported (IBNR).
42.2 Claims risk (continued) Claims risk is the risk that incurred claims may exceed expected losses. Claims risk may arise from
invalid or fraudulent claim submissions; the frequency of incurred claims; the severity of incurred claims; the development of incurred claims.
Claims risk may be concentrated in geographic locations, altering the risk profile of the insurer. The most significant exposure for this type of risk arises where a single event could result in a large number of claims. Concentration of risk is mitigated through risk selection, line sizes, event limits, quota share reinsurance and excess of loss reinsurance. Total insurance coverage on insurance policies provides a quantitative measure of absolute risk. However, claims arising in any one year are a very small proportion in relation to the total insurance coverage provided. The total amounts insured by the Group at December 31, gross and net of reinsurance, are summarised by class of insurance.
Total insurance coverage 2013 2012
Property Gross 5,999,030 5,999,415
Net 1,347,863 1,347,844
Motor Gross 346,662 346,662
Net 173,331 173,331
Accident and liability Gross 2,053,672 2,053,702
Net 995,697 995,697
Total Gross 8,399,364 8,399,779
Net 2,516,891 2,516,872
Notes to the Financial Statements Sagicor Financial Corporation Year ended December 31, 2013 Amounts expressed in US$000
Sagicor Financial Corporation 100
42.2 Claims risk (continued) The insurer assesses its exposures by modelling realistic disaster scenarios of potential catastrophic events. Claims arising from wind storms, earthquakes and floods and events triggering multi-coverage corporate liability claims are considered to be the potential sources of catastrophic losses arising from insurance risks. A realistic disaster scenario modelled for 2013 is presented below and results in estimated gross and net losses.
Gross loss Net loss
A Barbados and St. Lucia windstorm having a 200 year return period.
294,483 5,000
The occurrence of one or more catastrophic events in any year may have a material impact on the reported net income of the Group. 42.3 Reinsurance risk
To limit the potential loss for single policy claims and for aggregations of catastrophe claims, the insurer may cede certain levels of risk to a reinsurer. Reinsurance however does not discharge the insurer’s liability. Reinsurance risk is the risk that reinsurance is not available to mitigate the potential loss on an insurance policy. The risk may arise from
the credit risk of holding a recovery from a reinsurer; the unavailability of reinsurance cover in the market at adequate levels or prices, the failure of a reinsurance layer upon the occurrence of a catastrophic event.
The Group selects reinsurers which have well established capability to meet their contractual obligations and which generally have a Sagicor credit risk rating of 1 or 2. Insurers also place reinsurance coverage with various reinsurers to limit their exposure to any one reinsurer. The reinsurance programmes are negotiated annually with reinsurers for coverage generally over a 12 month period. It is done by class of insurance, though for some classes there is aggregation of classes and / or subdivision of classes by the location of risk.
42.3 Reinsurance risk (continued)
For its property risks, insurers use quota share and excess of loss catastrophe reinsurance treaties to obtain reinsurance cover. Catastrophe reinsurance is obtained for multiple claims arising from one event or occurring within a specified time period. However, treaty limits may apply and may expose the insurer to further claim exposure. Under some treaties, when treaty limits are reached, the insurer may be required to pay an additional premium to reinstate the reinsurance coverage. Excess of loss catastrophe reinsurance treaties typically cover up to four separate catastrophic events per year. For other insurance risks, insurers limit their exposure by event or per person by excess of loss or quota share treaties. Retention limits represent the level of risk retained by the insurer. Coverage in excess of these limits is ceded to reinsurers up to the treaty limit. Claim amounts in excess of reinsurance treaty limits revert to the insurer. Principal features of retention program used by Sagicor General for its property insurance class is summarised in the following table.
Type of risk Retention by insurers - currency amounts in thousands
Property
maximum retention of $5,250 for a single event; maximum retention of $5,000 for a catastrophic event; quota share retention to maximum of 30% in respect of treaty limits; quota share retention is further reduced to a maximum of $750 per
event. The effects of reinsurance ceded are disclosed in notes 14, 24 and 27 and information on reinsurance balances is included in notes 10, 20 and 41. In order to assess the potential reinsurance recoveries on the occurrence of a catastrophic insurance event, the Sagicor credit risk ratings of the reinsurance recoverable are assessed using the following realistic disaster scenario:
Hurricane with a 250 year return period affecting Barbados and St. Lucia and an earthquake with a 250 year return period affecting Trinidad within a 24 hour period.
Notes to the Financial Statements Sagicor Financial Corporation Year ended December 31, 2013 Amounts expressed in US$000
101 Sagicor Financial Corporation
42.3 Reinsurance risk (continued)
The reinsurance recoveries derived from the foregoing are assigned internal credit ratings as follows:
Risk Rating
Classification Exposure
$000 Exposure
%
1 Minimal risk 208,430 34%
2 Low risk 381,617 62%
3 Moderate risk 23,118 4%
4 Acceptable risk - 0%
5 Average risk - 0%
6 Higher risk - 0%
7 Special mention - 0%
8 Substandard - 0%
TOTAL 613,165 100%
43 INSURANCE RISK – LIFE, ANNUITY & HEALTH CONTRACTS Insurers are exposed to insurance risks such as product design and pricing, mortality and morbidity, lapse, expense, reinsurance, and actuarial liability estimation in respect of life, annuity and health contracts. Disclosure of these risks is set out in the following sections. 43.1 Contracts without investment returns These contracts are principally term life, critical illness and health insurance. Individual term life and critical illness products are generally long-term contracts while group term life and health insurance products are generally one year renewable. The principal insurance risks associated with these contracts are product design and pricing and mortality and morbidity.
43.1 Contracts without investment returns (continued) (a) Product design and pricing risk Product design and pricing risk arises from poorly designed or inadequately priced contracts and can lead to both financial loss and reputational damage to the insurer. Risks are priced to achieve an adequate return on capital on the insurer’s business as a whole. In determining the pricing of an insurance contract, the insurer considers the nature and amount of the risk assumed, and recent experience and industry statistics of the benefits payable. Pricing inadequacy may arise either from the use of inadequate experience and statistical data in deriving pricing factors or from market softening conditions. The underwriting process has established pricing guidelines, and may include specific medical tests and enquiries which determine the insurer’s assessment of the risk. Insurers may also establish deductibles and coverage limits for health risks which will limit the potential claims incurred. Term life and critical illness risks have limitations of insured amounts. The pricing of a contract therefore consists of establishing appropriate premium rates, deductibles and coverage limits.
(b) Mortality and morbidity risk
Mortality risk is the risk that worsening mortality rates will result in an increase of death claims. Morbidity is the incidence of disease or illness and the associated risk is that of increased disability and medical claims. Insurance claims are triggered by the incurrence of a medical claim, the diagnosis of a critical illness or by death of the person insured. For contracts providing death benefits, higher mortality rates would result in an increase in death claims. The Group annually reviews its mortality experience and compares it to industry mortality tables. This review may result in future adjustments to the pricing or re-pricing of these contracts. Critical illness claims arise from the diagnosis of a specific illness incurred by the policy beneficiary. The Group annually reviews its critical illness claims experience and compares it to industry statistics. This review may result in future adjustments to the pricing or re-pricing of these contracts. The concentration risks of term life and critical illness contracts are included in the related disclosure on other long-term contracts in note 43.2(b).
Notes to the Financial Statements Sagicor Financial Corporation Year ended December 31, 2013 Amounts expressed in US$000
Sagicor Financial Corporation 102
43.1 Contracts without investment returns (continued) The cost of health related claims depends on the incidence of beneficiaries becoming ill, the duration of their illness, and the cost of providing medical services. An increase in any of these three factors will result in increased health insurance claims. In such circumstances, the insurer may adjust the pricing or re-pricing of these contracts. For health insurance contracts, the concentration of insurance risk is illustrated by the distribution of premium revenue by the location of the insured persons.
2013 Premium revenue by location of insureds Gross Ceded Net
Barbados 20,911 1,087 19,824
Jamaica 77,480 1,799 75,681
Trinidad & Tobago 21,629 745 20,884
Other Caribbean 25,853 1,343 24,510
USA 182 158 24
Total 146,055 5,132 140,923 (c) Sensitivity of incurred claims The sensitivity of term life and critical illness claims is included in the related disclosure on other long-term contracts in note 43.4. The impact on gross claims of increasing the total liability by 5% for un-reinsured health insurance claims is illustrated in the following table.
2013 2012
Liability 5% increase
in liability Liability
5% increase in liability
Actuarial liability 42,174 2,109 37,742 1,887
Claims payable 2,687 134 2,632 132
44,861 2,243 40,374 2,019
43.2 Contracts with investment returns Life and annuity insurance contracts with investment returns generally have durations of 5 or more years. The contract terms provide for the policyholder to pay either a single premium at contract inception, or periodic premiums over the duration of the contract. From the premium received, acquisition expenses and maintenance expenses are financed. Investment returns are credited to the policy and are available to fund surrender, withdrawal and maturity policy benefits. The principal risks associated with these policies are in respect of product design and pricing, mortality and longevity, lapse, expense and investment.
(a) Product design and pricing risk
Product design and pricing risk arises from poorly designed or inadequately priced contracts and can lead to both financial loss and reputational damage to the insurer. Risks are priced to achieve an adequate return on capital on the insurer’s business as a whole. In determining the pricing of a contract, the insurer considers the age of the policyholder and/or beneficiary, the expenses and taxes associated with the contract, the prospective investment returns to be credited to the contract, and the guaranteed values within the contract. Pricing inadequacy may arise either from the use of inadequate experience and statistical data in deriving pricing factors or from future changes in the economic environment.
(b) Mortality and longevity risk
Mortality risk is the risk that worsening mortality rates will result in an increase of death claims. Longevity risk is the risk that improving mortality rates will lengthen the payout period of annuities. For contracts providing death benefits, higher mortality rates will result in an increase in death claims over time. For contracts providing the payout of annuities, improving mortality rates will lead to increased annuity benefits over time. Insurers annually review their mortality experience and compare it to industry mortality tables. This review may result in future adjustments to the pricing or re-pricing of these contracts.
Notes to the Financial Statements Sagicor Financial Corporation Year ended December 31, 2013 Amounts expressed in US$000
103 Sagicor Financial Corporation
43.2 Contracts with investment returns (continued) Mortality risk may be concentrated in geographic locations, affecting the risk profile of the insurer. The most significant exposure for this type of risk arises where a single event or pandemic could result in a large number of claims. Total insurance coverage on insurance policies provides a quantitative measure of absolute mortality risk. However, claims arising in any one year are a very small proportion in relation to the total insurance coverage provided. The total amounts insured by the Group at December 31, gross and net of reinsurance, are summarised by geographic area below.
Other Caribbean Gross 7,146,664 2,532,093 6,542,572 2,990,004
Net 5,833,715 1,872,424 5,191,479 1,945,312
USA Gross 3,954,741 57,145 3,942,610 64,262
Net 1,731,024 53,909 1,709,847 59,076
Total Gross 23,818,962 10,168,735 23,071,220 10,027,876
Net 19,129,474 9,304,611 18,279,378 8,718,407
43.2 Contracts with investment returns (continued)
(c) Lapse risk Lapse risk is that, on average, policyholders will terminate their policies ahead of the insurer’s expectation. Early lapse may result in the following:
Acquisition costs are not recovered from the policyholder; In order to settle benefits, investments are liquidated prematurely resulting in a loss to the
insurer; Maintenance expenses are allocated to the remaining policies, resulting in an increase in
expense risk.
(d) Expense risk The Group monitors policy acquisition and policy maintenance expenses. Expenses are managed through policy design, fees charged and expense control. However, there are a significant number of inforce contracts for which insurers have limited or no ability to re-price for increases in expenses caused by inflation or other factors. Therefore growth in maintenance expenses has to be funded either by increasing the volume of inforce policies or by productivity gains. Failure to achieve these goals will require increases in actuarial liabilities held.
(e) Investment risk A substantial proportion of the Group’s financial investments support insurer obligations under life and annuity contracts with investment returns. The financial risks outlined in note 41 pertaining to credit, liquidity, interest rate, foreign exchange and equity price are considered integral investment risks associated with these insurance contracts. Asset defaults, mismatches in asset and liability cash flows, interest rate and equity price volatility generally have the effect of increasing investment risk and consequential increases in actuarial liabilities held.
Notes to the Financial Statements Sagicor Financial Corporation Year ended December 31, 2013 Amounts expressed in US$000
Sagicor Financial Corporation 104
43.3 Reinsurance risk To limit its exposure of potential loss on an insurance policy, the insurer may cede certain levels of risk to a reinsurer. The Group selects reinsurers which have well established capability to meet their contractual obligations and for new business a Sagicor credit risk rating of 1 or 2 is usually selected. Reinsurance ceded does not discharge the insurer’s liability and failure by a reinsurer to honour its commitments could result in losses to the Group. Insurers have limited their exposure per person by excess of loss or quota share treaties. Retention limits represent the level of risk retained by the insurer. Coverage in excess of these limits is ceded to reinsurers up to the treaty limit. The principal features of retention programs used by insurers are summarised in the following table.
Type of insurance contract Retention by insurers - currency amounts in thousands
Health insurance contracts with individuals Retention per individual to a maximum of $75
Health insurance contracts with groups Retention per individual to a maximum of $75
Life insurance contracts with individuals Retention per individual life to a maximum of $500
Life insurance contracts with groups Retention per individual life to a maximum of $330
43.4 Sensitivity arising from the valuation of actuarial liabilities The estimation of actuarial liabilities is sensitive to a number of assumptions. Changes in those assumptions could have a significant effect on the valuation results which are discussed below. The valuation of actuarial liabilities of life insurance and annuity contracts is sensitive to:
the economic scenario used, the investments allocated to back the liabilities, the underlying assumptions used (note 13.3 (b) to (f)), and the margins for adverse deviations (note 13.3 (g)).
43.4 Sensitivity arising from the valuation of actuarial liabilities (continued) Under Canadian accepted actuarial standards, the AA is required to test the actuarial liability under economic scenarios. The scenarios developed and tested by insurers were as follows.
Sensitivity Scenario
Sagicor Life Inc
segment Sagicor Jamaica
Segment Sagicor USA segment
Worsening rate of lapse
Lapse rates were either doubled or halved, and the more adverse result was selected.
Lapse rates were doubled.
High interest rate
Assumed increases in the investment portfolio yield rates of 0.25% per year for 5 years, with the rates remaining constant
thereafter.
Assumed increases in the investment portfolio yield rates of 0.5% for 10 years.
A 1% increase was applied to the investment portfolio rate.
Low interest rate
Assumed decreases in investment portfolio yield rates of 0.25% per year for 5 years, with the rates remaining constant
thereafter.
Assumed decreases in investment portfolio yield rates of 0.5% per year for 10 years.
A 1% decrease was applied to the investment portfolio rate.
Worsening mortality and morbidity
Mortality and morbidity rates for insurance and critical illness products were increased by 3% of the base rate per year for 5 years. For annuity products, the mortality rates were decreased by 3% of the base rate for 5 years.
For life insurance products only, the base assumed rates were increased annually by 3% cumulatively over the next 5 years.
Higher expenses
Policy unit maintenance expense rates were increased by 5% per year for 5 years above those reflected in the base scenario.
Notes to the Financial Statements Sagicor Financial Corporation Year ended December 31, 2013 Amounts expressed in US$000
105 Sagicor Financial Corporation
43.4 Sensitivity arising from the valuation of actuarial liabilities (continued) The following table represents the estimated sensitivity of each of the above scenarios to net actuarial liabilities for insurers by segment. Correlations that may exist between scenario assumptions were not explicitly taken into account.
Sagicor Life segment Sagicor Jamaica segment
Sagicor Life USA segment
2013 2012 2013 2012 2013 2012
Base net actuarial liability 864,680 823,715 458,188 424,308 709,225 723,137
Scenario
increase in liability increase in liability increase in liability Worsening rate of lapse
108,682 79,214 42,921 45,106 24,967 19,077
High interest rate (146,739) (124,698) (90,059) (81,408) (42,476) (41,925)
43.5 Dynamic capital adequacy testing (DCAT) DCAT is a technique used by the Group to assess the adequacy of the insurer’s financial position and financial condition in the light of different future economic and policy experience scenarios. DCAT assesses the impact over the next 5 years on the insurer’s financial position and financial condition under specific scenarios. The financial position of an insurer is reflected by the amounts of assets, liabilities and equity in the financial statements at a given date. The financial position therefore relies on the valuation assumptions used for establishing the actuarial liabilities being adequate to measure future adverse deviations in experience. The financial position does not offer any indication of an insurer’s ability to execute its business plan. The financial condition of an insurer at a particular date is its prospective ability at that date to meet its future obligations, especially obligations to policyholders, those to whom it owes benefits and to its shareholders. The financial condition analysis examines both an insurer’s ability to execute its business plan and to absorb adverse experience beyond that provided for when its actuarial liabilities are established. The purpose of the DCAT is
to develop an understanding of the sensitivity of the total equity of the insurer and future financial condition to changes in various experience factors and management policies;
to alert management to material, plausible and imminent threats to the insurer’s solvency; and to describe possible courses of action to address these threats.
Full DCAT is conducted periodically by some insurers within the Group.
Notes to the Financial Statements Sagicor Financial Corporation Year ended December 31, 2013 Amounts expressed in US$000
Sagicor Financial Corporation 106
46 CAPITAL MANAGEMENT The Group's objectives when managing capital, which is a broader concept than equity in the statement of financial position, are:
To comply with capital requirements established by insurance, banking and other financial intermediary regulatory authorities;
To comply with internationally recognised capital requirements for insurance, where local regulations do not meet these international standards;
To safeguard its ability as a going concern to continue to provide benefits and returns to policyholders, depositors, note-holders and shareholders;
To provide adequate returns to shareholders; To maintain a strong capital base to support the future development of Group operations.
46.1 Capital resources The principal capital resources of the Group are as follows:
2013 2012
Shareholders’ equity 512,097 587,034 Minority interest 218,751 226,433 Notes and loans payable 290,160 241,556 Total financial statement capital resources 1,022,008 1,055,023
Letter of credit facilities, net of collateral assets - 35,318
Total off financial statement resources - 35,318 Total capital resources 1,022,008 1,090,341
The Group deploys its capital resources through its operating activities. These operating activities are carried out by subsidiary companies which are either insurance entities or provide other financial services. The capital is deployed in such a manner as to ensure that subsidiaries have adequate and sufficient capital resources to carry out their activities and to meet regulatory requirements.
44 FIDUCIARY RISK The Group provides investment management and pension administration services to investment and pension funds which involve the Group making allocation, purchase and sale decisions in relation to a wide range of investments. These services give rise to fiduciary risk that may expose the Group to claims for mal-administration or under-performance of these funds. In the ordinary course of business, the Group manages assets of pension funds, mutual funds and unit trusts which are held in a fiduciary capacity and are not included in the Group’s financial statements. The investments and cash under administration are summarised in the following table.
2013 2012
Pension and insurance fund assets 1,282,487 1,318,748
Mutual fund, unit trust and other investment fund assets 431,816 439,731
1,714,303 1,758,479 Fee income under administration is discussed in Note 26.
45 STATUTORY RESTRICTIONS ON ASSETS Insurers are registered to conduct insurance business under legislation in place in each relevant jurisdiction. This legislation may prescribe a number of requirements with respect to deposits, investment of funds and solvency for the protection of policyholders. In general, these requirements do not restrict the ability of the insurer to trade investments. Banking subsidiaries may also be required to hold deposits with Central Banks which regulate the conduct of banking operations. To satisfy the above requirements, invested assets and cash totalling $1,202,220 (2012 - $1,371,876) have been deposited with regulators or are held in trust to the order of regulators. In some countries where the Group operates, there are exchange controls or other restrictions on the remittance of funds out of those countries.
Notes to the Financial Statements Sagicor Financial Corporation Year ended December 31, 2013 Amounts expressed in US$000
107 Sagicor Financial Corporation
46.2 Capital adequacy
The capital adequacy of the principal operating subsidiaries is discussed in this section.
(a) Life insurers Capital adequacy is managed at the operating company level. It is calculated by the Appointed Actuary and reviewed by executive management, the audit committee and the board of directors. In addition, the Group seeks to maintain internal capital adequacy at levels higher than the regulatory or internationally recognised requirements.
To assist in evaluating the current business and strategy opportunities, a risk-based capital approach is a core measure of financial performance. The risk-based assessment measure which has been adopted is the Canadian Minimum Continuing Capital and Surplus Requirement (MCCSR) standard. The minimum standard recommended by the Canadian regulators for companies is an MCCSR of 150%. A number of jurisdictions in the Caribbean region have no internationally recognised capital adequacy requirements, and in accordance with its objectives for managing capital, the Group has adopted the Canadian MCCSR standard. Jamaica and the USA have recognised capital adequacy standards. The consolidated MCCSR for the Sagicor Group as of December 31 has been estimated as 259% (2012 – 250%). This is the principal standard of capital adequacy used to assess the overall strength of the Sagicor Group. However, because of the variations in capital adequacy standards across jurisdictions, the consolidated result should be regarded as applicable to the Group as a whole and not necessarily applicable to each individual segment, insurance subsidiary or insurance subsidiary branch.
46.2 Capital adequacy (continued) (i) Sagicor Life Jamaica Sagicor Life Jamaica is governed by the Jamaican MCCSR regime which requires an insurer to maintain a minimum ratio of 150%. For the years ended December 31, 2013 and 2012, this ratio was 180% and 163% respectively. (ii) Sagicor Life Insurance Company (USA) A risk-based capital (RBC) formula and model were adopted by the National Association of Insurance Commissioners (NAIC) of the United States. RBC is designed to assess minimum capital requirements and raise the level of protection that statutory surplus provides for policyholder obligations. The RBC formula for life insurance companies measures four major areas of risk: (i) underwriting, which encompasses the risk of adverse loss developments and property and casualty insurance product mix; (ii) declines in asset values arising from credit risk; (iii) declines in asset values arising from investment risks, including concentrations; and (iv) off-balance sheet risk arising from adverse experience from non-controlled assets such as reinsurance guarantees for affiliates or other contingent liabilities and reserve and premium growth. If an insurer's statutory surplus is lower than required by the RBC calculation, it will be subject to varying degrees of regulatory action, depending on the level of capital inadequacy.
The RBC methodology provides for four levels of regulatory action. The extent of regulatory intervention and action increases as the ratio of surplus to RBC falls. The least severe regulatory action is the "Company Action Level" (as defined by the NAIC) which requires an insurer to submit a plan of corrective actions to the regulator if surplus falls below 200% of the RBC amount. Sagicor Life Insurance Company looks to maintain at least 300% of the Company Action Level, and has maintained these ratios as of December 31, 2013 and 2012 respectively.
Notes to the Financial Statements Sagicor Financial Corporation Year ended December 31, 2013 Amounts expressed in US$000
Sagicor Financial Corporation 108
46.2 Capital adequacy (continued) (b) Sagicor Investments Jamaica Limited and Sagicor Bank Jamaica Limited Capital adequacy and the use of regulatory capital are monitored monthly by management employing techniques based on the guidelines developed by the Financial Services Commission (FSC), the Bank of Jamaica (BOJ), Basel II and the Risk Management and Compliance Unit. The required information is filed with the respective Regulatory Authorities at stipulated intervals. The BOJ and the FSC require each regulated entity to hold the minimum level of regulatory capital, and to maintain a minimum ratio of total regulatory capital to the risk-weighted assets. The risk-weighted assets are measured by means of a hierarchy of five risk weights classified according to the nature of each asset and counterparty, taking into account any eligible collateral or guarantees. A similar treatment is adopted for off financial statements exposure, with some adjustments to reflect the more contingent nature of the potential losses.
The table below summarises the capital adequacy ratios. During 2013 and 2012, all applicable externally imposed capital requirements were complied with.
Sagicor Investments
Jamaica
Sagicor Bank Jamaica
2013 2012 2013 2012
Actual capital base to risk weighted assets 15% 17% 17% 21%
Required capital base to risk weighted assets 10% 10% 10% 10%
46.3 Financial covenants (a) 7.5% senior notes due 2016 and 4.6% notes due 2015 Under an indenture and a trust deed entered into by the Group on the issue of the senior notes and notes respectively (see note 16), the Group has to comply with permitted lien covenants, which will not allow the Company nor any of its subsidiaries to directly or indirectly, incur or permit to exist any lien to secure any indebtedness or any guarantee of indebtedness, other than permitted liens, without effectively providing that the senior notes and notes are secured equitably and rateably with (or, if the obligation to be secured by the lien is subordinated in right of payment to the senior notes and notes, prior to) the obligations so secured for so long as such obligations are so secured. Permitted liens are liens existing on the dates of issue of the senior notes and notes respectively, certain liens which would arise in the course of normal business, and other liens whose outstanding principal amounts in aggregate outstanding principal amount do not exceed 10% of the consolidated net tangible assets (as is defined in the indenture and trust deed). As of December 31, 2013 and 2012, the Group satisfied these requirements.
Notes to the Financial Statements Sagicor Financial Corporation Year ended December 31, 2013 Amounts expressed in US$000
109 Sagicor Financial Corporation
46.3 Financial covenants (continued)
(b) International Finance Corporation (IFC) On March 31, 2011, the Company entered into subscription and policy agreements with IFC, regarding the latter’s participation in the issue of new common and convertible redeemable preference shares. Pursuant to the aforementioned agreements, on July 18, 2011, 12,269,938 common shares and 78,339,530 convertible redeemable preference shares were issued to IFC. The financial covenants included in these agreements are summarised as follows. (i) Price protection rights
IFC has been granted price protection rights to in relation to the common shares held. If within a 2 year period of the subscription date, the Company issues or sells any shares, except as pursuant to any employee stock incentive plan, at a price less than Barbados $3.26 per share, the Company shall compensate IFC by the issue to IFC of additionally fully-paid true-up shares to place IFC in the position as if it had subscribed at the lower price.
(ii) Put option IFC has been granted the right to require the Company to purchase IFC’s holding of convertible redeemable preference shares in the event that the Company is in breach of any of the policy reporting or IFC policy covenants. The Company may nominate a third party to purchase the shares. The purchase must take place within 10 and 60 days of the date of notice. If the Company either fails to purchase or does not arrange a third party purchase, IFC may sell the shares to a third party and the Company is required to pay a late payment charge of 6.5% per annum.
47 RELATED PARTY TRANSACTIONS
Other than as disclosed in notes 5 12, 26, 30 and 44, there are no material related party transactions except as disclosed below.
Key management transactions and balances
Key management comprises directors and senior management of the Company and of Group subsidiaries. Key management includes those persons at or above the level of Vice President or its equivalent. Compensation of and loans to these individuals are summarised in the following tables:
Compensation 2013 2012
Salaries, directors’ fees and other short-term benefits 21,027 19,044
Equity-settled compensation benefits 4,359 4,247
Pension and other retirement benefits 737 2,688
26,123 25,979
Mortgage
loans Other loans Total loans
Balance, beginning of year 4,974 420 5,394
Advances 1,345 10,770 12,115
Repayments (877) (10,763) (11,640)
Effects of exchange rate changes (1) (32) (33)
Balance, end of year 5,441 395 5,836
Interest rates prevailing during the year 5% - 8.25% 5% - 17.7%
Notes to the Financial Statements Sagicor Financial Corporation Year ended December 31, 2013 Amounts expressed in US$000
Sagicor Financial Corporation 110
48 Change in accounting policy (continued)
Year ended December 31, 2012 As
previously stated
Effect of restatements
As restated
Statement of income
Defined benefit expense (note 31) (10,589) 1,542. (9,047)
Net investment income (note 25) 295,148. (122) 295,026.
Administrative expenses (181,542) (160) (181,702)
Impact to net income from continuing operations 74,060. 1,260. 75,320..
Impact to net income attributable to common shareholders from continuing operations
52,408 693. 53,101.
Basic earnings per common share from continuing operations in cents
16.8¢ 0.3¢ 17.1¢.
Fully diluted earnings per common share from continuing operations in cents
16.8¢ (0.6)¢ 16.2¢.
Statement comprehensive income
Defined benefit losses(note 35) - (7,967) (7,967)
Other comprehensive income from continuing operations
(15,679) (8,248) (23,927)
Total comprehensive income attributable to common shareholders from continuing operations
45,676 (5,774) 39,902.
48 CHANGE IN ACCOUNTING POLICIES The restatements of the prior period financial statements arising from the change in accounting policy summarised in note 2(a) are set out in the following tables.
Statement of financial position As
previously stated
Effect of restatements
As restated
December 31, 2012
Net defined benefit assets (note 12) 2,615 (2,039) 576
Associates and joint ventures (note 6) 36,559 5,874. 42,433
Miscellaneous assets and receivables (note 12) 102,714 (4,133) 98,581
Impact to total assets 5,549,355 (298) 5,549,057
Net defined benefit liabilities (note 18) 43,168 15,208. 58,376
Impact to total liabilities 4,730,715 15,208. 4,745,923
Impact to total equity 818,640 (15,506) 803,134
January 1, 2012
Net defined benefit assets (note 12) 3,356 (164) 3,192
Impact to total assets 5,364,073 (164) 5,363,909
Net defined benefit liabilities (note 18) 37,429 8,354 45,783
Impact to total liabilities 4,566,540 8,354 4,574,894
Impact to total equity 797,533 (8,518) 789,015
Notes to the Financial Statements Sagicor Financial Corporation Year ended December 31, 2013 Amounts expressed in US$000
111 Sagicor Financial Corporation
48 Change in accounting policy (continued)
Statement of changes in equity
Retained Earnings
Total Shareholders’
Equity
Minority Interests
Total
Equity
Year ended December 31, 2012
Balance, beginning of year as previously reported 290,222 607,135 188,197 797,533
Effect of change in accounting policy (8,797) (8,797) 279 (8,518)
Balance, beginning of year as restated 281,425 598,338 188,476 789,015
Net income from continuing operations, as previously reported 52,408 52,408 34,177 74,060
Effect of change in accounting policy 693 693 567 1,260
Net income from continuing operations, as restated 53,101 53,101 34,744 75,320
Total comprehensive income from continuing operations, as previously reported (19) (6,732) (9,186) (15,679)
Effect of change in accounting policy (6,467) (6,467) (1,781) (8,248)
Total comprehensive income from continuing operations, as restated (6,486) (13,199) (10,967) (23,927)
Balance, end of year, as previously reported 289,136 601,605 227,368 818,640
Effect of change in accounting policy (14,571) (14,571) (935) (15,506)
Balance, end of year, as restated 274,565 587,034 226,433 803,134 As there has been no change in share capital, reserves, participating accounts, results of discontinued operations and transactions with holders of equity instruments, these items have been excluded from the foregoing tables.
Notes to the Financial Statements Sagicor Financial Corporation Year ended December 31, 2013 Amounts expressed in US$000
Sagicor Financial Corporation 112
49 EVENTS AFTER DECEMBER 31, 2013
Acquisition of RBC Jamaica On January 29, 2014, Sagicor Group Jamaica Limited signed an agreement to acquire all of the issued shares of RBC Royal Bank (Jamaica) Limited and RBTT Securities Jamaica Limited (collectively “RBC Jamaica”) from Royal Bank of Canada. The acquisition is subject to regulatory approvals. As of December 2013, RBC Jamaica had total assets of approximately $509,000.


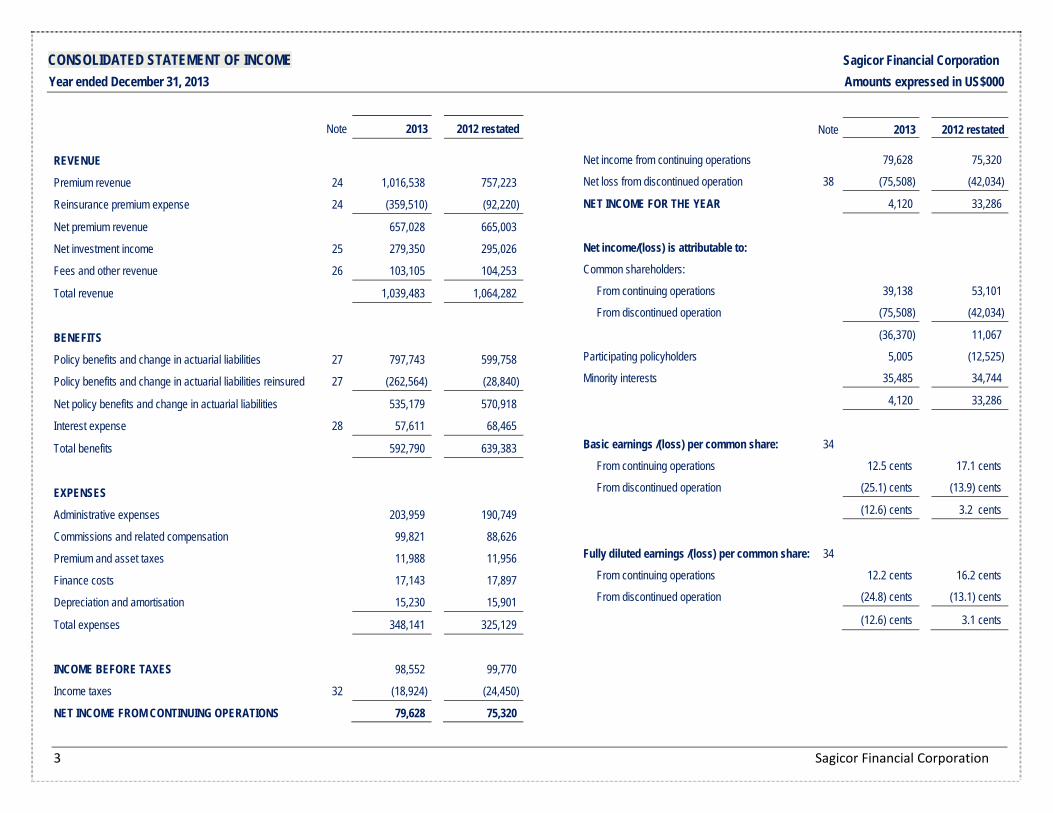

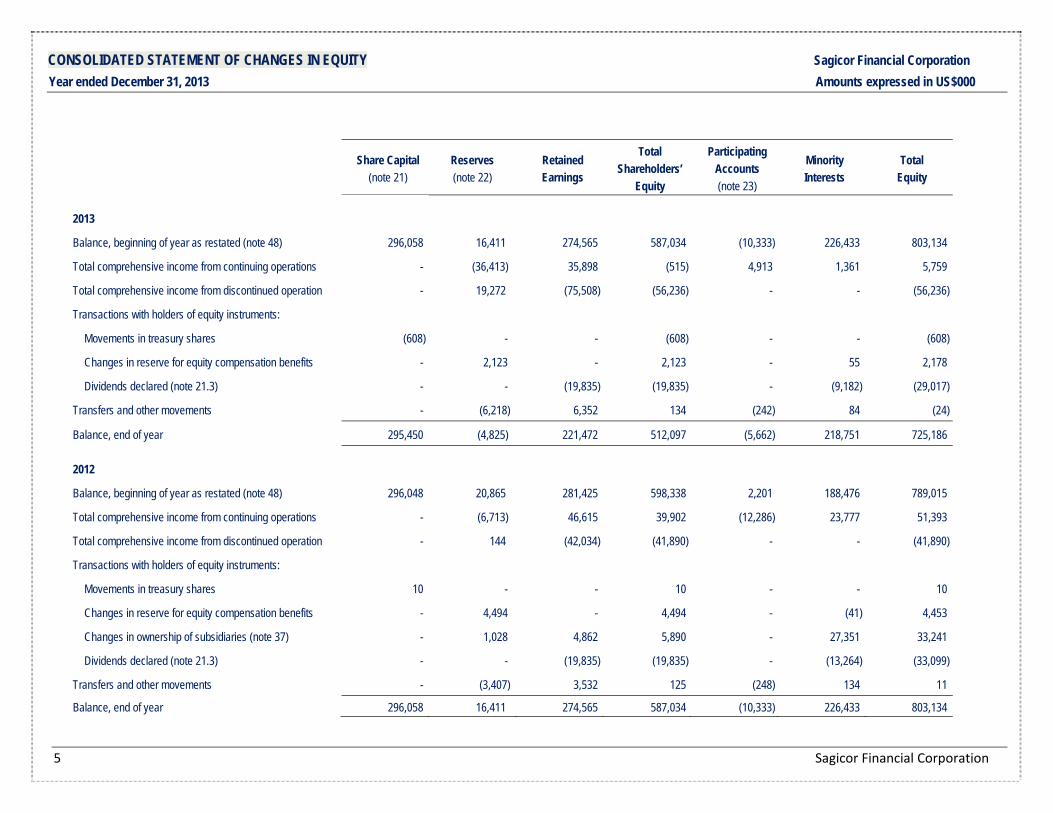


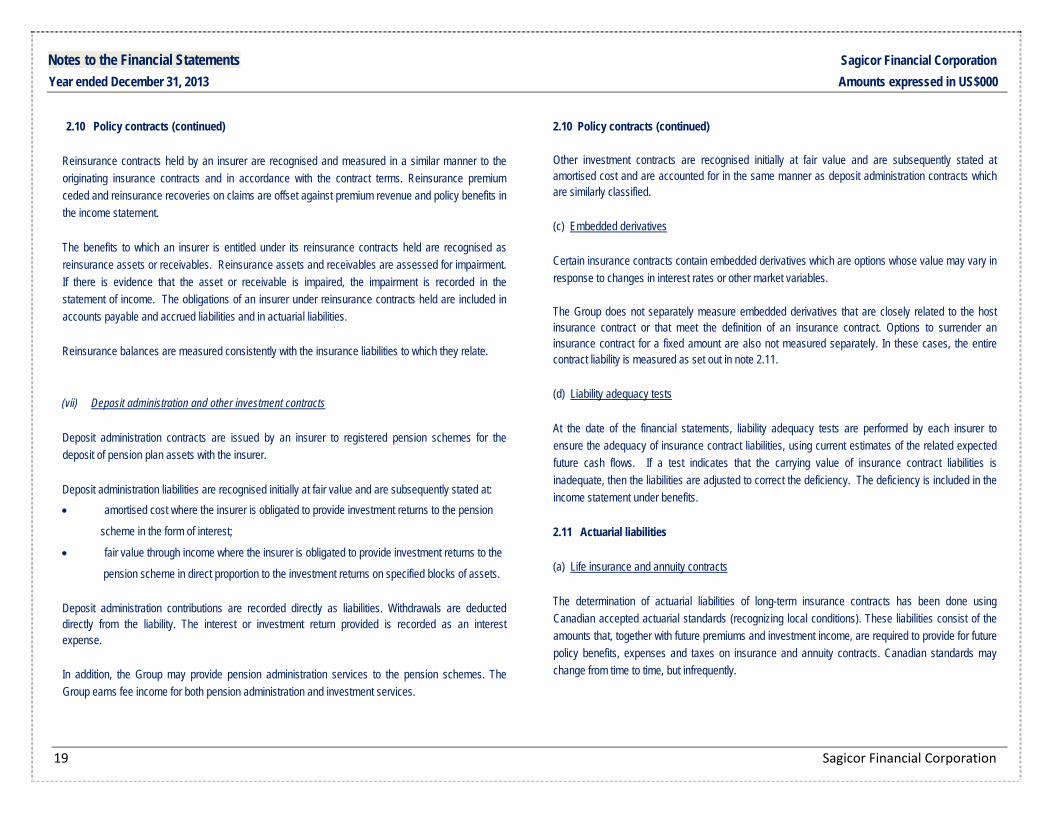


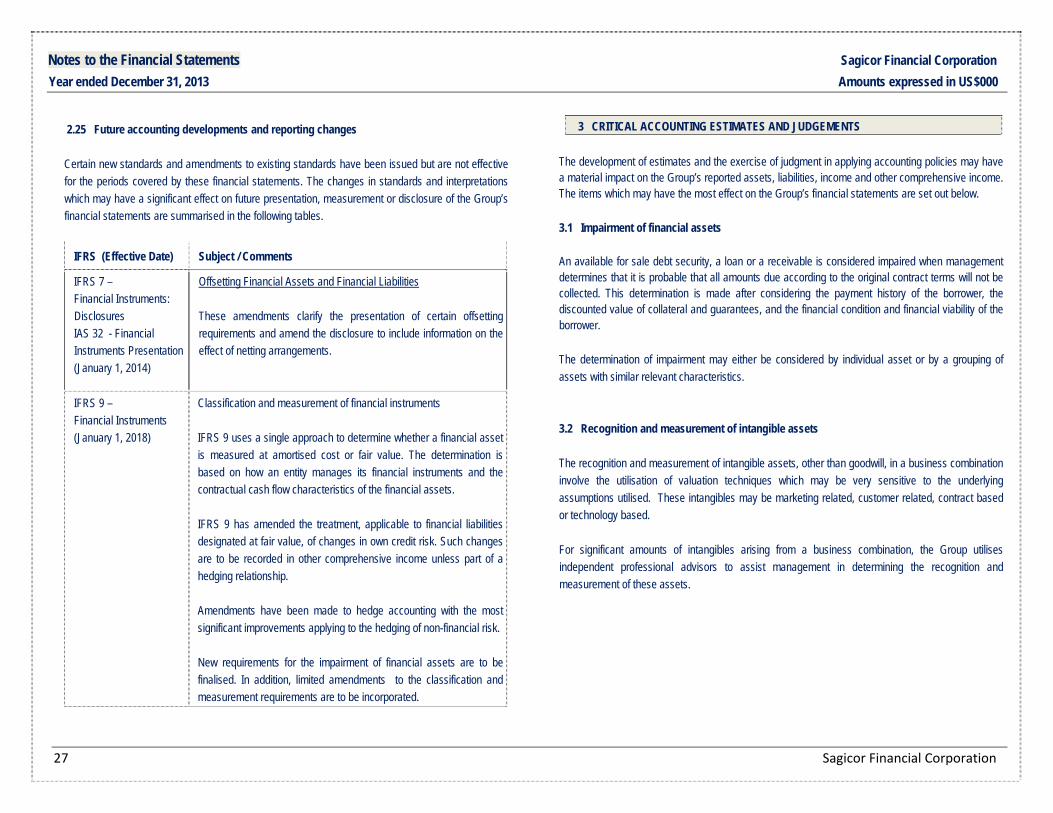


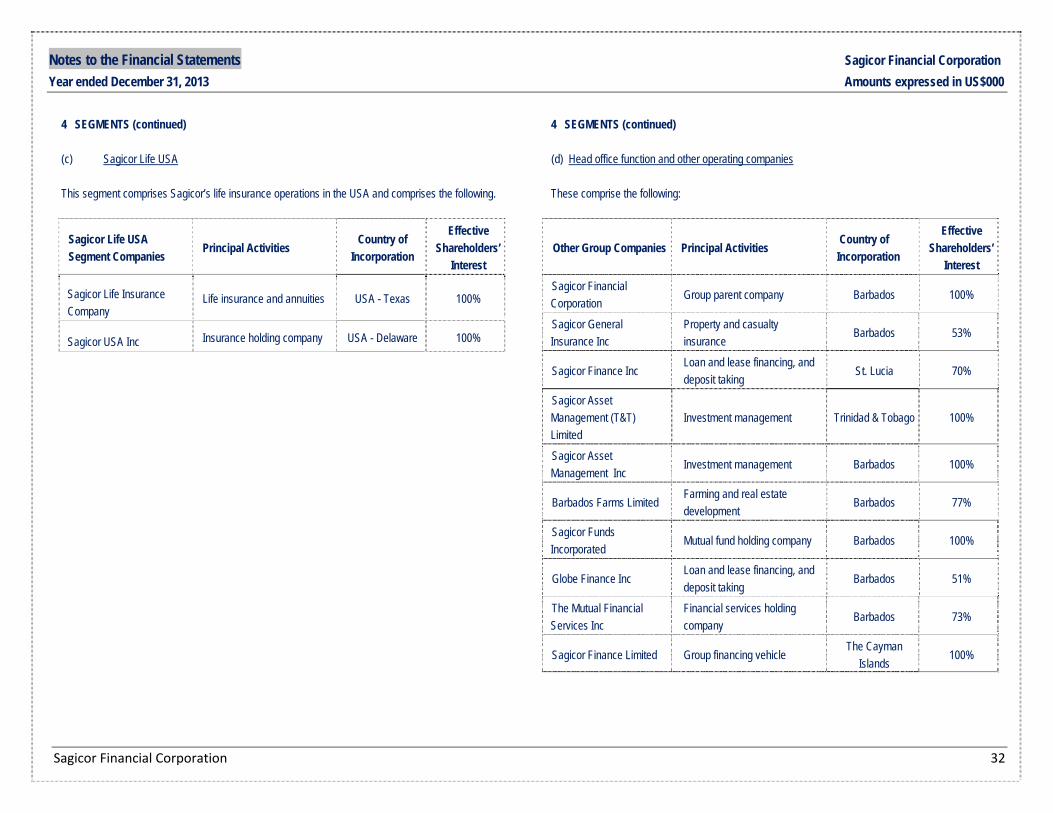
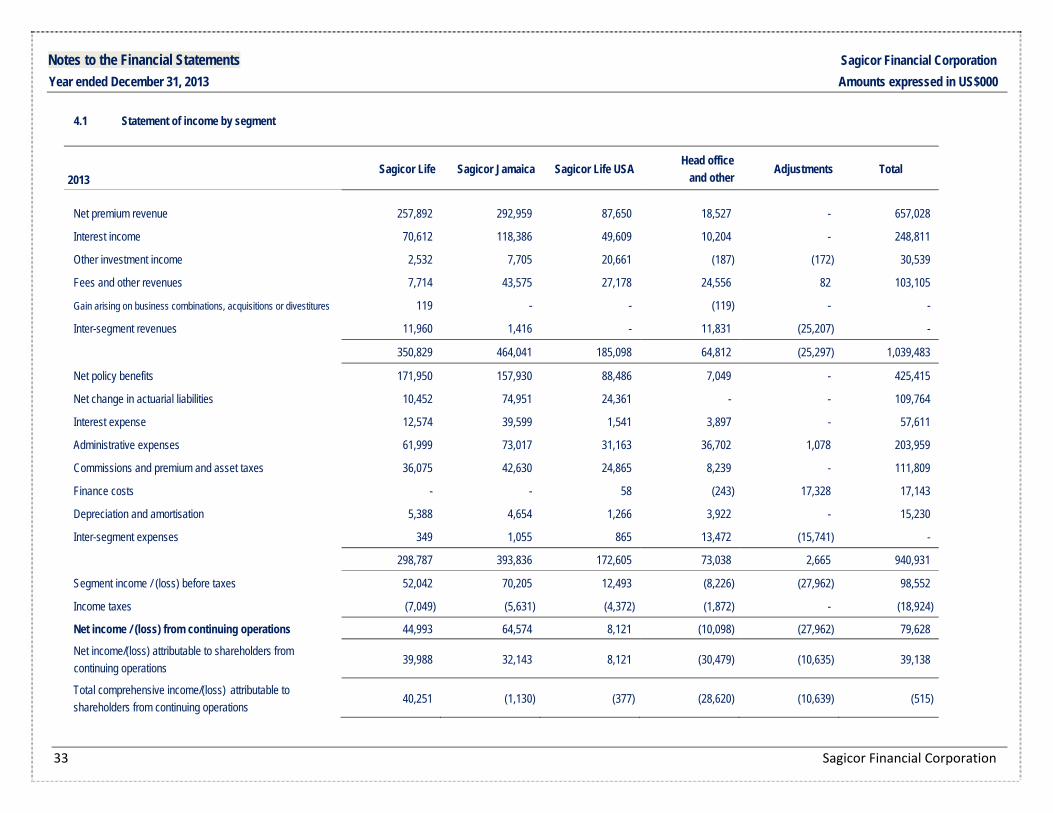


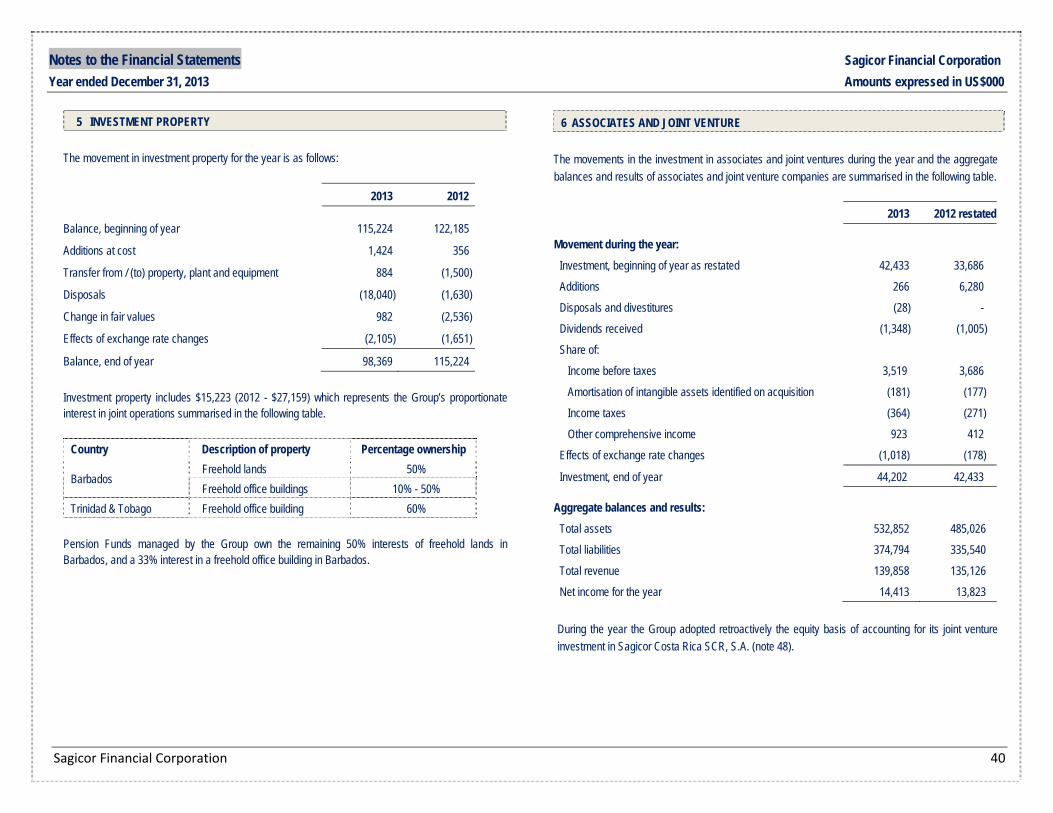


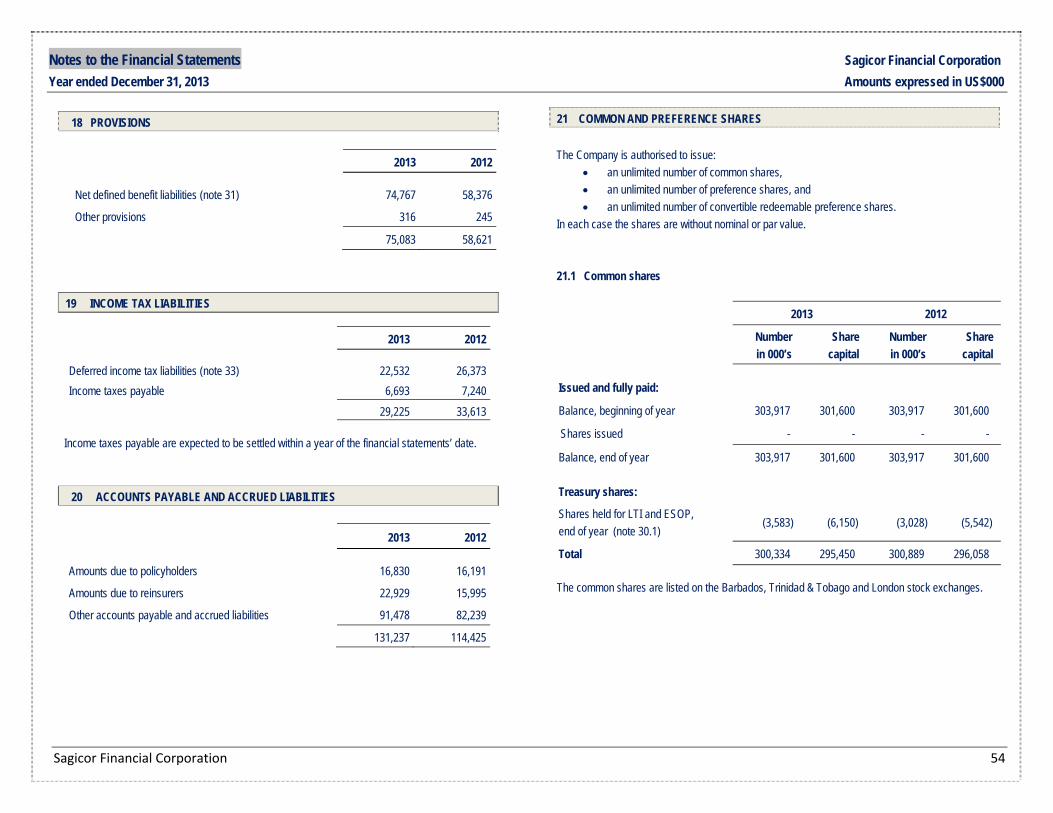


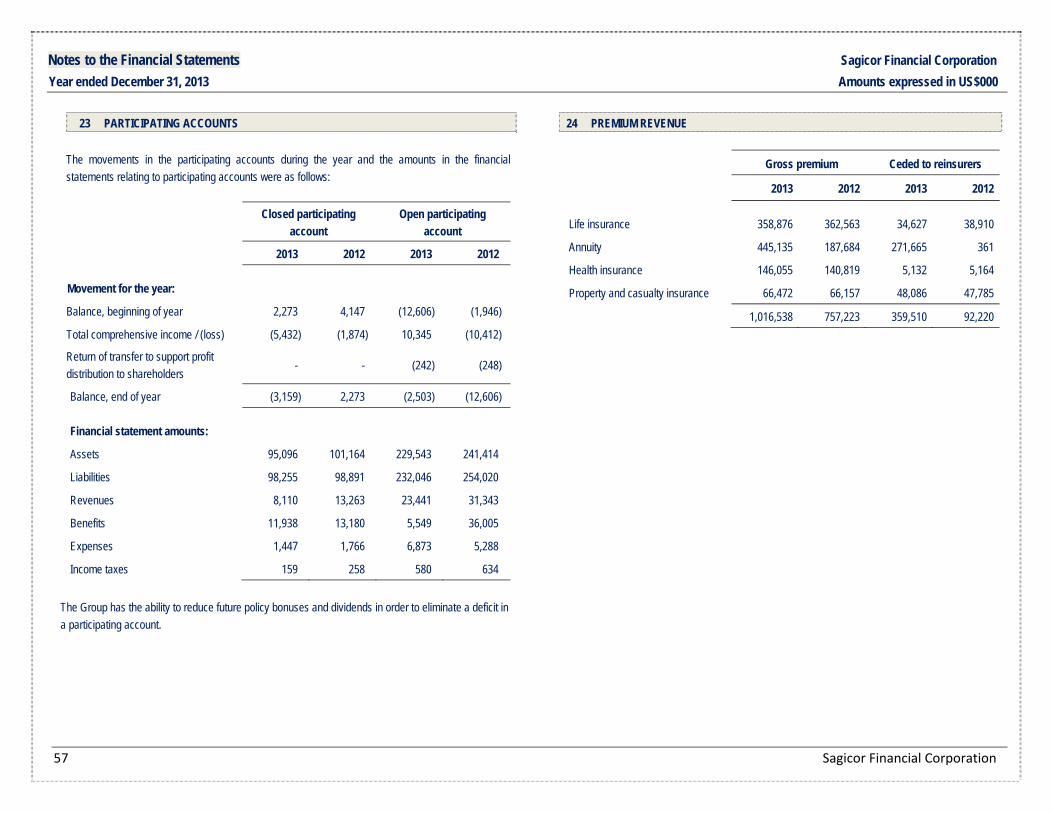
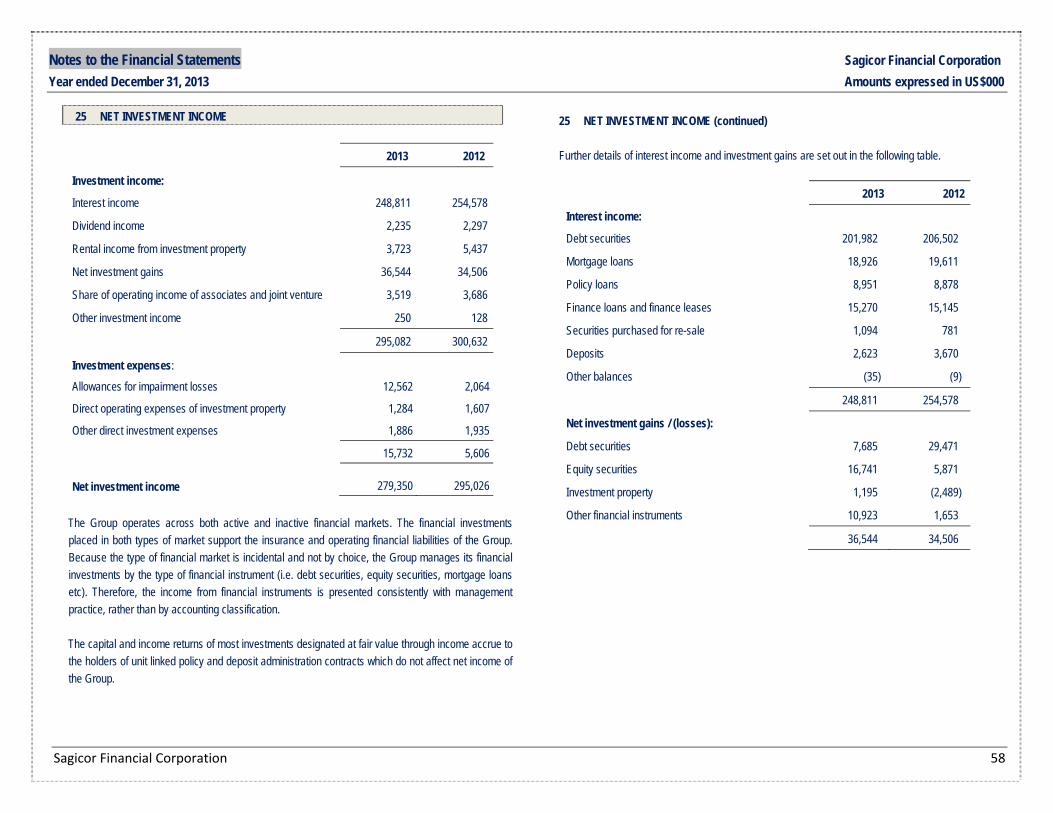


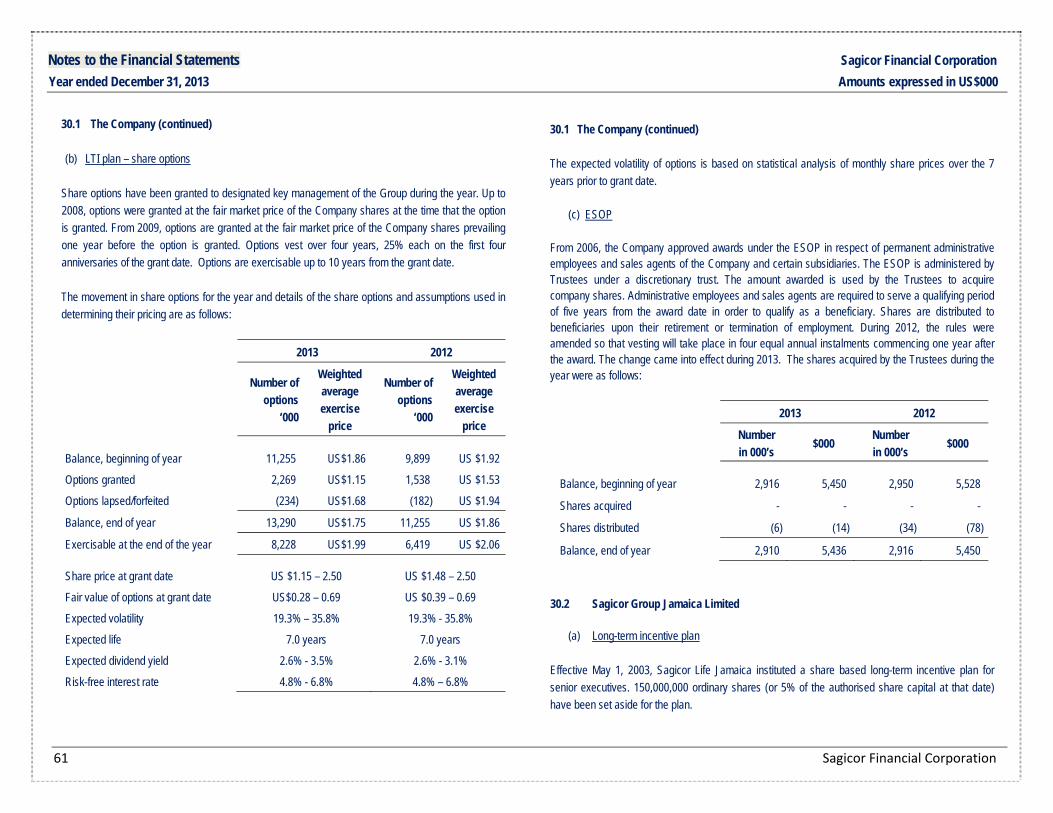
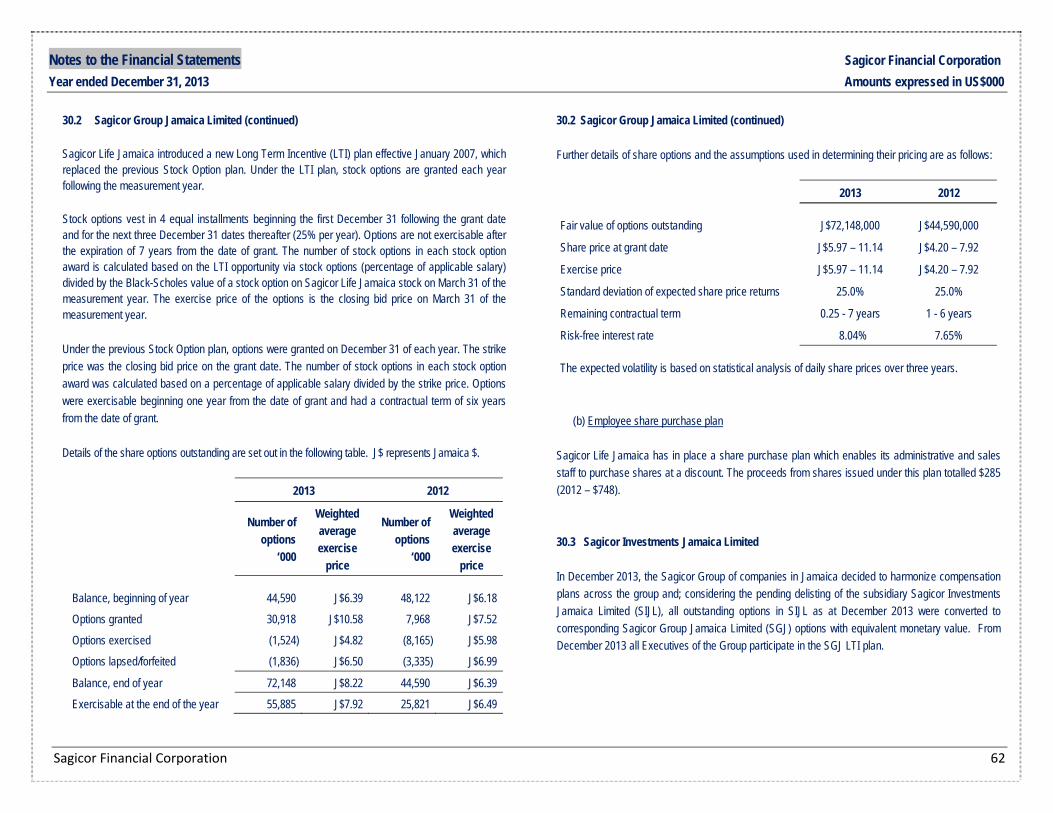

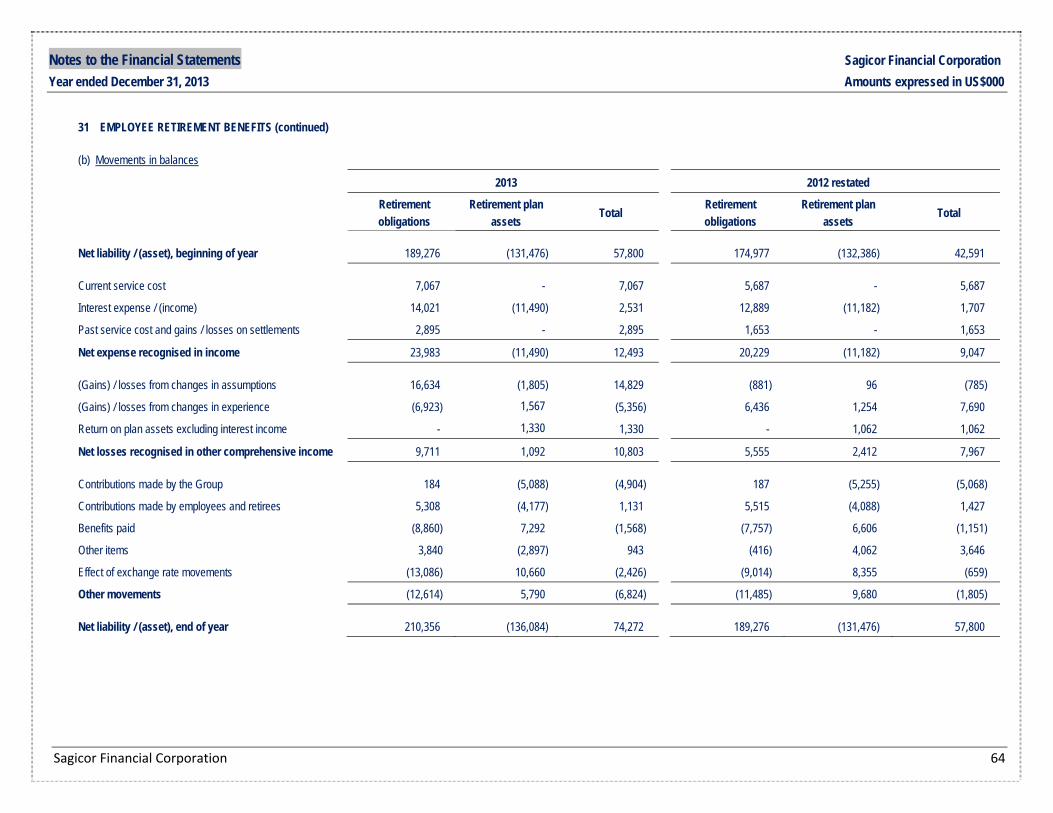
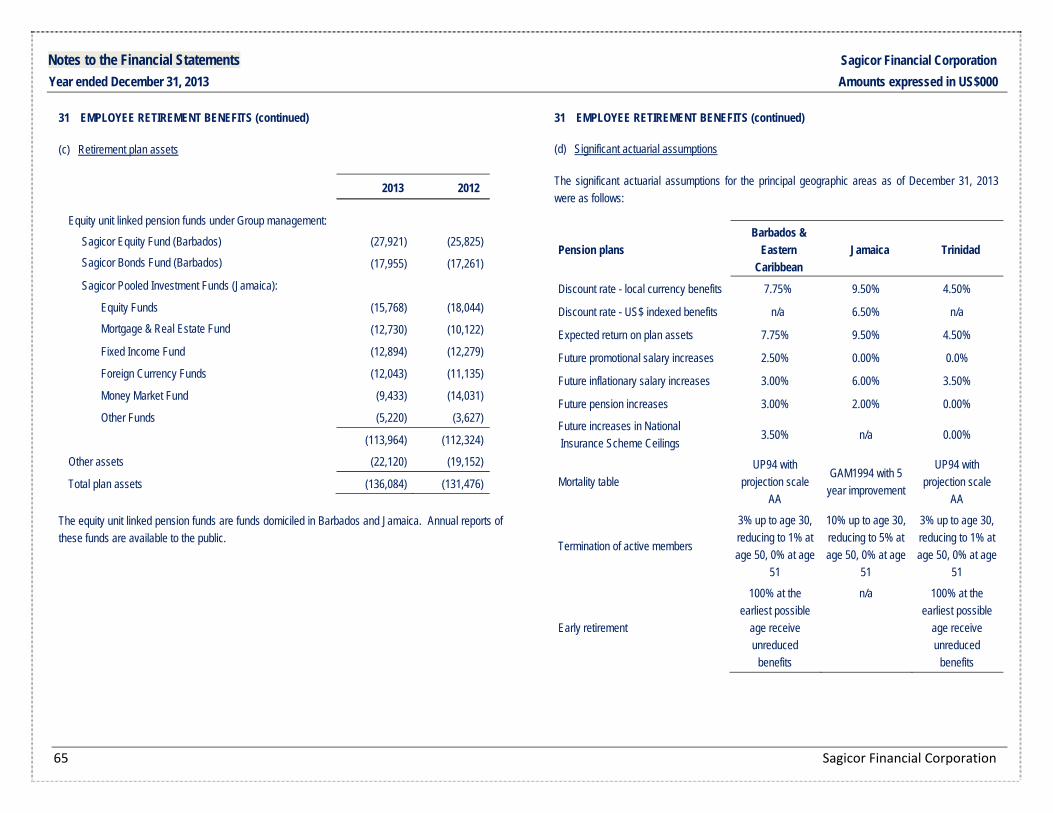

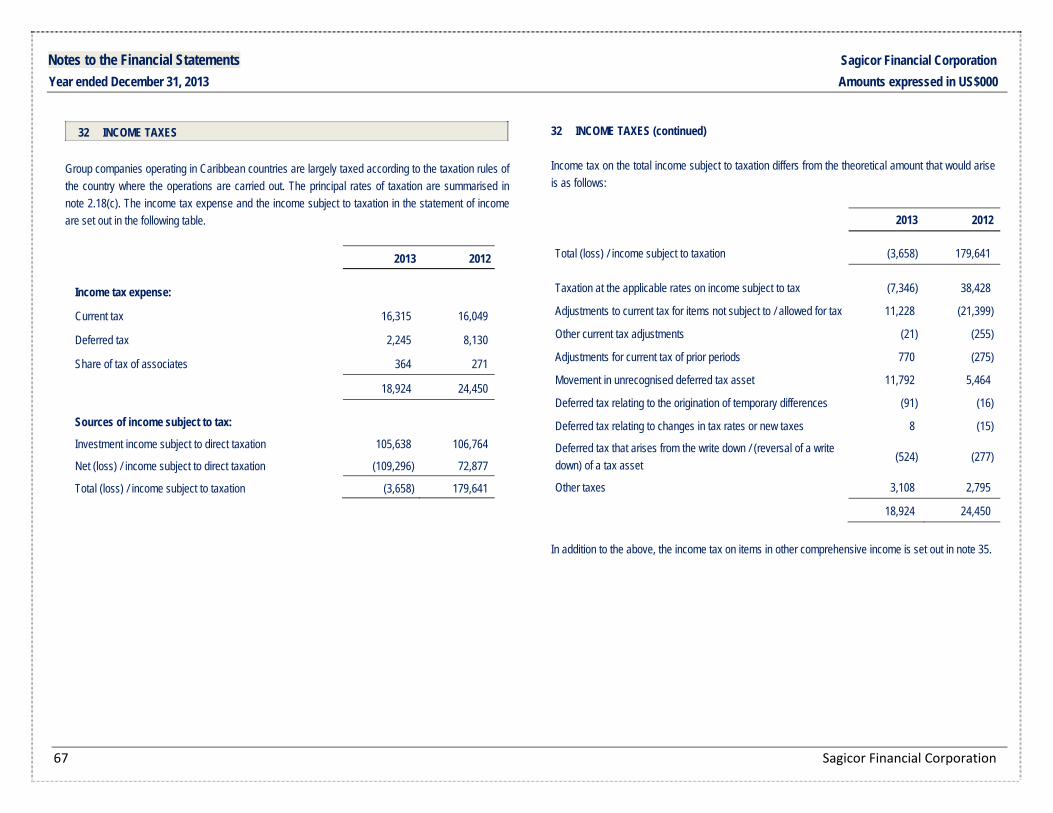

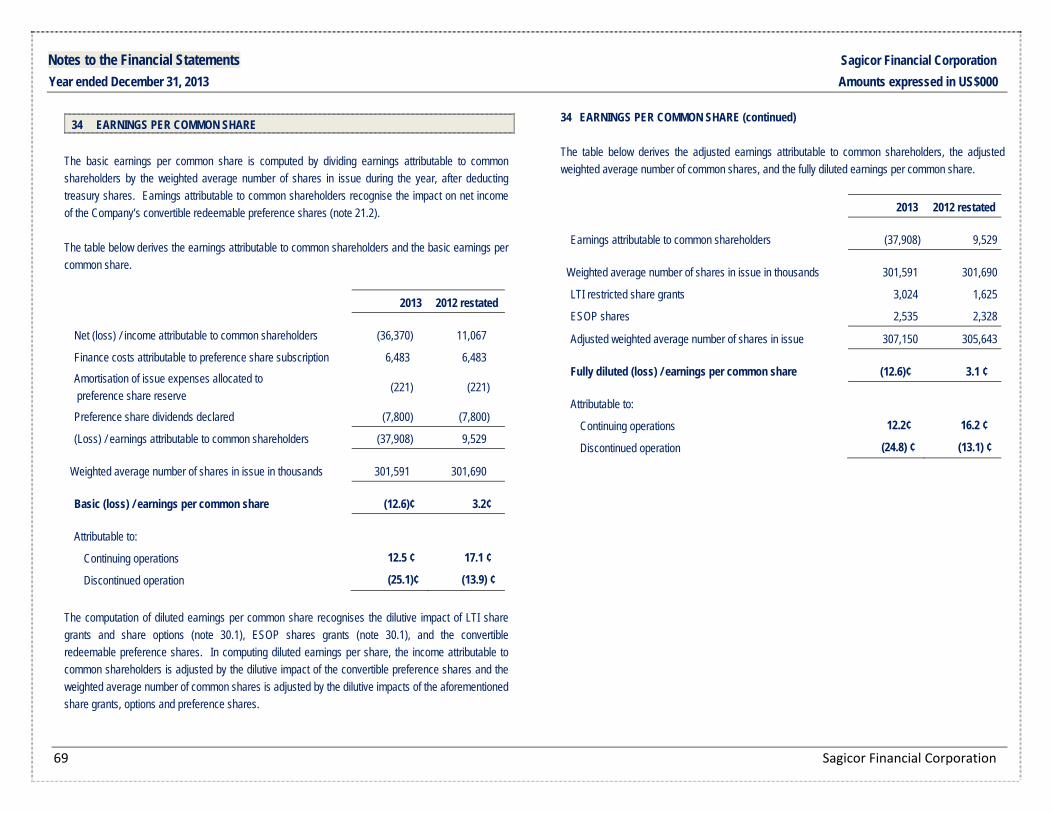


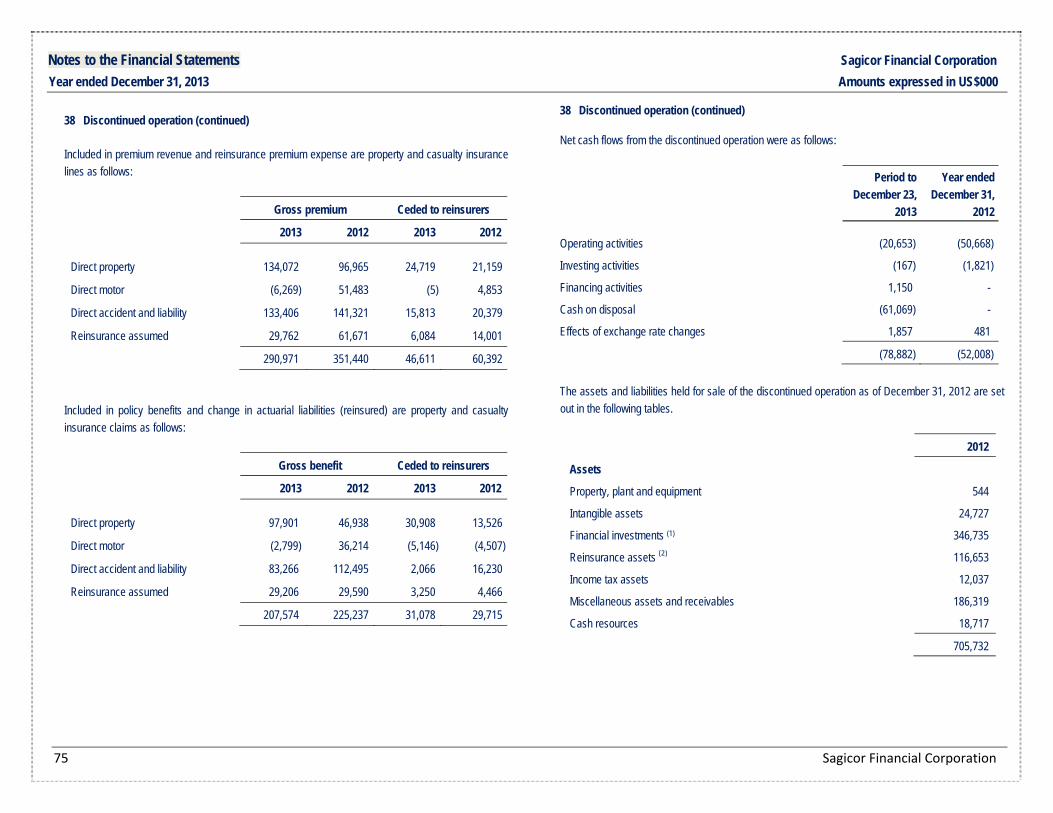

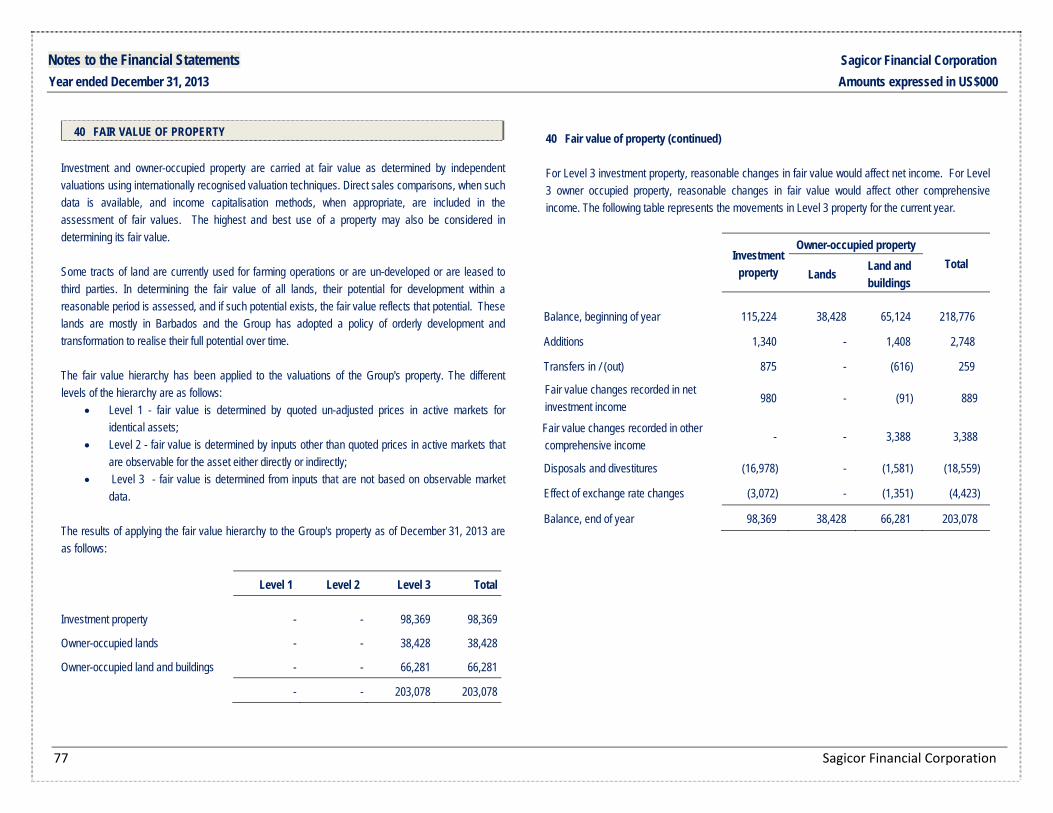

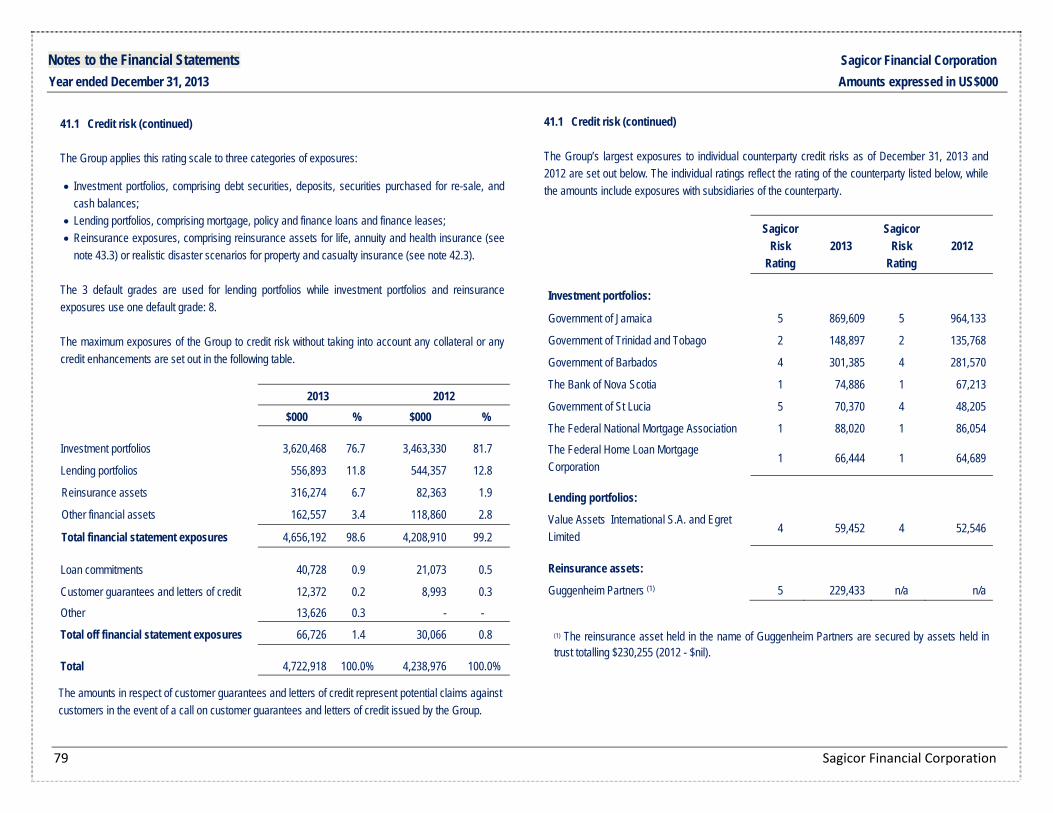


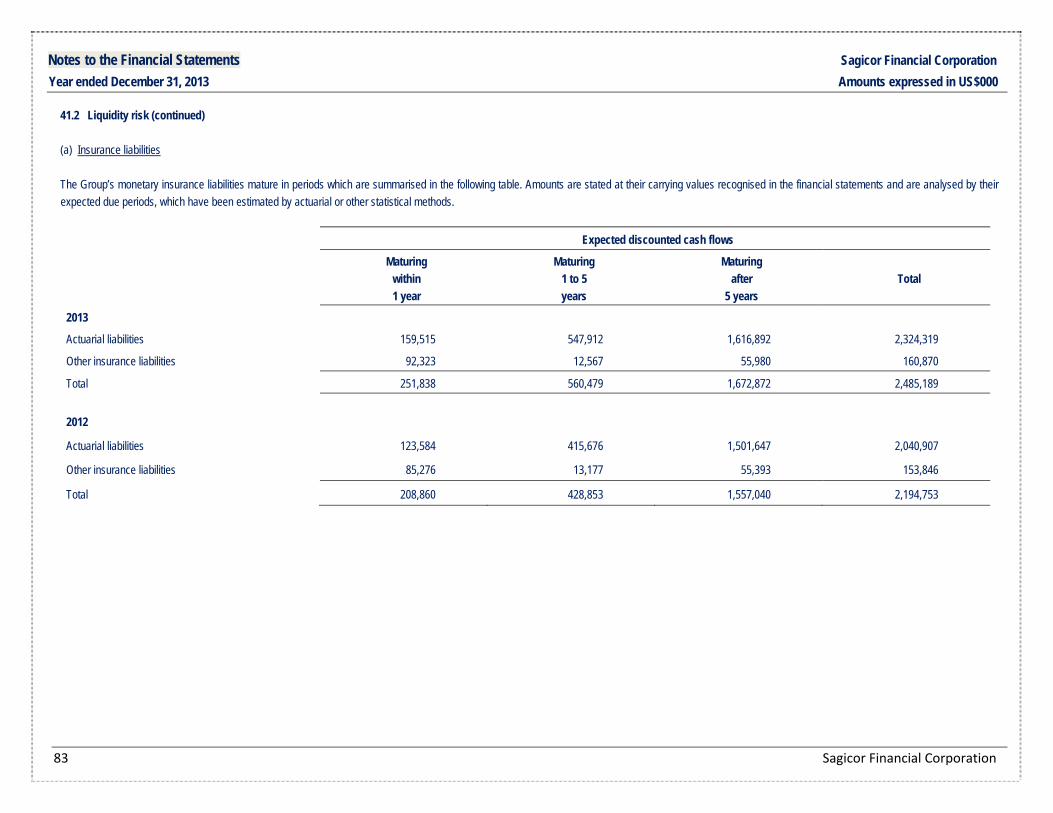
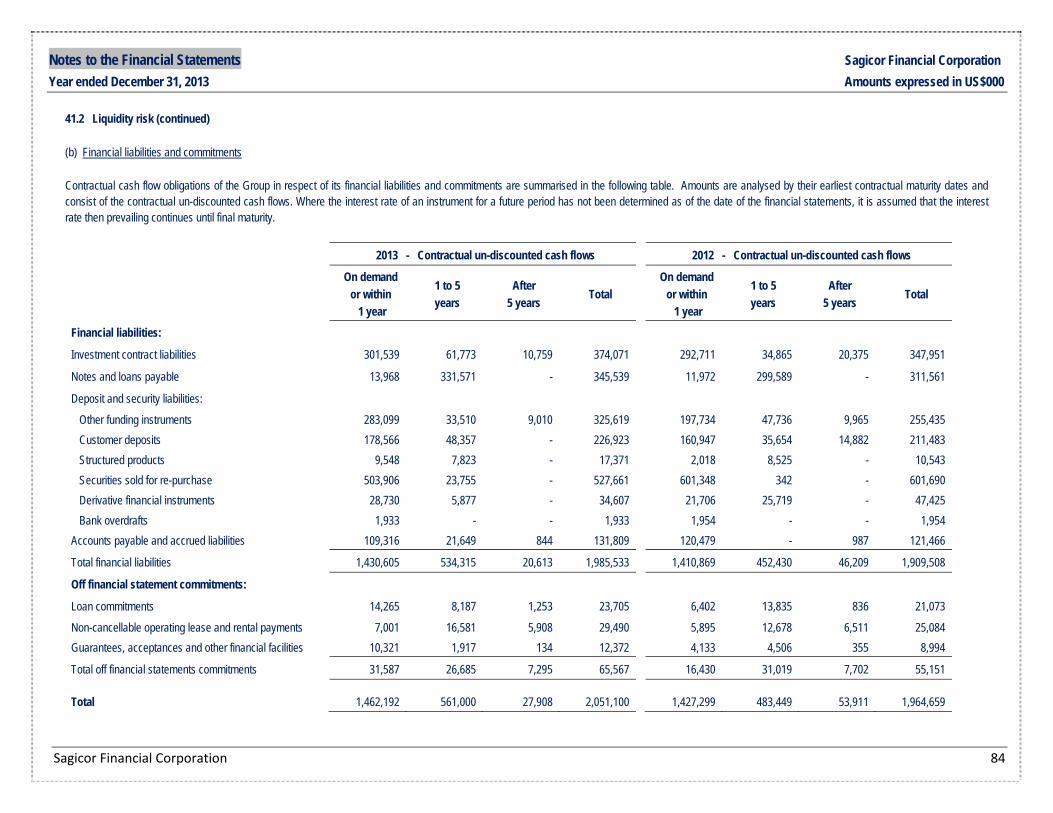


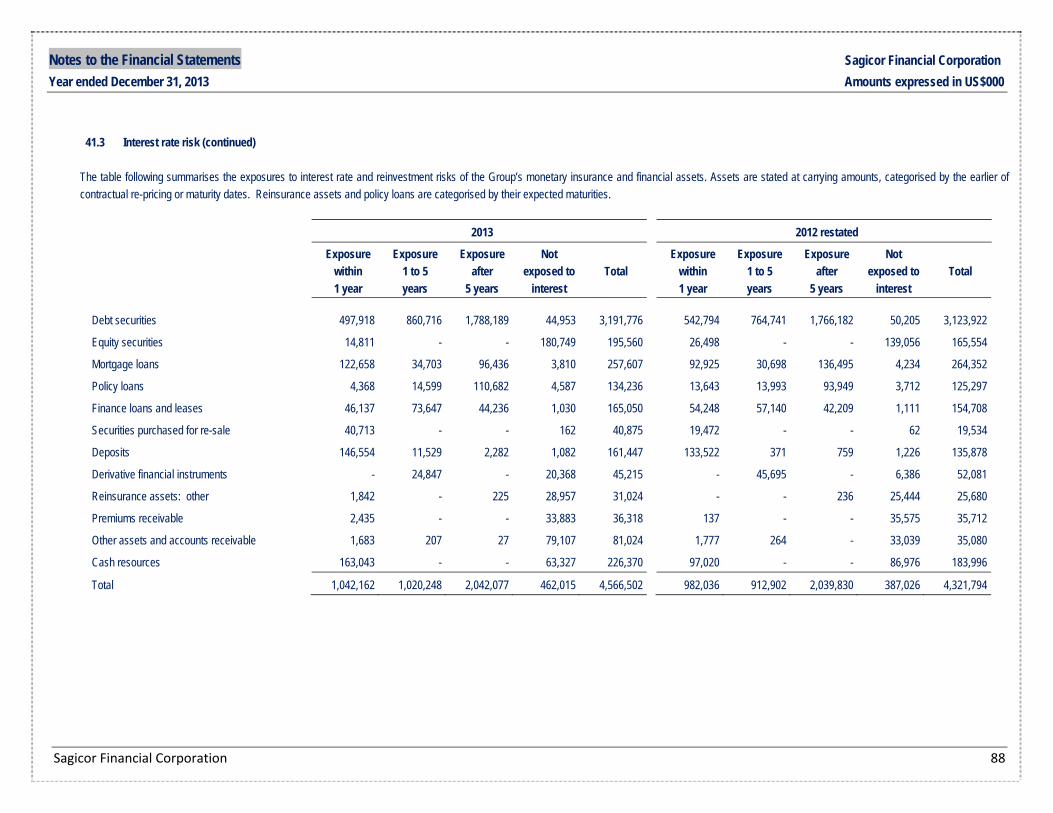
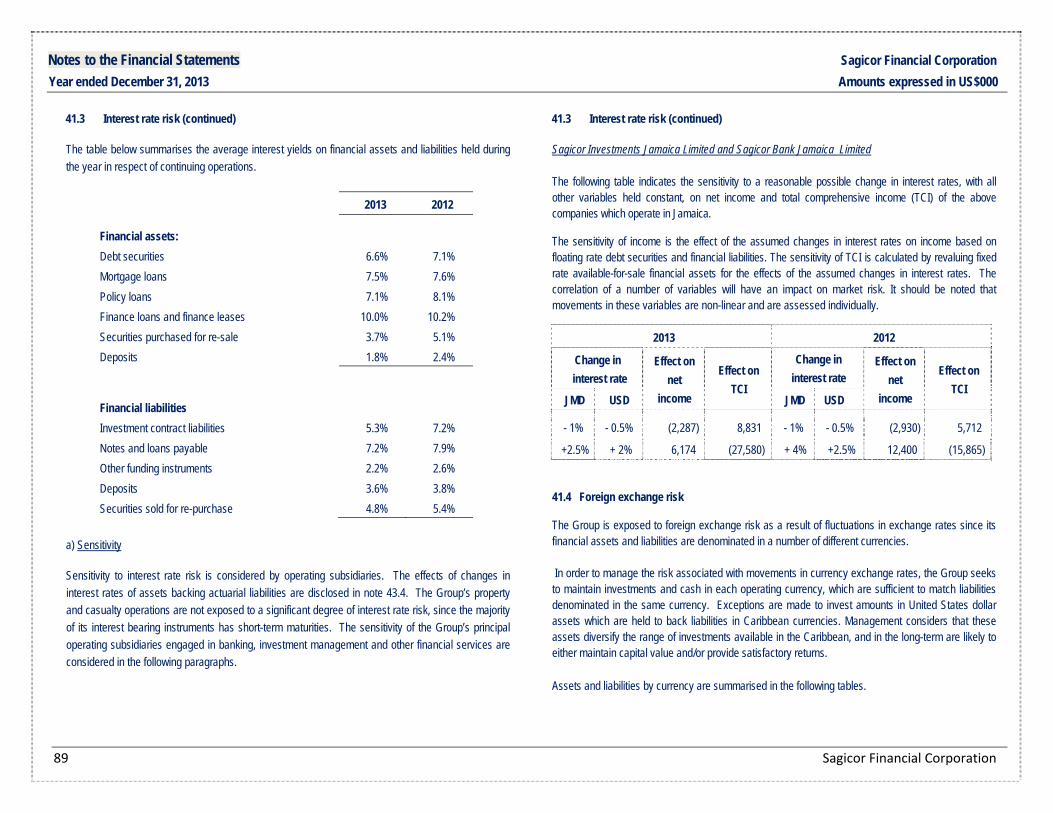
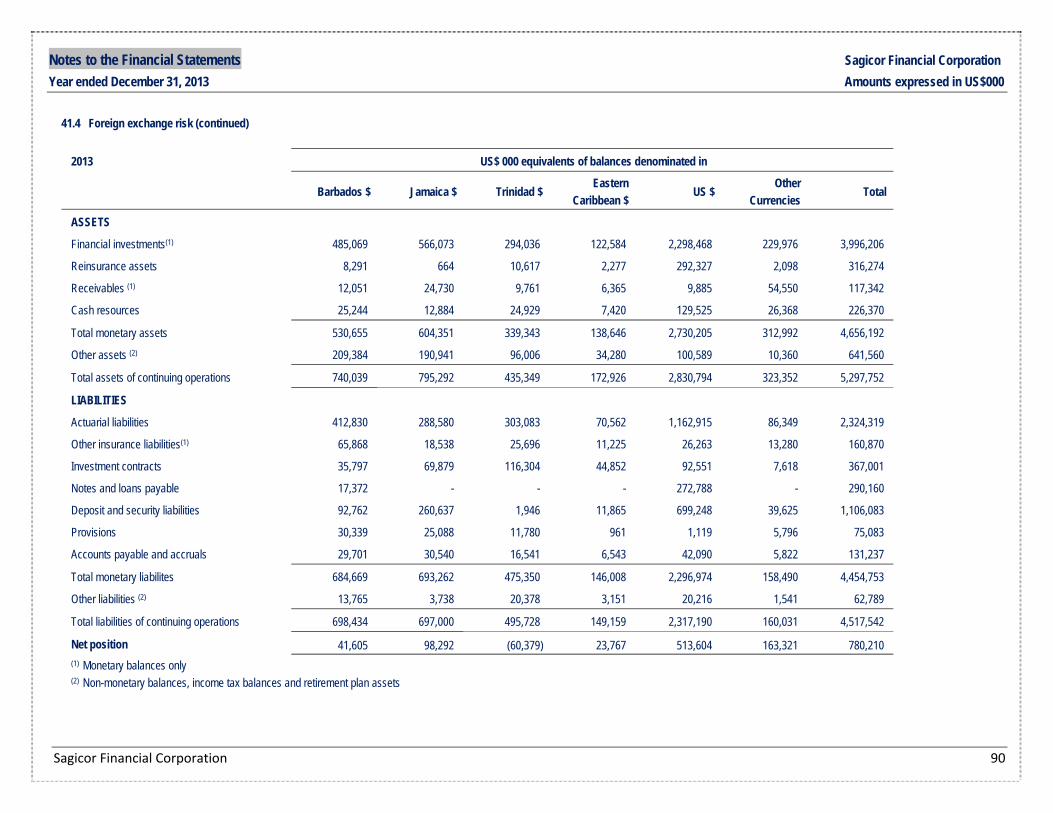

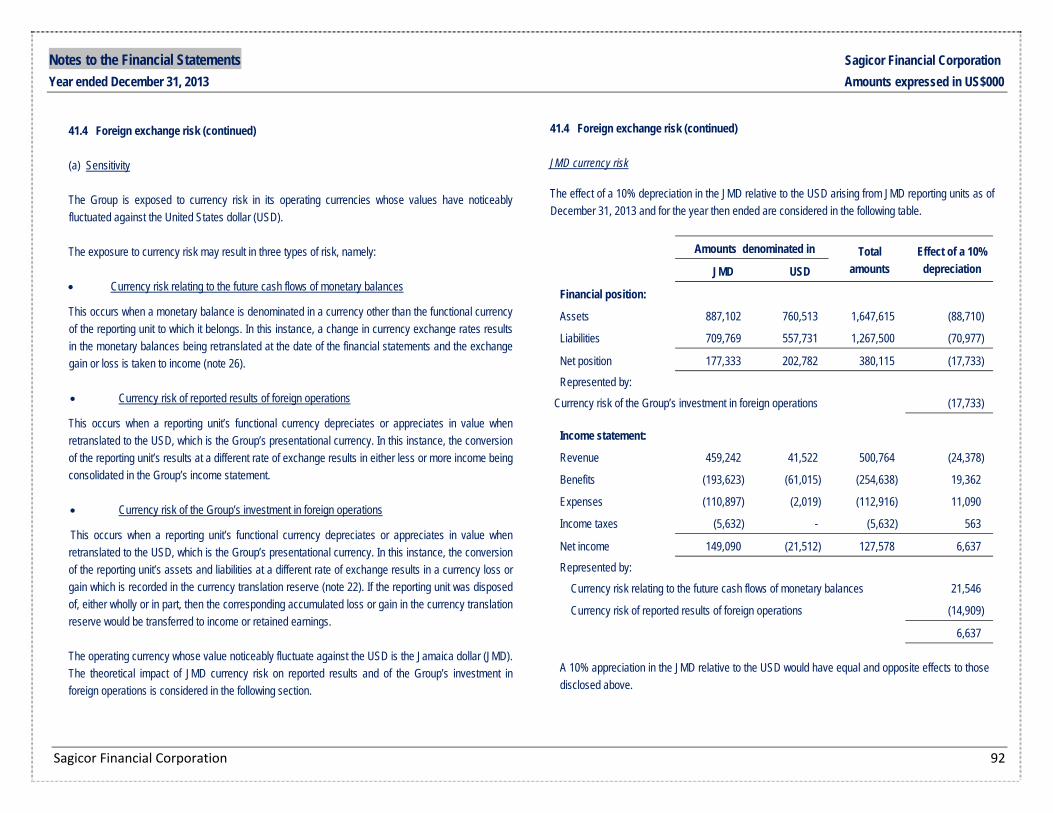


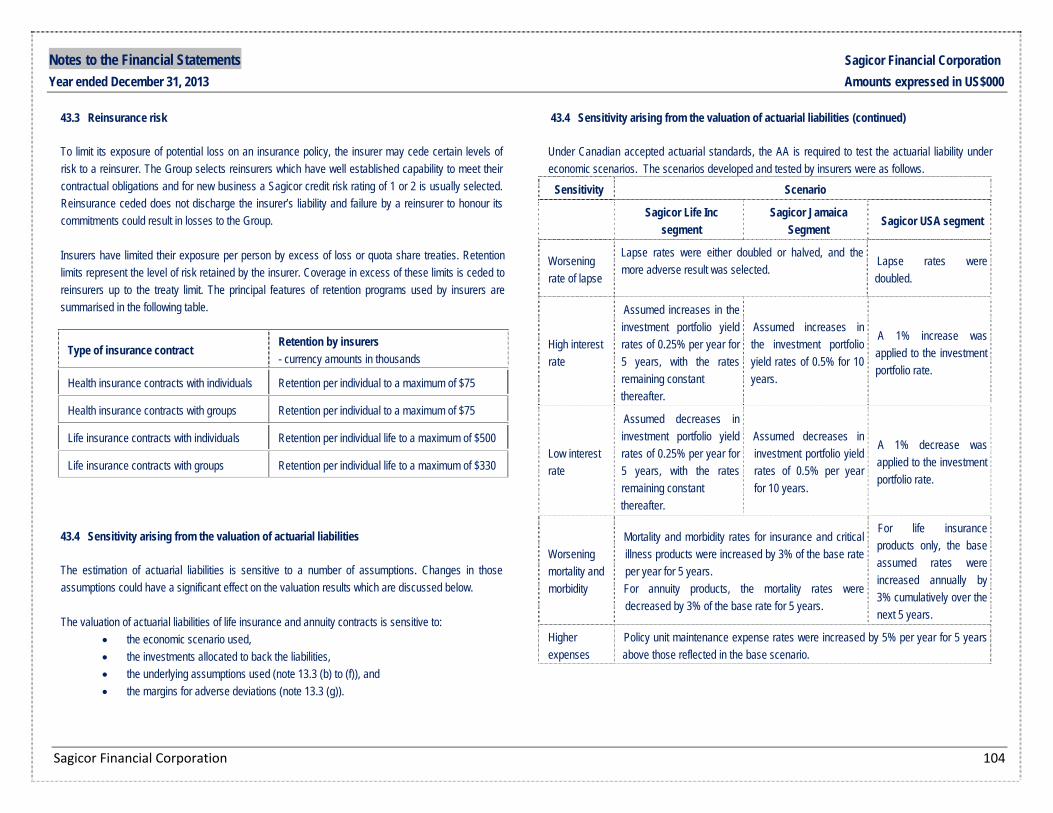
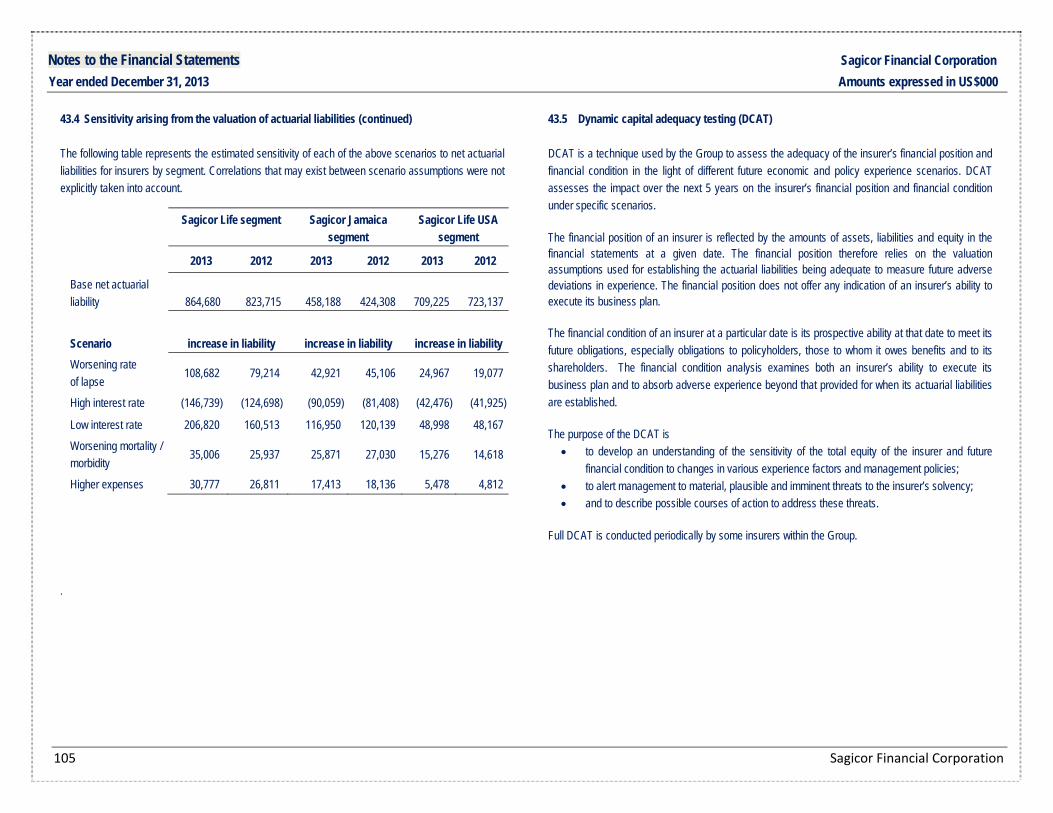


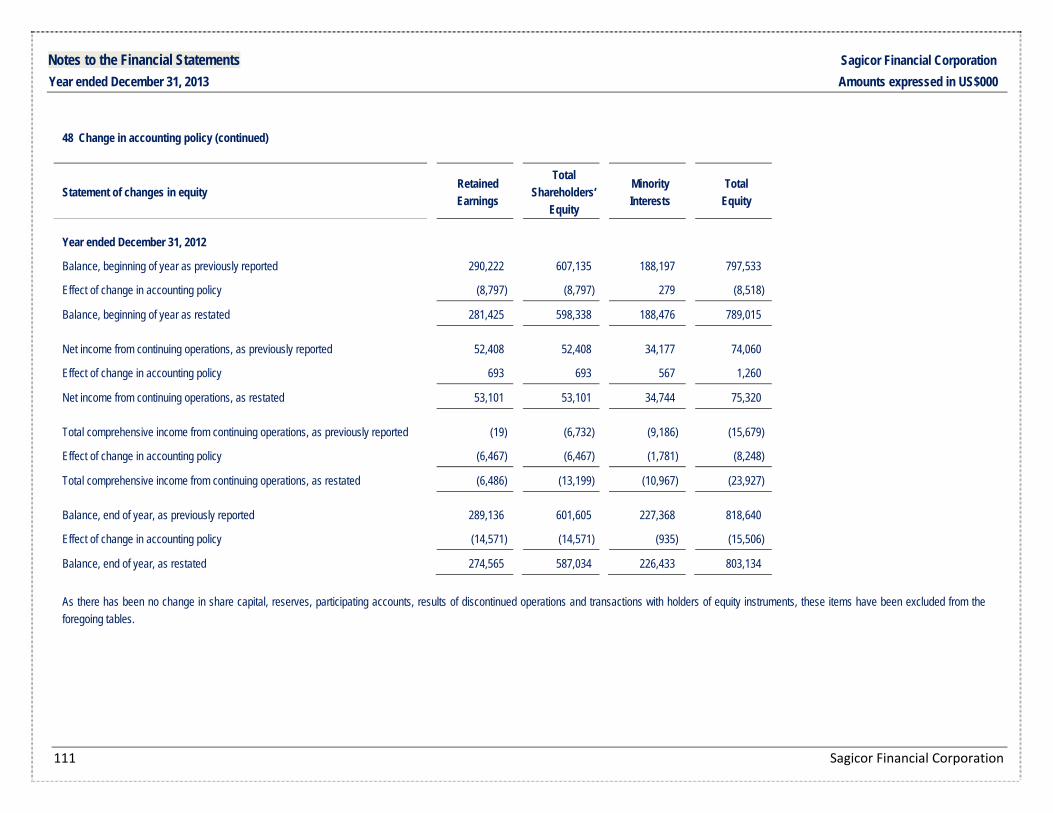


![Audited Financial Results March 2009[1]](https://static.documents.pub/doc/80x56/577d27ac1a28ab4e1ea4835e/audited-financial-results-march-20091.jpg)


