45
by Aniket Bhusha n Beyond Aid: Trade, Investment, and Remittances between Canada and Developing Countries June 2013

7/18/2019 2013. Beyond Aid in Canada
http://slidepdf.com/reader/full/2013-beyond-aid-in-canada 1/45
by
Aniket Bhushan
Beyond Aid: Trade, Investment,and Remittances betweenCanada and DevelopingCountries
June 2013

7/18/2019 2013. Beyond Aid in Canada
http://slidepdf.com/reader/full/2013-beyond-aid-in-canada 2/45
i
Table of Contents
Abstract ..................................................................................................................................................................... ii
Introduction ............................................................................................................................................................ 1
Background: Why Look Beyond Aid? ............................................................................................................ 1
Findings .................................................................................................................................................................... 3
General trends in financial flows between traditional and non-traditional donors and
developing countries ...................................................................................................................................... 3
Flows between Canada and developing countries .............................................................................. 6
Flows disaggregated by income level ....................................................................................................... 7
Flows disaggregated by region ................................................................................................................... 8
Canada’s largest aid recipients, and select other examples ............................................................. 9
Summary of findings .................................................................................................................................... 12
Policy Dilemmas ................................................................................................................................................. 13
Foreign aid ....................................................................................................................................................... 13
Trade and investment ................................................................................................................................. 17
Migration and remittances ........................................................................................................................ 27
Conclusion............................................................................................................................................................. 32
Appendix: Data and Data Sources ................................................................................................................ 35
General features of the dataset ................................................................................................................ 35
Foreign aid, trade, investment and remittances data sources ..................................................... 36

7/18/2019 2013. Beyond Aid in Canada
http://slidepdf.com/reader/full/2013-beyond-aid-in-canada 3/45
ii
Abstract
This report provides a sense of Canada’s development footprint beyond aid by drawingon a cross-section dataset collated from The North South-Institute’s (NSI) Canadian
International Development Platform (CIDP) which comprises the most recent data onaid, trade, investment, and migrant remittance flows between Canada and developingcountries. The report also highlights key policy dilemmas that make achievingcoherence across this broad range of policy areas problematic. Many of these dilemmashave received very little attention, especially in the Canadian context.
At the aggregate level, for the 156 countries included in the analysis, foreign aid is farsmaller than FDI from Canada and remittances, and is a fraction of the value ofCanadian imports from these countries. The pattern changes when we look at a subsetof the poorest countries. Here foreign aid is far more significant, but somewhatsurprisingly even here the value of Canadian imports is more than twice that ofCanadian aid. African countries dominate Canada’s foreign aid, and aid is far largerthan FDI or remittances and will likely remain so in coming years.
Much greater nuance is needed in the ongoing discussions on the need to look beyondaid. While it is true that aid makes up a small and even declining share of Canada’sdevelopment footprint in many developing countries, including many of the poorest,foreign aid still trumps other flows to Canada’s main development partner s, especiallythose in Africa. In many rapidly emerging developing economies Canadian aid isalready very small compared to other flows and other interests. Engaging morecoherently with these countries requires further unpacking how trade, investment, andother interests can be pursued in a way that is consistent with the developmentobjectives of both Canada and its partner countries. Rationalizing aid allocation may
require much greater focus on a subset of like-minded countries where Canadian aidcan play a meaningful role in achieving shared goals.

7/18/2019 2013. Beyond Aid in Canada
http://slidepdf.com/reader/full/2013-beyond-aid-in-canada 4/45
1
Introduction
This report examines Canada’s development footprint by analyzing aid, trade,
investment, and migrant remittance flows between Canada and developing countries. It
contributes to the “beyond aid” discussion in two ways. First, the “beyond aid” literaturerarely goes beyond aid to systematically look at other flows, such as trade, investment,
and migrant remittances in comparative perspective.1 Donors and development
practitioners often highlight trends such as the declining importance of aid relative to
other flows based on long term trends or highly aggregated data, but neglect to
systematically compare the scale of flows at a disaggregated level. The analysis
provided here addresses this analytical gap from a Canadian perspective. Using a
cross-section dataset collated from The North South-Institute’s (NSI) Canadian
International Development Platform (CIDP), which comprises the most recent data on
aid, trade, investment, and migrant remittance flows between Canada and developingcountries, I provide a sense of Canada’s broader development footprint beyond aid.
Such comparisons are important to get a fuller picture of Canada’s development
footprint and allow a more nuanced discussion about policy coherence. Second, the
paper highlights key policy dilemmas that make achieving coherence across this broad
range of policy areas problematic. Many of these dilemmas have received very little
attention in the Canadian context.
The rest of this report is divided into four sections. The next section discusses the
context in which we need to look beyond aid. The section after that presents findings on
Canada’s development footprint beyond aid. The section thereafter outlines key policy
issues for supporting better development outcomes through aid, trade, investment, and
migrant remittances. The concluding section recaps key findings.
Background: Why Look Beyond Aid?
Foreign aid is declining in volume relative to other financial flows from rich to poor
countries. At least three important forces are at work. First, aid is falling. After years of
steady increases, aid from the Organisation for Economic Co-operation andDevelopment’s Development Assistance Committee (OECD-DAC) countries has fallen
around 6 per cent in real terms since 2010. In 2012, aid to sub-Saharan Africa, the
neediest region, and to least developed countries (LDCs) fell in real terms (Bhushan
2013). Second, other linkages between rich and poor countries such as trade and
investment are increasing rapidly. Third, sustained growth in many of the largest aid

7/18/2019 2013. Beyond Aid in Canada
http://slidepdf.com/reader/full/2013-beyond-aid-in-canada 5/45
2
recipients in past years (e.g. China) has meant that these countries have rapidly
outgrown the need for aid. If this trend continues, many more developing countries will
outgrow the need for aid in the near future (Fengler 2013).
The changing geography of poverty is at the heart of these developments. One of the
most cited data points in the recent development economics literature is that the
majority of the poorest people now live not in low-income but rather middle-income
countries, which represents a sea change over a relatively short period, from 1990 to
2007. This trend is driven by the fact that the number of low-income countries (LICs)
has fallen dramatically and some of the largest contributors to global poverty – such as
India, China, Nigeria, and Indonesia – have graduated to middle-income status (Sumner
2011).2 Nearly 95 per cent of the world’s poor lived in LICs 20 years ago. Today only 25
per cent live in LICs.
This is meaningful for how scarce aid dollars are allocated and how that allocation is
justified. Recent discussions surrounding the World Bank’s International Development
Association’s (IDA) 17th replenishment speak to a number of issues at stake (IDA
2013). IDA is the most important source of concessional financing for the world’s
poorest countries and provides about $15 billion a year in aid, making it one of the
largest donors.3 Contributing around 4 per cent of the IDA’s 16th replenishment,4
Canada is a key IDA contributor. But IDA is facing a rapidly changing client base. Its
largest borrowers—India, Nigeria, and Pakistan—are all set to graduate and become
ineligible for IDA financing soon. Today IDA and IDA-blend financing goes to 81
countries. It is projected that by 2025 only 31 countries will be eligible and the majorityof the largest recipients, accounting for 60 per cent of current IDA allocations, will have
graduated (The Future of IDA Working Group 2012).
It is within this context that the international development discussion needs to go
beyond aid and explore critical questions. What is the role and policy space for aid
policy and development practitioners in a world where poverty is falling rapidly, or at
least the geography of poverty is changing rapidly? How should aid policy be positioned
alongside trade, investment, and migration policies, not only to ensure greater
coherence but also enhance development impact? While these broad questions gobeyond the scope of this report, I aim to contribute to the discussion in the following
ways. First, studies that systematically compare the scale of different flows between rich
and poor countries at a sufficiently disaggregated level (bilateral country pairs) are rare.
They are particularly rare in the Canadian context. And yet such comparisons are
important not only to get a fuller picture of Canada’s development footprint but also to
have a more nuanced discussion about policy coherence. In this regard, I compare aid

7/18/2019 2013. Beyond Aid in Canada
http://slidepdf.com/reader/full/2013-beyond-aid-in-canada 6/45
3
flows with trade (specifically imports into Canada from developing countries, since these
entail a monetary transfer to the exporter), foreign direct investment (FDI) outflows from
Canada to developing countries, and bilateral remittances from Canada to developing
countries. Second, achieving greater development impact through complementary
policies in areas beyond aid—such as trade, investment, and immigration policy—
presents dilemmas that are often downplayed in the “beyond aid” literature. These
policy dilemmas need to be further articulated in order to have a more nuanced
discussion. This is particularly the case in the Canadian context, where many of the
dilemmas I highlight below have received very little debate.
Findings
General trends in financial flows between traditional and
non-traditional donors and developing countries
We begin with recent trends for OECD-DAC countries as a group (see Figure 1). DAC
aid statistics show the overall trend for total net financial flows by flow type. Total
financial flows (excluding remittances) from DAC countries to developing countries
increased from around $181 billion per year in 1995 to nearly $500 billion per year by
2011. This increase is driven by private flows, which include FDI, portfolio investment,
and export credits. As can also be seen in Figure 1, private flows are highly volatile,
contracting sharply during crises such as in 2000 –01 and again in 2008. In relative
terms, official development assistance (ODA) flows have been at their highest (around44 per cent) during crises. ODA has declined to around 27 per cent in recent years and
shows a declining trend over a longer period of time. Other flows such as grants by non-
governmental organizations have increased sharply—they have increased nearly six-
fold, and doubled in percentage terms, between 1995 and 2011.

7/18/2019 2013. Beyond Aid in Canada
http://slidepdf.com/reader/full/2013-beyond-aid-in-canada 7/45
4
Figure 1. Comparison of financial flows from OECD-DAC countries to developing
countries
Source: OECD (2013)
Significant changes are taking place within the aid landscape. Among the most talked
about is the rise of emerging donors like the BRICS (Brazil, Russia, India, China, and
South Africa) and other non-DAC donors as well as the growth of foundations and
private philanthropic sources of development financing. How large are these providers
compared to traditional DAC donors? Figure 2 provides a comparison of the scale of
development financing provided by DAC countries, select non-DAC donors, the BRICS,
and select foundations in 2011.5 As can be seen, DAC donors remain the largest
providers of development financing. However, other players are emerging rapidly. SaudiArabia is the largest non-DAC donor and its aid program is already larger than that of
Italy. Other countries, such as Turkey and the United Arab Emirates, are larger aid
donors than all the BRICS, with the exception of China. Among the BRICS, China is by
far the largest aid provider. It is noteworthy, however, that the Bill & Melinda Gates
Foundation is a bigger player than China and by far the largest US foundation.6 In
particular sectors, such as health, the Gates Foundation is the third largest donor

7/18/2019 2013. Beyond Aid in Canada
http://slidepdf.com/reader/full/2013-beyond-aid-in-canada 8/45
5
(behind the United States and the Global Fund to Fight AIDS, Tuberculosis and Malaria,
yet far ahead of Canada, which ranks sixth).
Figure 2. OECD-DAC donors compared to non-DAC donors, foundations, and the
BRICS
Sources: OECD (2013) and Foundation Centre (2013)
OECD-DAC data also indicate that just focusing on official flows—in other words ODA—
may understate the scale of development financing provided by some countries. At over
$30 billion per year, grants from private voluntary agencies based in donor countries arealready quite significant (see Figure 1). The United States is the largest provider of
private grants, worth approximately $23 billion. Adding this to ODA would nearly double
the United States’ contribution to development financing, bringing it to around $54
billion. Canada, interestingly, was the second largest provider of private grants in 2011,
according to the OECD-DAC. Adding grants by private voluntary agencies based in

7/18/2019 2013. Beyond Aid in Canada
http://slidepdf.com/reader/full/2013-beyond-aid-in-canada 9/45
6
Canada would take the overall Canadian contribution to development financing to
approximately $7.5 billion, nearly 50 per cent higher than ODA.
Flows between Canada and developing countries
In this section we analyze aid, trade, investment, and migrant remittance flows between
Canada and all countries in our dataset. For the given group of 156 countries, trade, or
more appropriately imports into Canada from these countries, constitutes the largest
financial flow. In relative terms, foreign aid is the smallest of the four flows. Data shown
below are for 2012, with the exception of remittances, for which data are only available
for 2011. The value of goods imported into Canada was around $133.4 billion,
remittances from Canada to these countries totalled around $14.7 billion, FDI totalled
around $11.7 billion, and foreign aid totalled approximately $5.6 billion.
Figure 3. Aid, trade, investment and remittances between Canada and developing
countries
Source: CIDP (2013)
Since foreign aid was our starting point for comparison, the number above accounts for
all of Canada’s foreign aid. Total FDI outflow from Canada in 2012 totalled
approximately $36.9 billion, therefore the developing countries included above receive
only around 31 per cent of Canada’s FDI. Total remittance outflow from Canada was
$23 billion, so developing countries included above receive 64 per cent of Canada’s
total migrant remittances. Similarly, total imports into Canada were worth $458 billion,
hence the developing countries above account for only around 29 per cent of Canada’s
imports.
7/18/2019 2013. Beyond Aid in Canada
http://slidepdf.com/reader/full/2013-beyond-aid-in-canada 10/45
7
Flows disaggregated by income level
If we limit our query to just LDCs and other LICs, a subgroup that comprises 53
countries—35 of which are in sub-Saharan African, 12 in Asia, five in Oceania, and one
in the Americas—we get the result featured in Figure 4. This subgroup accounts for the
majority of Canadian aid in 2012, 61 per cent of the share of aid that was allocable by
income level.7 It is interesting to note that even among the poorest countries, the value
of imports into Canada is more than twice what Canada provides in aid. We should also
note that migrant remittances and FDI are nowhere near as important for this sub group
(see Figure 4).8
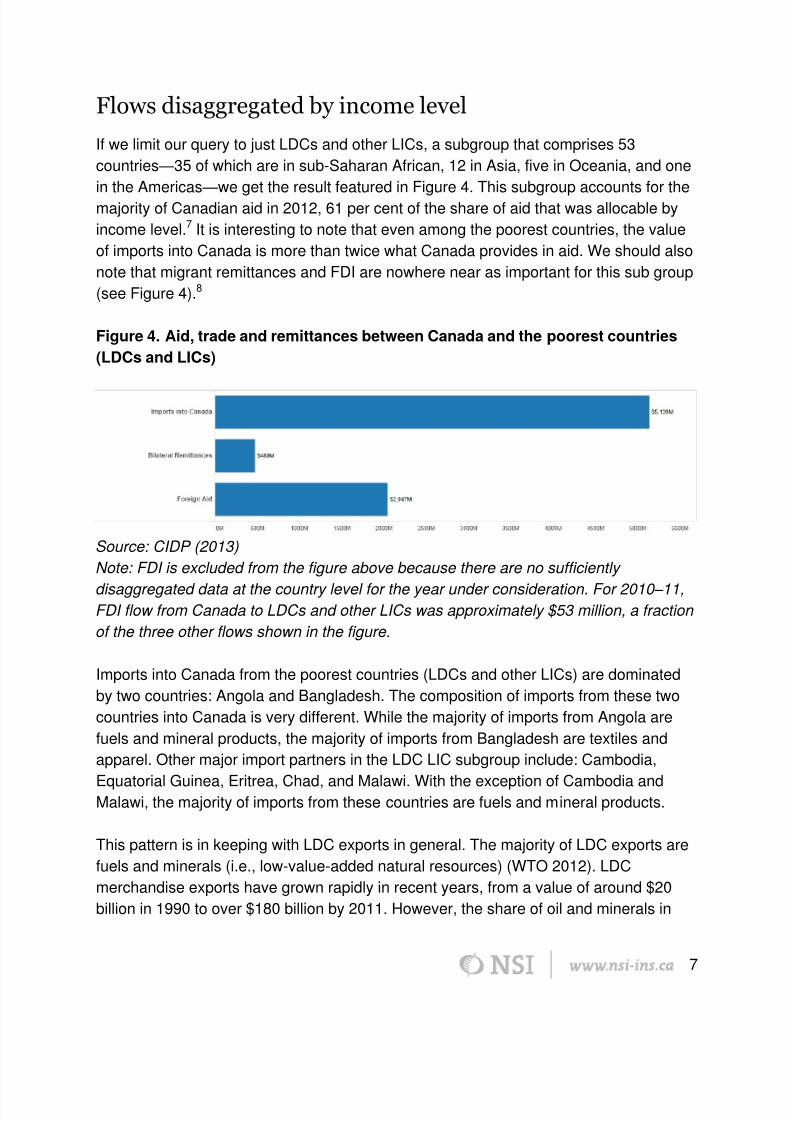
Figure 4. Aid, trade and remittances between Canada and the poorest countries
(LDCs and LICs)
Source: CIDP (2013)
Note: FDI is excluded from the figure above because there are no sufficiently
disaggregated data at the country level for the year under consideration. For 2010 –11,FDI flow from Canada to LDCs and other LICs was approximately $53 million, a fraction
of the three other flows shown in the figure.
Imports into Canada from the poorest countries (LDCs and other LICs) are dominated
by two countries: Angola and Bangladesh. The composition of imports from these two
countries into Canada is very different. While the majority of imports from Angola are
fuels and mineral products, the majority of imports from Bangladesh are textiles and
apparel. Other major import partners in the LDC LIC subgroup include: Cambodia,
Equatorial Guinea, Eritrea, Chad, and Malawi. With the exception of Cambodia andMalawi, the majority of imports from these countries are fuels and mineral products.
This pattern is in keeping with LDC exports in general. The majority of LDC exports are
fuels and minerals (i.e., low-value-added natural resources) (WTO 2012). LDC
merchandise exports have grown rapidly in recent years, from a value of around $20
billion in 1990 to over $180 billion by 2011. However, the share of oil and minerals in

7/18/2019 2013. Beyond Aid in Canada
http://slidepdf.com/reader/full/2013-beyond-aid-in-canada 11/45
8
LDC exports is now twice what it was a decade ago. LDC exports to non-OECD
emerging and developing countries including the BRICS have grown twice as fast as
exports to OECD countries. This again has been almost entirely driven by oil and
minerals, which represent a higher share of LDC exports to non-OECD countries (77
per cent) than OECD countries (51 per cent). While so-called “South–South trade” may
have helped LDCs diversify their export markets, it has had the opposite effect on their
export products (Ancharaz and Pfister 2013).
Flows disaggregated by region
We can disaggregate our data further by region. Imports are the largest flow in all
regions. Imports from Asia are the largest at $74 billion per year, dominated by China at
$50 billion per year. The largest remittance recipients from Canada are also in Asia:
China, India, and the Philippines. Asia is the second largest recipient region for
Canadian foreign aid, but both imports and remittances are far larger than the $1.2
billion in aid per year.
The Americas is the only region where Canadian FDI flows are significant. As
mentioned above, private flows such as FDI can be volatile. Outside of the United
States, United Kingdom, European countries, Australia, and Japan, the largest
destinations for Canadian FDI are all in the Americas. These include countries such as
Barbados, Argentina, Chile, and Mexico. Imports into Canada from the Americas, FDI
outflow to countries in the Americas, and remittances between Canada and the
Americas are higher than Canadian foreign aid to countries in the region. Especiallygiven the vast majority of Canadian foreign aid in recent years has gone to one country
in the region, Haiti.

7/18/2019 2013. Beyond Aid in Canada
http://slidepdf.com/reader/full/2013-beyond-aid-in-canada 12/45
9
Figure 5. Aid, trade, investment, and remittances between Canada and developing
regions
Source: CIDP (2013) The pattern of flows to Africa is interesting. Once again, imports are far more important
than other flows. But in contrast to other regions, foreign aid is the second most
important flow. On a regional basis, Africa is the largest recipient of Canadian foreign
aid. It is worth emphasizing that aid is larger than FDI9 and worth more than twice the
remittances from Canada to African countries. It is likely that foreign aid will become
even more concentrated in Africa, a region which already accounts for around 42 per
cent of total Canadian aid. Canada’s aid is already becoming more Africa-focused. In
2000 –01, Africa’s share of Canadian aid was around 24 per cent. Moreover, according
to available projections (discussed below), extreme poverty—even though in decline—is
expected to become more concentrated in African countries.
Canada’s largest aid recipients, and select other examples
What do these patterns look like from the perspective of Canada’s largest aid
recipients? In Figure 6 below, data are disaggregated further at the country level.
Ethiopia, Haiti, Tanzania, Afghanistan, and Ghana were the largest recipients of
Canadian aid in 2012, and have been important development partners in recent years.
In each case, foreign aid is by far the largest flow between Canada and these countries.Imports into Canada remain negligible despite the fact that nearly all of these countries
(except Ghana) are eligible for Canada’s LDC duty-free tariff treatment (CBSA 2003),
and most have also been major recipients of Aid for Trade initiatives.

7/18/2019 2013. Beyond Aid in Canada
http://slidepdf.com/reader/full/2013-beyond-aid-in-canada 13/45
10
Figure 6. Aid, trade, and remittances between Canada and its top five aid
recipients
Source: CIDP (2013)
The pattern of flows is considerably different further down the list of Canadian aid
recipients (see Figure 7 below). Pakistan, India, Bangladesh, Vietnam, and Nigeria were
Canada’s eighth, ninth, 10th, 12th, and 15th largest aid recipients, respectively, in 2012.
But aid is a small portion of Canada’s development footprint in each of these countries.
Imports are far larger than aid in all cases. It is interesting to note that remittances are
also far larger than aid for each country: their value is more than six times that of aid to
Nigeria, more than eight times aid to Vietnam, over four times aid to Pakistan, and over30 times aid to India.
Figure 8 below points to two countries of increasing interest to Canada from the
perspective of trade and investment: Eritrea and Mongolia. While Eritrea is among the
poorest countries in the world, it has been one of Canada’s fastest growing trade
partners in recent years. The value of imports into Canada from Eritrea grew from just
around $100,000 in 2009 to over $370 million in 2012. This rapid growth is driven
almost entirely by imports of minerals (primarily gold). Similarly, among low- and lower-
middle-income countries, one of the largest emerging destinations of Canadian FDI isMongolia. The stock of Canadian FDI in Mongolia increased from under $250 million in
2007 to nearly $2 billion by 2012, with the value of the flow in 2012 estimated at around
$605 million. Despite their status as very poor countries with very low levels of human
development, Canadian aid plays a negligible role in Canada’s development footprint in
both countries while trade and investment are significant and growing at a rapid rate.10

7/18/2019 2013. Beyond Aid in Canada
http://slidepdf.com/reader/full/2013-beyond-aid-in-canada 14/45
11
Figure 7. Aid, trade, investment, and remittances between Canada and select
developing countries
Source: CIDP (2013)
Figure 8. Aid, trade, and investment between Canada and Eritrea and Mongolia
Source: CIDP (2013)

7/18/2019 2013. Beyond Aid in Canada
http://slidepdf.com/reader/full/2013-beyond-aid-in-canada 15/45
12
Summary of findings
Our analysis based on a cross-section of recent data on aid, trade, investment, and
migrant remittance flows between Canada and developing countries shows that at the
aggregate level, for the 156 countries included, foreign aid is far smaller than FDI from
Canada and remittances, and is a fraction of the value of Canadian imports from these
countries.
However, the pattern changes when we look at a subset of the poorest countries (LDCs
and other LICs). Here foreign aid is far more significant, as would be expected, but
somewhat surprisingly the value of imports into Canada from these countries is more
than twice that of Canadian aid.
African countries dominate Canada’s foreign aid, and aid is far larger than FDI or
remittances and will likely remain so in coming years. Imports into Canada from African
countries (at around $13 billion in 2012) are of course far larger than aid. But it should
be pointed out that just three countries (Algeria, Nigeria, and Angola) account for 73 per
cent of these imports, which are almost exclusively oil and other petroleum and mineral
products.
Aid is the largest component in Canada’s development footprint in its largest aid
recipient countries. However, for the group of countries just outside Canada’s top five
aid recipients but in the top 15, aid is remarkably small, especially compared to migrant
remittances. Unsurprisingly, aid is a fraction of the value of imports into Canada fromthese countries.
This analysis demonstrates that much greater nuance is needed in the ongoing
discussions about the need to look beyond aid. While it is true that aid makes up a small
and even declining share of Canada’s development footprint in many developing
countries, including many of the poorest, foreign aid still trumps other flows in Canada’s
main development partners, especially those in Africa.
In many rapidly emerging developing economies Canadian aid is already very smallcompared to other flows and other interests. Engaging more coherently with these
countries requires further unpacking how trade, investment, and other interests can be
pursued in a way that is consistent with the development objectives of both Canada and
its partner countries. Below I turn to key policy dilemmas that Canada faces in these
areas.

7/18/2019 2013. Beyond Aid in Canada
http://slidepdf.com/reader/full/2013-beyond-aid-in-canada 16/45
13
Policy Dilemmas
Foreign aid
The aid landscape is changing rapidly. This means that the demands on theinternational development community are changing radically. Yet, the development
community has been holding on to outdated ideas about aid and development. The fact
that most of the world’s poor now live in middle-income countries and the number of
low-income countries has fallen dramatically came as such a surprise shows that much
of the development community has been unaware of major changes taking place in the
global economy. As mentioned, one of the best examples of this change is the expected
decline in IDA’s client base (The Future of IDA Working Group 2012; IDA 2013). A
number of countries are expected to graduate from IDA eligibility in the near future (see
Figure 10). Several policy options—such as transitional support after graduation fromIDA and support at the sub-national level where pockets of poverty may be
concentrated—are already under discussion (IDA 2013). Nevertheless, IDA graduation
projections provide a useful starting point to look beyond aid and step up other modes
of engagement.
Some donors are already facing these issues. In the case of the United Kingdom, for
example, this is reflected in a transition in debate and discourse from aid effectiveness
to development effectiveness. The Department for International Development, the UK
aid agency, recently announced the beginning of a new “non-aid based” relationshipfocused on trade and the private sector with India, its largest aid recipient (Ryder 2013).
When the proposed shift was brought up at a joint press conference with UK Foreign
Secretary William Hague and Indian External Affairs Minister Salman Khurshid, the
latter said aid was an issue that “did not merit discussion.” This came after a former
Indian finance minister had dismissed UK aid to India as “peanuts” (Mulholland and
Burke 2012). Beyond obvious political rhetoric and posturing, this exchange between
the United Kingdom (one of the world’s largest donors) and India (one of the United
Kingdom’s largest aid recipient and still one of the largest aid recipients in the world)
does point to an important issue. Donors need to look at the foreign aid that they
provide within the broader context of the role of aid from the perspective of recipient
countries.
The magnitude of aid viewed from the perspective of the share of a donor’s budget, or
from the perspective of the political or strategic relevance of the partner country to a
donor, is only one side of the coin. Viewed from the perspective of the recipient, the

7/18/2019 2013. Beyond Aid in Canada
http://slidepdf.com/reader/full/2013-beyond-aid-in-canada 17/45
14
picture can look quite different. For the United Kingdom, India was a key development
partner and the largest aid recipient in recent years. But for India, aid from all donors
amounts to less than 0.5 per cent of GNI. A useful analytical framework that combines
the two sides of the coin involves looking at the amount of a donor’s aid that goes to
low- and very low-aid countries. Jonathan Glennie and Annalisa Prizzon (2012) outline
a framework where very low-aid countries (VLACs) are defined as those where aid
received as a share of GNI is below 1 per cent, and low-aid countries (LACs) are those
where aid received as a share of GNI is below 2 per cent. Countries with aid/GNI ratios
higher than 10 per cent are classified as high-aid countries (HACs). The main finding,
mirroring the discussion on the changing geography of poverty, is that the number of
HACs has halved compared to 20 years ago, while the number of LACs and VLACs has
grown. Most of the world’s poor live in LACs or VLACs. However, Glennie and Prizzon
caution against drawing the hasty conclusion that a low aid/GNI ratio indicates that aid
is not relevant. The relationship between the relevance or importance of aid and its
scale or volume is a topic that is beyond the scope of the discussion in this paper. Given
our focus on Canada, we are interested in examining two questions. How much of
Canada’s aid goes to LACs and VLACs? And which LACs and VLACs receive
Canadian aid? These are relevant questions because aid is a scarce resource and how
it is allocated matters. In order to achieve greater coherence and a better balance
between aid and non-aid development policies, it is useful to reflect on the scale of aid
both from donors’ as well as recipients’ perspectives.

7/18/2019 2013. Beyond Aid in Canada
http://slidepdf.com/reader/full/2013-beyond-aid-in-canada 18/45
15
Figure 9. Canadian aid going to low-aid and very low-aid countries
Sources: CIDP (2013) and World Bank (2011)
Note: Size of dots indicates the amount of aid received from Canada in 2012.
Figure 9 maps Canadian aid going to LACs and VLACs, as defined above. The map
indicates the amount of aid received from Canada in 2012 (the most recent year forwhich data are available) alongside the overall aid/GNI ratio for each country. I estimate
that $930 million, or around 16 per cent of Canada’s aid, went to LACs and VLACs in
2012. Some of this amount may be disputed, since Sudan and South Sudan, which
received the largest share of this figure, are at present clubbed together. If I limit the
threshold to just VLACs or recipients whose aid/GNI ratio is less than 1 per cent, I get a
total of $535 million, a significant amount at nearly 10 percent of Canada’s total aid
budget. This group includes countries like India, Nigeria, Ukraine, Indonesia, Colombia,
China and Peru.
A similar picture emerges if we take IDA graduation as a reference point. Leaving aside
small island states, 34 countries are expected to graduate out of IDA eligibility between
now and 2025. Around $1.15 billion in Canadian aid in 2012 went to countries that will
be graduating from IDA between now and 2025.

7/18/2019 2013. Beyond Aid in Canada
http://slidepdf.com/reader/full/2013-beyond-aid-in-canada 19/45
16
Figure 10. The World Bank’s IDA graduation projections
Sources: Based on the Future of IDA Working Group (2012) and Troilo (2013)
As mentioned above, a low aid/GNI ratio or low total volumes of aid do not automatically
imply that aid is irrelevant. Aid is clearly a scarce resource since it implies a real fiscal
transfer on the part of the donor, and most donor budgets are under pressure due to the
financial crisis. Given this backdrop, donors, including Canada, face important choices
about their aid allocation strategies and criteria. How well do small amounts of aid
spread across a wide range of countries serve Canada’s development and poverty
reduction objectives? What are the opportunity costs of the current allocation strategy?
Rationalizing aid allocation may require much greater focus on a subset of like-minded
countries where Canadian aid can play a meaningful role in achieving shared goals. As

7/18/2019 2013. Beyond Aid in Canada
http://slidepdf.com/reader/full/2013-beyond-aid-in-canada 20/45
17
alternative sources of financing, including emerging donors, rival traditional donors in
scale, the ability of aid to incentivize policy change could blunt even further (Calleja and
Bhushan 2013). This backdrop makes it important for Canada to revisit its aid allocation
strategies and criteria, including from the perspective of how aid policy can play a role in
leveraging the development impact of other policies in such areas as trade, investment,
and migration. This is even more important now that the Canadian International
Development Agency (CIDA) has been amalgamated with the Department of Foreign
Affairs and International Trade Canada (DFAIT) (Bhushan and Ingram 2013).
Trade and investment
Trade and investment policy domains will become ever more important from the
standpoint of development and poverty reduction as developing countries grow and
increasingly liberalize. This is especially the case in countries where aid is already small
compared to trade and investment flows. From a development perspective, the typical
entry point into trade and investment policy has been to either focus on preferential
market access or to criticize subsidies and non-tariff barriers that prevent developing
countries’ access to developed country markets. However, as discussed below, the
policy dilemmas confronting trade and investment go well beyond these issues.
Canada first implemented its version of a generalized system of preferences program,
called the General Preferential Tariff (GPT), in 1974. The GPT covers 175 developing
countries, nearly the entire developing world. It is renewed every 10 years and the next
renewal is in 2014. The Department of Finance’s recent comprehensive review of theGPT proposed major changes to Canada’s GPT (Canada Gazette 2012). Based on the
applied criteria, 72 countries would lose GPT status by 2014 and a more focused list of
102 developing countries—reflecting major changes in the global economy—will remain
eligible for Canada’s GPT (see Figure 11).11 These changes are entirely rational in that
it is hard to see how GPT treatment for countries including China, India, Brazil, South
Korea, Israel, the United Arab Emirates, and others can be defended. Several of the
countries that will lose GPT status already have free trade agreements (FTAs) with
Canada (see Figure 14), which lessens the relevance of the GPT.
The GPT program excludes some of the key exports of the poorest countries, such as
sugar, textiles, apparel, and footwear. But in 2003 Canada provided duty-free and
quota-free access to virtually all products—including textiles and apparel—from the
poorest countries under the Least Developed Country Tariff (LDCT) and the Canadian
Market Access Initiative for Least Developed Countries (CMAI-LDC). The LDCT and
CMAI-LDC cover 48 of the poorest countries (see Figure 11 below). Canada has also

7/18/2019 2013. Beyond Aid in Canada
http://slidepdf.com/reader/full/2013-beyond-aid-in-canada 21/45
18
been providing preferential access for 18 Caribbean countries through the
Commonwealth Caribbean Countries Tariff since 1986. By any measure, Canada
provides a comprehensive and generous set of preferential trade arrangements,
especially for the poorest countries. This is part of the reason why Canada ranks fourth
out of 27 donors on the Commitment to Development Index’s trade performance
measure (CGD 2013).12
How successful are Canada’s preferential trade measures? There are several ways by
which this question can be analyzed. Below I do so by focusing on three questions.
What is the trend of imports into Canada and overall bilateral trade between Canada
and countries receiving the most generous preferential treatment (the CMAI-LDC and
LDCT countries)? What is the performance in terms of the rate of growth of trade with
these countries relative to the rate of growth of Canada’s bilateral trade overall (in other
words, is trade with these countries growing faster than Canadian trade in general?)?
And what has happened to the share of Canada’s trade that these countries make up?

7/18/2019 2013. Beyond Aid in Canada
http://slidepdf.com/reader/full/2013-beyond-aid-in-canada 22/45
19
Figure 11. Canada’s preferential trade map
Sources: WTO (2012), CBSA (2003) and Canada Gazette (2012)
Canada’s trade is highly concentrated within North America and with other high -income
countries (around 80 per cent of total trade in 2012). Poorer regions such as sub-Saharan Africa and South Asia make up less than 1 per cent of Canada’s trade. Despite
this, as mentioned earlier, imports into Canada from the poorest countries are more
than twice the amount in aid provided by Canada to the same countries. Figure 12
below shows the rapid growth in imports into Canada from CMAI-LDC and LDCT
countries and notes the six largest trade partners that dominate trade with this group.
7/18/2019 2013. Beyond Aid in Canada
http://slidepdf.com/reader/full/2013-beyond-aid-in-canada 23/45
20
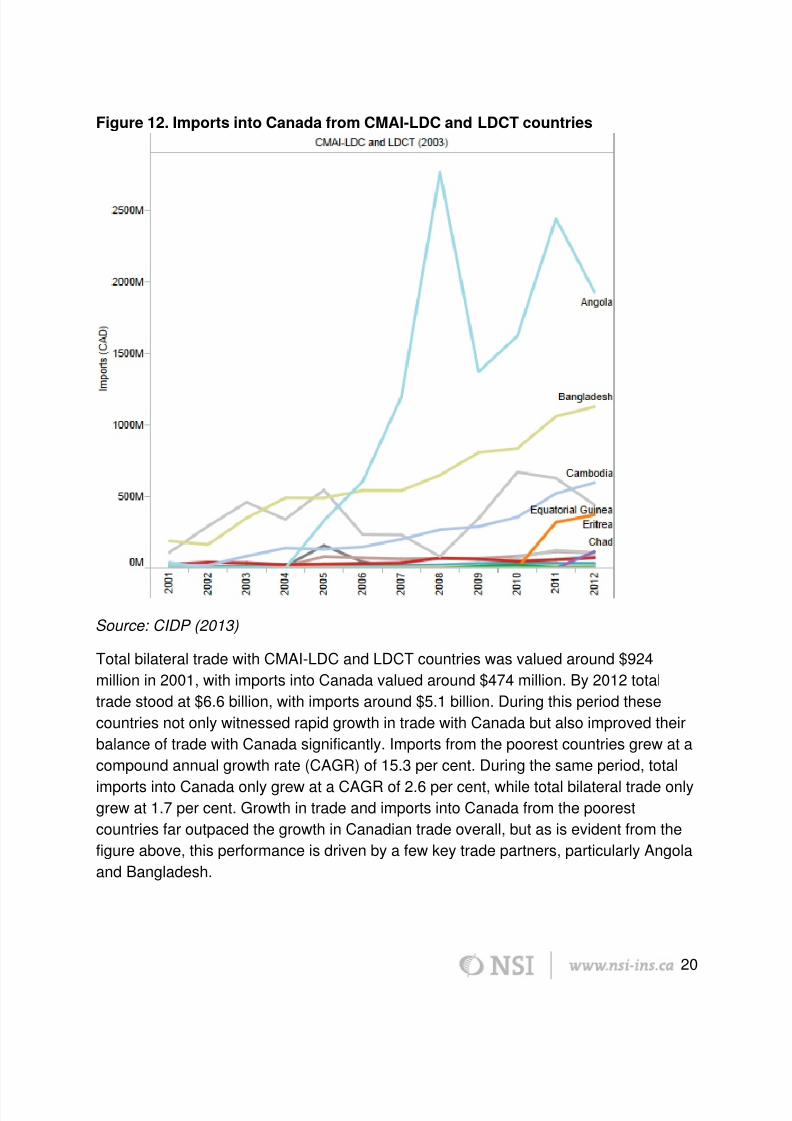
Figure 12. Imports into Canada from CMAI-LDC and LDCT countries
Source: CIDP (2013)
Total bilateral trade with CMAI-LDC and LDCT countries was valued around $924
million in 2001, with imports into Canada valued around $474 million. By 2012 total
trade stood at $6.6 billion, with imports around $5.1 billion. During this period these
countries not only witnessed rapid growth in trade with Canada but also improved their
balance of trade with Canada significantly. Imports from the poorest countries grew at a
compound annual growth rate (CAGR) of 15.3 per cent. During the same period, total
imports into Canada only grew at a CAGR of 2.6 per cent, while total bilateral trade onlygrew at 1.7 per cent. Growth in trade and imports into Canada from the poorest
countries far outpaced the growth in Canadian trade overall, but as is evident from the
figure above, this performance is driven by a few key trade partners, particularly Angola
and Bangladesh.

7/18/2019 2013. Beyond Aid in Canada
http://slidepdf.com/reader/full/2013-beyond-aid-in-canada 24/45
21
While this may look like an outright success, we should point out that in 2001 imports
from CMAI-LDC and LDCT countries accounted for a mere 0.001 per cent of total
Canadian imports. Even in 2012, imports from these countries into Canada only
accounted for around 0.01 per cent of total Canadian imports and an even smaller
share of total Canadian bilateral trade.
Many claim that the best way out of poverty is through trade. In Canada, the
amalgamation of CIDA with the Department of Foreign Affairs and International Trade
Canada is seen as a way to promote greater coherence between trade and
development. Preferential market access for the poorest countries, in addition to Aid for
Trade initiatives, is a key instrument in promoting trade-led poverty reduction and
development. There is evidence that it works. From a Canadian perspective, take
Bangladesh and Cambodia. Both countries have benefited massively from preferential
access, not only to the Canadian market but also the European Union and other
important export markets. In recent years, both have enjoyed strong export-led growth
that has helped reduce extreme poverty. The share of people living under $1.25 a day
in Bangladesh has fallen from 68 per cent in 1992 to 43 per cent in 2010 and from 44
per cent in 1992 in Cambodia to 22 per cent in 2008 (World Bank 2013b).
But preferential access presents its own set of policy dilemmas. These include well-
known and much-debated issues. Preferential access goes against the grain of
multilateral free trade, even though it is sanctioned under World Trade Organization
rules. It amounts to picking winners and losers among developing countries. It opens
the door to complications, such as determining exclusion lists, negotiating rules of originclauses, negotiating the extension of preferences and application of non-tariff barriers,
all of which arguably increase transactions costs for developing countries.
If our concern is with how trade-led growth can be translated into poverty reduction and
sustainable development, labour rights and working conditions also require attention.
The collapse of an eight-storey garment factory that killed over 1,100 workers in April
2013 in Bangladesh’s lucrative garment export sector, which enjoys preferential access
to key markets including Canada, is a case in point. This disaster is the most recent in a
string of incidents and only exceptional in its scale. Garment export is a very low-wage,low-skill, and highly competitive sector in Bangladesh, with thin margins. Exporters have
little incentive to invest in better work conditions. Preferential trade access adds to the
dilemma. Countries already providing preferential access with inadequate attention to
working conditions lose leverage in getting authorities to change behaviour. The United
States, which unlike Canada has not yet provided preferential access in this sector to
Bangladesh, can use such access as a carrot to get the country to adopt the

7/18/2019 2013. Beyond Aid in Canada
http://slidepdf.com/reader/full/2013-beyond-aid-in-canada 25/45
22
International Labour Organization’s Better Work standards (Elliott 2013; Urbina 2013;
see also ILO 2013). The threat of removal of preferential access can also be used as
leverage, but this is uncommon, at least in the case of Canadian preferences.13 Offering
open-ended preferential treatment without adequate attention to labour, working and
environmental conditions in the poorest countries invites trouble.
While there are no specific preferential treatment provisions when it comes to foreign
investment, a similar picture emerges when Canadian FDI in developing regions is
analyzed. The total stock of Canadian FDI in developing countries has nearly doubled
between 2001 and 2011 from $7.8 billion to $13.5 billion, representing a CAGR of 5 per
cent. This outpaced the rate of growth of overall Canadian FDI. However, Canadian FDI
in developing countries (including the BRICS and other rapidly growing emerging
economies) is only around 2 per cent of total Canadian FDI. The poorest countries—
LDCs—account for less than 0.2 per cent.
Sub-Saharan Africa is expected be one of the fastest growing regions, second only to
developing countries in Asia, but the region may also account for a larger share of
global poverty in the future. Seventeen of the 50 fastest growing economies out to 2018
will be in Africa. While China and India currently account for over one-third of the world’s
poor at the $2-a-day level, this picture will change rapidly. By 2030, the majority of the
world’s poor will reside in African countries, including the Democratic Republic of Congo
(18 per cent), Nigeria (11 per cent), Tanzania (6 per cent), Uganda, Madagascar, and
Ethiopia (each around 4 per cent). China, India, Vietnam, Indonesia, Philippines,
Pakistan, South Africa, and Cambodia are all expected to eliminate $2-a-day povertyahead of 2030 (Kaufmann, Kharas, and Penciakova 2012/2013; Kharas and Rogerson
2012).
These developments require updating the way Canada engages with these countries,
many of which, while still relatively poor, will become the “emerging economies” of the
future. There are signs that this is already happening. For instance, Canada’s foreign
investment protection and promotion agreements (FIPAs) map is more widespread than
its FTAs map (compare Figures 13 and 14 below). Inclusive of the North American Free
Trade Agreement (NAFTA), Canada has FTAs with 13 countries. This group not onlyaccounts for the bulk of Canada’s bilateral trade but also includes some of the fastest
growing bilateral trade partners (e.g., Peru). There are also signs that Canada is using
its leverage with countries like Peru, which is both a significant development partner and
a trade and investment partner, to increase its visibility in multilateral groupings such as
the Trans-Pacific Partnership. FTA negotiations are ongoing or at an exploratory stage
with another 20 countries. Some of these negotiations have been ongoing for long

7/18/2019 2013. Beyond Aid in Canada
http://slidepdf.com/reader/full/2013-beyond-aid-in-canada 26/45
23
periods of time, in some cases over a decade. Interests and concerns on both sides
change dramatically over such long periods and more effort is needed to conclude
negotiations, especially with key emerging economies and developing countries.
Canada’s FIPA map includes more countries. FIPAs are in force with 24 countries and
the map approximates Canadian FDI interests.14 For instance, FIPAs are in force with
several countries in Latin America and the Caribbean, which among developing regions
is the largest destination for Canadian FDI. Negotiations have concluded with another
11 countries and agreements may soon come into force. It is worth noting that the
majority of these countries are in Africa, and all negotiations have had significant mining
components (these countries virtually mirror the map of Canadian mining assets in
Africa). Negotiations are ongoing with another 14 countries. These again mirror
Canadian mining investments, especially in West Africa, countries like Kazakhstan and
Mongolia, and emerging investment destinations like Vietnam, India, Pakistan, and
Indonesia.

7/18/2019 2013. Beyond Aid in Canada
http://slidepdf.com/reader/full/2013-beyond-aid-in-canada 27/45
24
Figure 13. Canada’s free trade agreements map by status of agreements
Sources: CIDP (2013), based on DFAIT (2012)
Note: Some countries may be listed as both “in force” and “ongoing” because
agreements are being reviewed or updated.
The push to expand Canadian FTAs and FIPAs is welcome and necessary, but it is not
without controversy. For instance, the Canada-China FIPA saw much political
opposition due to the secretive nature of the negotiations. Despite this, Parliament
rejected the opposition to the FIPA (Lane 2013). On the one hand, the rapid pace of
change within the global economy and the real and potential impact of this change on
Canada’s engagement with key emerging economies dictates that policy keep pace.However, speeding decisions through Parliament without adequate public consultation
risks loss of public support. Civil society groups have been critical of past model FIPAs
(Peterson 2006). Up until the recent conclusion of negotiations with China (the
agreement has yet to be ratified at the time of writing), Canada had been having a hard
time concluding FIPAs with key developing country partners. The main stumbling block
in FIPAs with developing countries has been the national treatment principle. National

7/18/2019 2013. Beyond Aid in Canada
http://slidepdf.com/reader/full/2013-beyond-aid-in-canada 28/45
25
treatment requires that host governments treat foreign investment as favourably as
investment by their own nationals if the two are in like circumstances. Any sectors that
countries wish not to open need to be identified in negative lists. Developing countries
have objected to liberalization on the basis of negative lists since anticipating sectors
that need to be sheltered is difficult. Take the case of the Canada-South Africa FIPA.
Despite having been concluded after rounds of negotiations, South Africa chose not to
ratify the FIPA, citing pre-establishment of negative-list sectors as being a key issue
(Peterson 2006).
Figure 14. Canada’s foreign investment promotion and protection agreement map
by status of agreement
Sources: CIDP (2013), based on DFAIT (2012)
As far as Canada’s engagement with emerging economies is concerned, an added
dilemma is how rapidly the pattern of net investment has changed. As recently as 2000,
Canadian FDI in Brazil, China, and India far exceeded FDI from these countries in

7/18/2019 2013. Beyond Aid in Canada
http://slidepdf.com/reader/full/2013-beyond-aid-in-canada 29/45
26
Canada. But as Figure 15 below shows, in a period of just over a decade, FDI from
Brazil, China, and India in Canada has far surpassed Canadian FDI in these countries,
even though Canadian FDI has grown rapidly. By 2011, Brazilian investment in Canada
stood at $19 billion while Canadian investment in Brazil was around $10 billion, Chinese
investment in Canada was valued at $11 billion while Canadian investment in China
was only around $4.4 billion, and Indian investment in Canada was worth $4.4 billion
while Canadian investment in India was less than $1 billion. This pattern indicates that
Canada is a more significant investment destination for these countries than they are for
Canada.
Figure 15. Canada’s net FDI position with emerging economies
Source: CIDP (2013)
Note: Data are in stock basis. Series have been smoothened in the case of China,
where there were no data for 2004 and 2006.
This rapidly changing pattern has important implications for Canadian engagement.
Clearly it gives Canada added negotiating leverage because these countries are highly
interested in investing in Canada. However, the key issue is reciprocity. Expecting
fairer, freer, more transparent markets for Canadian investment abroad requires taking
reciprocity more seriously. Canada needs to become more open at home in order to
effectively promote Canadian investment abroad. Among its peers, Canada ranks
poorly on the OECD’s FDI Regulatory Restrictiveness Index, a measure of regulatory
restrictions on FDI. In fact, Canada ranks second worst when it comes to FDI

7/18/2019 2013. Beyond Aid in Canada
http://slidepdf.com/reader/full/2013-beyond-aid-in-canada 30/45
27
restrictiveness, ranking only above Japan (OECD 2011). Canada has significant
barriers to FDI in key sectors, including telecommunications, air transportation, banking,
and certain segments of the natural resources sector. Several recent examples can be
cited. In 2010, the Canadian government blocked BHP Billiton’s acquisition of Potash
Corporation of Saskatchewan. Notably, when Potash Corporation wanted to acquire
Israel Chemicals Ltd., the latter rejected the bid by the Canadian company. In 2012,
Canada delayed (but finally allowed) both China National Offshore Oil Corporation’s bid
for Nexen as well as Petronas’s bid for Progress Energy, citing the Investment Canada
Act’s “net benefit” standard. While the lack of transparency around the calculation of
“net benefit” has been a source of much debate in Canada, it has certainly added to
perceived FDI restrictiveness. Internal mergers both in the telecommunications and
banking sectors have also been rejected in the past. Further, Canada’s share of global
inward FDI has dropped significantly over the past few decades (The Conference Board
of Canada 2011a, 6 –7). On outward FDI, the Conference Board of Canada gives
Canada a grade of “C” in its index of FDI performance, ranking the country 10th among
16 comparator countries.15 Canada needs to reflect on its own policies before extolling
the benefits of investment liberalization abroad.
Migration and remittances
The final area we evaluate from a policy perspective is migration and remittances.
Developing countries received over $400 billion in migrant remittances in 2012, which
implies that remittances are more than three times the size of aid flows (World Bank
2013a). Our estimates for countries for which comparable data were available show thatremittance outflows from Canada to developing countries were about five times larger
than aid flows. Remittances from Canada are larger than aid to some of Canada’s
largest aid recipients, including Pakistan, Bangladesh, Colombia, Peru, Kenya, Nigeria,
and Vietnam. The pattern of remittance outflows from Canada is different from trade
and investment in that a significant share goes to developing countries. Total remittance
outflows from Canada in 2011 are estimated at over $23 billion. A large share—$14.7
billion—went to developing countries, with the majority going to middle-income
countries.
What are the challenges when it comes to migrant remittances? A key issue is the cost
of sending remittances. Globally, remitting money costs an average of 9 per cent of the
amount sent. This “spread” is made up of both transaction fees levied by financial
institutions as well as the exchange rate spread. It is estimated that a reduction in
remittance costs could save migrants up to $16 billion a year (World Bank 2013a). The
average cost of remitting money from Canada across a range of corridors is around

7/18/2019 2013. Beyond Aid in Canada
http://slidepdf.com/reader/full/2013-beyond-aid-in-canada 31/45
28
11.1 per cent, which is higher than the average for other developed countries and the
Group of Eight. In recent years this cost has decreased from a high of 14 per cent in
2008, but it remains high by international standards. Moreover, the costs range from as
high as 14 per cent for the Canada –Rwanda corridor to a low of 6.8 per cent for the
Canada –Philippines corridor (World Bank 2013a; CIDP 2013). Even in corridors where
the cost to remit from Canada is relatively low, such as the Philippines, the cost to remit
from other countries is far lower (for example, the cost for the United Arab Emirates –
Philippines corridor is only 3.2 per cent). Such costs are inversely correlated with the
level of competition among remittance service providers, which in turn depends on the
volume or size of the market. In general, average costs are driven up by banks, while
the costs charged by money transfer operators are far lower.
Figure 16. Remittances from Canada to top 20 developing countries
Source: CIDP (2013), based on World Bank Bilateral Remittance Matrix (2011)

7/18/2019 2013. Beyond Aid in Canada
http://slidepdf.com/reader/full/2013-beyond-aid-in-canada 32/45
29
Recognizing high remittance costs as an issue, donors signed on to the 5x5 initiative at
the L’Aquila Group of Eight summit in 2009. The 5x5 initiative involves a promise to
reduce remittance costs by five percentage points in five years. It should be noted that
since that summit remittance costs have fluctuated in both directions but the general
trend is downward. Whether this trend is due to any special donor effort or simply a
response to market forces (the volume of remittances has increased substantially) is a
question that has not been sufficiently addressed. Yet, donors seem to have latched
onto the idea of reducing remittance costs, largely due to highly effective campaigning
by the World Bank. The most recent example is a tender launched by CIDA to solicit
innovative financing mechanisms to reduce these costs. This response demonstrates
the nearsightedness that donors can have, ignoring other, arguably harder but more
important policy dilemmas.
High transactions costs limit remittances from achieving greater development impact,
but an important question is whether they represent a market failure that donors can
correct. For instance, it is more than likely that, in time, a combination of technological
change, increased competition, and volume growth in the remittance market will drive
down costs dramatically. Take for example a new money transfer service being
launched by Google. When launched, the integrated Google Wallet – and Gmail-based
service will let users send money to each other for free or send money using a credit or
debit card at a flat 2.9 per cent rate, with transaction limits as high as $10,000 (Solon
2013). While such services already exist at the domestic level in many countries, their
potential to expand to allow cross-border transactions remains untapped.16 A nearly free
money transfer service, coupled with the rapid rate of penetration of fixed and mobileinternet services, including in Africa, could be a game changer for remittance transfer.
Yet, there are more intractable policy issues. Ultimately remittances are a function of
immigration and how well new immigrants fare in the Canadian labour market. Despite
the scale of immigration to Canada and the important roles that immigrants play in the
Canadian economy, there is remarkably little publicly available research on migrants’
remittance behaviour.17 The only official study we found estimates that about 30 per
cent of immigrants sent money, an average of $1,450 per year, to their home country
during the first two to four years after their arrival to Canada (Houle and Schellenberg2008). The study also found a strong correlation between remittance behaviour and
financial characteristics. The probability of remitting and amount remitted increases as
family income increases. This provokes the question: how are immigrants’ incomes
faring in Canada? This is when more intractable policy dilemmas begin to appear.
Research suggests that the incomes of immigrants are taking much longer to catch up
to those of Canadian-born workers, if they catch up at all. In the 1970s, new immigrants

7/18/2019 2013. Beyond Aid in Canada
http://slidepdf.com/reader/full/2013-beyond-aid-in-canada 33/45
30
earned 80 –90 per cent of what comparably skilled Canadian-born workers earned. By
2006 the figure had fallen to 60 per cent. The proportion of recent immigrants (in
Canada for less than five years) living in poverty, as defined by the Statistics Canada
low-income cut-off, increased from 24.6 per cent in 1980 to a high of 47 per cent in
1995 and was around 36 per cent by 2005. Remarkably, this increase in poverty took
place during a period when non-immigrant poverty rates were falling (Friesen 2013;
Dungan, Fang, and Gunderson 2012).
These trends have provoked a substantial debate in Canada about the fiscal costs of
immigration. Partisan studies, such as those by the Fraser Institute for example, argue
that immigrants impose a huge fiscal burden by consuming a lot more in services than
contributing in taxes (Grubel and Grady 2011). Others have shown the costs to be a lot
lower (Friesen 2013). However, even balanced projections, which show for instance that
an increase of 100,000 immigrants to Canada under the current model would result in a
2.3 per cent increase in real gross domestic product over 10 years, are forced to
conclude that the net impact may well be negative since the population would have
increased by 2.6 per cent, so gross domestic product per capita could well decline
(Dungan, Fang, and Gunderson 2012). The reaction to this has been to recommend
that new immigration be limited to, or at least focused on, economic class migrants.
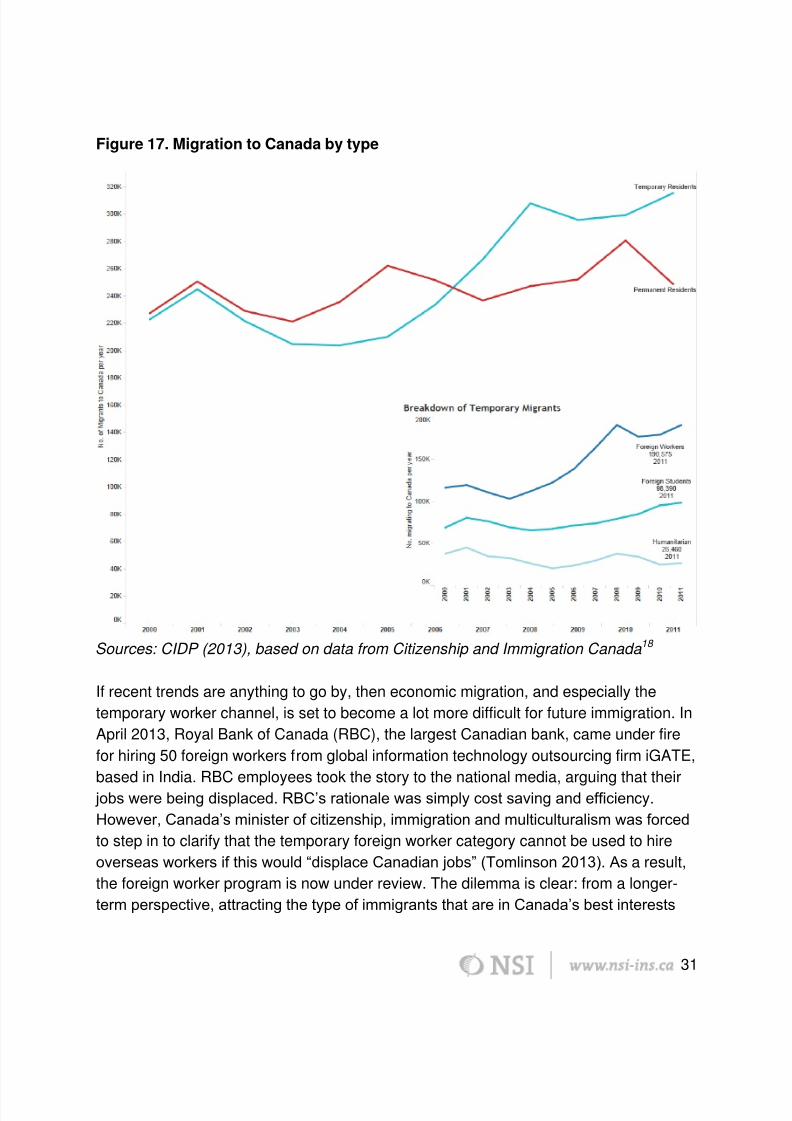
This presents a different set of challenges. Recent trends point to changes in Canada’s
immigration profile. More temporary migrants now enter Canada each year than
permanent residents. As Figure 17 shows, this rapid growth in temporary migration is
driven by the sharp increase in temporary foreign workers. These workers could beformer foreign students, potential new immigrants, or on intra-corporate transfers.
7/18/2019 2013. Beyond Aid in Canada
http://slidepdf.com/reader/full/2013-beyond-aid-in-canada 34/45
31
Figure 17. Migration to Canada by type
Sources: CIDP (2013), based on data from Citizenship and Immigration Canada18
If recent trends are anything to go by, then economic migration, and especially the
temporary worker channel, is set to become a lot more difficult for future immigration. In
April 2013, Royal Bank of Canada (RBC), the largest Canadian bank, came under fire
for hiring 50 foreign workers from global information technology outsourcing firm iGATE,
based in India. RBC employees took the story to the national media, arguing that their
jobs were being displaced. RBC’s rationale was simply cost saving and efficiency.
However, Canada’s minister of citizenship, immigration and multiculturalism was forced
to step in to clarify that the temporary foreign worker category cannot be used to hire
overseas workers if this would “displace Canadian jobs” (Tomlinson 2013). As a result,
the foreign worker program is now under review. The dilemma is clear: from a longer-
term perspective, attracting the type of immigrants that are in Canada’s best interests

7/18/2019 2013. Beyond Aid in Canada
http://slidepdf.com/reader/full/2013-beyond-aid-in-canada 35/45
32
may well go against near-term social and political considerations. Not addressing the
issue implies not only that the fiscal pressure of immigration on Canada increases, but
also that remittance outflows from Canada to developing countries fail to reach their full
developmental potential.
Conclusion
This report sought to contribute to the “beyond aid” discussion in two ways. First, we
systematically compared the scale of aid flows to trade (imports into Canada from
developing countries), investment, and migrant remittances at a disaggregated level.
Such comparisons are important to get a fuller picture of Canada’s development
footprint and allow a more nuanced discussion about policy coherence. Second, we
highlighted policy dilemmas in achieving greater development impact through
complementary policies in domains beyond aid, specifically trade, investment, andimmigration policy. Many of these dilemmas have received little debate, particularly in
the Canadian context.
The analysis presented in this report, based on a cross-section of recent data on aid,
trade, investment, and migrant remittance flows between Canada and developing
countries, shows that at the aggregate level, for the 156 countries included, Canadian
foreign aid is far smaller than FDI from Canada and remittances, and is a fraction of the
value of Canadian imports from these countries.
However, the pattern changes when we look at a subset of the poorest countries (LDCs
and LICs). Here foreign aid is far more significant, but somewhat surprisingly the value
of Canadian imports is more than twice that of Canadian aid. Canada provides some of
the most generous preferential trade access arrangements for the poorest countries,
and imports into Canada from these countries have grown rapidly over time. But the
majority of Canadian imports from LDCs and LICs are oil, petroleum, and mineral
products (i.e., low-value-added natural resources and not high-employment-generating
manufacturing exports). That said, there are exceptions. Bangladesh and Cambodia, for
instance, have benefited greatly from preferential access to Canadian textile and
garment markets in particular. Still, as we argued with reference to the recent collapse
of a large garment factory in Bangladesh, offering open-ended preferential treatment
without adequate attention to labour, working, and environmental conditions in the
poorest countries can be highly problematic.

7/18/2019 2013. Beyond Aid in Canada
http://slidepdf.com/reader/full/2013-beyond-aid-in-canada 36/45
33
Much greater nuance is needed in the ongoing discussions on the need to look beyond
aid. While it is true that aid makes up a small and even declining share of Canada’s
development footprint in many developing countries, including many of the poorest,
foreign aid still trumps other flows to Canada’s main development partners, especially
those in Africa.
In many rapidly emerging developing economies Canadian aid is already very small
compared to other flows and other interests. Engaging more coherently with these
countries requires further unpacking how trade, investment, and other interests can be
pursued in a way that is consistent with the development objectives of both Canada and
its partner countries. Rationalizing aid allocation may require much greater focus on a
subset of like-minded countries where Canadian aid can play a meaningful role in
achieving shared goals.
On investment, while Canadian FDI has nearly doubled in developing countries over the
course of a decade, such investment makes up an insignificant share of Canada’s total
FDI. Canada’s FIPA map has grown much more aggressively than its FTA map. While
the push to expand the number of Canadian FTAs and FIPAs is both welcome and
necessary, it is not without controversy. Key FIPAs concluded recently have been
criticized for being secretive and Canada has had difficulties concluding FIPAs with
developing countries. Meanwhile, Canada’s net investment position with key emerging
economies such as China, Brazil, and India has changed dramatically in a short period
of time. Canada is now a more important investment destination for these countries than
they are for Canada, which implies Canada’s openness as an investment destinationwill become an increasingly important issue. Notably, Canada ranks poorly on most
measures of FDI regulatory restrictiveness.
Migrant remittance outflows are a major part of Canada’s development footprint beyond
aid. In order to leverage development impact donors have so far focused on reducing
remittance costs. While this is important, there are more intractable policy dilemmas
when it comes to migration and remittances. Remittance outflows are linked to new
immigrants’ family incomes. Recent research shows that the incomes of new
immigrants are catching up with those of comparable Canadian-born workers at theirslowest pace in history. Poverty among recent immigrants has risen rapidly even as
poverty in Canada has been falling generally. The fiscal pressure created by new
immigration has increased. The often-suggested response to this is to focus on
economic migration, but this response creates serious short-term dilemmas such as
displacing Canadian workers, which is problematic.

7/18/2019 2013. Beyond Aid in Canada
http://slidepdf.com/reader/full/2013-beyond-aid-in-canada 37/45
34
We are forced to conclude with a note about data quality and transparency. Canada has
made important strides and vastly improved both the timeliness and quality of data (see
Bhushan and Higgins 2011). However, much more needs to and can be done to
improve both the quality and transparency of data in two key areas: bilateral remittance
outflows and FDI. There is little publicly available research or official information on
migrant remittance outflows from Canada. This is surprising for a country that boasts
one of the highest migration intensity rates in the world. It is also despite the fact that
key departments like Statistics Canada and Citizenship and Immigration Canada are
partners in the Treasury Board of Canada Secretariat’s Open Government initiative.
While there are understandable privacy concerns, much more data and analysis can
and should be made publicly available. Such information may go a long way in helping
researchers provide a more accurate picture of Canada’s development footprint beyond
aid. Similarly, while FDI data is published on an annual basis, at the country level only
stock figures are made publicly available and data for a large number of countries are
kept confidential. In our research, we also came across discrepancies in FDI data found
in official databases and reported in official publications (see Appendix; see also DFAIT
2012), which necessitates change.
7/18/2019 2013. Beyond Aid in Canada
http://slidepdf.com/reader/full/2013-beyond-aid-in-canada 38/45
35
Appendix: Data and Data Sources
All data used in this paper are freely available from NSI’s CIDP data and analytics
platform (www.cispnsi.ca). The analysis presented is based on a cross-section dataset
for the year 2012. In the case of remittances, data are only available for 2011. Othercontextual data below from the OECD and the Foundation Center (not our focus but
provided for reference) may be from 2011, since this is the latest year available, and is
specified where this is the case.
General features of the dataset
The cross-section dataset constructed for this analysis gave us a list o f 172 “rows” of
data, with four data points per row—aid, imports, FDI outflow, and migrant remittances.
In all, the dataset covers 156 countries. The difference between the two numbers (172rows and 156 countries) arises from data covering aid funding at the regional or multi-
regional level or otherwise “un-coded” at the country level. The resulting country list
comprises all countries to which Canada provided foreign aid in 2012. The datasets on
trade (imports into Canada), FDI outflow, and migrant remittances were joined with this
country list. The country list is based on the OECD-DAC list of ODA-eligible countries.
To this I applied the ISO-2 country classification standard (the same used by the OECD-
DAC) for both geographic and income-level classification. The list breaks down as
follows by geography:
59 country and regional observations in Africa
42 in Asia
39 in the Americas
16 in Europe
15 in Oceania
There is one additional category that is “unspecified” (by geography). The same list
breaks down as follows by income-level classification:
54 upper-middle income
48 LDCs
40 lower-middle-income
5 other low-income
Four more advanced developing countries

7/18/2019 2013. Beyond Aid in Canada
http://slidepdf.com/reader/full/2013-beyond-aid-in-canada 39/45
36
16 un-coded (these cover regional funding going to countries with varying income
levels)
Five high-income or developed countries
Foreign aid, trade, investment and remittances datasources
The cross-section dataset comprises data on foreign aid from Canada to developing
countries. This dataset draws on three primary sources linked to the CIDP: annual CIDA
statistical reports on country spending (the full dataset and code sheets are made
available to NSI directly by CIDA), CIDA’s historical project dataset, and CIDA’s project
browser dataset. These data are in Canadian dollars and on a fiscal year basis (2011 –
12).
The cross-section also includes data on bilateral goods trade. Data covered here are on
imports into Canada. Since imports into Canada entail a monetary transfer to the
exporting partner, only imports are included in the comparison. Data are drawn from
Industry Canada’s “Trade Data Online (TDO)” (see Industry Canada 2013). The data
included cover the year 2012 and are in Canadian dollars.
Data on FDI are also included in this analysis. Only data on Canadian direct investment
abroad are included as these are the portion that entail flows from Canada to partner
countries. FDI data are drawn from Statistics Canada’s CANSIM database (seeStatistics Canada 2013a). Specifically, CANSIM Table 376-0051 is used because it
provides disaggregated information on the stock of Canadian FDI. There are two issues
with these data. First, it is on stock basis, whereas other data are flows in a particular
year. An alternate CANSIM table could be used, but there is insufficient
disaggregation.19 However, since the FDI stock data correct for inflation and currency
fluctuations, following established convention I use year-on-year change in stock to
estimate FDI flows (Statistics Canada 2013). The second issue is that FDI data are
subject to confidentiality considerations. For instance, when one or two firms account for
the entire stock of Canadian FDI in a partner country, these data are kept confidential.20
However, this does not affect regional or other aggregates and the total values used
here reflect actual totals.21 FDI data used here are for 2012 and are in Canadian dollars.
Migrant remittance data are included but are also problematic. Despite significant efforts
to improve remittances data, led by organizations like the World Bank and the Center
for Global Development, gaps remain. Data used here are from the World Bank’s

7/18/2019 2013. Beyond Aid in Canada
http://slidepdf.com/reader/full/2013-beyond-aid-in-canada 40/45
37
Bilateral Remittance Matrix (see World Bank 2011). There are two important issues with
this source. First, the data are in US dollars. Second, the only year for which data are
available is 2011. Given the closeness to parity between Canadian and US dollars in
the given year, the currency is not converted. Since data are only available for 2011, the
comparison is rough though still useful. It should also be noted that the methodology
employed by the World Bank in this particular dataset is based on assumptions using
migrant stock, host country incomes, and origin country incomes. As such, this
approach does not amount to actually calculating flows between countries, and is
different from even the World Bank’s other datasets such as from the Migration and
Remittances Factbook, which relies on data from the International Monetary Fund,
national statistical agencies, and World Bank country offices.22 However, the Bilateral
Remittance Matrix is the only source that provides remittance estimates at a sufficiently
disaggregated level and is therefore the best data source available for this analysis.
About the Canadian International Development Platform
The Canadian International Development Platform
(CIDP) is NSI’s data and analytics platform aimed at
engaging Canadians on international development,
raising the profile of international development within
Canadian foreign policy, and elevating the quality of
debate by grounding discussion in the best evidence.
To learn more visit: http://cidpnsi.ca.
The CIDP is led by Aniket Bhushan:

7/18/2019 2013. Beyond Aid in Canada
http://slidepdf.com/reader/full/2013-beyond-aid-in-canada 41/45
38
Endnotes1 A possible exception is the Commitment to Development Index (see CGD 2013). The index assigns points in seven policyareas: aid (both quantity as a share of income and quality), trade, investment, migration, environment, security, and
technology. Within each component, a country receives points for policies and actions that support the poor. The sevencomponents are averaged for a final score. However, the index is not fit for this paper’s purposes because I am primarilyinterested in comparing the scale of flows, not assessment scores. Furthermore, I am interested in being able todisaggregate my analysis down to the country pair level, which the Commitment to Development Index is not conducive to.2 It is worth pointing out here that Sumner et al. may be overstating this statistical artifact. While it is correct that severalcountries have “graduated” out of LIC status, the trend at the global level is driven by just six countries, which Sumner clubstogether as “middle-income”: India, China, Nigeria, Indonesia, Pakistan, and the Philippines. There are vast differencesbetween these countries and clubbing them together as “middle-income” makes no sense. In fact, there is no suchinternationally accepted category. Even the World Bank recognizes the range is too broad (above $1,025 GNI per capitaimplies a country is out of LIC status, and high income only begins at $12,475) and therefore splits countries into lower-middle-income ($1,025 to $4,035) and upper-middle-income ($4,035 to $12,475) statuses. By taking this internationallyaccepted standard, all of Sumner’s graduates—with the exception of China—would be lower-middle income. Yet, there arebig differences even among these countries. Pakistan and Nigeria just barely make it past the LIC cut-off. The Philippines’GNI per capita is approximately twice that of Pakistan. Indonesia’s is about twice that of India’s. And China’s is more thantwice that of the Philippines. So it is questionable what is gained by clubbing these varied countries together as “middle-income.” If the experience of Ghana, which catapulted itself instantly from LIC to lower -middle-income status when it
updated its national income accounting standards, is anything to go by, then it is at least worth taking a harder look at thefactors behind these trends rather than accepting them at face value (Bhushan 2012). Others have argued that thisdevelopment is a passing phase and popularizing such statistical artifacts seeks to distract attention from longer-term trendswhich show that global poverty will become more concentrated in the poorest fragile states, mostly in sub-Saharan Africa(Kharas and Rogerson 2012).3 Figures are in US$ unless specified. Most figures in the data section are in CAD$, with the exception of remittances asnoted in relevant sections.4 IDA is funded largely by contributions from the governments of its richer member countries. Donors meet every three yearsto replenish IDA funds and review IDA’s policies. The most recent replenishment of IDA’s resources, the 16th, was finalizedin December 2010. This resulted in a record replenishment size of $49.3 billion to finance projects over a three-year period,which ends on June 30, 2014. Donors reviewed progress at the mid-term review in fall 2012 and are currently discussing thefuture of IDA as they get closer to the 17th replenishment.5 To enable comparison, data for the reference year 2011 are used since more recent data are unavailable for mostcountries including the BRICS and others outside the DAC. Data for Brazil, however, are for 2009. Figures should beinterpreted with caution because non-DAC donors are not restricted to the OECD-DAC definition of aid. Data on foundations
come from the Foundation Center database (see Foundation Center 2013).6 The Foundation Center indicates that the total amount of grants given by the 50 largest US foundations outside the UnitedStates in 2011 was approximately $3.26 billion. Among foundations, the Bill & Melinda Gates Foundation is notable becauseit is larger than some DAC donors, all the BRICS donors, and most non-DAC donors (Foundation Center 2013).7 LDCs and other LICs received 36 per cent of total Canadian aid in 2012. A significant share of aid (41 per cent) is notclassifiable by income group. Of the remainder that is allocable by income level, LDCs and other LICs received 61 per cent.8 We did not find any FDI flow for any of these countries for 2012. Part of the reason for this is the extent to which FDI datais held confidential.9 We have noticed large discrepancies in FDI data, especially as they relate to African countries, that may affect regionalaggregates. For instance, the stock of Canadian FDI in South Africa—the largest Canadian FDI recipient in Africa—in 2011is listed at $1,438 million, both in the Department of Foreign Affairs and International Trade Canada’s recent annual tradeand investment report (see DFAIT 2012) as well as in the CIDP database, which draws on Statistics Canada’s CANSIMdatabase. However, when accessed in April 2013 the corresponding figure for South Africa was changed in CANSIM to$3,204 million. Yet, the regional aggregate in both sources remain the same at $3,104 million. For this to be plausible itwould mean that the stock of Canadian FDI in the rest of Africa by 2011 fell by $100 million. Keeping Canadian FDI to SouthAfrica at $1,438 at the country level, we get the quoted figure of $1,835 million for FDI flow to Africa in 2012. Taking the
regional aggregate now reported in CANSIM, the total FDI flow to Africa in 2012 would be only $496 million. Therefore thepoint holds either way: FDI flows to Africa are still probably a lot smaller than aid, trade, and other flows.10 Eritrea’s gross domestic product per capita is less than $500, making it one of the poorest countries in the world. Eritrearanks 181st out of 186 countries on the United Nations’ annual Human Development Index for 2012, while Mongolia ranks108th.11 The criteria applied is that GPT treatment is removed if a country is classified as high-income or upper-middle income intwo consecutive years, or if its share of world exports is equal to or greater than 1 per cent in two consecutive years. Twocountries—Equatorial Guinea and Maldives—would also lose Least Developed Country Tariff status.

7/18/2019 2013. Beyond Aid in Canada
http://slidepdf.com/reader/full/2013-beyond-aid-in-canada 42/45
39
12 It should be noted that the strengths behind Canada’s ranking are low tariffs on non-agricultural commodities and sugar.High tariffs on most agricultural commodities and low level of manufacturing imports from poor countries are highlighted asweaknesses (CGD 2013).13 An alternative is the African Growth Opportunity Act (AGOA), brought into law by the United States in 2000. AGOAprovides duty-free, quota-free access for select countries, and in this way positively discriminates in favour of select sub-Saharan African countries, even over other poor countries. While AGOA has led to the development of textiles, apparel, and
horticulture export sectors in small countries, around 95 per cent of AGOA-related imports into the United States arepetroleum and mineral products from Nigeria, Angola, and South Africa. Moreover, AGOA has made certain small countriesentirely dependent on preferential access. In order to maintain leverage, the United States periodically adjusts AGOAeligibility based on local political environment.14 For all practical purposes, NAFTA’s investment provisions cover most of the ground covered in FIPAs. As such, one couldargue investment agreements are also effectively in place with the United States and Mexico.15 An alternative and in this case inconsistent measure of investment performance is the Center for Global Development’sCommitment to Development Index’s investment performance score, where Canada ranks fourth out of 27 donor countries.The reasons cited are that Canada employs double taxation prevention and is particularly active in the Extractive IndustriesTransparency Initiative and the Kimberley Process. A weakness is that political risk insurance is provided to inefficientimport-substituting projects (CGD 2013).16 Options like these will not do much to overcome exchange rate spreads however, and financial service providers maysimply pass costs (reducing or eliminating fees but increasing ex-rate spreads) as money transfer operators do today.17 We found only one official publically available study by Statistics Canada on the topic (see Houle and Schellenberg 2008).The authors of the study were contacted for more information and other similar surveys, but we were told that there was nofurther public information on the topic. We should also add that while there are at least remittance outflow estimates in the
World Bank’s Migration and Remittances Factbook for most countries, there was no data on Canada. The data we used inthis report comes from the World Bank’s Bilateral Remittance Matrix which uses a different methodology (a comparison canbe found on the CIDP’s Aid vs. Remittances dashboard).18 Data were provided directly to author via information request to Citizenship and Immigration Canada.19 The author contacted Statistics Canada about FDI flow data and was informed that the agency is working on a plan tomake its yearly survey of firms’ data publicly available, which would provide FDI flow data, but that the earliest release of thisdata would be in 2015.20 For example, in 2011 data were kept confidential for 84 out of 153 countries. Despite requests, this information was notprovided.21 An alternative data source could be the OECD’s FDI statistics database. While this database is useful in providing contextfor where Canada stands among other countries, at the bilateral pairing level it faces the same confidentiality restrictions.22 The World Bank’s Bilateral Remittance Matrix data (see World Bank 2013c) are based on assumptions using migrantstock, host country incomes, and origin country incomes. I have found large discrepancies between these and other datafrom the same source. For instance, while the Bilateral Remittance Matrix estimates global remittances to be around $500billion for 2011, the Bank’s own remittance outflow database (which relies on data from the International Monetary Fund,national statistical agencies, and the Bank’s country offices) reports the figure to be around $337 billion for the same year .The discrepancy may be explained by the fact that some countries included in the assumptions-based Bilateral RemittanceMatrix are not covered in the remittance outflow database, which relies on national and international sources. Thereforethese data are useful in at least providing a sense of the scales involved, but they should be interpreted with caution.

7/18/2019 2013. Beyond Aid in Canada
http://slidepdf.com/reader/full/2013-beyond-aid-in-canada 43/45
40
ReferencesAncharaz, Vinaye, and Anne-Katrin Pfister. 2013. “Trade as a Compass for LDCs Structural
Transformation.” Bridges Africa 2 (2): 7 –9.Bhushan, Aniket. 2012. “Big Data.” In Frontiers in Development , edited by Rajiv Shah and Steven
Radelet, 152 –56. Washington, DC: United States Agency for International Development.———. 2013. Foreign Aid and Crises: Examining 2012 Aid Data. Ottawa: The North-South Institute.Bhushan, Aniket, and Joe Ingram. 2013. “CIDA merger should get Canada thinking bigger on
development.” Ottawa Citizen, April 5, 2013.http://www.ottawacitizen.com/opinion/oped/CIDA+merger+should+Canada+thinking+bigger+development/8202750/story.html
Bhushan, Aniket, and Kate Higgins. 2011. “Using the New Canadian International DevelopmentPlatform to Enhance Understanding of Multilateral Development Cooperation.” In CanadianDevelopment Report 2011; Global Challenges: Multilateral Solutions, edited by Hany Besada andShannon Kindornay, 117 –43. Ottawa: The North South Institute.
Calleja, Rachael, and Aniket Bhushan. 2013. “Aid Innovation: Motivating Reforms from the Outside?”
In International Development in a Changing World: Canadian and Global Perspectives onGrowth, Aid, and Global Governance, edited by Kate Higgins, 35 –36. Ottawa: The North-SouthInstitute.
Canada Gazette. 2012. “Proposed Amendments to Canada’s General Preferential Tariff.” Vol. 146,No. 51, December 22. http://www.gazette.gc.ca/rp-pr/p1/2012/2012-12-22/html/notice-avis-eng.html.
CBSA (Canada Border Services Agency). 2003. “An Introductory Guide to the Market AccessInitiative for the Least Developed Country and the Least Developed Country Tariff.” Last modifiedMarch 24, 2003. http://www.cbsa-asfc.gc.ca/publications/pub/rc4322-eng.html.
CGD (Center for Global Development). 2013. “Commitment to Development Index.”http://www.cgdev.org/initiative/commitment-development-index.
CIDP (Canadian International Development Platform). 2013. Accessed March 2013.http://cidpnsi.ca.
Conference Board of Canada, The. 2011a. How Canada Performs: A Report Card on Canada.Ottawa: The Conference Board of Canada.
———. 2011b. “How Canada Performs: Outward Foreign Direct Investment (FDI) PerformanceIndex.” Accessed March 2013. http://www.conferenceboard.ca/hcp/details/economy/outward-fdi-performance.aspx.
DFAIT (Department of Foreign Affairs and International Trade Canada). 2012. Canada’s State ofTrade: Trade and Investment Update 2012 . Ottawa: Public Works and Government ServicesCanada.
Dungan, Peter, Tony Fang, and Morley Gunderson. 2012. “Macroeconomic Impacts of CanadianImmigration: Results from a Macro-Model.” Working Paper No. 106, Canadian Labour Market andSkills Researcher Network.
Elliott, Kimberly. 2013. “How to Avoid Another Bangladesh Factory Disaster.” Center for GlobalDevelopment, Global Prosperity Wonkcast, 23:30. http://www.cgdev.org//blog/how-avoid-another-bangladesh-factory-disaster-kimberly-elliott.
Fengler, Wolfgang. 2013. “Has Africa Outgrown Aid?” Africa Can . . . End Poverty (blog), WorldBank, January 29. http://blogs.worldbank.org/africacan/has-africa-outgrown-aid.
Foundation Center. 2013. “Foundation Directory Online.” Accessed April 2013.http://foundationcenter.org.
Friesen, Joe. 2013. “How Immigrants Affect the Economy: Weighing the Benefits and Costs.” Globeand Mail , last updated January 10, 2013. http://www.theglobeandmail.com/news/national/time-to-lead/how-immigrants-affect-the-economy-weighing-the-benefits-and-costs/article4106049.

7/18/2019 2013. Beyond Aid in Canada
http://slidepdf.com/reader/full/2013-beyond-aid-in-canada 44/45
41
Future of IDA Working Group, The. 2012. Soft Lending without Poor Countries: Recommendationsfor a New IDA. Washington, DC: Center for Global Development.
Glennie, Jonathan, and Annalisa Prizzon. 2012. From High to Low Aid: A Proposal to ClassifyCountries by Aid Receipt . London: Overseas Development Institute.
Grubel, Herbert, and Patrick Grady. 2011. Immigration and the Canadian Welfare State 2011.
Vancouver: Fraser Institute.Holmes, Kieran. 2013. “Tax Reform as a Prerequisite for Development Assistance.” Global
Development Professionals Network , Guardian, April 18. http://www.guardian.co.uk/global-development-professionals-network/2013/apr/18/uk-aid-pakistan-tax-reform.
Houle, René, and Grant Schellenberg. 2008. Remittance Behaviours Among Recent Immigrants inCanada. Ottawa: Statistics Canada.
Industry Canada. “Trade Data Online (TDO).” Accessed Feb to March 2013.http://www.ic.gc.ca/eic/site/tdo-dcd.nsf/eng/Home.
IDA (International Development Association). 2013. Follow-Up on IDA’s Graduation Policy andProposal for Transitional Support for Graduating Countries. Washington, DC: IDA.
IMF (International Monetary Fund). 2013. “World Economic Outlook Database.” April 2013 Edition.Accessed April 2013. http://www.imf.org/external/pubs/ft/weo/2013/01/weodata/index.aspx.
ILO (International Labour Office). 2013. “Better Work.” http://betterwork.org/global.
Kaufmann, Daniel, Homi Kharas, and Veronika Penciakova. 2012/2013. “Development, Aid andGovernance Indicators (DAGI).” http://www.brookings.edu/research/interactives/development-aid-governance-indicators.
Kharas, Homi, and Andrew Rogerson. 2012. Horizon 2025: Creative Destruction in the Aid Industry .London: Overseas Development Institute.
Lane, Chris. 2013. “Parliament Rejects NDP Motion to Stop FIPA.” Vancouver Observer , April 22.http://www.vancouverobserver.com/tags/china-canada-fipa/parliament-votes-against-ndp-motion-stop-fipa.
Mulholland, Hélène, and Jason Burke. 2012. “UK to Halt India Aid and Focus on Trade.” Guardian,November 9. http://www.guardian.co.uk/global-development/2012/nov/09/uk-india-aid-trade.
OECD (Organisation for Economic Co-operation and Development). 2011. “FDI RegulatoryRestrictiveness Index.” http://dx.doi.org/10.1787/888932707515.
———. 2013. “OECD.Stat Extracts.” Accessed Feb to May 2013. http://stats.oecd.org. Peterson, Luke Eric. 2006. Evaluating Canada’s 2004 Model Foreign Investment Protection Agreement in Light of Civil Society Concerns. Ottawa: Canadian Council for International Co-operation.
Ryder, Hannah. 2013. “The Rise of Development Effectiveness.” Global Development ProfessionalsNetwork , Guardian, March 13. http://www.guardian.co.uk/global-development-professionals-network/2013/mar/13/development-effectiveness-dfid-aid-india.
Solon, Olivia. 2013. “Google Lets You Email Money to Friends Through Gmail.” Wired UK , May 17.http://www.wired.co.uk/news/archive/2013-05/17/google-wallet-payments.
Statistics Canada. 2013a. “CANSIM.” Accessed October 2012 to May 2013.http://www5.statcan.gc.ca/cansim/home-accueil?lang=eng.
———. 2013b. “Foreign Direct Investment, 2012.” The Daily , May 9. http://www.statcan.gc.ca/daily-quotidien/130509/dq130509a-eng.htm.
Sumner, Andy. 2011. The New Bottom Billion: What If Most of the World’s Poor Live in Middle -Income Countries? Washington, DC: Center for Global Development.
Tomlinson, Kathy. 2013. “RBC Replaces Canadian Staff With Foreign Workers.” CBC News, April 6.http://www.cbc.ca/news/canada/british-columbia/story/2013/04/05/bc-rbc-foreign-workers.html.
Troilo, Pete. 2013. “Looking to 2025, World Bank Soft Loaning Could Shift Course.” Devex , April 22.https://www.devex.com/en/news/looking-to-2025-world-bank-soft-loaning-could-shift-course/80759.

7/18/2019 2013. Beyond Aid in Canada
http://slidepdf.com/reader/full/2013-beyond-aid-in-canada 45/45
Urbina, Ian. 2013. “Unions Press to End Special Trade Status for Bangladesh.” New York Times,May 30. http://www.nytimes.com/2013/05/31/business/us-pressure-rises-to-end-bangladesh-trade-status.html?pagewanted=all&_r=0.
World Bank. 2011. “Bilateral Remittance Matrix 2011.” http://siteresources.worldbank.org/INTPROSPECTS/Resources/334934-
1110315015165/Bilateral_Remittance_Matrix_2011_Final.xlsx. ———. 2013a. Migration and Development Brief 20. April 19. Washington, DC: World Bank.———. 2013b. “PovcalNet.” Accessed April 2013.
http://iresearch.worldbank.org/PovcalNet/index.htm.———.2013c. “Remittance Prices Worldwide.” Accessed March 2013.
http://remittanceprices.worldbank.org. WTO (World Trade Organization). 2012. International Trade Statistics 2012 . Geneva: WTO.


