82
2013 INFLATION REPORT / III
| Date post: | 02-May-2018 |
| Category: |
Documents |
| Upload: | nguyenhanh |
| View: | 218 times |
| Download: | 4 times |

20
13INFLATION REPORT / III


INFLATION REPORT / III


3
Czech National Bank / Inflation Report III/2013
In 1998, the Czech National Bank switched to inflation targeting. In the inflation targeting regime, the central bank’s communication with the public plays a significant role. One of the core elements of this communication is the publishing of quarterly Inflation Reports. Section II of the Inflation Report contains a description of the Czech National Bank’s new quarterly macroeconomic forecast, and section III presents its assessment of past economic and monetary developments.
The inflation forecast and the assumptions underlying it are published with the aim of making monetary policy as transparent, comprehensible, predictable and therefore credible as possible. The Czech National Bank is convinced that credible monetary policy effectively influences inflation expectations and minimises the costs of maintaining price stability. Maintaining price stability is the Czech National Bank’s primary objective.
The forecast for the Czech economy is drawn up by the CNB’s Monetary and Statistics Department. The forecast for inflation at the “monetary policy horizon” (about 12–18 months ahead) is of greatest relevance to the decision-making on the current interest rate settings.
The forecast is the key, but not the only, input to the Bank Board’s decision-making. At its meetings during the quarter, the Bank Board discusses the current forecast and the balance of risks and uncertainties surrounding it. The arrival of new information since the forecast was drawn up and the possibility of asymmetric assessment of the risks of the forecast and divergent views of some board members on the development of the external environment or the linkages between the various indicators within the Czech economy mean that the Bank Board’s final decision need not correspond to the message of the forecast.
This Inflation Report was approved by the CNB Bank Board on 8 August 2013 and contains the information available as of 19 July 2013. Unless stated otherwise, the sources of the data contained in this Inflation Report are the CZSO or the CNB. All the Inflation Reports published to date are available on the CNB website. Underlying data for the tables and charts presented in the text of this Inflation Report, minutes of Bank Board meetings, and time series of selected economic and monetary indicators (available in the ARAD database) are published at the same internet address.
FOREWORD

5
Czech National Bank / Inflation Report III/2013
CONTENTS
FOREWORD 3CONTENTS 5I. SUMMARY 6II. THEFORECAST,ITSCHANGESANDRISKS 8 II.1 Externalassumptionsoftheforecast 8 II.2 Theforecast 10 II.3 Comparisonwiththepreviousforecast 20 II.4 Alternativescenariosandsensitivityanalyses 22 II.4.1 Exchange rate sensitivity scenario 22 II.5 Forecastsbyotherentities 23III.CURRENTECONOMICDEVELOPMENTS 25 III.1 Inflation 25 III.1.1 Fulfilment of the inflation target 25 III.1.2 Current inflation 27 III.2 Importpricesandproducerprices 29 III.2.1 Import prices 29 III.2.2 Producer prices 30 III.3 Demandandoutput 33 III.3.1 Domestic demand 33 BOX 1 Consumption, savings and debt burden of household income groups in 2012 34 III.3.2 Net external demand 37 III.3.3 Output 38 III.3.4 Potential output and estimate of the cyclical position of the economy 40 III.4 Thelabourmarket 41 III.4.1 Employment and unemployment 41 III.4.2 Wages and productivity 43 III.5 Financialandmonetarydevelopments 45 III.5.1 Money 45 III.5.2 Credit 46 III.5.3 Interest rates 48 III.5.4 The exchange rate 51 III.5.5 Economic results of non-financial corporations 52 III.5.6 Financial position of corporations and households 53 III.5.7 The property market 54 III.6 Balanceofpayments 55 III.6.1 The current account 55 III.6.2 The capital account 56 III.6.3 The financial account 56 III.7 Theexternalenvironment 58 III.7.1 The euro area 58 BOX 2 The announced reduction of quantitative easing in the USA and its effect on yield curves 59 III.7.2 The United States 61 III.7.3 The exchange rate of the euro against the dollar and other major currencies 62 III.7.4 Prices of oil and other commodities 63CHARTSINTHETEXT 66TABLESINTHETEXT 69ABBREVIATIONS 70BOXESANDANNEXESCONTAINEDININFLATIONREPORTS 71GLOSSARY 72KEYMACROECONOMICINDICATORS 76

Czech National Bank / Inflation Report III/2013
6 I. SUMMARY
I.SUMMARY
The decline of the Czech economy deepened further in 2013 Q1. Headline inflation was below the CNB’s target in 2013 Q2, while monetary-policy relevant inflation was below the lower boundary of the tolerance band around the target. This will remain the case for the rest of this year. Food prices remain a source of inflation, while the contribution of tax changes and administered prices has decreased. The domestic economy remains strongly anti-inflationary, whereas the depreciation of the koruna is having the opposite effect. Real economic activity will drop by 1.5% this year, but will slowly recover from 2013 Q2 onwards. GDP will grow by about 2% next year thanks to rising external demand and the unwinding of the dampening effect of domestic fiscal consolidation. The growth will pick up further in 2015. Both headline and monetary-policy relevant inflation will gradually return towards the target over the monetary policy horizon. The exchange rate of the koruna against the euro will appreciate very slowly from its current weak level. Consistent with the forecast is a decline in market interest rates to zero, followed by a noticeable rise in rates only in 2015. Given the zero lower bound on monetary policy rates, this points to a need to ease monetary policy using other instruments.
The Czecheconomy contracted by 2.4% year on year in2013Q1, owing mainly to a fall in gross capital formation. The contributions of the other components were negligible overall. The forecast assumes a moderation of the year-on-year decline in GDP in 2013 Q2, with economic activity increasing slightly in quarter-on-quarter terms.
Headline inflation was below the CNB’s target in 2013 Q2 (see Chart I.1), while monetary-policy relevant inflation was slightly below the lower boundary of the tolerance band around the target. Food prices remain a source of inflation, while the contribution of tax changes and administered prices has decreased. Negative adjusted inflation excluding fuels continues to reflect the strongly anti-inflationary effect of the domestic economy, whereas the weaker exchange rate of the koruna is acting in the opposite direction via import prices.
Economicactivity intheeffectiveeuroarea was flat in 2013 H1. According to the assumptions of the forecast, growth is expected to reach 0.3% in effective terms in 2013, but the euro area as a whole will record a continuing modest recession. The low outlook for 3M EURIBOR rates takes into account the ECB’s still easy monetary policy as well as its communication that policy will remain easy, amid only a gradual recovery of economic activity in the euro area. This is reflected in an outlook for gradual depreciation of the euro against the dollar. Oil prices are expected to fall gradually over the forecast horizon.
According to the forecast, headline inflation will be below the CNB’s 2% target this year despite an increase in both VAT rates of one percentage point. After the effect of this tax change drops out in early 2014, inflation will fall more markedly below the target, but later
93/1312 69/12 123/12 6 9
-1
0
1
2
3
4
5
6
Inflation target
April–June 2013
FULFILMENTOFTHEINFLATIONTARGETHeadlineinflationwasbelowtheCNB’stargetin2013Q2(year on year in %)
Chart I.1
90% 70% 50% 30% confidence interval
-1
0
1
2
3
4
5
6
III IV I/15IIIV IVI/12 I/13IIIIII/11 II IIIV I/14III
Monetary policy horizon
Inflation target
HEADLINEINFLATIONFORECASTHeadlineinflationwillbebelowtheCNB’s2%targetthisyeardespiteanincreaseinindirecttaxes;afterdecliningfurtherinearly2014itwillrisesteadily(year on year in %)
Chart I.2
Monetary policy horizon
Inflation target
90% 70% 50% 30% confidence interval
-1
0
1
2
3
4
5
6
III IV I/15IIIV IVI/12 I/13IIIIII/11 II IIIV I/14III
MONETARY-POLICYRELEVANTINFLATIONFORECASTMonetary-policyrelevantinflationwillbebelowthelowerboundaryofthetolerancebandaroundthetargetthisyearandthenreturnslowlytowardsthetargetoverthemonetarypolicyhorizon(year on year in %)
Chart I.3

Czech National Bank / Inflation Report III/2013
7
it will slowly converge towards it again (see Chart I.2). Monetary-policy relevant inflation, i.e. inflation adjusted for the first-round effects of changes to indirect taxes, will be below the lower boundary of the tolerance band this year and then return slowly towards the target over the monetary policy horizon (see Chart I.3). The overall upward pressures on consumer prices will increase in the near future as growth in import prices strengthens due to the koruna’s weaker exchange rate. The anti-inflationary effect of the domestic economy will meanwhile subside only slowly. In the longer term, the inflationary effect of import prices will weaken as the exchange rate gradually appreciates, but this will be more than offset by a recovery in the domestic economy. Adjusted inflation excluding fuels will turn slightly positive in early 2014 and then increase steadily. Administered prices will grow at a modest pace, food price inflation will slow significantly and fuel prices will show a temporary decrease.
Consistent with the forecast is a decline in market interestratesto zero, followed by a noticeable rise in rates only in 2015 (see Chart I.4). Given the zero lower bound on monetary policy rates, this points to a need to ease monetary policy using other instruments. The low level of foreign interest rates and slow domestic inflation, reflecting the subdued Czech economy, are the main factors fostering a decline in interest rates. The exchange rate of the koruna against the euro has weakened and will appreciate only very slowly over the forecast horizon (see Chart I.5) due to a low outlook for foreign interest rates and rising net exports thanks to a recovery in external demand.
Generally weak domestic demand in an environment of existing fiscal consolidation and an only gradual recovery in external demand will lead to a 1.5% decline in the Czech economy this year (see Chart I.6). Economic activity will be strongly hampered by a fall in gross capital formation. By contrast, the contributions of net exports and household consumption will be positive. However, 2013 Q2 will see a gradual recovery thanks to external demand developments. Next year, the previous years’ dampening factors will largely subside and the economy will grow by about 2%. In 2015, the GDP growth rate will slightly exceed 3%. On the labourmarket, the currently subdued economic activity will cause the unemployment rate to increase and wage growth in the business sector to be low. Wage growth will pick up in mid-2014 as economic activity recovers more significantly. Wages in the non-business sector will continue to rise slowly.
At its monetary policy meeting on 1 August 2013, the Bank Board decided unanimously to leavekey interest ratesunchanged. The Board again stated that interest rates would be kept at their current levels (i.e. at “technical zero”) over a longer horizon until inflation pressures increase significantly. At the same time, the likelihood of launching foreign exchange interventions to ease monetary policy has increased according to the Board. The risks of the new forecast were assessed as being skewed towards a need for easier monetary conditions. Energy prices and the risk of unfulfilled expectations of a recovery in the euro area are acting in this direction.
90% 70% 50%
0
1
2
3
4
IV I/15IIIIIV IVI/12 I/13IIIIII/11 III IV IIII/14 II
30% confidence interval
INTERESTRATEFORECASTConsistentwiththeforecastisadeclineinmarketinterestratestozero,followedbyanoticeableriseinratesonlyin2015(3M PRIBOR in %)
Chart I.4
90% 70% 50% 30% confidence interval
21
23
25
27
29
III IV I/15IIIV IVI/12 I/13IIIIII/11 II IIIV I/14III
EXCHANGERATEFORECASTThenominalexchangeratehasweakenedandwillappreciateonlyveryslowlyovertheforecasthorizon(CZK/EUR)
Chart I.5
90% 70% 50% 30% confidence interval
-4
-2
0
2
4
6
8
10
III IV I/15IIIV IVI/12 I/13IIIIII/11 II IIIV I/14III
GDPGROWTHFORECASTGDPwilldeclinethisyearoverall,butwillgraduallystarttorecover(annual percentage changes; seasonally adjusted)
Chart I.6
I. SUMMARY

Czech National Bank / Inflation Report III/2013
8
II.THEFORECAST,ITSCHANGESANDRISKS
II.1EXTERNALASSUMPTIONSOFTHEFORECAST
The rate of economic growth in the effective euro area will be weak this year, but a more pronounced recovery in economic activity is expected in the next two years. The subdued economic activity and declining prices of industrial commodities are reflected in low producer and consumer price inflation. The low outlook for 3M EURIBOR rates takes into account the ECB’s still easy monetary policy as well as its communication that policy will remain easy. The euro-dollar exchange rate should be below USD 1.30/EUR over the entire forecast horizon. The outlook for the Brent crude oil price continues to expect a gradual decline.
The outlook for the effectiveindicatorofeuroareaGDP foresees only weak economic growth of 0.3% this year (see Chart II.1.1).1 The slightly positive growth in the effective indicator is again due mainly to the German and Slovak economies, whereas most euro area countries will record declines this year. A more marked recovery in the effective euro area is expected at the end of this year, and particularly in 2014, when the growth rate of external demand should reach 1.4% from the whole-year perspective. A further pick-up to 2% is forecasted for 2015. Compared to the previous forecast, this means a modest shift in the outlook towards lower growth over almost the entire forecast horizon. In addition, given the continuing debt crisis, the risks to economic growth in the euro area remain tilted to the downside over the entire forecast horizon.
The slowdown in economic activity accompanied by falling prices of industrial commodities is reflected in the outlook for the effectiveindicatorofproducerpricesintheeuroarea (see Chart II.1.2). Its growth should reach 1% this year, which is much lower than in 2012. Producer price inflation is expected to pick up to 1.9% in 2014 as the economy (and industrial production) recovers. This trend should continue until the end of 2015, when producer prices are expected to grow at a rate of almost 3%. These figures are lower compared to the previous forecast at the one-year horizon.
The expected slowing growth of the effectiveindicatorofconsumerpricesintheeuroarea in the near future primarily takes into account the continuing subdued demand and a further decline in energy prices. Compared to 2012, consumer price inflation is expected to slow noticeably this year to 1.7%, in line with the observed trend (see Chart II.1.3). The growth in consumer prices will be chiefly due to food prices. Inflation is expected to fluctuate around the 2% level over the next two years. The previous forecast’s outlook was rather higher.
1 The outlooks for euro area GDP, PPI and CPI and the dollar-euro exchange rate are based on the July Consensus Forecasts (CF). The outlooks for the 3M EURIBOR and Brent crude oil are derived from prices of market contracts as of 8 July 2013. The outlook is indicated by the grey areas in the charts. This convention is used throughout this Report.
II. THE FORECAST, ITS CHANGES AND RISKS
-0.4
-0.2
0.0
0.2
0.4
-1
0
1
2
3
I/10 I/15I/09 I/11 I/12 I/13 I/14
DifferencesPrevious forecast New forecast
EFFECTIVECPIINTHEEUROAREAEffectiveinflationfellslightlybelow2%thisyearandwillreturntothislevelinthelongerterm(year on year in %; differences in percentage points – right-hand scale; seasonally adjusted)
Chart II.1.3
DifferencesPrevious forecast New forecast
-1.2
-0.8
-0.4
-0.0
0.4
0.8
1.2
I/11I/10 I/15I/09 I/12 I/13 I/14
-9
-6
-3
0
3
6
9
-9
-6
-3
0
3
6
9
EFFECTIVEPPIINTHEEUROAREAProducerpriceinflationwillbelowin2013owingtosubduedeconomicactivityandfallingcommodityprices;itwillsubsequentlyaccelerategradually(year on year in %; differences in percentage points – right-hand scale; seasonally adjusted)
Chart II.1.2
-0.9
-0.6
-0.3
0.0
0.3
0.6
-6
-4
-2
0
2
4
I/11I/10 I/15I/09 I/12 I/13 I/14
DifferencesPrevious forecast New forecast
EFFECTIVEGDPINTHEEUROAREAOnlyweakeconomicgrowthisexpectedintheeuroareathisyear;amoremarkedrecoveryshouldoccurin2014–2015(annual percentage changes; differences in percentage points – right-hand scale; seasonally adjusted)
Chart II.1.1

Czech National Bank / Inflation Report III/2013
9II. THE FORECAST, ITS CHANGES AND RISKS
The expected 3M EURIBOR path reflects the lowering of the ECB’s main refinancing rate by 0.25 percentage point to 0.50% (on 2 May). The ECB responded to the deteriorating macroeconomic environment in the euro area and the related absence of major inflationary pressures in the medium term by further easing monetary policy. At its June meeting, the ECB announced that monetary policy would remain easy for as long as necessary and key interest rates would remain at present or lower levels for an extended period of time (“forward guidance”). The market outlook thus expects the 3M EURIBOR to average only 0.2% this year (see Chart II.1.4). This rate is expected to increase gradually to about 0.4% next year and to 0.7% in 2015 as economic growth gathers pace. The market outlook for rates thus remained almost unchanged from the previous forecast. The market outlooks for the 3M EURIBOR for this year and the next are in line with the expectations of the analysts surveyed in the July CF. They expect this rate to stay at the current level of 0.2% at the three-month horizon and at 0.3% at the one-year horizon. Most analysts expect the ECB’s main refinancing rate to stay at the current level of 0.5% at least until mid-2014.
The outlook for the euro-dollar exchange rate foresees the euro staying at USD 1.30/EUR on average in 2013 (see Chart II.1.5), mainly as a result of the strengthening of the euro in the first few months of this year, which reflected positive sentiment and higher demand for risky assets. However, the euro is expected to start depreciating gradually in the second half of this year in response to the ECB’s continued easy monetary policy as well as the improving prospects for the US economy and the potential scaling down of the quantitative easing programme by the Fed. The euro-dollar exchange rate should thus be USD 1.27/EUR on average in 2014 and 2015, roughly in line with the previous forecast’s assumptions.
The outlook for the Brentcrudeoilprice based on market futures continues to expect a falling path over the entire forecast horizon (see Chart II.1.6). The average price of Brent crude oil should be USD 107 a barrel this year. The falling outlook reflects weaker demand from the Chinese economy, which is showing signs of slowing economic growth, and higher oil extraction in North America. The expected appreciation of the dollar is also fostering a lower price of Brent crude oil. According to the forecast, the price of Brent crude oil should decrease gradually to about USD 94 a barrel at the end of 2015. This represents a negligible change compared to the previous forecast. The analysts surveyed in the July CF predict the price of Brent crude oil to be flat at around USD 105 a barrel at the 12-month horizon, i.e. about USD 4 a barrel higher than the market outlook.
-0.2
-0.1
0.0
0.1
0
1
2
3
I/10 I/15I/09 I/11 I/12 I/13 I/14
DifferencesPrevious forecast New forecast
3MEURIBORTheloweringoftheECB’smainrefinancingrateinMayandthecontractionineconomicactivityarereflectedinalowoutlookforinterestrates(in %; differences in percentage points – right-hand scale)
Chart II.1.4
-6
-3
0
3
1.2
1.3
1.4
1.5
I/10 I/15I/09 I/11 I/12 I/13 I/14
DifferencesPrevious forecast New forecast
EURO-DOLLAREXCHANGERATETheexchangerateoftheeuroagainstthedollarshouldbebelowUSD1.30/EURovertheentireforecasthorizon(USD/EUR; differences in % – right-hand scale)
Chart II.1.5
-4
-2
0
2
4
40
60
80
100
120
I/10 I/15I/09 I/11 I/12 I/13 I/14
DifferencesPrevious forecast New forecast
PRICEOFBRENTCRUDEOILThemarketoutlookfortheBrentcrudeoilpricehasaslightlyfallingpath(USD/barrel; differences in % – right-hand scale)
Chart II.1.6
Czech National Bank / Inflation Report III/2013
10
II.2THEFORECAST
Food prices remain a source of inflation, while the contribution of tax changes and administered prices has decreased. Negative adjusted inflation excluding fuels continues to reflect the strongly anti-inflationary effect of the domestic economy, whereas a weaker exchange rate of the koruna is acting in the opposite direction via import prices. Headline inflation will remain below the CNB’s 2% target for the rest of this year and monetary-policy relevant inflation will be below the lower boundary of the tolerance band. Import prices will remain inflationary because of steady growth in foreign prices, the depreciation of the koruna against the euro in the first half of this year and its subsequent only very slow appreciation. The anti-inflationary domestic pressures will subside only slowly and developments in the Czech economy will start to push prices slightly upwards in 2014. This, together with a closing negative gap in profit mark-ups, will cause both headline and monetary-policy relevant inflation to gradually converge towards the target over the monetary policy horizon. Subdued external and domestic demand due to existing fiscal consolidation will lead to a 1.5% decline in GDP this year. The economy will grow by about 2% next year thanks to an expected recovery in external demand and the unwinding of the effect of government consolidation measures. The growth will pick up further in 2015. Consistent with the forecast is a decline in market interest rates to zero, followed by a noticeable rise in rates only in 2015. Given the zero lower bound on monetary policy rates, this points to a need to ease monetary policy using other instruments.
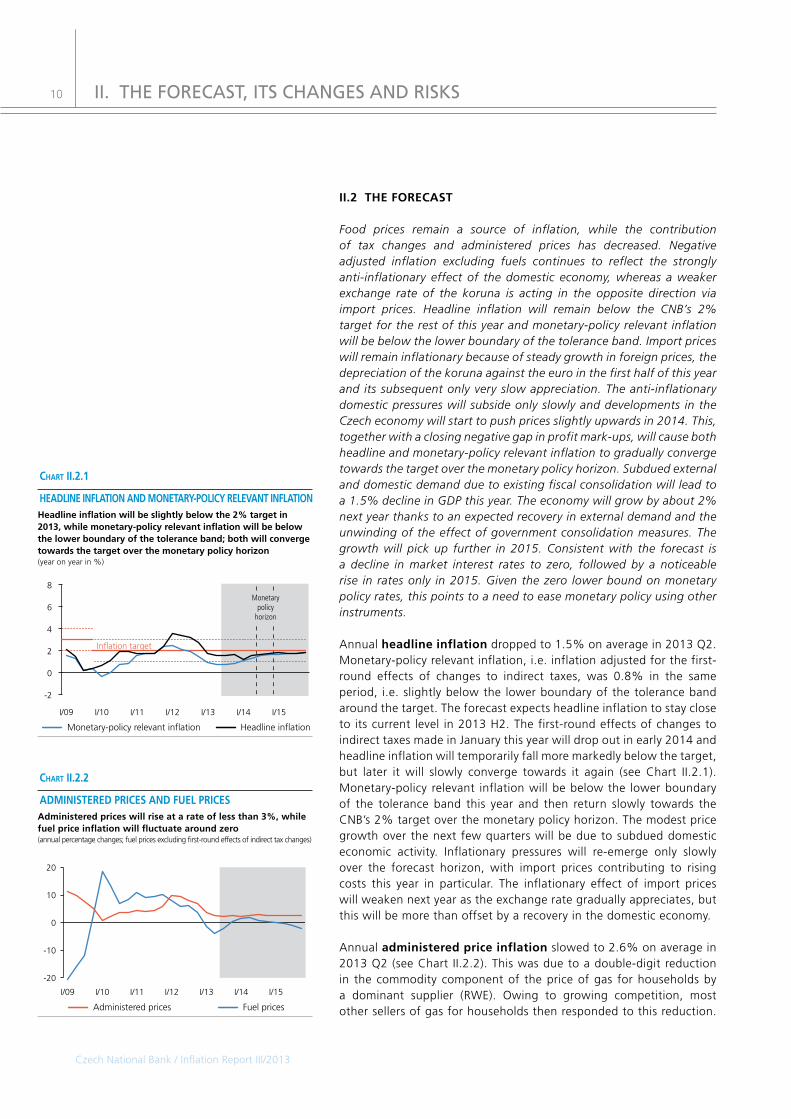
Annualheadlineinflationdropped to 1.5% on average in 2013 Q2. Monetary-policy relevant inflation, i.e. inflation adjusted for the first-round effects of changes to indirect taxes, was 0.8% in the same period, i.e. slightly below the lower boundary of the tolerance band around the target. The forecast expects headline inflation to stay close to its current level in 2013 H2. The first-round effects of changes to indirect taxes made in January this year will drop out in early 2014 and headline inflation will temporarily fall more markedly below the target, but later it will slowly converge towards it again (see Chart II.2.1). Monetary-policy relevant inflation will be below the lower boundary of the tolerance band this year and then return slowly towards the CNB’s 2% target over the monetary policy horizon. The modest price growth over the next few quarters will be due to subdued domestic economic activity. Inflationary pressures will re-emerge only slowly over the forecast horizon, with import prices contributing to rising costs this year in particular. The inflationary effect of import prices will weaken next year as the exchange rate gradually appreciates, but this will be more than offset by a recovery in the domestic economy.
Annual administeredpriceinflationslowed to 2.6% on average in 2013 Q2 (see Chart II.2.2). This was due to a double-digit reduction in the commodity component of the price of gas for households by a dominant supplier (RWE). Owing to growing competition, most other sellers of gas for households then responded to this reduction.
II. THE FORECAST, ITS CHANGES AND RISKS
Fuel pricesAdministered prices
I/09 I/14 I/15I/10 I/11 I/12 I/13
-20
-10
0
10
20
ADMINISTEREDPRICESANDFUELPRICESAdministeredpriceswillriseatarateoflessthan3%,whilefuelpriceinflationwillfluctuatearoundzero(annual percentage changes; fuel prices excluding first-round effects of indirect tax changes)
Chart II.2.2
Monetary-policy relevant inflation Headline inflation
I/09 I/14 I/15I/10 I/13I/11 I/12
Inflation target
Monetarypolicy
horizon
-2
0
2
4
6
8
HEADLINEINFLATIONANDMONETARY-POLICYRELEVANTINFLATIONHeadlineinflationwillbeslightlybelowthe2%targetin2013,whilemonetary-policyrelevantinflationwillbebelowthelowerboundaryofthetoleranceband;bothwillconvergetowardsthetargetoverthemonetarypolicyhorizon(year on year in %)
Chart II.2.1
Czech National Bank / Inflation Report III/2013
11
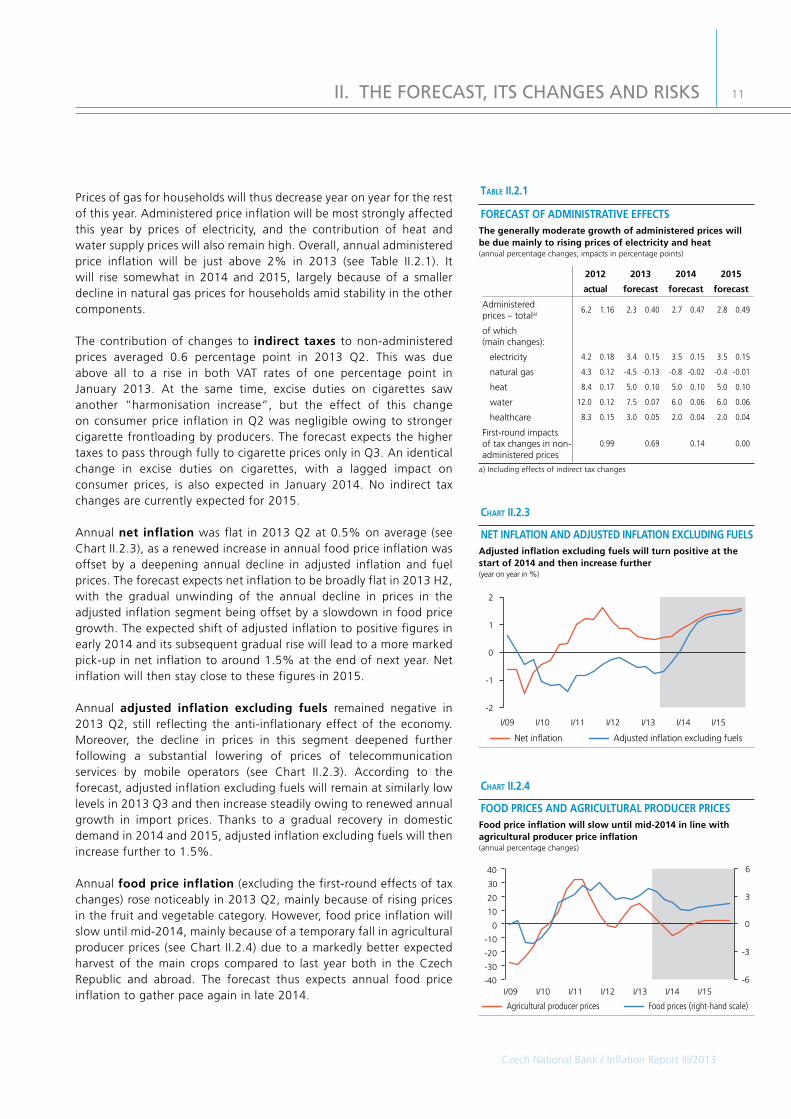
Prices of gas for households will thus decrease year on year for the rest of this year. Administered price inflation will be most strongly affected this year by prices of electricity, and the contribution of heat and water supply prices will also remain high. Overall, annual administered price inflation will be just above 2% in 2013 (see Table II.2.1). It will rise somewhat in 2014 and 2015, largely because of a smaller decline in natural gas prices for households amid stability in the other components.
The contribution of changes to indirect taxes to non-administered prices averaged 0.6 percentage point in 2013 Q2. This was due above all to a rise in both VAT rates of one percentage point in January 2013. At the same time, excise duties on cigarettes saw another “harmonisation increase”, but the effect of this change on consumer price inflation in Q2 was negligible owing to stronger cigarette frontloading by producers. The forecast expects the higher taxes to pass through fully to cigarette prices only in Q3. An identical change in excise duties on cigarettes, with a lagged impact on consumer prices, is also expected in January 2014. No indirect tax changes are currently expected for 2015.
Annual net inflation was flat in 2013 Q2 at 0.5% on average (see Chart II.2.3), as a renewed increase in annual food price inflation was offset by a deepening annual decline in adjusted inflation and fuel prices. The forecast expects net inflation to be broadly flat in 2013 H2, with the gradual unwinding of the annual decline in prices in the adjusted inflation segment being offset by a slowdown in food price growth. The expected shift of adjusted inflation to positive figures in early 2014 and its subsequent gradual rise will lead to a more marked pick-up in net inflation to around 1.5% at the end of next year. Net inflation will then stay close to these figures in 2015.
Annual adjusted inflation excluding fuels remained negative in 2013 Q2, still reflecting the anti-inflationary effect of the economy. Moreover, the decline in prices in this segment deepened further following a substantial lowering of prices of telecommunication services by mobile operators (see Chart II.2.3). According to the forecast, adjusted inflation excluding fuels will remain at similarly low levels in 2013 Q3 and then increase steadily owing to renewed annual growth in import prices. Thanks to a gradual recovery in domestic demand in 2014 and 2015, adjusted inflation excluding fuels will then increase further to 1.5%.
Annual foodpriceinflation (excluding the first-round effects of tax changes) rose noticeably in 2013 Q2, mainly because of rising prices in the fruit and vegetable category. However, food price inflation will slow until mid-2014, mainly because of a temporary fall in agricultural producer prices (see Chart II.2.4) due to a markedly better expected harvest of the main crops compared to last year both in the Czech Republic and abroad. The forecast thus expects annual food price inflation to gather pace again in late 2014.
II. THE FORECAST, ITS CHANGES AND RISKS
-40
-30
-20
-10
0
10
20
30
40
-6
-3
0
3
6
Agricultural producer prices Food prices (right-hand scale)
I/09 I/14 I/15I/10 I/11 I/12 I/13
FOODPRICESANDAGRICULTURALPRODUCERPRICESFoodpriceinflationwillslowuntilmid-2014inlinewithagriculturalproducerpriceinflation(annual percentage changes)
Chart II.2.4
Adjusted inflation excluding fuelsNet inflation
I/09 I/14 I/15I/10 I/11 I/12 I/13
-2
-1
0
1
2
NETINFLATIONANDADJUSTEDINFLATIONEXCLUDINGFUELSAdjustedinflationexcludingfuelswillturnpositiveatthestartof2014andthenincreasefurther(year on year in %)
Chart II.2.3
table II.2.1
2012 2013 2014 2015
actual forecast forecast forecast
Administered prices – totala) 6.2 1.16 2.3 0.40 2.7 0.47 2.8 0.49
of which (main changes):
electricity 4.2 0.18 3.4 0.15 3.5 0.15 3.5 0.15
natural gas 4.3 0.12 -4.5 -0.13 -0.8 -0.02 -0.4 -0.01
heat 8.4 0.17 5.0 0.10 5.0 0.10 5.0 0.10
water 12.0 0.12 7.5 0.07 6.0 0.06 6.0 0.06
healthcare 8.3 0.15 3.0 0.05 2.0 0.04 2.0 0.04
First-round impacts of tax changes in non-administered prices
0.99 0.69 0.14 0.00
FORECASTOFADMINISTRATIVEEFFECTSThegenerallymoderategrowthofadministeredpriceswillbeduemainlytorisingpricesofelectricityandheat(annual percentage changes; impacts in percentage points)
a) Including effects of indirect tax changes

Czech National Bank / Inflation Report III/2013
12
Annual fuel price inflation turned more negative in 2013 Q2, mirroring world prices of petrol and Brent oil (see Chart II.2.5). The forecast expects growth in fuel prices to gradually turn slightly positive at the end of this year and stay at this level until mid-2015.
Interestrateson the Czech money market remained low in 2013 Q2, reflecting the easy monetary policy in the Czech Republic due to the anti-inflationary effect of the domestic economy and low interest rates in the euro area. Rates with maturities longer than one year increased in connection with a rise in long-term rates abroad. Consistent with the forecast is a decline in market interest rates to zero, followed by a noticeable rise in rates only in 2015 (see Chart II.2.6). Given the zero lower bound on monetary policy rates, this points to a need to ease monetary policy using other instruments. The low level of foreign interest rates and slow domestic inflation, reflecting the subdued Czech economy, are the main factors fostering a decline in interest rates.
Thekoruna depreciated againsttheeuro to CZK 25.8 on average in 2013 Q2. The short-term forecast for 2013 Q3 assumes that the exchange rate will be at the same level (see Chart II.2.7). Weaker levels of the exchange rate at the start of the forecast reflect the subdued external demand and the CNB’s previous communication regarding its preparedness to use foreign exchange interventions. However, the low outlook for interest rates and a recovery in external demand, reflected in increasing net exports, will gradually prevail slightly. This leads to very slow appreciation of the exchange rate over the forecast horizon to CZK 25.1 against the euro at the end of 2015. In light of the CF outlook for a gradually depreciating exchange rate of the euro against the dollar (see section II.1), this implies a slight depreciation of the koruna-dollar rate until the start of 2014.
Quarterly growth in nominalmarginalcostsintheconsumergoodssector was low in 2013 Q2, despite picking up further compared to the previous two quarters (see Chart II.2.8). Owing to continued subdued economic activity, the effect of the domestic economy, approximated by intermediate goods price inflation, remains anti-inflationary. Inflationary pressures from import prices are positive, albeit subdued, as the gradual effect of exchange rate depreciation is being partly offset by lower inflation abroad. The estimated impact of growth in export-specific technology is linked to the difference in the evolution of prices of tradables and non-tradables (the Balassa-Samuelson effect), which for some time now has been contributing less markedly to inflation than in the pre-crisis period. The overall upward pressures on consumer prices will increase at the start of the forecast horizon as growth in import prices strengthens due to the koruna’s weaker exchange rate. This effect of import prices will begin to weaken at the start of 2014 as a result of a very gradual appreciation of the koruna amid stable foreign producer prices. The anti-inflationary effect of the domestic economy will subside only slowly and the domestic economy will start to push inflation gently upwards in mid-2014. The contribution of export-specific technology will increase as economic activity gradually recovers.
II. THE FORECAST, ITS CHANGES AND RISKS
3M EURIBOR3M PRIBOR
0
1
2
3
I/09 I/14 I/15I/10 I/11 I/12 I/13
INTERESTRATEFORECASTConsistentwiththeforecastisadeclineinmarketinterestratestozero,followedbyanoticeableriseinratesonlyin2015(3M PRIBOR and 3M EURIBOR in %)
Chart II.2.6
15
20
25
30
CZK/USD exchange rate CZK/EUR exchange rate
I/09 I/15I/10 I/11 I/12 I/13 I/14
EXCHANGERATEFORECASTTheexchangerateofthekorunaagainsttheeuroweakenedandwillappreciateonlyveryslowlyovertheforecasthorizon(CZK/EUR and CZK/USD)
Chart II.2.7
-50
-25
0
25
50
-20
-10
0
10
20
Oil price (in CZK) Fuel prices (right-hand scale)
I/09 I/14 I/15I/10 I/11 I/12 I/13
FUELPRICESANDOILPRICESTheyear-on-yeardeclineinfuelpriceswillgraduallydisappearbytheendof2013(annual percentage changes)
Chart II.2.5

Czech National Bank / Inflation Report III/2013
13
Nominal marginal costs in the intermediate goods sector continued to decline in 2013 Q2. Nominal wage growth in the business sector remained very low (when adjusted for the one-off effect of tax optimisation) and was thus significantly outweighed by the estimated declining price of capital, which reflects subdued economic activity and weak investment activity. The contributions of labour-augmenting technology are only slightly anti-inflationary due to weak productivity growth (see Chart II.2.9). Domestic nominal costs will decline moderately until the end of 2013. The contribution of the price of capital will stay negative until the start of 2014 and will have an almost neutral effect thereafter. Wage growth will remain low amid an only gradual recovery in the domestic economy and, in terms of costs, will be almost fully offset by gradually accelerating growth in productivity.
The estimated gap in profit mark-ups in the consumer goodssectorwas slightly positive in 2013 Q2 (see Chart II.2.10), partly due to revisions of the national accounts data for 2012. In an environment of weak growth in prices of consumer goods, this reflects the fact that estimated costs in this sector grew even more slowly. The gap in profit mark-ups will turn negative again at the start of the forecast horizon, as the weak domestic demand will prevent prices from rising in line with growth in costs stemming mainly from import prices. The gap in profit mark-ups will converge towards zero again in 2015.
The sizeable decline in whole-economy labour productivity will continue into 2013 Q2 but will gradually subside in the quarters ahead. Productivity will return to growth in 2014 Q1 and rise at a rate of around 3.5% from the start of 2015 onwards.
The average nominal wage in the business sector was volatile in late 2012 and early 2013 due to a time shift in wages caused by tax optimisation related to the abolition of the cap on health insurance and additional taxation of higher income at the start of 2013. The average wage rose by 0.1% in 2013 Q1 year on year after seasonal adjustment.2 The impact of tax optimisation is estimated at around 2 percentage points. Once the one-off effect of tax optimisation unwinds in 2013 Q2, growth in the average wage will pick up again to 2%. Wage growth adjusted for the fluctuations due to tax optimisation will remain around this level until mid-2014, when it will start to rise as the economy recovers. Overall, wages in the business sector will thus increase by only 0.8% in 2013, again due to tax optimisation, and pick up to 2.7% and 3% respectively in the next two years (see Chart II.2.11).
Growth in the average nominal wage in thenon-business sectorwill be negligible throughout the year. The forecast expects wage growth in this sector to reach 0.2% in 2013 Q2 and to fluctuate
2 Without seasonal adjustment, it declined by 0.4%. For details see section III.4.2.
II. THE FORECAST, ITS CHANGES AND RISKS
Gap in profit mark-ups in the consumer sector
I/09 I/15I/10 I/11 I/12 I/13 I/14
-1.0
-0.5
0.0
0.5
1.0
GAPINPROFITMARK-UPSINTHECONSUMERSECTORThegapinprofitmark-upswillbenegativeovermostoftheforecasthorizon(percentages)
Chart II.2.10
I/09 I/15I/10 I/11 I/12 I/13 I/14
-4
-2
0
2
4
TotalWagesLabour-augmenting technology
Price of capital
COSTSINTHEINTERMEDIATEGOODSSECTORDomesticcostswillcontinuetodeclinemoderatelyuntiltheendof2013asaresultoflowwagegrowthandnegativecontributionsfromthepriceofcapital(quarterly percentage changes; contributions in percentage points; annualised)
Chart II.2.9
Total
I/09 I/15I/10 I/11 I/12 I/13 I/14
-3
-2
-1
0
1
2
3
Export-specific technologyImport pricesIntermediate goods prices
COSTSINTHECONSUMERSECTORTheoverallinflationarypressuresintheconsumersectorwillincreasegraduallyfromtheircurrentlowlevels(quarterly percentage changes; contributions in percentage points; annualised)
Chart II.2.8

Czech National Bank / Inflation Report III/2013
14
around this level throughout 2013. Wage growth will remain subdued in 2014 and 2015, when the average wage in the non-business sector will rise by 1%.
RealGDPrecorded a year-on-year decline of 2.4% and a quarter-on-quarter decline of 1.3% in2013Q1 (see Chart II.2.12). The annual decline was fostered mainly by gross capital formation, while the contributions of the other components were negligible overall. The forecast assumes that economic activity in 2013 Q2 dropped by 1.7% year on year (see Chart II.2.13), but increased by 0.2% quarter on quarter. The sharp fall in gross capital formation continued. By contrast, household consumption is expected to increase slightly year on year. Net exports seem to have made a positive contribution to economic activity, too, amid declining volumes of imports and exports.
In 2013, real economic activity will drop by 1.5% overall due to still restrictive domestic fiscal policy and an only gradual recovery in external demand. Household consumption will be dampened by disposable income, affected mainly by low nominal wage growth and fiscal consolidation. However, as a result of a slight decline in the saving rate, household consumption will edge up and net exports will also make a positive contribution to GDP. Nevertheless, the strongly negative contribution of gross capital formation will outweigh them.
GDP will grow by 2.1% in 2014after the previous years’ dampening factors largely subside. The forecast assumes more robust growth in external demand and an almost neutral effect of fiscal policy. The contribution of government consumption to GDP growth will be slightly positive and growth in government investment, which started this year, is expected to continue. Household consumption will rise more significantly as a result of moderately accelerating wage growth and the unwinding of the effect of fiscal consolidation. Gross capital formation will remain subdued. As a result of a recovery in external demand, net exports will contribute more significantly to GDP growth, partly because of still subdued import-intensive domestic demand.
Total GDP growth will reach 3.3% in 2015. This will be fostered significantly by a recovery in domestic demand, especially growth in household consumption. Owing to a continuing recovery abroad, net exports will remain the biggest contributor to GDP growth, despite growth in imports for consumption and for production of export goods. The contribution of gross capital formation will stay negligible, albeit slightly positive, in 2015.
Quarterly growth in total employment slowed in 2013 Q2. The number of employed persons will start to decline in the second half of this year and will rise again in 2015. Nevertheless, in annual terms, employment will rise throughout 2013 and switch to a decline only subsequently, peaking in the first half of 2014 (see Chart II.2.14). Total employment will start growing again at the end of 2015. When converted into full-time equivalents, the currently observed annual decline in the number of employees will deepen further
II. THE FORECAST, ITS CHANGES AND RISKS
Quarter on quarterYear on year
-6
-4
-2
0
2
4
I/09 I/15I/10 I/11 I/12 I/13 I/14
GDPGROWTHFORECASTGDPwilldeclineoverallthisyear,butshouldstarttogrowatagraduallyrisingpaceinquarteronquarterterms(percentage changes; seasonally adjusted)
Chart II.2.12
Government consumptionGross fixed capital formationChange in inventories
Net exportsHousehold consumption
GDP growth
I/15I/09 I/10 I/11 I/12 I/13 I/14
-8
-6
-4
-2
0
2
4
6
ANNUALGDPGROWTHSTRUCTUREGrosscapitalformationwillmakeastronglynegativecontributiontoGDPgrowththisyear,whilenetexportsandhouseholdconsumptionwillmakesmallpositivecontributions(annual percentage changes; contributions in percentage points; seasonally adjusted)
Chart II.2.13
Nominal wages in the business sectorNominal wages in the non-business sector
-4
-2
0
2
4
6
I/09 I/15I/10 I/11 I/12 I/13 I/14
AVERAGENOMINALWAGEWagegrowthwillbelowbutvolatileduetotaxoptimisationandwillnotstarttoriseuntilmid-2014(annual percentage changes; business sector – seasonally adjusted; non-business sector – seasonally unadjusted)
Chart II.2.11

Czech National Bank / Inflation Report III/2013
15
in the quarters ahead (see Chart II.2.15). The converted number of employees will start to rise again in 2014 Q2 as the economy recovers. Its growth will fluctuate around 1.5% throughout 2015.
The forecast assumes that the seasonally adjusted generalunemploymentrate edged down to 7.2% in 2013 Q2. However, given the gradual slowdown in employment growth and persisting growth in the labour force, the general unemployment rate will rise gradually to 8% in 2014 Q2. It will fluctuate around this level until mid-2015, when it will start to decline gradually (see Chart II.2.14). A continuing increase can also be expected for the seasonally adjusted shareofunemployedpersonsaccordingtotheMLSA, which will rise to just above 8% owing to a further cyclical increase in the number of job applicants registered with labour offices amid a decrease in the population aged 15–64. The share of unemployed persons will gradually decline starting in the second half of 2014.
Real household consumption will switch to annual growth in 2013 Q2. Consumption will increase by 0.9% for the year as a whole, despite weak growth in nominal and real disposable income (see Chart II.2.16). Real and nominal consumption will thus grow mainly as a result of a further gradual decline in the saving rate. A slight rise in consumer demand in the near future is also indicated by the available leading indicators, such as rising – although still low – consumer confidence and retail sales in April and May 2013 (see section III.3). Real consumption will also be fostered by low inflation, which should mainly affect prices of semi-durable and durable goods. Household consumption will rise in 2014 and 2015 as a result of a recovery in economic activity and an ensuing gradual pick-up in growth in the volume of wages as the impacts of fiscal consolidation subside.
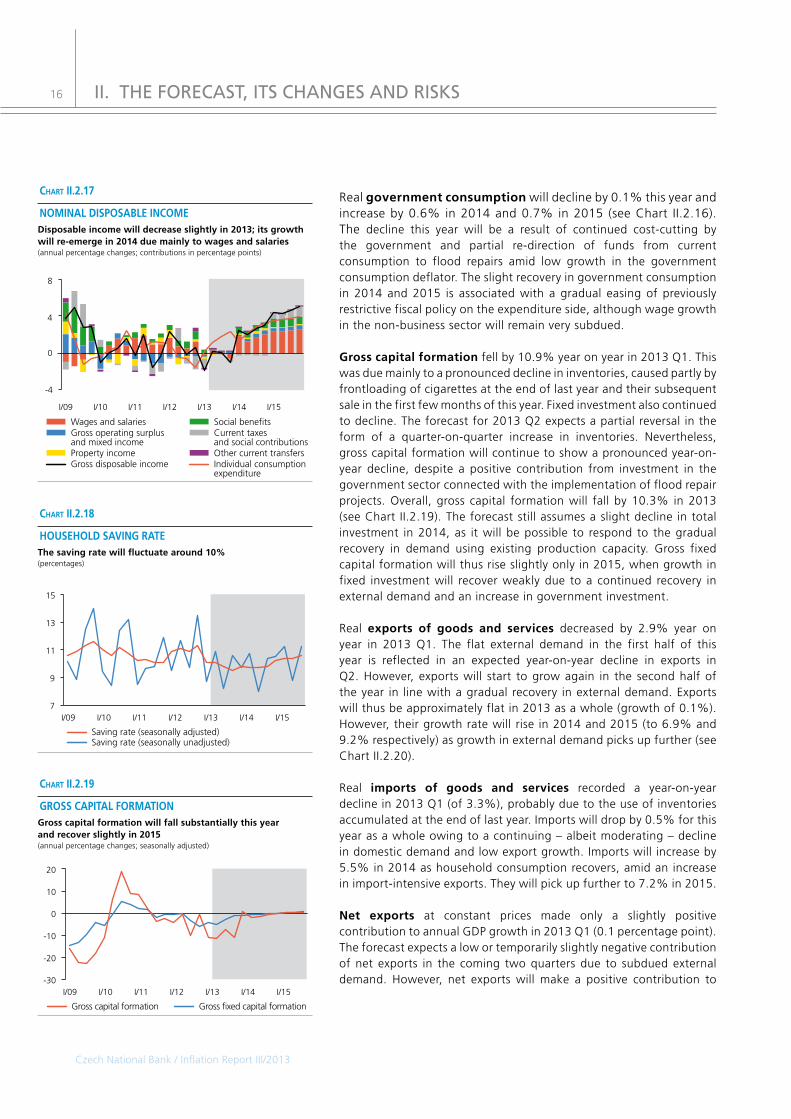
Gross nominal disposable income will decrease by 0.6% this year (see Chart II.2.17). The contribution of its most significant component, i.e. wages and salaries, will be slightly negative this year. At the start of next year, however, its growth will start to rise significantly in connection with the gradual economic recovery and its lagged impact on the labour market. Another significant component of disposable income, social benefits, should record gradually increasing contributions over the entire forecast horizon. The contribution of operating surplus and mixed income will start to grow next year thanks to a pronounced economic recovery. Overall, gross disposable income will increase by 2.5% and 4.6% in nominal terms in 2014 and 2015 respectively.
The forecast assumes a moderate decline in the householdsavingratefrom its current level of around 10% until the end of 2013 (see Chart II.2.18). The saving rate will then start to increase gradually, with households’ disposable income recovering faster than consumption. The profile of the saving rate thus will reflect the gradually improving domestic economy.
II. THE FORECAST, ITS CHANGES AND RISKS
Employment General unemployment rate (right-hand scale)
-3
-2
-1
0
1
2
4
5
6
7
8
9
I/09 I/15I/10 I/11 I/12 I/13 I/14
LABOURMARKETFORECASTTotalemploymentwillmostlyfallandtheunemploymentratewillrisefurther(annual percentage changes in employment; general unemployment rate in percentages; seasonally adjusted)
Chart II.2.14
-8
-6
-4
-2
0
2
4
I/09 I/15I/10 I/11 I/12 I/13 I/14
EmployeesHours worked per employeeEmployees (full-time equivalent)
NUMBEROFEMPLOYEES(FULL-TIMEEQUIVALENT)Theconvertednumberofemployeeswillstarttoriseinmid-2014astheeconomyrecovers(annual percentage changes; contributions in percentage points)
Chart II.2.15
Household consumption Government consumption
-6
-4
-2
0
2
4
6
I/09 I/15I/10 I/11 I/12 I/13 I/14
REALHOUSEHOLDANDGOVERNMENTCONSUMPTIONHouseholdconsumptionwillrecordrenewedyear-on-yeargrowthin2013Q2(annual percentage changes; seasonally adjusted)
Chart II.2.16
Czech National Bank / Inflation Report III/2013
16
Real governmentconsumptionwill decline by 0.1% this year and increase by 0.6% in 2014 and 0.7% in 2015 (see Chart II.2.16). The decline this year will be a result of continued cost-cutting by the government and partial re-direction of funds from current consumption to flood repairs amid low growth in the government consumption deflator. The slight recovery in government consumption in 2014 and 2015 is associated with a gradual easing of previously restrictive fiscal policy on the expenditure side, although wage growth in the non-business sector will remain very subdued.
Grosscapitalformation fell by 10.9% year on year in 2013 Q1. This was due mainly to a pronounced decline in inventories, caused partly by frontloading of cigarettes at the end of last year and their subsequent sale in the first few months of this year. Fixed investment also continued to decline. The forecast for 2013 Q2 expects a partial reversal in the form of a quarter-on-quarter increase in inventories. Nevertheless, gross capital formation will continue to show a pronounced year-on-year decline, despite a positive contribution from investment in the government sector connected with the implementation of flood repair projects. Overall, gross capital formation will fall by 10.3% in 2013 (see Chart II.2.19). The forecast still assumes a slight decline in total investment in 2014, as it will be possible to respond to the gradual recovery in demand using existing production capacity. Gross fixed capital formation will thus rise slightly only in 2015, when growth in fixed investment will recover weakly due to a continued recovery in external demand and an increase in government investment.
Real exports of goods and services decreased by 2.9% year on year in 2013 Q1. The flat external demand in the first half of this year is reflected in an expected year-on-year decline in exports in Q2. However, exports will start to grow again in the second half of the year in line with a gradual recovery in external demand. Exports will thus be approximately flat in 2013 as a whole (growth of 0.1%). However, their growth rate will rise in 2014 and 2015 (to 6.9% and 9.2% respectively) as growth in external demand picks up further (see Chart II.2.20).
Real imports of goods and services recorded a year-on-year decline in 2013 Q1 (of 3.3%), probably due to the use of inventories accumulated at the end of last year. Imports will drop by 0.5% for this year as a whole owing to a continuing – albeit moderating – decline in domestic demand and low export growth. Imports will increase by 5.5% in 2014 as household consumption recovers, amid an increase in import-intensive exports. They will pick up further to 7.2% in 2015.
Net exports at constant prices made only a slightly positive contribution to annual GDP growth in 2013 Q1 (0.1 percentage point). The forecast expects a low or temporarily slightly negative contribution of net exports in the coming two quarters due to subdued external demand. However, net exports will make a positive contribution to
II. THE FORECAST, ITS CHANGES AND RISKS
Property income
Social benefitsGross operating surplus and mixed income
I/15I/09 I/10 I/11 I/13I/12 I/14
Individual consumption expenditure
Gross disposable income
Current taxes and social contributions
Wages and salaries
Other current transfers
-4
0
4
8
NOMINALDISPOSABLEINCOMEDisposableincomewilldecreaseslightlyin2013;itsgrowthwillre-emergein2014duemainlytowagesandsalaries(annual percentage changes; contributions in percentage points)
Chart II.2.17
Saving rate (seasonally adjusted)Saving rate (seasonally unadjusted)
7
9
11
13
15
I/09 I/15I/10 I/11 I/12 I/13 I/14
HOUSEHOLDSAVINGRATEThesavingratewillfluctuatearound10%(percentages)
Chart II.2.18
Gross capital formation Gross fixed capital formation
-30
-20
-10
0
10
20
I/09 I/15I/10 I/11 I/12 I/13 I/14
GROSSCAPITALFORMATIONGrosscapitalformationwillfallsubstantiallythisyearandrecoverslightlyin2015(annual percentage changes; seasonally adjusted)
Chart II.2.19

17
real GDP on average for this year as a whole (0.5 percentage point). The contribution of net exports will increase again in the years ahead as external demand recovers, to 1.5 percentage points in 2014 and 2.1 percentage points in 2015.
The balance of payments forecast expects the decrease in the current account deficit, as recorded in the previous two years, to continue this year and the next. A balanced current account should be reached in 2015 (see Table II.2.3). In relative terms, this means a decline in the deficit from 2.4% of GDP in 2012 to 1.4% this year, 0.5% next year and zero in 2015. The decline in the current account deficit will be due to a continuing increase in the goods and services surplus. An increasing income deficit will counteract the moderation in the current account deficit. The growing trade surplus in 2013 is associated on the one hand with an expected year-on-year decline in total domestic demand and a modest decrease in commodity prices on world markets, hindering growth in imports, and on the other hand with growth (albeit very weak) in external demand, supporting growth in exports. Faster growth in foreign demand than domestic demand will also be apparent in 2014 and 2015. The continuing deterioration in the income balance will be almost exclusively a result of increasing non-residents’ income from direct investment. The forecast expects current transfers to remain flat at around zero, i.e. at the 2012 level.
The year-on-year deterioration in the capital account this year is associated mainly with an expected slightly lower drawing of EU funds. By contrast, the forecast expects faster drawdown of these funds and a one-off revenue from the sale of telecommunication frequencies in 2014.
The financial account surplus is declining significantly over the forecast horizon compared with previous years. Given the weak demand and excess production capacity in Europe, the need for new investment is very limited. In 2013 the overall balance of direct investment will be affected by a relatively significant foreign acquisition by a resident, but its impact will be outweighed by a marked increase in the equity capital of a foreign energy company in the Czech Republic. The forecast expects renewed moderate growth in FDI inflows in 2015 in connection with the expected accelerating recovery of the European economy. The year-on-year increase in the portfolio investment surplus this year is due solely to expected lower holdings of foreign debt securities by residents. By contrast, expected slightly lower drawdown of foreign funds by the government and government-controlled companies and increased demand of residents for foreign shares will be acting towards a lower deficit. The expected lower net portfolio investment inflow in 2014 is connected with predicted higher interest among residents in investing abroad due to the economic recovery and a further decrease in foreign funding of the government and government-controlled companies.
II. THE FORECAST, ITS CHANGES AND RISKS
-40
-20
0
20
40
-20
-10
0
10
20
Real net exports (change in CZK bn; right-hand scale)Real importsReal exports
I/10 I/15I/09 I/11 I/12 I/13 I/14
REALEXPORTSANDIMPORTSExportandimportgrowthwillpickuppacein2013H2,andthecontributionsofnetexportstoGDPgrowthwillsubsequentlyincreaseagain(annual percentage changes; annual changes in CZK billions; seasonally adjusted)
Chart II.2.20
a) ILO methodology, 15–64 years
table II.2.2
2012 2013 2014 2015
actual forec. forec. forec.
Real gross disposable income of households
-1.4 -1.2 1.5 2.9
Total employment 0.4 0.6 -0.6 -0.1
Unemployment rate (in per cent)a) 7.0 7.4 8.0 7.8
Labour productivity -1.6 -2.2 2.7 3.4
Average nominal wage 2.7 0.7 2.4 2.6
Average nominal wage in business sector 2.8 0.8 2.7 3.0Current account deficit (ratio to GDP in per cent)
-2.5 -1.2 -0.5 0.0
M2 5.6 3.5 3.0 3.2
FORECASTSOFSELECTEDVARIABLESRealdisposableincomewillnotriseuntil2014aswagegrowthpicksup;labourproductivitywillalsostarttoincreaseagain(annual percentage changes unless otherwise indicated)
a) forecast excluding operations of banking sector and financial derivatives
table II.2.3
2012 2013 2014 2015actual forec. forec. forec.
A. CURRENT ACCOUNT -94.0 -45.0 -20.0 0.0Trade balance 145.8 200.0 230.0 265.0
Balance of services 49.8 65.0 70.0 75.0
Income balance -288.6 -310.0 -320.0 -340.0
Current transfers -1.0 0.0 0.0 0.0
B. CAPITAL ACCOUNT 51.7 42.0 86.0 78.0
C. FINANCIAL ACCOUNT a) 121.7 120.0 50.0 20.0
Direct investment 181.1 90.0 65.0 75.0
Portfolio investment 42.6 75.0 30.0 -15.0
Financial derivatives 8.8
Other investment -110.8 -45.0 -45.0 -40.0
D. ERRORS AND OMISSIONS 1.0E. CHANGE IN RESERVES (- = increase)
-80.5
BALANCEOFPAYMENTSFORECASTThecurrentaccountdeficitwillfalltozerothankstoarisingtradesurplus(CZK billions)

18
The future macroeconomic developments described above and the current fiscal policy settings are reflected in the governmentfinance outlook for 2013–2015 (see Table II.2.4). Starting in 2013 the consolidation measures adopted will lead to a fall in the general government deficit below 3% of GDP, which will enable the Excessive Deficit Procedure (EDP) to be ended on time. However, the consolidation efforts are not expected to continue in 2014 and 2015. Without further measures, the deficit will diverge from the medium-term objective of a general government structural deficit of 1% of GDP in 2015. The European Commission recommendations published in June 2013 and subsequently approved by the Ecofin Council recommend that the Czech Republic should strengthen and consistently implement a fiscal strategy leading to substantial progress in the achievement of the medium-term objective. However, no additional measures based on this recommendation have been announced by the Czech government so far.
The government deficit should fall to 2.3% of GDP in 2013 owing to consolidation measures3 counteracted by a weaker effect of the contracting economy and continuing labour market downturn. The forecast also expects a recovery in government investment connected with faster drawdown of EU funds4 and with the domestic component. The investment recovery will also be affected by the repair of flood damage. However, the forecast also assumes that this expenditure will be partly covered by cuts in government consumption. Government consumption will thus go down slightly year on year in 2013. Overall, the forecast expects a negative contribution of fiscal policy to economic activity of around 0.6 percentage point this year, i.e. roughly at the previous year’s level.5 The consolidation measures will affect the economy both through the price effect stemming from the increase in VAT and through lower nominal disposable income, with both factors reducing real household consumption. The estimate of the shortfall in social security contributions associated with the launch of the second pillar of the pension system has been lowered significantly due to the low observed interest in participation in this pillar.
A further decrease in the government deficit to 2% of GDP is expected in 2014, owing mainly to renewed growth in economic activity. On the one hand, the forecast takes into account the continuing effect of the consolidation measures adopted in 2012 (a smaller increase in pensions and the freezing of state employees’ salaries), but on the
3 The marked fall in the government deficit this year compared to 2012 is also due to the financial settlement with churches, which led to a one-off widening of the general government deficit last year under ESA 95 methodology.
4 The share of gross fixed capital formation in the government sector in the drawdown of EU funds has decreased in favour of “soft” expenditure programmes over the forecast horizon, slightly lowering government investment growth in 2013 compared to the previous forecast.
5 The overall fiscal impulse is unchanged from the previous forecast. However, there are small changes in its structure as a result of new information on general government revenue and expenditure (among other things, the effect of the planned accelerated depreciation in 2013 and 2014 has been taken on board).
II. THE FORECAST, ITS CHANGES AND RISKS
a) government budget balance minus interest paymentsb) 2012: impact of property settlement between state and churches. 2013–2015:
impacts of pension reform.c) adjusted for one-off measures; CNB estimated) CNB estimatee) year-on-year change in structural balance (positive value indicates fiscal
restriction, negative value fiscal expansion)
table II.2.4
2012 2013 2014 2015
actual forec. forec. forec.
Government revenue 40.3 41.9 42.4 41.4
Government expenditure 44.6 44.2 44.4 43.7
of which: interest payments 1.5 1.5 1.6 1.6
GOVERNMENT BUDGET BALANCE -4.4 -2.3 -2.0 -2.3
of which:
primary balance a) -2.9 -0.8 -0.5 -0.7
one-off measures b) -1.5 0.0 -0.1 -0.1
ADJUSTED BUDGET BALANCE c) -2.8 -2.4 -2.1 -2.4
Cyclical component (ESCB method) d) -0.5 -0.8 -0.7 -0.3
Structural balance (ESCB method) d) -2.3 -1.4 -1.3 -1.9
Fiscal stance in pp (ESCB method) e) 1.0 0.9 0.2 -0.6
Cyclical component (EC method) d) -0.5 -1.3 -1.0 -0.2
Structural balance (EC method) d) -2.4 -1.0 -1.0 -2.0
Fiscal stance in pp (EC method) e) 0.9 1.4 -0.1 -1.0
Government debt 45.9 47.2 48.0 48.1
FISCALFORECASTFiscalconsolidationwillendin2013andfiscalpolicywillstarttoloosenin2014(% of nominal GDP)
Czech National Bank / Inflation Report III/2013
Czech National Bank / Inflation Report III/2013
19
other hand their restrictive impact on economic growth will be offset by an expected pronounced recovery in government investment. In 2014, therefore, the overall effect of fiscal policy will be broadly neutral.
The general government deficit can be expected to pick up to 2.3% in 2015 despite a continuing economic recovery. This is because a tax reform6 resulting in a considerable decline in direct tax revenue (of almost 1 percentage point of GDP) takes effect in 2015. Fiscal policy will therefore be slightly expansionary in 2015, with a positive contribution to economic activity of around 0.3 percentage point.
The general government structuraldeficit was around 2.3% of GDP in 2012. It is expected to fall below 1.5% of GDP in 2013 and 2014 in connection with the consolidation measures. In 2015 it will return towards 2% of GDP. The structural deficit will deepen amid an expected economic recovery, which would imply pro-cyclical fiscal policy. The expected general government deficit will cause generalgovernmentdebt to increase slightly above 48% of GDP in 2015. In addition to the expected borrowing requirements of general government owing to persisting public finance deficits and the positive effect of the recovery in nominal GDP growth, the prediction of this ratio reflects the announced release of the debt reserve in 2013.
A potential weaker recovery in general government investment activity is a risk to the fiscal forecast towards lower deficits and a more restrictive effect of fiscal policy.
6 The reform consists mainly of changes to indirect taxes and social security contributions, the abolition of dividend tax, a lower VAT registration threshold and higher limits for tax deductions on gifts.
II. THE FORECAST, ITS CHANGES AND RISKS

Czech National Bank / Inflation Report III/2013
20
II.3COMPARISONWITHTHEPREVIOUSFORECAST
The forecasts for headline and monetary-policy relevant inflation are slightly lower than in the previous prediction owing to a downward revision of net inflation. In the near future, the interest rate path falls below the previous forecast as a result of the short-term inflation prediction and generally worse economic activity. In 2014, the difference in rates widens further owing to the extension of the low outlook for foreign interest rates to 2015. The recent evolution of the koruna and a worse outlook for external demand shift the exchange rate path to weaker levels over the entire forecast horizon. The GDP growth forecast for this year is lower as a result of the very low levels observed in Q1 and a slightly weaker outlook for external demand growth. By contrast, the prediction for 2014 is slightly higher. The expected pace of nominal wage growth in the business sector has been revised downwards.
The forecast for annual headlineinflation is slightly lower than the previous forecast (see Chart II.3.1). This change is due to a lower prediction for net inflation, reflecting more subdued economic activity. The assumptions regarding indirect tax changes remain almost the same as in the previous forecast, so the outlook for monetary-policyrelevantinflation has changed in a similar way to that for headline inflation.
Expected administered price inflation in 2013 is only marginally lower than in the previous forecast. A marked fall in the commodity component of the gas price for households of more than 10% was already expected in the previous forecast, but the decline is even more pronounced in reality. Most other items of administered prices were in line with the previous forecast and their outlook is little changed.
Compared to the previous forecast, annual net inflation has been revised downwards (see Chart II.3.2). This is due to more subdued economic activity and a lower short-term prediction for net inflation in 2013 Q3. This forecast primarily reflects substantially lower adjusted inflation excluding fuels (the result of a sharp decrease in prices of telecommunication services), which outweighs the impact of a slightly higher food price prediction. The revision of food prices is due to the high prices of fruit and vegetables observed in June; however, this is largely regarded as a one-off factor and the propagation of its effect is therefore dampened in the forecast.
Turning to theexternalenvironmentoutlook, by comparison with the assumptions of the previous forecast, the path of external demand and foreign producer prices has decreased slightly. The 3M EURIBOR outlook is almost unchanged, but the outlook has been extended by one year to the end of 2015. Even at this horizon the outlook for foreign rates is significantly lower than their long-term equilibrium values. This is fostering lower domestic interest rates in the forecast.
II. THE FORECAST, ITS CHANGES AND RISKS
-0.4
-0.2
0.0
0.2
0.4
I/09 I/15I/10 I/11 I/12 I/13 I/14
0
1
2
3
4
DifferencesPrevious forecast New forecast
CHANGEINTHEHEADLINEINFLATIONFORECASTTheforecastforheadlineinflationhasbeenreviseddownwardsslightly(year on year in %; differences in pp – right-hand scale)
Chart II.3.1
-0.6
-0.3
0.0
0.3
0.6
-2
-1
0
1
2
I/09 I/15I/10 I/11 I/12 I/13 I/14
DifferencesPrevious forecast New forecast
CHANGEINTHENETINFLATIONFORECASTTheforecastfornetinflationhasmoveddownwards(year on year in %; differences in pp – right-hand scale)
Chart II.3.2
-0.8
-0.4
0.0
0.4
I/09 I/15I/10 I/11 I/12 I/13 I/14
DifferencesPrevious forecast New forecast
0
1
2
3
CHANGEINTHEINTERESTRATEPATHThemarketinterestratepathislowerovertheentirehorizon(3M PRIBOR in %; differences in pp – right-hand scale)
Chart II.3.3

Czech National Bank / Inflation Report III/2013
21
The forecast for domestic marketinterestrateshas moved downwards over the entire horizon (see Chart II.3.3). Lower rates are being fostered mainly by the external environment outlook, as the impact of lower foreign producer prices and the extended outlook for very low 3M EURIBOR rates gradually outweigh the depreciation effect of the slower recovery in external demand (see Chart II.3.4). The short-term inflation prediction and next year also a more anti-inflationary initial state, reflecting more subdued domestic economic activity, are also fostering lower rates. Expert adjustments reducing the equilibrium exchange rate appreciation, which are lowering inflation pressures by dampening the Balassa-Samuelson effect, are also acting in the same direction. Acting slightly against the overall anti-inflationary effect of the above factors are the inclusion of a moderately expansive fiscal policy in 2015 and the outlook for administered prices. The short-term exchange rate prediction is having a broadly neutral effect on interest rates, as its weaker level compared to the previous forecast is due to fundamentals.
The forecast for the nominal exchangerateofthekorunaagainstthe euro has been revised towards weaker levels over the entire horizon (see Chart II.3.5). Besides a weaker initial level, this is also due to a worse external demand outlook outweighing the effect of the extended outlook for low foreign interest rates. The expert adjustments reducing the equilibrium rate of appreciation are also fostering a weaker exchange rate compared to the previous forecast.
The forecast for annual GDP growth is 1 percentage point lower for this year (see Chart II.3.6). This is due chiefly to the lower growth observed in 2013 Q1 and a slightly worse outlook for external demand. The prediction of household consumption growth has shifted from slightly negative to slightly positive levels, owing to new observed data for 2013 Q1 and a revision of the data for 2012. The GDP forecast is 0.3 percentage point higher in 2014, with base effects outweighing a more gradual recovery in external demand.
The contribution of net exports to GDP growth will be roughly comparable with the previous forecast despite lower overall volumes of exports and imports reflecting weaker external demand. From the end of this year, more subdued import-intensive investment and partly also slower export growth will foster weaker import growth as well. The contribution of net exports to GDP growth in 2014 will be slightly lower than in the previous forecast.
The forecast for averagenominalwage growth in the business sector has been lowered compared to the previous prediction. This is due mainly to a more subdued outlook for domestic economic activity and inflation. The estimate of tax optimisation in late 2012/early 2013 linked with the abolition of the cap on health insurance and the additional taxation of higher income remains unchanged.
II. THE FORECAST, ITS CHANGES AND RISKS
Initial state Foreign environmentAdministered prices Fiscal policy
Expert judgementShort-term exch. rate forecast Short-term inflation
forecast
III/13 IV I/14 II III IV
-0.6
-0.4
-0.2
-0.0
0.2
Difference
DECOMPOSITIONOFCHANGESINTHEINTERESTRATEFORECASTLowerratesarebeingfosteredintheneartermprimarilybytheshort-terminflationforecast,whiletheextendedoutlookforforeignratesandamoresubdueddomesticeconomydominateinthelongerterm(3M PRIBOR; percentage points)
Chart II.3.4
-0.6
-0.3
0.0
0.3
0.6
I/09 I/15I/10 I/11 I/12 I/13 I/14
DifferencesPrevious forecast New forecast
24
25
26
27
28
CHANGEINTHEEXCHANGERATEFORECASTTheexchangerateforecasthasmovedtoweakerlevels(CZK/EUR; differences in CZK – right-hand scale)
Chart II.3.5
-2
-1
0
1
-8
-4
0
4
I/09 I/15I/10 I/11 I/12 I/13 I/14
DifferencesPrevious forecast New forecast
CHANGEINTHEGDPFORECASTTheGDPgrowthforecasthasbeenreviseddownwardsnoticeablyforthisyearbutisslightlyhigherfornextyear(annual percentage changes; differences in pp – right-hand scale; seasonally adjusted)
Chart II.3.6

Czech National Bank / Inflation Report III/2013
22
II.4ALTERNATIVESCENARIOSANDSENSITIVITYANALYSES
Several risks and uncertainties were identified during the preparation of the forecast. A significant risk is still associated with the possibility of a slower recovery in external demand amid a continuing euro area debt crisis. This would imply a need for even easier monetary conditions compared to the forecast. Another source of uncertainty is the published data on the GDP structure for 2013 Q1, when a marked drop in additions to inventories and a significant quarter-on-quarter rise in household consumption were recorded. The effect of opposing price factors in the recent period (a decline in prices of telecommunication services versus growth in volatile food price items) and their propagation to future inflation are another uncertainty. However, these risks and uncertainties are not sufficiently clear-cut to lead to the preparation of an alternative scenario. An exchange rate sensitivity scenario was prepared as usual.
II.4.1Exchangeratesensitivityscenario
The sensitivity scenario quantifies the impacts of a possible differentexchange rate path. This standard sensitivity scenario assumes a deviation of the nominal exchange rate of ±3% from the forecast in the first quarter of the forecast. Interest rates in that quarter are the same as in the forecast. The exchange rate is thus CZK 26.6/25.0 to the euro in 2013 Q3, compared to CZK 25.8 in the forecast.
The table shows the results of the depreciation scenario, expressed as deviations from the forecast (see Table II.4.1). The scenario of a stronger nominal exchange rate leads to the same results but with the opposite sign.
Exchange rate depreciation improves exporters’ price competitiveness and, via higher net exports, leads to slightly higher GDP growth compared to the forecast at the start of the forecast horizon. It also results in higher import prices and temporarily higher inflation. The market interest rate path is therefore higher than in the forecast over the next few quarters. However, GDP growth then slows slightly below the forecast in response to tighter monetary policy and an exchange rate correction.
II. THE FORECAST, ITS CHANGES AND RISKS
table II.4.1
CPIinflation(inpp)
3MPRIBOR(inpp)
GDPgrowth(inpp)
Nominalexchange
rate(CZK/EUR)
III/13 0.0 0.0 0.1 0.8
IV/13 0.1 0.3 0.2 0.2
I/14 0.1 0.4 0.1 0.1
II/14 0.2 0.3 0.0 0.0
III/14 0.2 0.2 -0.2 0.0
IV/14 0.2 0.0 -0.3 0.0
I/15 0.1 0.0 -0.2 0.0
II/15 0.0 0.0 0.0 0.0
III/15 0.0 0.0 0.1 0.0
IV/15 0.0 0.0 0.1 0.0
EXCHANGERATESENSITIVITYSCENARIOExchangeratedepreciationleadstotemporarilyhigherinflationandhigherGDPgrowththanintheforecast;interestratesincrease(deviations from forecast)

Czech National Bank / Inflation Report III/2013
23
II.5FORECASTSBYOTHERENTITIES
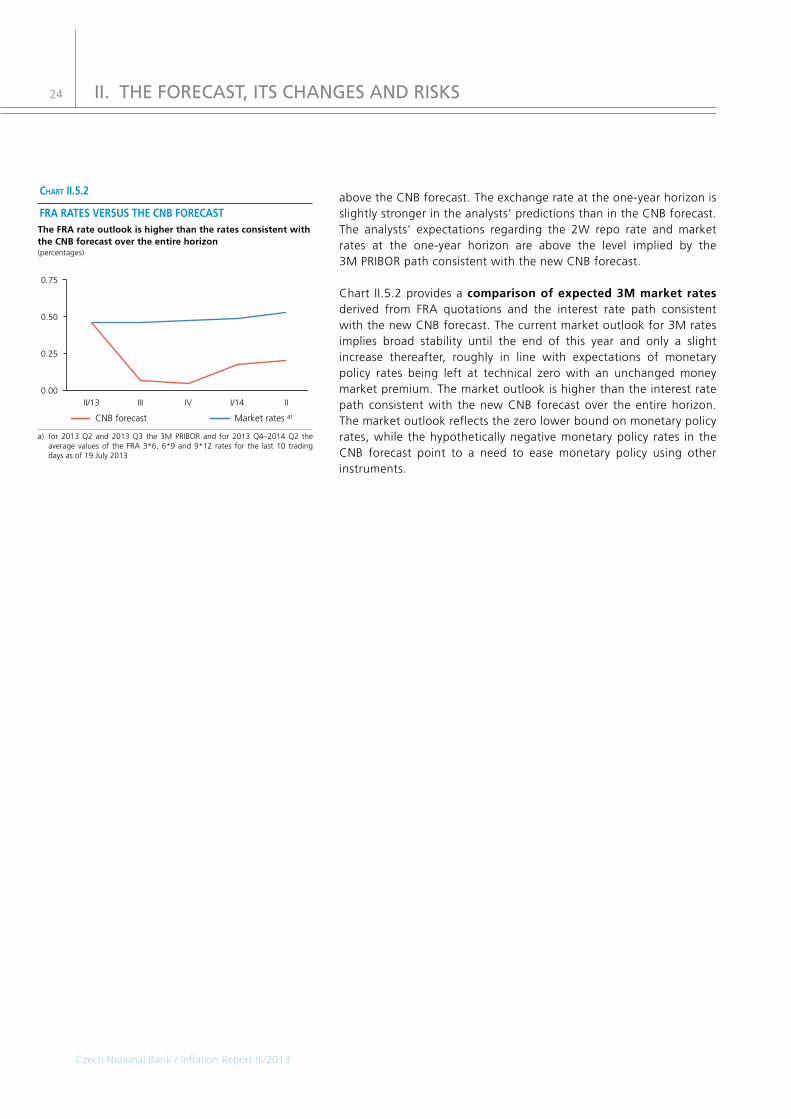
Analysts’ inflation expectations were below the CNB’s target of 2% at the one-year horizon and very close to the target at the three-year horizon. The analysts expect GDP to decline this year. All the analysts were expecting stable key rates before the CNB Bank Board meeting in August. A large majority of them also expect the koruna to appreciate and the CNB’s 2W repo rate as well as market interest rates to be flat in the following 12 months. The market rate outlook one year ahead also indicates expectations of broad stability and is above the interest rate path consistent with the new CNB forecast over the entire forecast horizon.
Inflationexpectedby financialmarketanalystsat the one-year horizon was below the CNB’s target from early 2013. The inflation expectations of business managers fell slightly but remained above the CNB’s target of 2% (see Table II.5.1). The analysts’ inflation expectations at the three-year horizon were very close to the target.
The indicator of inflationperceivedbyhouseholdswas only slightly positive in 2013 H1 (see Chart II.5.1). This means that households on average felt that prices rose moderately over the last 12 months. The indicator ofexpectedinflation is also positive, slightly above the level of perceived inflation. This suggests that the number of respondents who expect prices to rise more rapidly over the next 12 months is higher than the number of those who expect prices to stay the same or increase more slowly than in the recent past. Both indicators fell on average in 2013 Q2.
BoththeFMIEandCFanalysts expect GDP to fall by less than 1% this year. The expected decline has gradually deepened in recent months (see Table II.5.1 and Table II.5.2). Next year the economy should expand by almost 2%, and wage growth should also accelerate. Compared to the average koruna exchange rate so far in July 2013, the analysts participating in both the FMIE and the CF expect the exchange rate to be stronger at the one-year horizon (by 2.9% and 2.6% respectively). Before the August CNB Bank Board meeting, all 12 analysts participating in the FMIE survey were expecting key interest rates to remain unchanged at this meeting and the monetary conditions not to be eased further using foreign exchange interventions7. A large majority of the analysts also expect rates to remain flat at the current level at the one-year horizon. Their estimates for the 2W repo rate lie in the range of 0.05–0.25%.
Overall, comparedtotheCNB’snewforecast, the analysts expect a less pronounced decline in real GDP this year, but next year they expect the economy to grow at a lower pace than predicted by the CNB. Inflation expected by the analysts at the one-year horizon is just
7 Only one analyst regarded foreign exchange interventions as possible, with a probability of 50%.
II. THE FORECAST, ITS CHANGES AND RISKS
table II.5.1
3/13 4/13 5/13 6/13 7/13
FMIE:
CPI 1.7 1.7 1.7 1.6 1.6
CPI, 3Y horizon 1.9 1.9 2.0 2.1 2.1
Real GDP in 2013 0.0 -0.1 -0.3 -0.7 -0.8
Real GDP in 2014 1.7 1.7 1.8 1.8 1.7
Nominal wages in 2013 2.2 2.1 1.9 1.5 1.1
Nominal wages in 2014 2.9 2.9 2.8 2.8 2.5
CZK/EUR exchange rate (level)
25.1 25.2 25.2 25.1 25.2
2W repo rate (in per cent) 0.1 0.1 0.1 0.1 0.1
1Y PRIBOR (in per cent) 1.0 0.9 0.9 0.9 0.9
Corporations:
CPI 2.4 2.2
EXPECTEDINDICATORSOFFMIEANDCORPORATIONSTheinflationexpectationsofanalystsattheone-yearhorizonwerebelowtheCNB’starget(at 1Y; annual percentage changes unless otherwise indicated)
table II.5.2
3/13 4/13 5/13 6/13 7/13
Real GDP in 2013 0.0 -0.1 -0.3 -0.7 -0.9
Real GDP in 2014 1.7 1.7 1.7 1.7 1.8
Nominal wages in 2013 2.3 2.1 1.7 1.5 1.0
Nominal wages in 2014 3.0 2.9 2.7 2.7 2.6
CZK/EUR exchange rate (level)
25.3 25.3 25.3 25.5 25.3
3M PRIBOR (in per cent) 0.5 0.5 0.5 0.6 0.6
CFEXPECTEDINDICATORSTheCFanalystsexpecttheeconomytocontractthisyear(at 1Y; annual percentage changes unless otherwise indicated)
Next 12 monthsLast 12 months
1/09 1/10 1/11 1/131/11-100
-75
-50
-25
0
25
50
75
100
PERCEIVEDANDEXPECTEDINFLATIONTheinflationexpectationsofhouseholdsdecreasedslightlyin2013Q2(source: European Commission Business and Consumer Survey)
Chart II.5.1
Czech National Bank / Inflation Report III/2013
24
above the CNB forecast. The exchange rate at the one-year horizon is slightly stronger in the analysts’ predictions than in the CNB forecast. The analysts’ expectations regarding the 2W repo rate and market rates at the one-year horizon are above the level implied by the 3M PRIBOR path consistent with the new CNB forecast.
Chart II.5.2 provides a comparisonofexpected3Mmarketratesderived from FRA quotations and the interest rate path consistent with the new CNB forecast. The current market outlook for 3M rates implies broad stability until the end of this year and only a slight increase thereafter, roughly in line with expectations of monetary policy rates being left at technical zero with an unchanged money market premium. The market outlook is higher than the interest rate path consistent with the new CNB forecast over the entire horizon. The market outlook reflects the zero lower bound on monetary policy rates, while the hypothetically negative monetary policy rates in the CNB forecast point to a need to ease monetary policy using other instruments.
II. THE FORECAST, ITS CHANGES AND RISKS
IVIIIII/13 III/140.00
0.25
0.50
0.75
Market rates a)CNB forecast
FRARATESVERSUSTHECNBFORECASTTheFRArateoutlookishigherthantheratesconsistentwiththeCNBforecastovertheentirehorizon(percentages)
Chart II.5.2
a) for 2013 Q2 and 2013 Q3 the 3M PRIBOR and for 2013 Q4–2014 Q2 the average values of the FRA 3*6, 6*9 and 9*12 rates for the last 10 trading days as of 19 July 2013

Czech National Bank / Inflation Report III/2013
25
III.CURRENTECONOMICDEVELOPMENTS
III.1INFLATION
Headline annual inflation stood at 1.6% in June 2013 and was thus below the CNB’s target. At 0.9%, monetary-policy relevant inflation was just below the lower boundary of the tolerance band around the CNB’s target. The further slight decline in annual inflation in 2013 Q2 compared to Q1 was due to administered prices and adjusted inflation excluding fuels. By contrast, food price inflation gathered pace, particularly at the end of the quarter. In an environment of subdued economic activity and a continuing anti-inflationary effect of the domestic economy, market price inflation remained low overall. Falling oil prices also contributed to the low inflation in 2013 Q2.
III.1.1Fulfilmentoftheinflationtarget
Headline inflation was below the CNB’s target in 2013 Q2 (see Chart III.1.1), while monetary-policy relevant inflation was slightly below the lower boundary of the tolerance band around the target. This section of the Inflation Report briefly analyses the contribution of the CNB’s monetary policy to this situation. In order to assess the effect of monetary policy on the fulfilment of the inflation target one needs toanalyseretrospectivelytheforecastsand the Bank Board’s decisions based thereon in the past. To assess the fulfilment of the inflation target in 2013 Q2, we have to examine above all the period roughly from October 2011 to June 2012 (referred to as the “key period”), as monetary policy is focused on hitting the inflation target at the 12–18 month horizon. For the sake of clarity, the analysis of the accuracy of the forecasts is limited here to a comparison of the Inflation Report I/2012 forecast with subsequent inflation.
The Inflation Report I/2012 forecast expected headline inflation to stand just above 3% and monetary-policy relevant inflation to be close to the inflation target in 2012 owing to tax changes. Both headline and monetary-policy relevant inflation were expected to fall below the inflation target in 2013 (see Chart III.1.1). The inflationary effect of import prices was expected to persist at the start of the forecast horizon, but fade gradually thanks to renewed exchange rate appreciation. Cost pressures from the domestic economy, which were anti-inflationary at the start of the forecast horizon, were expected to start to resurge at the end of 2012 as both external and domestic activity recovered. The forecast predicted that a decline in inflation slightly below the target would also be fostered by a pronounced slowdown in food and fuel price inflation.
Headline inflation in reality was slightly above the forecast over almost the entire forecast horizon. It was then in line with the forecast in 2013 Q2, although the forecast had not counted on the increase in both VAT rates at the start of 2013. This was a result of opposite deviations of the individual components of inflation. The first-round
III. CURRENT ECONOMIC DEVELOPMENTS
IR I/2012 forecast
Actual inflation
Inflation target
IV/11 I/12 I/13II IIIVIII
0
1
2
3
4
FORECASTVERSUSACTUALINFLATIONInflationwasbelowthetargetinlinewiththeIRI/2012forecastin2013Q2(year on year in %)
Chart III.1.1
a) impact in non-administered prices on total inflationb) excluding the first-round effects of changes to indirect taxesc) Owing to rounding, the total difference may not be equal.
table III.1.1
IR I/2012 forecast
2013 Q2 outturn
Contribution to total
differencec)
CONSUMER PRICES 1.5 1.5 0.1
Breakdown into contributions:
administered prices 3.0 2.6 -0.1
first-round impacts of changes to indirect taxesa) -0.2 0.6 0.9
food pricesb) 1.1 3.8 0.7
fuel pricesb) -1.2 -3.7 -0.1
adjusted inflation excl. fuelsb) 1.8 -0.6 -1.3
FULFILMENTOFTHEINFLATIONFORECASTAdjustedinflationexcludingfuelswassignificantlylowerthanforecasted,whilethefirst-roundeffectsofchangestoindirecttaxesandfoodpriceswerehigherthanforecasted(annual percentage changes; contributions in percentage points)
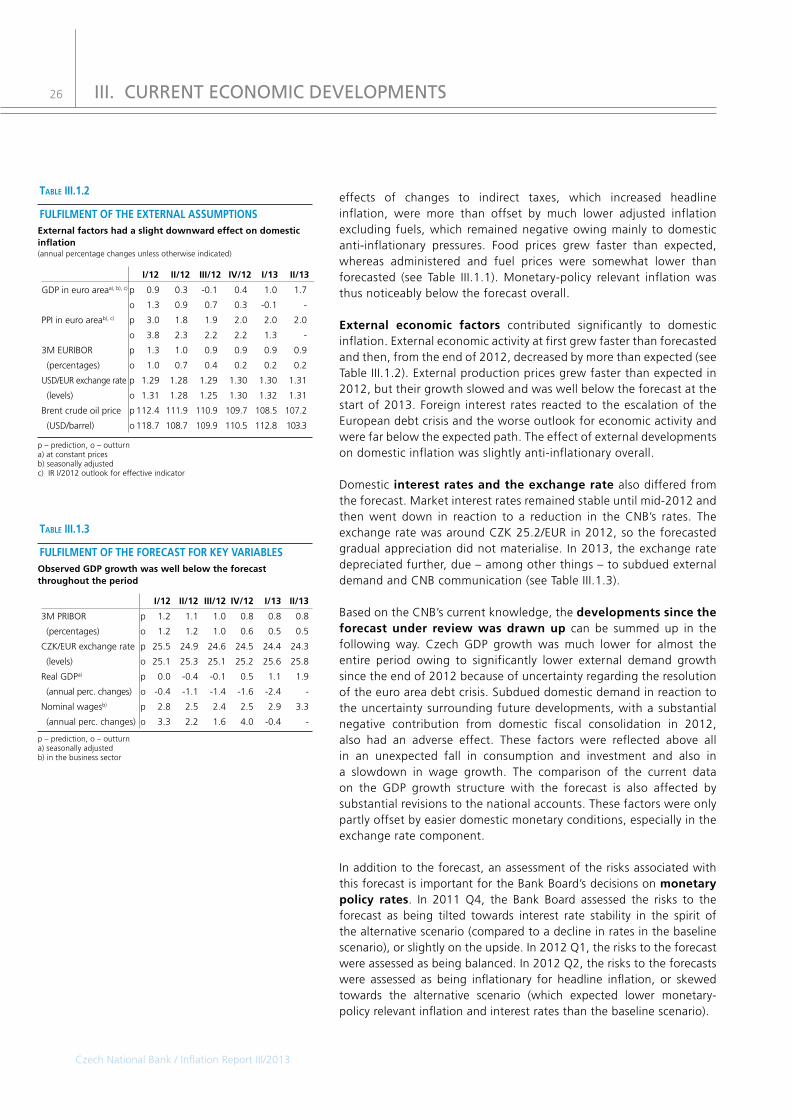
Czech National Bank / Inflation Report III/2013
26
effects of changes to indirect taxes, which increased headline inflation, were more than offset by much lower adjusted inflation excluding fuels, which remained negative owing mainly to domestic anti-inflationary pressures. Food prices grew faster than expected, whereas administered and fuel prices were somewhat lower than forecasted (see Table III.1.1). Monetary-policy relevant inflation was thus noticeably below the forecast overall.
External economic factors contributed significantly to domestic inflation. External economic activity at first grew faster than forecasted and then, from the end of 2012, decreased by more than expected (see Table III.1.2). External production prices grew faster than expected in 2012, but their growth slowed and was well below the forecast at the start of 2013. Foreign interest rates reacted to the escalation of the European debt crisis and the worse outlook for economic activity and were far below the expected path. The effect of external developments on domestic inflation was slightly anti-inflationary overall.
Domestic interestratesandtheexchangeratealso differed from the forecast. Market interest rates remained stable until mid-2012 and then went down in reaction to a reduction in the CNB’s rates. The exchange rate was around CZK 25.2/EUR in 2012, so the forecasted gradual appreciation did not materialise. In 2013, the exchange rate depreciated further, due – among other things – to subdued external demand and CNB communication (see Table III.1.3).
Based on the CNB’s current knowledge, the developmentssincetheforecast under review was drawn up can be summed up in the following way. Czech GDP growth was much lower for almost the entire period owing to significantly lower external demand growth since the end of 2012 because of uncertainty regarding the resolution of the euro area debt crisis. Subdued domestic demand in reaction to the uncertainty surrounding future developments, with a substantial negative contribution from domestic fiscal consolidation in 2012, also had an adverse effect. These factors were reflected above all in an unexpected fall in consumption and investment and also in a slowdown in wage growth. The comparison of the current data on the GDP growth structure with the forecast is also affected by substantial revisions to the national accounts. These factors were only partly offset by easier domestic monetary conditions, especially in the exchange rate component.
In addition to the forecast, an assessment of the risks associated with this forecast is important for the Bank Board’s decisions onmonetarypolicy rates. In 2011 Q4, the Bank Board assessed the risks to the forecast as being tilted towards interest rate stability in the spirit of the alternative scenario (compared to a decline in rates in the baseline scenario), or slightly on the upside. In 2012 Q1, the risks to the forecast were assessed as being balanced. In 2012 Q2, the risks to the forecasts were assessed as being inflationary for headline inflation, or skewed towards the alternative scenario (which expected lower monetary-policy relevant inflation and interest rates than the baseline scenario).
p – prediction, o – outturna) at constant pricesb) seasonally adjustedc) IR I/2012 outlook for effective indicator
table III.1.2
I/12 II/12 III/12 IV/12 I/13 II/13
GDP in euro areaa), b), c) p 0.9 0.3 -0.1 0.4 1.0 1.7
o 1.3 0.9 0.7 0.3 -0.1 -
PPI in euro areab), c) p 3.0 1.8 1.9 2.0 2.0 2.0
o 3.8 2.3 2.2 2.2 1.3 -
3M EURIBOR p 1.3 1.0 0.9 0.9 0.9 0.9
(percentages) o 1.0 0.7 0.4 0.2 0.2 0.2
USD/EUR exchange rate p 1.29 1.28 1.29 1.30 1.30 1.31
(levels) o 1.31 1.28 1.25 1.30 1.32 1.31
Brent crude oil price p 112.4 111.9 110.9 109.7 108.5 107.2
(USD/barrel) o 118.7 108.7 109.9 110.5 112.8 103.3
FULFILMENTOFTHEEXTERNALASSUMPTIONSExternalfactorshadaslightdownwardeffectondomesticinflation(annual percentage changes unless otherwise indicated)
p – prediction, o – outturna) seasonally adjustedb) in the business sector
table III.1.3
I/12 II/12 III/12 IV/12 I/13 II/13
3M PRIBOR p 1.2 1.1 1.0 0.8 0.8 0.8
(percentages) o 1.2 1.2 1.0 0.6 0.5 0.5
CZK/EUR exchange rate p 25.5 24.9 24.6 24.5 24.4 24.3
(levels) o 25.1 25.3 25.1 25.2 25.6 25.8
Real GDPa) p 0.0 -0.4 -0.1 0.5 1.1 1.9
(annual perc. changes) o -0.4 -1.1 -1.4 -1.6 -2.4 -
Nominal wagesb) p 2.8 2.5 2.4 2.5 2.9 3.3
(annual perc. changes) o 3.3 2.2 1.6 4.0 -0.4 -
FULFILMENTOFTHEFORECASTFORKEYVARIABLESObservedGDPgrowthwaswellbelowtheforecastthroughouttheperiod
III. CURRENT ECONOMIC DEVELOPMENTS

Czech National Bank / Inflation Report III/2013
27
Overall, monetary policy in the key period can be assessed as follows. Market interest rates remained stable until mid-2012 and then decreased in reaction to the CNB’s rate cuts in June – roughly in line with the forecasts. Headline inflation was below the target in 2013 Q2 despite strong impacts of tax changes, while monetary-policy relevant inflation was below the lower boundary of the tolerance band around the CNB’s target. Most of the identified risks materialised in the key period, with anti-inflationary risks prevailing overall. From this perspective, based on current knowledge, it seems that the monetary policy pursued between October 2011 and June 2012 should have been easier.
III.1.2Currentinflation
Annual inflation8 decreased slightly overall in 2013 Q2. At 1.6% in June, it was 0.1 percentage point lower than in March 2013 (see Chart III.1.2). This change was due to a continued decline in administered price inflation and considerably lower adjusted inflation excluding fuels. These effects, however, were largely offset by higher food price inflation (see Chart III.1.3).
Although the contribution of market prices to annual inflation was somewhat higher in 2013 Q2, the structure of annual inflationcontinued to be greatly affected by administrative factors, i.e. changes to indirect taxes and administered prices. Nonetheless, their contribution to overall annual consumer price inflation fell noticeably (see Chart III.1.4).
Owing to an increase in both VAT rates of one percentage point and an as yet insignificant rise in excise duty on tobacco products at the start of this year, changes to indirect taxes contributed about 0.63 percentage point to annual market price inflation. The overall first-round effect of tax changes on inflation including administered prices was roughly 0.76 percentage point. Monetary-policyrelevantinflation, i.e. inflation adjusted for the effects of all the changes to indirect taxes, stayed well below annual headline inflation. In June it was 0.9% (see Chart III.1.2).
Annual administeredpriceinflation slowed further in 2013 Q2. At 2.2% in June, it was more than one percentage point lower than in March (see Chart III.1.3). This change was due to a marked reduction in the commodity component of the retail price of gas by a dominant supplier. Owing to growing competition, most other sellers of gas to households then responded to this reduction. Nonetheless, housing-related items remained the main contributors to annual administered price inflation, as other housing costs – electricity prices, water supply and sewerage collection charges, heat prices and waste collection
8 Measured by year-on-year growth in consumer prices.
-8
-6
-4
-2
0
2
4
6
8
-25-20-15-10-505
10152025
1/09 1/10 1/11 1/12 1/13
Administered prices (right-hand scale)
Food pricesAdjusted inflation excluding fuels
Fuel prices (right-hand scale)
INFLATIONCOMPONENTSAdministeredpricesandadjustedinflationexcludingfuelscontributedtothedecreaseininflation(annual percentage changes; excluding indirect tax changes)
Chart III.1.3
Monetary-policy relevant inflation Consumer price inflation
1/09 1/10 1/11 1/12 1/13
-1
0
1
2
3
4
INFLATIONInflationdecreasedslightlyoverallin2013Q2(year on year in %)
Chart III.1.2
Annual consumer price inflation (in per cent)
Administered pricesIndirect taxes in non-administered pricesFood prices (including alcoholic beverages and tobacco)
Adjusted inflation excluding fuels and food
Fuel prices
1/12 3 5 7 1/139 11 3 5
-1
0
1
2
3
4
STRUCTUREOFINFLATIONThecontributionofadministrativeeffectstoinflationdecreased,whereasthatoffoodpricesincreased(annual percentage changes; contributions in percentage points)
Chart III.1.4
III. CURRENT ECONOMIC DEVELOPMENTS

Czech National Bank / Inflation Report III/2013
28
charges – also showed quite fast growth. The following text assesses the evolution of the main components of market price inflation adjusted for the tax changes.
Market prices, as measured by net inflation, saw a rise in annual growth in 2013 Q2 (from 0.4% in March to 0.7% in June). The rise in annual net inflation was a result of contrary movements in adjusted inflation excluding fuels and annual food price inflation, with the effect of food prices prevailing in 2013 Q2.
The still generally low annual net inflation, and particularly the deepening decline in prices within adjusted inflation in 2013 Q2, indicated a persisting anti-inflationary effect of subdued domestic economic activity. Low net inflation was also fostered by a substantial decline in oil price growth on global markets, which halted only at the end of the period under review. By contrast, import prices of final products for the consumer market rose slightly owing to year-on-year depreciation of the koruna against the euro. However, net inflation was pushed upwards most strongly by food prices.
The noticeable pick-up in annual food price inflation in 2013 Q2 (from 2.4% in March to 4.1% in June; see Chart III.1.5) was due to several factors. Growth in agricultural producer prices in crop production started to slow significantly, but food prices were still being affected, with a lag, by its previous high values. Food prices were affected even more noticeably by rising prices in the vegetables category, potatoes in particular, whose strong annual growth in 2013 Q2 fostered a rise in annual inflation of 0.2 percentage point on average.9
The effect of the subdued domestic economic activity and low consumer demand was still most apparent in annual adjustedinflation excluding fuels, whose negative values deepened in 2013 Q2 (from -0.3% in March to -0.7% in June; see Chart III.1.6). This change was linked with a halt in annual growth in prices of non-tradable commodities, due mainly to mobile operators, who lowered prices of telecommunication services. By contrast, annual growth in prices of other tradable commodities excluding food and fuels turned less negative, mainly because of a more moderate decline in prices in the clothing and footwear category.
Annual fuelpriceinflation reflected the oil and petrol price volatility on global markets in 2013 Q2. Both oil and petrol prices were still falling at double-digit rates in April in year-on-year terms, but turned positive in June due to base effects. The annual decline in fuel prices thus deepened further in April and May, but returned to more modest levels in June (-1.6%; see Chart III.1.3).
9 This year-on-year increase in prices (of 75% on average in 2013 Q2) was due largely to a delayed harvest of early potatoes caused by bad weather.
III. CURRENT ECONOMIC DEVELOPMENTS
-6-5-4-3-2-101234
1/09 1/11 1/12 1/131/10
Prices of non-tradables (except administered prices)Prices of other tradables (except food and fuels)
Adjusted inflation (except fuels)
ADJUSTEDINFLATIONEXCLUDINGFUELSAdjustedinflationexcludingfuelsturnedmorenegativeasgrowthinpricesofnon-tradableshalted(annual percentage changes)
Chart III.1.6
-10-8-6-4-202468
10
1/09 1/10 1/11 1/12 1/13
Food prices (including indirect tax changes)Food prices (excluding indirect tax changes)Producer prices in manufacture of food, beverages and tobaccoAgricultural producer prices (right-hand scale)
-40
-20
0
20
40
FOODPRICESFoodpriceinflationincreasedin2013Q2(annual percentage changes)
Chart III.1.5

Czech National Bank / Inflation Report III/2013
29
III.2IMPORTPRICESANDPRODUCERPRICES
Import prices fluctuated close to zero in April and May 2013 in year-on-year comparison. Prices of energy and non-energy commodities continued falling owing to a decline in commodity prices on global markets. Import prices of semi-finished products saw only modest growth, whereas import prices of products with a high degree of processing recorded stronger growth due to a weaker exchange rate, as did prices of imported food. Industrial producer price inflation declined further in 2013 Q2. Owing to falling commodity prices and persisting low demand, branches with falling or only slightly rising prices were predominant. Agricultural producer price inflation slowed quite significantly as well. The year-on-year decline in construction work prices and prices of market services in the business sector increased further amid persisting low domestic demand.
III.2.1Importprices
As in 2013 Q1, annual import price inflation was around zero in April and May (see Chart III.2.1). According to the latest data for May, import prices fell by 1.1% year on year (compared to a 0.8% increase in April). These fluctuations were mostly due to rising prices of products with a high degree of processing, whose impact on import price inflation was moderated by a stronger decline in import prices of mineral fuels and lubricants.
The year-on-year decline in import prices of mineral fuels, which have been falling constantly since January 2013, increased to -8.8% in May (see Chart III.2.2). This was a result of falling dollar prices of oil and natural gas on global markets. The koruna-dollar exchange rate depreciated slightly during 2013 Q1 and Q2, but this change merely softened the impact of the falling prices of the above energy commodities on import prices (see Chart III.2.3).10 The contribution of import prices of mineral fuels to overall annual import price inflation has thus been constantly negative since January 2013 and increased further in 2013 Q2, reaching -1.5 percentage points in May.
Import prices of non-energycommodities also continued to fall in April and May 2013. This decline has been observed for a year now. Moreover, it deepened again (to -5.7% in May). Import prices of semi-finished products started rising again year on year in March. This growth picked up slightly in April owing mainly to a weaker exchange rate, but was again close to zero in May (see Table III.2.1).
Unlike commodities and semi-finished products, import prices of foodandliveanimalscontinued to record substantial year-on-year growth. This growth peaked at 7.2% in April and then fell back to
10 The koruna-dollar exchange rate depreciated by 5.2% year on year in April 2013, but weakened only slightly in May (by 0.6%).
III. CURRENT ECONOMIC DEVELOPMENTS
Import prices, total (annual percentage changes)
Non-energy commoditiesCommodities with a high degree of processing
Mineral fuels, lubricants and related materialsSemi-finished products
Food and live animals
95 73 531/12 1/1311
-3-2-1012345678
IMPORTPRICESImportpriceinflationfluctuatedaroundzero(annual percentage changes; contributions in percentage points)
Chart III.2.2
Construction work pricesIndustrial producer pricesMarket services prices
Import prices
Agricultural producer prices (right-hand scale)
1/09 1/11 1/12 1/131/10
-10
-5
0
5
10
-40
-20
0
20
40
IMPORTPRICESANDPRODUCERPRICESImportpriceinflationandindustrialproducerpriceinflationweresubduedin2013Q2,whileagriculturalproducerpriceinflationslowed(annual percentage changes)
Chart III.2.1
Natural gasBrent crude oilImport prices of mineral fuels, lubricants and related materials
CZK/USD exchange rate
1/09 1/11 1/12 1/131/10
-80
-60
-40
-20
0
20
40
60
80
100
MINERALFUELSPricesofimportedmineralfuelsandlubricantswentdown,mainlybecauseoffallingglobalpricesofoilandnaturalgas(annual percentage changes)
Chart III.2.3

Czech National Bank / Inflation Report III/2013
30
5.5% in May. It was fostered by a weaker exchange rate against both the euro and the dollar and by prices of some volatile items (vegetables in particular), whereas global prices of the main food commodities were falling. Import prices of chemicals and related products saw only very modest growth before declining year on year in May, mainly due to falling global oil prices.
Import prices of high-value-added commodities11 continued to record year-on-year growth in the first two months of 2013 Q2. The growth has increased overall in the last three months (see Table III.2.1), mainly because of the year-on-year depreciation of the koruna-euro exchange rate, as inflation abroad has been low.
III.2.2Producerprices
Industrial producer pricesThe slowdown in annual industrialproducerpriceinflation visible since 2012 Q4 continued overall in 2013 Q2. After falling to a three-year low (0.3%) in May, it picked up slightly in June (to 0.7%; see Chart III.2.4).
A closer look at the pricegrowth structure suggests that the anti-inflationary factors were more or less across-the-board in their effect. This is evidenced by the fact that more than half of the main industries recorded falling prices and only a small number had noticeably rising prices. The low industrial producer price inflation was due mainly to the continuing decline in global prices of energy commodities and prices of imported non-energy inputs, whereas exchange rate depreciation and still fast price growth in the food industry acted in the opposite direction. At the same time, rising prices of energy, especially electricity, pushed up producers’ costs (see Chart III.2.5). Falling producer prices in other branches of manufacturing from May onwards confirmed that there is a close link between these prices and the generally subdued demand and falling prices of most of the main production inputs.
Owing to the aforementioned evolution of dollar oil prices and the koruna-dollar exchange rate, the year-on-year decline in producer prices in themanufactureofcokeandrefinedpetroleumproductsdeepened to -8.8% in May; this decline then moderated to -1.4% in June12 (see Chart III.2.4). Producer prices in the manufacture ofbasicmetalsandfabricatedmetalproducts continued to record an annual decline of about -2% in 2013 Q2. Producer price inflation in the foodindustry fell slightly below 4%, probably as a result of a gradual unwinding of the high growth in prices of agricultural inputs of crop origin amid a weak recovery in livestock production price inflation.
11 This category contains machinery, transport equipment and miscellaneous manufactured articles. Their prices are affected mainly by the koruna-euro exchange rate, which depreciated by 2.2% and 0.5% year on year in May and June respectively.
12 This was due mainly to the year-on-year evolution of oil prices – see Chart III.2.3.
table III.2.1
2/13 3/13 4/13 5/13
IMPORTS, TOTAL -0.5 1.1 0.8 -1.1of which: food and live animals 3.3 6.8 7.2 5.5 beverages and tobacco 8.3 11.1 11.4 9.7 crude materials inedible, except fuels -7.6 -3.9 -5.4 -5.7 mineral fuels and related products -4.0 -4.8 -7.0 -8.8 animal and vegetable oils 1.6 0.0 -4.3 -8.2 chemicals and related products 0.3 1.4 0.5 -2.3 manufactured goods classified chiefly by material -0.2 1.7 1.9 0.1
machinery and transport equipment 0.3 2.7 2.8 0.8 miscellaneous manufactured articles 1.0 3.3 3.1 2.2
STRUCTUREOFIMPORTPRICEINFLATIONImportpricesofcrudematerialswentdown,whileimportpricesoffood,commoditieswithahighdegreeofprocessingandsemi-finishedproductswentup(annual percentage changes)
Total PPI (annual percentage changes)
Mining and quarrying and power generationManufacture of food, beverages and tobacco
Manufacture of coke and refined petroleum productsManufacture of basic metals and fabricated metal products
Other branches of manufacturing
1/12 3 5 7 9 11 1/13 3 5
-2
-1
0
1
2
3
4
5
INDUSTRIALPRODUCERPRICESIndustrialproducerpriceinflationslowedfurtheroverallin2013Q2,butpricesofelectricityandfoodwentup(annual percentage changes; contributions in percentage points)
Chart III.2.4
Capital goodsNon-durable consumer goods
Industrial producer pricesDurable consumer goodsEnergy
Intermediate goods
1/09 1/11 1/12 1/131/10-12
-9
-6
-3
0
3
6
9
12
PRODUCERPRICESBYMAININDUSTRIALGROUPINGSPricesofintermediategoodsfellinparticular,whilepricesofenergyandnon-durableconsumergoodsrecordedthestrongestgrowth(annual percentage changes)
Chart III.2.5
III. CURRENT ECONOMIC DEVELOPMENTS

Czech National Bank / Inflation Report III/2013
31
Noticeable inflation has also been recorded since the start of 2013 in the electricity,gas,steamandwatersupplyindustries, where prices rose by 3.8% in June. The fastest growth within this category, however, was recorded for prices in the water supply and sewerage-related services industry, which have been showing more or less stable annual growth of just below 6% since the start of 2013.13 Prices in mining and quarrying saw renewed growth in April 2013, which however stayed at low levels in May and June (0.2% in June).
Annual producer price inflation in the other branches ofmanufacturing, comprising the manufacture of high-value-added products, slowed gradually, turning slightly negative in May and June (see Chart III.2.4). Prices in most branches of manufacturing dropped or saw slower growth. Slight or negligible price growth was recorded in just three branches.14
Agricultural producer pricesIn 2013 Q2, annual agricultural producer price inflation moderated from the high levels (exceeding 15%) recorded in the previous quarter to 7.3% in June. This was mainly due to a sharp slowdown in growth in crop production prices from about 30% in 2013 Q1 to close to 10% at the end of Q2. By contrast, prices in the higher-weight livestock production category returned to modest growth in Q2 (of 3.7% in June) after recording a slight year-on-year decline.
The main factors underlying the sharp fall in agricultural producer price inflation in 2013 H1 included a significant change in the situation on crop commodity markets. Whereas 2012 had seen one of the lowest harvests in recent years both globally and in the Czech Republic, leading to a noticeable decrease in stocks and a significant increase in prices, this year’s situation is very different, as a strongly above-average harvest is expected this year, particularly in Europe and the Black Sea region and, to a lesser extent, in North America. The impact of these factors on agricultural producer prices in the Czech Republic was partly offset by a weaker exchange rate of the koruna.
Other producer pricesAmid persisting low construction investment demand, prices ofconstructionworkcontinued to follow the downward trend observed since 2010. In 2013 Q3, the year-on-year decline deepened further (to -1.3%; see Chart III.2.8). Prices of materials and products consumed in construction also dropped slightly year on year during this quarter.
13 Price agreements in these industries are usually signed for one year.14 Prices went up by 1% in furniture manufacture and other branches of manufacturing, by
0.1% in the manufacture of machinery and equipment and by 0.2% in the manufacture of textile, clothing and leather products.
Livestock product prices
Agricultural producer pricesCrop product prices
1/09 1/11 1/12 1/131/10-60
-40
-20
0
20
40
60
80
AGRICULTURALPRODUCERPRICESAgriculturalproducerpriceinflationgraduallyslowedin2013Q2(annual percentage changes)
Chart III.2.7
Import prices of energy commodities
Producer prices in manufacture of mineral fuels, lubricants and related materials
Import prices of semi-finished products (right-hand scale)
Producer prices in manufacture of basic metals and fabricated metal products (right-hand scale)
1/09 1/10 1/11 1/12 1/13
-60
-40
-20
0
20
40
60
-30
-20
-10
0
10
20
30
PRICESOFMETALSANDREFINEDPETROLEUMPRODUCTSPricesofcokeandrefinedpetroleumproductsandpricesofbasicmetalsandfabricatedmetalproductscontinuedtofall(annual percentage changes)
Chart III.2.6
III. CURRENT ECONOMIC DEVELOPMENTS

Czech National Bank / Inflation Report III/2013
32
The annual decline in prices of market services for the business sector increased significantly in 2013 Q2 (by 2.2 percentage points to -2.5% in June compared to March 2013; see Chart III.2.8). The biggest price declines were recorded for telecommunication services, storage and road and pipeline transport. Most other categories of market services saw either a more modest price decrease or only a weak annual increase not exceeding 1%. Advertising services and market research and insurance were the only services to record higher growth in prices in June (3.3% and 2.4% respectively).
-3
-2
-1
0
1
2
3
4
Construction work pricesMarket services prices in the business sector
1/09 1/10 1/11 1/12 1/13
OTHERPRICECATEGORIESThedeclineinpricesofconstructionworkandmarketservicesforthebusinesssectordeepenedin2013Q2(annual percentage changes)
Chart III.2.8
III. CURRENT ECONOMIC DEVELOPMENTS

Czech National Bank / Inflation Report III/2013
33
III.3DEMANDANDOUTPUT
The year-on-year decline in real GDP deepened further in 2013 Q1 (to -2.4%).15 In quarter-on-quarter terms, GDP decreased by 1.3%. The year-on-year decline was due chiefly to gross capital formation and, to a lesser extent, household consumption. By contrast, government consumption made a positive contribution to economic growth. Net exports had an almost neutral effect, with both exports and imports declining. On the supply side, positive contributions to GDP growth came only from some services. In manufacturing, by contrast, value added decreased year on year for the third consecutive quarter. The estimated output gap continued to open into negative values.
III.3.1Domesticdemand
The year-on-year decline in domestic demand deepened markedly in 2013 Q1. This was mainly due to change in inventories (see Chart III.3.2). The negative contribution of fixed investment was also significant, whereas that of household consumption was by now insignificant. The only slightly rising government consumption had a weak opposite effect.
Final consumptionThe year-on-year decline in household final consumptionexpenditureobserved since the start of last year due to continuing fiscal consolidation, gradually rising unemployment and uncertainty surrounding future economic developments continued into 2013 Q1. However, it decreased noticeably in intensity (to -0.5% year on year; see Chart III.3.3) and household consumption rose by 1.7% quarter on quarter. Expenditure on most consumer goods and on services continued falling year on year, but durable goods purchases increased for the first time in a long time (see Chart III.3.5).
Fiscal consolidation and the subdued labour market had a strong effect on the disposable income of households. After a modest increase at the end of 2012, nominalgrossdisposable income, which is the main source of financing of households’ consumption expenditure, decreased in 2013 Q1 (by 1.8%). Its realpurchasingpower16 fell by 2.8% as a result of annual inflation (see Chart III.3.3).
A closer look at the structure of nominal gross disposable income reveals that – in an environment of weakening economic activity – most of its components contributed to its annual decline in 2013 Q1. The main contributor was wages and salaries, which were also
15 The assessment of GDP expenditure and sources is based on seasonally adjusted data from the quarterly national accounts revised according to the publication of the annual national accounts for 2010–2012.
16 As measured by the household consumption deflator.
NPISH expenditure
Net exports
Change in inventoriesGross fixed capital formation Government consumptionHousehold consumption
I/13I/10I/09 I/11 I/12
-8
-6
-4
-2
0
2
4
6
STRUCTUREOFANNUALGDPGROWTHTheweaklypositivecontributionsofgovernmentconsumptionandnetexportstoGDPdevelopmentswereoutweighedbydeclinesintheothercomponentsofdomesticdemand(contributions in percentage points; seasonally adjusted data)
Chart III.3.2
q-o-q GDP growth (right-hand scale)y-o-y GDP growth
I/09 I/013I/10 I/11 I/12
-4
-3
-2
-1
0
1
2
3
4
-6
-4
-2
0
2
4
6
GROSSDOMESTICPRODUCTThedeclineinGDPdeepenedfurtherin2013Q1(annual and quarterly percentage changes at constant prices; seasonally adjusted data)
Chart III.3.1
Real individual consumption expenditureNominal individual consumption expenditureReal gross disposable incomeNominal gross disposable income
I/12 I/13I/09 I/10 I/11
-6
-4
-2
0
2
4
6
HOUSEHOLDCONSUMPTIONEXPENDITUREThedeclineinrealhouseholdexpenditureslowednoticeably(annual percentage changes)
Chart III.3.3
III. CURRENT ECONOMIC DEVELOPMENTS

34
affected in late 2012/early 2013 by a time shift of extraordinary bonus payments for 2012 in some industries from 2013 Q1 to the end of 2012 because of tax optimisation17 (see Chart III.3.4). The relatively high-weight category of business income and other transfers also declined year on year. Only income from social benefits other than transfers in kind continued rising, albeit at a lower rate than in the previous quarter.
The deepening decline in nominal gross disposable income in 2013 Q1 and the year-on-year stagnation in consumption expenditure were reflected in a decrease in the saving rate of households from last year’s above-average levels (to 10.1%; see section II.2).18 BOX 1 looks in detail at households’ propensity to consume and save by individual income groups in 2012.
BOX1Consumption,savingsanddebtburdenofhouseholdincomegroupsin2012
Real household consumption has been falling in year-on-year terms for more than a year, although the decline moderated at the start of this year and consumption rose in quarter-on-quarter terms. With nominal disposable income falling, the gross saving rate was above its long-term average in 2012. This box analyses the behaviour of individual household income groups in the areas of consumption, saving and debt using the latest data for 2012.
In 2012, nominal consumption was decreasing in most household income groups. Consumption dropped most significantly among households with the highest income (see Chart 1),19 although income in this group increased in both nominal and real terms following a previous decrease. Only in low-income groups did nominal consumption increase.
By comparison with the pre-crisis period, the consumption-to-income ratio decreased in all household income groups. In 2009 it had been low and medium-income households that had reacted to the worsening economic situation with cautious consumption behaviour, whereas in 2012 it was mainly households in the two highest deciles. Compared to the pre-crisis period, most medium-income groups and all high-income groups had a somewhat larger proportion of their income left after covering consumption and loan repayments. However,
17 For details see section III.4 The labour market.18 The saving rate decreased by 1.2 percentage points quarter on quarter and by 0.8 percentage
point year on year.19 Data based on the CZSO Household Budget Survey for 2012.
Social benefits
Other current transfers
Property income
Wages and salaries
Taxes and social contributions
Gross operating surplus and mixed income
Gross disposable income (y-o-y change)
I/10 I/13I/12I/09 I/11
-4
-2
0
2
4
6
8
DISPOSABLEINCOMENominalgrossdisposableincomegrowthdecreasedyearonyearin2013Q1(annual percentage changes; contributions in percentage points; current prices)
Chart III.3.4
Expenditure on durable goodsExpenditure on semi-durable goodsExpenditure on non-durable goodsExpenditure on services
I/12 I/13I/09 I/10 I/11
Household final consumption expenditure (annual percentage changes)
-5
-4
-3
-2
-1
0
1
2
3
4
STRUCTUREOFHOUSEHOLDCONSUMPTIONHouseholdsincreasedtheirspendingondurablegoods,butexpenditureonothergoodsandservicesfell(annual percentage changes; contributions in percentage points; constant prices)
Chart III.3.5
1st decile5th decile10th decile
2nd decile9th decileHouseholds, total
20122004 2005 2006 2007 2008 2009 2010 2011
-10
-5
0
5
10
15
Consumption, c.p., s.a. (NA)
CONSUMPTIONOFSELECTEDHOUSEHOLDINCOMEGROUPSConsumptiondroppedmostsignificantlyin2012inhigh-incomehouseholds(annual percentage changes; in nominal terms)
Chart 1 (box)
III. CURRENT ECONOMIC DEVELOPMENTS
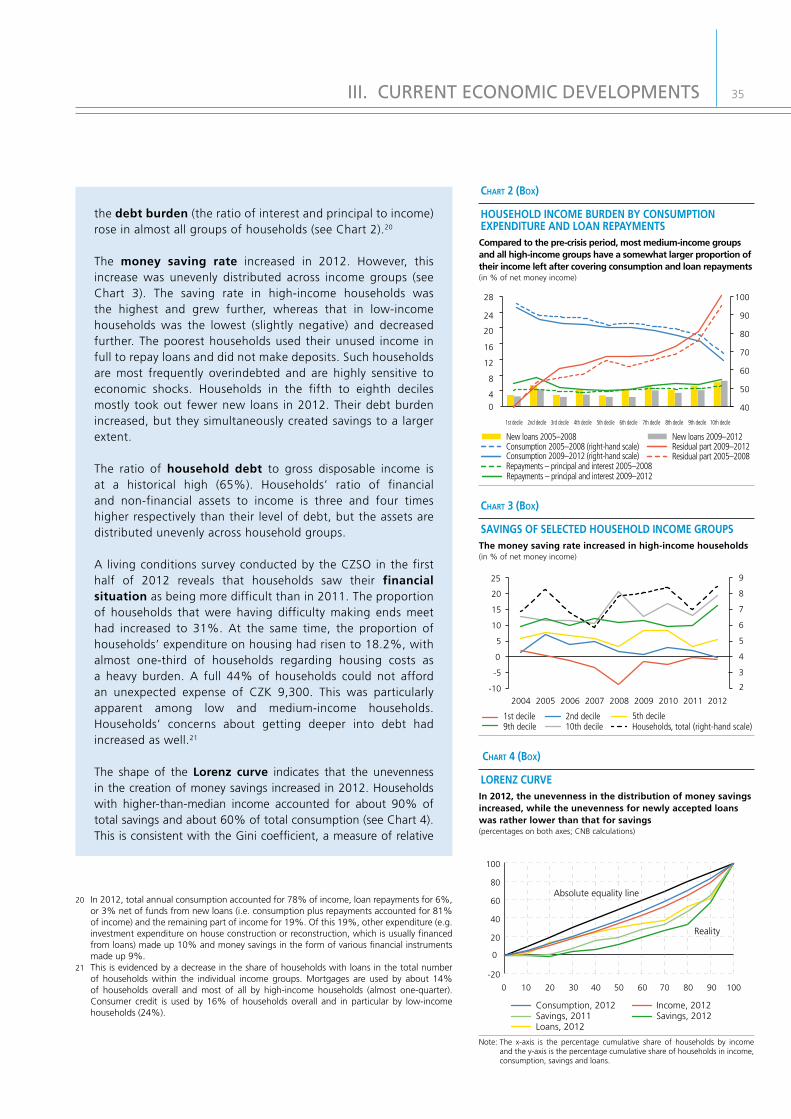
35
the debtburden (the ratio of interest and principal to income) rose in almost all groups of households (see Chart 2).20
The money saving rate increased in 2012. However, this increase was unevenly distributed across income groups (see Chart 3). The saving rate in high-income households was the highest and grew further, whereas that in low-income households was the lowest (slightly negative) and decreased further. The poorest households used their unused income in full to repay loans and did not make deposits. Such households are most frequently overindebted and are highly sensitive to economic shocks. Households in the fifth to eighth deciles mostly took out fewer new loans in 2012. Their debt burden increased, but they simultaneously created savings to a larger extent.
The ratio of household debt to gross disposable income is at a historical high (65%). Households’ ratio of financial and non-financial assets to income is three and four times higher respectively than their level of debt, but the assets are distributed unevenly across household groups.
A living conditions survey conducted by the CZSO in the first half of 2012 reveals that households saw their financialsituation as being more difficult than in 2011. The proportion of households that were having difficulty making ends meet had increased to 31%. At the same time, the proportion of households’ expenditure on housing had risen to 18.2%, with almost one-third of households regarding housing costs as a heavy burden. A full 44% of households could not afford an unexpected expense of CZK 9,300. This was particularly apparent among low and medium-income households. Households’ concerns about getting deeper into debt had increased as well.21
The shape of the Lorenz curve indicates that the unevenness in the creation of money savings increased in 2012. Households with higher-than-median income accounted for about 90% of total savings and about 60% of total consumption (see Chart 4). This is consistent with the Gini coefficient, a measure of relative
20 In 2012, total annual consumption accounted for 78% of income, loan repayments for 6%, or 3% net of funds from new loans (i.e. consumption plus repayments accounted for 81% of income) and the remaining part of income for 19%. Of this 19%, other expenditure (e.g. investment expenditure on house construction or reconstruction, which is usually financed from loans) made up 10% and money savings in the form of various financial instruments made up 9%.
21 This is evidenced by a decrease in the share of households with loans in the total number of households within the individual income groups. Mortgages are used by about 14% of households overall and most of all by high-income households (almost one-quarter). Consumer credit is used by 16% of households overall and in particular by low-income households (24%).
1st decile 10th decile9th decile8th decile7th decile6th decile5th decile4th decile3rd decile2nd decile
New loans 2005–2008 New loans 2009–2012Consumption 2005–2008 (right-hand scale)Consumption 2009–2012 (right-hand scale) Residual part 2005–2008
Residual part 2009–2012
Repayments – principal and interest 2005–2008Repayments – principal and interest 2009–2012
40
50
60
70
80
90
100
0
4
8
12
16
20
24
28
HOUSEHOLDINCOMEBURDENBYCONSUMPTIONEXPENDITUREANDLOANREPAYMENTSComparedtothepre-crisisperiod,mostmedium-incomegroupsandallhigh-incomegroupshaveasomewhatlargerproportionoftheirincomeleftaftercoveringconsumptionandloanrepayments(in % of net money income)
Chart 2 (box)
2nd decile1st decile9th decile
5th decile10th decile Households, total (right-hand scale)
2004 2005 2006 2007 2008 2009 2010 2011 2012
-10
-5
0
5
10
15
20
25
2
3
4
5
6
7
8
9
SAVINGSOFSELECTEDHOUSEHOLDINCOMEGROUPSThemoneysavingrateincreasedinhigh-incomehouseholds(in % of net money income)
Chart 3 (box)
Consumption, 2012Savings, 2011Loans, 2012
Income, 2012Savings, 2012
1000 10 20 30 40 50 60 70 80 90
Reality
Absolute equality line
-20
0
20
40
60
80
100
LORENZCURVEIn2012,theunevennessinthedistributionofmoneysavingsincreased,whiletheunevennessfornewlyacceptedloanswasratherlowerthanthatforsavings(percentages on both axes; CNB calculations)
Chart 4 (box)
Note: The x-axis is the percentage cumulative share of households by income and the y-axis is the percentage cumulative share of households in income, consumption, savings and loans.
III. CURRENT ECONOMIC DEVELOPMENTS

Czech National Bank / Inflation Report III/2013
36
inequality, which for savings increased from 0.46 in 2011 to 0.58.22 In 2012, the unevenness was somewhat lower for consumption than for income. Unevenness was visible also for new loans – households with higher-than-median income accounted for about 70% of such loans, slightly less than in 2011.
The latest available leadingindicators suggest a modest improvement in household consumption in the near future, although this will not mean a noticeable recovery. Retail sales rose by 0.8% year on year in May,23 but this increase was concentrated in the automotive segment. Sales in the non-motor-vehicle segment were flat year on year in May after decreasing in April. In addition, the CZSO’s business surveys this year are indicating an upward trend in consumer confidence, although this indicator remains low (see Chart III.3.6).
Real government final consumption expenditure continued to show modest growth in 2013 Q1. Its year-on-year growth rate increased by 0.6 percentage point compared to 2012 Q4, to 1.2%.
InvestmentInvestment remained subdued in 2013 Q1 amid weakening economic activity and persisting considerable uncertainty among both corporations and households regarding future economic developments (see Chart III.3.7). According to seasonally adjusted data, the year-on-year decline infixedinvestment was -4.1% in 2013 Q1.
Turning to the structure, some changes were apparent in fixed investment in some sectors compared to the previous quarter. A major change occurred in the non-financialcorporationssector, where the year-on-year decline in fixed investment deepened significantly in 2013 Q1 (to -7.7%). Their negative contribution to annual fixed investment growth thus increased by almost 5 percentage points (see Chart III.3.7). This was reflected in a noticeable deepening of the year-on-year decline in investment in machinery and equipment (see Chart III.3.8). The continued weakening of investment activity in the non-financial corporations sector can be seen as a consequence of persisting low demand for production and the resulting low business confidence.
The governmentsector also recorded a marked change in year-on-year fixed investment growth, but in the opposite direction compared to the non-financial corporations sector. However, the marked moderation in the year-on-year decline in investment (from -20.6% in 2012 Q4 to -1.2% in 2013 Q1) was mainly due to base effects. Fixed investment by the government fell to a low absolute level last year, partly as a result of problems with the drawdown of EU funds.
22 The highest Gini coefficient in recent years was recorded in 2008 (0.67).23 According to seasonally adjusted data.
Non-profit institutionsFinancial corporationsGeneral governmentHouseholdsNon-financial corporations
I/12 I/13I/09 I/10 I/11
Gross fixed capital formation (annual percentage changes)
-18
-15
-12
-9
-6
-3
0
3
6
9
INVESTMENTBYSECTORInvestmentwentdowninmostofthemonitoredsectors(annual percentage changes; contributions in percentage points; constant prices)
Chart III.3.7
Intangible fixed assetsOther buildings and structuresDwellingsTransport equipmentOther machinery and equipment
Cultivated assets
I/12 I/13I/09 I/10 I/11
Gross fixed capital formation (annual percentage changes)
-20
-16
-12
-8
-4
0
4
8
FIXEDCAPITALFORMATIONFixedinvestmentdeclinedinallcategories,mostofallinothermachineryandequipment(annual percentage changes; contributions in percentage points; constant prices)
Chart III.3.8
Composite confidence indicatorConsumer confidence indicatorBusiness confidence indicator
I/12 I/13I/09 I/10 I/11
60
70
80
90
100
CONFIDENCEINDICATORSConsumerconfidenceindicatesanupwardtrend,butremainslow(2005 average = 100; source: CZSO)
Chart III.3.6
III. CURRENT ECONOMIC DEVELOPMENTS

Czech National Bank / Inflation Report III/2013
37
Investment in the household sector fell by 6.6% year on year in 2013 Q1. This was mostly due to investment in dwellings, whose year-on-year decline, however, slowed somewhat to -4.1% (see Chart III.3.9). Uncertain prospects for economic growth and unemployment were again the main cause of the persisting weak demand for investment in dwellings. This was also evidenced by slower growth in mortgage loans, even though rates on these loans were reduced (see section III.5.2). The leading indicators do not currently signal any major recovery in investment in dwellings in the period ahead, as the year-on-year decline in the number of housing starts deepened further (to -20.6%). Only the financialinstitutions sector contributed positively to the year-on-year growth rate of total investment, but even its contribution was negligible.
The year-on-year growth rate of changes in inventories also saw a pronounced change in 2013 Q1 (see Chart III.3.2). The renewed decline in additions to inventories in this quarter was probably linked with a decrease in inventories in wholesale trade and in some industries (manufacture of tobacco products, manufacture of food). The contribution of changes in inventories to GDP growth was thus strongly negative (-1.5 percentage points). According to the latest business survey conducted by the CNB and the Confederation of Industry, it cannot be ruled out that inventories will be replenished following their decline in 2013 Q1.24
III.3.2Netexternaldemand
The year-on-year growth in net exports of goods and services25 came to a halt in 2013 Q1 after more than two years. The net export surplus was CZK 89 billion, which meant a slight year-on-year decrease (of CZK 0.3 billion). In quarter-on-quarter terms, however, it rose by CZK 5 billion (see Chart III.3.10). The trade surplus decreased after nine quarters of year-on-year growth. However, this decrease was almost offset by a year-on-year rise in the services surplus, which increased after having declined for about a year. The contribution of net exports to the year-on-year change in GDP increased slightly (to 0.1 percentage point) compared to the previous quarter, when it had been neutral (see Chart III.3.2).
The year-on-year growth in net exports halted amid a further weakening of tradeturnover growth, which culminated in a year-on-year decline for the first time in more than three years. However, the lead of export growth over import growth was renewed (0.4 percentage point; see Chart III.3.11), as imports fell faster than exports. Totalexports fell by 2.9% year on year, their growth rate falling by 5.3 percentage points from the previous quarter. The decline in exports was linked with external demand in the Czech Republic’s major trading partner
24 The respondents expect a slight year-on-year increase in inventories overall in 2013 Q2.25 At 2005 prices, seasonally adjusted.
I/09 I/12 I/13I/10 I/11
Exports of goods and services Imports of goods and servicesDifference between export growth and import growth (in pp; right-hand scale)
-25-20-15-10
-505
10152025
-15
-10
-5
0
5
10
15
EXPORTSANDIMPORTSForeigntradeturnoverdecreasedin2013Q1,butexportsfellratherslowerthanimports(annual percentage changes; percentage points; constant prices; seasonally adjusted data)
Chart III.3.11
Net exports (y-o-y changes in CZK billions)Net exports (q-o-q changes in CZK billions)
I/09 I/13I/10 I/11 I/12
-30
-20
-10
0
10
20
30
40
NETEXPORTSNetexportswerealmostunchangedyearonyearin2013Q1(seasonally adjusted data; constant prices)
Chart III.3.10
-40
-30
-20
-10
0
10
20
30
I/13I/09 I/10 I/11 I/12
Housing startsHousing completionsInvestment in dwellings (constant prices)
INVESTMENTINDWELLINGSInvestmentindwellingscontinuedtodeclinesignificantly(annual percentage changes)
Chart III.3.9
III. CURRENT ECONOMIC DEVELOPMENTS

Czech National Bank / Inflation Report III/2013
38
countries switching from growth to weak decline. The decline in total exports was due to a fall in exports of goods, whereas exports of services recorded steady growth.
Totalimports went down by 3.3% year-on-year, i.e. by 5.9 percentage points less than in the previous quarter. The decline in imports was associated with the continued weakening of total domestic and external demand given the high import intensity of exports. This was reflected mainly in imports of intermediate goods. The decrease in total imports was also due to declining imports of services.
III.3.3Output
In an environment of weakening domestic and external demand, the year-on-year decline in grossvalueaddedat basic prices deepened further in 2013 Q1 (to -2.0%; see Chart III.3.12). The weak demand continued to affect the output of most branches with different intensity. Only some services made positive contributions to annual developments in gross value added.
The contribution of industryto annual developments in gross value added was negative in 2013 Q1 and deepened to -1.1 percentage points. This was attributable to other branches of industry consisting of the mining and energy supply sectors. By contrast, in manufacturing, whose production is largely exported, the decline in gross value added moderated to -2.2% year on year (see Chart III.3.12).
The annual dynamics of gross value added in industry weakened further amid a real decline in industrial production, which strengthened further in Q1 (see Chart III.3.13).26 Output continued to decline in most branches of industry.27 The adverse situation in industrial production was again mostly due to the manufacture of motor vehicles, trailers and semi-trailers, where the decline in output deepened to double figures (-11.9%). Only manufacture of food products, manufacture of clothing and other manufacturing maintained the output growth observed in the previous quarter. Output growth recovered slightly in some other, lower-weight branches in 2013 Q1.28
In 2013 Q1, the effect of low domestic and external demand on output in industry was also reflected in a deeper decline in direct export sales(to -3.2% year on year at current prices). The decline in domestic sales29 was even more pronounced, reaching almost double the level.30
According to seasonally adjusted data, industrial production
26 According to seasonally adjusted data.27 Output fell in real terms in almost 70% of the branches monitored in manufacturing.28 Wood processing, manufacture of pharmaceutical products and manufacture of other
transport equipment. 29 Domestic sales also include indirect exports through non-industrial corporations.30 While direct export sales dropped in less than half of manufacturing industries, domestic
sales fell in around 80% of industries.
None OtherFinancial constraints Material and/or equipment shortagesLabour shortages Insufficient demand
0
20
40
60
80
100
1/09 1/10 1/11 1/12 1/13
BARRIERSTOGROWTHININDUSTRYTheeffectofinsufficientdemandasthemainbarriertogrowthinindustrialproductioncontinuedtoincrease(percentages)
Chart III.3.14
Seasonally adjusted data
Production capacity utilisation in industry (in %, right-hand scale)Trend (CZSO)Industrial production
80
90
100
110
120
60
70
80
90
1/09 1/10 1/11 1/131/12
INDUSTRIALPRODUCTIONTheseasonallyadjustedvolumeofindustrialproductionwasbroadlyflatin2013Q2(basic index; year 2010 = 100)
Chart III.3.13
Agriculture, forestry, fishing
Manufacturing
Mining, energyConstructionTrade, hotels, transport
Financial and business activitiesOther service activities
Gross value added at basic prices (annual percentage changes)
I/12 I/13I/10I/09 I/11
-8
-6
-4
-2
0
2
46
8
CONTRIBUTIONSOFBRANCHESTOGVAGROWTHThedeclineingrossvalueaddeddeepenedfurtherin2013Q1(contributions in percentage points; annual percentage changes)
Chart III.3.12
III. CURRENT ECONOMIC DEVELOPMENTS

Czech National Bank / Inflation Report III/2013
39
continued to decline year on year in real terms in the first two months of 2013 Q2, although the volume of industrial production has been broadly unchanged since the end of Q1 (see Chart III.3.13). According to the July results of the CZSO’s business survey, the effect of insufficient demand as abarriertogrowthinindustry increased further (see Chart III.3.14). Production capacity utilisation fell slightly. Nevertheless, the volatility of new industrial orders, especially from abroad, in the first two months of 2013 Q2 does not indicate any significant improvement in the conditions for growth in industrial production in the period ahead (see Chart III.3.15).
The contribution of trade and services to annual developments in gross value added was also negative in 2013 Q1 (-0.4 percentage point). Underlying this outcome were negative contributions from most market and non-market services. Positive contributions were recorded only by financial intermediation and insurance and other services. According to the CZSO’s latest May statistics, the only slightly rising retail sales for the second consecutive month do not signal any market recovery in value added in 2013 Q2.
Gross value added in construction was adversely affected by the persisting strong contraction in demand in 2013 Q1. In these circumstances, gross value added continued to decline year on year (by 2.2%; see Chart III.3.12). The year-on-year decline in output in both building construction and civil engineering deepened further in this period, reaching double figures. The latest available CZSO data do not indicate any improvement in the trend, since both construction output and the number and the approximate value of building permits declined at double-digit rates in May.
An international comparison reveals that economic sentiment in both the Czech Republic and Germany and the EU as a whole worsened temporarily in April 2013. In May and June, however, it returned to the levels observed at the end of the previous quarter in all the countries under review (see Chart III.3.16). The difference between economic sentiment in the Czech Republic and the EU as a whole stayed negative. According to the CZSO’s business survey results, the overall confidence indicator recorded similar developments (see Chart III.3.6).
Germany European UnionCzech Republic
60
70
80
90
100
110
120
1/09 1/10 1/12 1/131/11
ECONOMICSENTIMENTEconomicsentimentintheCzechRepublic,GermanyandtheEUimprovedagainafterdeclininginApril(long-term average = 100; seasonally adjusted data; source: Eurostat)
Chart III.3.16
New orders in industry from abroadDomestic new industrial orders
New orders in industry, total
1/09 1/11 1/12 1/131/10
-30
-20
-10
0
10
20
30
NEWORDERSININDUSTRYNewindustrialorderswereveryvolatileinAprilandMay2013(annual percentage changes)
Chart III.3.15
III. CURRENT ECONOMIC DEVELOPMENTS
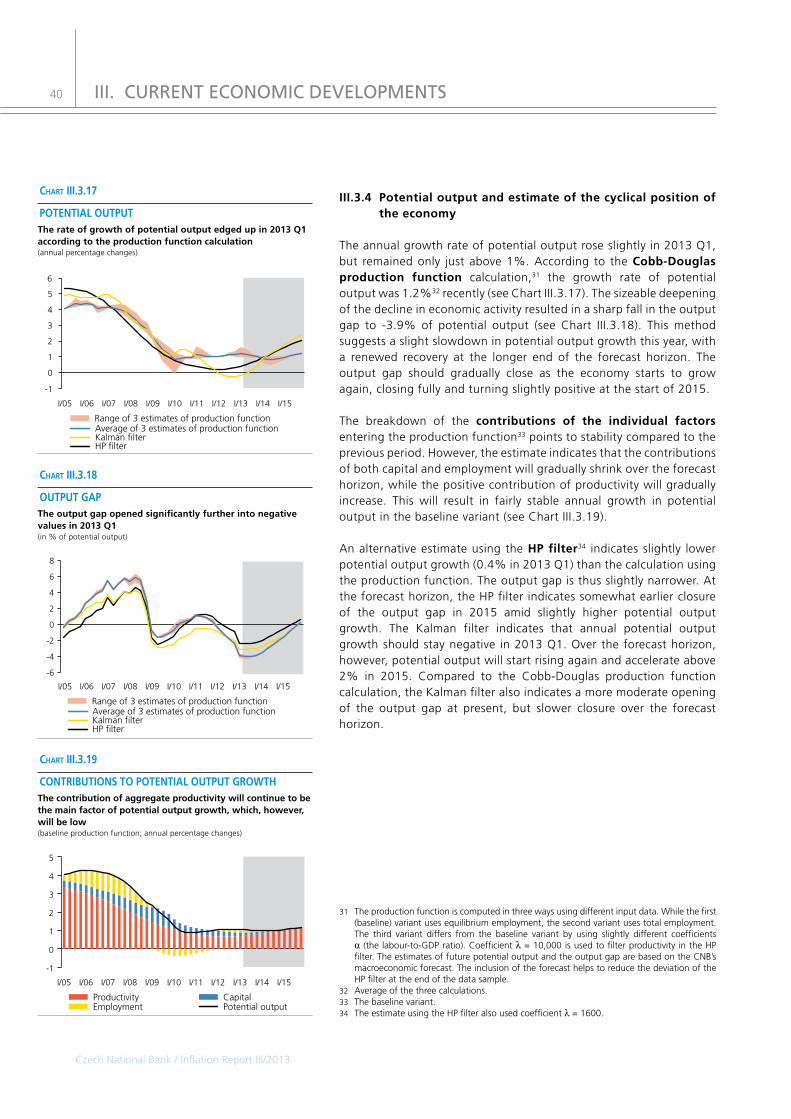
Czech National Bank / Inflation Report III/2013
40
III.3.4Potentialoutputandestimateofthecyclicalpositionoftheeconomy
The annual growth rate of potential output rose slightly in 2013 Q1, but remained only just above 1%. According to the Cobb-Douglasproduction function calculation,31 the growth rate of potential output was 1.2%32 recently (see Chart III.3.17). The sizeable deepening of the decline in economic activity resulted in a sharp fall in the output gap to -3.9% of potential output (see Chart III.3.18). This method suggests a slight slowdown in potential output growth this year, with a renewed recovery at the longer end of the forecast horizon. The output gap should gradually close as the economy starts to grow again, closing fully and turning slightly positive at the start of 2015.
The breakdown of the contributions of the individual factorsentering the production function33 points to stability compared to the previous period. However, the estimate indicates that the contributions of both capital and employment will gradually shrink over the forecast horizon, while the positive contribution of productivity will gradually increase. This will result in fairly stable annual growth in potential output in the baseline variant (see Chart III.3.19).
An alternative estimate using the HPfilter34 indicates slightly lower potential output growth (0.4% in 2013 Q1) than the calculation using the production function. The output gap is thus slightly narrower. At the forecast horizon, the HP filter indicates somewhat earlier closure of the output gap in 2015 amid slightly higher potential output growth. The Kalman filter indicates that annual potential output growth should stay negative in 2013 Q1. Over the forecast horizon, however, potential output will start rising again and accelerate above 2% in 2015. Compared to the Cobb-Douglas production function calculation, the Kalman filter also indicates a more moderate opening of the output gap at present, but slower closure over the forecast horizon.
31 The production function is computed in three ways using different input data. While the first (baseline) variant uses equilibrium employment, the second variant uses total employment. The third variant differs from the baseline variant by using slightly different coefficients α (the labour-to-GDP ratio). Coefficient λ = 10,000 is used to filter productivity in the HP filter. The estimates of future potential output and the output gap are based on the CNB’s macroeconomic forecast. The inclusion of the forecast helps to reduce the deviation of the HP filter at the end of the data sample.
32 Average of the three calculations.33 The baseline variant.34 The estimate using the HP filter also used coefficient λ = 1600.
EmploymentCapitalProductivityPotential output
I/12 I/13 I/14I/05 I/15I/06 I/07 I/08 I/09 I/10 I/11
-1
0
1
2
3
4
5
CONTRIBUTIONSTOPOTENTIALOUTPUTGROWTHThecontributionofaggregateproductivitywillcontinuetobethemainfactorofpotentialoutputgrowth,which,however,willbelow(baseline production function; annual percentage changes)
Chart III.3.19
Range of 3 estimates of production functionAverage of 3 estimates of production functionKalman filterHP filter
I/12 I/14I/13I/05 I/15I/06 I/07 I/08 I/09 I/10 I/11
-6
-4
-2
0
2
4
6
8
OUTPUTGAPTheoutputgapopenedsignificantlyfurtherintonegativevaluesin2013Q1(in % of potential output)
Chart III.3.18
III. CURRENT ECONOMIC DEVELOPMENTS
Range of 3 estimates of production functionAverage of 3 estimates of production functionKalman filterHP filter
I/12 I/13 I/14I/05 I/15I/06 I/07 I/08 I/09 I/10 I/11
-1
0
1
2
3
4
5
6
POTENTIALOUTPUTTherateofgrowthofpotentialoutputedgedupin2013Q1accordingtotheproductionfunctioncalculation(annual percentage changes)
Chart III.3.17

Czech National Bank / Inflation Report III/2013
41
III.4THELABOURMARKET
The labour market continued to be affected by weakening economic activity in 2013 Q1. Total employment and the number of employees increased, but the number of employees converted into full-time equivalents declined further amid continuing cuts in hours worked in a number of industries due to low demand. The general unemployment rate recorded an annual increase amid higher growth in the labour force than in employment. The share of unemployed persons also went up. A smaller decline in the average wage than in whole-economy labour productivity led to a continued rise in unit labour costs.
III.4.1Employmentandunemployment
Annual growth in employment35 picked up further in 2013 Q1 (to 1%; see Chart III.4.1) and employment also increased in quarter-on-quarter terms (seasonally adjusted) by 0.4%. The continued pick-up in annual employment growth was due to the category of employees,36 whose growth strengthened from 0.6% in 2012 Q4 to 2%. However, the number of entrepreneurs started falling year on year at the beginning of 2013.
The pronounced increase in the number of employees at the start of 2013 was again due mainly to increased use of alternative forms of employment at a time of recession, especially in the form of shorter working hours. This is indicated by a continued annual decline in the converted number of employees (see Chart III.4.2), which takes into account the average number of hours worked by employees. This indicator, which reflects the cyclical position of the domestic economy more credibly than employment, fell by 0.6% year on year in 2013 Q1. This decline was attributable to the business sector (industry and construction in particular),37 since the converted number of employees increased again in the non-business sector after a previous fall.38
Cuts in hours worked can be viewed as an expression of prudence by employers given the persisting considerable uncertainty about future demand and as a way of cutting labour costs in the face of lower demand. At the same time, employers use such cuts to address the risk of losing qualified workers, who might be difficult to find during the recovery phase.
35 Employment according to the LFS.36 Including members of production cooperatives.37 However, the converted number of employees also declined in some market services –
transport and storage, hotels and restaurants, wholesale and retail trade, and education. 38 The decline in the converted number of employees was concentrated mainly in medium-
sized corporations (20–100 employees) and large corporations (500–1,000 employees).
Average nominal wage in business sectorNominal unit labour costs
Number of people employed in economyNumber of employees (full-time equivalent)
I/09 I/10 I/12 I/13I/11
-8
-6
-4
-2
0
2
4
6
LABOURMARKETINDICATORSThenumberofemployeesconvertedintofull-timeequivalentsdeclinedfurtherin2013Q1(annual percentage changes)
Chart III.4.1
Number of employees (full-time equivalent)GDP
I/09 I/13I/10 I/11 I/12
-8
-6
-4
-2
0
2
4
Number of employeesHours worked per employee
NUMBEROFEMPLOYEES(FULL-TIMEEQUIVALENT)Employerscontinuedtocutaverageworkinghoursperemployeeduetolowdemand(contributions in percentage points; annual percentage changes)
Chart III.4.2
III. CURRENT ECONOMIC DEVELOPMENTS

Czech National Bank / Inflation Report III/2013
42
As regards sectors, the annual rise in employment in 2013 Q1 was largely due to the tertiary sector. Within it, the largest contributor was non-marketservices (see Chart III.4.3), where the number of employed persons increased mainly in education and other activities and in public administration and defence. The number of persons employed in market services also increased again after a previous decline. However, this increase was concentrated mainly in administration and other support activities and in financial intermediation and insurance. The share of employment growth in agriculturein total employment growth was less significant compared to services (see Chart III.4.3). By contrast, employment continued to decline in the other production sectors – industryandconstruction– in 2013 Q1 amid persisting unfavourable demand. In industry, this was fostered by a decrease in the number of employees in manufacturing. According to the latest CZSO data, the decline in the number of employees in industry deepened again in April and May 2013 (to -1.8% in May).39 The decline was even more pronounced in construction, reaching -8.5% in May.
Continued faster growth in the labour force40 than employment resulted in a year-on-year increase in the general unemploymentrate41 in 2013 Q1 (see Chart III.4.4). In quarter-on-quarter terms, it was flat at 7.3% adjusted for seasonal effects. The annual growth in the labour force was due mainly to an increasing rate of economic activity42 in all age groups. The overall rate of economic activity reached a historical high (72.6% after seasonal adjustment). According to the April and May figures, the seasonally adjusted unemployment rate edged down to 7.2% and a further increase in the rate of economic activity was recorded.
The annual and quarterly growth in the share of unemployedpersons43 continued into 2013 Q1. This indicator was slightly above the general unemployment rate (see Chart III.4.4). The seasonally adjusted share of persons unemployed increased further to 7.7% in 2013 Q2. This was due to both an increase in the registered unemployed and a continued decline in the population in the given age group.
The Beveridgecurve44 continued to move gradually in approximately the easterly direction in 2013 Q2, as continued sizeable growth in registered job applicants was accompanied by only a slight increase in the number of vacancies (see Chart III.4.5).
39 Corporations with 50 employees or more, excluding agency workers.40 The labour force increased in all age groups. 41 In the 15–64 age category. Measured by the ILO methodology according to the LFS.42 The rate of economic activity is defined as the ratio of employed and unemployed persons
to the population in each age category.43 The share of persons unemployed is the ratio of available job applicants aged 15–64 to the
population of the same age. It is a new MLSA indicator.44 The Beveridge curve has been affected by legislative changes in effect since 1 January 2012.
Since that date, corporations have not been obliged to report the number of vacancies to labour offices.
Num
ber
of v
acan
cies
Number of people unemployed310 330 350 370 390 410 430 450 470 490 510 530 550 570
30405060708090
100110120130140150160
1/08
1/09
6/13
6/13
1/12
1/12 1/10
1/11
490 510 530 550 57035
37
39
41
43
BEVERIDGECURVEThenumberofunemployedpeopleincreasedfurther(seasonally adjusted numbers in thousands; source: MLSA)
Chart III.4.5
Share of unemployed personsGeneral unemployment rate
I/09 I/10 I/11 I/12 I/13
5
6
7
8
UNEMPLOYMENTRATETheshareofunemployedpersonscontinuedtorisein2013Q2(percentages; seasonally adjusted data; source: MLSA, CZSO)
Chart III.4.4
III. CURRENT ECONOMIC DEVELOPMENTS
IV/12 I/13
Tota
l
Agr
icul
ture
Indu
stry
Con
stru
ctio
n
Mar
ket
serv
ices
Non
-mar
ket
serv
ices
-0.8
-0.6
-0.4
-0.2
0.0
0.2
0.4
0.6
0.8
1.0
EMPLOYMENTBREAKDOWNBYBRANCHESThecontinuinggrowthinemploymentwasdrivenbynon-marketservices(contributions in percentage points to annual change; selected branches; source: LFS)
Chart III.4.3

Czech National Bank / Inflation Report III/2013
43
III.4.2Wagesandproductivity
The high year-on-year volatility in the average nominal wage45 in late 2012 and early 2013 was due mainly to a one-off factor that affected wages in the business sector (see Table III.4.1). The changes in average nominal wage growth in the non-business sector were less pronounced. In these circumstances, the average nominal wage recorded an overall year-on-year decrease (of 0.4%) in 2013 Q1 for the first time since 2001. Despite lower annual inflation, the averagereal wage thus fell more significantly in 2013 Q1 than in previous quarters46 (by 2.2% year on year).
The sizeable pick-up in average annual nominal wage growth in the businesssectorto 4% in 2012 Q4 and the subsequent decline of 0.4% in 2013 Q1 was due largely to the shift of extraordinary performance-related bonuses for the previous year in some industries to 2012 Q4 because of tax optimisation.47 This pertained to the industries which usually recorded the highest shares of such extraordinary bonuses in the first quarter of the following year. As a result of this shift, the average nominal wage in financial intermediation and insurance, for example, fell by a significant 11.1% year on year in 2013 Q1. At the start of 2013, however, the average nominal wage also decreased in most other sectors, where there was a clear link with weakening productivity. The average wage decreased mainly in large corporations,48 but a more moderate wage decline was also observed in small and medium-sized corporations. The real average wage in the business sector thus declined year on year (by 2.2%) due to a significant drop in its nominal growth rate.
The average nominal wage in the non-business sector was flat in year on year terms in 2013 Q1 after a previous slight increase. This was due to a rise in the average wage in central government, which was offset by a decline in the average wage in local government. The real decline in the average wage in the non-business sector deepened (to -1.8%; see Table III.4.1) on account of a slowdown in nominal wage growth accompanied by a more moderate decline in inflation.
A significant deepening of the decline in real GDP accompanied by a rise in employment caused the decline in whole-economyproductivity49 to strengthen further in 2013 Q1 (to -4% year on year; see Chart III.4.6). This was mostly due to industry, where an only slight decline in productivity in 2012 Q4 was replaced by a sizeable year-on-year fall (of 6.6%). This was caused by a noticeable deepening of the decline in gross value added in 2013 Q1, accompanied by
45 The average gross wage converted into full-time equivalents.46 Except in 2012 Q4, when the average real wage rose temporarily.47 An increase of 7 percentage points in the tax rate for employed persons with income
exceeding CZK 103,536 a month was introduced on 1 January 2013, and the cap on health insurance premium payments was abolished at the same time.
48 Large corporations include corporations with 1,000 employees or more. 49 Productivity is calculated on the basis of non-seasonally adjusted data.
table III.4.1
II/12 III/12 IV/12 I/13
Average wage in Czech Republic
nominal 2.2 1.7 3.5 -0.4
real -1.2 -1.5 0.7 -2.2
Average wage in business sector
nominal 2.2 1.6 4.0 -0.4
real -1.2 -1.6 1.2 -2.2
Average wage in non-business sector
nominal 2.2 2.3 1.2 0.0
real -1.2 -1.0 -1.6 -1.8
Whole-economy labour productivity -2.0 -2.2 -2.1 -4.0
Nominal unit labour costs 2.8 2.2 3.4 2.8
WAGES,PRODUCTIVITY,UNITLABOURCOSTSAveragenominalwagesfellslightlyin2013Q1,partlyduetoatimeshiftinthepaymentofbonuses(annual percentage changes)
ConstructionProductivity per hour
Non-market services
IndustryMarket services
I/09 I/12 I/13I/10 I/11
-10
-5
0
5
10
15
PRODUCTIVITYPERHOURProductivityperhour,however,increasedin2013Q1,fallingonlyinindustry(annual percentage changes)
Chart III.4.7
III. CURRENT ECONOMIC DEVELOPMENTS
IndustryWhole-economy productivity
Construction
Market servicesNon-market services
I/09 I/12 I/13I/10 I/11
-15
-10
-5
0
5
10
15
WHOLE-ECONOMYPRODUCTIVITYProductivityfellinmostofthemonitoredsectors,andespeciallyinindustry(annual percentage changes)
Chart III.4.6

Czech National Bank / Inflation Report III/2013
44
slower adjustment of employment. However, productivity perhour, which better captures the evolution of productivity due to the adjustment mechanisms applied, increased year on year in 2013 Q1 (see Chart III.4.7). All the monitored sectors except industry recorded higher productivity.
A more pronounced decline in economic activity compared to an only slight decrease in wages and salaries implied continued annual growth in unit labour costs50 at a rate of almost 3% in 2013 Q1 (see Chart III.4.8). This variable was also affected by tax optimisation, whose effect was, however, almost fully offset by a substantial deepening of the decline in economic activity. Nominal unit labour costs grew fastest in industry, where the decline in gross value added was strongest. Nominal unit labour costs increased more moderately in non-market services, while remaining flat in market services.
50 Nominal unit labour costs are calculated on the basis of non-seasonally adjusted data.
Volume of wages and salaries GDPNominal unit labour costs (annual percentage changes)
I/09 I/12 I/13I/10 I/11
-4
-2
0
2
4
6
8
UNITLABOURCOSTSGrowthinnominalunitlabourcostsslowed,partlybecauseofthetimeshiftofbonuspaymentsfor2012(contributions in percentage points; annual percentage changes)
Chart III.4.8
III. CURRENT ECONOMIC DEVELOPMENTS
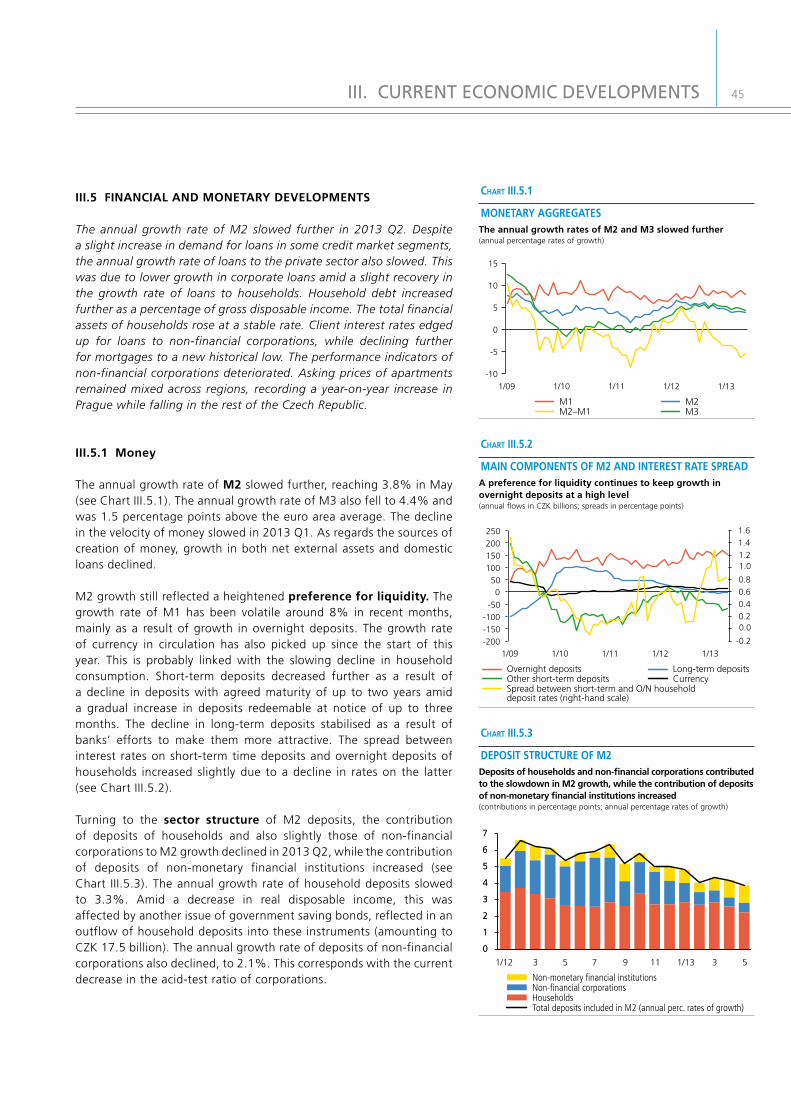
45
III.5FINANCIALANDMONETARYDEVELOPMENTS
The annual growth rate of M2 slowed further in 2013 Q2. Despite a slight increase in demand for loans in some credit market segments, the annual growth rate of loans to the private sector also slowed. This was due to lower growth in corporate loans amid a slight recovery in the growth rate of loans to households. Household debt increased further as a percentage of gross disposable income. The total financial assets of households rose at a stable rate. Client interest rates edged up for loans to non-financial corporations, while declining further for mortgages to a new historical low. The performance indicators of non-financial corporations deteriorated. Asking prices of apartments remained mixed across regions, recording a year-on-year increase in Prague while falling in the rest of the Czech Republic.
III.5.1Money
The annual growth rate of M2slowed further, reaching 3.8% in May (see Chart III.5.1). The annual growth rate of M3 also fell to 4.4% and was 1.5 percentage points above the euro area average. The decline in the velocity of money slowed in 2013 Q1. As regards the sources of creation of money, growth in both net external assets and domestic loans declined.
M2 growth still reflected a heightened preferenceforliquidity. The growth rate of M1 has been volatile around 8% in recent months, mainly as a result of growth in overnight deposits. The growth rate of currency in circulation has also picked up since the start of this year. This is probably linked with the slowing decline in household consumption. Short-term deposits decreased further as a result of a decline in deposits with agreed maturity of up to two years amid a gradual increase in deposits redeemable at notice of up to three months. The decline in long-term deposits stabilised as a result of banks’ efforts to make them more attractive. The spread between interest rates on short-term time deposits and overnight deposits of households increased slightly due to a decline in rates on the latter (see Chart III.5.2).
Turning to the sector structure of M2 deposits, the contribution of deposits of households and also slightly those of non-financial corporations to M2 growth declined in 2013 Q2, while the contribution of deposits of non-monetary financial institutions increased (see Chart III.5.3). The annual growth rate of household deposits slowed to 3.3%. Amid a decrease in real disposable income, this was affected by another issue of government saving bonds, reflected in an outflow of household deposits into these instruments (amounting to CZK 17.5 billion). The annual growth rate of deposits of non-financial corporations also declined, to 2.1%. This corresponds with the current decrease in the acid-test ratio of corporations.
Total deposits included in M2 (annual perc. rates of growth)
1/12 1/133 5 7 9 11 3 5
HouseholdsNon-financial corporationsNon-monetary financial institutions
0
1
2
3
4
5
6
7
0
1
2
3
4
5
6
7
DEPOSITSTRUCTUREOFM2Depositsofhouseholdsandnon-financialcorporationscontributedtotheslowdowninM2growth,whilethecontributionofdepositsofnon-monetaryfinancialinstitutionsincreased(contributions in percentage points; annual percentage rates of growth)
Chart III.5.3
Long-term depositsOvernight depositsCurrencyOther short-term deposits
Spread between short-term and O/N household deposit rates (right-hand scale)
1/09 1/10 1/11 1/12 1/13-200
-150
-100
-50
050
100
150
200
250
-0.2
0.00.2
0.4
0.6
0.8
1.01.2
1.4
1.6
MAINCOMPONENTSOFM2ANDINTERESTRATESPREADApreferenceforliquiditycontinuestokeepgrowthinovernightdepositsatahighlevel(annual flows in CZK billions; spreads in percentage points)
Chart III.5.2
M2M1M3M2–M1
1/09 1/10 1/11 1/12 1/13
-10
-5
0
5
10
15
MONETARYAGGREGATESTheannualgrowthratesofM2andM3slowedfurther(annual percentage rates of growth)
Chart III.5.1
III. CURRENT ECONOMIC DEVELOPMENTS

46
III.5.2Credit
The annual growth rate of loans to the private sector slowed to 2.6% in May. This reflected lower growth in corporate loans due to weak economic activity. According to the Bank Lending Survey, however, demand for loans increased in 2013 Q2, albeit with varying intensity across the segments of the credit market. On the supply side, credit standards were tightened in part of the credit market (see Table III.5.1).51
The annual growth rate of loanstonon-financialcorporationsfell to zero in May (see Chart III.5.4). Loans to most branches and loans to corporations of all sizes contributed to the slowdown in growth. Short-term loans declined further and the growth rate of medium-term and long-term loans declined. New loans decreased. According to the Bank Lending Survey, demand for loans continued to increase due to the financing of mergers and acquisitions of large corporations and newly also to debt restructuring and financing of inventories and working capital amid a significantly less across-the-board decline in demand for loans to finance fixed investment. Corporations are generally trying to rationalise their costs and credit burdens. Credit standards for corporate loans tightened in part of the credit market due to the persisting adverse outlook for overall economic activity and for some sectors. As regards lending conditions, banks lowered their average margins and increased their collateral requirements.
Since 2008, the total volume of loans has declined most of all in large corporations with 250 employees or more and to a lesser extent in medium-sized corporations, while remaining unchanged in small corporations (see Chart III.5.5). The lower demand of large corporations for loans is associated among other things with increased bond issuance as an alternative source of external financing (see also section III.5.6). These bonds are mostly long-term ones. Current data show that issuance of corporate bonds at the aggregate level rose by 86% between 2008 and 2013 Q1, while total loans declined by 2%.
On the other hand, smallandmedium-sizedcorporations usually have limited access to alternative forms of external financing and, unlike large corporations, are thus usually more dependent on bank loans. According to the Bank Lending Survey, the average margins for this group of corporations declined, although interest rates on small loans – provided usually to smaller corporations – are higher than those on large loans. Small and medium-sized corporations account for a relatively large proportion of total book value added – around
51 According to the Bank Lending Survey, demand for loans declined in the euro area in 2013 Q1; euro area banks expect this decline to moderate in Q2.
Short-term loans to non-financial corporationsLoans to non-financial corporations, total
Medium- and long-term loans to non-financial corporations
-50
-40
-30
-20
-10
0
10
20
30
1/09 1/11 1/12 1/131/10
-25
-20
-15
-10
-5
0
5
10
15
New loans to non-financial corporations (right-hand scale, annual percentage changes)
LOANSTONON-FINANCIALCORPORATIONSGrowthinloanstonon-financialcorporationsfelltozero(annual percentage rates of growth; annual percentage changes)
Chart III.5.4
table III.5.1
Supply Demand
Credittermsandconditions:ofwhich
Creditstandards
Averagemargin
forloansMarginon
riskierloansDemandforloans
Loans to non-financial corporations
IV/12 a) 37 (19) 8 1 17 (-6)
I/13 b) 0 (22) 7 46 23 (-21)
II/13 c) 17(9) -36 3 19 (-1)
III/13 d) (20) (23)
Loans for house purchase
IV/12 a) -28 (-44) -30 17 21 (24)
I/13 b) -6 (-7) -27 -26 12 (-19)
II/13 c) 4 (-26) -43 -4 67 (17)
III/13 d) (-22) (-7)
Consumer credit
IV/12 a) 0 (0) 0 7 51 (7)
I/13 b) -1 (2) 23 1 5 (9)
II/13 c) 26 (30) 7 7 69 (-7)
II/13 d) (0) (-15)
CHANGESINBANKS’CREDITCONDITIONSDemandforloansincreasedandcreditstandardsweretightenedinpartofthecreditmarket(net percentages; positive value = tightening standards/conditions, demand growth; negative value = easing standards/conditions, demand decrease)
Note: Net percentages are calculated as the difference between the percentage share of loans provided by banks reporting that standards/conditions have been tightened (or demand increased) and the percentage share of loans provided by banks reporting that standards/conditions have been eased (or demand decreased). The individual responses are thus weighted by the volumes of loans of a given type.
a) Banks’ expectations reported in the III/12 survey given in parentheses.b) Banks’ expectations reported in the IV/12 survey given in parentheses.c) Banks’ expectations reported in the I/13 survey given in parentheses.d) Banks’ expectations reported in the II/13 survey given in parentheses.
III. CURRENT ECONOMIC DEVELOPMENTS

Czech National Bank / Inflation Report III/2013
47
40%, compared to 60% for large corporations. Nevertheless, small and medium-sized corporations are more indebted in relation to book value added.52
Households’ demand for loans recovered slightly. The annual growth rate of such loans rose by 0.3 percentage point compared to March, reaching 4.5% in May. The number and volume of new mortgages and consumer credit rose significantly (see Chart III.5.6).
The annual growth rate of loans for house purchase stabilised, although growth in mortgages picked up to 6.1% while the decline in building society loans deepened. Banks left their credit standards largely unchanged while reducing their average margins. The number and volume of new mortgages went up substantially. Demand for loans for house purchase increased due to refinancing of old loans, a better outlook for the residential property market and improved consumer confidence. An alternative source – Fincentrum Hypoindex – reveals that the growth in the number of new mortgages was fostered by mortgages for house purchase, mortgages for property construction and other mortgages, including refinancing (see Chart III.5.7). The contribution of the last-mentioned category was the largest since 2009. The share of the number of other mortgages is on an upward trend and currently stands at 25%. According to Hypoindex data, annual growth in the volume and number of new mortgages fell slightly in June 2013. Banks expect credit standards for housing loans to ease in 2013 Q3.
The annual growth rate of bankconsumercreditalso edged up to 2% amid renewed growth in consumer credit from non-banks (6.1%). New consumer credit increased sharply, partly because of consolidation of old loans (see Chart III.5.6). Demand for consumer credit was also probably affected by higher expenditure on durable goods.
The ratio of total household debt to disposable income increased to 59% in 2013 Q1 (or 65% including other accounts payable). This reflected a decline in gross disposable income. Despite falling interest rates, this decline was also reflected in a higher relative interest burden of households in the form of net interest paid, which increased to around 2% of disposable income (see Chart III.5.8). The ratio of household debt to GDP rose to 33%. Households’ behaviour in the areas of consumption, saving and debt is analysed in BOX 1 Consumption, savings and debt burden of household income groups in 2012 in section III.3.1.
52 The ratio of loans to book value added decreases with increasing corporation size. In 2011 it was 419% for micro-corporations, 49% for small corporations, 35% for medium-sized corporations and 22% for large corporations.
Housing loans (mortgages and building society loans)Loans to households, total
Consumer loansMortgages
New consumer loans (right-hand scale, annual percentage changes)New mortgages (right-hand scale, annual percentage changes)
1/11 5 9 5 591/12 1/13-1.5
0.0
1.5
3.0
4.5
6.0
7.5
9.0
10.5
-15
0
15
30
45
60
75
90
105
LOANSTOHOUSEHOLDSTheannualrateofgrowthofloanstohouseholdsincreasedslightly(annual percentage rates of growth; annual percentage changes)
Chart III.5.6
Total (annual percentage changes)OtherFor house purchase For construction
1/11 5 9 55 91/12 1/13
-20
-10
0
10
20
30
40
50
60
STRUCTUREOFNUMBEROFNEWMORTGAGES2013Q2sawgrowthinthenumbersofnewmortgagesforhousepurchaseandconstructionandinthenumbersofothermortgages,includingrefinancingofoldloans(contributions in percentage points; annual percentage changes; source: Fincentrum Hypoindex)
Chart III.5.7
III. CURRENT ECONOMIC DEVELOPMENTS
Micro-corporations Small corporations
Medium-sized corporations
Large corporations
Bonds 2011Bonds 2008 Bonds 2010Loans 2011Loans 2008 Loans 2010
0
50
100
150
200
250
LOANSBROKENDOWNBYSIZEOFNON-FINANCIALCORPORATIONSLargecorporationsinparticularhaveswitchedpartlyfromloanfinancingtobondissuance(volumes in CZK billions; source: Bach database, Banque de France, CNB calculations)
Chart III.5.5
Note: Micro-corporations – 0–9 employees, small corporations – 10–49 employees, medium-sized corporations – 50–249 employees, large corporations – 250 employees or more. The sample consists of 14,588 corporations over the last four years.
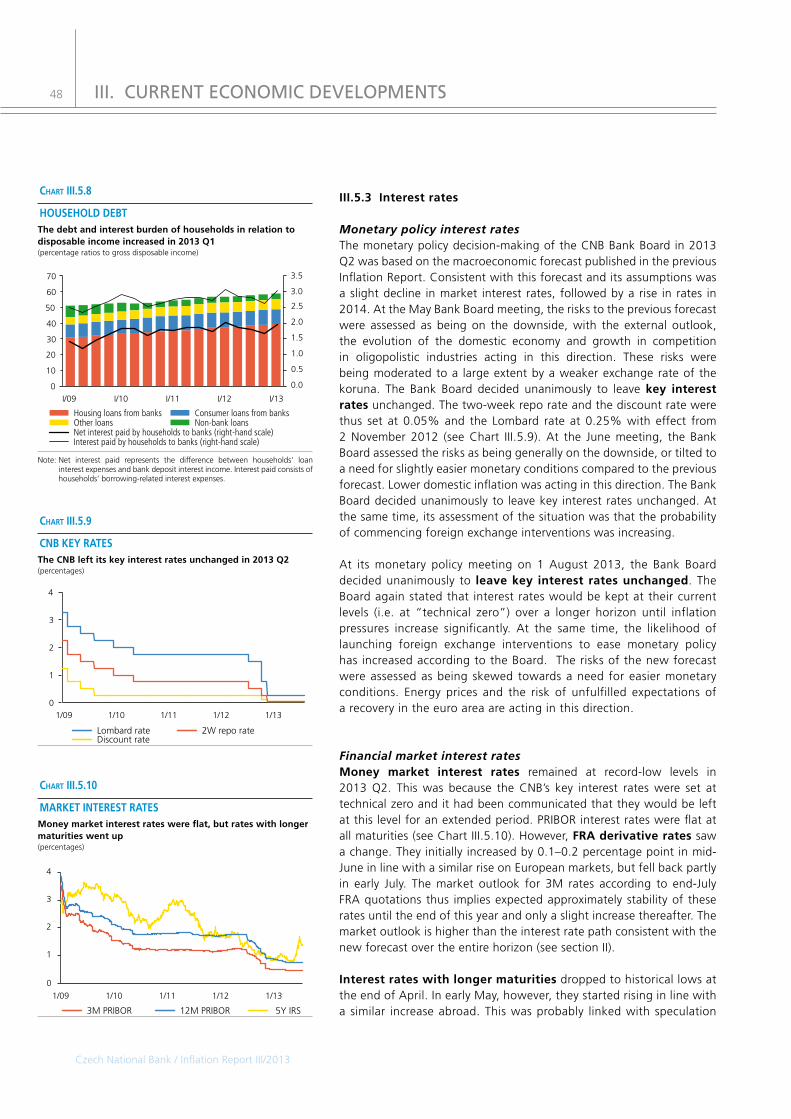
Czech National Bank / Inflation Report III/2013
48
III.5.3Interestrates
Monetary policy interest ratesThe monetary policy decision-making of the CNB Bank Board in 2013 Q2 was based on the macroeconomic forecast published in the previous Inflation Report. Consistent with this forecast and its assumptions was a slight decline in market interest rates, followed by a rise in rates in 2014. At the May Bank Board meeting, the risks to the previous forecast were assessed as being on the downside, with the external outlook, the evolution of the domestic economy and growth in competition in oligopolistic industries acting in this direction. These risks were being moderated to a large extent by a weaker exchange rate of the koruna. The Bank Board decided unanimously to leave key interestrates unchanged. The two-week repo rate and the discount rate were thus set at 0.05% and the Lombard rate at 0.25% with effect from 2 November 2012 (see Chart III.5.9). At the June meeting, the Bank Board assessed the risks as being generally on the downside, or tilted to a need for slightly easier monetary conditions compared to the previous forecast. Lower domestic inflation was acting in this direction. The Bank Board decided unanimously to leave key interest rates unchanged. At the same time, its assessment of the situation was that the probability of commencing foreign exchange interventions was increasing.
At its monetary policy meeting on 1 August 2013, the Bank Board decided unanimously to leavekey interest ratesunchanged. The Board again stated that interest rates would be kept at their current levels (i.e. at “technical zero”) over a longer horizon until inflation pressures increase significantly. At the same time, the likelihood of launching foreign exchange interventions to ease monetary policy has increased according to the Board. The risks of the new forecast were assessed as being skewed towards a need for easier monetary conditions. Energy prices and the risk of unfulfilled expectations of a recovery in the euro area are acting in this direction.
Financial market interest ratesMoney market interest rates remained at record-low levels in 2013 Q2. This was because the CNB’s key interest rates were set at technical zero and it had been communicated that they would be left at this level for an extended period. PRIBOR interest rates were flat at all maturities (see Chart III.5.10). However, FRAderivativerates saw a change. They initially increased by 0.1–0.2 percentage point in mid-June in line with a similar rise on European markets, but fell back partly in early July. The market outlook for 3M rates according to end-July FRA quotations thus implies expected approximately stability of these rates until the end of this year and only a slight increase thereafter. The market outlook is higher than the interest rate path consistent with the new forecast over the entire horizon (see section II).
Interestrateswithlongermaturities dropped to historical lows at the end of April. In early May, however, they started rising in line with a similar increase abroad. This was probably linked with speculation 12M PRIBOR 5Y IRS3M PRIBOR
0
1
2
3
4
1/09 1/11 1/12 1/131/10
MARKETINTERESTRATESMoneymarketinterestrateswereflat,butrateswithlongermaturitieswentup(percentages)
Chart III.5.10
Lombard rate 2W repo rateDiscount rate
1/09 1/11 1/12 1/131/100
1
2
3
4
CNBKEYRATESTheCNBleftitskeyinterestratesunchangedin2013Q2(percentages)
Chart III.5.9
Net interest paid by households to banks (right-hand scale)Interest paid by households to banks (right-hand scale)
I/09 I/10 I/11 I/12 I/13
0
10
20
30
40
50
60
70
0.0
0.5
1.0
1.5
2.0
2.5
3.0
3.5
Housing loans from banks Consumer loans from banksOther loans Non-bank loans
HOUSEHOLDDEBTThedebtandinterestburdenofhouseholdsinrelationtodisposableincomeincreasedin2013Q1(percentage ratios to gross disposable income)
Chart III.5.8
Note: Net interest paid represents the difference between households’ loan interest expenses and bank deposit interest income. Interest paid consists of households’ borrowing-related interest expenses.
III. CURRENT ECONOMIC DEVELOPMENTS

Czech National Bank / Inflation Report III/2013
49
regarding the discontinuation of the quantitative easing programme in the USA53 and with the repayment of ECB loans drawn by financial institutions under the LTRO programme. A role might also have been played by favourable macroeconomic data suggesting signs of recovery in global growth and by sales of bonds of CEE countries due to a rise in risk aversion. This was partially reversed in July, as major central banks (the Fed and the ECB) announced that current easy monetary policy would be maintained for an extended period. Despite this, domestic IRS rates increased (see Chart III.5.10) at individual maturities by as much as 0.6 percentage point compared to the start of May.
The average 3MPRIBORrate in 2013 Q2 was 0.5%, i.e. above the level assumed by the previous forecast, which, however, would have necessitated a hypothetical decline in the 2W repo rate to slightly negative values. Money market interest rates continued to be influenced by the credit premium. This premium, as measured by the spread between the 3M PRIBOR and 2W repo rate, declined slightly, averaging 0.4 percentage point in 2013 Q2.
The positively sloped PRIBORyieldcurve was almost unchanged in 2013 Q2. The spread between the 1Y PRIBOR and the 2W PRIBOR was flat at 0.5 percentage point. TheIRSyieldcurve initially shifted to a slightly lower level in 2013 Q2 and its positive slope decreased somewhat. During May, however, it started to shift upwards and its slope steepened significantly. In June, the average 5Y–1Y spread was 0.8 percentage point and the 10Y–1Y spread 1.3 percentage point.
Short-term interestratedifferentialsvis-à-vis the two main world currencies (PRIBOR/CZK–EURIBOR/EUR, or LIBOR/USD) reflected the only marginal changes in key rates in the Czech Republic and foreign financial markets. The differentials vis-à-vis euro and dollar rates were thus almost unchanged (see Chart III.5.11). The 3M PRIBOR–3M EURIBOR interest rate differential was 0.3 percentage point on average in 2013 Q2 and was at the same level on 19 July.
Eight auctions of fixed coupon bonds and four auctions of variable coupon bonds have been held on the primary government bondmarket since the start of April. The total volume of bonds issued was CZK 35 billion. Demand strongly exceeded supply in almost all the auctions. The bid-to-cover ratio was 2.6 on average. The Ministry of Finance subscribed the government bonds with very low yields, despite an increase in yields on the secondary market. The Ministry of Finance also issued a fourth issue of state saving bonds totalling CZK 17.5 billion; the yield was 1.7–3.1% depending on maturity (1.5Y to 7Y). The government bond yield curve – like the IRS curve – shifted slightly downwards in 2013 Q2 and then moved up again, mostly as a result of the foreign bond market situation. Its positive slope remained approximately unchanged (see Chart III.5.12).
53 For details see BOX 2 in section III.7.
3/137/12 7/135/13
1Y 2Y 3Y 4Y 5Y 6Y 7Y 8Y 9Y 10Y 11Y 12Y 13Y 14Y 15Y0
1
2
3
4
GOVERNMENTBONDYIELDCURVEThegovernmentbondyieldcurvemovedupcomparedtopreviousmonths(percentages)
Chart III.5.12
EUR 3M EUR 12MUSD 3M USD 12M
-1
0
1
2
3
1/09 1/10 1/11 1/12 1/13
INTERESTRATEDIFFERENTIALSInterestratedifferentialsvis-à-vistheeuroandthedollarwereflatatlowlevels(percentage points)
Chart III.5.11
III. CURRENT ECONOMIC DEVELOPMENTS

50
Client interest rates Client interest rate on new loans showed mixed developments in 2013 Q2. They increased for non-financial corporations, while declining for households. Short-term rate fixations for new loans in these two sectors remained flat or edged up, while long-term ones declined further.
The interest rate on new loans to non-financial corporations slightly edged up on average in Q2, reaching 2.2% in May. This reflected a rise in short-term rates, while the long-term rate on corporate loans declined (see Chart III.5.13). The average rate on small loans of up to CZK 30 million reached 3.2% and that on large loans edged up to 1.9%. The spread between these rates fluctuated slightly above 1%, indicating that credit conditions remain tighter for small loans than for large loans. With the 3M PRIBOR flat, the spread between the short-term rate on large corporate loans and the 3M PRIBOR increased slightly (see Chart III.5.15). Euro area rates showed similar developments but are currently slightly higher than those in the Czech Republic.
The interest rate on new loans for house purchase declined further for households, amounting to 3.4% on average in May (3.1% for mortgages). The largest decreases were recorded by rates on loans with fixations of over one year and up to five years (3.2%), which account for three-quarters of all house purchase loans, and also by rates with fixations of over five years and up to ten years (see Chart III.5.14). Rates on house purchase loans thus reached a new historical low. Floating rates and rates fixed for up to one year were flat. The spread between short-term and market rates stabilised this year after increasing in 2012 (see Chart III.5.15). The spread between the average rate on loans for house purchase and the long-term financial market rate showed similar developments. The margin on new house purchase loans edged down further to 2.5 percentage point on average due to a decline in the rate on loans amid a flat rate on deposits. According to Hypoindex, the interest rate on new mortgages went down only slightly in June 2013. The interest rate on house purchase loans also decreased in the euro area, fluctuating around 3%.
The interest rate and the APRC on consumer credit dropped to 14.5% and 15.5% respectively in May after a previous increase (see Chart III.5.14). According to banks’ information, the availability of these loans declined due to lower client creditworthiness. Banks increased the average margin and the margin on riskier loans, while lowering their non-interest charges. The share of non-performing consumer credit increased to 12.5%, the highest level reached over the past few years. The rate on overdrafts and revolving loans dropped to 14.4% and the rate on credit card debt was flat at 24.1%. The interest rate on consumer credit in the euro area is at lower levels (6–8%).
Interest rates on deposits of households and corporations remained low. Rates on overnight deposits edged down to 0.5% for households while remaining at 0.3% for non-financial corporations.
With floating rate and initial rate fixation up to 1 yearWith initial rate fixation over 1 and up to 5 yearsWith initial rate fixation over 5 and up to 10 yearsWith initial rate fixation over 10 years3M PRIBOR10-year government bond yieldInterest rate on consumer credit (right-hand scale)
0
1
2
3
4
5
6
7
1/11 1/12 1/131/09 1/1012
13
14
15
16
INTERESTRATESONLOANSTOHOUSEHOLDSInterestratesonloanstohouseholdsdeclined,reachingahistoricallowforhousingloans(new business; percentages)
Chart III.5.14
Loans to corporations (up to CZK 30m – with float. and fix. rate up to 1Y) – 3M PRIBORLoans to corporations (over CZK 30m – with float. and fix. rate up to 1Y) – 3M PRIBOR
Loans for house purchase, total – 10Y government bondsLoans for house purchase (with float. and fix. rate up to 1Y) – 3M PRIBOR
1/09 1/10 1/11 1/12 1/13
0
1
2
3
4
5
CLIENTANDMARKETINTERESTRATESPREADSThespreadbetweentheshort-termrateonlargecorporateloansandthe3MPRIBORincreasedslightly(percentage points)
Chart III.5.15
III. CURRENT ECONOMIC DEVELOPMENTS
Interest rate on loans to non-financial corporations (excluding overdrafts and others)
Up to CZK 30m with initial rate fixation over 5 yearsUp to CZK 30m with floating rate and initial rate fixation up to 1 yearOverdrafts3M PRIBOR
Over CZK 30m with floating rate and initial rate fixation up to 1 year
1/11 1/12 1/131/09 1/10
0
1
2
3
4
5
6
INTERESTRATESONLOANSTOCORPORATIONSTheinterestrateoncorporateloansslightlyedgedup(new business; percentages)
Chart III.5.13
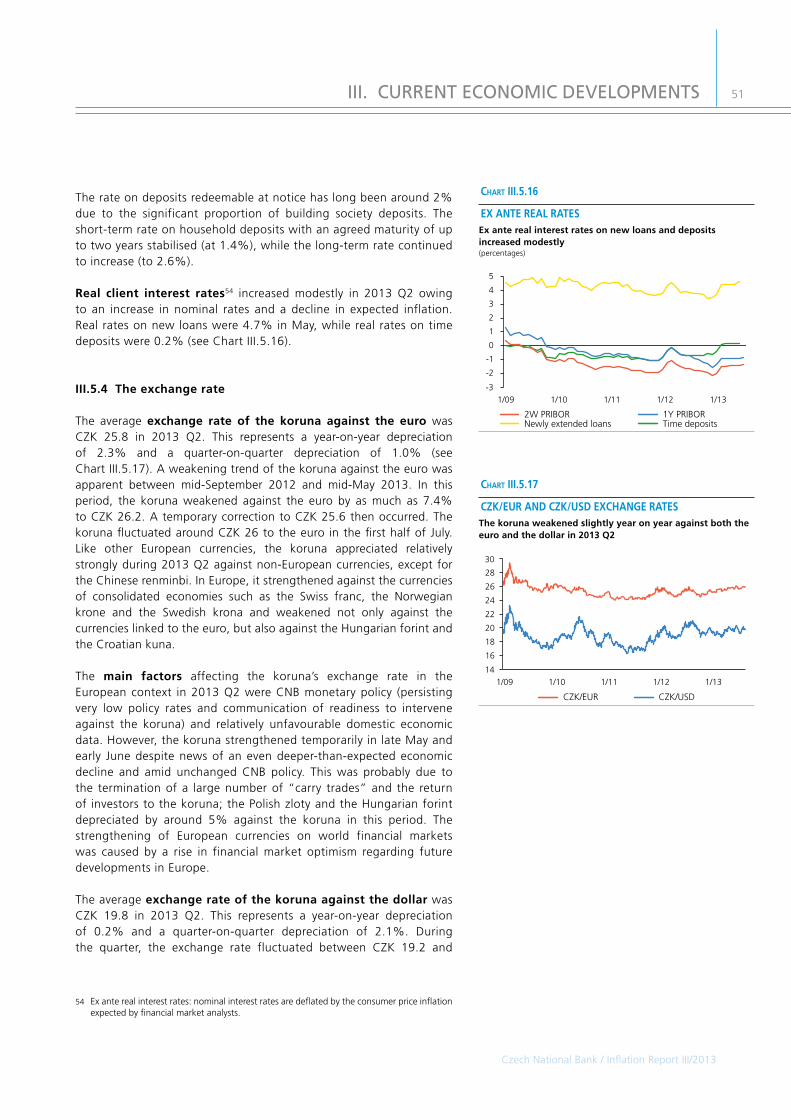
Czech National Bank / Inflation Report III/2013
51
The rate on deposits redeemable at notice has long been around 2% due to the significant proportion of building society deposits. The short-term rate on household deposits with an agreed maturity of up to two years stabilised (at 1.4%), while the long-term rate continued to increase (to 2.6%).
Real client interest rates54 increased modestly in 2013 Q2 owing to an increase in nominal rates and a decline in expected inflation. Real rates on new loans were 4.7% in May, while real rates on time deposits were 0.2% (see Chart III.5.16).
III.5.4Theexchangerate
The average exchange rate of the koruna against the euro was CZK 25.8 in 2013 Q2. This represents a year-on-year depreciation of 2.3% and a quarter-on-quarter depreciation of 1.0% (see Chart III.5.17). A weakening trend of the koruna against the euro was apparent between mid-September 2012 and mid-May 2013. In this period, the koruna weakened against the euro by as much as 7.4% to CZK 26.2. A temporary correction to CZK 25.6 then occurred. The koruna fluctuated around CZK 26 to the euro in the first half of July. Like other European currencies, the koruna appreciated relatively strongly during 2013 Q2 against non-European currencies, except for the Chinese renminbi. In Europe, it strengthened against the currencies of consolidated economies such as the Swiss franc, the Norwegian krone and the Swedish krona and weakened not only against the currencies linked to the euro, but also against the Hungarian forint and the Croatian kuna.
The main factors affecting the koruna’s exchange rate in the European context in 2013 Q2 were CNB monetary policy (persisting very low policy rates and communication of readiness to intervene against the koruna) and relatively unfavourable domestic economic data. However, the koruna strengthened temporarily in late May and early June despite news of an even deeper-than-expected economic decline and amid unchanged CNB policy. This was probably due to the termination of a large number of “carry trades” and the return of investors to the koruna; the Polish zloty and the Hungarian forint depreciated by around 5% against the koruna in this period. The strengthening of European currencies on world financial markets was caused by a rise in financial market optimism regarding future developments in Europe.
The average exchangerateofthekorunaagainstthedollar was CZK 19.8 in 2013 Q2. This represents a year-on-year depreciation of 0.2% and a quarter-on-quarter depreciation of 2.1%. During the quarter, the exchange rate fluctuated between CZK 19.2 and
54 Ex ante real interest rates: nominal interest rates are deflated by the consumer price inflation expected by financial market analysts.
2W PRIBORNewly extended loans
1Y PRIBORTime deposits
1/09 1/11 1/12 1/131/10
-3
-2
-1
0
1
2
3
4
5
EXANTEREALRATESExanterealinterestratesonnewloansanddepositsincreasedmodestly(percentages)
Chart III.5.16
CZK/EUR CZK/USD
1/11 1/12 1/131/101/09
14
16
18
20
22
24
26
28
30
CZK/EURANDCZK/USDEXCHANGERATESThekorunaweakenedslightlyyearonyearagainstboththeeuroandthedollarin2013Q2
Chart III.5.17
III. CURRENT ECONOMIC DEVELOPMENTS

52
CZK 20.3/USD without showing any signs of a clear trend. Compared with the start of the quarter, the dollar weakened very slightly against the koruna and other European currencies owing to market optimism regarding future developments in Europe.
III.5.5Economicresultsofnon-financialcorporations
The financial results of non-financial corporations with 50employeesormore55 in 2013 Q1 were consistent with the continued decline in economic activity. Annual growth in output fell noticeably and sales saw an annual decrease for the first time since 2009 (-6.8%). In these circumstances, the year-on-year decline in book value added deepened despite a marked fall in intermediate consumption (see Chart III.5.18). Gross operating surplus also recorded an annual decline, even though year-on-year growth in personnel costs almost halted.
With intermediate consumption falling faster than output, the materialcost-outputratio56 fell further year on year in 2013 Q1 (by 0.9 percentage point; see Table III.5.2). The fall was recorded mainly in the electricity, gas, heat and air-conditioned air supply industry and in real estate activities. By contrast, the material cost-output ratio in mining and quarrying and in professional and scientific activities moved in the opposite direction. In the high-weight manufacturing industry, the material cost-output ratio was flat in year-on-year terms following a slight increase in 2012 Q4.
By contrast, the personnel cost-output ratio57 recorded further annual growth in 2013 Q1 (see Table III.5.2). This was due chiefly to a sharper annual decline in book value added stemming from the persisting low demand, as personnel costs were almost unchanged in year-on-year terms.
Data for the narrower segment of large corporations (with 250 employees or more58) indicate similar trends in the main financial indicators in 2013 Q1 as in the larger segment of corporations, although the rate of decrease of these indicators is slightly more pronounced.
55 The segment of corporations with 50 employees or more consisted of almost 9,300 non-financial corporations at the end of 2013 Q1.
56 The material cost-output ratio defined as the ratio of intermediate consumption to output.57 The personnel cost-output ratio defined as the ratio of personnel costs to output.58 The segment of corporations with 250 employees or more consisted of almost 1,700 non-
financial corporations at the end of 2013 Q1.
Czech National Bank / Inflation Report III/2013
table III.5.2
2012 Q1 2013 Q1Annual
percentagechanges
Output incl. profit margin (CZK billions)a) 1,407.4 1,298.6 -7.7
Personnel costs (CZK billions) 197.9 198.3 0.2Intermediate consumption (CZK billions)
1,036.6 945.6 -8.8
Book value added (CZK billions) 370.8 353.0 -4.8
Sales (CZK billions) 1,811.1 1,688.3 -6.8
Percen-tages
Percen-tages
Annualchangesinpp
Ratio of personnel costs to value addeda) 53.4 56.2 2.8
Material cost-output ratioa) 73.7 72.8 -0.9
Personnel cost-output ratioa) 14.1 15.3 1.2
Ratio of book value added to outputa) 26.3 27.2 0.9
PERFORMANCEINDICATORSOFCORPORATIONSThematerialcost-outputratiodecreasedfurther
a) CNB calculation
Book value added (right-hand scale)Gross operating surplus (depreciation + profits)
Intermediate consumption (right-hand scale)Personnel costs (right-hand scale)
Output including profit margin (right-hand scale)
I/09 I/13I/10 I/11 I/12-40
-30
-20
-10
0
10
20
30
40
-20
-15
-10
-5
0
5
10
15
20
KEYFINANCIALINDICATORSThemainfinancialindicatorsworsenedagainin2013Q1(annual percentage changes)
Chart III.5.18
III. CURRENT ECONOMIC DEVELOPMENTS

53
Czech National Bank / Inflation Report III/2013
III.5.6Financialpositionofcorporationsandhouseholds
Annual growth in the financial liabilities of non-financialcorporationsin 2013 Q1 was very moderate and slowed by comparison with the previous two quarters (see Chart III.5.19). For several quarters now, the growth in financial liabilities has been driven by debt securities (corporate bonds issued59) and to an almost negligible extent also by loans. Quoted shares (i.e. registered capital) have been recording negative contributions owing to revaluation of these shares. As regards the assets of non-financial corporations, the share of currency and deposits continued to increase in Q1, albeit more slowly than in the previous period, and the volume of long-term debt securities rose owing to bond purchases by corporations. Domestic government and non-financial corporations themselves were the counterparties to these transactions.60 The share of issued bonds in corporate financing, and also the willingness of corporations to hold corporate and government bonds in their balance sheets, have thus been rising over the last few quarters. The overall net financial position of corporations has long been negative, reaching -91% of GDP.
The main balance sheet trends in non-financial corporations are reflected in the financial indicators; the acid-test ratio of corporations slowed in 2013 Q1 and the ratio of market-based financing fell slightly. Corporate solvency was almost unchanged from the previous quarter and was roughly at the level observed in 2011.
Households are net creditors in the national economy and their net financial position is 71% of GDP. Net financial assets have been growing at an annual rate of almost 6% over the last few quarters. All components of financial assets increased, the biggest contributors as usual being currency and deposits, long-term securities61 and pension fund reserves. Households’ financial liabilities are still rising steadily, but the growth slowed compared to previous quarters. Long-term loans made the dominant contribution (roughly 3 percentage points) to annual growth in financial liabilities. In recent quarters, annual growth in the net financial assets of households has been around 7% of the annual gross disposable income of households (see Chart III.5.20).
59 Corporate bond issuance recorded an increase particularly at the end of 2012, when advantageous tax conditions applied to the issuance of bonds with a nominal value of one koruna (valid until 31 December 2012). A large number of issues motivated by these conditions occurred at the end of 2012. Households were the main counterparties. The volume of corporate bond issuance in 2012 as a whole was double the average for the previous three years owing to the tax benefits and to increased usual issuance activity.
60 The increased holdings of long-term securities by non-financial corporations in 2013 Q1 may have been due to the rise in the number of bonds issued at the end of 2012 and credited to the asset accounts of their holders in 2013 Q1 (see the previous footnote).
61 In 2013 Q1, only minor bond purchases were made by households (the spring issue of saving bonds will affect household balance sheets in 2013 Q2). However, unusually high purchases of corporate bonds and issues of government saving bonds at the close of last year were reflected in higher annual growth in the outstanding amounts of securities at the start of this year.
Growth in ratio of net financial assets to gross disposable income
I/12I/09 I/13I/10 I/11
Insurance technical reservesShares and other equityOthers
Saving rateNet financial assets
Currency and depositsDebt securities
-2
0
2
4
6
8
10
12
14
STRUCTUREOFHOUSEHOLDFINANCIALASSETSThefinancialassetsofhouseholdsaregrowingatasteadyrate(contributions in percentage points; annual percentage changes and percentage ratios)
Chart III.5.20
LoansDebt securitiesQuoted shares Other accounts payableShares and other equity excluding quoted sharesTotal financial liabilities (annual percentage changes)
I/09 I/12 I/13I/10 I/11
-8
-6
-4
-2
0
2
4
6
8
FINANCIALLIABILITIESOFNON-FINANCIALCORPORATIONSThefinancialliabilitiesofcorporationsincreasedonlyveryslightlyyearonyearin2013Q1(annual percentage changes; contributions in percentage points)
Chart III.5.19
III. CURRENT ECONOMIC DEVELOPMENTS
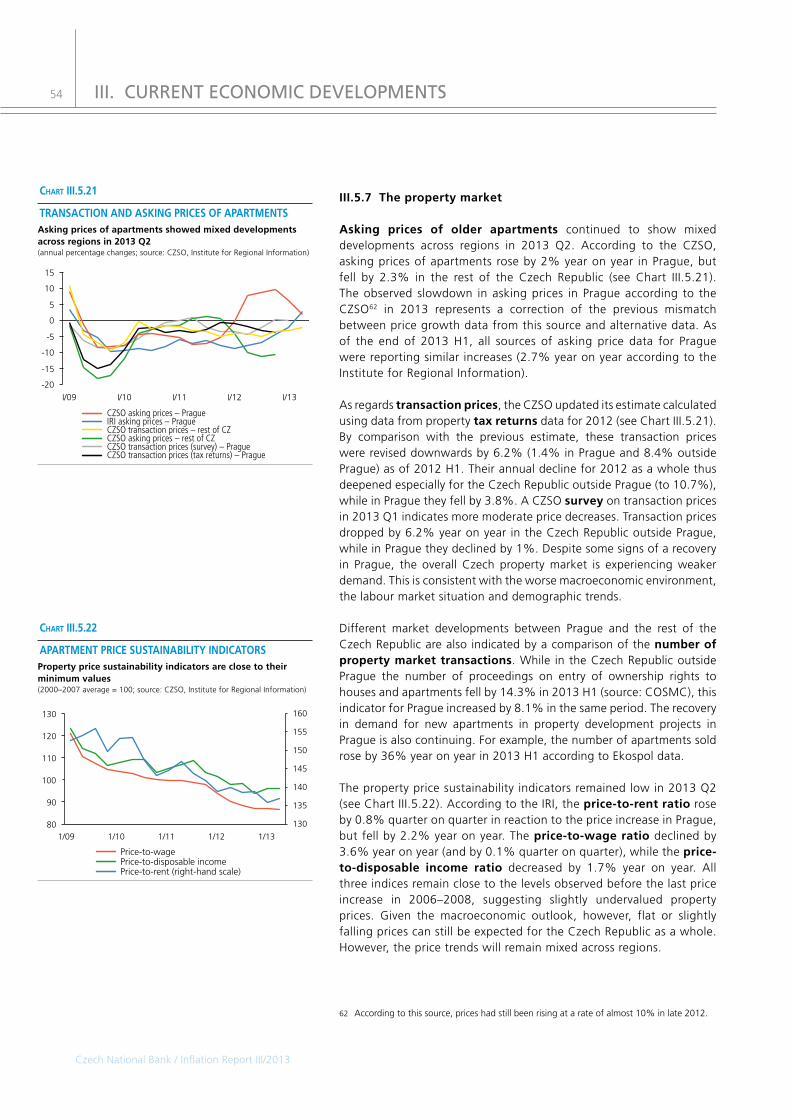
Czech National Bank / Inflation Report III/2013
54
III.5.7Thepropertymarket
Asking prices of older apartments continued to show mixed developments across regions in 2013 Q2. According to the CZSO, asking prices of apartments rose by 2% year on year in Prague, but fell by 2.3% in the rest of the Czech Republic (see Chart III.5.21). The observed slowdown in asking prices in Prague according to the CZSO62 in 2013 represents a correction of the previous mismatch between price growth data from this source and alternative data. As of the end of 2013 H1, all sources of asking price data for Prague were reporting similar increases (2.7% year on year according to the Institute for Regional Information).
As regards transactionprices, the CZSO updated its estimate calculated using data from property taxreturns data for 2012 (see Chart III.5.21). By comparison with the previous estimate, these transaction prices were revised downwards by 6.2% (1.4% in Prague and 8.4% outside Prague) as of 2012 H1. Their annual decline for 2012 as a whole thus deepened especially for the Czech Republic outside Prague (to 10.7%), while in Prague they fell by 3.8%. A CZSO survey on transaction prices in 2013 Q1 indicates more moderate price decreases. Transaction prices dropped by 6.2% year on year in the Czech Republic outside Prague, while in Prague they declined by 1%. Despite some signs of a recovery in Prague, the overall Czech property market is experiencing weaker demand. This is consistent with the worse macroeconomic environment, the labour market situation and demographic trends.
Different market developments between Prague and the rest of the Czech Republic are also indicated by a comparison of the numberofpropertymarkettransactions. While in the Czech Republic outside Prague the number of proceedings on entry of ownership rights to houses and apartments fell by 14.3% in 2013 H1 (source: COSMC), this indicator for Prague increased by 8.1% in the same period. The recovery in demand for new apartments in property development projects in Prague is also continuing. For example, the number of apartments sold rose by 36% year on year in 2013 H1 according to Ekospol data.
The property price sustainability indicators remained low in 2013 Q2 (see Chart III.5.22). According to the IRI, the price-to-rentratio rose by 0.8% quarter on quarter in reaction to the price increase in Prague, but fell by 2.2% year on year. The price-to-wageratio declined by 3.6% year on year (and by 0.1% quarter on quarter), while the price-to-disposable income ratio decreased by 1.7% year on year. All three indices remain close to the levels observed before the last price increase in 2006–2008, suggesting slightly undervalued property prices. Given the macroeconomic outlook, however, flat or slightly falling prices can still be expected for the Czech Republic as a whole. However, the price trends will remain mixed across regions.
62 According to this source, prices had still been rising at a rate of almost 10% in late 2012.
Price-to-wagePrice-to-disposable incomePrice-to-rent (right-hand scale)
1/09 1/10 1/11 1/12 1/1380
90
100
110
120
130
130
135
140
145
150
155
160
APARTMENTPRICESUSTAINABILITYINDICATORSPropertypricesustainabilityindicatorsareclosetotheirminimumvalues(2000–2007 average = 100; source: CZSO, Institute for Regional Information)
Chart III.5.22
III. CURRENT ECONOMIC DEVELOPMENTS
I/09 I/10 I/11 I/13I/12
CZSO asking prices – PragueIRI asking prices – Prague
CZSO asking prices – rest of CZ
CZSO transaction prices (tax returns) – PragueCZSO transaction prices (survey) – Prague
CZSO transaction prices – rest of CZ
-20
-15
-10
-5
0
5
10
15
TRANSACTIONANDASKINGPRICESOFAPARTMENTSAskingpricesofapartmentsshowedmixeddevelopmentsacrossregionsin2013Q2(annual percentage changes; source: CZSO, Institute for Regional Information)
Chart III.5.21

55
III.6BALANCEOFPAYMENTS
In 2013 Q1, the balance of payments was characterised by a high goods and services surplus, linked mainly with a trade surplus. However, its effect on the current account was largely offset by an increasing income deficit resulting from high direct investment income debits, especially dividends paid to non-residents. Direct investment recorded the biggest surplus on the financial account, thanks mainly to equity capital increases in foreign-owned corporations in the Czech Republic. However, this surplus and the net inflow of portfolio investment were largely offset by a net outflow of other investment, due chiefly to capital flows in the corporate sector.
III.6.1Thecurrentaccount
Thecurrentaccount recorded a surplus of CZK 16.8 billion in 2013 Q1. Following a year-on-year deepening of the current account deficit in the previous two quarters, its surplus was almost unchanged in Q1 due to contrary movements in the income balance and the other three balances. At -2.5%, the annual moving ratio of the current account to GDP was also unchanged from the previous quarter.
The tradesurplus amounted to CZK 55 billion in Q1, recording a year-on-year increase of more than CZK 3 billion. The rise in the trade surplus in this quarter was supported by price developments coupled with a positive year-on-year change in the terms of trade, roughly one-half of which, however, was offset by developments in real terms. The shift of external demand from annual growth to a slight decrease was reflected in nominal exports, which switched from annual growth to a decline exceeding 3%. Goods imports fell even faster (by almost 4%). In addition to a decline in traditionally import-intensive exports, these developments were due to a continuing decrease in total domestic demand and a drop in energy input prices. On the other hand, the decline in trade turnover was partly dampened by a weakening koruna. Turning to the commodity structure, a decrease in the mineral fuels deficit was the biggest contributor to the rise in the overall surplus. By contrast, a decrease in the surplus on machinery and transport equipment had the strongest dampening effect on the rise in the overall surplus (see Chart III.6.2). The year-on-year growth in the trade surplus accelerated significantly during 2013 Q2, reaching almost CZK 18 billion for April–May.
In 2013 Q1, the services surplus rose slightly year on year to CZK 17.4 billion (see Chart III.6.3). The overall surplus was due to a rising travel surplus and a persisting transport surplus. The slight increase in the travel surplus was linked with a rapid rise in the Czech Republic’s credits on private travel. Other services recorded a slight deficit, which, however, moderated in year-on-year terms owing to a sharp increase in credits. The lower deficit on other services was due chiefly to merchanting and technical services. At the same time, the narrowing of the other services deficit had the largest impact on the year-on-year change in the overall surplus.
Czech National Bank / Inflation Report III/2013
Trade balanceCurrent transfers Balance of services
Income balance
Current account
I/09 I/12 I/13I/10 I/11
-400
-300
-200
-100
0
100
200
300
CURRENTACCOUNTTheannualmovingcurrentaccountdeficitwasalmostunchangedin2013Q1(annual moving totals in CZK billions)
Chart III.6.1
2009 2010 2011 2012 2013
Mineral fuels ChemicalsManufactured
goods MachineryManufactured
articles-60
-40-20
020
4060
80
100
120
TRADEBALANCETheyear-on-yearchangeinthetradebalancewasaffectedmoststronglyin2013Q1byadecreaseinthemineralfuelsdeficit(accumulation since start of year in CZK billions; change of ownership principle)
Chart III.6.2
Transport TravelOther services Total
I/09 I/12 I/13I/10 I/11
-15
-10
-5
0
5
10
15
20
25
BALANCEOFSERVICESTravelandtransportagaincontributedtotheservicessurplusin2013Q1(CZK billions)
Chart III.6.3
III. CURRENT ECONOMIC DEVELOPMENTS

56
In contrast to the goods and services surplus, the income balance showed a deficit of CZK 64.5 billion, up by almost CZK 14 billion year on year. The largest component of the overall balance was a direct investment income deficit of CZK 67.5 billion (see Chart III.6.4), linked mainly with income in the form of dividends paid to non-residents and estimated reinvested earnings in the Czech Republic. The year-on-year increase in the overall deficit was due above all to a higher direct investment income deficit resulting from higher dividend payments, whereas earnings reinvested in the Czech Republic and interest payments decreased. Portfolio investment income also shifted to a slight deficit. By contrast, other investment income and compensation of employees recorded modest surpluses.
Currenttransfers recorded a surplus of CZK 8.9 billion in 2013 Q1, up by almost CZK 8 billion on a year earlier. The government transfers surplus reached CZK 13.9 billion, stemming almost exclusively from a surplus on transfers between the Czech Republic and the EU budget (CZK 14 billion). However, it was partly offset by a deficit on transfers of other sectors. The year-on-year increase in the overall surplus was linked mainly with higher transfers from the EU budget.
III.6.2Thecapitalaccount
The capitalaccount also ended in a small surplus of CZK 0.4 billion, almost unchanged from a year earlier. The overall surplus was due mainly to income of CZK 0.3 billion from the EU budget.
III.6.3Thefinancialaccount
The financialaccount ended 2013 Q1 in a surplus of CZK 6.5 billion, due mainly to net inflows of direct and portfolio investment (see Chart III.6.5). However, these surpluses were largely offset by a net outflow of other investment.
In 2013 Q1, directinvestment recorded a surplus of CZK 28.4 billion, slightly lower than a year earlier (see Chart III.6.6). The overall gross inflow in this quarter exceeded CZK 56 billion and was linked mainly with an equity capital increase resulting from a one-off operation of a foreign energy company. Estimated reinvested earnings were also an important component of the gross inflow. By contrast, outflows abroad were predominant in credit relations between affiliated corporations, fostering a moderation of the overall surplus. Czech direct investment abroad was also affected mainly by an equity capital outflow resulting from a significant foreign acquisition by a Czech company. With regard to industries, the foreign capital inflow (excluding reinvestment) was channelled primarily into electricity and gas supply. Capital outflows abroad also went mainly into the energy sector.
Czech National Bank / Inflation Report III/2013
Direct investment Portfolio investmentFinancial derivativesOther investment
Financial account
I/09 I/12 I/13I/10 I/11
-200
-100
0
100
200
300
400
FINANCIALACCOUNTTheannualmovingfinancialaccountsurplusmoderatedin2013Q1duemainlytoadecreaseintheportfolioinvestmentsurplus(annual moving totals in CZK billions)
Chart III.6.5
Equity capital Reinvested earningsOther capital Total
I/09 I/12 I/13I/10 I/11
-40
-20
0
20
40
60
80
DIRECTINVESTMENTAnetinflowofinvestmentinequitycapitalcontributedthemosttothedirectinvestmentsurplusin2013Q1(CZK billions)
Chart III.6.6
-70
-60
-50
-40
-30
-20
-10
0
10
2009 2010 2011 2012 2013
Compensation of employees
Direct investment
income
Portfolio investment
income
Other investment
income
INCOMEBALANCEWithintheincomebalance,thedirectinvestmentincomedeficitincreasedinparticularyearonyearin2013Q1(accumulation since start of year in CZK billions)
Chart III.6.4
III. CURRENT ECONOMIC DEVELOPMENTS

Czech National Bank / Inflation Report III/2013
57
Portfolio investment also recorded a net inflow, in contrast to a net outflow in the previous quarter. This net inflow totalled CZK 18.9 billion (see Chart III.6.7). The largest operations were purchases of government bonds and short-term bank money market instruments by foreign investors. Non-residents also made very modest purchases of domestic shares. Trading by domestic investors in foreign securities was dominated by sales as a result of a decrease in bond holdings, of which only one-half was offset by share purchases. The net inflow of portfolio investment moderated by more than CZK 6 billion year on year. A fall in the gross inflow on the liabilities side stemming from the absence of a significant government bond issue on foreign markets in this quarter was largely offset by a change in flows on the asset side linked with a loss of interest in foreign securities among domestic investors.
Settlement of financialderivatives led to a negligible net inflow of CZK 0.1 billion, down by almost CZK 5 billion year on year.
By contrast, otherinvestment saw a net outflow of funds totalling CZK 41 billion, almost unchanged from a year earlier. The overall deficit was due chiefly to a net outflow of CZK 27.3 billion in the corporate sector, linked with the repayment of short-term financial loans and trade credits received from abroad and current provision of loans to non-residents. In addition, a net capital outflow was recorded by the monetary financial institutions sector, owing to growth in long-term deposits and loans abroad. Other investment in the government sector also ended in a small deficit associated chiefly with an increase in the Czech Republic’s ownership interest in the EIB.
The CNB’s internationalreserves totalled CZK 868.3 billion at the end of 2013 Q2, representing a quarter-on-quarter decrease of almost CZK 25 billion due mainly to a deficit on transactions executed for CNB clients. In dollar terms, the reserves declined by USD 0.7 billion to USD 43.8 billion in the same period (see Chart III.6.8). The CNB’s international reserves covered 45% of all external debt liabilities of domestic entities at the end of 2013 Q1.
Czech equity securities and participations held by non-residentsForeign debt securities held by residentsForeign equity securities and participations held by residents
Czech debt securities held by non-residents
Net inflow of portfolio investment
I/09 I/12 I/13I/10 I/11
-80
-60
-40
-20
0
20
40
60
80
100
PORTFOLIOINVESTMENTPortfolioinvestmentrecordedanetinflowin2013Q1,owingmainlytopurchasesofCzechdebtsecuritiesbynon-residents(CZK billions)
Chart III.6.7
The CNB's international reserves
I/09 I/10 I/11 I/12 I/13
0
5
10
15
20
25
30
35
40
45
CNBINTERNATIONALRESERVESTheCNB’sinternationalreservesdecreasedslightlyin2013Q2comparedtothepreviousquarterindollarterms(USD billions; end of quarter)
Chart III.6.8
III. CURRENT ECONOMIC DEVELOPMENTS

Czech National Bank / Inflation Report III/2013
58
III.7THEEXTERNALENVIRONMENT
The euro area economy remained in recession in 2013 Q1, although its quarter-on-quarter contraction moderated, whereas the US economy continued to grow. The decline in euro area GDP should come to a halt in 2013 Q2, and in 2014 the economy should start to grow, albeit at a much lower pace than in the USA. Consumer prices increased in June in both the euro area and the USA owing chiefly to energy and fuel prices. However, the commodity market situation is stable thanks to satisfactory supply and still subdued demand and should not be a source of inflation pressures in the near future. The estimates for consumer price inflation in 2013 as a whole were therefore decreased to about 1.5% in both the euro area and the USA. The euro-dollar exchange rate was volatile owing to increased uncertainty regarding the future monetary policy direction of the ECB and Fed.
III.7.1Theeuroarea
The quarter-on-quarter decline in euro area GDP slowed by 0.4 percentage point in 2013 Q1 compared to the previous quarter, to -0.2%, thanks mainly to household consumption switching from decline to weak growth. By contrast, the year-on-year decline in GDP deepened to -1.1%, with decreases in all components of domestic demand being only partly offset by a positive – albeit falling – contribution of net exports (see Chart III.7.1).
The economicgrowthestimate for Q2 deteriorated in the July CF compared to the April one, but the quarter-on-quarter economic decline should come to a halt and the year-on-year contraction should moderate to -0.9%. This outlook is supported by data on industry and retail trade, where the declines moderated in April and May by comparison with Q1. By contrast, the unemployment rate rose by a further 0.1 percentage point in May to 12.2%, up by almost 1 percentage point on a year earlier. In the second half of this year, GDP should switch to quarterly growth according to the CF forecast. This expectation is supported by leading indicators, which mostly increased in May and June. The GDP growth estimate for 2013 as a whole was revised downwards by 0.2 percentage point in the July CF by comparison with the April one, to -0.6%, which is also in line with forecasts of international institutions (see Chart III.7.2). GDP is expected to grow by 0.8% in 2014.
Inflation went up by 0.2 percentage point to 1.6% in June (see Chart III.7.3) owing to a significant increase in annual energy price growth. However, the July CF expects inflation to slow again in Q3 and Q4. The estimated average inflation rate for 2013 as a whole fell by 0.2 percentage point to 1.5% compared to April.
In May 2013 the ECB cut its key interest rate from 0.75% (valid since July 2012) to 0.5% and reiterated that further steps – including negative deposit rates – were possible. It does not expect inflation
Change in inventoriesGross fixed capital formation
Net exportsGovernment consumption
Household consumption GDP (annual percentage changes)
I/09 I/13I/10 I/11 I/12
-6
-4
-2
0
2
4
GDPINTHEEUROAREATheyear-on-yeardeclineinGDP–duetoallcomponentsofdomesticdemand–deepenedslightlyfurtherin2013Q1(annual percentage changes; contributions in percentage points; seasonally adjusted; source: Datastream)
Chart III.7.1
-0.8
-0.6
-0.4
-0.2
0.0
1.2
1.4
1.6
1.8
CF
7/13
IMF
7/13
OEC
D 5
/13
ECB
6/13
CF
7/13
IMF
4/13
OEC
D 5
/13
ECB
6/13
GDP
Inflation
EUROAREAGDPANDINFLATIONOUTLOOKSFOR2013EuroareaGDPisexpectedtodecreaseby0.6%in2013,whileinflationshouldbearound1.5%(annual percentage changes; source: CF, IMF, OECD, ECB)
Chart III.7.2
Note: Horizontal axis shows most recent forecast data in format “Source month/year of publication”. Midpoint of range for ECB.
III. CURRENT ECONOMIC DEVELOPMENTS

Czech National Bank / Inflation Report III/2013
59
pressures to re-emerge over the medium term. This is evidenced by low money supply growth and a falling volume of loans to the private sector. In addition, the ECB used forward guidance for the first time in July, stating that “the Governing Council expects the key ECB interest rates to remain at present or lower levels for an extended period of time”.63 The use of this instrument was prompted by a global increase in government bond yields after Fed representatives suggested that the Fed’s bond purchases could be reduced in the foreseeable future (see BOX 2).
BOX2TheannouncedreductionofquantitativeeasingintheUSAanditseffectonyieldcurves
The May FOMC meeting and a number of statements made by leading representatives of the US central bank led to widespread speculation that the Fed would taper its bond purchases soon. This resulted in a surge in bond yields globally, while stock markets declined and the currencies of emerging economies weakened. In particular, long-term interest rate outlooks were revised, but a correction occurred in late June and bond yields edged down again. In addition, some Fed representatives quelled the speculation by stating that the retreat from quantitative easing depended on the US growth outlook. Nevertheless, the implied outlook for EURIBOR and LIBOR rates remains above the path expected by the markets in May, with the shift being particularly visible for dollar LIBOR rates (see Chart 1). The correction was more pronounced in the euro area, primarily as a result of the ECB’s communication following the June meeting. The ECB announced that monetary policy would remain accommodative for as long as necessary and key interest rates would remain at present or lower levels for an extended period of time (“forward guidance”). On the Czech financial market, these factors were also reflected mainly in medium-term and long-term rates, whereas the short-term rate outlook increased only slightly.
Market rates in the euro area are also affected by the ECB’s long-term operations. The volume of three-year lending operations and therefore also excess liquidity has been falling steadily since January 2013 (see Chart 2). The faster decrease in excess liquidity in 2013 Q1 was due to banks’ efforts to repay long-term loans ahead of schedule, motivated mainly by a lower need for liquidity buffers and better funding opportunities on the market. The decrease slowed in the following months. Excess liquidity stood at EUR 275 billion in the first week of July.
63 Publication of the interest rate outlook is common practice in some central banks. The Reserve Bank of New Zealand became the first central bank to regularly publish an interest rate outlook in 1997. It was followed by the central banks of Norway, Sweden and the Czech Republic. The Fed has started using forward guidance as an unconventional monetary policy instrument. The Bank of England started to apply this instrument at the same time as the ECB.
1Y EURIBOR (7/13)1Y LIBOR (7/13)
1Y EURIBOR (5/13)1Y LIBOR (5/13)
0.0
0.5
1.0
1.5
2.0
2.5
3.0
3.5
4.0
4.5
1/131/12 1/151/14
EURIBORANDLIBORRATES–HISTORYANDOUTLOOKThemarketinterestrateoutlookshiftedupwardsaftertheFedannounceditwouldlimitquantitativeeasing(percentages; monthly averages; source: Datastream and Bloomberg, outlook based on market contracts)
Chart 1 (box)
Outlook (6/13)Excess liquidity and outlook (7/13)
0
100
200
300
400
500
600
700
800
900
1/12 7/137/12 1/13
EXCESSLIQUIDITYINTHEEUROAREAExcessliquidityfellsharplyin2013Q1,buttherateofdeclineshouldslowovertheremainderofthisyear(EUR billions; weekly data; source: Datastream, outlook based on EONIA forwards)
Chart 2 (box)
CPICPI excluding energy and food prices
PPI (right-hand scale)
I/11 I/12 I/13I/09 I/10
-3
-2
-1
0
1
2
3
4
5
-9
-6
-3
0
3
6
9
12
15
INFLATIONANDPRODUCERPRICESINTHEEUROAREAInflationwentupin2013Q2,whileproducerpricesfellslightly(annual percentage changes; source: Datastream)
Chart III.7.3
III. CURRENT ECONOMIC DEVELOPMENTS

Czech National Bank / Inflation Report III/2013
60
In June 2013 the market was still expecting excess liquidity to fall below EUR 200 billion by the end of this year, but in July the outlook shifted slightly upwards. This was mainly caused by ECB communications stating that monetary policy would remain accommodative for an extended period of time. By the ECB’s estimation, market rates will stay only slightly above its deposit rate if excess liquidity is between EUR 100 and 200 billion.
Following a quarter-on-quarter decline of 0.7% at the close of 2012, GermanGDP grew by 0.1% in 2013 Q1. It was favourably affected mainly by higher household spending on final consumption. The contributions of fixed investment and government consumption were negative in this period, while the impact of net exports was negligible. In year-on-year terms GDP fell by 0.3% as a result of a lower positive contribution of net exports amid a continuing decline in investment (see Chart III.7.4). The July CF expects a renewal of annual economic growth in 2013 Q2. This is also suggested by year-on-year data on industrial production for the first two months of Q2, when production rose slightly again after decreasing by almost 2.5% in Q1. On the other hand, retail turnover growth slowed somewhat compared to 2013 Q1 (to around 0.7%).
Inthesecondhalfofthisyear, the July CF expects a further slight acceleration in economic growth. This will be due chiefly to household consumption, which will offset a drop in investment and a decline in the positive contribution of net exports stemming mainly from a continued economic slowdown in the euro area (where almost one-half of German exports go) and emerging economies (China, India, etc.). Most leading indicators increased at the end of 2013 Q2. Compared to April, the July CF expects a sharper fall in fixed investment for 2013 as a whole. It has therefore reduced the GDP growth outlook for 2013 by 0.3 percentage point to 0.4%. Household consumption will remain the main driver of growth. Next year economic activity is expected to increase by 1.6%.
InflationinGermany went up to 1.8% in June (see Chart III.7.5). The higher annual consumer price inflation was due above all to higher prices of food and energy (including a rise in electricity prices of 12% at the beginning of 2013 due to support for renewable resources). CF expects inflation to reach 1.6% in 2013 as a whole and 1.7% in 2014.
In 2013 Q1 the quarterly GDP growth rate in Slovakia edged up to 0.2%, thanks mainly to a higher positive contribution of net exports amid a decline in domestic demand. By contrast, the annual GDP growth rate slowed by 0.2 percentage point to 0.8%. Compared to April, the July CF reduced the GDP growth estimate by 0.2 percentage point to 0.8% for 2013 as a whole and to 2.1% for 2014. Unemployment has fluctuated just above 14% over the last three months, up by 0.3 percentage point on a year earlier. Compared to May, inflation
Change in inventoriesGross fixed capital formation
Net exportsGovernment consumption
Household consumption GDP (annual percentage changes)
I/09 I/13I/10 I/11 I/12
-8
-6
-4
-2
0
2
4
6
GDPINGERMANYGDPdeclinedyearonyearin2013Q1,withnetexportgrowthslowingandthedeclineinfixedinvestmentstayingatthepreviousquarter’slevel(annual percentage changes; contributions in percentage points; seasonally adjusted; source: Datastream)
Chart III.7.4
CPICPI excluding energy and food prices
PPI (right-hand scale)
I/11 I/12 I/13I/09 I/10
-3
-2
-1
0
1
2
3
4
-9
-6
-3
0
3
6
9
12
INFLATIONANDPRODUCERPRICESINGERMANYInflationwentupgraduallyin2013Q2,mainlyduetopricesofenergyandfood.Industrialproducerpriceinflationapproachedzero(annual percentage changes; source: Datastream)
Chart III.7.5
III. CURRENT ECONOMIC DEVELOPMENTS

Czech National Bank / Inflation Report III/2013
61
in Slovakia fell slightly to 1.6% in June, mainly as a result of cheaper fuels. Producer price inflation, which turned negative in May (-0.6% year on year), also indicates weak inflation pressures. The July CF expects average inflation of 1.8% for 2013 as a whole.
III.7.2TheUnitedStates
Annual economic growth in the USA edged down from 1.7% in 2012 Q4 to 1.6% in 2013 Q1 (see Chart III.7.6). By contrast, annualised quarterly growth accelerated from 0.4% to 1.8%. This acceleration was due chiefly to private consumption, which rose by 2.6% in annualised terms, while investment increased by 7.2%. Government expenditure had a negative impact, falling by 4.9%. Weaker external demand resulted in a decrease in exports of 1.1%, which was partly offset by a drop in imports of 0.4%. Overall, net exports made a contribution of -0.1 percentage point to GDP growth.
Following a slight slowdown in April, industrialproductiongrowth returned above 2% in May and June. However, the PMI leading indicator in industry is only slightly above the 50-point threshold separating expected improvement in economic activity from deterioration. Retail sales fell short of expectations in June, but their annual growth is still fluctuating around 5%. This is being aided by rapid growth in consumer confidence and a relatively low unemployment rate, which was flat at 7.6% in June.
According to new IMF estimates, large budget cuts implemented in early March 201364 will be reflected in a slowdown in US economic growth of 1.25–1.75 percentage points. There is still no agreement across the political spectrum on how to reduce the high budget deficits. Weak external demand will also foster slower GDP growth. US growth should continue to be driven by domestic demand, supported by rising household wealth thanks to a recovery on the property market. According to the July CF, a slowdowninGDPgrowth from 2.2% in 2012 to 1.8% in 2013 is expected. The Fed remains more optimistic, estimating GDP growth of over 2%, while the IMF expects worse growth (see Chart III.7.7). CF expects economic growth to pick up pace to 2.7% in 2014.
Following a marked decrease in April, inflation rose gradually, reaching its highest level in four months in June (1.8%). Two-thirds of the increase in headline inflation was due to rising fuel prices. By contrast, core inflation (excluding energy and food prices) has been declining gradually since February. In June it stood at 1.6% year on year, its lowest level in two years. The producer price index recorded
64 Automatic budget cuts (known as the sequester) were launched in the USA on 1 March 2013. The federal budget cuts are evenly distributed between defence spending and other expenditure. However, large government programmes (Social Security, Medicaid) are exempt.
Change in inventoriesGross fixed capital formation
Net exportsGovernment consumption
Household consumption GDP (annual percentage changes)
I/09 I/13I/10 I/11 I/12
-8
-6
-4
-2
0
2
4
GDPINTHEUSAGDPgrowthslowedslightlyin2013Q1(annual percentage changes; contributions in percentage points; seasonally adjusted; source: Datastream)
Chart III.7.6
1.0
1.3
1.6
1.9
2.2
2.5
2.8
CF
7/13
IMF
7/13
OEC
D 7
/13
Fed
6/13
CF
7/13
IMF
4/13
OEC
D 5
/13
Fed
6/13
GDP Inflation
0.8
1.1
1.4
1.7
2.0
2.3
2.6
USGDPANDINFLATIONOUTLOOKSFOR2013GDPgrowthshouldbearound2%andinflationbelow2%(annual percentage changes; source: CF, IMF, OECD, Fed)
Chart III.7.7
Note: Horizontal axis shows most recent forecast data in format “Source month/year of publication”. Midpoint of range for Fed.
III. CURRENT ECONOMIC DEVELOPMENTS

Czech National Bank / Inflation Report III/2013
62
only very moderate growth (see Chart III.7.8). CF predicts an average rise in consumer prices of 1.5% this year. At 1%, the Fed’s estimate is considerably lower.
Fed Chairman Ben Bernanke declared after the June meeting that the Fed might reduce its stimulus measures later this year and completely end its bond purchase programme (of USD 85 billion per month) in mid-2014 if economic growth is in line with the forecast. However, it is clear from subsequent statements made by Fed representatives that the monetary stimulus is not likely to end soon (see BOX 2). Annual M2 growth slowed slightly to 5.8% in May.
III.7.3Theexchangerateoftheeuroagainstthedollarandothermajorcurrencies
The exchange rateof theeuroagainstmajorworld currencies followed no clear trend in 2013 Q2 (see Chart III.7.9). The euro weakened against the dollar in early May, but the trend reversed at the end of the month and the single European currency appreciated until mid-June. This was mainly because of uncertainty surrounding the future direction of both euro area and US monetary policy, which also increased the sensitivity of the exchange rate to new data coming from the two economies.
At the May meeting, the ECB cut its main refinancing rate by 25 basis points to 0.50%. At the end of the month there was speculation that the Fed would start reducing the volume of bond purchases soon. During June, however, both the Fed and the ECB confirmed their current monetary policy settings. Turning to other currencies, between early April and late June the euro recorded the largest appreciation against the Japanese yen (8%). The very easy fiscal and monetary policies in Japan are starting to give rise to a slight economic recovery, but doubts persist about whether the 2% inflation target will be hit. The depreciation of the Japanese yen against major world currencies, observed since last September, recorded a slowdown. The strengthening of the euro against the British pound (like against the US dollar) was less than 2% in April–June. The British economy is also showing signs of recovery, but as in the euro area the growth remains fragile.
In the firsthalfofJuly2013, the euro strengthened slightly against major currencies. In reaction to an increase in interest rates in June connected with speculation regarding the Fed’s future actions, the ECB and the Bank of England decided to publish the outlook for rates and thus change the form of communication in order to clearly flag the future direction of monetary policy.
TheJulyCF expects the euro to depreciate slightly against the dollar to USD 1.27 at the one-year horizon. The British pound should also appreciate similarly, as the growth outlook for the UK exceeds that for the euro area. The current depreciation trend of the yen against the euro will continue until the end of 2014.
euro appreciation
GBPUSD JPY
50
60
70
80
90
100
110
120
130
1/09 1/14 1/151/10 1/11 1/12 1/13
EUROEXCHANGERATEAGAINSTMAJORCURRENCIESTheeuroshouldstrengthenagainsttheJapaneseyenandweakenagainsttheUSdollarandtheBritishpoundattheone-yearhorizon(January 2009 = 100; source: Datastream, outlook from CF)
Chart III.7.9
CPICPI excluding energy and food prices
PPI (right-hand scale)
I/11 I/12 I/13I/09 I/10
-4
-2
0
2
4
6
-8
-4
0
4
8
12
INFLATIONANDPRODUCERPRICESINTHEUSAInflationrosegraduallyinMayandJune2013(annual percentage changes; source: Datastream)
Chart III.7.8
III. CURRENT ECONOMIC DEVELOPMENTS
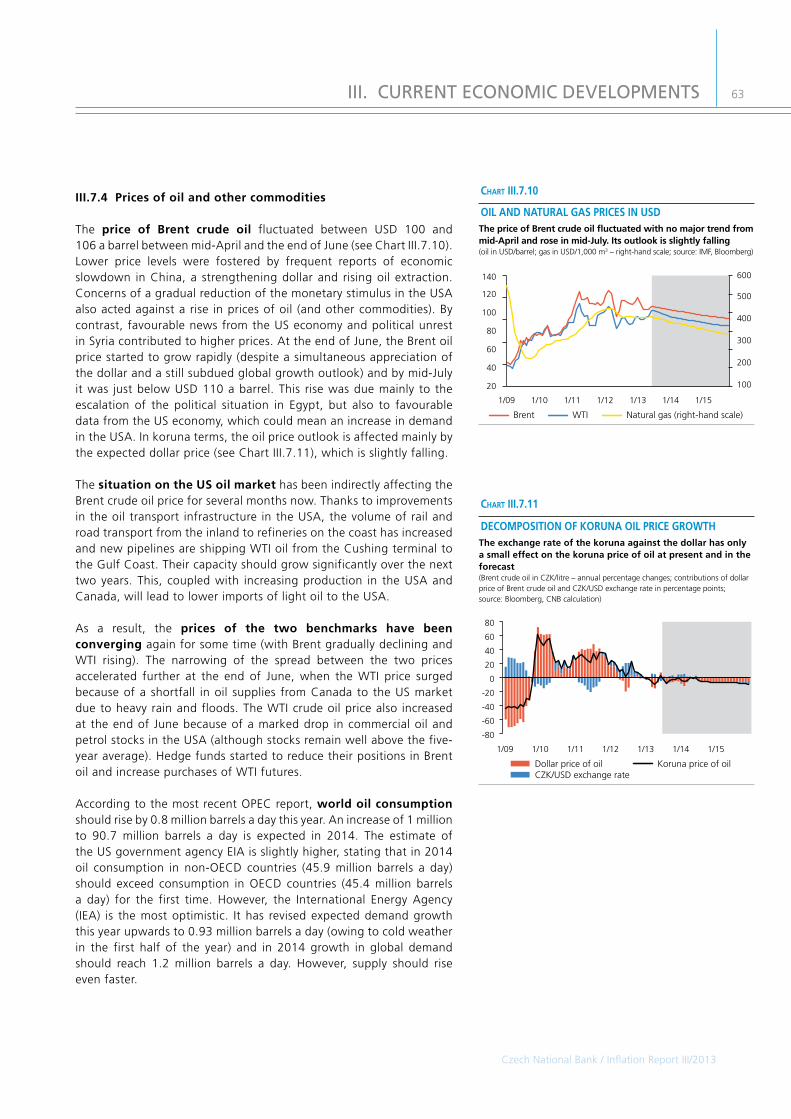
Czech National Bank / Inflation Report III/2013
63
III.7.4Pricesofoilandothercommodities
The price of Brent crude oil fluctuated between USD 100 and 106 a barrel between mid-April and the end of June (see Chart III.7.10). Lower price levels were fostered by frequent reports of economic slowdown in China, a strengthening dollar and rising oil extraction. Concerns of a gradual reduction of the monetary stimulus in the USA also acted against a rise in prices of oil (and other commodities). By contrast, favourable news from the US economy and political unrest in Syria contributed to higher prices. At the end of June, the Brent oil price started to grow rapidly (despite a simultaneous appreciation of the dollar and a still subdued global growth outlook) and by mid-July it was just below USD 110 a barrel. This rise was due mainly to the escalation of the political situation in Egypt, but also to favourable data from the US economy, which could mean an increase in demand in the USA. In koruna terms, the oil price outlook is affected mainly by the expected dollar price (see Chart III.7.11), which is slightly falling.
The situationontheUSoilmarket has been indirectly affecting the Brent crude oil price for several months now. Thanks to improvements in the oil transport infrastructure in the USA, the volume of rail and road transport from the inland to refineries on the coast has increased and new pipelines are shipping WTI oil from the Cushing terminal to the Gulf Coast. Their capacity should grow significantly over the next two years. This, coupled with increasing production in the USA and Canada, will lead to lower imports of light oil to the USA.
As a result, the prices of the two benchmarks have beenconverging again for some time (with Brent gradually declining and WTI rising). The narrowing of the spread between the two prices accelerated further at the end of June, when the WTI price surged because of a shortfall in oil supplies from Canada to the US market due to heavy rain and floods. The WTI crude oil price also increased at the end of June because of a marked drop in commercial oil and petrol stocks in the USA (although stocks remain well above the five-year average). Hedge funds started to reduce their positions in Brent oil and increase purchases of WTI futures.
According to the most recent OPEC report, worldoilconsumption should rise by 0.8 million barrels a day this year. An increase of 1 million to 90.7 million barrels a day is expected in 2014. The estimate of the US government agency EIA is slightly higher, stating that in 2014 oil consumption in non-OECD countries (45.9 million barrels a day) should exceed consumption in OECD countries (45.4 million barrels a day) for the first time. However, the International Energy Agency (IEA) is the most optimistic. It has revised expected demand growth this year upwards to 0.93 million barrels a day (owing to cold weather in the first half of the year) and in 2014 growth in global demand should reach 1.2 million barrels a day. However, supply should rise even faster.
-80
-60
-40
-20
0
20
40
60
80
Koruna price of oil
1/12 1/131/09 1/14 1/151/10 1/11
Dollar price of oilCZK/USD exchange rate
DECOMPOSITIONOFKORUNAOILPRICEGROWTHTheexchangerateofthekorunaagainstthedollarhasonlyasmalleffectonthekorunapriceofoilatpresentandintheforecast(Brent crude oil in CZK/litre – annual percentage changes; contributions of dollar price of Brent crude oil and CZK/USD exchange rate in percentage points; source: Bloomberg, CNB calculation)
Chart III.7.11
20
40
60
80
100
120
140
Natural gas (right-hand scale)Brent WTI
1/12 1/131/09 1/14 1/151/10 1/11
100
200
300
400
500
600
OILANDNATURALGASPRICESINUSDThepriceofBrentcrudeoilfluctuatedwithnomajortrendfrommid-Aprilandroseinmid-July.Itsoutlookisslightlyfalling(oil in USD/barrel; gas in USD/1,000 m3 – right-hand scale; source: IMF, Bloomberg)
Chart III.7.10
III. CURRENT ECONOMIC DEVELOPMENTS
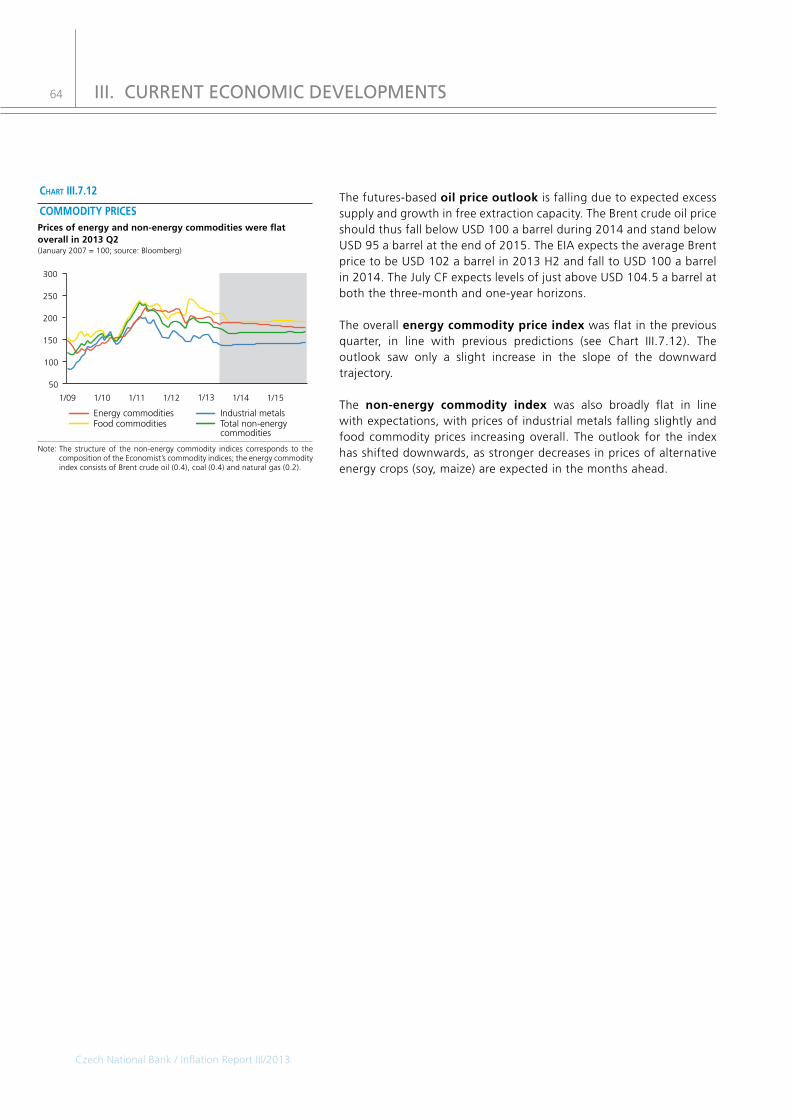
Czech National Bank / Inflation Report III/2013
64
The futures-based oilpriceoutlook is falling due to expected excess supply and growth in free extraction capacity. The Brent crude oil price should thus fall below USD 100 a barrel during 2014 and stand below USD 95 a barrel at the end of 2015. The EIA expects the average Brent price to be USD 102 a barrel in 2013 H2 and fall to USD 100 a barrel in 2014. The July CF expects levels of just above USD 104.5 a barrel at both the three-month and one-year horizons.
The overall energycommoditypriceindex was flat in the previous quarter, in line with previous predictions (see Chart III.7.12). The outlook saw only a slight increase in the slope of the downward trajectory.
The non-energy commodity index was also broadly flat in line with expectations, with prices of industrial metals falling slightly and food commodity prices increasing overall. The outlook for the index has shifted downwards, as stronger decreases in prices of alternative energy crops (soy, maize) are expected in the months ahead.
Industrial metalsTotal non-energy commodities
Energy commoditiesFood commodities
50
100
150
200
250
300
1/101/09 1/14 1/151/11 1/12 1/13
COMMODITYPRICESPricesofenergyandnon-energycommoditieswereflatoverallin2013Q2(January 2007 = 100; source: Bloomberg)
Chart III.7.12
Note: The structure of the non-energy commodity indices corresponds to the composition of the Economist’s commodity indices; the energy commodity index consists of Brent crude oil (0.4), coal (0.4) and natural gas (0.2).
III. CURRENT ECONOMIC DEVELOPMENTS


66
Czech National Bank / Inflation Report III/2013
Chart I.1 Fulfilment of the inflation target 6Chart I.2 Headline inflation forecast 6Chart I.3 Monetary-policy relevant inflation forecast 6Chart I.4 Interest rate forecast 7Chart I.5 Exchange rate forecast 7Chart I.6 GDP growth forecast 7
Chart II.1.1 Effective GDP in the euro area 8Chart II.1.2 Effective PPI in the euro area 8Chart II.1.3 Effective CPI in the euro area 8Chart II.1.4 3M EURIBOR 9Chart II.1.5 Euro-dollar exchange rate 9Chart II.1.6 Price of Brent crude oil 9Chart II.2.1 Headline inflation and monetary-policy relevant inflation 10Chart II.2.2 Administered prices and fuel prices 10Chart II.2.3 Net inflation and adjusted inflation excluding fuels 11Chart II.2.4 Food prices and agricultural producer prices 11Chart II.2.5 Fuel prices and oil prices 12Chart II.2.6 Interest rate forecast 12Chart II.2.7 Exchange rate forecast 12Chart II.2.8 Costs in the consumer sector 13Chart II.2.9 Costs in the intermediate goods sector 13Chart II.2.10 Gap in profit mark-ups in the consumer sector 13Chart II.2.11 Average nominal wage 14Chart II.2.12 GDP growth forecast 14Chart II.2.13 Annual GDP growth structure 14Chart II.2.14 Labour market forecast 15Chart II.2.15 Number of employees (full-time equivalent) 15Chart II.2.16 Real household and government consumption 15Chart II.2.17 Nominal disposable income 16Chart II.2.18 Household saving rate 16Chart II.2.19 Gross capital formation 16Chart II.2.20 Real exports and imports 17Chart II.3.1 Change in the headline inflation forecast 20Chart II.3.2 Change in the net inflation forecast 20Chart II.3.3 Change in the interest rate path 20Chart II.3.4 Decomposition of changes in the interest rate forecast 21Chart II.3.5 Change in the exchange rate forecast 21Chart II.3.6 Change in the GDP forecast 21Chart II.5.1 Perceived and expected inflation 23Chart II.5.2 FRA rates versus the CNB forecast 24
Chart III.1.1 Forecast versus actual inflation 25Chart III.1.2 Inflation 27Chart III.1.3 Inflation components 27Chart III.1.4 Structure of inflation 27Chart III.1.5 Food prices 28Chart III.1.6 Adjusted inflation excluding fuels 28Chart III.2.1 Import prices and producer prices 29Chart III.2.2 Import prices 29Chart III.2.3 Mineral fuels 29Chart III.2.4 Industrial producer prices 30
CHARTS IN THE TEXT
67
Czech National Bank / Inflation Report III/2013
Chart III.2.5 Producer prices by main industrial groupings 30Chart III.2.6 Prices of metals and refined petroleum products 31Chart III.2.7 Agricultural producer prices 31Chart III.2.8 Other price categories 32Chart III.3.1 Gross domestic product 33Chart III.3.2 Structure of annual GDP growth 33Chart III.3.3 Household consumption expenditure 33Chart III.3.4 Disposable income 34Chart III.3.5 Structure of household consumption 34Chart III.3.6 Confidence indicators 36Chart III.3.7 Investment by sector 36Chart III.3.8 Fixed capital formation 36Chart III.3.9 Investment in dwellings 37Chart III.3.10 Net exports 37Chart III.3.11 Exports and imports 37Chart III.3.12 Contributions of branches to GVA growth 38Chart III.3.13 Industrial production 38Chart III.3.14 Barriers to growth in industry 38Chart III.3.15 New orders in industry 39Chart III.3.16 Economic sentiment 39Chart III.3.17 Potential output 40Chart III.3.18 Output gap 40Chart III.3.19 Contributions to potential output growth 40Chart III.4.1 Labour market indicators 41Chart III.4.2 Number of employees (full-time equivalent) 41Chart III.4.3 Employment breakdown by branches 42Chart III.4.4 Unemployment rate 42Chart III.4.5 Beveridge curve 42Chart III.4.6 Whole-economy productivity 43Chart III.4.7 Productivity per hour 43Chart III.4.8 Unit labour costs 44Chart III.5.1 Monetary aggregates 45Chart III.5.2 Main components of M2 and interest rate spread 45Chart III.5.3 Deposit structure of M2 45Chart III.5.4 Loans to non-financial corporations 46Chart III.5.5 Loans broken down by size of non-financial corporations 47Chart III.5.6 Loans to households 47Chart III.5.7 Structure of number of new mortgages 47Chart III.5.8 Household debt 48Chart III.5.9 CNB key rates 48Chart III.5.10 Market interest rates 48Chart III.5.11 Interest rate differentials 49Chart III.5.12 Government bond yield curve 49Chart III.5.13 Interest rates on loans to corporations 50
Chart III.5.14 Interest rates on loans to households 50Chart III.5.15 Client and market interest rate spreads 50Chart III.5.16 Ex ante real rates 51Chart III.5.17 CZK/EUR and CZK/USD exchange rates 51Chart III.5.18 Key financial indicators 52Chart III.5.19 Financial liabilities of non-financial corporations 53Chart III.5.20 Structure of household financial assets 53
CHARTS IN THE TEXT
68
Czech National Bank / Inflation Report III/2013
Chart III.5.21 Transaction and asking prices of apartments 54Chart III.5.22 Apartment price sustainability indicators 54Chart III.6.1 Current account 55Chart III.6.2 Trade balance 55Chart III.6.3 Balance of services 55Chart III.6.4 Income balance 56Chart III.6.5 Financial account 56Chart III.6.6 Direct investment 56Chart III.6.7 Portfolio investment 57Chart III.6.8 CNB international reserves 57Chart III.7.1 GDP in the euro area 58Chart III.7.2 Euro area GDP and inflation outlooks for 2013 58Chart III.7.3 Inflation and producer prices in the euro area 59Chart III.7.4 GDP in Germany 60Chart III.7.5 Inflation and producer prices in Germany 60Chart III.7.6 GDP in the USA 61Chart III.7.7 US GDP and inflation outlooks for 2013 61Chart III.7.8 Inflation and producer prices in the USA 62Chart III.7.9 Euro exchange rate against major currencies 62Chart III.7.10 Oil and natural gas prices in USD 63Chart III.7.11 Decomposition of koruna oil price growth 63Chart III.7.12 Commodity prices 64
CHARTS IN THE TEXT

69
Czech National Bank / Inflation Report III/2013
Table II.2.1 Forecast of administrative effects 11Table II.2.2 Forecasts of selected variables 17Table II.2.3 Balance of payments forecast 17Table II.2.4 Fiscal forecast 18Table II.4.1 Exchange rate sensitivity scenario 22Table II.5.1 Expected indicators of FMIE and corporations 23Table II.5.2 CF expected indicators 23
Table III.1.1 Fulfilment of the inflation forecast 25Table III.1.2 Fulfilment of the external assumptions 26Table III.1.3 Fulfilment of the forecast for key variables 26Table III.2.1 Structure of import price inflation 30Table III.4.1 Wages, productivity, unit labour costs 43Table III.5.1 Changes in banks’ credit conditions 46Table III.5.2 Performance indicators of corporations 52
TABLES IN THE TEXT

70
Czech National Bank / Inflation Report III/2013
APRC annual percentage rate of charge
CF Consensus Forecasts
CNB Czech National Bank
CPI consumer price index
CZK Czech koruna
CZSO Czech Statistical Office
COSMC Czech Office for Surveying, Mapping and Cadastre
ECB European Central Bank
EDP Excessive Deficit Procedure
EIA Energy Information Administration
EIB European Investment Bank
EONIA Euro Over-Night Index Average
ESCB European System of Central Banks
EU European Union
EUR euro
EURIBOR Euro Interbank Offered Rate
FDI foreign direct investment
Fed US central bank
FMIE Financial Market Inflation Expectations
FOMC Federal Open Market Committee
FRA forward rate agreement
GBP pound sterling
GDP gross domestic product
GVA gross value added
HP filter Hodrick-Prescott filter
IEA International Energy Agency
ILO International Labour Organization
IMF International Monetary Fund
IRI Institute for Regional Information
IRS interest rate swap
JPY Japanese yen
LFS Labour Force Survey
LIBOR London Interbank Offered Rate
LTROs long-term refinancing operations
M1, M2, M3 monetary aggregates
MLSA Ministry of Labour and Social Affairs
OECD Organisation for Economic Co-operation and Development
OPEC Organization of the Petroleum Exporting Countries
PMI Purchasing Managers Index
pp percentage points
PPI producer price index
PRIBOR Prague Interbank Offered Rate
(1W, 1M, 1Y) (one-week, one-month, one-year)
repo rate repurchase agreement rate
USD US dollar
VAT value added tax
WTI West Texas Intermediate
ABBREVIATIONS

71
Czech National Bank / Inflation Report III/2013
BOXES AND ANNEXES CONTAINED IN INFLATION REPORTS
Forecastsforgeneralgovernmentdebtanddebtservice,andsensitivityanalyses (Box) I/2011
Price-settingbehaviourintheCzechRepublic(microdataevidence)inrelationtothepricingmechanismintheg3forecastingmodel (Box) II/2011
TherelationshipbetweentheBrentcrudeoilpriceandthedollarexchangerate (Box) II/2011
TheimpactsofchangestoVATratesonthebudgetandinflationandtheircomponentsin2012and2013 (Box) III/2011
Labourmarketdevelopmentsduringtheeconomicrecessionandthesubsequentrecovery (Box) III/2011
ThedebtsituationinItaly (Box) III/2011
PublicationoftheGraphofRiskstotheInflationProjection(GRIP) (Annex) III/2011
Pensionsystemreform (Box) IV/2011
ThecreditratingoftheCzechRepublic (Box) IV/2011
Germany–theCzechRepublic’smaintradingpartner (Box) IV/2011
Thepass-throughofVATtofoodpricesattheendof2011 (Box) I/2012
Extraordinaryrevisionofthequarterlynationalaccounts (Box) I/2012
AnanalysisoftheimpactsoffiscalmeasuresintheCzechRepublicin2001–2011 (Box) I/2012
Revisionoftheconsumerbasket (Box) II/2012
Factorsaffectingretailfuelprices (Box) II/2012
TheBankLendingSurvey (Box) III/2012
TheCZK/USDexchangerateatatimeofuncertainty (Box) III/2012
Easymonetarypolicyandcommodityprices (Box) III/2012
Thehouseholdsavingrate (Box) IV/2012
Consumptionandmoneysavingsbyhouseholdincomegroup (Box) IV/2012
TheshareofreinvestedearningsintotalFDIincome (Box) IV/2012
Revisionofthequarterlynationalaccounts (Box) I/2013
Consumption,savingsanddebtburdenofhouseholdincomegroupsin2012 (Box) III/2013
TheannouncedreductionofquantitativeeasingintheUSAanditseffectonyieldcurves (Box) III/2013

72
Czech National Bank / Inflation Report III/2013
This glossary explains some terms frequently used in the Inflation Report. A more detailed glossary can be found on the CNB website (www.cnb.cz/en/general/glossary/index.html).
Adjustedinflationexcludingfuels: The increase in prices of non-food items of the consumer basket excluding items with administered prices, indirect tax changes and fuels.
Administered prices: A sub-category of the consumer basket consisting of items with price ceilings (set at either central or local level), prices regulated on a cost-plus basis (items whose prices may only reflect economically justified costs and a reasonable profit) and administratively fixed fees. The selection of these items is based on the Price Bulletin of the Czech Ministry of Finance.
Balanceofpayments: Records economic transactions with other countries (i.e. between residents and non-residents) over a particular period. The basic structure of the balance of payments includes the current account, the capital and financial accounts and the change in CNB international reserves.
Bid-to-coverratio:The ratio of total demand to demand coverage in primary auctions of medium-term and long-term government bonds.
ConsensusForecasts: A regular monthly publication issued by Consensus Economics bringing together the forecasts of hundreds of prominent economists and analytical teams regarding future world developments. The CNB uses these predictions in its macroeconomic forecast when forming assumptions regarding the future development of the external environment.
Coveredbond: A bond collateralised (backed) by long-term assets, usually mortgage loans or public sector loans. The issuers are mostly banks and the issuance of covered bonds is subject to strict legislative rules. Compared to standard bonds, this type of bond has lower credit risk thanks to higher coverage (known as dual recourse), which gives the covered bond holder a preferential claim on the issuer’s receivables underlying the mortgage loans or public sector loans and likewise a claim on the issuer. If the issuer defaults, the holder therefore has a preferential right to the assets backing the covered bond.
Currentaccount: Records exports and imports of goods and services, income from capital, investment and labour and unrequited transfers.
Cyclicalcomponentofthegeneralgovernmentbalance: Expresses the effect of the business cycle on the general government fiscal balance.
Discountrate:A monetary policy rate which as a rule represents the floor for short-term money market interest rates. The CNB applies it to the excess liquidity which banks deposit with the CNB overnight under the deposit facility.
Disinflation:A decline in inflation.
Effective euro area indicators: Proxy for the effect of economic activity (effective GDP) and inflation (effective producer prices and consumer prices) in the euro area on the Czech economy. The weights used in the calculation are the shares of the individual euro area economies in the foreign trade turnover of the Czech Republic.
Effectiveexchangerate:Shows the appreciation (index > 100) or depreciation (index < 100) of the national currency against a basket of selected currencies for a certain time period relative to a base period. The weights applied in the basket are the shares of major trading partners in foreign trade turnover.
GLOSSARY

73
Czech National Bank / Inflation Report III/2013
Escapeclause:Excuses the central bank from its obligation to hit the inflation target. In the flexible inflation targeting regime, it is applied in the event of large shock changes in exogenous factors (particularly supply-side shocks, e.g. indirect tax changes) that are completely or largely outside the purview of central bank monetary policy.
Euroarea:The territory of all Member States of the European Union that have adopted the euro as a single currency pursuant to the Treaty Establishing the European Community.
Financial account: Records transactions connected with the creation, liquidation and change in ownership of the financial assets and liabilities of the government, the banking and corporate sectors and other entities vis-à-vis the rest of the world. It consist of direct investment, portfolio investment, other investment and financial derivatives transactions.
Fiscalstance:The annual change in the general government structural balance (in percentage points). A positive figure indicates fiscal restriction and a negative figure indicates fiscal expansion.
Foodprices: In CNB documents, the term food prices refers to the consolidated category of prices of food and non-alcoholic beverages and prices of alcoholic beverages and tobacco.
General government balance: Revenues minus expenditures of the general government sector. A negative government balance is called a general government deficit and a positive government balance is called a general government surplus.
Generalgovernmentprimarybalance:The general government balance net of interest payments (i.e. debt service).
General government structural balance: The cyclically adjusted general government balance adjusted for extraordinary one-off operations. It captures the structural configuration of fiscal policy.
Goodsandservicesbalance:The sum of the trade balance and the services balance.
GrossDomesticProduct(GDP):The key indicator of economic development. It represents the sum of the value added by all economic sectors. In terms of use it consists of expenditure on final consumption (consumption of households, the government and non-profit institutions), gross capital formation (fixed investment and changes in inventories) and foreign trade (net exports of goods and services).
Inflation:Commonly, inflation is considered to be recurring growth of most prices in the economy. It means a decrease in the real value (i.e. purchasing power) of a given currency relative to the goods and services which consumers buy – if there is inflation in the economy, consumers need ever more currency units of the given country to buy the same basket of goods and services. In practice, inflation is measured by the increment of the consumer price index.
Inflation pressures: Proxied in the CNB’s modelling system by the real marginal cost gap in the consumer goods sector. Total inflation pressures are divided into domestic inflation pressures (in the intermediate goods sector) and imported inflation pressures (in the import price sector).
Inflationrate:The increase in the average (basic) consumer price index for the last 12 months relative to the average for the previous 12 months.
Inflationtarget:The level of consumer price inflation that the CNB endeavours to achieve, set publicly and well in advance.
Lombardrate:A monetary policy interest rate which provides a ceiling for short-term interest rates on the money market. The CNB applies it to the liquidity which it provides to banks overnight under the lending facility.
GLOSSARY

74
Czech National Bank / Inflation Report III/2013
Monetaryaggregates:Represent the amount of money in the economy covered in the monetary survey. According to the national definition, they are calculated from the monetary liabilities of resident monetary financial institutions to other resident sectors in the Czech Republic (households, non-financial corporations and financial institutions excluding the general government). Monetary aggregates differ according to the degree of liquidity of the individual components. The narrow monetary aggregate M1 comprises currency in circulation and overnight deposits. The broad monetary aggregate M2 comprises M1 plus total deposits with agreed maturity and redeemable at notice and repurchase agreements. The broad monetary aggregate M3 (harmonised with EU standards) comprises currency in circulation, overnight deposits, deposits with agreed maturity of up to two years, deposits redeemable at notice of up to three months, repurchase agreements, money market fund shares/units and issued debt securities with maturity of up to two years.
Monetaryconditions:Represent the combined effect of interest rates (the interest rate component of the monetary conditions) and the exchange rate (the exchange rate component) on the economy. These are the key variables through which monetary policy can affect economic activity and, through it, inflation. Interest rates and the exchange rate do not necessarily affect the economy in the same direction.
Monetary policy horizon: The time horizon which monetary policy-makers focus on when making decisions and which takes into account the monetary policy transmission lag. This horizon is about 12–18 months ahead.
Monetarypolicyinterestrates:Short-term interest rates associated with monetary policy-making. They comprise the two-week repo rate, the discount rate and the Lombard rate.
Monetary-policy relevant inflation: Inflation to which monetary policy reacts. It is defined as headline inflation adjusted for the first-round effects of changes to indirect taxes.
Moneymarket:The part of the financial markets which is used to obtain short-term loans and where debt instruments maturing in less than one year are traded. T-bills are typical securities traded on this market. Within this market the CNB carries out its repo operations.
Netinflation:Consumer price inflation net of administered prices and adjusted for the first-round effects of changes to indirect taxes. Net inflation consists of food price inflation, fuel price inflation and adjusted inflation excluding fuels. Until the end of 2001, the CNB’s inflation targets were set in terms of net inflation. Since 2002, the CNB has targeted headline inflation, using net inflation for analytical purposes only.
Nominalcostsintheconsumptionsector: These comprise output prices in the intermediate goods sector and import sector, as final consumption goods are produced using inputs from these sectors. They also include “export-specific technology”, which approximates the productivity differential between the tradables sector and the non-tradables sector and its price effect, known as an analogy to the Balassa-Samuelson effect.
Nominalcostsintheintermediategoodssector:Co-determined by prices of production factors, i.e. labour costs and the price of capital. In addition to these components, they are determined by “labour-augmenting technology”. This technology can be understood as a concept similar to total factor productivity, e.g. in the Cobb-Douglas production function.
Nominal unit labour costs: The labour costs needed to produce a unit of output. Nominal unit labour costs are calculated as the ratio of the nominal volume of wages and salaries to GDP at constant prices.
Price-to-disposableincomeratio:The ratio of the price of an apartment to the sum of disposable income over the last four quarters. Higher values of this indicator usually mean that apartments are overpriced.
Price-to-rentratio:Indicator of sustainability of apartment prices, calculated as the ratio of the price of the apartment to the annual rent. The price-to-rent ratio is the inverse of the rent return. Higher values of this indicator usually mean that apartments are overpriced.
GLOSSARY

75
Czech National Bank / Inflation Report III/2013
75
Czech National Bank / Inflation Report III/2013
Price-to-wageratio:The ratio of the price of an apartment to the sum of the annual wage over the last four quarters. Higher values of this indicator usually mean that apartments are overpriced.
Producers’margins:The inverse of producers’ real marginal costs in the relevant sector. Growth in producers’ nominal costs without corresponding growth in the price of production causes a decline in the profit margin, i.e. an increase in real marginal costs. If prices in the sector were perfectly flexible, the price at any given moment would comprise a constant margin over marginal nominal costs. In the consumer sector, a gap in profit mark-ups represents a deviation from the long-term margin level.
Propertyaskingprices:Property sale asking prices in estate agencies. Asking prices should be higher than transaction prices. Property asking prices in the Czech Republic are published, for example, by the CZSO and the Institute for Regional Information (IRI).
Property transaction prices: Prices based on Ministry of Finance statistics from property transfer tax returns and published by the CZSO. These prices are the closest to actual market prices in terms of methodology, but are published with a time delay.
Reporate:The CNB’s key monetary policy rate, paid on commercial banks’ excess liquidity as withdrawn by the CNB in two-week repo tenders.
Technological growth: The situation where the volume of production rises without an increase in the production factors of labour or capital. Growth in technology thus causes the real volume of production to rise given a constant price of production, or the output price to fall relative to input prices given a constant real volume of production.
Unemployment rate: The ratio of the number of unemployed persons to the total labour force. We distinguish between the general unemployment rate, as determined by the CZSO according to International Labour Organisation methodology, and the share of unemployed persons, as determined by the Ministry of Labour and Social Affairs.
GLOSSARY
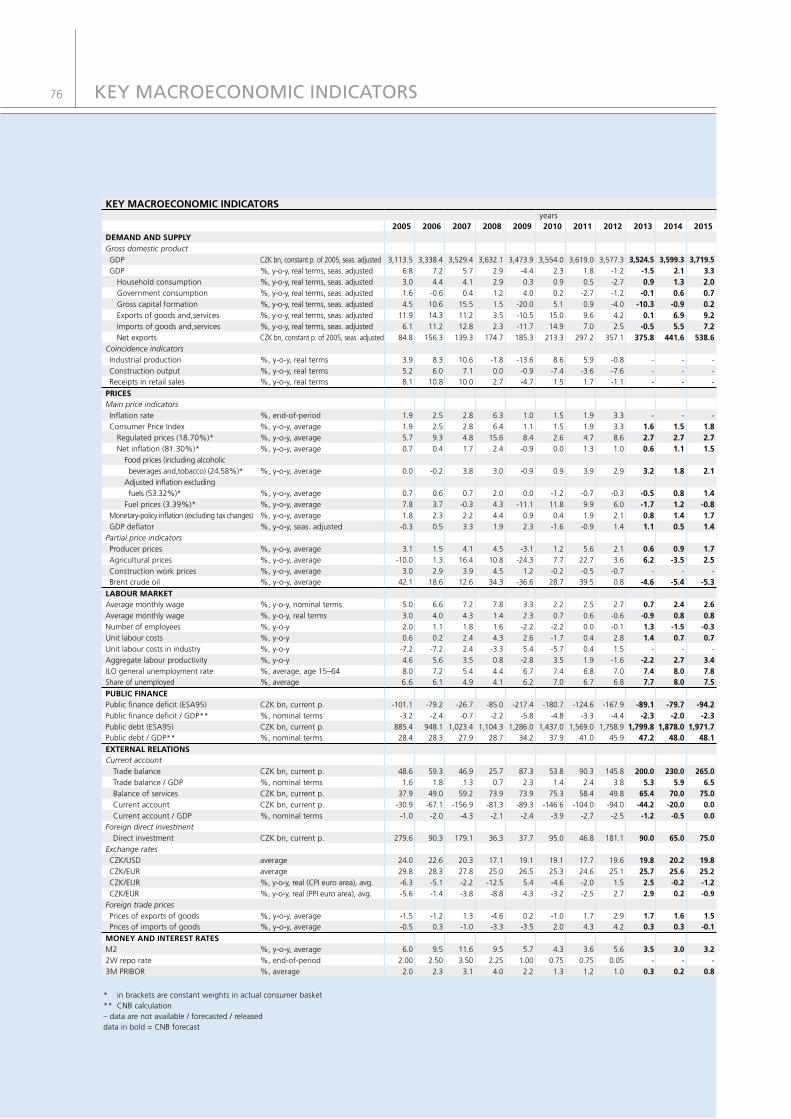
76
KEYMACROECONOMICINDICATORSyears
2005 2006 2007 2008 2009 2010 2011 2012 2013 2014 2015DEMANDANDSUPPLYGross domestic productGDP CZK bn, constant p. of 2005, seas. adjusted 3,113.5 3,338.4 3,529.4 3,632.1 3,473.9 3,554.0 3,619.0 3,577.3 3,524.5 3,599.3 3,719.5GDP %, y-o-y, real terms, seas. adjusted 6.8 7.2 5.7 2.9 -4.4 2.3 1.8 -1.2 -1.5 2.1 3.3
Household consumption %, y-o-y, real terms, seas. adjusted 3.0 4.4 4.1 2.9 0.3 0.9 0.5 -2.7 0.9 1.3 2.0Government consumption %, y-o-y, real terms, seas. adjusted 1.6 -0.6 0.4 1.2 4.0 0.2 -2.7 -1.2 -0.1 0.6 0.7Gross capital formation %, y-o-y, real terms, seas. adjusted 4.5 10.6 15.5 1.5 -20.0 5.1 0.9 -4.0 -10.3 -0.9 0.2Exports of goods and,services %, y-o-y, real terms, seas. adjusted 11.9 14.3 11.2 3.5 -10.5 15.0 9.6 4.2 0.1 6.9 9.2Imports of goods and,services %, y-o-y, real terms, seas. adjusted 6.1 11.2 12.8 2.3 -11.7 14.9 7.0 2.5 -0.5 5.5 7.2Net exports CZK bn, constant p. of 2005, seas. adjusted 84.8 156.3 139.3 174.7 185.3 213.3 297.2 357.1 375.8 441.6 538.6
Coincidence indicatorsIndustrial production %, y-o-y, real terms 3.9 8.3 10.6 -1.8 -13.6 8.6 5.9 -0.8 - - -Construction output %, y-o-y, real terms 5.2 6.0 7.1 0.0 -0.9 -7.4 -3.6 -7.6 - - -Receipts in retail sales %, y-o-y, real terms 8.1 10.8 10.0 2.7 -4.7 1.5 1.7 -1.1 - - -
PRICESMain price indicatorsInflation rate %, end-of-period 1.9 2.5 2.8 6.3 1.0 1.5 1.9 3.3 - - -Consumer Price Index %, y-o-y, average 1.9 2.5 2.8 6.4 1.1 1.5 1.9 3.3 1.6 1.5 1.8
Regulated prices (18.70%)* %, y-o-y, average 5.7 9.3 4.8 15.6 8.4 2.6 4.7 8.6 2.7 2.7 2.7Net inflation (81.30%)* %, y-o-y, average 0.7 0.4 1.7 2.4 -0.9 0.0 1.3 1.0 0.6 1.1 1.5
Food prices (including alcoholic beverages and,tobacco) (24.58%)* %, y-o-y, average 0.0 -0.2 3.8 3.0 -0.9 0.9 3.9 2.9 3.2 1.8 2.1Adjusted inflation excluding fuels (53.32%)* %, y-o-y, average 0.7 0.6 0.7 2.0 0.0 -1.2 -0.7 -0.3 -0.5 0.8 1.4Fuel prices (3.39%)* %, y-o-y, average 7.8 3.7 -0.3 4.3 -11.1 11.8 9.9 6.0 -1.7 1.2 -0.8
Monetary-policy inflation (excluding tax changes) %, y-o-y, average 1.8 2.3 2.2 4.4 0.9 0.4 1.9 2.1 0.8 1.4 1.7GDP deflator %, y-o-y, seas. adjusted -0.3 0.5 3.3 1.9 2.3 -1.6 -0.9 1.4 1.1 0.5 1.4
Partial price indicatorsProducer prices %, y-o-y, average 3.1 1.5 4.1 4.5 -3.1 1.2 5.6 2.1 0.6 0.9 1.7Agricultural prices %, y-o-y, average -10.0 1.3 16.4 10.8 -24.3 7.7 22.7 3.6 6.2 -3.5 2.5Construction work prices %, y-o-y, average 3.0 2.9 3.9 4.5 1.2 -0.2 -0.5 -0.7 - - -Brent crude oil %, y-o-y, average 42.1 18.6 12.6 34.3 -36.6 28.7 39.5 0.8 -4.6 -5.4 -5.3
LABOURMARKETAverage monthly wage %, y-o-y, nominal terms 5.0 6.6 7.2 7.8 3.3 2.2 2.5 2.7 0.7 2.4 2.6Average monthly wage %, y-o-y, real terms 3.0 4.0 4.3 1.4 2.3 0.7 0.6 -0.6 -0.9 0.8 0.8Number of employees %, y-o-y 2.0 1.1 1.8 1.6 -2.2 -2.2 0.0 -0.1 1.3 -1.5 -0.3Unit labour costs %, y-o-y 0.6 0.2 2.4 4.3 2.6 -1.7 0.4 2.8 1.4 0.7 0.7Unit labour costs in industry %, y-o-y -7.2 -7.2 2.4 -3.3 5.4 -5.7 0.4 1.5 - - -Aggregate labour productivity %, y-o-y 4.6 5.6 3.5 0.8 -2.8 3.5 1.9 -1.6 -2.2 2.7 3.4ILO general unemployment rate %, average, age 15–64 8.0 7.2 5.4 4.4 6.7 7.4 6.8 7.0 7.4 8.0 7.8Share of unemployed %, average 6.6 6.1 4.9 4.1 6.2 7.0 6.7 6.8 7.7 8.0 7.5
PUBLICFINANCEPublic finance deficit (ESA95) CZK bn, current p. -101.1 -79.2 -26.7 -85.0 -217.4 -180.7 -124.6 -167.9 -89.1 -79.7 -94.2Public finance deficit / GDP** %, nominal terms -3.2 -2.4 -0.7 -2.2 -5.8 -4.8 -3.3 -4.4 -2.3 -2.0 -2.3Public debt (ESA95) CZK bn, current p. 885.4 948.1 1,023.4 1,104.3 1,286.0 1,437.0 1,569.0 1,758.9 1,799.8 1,878.0 1,971.7Public debt / GDP** %, nominal terms 28.4 28.3 27.9 28.7 34.2 37.9 41.0 45.9 47.2 48.0 48.1EXTERNALRELATIONSCurrent account
Trade balance CZK bn, current p. 48.6 59.3 46.9 25.7 87.3 53.8 90.3 145.8 200.0 230.0 265.0Trade balance / GDP %, nominal terms 1.6 1.8 1.3 0.7 2.3 1.4 2.4 3.8 5.3 5.9 6.5Balance of services CZK bn, current p. 37.9 49.0 59.2 73.9 73.9 75.3 58.4 49.8 65.4 70.0 75.0Current account CZK bn, current p. -30.9 -67.1 -156.9 -81.3 -89.3 -146.6 -104.0 -94.0 -44.2 -20.0 0.0Current account / GDP %, nominal terms -1.0 -2.0 -4.3 -2.1 -2.4 -3.9 -2.7 -2.5 -1.2 -0.5 0.0
Foreign direct investmentDirect investment CZK bn, current p. 279.6 90.3 179.1 36.3 37.7 95.0 46.8 181.1 90.0 65.0 75.0
Exchange ratesCZK/USD average 24.0 22.6 20.3 17.1 19.1 19.1 17.7 19.6 19.8 20.2 19.8CZK/EUR average 29.8 28.3 27.8 25.0 26.5 25.3 24.6 25.1 25.7 25.6 25.2CZK/EUR %, y-o-y, real (CPI euro area), avg. -6.3 -5.1 -2.2 -12.5 5.4 -4.6 -2.0 1.5 2.5 -0.2 -1.2CZK/EUR %, y-o-y, real (PPI euro area), avg. -5.6 -1.4 -3.8 -8.8 4.3 -3.2 -2.5 2.7 2.9 0.2 -0.9
Foreign trade pricesPrices of exports of goods %, y-o-y, average -1.5 -1.2 1.3 -4.6 0.2 -1.0 1.7 2.9 1.7 1.6 1.5Prices of imports of goods %, y-o-y, average -0.5 0.3 -1.0 -3.3 -3.5 2.0 4.3 4.2 0.3 0.3 -0.1
MONEYANDINTERESTRATESM2 %, y-o-y, average 6.0 9.5 11.6 9.5 5.7 4.3 3.6 5.6 3.5 3.0 3.22W repo rate %, end-of-period 2.00 2.50 3.50 2.25 1.00 0.75 0.75 0.05 - - -3M PRIBOR %, average 2.0 2.3 3.1 4.0 2.2 1.3 1.2 1.0 0.3 0.2 0.8
KEY MACROECONOMIC INDICATORS
* in brackets are constant weights in actual consumer basket** CNB calculation– data are not available / forecasted / releaseddata in bold = CNB forecast
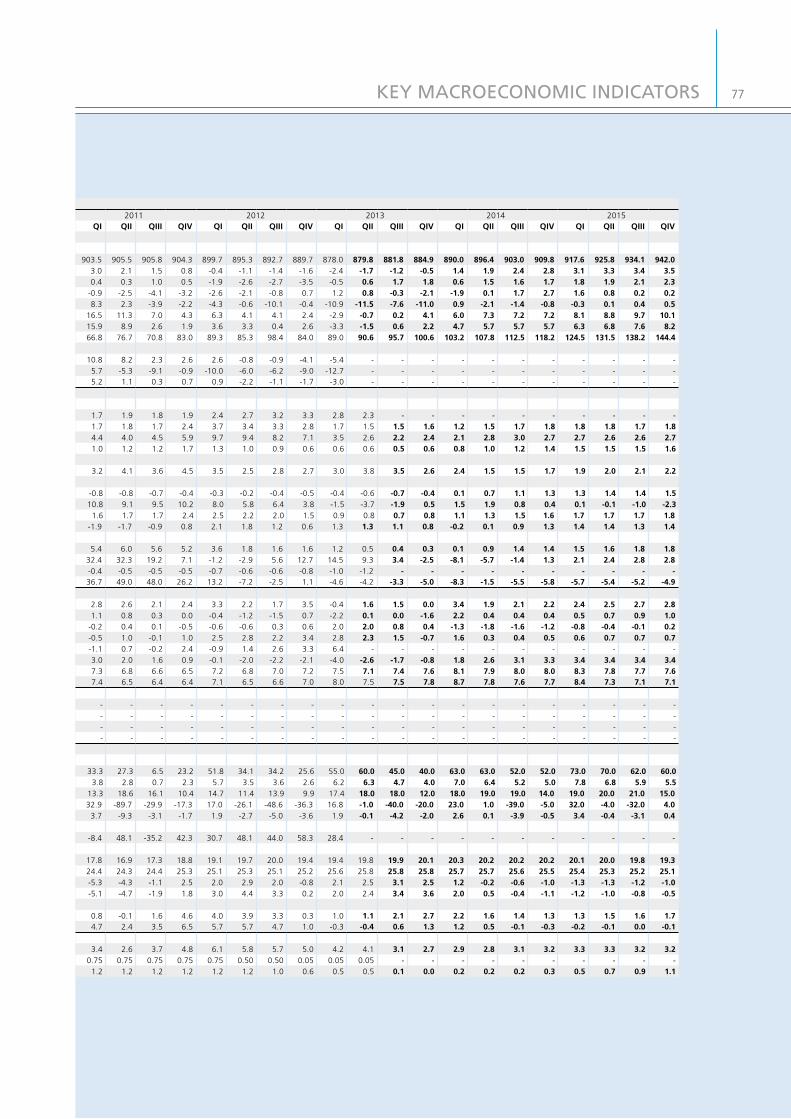
77
Czech National Bank / Inflation Report III/2013
77KEY MACROECONOMIC INDICATORS
2011 2012 2013 2014 2015QI QII QIII QIV QI QII QIII QIV QI QII QIII QIV QI QII QIII QIV QI QII QIII QIV
903.5 905.5 905.8 904.3 899.7 895.3 892.7 889.7 878.0 879.8 881.8 884.9 890.0 896.4 903.0 909.8 917.6 925.8 934.1 942.03.0 2.1 1.5 0.8 -0.4 -1.1 -1.4 -1.6 -2.4 -1.7 -1.2 -0.5 1.4 1.9 2.4 2.8 3.1 3.3 3.4 3.50.4 0.3 1.0 0.5 -1.9 -2.6 -2.7 -3.5 -0.5 0.6 1.7 1.8 0.6 1.5 1.6 1.7 1.8 1.9 2.1 2.3
-0.9 -2.5 -4.1 -3.2 -2.6 -2.1 -0.8 0.7 1.2 0.8 -0.3 -2.1 -1.9 0.1 1.7 2.7 1.6 0.8 0.2 0.28.3 2.3 -3.9 -2.2 -4.3 -0.6 -10.1 -0.4 -10.9 -11.5 -7.6 -11.0 0.9 -2.1 -1.4 -0.8 -0.3 0.1 0.4 0.5
16.5 11.3 7.0 4.3 6.3 4.1 4.1 2.4 -2.9 -0.7 0.2 4.1 6.0 7.3 7.2 7.2 8.1 8.8 9.7 10.115.9 8.9 2.6 1.9 3.6 3.3 0.4 2.6 -3.3 -1.5 0.6 2.2 4.7 5.7 5.7 5.7 6.3 6.8 7.6 8.266.8 76.7 70.8 83.0 89.3 85.3 98.4 84.0 89.0 90.6 95.7 100.6 103.2 107.8 112.5 118.2 124.5 131.5 138.2 144.4
10.8 8.2 2.3 2.6 2.6 -0.8 -0.9 -4.1 -5.4 - - - - - - - - - - -5.7 -5.3 -9.1 -0.9 -10.0 -6.0 -6.2 -9.0 -12.7 - - - - - - - - - - -5.2 1.1 0.3 0.7 0.9 -2.2 -1.1 -1.7 -3.0 - - - - - - - - - - -
1.7 1.9 1.8 1.9 2.4 2.7 3.2 3.3 2.8 2.3 - - - - - - - - - -1.7 1.8 1.7 2.4 3.7 3.4 3.3 2.8 1.7 1.5 1.5 1.6 1.2 1.5 1.7 1.8 1.8 1.8 1.7 1.84.4 4.0 4.5 5.9 9.7 9.4 8.2 7.1 3.5 2.6 2.2 2.4 2.1 2.8 3.0 2.7 2.7 2.6 2.6 2.71.0 1.2 1.2 1.7 1.3 1.0 0.9 0.6 0.6 0.6 0.5 0.6 0.8 1.0 1.2 1.4 1.5 1.5 1.5 1.6
3.2 4.1 3.6 4.5 3.5 2.5 2.8 2.7 3.0 3.8 3.5 2.6 2.4 1.5 1.5 1.7 1.9 2.0 2.1 2.2
-0.8 -0.8 -0.7 -0.4 -0.3 -0.2 -0.4 -0.5 -0.4 -0.6 -0.7 -0.4 0.1 0.7 1.1 1.3 1.3 1.4 1.4 1.510.8 9.1 9.5 10.2 8.0 5.8 6.4 3.8 -1.5 -3.7 -1.9 0.5 1.5 1.9 0.8 0.4 0.1 -0.1 -1.0 -2.3
1.6 1.7 1.7 2.4 2.5 2.2 2.0 1.5 0.9 0.8 0.7 0.8 1.1 1.3 1.5 1.6 1.7 1.7 1.7 1.8-1.9 -1.7 -0.9 0.8 2.1 1.8 1.2 0.6 1.3 1.3 1.1 0.8 -0.2 0.1 0.9 1.3 1.4 1.4 1.3 1.4
5.4 6.0 5.6 5.2 3.6 1.8 1.6 1.6 1.2 0.5 0.4 0.3 0.1 0.9 1.4 1.4 1.5 1.6 1.8 1.832.4 32.3 19.2 7.1 -1.2 -2.9 5.6 12.7 14.5 9.3 3.4 -2.5 -8.1 -5.7 -1.4 1.3 2.1 2.4 2.8 2.8-0.4 -0.5 -0.5 -0.5 -0.7 -0.6 -0.6 -0.8 -1.0 -1.2 - - - - - - - - - -36.7 49.0 48.0 26.2 13.2 -7.2 -2.5 1.1 -4.6 -4.2 -3.3 -5.0 -8.3 -1.5 -5.5 -5.8 -5.7 -5.4 -5.2 -4.9
2.8 2.6 2.1 2.4 3.3 2.2 1.7 3.5 -0.4 1.6 1.5 0.0 3.4 1.9 2.1 2.2 2.4 2.5 2.7 2.81.1 0.8 0.3 0.0 -0.4 -1.2 -1.5 0.7 -2.2 0.1 0.0 -1.6 2.2 0.4 0.4 0.4 0.5 0.7 0.9 1.0
-0.2 0.4 0.1 -0.5 -0.6 -0.6 0.3 0.6 2.0 2.0 0.8 0.4 -1.3 -1.8 -1.6 -1.2 -0.8 -0.4 -0.1 0.2-0.5 1.0 -0.1 1.0 2.5 2.8 2.2 3.4 2.8 2.3 1.5 -0.7 1.6 0.3 0.4 0.5 0.6 0.7 0.7 0.7-1.1 0.7 -0.2 2.4 -0.9 1.4 2.6 3.3 6.4 - - - - - - - - - - -3.0 2.0 1.6 0.9 -0.1 -2.0 -2.2 -2.1 -4.0 -2.6 -1.7 -0.8 1.8 2.6 3.1 3.3 3.4 3.4 3.4 3.47.3 6.8 6.6 6.5 7.2 6.8 7.0 7.2 7.5 7.1 7.4 7.6 8.1 7.9 8.0 8.0 8.3 7.8 7.7 7.67.4 6.5 6.4 6.4 7.1 6.5 6.6 7.0 8.0 7.5 7.5 7.8 8.7 7.8 7.6 7.7 8.4 7.3 7.1 7.1
- - - - - - - - - - - - - - - - - - - -- - - - - - - - - - - - - - - - - - - -- - - - - - - - - - - - - - - - - - - -- - - - - - - - - - - - - - - - - - - -
33.3 27.3 6.5 23.2 51.8 34.1 34.2 25.6 55.0 60.0 45.0 40.0 63.0 63.0 52.0 52.0 73.0 70.0 62.0 60.03.8 2.8 0.7 2.3 5.7 3.5 3.6 2.6 6.2 6.3 4.7 4.0 7.0 6.4 5.2 5.0 7.8 6.8 5.9 5.5
13.3 18.6 16.1 10.4 14.7 11.4 13.9 9.9 17.4 18.0 18.0 12.0 18.0 19.0 19.0 14.0 19.0 20.0 21.0 15.032.9 -89.7 -29.9 -17.3 17.0 -26.1 -48.6 -36.3 16.8 -1.0 -40.0 -20.0 23.0 1.0 -39.0 -5.0 32.0 -4.0 -32.0 4.0
3.7 -9.3 -3.1 -1.7 1.9 -2.7 -5.0 -3.6 1.9 -0.1 -4.2 -2.0 2.6 0.1 -3.9 -0.5 3.4 -0.4 -3.1 0.4
-8.4 48.1 -35.2 42.3 30.7 48.1 44.0 58.3 28.4 - - - - - - - - - - -
17.8 16.9 17.3 18.8 19.1 19.7 20.0 19.4 19.4 19.8 19.9 20.1 20.3 20.2 20.2 20.2 20.1 20.0 19.8 19.324.4 24.3 24.4 25.3 25.1 25.3 25.1 25.2 25.6 25.8 25.8 25.8 25.7 25.7 25.6 25.5 25.4 25.3 25.2 25.1-5.3 -4.3 -1.1 2.5 2.0 2.9 2.0 -0.8 2.1 2.5 3.1 2.5 1.2 -0.2 -0.6 -1.0 -1.3 -1.3 -1.2 -1.0-5.1 -4.7 -1.9 1.8 3.0 4.4 3.3 0.2 2.0 2.4 3.4 3.6 2.0 0.5 -0.4 -1.1 -1.2 -1.0 -0.8 -0.5
0.8 -0.1 1.6 4.6 4.0 3.9 3.3 0.3 1.0 1.1 2.1 2.7 2.2 1.6 1.4 1.3 1.3 1.5 1.6 1.74.7 2.4 3.5 6.5 5.7 5.7 4.7 1.0 -0.3 -0.4 0.6 1.3 1.2 0.5 -0.1 -0.3 -0.2 -0.1 0.0 -0.1
3.4 2.6 3.7 4.8 6.1 5.8 5.7 5.0 4.2 4.1 3.1 2.7 2.9 2.8 3.1 3.2 3.3 3.3 3.2 3.20.75 0.75 0.75 0.75 0.75 0.50 0.50 0.05 0.05 0.05 - - - - - - - - - -
1.2 1.2 1.2 1.2 1.2 1.2 1.0 0.6 0.5 0.5 0.1 0.0 0.2 0.2 0.2 0.3 0.5 0.7 0.9 1.1

Issuedby:CZECH NATIONAL BANKNa Příkopě 28115 03 Praha 1CZECH REPUBLIC
Contact:COMMUNICATIONS DEPARTMENTTel.: +420 22441 3494Fax: +420 22441 2179
http://www.cnb.cz
Producedby: Jerome s.r.o.Design: Jerome s.r.o.
ISSN 1803-2419 (Print)ISSN 1804-2465 (Online)

Czech National Bank / Inflation Report III/2013
ZÁKLADNÍ TEXT
tab. 1 (box)
79
Pramen:
Graf I.4


