99
2013 OREGON PUBLIC FINANCE: BASIC FACTS Research Report #1-13 LEGISLATIVE REVENUE OFFICE http://www.leg.state.or.us/comm/lro/home.htm
2013 OREGON PUBLIC FINANCE:
BASIC FACTS
Research Report #1-13
LEGISLATIVE REVENUE OFFICE
http://www.leg.state.or.us/comm/lro/home.htm
LRO: 2/21/2013 i Research Report #1-13
INDEX
Section Pages Subject
A A1 – A7 Overview
B B1 - B2 Surplus Kicker
B3 - B4 State Budget History
B5 – B6 Effect of Tax Changes
C C1 – C12 Personal Income Taxes
C13 – C28 Corporate Excise Taxes
D D1 – D10 Property Taxes
E E1 – E5 Property Tax Relief
F F1 – F5 Estate and Inheritance Tax
G G1 – G4 School Finance
G5 – G7 School Formula and ESD
G8 – G11 School Finance data and Tables
H H1 – H6 Transportation Taxes
I I1 – I7 Timber Taxes
J J1 – J3 Excise Cigarettes, Tobacco and Alcohol (OLCC) Taxes
K K1 – K3 Lottery
L L1 – L3 Recent Tax Votes
M M1 – M3 Other Reports

House Revenue Chair
Representative Phil Barnhart
&
Senate Revenue Chair
Senator Ginny Burdick
LEGISLATIVE REVENUE OFFICER
PAUL WARNER
Expertise: General revenue issues,
Spending limits, 2% kicker, Tax reform, some local
government finance issues
503 986-1263
Economist - Christine Broniak
Expertise: Property Taxes (statutory changes only),
Timber, Natural Resource Taxes/Fees, Other Local
Finance
503 986-1262
Economist - Dae Baek
Expertise: School Finance, Cigarette Taxes, Unemployment
taxes, Health care taxes
503 986-1265
Sr. Economist - Chris Allanach
Expertise: Personal income tax, Corporate
excise tax & other general business taxes, Revenue
forecast, Tax incidence model
503 986-1261
Office Manager – Corinne Gavette
Expertise: general office issues,
committee scheduling, bill process
503-986-1264
Sr. Economist - Mazen Malik
Expertise: Transportation finance, Consumption tax
(sales), Excise taxes, Lottery, Bonds, Estate taxes,
OLCC, some local government issues
503-986-1260
LRO/LFO Business Systems & Data Analyst
June Starkey
Expertise: Legislative Systems, I.T. functions
503-986-1272
2013 Organizational Chart
Legislative Revenue OfficeState Capitol Building
900 Court Street N.E., Room 143
Salem, OR 97301
503-986-1266
Http://www.leg.state.or.us/comm/lro
Committee Assistant-Nick Herrera
Expertise: House Committee Business
503-986-1269
Committee Assistant – Edward Klein
Expertise: Senate Committee Business
503-986-1268
Docket Clerk – Trenda Staudenmier
503-986-1266
LRO 2/21/2013 A1 Research Report #1-13
Overview of Oregon’s Revenue System Comparative Analysis The most comprehensive way to compare Oregon’s current revenue system with other states is to examine the most recent U.S. Census Bureau statistics on state and local government finance. These data include all state and local revenue sources (and expenditures) collected on a consistent basis from all states. The most recent data are for the 2009-10 fiscal year, released in September of 2012. Census divides state and local revenue sources into six categories. These categories are: Taxes Revenue from the Federal Government Charges—consisting of direct payments for services from governments. The largest
components of this category are higher education (tuition & fees) and payments for health-hospital services.
Miscellaneous Revenue—the largest component of this category is interest earnings on government balances. Also included in this category are asset sales, system development charges and net revenue from lottery.
Government Enterprises—consisting of gross revenue from government operated enterprises such as liquor sales and public utilities.
Insurance Trust Revenue—is made up of current revenue generated by public employee retirement funds (mostly earnings on retirement funds), state operated workers’ compensation funds and unemployment trust funds.
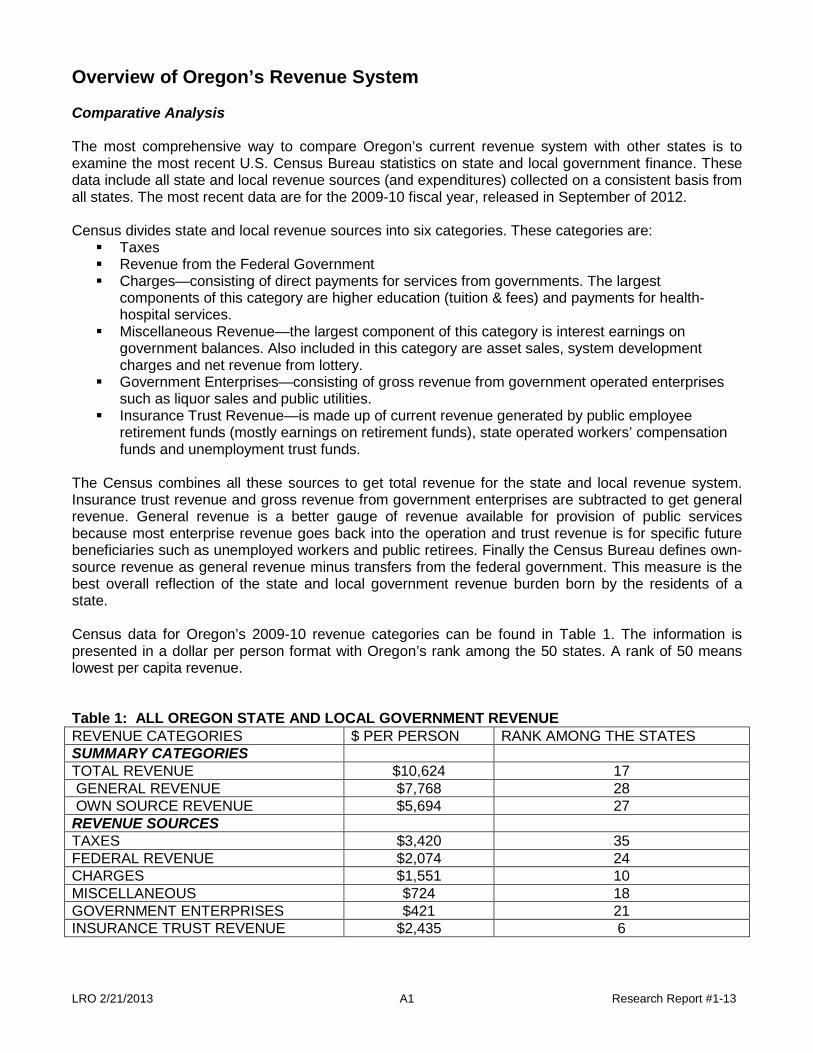
The Census combines all these sources to get total revenue for the state and local revenue system. Insurance trust revenue and gross revenue from government enterprises are subtracted to get general revenue. General revenue is a better gauge of revenue available for provision of public services because most enterprise revenue goes back into the operation and trust revenue is for specific future beneficiaries such as unemployed workers and public retirees. Finally the Census Bureau defines own-source revenue as general revenue minus transfers from the federal government. This measure is the best overall reflection of the state and local government revenue burden born by the residents of a state. Census data for Oregon’s 2009-10 revenue categories can be found in Table 1. The information is presented in a dollar per person format with Oregon’s rank among the 50 states. A rank of 50 means lowest per capita revenue. Table 1: ALL OREGON STATE AND LOCAL GOVERNMENT REVENUE REVENUE CATEGORIES $ PER PERSON RANK AMONG THE STATES SUMMARY CATEGORIES TOTAL REVENUE $10,624 17 GENERAL REVENUE $7,768 28 OWN SOURCE REVENUE $5,694 27 REVENUE SOURCES TAXES $3,420 35 FEDERAL REVENUE $2,074 24 CHARGES $1,551 10 MISCELLANEOUS $724 18 GOVERNMENT ENTERPRISES $421 21 INSURANCE TRUST REVENUE $2,435 6

LRO 2/21/2013 A2 Research Report #1-13
Revenue systems across the country were still suffering badly from the impact of the Great Recession in the 2009-10 fiscal year. Declining economic activity depressed most major state and local revenue sources during this period, particularly income and sales taxes. Despite the lingering effects of the recession, states experienced a huge turn around in insurance trust earnings in the 2009-10 fiscal year. Insurance trust funds, which largely consist of public employee retirement funds, are heavily invested in equities. After plunging over 50% in 2008-09, stock prices rebounded sharply in 2009-10. As a result, Oregon’s trust fund earnings bounced back from a decline of $2,799 per person to a gain of $2,435 per person. Oregon had the 6th highest trust fund earnings in the country in 2009-10. However, insurance trust revenue is not an accurate reflection of revenue available to fund state and local government operations in the short term. General revenue (excluding the insurance trust and government enterprise categories), provides a better indication of revenue available to fund public services in the current year. In this category, Oregon state and local governments received $7,768 per person during the 2009-10 fiscal year. Oregon ranked #28 among the states in this category. Own source revenue (general revenue minus transfers from the federal government) totaled $5,694 per person for a ranking of #27. Table 1 also breaks down Oregon’s revenue sources by category. Taxes comprise 44% of Oregon general state and local revenue. Oregon state and local governments collected $3,420 per person in taxes in the 2009-10 fiscal year. This ranked the state 35th in overall per person tax burden. These figures include the first fiscal year in which Measures 66 and 67 were fully operational. In 2008-09, Oregon ranked #39 among the states in overall per capita tax burden. Oregon ranks 24th among the states with $2,074 in federal revenue (this category does not include federal revenue going directly to individuals such as Social Security benefits). Oregon is relatively dependent on charges for services, ranking 10th with $1,551 in per person revenue. Oregon also ranks relatively high in the miscellaneous (#18) and government enterprise categories (#21). The state’s extensive use of lottery revenue accounts for the former while the existence of a state run liquor monopoly is a major factor in the latter. Table 2 narrows the Oregon revenue system down to taxes only. Taxes play a particularly important role in state and local revenue systems because they are the primary source of revenue for general public goods such as education and public safety. Taxes also potentially have the largest impact on economic activity because they represent a direct extraction of resources from the private sector for use by the public sector. Table 2: OREGON’S TAX REVENUE REVENUE CATEGORIES $ PER PERSON RANK AMONG THE
STATES TOTAL TAXES $3,420 35 PERSONAL INCOME TAX $1,289 5 CORPORATE INCOME TAX $104 25 PROPERTY TAX $1,287 26 GENERAL SALES TAX 0 47* SELECTIVE SALES TAXES $343 42 OTHER TAXES $473 7
* tied with 3 other states. Oregon’s overall state and local tax burden ranks 35th on a per person basis. However, the state personal income tax burden is among the highest in the nation at $1,289 per person. The ranking for corporate income taxes is right in the middle among the states at #25, following the imposition of Measure 67. Property taxes are also near the middle of the states, ranking # 26. For the first time in two decades, property taxes were nearly equal to personal income taxes in 2009-10. This occurred because personal income taxes dropped sharply during the recession while property taxes continued to grow around 3% annually under the structure established by Measure 50. Over the past two years, the pattern of stronger personal income tax growth has re-established itself.

LRO 2/21/2013 A3 Research Report #1-13
The state tax burden on consumption (general sales plus selective sales) is the lowest in the country. In addition to being one of five states without a general sales tax, Oregon ranks 42nd in selective sales tax collections per person. Selective sales taxes include gasoline taxes, tobacco taxes, alcoholic beverage taxes, real estate transfer taxes and other excise taxes on specific purchases. It also includes health provider taxes which have risen in Oregon and other states in recent years. The other tax category includes severance taxes and estate taxes. Another way to look at this same comparative revenue data is to divide the revenue numbers by total state resident income instead of population. This measure accounts for the size of the state economy rather than simply population size. In some cases the two measures can give very different rankings. For example, the state of Mississippi ranks near the bottom (45th) of the states in tax collections per capita but ranks near the middle (29th) as a percentage of resident income because the state’s per capita income is relatively low. Table 3 shows the Oregon 2009-10 total revenue data as a percentage of state personal income for 2009. Table 3: ALL STATE AND LOCAL GOVERNMENT REVENUE AS % OF PERSONAL INCOME REVENUE CATEGORIES % of TOTAL
PERSONAL INCOME RANK AMONG THE STATES
SUMMARY CATEGORIES TOTAL REVENUE 30.4% 8 GENERAL REVENUE 22.3% 19 OWN SOURCE REVENUE 16.3% 19 REVENUE SOURCES TAXES 9.8% 35 FEDERAL REVENUE 5.9% 22 CHARGES 4.4% 7 MISCELLANEOUS 2.1% 13 GOVERNMENT ENTERPRISES 1.2% 18 INSURANCE TRUST REVENUE 7.0% 4 Oregon ranks higher in most revenue categories when percentage of personal income is used. This is not surprising, given that Oregon’s per capita income is below the national average. Oregon’s ranking in general revenue and own source revenue increases to #19 in both categories. However, Oregon’s ranking in overall taxes as a percentage of personal income is #35 on both a percentage of personal income and a per capita basis. Oregon ranks slightly higher on a percentage of personal income basis in all the other categories. Table 4 converts Table 2 from a per capita comparison to a percentage of personal income basis for state and local taxes. Both the personal income tax and the property tax burden appear higher on a percentage of personal income basis. Personal income taxes at 3.7% of personal income ranks 3rd highest. Personal income taxes are 5th highest among the states on a per capita basis. In terms of property taxes, Oregon ranks #20 on a percentage of personal income basis, up 6 notches from its per capita ranking. The state moves from #25 to #22 when personal income is used to measure the corporate income tax burden.

LRO 2/21/2013 A4 Research Report #1-13
Table 4: OREGON’S TAX REVENUE AS A % OF PERSONAL INCOME
REVENUE CATEGORIES COLLECTIONS AS A PERCENTAGE OF PERSONAL INCOME
RANK AMONG THE STATES
TOTAL TAXES 9.8% 35 PERSONAL INCOME TAX 3.7% 2
CORPORATE INCOME TAX 0.3% 22 PROPERTY TAX 3.7% 20
GENERAL SALES TAX 0% 47* SELECTIVE SALES TAXES 1.0% 39
OTHER TAXES 1.1% 10 *tied with 3 other states. The comparative analysis based on the most recent U.S. Census data leads to the following conclusions: In 2009-10, relatively strong investment earnings in trust fund accounts pushed Oregon’s total
state and local revenue up to #8 among the states. However, general revenue serves as a better guide to Oregon’s relative revenue ranking for provision for current government services. Based on this measure, Oregon ranks slightly below the median state at #28 on a per capita basis and slightly above the median with a ranking of #19 on a percentage of personal income basis.
Oregon’s tax burden ranks in the bottom third of the states when measured on both a per capita and a percentage of income basis.
Oregon relies more on non-tax sources for its revenue than most states. This results in a relatively high state ranking for both charges and miscellaneous revenue.
Oregon’s personal income tax burden is among the highest in the country. Oregon’s consumption tax burden (general sales plus selective sales taxes) is the lowest in the
country. Oregon’s property tax and corporate income tax burdens rank near the middle among the
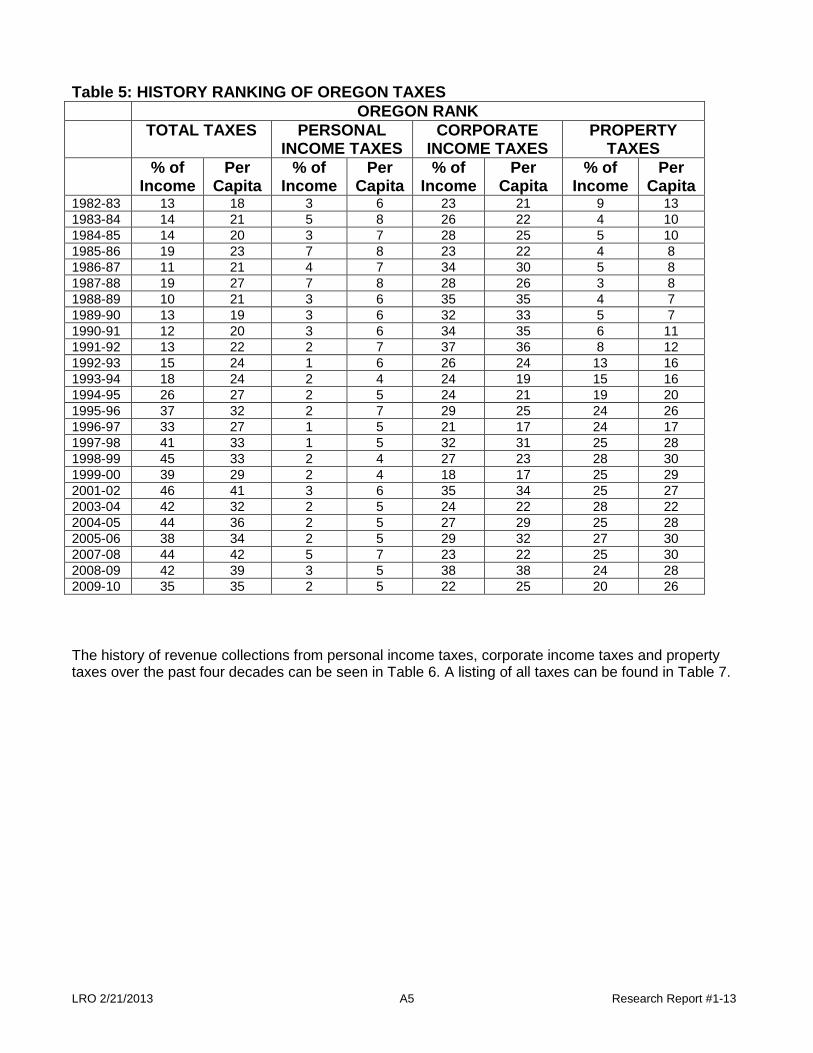
states. Oregon’s Revenue System over Time Table 5 displays Oregon’s relative ranking among the states over time for total taxes and the major broad taxes that the state revenue system has traditionally relied upon to fund public services. Throughout the past two decades Oregon has consistently ranked high among the states in personal income taxes. The state has also consistently ranked near the middle in corporate income taxes. However, Oregon’s property tax ranking among the states has declined as voter approved initiatives (Measures 5 and 50) limited revenue growth. As a result, Oregon’s overall tax burden dropped from the upper half among the states to the lower half. Not shown on the table is the state’s overall consumption tax burden, which has consistently ranked right at the bottom among the states.
LRO 2/21/2013 A5 Research Report #1-13
Table 5: HISTORY RANKING OF OREGON TAXES OREGON RANK TOTAL TAXES PERSONAL
INCOME TAXES CORPORATE
INCOME TAXES PROPERTY
TAXES % of
Income Per
Capita % of
Income Per
Capita % of
Income Per
Capita % of
Income Per
Capita 1982-83 13 18 3 6 23 21 9 13 1983-84 14 21 5 8 26 22 4 10 1984-85 14 20 3 7 28 25 5 10 1985-86 19 23 7 8 23 22 4 8 1986-87 11 21 4 7 34 30 5 8 1987-88 19 27 7 8 28 26 3 8 1988-89 10 21 3 6 35 35 4 7 1989-90 13 19 3 6 32 33 5 7 1990-91 12 20 3 6 34 35 6 11 1991-92 13 22 2 7 37 36 8 12 1992-93 15 24 1 6 26 24 13 16 1993-94 18 24 2 4 24 19 15 16 1994-95 26 27 2 5 24 21 19 20 1995-96 37 32 2 7 29 25 24 26 1996-97 33 27 1 5 21 17 24 17 1997-98 41 33 1 5 32 31 25 28 1998-99 45 33 2 4 27 23 28 30 1999-00 39 29 2 4 18 17 25 29 2001-02 46 41 3 6 35 34 25 27 2003-04 42 32 2 5 24 22 28 22 2004-05 44 36 2 5 27 29 25 28 2005-06 38 34 2 5 29 32 27 30 2007-08 44 42 5 7 23 22 25 30 2008-09 42 39 3 5 38 38 24 28 2009-10 35 35 2 5 22 25 20 26 The history of revenue collections from personal income taxes, corporate income taxes and property taxes over the past four decades can be seen in Table 6. A listing of all taxes can be found in Table 7.

LRO 2/21/2013 A6 Research Report #1-13
Receipts % Change Receipts % Change Receipts % Change1968-69 $204.3 $37.51969-70 213.1 4.3% 39.9 6.2%1970-71 226.2 6.2% 36.5 -8.4% $503.21971-72 251.2 11.0% 40.6 11.1% 541.3 7.6%1972-73 300.6 19.6% 51.1 25.9% 583.9 7.9%1973-74 352.4 17.2% 85.7 67.7% 595.3 2.0%1974-75 424.0 20.3% 90.7 5.8% 687.1 15.4%1975-76 472.1 11.4% 67.2 -25.9% 778.5 13.3%1976-77 561.9 19.0% 91.2 35.6% 860.0 10.5%1977-78 686.2 22.1% 125.6 37.7% 901.0 4.8%1978-79 807.0 17.6% 166.0 32.2% 916.0 1.7%1979-80 868.0 7.6% 177.4 6.9% 1,014.4 10.7%1980-81 1,005.1 15.8% 155.5 -12.4% 1,191.3 17.4%1981-82 968.3 -3.7% 124.2 -20.1% 1,435.6 20.5%1982-83 1,181.7 22.0% 125.1 0.8% 1,543.6 7.5%1983-84 1,220.8 3.3% 144.8 15.7% 1,612.3 4.5%1984-85 1,310.7 7.4% 153.9 6.3% 1,740.0 7.9%1985-86 1,188.0 -9.4% 161.8 5.1% 1,819.2 4.6%1986-87 1,435.8 20.9% 135.7 -16.1% 1,946.5 7.0%1987-88 1,283.7 -10.6% 167.0 23.1% 2,072.9 6.5%1988-89 1,725.3 34.4% 157.0 -6.0% 2,223.7 7.3%1989-90 1,827.6 5.9% 146.8 -6.5% 2,386.0 7.3%1990-91 2,026.3 10.9% 149.1 1.6% 2,550.6 6.9%1991-92 2,178.7 7.5% 150.9 1.2% 2,549.9 0.0%1992-93 2,383.2 9.4% 198.0 31.2% 2,529.0 -0.8%1993-94 2,583.5 8.4% 262.8 32.7% 2,466.4 -2.5%1994-95 2,797.6 8.3% 311.8 18.6% 2,369.8 -3.9%1995-96 2,901.7 3.7% 300.0 -3.8% 2,248.1 -5.1%1996-97 3,401.7 17.2% 384.4 28.1% 2,527.9 12.4%1997-98 3,419.9 0.5% 275.2 -28.4% 2,476.5 -2.0%1998-99 3,705.9 8.4% 313.9 14.1% 2,617.9 5.7%1999-00 4,197.3 13.3% 381.9 21.7% 2,801.5 7.0%2000-01 4,539.7 8.2% 373.0 -2.4% 3,014.0 7.6%2001-02 3,677.7 -19.0% 195.2 -47.7% 3,251.9 7.9%2002-03 4,021.9 9.4% 224.9 15.2% 3,414.6 5.0%2003-04 4,268.6 6.1% 317.5 41.2% 3,611.1 5.8%2004-05 4,723.0 10.6% 323.3 1.8% 3,763.9 4.2%2005-06 5,443.6 15.3% 438.2 35.6% 3,899.1 3.6%2006-07 5,596.7 2.8% 405.9 -7.4% 4,077.4 4.6%2007-08 4,972.0 -11.2% 440.7 8.6% 4,470.4 9.6%2008-09 5,118.6 2.9% 243.8 -44.7% 4,676.4 4.6%2009-10 4,943.2 -3.4% 359.0 47.3% 4,969.0 6.3%2010-11 5,524.0 11.7% 468.6 30.5% 5,022.0 1.1%2011-12 $5,852.9 6.0% $427.2 -8.8% 5,106.4 1.7%
CORPORATE INCOME TAXPERSONAL INCOME TAX PROPERTY TAX
Table 6
(millions of dollars)
FISCAL YEAR
HISTORY OF TAX COLLECTIONS - BY MAJOR TAX SOURCE
0
1,000
2,000
3,000
4,000
5,000
6,000
7,000
1970
-71
1972
-73
1974
-75
1976
-77
1978
-79
1980
-81
1982
-83
1984
-85
1986
-87
1988
-89
1990
-91
1992
-93
1994
-95
1996
-97
1998
-99
2000
-01
2002
-03
2004
-05
2006
-07
2008
-09
2010
-11
Mill
ions
of D
olla
rs
Fiscal Year
Oregon Income and Property Taxes
Property Tax
Personal Income
Corporate Income Tax

LRO 2/21/2013 A7 Research Report #1-13
SUMMARY OF OREGON TAXES12 year
STATE 1999-00 COLLECTIONS
2010-11 COLLECTIONS
2011-12 COLLECTIONS
2011 to 2012
2000 to 2012
PERSONAL INCOME TAX $4,126,282,123 $5,493,120,002 $5,825,202,930 6.0% 41.2%UNEMPLOYMENT INSURANCE TAXES 515,573,900 912,158,000 998,612,459 9.5% 93.7%GASOLINE AND USE FUEL TAXES 394,167,788 444,659,085 493,081,735 10.9% 25.1%CORPORATE INCOME TAX 405,220,686 468,606,463 430,988,674 -8.0% 6.4%WEIGHT MILE TAX 224,954,955 248,012,745 267,021,656 7.7% 18.7%CIGARETTE TAX 163,960,272 211,645,072 203,486,635 -3.9% 24.1%INSURANCE TAXES 59,602,111 43,235,265 56,571,344 30.8% -5.1%OTHER LABOR TAXES 104,213,309 70,486,050 71,319,535 1.2% -31.6%TIMBER SEVERANCE TAXES 32,843,222 252,687 380,116 50.4% -98.8%ESTATE (INHERITANCE) TAX 47,684,649 76,248,946 101,766,033 33.5% 113.4%WORKERS’ COMP INSURANCE TAXES 42,293,900 34,295,510 49,426,322 44.1% 16.9%TELEPHONE EXCHANGE ACCESS TAX 26,320,757 39,539,082 39,270,765 -0.7% 49.2%OTHER TOBACCO PRODUCTS TAX 20,374,525 51,154,246 52,167,233 2.0% 156.0%REAL ESTATE RECORDING TAX 20,636,689 33,641,626 23,042,048 -31.5% 11.7%BEER & WINE TAXES 12,377,350 16,181,608 17,322,409 7.0% 40.0%FOREST PRODUCTS HARVEST TAXES 11,110,002 11,326,155 12,900,547 13.9% 16.1%ELECTRIC COOP TAX 6,715,185 5,344,822 7,384,512 38.2% 10.0%PHONE ACCESS SURCHARGE 3,143,941 6,395,453 6,381,168 -0.2% 103.0%AMUSEMENT DEVICE TAX 1,817,543 3,080,589 1,917,049 -37.8% 5.5%HAZARDOUS SUBSTANCE TAXES 2,406,331 2,577,741 2,481,753 -3.7% 3.1%AVIATION GAS AND JET FUEL TAXES 1,978,104 1,828,086 1,833,169 0.3% -7.3%PETROLEUM LOADING FEE 1,272,955 1,076,376 1,162,694 8.0% -8.7%BOXING TAX 69,034 56,574 44,603 -21.2% -35.4%PRIVATE RAIL CAR TAX 100,589 266,907 216,287 -19.0% 115.0%OIL & GAS SEVERANCE TAX 128,445 243,554 142,129 -41.6% 10.7%DRY CLEANERS TAX 695,302 0 0 0.0% -100.0%STATE LODGING TAX 0 11,144,975 11,938,346 7.1% NAMEDICAL PROVIDER TAXES 310,249,783 418,192,283 35% NA
LOCAL TAXES 1999-00 COLLECTIONS
2010-11** COLLECTIONS
2011-12** COLLECTIONS
2000 to 2012
% CHANGE
PROPERTY TAXES* 2,800,781,460 5,021,861,380 5,106,431,660 1.7% 82.3%
TRANSIT PAYROLL & SELF EMPLOYMENT TAXES
163,488,288 244,204,524 265,427,525 8.7% 62.4%
FRANCHISE TAXES 115,617,000 232,462,000 237,808,626 2.3% 105.7%
HOTEL-MOTEL 64,150,000 95,416,277 98,565,014 3.3% 53.6%
PORTLAND BUSINESS LICENSE TAX 50,794,774 63,121,484 72,071,000 14.2% 41.9%
MULTNOMAH COUNTY BUSINESS INCOME TAX
40,846,593 48,570,000 52,250,000 7.6% 27.9%
MOTOR FUEL TAXES 9,837,758 16,228,195 15,908,544 -2.0% 61.7%
WASHINGTON COUNTY REAL ESTATE TRANSFER TAX
2,840,473 2,301,442 2,768,067 20.3% -2.5%
OTHER TAXES AND LICENSES 237,878,000 417,013,281 463,178,919 11.1% 94.7%
* includes tax imposed and urban renewal revenue
TABLE 7 % CHANGE
** Estimates where actuals are not available

LRO: 2/21/2013 B1 Research Report #1-13
2 % SURPLUS KICKER Another unique feature of Oregon’s revenue system is the 2% surplus kicker. The kicker was approved by the 1979 Legislature as part of an overall fiscal reform package. The package, which included property tax relief, was approved by voters in the spring of 1980. A complete listing of revenue related votes over the past 30 years can be found in section L1-L2. In 2000, voters acting on a legislative referral put a large portion of the 2% surplus kicker statute into the state constitution (Article IX, Section 14). How it Works The kicker law divides all General Fund money into two pots: (1) personal income taxes plus all other revenue and (2) corporate income taxes. At the end of each biennium, a calculation is made for each pot. If personal income tax collections plus all other General Fund revenue is more than 2% higher than was forecast at the close of the regular session, then a credit must be paid to personal income taxpayers. If actual revenue in the personal income tax pot exceeds the 2% threshold, then all the money in excess of the close of session forecast, including the 2%, is returned to taxpayers. A similar calculation is carried out for corporate income taxes. If actual corporate income tax collections are 2% or more above the close of session estimate for corporate income tax revenue then a kicker is triggered. Under Measure 85, approved by voters in 2012, revenue resulting from the corporate kicker calculation is allocated to the General Fund for purposes of funding K-12 education. This constitutional amendment applies to corporate kicker calculations starting with the 2013-15 biennium. Surpluses in the "all other" pot fund lead to a credit on personal income tax returns. The amount of the credit is an identical proportion of each taxpayer’s personal income tax liability, prior to state credits, for the prior year. For example, if the kicker credit is 5% and the taxpayer had a liability before credits of $1,000, he or she would receive a credit of $50 on their income tax return. The estimate upon which the kicker calculation is based can be increased, thereby reducing or eliminating the personal tax credit, on a one-time basis if an emergency is declared and approved by a 2/3 vote in each chamber of the Legislative Assembly prior to the end of the biennium upon which the kicker calculation is based. History Table 10 shows the history of the surplus kicker. A severe recession dropped revenues far short of the forecast in the first two biennia after enactment. The table actually understates the recession’s effect. If the Legislature had not increased taxes in special session the shortfall would have been much larger than shown in the table. Faced with budget problems associated with Measure 5 (1990), the Legislature suspended the kicker in 1991 and 1993. Kickers would have triggered in just one of the two pots in each of those biennia. The 1995 personal income tax refund was the first one paid by check. Prior to 1995, the personal kicker was paid through a tax credit. Personal kickers would continue to be returned through a refund when triggered until the 1995 law was changed by the 2011 Legislature. Large corporate kicker credits were applied following the1993-95 and 1995-97 biennia. Corporations were not eligible for a surplus credit for 3 biennia following the 1995-97 biennium. Corporate income tax collections exceeded the forecast by $101 million in the 2003-05 biennium leading to a 35.9% credit on 2005 corporate income tax returns. The excess corporate revenue occurred despite the defeat of

LRO: 2/21/2013 B2 Research Report #1-13
Measure 30 in January 2004. The revenue from Measure 30 was included in the close of session forecast and therefore part of the base for the kicker calculation. Personal income tax kicker refunds were distributed four biennia in a row starting with the 1993-95 biennium. These refunds averaged 7.8% with the largest (14.4%) following the 1995-97 biennium. The 2001 recession depressed non-corporate General Fund revenue well below forecast in 2001-03 and the failure of Measure 30 held non-corporate revenue $401 million below the close of session projection for the 2003-05 biennium. Table 8: 2% KICKER (1979/81 – 2011/13)
SURPLUS KICKER HISTORY Biennium
Tax Year
Personal Corporate Surplus/ Shortfall ($ million)
Credit/ Refund (% of liability)
Surplus/ Shortfall ($ million)
Credit (% of liability)
1979-81 1981 -141 None -25 None 1981-83 1983 -115 None -110 None 1983-85 1985 89 7.7% 13 10.6% 1985-87 1987 221 16.6% 7 6.2% 1987-89 1989 175 9.8% 36 19.7% 1989-91 1991 186 Suspended -23 None 1991-93 1993 60 None 18 Suspended 1993-95 1994/5 163 6.27% 167 50.1% 1995-97 1996/7 432 14.4% 203 42.2% 1997-99 1998/9 167 4.6% -69 None 1999-01 2000/1 254 6.0% -44 None 2001-03 2002/03 -1,249 None -439 None 2003-05 2004/05 -401 None 101 35.9% 2005-07 2006/07 1,071 18.6% 344 Suspended 2007-09 2008 -1,113 None -236 None 2009-11 2010 -1,050 None -4 None 2011-13* 2012 -32.5 None -38.3 None
* December 2012 Forecast The 2007 Legislature made a number of statutory changes that affected the kicker. First, using the constitutional exception process that allows the estimate to be changed with a 2/3 vote, the Legislature redirected the corporate kicker credit to the newly established Rainy Day Fund. The Legislature also modified the personal income tax refund process by basing the calculation on before credits tax liability rather than after credit liability. This change affected the distribution of the refund but did not affect the amount. Finally, the Legislature changed the tax year the corporate credit is based on from the current year to the prior year. This brought the corporate calculation into line with the personal refund calculation. Unless the corporate kicker is triggered for the 2011-13 biennium, this change will no longer apply due to the elimination of the corporate kicker credit with the passage of Measure 85. The largest personal kicker refund was returned to taxpayers following the 2005-07 biennium. The refunds totaled $1.071 billion or 18.6% of pre-credit tax liability in the 2006 tax year. The refunds were mailed out in the fall of 2007. The Great Recession and its aftermath forced both personal and corporate income tax revenue short of projections for the 2007-09 and 2009-11 biennia. Through December of 2012, revenue projections continue to track short of the close of session estimate leaving the current projection for the 2011-13 biennium below the 2% trigger threshold for both the personal and the corporate kicker.

LRO: 2/21/2013 B3 Research Report #1-13
The 2011 Legislature changed the return mechanism for the personal income tax kicker from a refund back to a credit. The personal kicker operated as a credit from 1979 to 1995. This means that the next time a personal kicker is triggered; taxpayers will receive their kicker through a credit on their income tax return rather than through a mailed refund check. For the 16 biennia in which the kicker has been in effect (1979-81 through 2009-11), the personal income tax trigger has been exceeded nine times. Kicker refunds/credits were distributed on eight occasions and suspended once. Seven times revenue has fallen short of the 2% personal income tax trigger. For the corporate calculation, actual collections have exceeded the trigger eight times and fallen below eight times. Of the eight times in which the corporate trigger was exceeded, the kicker was credited to corporate taxpayers six times and suspended twice.
STATE REVENUE AND EXPENDITURES Recent state budget history is shown in Table 9. The table shows state General Fund revenue and expenditures and state All Funds revenue and expenditures for the 1999-2015 period. The 2011-13 revenue and expenditures are based on the December 12 revenue forecast. The 2013-15 biennium figures are based on the Governor’s Recommended Budget. The table also shows values for total personal income of Oregon residents, total Oregon population and the consumer price index for comparison purposes.

LRO 2/21/2013 B4 Research Report #1-13
PROGRAM AREA 1999-01 2001-03 2003-05 2005-07 2007-09 2009-11 2011-13* 2013-15**EDUCATION $5,852.6 $5,210.9 $5,921.0 $6,417.5 $6,751.7 $6,433.2 $6,754.3 $7,648.8HUMAN RESOURCES $2,282.1 $2,387.4 $2,327.4 $2,781.0 $3,195.7 $3,238.3 $3,842.4 $4,386.1PUBLIC SAFETY $1,185.4 $1,231.2 $1,228.7 $1,528.1 $1,828.4 $1,778.7 $1,952.9 $2,120.3ECON. & COMM. DEV. + CONS & BUS. SERV. $44.7 $29.4 $29.7 $33.7 $46.7 $38.9 $36.2 $36.6NAT. RES. $150.6 $144.5 $115.3 $142.6 $164.9 $141.3 $130.8 $167.1TRANS. $20.0 $17.1 $3.9 $8.6 $4.5 $16.9 $2.0 $2.8ADMIN. $141.4 $149.3 $142.0 $168.7 $187.8 $181.9 $201.8 $194.2LEGISLATURE $53.6 $52.6 $53.9 $63.2 $77.9 $70.5 $82.7 $88.5JUDICIAL $366.3 $374.0 $401.3 $465.8 $521.9 $495.6 $589.6 $633.0MISC. $0.0 $0.0 $0.0 $0.0 $0.0 $0.0 $109.4 $130.8TOTAL $10,096.7 $9,596.4 $10,223.2 $11,609.2 $12,779.5 $12,395.3 $13,702.1 $15,408.2
1999-01 2001-03 2003-05 2005-07 2007-09 2009-11 2011-13* 2013-15*BEGINNING BALANCE 338.1$ 363.0$ 113.5$ 308.5$ 1,436.7$ -$ -$ 83.7$ PERSONAL INCOME TAXES 8,737.0$ 7,699.5$ 8,991.6$ 11,040.3$ 9,916.5$ 10,467.2$ 11,962.8$ 13,450.6$ CORPORATE INCOME TAXES 754.9$ 420.1$ 640.8$ 844.1$ 602.8$ 827.6$ 855.9$ 1,004.1$ OTHER TAXES 325.0$ 350.7$ 344.6$ 407.5$ 392.9$ 386.0$ 428.9$ 441.9$ OTHER REVENUE 305.0$ 895.7$ 461.3$ 450.1$ 800.7$ 840.6$ 701.5$ 515.7$ TOTAL $ 10,460.0 $ 9,729.0 $ 10,551.8 $ 13,050.5 $ 13,149.6 $ 12,521.4 $ 13,949.1 $ 15,496.0
PROGRAM AREA 1999-01 2001-03 2003-05 2005-07 2007-09 2009-11 2011-13* 2013-15**EDUCATION $9,498.0 $10,277.0 $10,216.8 $11,539.7 $13,953.2 $13,794.0 $13,591.5 $9,779.7HUMAN RESOURCES $7,702.2 $9,068.4 $9,261.7 $9,536.9 $11,906.8 $17,660.7 $20,567.3 $25,258.2PUBLIC SAFETY $1,959.0 $2,128.1 $1,973.4 $2,282.5 $2,930.8 $2,991.8 $2,977.2 $3,180.9ECON. & COMM. DEV. + CONS & BUS. SERV. $3,998.6 $5,778.6 $5,679.9 $4,875.8 $6,118.1 $8,608.4 $6,188.8 $4,286.1NAT. RES. $1,152.7 $1,166.9 $1,243.9 $1,324.4 $1,496.7 $1,518.3 $1,761.8 $1,759.9TRANS. $1,660.8 $1,871.4 $2,669.6 $2,886.1 $3,132.5 $3,862.1 $3,834.6 $4,088.2ADMIN. $4,058.8 $4,765.7 $6,011.8 $6,805.0 $8,215.1 $8,282.7 $9,042.0 $10,893.6LEGISLATURE $57.9 $59.8 $56.9 $69.7 $116.5 $78.8 $89.9 $94.3JUDICIAL $374.2 $393.1 $409.2 $434.3 $578.2 $589.9 $650.1 $716.4MISC. $0.0 $0.0 $0.0 $0.0 $0.0 $0.0 $109.4 $130.8TOTAL $30,462.2 $35,509.0 $37,523.2 $39,754.4 $48,447.9 $57,386.7 $58,812.6 $60,188.1
1999-01 2001-03 2003-05 2005-07 2007-09 2009-11 2011-13 2013-15*TAXES $13,168.9 $11,912.3 $14,265.6 $16,870.2 $15,437.7 $16,827.7 $19,534.9 $21,101.4FEDERAL FUNDS $7,352.3 $9,604.1 $10,287.8 $10,060.3 $11,896.3 $18,900.9 $17,099.9 $18,479.1INTEREST EARNINGS $4,247.9 $801.9 $11,970.1 $21,545.2 $272.7 $8,327.5 $7,746.8 $13,749.8DONATIONS&CONTRIB. $2,917.5 $5,073.7 $5,105.9 $3,695.0 $3,230.3 $2,787.9 $3,579.4 $2,445.5BOND SALES $1,768.1 $2,486.4 $2,756.9 $2,902.8 $2,700.5 $2,476.3 $1,689.2 $2,295.5LIQUOR & OTHER SALES $412.8 $469.6 $553.5 $632.6 $681.2 $653.2 $730.0 $766.7LOAN REPAYMENTS $673.4 $790.2 $727.8 $570.5 $568.7 $641.5 $485.0 $494.4CHARGES $1,283.9 $1,491.7 $1,992.5 $2,432.6 $2,825.3 $5,138.7 $5,680.0 $3,816.2LICENSES & FEES $665.6 $1,021.6 $1,143.1 $1,331.7 $1,336.8 $1,454.4 $1,630.3 $1,595.2LOTTERY $630.6 $738.1 $780.6 $1,087.7 $1,326.9 $1,085.3 $1,128.3 $1,048.8OTHER $1,136.9 $2,463.7 $1,526.4 $1,537.2 $2,822.8 $2,767.9 $2,165.2 $2,121.8TOTAL $34,257.9 $36,853.3 $51,110.2 $62,665.8 $43,099.2 $61,061.3 $61,469.0 $67,914.4
2000 2002 2004 2006 2008 2010 2012* 2014*OREGON PERSONAL INC.(MILL.) $98,530 $104,690 $112,974 $127,403 $140,949 $137,821 $150,927 $164,207OREGON POPULATION(MILL.) 3.437 3.508 3.586 3.693 3.788 3.84 3.889 3.964U.S. CONSUMER PRICE INDEX 172.2 179.9 188.9 201.6 215.2 218.1 229.5 236.6*December 2012 Economic and Revenue Forecast
*December 2012 Economic and Revenue Forecast
**Governor's Recommended Budget* Legislatively Approved Budget
ALL FUNDS REVENUE (IN MILLIONS)
GROWTH MEASURES
ALL FUNDS BUDGET (IN MILLIONS)
*Governor's Recommended Budget
* Legislatively Approved Budget**Governor's Recommended Budget
TABLE 9STATE BUDGET HISTORY: 1999-2015
GENERAL FUND BUDGET (IN MILLIONS)
GENERAL FUND RESOURCES (IN MILLIONS)

LRO 2/21/2013 B5 Research Report #1-13
EFFECT OF TAX CHANGES The table contains rough approximations of the static revenue impacts of selected tax changes. All figures are in millions of dollars. The estimates assume that the proposed change is fully phased in. Due to time lags in the tax system, a proposed change might not have the effect shown here in the first fiscal year.
TAX REDUCTIONS Revenue Effect
(in millions) FY
2013-14 FY
2014-15 FY
2015-16 FY
2016-17 Property Tax
Personal Property Tax Threshold (current law: accounts under $12,500 in Assessed Value are exempt from Taxes) Increase the Tax Exempt Threshold to $20,000 of Assessed Value -2.9 -3.0 -3.1 -3.2 Senior Homeowner Property Tax Freeze: Freeze property taxes on residences who are over the age of 65 and have income < $35,000
-7.3 -7.5 -7.9 -8.2
Personal Income Tax Earned Income Credit (EIC) Increase EIC to 12% of federal EIC -32.7 -67.1 -68.3 -69.6 Increase EIC to 18% of federal EIC -65.4 -100.8 -102.6 -104.4 Rate Reductions (current rates: 5% – 7% – 9% – 9.9%) Reduce rates to 5 - 7 - 9% -77.3 -91.4 -99.1 -107.1 Reduce rates to 4.5 - 6.5 - 8.5% -456.2 -492.4 -517.6 -545.6 Reduce rates to 4 - 6 - 8% -837.1 -895.2 -937.8 -985.8 Tax Bracket Changes Double width of 5% and 7% brackets -428.3 -443.4 -459.6 -479.0 Widen 5% and 7% brackets by $1,000 ($2,000 on joint returns) -196.6 -204.8 -213.4 -222.2 Income Subtractions and Deductions Double standard deduction ($2,025 single; $4,055 joint in 2012) -175.1 -180.0 -183.8 -188.6 Increase Maximum Federal Tax Subtraction to $10,000 -104.7 -115.6 -114.9 -113.6 No limit on maximum subtraction for federal income taxes -802.9 -944.0 -1,003.6 -1,070.2 Credits Increase personal exemption credit $10 -29.2 -29.7 -30.1 -30.6 Capital Gains (taxed at regular income tax rates) Reduce tax rate on capital gains to 5% -186.7 -237.0 -240.9 -242.7 Reduce tax rate on capital gains to 4% -231.8 -294.1 -298.8 -301.0
Estate Taxes Eliminate estate taxes in Oregon -47 -100.0 -103.3 -107.1
Corporate Income Tax Reduce corporate tax rate 0.1 percentage point (to 6.5% & 7.5%) -6.7 -7.2 -7.2 -7.2 Reduce corporate tax rate 1 percentage point (to 5.6% & 6.6%) -66.2 -70.3 -70.0 -71.5 Reduce top tax rate to 6.6% -37.1 -40.1 -39.9 -39.8 Reduce C-corp. min tax to $150 / $500 -39.5 -39.1 -38.7 -38.3

LRO 2/21/2013 B6 Research Report #1-13
TAX INCREASES/NEW TAXES
Revenue Effect
(in millions) FY
2013-14 FY
2014-15 FY
2015-16 FY
2016-17 Statewide Property Tax for School Districts
Establish an additional tax rate of $1 per $1,000 of assessed value for all school districts statewide that is outside the Measure 5 limit
301.5 315.6 326.6 338.0
Personal Income Tax Increase all rates 5% (5.25% to 10.4%) 316.6 336.2 351.3 368.5 Increase all rates 1 percentage point (6% to 10.9%) 750.2 793.5 828.1 867.7 Continue top rates of 10.8% and 11% 87.8 103.9 112.7 121.8 Decrease maximum federal tax subtraction to $3,000 (2012 federal tax subtraction was $6,100) 157.8 184.1 196.1 211.5 1% Surtax 56.9 60.5 63.3 66.5 Reduce personal exemption credit by $10 29.3 29.7 30.1 30.7 Limit property tax deduction to $5,000 18.7 20.1 21.5 22.8 Limit mortgage interest deduction to $15,000 78.0 82.7 87.3 92.5 Reduce itemized deductions 5% 58.7 60.6 63.2 66.1
Corporate Income Tax 1% Surtax 4.8 5.2 5.2 5.1 Maintain 7.6% rate starting at $250,000 26.2 28.3 28.2 28.1 Increase Rate One Percentage Point (to 7.6% & 8.6%) 67.1 72.5 72.2 72.0
Sales Taxes (begin 2014) Restricted Retail Sales Tax – Washington Base 1% Rate 227 598 628 660 Broad Retail Sales Tax – Washington Base plus Services 1% Rate 301 789 830 872 Restricted Retail Sales Tax – 3% Rate
681
1,795
1,885
1,890
Broad Retail Sales Tax – 3% Rate 903 2,368 2,489 2,617 Restricted Retail Sales Tax – 5% Rate 1,136 2,992 3,142 3,300 Broad Retail Sales Tax – 5% Rate 1,505 3,947 4,149 4,362
Business Activity Taxes (begin 2014) Gross Receipts Tax .25% (1/4 of 1%) Rate 210 553 583 615 Value Added Tax (no exemptions) – 1% rate 214 563 594 626
Excise Taxes (begin 2014) Washington Real Estate Transfer Tax – 1% Rate 90.1 180.9 207 219.6 Increase Cigarette Tax by 10¢ per Pack 6.6 12.6 12.1 11.4 Increase Other Tobacco Products by 10% of wholesale price --17.8 cents per oz. for moist snuff 3.6 7.6 7.8 8.1 Increase Beer Tax by $1 per barrel (38.5% increase) 1.6 3.0 3.0 3.1 Increase Wine Tax by 25¢ per gallon (37.3 % increase) 1.7 3.2 3.3 3.4 Increase OLCC Mark-up by 5% (current = 106%) 5.7 10.5 10.7 11.1 Transient Lodging Tax – 1% Rate (no exemption amount) 5.9 10.9 10.9 11.3
LRO: 2/21/2013 C1 Research Report #1-13
OREGON INCOME TAXES Oregon’s primary source of revenue is from income taxes – both personal and corporate. Together they account for roughly 92 percent of the General Fund. The personal income tax is imposed on all the income of residents (full-year filers) and the income earned in Oregon by non-residents (non-resident filers). The tax is also imposed on part-year residents for the portion of the year in which lived in Oregon. Corporations doing business in Oregon are subject to the excise tax while those that only have income from Oregon sources are subject to the income tax. Roughly 99 percent of corporations are excise tax filers.
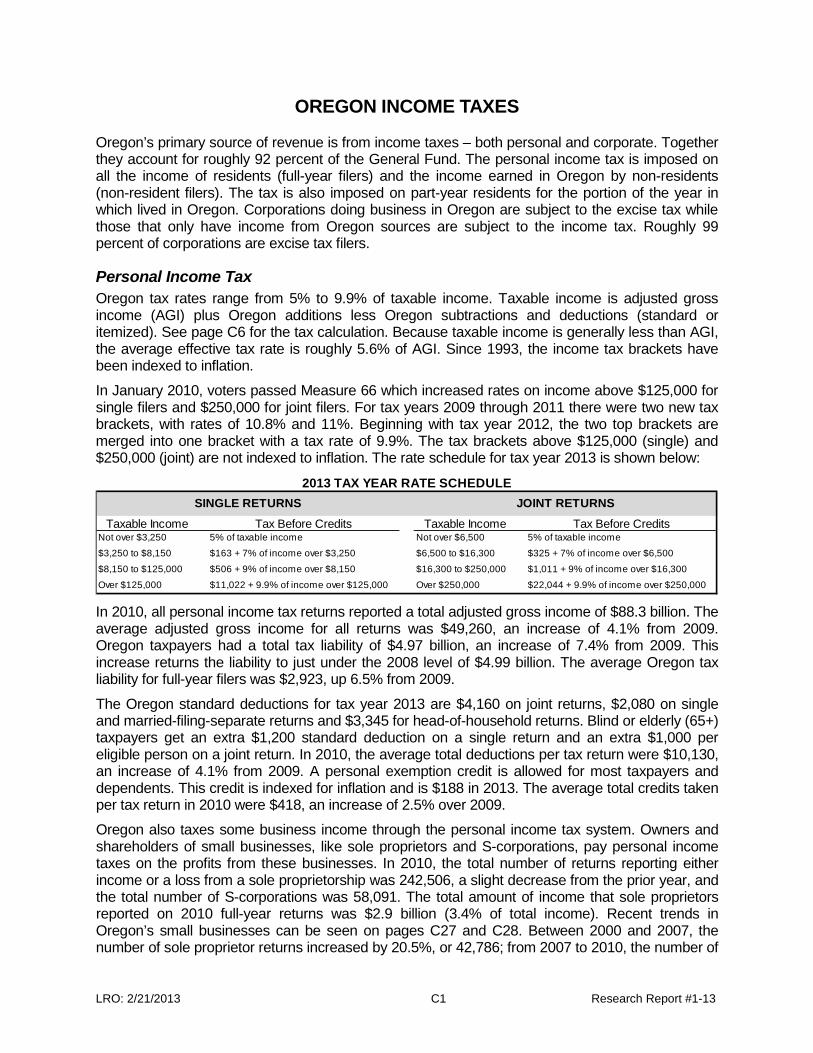
Personal Income Tax Oregon tax rates range from 5% to 9.9% of taxable income. Taxable income is adjusted gross income (AGI) plus Oregon additions less Oregon subtractions and deductions (standard or itemized). See page C6 for the tax calculation. Because taxable income is generally less than AGI, the average effective tax rate is roughly 5.6% of AGI. Since 1993, the income tax brackets have been indexed to inflation.
In January 2010, voters passed Measure 66 which increased rates on income above $125,000 for single filers and $250,000 for joint filers. For tax years 2009 through 2011 there were two new tax brackets, with rates of 10.8% and 11%. Beginning with tax year 2012, the two top brackets are merged into one bracket with a tax rate of 9.9%. The tax brackets above $125,000 (single) and $250,000 (joint) are not indexed to inflation. The rate schedule for tax year 2013 is shown below:
In 2010, all personal income tax returns reported a total adjusted gross income of $88.3 billion. The average adjusted gross income for all returns was $49,260, an increase of 4.1% from 2009. Oregon taxpayers had a total tax liability of $4.97 billion, an increase of 7.4% from 2009. This increase returns the liability to just under the 2008 level of $4.99 billion. The average Oregon tax liability for full-year filers was $2,923, up 6.5% from 2009.
The Oregon standard deductions for tax year 2013 are $4,160 on joint returns, $2,080 on single and married-filing-separate returns and $3,345 for head-of-household returns. Blind or elderly (65+) taxpayers get an extra $1,200 standard deduction on a single return and an extra $1,000 per eligible person on a joint return. In 2010, the average total deductions per tax return were $10,130, an increase of 4.1% from 2009. A personal exemption credit is allowed for most taxpayers and dependents. This credit is indexed for inflation and is $188 in 2013. The average total credits taken per tax return in 2010 were $418, an increase of 2.5% over 2009.
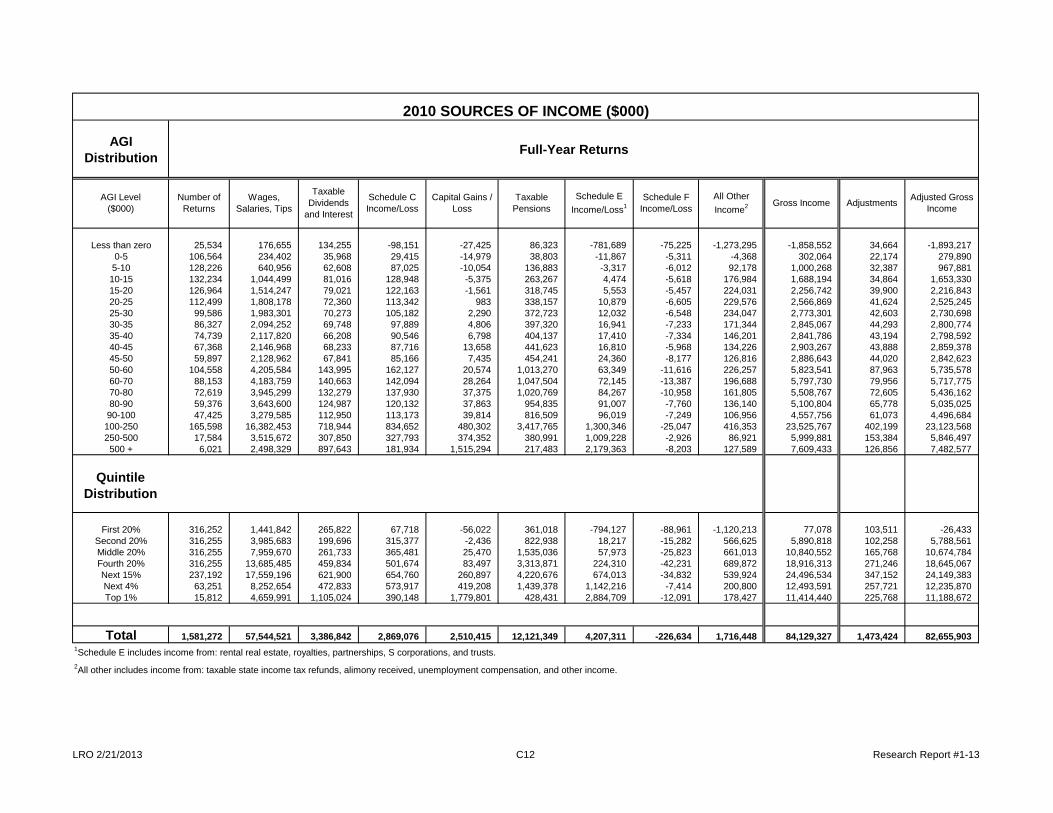
Oregon also taxes some business income through the personal income tax system. Owners and shareholders of small businesses, like sole proprietors and S-corporations, pay personal income taxes on the profits from these businesses. In 2010, the total number of returns reporting either income or a loss from a sole proprietorship was 242,506, a slight decrease from the prior year, and the total number of S-corporations was 58,091. The total amount of income that sole proprietors reported on 2010 full-year returns was $2.9 billion (3.4% of total income). Recent trends in Oregon’s small businesses can be seen on pages C27 and C28. Between 2000 and 2007, the number of sole proprietor returns increased by 20.5%, or 42,786; from 2007 to 2010, the number of
2013 TAX YEAR RATE SCHEDULE
Taxable Income Tax Before Credits Taxable Income Tax Before CreditsNot over $3,250 5% of taxable income Not over $6,500 5% of taxable income
$3,250 to $8,150 $163 + 7% of income over $3,250 $6,500 to $16,300 $325 + 7% of income over $6,500
$8,150 to $125,000 $506 + 9% of income over $8,150 $16,300 to $250,000 $1,011 + 9% of income over $16,300
Over $125,000 $11,022 + 9.9% of income over $125,000 Over $250,000 $22,044 + 9.9% of income over $250,000
SINGLE RETURNS JOINT RETURNS

LRO: 2/21/2013 C2 Research Report #1-13
these returns declined by 3.5%, or 8,761. The number of S-corporations increased by 35% (15,628) between 2000 and 2008, before declining by 2.7% (1,584) between 2008 and 2010.
Personal income tax collections are the largest source of state tax revenue and are projected to comprise 86% of the total General Fund revenues in the 2011-13 biennium. (They were 84% of the total general fund revenues in the 2009-11 biennium.) The following chart shows the personal income tax collections since fiscal year 2001-02.
History In 1917 the Oregon Constitution was amended to allow a progressive income tax. In 1923 an income tax was adopted by the legislature and approved by a state wide vote. The tax was collected for only one year. A successful initiative petition repealed it in 1924. Subsequent to 1924 three initiative petitions and a legislative referral failed at the polls. The 1929 legislature adopted an income tax dedicated to reducing the state property tax. The tax was brought to a vote by referendum. It was approved by the voters in 1930. By 1938 the state property tax was completely offset by income tax collections, and except for 1940, no state property tax has been collected since. Here are some major changes in the tax since 1929: 1933 First rate and exemption change, designed to offset depression revenue losses,
increased bottom rate from 1% to 2% and top rate from 5% to 7%.
1939 Rates changed again, top rate still 7% but hit at $4,000 rather than $5,000.
1943 "Walker Plan" adopted, designed to cope with additional revenue from increased wartime economic activity, reduced tax liability 5% for each extra $1 million in taxes collected. It was modified in 1945, suspended in 1947 and repealed in 1949.
1947 Withholding on wages begins; new rates; 8% bracket added for income over $8,000.
1953 Income tax placed into general fund rather than property tax relief account. Personal exemption set equal to federal exemption.
2001-02
2002-03
2003-04
2004-05
2005-06
2006-07
2007-08
2008-09
2009-10
2010-11
2011-12
Collections $3.68 $4.02 $4.27 $4.72 $5.44 $5.77 $4.79 $5.30 $4.94 $5.52 $5.85
$0.0
$1.0
$2.0
$3.0
$4.0
$5.0
$6.0
$7.0
$ B
illio
ns
Fiscal Year
Personal Income Tax Collections

LRO: 2/21/2013 C3 Research Report #1-13
1955 45% surcharge imposed, in effect for 1955 and 1956.
1957 Rate structure changed, ranges from 3% at bottom to 9.5% for income over $8,000.
1959 Special capital gains treatment begins.
1969 Federal income tax base adopted. Rate schedule adjusted, 4% to 10% for income over $5,000.
1971 Planned federal increases in the personal exemption and standard deduction threaten Oregon revenue. Oregon freezes to IRC as of December 31, 1971.
1975 Oregon reconnects to federal code but maintains separate standard deduction and personal exemption.
1979 9% income tax refund for 1978 taxes. 2% surplus kicker created. Personal exemption increased and indexed for inflation.
1981 Federal changes threaten state revenue, Oregon freezes to federal code as of December 31, 1980. Personal exemption indexing delayed.
1982 Rates increased, 4.2% to 10.8%.
1983 Federal conformity updated to December 31, 1982, except for ACRS. $85 personal tax credit replaces personal exemption.
1985 Rates revert to 4% to 10% structure. Oregon law fixed to federal code as of December 31, 1984.
1987 Federal conformity updated to December 31, 1986, connects Oregon to the 1986 federal tax reforms (including full taxation of capital gains). Tax rates reduced (5% to 9% over $5,000), standard deduction increased.
1989 Federal conformity updated to December 31, 1988. Double weighted sales in apportionment formula.
1991 Federal conformity updated to December 31, 1990. Tax brackets indexed beginning in 1993. Taxed all pension income, with new retirement credit. Allows nonresident credit for tax paid to other states.
1993 Federal conformity updated to December 31, 1992.
1995 Federal conformity updated to April 15, 1995.
1997 Federal conformity updated to December 31, 1996 and permanently reconnected to future changes. Earned income credit adopted. Lottery jackpots subject to tax.
1998 Federal pension income is excluded from taxable income. Credit for long-term care insurance adopted.
2000 Federal tax subtraction increased from 3,000 to 5,000 effective 1/1/2002. Indexed for inflation beginning 2003.
2001 Standard deductions changed to $1,640 for single filers and $3,280 for joint filers effective 1/1/2002. Indexed for inflation beginning 2003. Working Family Childcare credit made refundable effective 1/1/2003.
2002 Phase-in the implementation of the higher federal tax subtraction. In 2002 the federal tax subtraction is $3,250 and in 2003 it is $3,500; it then increases $500 annually until $5,500 in 2007. Beginning in 2008 it is indexed to inflation.
2003 Federal conformity updated to December 31, 2002, except for changes in
LRO: 2/21/2013 C4 Research Report #1-13
depreciation, 179 expensing, deferred compensation plans, pension, employee stock ownership, deferred compensation, individual retirement plans, medical savings accounts, qualified tuition savings accounts or other tax-exempt savings programs. Eliminates the “rolling reconnect” for changes in federal tax law for 3 years until December 31, 2005. Re-establishes the “rolling reconnect” for changes in federal law pertaining to taxable income for federal tax law changes after December 31, 2005.
2005 Oregon’s earned income credit is increased to 6% of the federal credit beginning January 1, 2008. It is also made refundable for tax years 2006 through 2010. The residential energy tax credit is also expanded. New credits are created for volunteer emergency medical technicians and taxpayers who contribute to an individual development account.
2007 New compliance measures were passed pertaining to the use of listed and reportable transactions. A variety of tax credits were either created or modified, including a credit for donations to university venture development funds or the Oregon Production Investment Fund; producer and consumer biofuels credits; the business and residential energy credits; mobile home closure credit; and diesel truck engine credits. The refundability of the earned income credit was extended through tax year 2013 and the credit for donations to the Child Care Division was extended through 2012. Tax provisions pertaining to the military, veterans, and college savings accounts were enacted. The personal exemption credit was reduced for higher income filers. Withholding was established for certain nonresidents who sell Oregon real property.
2008 Clarifying language was added to the ORS for the business energy tax credit, the withholding requirement for nonresidents who sell Oregon real property, and the TRICARE tax credit.
2009 Sunset dates were placed on nearly all income tax credits; they were organized into three groups according to broad policy objectives. Those without a sunset date are the personal exemption credit, the credit for a claim of right income, and the credit for taxes paid to another state.
Federal conformity was updated to May 1, 2009, except for provisions relating to bonus depreciation, the discharge of indebtedness, and Section 179 expensing. Re-establishes the rolling reconnect on January 1, 2011.
The Assembly passed HB 2649 which increased tax rates for taxable income above $125,000 for single filers and $250,000 for joint filers. For single filers in tax years 2009 to 2011, income between $125,000 and $250,000 is taxed at 10.8% and income above $250,000 is taxed at 11%; for joint filers, the brackets are $250,000 and $500,000. Also, the federal tax subtraction was phased-out for single filers above $125,000 of income and for joint filers above $250,000. After the Governor signed the bill, citizens referred it to the ballot for a special election in January 2010. Voters approved Measure 66, gathering 54% of ‘yes’ votes.
2010 Federal conformity was updated to December 31, 2009.
A number of changes were made to the Business Energy Tax Credit, including a limit to the amount of certifications for the renewable and manufacturing portions of the program, a reduction in subsidies for wind projects, an extension to six years for the time period over which renewable projects of more than $10 million may take the credit, and the addition of battery and electric vehicle manufacturers to the manufacturing credit. The sunset for renewable and conservation projects is

LRO: 2/21/2013 C5 Research Report #1-13
extended to July 1, 2012 and is based on final certification. The sunset for manufacturing projects is extended to January 1, 2014 and is based on preliminary certification.
2011 Federal conformity was updated to December 31, 2010.
Several tax credits were extended, including credits for biomass, E-commerce zones, film & video, fish screening, and residential energy. The Business Energy Tax Credit was allowed to sunset and was replaced by separate credits for manufacturing, renewable energy, conservation, and transportation projects. The structure of the manufacturing credit was not changed, but the other three credits are continued at a much smaller magnitude.
A new credit was created for qualified equity investments in low-income areas.
2012 Federal conformity was updated to December 31, 2011.

LRO: 2/21/2013 C6 Research Report #1-13
Calculation of Oregon Personal Income Tax (Full-Year Filers)
Federal Adjusted Gross Income
Oregon Additions: • Interest on government bonds • Difference in depreciation
Oregon Subtractions: • Federal income tax • U.S. government bond interest
Deductions
Oregon Taxable Income
Tax Rates
Tax Before Credits
Tax Credits: • Personal exemption • Political contribution • Child Care • Earned income
Tax Liability (Tax Due)
-
+
-
=
x
=
-
=

LRO 2/21/2013 C7 Research Report #1-13
Oregon Personal Income Tax Returns, 1990-2010
ReturnsPercent Change Returns
Percent Change Returns
Percent Change Returns
Percent Change
1990 1,176,920 55,875 71,327 1,304,1221991 1,194,895 1.5% 53,748 -3.8% 75,044 5.2% 1,323,687 1.5%1992 1,211,927 1.4% 54,073 0.6% 86,559 15.3% 1,352,559 2.2%1993 1,235,970 2.0% 56,293 4.1% 89,569 3.5% 1,381,832 2.2%1994 1,267,485 2.5% 60,338 7.2% 93,048 3.9% 1,420,871 2.8%1995 1,302,656 2.8% 64,101 6.2% 100,257 7.7% 1,467,014 3.2%1996 1,345,533 3.3% 68,560 7.0% 105,891 5.6% 1,519,984 3.6%1997 1,381,479 2.7% 71,244 3.9% 110,416 4.3% 1,563,139 2.8%1998 1,403,128 1.6% 70,983 -0.4% 113,288 2.6% 1,587,399 1.6%1999 1,414,966 0.8% 70,617 -0.5% 117,267 3.5% 1,602,850 1.0%2000 1,435,203 1.4% 73,812 4.5% 119,398 1.8% 1,628,413 1.6%2001 1,434,864 0.0% 68,518 -7.2% 120,611 1.0% 1,623,993 -0.3%2002 1,432,971 -0.1% 62,719 -8.5% 121,010 0.3% 1,616,700 -0.4%2003 1,430,750 -0.2% 60,535 -3.5% 120,500 -0.4% 1,611,785 -0.3%2004 1,461,735 2.2% 65,632 8.4% 125,836 4.4% 1,653,203 2.6%2005 1,495,091 2.3% 71,005 8.2% 131,070 4.2% 1,697,166 2.7%2006 1,546,097 3.4% 71,711 1.0% 137,760 5.1% 1,755,568 3.4%2007 1,617,135 4.6% 73,443 2.4% 144,517 4.9% 1,835,095 4.5%2008 1,593,363 -1.5% 67,919 -7.5% 144,561 0.0% 1,805,843 -1.6%2009 1,571,302 -1.4% 56,544 -16.7% 140,551 -2.8% 1,768,397 -2.1%2010 1,581,272 0.6% 62,721 10.9% 147,687 5.1% 1,791,680 1.3%
Full-Year Part-Year Non-Resident Total
0200,000400,000600,000800,000
1,000,0001,200,0001,400,0001,600,0001,800,0002,000,000
2000 2001 2002 2003 2004 2005 2006 2007 2008 2009 2010
Number of Returns
Full-Year Part-Year Non-Resident

LRO 2/21/2013 C8 Research Report #1-13
Oregon Tax Returns and Tax LiabilityTax Year 2010, by Type of Return
Oregon Income Tax LiabilityAmount Share Amount Share
Full-Year 1,581,272 88.3% $4,622.8 92.9%Part-Year 62,721 3.5% $95.7 1.9%Non-Resident 147,687 8.2% $256.4 5.2%
1,791,680 100.0% $4,974.9 100.0%
Full-Year; 88% Part-Year; 4%
Non-Resident; 8%
Tax Returns
Full-Year; 93%
Part-Year; 2% Non-Resident;
5%
Tax Liability

LRO 2/21/2013 C9 Research Report #1-13
Components of Income, 1990-2010(Full-Year Returns)
WagesDividends & Interest Business
Net Capital Gains Retirement Other1
Gross Income
1990 $22,993 $3,023 $2,859 $1,183 $2,164 $810 $33,0311991 $24,195 $2,891 $2,959 $1,172 $2,444 $836 $34,4971992 $25,867 $2,547 $3,503 $1,450 $2,654 $971 $36,9921993 $27,317 $2,450 $4,044 $2,109 $2,863 $898 $39,6811994 $29,004 $2,418 $4,418 $1,970 $3,223 $1,014 $42,0461995 $31,036 $2,923 $4,578 $2,178 $3,585 $1,353 $45,6531996 $33,546 $3,142 $4,936 $2,913 $3,944 $1,452 $49,9341997 $35,958 $3,299 $5,303 $4,127 $4,666 $2,077 $55,4301998 $38,072 $3,336 $5,301 $4,747 $5,190 $1,839 $58,4851999 $40,094 $3,461 $5,560 $5,408 $5,716 $2,272 $62,5102000 $43,294 $3,733 $5,370 $5,987 $6,304 $2,295 $66,9832001 $43,677 $3,441 $5,323 $2,914 $6,458 $2,279 $64,0922002 $43,926 $2,724 $5,413 $2,494 $6,620 $2,136 $63,3132003 $45,671 $2,624 $5,687 $3,109 $7,136 $825 $65,0522004 $48,222 $2,949 $6,796 $4,502 $7,849 $291 $70,6092005 $51,051 $3,431 $8,235 $7,158 $8,497 $285 $78,6572006 $54,698 $4,466 $8,579 $7,650 $9,330 $570 $85,2922007 $58,487 $5,301 $8,338 $9,636 $10,368 $1,232 $93,3622008 $59,050 $4,607 $6,586 $3,834 $10,822 $663 $85,5622009 $56,450 $3,428 $6,250 $2,018 $10,767 $1,212 $80,1262010 $57,545 $3,387 $7,076 $2,510 $12,121 $1,490 $84,129
1 A technical change in 2003 resulted in the majority of "other" income being assigned to the listed categories
$0$10,000$20,000$30,000$40,000$50,000$60,000$70,000$80,000$90,000
$100,000
$ M
illio
ns
Tax Year
Other
Retirement
Net Capital Gains
Business
Dividends & Interest
Wages

LRO 2/21/2013 C10 Research Report #1-13
2010 TOTAL INCOME AND TAX ($000)
AGI Distribution Full-Year Returns
Less than zero 25,534 40,719 -1,893,216 98,888 46,050 320,527 8,708 797 375 422 11,532 2,274 1480-5 106,564 98,810 279,890 7,975 11,640 356,366 86,075 4,380 3,304 1,076 55,570 71,043 2,379
5-10 128,226 164,456 967,881 10,755 30,020 503,918 553,204 31,672 20,966 10,706 27,286 145,998 5,66210-15 132,234 217,307 1,653,330 12,711 63,773 617,454 1,072,351 69,237 37,892 31,345 18,754 175,215 8,10915-20 126,964 236,825 2,216,843 9,987 119,708 637,590 1,534,616 106,062 47,580 58,482 13,900 184,032 9,57420-25 112,499 221,372 2,525,245 10,581 181,928 613,043 1,788,760 129,923 46,486 83,437 11,579 198,718 11,27625-30 99,586 200,036 2,730,698 10,324 238,459 605,610 1,934,268 145,597 42,207 103,390 9,767 203,284 12,32530-35 86,327 177,344 2,800,774 11,067 280,447 592,648 1,971,696 151,946 36,531 115,415 8,112 201,074 12,88035-40 74,739 156,481 2,798,592 10,703 301,215 575,654 1,957,913 153,449 31,292 122,157 7,041 201,679 13,41940-45 67,368 143,015 2,859,378 11,243 345,510 579,812 1,970,628 156,364 28,009 128,355 6,107 197,965 13,64845-50 59,897 130,464 2,842,623 10,904 363,178 569,229 1,941,265 155,487 25,126 130,361 5,402 195,956 13,76750-60 104,558 237,115 5,735,578 23,695 798,978 1,154,731 3,846,258 311,182 45,525 265,657 8,767 368,794 26,58960-70 88,153 211,009 5,717,775 23,794 808,461 1,128,695 3,835,736 314,127 40,725 273,402 6,464 324,093 23,95070-80 72,619 181,737 5,436,162 22,302 762,154 1,035,641 3,679,457 304,320 35,499 268,821 4,889 284,135 21,34280-90 59,376 152,482 5,035,025 21,889 686,036 930,478 3,452,815 288,144 30,393 257,751 3,490 232,228 17,796
90-100 47,425 125,188 4,496,684 18,968 573,973 803,999 3,146,599 264,718 25,351 239,367 2,521 189,260 14,589100-250 165,598 459,877 23,123,568 142,357 2,055,076 3,614,901 17,623,059 1,522,858 108,540 1,414,318 7,792 898,734 71,241250-500 17,584 52,097 5,846,497 84,844 148,411 695,501 5,097,238 471,750 21,956 449,794 950 282,748 23,935
500 + 6,021 17,599 7,482,577 248,608 112,769 683,037 6,938,899 729,941 61,384 668,557 485 559,884 49,436
Quintile Distribution
First 20% 316,252 390,382 -26,434 121,504 110,493 1,431,416 1,037,597 61,084 38,695 22,389 42,085 19,884 816Second 20% 316,255 590,038 5,788,561 29,425 343,661 1,620,065 4,014,858 281,640 118,102 163,538 42,076 132,888 4,722Middle 20% 316,255 651,701 10,674,784 41,314 1,102,262 2,248,607 7,482,086 579,335 133,096 446,239 42,083 418,001 19,402Fourth 20% 316,255 733,236 18,645,067 76,893 2,572,710 3,691,067 12,568,468 1,023,060 141,582 881,478 42,084 978,367 61,837Next 15% 237,192 631,309 24,149,383 110,355 2,854,866 4,196,282 17,255,598 1,460,347 131,377 1,328,970 31,560 1,527,423 112,842Next 4% 63,251 180,612 12,235,870 102,602 754,785 1,722,771 9,867,744 867,987 50,837 817,150 8,417 869,829 68,465Top 1% 15,812 46,655 11,188,672 309,502 189,009 1,108,628 10,213,193 1,038,502 75,454 963,048 2,103 970,724 83,978
Total 1,581,272 3,223,933 82,655,903 791,595 7,927,787 16,018,836 62,439,544 5,311,955 689,142 4,622,813 210,408 4,917,115 352,063
AGI Level ($000)
Number of Returns
Number of Exemptions
Adjusted Gross Income
Part-Year and Nonresident Returns
SubtractionsAdditions Number of Returns
Taxable Income Net TaxDeductions Taxable
Income Gross Tax Credits Net Tax

LRO2/21/2013 C11 Research Report #1-13
2010 AVERAGE INCOME AND TAX
AGI Distribution Full-Year Returns
Less than zero 25,534 1.6 -74,145 3,873 1,803 12,553 341 31 15 17 11,532 197 130-5 106,564 0.9 2,626 75 109 3,344 808 41 31 10 55,570 1,278 43
5-10 128,226 1.3 7,548 84 234 3,930 4,314 247 164 83 27,286 5,351 20810-15 132,234 1.6 12,503 96 482 4,669 8,109 524 287 237 18,754 9,343 43215-20 126,964 1.9 17,460 79 943 5,022 12,087 835 375 461 13,900 13,240 68920-25 112,499 2.0 22,447 94 1,617 5,449 15,900 1,155 413 742 11,579 17,162 97425-30 99,586 2.0 27,421 104 2,395 6,081 19,423 1,462 424 1,038 9,767 20,813 1,26230-35 86,327 2.1 32,444 128 3,249 6,865 22,840 1,760 423 1,337 8,112 24,787 1,58835-40 74,739 2.1 37,445 143 4,030 7,702 26,197 2,053 419 1,634 7,041 28,644 1,90640-45 67,368 2.1 42,444 167 5,129 8,607 29,252 2,321 416 1,905 6,107 32,416 2,23545-50 59,897 2.2 47,459 182 6,063 9,503 32,410 2,596 419 2,176 5,402 36,275 2,54950-60 104,558 2.3 54,855 227 7,641 11,044 36,786 2,976 435 2,541 8,767 42,066 3,03360-70 88,153 2.4 64,862 270 9,171 12,804 43,512 3,563 462 3,101 6,464 50,138 3,70570-80 72,619 2.5 74,859 307 10,495 14,261 50,668 4,191 489 3,702 4,889 58,117 4,36580-90 59,376 2.6 84,799 369 11,554 15,671 58,152 4,853 512 4,341 3,490 66,541 5,099
90-100 47,425 2.6 94,817 400 12,103 16,953 66,349 5,582 535 5,047 2,521 75,073 5,787100-250 165,598 2.8 139,637 860 12,410 21,829 106,421 9,196 655 8,541 7,792 115,341 9,143250-500 17,584 3.0 332,490 4,825 8,440 39,553 289,879 26,828 1,249 25,580 950 297,629 25,195500 + 6,021 2.9 1,242,747 41,290 18,729 113,442 1,152,450 121,233 10,195 111,038 485 1,154,400 101,930
Quintile Distribution
First 20% 316,252 1.2 -84 384 349 4,526 3,281 193 122 71 42,085 472 19Second 20% 316,255 1.9 18,303 93 1,087 5,123 12,695 891 373 517 42,076 3,158 112Middle 20% 316,255 2.1 33,754 131 3,485 7,110 23,658 1,832 421 1,411 42,083 9,933 461Fourth 20% 316,255 2.3 58,956 243 8,135 11,671 39,742 3,235 448 2,787 42,084 23,248 1,469Next 15% 237,192 2.7 101,814 465 12,036 17,691 72,749 6,157 554 5,603 31,560 48,397 3,575Next 4% 63,251 2.9 193,449 1,622 11,933 27,237 156,009 13,723 804 12,919 8,417 103,342 8,134Top 1% 15,812 3.0 707,606 19,574 11,954 70,113 645,914 65,678 4,772 60,906 2,103 461,590 39,932
Total 1,581,272 2.0 52,272 501 5,014 10,130 39,487 3,359 436 2,923 210,408 23,369 1,673
Part-Year and Nonresident Returns
AGI Level ($000)
Number of Returns
Number of Exemptions
Adjusted Gross Income Additions Subtractions Deductions Taxable
Income Gross Tax Credits Net Tax Number of Returns
Taxable Income Net Tax
LRO 2/21/2013 C12 Research Report #1-13
2010 SOURCES OF INCOME ($000)
AGI Distribution Full-Year Returns
Less than zero 25,534 176,655 134,255 -98,151 -27,425 86,323 -781,689 -75,225 -1,273,295 -1,858,552 34,664 -1,893,2170-5 106,564 234,402 35,968 29,415 -14,979 38,803 -11,867 -5,311 -4,368 302,064 22,174 279,8905-10 128,226 640,956 62,608 87,025 -10,054 136,883 -3,317 -6,012 92,178 1,000,268 32,387 967,88110-15 132,234 1,044,499 81,016 128,948 -5,375 263,267 4,474 -5,618 176,984 1,688,194 34,864 1,653,33015-20 126,964 1,514,247 79,021 122,163 -1,561 318,745 5,553 -5,457 224,031 2,256,742 39,900 2,216,84320-25 112,499 1,808,178 72,360 113,342 983 338,157 10,879 -6,605 229,576 2,566,869 41,624 2,525,24525-30 99,586 1,983,301 70,273 105,182 2,290 372,723 12,032 -6,548 234,047 2,773,301 42,603 2,730,69830-35 86,327 2,094,252 69,748 97,889 4,806 397,320 16,941 -7,233 171,344 2,845,067 44,293 2,800,77435-40 74,739 2,117,820 66,208 90,546 6,798 404,137 17,410 -7,334 146,201 2,841,786 43,194 2,798,59240-45 67,368 2,146,968 68,233 87,716 13,658 441,623 16,810 -5,968 134,226 2,903,267 43,888 2,859,37845-50 59,897 2,128,962 67,841 85,166 7,435 454,241 24,360 -8,177 126,816 2,886,643 44,020 2,842,62350-60 104,558 4,205,584 143,995 162,127 20,574 1,013,270 63,349 -11,616 226,257 5,823,541 87,963 5,735,57860-70 88,153 4,183,759 140,663 142,094 28,264 1,047,504 72,145 -13,387 196,688 5,797,730 79,956 5,717,77570-80 72,619 3,945,299 132,279 137,930 37,375 1,020,769 84,267 -10,958 161,805 5,508,767 72,605 5,436,16280-90 59,376 3,643,600 124,987 120,132 37,863 954,835 91,007 -7,760 136,140 5,100,804 65,778 5,035,02590-100 47,425 3,279,585 112,950 113,173 39,814 816,509 96,019 -7,249 106,956 4,557,756 61,073 4,496,684100-250 165,598 16,382,453 718,944 834,652 480,302 3,417,765 1,300,346 -25,047 416,353 23,525,767 402,199 23,123,568250-500 17,584 3,515,672 307,850 327,793 374,352 380,991 1,009,228 -2,926 86,921 5,999,881 153,384 5,846,497500 + 6,021 2,498,329 897,643 181,934 1,515,294 217,483 2,179,363 -8,203 127,589 7,609,433 126,856 7,482,577
Quintile Distribution
First 20% 316,252 1,441,842 265,822 67,718 -56,022 361,018 -794,127 -88,961 -1,120,213 77,078 103,511 -26,433Second 20% 316,255 3,985,683 199,696 315,377 -2,436 822,938 18,217 -15,282 566,625 5,890,818 102,258 5,788,561Middle 20% 316,255 7,959,670 261,733 365,481 25,470 1,535,036 57,973 -25,823 661,013 10,840,552 165,768 10,674,784Fourth 20% 316,255 13,685,485 459,834 501,674 83,497 3,313,871 224,310 -42,231 689,872 18,916,313 271,246 18,645,067Next 15% 237,192 17,559,196 621,900 654,760 260,897 4,220,676 674,013 -34,832 539,924 24,496,534 347,152 24,149,383Next 4% 63,251 8,252,654 472,833 573,917 419,208 1,439,378 1,142,216 -7,414 200,800 12,493,591 257,721 12,235,870Top 1% 15,812 4,659,991 1,105,024 390,148 1,779,801 428,431 2,884,709 -12,091 178,427 11,414,440 225,768 11,188,672
Total 1,581,272 57,544,521 3,386,842 2,869,076 2,510,415 12,121,349 4,207,311 -226,634 1,716,448 84,129,327 1,473,424 82,655,9031Schedule E includes income from: rental real estate, royalties, partnerships, S corporations, and trusts.2All other includes income from: taxable state income tax refunds, alimony received, unemployment compensation, and other income.
Adjustments Adjusted Gross Income
Capital Gains / Loss
Taxable Pensions
Schedule E Income/Loss1
Schedule F Income/Loss
All Other Income2 Gross IncomeSchedule C
Income/LossAGI Level
($000)Number of
ReturnsWages,
Salaries, Tips
Taxable Dividends
and Interest

LRO 2/21/2013 C13 Research Report #1-13
Corporate Income and Excise Taxes Historically, C-Corporation net income attributable to Oregon has been taxed under the corporate excise tax at the rate of 6.6%. In January 2010, voters passed Measure 67 which, in part, increased the minimum tax on C-corporations and added another tax bracket for income above $250,000. For tax years 2009 and 2010, the top rate was 7.9%. For 2011 and 2012, the top rate fell to 7.6%. Beginning in 2013, the top rate only applies to income above $10 million. The tables below show the tax brackets for 2013 and the minimum tax.
The corporate excise tax is the second largest tax source for the state General Fund. The corporate tax revenue is projected to provide 6.1% of General Fund revenue in the 2011-13 biennium. (They were 6.6% of the total general fund revenues in the 2009-11 biennium.) Oregon uses federal taxable income, with some modifications, as its tax base. The following chart shows the corporate tax collections since fiscal year 2001-02.
Corporations pay taxes only on income attributable to Oregon. For multi-state C-corporations, a three-factor formula using property, payroll and sales has been historically used to apportion income to Oregon. Over the past 20 years the formula weights have changed from an equally weighted formula (used prior to 1991) to a one-hundred percent weighted sales formula (for tax
2013 TAX YEAR RATE SCHEDULE
Taxable Income Tax Before CreditsNot over $10M 6.6% of taxable income
Over $10M$660,00 + 7.6% of income over $10M
C-Corporations
2001-02
2002-03
2003-04
2004-05
2005-06
2006-07
2007-08
2008-09
2009-10
2010-11
2011-12
Collections $195 $225 $318 $323 $438 $406 $441 $244 $359 $469 $427
$0
$100
$200
$300
$400
$500
$ M
illio
ns
Fiscal Year
Corporate Tax Collections
Oregon Sales ($) Minimum Tax< $500,000 $150$500,000 to $1 Million $500$1 Million to $2 Million $1,000$2 Million to $3 Million $1,500$3 Million to $5 Million $2,000$5 Million to $7 Million $4,000$7 Million to $10 Million $7,500$10 Million to $25 Million $15,000$25 Million to $50 Million $30,000$50 Million to $75 Million $50,000$75 Million to $100 Million $75,000$100 Million or more $100,000
C-Corporate Alternative Minimum Tax

LRO 2/21/2013 C14 Research Report #1-13
years beginning on or after July 1, 2005) that is used by most corporations.1 The following table contains the corporate apportionment formula weights for each factor and their effective dates.
C-corporations can be divided into two groups: corporations which do business only in Oregon and those which do business in multiple states. In 2010, the total number of Oregon only corporate returns was 18,380 (59% of all 31,379 C-corporations) and the total number of multi-state corporations was 12,999 (41% of all 31,379 C-corporations). The total taxable income of multi-state corporations was $5.2 billion (93% of total taxable income) and total taxable income of Oregon only corporations was $0.4 billion (7% of total taxable income). Page C22 illustrates the trends in the Oregon only and multi-state corporations between 2000 and 2010. During this time period, the number of Oregon only corporations has declined by 29% while the number of multi-state corporations has increased by 4%.
S-corporations do not generally pay tax at the entity level, but are required to file a corporate tax return. Just over 58,000 S-corporations currently file tax returns, with almost every one (99.7%) paying the minimum tax. The remaining 0.3% of S-corporations has a tax liability greater than the minimum due to built-in capital gains or net excess passive income.
History The corporate excise tax was enacted in 1929 with the Personal Income Tax. Initially the Corporate Excise Tax was intended to not only raise revenues to alleviate the State Property Tax but also to provide a means of imposing a state tax on national banks, which had been declared exempt from state property taxes in 1925. 2 Here are some major changes, excluding changes to tax deductions and credits, in the income and excise corporate tax law since its enactment: 1929 The legislature passed a law titled the Corporate Excise of 1929 which enacted a
corporate excise tax on corporations doing business within the state of Oregon. The tax rate was set at 5%, with a few corporations being exempt. The corporate minimum tax was set at $25. The excise tax was measured by net income in order to circumvent the federal prohibition against taxation of income from federal securities. Because the tax was designed to furnish property tax relief and also be a state tax imposed upon national banks, corporations were allowed to offset 90% of their tax liability by the amount of personal property tax paid. The corporate apportionment formula was to be decided by tax commission regulations. Generally, the tax commission adopted a three factor formula based on the amount of property, payroll
1 The one exception is that utilities and telecommunications corporations may elect to use the double-weighted sales formula. 2 Handbook Of Oregon State Taxes, Oregon Tax Foundation, May 1983
Apportionment Formula WeightsTax Year Beginning Sales Payroll Property
12/31/1990 and earlier 33% 33% 33%
1/1/1991 to 4/30/2003 50% 25% 25%
5/1/2003 to 6/30/2005 80% 10% 10%
7/1/2005 to current 100% 0% 0%

LRO 2/21/2013 C15 Research Report #1-13
and sales of the corporation in Oregon equally weighted.
1931 Tax rate increased to 8%. Corporate minimum tax was reduced to $10.
1933 Personal property offset reduced from 90% to 75% of State Excise Tax liability.
1939 A law change added segregated accounting or apportionment as reporting methods as defined by rules and regulations adopted by the Oregon State Tax Commission. Personal property offset was reduced from 75% to 50% of State Excise Tax liability.
1943 “Walker Plan” enacted which permitted a reduction in the Personal Income and Corporate Excise Taxes when a state budget surplus occurred. Tax Liabilities discounted 75% in 1943 and 30% in 1944 as provided by the “Walker Plan” law.
1951 Revenues from the Corporate Excise Tax were directed into the General Fund rather than as an offset to the statewide property tax levy.
1955 A 8% corporate income tax was enacted to cover two classes of corporations not covered by the excise tax: those doing business only in interstate commerce and those with no property or offices in the state but which solicit orders from users of their products within the state. Public utilities were subject to taxation at a 4% rate. The corporate tax of 8% was assessed on the earnings of corporations deriving 95% or more of their income from rental of real property or whose assets consist of at least 95% or more of real property.
1957 Business corporate tax rate decreased to 6%. Financial corporation rate increased to 9%. Public utilities rate increased to 7%. Personal property tax offset was eliminated for all corporations except those corporations engaged primarily in manufacturing, processing or assembling materials into finished products and their offset was reduced from 50% to 33%.
1959 Federal Public Law 86-272 was enacted to allow some corporations to be exempt from state taxes when the corporation’s only business activity is the solicitation of orders for the sale of tangible personal property. Public utilities and other centrally assessed corporations were brought under the regular corporate excise tax law. Certain exempt corporations (labor, and agriculture; religious, charitable, etc.; business and civic leagues) made taxable on “unrelated business income.”
1963 Financial institution tax rate decreased to 8%. Exempted People’s Public Utility Districts from the Corporate Excise Tax.
1965 U.S. court cases influenced the legality of using worldwide apportionment in states from the early 1960s. Oregon had an equally weighted three-factor corporate apportionment formula for multi-state corporations and the Uniform Division of Income For Tax Purposes Act was adopted into the Oregon statutes in 1965.
1967 The legislature adopted the Multi-state Tax Compact to have consistent tax provisions among states.
1971 Depreciation options were frozen at 1970 levels to compensate for revenue losses resulting from the use of Federal asset depreciation range schedules. Federal government passed the Domestic International Sales Corporation (DISC) law which provided a tax deferral for the export earnings of multi-national corporation.
1973 Semi-annual estimated tax payments required for corporations beginning Jan. 1, 1974. Imposed corp. excise tax on real estate investment trusts (REIT).
1975 Supreme Court ruling on Coca-Cola case upheld combined reporting for tax years

LRO 2/21/2013 C16 Research Report #1-13
1962-1964. The ruling stated that the Oregon State Tax Commission had authority to permit or require corporations to use either segregated accounting or apportionment, even though there was no specific reference to a combined reporting in the law. The legislature adopted a combined reporting law which clearly stated the current practice by the Dept. of Revenue. Credit unions are taxed on their unrelated business income.
1976 All corporations taxed at the same rate, 6.5% for 1976.
1977 All corporations taxed at the same rate, 7% for 1977 and 7.5% for subsequent years.
1977 Use of Federal depreciation options allowed.
1980 Personal property tax offset expired.
1981 Depreciation schedules frozen at 1980 levels for two years, to compensate State budget for revenue losses resulting from changes in Federal law.
1982 Quarterly estimated tax payments required beginning Jan. 1, 1982.
1983 Corporate tax law in Oregon tied to federal tax law enacted as of Dec. 31, 1982. Enactment of the corporate dividend exclusion.
1984 The legislature adopted a “Waters Edge” unitary reporting requirement instead of a worldwide reporting requirement. Only business in the U.S. would be reported on a consolidated federal corporate tax return of both U.S. and foreign corporations. Corporations filing a consolidated federal return are required to file an Oregon consolidated return. Provides 85% corporate dividend exclusion.
1985 Oregon corporate and personal tax law tied to federal tax law as in effect Dec. 31, 1984, including Tax Reform Act of 1984 (TRA). The legislature chose not to connect to the federal law changes in the Foreign Sales Corporation (FSC) law change which repealed the Domestic International Sales Corporation (DISC) laws. Oregon added back the income earned by Foreign Sales Corporations to the multi-national corporations’ taxable income. Provides 100% corporate dividend exclusion.
1987 Oregon tied to the Internal Revenue Code as amended on or before Dec. 31, 1986. Reduced the corporate tax rate from 7.5% to 6.6% beginning Jan. 1, 1987.
1989 Corporate excise tax law tied to the Internal Revenue Code as amended on or before Dec.31,1988. Add S-corporations to the corporations required to pay the corporate minimum tax. Oregon shifts to a doubled weighted sales corporate apportionment formula beginning tax years on or after Jan.1,1991. Dividend deduction is allowed for 70% on dividends received from a corporation owned less than 20%. 80% exclusion is allowed on dividends received from 20% or more owned corporations.
1991 Corporate tax law tied to the Internal Revenue Code as of Dec. 31, 1990.
1993 Corporate tax law tied to the Internal Revenue Code as of Dec. 31, 1992.
1995 Corporate tax law tied to the Internal Revenue Code as of April 15, 1995.
1997 Oregon establishes “rolling reconnect” for federal changes made after April 15, 1997.
2000 The federal government passed the Exterritorial Income Act (ETI) which replaced the foreign sales corporate laws which were found to be an unfair trade practice by the World Trade Organization. Due to Oregon’s automatic connection to the federal definition of taxable income, Oregon excluded exterritorial income from the taxable income of multi-national corporations. Prior to 2000, Oregon included the income of foreign sales corporations in the definition of taxable income.

LRO 2/21/2013 C17 Research Report #1-13
2001 Oregon moved to a “super sales” corporate apportionment formula where the sales factor was weighted (.8) and payroll and property factors are each weighted (.1). This applied for corporate tax years beginning May1, 2003.
2003 Oregon will increase the sales factor of the corporate apportionment formula to (.9) and payroll and property factors are each (.05). This will apply to corporate tax years beginning July 1, 2006. Oregon will adopt a single sales corporate apportionment formula (100% sales) beginning corporate tax years after July 1, 2008. Established a date specific connection to federal tax law, as in effect on Dec. 31, 2002, for federal law changes occurring in 2003-2005 except for federal law changes pertaining to the following: depreciation, 179 expensing, pension, employee stock ownership, deferred compensation, individual retirement plans, medical savings accounts, education IRAs, qualified tuition savings accounts or other tax-exempt savings programs. Re-establishes the “rolling reconnect” for changes in federal law pertaining to taxable income for federal law changes after December 31, 2005.
2005 The corporate single-sales apportionment formula became effective for tax years beginning on or after July 1, 2005. The maximum research and development tax credit increased to $2 million, beginning January 1, 2006.
2007 New compliance measures were passed pertaining to the use of listed and reportable transactions. The apportionment formula for insurance companies was changed to a single sales factor. A variety of tax credits were either created or modified, including a credit for donations to university venture development funds or the Oregon Production Investment Fund; biofuels producer credit; the business energy credit; diesel truck engine credits; and affordable housing loans credit. A one-time small corporation tax credit was created for tax year 2007. Withholding was established for certain C-corporations that sell Oregon real property.
2008 Clarifying language was added to the ORS for the business energy tax credit, and the withholding requirement for certain C-corporations that sell Oregon real property. The cap on the affordable housing credit was increased to $17 million.
2009 Sunset dates were placed on nearly all income tax credits; they were organized into three groups according to broad policy objectives.
Federal conformity was updated to May 1, 2009, except for provisions relating to bonus depreciation, the discharge of indebtedness, and Section 179 expensing. Re-establishes the rolling reconnect on January 1, 2011.
The Assembly passed HB 3505 which added a second tax bracket for taxable income above $250,000. For tax years 2009 and 2010, the top rate is 7.9%; for tax years 2011 and 2012, the top tax rate is 7.6%. Beginning with tax year 2013, the top rate of 7.6% applies only to income exceeding $10 million. The C-corporation minimum tax was changed from a flat $10 to an amount ranging between $150 and $100,000, depending on the level of Oregon sales. After the Governor signed the bill citizens referred it to the ballot for a special election in January 2010. Voters approved Measure 67, gathering 53% of ‘yes’ votes.
2010 Federal conformity was updated to December 31, 2009.
A number of changes were made to the Business Energy Tax Credit, including a limit to the amount of certifications for the renewable and manufacturing portions of the program, a reduction in the subsidies for wind projects, an extension to six years for the time period over which renewable projects of more than $10 million may take the

LRO 2/21/2013 C18 Research Report #1-13
credit, and the addition of battery and electric vehicle manufacturers to the manufacturing credit. The sunset for renewable and conservation projects is extended to July 1, 2012 and is based on final certification. The sunset for manufacturing projects is extended to January 1, 2014 and is based on preliminary certification.
2011 Federal conformity was updated to December 31, 2010.
Several tax credits were extended, including credits for biomass, fire insurance, E-commerce zones, long-term rural enterprise zone, research activities, film & video, fish screening, and affordable housing. The Business Energy Tax Credit was allowed to sunset and was replaced by separate credits for manufacturing, renewable energy, conservation, and transportation projects. The structure of the manufacturing credit was not changed, but the other three credits are continued with a much smaller magnitude.
A new credit was created for qualified equity investments in low-income areas.
The definition of Oregon Sales was changed to reduce the impact of the corporate minimum tax on agricultural co-operatives.
2012 Federal conformity was updated to December 31, 2011.
The Legislature granted the Governor authority for one year (2013) to enter into contracts with businesses that meet certain investment requirements. In return for making such investments, the Governor is authorized to enter into a contact that guarantees use of the single sales factor apportionment for a period of between five and 30 years.
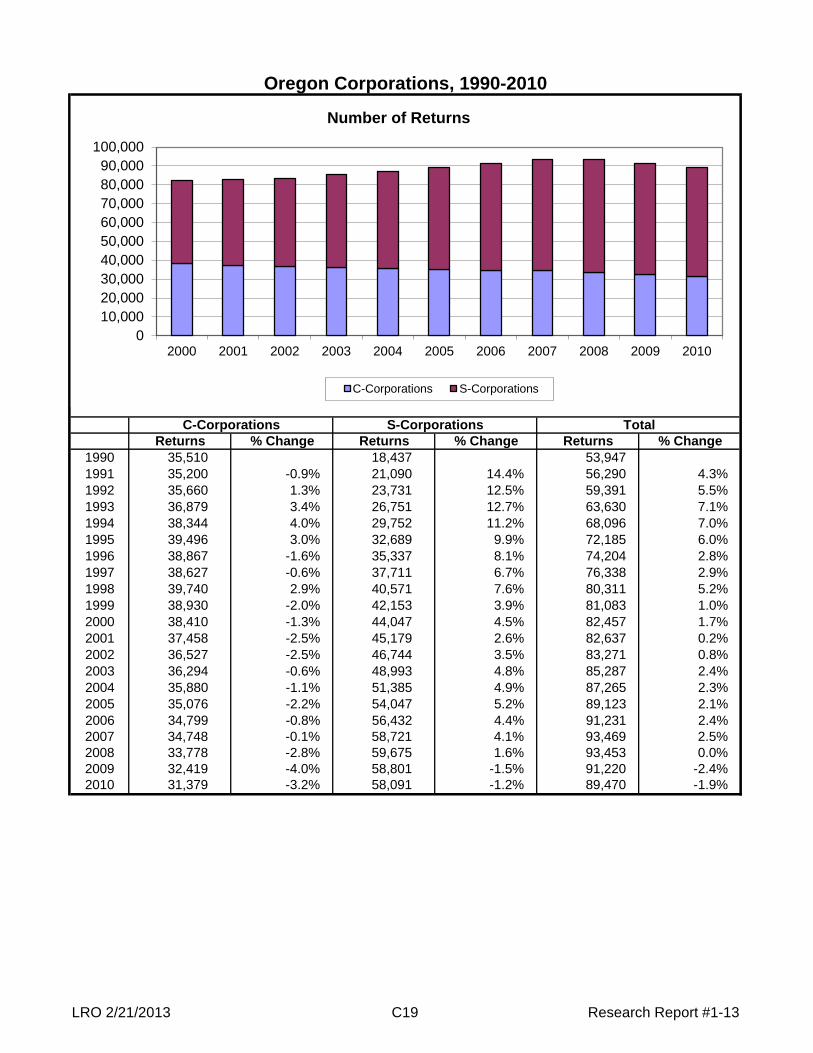
LRO 2/21/2013 C19 Research Report #1-13
Oregon Corporations, 1990-2010
Returns % Change Returns % Change Returns % Change1990 35,510 18,437 53,9471991 35,200 -0.9% 21,090 14.4% 56,290 4.3%1992 35,660 1.3% 23,731 12.5% 59,391 5.5%1993 36,879 3.4% 26,751 12.7% 63,630 7.1%1994 38,344 4.0% 29,752 11.2% 68,096 7.0%1995 39,496 3.0% 32,689 9.9% 72,185 6.0%1996 38,867 -1.6% 35,337 8.1% 74,204 2.8%1997 38,627 -0.6% 37,711 6.7% 76,338 2.9%1998 39,740 2.9% 40,571 7.6% 80,311 5.2%1999 38,930 -2.0% 42,153 3.9% 81,083 1.0%2000 38,410 -1.3% 44,047 4.5% 82,457 1.7%2001 37,458 -2.5% 45,179 2.6% 82,637 0.2%2002 36,527 -2.5% 46,744 3.5% 83,271 0.8%2003 36,294 -0.6% 48,993 4.8% 85,287 2.4%2004 35,880 -1.1% 51,385 4.9% 87,265 2.3%2005 35,076 -2.2% 54,047 5.2% 89,123 2.1%2006 34,799 -0.8% 56,432 4.4% 91,231 2.4%2007 34,748 -0.1% 58,721 4.1% 93,469 2.5%2008 33,778 -2.8% 59,675 1.6% 93,453 0.0%2009 32,419 -4.0% 58,801 -1.5% 91,220 -2.4%2010 31,379 -3.2% 58,091 -1.2% 89,470 -1.9%
C-Corporations S-Corporations Total
010,00020,00030,00040,00050,00060,00070,00080,00090,000
100,000
2000 2001 2002 2003 2004 2005 2006 2007 2008 2009 2010
Number of Returns
C-Corporations S-Corporations

LRO 2/21/2013 C20 Research Report #1-13
Corporation Filers by Industry, Tax Year 2010
Industry C-Corporations S-CorporationsAgriculture & Forestry 1,502 2,277Mining 95 95Utilities 65 42Construction 2,754 9,394Manufacturing 2,232 3,333Wholesale Trade 3,455 3,303Retail Trade 2,087 5,065Transportation & Warehousing 812 1,639Information 1010 1022Finance & Insurance 2,947 2,103Real Estate 1,845 3,931Professional, Scientific & Tech Services 3,706 8,502Management of Companies and Enterprises 1192 390Administration, Supply & Waste Management 1,128 2,792Education Services 220 533Health Care & Social Assistance 1,611 3,701Arts, Entertainment, & Recreation 368 916Accomodation & Food Services 813 3,713Other Services 1,818 2,803Unknown 1,719 2,537
Total 31,379 58,091
0 2,000 4,000 6,000 8,000 10,000 12,000 14,000
Agriculture & ForestryMiningUtilities
ConstructionManufacturing
Wholesale TradeRetail Trade
Transportation & WarehousingInformation
Finance & InsuranceReal Estate
Professional, Scientific & Tech ServicesManagement of Companies and Enterprises
Administration, Supply & Waste ManagementEducation Services
Health Care & Social AssistanceArts, Entertainment, & Recreation
Accomodation & Food ServicesOther Services
Number of Corporations C-Corporations
S-Corporations

LRO 2/21/2013 C21 Research Report #1-13
Corporation Net Tax by Industry, Tax Year 2010(Thousands of Dollars)
Industry C-Corporations S-CorporationsAgriculture & Forestry $6,178 $398Mining $694 $16Utilities $3,066 $6Construction $9,234 $1,434Manufacturing $48,317 $529Wholesale Trade $101,835 $902Retail Trade $50,858 $949Transportation & Warehousing $16,081 $244Information $20,623 $149Finance & Insurance $67,452 $331Real Estate $6,172 $600Professional, Scientific & Tech Services $12,511 $1,327Management of Companies and Enterprises $31,502 $57Administration, Supply & Waste Management $8,264 $433Education Services $1,853 $79Health Care & Social Assistance $7,453 $569Arts, Entertainment, & Recreation $856 $132Accomodation & Food Services $5,169 $561Other Services $10,292 $423Unknown $451 $358
Total $408,860 $9,498
$0 $20,000 $40,000 $60,000 $80,000 $100,000 $120,000
Agriculture & ForestryMiningUtilities
ConstructionManufacturing
Wholesale TradeRetail Trade
Transportation & WarehousingInformation
Finance & InsuranceReal Estate
Professional, Scientific & Tech ServicesManagement of Companies and Enterprises
Administration, Supply & Waste ManagementEducation Services
Health Care & Social AssistanceArts, Entertainment, & Recreation
Accomodation & Food ServicesOther Services
Thousands of Dollars
C-Corporations
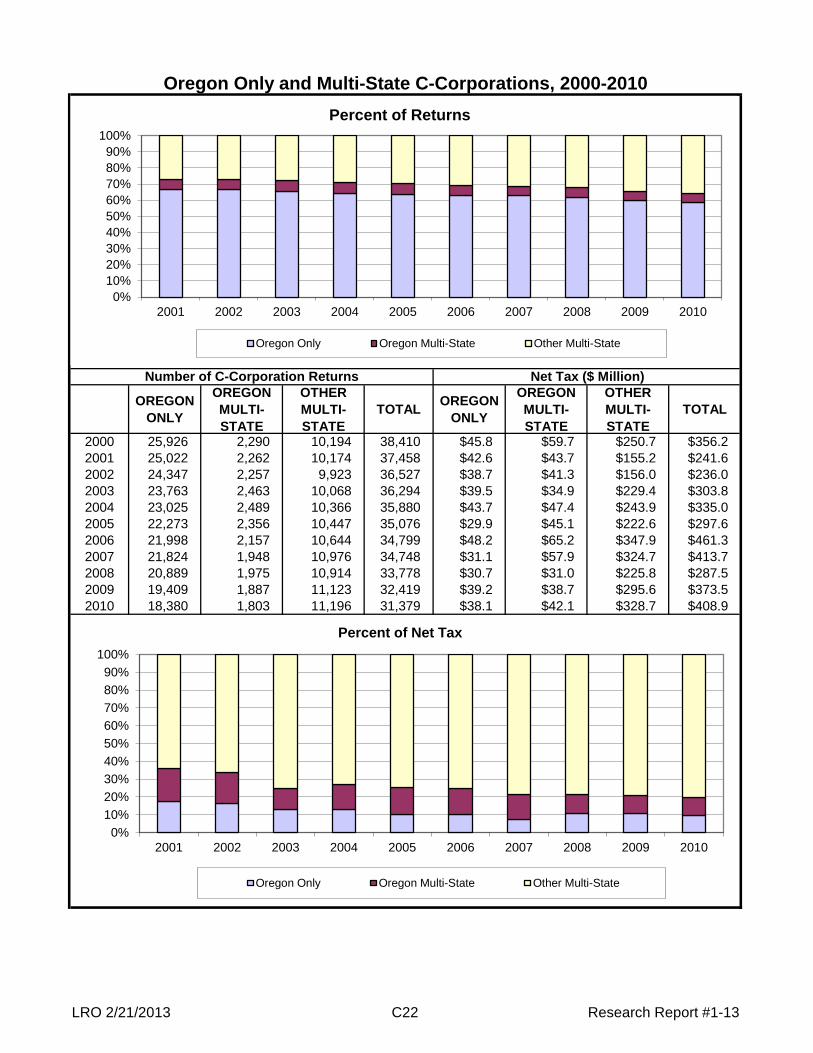
LRO 2/21/2013 C22 Research Report #1-13
Oregon Only and Multi-State C-Corporations, 2000-2010
OREGON ONLY
OREGON MULTI-STATE
OTHER MULTI-STATE
TOTAL OREGON ONLY
OREGON MULTI-STATE
OTHER MULTI-STATE
TOTAL
2000 25,926 2,290 10,194 38,410 $45.8 $59.7 $250.7 $356.22001 25,022 2,262 10,174 37,458 $42.6 $43.7 $155.2 $241.62002 24,347 2,257 9,923 36,527 $38.7 $41.3 $156.0 $236.02003 23,763 2,463 10,068 36,294 $39.5 $34.9 $229.4 $303.82004 23,025 2,489 10,366 35,880 $43.7 $47.4 $243.9 $335.02005 22,273 2,356 10,447 35,076 $29.9 $45.1 $222.6 $297.62006 21,998 2,157 10,644 34,799 $48.2 $65.2 $347.9 $461.32007 21,824 1,948 10,976 34,748 $31.1 $57.9 $324.7 $413.72008 20,889 1,975 10,914 33,778 $30.7 $31.0 $225.8 $287.52009 19,409 1,887 11,123 32,419 $39.2 $38.7 $295.6 $373.52010 18,380 1,803 11,196 31,379 $38.1 $42.1 $328.7 $408.9
Number of C-Corporation Returns Net Tax ($ Million)
0%10%20%30%40%50%60%70%80%90%
100%
2001 2002 2003 2004 2005 2006 2007 2008 2009 2010
Percent of Returns
Oregon Only Oregon Multi-State Other Multi-State
0%10%20%30%40%50%60%70%80%90%
100%
2001 2002 2003 2004 2005 2006 2007 2008 2009 2010
Percent of Net Tax
Oregon Only Oregon Multi-State Other Multi-State
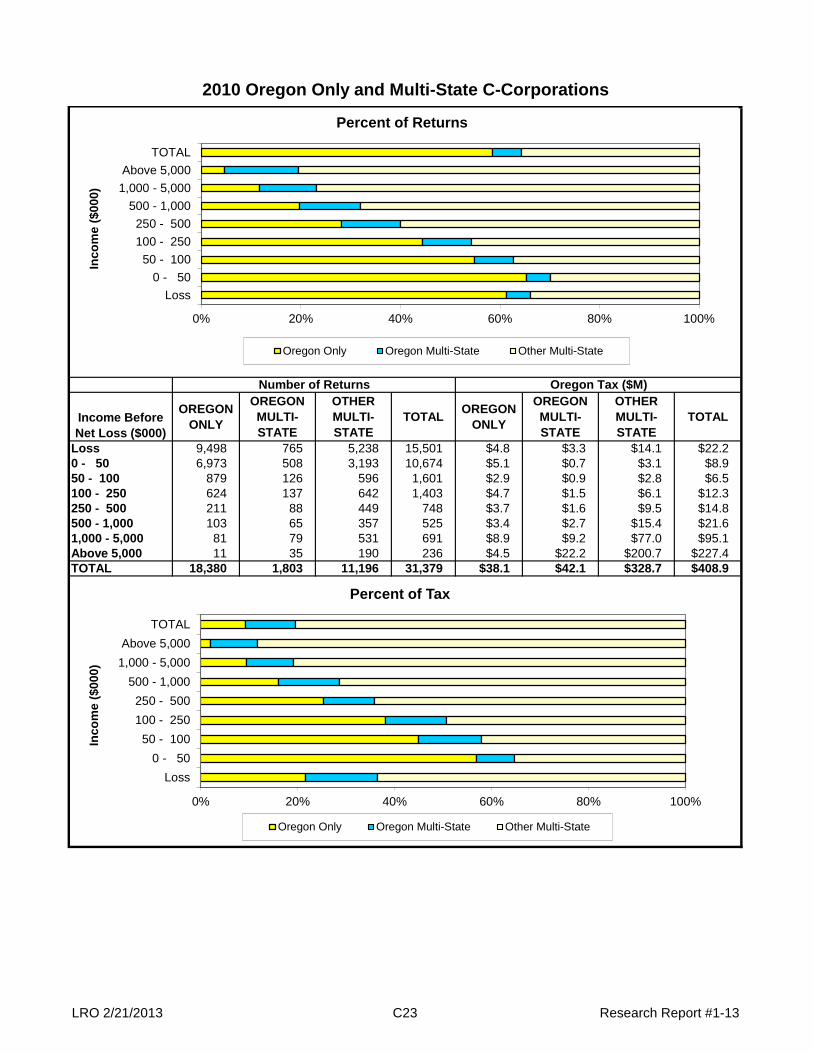
LRO 2/21/2013 C23 Research Report #1-13
2010 Oregon Only and Multi-State C-Corporations
Income Before Net Loss ($000)
OREGON ONLY
OREGON MULTI-STATE
OTHER MULTI-STATE
TOTAL OREGON ONLY
OREGON MULTI-STATE
OTHER MULTI-STATE
TOTAL
Loss 9,498 765 5,238 15,501 $4.8 $3.3 $14.1 $22.20 - 50 6,973 508 3,193 10,674 $5.1 $0.7 $3.1 $8.950 - 100 879 126 596 1,601 $2.9 $0.9 $2.8 $6.5100 - 250 624 137 642 1,403 $4.7 $1.5 $6.1 $12.3250 - 500 211 88 449 748 $3.7 $1.6 $9.5 $14.8500 - 1,000 103 65 357 525 $3.4 $2.7 $15.4 $21.61,000 - 5,000 81 79 531 691 $8.9 $9.2 $77.0 $95.1Above 5,000 11 35 190 236 $4.5 $22.2 $200.7 $227.4TOTAL 18,380 1,803 11,196 31,379 $38.1 $42.1 $328.7 $408.9
Number of Returns Oregon Tax ($M)
0% 20% 40% 60% 80% 100%
Loss0 - 50
50 - 100100 - 250250 - 500
500 - 1,0001,000 - 5,000Above 5,000
TOTAL
Inco
me
($00
0)
Percent of Returns
Oregon Only Oregon Multi-State Other Multi-State
0% 20% 40% 60% 80% 100%
Loss0 - 50
50 - 100100 - 250250 - 500
500 - 1,0001,000 - 5,000Above 5,000
TOTAL
Inco
me
($00
0)
Percent of Tax
Oregon Only Oregon Multi-State Other Multi-State

LRO 2/21/2013 C24 Research Report #1-13
C-Corporations Affected by the Minimum Tax or Tax RatesTax Year 2010
Minimum Tax Returns Net Tax Returns Net Tax Returns Net Tax< $500,000 $150 16,449 $2.5 3,469 $9.0 19,918 $11.4$500,000 to $1 Million $500 2,247 $1.1 911 $4.5 3,158 $5.6$1 to $2 Million $1,000 1,718 $1.7 875 $7.3 2,593 $9.0$2 to $3 Million $1,500 779 $1.2 422 $6.1 1,201 $7.2$3 to $5 Million $2,000 835 $1.7 507 $11.1 1,342 $12.8$5 to $7 Million $4,000 418 $1.7 292 $10.1 710 $11.8$7 to $10 Million $7,500 357 $2.7 224 $10.6 581 $13.3$10 to $25 Million $15,000 564 $8.5 387 $42.6 951 $51.1$25 to $50 Million $30,000 229 $6.8 201 $44.2 430 $51.1$50 to $75 Million $50,000 87 $4.4 80 $26.7 167 $31.0$75 to $100 Million $75,000 42 $3.2 37 $19.5 79 $22.7> $100 Million $100,000 120 $11.9 129 $169.9 249 $181.8
Total 23,845 $47.2 7,534 $361.7 31,379 $408.9
Returns Net Tax Returns Net Tax Returns Net Tax1,119 $0.9 383 $5.3 1,502 $6.2
76 $0.1 19 $0.6 95 $0.749 $0.4 16 $2.7 65 $3.1
2,285 $2.2 469 $7.1 2,754 $9.21,615 $6.7 617 $41.6 2,232 $48.32,333 $8.7 1,122 $93.2 3,455 $101.81,581 $4.8 506 $46.1 2,087 $50.9
591 $1.6 221 $14.4 812 $16.1812 $1.7 198 $18.9 1,010 $20.6
1,943 $6.8 1,004 $60.6 2,947 $67.51,448 $1.4 397 $4.8 1,845 $6.22,889 $2.1 817 $10.4 3,706 $12.5
833 $4.5 359 $27.0 1,192 $31.5848 $0.9 280 $7.4 1,128 $8.3164 $0.2 56 $1.7 220 $1.9
1,336 $2.3 275 $5.1 1,611 $7.5296 $0.3 72 $0.6 368 $0.9632 $0.6 181 $4.6 813 $5.2
1,493 $0.6 325 $9.7 1,818 $10.31,502 $0.3 217 $0.2 1,719 $0.5
Total 23,845 $47.2 7,534 $361.7 31,379 $408.9
Oregon SalesAffected by
the Minimum TaxAffected by
the Tax Rates All Returns
Industry SectorAffected by
the Minimum TaxAffected by
the Tax Rates All Returns
Professional, Scientific & Tech Services
Agriculture & ForestryMiningUtilitiesConstructionManufacturingWholesale TradeRetail TradeTransportation & WarehousingInformationFinance & InsuranceReal Estate
Other ServicesUnknown
Management of Companies and EnterprisesAdministration, Supply & Waste ManagementEducation ServicesHealth Care & Social AssistanceArts, Entertainment, & RecreationAccomodation & Food Services

LRO 2/21/2013 C25 Research Report #1-13
Corporations Paying More than the Minimum Tax*By Tax Category, Tax Year 2010
Tax Category ($)Number of
Returns Percent of Total Net Tax ($M) Percent of Total$0 - $150 366 4.9% $0.0 0.0%$151 - $500 1,090 14.5% $0.3 0.1%$501 - $1,000 835 11.1% $0.6 0.2%$1,001 - $1,500 608 8.1% $0.8 0.2%$1,501 - $2,000 391 5.2% $0.7 0.2%$2,001 - $4,000 1,134 15.1% $3.2 0.9%$4,001 - $7,500 812 10.8% $4.4 1.2%$7,501 - $15,000 630 8.4% $6.6 1.8%$15,001 - $30,000 466 6.2% $9.8 2.7%$30,001 - $50,000 298 4.0% $11.5 3.2%$50,001 - $75,000 181 2.4% $11.0 3.0%$75,001 - $100,000 120 1.6% $10.5 2.9%$100,000 - $500,000 471 6.3% $102.5 28.4%$500,000 - $1 Million 66 0.9% $45.5 12.6%Greater than $1 Million 66 0.9% $154.1 42.6%
Total 7,534 100.0% $361.7 100.0%
* In tax year 2008 the minimum tax was $10. Beginning in 2009, the minimum tax was increased to a value between $150 and $100,000 depending on the corporation's amount of Oregon sales. The minimum tax schedule is on Page C13.
0% 10% 20% 30% 40% 50%
$0 - $150$151 - $500
$501 - $1,000$1,001 - $1,500$1,501 - $2,000$2,001 - $4,000$4,001 - $7,500
$7,501 - $15,000$15,001 - $30,000$30,001 - $50,000$50,001 - $75,000
$75,001 - $100,000$100,000 - $500,000$500,000 - $1 Million
Greater than $1 Million
Percent of Total
Net
Tax
($)
C-Corporations Paying More Than the Minimum Tax
Net Tax ($M) Number of Returns

LRO 2/21/2013 C26 Research Report #1-13
Corporations Paying More than the Minimum Tax*By Sales Category, Tax Year 2010
Sales Category ($000)Number of
Returns Percent of Total Net Tax ($M) Percent of TotalLess or equal to $0 581 7.7% $4.0 1.1%$0 - $500 2,888 38.3% $5.0 1.4%$500 - $1,000 911 12.1% $4.5 1.2%$1,000 - $2,000 875 11.6% $7.3 2.0%$2,000 - $3,000 422 5.6% $6.1 1.7%$3,000 - $5,000 507 6.7% $11.1 3.1%$5,000 - $7,000 292 3.9% $10.1 2.8%$7,000 - $10,000 224 3.0% $10.6 2.9%$10,000 - $25,000 387 5.1% $42.6 11.8%$25,000 - $50,000 201 2.7% $44.2 12.2%$50,000 - $75,000 80 1.1% $26.7 7.4%$75,000 - $100,000 37 0.5% $19.5 5.4%Greater than $100,000 129 1.7% $169.9 47.0%
Total 7,534 100.0% $361.7 100.0%
* In tax year 2008 the minimum tax was $10. Beginning in 2009, the minimum tax was increased to a value between $150 and $100,000 depending on the corporation's amount of Oregon sales. The minimum tax schedule is on Page C13.
0% 10% 20% 30% 40% 50%
Less or equal to $0
$0 - $500
$500 - $1,000
$1,000 - $2,000
$2,000 - $3,000
$3,000 - $5,000
$5,000 - $7,000
$7,000 - $10,000
$10,000 - $25,000
$25,000 - $50,000
$50,000 - $75,000
$75,000 - $100,000
Greater than $100,000
Percent of Total
Ore
gon
Sale
s ($
000s
)
C-Corporations Paying More Than the Minimum Tax
Net Tax ($M) Number of Returns

LRO 2/21/2013 C27 Research Report #1-13
Oregon Tax Returns with Business Income, 2000-2010
2000 208,481 35,248 32,225 44,047 38,410 358,4112001 208,347 34,701 33,637 45,179 37,458 359,3222002 212,573 34,418 35,552 46,744 36,527 365,8142003 220,511 34,215 37,043 48,993 36,294 377,0562004 227,273 33,875 41,130 51,385 35,880 389,5432005 234,774 33,311 45,085 54,047 35,076 402,2932006 240,983 33,121 49,188 56,432 34,799 414,5232007 251,267 33,567 52,545 58,721 34,748 430,8482008 246,527 32,753 52,426 59,675 33,778 425,1592009 242,602 32,154 53,656 58,801 32,419 419,6322010 242,506 31,836 53,722 58,091 31,379 417,534
Number of Business Tax ReturnsTax Year Partnerships S-
CorporationsC-
Corporations TOTALSole Proprietors Farms
050,000
100,000150,000200,000250,000300,000350,000400,000450,000
2000 2001 2002 2003 2004 2005 2006 2007 2008 2009 2010
Number of Returns
Sole Proprietors Farms Partnerships S-Corporations C-Corporations
0%10%20%30%40%50%60%70%80%90%
100%
2000 2001 2002 2003 2004 2005 2006 2007 2008 2009 2010
Percent of Returns
Sole Proprietors Farms Partnerships S-Corporations C-Corporations
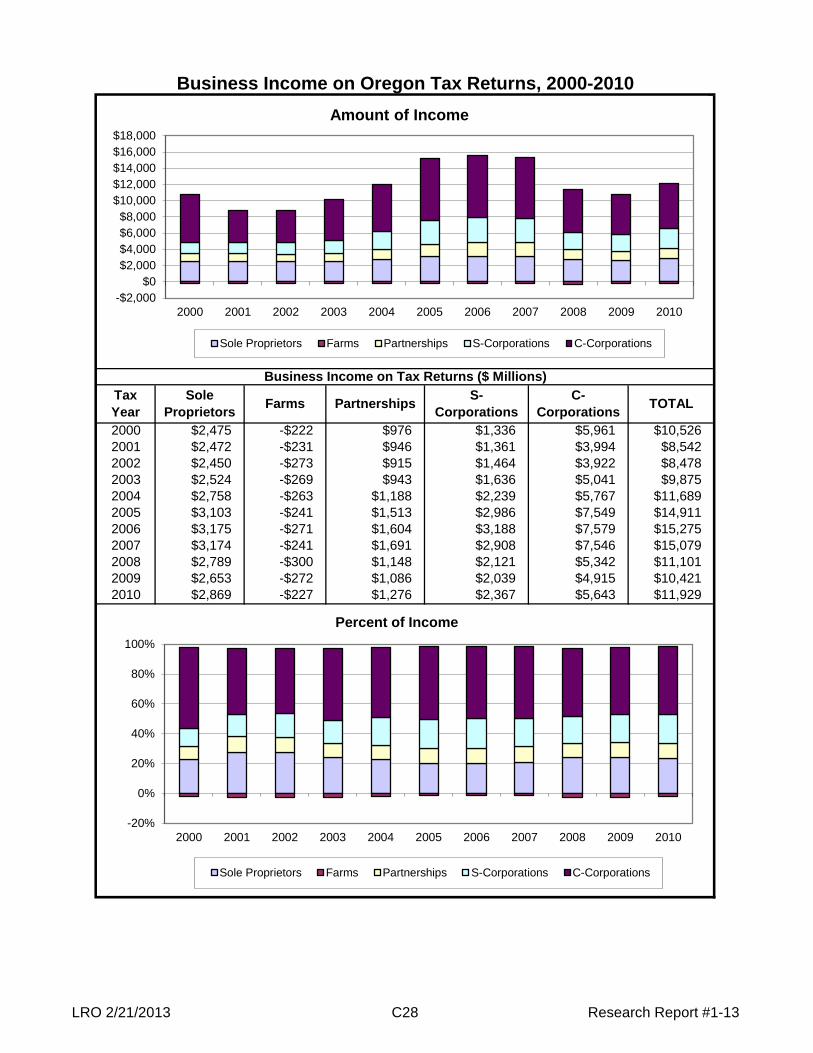
LRO 2/21/2013 C28 Research Report #1-13
Business Income on Oregon Tax Returns, 2000-2010
2000 $2,475 -$222 $976 $1,336 $5,961 $10,5262001 $2,472 -$231 $946 $1,361 $3,994 $8,5422002 $2,450 -$273 $915 $1,464 $3,922 $8,4782003 $2,524 -$269 $943 $1,636 $5,041 $9,8752004 $2,758 -$263 $1,188 $2,239 $5,767 $11,6892005 $3,103 -$241 $1,513 $2,986 $7,549 $14,9112006 $3,175 -$271 $1,604 $3,188 $7,579 $15,2752007 $3,174 -$241 $1,691 $2,908 $7,546 $15,0792008 $2,789 -$300 $1,148 $2,121 $5,342 $11,1012009 $2,653 -$272 $1,086 $2,039 $4,915 $10,4212010 $2,869 -$227 $1,276 $2,367 $5,643 $11,929
Business Income on Tax Returns ($ Millions)Tax Year Partnerships S-
CorporationsC-
Corporations TOTALSole Proprietors Farms
-$2,000$0
$2,000$4,000$6,000$8,000
$10,000$12,000$14,000$16,000$18,000
2000 2001 2002 2003 2004 2005 2006 2007 2008 2009 2010
Amount of Income
Sole Proprietors Farms Partnerships S-Corporations C-Corporations
-20%
0%
20%
40%
60%
80%
100%
2000 2001 2002 2003 2004 2005 2006 2007 2008 2009 2010
Percent of Income
Sole Proprietors Farms Partnerships S-Corporations C-Corporations
LRO 2/21/2013 D1 Research Report # 1-13
PROPERTY TAX The property tax in Oregon is a local tax. It funds most of the local services and many functions of county and city governments. Large portions of school districts’ and community college budgets also depend on property tax receipts. Taxable property includes real property, mobile homes and some tangible personal property used by business. Prior to the passage of property tax limitation Measure 50, property tax was generally based on its real market value. Since 1997-98 each property has a real market as well as an assessed value. Property value assessment and taxation is conducted at the county level, except for large industrial properties and "centrally" assessed utilities, where Oregon Department of Revenue plays a major role. Property tax rates differ across the state. The rate on any particular property depends on the tax rates approved by local voters and the limits established in the Oregon Constitution. Most properties are taxed by multiple districts, such as a city, county, school, community college, port and fire. The total tax rate on a particular property is figured by adding all the local taxing districts’ rates in the area. The tax on each property is computed by multiplying the total tax rate by the assessed value of the property. Annually, the county assessor verifies the tax rates and levies submitted by each local taxing district. Collection of taxes and distribution of the funds to local districts are done by the county tax collector. In 2011-12, the total Real Market Value (RMV) of taxable property in Oregon was $434.4 billion. RMV decreased 5% over 2010-11. Net Assessed Values of $312.7 billion reflect a 2.4% increase over 2010-11. Excluding $182.2 million in taxes imposed for Urban Renewal, the taxing districts imposed property taxes of $4.924 billion in 2011-12. This reflects an overall 1.7% growth rate over the prior year.
Exemptions Not all properties are taxable. Major exemptions include intangible property (stocks, bonds), tangible personal property of individuals (household furnishings, sporting equipment), licensed property (cars, trucks), business inventories, government property (unless leased), and property used for religious or charitable purposes. Electric cooperatives, rural telephone exchanges and some other property are exempt from property taxation because other taxes are paid in lieu of property tax. Some properties are taxed at lower values. These “specially assessed” properties include some forest land, farm land, and open space land. These properties are taxed at their values in the restricted use and are subject to penalties if not continued in the use for which it is specially assessed.
Limitations Measure 5 Measure 5 is a tax limitation constitutional amendment approved by Oregon voters in 1990. It restricted taxes on any parcel of property per $1,000 of real market value: the education category is limited to $5 and general government to $10. Tax compression occurs if the tax extended on a property exceeds either of Measure 5 limits. That is, if taxes for an individual property exceed the limits, then the taxes for that property are reduced to the limits. General obligation bonds are not restricted by Measure 5 limits.

LRO 2/21/2013 D2 Research Report # 1-13
Measure 50 In May 1997 voters passed a second constitutional amendment to limit property tax. Measure 50 did not replace Measure 5, but rather established a second level of restrictions. Measure 50 gave each district a permanent tax rate which can not be increased without a constitutional amendment. However, voters can approve local option levies for up to five years for operations, and up to the lesser of ten years or the useful life of capital projects. Those local option levies as well as two other types of levies, GAP1 and urban renewal, are subject to Measure 5 tax limits. Local option levies, as well as general obligation bonds, must be approved by a majority vote at a general election. Prior to November 2007, a double majority (i.e., a majority of at least 50% of eligible voters) was needed to approve either a local option tax or a general obligation bond proposal. Measure 50 also defined the concept of Assessed Value (AV). The 1997-98 Maximum Assessed Value (MAV) for each property is 90% of its 1995-96 real market value (RMV). If no new construction occurs on the property, then the growth in assessed value is capped at 3% a year. However, assessed value can not exceed real market value. The ratio of MAV to RMV is known as the Changed Property Ratio (CPR). Across all taxing districts, the CPR declined statewide from 64.6% in 2006-07 to 55.8% in 2007-08. A decline in RMV related to the recession’s impact on personal and business property values resulted in the CPR leveling off to 56.2% in 2008-09 and rising to 61.7% in 2009-10 and again to 68.8% in 2010-112. This trend continued in 2011-12 as the CPR rose again to 74.4%. Previously, the changes reflected the high appreciation rates in the real market values of housing that occurred in many areas of Oregon in the past several years, relative to 3% constitutionally capped growth rate in AV. The table below breaks down 2011-12 property taxes by type of taxing district and tax source. Excluding revenues of urban renewal districts, the largest portion of any district’s property tax revenue comes from its permanent rate. Taxes from this source totaling $3.832 billion in 2011-12 accounted for 75.1% of all taxes imposed. The 2011-12 tax revenue attributable to the permanent rate registered an annual growth rate of 2.1%. Community college districts, K-12 districts and special taxing districts increased their revenues from all sources over the prior year by 1.3%, 2.4%, and 0.1%, respectively. County taxing districts and Education Service Districts (ESDs) grew total revenues over the prior year by 1.5% and 2.3%, respectively. General obligation bond revenue in 2011-12 totaled $695.9 million or 14.1 % of all taxes listed in the table below, excluding the taxes that are reported for urban renewal. Across all taxing districts these revenues increased 14.7% in 2009-10 relative to 2008-09, with 62.7% of the total accounted for by K-12 taxing districts. In 2011-12, these revenues only increased by 0.4% from 2010-11 levels. Historically these funds have been an important source of revenue for the K-12 taxing districts. After falling for a while, bond revenue for the K-12 taxing districts started increasing again in 2006-07. In 2011-12, K-12 bond revenue increased by 2.7%. Since the timing of bond maturities affects the level of bond revenues in any one year, one or more years of data is needed to determine a significant trend. Bond revenues for community colleges increased by 0.9% over the prior year, resuming the increasing trend in the recent past after modest declines in 2007-08. Bond revenues for cities increased 9.1% from a year ago. In 2011-12, county taxing district’s bonds decreased 8.1% and special district’s bond revenues decreased 15.6% from 2010-11.
1 Principles and interest obligations of districts that are paid for with operating revenues rather than with the proceeds of a bond levy. 2 Source: Research Section at Oregon Department of Revenue. Changed Property Ratio (CPR) is the ratio of average maximum assessed value to average real market value.
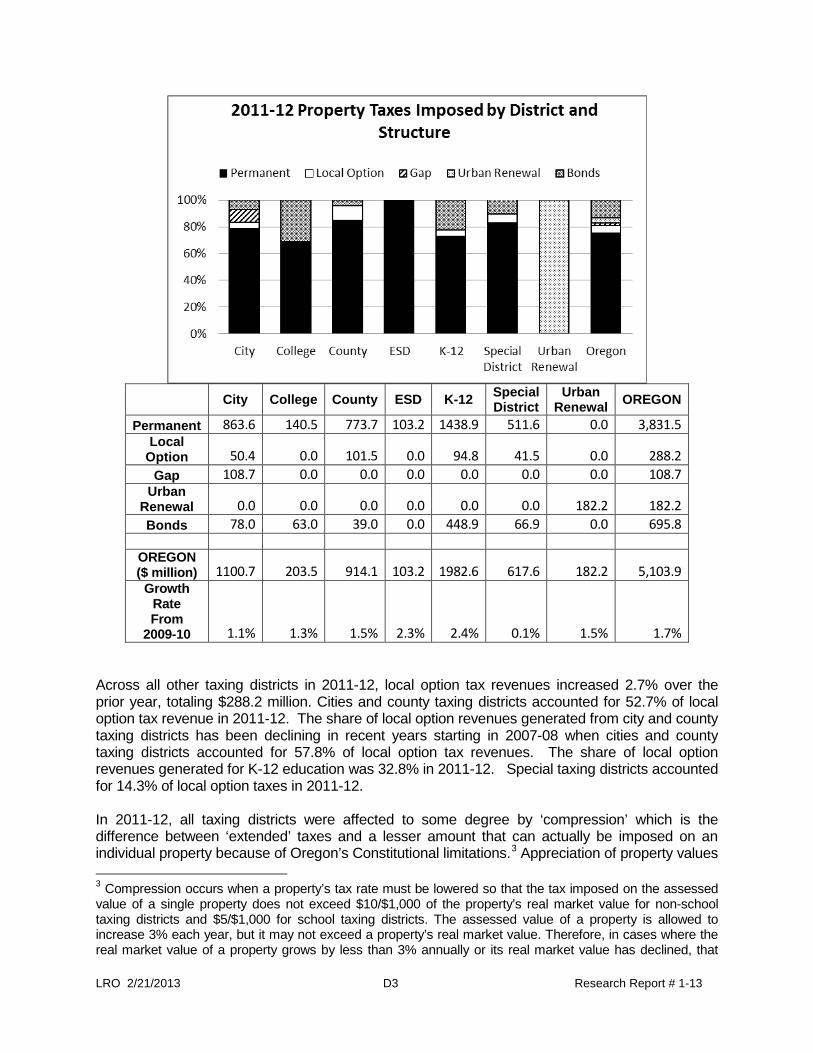
LRO 2/21/2013 D3 Research Report # 1-13
City College County ESD K-12 Special District
Urban Renewal OREGON
Permanent 863.6 140.5 773.7 103.2 1438.9 511.6 0.0 3,831.5 Local
Option 50.4 0.0 101.5 0.0 94.8 41.5 0.0 288.2 Gap 108.7 0.0 0.0 0.0 0.0 0.0 0.0 108.7
Urban Renewal 0.0 0.0 0.0 0.0 0.0 0.0 182.2 182.2 Bonds 78.0 63.0 39.0 0.0 448.9 66.9 0.0 695.8
OREGON ($ million) 1100.7 203.5 914.1 103.2 1982.6 617.6 182.2 5,103.9
Growth Rate From
2009-10 1.1% 1.3% 1.5% 2.3% 2.4% 0.1% 1.5% 1.7% Across all other taxing districts in 2011-12, local option tax revenues increased 2.7% over the prior year, totaling $288.2 million. Cities and county taxing districts accounted for 52.7% of local option tax revenue in 2011-12. The share of local option revenues generated from city and county taxing districts has been declining in recent years starting in 2007-08 when cities and county taxing districts accounted for 57.8% of local option tax revenues. The share of local option revenues generated for K-12 education was 32.8% in 2011-12. Special taxing districts accounted for 14.3% of local option taxes in 2011-12. In 2011-12, all taxing districts were affected to some degree by ‘compression’ which is the difference between ‘extended’ taxes and a lesser amount that can actually be imposed on an individual property because of Oregon’s Constitutional limitations.3 Appreciation of property values 3 Compression occurs when a property’s tax rate must be lowered so that the tax imposed on the assessed value of a single property does not exceed $10/$1,000 of the property’s real market value for non-school taxing districts and $5/$1,000 for school taxing districts. The assessed value of a property is allowed to increase 3% each year, but it may not exceed a property’s real market value. Therefore, in cases where the real market value of a property grows by less than 3% annually or its real market value has declined, that

LRO 2/21/2013 D4 Research Report # 1-13
during Oregon’s recent housing market boom helped lower compression losses statewide and the subsequent recession increased them again. Compression losses were $52.2 million in 2005-06, $48.8 million in 2006-07, $53.0 million in 2007-08, $51.1 million in 2008-09, increasing to $143.9 million by 2011-12. Regional disparities persist with respect to the importance of compression, as measured by the dollar value of the compression loss relative to the amount of tax imposed. In 2011-12 compression loss statewide totaled 2.9% of the taxes imposed. 55.9% (totaling $80.5 million) of total loss occurred in Multnomah County. In other counties, the dollar value of compression loss was lower; but in relative terms, loss in some counties was much more significant. For example, in Morrow County, the compression loss totaled $1.9 million but it accounted for 8.4% of this county’s property tax revenue. The fiscal significance of compression loss also varies across taxing districts. For example, for all taxing districts that provided services in Lane County, compression losses totaled $10.8 million, or 2.7% of the $397.0 million in property taxes that were imposed in 2011-12. The county’s maximum rate authority that is substantially lower than most other county taxing districts was enacted constitutionally at a time when Lane County received over half of its operating revenue from federal forest payments. These federal forest payments have been declining in recent years and the future is uncertain. This means that counties benefitting from these federal timber payments will have to find alternative sources of revenue or reduce funding for current programs and services. Compression may be a significant issue for the recipients of federal forest payments because it may restrict these districts’ ability to offset some portion of the lost federal revenue by raising their revenues from a voter approved local option property tax.
property’s tax rate may have to be reduced (i.e., compressed) in order to satisfy the $5/$1,000 or $10/$1,000 requirements.
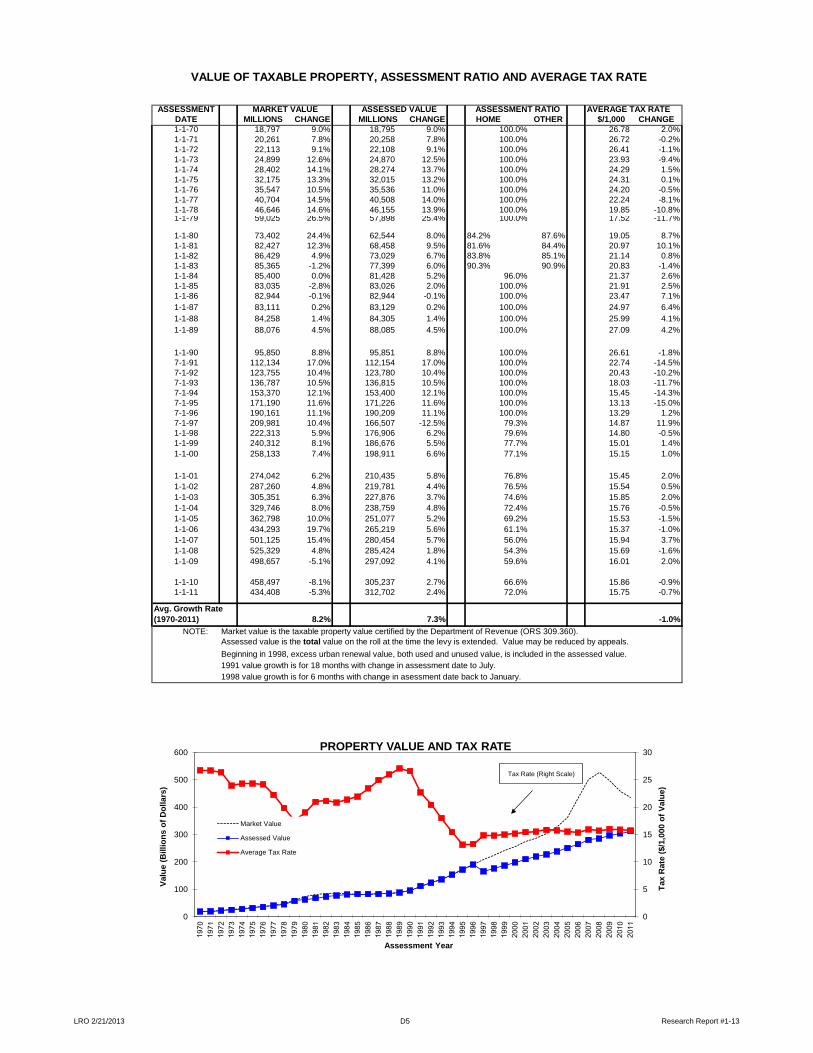
LRO 2/21/2013 D5 Research Report #1-13
VALUE OF TAXABLE PROPERTY, ASSESSMENT RATIO AND AVERAGE TAX RATE
ASSESSMENT MARKET VALUE ASSESSED VALUE ASSESSMENT RATIO AVERAGE TAX RATEDATE MILLIONS CHANGE MILLIONS CHANGE HOME OTHER $/1,000 CHANGE1-1-70 18,797 9.0% 18,795 9.0% 100.0% 26.78 2.0%1-1-71 20,261 7.8% 20,258 7.8% 100.0% 26.72 -0.2%1-1-72 22,113 9.1% 22,108 9.1% 100.0% 26.41 -1.1%1-1-73 24,899 12.6% 24,870 12.5% 100.0% 23.93 -9.4%1-1-74 28,402 14.1% 28,274 13.7% 100.0% 24.29 1.5%1-1-75 32,175 13.3% 32,015 13.2% 100.0% 24.31 0.1%1-1-76 35,547 10.5% 35,536 11.0% 100.0% 24.20 -0.5%1-1-77 40,704 14.5% 40,508 14.0% 100.0% 22.24 -8.1%1-1-78 46,646 14.6% 46,155 13.9% 100.0% 19.85 -10.8%1-1-79 59,025 26.5% 57,898 25.4% 100.0% 17.52 -11.7%
1-1-80 73,402 24.4% 62,544 8.0% 84.2% 87.6% 19.05 8.7%1-1-81 82,427 12.3% 68,458 9.5% 81.6% 84.4% 20.97 10.1%1-1-82 86,429 4.9% 73,029 6.7% 83.8% 85.1% 21.14 0.8%1-1-83 85,365 -1.2% 77,399 6.0% 90.3% 90.9% 20.83 -1.4%1-1-84 85,400 0.0% 81,428 5.2% 96.0% 21.37 2.6%1-1-85 83,035 -2.8% 83,026 2.0% 100.0% 21.91 2.5%1-1-86 82,944 -0.1% 82,944 -0.1% 100.0% 23.47 7.1%1-1-87 83,111 0.2% 83,129 0.2% 100.0% 24.97 6.4%1-1-88 84,258 1.4% 84,305 1.4% 100.0% 25.99 4.1%1-1-89 88,076 4.5% 88,085 4.5% 100.0% 27.09 4.2%
1-1-90 95,850 8.8% 95,851 8.8% 100.0% 26.61 -1.8%7-1-91 112,134 17.0% 112,154 17.0% 100.0% 22.74 -14.5%7-1-92 123,755 10.4% 123,780 10.4% 100.0% 20.43 -10.2%7-1-93 136,787 10.5% 136,815 10.5% 100.0% 18.03 -11.7%7-1-94 153,370 12.1% 153,400 12.1% 100.0% 15.45 -14.3%7-1-95 171,190 11.6% 171,226 11.6% 100.0% 13.13 -15.0%7-1-96 190,161 11.1% 190,209 11.1% 100.0% 13.29 1.2%7-1-97 209,981 10.4% 166,507 -12.5% 79.3% 14.87 11.9%1-1-98 222,313 5.9% 176,906 6.2% 79.6% 14.80 -0.5%1-1-99 240,312 8.1% 186,676 5.5% 77.7% 15.01 1.4%1-1-00 258,133 7.4% 198,911 6.6% 77.1% 15.15 1.0%
1-1-01 274,042 6.2% 210,435 5.8% 76.8% 15.45 2.0%1-1-02 287,260 4.8% 219,781 4.4% 76.5% 15.54 0.5%1-1-03 305,351 6.3% 227,876 3.7% 74.6% 15.85 2.0%1-1-04 329,746 8.0% 238,759 4.8% 72.4% 15.76 -0.5%1-1-05 362,798 10.0% 251,077 5.2% 69.2% 15.53 -1.5%1-1-06 434,293 19.7% 265,219 5.6% 61.1% 15.37 -1.0%1-1-07 501,125 15.4% 280,454 5.7% 56.0% 15.94 3.7%1-1-08 525,329 4.8% 285,424 1.8% 54.3% 15.69 -1.6%1-1-09 498,657 -5.1% 297,092 4.1% 59.6% 16.01 2.0%
1-1-10 458,497 -8.1% 305,237 2.7% 66.6% 15.86 -0.9%1-1-11 434,408 -5.3% 312,702 2.4% 72.0% 15.75 -0.7%
Avg. Growth Rate(1970-2011) 8.2% 7.3% -1.0% NOTE: Market value is the taxable property value certified by the Department of Revenue (ORS 309.360).
Assessed value is the total value on the roll at the time the levy is extended. Value may be reduced by appeals.Beginning in 1998, excess urban renewal value, both used and unused value, is included in the assessed value. 1991 value growth is for 18 months with change in assessment date to July.1998 value growth is for 6 months with change in asessment date back to January.
0
5
10
15
20
25
30
0
100
200
300
400
500
600
Tax
Rat
e ($
/1,0
00 o
f Val
ue)
Valu
e (B
illio
ns o
f Dol
lars
)
Assessment Year
PROPERTY VALUE AND TAX RATE
Market Value
Assessed Value
Average Tax Rate
Tax Rate (Right Scale)

LRO 2/21/2013 D6 Research Report #1-13
COUNTY 2010-11 2011-12 CHANGE 2010-11 2011-12 CHANGE 2010-11 2011-12 CHANGE
BAKER 1,554,593 1,558,034 0.2% 1,176,846 1,207,122 2.6% 75.70% 77.48% 2.3%BENTON 9,397,695 9,359,969 -0.4% 6,635,948 6,838,286 3.0% 70.61% 73.06% 3.5%CLACKAMAS 48,903,532 45,749,214 -6.5% 37,066,413 38,024,532 2.6% 75.79% 83.12% 9.7%CLATSOP 8,135,360 7,711,781 -5.2% 5,010,818 5,136,453 2.5% 61.59% 66.61% 8.1%COLUMBIA 5,478,626 4,842,863 -11.6% 4,082,276 4,055,309 -0.7% 74.51% 83.74% 12.4%COOS 6,420,316 6,314,089 -1.7% 4,467,849 4,586,912 2.7% 69.59% 72.65% 4.4%
CROOK 2,085,499 1,760,256 -15.6% 1,638,537 1,541,856 -5.9% 78.57% 87.59% 11.5%CURRY 3,354,983 3,201,149 -4.6% 2,495,410 2,566,391 2.8% 74.38% 80.17% 7.8%DESCHUTES 23,496,169 21,550,552 -8.3% 17,740,724 17,626,168 -0.6% 75.50% 81.79% 8.3%DOUGLAS 10,497,292 10,031,513 -4.4% 7,538,418 7,734,493 2.6% 71.81% 77.10% 7.4%GILLIAM 1,146,228 1,833,204 59.9% 859,119 1,004,908 17.0% 74.95% 54.82% -26.9%GRANT 646,984 642,456 -0.7% 450,551 469,213 4.1% 69.64% 73.03% 4.9%
HARNEY 683,456 689,523 0.9% 441,946 447,152 1.2% 64.66% 64.85% 0.3%HOOD RIVER 3,302,842 3,049,177 -7.7% 1,817,954 1,909,778 5.1% 55.04% 62.63% 13.8%JACKSON 23,184,044 21,316,602 -8.1% 16,236,519 16,434,483 1.2% 70.03% 77.10% 10.1%JEFFERSON 2,113,220 1,946,681 -7.9% 1,438,746 1,434,147 -0.3% 68.08% 73.67% 8.2%JOSEPHINE 8,444,284 7,572,667 -10.3% 6,085,181 6,181,069 1.6% 72.06% 81.62% 13.3%KLAMATH 7,647,374 6,932,245 -9.4% 4,931,356 5,175,727 5.0% 64.48% 74.66% 15.8%
LAKE 846,880 1,103,480 30.3% 520,698 827,184 58.9% 61.48% 74.96% 21.9%LANE 38,485,868 37,625,082 -2.2% 26,014,130 26,679,797 2.6% 67.59% 70.91% 4.9%LINCOLN 9,694,334 9,001,784 -7.1% 6,431,680 6,578,618 2.3% 66.34% 73.08% LINN 10,617,039 10,076,482 -5.1% 7,869,306 8,007,344 1.8% 74.12% 79.47% 7.2%MALHEUR 2,081,903 1,979,886 -4.9% 1,610,270 1,637,469 1.7% 77.35% 82.71% 6.9%MARION 26,814,987 25,452,994 -5.1% 19,625,532 20,053,037 2.2% 73.19% 78.78% 7.6%
MORROW 1,680,522 1,772,706 5.5% 1,332,893 1,423,418 6.8% 79.31% 80.30% 1.2%MULTNOMAH 101,607,598 95,390,151 -6.1% 60,994,476 62,660,378 2.7% 60.03% 65.69% 9.4%POLK 6,204,554 5,931,574 -4.4% 4,625,539 4,738,116 2.4% 74.55% 79.88% 7.1%SHERMAN 505,199 483,848 -4.2% 401,487 410,125 2.2% 79.47% 84.76% 6.7%TILLAMOOK 5,990,809 5,642,695 -5.8% 3,897,063 4,025,757 3.3% 65.05% 71.34% 9.7%UMATILLA 5,806,584 5,823,366 0.3% 4,446,818 4,541,778 2.1% 76.58% 77.99% 1.8%
UNION 2,088,875 2,100,910 0.6% 1,474,291 1,530,869 3.8% 70.58% 72.87% 3.2%WALLOWA 1,123,265 1,057,263 -5.9% 632,144 648,079 2.5% 56.28% 61.30% 8.9%WASCO 2,655,477 2,767,517 4.2% 1,806,770 1,865,739 3.3% 68.04% 67.42% -0.9%WASHINGTON 65,313,657 62,768,036 -3.9% 46,801,868 48,236,782 3.1% 71.66% 76.85% 7.2%WHEELER 280,163 178,584 -36.3% 105,285 108,541 3.1% 37.58% 60.78% 61.7%YAMHILL 10,206,295 9,189,327 -10.0% 6,744,125 6,826,462 1.2% 66.08% 74.29% 12.4%
OREGON 458,496,506 434,407,657 -5.3% 315,448,986 323,173,492 2.4% 68.80% 74.39% 8.1%
TOTAL ASSESSED (AV) AND REAL MARKET (RMV) VALUES AND CHANGED PROPERTY RATIOS (CPR)
TOTAL RMV ($000s) TOTAL AV ($000s) RATIO - AV/RMV (CPR)

LRO 2/21/2013 D7 Research Report #1-13
--- NET ASSESSED VALUE ($000s) --- -- AVERAGE TAX RATE --COUNTY 2010-11 2011-12 CHANGE 2010-11 2011-12 CHANGE
BAKER 1,177,057 1,207,339 2.57% 13.58 13.45 -0.96%BENTON 6,610,232 6,811,922 3.05% 16.01 16.21 1.25%CLACKAMAS 35,407,974 36,362,511 2.70% 16.29 16.23 -0.37%CLATSOP 4,854,475 4,974,849 2.48% 12.81 12.66 -1.17%COLUMBIA 4,022,786 4,042,161 0.48% 13.68 13.21 -3.44%COOS 4,276,479 4,386,230 2.57% 12.66 12.62 -0.32%
CROOK 1,638,537 1,541,856 -5.90% 13.90 13.79 -0.79%CURRY 2,450,240 2,518,284 2.78% 8.90 8.73 -1.91%DESCHUTES 17,467,969 17,344,951 -0.70% 15.14 15 -0.92%DOUGLAS 7,322,895 7,514,159 2.61% 11.40 11.34 -0.53%GILLIAM 861,592 1,007,455 16.93% 11.83 11.74 -0.76%GRANT 450,998 469,662 4.14% 15.05 14.42 -4.19%
HARNEY 441,946 447,152 1.18% 14.33 14.23 -0.70%HOOD RIVER 1,754,495 1,830,667 4.34% 13.91 14.26 2.52%JACKSON 15,981,129 16,178,756 1.24% 14.28 14.1 -1.26%JEFFERSON 1,416,498 1,410,911 -0.39% 16.61 16.43 -1.08%JOSEPHINE 6,086,991 6,182,933 1.58% 9.53 9.46 -0.73%KLAMATH 4,880,372 5,124,383 5.00% 10.99 10.59 -3.64%
LAKE 521,821 828,340 58.74% 13.47 12.81 -4.90%LANE 25,732,287 26,386,153 2.54% 15.28 15.04 -1.57%LINCOLN 6,012,532 6,206,795 3.23% 13.62 13.66 0.29%LINN 7,657,389 7,701,081 0.57% 16.04 15.93 -0.69%MALHEUR 1,611,271 1,638,499 1.69% 13.84 13.76 -0.58%MARION 18,797,852 19,196,147 2.12% 15.99 16.14 0.94%
MORROW 1,332,614 1,423,030 6.78% 16.10 16.15 0.31%MULTNOMAH 55,987,408 57,541,485 2.78% 19.57 19.35 -1.12%POLK 4,546,961 4,653,358 2.34% 15.01 15.17 1.07%SHERMAN 401,515 410,153 2.15% 16.19 16.08 -0.68%TILLAMOOK 3,872,493 3,998,532 3.25% 11.06 11.07 0.09%UMATILLA 4,388,392 4,476,221 2.00% 15.95 16.25 1.88%
UNION 1,445,298 1,480,818 2.46% 13.07 12.99 -0.61%WALLOWA 632,710 648,654 2.52% 12.34 12.2 -1.13%WASCO 1,742,795 1,804,541 3.54% 17.51 17.56 0.29%WASHINGTON 46,603,239 48,018,884 3.04% 16.63 16.49 -0.84%WHEELER 106,090 109,369 3.09% 17.41 17.32 -0.52%YAMHILL 6,741,783 6,823,878 1.22% 15.15 14.86 -1.91%TOTAL 305,237,113 312,702,119 2.45% 15.86 15.75 -0.69%URBAN RENEWAL 10,297,423 10,557,906 2.53% 17.44 17.25 -1.07%OREGON 315,534,536 323,260,025 2.45% 15.91 15.80 -0.70%Net Assessed Value is equal to Total Roll Value + Nonprofit Housing + Fish&Wildlife Value - UR Excess Value. UR Assessed Value includes the used Excess Value only.
NET ASSESSED VALUE AND AVERAGE TAX RATE

LRO 2/21/2013 D8 Research Report #1-13
COUNTIES CITIES SCHOOLS COMMUNITY OTHERTOTAL AND E.S.D.S COLLEGES DISTRICTS
YEAR LEVIES % LEVIES % LEVIES % LEVIES % LEVIES % LEVIES %1970-71 503.2 11.1% 51.3 3.4% 69.4 10.5% 341.4 11.1% 18.9 32.2% 22.2 18.1%1971-72 541.3 7.6% 56.5 10.1% 71.1 2.4% 364.5 6.8% 21.0 11.1% 28.2 27.0%1972-73 583.9 7.9% 58.4 3.4% 75.2 5.8% 394.6 8.3% 22.8 8.6% 32.9 16.7%1973-74 595.3 2.0% 61.1 4.6% 81.0 7.7% 394.4 -0.1% 24.2 6.1% 34.6 5.2%1974-75 687.1 15.4% 65.8 7.7% 91.8 13.3% 458.9 16.4% 28.2 16.5% 42.4 22.5%1975-76 778.5 13.3% 71.2 8.2% 103.1 12.3% 521.3 13.6% 33.3 18.1% 49.6 17.0%1976-77 860.0 10.5% 79.4 11.5% 115.6 12.1% 567.8 8.9% 36.1 8.4% 61.1 23.2%1977-78 901.0 4.8% 85.7 7.9% 124.4 7.6% 577.2 1.7% 39.9 10.5% 73.8 20.8%1978-79 916.0 1.7% 88.1 2.8% 132.0 6.1% 575.8 -0.2% 40.9 2.5% 79.2 7.3%1979-80 1,014.4 10.7% 94.3 7.0% 152.7 15.7% 636.2 10.5% 47.8 16.9% 83.4 5.3%
1980-81 1,191.3 17.4% 107.6 14.1% 183.9 20.4% 743.5 16.9% 56.2 17.6% 100.1 20.0%1981-82 1,435.6 20.5% 150.1 39.5% 206.7 12.4% 889.5 19.6% 64.8 15.3% 124.5 24.4%1982-83 1,543.6 7.5% 159.2 6.1% 220.4 6.6% 958.8 7.8% 70.6 9.0% 134.6 8.1%1983-84 1,612.3 4.5% 149.0 -6.4% 233.4 5.9% 1,010.1 5.4% 73.9 4.7% 145.9 8.4%1984-85 1,740.0 7.9% 163.7 9.9% 251.6 7.8% 1,081.8 7.1% 79.5 7.6% 163.4 12.0%1985-86 1,819.2 4.6% 173.3 5.9% 267.6 6.4% 1,139.2 5.3% 82.0 3.1% 157.1 -3.9%1986-87 1,946.5 7.0% 198.6 14.6% 289.0 8.0% 1,199.0 5.2% 92.9 13.3% 167.0 6.3%1987-88 2,072.9 6.5% 223.9 12.7% 309.9 7.2% 1,269.2 5.9% 97.0 4.4% 172.9 3.5%1988-89 2,223.7 7.3% 243.1 8.6% 318.5 2.8% 1,368.8 7.8% 106.0 9.3% 187.3 8.3%1989-90 2,386.0 7.3% 248.3 2.1% 359.9 13.0% 1,475.2 7.8% 109.2 3.0% 193.4 3.3%
1990-91 2,550.6 6.9% 282.1 13.6% 390.4 8.5% 1,550.4 5.1% 115.0 5.3% 212.7 10.0%1991-92 2,549.9 0.0% 292.1 3.5% 382.7 -2.0% 1,537.7 -0.8% 112.5 -2.2% 224.9 5.7%1992-93 2,529.0 -0.8% 314.7 7.7% 416.8 8.9% 1,461.3 -5.0% 112.2 -0.3% 224.0 -0.4%1993-94 2,466.4 -2.5% 336.3 6.9% 447.2 7.3% 1,340.4 -8.3% 103.6 -7.7% 238.8 6.6%1994-95 2,369.8 -3.9% 353.8 5.2% 494.1 10.5% 1,175.6 -12.3% 90.1 -13.0% 256.3 7.3%1995-96 2,248.2 -5.1% 398.8 12.7% 533.5 8.0% 927.2 -21.1% 78.6 -12.8% 310.1 21.0%1996-97 2,527.9 12.4% 470.5 18.0% 568.8 6.6% 1,045.9 12.8% 89.0 13.2% 353.6 14.0%1997-98 2,476.5 -2.0% 469.6 -0.2% 549.1 -3.5% 1,005.1 -3.9% 88.9 -0.1% 363.7 2.9%1998-99 2,617.8 5.7% 514.7 9.6% 579.9 5.6% 1,049.1 4.4% 93.1 4.7% 381.0 4.8%1999-00 2,801.5 7.0% 536.9 4.3% 625.9 7.9% 1,135.4 8.2% 97.8 5.1% 405.6 6.4%
2000-01 3,014.0 7.6% 574.2 7.0% 664.4 6.1% 1,229.2 8.3% 105.1 7.4% 441.3 8.8%2001-02 3,251.9 7.9% 618.7 7.7% 699.0 5.2% 1,337.8 8.8% 127.3 21.1% 469.1 6.3%2002-03 3,414.6 5.0% 638.5 3.2% 733.6 4.9% 1,424.7 6.5% 128.8 1.2% 489.0 4.2%2003-04 3,611.1 5.8% 660.3 3.4% 804.0 9.6% 1,500.9 5.3% 134.0 4.0% 404.6 -17.3%2004-05 3,763.9 4.2% 691.7 4.8% 833.7 3.7% 1,550.5 3.3% 146.5 9.4% 392.0 -3.1%2005-06 3,899.1 3.6% 723.0 4.5% 873.6 4.8% 1,569.9 1.3% 155.4 6.0% 422.0 7.6%2006-07 4,077.4 4.6% 746.5 3.3% 920.5 5.4% 1,640.0 4.5% 161.3 3.8% 444.2 5.3%2007-08 4,470.4 9.6% 810.7 8.6% 969.6 5.3% 1,817.3 10.8% 165.6 2.6% 515.8 16.1%2008-09 4,676.4 4.6% 852.3 5.1% 1,001.4 3.3% 1,899.9 4.5% 175.0 5.7% 550.5 6.7%2009-10 4,969.0 6.3% 882.6 3.6% 1,065.2 6.4% 2,005.6 5.6% 196.9 12.5% 606.5 10.2%
2010-11 5,051.9 1.7% 900.2 2.0% 1,089.1 2.2% 2,035.3 1.5% 200.8 2.0% 616.8 1.7%2011-12 5,133.5 1.6% 914.1 1.5% 1,100.7 1.1% 2,085.8 2.5% 203.5 1.3% 620.1 0.5%
Avg. Growth Rate (1970-2012) 6.1% 7.4% 7.1% 4.9% 6.8% 9.0%
Avg. Growth Rate (1990-2012) 3.6% 6.2% 5.3% 1.9% 3.2% 5.7%
NOTES: Dollar figures in millions."Other Districts" does not include urban renewal districts.
0%
10%
20%
30%
40%
50%
60%
70%
80%
90%
100%
1970
-71
1971
-72
1972
-73
1973
-74
1974
-75
1975
-76
1976
-77
1977
-78
1978
-79
1979
-80
1980
-81
1981
-82
1982
-83
1983
-84
1984
-85
1985
-86
1986
-87
1987
-88
1988
-89
1989
-90
1990
-91
1991
-92
1992
-93
1993
-94
1994
-95
1995
-96
1996
-97
1997
-98
1998
-99
1999
-00
2000
-01
2001
-02
2002
-03
2003
-04
2004
-05
2005
-06
2006
-07
2007
-08
2008
-09
2009
-10
2010
-11
2011
-12
Tax Year
GROWTH IN TAXES IMPOSED BY TYPE OF TAXING DISTRICT
K-12 & ESDs Cities & Counties Other

LRO 2/21/2013 D9 Research Report #1-13
Property Taxes Imposed 2011-12 ---- TOTAL IMPOSED ---- ---- COUNTIES---- ---- CITIES ---- --- SCHOOLS & ESDs ---- COMMUNITY COLLEGE --SPECIAL DISTRICTS--
COUNTY AMOUNT % CHG. AMOUNT % CHG. AMOUNT % CHG. AMOUNT % CHG. AMOUNT % CHG. AMOUNT % CHG.BAKER 16,234,738 1.6% 4,537,961 2.4% 3,241,071 2.0% 5,963,044 0.6% 773,998 2.8% 1,718,665 1.8%BENTON 110,416,143 4.3% 19,612,338 4.4% 31,217,310 9.7% 48,424,629 1.4% 4,608,520 4.2% 6,553,346 2.2%CLACKAMAS 589,983,977 2.3% 105,882,817 2.6% 80,211,324 3.0% 270,598,588 3.1% 23,632,290 -1.4% 109,658,959 0.4%CLATSOP 62,982,471 1.3% 7,976,022 1.2% 12,783,819 7.2% 27,725,614 -0.2% 4,150,210 3.0% 10,346,806 -2.2%COLUMBIA 53,394,734 -3.0% 6,852,628 1.5% 6,104,285 -2.9% 24,893,432 -1.9% 1,771,140 -6.8% 13,773,251 -6.4%COOS 55,343,992 2.3% 6,772,642 3.2% 12,446,654 1.2% 22,165,926 2.4% 3,018,209 2.4% 10,940,561 2.6%
CROOK 21,263,726 -6.6% 6,180,701 -5.7% 1,637,414 -10.9% 8,669,094 -6.8% 1,098,407 -5.5% 3,678,111 -6.1%CURRY 21,982,421 0.8% 1,509,975 2.8% 3,545,372 -1.4% 11,383,967 0.7% 1,765,239 2.8% 3,777,868 1.5%DESCHUTES 260,235,879 -1.6% 26,847,341 -1.5% 32,225,978 -4.1% 113,020,667 -4.1% 12,709,719 0.7% 75,432,174 3.2%DOUGLAS 85,228,888 2.1% 8,335,767 2.5% 19,086,521 2.6% 40,736,018 2.3% 3,468,471 2.3% 13,602,111 0.7%GILLIAM 11,825,906 16.0% 3,868,143 16.9% 426,881 2.7% 5,526,009 16.1% . 2,004,873 17.2%GRANT 6,774,463 -0.2% 1,352,955 -14.4% 723,099 6.1% 2,513,503 3.8% . 2,184,905 3.8%
HARNEY 6,364,909 0.5% 1,979,732 0.6% 800,068 -0.6% 2,644,137 0.7% . 940,971 0.5%HOOD RIVER 26,107,643 7.0% 2,934,580 3.2% 2,543,534 3.4% 14,871,549 4.3% 1,167,839 4.4% 4,590,141 23.1%JACKSON 228,078,742 -0.1% 35,678,123 -4.1% 50,703,976 1.5% 105,352,653 0.3% 9,959,528 -1.2% 26,384,463 1.5%JEFFERSON 23,185,916 -1.4% 7,253,324 -3.5% 1,492,630 -6.7% 9,685,638 0.0% 1,029,062 1.5% 3,725,262 0.5%JOSEPHINE 58,513,174 0.9% 4,656,988 0.9% 16,092,732 1.2% 32,741,577 0.8% 3,132,586 0.9% 1,889,290 0.0%KLAMATH 54,280,676 1.2% 9,020,788 -10.8% 6,886,032 0.0% 20,761,887 5.5% 2,206,040 5.1% 15,405,929 3.7%
LAKE 10,609,909 51.0% 3,089,483 59.2% 793,291 2.6% 4,121,098 57.1% 104,790 5.1% 2,501,248 57.4%LANE 396,956,907 1.0% 36,788,712 2.7% 136,342,581 -0.3% 171,496,244 0.7% 22,911,802 4.6% 29,417,567 3.7%LINCOLN 84,804,973 3.5% 18,228,021 3.3% 16,008,926 6.6% 36,787,050 3.0% 2,784,027 2.6% 10,996,949 1.8%LINN 122,706,258 -0.1% 26,994,487 5.2% 30,410,423 -4.8% 49,597,149 0.0% 5,283,473 1.8% 10,420,727 -0.2%MALHEUR 22,546,337 1.1% 4,818,278 1.9% 4,134,695 0.5% 8,558,725 0.8% 1,840,275 0.8% 3,194,363 1.9%MARION 309,847,895 3.1% 57,549,946 1.8% 75,681,770 2.0% 127,767,503 3.5% 16,910,381 13.4% 31,938,295 1.2%
MORROW 22,980,169 7.1% 5,697,261 6.3% 2,507,597 3.7% 9,152,068 6.7% 1,325,978 4.2% 4,297,265 12.1%MULTNOMAH 1,113,586,551 1.6% 285,997,192 0.7% 365,727,888 -0.3% 394,458,169 6.2% 32,298,863 -2.2% 35,104,439 -13.7%POLK 70,608,961 3.5% 10,535,086 3.0% 18,714,020 2.6% 32,168,720 3.2% 4,032,585 13.5% 5,158,548 2.3%SHERMAN 6,595,893 1.5% 3,481,337 1.9% 165,237 7.1% 2,188,452 0.1% . 760,867 2.3%TILLAMOOK 44,254,838 3.4% 10,553,412 2.7% 1,783,881 -2.5% 22,333,333 3.5% 1,734,549 6.6% 7,849,662 4.5%UMATILLA 72,729,699 3.9% 13,806,172 1.7% 13,089,078 2.0% 33,906,475 3.8% 4,078,289 -0.4% 7,849,685 15.4%
UNION 19,235,344 1.8% 4,365,328 3.5% 4,711,083 -1.8% 8,496,920 3.0% . 1,662,013 1.9%WALLOWA 7,916,379 1.4% 1,645,365 2.5% 929,500 4.2% 3,829,872 2.1% . 1,511,642 -3.0%WASCO 31,681,779 3.8% 8,037,454 3.3% 2,970,985 7.6% 12,083,547 3.0% 1,906,835 2.9% 6,682,957 4.6%WASHINGTON 791,736,473 2.2% 142,804,801 2.8% 122,222,481 4.2% 350,237,068 2.7% 28,575,321 -3.2% 147,896,802 -0.2%WHEELER 1,894,448 2.6% 912,268 2.6% 184,287 1.5% 667,778 2.7% . 130,115 3.1%YAMHILL 101,379,251 -0.8% 17,588,486 1.2% 22,163,306 1.3% 50,307,756 -3.2% 5,235,400 6.6% 6,084,303 1.0%
TOTAL 4,924,270,460 1.7% 914,145,914 1.5% 1,100,709,730 1.1% 2,085,835,859 2.5% 203,513,826 1.3% 620,065,132 0.5%URBAN RENEWAL 182,161,660 1.5%OREGON 5,106,432,120 1.7%

LRO 2/21/2013 D10 Research Report #1-13
PROPERTY TAX COMPRESSION LOSSES2011-12
Loss % of % Loss % of % Loss % of %
COUNTY $000s Tax Change $000s Tax Change $000s Tax Change
BAKER 404.9 6.8% -2.8% 263.9 2.6% 13.5% 668.8 4.1% 3.0%
BENTON 3,461.5 7.1% 27.4% 133.5 0.2% 78.2% 3,595.0 3.3% 28.7%
CLACKAMAS 11,734.0 4.3% 68.8% 892.1 0.3% 49.7% 12,626.0 2.1% 67.3%
CLATSOP 518.2 1.9% 19.4% 113.3 0.3% -1.1% 631.5 1.0% 15.2%
COLUMBIA 846.8 3.4% 199.6% 225.7 0.8% 51.5% 1,072.4 2.0% 148.5%
COOS 152.1 0.7% 23.5% 46.1 0.1% 17.1% 198.2 0.4% 22.0%
CROOK 451.4 0.1 42.8% 58.2 0.5% 43.0% 509.7 2.4% 42.8%
CURRY 11.5 0.1% 31.6% 1.8 0.02% 31.5% 13.4 0.1% 31.6%
DESCHUTES 2,700.0 2.39% 45.4% 549.6 0.4% 38.3% 3,249.6 1.2% 44.1%
DOUGLAS 566.9 1.4% 32.5% 276.5 0.6% 32.8% 843.4 1.0% 32.6%
GILLIAM 25.9 0.5% 5.2% 17.8 0.3% 26.2% 43.6 0.4% 12.8%
GRANT 44.0 1.7% 28.8% 2.1 0.0% 2.6% 46.0 0.7% 27.3%
HARNEY 74.2 2.8% 29.1% 84.0 2.3% 56.9% 158.2 2.5% 42.5%
HOOD RIVER 655.9 4.4% 19.4% 7.3 0.1% 47.1% 663.2 2.5% 19.7%
JACKSON 1,612.4 1.5% 79.4% 117.1 0.1% 57.2% 1,729.5 0.8% 77.7%
JEFFERSON 251.2 2.6% 14.1% 332.8 2.5% 16.2% 584.0 2.5% 15.3%
JOSEPHINE 361.7 1.1% 147.3% 38.0 0.15% 147.1% 399.7 0.7% 147.3%
KLAMATH 1.9 0.0% 30.7% 626.9 1.9% 44.9% 628.8 1.2% 44.8%
LAKE 65.4 1.6% 436.6% 93.6 1.4% 20.5% 159.0 1.5% 76.9%
LANE 10,588.0 6.2% 33.5% 310.9 0.1% 38.4% 10,898.8 2.7% 33.7%
LINCOLN 215.2 0.6% 45.0% 7.6 0.0% -53.8% 222.8 0.3% 35.2%
LINN 1,160.8 2.3% 39.3% 6,910.8 9.5% 109.4% 8,071.6 6.6% 95.3%
MALHEUR 257.2 3.0% 40.2% 105.9 0.8% 30.9% 363.1 1.6% 37.4%
MARION 1,059.1 0.8% 55.7% 1,926.7 1.1% 51.6% 2,985.8 1.0% 53.1%
MORROW 1,149.2 12.6% 12.7% 788.2 5.7% 20.5% 1,937.4 8.4% 15.8%
MULTNOMAH 28,213.7 7.2% 138.7% 52,255.8 7.3% 47.8% 80,469.5 7.2% 70.6%
POLK 376.7 1.2% 50.6% 45.1 0.1% 51.9% 421.8 0.6% 50.7%
SHERMAN 42.6 1.9% 3.2% 146.3 3.3% 12.4% 188.9 2.9% 10.2%
TILLAMOOK 171.8 0.8% 46.0% 9.7 0.0% 42.9% 181.5 0.4% 45.9%
UMATILLA 1,832.8 5.4% 15.4% 573.8 1.5% 40.0% 2,406.5 3.3% 20.4%
UNION 83.8 1.0% -10.7% 122.3 1.1% 41.3% 206.1 1.1% 14.3%
WALLOWA 36.4 1.0% 18.3% 0.2 0.01% -22.9% 36.7 0.5% 18.0%
WASCO 149.3 1.2% 0.6% 252.6 1.3% -3.4% 401.9 1.3% -2.0%
WASHINGTON 6,548.9 1.9% 51.2% 221.4 0.05% 26.0% 6,770.2 0.9% 50.2%
WHEELER 14.8 2.2% 26.0% 36.2 3.0% 32.5% 51.0 2.7% 30.6%
YAMHILL 443.7 0.9% 48.3% 47.1 0.1% 53.2% 490.8 0.5% 48.7%
TOTAL 76,283.8 3.7% 69.5% 67,640.7 2.4% 50.9% 143,924.5 2.9% 60.8%
NOTE: Thousands of Dollars. Levies for joint districts are apportioned among counties. Compression loss equals the M5 compression losses for local taxing districts , excluding urban renewal agencies.
INSIDE M5 LIMIT INSIDE M5 LIMIT ------- TOTAL LEVIES -------
SCHOOL LEVIES NON-SCHOOL LEVIES (Excludes Urban Renewal)

LRO 2/21/2013 E1 Research Report #1-13
PROPERTY TAX RELIEF General property tax relief began with the Property Tax Relief Act of 1929. This act imposed a personal income tax and dedicated the revenues to offset the State's property tax levy. As a result, the State has not levied a property tax since 1940.
Homeowners and Renters Refund Program (HARRP) HARRP was created in 1973 and discontinued by the 1991 Legislature. Refunds were phased down in 1991 and then ended. In 1991 HARRP gave property tax refunds to homeowners and renters with household income of less than $10,000. Assets (excludes homestead, personal property and retirement plans) could not exceed $25,000 unless age 65 or older. The program refunded property taxes up to a maximum for each income group.
Property Tax Relief Program (PTR) PTR was enacted in 1979 and repealed by the 1985 Legislature. The program, when originally enacted, refunded 30% of qualifying operating levies up to a maximum of $800 for each homeowner. Renters were refunded 4.7% of contract rent up to $400 for each renter.
Elderly Rental Assistance (ERA) ERA was enacted in 1975. ERA makes payments to renters age 58 and older with annual household income less than $10,000. Assets (excludes homestead, personal property and retirement plans) must be less than $25,000 if under age 65. Rent must exceed 20% of household income for calculating a payment. The payment is gross rent (including fuel and utilities) up to the $2,100 limit less 20% of household income, such that the payment reaches the maximum of $2,100 when income is zero and the minimum $100 at $10,000 income. Taxpayers must file Form 90R by July 1 of the year following the year rent was paid to apply for a payment. Payments are made by check in November of each year out of a single appropriation to fund this program and make payments to counties in lieu of property taxes for exempt nonprofit corporation housing for elderly persons. If the appropriation is insufficient to cover the payments, payments to both programs are prorated. In 1992, the total cash outlay from the General Fund reached its highest level with an average refund of $711 per renter. Between 1992 and 2006, the number of participants declined by 63%; and the average refund declined by 34%. One plausible explanation is that between 2002 and 2005, mortgage interest rates declined; and the availability of financial instruments such as the ‘interest only’ mortgages may have enabled a number of former renters to purchase homes.1 Another reason is that the income limits to participate in the program are less than the minimum Social Security benefit amount for couples established in 2005. The declining trend has continued through 2012, with 2,500 participants and an average refund of $367. Low interest rates have accompanied the recession in recent years as well. Senior Citizens Property Tax Deferral Program The senior deferral was enacted in 1963. Homeowners age 62 and over can defer payment of property taxes until the owner dies or sells the property. The State pays the tax and obtains a lien 1 There are other potential reasons for this decline that worked against eligibility. First, unless a husband and wife or registered domestic partners are living apart permanently on December 31, their income must be combined to determine their household income. Second, in 2005, cost of living allowance raised the minimum social security benefits for a couple to $10,015.

LRO 2/21/2013 E2 Research Report #1-13
on the property for the tax and accrued interest at the rate of 6% per year. At the time of enactment, the owner’s household income was required to be under $24,500 in the year prior to applying. Once in the program, a taxpayer could defer only in years when federal adjusted gross income was less than $29,000. In 1977, the Legislature expanded the program to include special assessments. These were discontinued in 2011 with HB 2543. The 1999 Legislature opened the deferral program to the disabled community and increased the initial income threshold to $27,500 in the year prior to applying, and raised household income once in the program to $32,000. The 2001 Legislature raised the initial household income to match the “once in the program limit” of $32,000. These income limits are indexed to the U.S. Urban CPI. The current household and federal adjusted gross income limit is $41,500 for the 2013-14 tax year. Between 1980 and 1992-93, the number of deferred accounts increased from 1,976 to 12,181, an annualized increase of about 37% over the 14 year period. During every year of this period, except for 1992-93, property tax payments to counties on behalf of some senior citizens exceeded other seniors’ repayments of their deferred taxes and accrued interest. Therefore, by the end of 1992-93, the ‘balance owed’ to the General Fund stood at $102 million, reflecting an annualized growth rate of roughly 34% during this period. In 2005, the Legislature created Oregon Project Independence (OPI) and funded it from any ‘excess’ balances that accumulate in the Senior Deferral Account. Excess balances accumulate if the property tax plus interest that seniors repay are greater than the amount that the State of Oregon pays counties on behalf of the qualified Seniors who are in the Senior Deferral Program. The first payment sent in 2006 from the Deferral Account was in the amount of $250,000. No payment was made in 2007. The January 2008 payment was in the amount of $14.29 million. Funding challenges related to the Senior and Disabled Deferral Program in recent years have resulted in a loss of funding to OPI. To stabilize the program’s funds, the 2011 Legislature removed the program as a source of OPI funding in HB 2543. Details about this bill are given below. Between 1992-93 and 2005-06, the number of deferred accounts declined from 12,181 to 8,866; but both the payments to counties and seniors’ repayments of deferred taxes increased. In addition, during this period payments to counties on behalf of her senior citizens were less than seniors’ repayments. These changes mitigated growth in the ‘balance owed’; but this balance did not begin to decline consistently until after 1998-99. Between 1998-99 and 2006-07 the ‘balance owed’ declined from $136 million to $116 million. Recent years have seen a reduction in the number of deferred accounts and periods of repayment with interest rates at historic lows. However, in 2010 and 2011, the program saw a reduction in repayments and an increase in program participation due to depressed activity in the housing market. The resulting shortfall in the program’s account led to the passage of HB 2543 in 2011. HB 2543 changed the income requirement to a more comprehensive measure of income, imposed an asset limit of $500,000, a limit on the Real Market Value (RMV) of homes in the program according to an adjustable schedule, a prohibition on homes with reverse mortgages, and a requirement that participants be in their homes for 5 or more years to apply or participate. The changes to the program reduced participation by roughly half and reduced payment obligations for the 2011-12 property tax year. By 2012 it had become clear that one of HB 2543’s prohibitions on participation by seniors with reverse mortgages was particularly burdensome on this group. As a result, HB 4039 was passed in 2012, which extended participation to 1,534 seniors with reverse mortgages who had already been participants in the program. No new participants with reverse mortgages would be accepted.
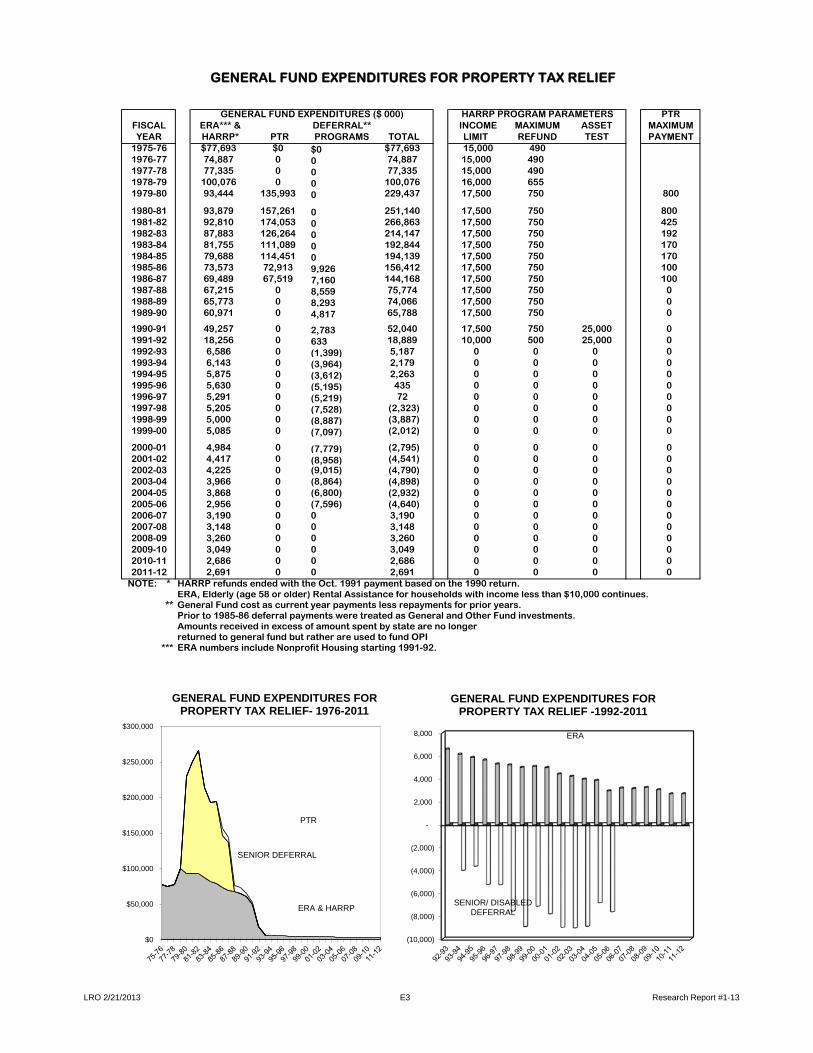
LRO 2/21/2013 E3 Research Report #1-13
GENERAL FUND EXPENDITURES FOR PROPERTY TAX RELIEF
GENERAL FUND EXPENDITURES ($ 000) HARRP PROGRAM PARAMETERS PTRFISCAL ERA*** & DEFERRAL** INCOME MAXIMUM ASSET MAXIMUMYEAR HARRP* PTR PROGRAMS TOTAL LIMIT REFUND TEST PAYMENT
1975-76 $77,693 $0 $0 $77,693 15,000 4901976-77 74,887 0 0 74,887 15,000 4901977-78 77,335 0 0 77,335 15,000 4901978-79 100,076 0 0 100,076 16,000 6551979-80 93,444 135,993 0 229,437 17,500 750 800
1980-81 93,879 157,261 0 251,140 17,500 750 8001981-82 92,810 174,053 0 266,863 17,500 750 4251982-83 87,883 126,264 0 214,147 17,500 750 1921983-84 81,755 111,089 0 192,844 17,500 750 1701984-85 79,688 114,451 0 194,139 17,500 750 1701985-86 73,573 72,913 9,926 156,412 17,500 750 1001986-87 69,489 67,519 7,160 144,168 17,500 750 1001987-88 67,215 0 8,559 75,774 17,500 750 01988-89 65,773 0 8,293 74,066 17,500 750 01989-90 60,971 0 4,817 65,788 17,500 750 0
1990-91 49,257 0 2,783 52,040 17,500 750 25,000 01991-92 18,256 0 633 18,889 10,000 500 25,000 01992-93 6,586 0 (1,399) 5,187 0 0 0 01993-94 6,143 0 (3,964) 2,179 0 0 0 01994-95 5,875 0 (3,612) 2,263 0 0 0 01995-96 5,630 0 (5,195) 435 0 0 0 01996-97 5,291 0 (5,219) 72 0 0 0 01997-98 5,205 0 (7,528) (2,323) 0 0 0 01998-99 5,000 0 (8,887) (3,887) 0 0 0 01999-00 5,085 0 (7,097) (2,012) 0 0 0 0
2000-01 4,984 0 (7,779) (2,795) 0 0 0 02001-02 4,417 0 (8,958) (4,541) 0 0 0 02002-03 4,225 0 (9,015) (4,790) 0 0 0 02003-04 3,966 0 (8,864) (4,898) 0 0 0 02004-05 3,868 0 (6,800) (2,932) 0 0 0 02005-06 2,956 0 (7,596) (4,640) 0 0 0 02006-07 3,190 0 0 3,190 0 0 0 02007-08 3,148 0 0 3,148 0 0 0 02008-09 3,260 0 0 3,260 0 0 0 02009-10 3,049 0 0 3,049 0 0 0 02010-11 2,686 0 0 2,686 0 0 0 02011-12 2,691 0 0 2,691 0 0 0 0
NOTE: * HARRP refunds ended with the Oct. 1991 payment based on the 1990 return.ERA, Elderly (age 58 or older) Rental Assistance for households with income less than $10,000 continues.
** General Fund cost as current year payments less repayments for prior years.Prior to 1985-86 deferral payments were treated as General and Other Fund investments.Amounts received in excess of amount spent by state are no longer returned to general fund but rather are used to fund OPI
*** ERA numbers include Nonprofit Housing starting 1991-92.
$0
$50,000
$100,000
$150,000
$200,000
$250,000
$300,000
GENERAL FUND EXPENDITURES FOR PROPERTY TAX RELIEF- 1976-2011
ERA & HARRP
SENIOR DEFERRAL
PTR
(10,000)
(8,000)
(6,000)
(4,000)
(2,000)
-
2,000
4,000
6,000
8,000
GENERAL FUND EXPENDITURES FOR PROPERTY TAX RELIEF -1992-2011
SENIOR/ DISABLED DEFERRAL
ERA

LRO 2/21/2013 E4 Research Report #1-13
PROPERTY TAX RELIEFHOMEOWNER'S AND RENTER'S REFUND PROGRAM (HARRP)
REFUNDS ($000) NUMBER OF RETURNS AVERAGE REFUND ($)RETURN HOME MOBILE HOME MOBILE HOME MOBILE
YEAR OWNER RENTER HOME TOTAL OWNER RENTER HOME TOTAL OWNER RENTER HOME TOTAL 1975 48,277 25,789 3,017 77,083 268,010 240,922 18,445 527,377 180.13 107.04 163.57 146.16 1976 44,044 25,939 3,055 73,038 234,813 241,469 18,229 494,511 187.57 107.42 167.59 147.70 1977 57,781 31,984 4,223 93,988 222,570 214,217 19,020 455,807 259.61 149.31 222.03 206.20 1978 53,172 32,015 3,878 89,065 209,977 221,354 20,410 451,741 253.23 144.63 190.00 197.16 1979 51,211 31,990 4,278 87,479 200,311 238,150 21,254 459,715 255.66 134.33 201.28 190.29 1980 49,861 33,297 4,422 87,580 185,111 238,498 20,997 444,606 269.36 139.61 210.60 196.98 1981 47,477 32,856 4,416 84,749 171,208 221,018 20,083 412,309 277.31 148.66 219.89 205.55 1982 43,886 26,677 4,174 74,737 152,214 175,902 18,069 346,185 288.32 151.66 231.00 215.89 1983 40,938 28,207 4,092 73,237 143,524 182,165 17,363 343,052 285.23 154.84 235.67 213.49 1984 37,002 28,229 3,950 69,181 129,900 179,968 16,335 326,203 284.85 156.86 241.81 212.08 1985 34,518 25,136 3,852 63,506 120,882 176,986 15,742 313,610 285.55 142.02 244.70 202.50 1986 32,342 25,329 4,047 61,718 112,816 169,351 15,255 297,422 286.68 149.57 265.29 207.51 1987 32,253 24,129 4,104 60,486 110,549 164,051 14,925 289,525 291.75 147.08 274.97 208.91 1988 29,851 22,646 3,886 56,383 103,337 157,141 14,127 274,605 288.87 144.11 275.08 205.32 1989 22,602 19,774 3,484 45,859 79,190 138,598 12,713 230,501 285.41 142.67 274.05 198.95 1990 4,578 4,487 747 9,812 26,873 56,711 4,772 88,356 170.36 79.12 156.54 111.05
HARRP NOTES: HARRP program ended in 1991. Refunds for 1971 and 1972 were under the Homeowners Property Tax Relief Program (HOPTR). Mobile homes are included in homeowners and renters for 1973 and 1974. In 1973 the household income limit increased to $16,000 and the maximum refund schedule increased. In 1977 the household income limit increased to $17,500 and the maximum refund schedule increased.
RETURN REFUNDS AVERAGE In 1982 the HARRP packet was separated from the income tax packet and mailed late in March of 1983. YEAR ($000) RETURNS REFUND In 1985 each qualified renter filed separately - previously only one return was allowed per household. 1980 2,820 4,699 $600 In 1989 asset test added for those under age 65. Assets must be less than $25,000 excluding the homestead 1981 2,184 3,525 620 tangible personal property and retiremnet plans. 1982 2,028 3,129 648 In 1990 the household income limit decreased to $10,000 and the maximum refund schedule decreased. 1983 1,757 2,738 642 ERA NOTES: 1984 1,482 2,397 618 In 1975 renters eligible if age 65 or older with income less than $3,000 and rent exceeds 60% of income. 1985 1,358 2,228 610 In 1977 age reduced to 58 or older, income increased to $5,000 and rent (up to $2,100) exceeds 40% of inco 1986 1,161 1,930 602 In 1989 asset limit of $25,000 (with exclusions) added if under age 65. 1987 1,063 1,810 587 In 1991 household income limit increased to $10,000 and percent of income reduced to 20%. 1988 879 1,549 567 Payment equals rent (up to $2,100) less 20% of household income ($10,000 limit). 1989 549 1,045 526 ERA payments are made each fall for returns filed in the Spring. Returns may be filed up to 3 years later. 1990 6,357 11,372 559 1991 5,564 10,430 533 1992 6,555 9,216 711 FISCAL REFUNDS AVERAGE 1993 5,522 9,542 579 YEAR ($000) RETURNS REFUND 1994 4,978 8,880 561 FY 95 648 25 25,920 1995 4,652 8,230 565 FY 96 664 28 23,714 1996 4,425 7,873 562 FY 97 760 31 24,516 1997 4,214 7,571 557 FY 98 747 32 23,344 1998 4,289 7,708 556 FY 99 828 34 24,353 1999 4,238 7,579 559 FY 00 901 36 25,028 2000 3,487 7,732 451 FY 01 1,009 38 26,553 2001 3,202 6,215 515 FY 02 840 39 21,538 2002 4,794 9,596 500 FY 03 1,083 41 26,415 2003 2,745 5,076 541 FY 04 1,221 43 28,395 2004 2,502 4,614 542 FY 05 1,364 44 31,000 2005 2,095 3,996 524 FY 06 1,263 44 28,7052006 1,797 3,934 477 FY 07 1,396 44 31,7272007 1,660 3,286 443 FY 08 1,488 44 33,8182008 1,656 3,646 454 FY 09 1,602 48 33,3852009 1,422 3,284 433 FY 10 1,627 48 33,8942010 1,122 3,240 343 FY 11 1,566 50 31,3122011 994 2,784 357 FY 12 1,697 49 34,6332012 918 2,500 367 FY 13 1,503 51 29,471
ELDERLY RENTAL ASSISTANCE (ERA)
NON PROFIT HOUSING
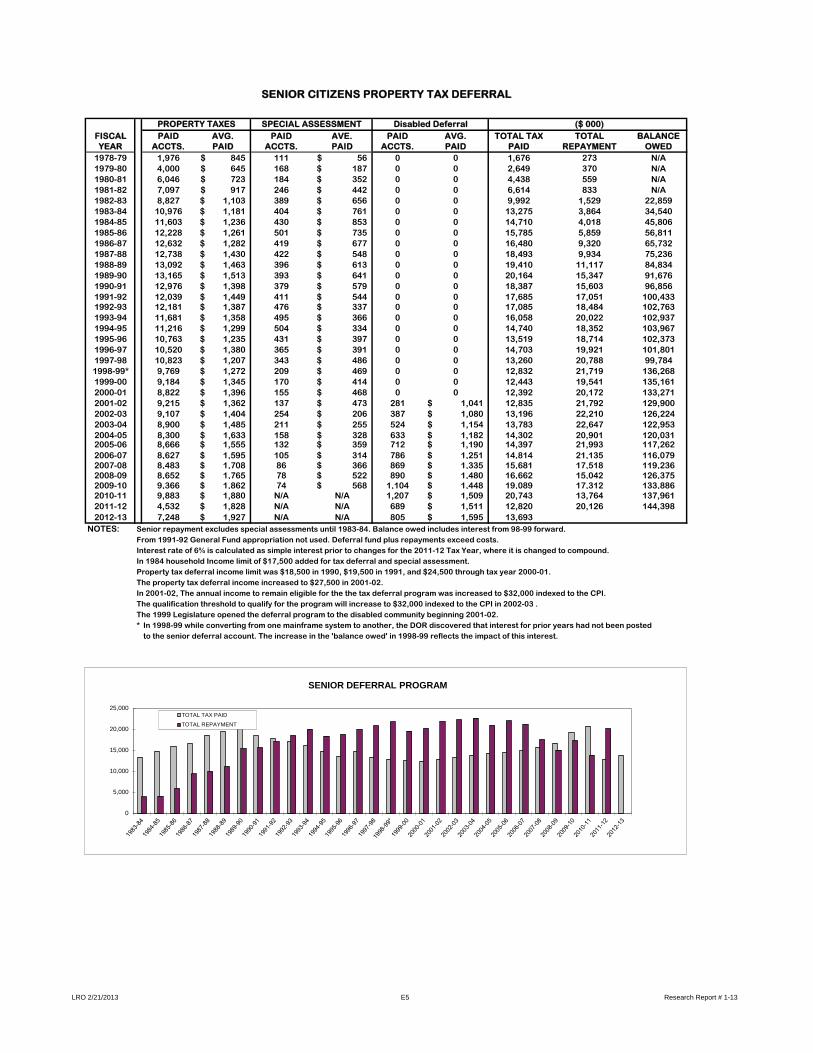
LRO 2/21/2013 E5 Research Report # 1-13
SENIOR CITIZENS PROPERTY TAX DEFERRAL
PROPERTY TAXES SPECIAL ASSESSMENT Disabled Deferral ($ 000)FISCAL PAID AVG. PAID AVE. PAID AVG. TOTAL TAX TOTAL BALANCEYEAR ACCTS. PAID ACCTS. PAID ACCTS. PAID PAID REPAYMENT OWED
1978-79 1,976 845$ 111 56$ 0 0 1,676 273 N/A1979-80 4,000 645$ 168 187$ 0 0 2,649 370 N/A1980-81 6,046 723$ 184 352$ 0 0 4,438 559 N/A1981-82 7,097 917$ 246 442$ 0 0 6,614 833 N/A1982-83 8,827 1,103$ 389 656$ 0 0 9,992 1,529 22,8591983-84 10,976 1,181$ 404 761$ 0 0 13,275 3,864 34,5401984-85 11,603 1,236$ 430 853$ 0 0 14,710 4,018 45,8061985-86 12,228 1,261$ 501 735$ 0 0 15,785 5,859 56,8111986-87 12,632 1,282$ 419 677$ 0 0 16,480 9,320 65,7321987-88 12,738 1,430$ 422 548$ 0 0 18,493 9,934 75,2361988-89 13,092 1,463$ 396 613$ 0 0 19,410 11,117 84,8341989-90 13,165 1,513$ 393 641$ 0 0 20,164 15,347 91,6761990-91 12,976 1,398$ 379 579$ 0 0 18,387 15,603 96,8561991-92 12,039 1,449$ 411 544$ 0 0 17,685 17,051 100,4331992-93 12,181 1,387$ 476 337$ 0 0 17,085 18,484 102,7631993-94 11,681 1,358$ 495 366$ 0 0 16,058 20,022 102,9371994-95 11,216 1,299$ 504 334$ 0 0 14,740 18,352 103,9671995-96 10,763 1,235$ 431 397$ 0 0 13,519 18,714 102,3731996-97 10,520 1,380$ 365 391$ 0 0 14,703 19,921 101,8011997-98 10,823 1,207$ 343 486$ 0 0 13,260 20,788 99,7841998-99* 9,769 1,272$ 209 469$ 0 0 12,832 21,719 136,2681999-00 9,184 1,345$ 170 414$ 0 0 12,443 19,541 135,1612000-01 8,822 1,396$ 155 468$ 0 0 12,392 20,172 133,2712001-02 9,215 1,362$ 137 473$ 281 1,041$ 12,835 21,792 129,9002002-03 9,107 1,404$ 254 206$ 387 1,080$ 13,196 22,210 126,2242003-04 8,900 1,485$ 211 255$ 524 1,154$ 13,783 22,647 122,9532004-05 8,300 1,633$ 158 328$ 633 1,182$ 14,302 20,901 120,0312005-06 8,666 1,555$ 132 359$ 712 1,190$ 14,397 21,993 117,2622006-07 8,627 1,595$ 105 314$ 786 1,251$ 14,814 21,135 116,0792007-08 8,483 1,708$ 86 366$ 869 1,335$ 15,681 17,518 119,2362008-09 8,652 1,765$ 78 522$ 890 1,480$ 16,662 15,042 126,3752009-10 9,366 1,862$ 74 568$ 1,104 1,448$ 19,089 17,312 133,8862010-11 9,883 1,880$ N/A N/A 1,207 1,509$ 20,743 13,764 137,9612011-12 4,532 1,828$ N/A N/A 689 1,511$ 12,820 20,126 144,3982012-13 7,248 1,927$ N/A N/A 805 1,595$ 13,693
NOTES: Senior repayment excludes special assessments until 1983-84. Balance owed includes interest from 98-99 forward.From 1991-92 General Fund appropriation not used. Deferral fund plus repayments exceed costs.Interest rate of 6% is calculated as simple interest prior to changes for the 2011-12 Tax Year, where it is changed to compound.In 1984 household Income limit of $17,500 added for tax deferral and special assessment.Property tax deferral income limit was $18,500 in 1990, $19,500 in 1991, and $24,500 through tax year 2000-01. The property tax deferral income increased to $27,500 in 2001-02. In 2001-02, The annual income to remain eligible for the the tax deferral program was increased to $32,000 indexed to the CPI.The qualification threshold to qualify for the program will increase to $32,000 indexed to the CPI in 2002-03 .The 1999 Legislature opened the deferral program to the disabled community beginning 2001-02.* In 1998-99 while converting from one mainframe system to another, the DOR discovered that interest for prior years had not been posted
to the senior deferral account. The increase in the 'balance owed' in 1998-99 reflects the impact of this interest.
0
5,000
10,000
15,000
20,000
25,000
SENIOR DEFERRAL PROGRAM
TOTAL TAX PAID
TOTAL REPAYMENT
LRO 2/21/2013 F1 Research Report #1-13
OREGON ESTATE AND INHERITANCE TAXES Overview of Estate and Inheritance Tax Revenues Estate, Inheritance and Gift taxes (EIG) are different forms of taxes on the transfer of wealth. Estate tax is imposed when the property transfer is caused by death and is levied on the value of property left by the deceased. The Inheritance tax is also imposed after death, but levied on the amounts that each relative receives depending on their income and relationships to the deceased. The Gift taxes are imposed when the property owner is still living and transfers property to different relatives. It complements estate and inheritance taxes, and is usually administered as part of the estate or inheritance tax. Currently Oregon has only an Estate tax.
Oregon collected $175 million in estate tax in the 2009-11 biennium, which comprised almost 2% of the total state general fund, and ranked as third largest single tax source behind corporate excise taxes. A small number of taxpayers (while less than 5% of decedents leave estates large enough to require filing a tax return, only half) pay the estate tax each year. Consequently, revenues from Oregon’s estate tax are very volatile and one large estate tax return paying a sizeable amount of tax in a given year can result in a significant increase in estate tax revenue. In examining the percentage change each year from fiscal year 1970-71 to 2011-12, the annual percentage change had a range between a high of 103% increase in 1992-93 and a low of 60% decrease for 1987-88 from the prior year.
Brief History of Oregon’s Estate and Inheritance Tax – pre-1990s Oregon first enacted an inheritance tax in 1903. An inheritance tax is a tax on the beneficiary of the estate rather than on the estate itself. Prior to 1977, Oregon imposed an inheritance, gift and estate tax. The Oregon inheritance tax was calculated as a variable tax rate, a certain percentage of taxable estate value. The tax rates ranged from 12% to 20% depending on who was inheriting the estate, with the closest relationships receiving the lowest tax rates. The estate tax imposed was a graduated tax rate on the gross estate value less deductions. Deductions are allowed for debts owed at the time of death. In 1977, Oregon’s inheritance tax was simplified and the tax was based on the value of the property received from a decedent’s estate and the tax rate was a flat 12% of the taxable value. In addition, Oregon adopted the federal pick-up estate tax instead of its own estate tax. The federal pick-up tax became a floor on Oregon’s own inheritance tax. Beginning in 1978, Oregon started phasing out its inheritance tax over 10 years. As the phase-out of Oregon’s inheritance tax continued, the tax revenues dropped significantly to a low of $8.87 million in fiscal year 1988-89, as the state was only collecting the federal pick-up tax. Since Oregon phased-out its inheritance tax and adopted the federal pick-up tax exclusively, Oregon’s estate tax revenue has been tied to federal law as in place on a specific date. As Oregon rapidly became a destination of the elderly population, as well as the growth in property values after 1988-89, the estate tax revenues in Oregon started growing again.
Federal Estate Tax Changes Oregon’s estate tax was based on the federal estate law and the pick-up tax prior to 2000. The federal pick-up tax is a way in which states capture a portion of the federal estate tax liability without increasing the overall tax liability of the estate. The federal pick-up tax was created in 1926. The maximum federal credit for state taxes paid is calculated as a graduated percentage of the taxable estate value. The tax rates, used to calculate the maximum state death tax credit, range from 0% for taxable estates under $40,000 up to 16% for estates over $10 million.
Oregon connected exclusively to the federal pick-up tax as of 1987. After that, Oregon’s estate tax revenue was dependent on a date specific federal tax code. Oregon was not automatically connecting to federal estate tax law changes. Additional legislation was needed in Oregon to adopt

LRO 2/21/2013 F2 Research Report #1-13
federal estate tax law changes. Oregon’s estate tax law however, was connected to federal law, which established the federal gross estate value filing threshold at $600,000. The 1997 Taxpayer Relief Act (TRA97) gradually increased the gross estate value filing threshold from $600,000 up to $1 million by tax year 2006. The 2001 federal Economic Growth and Tax Relief Reconciliation Act legislation (EGTRRA) – P.L. 107-16, made significant changes in a number of tax areas, including federal estate taxes. The 2001 federal estate tax law changes included a phase-out of the state death tax credit, an increase in the gross estate value filing threshold, a decrease in the federal highest estate tax rates and a complete elimination of the federal estate tax effective 2010 for one year. The phase-out of the total state death tax credit will eliminate the states’ ability to capture a portion of each estate’s federal tax liability by 2005. An increase in the gross estate value filing threshold will remove the tax assessment on certain smaller estates. The decrease in the federal highest estate tax rates also reduces the federal tax liability for estates. If Oregon connected to all the provisions in the 2001 estate tax law changes, it would have reduced Oregon’s estate tax 25% per year starting in 2002, and would have eliminated the estate tax by 2005. In 2003, Oregon passed legislation to confirm that it is connected to “Taxpayer Relief Act of 1997”, but not the 2001 federal law changes included in the Economic Growth and Tax Reconciliation Act. Congress acted at the end of 2010 to extend the federal estate tax for 2 more years at the $5 million threshold with 35% rate. In the last few days of 2012 congress again extended the threshold (as part of the fiscal cliff avoidance) for estate and gift taxes to $5 million for each spouse indexed to inflation. However, congress increased the maximum rate to 40%.
Legislative Changes Prior to the 2003 Oregon legislation, legal opinions indicated that Oregon had not adopted either the Taxpayer Relief Act (TRA97) or the Economic Growth and Tax Relief Reconciliation Act (EGTRRA) in 2001. The primary purpose of HB 3072 was to codify in law the connection to the Taxpayer Relief Act of 1997 (TRA97) for prior tax years 1998-2001. For deaths occurring in 2002, the gross estate value filing threshold was $1 million, the same as the federal filing threshold under EGTRRA. Another important objective of the 2003 legislation was to clarify that Oregon’s estate tax connection is to the federal law under the Taxpayer Relief Act of 1997 for deaths occurring in 2003 and beyond. Oregon is not connected to 2001 federal estate tax law changes contained in the Economic Growth and Tax Relief Reconciliation Act. The 2007 session attempted to preserve family owned farms, fishing business and small forest owners, by increasing the threshold for these estates to $7.5 million. However, HB 3201 faced difficulties in the implementation phase. The February 2008 session, introduced a credit schedule for the small family owned natural resource properties. The credit increases proportionally in HB 3618 to reach the maximum at tax amount due for the $7.5 million properties, then declines gradually to $0 at the $15 million mark. The 2011 legislative session approved (HB 2541) a major revamp of the estate tax. Oregon confirmed the tax to be an estate tax, and constructed a standalone system that only uses federal definitions. Oregon now uses the definitions from the most recent federal tax code and adds some of its own while the new standalone rate schedule (ORS 118) builds a smooth ramp up in rates, which avoid the bubble up in marginal rates caused by increasing the threshold while using the old (federal) pickup schedule that existed for much lower thresholds. The new law (effective 2012) has a threshold of one million and still allows for a natural resource credit through a defined formula. Ballot Measure 84 of 2012 proposed to repeal the estate tax in Oregon but it failed by 54%.
Increase in gross estate value filing threshold 2002 $ 1.0 million 2006 $ 2.0 million 2004 $ 1.5 million 2009 $ 3.5 million Decrease in federal highest estate tax rates 2002 50% 2005 47% 2003 49% 2006 47% 2004 48% 2007 -2009 45%

LRO 2/21/2013 F3 Research Report #1-13
Fiscal Yr. $ Amount % Change Fiscal Yr. $ Amount % Change1970-71 12,613,154 1991-92 20,398,303 14.8%1971-72 12,910,782 2.4% 1992-93 41,480,573 103.4%1972-73 17,649,065 36.7% 1993-94 45,323,450 9.3%1973-74 20,375,279 15.4% 1994-95 26,014,021 -42.6%1974-75 20,354,671 -0.1% 1995-96 41,264,996 58.6%1975-76 22,334,631 9.7% 1996-97 33,856,234 -18.0%1976-77 22,814,203 2.1% 1997-98 41,489,930 22.5%1977-78 24,782,221 8.6% 1998-99 47,483,851 14.4%1978-79 29,307,501 18.3% 1999-00 47,684,649 0.4%1979-80 26,190,894 -10.6% 2000-01 43,729,981 -8.3%1980-81 34,490,610 31.7% 2001-02 65,201,986 49.1%1981-82 41,494,561 20.3% 2002-03 51,431,290 -21.1%1982-83 33,236,857 -19.9% 2003-04 73,609,000 43.1%1983-84 33,855,381 1.9% 2004-05 56,852,202 -22.7%1984-85 27,084,953 -20.0% 2005-06 89,282,588 57.0%1985-86 26,313,563 -2.8% 2006-07 79,649,893 -10.8%1986-87 33,413,595 27.0% 2007-08 109,548,647 37.5%1987-88 13,476,313 -59.7% 2008-09 87,270,813 -20.3%1988-89 8,875,434 -34.1% 2009-10 98,034,497 12.3%1989-90 13,962,361 57.3% 2010-11 76,248,946 -22.2%1990-91 17,766,526 27.2% 2011-12 101,766,033 33.5%
0
20
40
60
80
100
120
1970
-71
1972
-73
1974
-75
1976
-77
1978
-79
1980
-81
1982
-83
1984
-85
1986
-87
1988
-89
1990
-91
1992
-93
1994
-95
1996
-97
1998
-99
2000
-01
2002
-03
2004
-05
2006
-07
2008
-09
2010
-11
Oregon Estate and Inheritance Tax Collections: FY 1971-2012
Inheritance + Gift + Estate Tax
Inheritance + Gift + Federal Pick-up Tax
OR law conforms to TRA97 only
Federal Pick-up Tax Only (OR law conforms to federal law)
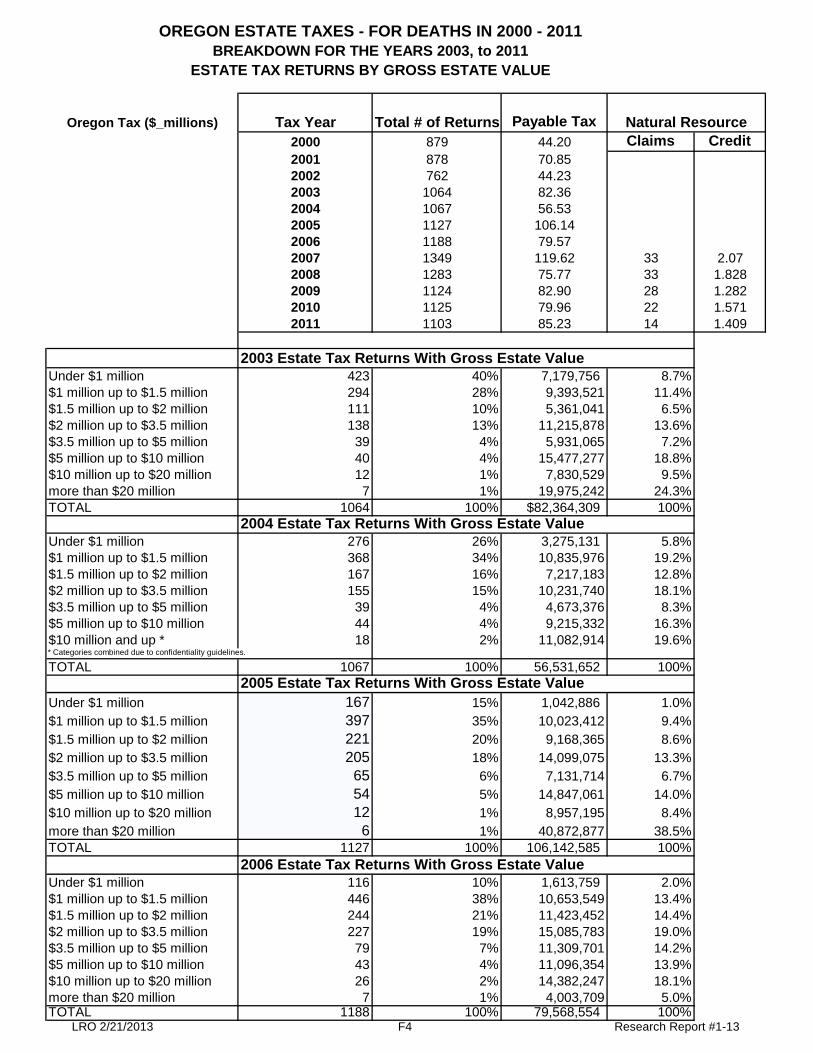
LRO 2/21/2013 F4 Research Report #1-13
Oregon Tax ($_millions) Tax Year Total # of Returns Payable Tax2000 879 44.20 Claims Credit2001 878 70.852002 762 44.232003 1064 82.362004 1067 56.532005 1127 106.142006 1188 79.572007 1349 119.62 33 2.072008 1283 75.77 33 1.8282009 1124 82.90 28 1.2822010 1125 79.96 22 1.5712011 1103 85.23 14 1.409
2003 Estate Tax Returns With Gross Estate ValueUnder $1 million 423 40% 7,179,756 8.7%$1 million up to $1.5 million 294 28% 9,393,521 11.4%$1.5 million up to $2 million 111 10% 5,361,041 6.5%$2 million up to $3.5 million 138 13% 11,215,878 13.6%$3.5 million up to $5 million 39 4% 5,931,065 7.2%$5 million up to $10 million 40 4% 15,477,277 18.8%$10 million up to $20 million 12 1% 7,830,529 9.5%more than $20 million 7 1% 19,975,242 24.3%TOTAL 1064 100% $82,364,309 100%
2004 Estate Tax Returns With Gross Estate Value Under $1 million 276 26% 3,275,131 5.8%$1 million up to $1.5 million 368 34% 10,835,976 19.2%$1.5 million up to $2 million 167 16% 7,217,183 12.8%$2 million up to $3.5 million 155 15% 10,231,740 18.1%$3.5 million up to $5 million 39 4% 4,673,376 8.3%$5 million up to $10 million 44 4% 9,215,332 16.3%$10 million and up * 18 2% 11,082,914 19.6%* Categories combined due to confidentiality guidelines.
TOTAL 1067 100% 56,531,652 100%2005 Estate Tax Returns With Gross Estate Value
Under $1 million 167 15% 1,042,886 1.0%$1 million up to $1.5 million 397 35% 10,023,412 9.4%$1.5 million up to $2 million 221 20% 9,168,365 8.6%$2 million up to $3.5 million 205 18% 14,099,075 13.3%$3.5 million up to $5 million 65 6% 7,131,714 6.7%$5 million up to $10 million 54 5% 14,847,061 14.0%$10 million up to $20 million 12 1% 8,957,195 8.4%more than $20 million 6 1% 40,872,877 38.5%TOTAL 1127 100% 106,142,585 100%
2006 Estate Tax Returns With Gross Estate Value Under $1 million 116 10% 1,613,759 2.0%$1 million up to $1.5 million 446 38% 10,653,549 13.4%$1.5 million up to $2 million 244 21% 11,423,452 14.4%$2 million up to $3.5 million 227 19% 15,085,783 19.0%$3.5 million up to $5 million 79 7% 11,309,701 14.2%$5 million up to $10 million 43 4% 11,096,354 13.9%$10 million up to $20 million 26 2% 14,382,247 18.1%more than $20 million 7 1% 4,003,709 5.0%TOTAL 1188 100% 79,568,554 100%
OREGON ESTATE TAXES - FOR DEATHS IN 2000 - 2011BREAKDOWN FOR THE YEARS 2003, to 2011
ESTATE TAX RETURNS BY GROSS ESTATE VALUE
Natural Resource

LRO 2/21/2013 F5 Research Report #1-13
2007 Estate Tax Returns With Gross Estate Value Under $1 million 119 9% 1,063,641 0.9%$1 million up to $1.5 million 504 37% 11,905,264 10.0%$1.5 million up to $2 million 262 19% 11,411,852 9.5%$2 million up to $3.5 million 295 22% 19,926,280 16.7%$3.5 million up to $5 million 82 6% 10,206,925 8.5%$5 million up to $10 million 58 4% 15,372,893 12.9%$10 million up to $20 million 20 1% 17,493,465 14.6%more than $20 million 9 1% 32,239,784 27.0%TOTAL 1349 100% 119,620,103 100%
2008 Estate Tax Returns With Gross Estate Value Under $1 million 135 11% 1,036,916 1.4%$1 million up to $1.5 million 496 39% 11,078,994 14.6%$1.5 million up to $2 million 245 19% 10,359,886 13.7%$2 million up to $3.5 million 269 21% 17,121,755 22.6%$3.5 million up to $5 million 75 6% 9,485,179 12.5%$5 million up to $10 million 40 3% 10,352,205 13.7%$10 million up to $20 million 16 1% 9,305,508 12.3%more than $20 million 7 1% 7,030,743 9.3%TOTAL 1283 100% 75,771,187 100%
2009 Estate Tax Returns With Gross Estate Value Under $1 million 103 9% 1,224,301 1.5%$1 million up to $1.5 million 419 37% 9,565,900 11.5%$1.5 million up to $2 million 219 19% 9,063,209 10.9%$2 million up to $3.5 million 232 21% 15,986,902 19.3%$3.5 million up to $5 million 71 6% 11,214,241 13.5%$5 million up to $10 million 58 5% 13,264,627 16.0%$10 million up to $20 million 8 1% 5,725,706 6.9%more than $20 million 14 1% 16,856,915 20.3%TOTAL 1124 100% 82,901,801 100%
2010 Estate Tax Returns With Gross Estate Value Under $1 million 111 10% 1,546,198 1.9%$1 million up to $1.5 million 465 41% 11,142,766 13.9%$1.5 million up to $2 million 208 18% 9,594,191 12.0%$2 million up to $3.5 million 203 18% 15,623,587 19.5%$3.5 million up to $5 million 67 6% 9,943,844 12.4%$5 million up to $10 million 55 5% 11,460,681 14.3%$10 million up to $20 million 8 1% 7,609,405 9.5%more than $20 million 8 1% 13,038,370 16.3%TOTAL 1125 100% 79,959,042 100%
2011 Estate Tax Returns With Gross Estate Value Under $1 million 95 9% 863,824 1.0%$1 million up to $1.5 million 423 38% 10,249,407 12.0%$1.5 million up to $2 million 233 21% 10,352,996 12.1%$2 million up to $3.5 million 231 21% 18,480,044 21.7%$3.5 million up to $5 million 56 5% 8,294,106 9.7%$5 million up to $10 million 42 4% 9,792,118 11.5%$10 million up to $20 million 16 1% 10,183,488 11.9%more than $20 million 7 1% 17,009,508 20.0%TOTAL 1103 100% 85,225,490 100%
LRO: 2/21/2013 G1 Research Report #1-13
SCHOOL FINANCE
K-12 School Districts Oregon has 197 school districts serving about 560,000 students in kindergarten through high school. These districts operate with relative autonomy within guidelines specified by both the Legislature and the State Department of Education. The federal government also requires certain mandated programs. Local Revenue School districts receive general operating revenue from various sources. Property taxes are the primary source. Other sources include federal forest payments, county school funds, the state Common School Fund and state timber sales. These local revenues are included in the school distribution formula and are about 36% of state and local formula operating revenue. State Support The Legislature through the State School Fund (SSF) provides about 64% of school formula operating revenue. This revenue is mostly from state income taxes and lottery revenue. The state’s share increased from about 30% before Measure 5 (1990) to about 70% after Measure 50 (1997). State revenue replaced reduced local revenue because of these property tax limitations. Along with increased state aid, the school finance distribution method for state support changed dramatically. Funding Equity The 1991 Legislature adopted the school equalization formula and phased in its implementation. Equity as measured by the equalization formula applied to all school districts beginning in 1992-93. Past Legislatures have also provided some funding outside the equalization formula. The 2007 Legislature provided funds for small high schools, special education and other programs from the State School Fund outside the formula. Currently state aid and local revenue for school districts equals 95.5% of the statewide K-12 school and education service district (ESD) formula revenue for general operating purposes. The remaining 4.5% goes to ESDs. Equalization Formula The SSF equalization formula allocates an amount to each school district based primarily on number of students. The state grant is this formula amount reduced by local revenues. The formula equalizes revenues per student by removing past differentials caused by widely varying local tax rates and property wealth per student. To recognize that some students need more school services and that their schools may face higher costs, the formula assigns weights to certain students. For example, special education students count as 2.0 students to recognize their need for special programs. Additional student weights are for English as a second language programs, students from families in poverty, remote small schools and others. A general purpose grant per weighted student is adjusted for the experience level of teachers and set at a level that allocates available funding. The formula also funds 70-90% of transportation costs, costs above $30,000 per high cost disability student (limited to $18 million per year statewide) and up to 8% of classroom construction costs (limited to $25 million per biennium). Local Property Tax Option School districts may ask voters to approve temporary local option levies. Local option revenue is limited to the lesser of (1) the district Measures 5 and 50 tax gap, (2) 20% of formula revenue or (3) $1,000 per weighted student (2007-08). The $1,000 is indexed to increase 3% per year beginning

LRO: 2/21/2013 G2 Research Report #1-13
in 2008-09. The levies may be approved for up to 5 years for operations and up to 10 years for capital projects. Local option revenue is in addition to equalization formula revenue. Construction Tax Option The 2007 Legislature granted school districts new taxing authority. School districts may impose a tax on new construction in the district. The tax rate cannot exceed $1 per square foot for residential use and $0.50 for nonresidential use. The maximum rates are indexed beginning in 2009. The tax on nonresidential use is also restricted to $25,000 per structure or building permit, whichever is less. The legislation exempts certain properties from this tax.
Education Service Districts The school system also includes education service districts (ESDs). Nineteen ESDs provide regional educational support services. The ESD share of statewide K-12 school and ESD general operating revenue is 4.5%. This includes both state aid from the State School Fund and ESD property tax revenue. Before Measure 5 (1990), they received no state aid. Subsequently state support helped replace reduced property taxes. The 2001 Legislature adopted a 5 year phase-in plan to equalize ESD revenue. Those below the state ESD average revenue per student gradually received more and those above the average gradually received less. Final equalization began in 2005-06. Beginning in 2011-12, ESD revenue is 4.712% of the sum of component district formula revenue. This makes the ESD share of total ESD and K-12 school formula revenue 4.5%. Also starting in 2011-12, some school districts can opt out of ESD’s and get reimbursement of their share of prorated formula revenues.
Community Colleges Community college districts also impose property taxes and receive state aid. Unlike school districts and ESDs, another major revenue source is tuition. Also state support is not from the State School Fund. The Legislature appropriates community college aid in a lump sum. The community colleges then allocate the state funds by rule.
School Improvement Fund The 2007 Legislature appropriated $260 million to the School Improvement Fund from the General Fund. School districts and ESDs received $126.6 million in 2007-08 and $133 million in 2008-09. Funds were targeted for a number of uses to improve student achievement. The Legislature has not made an appropriation to the School Improvement Fund since the 2007-09 biennium.
Education Stability Fund Voters approved a constitutional amendment converting the Education Endowment Fund to the Education Stability Fund in 2002 allowing the principal to be used to fund education. The fund receives 18% of lottery net proceeds. The size is limited to 5% of General Fund revenue. Use of the principal requires meeting criteria reflective of an economic recession and approval by a 3/5 vote in each legislative chamber. The principal can also be used if the Governor declares an emergency and both chambers approve by a 3/5 vote. The principal can only be used to fund pre-kindergarten through higher education, continuing education and workforce training. Fund earnings currently are used to pay education lottery bond debt (75%) and provide scholarships (25%).
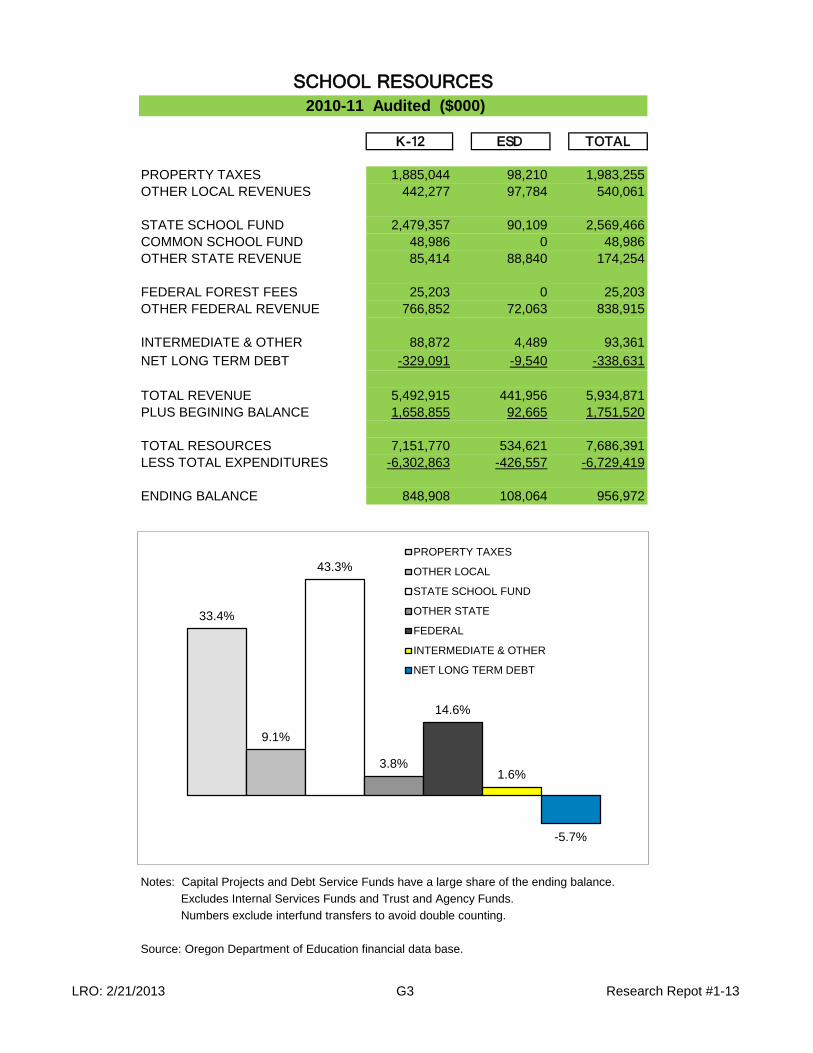
LRO: 2/21/2013 G3 Research Repot #1-13
K-12 ESD TOTAL
PROPERTY TAXES 1,885,044 98,210 1,983,255OTHER LOCAL REVENUES 442,277 97,784 540,061
STATE SCHOOL FUND 2,479,357 90,109 2,569,466COMMON SCHOOL FUND 48,986 0 48,986OTHER STATE REVENUE 85,414 88,840 174,254
FEDERAL FOREST FEES 25,203 0 25,203OTHER FEDERAL REVENUE 766,852 72,063 838,915
INTERMEDIATE & OTHER 88,872 4,489 93,361NET LONG TERM DEBT -329,091 -9,540 -338,631
TOTAL REVENUE 5,492,915 441,956 5,934,871PLUS BEGINING BALANCE 1,658,855 92,665 1,751,520
TOTAL RESOURCES 7,151,770 534,621 7,686,391LESS TOTAL EXPENDITURES -6,302,863 -426,557 -6,729,419
ENDING BALANCE 848,908 108,064 956,972
Notes: Capital Projects and Debt Service Funds have a large share of the ending balance. Excludes Internal Services Funds and Trust and Agency Funds. Numbers exclude interfund transfers to avoid double counting.
Source: Oregon Department of Education financial data base.
SCHOOL RESOURCES 2010-11 Audited ($000)
33.4%
9.1%
43.3%
3.8%
14.6%
1.6%
-5.7%
PROPERTY TAXES
OTHER LOCAL
STATE SCHOOL FUND
OTHER STATE
FEDERAL
INTERMEDIATE & OTHER
NET LONG TERM DEBT
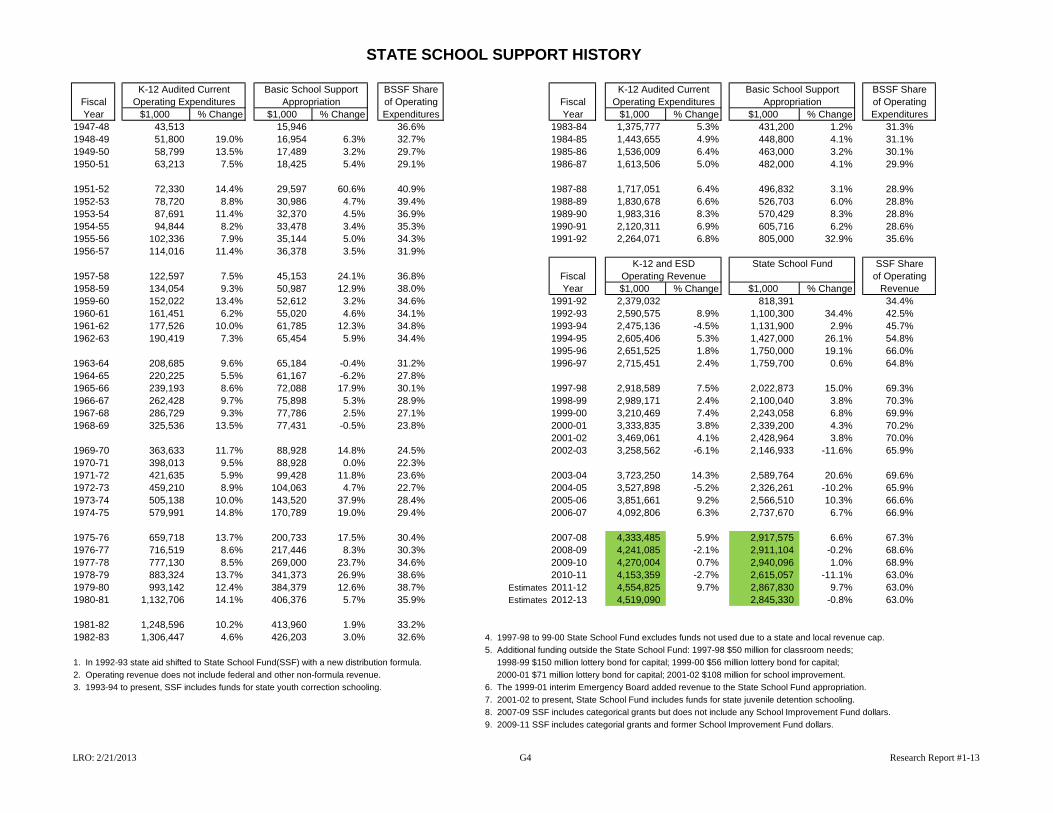
LRO: 2/21/2013 G4 Research Report #1-13
BSSF Share BSSF ShareFiscal of Operating Fiscal of OperatingYear $1,000 % Change $1,000 % Change Expenditures Year $1,000 % Change $1,000 % Change Expenditures
1947-48 43,513 15,946 36.6% 1983-84 1,375,777 5.3% 431,200 1.2% 31.3%1948-49 51,800 19.0% 16,954 6.3% 32.7% 1984-85 1,443,655 4.9% 448,800 4.1% 31.1%1949-50 58,799 13.5% 17,489 3.2% 29.7% 1985-86 1,536,009 6.4% 463,000 3.2% 30.1%1950-51 63,213 7.5% 18,425 5.4% 29.1% 1986-87 1,613,506 5.0% 482,000 4.1% 29.9%
1951-52 72,330 14.4% 29,597 60.6% 40.9% 1987-88 1,717,051 6.4% 496,832 3.1% 28.9%1952-53 78,720 8.8% 30,986 4.7% 39.4% 1988-89 1,830,678 6.6% 526,703 6.0% 28.8%1953-54 87,691 11.4% 32,370 4.5% 36.9% 1989-90 1,983,316 8.3% 570,429 8.3% 28.8%1954-55 94,844 8.2% 33,478 3.4% 35.3% 1990-91 2,120,311 6.9% 605,716 6.2% 28.6%1955-56 102,336 7.9% 35,144 5.0% 34.3% 1991-92 2,264,071 6.8% 805,000 32.9% 35.6%1956-57 114,016 11.4% 36,378 3.5% 31.9%
SSF Share1957-58 122,597 7.5% 45,153 24.1% 36.8% Fiscal of Operating1958-59 134,054 9.3% 50,987 12.9% 38.0% Year $1,000 % Change $1,000 % Change Revenue1959-60 152,022 13.4% 52,612 3.2% 34.6% 1991-92 2,379,032 818,391 34.4%1960-61 161,451 6.2% 55,020 4.6% 34.1% 1992-93 2,590,575 8.9% 1,100,300 34.4% 42.5%1961-62 177,526 10.0% 61,785 12.3% 34.8% 1993-94 2,475,136 -4.5% 1,131,900 2.9% 45.7%1962-63 190,419 7.3% 65,454 5.9% 34.4% 1994-95 2,605,406 5.3% 1,427,000 26.1% 54.8%
1995-96 2,651,525 1.8% 1,750,000 19.1% 66.0%1963-64 208,685 9.6% 65,184 -0.4% 31.2% 1996-97 2,715,451 2.4% 1,759,700 0.6% 64.8%1964-65 220,225 5.5% 61,167 -6.2% 27.8%1965-66 239,193 8.6% 72,088 17.9% 30.1% 1997-98 2,918,589 7.5% 2,022,873 15.0% 69.3%1966-67 262,428 9.7% 75,898 5.3% 28.9% 1998-99 2,989,171 2.4% 2,100,040 3.8% 70.3%1967-68 286,729 9.3% 77,786 2.5% 27.1% 1999-00 3,210,469 7.4% 2,243,058 6.8% 69.9%1968-69 325,536 13.5% 77,431 -0.5% 23.8% 2000-01 3,333,835 3.8% 2,339,200 4.3% 70.2%
2001-02 3,469,061 4.1% 2,428,964 3.8% 70.0%1969-70 363,633 11.7% 88,928 14.8% 24.5% 2002-03 3,258,562 -6.1% 2,146,933 -11.6% 65.9%1970-71 398,013 9.5% 88,928 0.0% 22.3%1971-72 421,635 5.9% 99,428 11.8% 23.6% 2003-04 3,723,250 14.3% 2,589,764 20.6% 69.6%1972-73 459,210 8.9% 104,063 4.7% 22.7% 2004-05 3,527,898 -5.2% 2,326,261 -10.2% 65.9%1973-74 505,138 10.0% 143,520 37.9% 28.4% 2005-06 3,851,661 9.2% 2,566,510 10.3% 66.6%1974-75 579,991 14.8% 170,789 19.0% 29.4% 2006-07 4,092,806 6.3% 2,737,670 6.7% 66.9%
1975-76 659,718 13.7% 200,733 17.5% 30.4% 2007-08 4,333,485 5.9% 2,917,575 6.6% 67.3%1976-77 716,519 8.6% 217,446 8.3% 30.3% 2008-09 4,241,085 -2.1% 2,911,104 -0.2% 68.6%1977-78 777,130 8.5% 269,000 23.7% 34.6% 2009-10 4,270,004 0.7% 2,940,096 1.0% 68.9%1978-79 883,324 13.7% 341,373 26.9% 38.6% 2010-11 4,153,359 -2.7% 2,615,057 -11.1% 63.0%1979-80 993,142 12.4% 384,379 12.6% 38.7% Estimates 2011-12 4,554,825 9.7% 2,867,830 9.7% 63.0%1980-81 1,132,706 14.1% 406,376 5.7% 35.9% Estimates 2012-13 4,519,090 2,845,330 -0.8% 63.0%
1981-82 1,248,596 10.2% 413,960 1.9% 33.2%1982-83 1,306,447 4.6% 426,203 3.0% 32.6% 4. 1997-98 to 99-00 State School Fund excludes funds not used due to a state and local revenue cap.
5. Additional funding outside the State School Fund: 1997-98 $50 million for classroom needs;1. In 1992-93 state aid shifted to State School Fund(SSF) with a new distribution formula. 1998-99 $150 million lottery bond for capital; 1999-00 $56 million lottery bond for capital;2. Operating revenue does not include federal and other non-formula revenue. 2000-01 $71 million lottery bond for capital; 2001-02 $108 million for school improvement.3. 1993-94 to present, SSF includes funds for state youth correction schooling. 6. The 1999-01 interim Emergency Board added revenue to the State School Fund appropriation.
7. 2001-02 to present, State School Fund includes funds for state juvenile detention schooling.8. 2007-09 SSF includes categorical grants but does not include any School Improvement Fund dollars.9. 2009-11 SSF includes categorial grants and former School Improvement Fund dollars.
STATE SCHOOL SUPPORT HISTORY
K-12 Audited Current Basic School Support K-12 Audited Current Basic School Support
K-12 and ESD State School FundOperating Revenue
Operating Expenditures Appropriation Operating Expenditures Appropriation

LRO: 2/21/2013 G5 Research Report #1-13
K-12 SCHOOL EQUALIZATION FORMULA
STATE SCHOOL FUND DISTRIBUTION
District Formula Revenue (Equalization Funding)
=
General Purpose Grant
+
Transportation Grant
+
High Cost Disability Grant
+
Facility Grant
School District Revenue
District Formula Revenue
=
State School Fund Grant
+
Local Revenue
The school equalization formula determines each school district’s general operating revenue from the State School Fund (SSF) in combination with local revenue. It is the sum of a general purpose grant, a transportation grant, a high cost disability grant and a facility grant. The formula allocates state and local revenue based on relative need for the formula component grants given the funding level available. State School Fund The Legislature allocates money to the State School Fund primarily from the state General Fund and lottery revenue for distribution to school districts. Local Revenue Statutorily, the school formula only includes district local revenue from the following sources: Operating property taxes collected (including prior years) Common School Fund County School Fund Federal forest related revenue State managed county trust forests (Chapter 530) ESD funds required to be shared with school districts Revenue in lieu of property taxes Supplantable federal funds General Purpose Revenue
General Purpose
Grant
=
Weighted Students (ADMw)
X
$4,500 Adjusted by Teacher
Experience and Balanced to
Available Funds
Weighted Students (ADMw) Weighted student count is measured by average daily membership with extra counts or weights for students in special categories. Average daily membership (ADM) is the average number of resident students during the school year. Weighted ADM or ADMw counts students in special enrollment categories as more than one student. The higher of the current year or prior year ADMw is used. The higher count is called extended ADMw.
Student Weights Student weight categories are as follows:
Category Additional Weight
Count (ADMw)
Special Education and At Risk Individual Education Program 1.00 2.00 English as a Second Language 0.50 1.50 Pregnant and Parenting 1.00 2.00 Students in Poverty Adjusted 0.25 1.25 Neglected and Delinquent 0.25 1.25 Students in Foster Care 0.25 1.25 Grade and School Kindergarten -0.50 0.50 Elementary District -0.10 0.90 Union High District 0.20 1.20 Remote Small School Varies
A student cannot have an additional weight sum greater than 2, but not all additional weights are included. Individual Education Program Weight Students with various limitations such as hearing, speech, and visual impairments receive special individual education. The count cannot exceed 11% of ADM without approval by the Department of Education. Remote Small School Weight A school site qualifies for additional ADMw if Elementary High ADM less than (varies with grades) 224 (8gr) 350 (4gr) Distance to nearest same district school more than 8 miles
The additional ADMw varies with number of students and distance. Generally, the smaller the school the greater the additional weight per student. The high school distance adjustment for being less than 20 miles from the nearest high school was phased out and sunset at the end of 2004-05. The weighting scheme will change when full-day kindergarten ADM weight becomes the same as other grades. Teacher Experience and Balance to Funding The dollars per weighted student target is arbitrarily set at $4,500 (adopted in 1991) before adjustment for teacher experience. The teacher experience adjustment increases (or decreases) the target by $25 for each year the district average teacher experience is more (or less) than the statewide average teacher experience. A calculated multiplier balances funds available to funds allocated. The multiplier modifies the adjusted target amount to distribute the available state appropriation. The multiplier changes over time and is about 1.33 using $4,500 per ADMw in 2012-13. The equivalent amount is $6,259 per ADMw.

LRO 2/21/2013 G6 Research Report #1-13
Transportation Revenue
Transportation Grant
= 70% to 90% of Transportation Costs
Districts are ranked by approved transportation costs per student from highest to lowest. The district grant depends on the following ranking:
District Rank % of Costs Top 10% 90% Next 10% 80% Bottom 80% 70%
The grant is the percent of costs corresponding to district rank times approved transportation costs. Approved transportation costs are the following:
Preschool handicapped students Elementary students more than 1 mile from school Secondary students more than 1.5 miles from school Students going between school facilities Students on field trips Health or safety needs Room and board in lieu of transportation
High Cost Disability Revenue
High Cost Disability Grant
=
Up to Sum of Costs above $30,000 per Disability Student
For a student with approved disability costs above $30,000, the grant is the cost minus $30,000. The district grant is the sum of the grants for each student with disability costs above $30,000. ESD costs for each student can be included in the student total. Total district grants cannot exceed $18 million per year. If total grants initially exceed this amount, the grants are reduced proportionally.
New Facility Revenue
Facility Grant
= Up to 8% of Construction Costs
Districts adding new classroom space receive up to 8% of construction (excluding land) and portable unit costs for furnishings and equipment. Total grants are limited to $25 million per biennium. If grants at 8% exceed the limit, the percent is reduced. School Revenue Share The school share of both school district and ESD formula revenue is 95.5%. Formula revenue is State School Fund dollars available for distribution to school districts and ESDs and designated local revenue (primarily property taxes) included for each in their respective formulas. The K-12 equalization formula uses 95.5% of this total to allocate to school districts. State Payment Schedule The July payment is 16.67% of the estimated State School Fund grant with 8.33% in each of the following 10 months. There is no June payment. Adjustment for audited data occurs in the following year. Other State School Fund Allocations The 2011 Legislature allocated $7.1 million of the State School Fund for special programs and grants. The largest were $5 million to small districts with small high schools and $1.584 million to the Department of Education for the purposes of the Oregon virtual school district.
FORMULA GRANT PERCENTAGE BY DISTRICT SIZE 2011-12
District Size by ADM
# of Districts
General Purpose Transportation High Cost
Disability
Facility 0- 500 81 93.12% 6.83% 0.05% 0.00% 500- 1,000 28 93.99% 5.83% 0.19% 0.00% 1,000- 3,000 43 95.11% 4.63% 0.26% 0.00% 3,000- 5,000 18 94.96% 4.47% 0.17% 0.39% 5,000-10,000 14 95.69% 3.99% 0.31% 0.01% 10,000-30,000 10 94.90% 4.56% 0.54% 0.00% 30,000-50,000 3 95.00% 3.86% 0.84% 0.30%

LRO 2/21/2013 G7 Research Report #1-13
ESD EQUALIZATION STATE SCHOOL FUND DISTRIBUTION
General Services Revenue
=
Higher of
(1) Base Revenue X Percent to Balance (2) $1 million
_________________________________________________________________________________
Equalization The ESD equalization formula determines each ESD's operating revenue from the State School Fund and local revenue. The allocation formula basically assumes that ESD revenue should be proportional to the equalization formula revenue of component school districts. Revenue Share Starting from 2011-12 school year, the ESD share of both school district and ESD formula revenue is 4.5%. Formula revenue is State School Fund dollars available for distribution to school districts and ESDs and designated local revenue (primarily property taxes) included for each in the respective formulas. Starting from 2011-12, some school districts can opt out of ESD’s and get reimbursement of their share of prorated formula revenues. Component School Districts The school districts within the boundary of an ESD are the ESD's component school districts. General Services Revenue General services revenue equals the district base revenue. The source is State School Fund revenue and the local revenue of the ESD.
General Services Revenue
=
State School
Fund Grant
+
Local Revenue
State School Fund Grant The State School Fund Grant is the ESD’s allocated general services amount less its local revenue. Local Revenue Local revenue is the sum of these two sources: Operating property tax collections (including prior years) State managed county trust timber (Chapter 530). Excess Local Revenue If an ESD’s local revenue is greater than its general services revenue, then the State School Fund grant is zero. Any local revenue in excess of the general services revenue is distributed to component districts proportional to ADMw (extended) and is included as local revenue for them in the school formula the following year.
Base Revenue and Minimum Base The base revenue is 4.712% times the sum of the school formula revenue for the ESD’s component districts. With the ESD total state and local share set at 4.5%, the ESD percent applied to the school district 95.5% must be more than 4.5% (4.712%*95.5%=4.5%).
Base
Revenue
=
4.712%
X Sum of
Component School District
Revenue
By using school district formula revenue as the basis for allocating general services revenue, ESD equalization depends on the same factors as school district equalization. ESDs in their role of assisting component school districts are assumed to have the same relative need for funds as their school districts. The district minimum allocation is $1 million beginning in 2007-08. If the base revenue allocation is initially less than $1 million, the base is increased to the $1 million minimum. Percent to Balance Applying the 4.712% to the sum of the component district formula revenue uses up the 4.5% of total revenue available for schools and ESDs. So if extra funds are necessary to meet the $1 million minimum, then the higher total must be reduced to stay within the 4.5% of available funds. Multiplying allocated revenue excluding minimums by a percent slightly less than 100% brings the total down to available funds. The percentage has to be further reduced to allow up to $484,000 per year for 10th grade assessment testing. State Payment Schedule The July payment is 16.67% of the estimated State School Fund grant with 8.33% in each of the following 10 months. There is no June payment. Adjustments for audited data are made the following year. ESD Students The student count for an ESD is considered to be the sum of the students in its component school districts. However, the formula does not directly use an ESD student count.
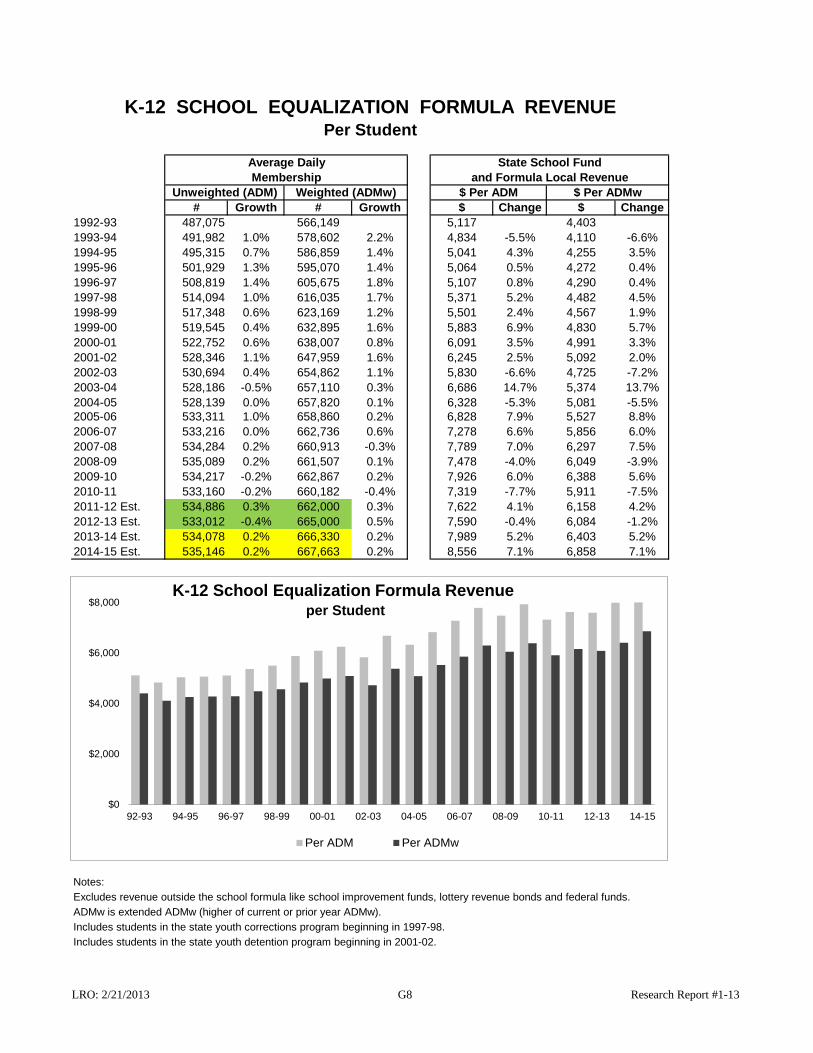
LRO: 2/21/2013 G8 Research Report #1-13
# Growth # Growth $ Change $ Change1992-93 487,075 566,149 5,117 4,4031993-94 491,982 1.0% 578,602 2.2% 4,834 -5.5% 4,110 -6.6%1994-95 495,315 0.7% 586,859 1.4% 5,041 4.3% 4,255 3.5%1995-96 501,929 1.3% 595,070 1.4% 5,064 0.5% 4,272 0.4%1996-97 508,819 1.4% 605,675 1.8% 5,107 0.8% 4,290 0.4%1997-98 514,094 1.0% 616,035 1.7% 5,371 5.2% 4,482 4.5%1998-99 517,348 0.6% 623,169 1.2% 5,501 2.4% 4,567 1.9%1999-00 519,545 0.4% 632,895 1.6% 5,883 6.9% 4,830 5.7%2000-01 522,752 0.6% 638,007 0.8% 6,091 3.5% 4,991 3.3%2001-02 528,346 1.1% 647,959 1.6% 6,245 2.5% 5,092 2.0%2002-03 530,694 0.4% 654,862 1.1% 5,830 -6.6% 4,725 -7.2%2003-04 528,186 -0.5% 657,110 0.3% 6,686 14.7% 5,374 13.7%2004-05 528,139 0.0% 657,820 0.1% 6,328 -5.3% 5,081 -5.5%2005-06 533,311 1.0% 658,860 0.2% 6,828 7.9% 5,527 8.8%2006-07 533,216 0.0% 662,736 0.6% 7,278 6.6% 5,856 6.0%2007-08 534,284 0.2% 660,913 -0.3% 7,789 7.0% 6,297 7.5%2008-09 535,089 0.2% 661,507 0.1% 7,478 -4.0% 6,049 -3.9%2009-10 534,217 -0.2% 662,867 0.2% 7,926 6.0% 6,388 5.6%2010-11 533,160 -0.2% 660,182 -0.4% 7,319 -7.7% 5,911 -7.5%2011-12 Est. 534,886 0.3% 662,000 0.3% 7,622 4.1% 6,158 4.2%2012-13 Est. 533,012 -0.4% 665,000 0.5% 7,590 -0.4% 6,084 -1.2%2013-14 Est. 534,078 0.2% 666,330 0.2% 7,989 5.2% 6,403 5.2%2014-15 Est. 535,146 0.2% 667,663 0.2% 8,556 7.1% 6,858 7.1%
Notes: Excludes revenue outside the school formula like school improvement funds, lottery revenue bonds and federal funds.ADMw is extended ADMw (higher of current or prior year ADMw).Includes students in the state youth corrections program beginning in 1997-98.Includes students in the state youth detention program beginning in 2001-02.
Unweighted (ADM) Weighted (ADMw) $ Per ADM $ Per ADMw
K-12 SCHOOL EQUALIZATION FORMULA REVENUEPer Student
Average Daily State School FundMembership and Formula Local Revenue
$0
$2,000
$4,000
$6,000
$8,000
92-93 94-95 96-97 98-99 00-01 02-03 04-05 06-07 08-09 10-11 12-13 14-15
K-12 School Equalization Formula Revenue per Student
Per ADM Per ADMw

LRO 2/21/2013 G9 Research Report #1-13
Revenue per student increases about 29%. Revenue per weighted student increases about 26%.
Revenue per student adjusted for inflation Revenue per weighted student adjusted for increases about 3%. inflation increases about 1%.
K-12 SCHOOL FINANCIAL TRENDSSTATE AND LOCAL FORMULA REVENUE PER STUDENT
10 Year Comparison
4809.05835 6235.216971
0
1000
2000
3000
4000
5000
6000
7000
1991-92 2001-02
Using ADM (Average Daily Membership)
US CPI US CPI
$6,073 $7,382
$0
$1,000
$2,000
$3,000
$4,000
$5,000
$6,000
$7,000
$8,000
$9,000
2000-01 2010-11
Using ADM (Average Daily Membership)
$4,975 $5,956
$0
$1,000
$2,000
$3,000
$4,000
$5,000
$6,000
$7,000
$8,000
$9,000
2000-01 2010-11
Using Weighted ADM (ADMw)
$7,448 $7,382
$0
$1,000
$2,000
$3,000
$4,000
$5,000
$6,000
$7,000
$8,000
$9,000
2000-01 2010-11
Using ADM Adjusted for Inflation
$6,101 $5,956
$0
$1,000
$2,000
$3,000
$4,000
$5,000
$6,000
$7,000
$8,000
$9,000
2000-01 2010-11
Using Weighted ADM Adjusted for Inflation
Portland-Salem CPI Portland-Salem CPI

LRO: 2/21/2013 G10 Research Report #1-13
K-12 and ESD REVENUE HISTORY
1999-00 2000-01 2001-02 2002-03 2003-04 2004-05 2005-06 2006-07 2007-08 2008-09 2009-10 2010-11 2011-12 2012-13Revenue SourceStateState School Fund $2,246.2 $2,339.2 $2,429.0 $2,146.9 $2,589.8 $2,326.3 $2,566.6 $2,737.7 $2,917.6 $2,911.2 $2,940.1 $2,797.7 $2,879.3 $2,856.8Local K-12Property and Timber Taxes 845.6 873.4 922.7 970.2 1,003.4 1,049.4 1,093.6 1,167.2 1,223.7 1,278.0 1,331.3 1,368.4 1,398.1 1,431.9Other Local 84.0 84.0 77.0 94.0 77.5 98.9 112.2 120.2 127.5 102.1 97.9 97.6 81.1 74.6Excluded from Formula -23.1 -22.1 -22.6 -19.5 -19.5 -21.7 0.0 -15.5 -16.5 -17.3 -17.9 -18.1 -18.7 -19.4
906.4 935.3 977.2 1,044.8 1,061.3 1,126.6 1,205.8 1,271.9 1,334.7 1,362.9 1,411.3 1,447.9 1,460.5 1,487.1Local ESDProperty Tax 61.8 63.2 66.6 70.1 72.2 75.1 79.4 83.3 87.1 90.5 94.9 98.0 100.4 103.1Shared with K-12 -3.9 -3.8 -3.6 -3.3 0.0 0.0 0.0 0.0 0.0 0.0 0.0 0.0 0.0 0.0
57.8 59.3 62.9 66.9 72.2 75.1 79.4 83.3 87.1 90.5 94.9 98.0 100.4 103.1
Total Sources 3,210.5 3,333.8 3,469.1 3,258.6 3,723.3 3,527.9 3,851.7 4,092.8 4,339.3 4,364.6 4,446.3 4,343.6 4,440.3 4,447.0
Revenue AllocationESDDistricts 148.7 148.7 157.3 145.8 176.1 170.6 192.0 191.8 204.9 205.8 210.0 205.1 193.1 199.0OPEN Technology/Testing 1.1 1.1 0.0 0.0 0.0 0.0 0.0 0.0 0.6 0.6 0.6 0.6 0.5 0.5K-12 SchoolCategorical Grants 0.4 0.4 0.4 0.4 0.0 0.0 1.0 1.0 1.4 8.2 1.2 1.2 1.2 1.2Small High School Grants 4.6 4.5 2.5 2.5 2.5 2.5 2.5 2.5 2.5 2.5 2.5 2.5State Special Education 7.2 7.4 7.3 7.1 7.2 9.8 10.1 9.8 9.4 9.4 9.7 9.7Youth Corrections & Detention 10.6 10.9 13.0 12.1 11.0 10.3 11.0 11.9 12.0 12.5 10.3 10.4 7.5 7.5District Equalization Formula 3,046.0 3,173.1 3,286.3 3,081.9 3,520.3 3,331.9 3,630.3 3,869.0 4,099.7 4,119.1 4,207.4 4,109.0 4,220.9 4,221.2Misc. & Prior Year Corrections 0.5 -0.4 0.2 6.4 6.0 5.4 7.6 6.9 8.2 6.2 5.0 5.5 5.0 5.5StateOver Cap for Lottery Bonds 3.1 0.0 0.0 0.0 0.0 0.0 0.0 0.0 0.0 0.0 0.0 0.0 0.0 0.0
Total Allocation 3,210.5 3,333.8 3,469.1 3,258.6 3,723.3 3,527.9 3,851.7 4,092.8 4,339.3 4,364.6 4,446.3 4,343.6 4,440.3 4,447.0
Other State RevenueK-12 Lottery-Backed Bonds 56.0 71.0 0.0 0.0 0 0 0 0 0 0 0 0 0 0K-12 Other/School Improvement 27.0 27.0 108.0 0.0 0.0 0.0 0.0 0.0 126.6 124.7 0.0 0.0 0.0 0.0
Notes: Dollars in millions.
Estimates Estimates

LRO 2/21/2013 G11 Research Report #1-13
State Rank Total Local State FederalWyoming 2 19,497 8,025 10,053 1,419Alaska 5 17,759 3,848 11,104 2,808Hawaii 12 14,234 495 11,617 2,122U.S. 12,111 5,304 5,266 1,540Washingrton 27 11,414 3,366 6,695 1,353Montana 28 11,398 4,252 5,317 1,829New Mexico 30 11,246 1,755 7,131 2,360OREGON 35 10,657 4,194 5,055 1,409Colorado 36 10,635 5,121 4,637 877California 39 10,239 3,278 5,547 1,414Nevada 41 10,048 5,913 3,279 856Arizona 44 9,343 3,971 3,615 1,757Idaho 49 8,044 1,721 4,648 1,675Utah 50 7,925 2,877 4,054 995
Source: National Center for Education Statistics, Revenue, 2009-10Notes: Numbers may not be completely comparable due to state definitional differences. Students is fall enrollment. Includes intermediate in local.
2009-10 REVENUE PER STUDENT WESTERN STATES COMPARISON BY SOURCE
0% 20% 40% 60% 80% 100%
Nevada
Colorado
U.S.
Arizona
Wyoming
OREGON
Montana
Utah
California
Washingrton
Alaska
Idaho
New Mexico
Hawaii
Local State Federal

LRO 2/21/2013 H1 Research Report #1-13
HIGHWAY and TRANSPORTATION TAXES Highway finance interacts with several aspects of Transportation policy and regulations. However, the following major revenue sources constitute the five pillars of Highway finance in Oregon: Fuel taxes include Motor Fuel Tax (gasoline) and Use fuel tax (diesel, natural gas, etc.) currently at 30 cents per gallon. Motor Fuel Tax is paid by the wholesaler and is included in the price at the pump. Non-highway or exempt users can apply for refunds of the taxes they paid. Use-Fuel tax is paid by the retailer when purchased for highway use. Heavy vehicles pay the weight-mile taxes and not fuel tax. Weight-Mile taxes (WMT) on heavy vehicles (trucks) are paid monthly to the Motor Carrier Division of the Department of Transportation for each mile traveled on Oregon roads. The cost per mile is based on the declared gross weight of the truck. The rate schedule ranges, in 2,000-pound increments, from 26,000 to 105,500. The rates increase from 4.98 cents per mile to 16.38 cents per mile for trucks below 80,000 pounds. The rates for trucks over 80,000 lb. increase while allowing a discount for a higher number of axles on the truck (table B). Over weight and dimensional vehicles pay additional fees. Log, sand, gravel, wood chip and other dump trucks may elect to pay monthly fees in lieu of weight-mile taxes (flat fees). These are based on gross vehicle weight and do not vary with miles traveled. Motor vehicle registration fees are imposed on cars and trucks. Cars and other vehicles less than 8,000 pounds pay $86 a biennium or $172 for a new vehicle 4 year registration (Since HB 2001 was effective on Oct, 1, 2009). Truck registration fees are based on gross weight. Fees for vehicles with weights below 26,000 lb. range from $391 to $764. Registrations for trucks heavier than 26,000 lb. rang from $375 to $1,295. Nonprofit organizations, tow trucks, and farm vehicles pay reduced fees based on separate registration schedules. Vehicle Titling Fees are imposed on cars and trucks. Vehicles under 26,000 pounds pay $77 and vehicles over 26,000 pounds pay $90. Salvage and duplicate titles are $27. Bonding started taking a bigger role in funding transportation with the introduction of the Oregon Transportation Improvement Act (OTIA) in 2001). OTIA I (HB 2142) dedicated $71.2 million a biennium for debt service on $400 million bonds for modernization projects. OTIA II (HB 4010 of 2002 first special session) took an advantage of lower interest rates and increased the limit on net proceeds to $500 million. OTIA III (HB 2041 of the 2003 session) increased most fees and rates to provide debt service for $1.6 billion in bond proceeds for bridge repair and replacement, and $300 million in net proceeds for highway modernization. HB 2001 of the 2009 session (Jobs and Transportation Act allowed new bonding for projects using $70 million from the new revenue for annual debt service. The above revenue sources makeup the majority of state funds available for highways. There are, however, other fees on recreational vehicles, motor homes, personalized license plates, and driver’s licenses. The different fees address multiple facets of the operation or regulation of the transportation system, and some of the fees are dedicated to non-highway uses such as state parks. Connect Oregon (I, II, and III), which includes multimodal projects were financed mostly by Lottery backed bonding.
Highway Fund The Oregon Constitution requires all tax revenues levied upon ownership or operation of motor vehicles (except recreational vehicle) be used for road related expenditures. In 1999, the cost responsibility clause was added to require that light and heavy vehicles pay fees in proportion to the costs exacted on the system by each vehicle class. Net revenues from the dedicated taxes and fees are deposited in the Highway Fund. The Highway Fund is distributed among the state,
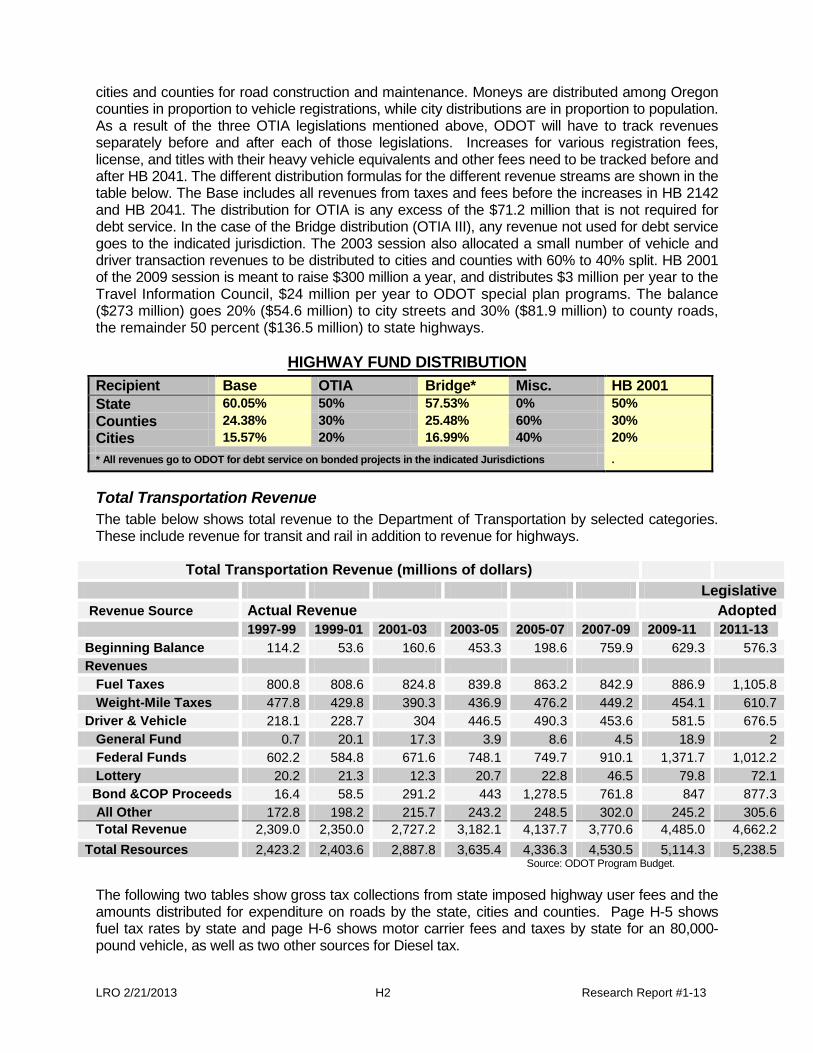
LRO 2/21/2013 H2 Research Report #1-13
cities and counties for road construction and maintenance. Moneys are distributed among Oregon counties in proportion to vehicle registrations, while city distributions are in proportion to population. As a result of the three OTIA legislations mentioned above, ODOT will have to track revenues separately before and after each of those legislations. Increases for various registration fees, license, and titles with their heavy vehicle equivalents and other fees need to be tracked before and after HB 2041. The different distribution formulas for the different revenue streams are shown in the table below. The Base includes all revenues from taxes and fees before the increases in HB 2142 and HB 2041. The distribution for OTIA is any excess of the $71.2 million that is not required for debt service. In the case of the Bridge distribution (OTIA III), any revenue not used for debt service goes to the indicated jurisdiction. The 2003 session also allocated a small number of vehicle and driver transaction revenues to be distributed to cities and counties with 60% to 40% split. HB 2001 of the 2009 session is meant to raise $300 million a year, and distributes $3 million per year to the Travel Information Council, $24 million per year to ODOT special plan programs. The balance ($273 million) goes 20% ($54.6 million) to city streets and 30% ($81.9 million) to county roads, the remainder 50 percent ($136.5 million) to state highways.
HIGHWAY FUND DISTRIBUTION Recipient Base OTIA Bridge* Misc. HB 2001 State 60.05% 50% 57.53% 0% 50% Counties 24.38% 30% 25.48% 60% 30% Cities 15.57% 20% 16.99% 40% 20%
* All revenues go to ODOT for debt service on bonded projects in the indicated Jurisdictions .
Total Transportation Revenue The table below shows total revenue to the Department of Transportation by selected categories. These include revenue for transit and rail in addition to revenue for highways.
Total Transportation Revenue (millions of dollars) Legislative Revenue Source Actual Revenue Adopted 1997-99 1999-01 2001-03 2003-05 2005-07 2007-09 2009-11 2011-13 Beginning Balance 114.2 53.6 160.6 453.3 198.6 759.9 629.3 576.3 Revenues Fuel Taxes 800.8 808.6 824.8 839.8 863.2 842.9 886.9 1,105.8 Weight-Mile Taxes 477.8 429.8 390.3 436.9 476.2 449.2 454.1 610.7 Driver & Vehicle 218.1 228.7 304 446.5 490.3 453.6 581.5 676.5 General Fund 0.7 20.1 17.3 3.9 8.6 4.5 18.9 2 Federal Funds 602.2 584.8 671.6 748.1 749.7 910.1 1,371.7 1,012.2 Lottery 20.2 21.3 12.3 20.7 22.8 46.5 79.8 72.1 Bond &COP Proceeds 16.4 58.5 291.2 443 1,278.5 761.8 847 877.3 All Other 172.8 198.2 215.7 243.2 248.5 302.0 245.2 305.6 Total Revenue 2,309.0 2,350.0 2,727.2 3,182.1 4,137.7 3,770.6 4,485.0 4,662.2 Total Resources 2,423.2 2,403.6 2,887.8 3,635.4 4,336.3 4,530.5 5,114.3 5,238.5
Source: ODOT Program Budget. The following two tables show gross tax collections from state imposed highway user fees and the amounts distributed for expenditure on roads by the state, cities and counties. Page H-5 shows fuel tax rates by state and page H-6 shows motor carrier fees and taxes by state for an 80,000-pound vehicle, as well as two other sources for Diesel tax.

LRO 2/21/2013 H3 Research Report #1-13
MOTOR VEHICLE AND FUEL TAX REVENUESGross Tax Collections* (millions)
Fuel Tax Weight-Mile Tax Registration & License Total CollectionsFiscal % of % of % ofYear Amount Total Amount Total Amount Total Amount Growth
1970-71 72.7 60.2% 25.9 21.4% 22.2 18.4% 120.8 1971-72 78.6 58.1% 30.4 22.5% 26.3 19.4% 135.3 12.0%1972-73 83.4 58.1% 34.1 23.8% 26.0 18.1% 143.5 6.1%1973-74 80.4 52.7% 36.2 23.7% 36.0 23.6% 152.6 6.3%1974-75 82.7 54.1% 37.0 24.2% 33.1 21.7% 152.8 0.1%1975-76 86.1 54.2% 39.3 24.7% 33.5 21.1% 158.9 4.0%1976-77 90.6 52.1% 43.3 24.9% 40.0 23.0% 173.9 9.4%1977-78 95.7 51.1% 50.8 27.1% 40.7 21.7% 187.2 7.6%1978-79 99.2 49.8% 56.5 28.4% 43.3 21.8% 199.0 6.3%1979-80 92.4 46.6% 60.1 30.3% 45.9 23.1% 198.4 -0.3%1980-81 88.8 44.8% 58.8 29.6% 50.8 25.6% 198.4 0.0%1981-82 90.6 45.4% 60.0 30.1% 48.9 24.5% 199.5 0.6%1982-83 96.6 45.2% 65.2 30.5% 51.9 24.3% 213.7 7.1%1983-84 104.9 44.6% 76.4 32.5% 54.1 23.0% 235.4 10.2%1984-85 118.6 45.2% 89.1 34.0% 54.7 20.8% 262.4 11.5%1985-86 132.0 45.1% 105.6 36.1% 55.1 18.8% 292.7 11.5%1986-87 151.5 46.3% 116.6 35.6% 59.0 18.0% 327.1 11.8%1987-88 168.3 46.1% 135.0 37.0% 61.6 16.9% 364.9 11.6%1988-89 200.6 48.9% 139.5 34.0% 69.7 17.0% 409.9 12.3%1989-90 231.1 49.5% 155.3 33.3% 80.5 17.2% 467.0 13.9%1990-91 257.6 51.2% 161.1 32.0% 84.5 16.8% 503.2 7.8%1991-92 290.2 52.8% 173.2 31.5% 86.2 15.7% 549.6 9.2%1992-93 302.3 52.5% 179.1 31.1% 94.5 16.4% 575.9 4.8%1993-94 345.9 54.4% 191.4 30.1% 98.6 15.5% 635.9 10.4%1994-95 357.8 54.3% 201.3 30.6% 99.5 15.1% 658.6 3.6%1995-96 368.1 54.5% 203.3 30.1% 104.1 15.4% 675.6 2.6%1996-97 370.2 53.9% 206.9 30.1% 109.3 15.9% 686.4 1.6%1997-98 375.6 53.9% 209.9 30.1% 111.3 16.0% 696.9 1.5%1998-99 387.9 54.1% 215.7 30.1% 113.1 15.8% 716.7 2.8%1999-00 386.4 53.2% 225.4 31.0% 114.6 15.8% 726.4 1.4%2000-01 386.2 54.7% 202.7 28.7% 117.6 16.6% 706.5 -2.7%2001-02 388.8 53.9% 187.9 26.0% 144.7 20.1% 721.4 2.1%2002-03 387.0 52.7% 192.4 26.2% 154.7 21.1% 734.1 1.8%2003-04 387.3 48.6% 211.2 26.5% 199.0 25.0% 797.5 8.6%2004-05 398.1 45.2% 237.0 26.9% 245.4 27.9% 880.5 10.4%2005-06 401.6 45.0% 243.0 27.3% 247.0 27.7% 891.6 1.3%2006-07 400.7 45.1% 242.0 27.3% 245.2 27.6% 887.9 -0.4%2007-08 398.4 45.3% 241.6 27.5% 239.6 27.2% 879.6 -0.9%2008-09 382.6 47.0% 214.4 26.3% 217.5 26.7% 814.5 -7.4%2009-10 390.5 43.6% 209.8 23.4% 295.9 33.0% 896.2 10.0%2010-11 429.0 42.4% 248.0 24.5% 334.7 33.1% 1,011.7 12.9%2011-12 475.5 43.8% 267.0 24.6% 343.5 31.6% 1,086.0 7.3%
* Exclusive of dedicated revenue such as recreational vehicle fees and custom license plates.
0
200
400
600
800
1000
1200
Mill
ions
of D
olla
rs
MOTOR VEHICLE AND FUEL TAX REVENUE
Registration
Weight-Mile
Fuel

LRO 2/21/2013 H4 Research Report #1-13
NET HIGHWAY FUND REVENUE(millions)
Total Net HighwayFiscal Highway Less Transfers to State FundYear Fund Cities Counties Revenue Growth
1971-72 120.8 14.0 23.8 83.0 7.5%1972-73 132.5 15.1 25.8 91.6 9.7%1973-74 138.0 16.3 27.1 94.6 4.2%1974-75 137.6 21.1 28.9 87.6 -0.3%1975-76 136.2 18.6 30.8 86.8 -1.0%1976-77 152.5 18.4 30.5 103.6 12.0%1977-78 155.5 18.4 30.6 106.5 2.0%1978-79 174.7 21.1 35.1 118.5 12.3%1979-80 170.8 20.7 34.1 116.0 -2.2%1980-81 170.3 21.0 34.6 114.7 -0.3%1981-82 166.7 19.9 32.9 113.9 -2.1%1982-83 184.0 22.4 36.9 124.7 10.4%1983-84 196.6 23.4 38.9 134.3 6.8%1984-85 221.9 27.0 44.3 150.6 12.9%1985-86 243.8 29.9 49.2 164.7 9.9%1986-87 277.4 36.3 58.4 182.7 13.8%1987-88 305.6 41.3 66.6 197.7 10.2%1988-89 356.6 50.0 80.0 226.6 16.7%1989-90 399.1 59.8 94.4 244.9 11.9%1990-91 442.9 69.0 108.1 265.8 11.0%1991-92 468.8 73.1 114.5 281.2 5.8%1992-93 510.2 79.4 124.4 306.4 8.8%1993-94 546.9 85.1 133.3 328.5 7.2%1994-95 569.5 88.2 138.3 343.0 4.1%1995-96 568.8 88.3 138.5 342.0 -0.1%1996-97 571.0 89.6 140.6 340.8 0.4%1997-98 578.7 89.6 140.6 348.5 1.4%1998-99 605.3 93.7 147.1 364.5 4.6%1999-00 626.1 97.0 152.2 377.0 3.4%2000-01 626.4 97.0 152.2 377.2 0.0%2001-02 617.4 95.3 149.2 372.9 -1.4%2002-03 651.7 95.9 150.2 405.6 5.5%2003-04 675.9 106.2 165.5 404.2 3.7%2004-05 774.9 117.8 168.5 488.6 14.6%2005-06 775.4 120.4 174.0 481.0 0.1%2006-07 779.8 118.8 172.3 488.7 0.6%2007-08 765.5 113.5 163.9 488.1 -1.8%2008-09 685.5 102.0 146.7 436.9 -10.5%2009-10 746.9 110.4 159.2 477.2 9.0%2010-11 841.6 128.1 185.5 528.0 12.7%2011-12 931.6 146.4 212.7 572.4 10.7% Source: Oregon Department of Transportation
0
100
200
300
400
500
600
700
800
900
1000
Mill
ions
of D
olla
rs
Fiscal Year Ending
NET HIGHWAY FUND REVENUE
City Share
County Share
State Share

LRO: 2/21/2013 H 5 Research Report #1-13
AddSales
State Excise Add'l Total Rank Excise Add'l Total Rank Excise Add'l Total Rank Tax OtherAlabama /1 16 2 18 41 19 19 39 16 2 18 41 Inspection feeAlaska 8 8 51 8 8 51 8 8 51 0Arizona 18 19 37 26 27 17 18 19 37 /9 LUST TaxArkansas 21.5 21.8 29 22.5 22.8 30 21.5 21.8 28 Environmental feeCalifornia 36 43 1 10 39 2 36 43 1 Y Includes prepaid sales tax /8Colorado 22 22 27 20.5 20.5 35 22 22 26Connecticut 25 25 18 51.2 51.2 1 25 25 18Delaware 23 23 25 22 22 32 23 23 24 Plus 0.9% GRTDist. of Columbia 23.5 23.5 23 23.5 23.5 26 23.5 23.5 22Florida /2 4 12.9 16.9 47 18.9 12.9 31.8 9 4 12.9 16.9 47 Y Sales tax added to excise /2Georgia 7.5 12 19.5 36 7.5 14.5 22 32 7.5 12 19.5 36 Y Sales tax added to exciseHawaii /1 17 0.0 17 45 17 0.0 17 45 17 0 17 45 Y Sales tax additionalIdaho 25 1 26 16 25 1 26 19 25 1 26 16 Clean water tax /7Illinois /1 19 1.1 20.1 33 21.5 1.1 22.6 31 19 1.1 20.1 32 Y Sales tax add., env. & LUST fee /3Indiana 18 0.0 18 41 16 0.0 16 47 18 0 18 41 Y Sales tax additional /3Iowa 21 1.0 22 27 22.5 1.0 23.5 26 19 1 20 33 Environmental feeKansas 24 0.0 24 20 26 0.0 26 19 24 0 24 20Kentucky 28.5 1.4 29.9 10 25.5 1.4 26.9 18 28.5 1.4 29.9 10 Environmental fee /4 /3Louisiana 20 0.1 20.125 32 20 0.1 20.125 36 20 0.125 20.125 31Maine 30 0.0 30 8 31.2 0.0 31.2 10 30 0 30 8 /5Maryland 23.5 0.0 23.5 23 24.25 0.0 24.25 24 23.5 0 23.5 22Massachusetts 21 0.0 21 31 21 0.0 21 34 21 0 21 30Michigan 19 0.0 19 37 15 0.0 15 48 19 0 19 37 Y Sales tax additionalMinnesota 28.5 0.1 28.6 11 28.5 0.1 28.6 13 28.5 0.1 28.6 11 Inspect fee /5Mississippi 18 0.4 18.4 40 18 0.4 18.4 40 18 0.4 18.4 40 Environmental feeMissouri 17 0.3 17.3 44 17 0.3 17.3 44 17 0.3 17.3 44 Inspection feeMontana 27 0.0 27 13 27.75 0.0 27.75 15 27 0 27 13Nebraska 24.6 0.9 25.5 17 24.6 0.3 24.9 21 24.6 0.9 25.5 17 Petroleum fee /5Nevada /1 23 0.805 23.805 22 27 0.75 27.75 15 23 0.805 23.805 21 Inspection & cleanup feeNew Hampshire 18 1.625 19.625 35 18 1.625 19.625 38 18 1.625 19.625 35 Oil discharge cleanup feeNew Jersey 10.5 4 14.5 49 13.5 4 17.5 42 10.5 4 14.5 49 Petroleum feeNew Mexico 17 1.875 18.875 39 21 1.875 22.875 29 17 1.875 18.875 39 Petroleum loading feeNew York 8 18.6 26.6 15 8 16.85 24.85 22 8 18.6 26.6 15 Y Petroleum Tax, Sales tax aditionalNorth Carolina 37.5 0.25 37.75 2 37.5 0.25 37.75 4 37.5 0.25 37.75 2 /4 Inspection taxNorth Dakota 23 0.0 23 25 23 0.0 23 28 23 0 23 24Ohio 28 0.0 28 12 28 0.0 28 14 28 0 28 12 Plus 3 cents commericalOklahoma 16 1 17 45 13 1 14 49 16 1 17 45 Environmental feeOregon /1 30 0 30 8 30 0 30 11 30 0 30 8Pennsylvania 12 19.2 31.2 7 12 26.1 38.1 3 12 19.2 31.2 7 Oil franchise taxRhode Island 32 1 33 5 32 1 33 7 32 1 33 5 LUST taxSouth Carolina 16 0.8 16.75 48 16 0.8 16.75 46 16 0.75 16.75 48 Inspection fee & LUST taxSouth Dakota /1 22 2.0 24 20 22 2.0 24 25 20 2 22 26 Inspection feeTennessee /1 20 1.4 21.4 30 17 1.4 18.4 40 20 1.4 21.4 29 Petroleum Tax & Envir. FeeTexas 20 0.0 20 34 20 0.0 20 37 20 0 20 33Utah 24.5 0.0 24.5 19 24.5 0.0 24.5 23 24.5 0 24.5 19Vermont 19 7.68 26.68 14 25 4 29 12 19 7.68 26.68 14 Cleanup Fee & Trans. FeeVirginia /1 17.5 0.0 17.5 43 17.5 0.0 17.5 42 17.5 0 17.5 43 /6Washington /8 37.5 0.0 37.5 3 37.5 0.0 37.5 5 37.5 0 37.5 3 0.5% privilege taxWest Virginia 20.5 14.2 34.7 4 20.5 14.2 34.7 6 20.5 14.2 34.7 4 Y Sales tax added to exciseWisconsin 30.9 2 32.9 6 30.9 2 32.9 8 30.9 2 32.9 6 Petroleum Insp. FeeWyoming 13 1 14 50 13 1 14 49 13 1 14 50 License taxFederal 18.3 0.1 18.4 24.3 0.1 24.4 13 0.1 13.1
SOURCE: Compiled by FTA from various sources.
/1 Tax rates do not include local option taxes. In AL, 1 - 3 cents; HI, 8.8 to 18.0 cent; IL, 5 cents in Chicago and 6 cents in Cook county
(gasoline only); NV, 4.0 to 9.0 cents; OR, 1 to 3 cents; SD and TN, one cent; and VA 2%.
/2 Local taxes for gasoline and gasohol vary from 10.8 cents to 18.9 cents. Plus a 1.9 cent per gallon pollution tax.
/3 Carriers pay an additional surcharge equal to IL-21.0 cents (g) 19.5 cents (d), IN-11 cents, KY-2% (g) 4.7% (d).
/4 Tax rate is based on the average wholesale price and is adjusted quarterly. The actual rates are: KY, 9%; and NC, 17.5¢ + 7%.
/5 Portion of the rate is adjustable based on maintenance costs, sales volume, cost of fuel to state government, or inflation.
/6 Large trucks pay an additional 3.5 cents.
/7 Tax rate is reduced by the percentage of ethanol used in blending (reported rate assumes the max. 10% ethanol).
/8 Califonia Gasoline subject to 2.25% sales tax. Diesel subject to a 9% sales tax.
/9 Diesel rate specified is the fuel use tax rate on large trucks. Small vehicles are subject to 18 cent tax rate.
Gasohol Tax Rates
Motor Fuel Tax Rates (cents per gallon)January 1, 2013
Gasoline Tax Rates Diesel Fuel Tax Rates
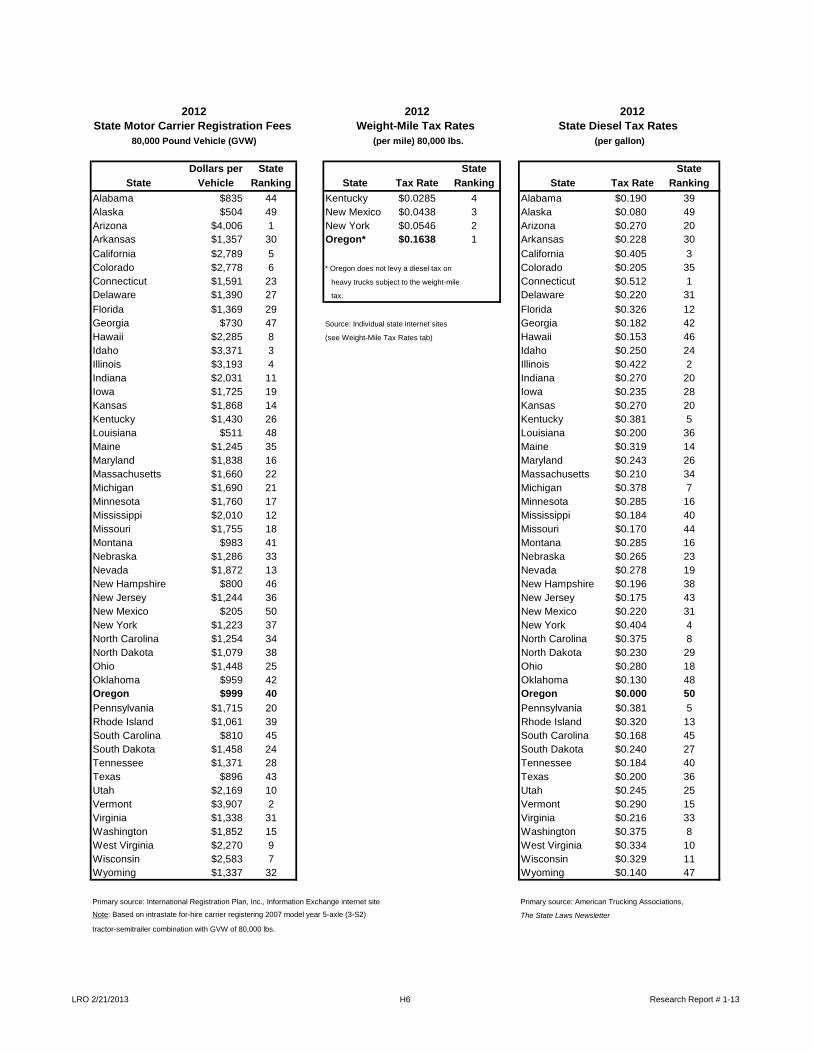
LRO 2/21/2013 H6 Research Report # 1-13
2012 2012Weight-Mile Tax Rates
(per mile) 80,000 lbs.
Dollars per State State StateState Vehicle Ranking State Tax Rate Ranking State Tax Rate Ranking
Alabama $835 44 Kentucky $0.0285 4 Alabama $0.190 39Alaska $504 49 New Mexico $0.0438 3 Alaska $0.080 49Arizona $4,006 1 New York $0.0546 2 Arizona $0.270 20Arkansas $1,357 30 Oregon* $0.1638 1 Arkansas $0.228 30California $2,789 5 California $0.405 3Colorado $2,778 6 * Oregon does not levy a diesel tax on Colorado $0.205 35Connecticut $1,591 23 heavy trucks subject to the weight-mile Connecticut $0.512 1Delaware $1,390 27 tax. Delaware $0.220 31Florida $1,369 29 Florida $0.326 12Georgia $730 47 Source: Individual state internet sites Georgia $0.182 42Hawaii $2,285 8 (see Weight-Mile Tax Rates tab) Hawaii $0.153 46Idaho $3,371 3 Idaho $0.250 24Illinois $3,193 4 Illinois $0.422 2Indiana $2,031 11 Indiana $0.270 20Iowa $1,725 19 Iowa $0.235 28Kansas $1,868 14 Kansas $0.270 20Kentucky $1,430 26 Kentucky $0.381 5Louisiana $511 48 Louisiana $0.200 36Maine $1,245 35 Maine $0.319 14Maryland $1,838 16 Maryland $0.243 26Massachusetts $1,660 22 Massachusetts $0.210 34Michigan $1,690 21 Michigan $0.378 7Minnesota $1,760 17 Minnesota $0.285 16Mississippi $2,010 12 Mississippi $0.184 40Missouri $1,755 18 Missouri $0.170 44Montana $983 41 Montana $0.285 16Nebraska $1,286 33 Nebraska $0.265 23Nevada $1,872 13 Nevada $0.278 19New Hampshire $800 46 New Hampshire $0.196 38New Jersey $1,244 36 New Jersey $0.175 43New Mexico $205 50 New Mexico $0.220 31New York $1,223 37 New York $0.404 4North Carolina $1,254 34 North Carolina $0.375 8North Dakota $1,079 38 North Dakota $0.230 29Ohio $1,448 25 Ohio $0.280 18Oklahoma $959 42 Oklahoma $0.130 48Oregon $999 40 Oregon $0.000 50Pennsylvania $1,715 20 Pennsylvania $0.381 5Rhode Island $1,061 39 Rhode Island $0.320 13South Carolina $810 45 South Carolina $0.168 45South Dakota $1,458 24 South Dakota $0.240 27Tennessee $1,371 28 Tennessee $0.184 40Texas $896 43 Texas $0.200 36Utah $2,169 10 Utah $0.245 25Vermont $3,907 2 Vermont $0.290 15Virginia $1,338 31 Virginia $0.216 33Washington $1,852 15 Washington $0.375 8West Virginia $2,270 9 West Virginia $0.334 10Wisconsin $2,583 7 Wisconsin $0.329 11Wyoming $1,337 32 Wyoming $0.140 47
Primary source: International Registration Plan, Inc., Information Exchange internet site Primary source: American Trucking Associations,
Note: Based on intrastate for-hire carrier registering 2007 model year 5-axle (3-S2) The State Laws Newsletter
tractor-semitrailer combination with GVW of 80,000 lbs.
2012State Motor Carrier Registration Fees State Diesel Tax Rates
80,000 Pound Vehicle (GVW) (per gallon)
LRO 2/21/2013 I1 Research Report #1-13
TIMBER TAXATION A Brief History Prior to 1929, all private forestland in Oregon (8 million acres) was taxed based on the value of standing timber and the land beneath it. At the time, it was common for landowners to log old growth, and to not invest further in replanting. Lands would often revert to farm or urban uses after being logged. Some lands even reverted to county ownership, as private landowners stopped paying property taxes on logged lands that were viewed as worthless. In response to these foreclosures, the 1929 Legislature implemented an optional Forest Fee and Yield tax. The tax applied to reforestation lands (860,000 acres) and allowed taxation on the value of timber upon the cutting of trees rather than a property tax each year as the trees grew. Forests that qualified as reforestation lands were subject to a 5 cents per acre “forest fee” annually as well as a 12.5% “Yield Tax” on the value of timber that was harvested. This system continued until it was repealed in 1977. In 1947, a Forest Products Harvest Tax was imposed per thousand board feet on all merchantable harvests from both public and private land (first 25,000 bf exempt). Under 1961 legislation, most Western Oregon land was subject to partial property tax exemption where all timber under 12’’ in diameter was exempt from property tax due to its designation as “reproduction timber.” Larger trees were placed on the property tax roll at a percentage of their immediate harvest value. In the year of harvest, the local property tax rate was applied to 70% of the value of the harvested timber. For small tracts, the Western Oregon Small Tract Optional Tax (WOSTOT) allowed small forestland owners to pay property tax on the productivity value of qualified forestland (200,000 acres). Forest land’s productivity value was categorized by site class ranked I (most productive) through V (least productive) and values were set accordingly. Eastern Oregon began a severance tax during this time, where owners paid 5% of the market value of all private timber harvested. Beginning in 1962 (eastern Oregon) and in 1978 (western Oregon), severance taxes on timber harvest were imposed on the value of timber harvested in lieu of property tax on the value of standing timber (not applicable to forestland under WOSTOT). The 1977 Legislature repealed the Forest Fee and Yield Tax, returning the reforestation lands to the regular program phased in over the next 20 years. State collected severance taxes were distributed to local taxing districts as an offset to property taxes. In 1991, in response to Measure 5 (1990), severance taxes were converted to privilege taxes with temporary rate reductions. The 1993 Legislature exempted standing timber from property tax, set new statutory forestland values, assessed forestland at 20% of the statutory value, reduced privilege tax rates, and completed the transition for reforestation lands. Privilege taxes were imposed in lieu of property tax on 80% of forestland value. Under Measure 50 (1997), WOSTOT productivity values were converted to statutory forestland values and maximum assessed values were established for all forestland (see RR #6-00 for more detail). The 1999 Legislature phased in a new program for forestland in ownerships of 5,000 or more acres and the 2001 Legislature extended this program to all forestland as of 2003. Forestland was assessed at 100% of the lesser of its maximum specially assessed value or its specially assessed value as determined by the Department of Revenue (Department). Privilege taxes were repealed. The 2003 Legislature passed HB 2197, which extended the 1999 phase in for one year for ownerships of less than 5,000 acres and created an optional Small Tract Forestland (STF) program (see below). The 2005 Legislature simplified the time requirements for filers who apply for a continued classification of a parcel as STF; and clarified

LRO 2/21/2013 I2 Research Report #1-13
that unless the Tax Assessor determines that the property does not constitute forestland, a disqualified STF parcel will automatically be qualified as either Western or Eastern Oregon forestland. A $200 late filing fee was also enacted for applications for continued classification as STF parcels if the applications are filed after a 30 day notification period has ended. Current Law As of July 1, 2004, all forestland is subject to the Forest Products Harvest Tax and all private forestland is taxed under the Oregon Forestland program (sometimes referred to either as the 100% program or the industrial program) unless the owner elects to have qualified parcels taxed under the Small Tract Forestland (STF) program. Under the Oregon Forestland program, forestland is assessed for property tax at the lesser of either its maximum specially assessed value or its specially assessed value as determined by the Department. There are no privilege or severance taxes imposed at the time of harvest other than the Forest Products Harvest Tax. The Forest Products Harvest Tax Rate is established annually. Under the STF program, forestland has an assessed value equal to 20% of the specially assessed forestland values determined by the Department. The 2012-13 values are shown in the table below. The amount of tax that is not imposed due to the 80% reduction is recovered when a severance tax is applied to harvested timber. The severance tax applies to the net volume of logs from harvested timber. The Forest Products Harvest Tax also applies to this volume. The severance tax rates for calendar year 2012 are $4.88 (Western Oregon) and $3.80 (Eastern Oregon) per 1,000 board feet harvested. These rates are indexed annually in proportion to the increase in value of forestland in the Program in each area. For a parcel of forestland to qualify for the STF program, it must be held in common ownership of at least 10 acres but less than 5,000 acres of Oregon forestland and meet minimum stocking and species requirements. The owner must apply to the relevant county assessor(s) and the application must include all forestland owned in contiguous parcels. Assessors must disqualify forestland from the STF program if it fails to meet minimum stocking and species requirements or becomes part of an ownership of less than 10 acres or more than 5,000 acres. Disqualification from the program is subject to additional taxes equal to the tax on the 80% of value not assessed while in the program to a maximum of 10 years. The values per acre shown in the table below are the maximum assessed values for forest land in the Oregon Forestland program (OFP) and the value limits for forest land in the Small Tract Forestland program (STF). 2012-13 Limit on Per Acre Forestland Value Site Class by Region OFP STF Western Oregon FA $587.11
$116.50
FB $465.77 $92.44 FC $390.08 $77.23 FD $331.37 $65.83 FE $220.46 $43.04 FF $159.13 $31.63 FG $66.51 $12.61 FX $7.79 $1.24 Eastern Oregon $66.51 $12.61
The historically complex distribution system for privilege taxes has been eliminated. Property taxes on forestland are treated like any other property taxes. The severance taxes under the
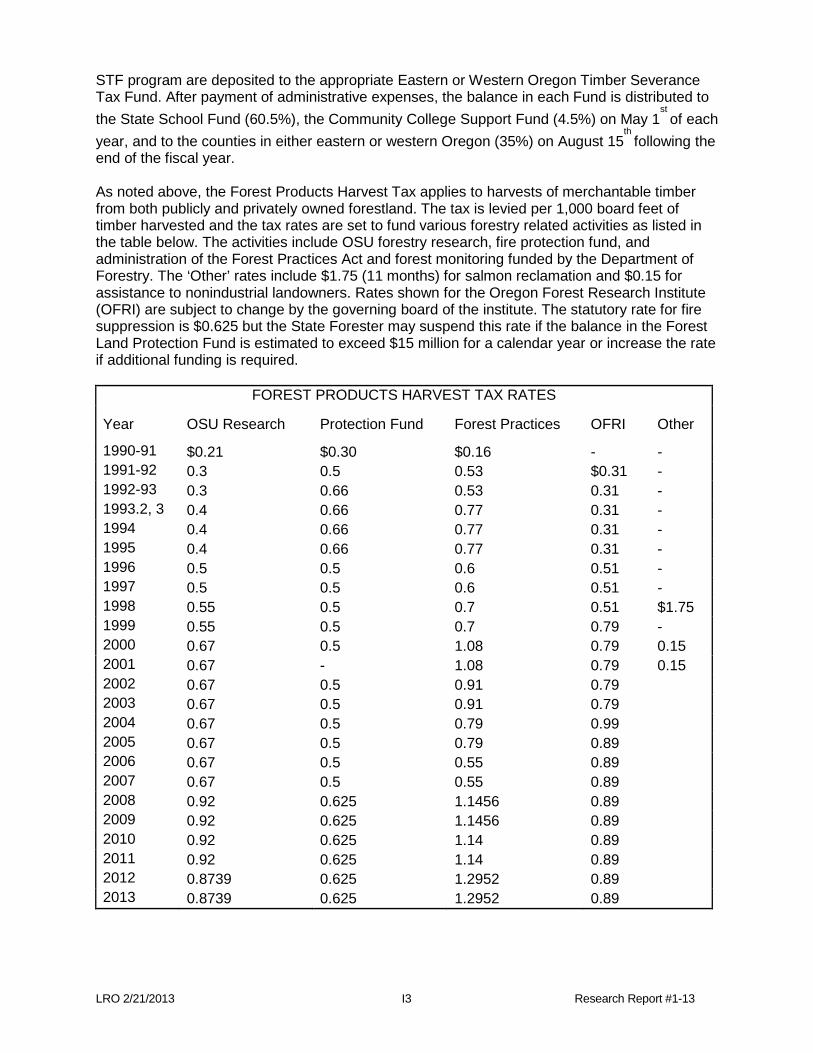
LRO 2/21/2013 I3 Research Report #1-13
STF program are deposited to the appropriate Eastern or Western Oregon Timber Severance Tax Fund. After payment of administrative expenses, the balance in each Fund is distributed to the State School Fund (60.5%), the Community College Support Fund (4.5%) on May 1
st of each
year, and to the counties in either eastern or western Oregon (35%) on August 15th
following the end of the fiscal year. As noted above, the Forest Products Harvest Tax applies to harvests of merchantable timber from both publicly and privately owned forestland. The tax is levied per 1,000 board feet of timber harvested and the tax rates are set to fund various forestry related activities as listed in the table below. The activities include OSU forestry research, fire protection fund, and administration of the Forest Practices Act and forest monitoring funded by the Department of Forestry. The ‘Other’ rates include $1.75 (11 months) for salmon reclamation and $0.15 for assistance to nonindustrial landowners. Rates shown for the Oregon Forest Research Institute (OFRI) are subject to change by the governing board of the institute. The statutory rate for fire suppression is $0.625 but the State Forester may suspend this rate if the balance in the Forest Land Protection Fund is estimated to exceed $15 million for a calendar year or increase the rate if additional funding is required.
FOREST PRODUCTS HARVEST TAX RATES
Year OSU Research Protection Fund Forest Practices OFRI Other
1990-91 $0.21 $0.30 $0.16 - - 1991-92 0.3 0.5 0.53 $0.31 - 1992-93 0.3 0.66 0.53 0.31 - 1993.2, 3 0.4 0.66 0.77 0.31 - 1994 0.4 0.66 0.77 0.31 - 1995 0.4 0.66 0.77 0.31 - 1996 0.5 0.5 0.6 0.51 - 1997 0.5 0.5 0.6 0.51 - 1998 0.55 0.5 0.7 0.51 $1.75 1999 0.55 0.5 0.7 0.79 - 2000 0.67 0.5 1.08 0.79 0.15 2001 0.67 - 1.08 0.79 0.15 2002 0.67 0.5 0.91 0.79 2003 0.67 0.5 0.91 0.79 2004 0.67 0.5 0.79 0.99 2005 0.67 0.5 0.79 0.89 2006 0.67 0.5 0.55 0.89 2007 0.67 0.5 0.55 0.89 2008 0.92 0.625 1.1456 0.89 2009 0.92 0.625 1.1456 0.89 2010 0.92 0.625 1.14 0.89 2011 0.92 0.625 1.14 0.89 2012 0.8739 0.625 1.2952 0.89 2013 0.8739 0.625 1.2952 0.89

LRO 2/21/2013 I4 Research Report #1-13
Local Revenues from Federally-Owned Forest Lands Notwithstanding the importance of the Forest Products Harvest Tax and Severance Tax revenues to the state and to local taxing districts, among certain counties primarily located in southwest Oregon, federally-owned forestlands are a critical revenue source. Under federal law, harvested timber from federally-owned lands must be shared with the state and counties in which the federally-owned forestlands are located. On October 30, 2000, Congress passed Public Law 106-393 (the Secure Rural School and Community Self-Determination Act of 2000, commonly known as "Payments to States") in order to offset the effect of decreased revenues available to counties from declining timber harvests on federal lands. In FY 2010-11, estimated federal forest payments totaled $116 million. The act has been reauthorized for FY 2012 for 1 year but the future of these payments is uncertain.

LRO: 2/21/2013 I5 Research Report #1-13
TIMBER TAX COLLECTIONS(millions of dollars)
Privilege Taxes Forest ProductsFiscal Eastern Oregon Western Oregon Harvest TaxYear Amount % Change Amount % Change Amount % Change Amount % Change
1979-80 2.53 6.1% 45.67 8.3% 1.75 0.2%1980-81 3.10 22.4% 51.36 12.5% 1.81 3.3%1981-82 3.05 -1.7% 43.04 -16.2% 1.89 4.4%1982-83 2.64 -13.3% 43.62 1.4% 2.50 31.9%1983-84 2.15 -18.5% 25.85 -40.8% 3.23 29.2%1984-85 1.98 -8.2% 26.92 4.1% 3.35 3.8%1985-86 1.51 -23.8% 25.04 -7.0% 2.79 -16.7%1986-87 1.97 30.8% 25.49 1.8% 3.11 11.7%1987-88 2.15 9.2% 25.08 -1.6% 3.87 24.3%1988-89 2.57 19.4% 30.02 19.7% 3.48 -10.0%1989-90 3.72 44.9% 42.80 42.6% 4.76 36.8%1990-91 3.66 -1.7% 54.43 27.2% 4.12 -13.5%1991-92 4.50 23.0% 49.84 -8.4% 8.41 104.3%1992-93 6.51 44.6% 45.33 -9.0% 9.26 10.1%1993-94 7.94 22.0% 56.30 24.2% 9.94 7.3%1994-95 6.85 -13.7% 61.56 9.3% 8.70 -12.4%1995-96 5.18 -24.3% 49.93 -18.9% 8.01 -7.9%1996-97 2.88 -44.4% 40.90 -18.1% 7.96 -0.7%1997-98 2.71 -6.0% 34.59 -15.4% 8.77 10.1%1998-99 2.95 9.1% 32.97 -4.7% 13.05 48.8%1999-00 2.73 -7.6% 29.95 -9.2% 11.11 -14.9%2000-01 1.50 -45.1% 22.53 -24.8% 10.48 -5.7%2001-02 1.28 -14.9% 17.60 -21.9% 9.67 -7.7%2002-03 0.78 -39.1% 12.49 -29.0% 11.42 18.0%2003-04 0.18 -76.3% 3.60 -71.2% 11.94 4.6%2004-05 0.04 -78.3% 1.00 -72.2% 13.02 9.0% 0.33 2005-06 0.03 -25.0% 0.70 -30.0% 12.00 -7.8% 0.32 -3.1%2006-07 0.08 166.7% 0.44 -37.1% 10.53 -12.3% 0.37 17.0%2007-08 0.01 -92.0% 0.19 -57.5% 10.18 -3.3% 0.31 -16.0%2008-09 (0.05) -600.0% 0.08 -57.2% 11.68 14.7% 0.18 -42.5%2009-10 0.00 109.6% 0.06 -25.0% 10.96 -6.2% 0.15 -15.0%2010-11 0.00 15.7% 0.04 -30.8% 11.33 3.3% 0.21 37.5%2011-12 0.00 -66.8% 0.03 -18.7% 12.90 13.9% 0.35 64.0% Source: Oregon Department of Revenue, Monthly Receipts Statement.
TIMBER TAX COLLECTIONS
Small Tract ForestlandTax
0
10
20
30
40
50
60
70
80
90
80 81 82 83 84 85 86 87 88 89 90 91 92 93 94 95 96 97 98 99 00 01 02 03 04 05 06 07 08 09 10 11 12
Mill
ions
of D
olla
rs
Fiscal Year Ending
Western Oregon Eastern Oregon Forest Products

LRO 2/21/2013 I6 Research Report # 1-13
CalendarYear Volume % Change Volume % Change Volume % Change Volume % Change1978 3,550 4,069 378 7,997 1979 3,208 -9.6% 4,123 1.3% 363 -4.0% 7,694 -3.8%1980 3,134 -2.3% 3,196 -22.5% 310 -14.6% 6,640 -13.7%1981 2,702 -13.8% 2,658 -16.8% 335 8.1% 5,695 -14.2%1982 3,440 27.3% 2,000 -24.8% 318 -5.1% 5,758 1.1%1983 3,373 -1.9% 3,691 84.6% 400 25.8% 7,464 29.6%1984 3,078 -8.7% 4,084 10.6% 388 -3.0% 7,550 1.2%1985 3,332 8.3% 4,371 7.0% 423 9.0% 8,126 7.6%1986 3,494 4.9% 4,892 11.9% 357 -15.6% 8,743 7.6%1987 3,281 -6.1% 4,566 -6.7% 368 3.1% 8,215 -6.0%1988 3,259 -0.7% 4,926 7.9% 430 16.8% 8,615 4.9%1989 3,721 14.2% 4,333 -12.0% 366 -14.9% 8,420 -2.3%1990 3,229 -13.2% 2,718 -37.3% 272 -25.7% 6,219 -26.1%1991 3,311 2.5% 2,554 -6.0% 214 -21.3% 6,079 -2.3%1992 3,581 8.2% 1,886 -26.2% 275 28.5% 5,742 -5.5%1993 3,609 0.8% 1,463 -22.4% 222 -19.3% 5,294 -7.8%1994 3,244 -10.1% 688 -53.0% 235 5.9% 4,167 -21.3%1995 3,432 5.8% 654 -4.9% 218 -7.2% 4,304 3.3%1996 3,018 -12.1% 690 5.5% 214 -1.8% 3,922 -8.9%1997 3,133 3.8% 659 -4.5% 290 35.5% 4,082 4.1%1998 2,840 -9.4% 455 -31.0% 237 -18.3% 3,532 -13.5%1999 3,014 6.1% 383 -15.8% 363 53.2% 3,760 6.5%2000 3,167 5.1% 328 -14.4% 359 -1.1% 3,854 2.5%2001 2,905 -8.3% 173 -47.3% 361 0.6% 3,439 -10.8%2002 3,318 14.2% 222 28.3% 382 5.8% 3,922 14.0%2003 3,313 -0.2% 281 26.6% 408 6.8% 4,002 2.0%2004 3,606 8.8% 433 54.1% 412 1.0% 4,451 11.2%2005 3,495 -3.1% 397 -8.3% 463 12.3% 4,355 -2.2%2006 3,596 2.9% 346 -12.8% 386 -16.6% 4,327 -0.6%2007 3,070 -14.6% 364 5.2% 366 -5.1% 3,800 -12.2%2008 2,740 -10.7% 323 -11.3% 379 3.6% 3,441 -9.4%2009 2,079 -24.1% 339 4.9% 331 -12.8% 2,748 -20.1%2010 2,432 17.0% 387 14.3% 407 23.1% 3,227 17.4%2011 2,514 3.4% 406 4.9% 321 -21.1% 3,241 0.4%
Source: http://www.oregon.gov/ODF/STATE_FORESTS/FRP/annual_reports.shtml
OREGON TIMBER HARVESTMillion Board Feet - Scribner Scale
Private Federal State / other public Total
01,0002,0003,0004,0005,0006,0007,0008,0009,000
10,000
78 79 80 81 82 83 84 85 86 87 88 89 90 91 92 93 94 95 96 97 98 99 00 01 02 03 04 05 06 07 08 09 10 11
Calendar Year
OREGON TIMBER HARVEST
Year Private State/Other Public Federal

LRO 2/21/2013 I7 Research Report # 1-13
Historical Log Prices and U.S. Housing StartsHarvest Year Weighted Oregon Log Priceand Quarter 2012$, $/MBF Millions of Units Indexed2003 1Q 740 1.736 739.6 $739.572003 2Q 699 1.754 747.1 $698.912003 3Q 705 1.890 805.0 $705.122003 4Q 745 2.036 867.2 $744.572004 1Q 796 1.918 817.2 $796.352004 2Q 765 1.937 825.3 $764.692004 3Q 777 1.977 842.2 $777.072004 4Q 766 1.965 837.3 $765.992005 1Q 798 2.072 882.6 $797.682005 2Q 814 2.051 873.9 $813.612005 3Q 769 2.100 894.6 $769.272005 4Q 727 2.069 881.3 $727.392006 1Q 781 2.120 903.3 $781.032006 2Q 734 1.855 790.3 $733.872006 3Q 662 1.702 725.2 $662.172006 4Q 624 1.570 668.9 $624.202007 1Q 676 1.461 622.5 $675.942007 2Q 620 1.451 618.2 $620.252007 3Q 585 1.289 549.1 $585.112007 4Q 527 1.166 496.7 $526.502008 1Q 470 1.064 453.3 $470.112008 2Q 477 1.011 430.6 $477.102008 3Q 455 0.862 367.4 $455.022008 4Q 423 0.663 282.5 $423.272009 1Q 363 0.526 224.0 $363.092009 2Q 355 0.534 227.6 $355.112009 3Q 393 0.588 250.6 $393.022009 4Q 430 0.568 241.9 $429.612010 1Q 476 0.618 263.3 $476.272010 2Q 498 0.602 256.5 $497.712010 3Q 416 0.580 247.0 $416.342010 4Q 471 0.542 231.0 $471.192011 1Q 541 0.583 248.5 $540.902011 2Q 469 0.573 244.0 $469.402011 3Q 488 0.614 261.6 $488.442011 4 Q 476 0.678 289.0 $475.662012 1Q 498 0.715 304.5 $497.552012 2Q 501 0.736 313.4 $501.072012 3Q 484 0.755 321.7 $484.022012 4Q 486 0.797 339.3 $485.52Note: All Oregon log prices adjusted for species, grade, location and inflation.
U.S. Housing Starts
0
100
200
300
400
500
600
700
800
900
1,000
2003 1Q2003 2Q2003 3Q2003 4Q2004 1Q2004 2Q2004 3Q2004 4Q2005 1Q2005 2Q2005 3Q2005 4Q2006 1Q2006 2Q2006 3Q2006 4Q2007 1Q2007 2Q2007 3Q2007 4Q2008 1Q2008 2Q2008 3Q2008 4Q2009 1Q2009 2Q2009 3Q2009 4Q2010 1Q2010 2Q2010 3Q2010 4Q2011 1Q2011 2Q2011 3Q2011 4 Q2012 1Q2012 2Q2012 3Q2012 4Q
2012
$/M
BF
Historical Log Prices and U.S. Housing Starts
Weighted Oregon Log Price
U.S. Housing Starts (Indexed)

LRO 2/21/2013 J1 Research Report #1-13
EXCISE TAXES Taxes on Cigarettes and Other Tobacco Products Excise taxes are imposed on distribution of all tobacco products in Oregon. Taxes are levied on each cigarette and as a percent of wholesale price of other tobacco products. With the passage of Measure 20 (in 2002), the permanent tax rate on cigarettes is $1.18 and the Other Tobacco Products (OTP) tax rate is 65% of wholesale price. However, the OTP tax is capped at 50¢ per cigar. The 2009 session introduced a tax by weight on noncombustible tobacco, a $1.78 tax per ounce (with a minimum of $2.14 per container of moist snuff). Cigarette tax is distributed to a number of uses, 22 cents are allocated to the General Fund (18.64%), the Health Plan gets 85.7 cents (72.66%), 3.4 cents (2.9%) go to the tobacco cessation programs, and 2.3 cents (1.93%) each to cities, counties , and ODOT (senior and disabled transit). Distributions within cities and counties are based on population. The Other Tobacco Products tax is distributed differently, with the General Fund getting 53.85%, the Health Plan 41.54%, and tobacco cessation programs 4.62%. The 2007 legislature sent the voters a tax increase (Measure 50), that failed to pass. The same session instituted an indoor smoking ban, which also expected to reduce revenue form cigarettes. Additional tobacco revenue is received under the Master Settlement Agreement. Through June 30, 2010, Oregon has received $900 million in payments and expects to receive slightly above $160 million for the 2011-13 biennium. The 2003 Session (SB 856) pledged much of this revenue for payments on $450 million appropriation bonds (terminating in 2015). Other bonds pledged against the MSA revenues further restrict the unobligated amounts.
CIGARETTE AND OTHER TOBACCO PRODUCTS TAXES Fiscal Year
Tax Rate (per pack)
Cigarettes Millions Change
Other Tobacco Millions Change
Total Tobacco Millions Change
1997-98 68.0¢ 199.5 40.8% 19.5 52.3% 219.0 41.7% 1998-99 68.0¢ 172.0 -13.8% 19.8 1.5% 191.8 -12.4% 1999-00 68.0¢ 161.8 -5.9% 20.2 2.0% 182.0 -5.1% 2000-01 68.0¢ 156.7 -3.2% 20.8 3.0% 177.5 -2.5% 2001-02 68.0¢ 155.0 -2.6% 20.1 -2.4% 175.1 -1.4% 2002-03 103.0¢ 222.0 43.2% 20.9 4.4% 242.9 38.7% 2003-04 123.0¢ 240.1 8.2% 25.3 20.8% 265.4 9.3% 2004-05 118.0¢ 217.8 -9.3% 26.0 2.7% 243.8 -8.1% 2005-06 118.0¢ 238.7 9.6% 31.2 20.0% 269.9 10.7% 2006-07 118.0¢ 240.2 0.6% 30.9 -0.8% 271.1 0.4% 2007-08 118.0¢ 222.2 -7.5% 32.8 5.9% 255.0 -6.0% 2008-09 118.0¢ 215.3 -3.1% 32.9 0.4% 248.2 -2.6% 2009-10 118.0¢ 201.9 -6.3% 37.4 13.7% 239.3 -3.6% 2010-11 118.0¢ 211.7 4.8% 51.2 36.8% 262.8 9.8% 2011-12 118.0¢ 203.49 -3.85% 52.17 1.98% 255.7 -2.7%
DISTRIBUTION OF TOBACCO TAXES Fiscal Year
General Fund
Health Plan
TURA Special Transit
Local Govt.
2000-01 63.0 93.0 7.8 4.6 9.1 2001-02 60.9 92.7 7.8 4.6 9.1 2002-03 57.1 164.0 7.9 4.7 9.3 2003-04 53.9 184.8 7.8 4.4 8.8 2004-05 52.5 168.5 7.3 4.3 8.6 2005-06 59.4 180.7 8.1 4.1 8.9 2006-07 60.6 185.3 8.3 4.6 9.2 2007-08 59.0 176.1 8.0 4.6 9.2 2008-09 57.1 168.5 7.7 4.1 8.3 2009-10 57.4 161.9 7.4 3.5 7.8 2010-11 66.3 173.2 7.9 4.0 8.1 2011-12 66.1 170.8 7.76 3.95 7.91
Source: Oregon Department of Revenue and DAS’s Economic and Revenue Forecast

LRO 2/21/2013 J2 Research Report #1-13
Oregon Liquor Control Commission (OLCC) Revenue: (Alcohol) Taxes are imposed on beer and wine manufactured or distributed in Oregon. The current rates are $2.60 per 31 gallon barrel (8.4¢ per gallon) of beer, Tax on wine is 67¢ per gallon, and 77¢ per gallon for dessert wine (14% to 21% alcohol content). Two cents of the wine tax goes to the Wine Board, 50% of the remaining beer and wine taxes go to Mental Health and Drug Abuse Prevention, and the balance goes into the OLCC Account. Beverages with 21% or more alcohol are exclusively imported and distributed by the state of Oregon. Currently OLCC sets retail prices, on average, at 110% above cost (including shipping, and federal taxes). The net revenue from these operations goes into the OLCC account. Available revenue in the OLCC account is distributed 56% to state General Fund, 10% to counties by population, 20% to cities by population, and 14% to cities by formula. A surcharge of 50¢ is only temporary for the last and this budget period.
OLCC REVENUE (millions) Fiscal Year
Beer & Wine Tax Change
Net Liquor Sales
Net Liquor Revenue Change
1994-95 10.6 0.0% 90.1 65.9 1.1% 1995-96 11.2 5.7% 93.4 67.7 2.7% 1996-97 11.8 5.4% 97.1 70.9 4.7% 1997-98 12.0 1.7% 102.4 73.8 4.1% 1998-99 12.1 0.8% 107.8 76.5 3.7% 1999-00 12.4 2.5% 116.1 84.8 10.8% 2000-01 12.5 0.8% 121.7 85.8 1.2% 2001-02 12.7 1.6% 127.8 93.0 8.4% 2002-03 13.3 4.7% 134.4 97.1 4.4% 2003-04 13.7 2.7% 145.1 107.3 10.4% 2004-05 14.0 2.2% 155.0 111.1 3.5% 2005-06 14.8 6.3% 172.2 126.1 13.5% 2006-07 15.2 2.4% 187.1 130.8 3.8% 2007-08 16.1 5.9% 199.2 141.1 7.9% 2008-09 16.33 1.5% 207.9 151.9 7.6% 2009-10 16.75 2.6% 215.6 159.8 5.2% 2010-11 16.20 -3.3% 224.1 162.2 1.5% 2011-12 16.89 4.3% 238.47 179.97 11% Source: Oregon Liquor Control Commission
OLCC REVENUE DISTRIBUTIONS (millions) Fiscal Year
Wine Board
Mental Health
General Fund
Counties Cities
1993-94 0.1 5.2 40.6 7.1 24.1 1994-95 0.1 5.2 41.3 7.4 25.1 1995-96 0.2 5.5 37.3 6.7 22.7 1996-97 0.2 5.8 48.9 8.7 29.7 1997-98 0.2 6.0 45.3 8.1 27.5 1998-99 0.2 5.9 45.7 8.2 27.7 1999-00 0.2 6.0 51.4 9.2 31.2 2000-01 0.2 6.2 52.5 9.4 31.9 2001-02 0.2 6.3 54.8 9.8 33.2 2002-03 0.2 6.6 60.1 10.2 34.7 2003-04 0.2 6.7 62.8 11.2 38.2 2004-05 0.2 6.9 65.6 11.6 39.6 2005-06 0.2 7.3 74.0 13.2 44.9 2006-07 0.2 7.5 75.1 13.4 45.6 2007-08 0.3 7.9 82.7 14.8 50.2 2008-09 0.3 8.0 93.9 15.9 53.9 2009-10 0.3 8.3 97.3 15.0 51.1 2010-11 0.3 7.97 101.25 15.64 53.17
2011-12 0.3 8.3 110.2 17.12 58.2 Source: Oregon Liquor Control Commission.

LRO 2/21/2013 J3 Research Report #1-13
BEER AND WINE RATES AS OF 2011
Rank State Excise Sales State Excise Sales State Excise Sales1 South Carolina 0.770 0.600 Florida 2.25 2.40 New York (a) 435.0 0.172 Hawaii 0.930 0.400 Iowa 1.75 2.40 Rhode Island 350.0 0.303 Mississippi 0.427 0.700 Tennessee 1.21 2.80 Connecticut 340.0 0.284 Florida 0.480 0.600 Illinois 1.39 2.50 Hawaii 320.0 0.175 Alaska 1.070 0.000 New Mexico 1.70 2.00 Washington 302.5 0.286 California 0.200 0.825 New Jersey 0.88 2.80 New Jersey 270.0 0.307 North Carolina 0.530 0.475 Virginia 1.51 2.00 Vermont 262.0 0.268 Alabama 0.530 0.400 California 0.20 3.30 Wisconsin 252.0 0.229 Washington 0.261 0.650 Washington 0.87 2.60 Massachusetts 251.0 0.27
10 New Mexico 0.410 0.500 Nevada 0.70 2.74 Dist. of Columbia (e) 250.0 0.2611 Utah 0.410 0.470 Rhode Island 0.60 2.80 Arizona 200.0 0.2912 Nebraska 0.310 0.550 West Virginia 1.00 2.40 Maryland 200.0 0.2613 Illinois 0.235 0.625 Alabama 1.70 1.60 Michigan 200.0 0.2614 Maine 0.350 0.500 South Carolina 0.90 2.40 Maine 200.0 0.2215 Oklahoma 0.400 0.450 Indiana 0.47 2.80 Alaska 200.0 0.0016 Nevada 0.160 0.685 Mississippi 0.35 2.80 Indiana 198.0 0.3017 Tennessee 0.140 0.700 Nebraska 0.95 2.20 Illinois (a) 198.0 0.2718 Minnesota 0.150 0.688 Arkansas 0.75 2.40 Utah 170.0 0.2619 Arkansas 0.230 0.600 Georgia 1.51 1.60 Montana 170.0 0.0020 Texas 0.200 0.625 Arizona 0.84 2.24 New Hampshire 168.0 0.0021 New Jersey 0.120 0.700 Minnesota 0.30 2.75 New Mexico 166.0 0.2222 Indiana 0.115 0.700 Connecticut 0.60 2.40 Pennsylvania 160.0 0.2623 Michigan 0.200 0.600 Hawaii 1.38 1.60 Delaware 160.0 0.0024 Rhode Island 0.100 0.700 Vermont 0.55 2.40 South Dakota 153.0 0.1725 Connecticut 0.190 0.600 Michigan 0.51 2.40 Texas 141.0 0.2726 Iowa 0.190 0.600 Idaho 0.45 2.40 Iowa 136.0 0.2627 West Virginia 0.180 0.600 Maryland 0.40 2.40 Florida (b) 133.9 0.2628 Virginia 0.260 0.500 Texas 0.20 2.50 Ohio 125.0 0.2429 Idaho 0.150 0.600 Dist. of Columbia 0.30 2.40 Minnesota (d) 123.0 0.3030 Ohio 0.180 0.550 North Carolina 0.79 1.90 Oregon 118.00 0.0031 Arizona 0.160 0.560 Maine 0.60 2.00 Arkansas 115.0 0.2632 Georgia 0.320 0.400 South Dakota 0.93 1.60 Oklahoma 103.0 0.2033 Louisiana 0.320 0.400 Oklahoma 0.72 1.80 California 87.0 0.3234 Kansas 0.180 0.530 Alaska 2.50 0.00 Colorado 84.0 0.1335 Dist. of Columbia 0.090 0.600 North Dakota 0.50 2.00 Nevada 80.0 0.3036 Maryland 0.090 0.600 Ohio 0.30 2.20 Kansas 79.0 0.2737 Pennsylvania 0.080 0.600 Pennsylvania 0.00 2.40 Mississippi 68.0 0.3038 South Dakota 0.270 0.400 Wisconsin 0.25 2.00 Nebraska 64.0 0.2439 North Dakota 0.160 0.500 Missouri 0.30 1.69 Tennessee (a) (e) 62.0 0.3040 Wisconsin 0.060 0.500 New York 0.30 1.60 Kentucky (c) 60.0 0.2641 New York 0.140 0.400 Utah 1.88 Wyoming 60.0 0.1742 Missouri 0.060 0.423 Louisiana 0.11 1.60 Idaho 57.0 0.2643 Wyoming 0.020 0.400 Wyoming 0.00 1.60 South Carolina 57.0 0.2644 Colorado 0.080 0.290 Colorado 0.28 1.16 West Virginia 55.0 0.2645 New Hampshire 0.300 0.000 Montana 1.06 0.00 North Carolina 45.0 0.2146 Vermont 0.265 0.000 Delaware 0.97 0.00 North Dakota 44.0 0.2247 Delaware 0.160 0.000 Oregon 0.67 0.00 Alabama (a) 42.5 0.1748 Montana 0.140 0.000 Massachusetts 0.55 0.00 Georgia 37.0 0.1749 Massachusetts 0.110 0.000 Kentucky 0.50 0.00 Louisiana 36.0 0.1750 Kentucky 0.080 0.000 Kansas 0.30 0.00 Virginia (a) 30.0 0.2251 Oregon 0.080 0.000 New Hampshire 0.00 0.00 Missouri (a) 17.0 0.18
Source: Excise tax rates from Federation of Tax Administrators (web). Sales tax rates assume $11 per gallon for beer, $40 a gallon for wine, and $4.35 per pack for cigarettes.
CIGARETTE EXCISE TAX RATES AS OF JANUARY 1, 2013
Ranked by Sum of Excise and Sales Tax Rates (Dollars)
Malt Liquor (Beer) per Gallon Table Wine (14% alcohol) per Gallon Cigarettes per Pack

LRO 2/21/2013 K1 Research Report #1-13
LOTTERY
History The Oregon State Lottery and the five members State Lottery Commission were created by an initiative petition in 1984. Commission members are appointed by the governor and charged to produce the maximum amount of net revenue to benefit the public purpose. The lottery currently offers 8 traditional games through 3,907 retailers, which are allowed to persons age 18 or older. Video lottery (poker and line games) is played on approximately 12,200 machines in more than 2,200 licensed premises, which are available to persons age 21 or older. The Constitution limits administrative expense to 16% of lottery revenue and requires that at least 50% of revenue be returned in the form of prizes. The Constitution, originally, dedicated the net lottery proceeds to the purpose of creating jobs and furthering economic development. This was expanded by Measure 21 (May 1995) to include financing public education, and by Measure 66 (Nov 1998) to include restoring and protecting Oregon’s parks, beaches, watersheds, and critical fish and wildlife habitats. Measure 21 also gave lottery bonds first claim on lottery proceeds and dedicated 15% of net proceeds to the Education Endowment Fund. Measure 66 dedicated 15% of net proceeds to the Parks and Natural Resources Fund with 50% dedicated to parks and recreational areas and 50% dedicated to fish and wildlife habitats. Measure 19 (Sept. 2002) converted the Education Endowment Fund to an Education Stability Fund, transferred $150 million of the principal to the State School Fund, and increased the lottery dedication to 18%. If the balance in the Stability Fund reaches 5% of General Fund revenue, the lottery dedication is reduced to 15% and deposited in a new school capital matching Subaccount. The 2005 legislature (HB 3466) repealed lottery games on sporting events starting in July 2007. The same bill also dedicated 1.0% of lottery proceeds to fund sports programs at Oregon universities. Measure 76 (Nov. 2010) made the 15% dedication to parks and natural resources permanent and allocated 12% to regional parks and grants.
Traditional Games The chart at right shows prizes, expense and net proceeds for the 2010-11 traditional games. The “other” group includes Breakopen, Daily 4/Win for Life and Pick 4. The initial game in 1985 was Instant (Scratch-it), which was followed by a number of games, some of which have been discontinued or modified. The 1989 Legislature initiated Sports Action as a separate lottery game. Proceeds of this game were dedicated to Higher Education intercollegiate athletics. However, the 2005 legislature repealed sports games as of July 2007. The intercollegiate athletic funding was augmented with a 1% of lottery net proceeds. This amount has pushed funding of university athletic programs to about $10 million a biennium.

LRO 2/21/2013 K2 Research Report #1-13
Video Lottery The 1989 Legislature authorized video lottery but the Governor suspended implementation. The 1991 Legislature reauthorized the commission to offer video lottery. Video poker began in 1992. The Commission may contract with persons, which have Oregon Liquor Control Commission licenses to install up to 6 (5 before 2004) video terminals (10 at race meets) on supervised premises which are restricted to persons over the age of 21. Video lottery revenue is the sum of the dollars put into lottery terminals and the value of games won. Prizes are the sum of the value games won plus amounts returned to the players. Statutes dedicate 2.5% of video net receipts (revenue less prizes) to counties for economic development. HB 2148 amended the dedication to counties “not to exceed” 2.5% of net receipts. Beginning July 1, 2001, 1% of net proceeds go to the Problem Gambling Addiction Fund, and 1% (up to $1.55 million annually) to the County Fair Account. Beginning July 2005, the lottery started offering Line games (slots) in addition to
LOTTERY REVENUE Traditional Games Video Games
Fiscal Gross Net Gross Net Year Revenue Prizes Expense Revenue Revenue Prizes Expense Revenue
1995-96 344.2 213.7 53.9 76.6 3,285.1 2,929.5 149.8 205.9 1996-97 333.1 207.6 52.6 72.8 3,636.7 3,243.5 168.7 224.5 1997-98 310.4 195.1 50.6 64.8 4,245.2 3,837.8 179.0 228.5 1998-99 325.9 206.0 49.0 70.9 5,660.1 5,257.5 172.0 230.5 1999-00 323.7 210.5 56.6 56.6 6,566.3 6,129.8 183.4 253.2 2000-01 323.3 211.9 56.8 54.5 7,293.4 6,831.0 194.7 267.7 2001-02 336.8 223.5 57.4 55.9 7,725.0 7,244.8 199.8 280.4 2002-03 354.8 235.5 60.1 59.2 8,133.3 7,634.6 201.8 297.0 2003-04 362.3 234.9 59.5 67.9 8,587.6 8,056.6 209.4 321.6 2004-05 360.2 234.2 58.6 67.9 9,189.0 8,609.3 206.1 373.6 2005-06 363.1 239.5 58.1 66.4 10,928.8 10,195.9 236.0 504.4 2006-07 354.6 233.6 60.1 61.0 12,093.0 11,239.5 271.8 581.7 2007-08 338.7 220.0 56.9 61.8 12,118.4 11,223.3 289.8 605.3 2008-09 313.8 205.3 55.1 53.3 10,582.9 9,796.2 277.0 509.8 2009-10 320.7 206.0 52.9 61.8 9,402.8 8,695.9 249.7 457.3 2010-11 317.5 206.4 51.9 59.2 9,550.5 8,830.0 254.0 466.6 2011-12 323.2 221.9 50.9 50.4 9,704.3 8,977.2 251.9 475.2

LRO 2/21/2013 K3 Research Report #1-13
video poker. Since then, Lottery revenue has grown significantly. Even though, the current recession has reduced lottery revenue by double digits for the past two biennia, it is still generating close to one billion dollars a biennium to the state.
Lottery Revenues Lottery revenues include non-game revenues (not shown in the table) such as interest earnings, penalties, and allowances for bad debts in addition to game revenues. The table shows the history of traditional and video lottery game revenues for 17 years. The introduction of video lottery games in 1992-93 grew revenue rapidly. Traditional games also grew during the previous period reaching peak revenue of $78.1 million in 1994-95. Traditional games net revenue stabilized at an average of $61 million a year. Net revenue from traditional games comprises less than 10% of revenue, while video lottery is more than 90% of total. Lottery in general has declined with the economic weakness in the state economy. Despite the double digit (-11%) decrease in 2009 and 2010 net revenue, Video lottery has grown 8.5% per year on average since 1994. Line games were the force pushing the growth in total lottery revenue since 2006, but its rapid growth stabilized and was further affected by the slow economy in the last four years. Revenue is forecast to grow at a sustainable long term average of 3%.
Lottery Transfers Fiscal year lottery revenues cannot be mapped into lottery transfers because there is a one-quarter lag in transfers from the previous quarter’s revenues. There are also revenues such as unclaimed prizes and administrative savings, which are not considered in determining net lottery revenue. Transfers may also differ from revenues because of amounts moved into or out of various contingency reserves.
The table below shows the amounts transferred since 1999-2001. Debt service on lottery revenue bonds has first claim on lottery revenue transferred to the Economic Development Fund. Thereafter the exact pecking order is not clear, but the Constitutional dedications for the Education Stability Fund and the Parks and Natural Resources Fund probably follow. After that comes the statutory dedication to county economic development, to the Board of Education, to the Gambling Addiction Fund, and to the County Fair Account. Any balance available after these transfers will be used by the legislature in any of the areas allowed by the constitution. Amounts available for legislative allocation do not include beginning balances, reversions, or interest earned on the Economic Development Fund. The table shows the distribution of lottery transfers through 2009-11 and the amounts forecast for the 2011-13 Biennium. The allocation of $3.3 million to County Fairs is not shown separately, but is reflected in the amount available for counties. Since the introduction of line games, Lottery proceeds are approaching a billion dollars a biennium. The clean door act of 2007 (Smoking ban) which took effect on 2009 combined with the recent economic recession resulted in the greatest reduction of lottery revenue growth ever witnessed. Net revenue declined by 20 % in the recession years.
Allocation of Lottery Transfers
Biennium Revenue Bonds
Education Stability
Parks & Recreation Counties College
Athletics Gambling Addiction
Leg. Approp.
1999-01 26.8 87.1 87.1 22.2 4.8 5.8 362 2001-03 71.3 110.7 110.7 24.3 5.2 6.2 409.7 2003-05 119.43 140.5 117.9 27.9 4.04 6.53 378.01 2005-07 133.73 195.78 163.15 45.51 3.62 8.34 486.44 2007-09 161.73 238.84 199.03 43.55 11.74 12.07 732.91 2009-11 225.18 194.76 162.30 32.99 9.67 8.66 443.10 2011-13* 272.60 194.06 161.72 40.72 8.59 10.58 402.33
*Revenue Forecast, December 2011, Department of Administrative Services
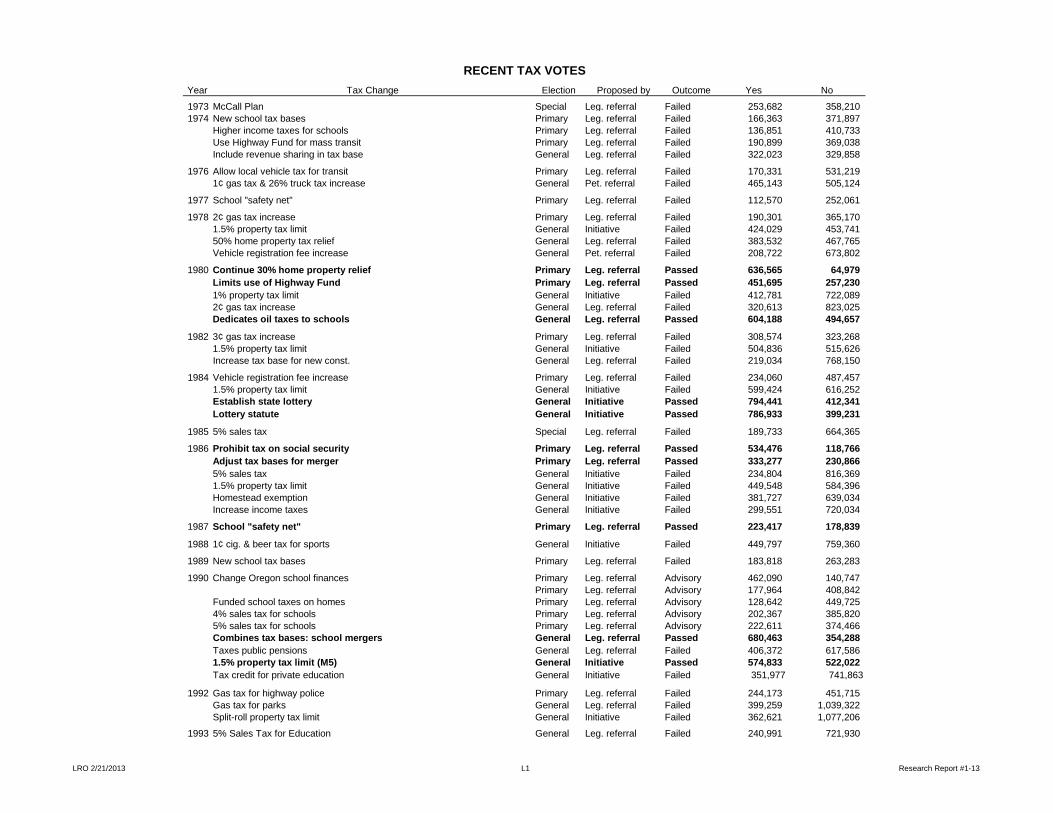
LRO 2/21/2013 L1 Research Report #1-13
RECENT TAX VOTESYear Tax Change Election Proposed by Outcome Yes No
1973 McCall Plan Special Leg. referral Failed 253,682 358,210 1974 New school tax bases Primary Leg. referral Failed 166,363 371,897
Higher income taxes for schools Primary Leg. referral Failed 136,851 410,733 Use Highway Fund for mass transit Primary Leg. referral Failed 190,899 369,038 Include revenue sharing in tax base General Leg. referral Failed 322,023 329,858
1976 Allow local vehicle tax for transit Primary Leg. referral Failed 170,331 531,219 1¢ gas tax & 26% truck tax increase General Pet. referral Failed 465,143 505,124
1977 School "safety net" Primary Leg. referral Failed 112,570 252,061
1978 2¢ gas tax increase Primary Leg. referral Failed 190,301 365,170 1.5% property tax limit General Initiative Failed 424,029 453,741 50% home property tax relief General Leg. referral Failed 383,532 467,765 Vehicle registration fee increase General Pet. referral Failed 208,722 673,802
1980 Continue 30% home property relief Primary Leg. referral Passed 636,565 64,979 Limits use of Highway Fund Primary Leg. referral Passed 451,695 257,230 1% property tax limit General Initiative Failed 412,781 722,089 2¢ gas tax increase General Leg. referral Failed 320,613 823,025 Dedicates oil taxes to schools General Leg. referral Passed 604,188 494,657
1982 3¢ gas tax increase Primary Leg. referral Failed 308,574 323,268 1.5% property tax limit General Initiative Failed 504,836 515,626 Increase tax base for new const. General Leg. referral Failed 219,034 768,150
1984 Vehicle registration fee increase Primary Leg. referral Failed 234,060 487,457 1.5% property tax limit General Initiative Failed 599,424 616,252 Establish state lottery General Initiative Passed 794,441 412,341 Lottery statute General Initiative Passed 786,933 399,231
1985 5% sales tax Special Leg. referral Failed 189,733 664,365
1986 Prohibit tax on social security Primary Leg. referral Passed 534,476 118,766 Adjust tax bases for merger Primary Leg. referral Passed 333,277 230,866 5% sales tax General Initiative Failed 234,804 816,369 1.5% property tax limit General Initiative Failed 449,548 584,396 Homestead exemption General Initiative Failed 381,727 639,034 Increase income taxes General Initiative Failed 299,551 720,034
1987 School "safety net" Primary Leg. referral Passed 223,417 178,839
1988 1¢ cig. & beer tax for sports General Initiative Failed 449,797 759,360
1989 New school tax bases Primary Leg. referral Failed 183,818 263,283
1990 Change Oregon school finances Primary Leg. referral Advisory 462,090 140,747 Primary Leg. referral Advisory 177,964 408,842
Funded school taxes on homes Primary Leg. referral Advisory 128,642 449,725 4% sales tax for schools Primary Leg. referral Advisory 202,367 385,820 5% sales tax for schools Primary Leg. referral Advisory 222,611 374,466 Combines tax bases: school mergers General Leg. referral Passed 680,463 354,288 Taxes public pensions General Leg. referral Failed 406,372 617,586 1.5% property tax limit (M5) General Initiative Passed 574,833 522,022 Tax credit for private education General Initiative Failed 351,977 741,863
1992 Gas tax for highway police Primary Leg. referral Failed 244,173 451,715 Gas tax for parks General Leg. referral Failed 399,259 1,039,322 Split-roll property tax limit General Initiative Failed 362,621 1,077,206
1993 5% Sales Tax for Education General Leg. referral Failed 240,991 721,930

LRO 2/21/2013 L2 Research Report #1-13
RECENT TAX VOTESYear Tax Change Election Proposed by Outcome Yes No
1994 Gas tax to prevent contamination Primary Leg. referral Failed 158,029 446,665 Vote on tax or fee increases General Initiative Failed 543,302 671,025 Minimum funding for schools (Kids First) General Initiative Failed 438,018 760,853 2% Equal Tax General Initiative Failed 284,195 898,416
1995 Lottery revenue for education Primary Leg. referral Passed 671,027 99,728 1996 3/5 vote to raise revenue Primary Leg. referral Passed 349,918 289,930
State pays for local mandates General Leg. referral Passed 731,127 566,168 Tobacco taxes for Health Plan General Initiative Passed 759,048 598,543 Counts non-voters as "no" votes General Initiative Failed 158,555 1,180,148 Cut and Cap property tax limit (M47) General Initiative Passed 704,554 642,613
1997 Replace cut and cap (M50) Primary Leg. referral Passed 429,943 341,781
1998 Authorize Lottery-backed school bonds (M54) General Leg. referral Passed 569,982 474,727 Dedicate 15% of Lottery to parks & salmon (M66) General Initiative Passed 742,038 362,247
1999 Vehicle cost responsibility (M76) Special Leg. referral Passed 372,613 314,351
2000 Transportation funding (M82) Primary Leg. referral Failed 109,741 767,329 Highway fund for State Police (M80) Primary Leg. referral Failed 310,640 559,941 Kicker Refunds in Constitution (M86) General Leg. referral Passed 898,793 550,304 Increases federal tax subtraction to $5,000 (M88) General Leg. referral Passed 739,270 724,097 Full deduction for federal taxes (M91) General Initiative Failed 661,342 814,885 Voter approval for taxes and fees (M93) General Initiative Failed 581,186 865,091 Funding of school equity goals (M1) General Initiative Passed 940,223 477,461 Property value reduced by regulation (M7) General Initiative PassedState growth limit (M8) General Initiative Failed 608,090 789,699
2002 Establishes Ed. Stability Fund and Transfers $220 million (M13) Primary Leg. referral Failed 376,605 411,923 General Obligation Bond Financing for OHSU Research (M11) Primary Leg. referral Passed 589,869 190,226 Establishes Ed. Stability Fund and Transfers $150 million (M19) Special Leg. referral Passed 496,815 306,440 Increases Cigarette Tax (M20) Special Leg. referral Passed 522,613 289,119 General Obligation Bond Financing for Ed. Buildings (M15) General Leg. referral Passed 624,789 505,797 General Obligation Bond Financing for Emergency Buildings (M16) General Leg. referral Passed 622,914 501,210 Allows Different Permanent Property Tax Rates Within Tax Zones (M18) General Leg. referral Failed 420,135 662,084 Tax Funded Universal Health Care (M23) General Initiative Failed 254,280 936,753
2003 Personal Income Tax Rate Increase (Top Tax Rate to 9.5%) (M 28) Special Leg. referral Failed 545,846 676,312 Authorizes G O Debt for Savings on Pension Liabilities (M29) Special Leg. referral Passed 360,209 291,778
2004 Temp Personal Income Tax increase & misc. tax changes (M30) Special Referendum Failed 481,315 691,462 Property value reduced by regulation (M37) General Initiative Passed 1,054,589 685,079
2006 Allows Income Tax Deduction Equal to Federal Exemptions (M41) General Initiative Failed 483,443 818,452 Amends Constitution: Limits Biennial Increase in State Spending (M48) General Initiative Failed 379,971 923,629
2007 Right To Build Homes; Limits Large Developments (M49) Special Leg. referral Passed 718,023 437,351
Dedicates Funds To Provide Health Care For Children, Fund Tobacco Prevention, Through Increased Tobacco Tax (M50) Special Leg. referral Failed 472,063 686,470
2008Eliminates double majority vote requirement for all May & November property tax elections (M56) General Leg. referral Passed 959,118 735,500 Creates An Unlimited Deduction For Federal Income Taxes On Individual Taxpayers' Oregon Income-Tax Returns(M59) General Initiative Failed 615,894 1,084,422
Court Ruled Unconstitutional

LRO 2/21/2013 L3 Research Report #1-13
RECENT TAX VOTESYear Tax Change Election Proposed by Outcome Yes No
Exempts Specified Property Owners From Building Permit Requirements For Improvements Valued At/Under 35,000 Dollars (M63) General Initiative Failed 784,376 928,721
2009 Allows state to issue bonds to match school capital bonds (M68) Primary Leg. referral Passed 498,073 267,052
2010 Raises personal income tax rate for high income taxpayers (M66) Special Referendum Passed 692,687 583,707 Raises corp tax rates and establishes new corp minimum tax (M67) Special Referendum Passed 682,720 591,188 Authorizes Multnomah County casino (M75) General Initiative Failed 448,162 959,342 Continues Lottery dedication to parks & natural resources (M76) General Initiative Passed 972,825 432,552
2012 Prohibits real estate transfer taxes, fees, other assessments (M79) General Initiative Passed 976,587 679,710 Authorizes establishment of privately owend casinos (M82) General Initiative Failed 485,240 1,226,331 Authorizes privately-owned Wood Village casino (M83) General Initiative Failed 500,123 1,207,508 Phases out existing inheritance taxes on large estates (M84) General Initiative Failed 776,143 912,541 Allocates corporate income/excise tax "kicker" refund to fund k-12 (M85) General Initiative Passed 1,007,122 672,586

LRO 2/21/2013 M1 Research Report #1-13
OTHER REPORTS AVAILABLE This section lists some other reports prepared by the Legislative Revenue Office that you may find useful. The research report number follows each title in parentheses, along with the year in which the report was written. The more recent reports may be found at http://www.leg.state.or.us/comm/lro/home.htm
GENERAL SUMMARY OF LEGISLATIVE SESSIONS AND COMMITTEE REPORTS “Revenue Measures Passed by the 76th Legislature 2012 Session” (Report #3-12) “Revenue Measures Passed by the 76th Legislature 2011” (Report #2-11) “Revenue Measures Passed by the 75th Legislature- Feb 2010 Special Session” (Report #1-10) “Revenue Measures Passed by the 75th Legislature 2009” (Report #5-09) “Revenue Measures Passed by the 74th Legislature- Feb 2008 Special Session” (Report #1-08) “Revenue Measures Passed by the 74th Legislature 2007” (Report #3-07) “Revenue Measures Passed by the 2005 Legislative Session” (Report #2-05) ALL TAXES “2012 Oregon Public Finance: Basic Facts” (Report #1-12) “2011 Oregon Public Finance: Basic Facts” (Report #1-11) “Task Force on Comprehensive Revenue Restructuring: Final Report” (Report #2-09) “2009 Oregon Public Finance: Basic Facts” (Report #1-09) “Oregon’s 2% Surplus Kicker” (Report #2-07) “2007 Oregon Public Finance: Basic Facts” (Report #1-07) “Measure 48: Proposed Constitutional Spending Limit” (Report #5-06) “2006 Oregon Public Finance: Basic Facts” (Report #1-06) “2005 Oregon Public Finance: Basic Facts” (Report #1-05)
PROPERTY TAX “Oregon’s Property Tax System: Horizontal Inequities under Measure 50” (Report #4-10) “Enterprise Zones Study” (Report #4-09) “Oregon’s Property Tax System: Horizontal Inequities under Measure 50” (Report #4-10) “2006 Oregon’s Enterprise Zone Programs” (Report #3-06)
INCOME TAX “Measures 85” (Report #4-12) “Measures 66 & 67 FAQ” (Report #7-09) “Measures 66 & 67” (Report #6-09) “Measure 41: Changing Oregon’s Treatment of Personal Exemptions” (Report #6-06)
SCHOOL FINANCE “School Property Tax Rates” (Report #3-10) “K-12 and ESD School Finance” (Report #2-10) “2009 School Finance Legislation: Funding and Distribution” (Report #8-09) “Small School District Funding” (Report #4-08) “Student Weights for small Schools” (Report #3-08) “2007 School Finance Legislation: Funding and Distribution” (Report #4-07) “Student Weights: Individualized Education Program” (Report #7-06)

LRO 2/21/2013 M2 Research Report #1-13
“K-12 and ESD School Finance: State School Fund Distribution” (Report #4-06) “Student Weights: English as a Second Language” (Report #2-06) “2005 School Finance Legislation, Funding and Distribution” (Report #3-05)
MISCELLANEOUS “Taxation and Oregon’s Interstate Competitiveness” (Report #6-12) “Measure 84” (Report #5-12) “Estimating Potential Sales Tax Revenue in Curry County” (Report #2-12) “The American Recovery and Reinvestment Act of 2009: The Impact on Oregon” (Report #3-09)


